


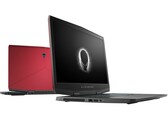
Alienware外星人m17 R2笔记本电脑评测:让i9显得值得
经过重新设计的Alienware m17 R2在迄今为止最薄的系列中最薄的机身中装配了Core i9-9980HK CPU和GeForce RTX 2080 Max-Q GPU。 我们原本希望通过一般般的性能来控制散热,但是即使对于高端游戏笔记本电脑,该系统也以其比平均更快的性能使我们感到惊讶。
Intel Core i9-9980HK, NVIDIA GeForce RTX 2080 Max-Q, 17.3", 2.6 kg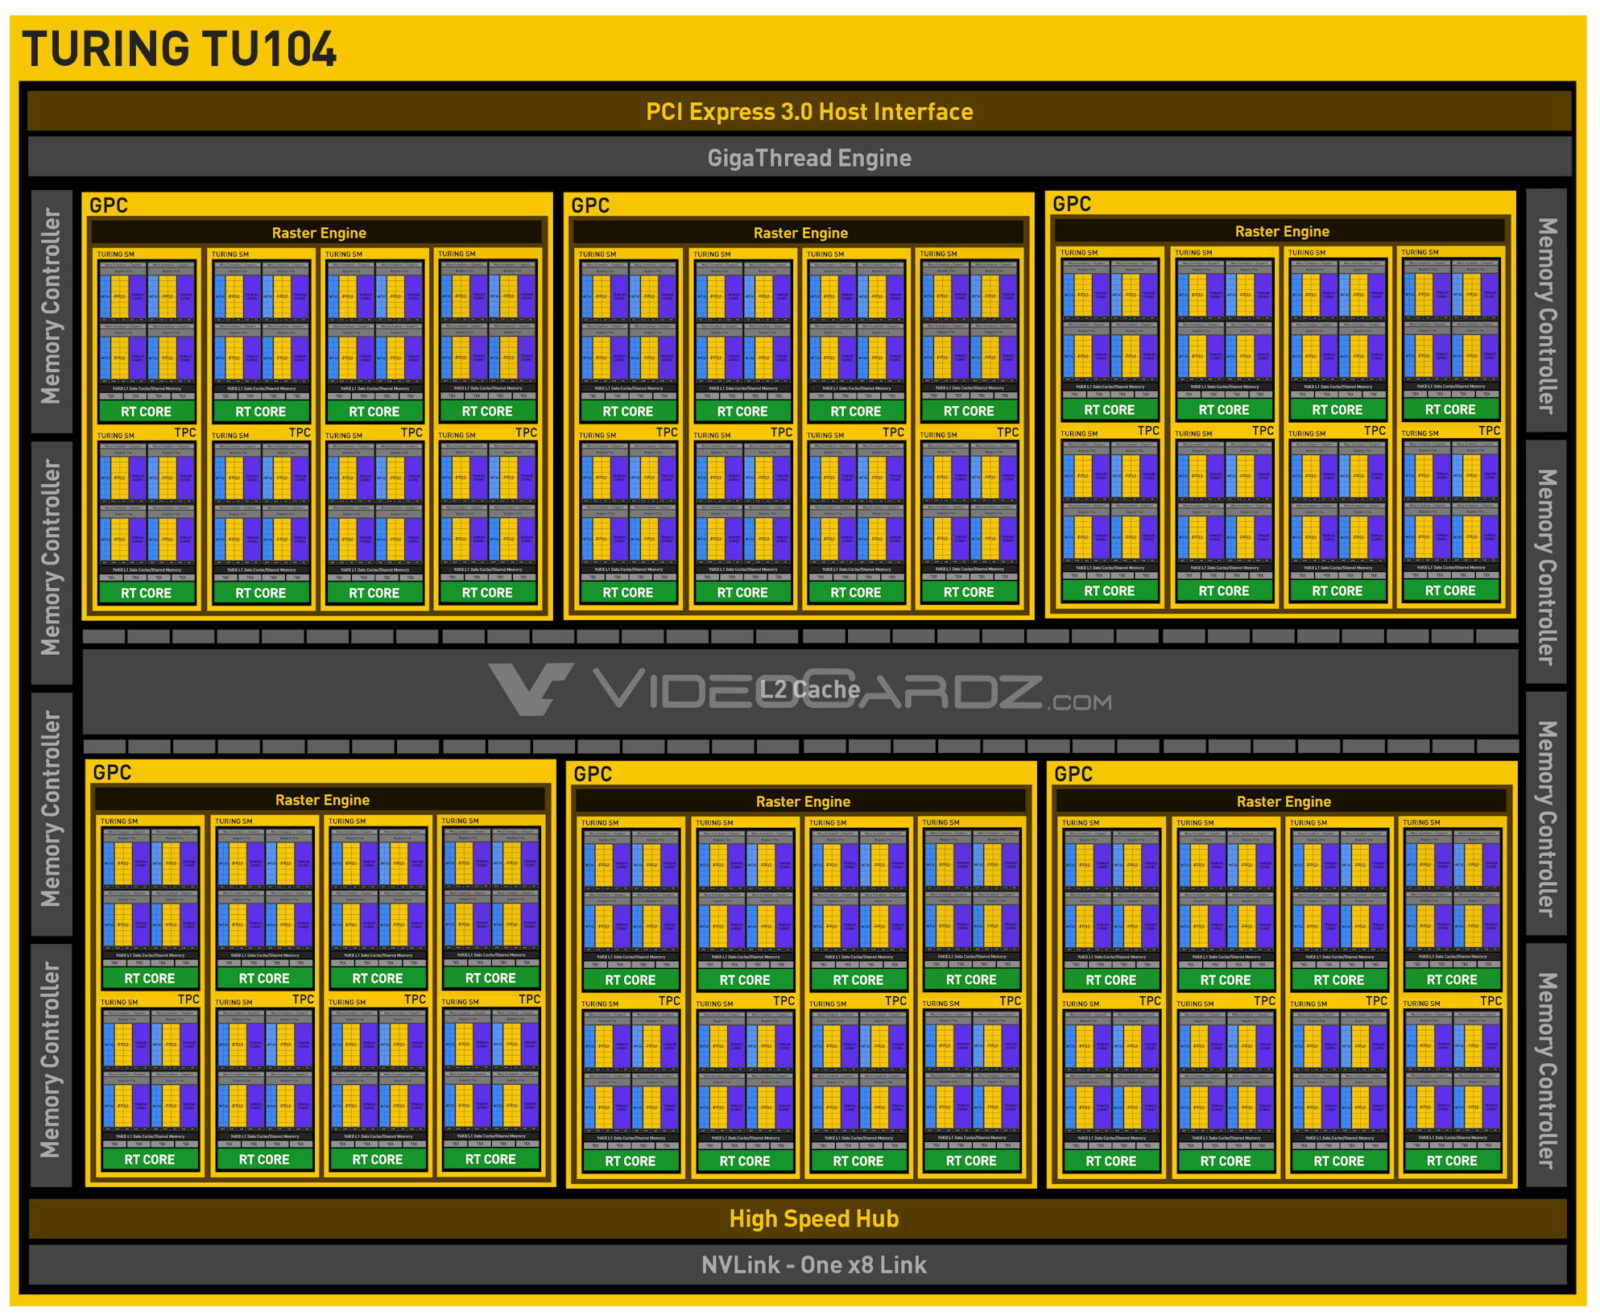
采用Max-Q设计的NVIDIA GeForce RTX 2080是移动RTX 2080的低功耗版,具有降低的频率和功耗。因此,它适用于轻薄的游戏笔记本电脑。它基于台式机和移动版相同的TU104芯片,并提供2944个着色器和8 GB GDDR6内存,并有256位(12 GHz)带宽。
目前看来,将有两个版本,一个低功耗80瓦版本,频率在735-1095 MHz之间,一个更强的90瓦版本,频率在990-1230 MHz之间。
与常规RTX 2080相比,频率不是唯一的区别。针对Max-Q版本的驱动针对效率进行了优化(而非性能;仅针对Max-Q型号进行了优化),电压被限制在1V,配有高端散热以及针对风扇噪声的40 dB限制进行了的优化(并进行频率调整以确保始终如此)。
特征
TU104芯片以12 nm FinFET工艺制造,并包括深度学习超级采样(DLSS)和实时光线追踪(RTRT)等功能,与基于Pascal架构的旧GPU相比,它们应结合起来可创造出更逼真的照光照效果(如果游戏支持)。 RTX 2080还支持DisplayPort 1.4,同时还支持HDMI 2.0b,HDR,同时多投影(SMP)和H.265视频编码/解码(PlayReady 3.0)。
性能
RTX 2080 Max-Q应该比普通的移动版RTX 2070强一点。它应该能够以高特效在4k画质下运行所有硬件要求高的游戏。但是,光线追踪功能可能会大大降低帧率。
GeForce RTX 2000 Series
| ||||||||||||||||||||||||||||||||||||||||||||||||||||||||||
| Codename | N18E-G3-A1 MAX-Q TU104 | |||||||||||||||||||||||||||||||||||||||||||||||||||||||||
| Architecture | Turing | |||||||||||||||||||||||||||||||||||||||||||||||||||||||||
| Pipelines | 2944 - unified | |||||||||||||||||||||||||||||||||||||||||||||||||||||||||
| Core Speed | 735-990 - 1095-1230 (Boost) MHz | |||||||||||||||||||||||||||||||||||||||||||||||||||||||||
| Memory Speed | 12000 MHz | |||||||||||||||||||||||||||||||||||||||||||||||||||||||||
| Memory Bus Width | 256 Bit | |||||||||||||||||||||||||||||||||||||||||||||||||||||||||
| Memory Type | GDDR6 | |||||||||||||||||||||||||||||||||||||||||||||||||||||||||
| Max. Amount of Memory | 8 GB | |||||||||||||||||||||||||||||||||||||||||||||||||||||||||
| Shared Memory | no | |||||||||||||||||||||||||||||||||||||||||||||||||||||||||
| API | DirectX 12_1, OpenGL 4.6 | |||||||||||||||||||||||||||||||||||||||||||||||||||||||||
| Power Consumption | 80-90 Watt | |||||||||||||||||||||||||||||||||||||||||||||||||||||||||
| Transistor Count | 13.6 Billion | |||||||||||||||||||||||||||||||||||||||||||||||||||||||||
| Man. Technology | 12 nm | |||||||||||||||||||||||||||||||||||||||||||||||||||||||||
| Features | NVLink, DLSS, Raytraycing, VR Ready, G-SYNC, Vulkan, Multi Monitor, 650 Watt system power recommended | |||||||||||||||||||||||||||||||||||||||||||||||||||||||||
| Notebook Size | large | |||||||||||||||||||||||||||||||||||||||||||||||||||||||||
| Date of Announcement | 06.01.2019 | |||||||||||||||||||||||||||||||||||||||||||||||||||||||||
The following benchmarks stem from our benchmarks of review laptops. The performance depends on the used graphics memory, clock rate, processor, system settings, drivers, and operating systems. So the results don't have to be representative for all laptops with this GPU. For detailed information on the benchmark results, click on the fps number.


For more games that might be playable and a list of all games and graphics cards visit our Gaming List
Asus Zephyrus S GX531GX: Intel Core i7-8750H, 15.60", 2.1 kg
Review » 华硕Zephyrus S GX531GX (i7-8750H, RTX 2080 Max-Q) 笔记本电脑评测
Lenovo Legion Y740-17ICH: Intel Core i7-8750H, 17.30", 2.8 kg
Review » 联想Legion Y740-17ICH (i7-8750H, RTX 2080 Max-Q) 笔记本电脑评测
Acer Predator Triton 500: Intel Core i7-8750H, 15.60", 2.1 kg
Review » 宏碁掠夺者Triton 500 (i7-8750H, RTX 2080 Max-Q) 笔记本电脑评测
Asus Zephyrus S GX701GXR-HG113R: Intel Core i7-9750H, 17.30", 2.6 kg
External Review » Asus Zephyrus S GX701GXR-HG113R
HP Omen X 2S 15-dg0004ur: Intel Core i9-9880H, 15.60", 2.5 kg
External Review » HP Omen X 2S 15-dg0004ur
Lenovo Legion Y740-17IRHg-81UJ001VGE: Intel Core i7-9750H, 17.30", 3 kg
External Review » Lenovo Legion Y740-17IRHg-81UJ001VGE
Alienware m15 R2-N00AWm15R210: Intel Core i7-9750H, 15.60", 2.2 kg
External Review » Alienware m15 R2-N00AWm15R210
MSI P75 Creator 9SG-1013NL: Intel Core i9-9880H, 17.30", 2.3 kg
External Review » MSI P75 Creator 9SG-1013NL
MSI GS65 Stealth 9SG: Intel Core i7-9750H, 15.60", 2 kg
External Review » MSI GS65 Stealth 9SG
Asus ROG Zephyrus S GX701GXR: Intel Core i7-9750H, 17.30", 2.7 kg
External Review » Asus ROG Zephyrus S GX701GXR
Alienware m17 R2, i7-9750H, RTX 2080 Max-Q: Intel Core i7-9750H, 17.30", 2.6 kg
External Review » Alienware m17 R2, i7-9750H, RTX 2080 Max-Q
HP Omen X2S 15-dg0901ng: Intel Core i7-9750H, 15.60", 2.5 kg
External Review » HP Omen X2S 15-dg0901ng
MSI GT76 Titan 9SG-225ID: Intel Core i9-9900K, 17.30", 4.2 kg
External Review » MSI GT76 Titan 9SG-225ID
Asus Zephyrus S GX531GXR-AZ044R: Intel Core i7-9750H, 15.60", 2.1 kg
External Review » Asus Zephyrus S GX531GXR-AZ044R
Acer Predator Triton 500 PT515-51-75C9: Intel Core i7-9750H, 15.60", 2.1 kg
External Review » Acer Predator Triton 500 PT515-51-75C9
Alienware m17 R2-C7XD9: Intel Core i9-9980HK, 17.30", 2.6 kg
External Review » Alienware m17 R2-C7XD9
HP Omen 15-dh0009ng: Intel Core i7-9750H, 15.60", 2.6 kg
External Review » HP Omen 15-dh0009ng
Asus Zephyrus S GX701GXR-H6081R: Intel Core i7-9750H, 17.30", 2.7 kg
External Review » Asus Zephyrus S GX701GXR-H6081R
Alienware m15 R2 P87F: Intel Core i7-9750H, 15.60", 2.2 kg
External Review » Alienware m15 R2 P87F
Lenovo Legion Y740-15ICHg-81UH0020GE: Intel Core i7-9750H, 15.60", 2.2 kg
External Review » Lenovo Legion Y740-15ICHg-81UH0020GE
Origin PC EVO16-S i7-9750H RTX 2080 Max-Q: Intel Core i7-9750H, 16.10", 2.1 kg
External Review » Origin PC EVO16-S i7-9750H RTX 2080 Max-Q
Asus ROG Zephyrus S GX701-EV020T: Intel Core i7-8750H, 17.30", 2.7 kg
External Review » Asus ROG Zephyrus S GX701-EV020T
Acer Predator Triton 500 PT515-51-74JA: Intel Core i7-8750H, 15.60", 2 kg
External Review » Acer Predator Triton 500 PT515-51-74JA
Razer Blade 15 RTX 2080 Max-Q, Core i7-8750H: Intel Core i7-8750H, 15.60", 2.1 kg
External Review » Razer Blade 15 RTX 2080 Max-Q, Core i7-8750H
Origin PC EVO17-S 2019 (i7-9750H, RTX 2080 Max-Q): Intel Core i7-9750H, 17.30", 2.5 kg
External Review » Origin PC EVO17-S 2019 (i7-9750H, RTX 2080 Max-Q)
Asus ROG Zephyrus S GX701GXR-EV013R: Intel Core i7-9750H, 17.30", 2.7 kg
External Review » Asus ROG Zephyrus S GX701GXR-EV013R
MSI GS65 Stealth-666: Intel Core i9-9880H, 15.60", 2 kg
External Review » MSI GS65 Stealth-666
MSI GS75 Stealth 9SG: Intel Core i7-9750H, 17.30", 2.3 kg
External Review » MSI GS75 Stealth 9SG
Razer Blade Pro 17 RTX 2080 Max-Q: Intel Core i7-9750H, 17.30", 2.8 kg
External Review » Razer Blade Pro 17 RTX 2080 Max-Q
Origin PC EVO16-S (i7-8750H, RTX 2080 Max-Q): Intel Core i7-8750H, 16.10", 2.1 kg
External Review » Origin PC EVO16-S (i7-8750H, RTX 2080 Max-Q)
Asus Zephyrus S GX701GX-EV021R: Intel Core i7-8750H, 17.30", 2.7 kg
External Review » Asus Zephyrus S GX701GX-EV021R
Acer ConceptD 7: Intel Core i7-9750H, 15.60", 2.1 kg
External Review » Acer ConceptD 7
MSI GS65 8SG-005: Intel Core i7-8750H, 15.60", 1.9 kg
External Review » MSI GS65 8SG-005
Alienware m15-565K7: Intel Core i9-8950HK, 15.60", 2.2 kg
External Review » Alienware m15-565K7
Alienware m17 P37E: Intel Core i9-8950HK, 17.30", 2.6 kg
External Review » Alienware m17 P37E
Razer Blade 15 RTX 2080 Max-Q: Intel Core i7-9750H, 15.60", 2.2 kg
External Review » Razer Blade 15 RTX 2080 Max-Q
Lenovo Legion Y740-17ICHg-81HH001NGE: Intel Core i7-8750H, 17.30", 2.9 kg
External Review » Lenovo Legion Y740-17ICHg-81HH001NGE
Asus Zephyrus S GX531GX: Intel Core i7-8750H, 15.60", 2.1 kg
External Review » Asus Zephyrus S GX531GX
Asus Zephyrus S GX701GX-EV064T: Intel Core i7-8750H, 17.30", 2.6 kg
External Review » Asus Zephyrus S GX701GX-EV064T
Gigabyte Aero 15-Y9: Intel Core i9-8950HK, 15.60", 2.1 kg
External Review » Gigabyte Aero 15-Y9
Asus Zephyrus S GX531GX-ES036R: Intel Core i7-8750H, 15.60", 2.1 kg
External Review » Asus Zephyrus S GX531GX-ES036R
Gigabyte Aero 15 Y9-9UK4720P: Intel Core i9-8950HK, 15.60", 2 kg
External Review » Gigabyte Aero 15 Y9-9UK4720P
Acer Predator Triton 500: Intel Core i7-8750H, 15.60", 2.1 kg
External Review » Acer Predator Triton 500
Lenovo Legion Y740-17ICH: Intel Core i7-8750H, 17.30", 2.8 kg
External Review » Lenovo Legion Y740-17ICH
Asus Zephyrus S GX701GX: Intel Core i7-8750H, 17.30", 2.6 kg
External Review » Asus Zephyrus S GX701GX
MSI GS65 8SG-055: Intel Core i7-8750H, 15.60", 1.9 kg
External Review » MSI GS65 8SG-055
MSI GS75 8SG Stealth: Intel Core i7-8750H, 17.30", 2.3 kg
External Review » MSI GS75 8SG Stealth
» Comparison of GPUs
Detailed list of all laptop GPUs sorted by class and performance.
» Benchmark List
Sort and restrict laptop GPUs based on performance in synthetic benchmarks.
» Notebook Gaming List
Playable games for each graphics card and their average FPS results.
* Approximate position of the graphics adapter
» Notebookcheck多媒体笔记本电脑Top 10排名
» Notebookcheck游戏笔记本电脑Top 10排名
» Notebookcheck低价办公/商务笔记本电脑Top 10排名
» Notebookcheck高端办公/商务笔记本电脑Top 10排名
» Notebookcheck工作站笔记本电脑Top 10排名
» Notebookcheck亚笔记本电脑Top 10排名
» Notebookcheck超级本产品Top 10排名
» Notebookcheck变形本产品Top 10排名
» Notebookcheck平板电脑Top 10排名
» Notebookcheck智能手机Top 10排名
» Notebookcheck评测过最出色的笔记本电脑屏幕
» Notebookcheck售价500欧元以下笔记本电脑Top 10排名
» Notebookcheck售价300欧元以下笔记本电脑Top 10排名