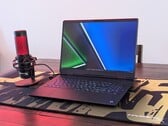
Notebookcheck Logo

Nvidia GeForce RTX 5070 Ti Laptop

NvidiaGeForce RTX 5070 Ti Laptop是在 2025 年 CES 上发布的 Blackwell 系列笔记本电脑移动显卡。它基于 GB205 芯片,拥有 5888 个着色器/CUDA 核心,主频为 847-1995 MHz(取决于型号),12 GB GDDR7 显存,192 位接口。该型号还拥有 46 个 RT 核心和 80 个 ROP。

作为一项新功能,Blackwell 借助第五代张量内核,通过 DLSS4 支持多帧生成 (MFG)。

性能

我们的测试表明,RTX 5070 Ti 笔记本电脑比标准的 RTX 5070 笔记本电脑在基准测试中平均快 23%。游戏性能差距较小;在这里,RTX 5070 Ti 笔记本电脑仅比 RTX 5070 笔记本电脑平均快 15%。台式机对应的 RTX 5070 Ti快 34%。此外,利用所提到的多帧生成(MFG),您可以获得令人印象深刻的帧率,但要注意延迟。

功耗

GB205 芯片采用台积电 4N(定制 4NP 5 纳米)工艺制造。该机型允许的最大 TGP 为 140 瓦(包括动态升压)。

GeForce RTX 5000 Laptop GPU Series

GeForce RTX 5090 Laptop 10496 @ 0.99 - 1.52 GHz256 Bit @ 28000 MHz
GeForce RTX 5080 Laptop 8192 @ 0.98 - 2.29 GHz256 Bit @ 28000 MHz
GeForce RTX 5070 Ti Laptop 5888 192 Bit @ 32000 MHz
GeForce RTX 5070 Laptop 4608 @ 2.24 - 2.52 GHz128 Bit @ 32000 MHz
GeForce RTX 5060 Laptop 3328 @ 0.95 - 1.46 GHz128 Bit @ 24000 MHz
GeForce RTX 5050 Laptop 2560 @ 1.02 - 2.66 GHz128 Bit @ 14000 MHz
CodenameGN22-X7
ArchitectureBlackwell
Pipelines5888 - unified
TMUs184
ROPs64
Raytracing Cores46
Tensor / AI Cores184
CacheL1: 5.8 MB, L2: 48 MB
Memory Speed32000 effective = 2000 MHz
Memory Bus Width192 Bit
Memory TypeGDDR7
Max. Amount of Memory12 GB
Shared Memoryno
Memory Bandwidth677 GB/s
APIDirectX 12_2, OpenCL 3.0, Vulkan 1.4
Power Consumption115 Watt (60 - 115 Watt TGP)
technology5 nm
PCIe5
Displays4 Displays (max.), HDMI 2.1b, DisplayPort 2.1b
Notebook Sizelarge
Date of Announcement02.01.2025

Benchmarks

Performance Rating - 3DMark 11 + Fire Strike + Time Spy
16.7 pt (50%)
Restrict / Search: Model: Max. age: years
3DMark - 3DMark Time Spy Score
min: 13812     avg: 16409     median: 16839.5 (45%)     max: 17747 Points
3DMark - 3DMark Time Spy Graphics
min: 14945     avg: 16838     median: 17225 (35%)     max: 17981 Points
Restrict / Search: Model: Max. age: years
3DMark - 3DMark Ice Storm Unlimited Graphics
882191 Points (89%)
3DMark - 3DMark Ice Storm Extreme Graphics
659227 Points (77%)
3DMark - 3DMark Cloud Gate Score
min: 61167     avg: 73232     median: 74060 (70%)     max: 82832 Points
3DMark - 3DMark Cloud Gate Graphics
min: 134306     avg: 166921     median: 155373 (38%)     max: 223650 Points
3DMark - 3DMark Fire Strike Standard Score
min: 32615     avg: 36726     median: 36215 (55%)     max: 42125 Points
3DMark - 3DMark Fire Strike Standard Graphics
min: 39170     avg: 44122     median: 44603.5 (41%)     max: 47933 Points
3DMark - 3DMark Ice Storm Graphics
760743 Points (84%)
3DMark - 3DMark Wild Life Extreme Unlimited
min: 28297     avg: 31578     median: 33562 (39%)     max: 33585 Points
3DMark - 3DMark Night Raid
82266 Points (78%)
3DMark - 3DMark Night Raid Graphics Score
182827 Points (70%)
3DMark 11 - 3DM11 Performance Score
min: 37247     avg: 44080     median: 45294 (55%)     max: 47299 Points
3DMark 11 - 3DM11 Performance GPU
min: 50966     avg: 56687     median: 56824 (43%)     max: 61651 Points
Restrict / Search: Model: Max. age: years
3DMark Vantage
3DM Vant. Perf. total +
3DMark Vantage - 3DM Vant. Perf. total
min: 121273     avg: 122137     median: 122137 (35%)     max: 123001 Points
3DM Vant. Perf. GPU no PhysX +
3DMark Vantage - 3DM Vant. Perf. GPU no PhysX
min: 122701     avg: 128541     median: 128540 (70%)     max: 134380 Points
Restrict / Search: Model: Max. age: years
3DMark 05 - 3DMark 05 - Standard
68580 Points (75%)
Intel Graphics Media Accelerator (GMA) 500
133.4 -100%
...
50971 -26%
52117 -24%
Intel Arc Graphics 140T
53521 -22%
53991 -21%
54320 -21%
55811 -19%
61850 -10%
62666 -9%
63165 -8%
Nvidia GeForce RTX 5070 Ti Laptop
68580
68868 0%
69623 2%
73485 7%
...
68868 0%
max:
87172 27%
0%
100%
Restrict / Search: Model: Max. age: years
3DMark 06 3DMark 06 - Standard 1280x1024 +
3DMark 06
min: 60964     avg: 65414     median: 65214 (85%)     max: 70064 Points
Unigine Valley 1.0 - Unigine Valley 1.0 DX
198.1 fps (60%)
Blender - Blender 3.3 Classroom CUDA *
min: 24     avg: 25.7     median: 24.5 (4%)     max: 33 Seconds
Blender - Blender 3.3 Classroom OPTIX *
min: 13     avg: 14.8     median: 15 (6%)     max: 16 Seconds
SPECviewperf 12
specvp12 sw-03 +
SPECviewperf 12 - specvp12 sw-03
92.2 fps (23%)
specvp12 snx-02 +
SPECviewperf 12 - specvp12 snx-02
18.5 fps (3%)
specvp12 showcase-01 +
SPECviewperf 12 - specvp12 showcase-01
190 fps (33%)
specvp12 mediacal-01 +
SPECviewperf 12 - specvp12 mediacal-01
98.6 fps (25%)
specvp12 maya-04 +
SPECviewperf 12 - specvp12 maya-04
188 fps (51%)
specvp12 energy-01 +
SPECviewperf 12 - specvp12 energy-01
29 fps (26%)
specvp12 creo-01 +
SPECviewperf 12 - specvp12 creo-01
90.3 fps (36%)
specvp12 catia-04 +
SPECviewperf 12 - specvp12 catia-04
171 fps (28%)
specvp12 3dsmax-05 +
SPECviewperf 12 - specvp12 3dsmax-05
284 fps (43%)
SPECviewperf 13 specvp13 sw-04 +
SPECviewperf 13 - specvp13 sw-04
92.9 fps (25%)
specvp13 snx-03 +
SPECviewperf 13 - specvp13 snx-03
14.1 fps (2%)
specvp13 showcase-02 +
SPECviewperf 13 - specvp13 showcase-02
91.3 fps (16%)
specvp13 medical-02 +
SPECviewperf 13 - specvp13 medical-02
36.2 fps (6%)
specvp13 maya-05 +
SPECviewperf 13 - specvp13 maya-05
202 fps (23%)
specvp13 energy-02 +
SPECviewperf 13 - specvp13 energy-02
22.6 fps (7%)
specvp13 creo-02 +
SPECviewperf 13 - specvp13 creo-02
152 fps (22%)
specvp13 catia-05 +
SPECviewperf 13 - specvp13 catia-05
92.7 fps (10%)
specvp13 3dsmax-06 +
SPECviewperf 13 - specvp13 3dsmax-06
166 fps (26%)
SPECviewperf 2020 specvp2020 snx-04 1080p +
SPECviewperf 2020 - specvp2020 snx-04 1080p
33.6 fps (4%)
specvp2020 medical-03 1080p +
SPECviewperf 2020 - specvp2020 medical-03 1080p
50.8 fps (14%)
specvp2020 maya-06 1080p +
SPECviewperf 2020 - specvp2020 maya-06 1080p
503 fps (54%)
specvp2020 energy-03 1080p +
SPECviewperf 2020 - specvp2020 energy-03 1080p
26 fps (4%)
specvp2020 creo-03 1080p +
SPECviewperf 2020 - specvp2020 creo-03 1080p
85.1 fps (29%)
specvp2020 catia-06 1080p +
SPECviewperf 2020 - specvp2020 catia-06 1080p
39.1 fps (19%)
specvp2020 3dsmax-07 1080p +
SPECviewperf 2020 - specvp2020 3dsmax-07 1080p
76.8 fps (20%)
Cinebench R10 Cinebench R10 Shading (32bit) +
Cinebench R10 - Cinebench R10 Shading (32bit)
24671 points (18%)
Cinebench R11.5 Cinebench R11.5 OpenGL 64 Bit +
Cinebench R11.5 - Cinebench R11.5 OpenGL 64 Bit
236.6 fps (78%)
Cinebench R15
Cinebench R15 OpenGL 64 Bit +
Cinebench R15 - Cinebench R15 OpenGL 64 Bit
min: 271     avg: 311.9     median: 327 (19%)     max: 335.41 fps
Cinebench R15 OpenGL Ref. Match 64 Bit +
Cinebench R15 - Cinebench R15 OpenGL Ref. Match 64 Bit
99.6 % (100%)
GFXBench - GFXBench 5.0 4K Aztec Ruins High Tier Offscreen
184.7 fps (69%)
GFXBench - GFXBench 5.0 Aztec Ruins High Tier Offscreen
403.5 fps (72%)
Restrict / Search: Model: Max. age: years
GFXBench - GFXBench 5.0 Aztec Ruins Normal Tier Offscreen
960 fps (71%)
GFXBench - GFXBench Car Chase Offscreen
859 fps (81%)
GFXBench 3.1 - GFXBench Manhattan ES 3.1 Offscreen
983 fps (21%)
GFXBench 3.0 - GFXBench 3.0 Manhattan Offscreen
1084 fps (45%)
GFXBench (DX / GLBenchmark) 2.7
GFXBench T-Rex HD Offscreen C24Z16 +
GFXBench (DX / GLBenchmark) 2.7 - GFXBench T-Rex HD Offscreen C24Z16
3321 fps (26%)
Basemark GPU 1.2 - Basemark GPU 1.2 Vulkan Official Medium Offscreen 1080
min: 68.3     avg: 430     median: 114.4 (3%)     max: 1863 fps
Basemark GPU 1.2 - Basemark GPU 1.2 Vulkan Official High Offscreen 2160
min: 3.64     avg: 5.2     median: 5.2 (1%)     max: 6.84 fps
Geekbench 6.4 - Geekbench 6.4 GPU OpenCL
min: 67235     avg: 145675     median: 155654 (41%)     max: 178141 points
Geekbench 6.4 - Geekbench 6.4 GPU Vulkan
min: 7769     avg: 58670     median: 40229 (10%)     max: 166112 points
LuxMark v2.0 64Bit - LuxMark v2.0 Room GPU
min: 7623     avg: 7789     median: 7788.5 (28%)     max: 7954 Samples/s
LuxMark v2.0 64Bit - LuxMark v2.0 Sala GPU
min: 15570     avg: 15671     median: 15671 (27%)     max: 15772 Samples/s
ComputeMark v2.1 - ComputeMark v2.1 Result
min: 40170     avg: 41323     median: 41323 (34%)     max: 42476 points
Power Consumption - Furmark Stress Test Power Consumption - external Monitor *
min: 163.3     avg: 187.7     median: 185.3 (25%)     max: 203 Watt
0153045607590105120135150165180195210225Tooltip
Power Consumption - The Witcher 3 Power Consumption - external Monitor *
221 Watt (31%)
0153045607590105120135150165180195210225Tooltip
Power Consumption - Power Efficiency - Witcher 3 ultra external Monitor
0.7 fps per Watt (58%)
Power Consumption - Cyberpunk 2077 Power Consumption 150cd *
min: 221     avg: 245.1     median: 245 (71%)     max: 285 Watt
020406080100120140160180200220240260280300Tooltip
Power Consumption - Cyberpunk 2077 Power Consumption - external Monitor *
min: 217     avg: 241     median: 242 (31%)     max: 278 Watt
0153045607590105120135150165180195210225240255270Tooltip
Power Consumption - Power Efficiency - Cyberpunk 2077 ultra
min: 0.4258     avg: 0.5     median: 0.5 (2%)     max: 0.509 fps per Watt
Emissions Witcher 3 Fan Noise +
Emissions - Witcher 3 Fan Noise
50.4 dB(A) (72%)
- Range of benchmark values
red legend - Average benchmark values
* Smaller numbers mean a higher performance

Game Benchmarks

The following benchmarks stem from our benchmarks of review laptops. The performance depends on the used graphics memory, clock rate, processor, system settings, drivers, and operating systems. So the results don't have to be representative for all laptops with this GPU. For detailed information on the benchmark results, click on the fps number.

F1 25

F1 25

2025
low 1920x1080
181.7 188.4 242 260 ~ 218 fps    + Compare
med. 1920x1080
181.2 184.5 217 243 ~ 206 fps    + Compare
high 1920x1080
168.3 170.8 171.9 225 ~ 184 fps    + Compare
ultra 1920x1080
33.3 35 35.3 42.1 ~ 36 fps    + Compare
QHD 2560x1440
18 20 21.3 25 ~ 21 fps    + Compare
QHD DLSS 2560x1440
32 36.9 39.3 45.9 ~ 39 fps    + Compare
» With most tested laptops playable in detail settings ultra.
Additional Benchmarks
Ultra High Preset 16xAF TAA 1920x1080
69.7
64.7
61
85.3
low 1920x1080
93  fps    + Compare
med. 1920x1080
77.5 94.8 94.9 ~ 89 fps    + Compare + 📈 Graph
high 1920x1080
67.3 84.3 86.1 ~ 79 fps    + Compare + 📈 Graph
ultra 1920x1080
65 82.7 85.4 ~ 78 fps    + Compare + 📈 Graph
QHD 2560x1440
45.7 57.9 59.1 ~ 54 fps    + Compare + 📈 Graph
QHD DLSS 2560x1440
61 79.1 82.5 ~ 74 fps    + Compare + 📈 Graph
» With all tested laptops playable in detail settings ultra.
low 1920x1080
116  fps    + Compare + 📈 Graph
med. 1920x1080
86.9 94 112.6 ~ 98 fps    + Compare + 📈 Graph
high 1920x1080
78.2 81.8 90.8 ~ 84 fps    + Compare + 📈 Graph
ultra 1920x1080
40 42.9 44 ~ 42 fps    + Compare + 📈 Graph
QHD 2560x1440
28 30.1 30.9 ~ 30 fps    + Compare + 📈 Graph
QHD DLSS 2560x1440
41.9 44.7 47.4 ~ 45 fps    + Compare + 📈 Graph
» With all tested laptops playable in detail settings ultra.
low 1920x1080
81 85 90 93 94 ~ 89 fps    + Compare
med. 1920x1080
76 77 84 84 89 ~ 82 fps    + Compare
high 1920x1080
63 66 70 72 77 ~ 70 fps    + Compare
ultra 1920x1080
47 52 52 53 55 55 58 ~ 53 fps    + Compare
QHD 2560x1440
40 41 42 44 45 47 48 ~ 44 fps    + Compare
4K 3840x2160
31 32 ~ 32 fps    + Compare
4K DLSS 3840x2160
41 44 ~ 43 fps    + Compare
QHD DLSS 2560x1440
49 51 58 59 ~ 54 fps    + Compare
» With all tested laptops playable in detail settings ultra.
Additional Benchmarks
Ultra High + GI + DLSS Quality + FG 2560x1440
78
70
84
Ultra High + GI + DLSS Quality + FG 3840x2160
56
low 1920x1080
443  fps    + Compare + 📈 Graph
med. 1920x1080
192.1 212 261 ~ 222 fps    + Compare + 📈 Graph
high 1920x1080
187.5 202 213 ~ 201 fps    + Compare + 📈 Graph
QHD 2560x1440
129.1 141.9 144 ~ 138 fps    + Compare + 📈 Graph
» With all tested laptops playable in detail settings high.
low 1920x1080
93.1  fps    + Compare
med. 1920x1080
84  fps    + Compare
ultra 1920x1080
67.2 70.8 ~ 69 fps    + Compare
QHD 2560x1440
54.7 55 ~ 55 fps    + Compare
4K 3840x2160
33.4  fps    + Compare
QHD DLSS 2560x1440
66.6 70.6 ~ 69 fps    + Compare
» With all tested laptops playable in detail settings ultra.
low 1920x1080
189.3  fps    + Compare + 📈 Graph
med. 1920x1080
145.2 152.4 153.5 ~ 150 fps    + Compare + 📈 Graph
high 1920x1080
118.8 125.2 126.7 ~ 124 fps    + Compare + 📈 Graph
ultra 1920x1080
84.1 88.2 90 ~ 87 fps    + Compare + 📈 Graph
QHD 2560x1440
59 62.7 65 ~ 62 fps    + Compare + 📈 Graph
QHD DLSS 2560x1440
79.2 86.1 94.7 ~ 87 fps    + Compare + 📈 Graph
» With all tested laptops playable in detail settings ultra.
low 1920x1080
126.7 144.4 158.1 ~ 143 fps    + Compare + 📈 Graph
high 1920x1080
93.5 102.4 118.6 ~ 105 fps    + Compare + 📈 Graph
ultra 1920x1080
82.2 89.9 101 105.1 107.4 ~ 97 fps    + Compare + 📈 Graph
QHD 2560x1440
63.5 68.4 77.6 80.8 82.5 ~ 75 fps    + Compare + 📈 Graph
4K 3840x2160
31.7 43.1 ~ 37 fps    + Compare
QHD DLSS 2560x1440
91.1 96 99.9 ~ 96 fps    + Compare + 📈 Graph
» With all tested laptops playable in detail settings ultra.
Additional Benchmarks
Very Ultra Preset + Full Path Tracing + Quality DLSS + Frame Generation 2560x1440
20.2
Stalker 2

Stalker 2

2024
med. 1920x1080
84.6 89.8 ~ 87 fps    + Compare + 📈 Graph
high 1920x1080
73.6 76.6 ~ 75 fps    + Compare + 📈 Graph
ultra 1920x1080
62 65.5 ~ 64 fps    + Compare + 📈 Graph
QHD 2560x1440
46.9 49.9 ~ 48 fps    + Compare + 📈 Graph
QHD DLSS 2560x1440
100.8 104.6 ~ 103 fps    + Compare + 📈 Graph
» With all tested laptops playable in detail settings ultra.
low 1920x1080
138 152 159 ~ 150 fps    + Compare
med. 1920x1080
135 142 150 ~ 142 fps    + Compare
high 1920x1080
100 100 121 ~ 107 fps    + Compare
ultra 1920x1080
94 94 97 112 ~ 99 fps    + Compare
QHD 2560x1440
65 68 68 89 ~ 73 fps    + Compare
4K 3840x2160
37  fps    + Compare
4K DLSS 3840x2160
58  fps    + Compare
QHD DLSS 2560x1440
98  fps    + Compare
» With all tested laptops playable in detail settings ultra.
med. 1920x1080
99.3  fps    + Compare + 📈 Graph
high 1920x1080
85.9  fps    + Compare + 📈 Graph
ultra 1920x1080
67.7  fps    + Compare + 📈 Graph
QHD 2560x1440
48  fps    + Compare + 📈 Graph
QHD DLSS 2560x1440
61.4  fps    + Compare + 📈 Graph
» With all tested laptops playable in detail settings ultra.
med. 1920x1080
90.9  fps    + Compare + 📈 Graph
high 1920x1080
88.8  fps    + Compare + 📈 Graph
ultra 1920x1080
87.7  fps    + Compare + 📈 Graph
QHD 2560x1440
73.1  fps    + Compare + 📈 Graph
QHD DLSS 2560x1440
84.6  fps    + Compare + 📈 Graph
» With all tested laptops playable in detail settings ultra.
low 1920x1080 cinem.
86.8  fps    + Compare + 📈 Graph
med. 1920x1080 cinem.
70.7 82.3 ~ 77 fps    + Compare + 📈 Graph
high 1920x1080 cinem.
66.5 72.2 ~ 69 fps    + Compare + 📈 Graph
ultra 1920x1080 cinem.
55.9 60.3 ~ 58 fps    + Compare + 📈 Graph
QHD 2560x1440 cinem.
40.3 43.5 ~ 42 fps    + Compare + 📈 Graph
QHD DLSS 2560x1440 cinem.
56.8 59.6 ~ 58 fps    + Compare + 📈 Graph
» With all tested laptops playable in detail settings ultra.
Additional Benchmarks
ultra, RT ultra, DLSS, FG RR 2560x1440 cinem.
64.9
low 1280x720 cinem.
84.7
low 1920x1080
133  fps    + Compare
med. 1920x1080
100  fps    + Compare
high 1920x1080
78  fps    + Compare
ultra 1920x1080
44  fps    + Compare
QHD 2560x1440
33  fps    + Compare
QHD DLSS 2560x1440
49  fps    + Compare
» With all tested laptops playable in detail settings ultra.
Additional Benchmarks
low TSR 100 1280x720
192
cinematic RT: Very High DLSS 68 FG 2560x1440
59
F1 24

F1 24

2024
low 1920x1080
247 322 ~ 285 fps    + Compare
med. 1920x1080
226 236 350 ~ 271 fps    + Compare
high 1920x1080
217 223 232 250 291 ~ 243 fps    + Compare
ultra 1920x1080
87.2 93 98.7 106.4 107.6 108 114.8 ~ 102 fps    + Compare
QHD 2560x1440
53.2 60.4 66.4 68.5 69.4 71.2 72.1 ~ 66 fps    + Compare
4K 3840x2160
28.1 35.6 ~ 32 fps    + Compare
4K DLSS 3840x2160
38.6 61.4 ~ 50 fps    + Compare
QHD DLSS 2560x1440
78.1 88.5 94.1 98.4 106 115.8 ~ 97 fps    + Compare
QHD FSR 2560x1440
113.8  fps    + Compare
» With all tested laptops playable in detail settings ultra.
med. 1920x1080
77.2  fps    + Compare + 📈 Graph
high 1920x1080
55  fps    + Compare + 📈 Graph
QHD 2560x1440
40  fps    + Compare + 📈 Graph
QHD DLSS 2560x1440
59.1  fps    + Compare + 📈 Graph
» With all tested laptops playable in detail settings high.
med. 1920x1080
106.5  fps    + Compare + 📈 Graph
high 1920x1080
102  fps    + Compare + 📈 Graph
ultra 1920x1080
83.8  fps    + Compare + 📈 Graph
QHD 2560x1440
60.7  fps    + Compare + 📈 Graph
QHD DLSS 2560x1440
83.9  fps    + Compare + 📈 Graph
» With all tested laptops playable in detail settings ultra.
med. 1920x1080
131.1  fps    + Compare + 📈 Graph
high 1920x1080
97.5  fps    + Compare + 📈 Graph
ultra 1920x1080
96  fps    + Compare + 📈 Graph
QHD 2560x1440
72.6  fps    + Compare + 📈 Graph
QHD DLSS 2560x1440
93.1  fps    + Compare + 📈 Graph
» With all tested laptops playable in detail settings ultra.
high 1920x1080
83  fps    + Compare + 📈 Graph
QHD 2560x1440
74.8  fps    + Compare + 📈 Graph
» With all tested laptops playable in detail settings high.
med. 1920x1080
143.8  fps    + Compare + 📈 Graph
high 1920x1080
141.7  fps    + Compare + 📈 Graph
ultra 1920x1080
141.4  fps    + Compare + 📈 Graph
QHD 2560x1440
101.6  fps    + Compare + 📈 Graph
» With all tested laptops playable in detail settings ultra.
med. 1920x1080
358  fps    + Compare + 📈 Graph
high 1920x1080
358  fps    + Compare + 📈 Graph
ultra 1920x1080
357  fps    + Compare + 📈 Graph
QHD 2560x1440
356  fps    + Compare + 📈 Graph
» With all tested laptops playable in detail settings ultra.
low 1920x1080
126  fps    + Compare
med. 1920x1080
114  fps    + Compare
high 1920x1080
98  fps    + Compare
ultra 1920x1080
74  fps    + Compare
QHD 2560x1440
47  fps    + Compare
» With all tested laptops playable in detail settings ultra.
Additional Benchmarks
Low Preset TAA 1280x720
183
low 1920x1080
93.2 93.2 108.9 ~ 98 fps    + Compare
med. 1920x1080
87.2 88.3 103.5 ~ 93 fps    + Compare
high 1920x1080
79.5 81.7 95.8 96 ~ 88 fps    + Compare
QHD 2560x1440
54.5 54.6 63.9 64.5 ~ 59 fps    + Compare
4K 3840x2160
33.6  fps    + Compare
» With all tested laptops playable in detail settings high.
Additional Benchmarks
High Preset + Ultra Ray Tracing 3840x2160
13.1
High Preset + Ultra Ray Tracing + Quality DLSS 3840x2160
22.9
High Preset + Ultra Ray Tracing + Quality DLSS + FG 2x 3840x2160
39.8
High Preset + Ultra Ray Tracing + Quality DLSS + FG 4x 3840x2160
72.4
low 1920x1080
521.4  fps    + Compare
med. 1920x1080
317.1  fps    + Compare
high 1920x1080
200.2  fps    + Compare
ultra 1920x1080
161.4  fps    + Compare
QHD 2560x1440
127.4  fps    + Compare
» With all tested laptops playable in detail settings ultra.
Additional Benchmarks
Low Preset 1280x720
641.8
med. 1920x1080
316  fps    + Compare + 📈 Graph
high 1920x1080
265  fps    + Compare + 📈 Graph
ultra 1920x1080
222  fps    + Compare + 📈 Graph
QHD 2560x1440
174.1  fps    + Compare + 📈 Graph
» With all tested laptops playable in detail settings ultra.
low 1920x1080
131.6 149.4 150.4 161.7 175.1 188.6 203 ~ 166 fps    + Compare
med. 1920x1080
127.4 134.4 138.5 139.8 156.8 166.9 169.2 178.7 ~ 151 fps    + Compare
high 1920x1080
115.9 117 126.4 133.9 135.4 138 143.2 144.6 154.1 ~ 134 fps    + Compare
ultra 1920x1080
104.9 105.4 115.7 119.6 124.1 126.7 129 129.9 132.4 135.5 ~ 122 fps    + Compare
QHD 2560x1440
68.4 71.7 75 80.8 81 81.6 82.6 84.3 87.5 ~ 79 fps    + Compare
4K 3840x2160
35.9 37.1 37.3 ~ 37 fps    + Compare
4K DLSS 3840x2160
57.4  fps    + Compare
4K FSR 3840x2160
33.6  fps    + Compare
QHD DLSS 2560x1440
81.5 83.6 91.2 91.6 93.9 94.2 102.1 ~ 91 fps    + Compare
» With all tested laptops playable in detail settings ultra.
Additional Benchmarks
Low Preset (FSR off) 1280x720
206
157
Ray Tracing Ultra Preset (DLSS off) 1920x1080
60.7
Ultra Preset (FSR2 on) 1920x1080
157.7
Ray Tracing Ultra Preset (DLSS off, no Path Tracing) 3840x2160
17.7
30min Start Ultra Preset (FSR off) 1920x1080
104.9
122.6
104.9
99.1
110.5
120.5
116.2
113.2
103.9
Ray Tracing Overdrive Preset (no DLSS, no FG) 3840x2160
3.7
Ray Tracing Overdrive Preset + DLSS 4 Transformer Quality (no FG) 3840x2160
19.4
19.9
18.9
Ray Tracing Overdrive Preset + DLSS 4 Transformer Quality + Frame Generation (M)FG 2x 3840x2160
34
35.8
31
Ray Tracing Overdrive Preset + DLSS 4 Transformer Quality + Frame Generation MFG 4x 3840x2160
61.8
66.8
54
low 1920x1080
167.7 175.8 175.9 176.3 202.6 ~ 180 fps    + Compare + 📈 Graph
med. 1920x1080
129.1 131.1 150.1 154.7 172.8 179.1 188 ~ 158 fps    + Compare + 📈 Graph
high 1920x1080
108.1 111.1 131.7 137.6 151.9 154.2 161 ~ 137 fps    + Compare + 📈 Graph
ultra 1920x1080
108.3 131.2 131.7 138.9 147.4 153.9 156 157 158.6 246.1 ~ 153 fps    + Compare + 📈 Graph
QHD 2560x1440
91 93.9 97.6 99.1 103 108.6 109.2 112.4 175.5 ~ 110 fps    + Compare + 📈 Graph
4K 3840x2160
46.6 59.2 91.4 ~ 66 fps    + Compare + 📈 Graph
4K DLSS 3840x2160
72.4 94.6 102.5 ~ 90 fps    + Compare
QHD DLSS 2560x1440
130  fps    + Compare
» With all tested laptops playable in detail settings ultra.
Additional Benchmarks
Low Preset SMAA 1280x720
245
233
Far Cry 6

Far Cry 6

2021
low 1280x720
170.9  fps    + Compare + 📈 Graph
med. 1920x1080
150.2  fps    + Compare + 📈 Graph
high 1920x1080
136  fps    + Compare + 📈 Graph
ultra 1920x1080
135.7  fps    + Compare + 📈 Graph
QHD 2560x1440
116.7  fps    + Compare + 📈 Graph
» With all tested laptops playable in detail settings ultra.
Additional Benchmarks
Low Graphics Quality 1920x1080
164.6
Ultra Graphics Quality + HD Textures + DXR TAA 1920x1080
102.4
Anno 1800

Anno 1800

2019
low 1280x720
182.4  fps    + Compare + 📈 Graph
med. 1920x1080
164.8  fps    + Compare + 📈 Graph
high 1920x1080
133.5  fps    + Compare + 📈 Graph
ultra 1920x1080
86.4  fps    + Compare + 📈 Graph
QHD 2560x1440
76.6  fps    + Compare + 📈 Graph
» With all tested laptops playable in detail settings ultra.
Strange Brigade

Strange Brigade

2018
low 1280x720
392 403 438 483 585 643 ~ 491 fps    + Compare
med. 1920x1080
201 338 348 362 464 479 ~ 365 fps    + Compare
high 1920x1080
156.5 294 308 328 381 403 ~ 312 fps    + Compare
ultra 1920x1080
136.4 266 276 303 337 347 353 ~ 288 fps    + Compare
QHD 2560x1440
103.8 198.9 209 228 229 246 250 ~ 209 fps    + Compare
4K 3840x2160
131.7 138.1 ~ 135 fps    + Compare
» With all tested laptops playable in detail settings ultra.
Far Cry 5

Far Cry 5

2018
low 1280x720
174  fps    + Compare + 📈 Graph
med. 1920x1080
155  fps    + Compare + 📈 Graph
high 1920x1080
145  fps    + Compare + 📈 Graph
ultra 1920x1080
142  fps    + Compare + 📈 Graph
QHD 2560x1440
144  fps    + Compare + 📈 Graph
» With all tested laptops playable in detail settings ultra.
Additional Benchmarks
Low Preset TAA 1920x1080
170
low 1280x720
107.9 121.8 138.7 144.1 155.1 155.8 156.9 165 173.7 ~ 147 fps    + Compare
med. 1920x1080
99.8 110.2 114.7 123.7 136.4 140.1 142.2 144.1 145.4 ~ 129 fps    + Compare
high 1920x1080
80.7 90.6 101.6 106.6 115.5 116 117.5 118.3 124.6 ~ 108 fps    + Compare
4K 3840x2160
91.8 108.2 ~ 100 fps    + Compare
» With all tested laptops playable in detail settings high.
low 1280x720
195.7 213 217 223 231 234 ~ 219 fps    + Compare
med. 1920x1080
164.7 180.2 183.4 197.6 208 216 221 230 ~ 200 fps    + Compare
high 1920x1080
135.8 144.3 147.8 156.8 163.1 166 167.2 173.1 180.1 181.4 ~ 162 fps    + Compare
QHD 2560x1440
107.6 109 119.7 125.2 126.2 127 129.5 132.4 134.2 139.2 ~ 125 fps    + Compare
4K 3840x2160
74.1 77.5 78.8 ~ 77 fps    + Compare
» With all tested laptops playable in detail settings high.
low 1280x720
166.9 170.3 209 213 223 223 228 256 263 ~ 217 fps    + Compare
med. 1366x768
153.7 155.7 183.9 186 192.9 198.2 199.7 217 222 ~ 190 fps    + Compare
high 1920x1080
145.7 152.7 175.8 178.8 185.5 189.3 189.7 213 215 ~ 183 fps    + Compare
ultra 1920x1080
134.2 141.1 164.7 165.4 171.4 174 174.8 193 193.9 ~ 168 fps    + Compare
4K 3840x2160
170.7 173.1 ~ 172 fps    + Compare
» With all tested laptops playable in detail settings ultra.
low 1024x768
686  fps    + Compare + 📈 Graph
med. 1366x768
517  fps    + Compare + 📈 Graph
high 1920x1080
341  fps    + Compare + 📈 Graph
ultra 1920x1080
154 176.2 ~ 165 fps    + Compare + 📈 Graph
QHD 2560x1440
130  fps    + Compare + 📈 Graph
» With all tested laptops playable in detail settings ultra.
Additional Benchmarks
Medium Graphics & Postprocessing 1920x1080
394
GTA V

GTA V

2015
low 1024x768
185.8 187.6 ~ 187 fps    + Compare
med. 1366x768
185.4 185.6 186 187.6 ~ 186 fps    + Compare
high 1920x1080
164.5 179 180.2 181 184.7 ~ 178 fps    + Compare
ultra 1920x1080
124.7 144.8 147.6 149 152.9 161 161 164.6 ~ 151 fps    + Compare
QHD 2560x1440
117.3 123.8 138.8 139.1 143 147.3 147.3 151.4 ~ 139 fps    + Compare
4K 3840x2160
124.2  fps    + Compare
» With all tested laptops playable in detail settings ultra.
Additional Benchmarks
Highest Settings possible 16xAF 4xMSAA + FXAA 3840x2160
83.3
62.5
Normal/Off 4xAF 1920x1080
184.1
187.2
Lowest Settings possible 1920x1080
186.3
187.9
lowmed.highultraQHD4K
F1 252182061843621
Doom: The Dark Ages9389797854
The Elder Scrolls IV Oblivion Remastered11698844230
Assassin's Creed Shadows898270534432
Civilization 7443222201138
Monster Hunter Wilds93.184695533.4
Kingdom Come Deliverance 2189.31501248762
Indiana Jones and the Great Circle143105977537
Stalker 287756448
Call of Duty Black Ops 6150142107997337
Until Dawn99.385.967.748
Space Marine 290.988.887.773.1
Star Wars Outlaws86.877695842
Black Myth: Wukong133100784433
F1 242852712431026632
Senua's Saga Hellblade 277.25540
Ghost of Tsushima106.510283.860.7
Horizon Forbidden West131.197.59672.6
Dragon's Dogma 28374.8
Helldivers 2143.8141.7141.4101.6
Prince of Persia The Lost Crown358358357356
Avatar Frontiers of Pandora126114987447
Alan Wake 29893885933.6
Total War Pharaoh521.4317.1200.2161.4127.4
Counter-Strike 2316265222174.1
Cyberpunk 2077 2.2 Phantom Liberty1661511341227937
Baldur's Gate 318015813715311066
Far Cry 6170.9150.2136135.7116.7
Anno 1800182.4164.8133.586.476.6
Strange Brigade491365312288209135
Far Cry 5174155145142144
X-Plane 11.11147129108100
Final Fantasy XV Benchmark21920016212577
Dota 2 Reborn217190183168172
The Witcher 3686517341165130
GTA V187186178151139124.2
lowmed.highultraQHD4K
< 30 fps
< 60 fps
< 120 fps
≥ 120 fps


6
20


13
21

1
16
18

5
13
12
1
11
13
9

7
3
3

For more games that might be playable and a list of all games and graphics cards visit our Gaming List

v1.33
log 12. 15:15:49

#0 ran 0s before starting gpusingle class +0s ... 0s

#1 no ids found in url (should be separated by "_") +0s ... 0s

#2 not redirecting to Ajax server +0s ... 0s

#3 did not recreate cache, as it is less than 5 days old! Created at Wed, 10 Sep 2025 11:52:14 +0200 +0.001s ... 0.001s

#4 no comparison url found in template nbc.compare_page_1 needed +0.023s ... 0.024s

#5 no comparison url found in template nbc.compare_page_1 needed +0s ... 0.024s

#6 no comparison url found in template nbc.compare_page_1 needed +0s ... 0.024s

#7 no comparison url found in template nbc.compare_page_1 needed +0s ... 0.024s

#8 no comparison url found in template nbc.compare_page_1 needed +0s ... 0.025s

#9 composed specs +0s ... 0.025s

#10 did output specs +0s ... 0.025s

#11 start showIntegratedCPUs +0s ... 0.025s

#12 getting avg benchmarks for device 12926 +0.023s ... 0.047s

#13 got single benchmarks 12926 +0.034s ... 0.081s

#14 got avg benchmarks for devices +0s ... 0.081s

#15 min, max, avg, median took s +0.961s ... 1.042s

#16 before gaming benchmark output +0s ... 1.043s

#17 Got 581 rows for game benchmarks. +0.207s ... 1.249s

#18 composed SQL query for gamebenchmarks +0s ... 1.249s

#19 got data and put it in $dataArray +0.023s ... 1.273s

#20 benchmarks composed for output. +0.295s ... 1.567s

#21 no comparison url found in template nbc.compare_page_1 needed +0.003s ... 1.57s

#22 return log +0s ... 1.57s

Notebook reviews with Nvidia GeForce RTX 5070 Ti Laptop graphics card

最便宜的 Nvidia RTX 5070 Ti 笔记本电脑 GPU - XMG Focus 17 M25 游戏笔记本电脑评测

最便宜的 Nvidia RTX 5070 Ti 笔记本电脑 GPU - XMG Focus 17 M25 游戏笔记本电脑评测

新款 XMG Focus 17 M25 是获得新款 NvidiaGeForce RTX 5070 Ti 笔记本 GPU 的最经济实惠的方式。这款 17 英寸游戏笔记本电脑现已上市,起价为 1,849 欧元(当前汇率约合人民币 2,100 元),但您需要为这个价格做出哪些妥协呢?...
Intel Core i9-13900HX | Nvidia GeForce RTX 5070 Ti Laptop | 17.30" | 2.8 kg
Chuwi Gamebook

配备 Ryzen 9 9955HX 和 RTX 5070 Ti GPU 的游戏笔记本 - Chuwi Gamebook 评测

Chuwi Gamebook 拥有高品质的外壳设计和更强大的组件。这使得该笔记本电脑在功能和外观上都更接近更高级的游戏机型。整体性能令人印象深刻。不过,也必须接受一些小的妥协。...
AMD Ryzen 9 9955HX | Nvidia GeForce RTX 5070 Ti Laptop | 16.00" | 2.5 kg
超速运行的 RTX 5070 Ti:Medion Erazer Major 16 X1 游戏笔记本电脑评测

超速运行的 RTX 5070 Ti:Medion Erazer Major 16 X1 游戏笔记本电脑评测

Medion 的 Erazer Major 16 X1 将坚固的机箱与由 RTX 5070 Ti 驱动的坚如磐石的性能结合在一起。在我们的评测中,这款 16 英寸游戏笔记本电脑与 RTX 5070 和 RTX 5080 等黑科技一代的竞争对手进行了正面交锋。...
Intel Core Ultra 7 255HX | Nvidia GeForce RTX 5070 Ti Laptop | 16.00" | 2.5 kg
迄今最强大的 RTX 5070 Ti 玩家 - 联想Legion Pro 5 16IAX10H OLED 评测

迄今最强大的 RTX 5070 Ti 玩家 - 联想Legion Pro 5 16IAX10H OLED 评测

怎样才能让去年的一款杰出游戏笔记本电脑成为更好的新机型?保持优点,改进缺点!这正是联想在今年的Legion Pro 5 16 上所做的。我们的评测将揭示它是否完全成功。...
Intel Core Ultra 9 275HX | Nvidia GeForce RTX 5070 Ti Laptop | 16.00" | 2.4 kg
微星 Vector 16 HX AI 评测:搭载 RTX 5070 Ti、功能丰富的游戏笔记本电脑

微星 Vector 16 HX AI 评测:搭载 RTX 5070 Ti、功能丰富的游戏笔记本电脑

微星推出的 Vector 16 HX AI 是一款引人注目的游戏笔记本,采用了最先进的英特尔(箭湖)和 Nvidia(黑睿)硬件。然而,仔细观察会发现其表面下存在一些小瑕疵。...
Intel Core Ultra 7 255HX | Nvidia GeForce RTX 5070 Ti Laptop | 16.00" | 2.6 kg

Asus ROG Zephyrus G16 2025 5070 Ti: Intel Core Ultra 9 285H, 16.00", 1.9 kg
  Review » 纤薄游戏玩家的 RTX 5070 Ti 笔记本电脑给人留下深刻印象--华硕 ROG Zephyrus G16 2025 评测

Asus ROG Zephyrus G14 2025 5070 Ti: AMD Ryzen AI 9 HX 370, 14.00", 1.6 kg
  Review » RTX 5070 Ti 笔记本电脑几乎与 RTX 5080 笔记本电脑一样快 - 华硕 ROG Zephyrus G14 2025 评测

MSI Vector A18 HX A9W: AMD Ryzen 9 9955HX, 18.00", 3.5 kg
  Review » 微星 Vector A18 HX A9W 笔记本电脑评测: GeForce RTX 5070 Ti 才是王道

SCHENKER XMG Pro 16 (E25): Intel Core Ultra 9 275HX, 16.00", 2.5 kg
  Review » RTX 5070 Ti 笔记本电脑和高达 128 GB 内存的游戏/工作站混合型笔记本电脑 - XMG Pro 16 (E25) 笔记本电脑评测

SCHENKER XMG Pro 16 (E25) Engineering Sample: Intel Core Ultra 9 275HX
  Review » 仅有 12 GB VRAM 的高端产品? - NvidiaGeForce RTX 5070 Ti 笔记本电脑评测

Asus ROG Strix G18 G815LR: Intel Core Ultra 9 275HX, 18.00", 3.2 kg
  External Review » Asus ROG Strix G18 G815LR

Alienware 16 Area-51, RTX 5070 Ti: Intel Core Ultra 9 275HX, 16.00", 3.4 kg
  External Review » Alienware 16 Area-51, RTX 5070 Ti

Lenovo Legion Pro 5 16IAX10, RTX 5070 Ti: Intel Core Ultra 9 275HX, 16.00", 2.4 kg
  External Review » Lenovo Legion Pro 5 16IAX10, RTX 5070 Ti

Asus ROG Zephyrus G16 2025 5070 Ti: Intel Core Ultra 9 285H, 16.00", 1.9 kg
  External Review » Asus ROG Zephyrus G16 2025 5070 Ti

Chuwi Gamebook, R9 9955HX: AMD Ryzen 9 9955HX, 16.00", 2.5 kg
  External Review » Chuwi Gamebook, R9 9955HX

Asus ROG Zephyrus G16 GU605CR: Intel Core Ultra 9 285H, 16.00", 2 kg
  External Review » Asus ROG Zephyrus G16 GU605CR

Asus ROG Strix G16 G615LR: Intel Core Ultra 9 275HX, 16.00", 2.7 kg
  External Review » Asus ROG Strix G16 G615LR

Asus ROG Zephyrus G14 2025 5070 Ti: AMD Ryzen AI 9 HX 370, 14.00", 1.6 kg
  External Review » Asus ROG Zephyrus G14 2025 5070 Ti

MSI Vector 16 HX AI A2XWHG, Ultra 9 275HX: Intel Core Ultra 9 275HX, 16.00", 2.7 kg
  External Review » MSI Vector 16 HX AI A2XWHG, Ultra 9 275HX

Asus ROG Strix G16 G614FR: AMD Ryzen 9 9955HX3D, 16.00", 2.5 kg
  External Review » Asus ROG Strix G16 G614FR

MSI Stealth A18 AI+ A3XWHG: AMD Ryzen AI 9 HX 370, 18.00", 2.9 kg
  External Review » MSI Stealth A18 AI+ A3XWHG

Asus ROG Zephyrus G14 GA403WR: AMD Ryzen AI 9 HX 370, 14.00", 1.6 kg
  External Review » Asus ROG Zephyrus G14 GA403WR

MSI Vector 16 HX AI A2XWHG: Intel Core Ultra 7 255HX, 16.00", 2.6 kg
  External Review » MSI Vector 16 HX AI A2XWHG

Acer Predator Helios Neo 18 AI PHN18-72: Intel Core Ultra 9 275HX, 18.00", 3.3 kg
  External Review » Acer Predator Helios Neo 18 AI PHN18-72

SCHENKER XMG Focus 17 M25: Intel Core i9-13900HX, 17.30", 2.8 kg
   » 配备 RTX 5070 Ti 的 XMG Focus 17 M25 是目前最超值的游戏笔记本电脑

Chuwi Gamebook, R9 9955HX: AMD Ryzen 9 9955HX, 16.00", 2.5 kg
   » 楚维进军游戏领域--配备 AMD Ryzen 9 和 NvidiaGeForce RTX 5070 Ti 笔记本图形处理器的强大笔记本电脑评测

MSI Vector A18 HX A9W: AMD Ryzen 9 9955HX, 18.00", 3.5 kg
   » 这些是目前配备GeForce RTX 5070 显卡的最慢和最快的笔记本电脑

Lenovo Legion 5 Pro 16IAX10H: Intel Core Ultra 9 275HX, 16.00", 2.4 kg
   » 联想Legion Pro 5i 16 与Legion Pro 7i 16:我们对两者进行了评测

Asus ROG Zephyrus G14 2025 5070 Ti: AMD Ryzen AI 9 HX 370, 14.00", 1.6 kg
   » 华硕 ROG Zephyrus G16 评论:功能强大,但速度仍慢于较小的 G14 同类产品

Asus ROG Zephyrus G16 2025 5070 Ti: Intel Core Ultra 9 285H, 16.00", 1.9 kg
   » 华硕 ROG Zephyrus G16 评论:功能强大,但速度仍慢于较小的 G14 同类产品

Asus ROG Zephyrus G14 2025 5070 Ti: AMD Ryzen AI 9 HX 370, 14.00", 1.6 kg
   » 华硕 ROG Zephyrus G14 是无与伦比的,因为 Razer Blade 14 只能使用 RTX 5070 笔记本电脑

SCHENKER XMG Pro 16 (E25): Intel Core Ultra 9 275HX, 16.00", 2.5 kg
   » 用 RTX 4070 笔记本电脑的钱购买 RTX 4080 笔记本电脑的性能 - 在我们的评测中,配备全新 5070 Ti 笔记本电脑的 XMG Pro 16 显示出强劲性能

Please share our article, every link counts!
Mail Logo

» Comparison of GPUs
Detailed list of all laptop GPUs sorted by class and performance.

» Benchmark List
Sort and restrict laptop GPUs based on performance in synthetic benchmarks.

» Notebook Gaming List
Playable games for each graphics card and their average FPS results.

Class 1

Class 2

GeForce RTX 2080 Super Mobile
RTX PRO 2000 Blackwell Generation Laptop *
M1 Max 32-Core GPU *
GeForce RTX 2070 Super Mobile
M1 Max 24-Core GPU *
Quadro RTX 5000 Max-Q
Radeon 8050S *
Radeon RX 5700M *
GeForce GTX 1080 Mobile
Quadro RTX 4000 (Laptop)
M1 Pro 16-Core GPU *
Radeon PRO W6600M *
GeForce RTX 2070 Super Max-Q
Quadro RTX 4000 Max-Q *
M1 Pro 14-Core GPU *
Quadro P5200
RTX PRO 1000 Blackwell Generation Laptop *
Quadro RTX 3000 Max-Q *
Quadro P4200
RTX PRO 500 Blackwell Generation Laptop *
Radeon 8040S *
Arc 140T *
Quadro P5000 Max-Q *
Arc 130T *

Class 3

GeForce GTX 980 (Laptop)
Quadro P4000
Quadro P4000 Max-Q
Quadro P3200
Radeon RX 580X (Laptop) *
Radeon RX 580 (Laptop)
Radeon Pro 5300M
Radeon RX 5300M
Quadro P3000 Max-Q *
Quadro T2000 Max-Q *
Radeon Pro WX 7100 *
Radeon RX 570X (Laptop) *
Radeon RX 570 (Laptop) *
Radeon RX 470 (Laptop) *
Quadro T1000 Max-Q *
Vega M GH
Quadro M5000M
GeForce GTX 1050 Ti Mobile
Radeon 680M
Quadro P2000
Quadro P2000 Max-Q
Quadro M4000M
T500 Laptop GPU *
Radeon R9 M395X
GeForce GTX 1050 Ti Max-Q *
Radeon Pro Vega 16
WX Vega M GL
Radeon R9 M485X
Quadro M3000M
FirePro W7170M
Radeon R9 M395
GeForce GTX 1050 Max-Q *
Radeon 660M
Radeon Pro WX 4150 *
Radeon RX 560X (Laptop)
Radeon RX 560 (Laptop)
Radeon RX 460 (Laptop)
Quadro P1000
Radeon R9 M390
Xe MAX
Radeon Pro 560X
Radeon Pro 560
Radeon Pro 460
Radeon Pro WX 4130 *
GeForce GTX 960M
Quadro P620 *
Radeon RX 550X (Laptop)
Radeon Pro WX 3200 *
Radeon Pro 555X
Radeon Pro 555
Radeon Pro 455
Quadro P600
Arc Graphics 3-core (Arrow Lake) *
Quadro M2000M
Radeon RX 540X *
Radeon Pro WX 2100 *
Radeon Pro WX 3100 *
Arc Graphics 2-core (Arrow Lake) *
GeForce GTX 950M
Radeon Pro 450
Radeon 630
Radeon 540X *
Radeon R9 M385X
Quadro P520
Quadro M1000M
GeForce 945M
Quadro P500 *
Iris Plus Graphics G7 (Ice Lake 64 EU) *
Vega 10 *
Iris Pro Graphics 580
FirePro W5170M *
Radeon R9 M370X
Vega 9
FirePro W5130M
UHD Graphics Xe G4 48EUs *
UHD Graphics 32EUs
UHD Graphics Xe 32EUs (Tiger Lake-H) *
UHD Graphics 750
UHD Graphics 730
Vega 7
Radeon R7 M465
Iris Pro Graphics 6200
Vega 8
GeForce 940M
Iris Plus Graphics G4 (Ice Lake 48 EU)
Quadro M600M
FirePro W4190M
Radeon R9 M375
Radeon R7 M445
Iris Plus Graphics 650
Iris Graphics 550
Radeon 625
Vega 6 *
Iris Plus Graphics 640
Iris Graphics 540
UHD Graphics 24EUs (Alder Lake-N) *
Radeon R7 M360
GeForce 920M
Radeon 620
Radeon R7 M340
Radeon 610
Radeon 610M *
Vega 6 *
UHD Graphics G1 (Ice Lake 32 EU)
UHD Graphics Xe 16EUs (Tiger Lake-H) *
HD Graphics 530
Radeon R5 (Bristol Ridge)
Adreno 690 *
Adreno 685 *
Adreno 680 *
Radeon R5 M330
GeForce 910M
HD Graphics 520

Class 4

Radeon R5 M320 *
Radeon R5 M315 *
Radeon R5 M420 *
Vega 2 *
UHD Graphics 617
UHD Graphics 615
HD Graphics 515
UHD Graphics 610
HD Graphics 510
UHD Graphics 605
Radeon R4 (Stoney Ridge)
Radeon R2 (Stoney Ridge)
VideoCore VII *
UHD Graphics 600
HD Graphics (Braswell)

* Approximate position of the graphics adapter

Klaus Hinum (Update: 2025-07-29)