Notebookcheck Logo

Apple M2 Pro 19-Core GPU

Apple M2 Pro 19-Core GPU

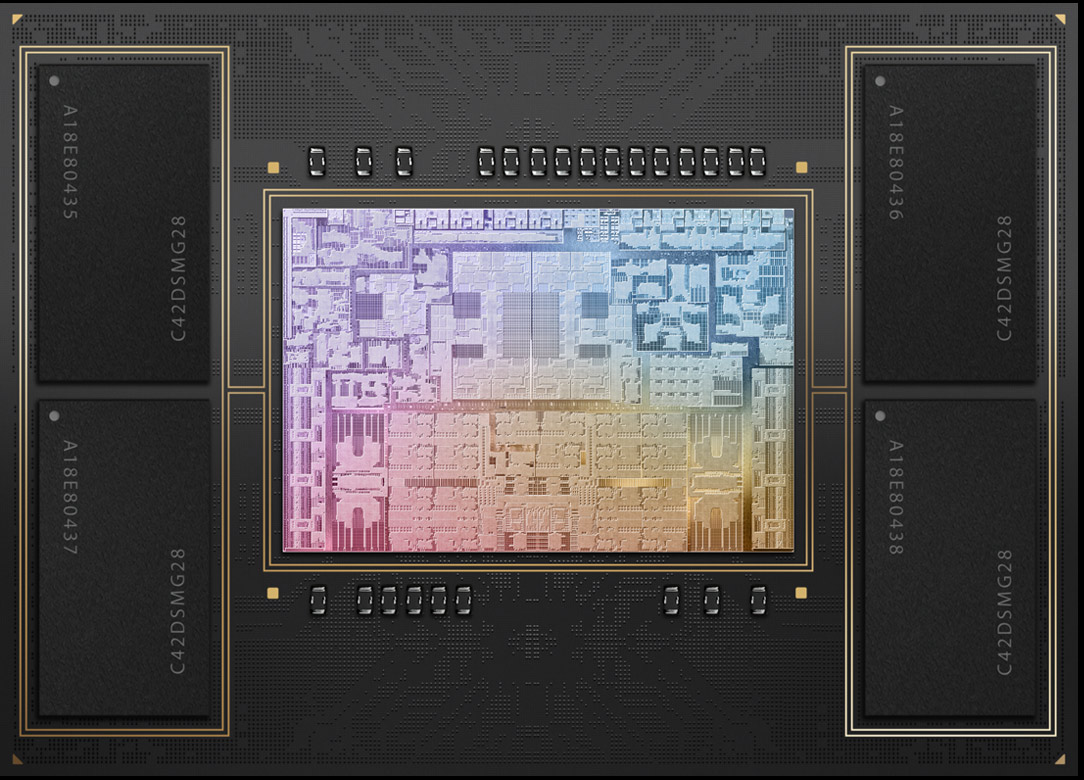
Apple M2 Pro 19 核 GPU 是Apple 的一款集成显卡,提供 M2 Pro 芯片中的全部 19 个内核。M2 Pro 芯片.

该显卡没有专用显存,但可以使用 256 位总线(高达 200 GBit/s)的快速 LPDDR5-6400 统一显存。图形处理器的频率从 444 MHz 到 1398 MHz,在游戏中保持在 1398 MHz。

根据Apple 的数据,其性能应比旧版的 16 核 GPU 高出 30%。 M1 Pro 的 16 核 GPU 高出 30% 。.

GPU 将使用Apple Metal 2 API,但仍可能基于较老的 PowerVR 架构(最后用于Apple A10)。2023 年款 MacBook Pro 14 和 16 的一个新功能是支持 HDMI 2.1 和 8k 输出。

Apple M2 Pro 采用台积电第二代 5 纳米工艺制造。M2 Pro 的 GPU 部分在游戏中的功耗略低于 20 瓦(用 powermetrics 测量的《边陲 3》)。

Apple M2 Series

M2 Max 38-Core GPU 38
M2 Max 30-Core GPU 30
M2 Pro 19-Core GPU 19 @ 0.44 - 1.4 GHz
M2 Pro 16-Core GPU 16
M2 10-Core GPU 10 @ 1.4 GHz
M2 8-Core GPU 8 @ 1.4 GHz
Pipelines19 - unified
Core Speed444 - 1398 (Boost) MHz
Memory TypeLPDDR5-6400
Shared Memoryno
Power Consumption20 Watt
technology5 nm
Notebook Sizemedium sized
Date of Announcement17.01.2023
CPU in M2 Pro 19-Core GPUGPU Base SpeedGPU Boost / Turbo
Apple M2 Pro12 x 2424 MHz? MHz? MHz

Benchmarks

3DMark - 3DMark Wild Life Extreme Unlimited
min: 12968     avg: 12983     median: 12982.5 (15%)     max: 12997 Points
Blender - Blender 3.3 Classroom METAL *
97 Seconds (10%)
Cinebench R15
Cinebench R15 OpenGL 64 Bit +
Cinebench R15 - Cinebench R15 OpenGL 64 Bit
140.9 fps (8%)
Cinebench R15 OpenGL Ref. Match 64 Bit +
Cinebench R15 - Cinebench R15 OpenGL Ref. Match 64 Bit
99.5 % (100%)
GFXBench - GFXBench 5.0 4K Aztec Ruins High Tier Offscreen
min: 92.1     avg: 92.2     median: 92.2 (37%)     max: 92.2 fps
GFXBench - GFXBench 5.0 Aztec Ruins High Tier Offscreen
min: 210.4     avg: 210.6     median: 210.6 (38%)     max: 210.7 fps
3.3 -98%
...
Apple M1 Pro 14-Core GPU
147 -30%
NVIDIA Quadro RTX 5000 Max-Q
153 -27%
161.4 -23%
Apple M1 Pro 16-Core GPU
166 -21%
178.7 -15%
181.1 -14%
185.4 -12%
187 -11%
208 -1%
Apple M2 Pro 19-Core GPU
210.6
219.7 4%
Apple M1 Max 24-Core GPU
240 14%
242.3 15%
248.5 18%
261.5 24%
288.5 37%
Apple M1 Max 32-Core GPU
309.4 47%
326.1 55%
397.6 89%
...
536 155%
0%
100%
GFXBench - GFXBench 5.0 Aztec Ruins Normal Tier Offscreen
min: 565.3     avg: 567     median: 566.7 (42%)     max: 568 fps
GFXBench - GFXBench Car Chase Offscreen
min: 434.4     avg: 435.2     median: 435.2 (49%)     max: 436 fps
GFXBench 3.1 - GFXBench Manhattan ES 3.1 Offscreen
min: 748     avg: 748     median: 748.2 (16%)     max: 748.4 fps
GFXBench 3.0 - GFXBench 3.0 Manhattan Offscreen
min: 1126.4     avg: 1131     median: 1131.2 (66%)     max: 1136 fps
GFXBench (DX / GLBenchmark) 2.7
GFXBench T-Rex HD Offscreen C24Z16 +
GFXBench (DX / GLBenchmark) 2.7 - GFXBench T-Rex HD Offscreen C24Z16
min: 1967.2     avg: 1970     median: 1969.6 (16%)     max: 1972 fps
Geekbench 6.2 - Geekbench 6.2 GPU Metal
82134 points (53%)
Power Consumption - The Witcher 3 Power Consumption - external Monitor *
49.6 Watt (7%)
05101520253035404550Tooltip
Power Consumption - Witcher 3 Power Consumption *
55.9 Watt (12%)
0510152025303540455055Tooltip
Power Consumption - Witcher 3 ultra Power Efficiency - external Monitor
min: 1.028     avg: 1     median: 1 (85%)     max: 1.207 fps per Watt
- Range of benchmark values for this graphics card
- Average benchmark values for this graphics card
* Smaller numbers mean a higher performance

Game Benchmarks

The following benchmarks stem from our benchmarks of review laptops. The performance depends on the used graphics memory, clock rate, processor, system settings, drivers, and operating systems. So the results don't have to be representative for all laptops with this GPU. For detailed information on the benchmark results, click on the fps number.

Cyberpunk 2077 2.0 Phantom Liberty

Cyberpunk 2077 2.0 Phantom Liberty

2023
low 1920x1080
39.6  fps    + Compare
med. 1920x1080
33.5  fps    + Compare
high 1920x1080
29.3  fps    + Compare
ultra 1920x1080
26.5  fps    + Compare
» With all tested laptops playable in detail settings low.
ultra 1920x1080
34  fps    + Compare
» The benchmarks indicate that the game is not playable in the tested settings.
low 1280x720
75.9 79 ~ 77 fps    + Compare
med. 1920x1080
54 60.3 ~ 57 fps    + Compare
high 1920x1080
40 40.6 ~ 40 fps    + Compare
ultra 1920x1080
29 30.4 ~ 30 fps    + Compare
» With all tested laptops playable in detail settings high.
Additional Benchmarks
Very Low Overall Quality (DX11) 1920x1080
78.6
low 1280x720
269  fps    + Compare
med. 1920x1080
84  fps    + Compare
high 1920x1080
54  fps    + Compare
ultra 1920x1080
40  fps    + Compare
QHD 2560x1440
25  fps    + Compare
» With all tested laptops playable in detail settings ultra.
low 1280x720
169  fps    + Compare
med. 1920x1080
80  fps    + Compare
high 1920x1080
72  fps    + Compare
ultra 1920x1080
63  fps    + Compare
QHD 2560x1440
40  fps    + Compare
» With all tested laptops playable in detail settings ultra.
high 1920x1080
57  fps    + Compare
ultra 1920x1080
51  fps    + Compare
» With all tested laptops playable in detail settings ultra.
lowmed.highultraQHD4K
Cyberpunk 2077 2.0 Phantom Liberty39.633.529.326.5
Baldur's Gate 334
Borderlands 377574030
Total War: Three Kingdoms26984544025
Shadow of the Tomb Raider16980726340
The Witcher 35751
< 30 fps
< 60 fps
< 120 fps
≥ 120 fps

1
1
2

2
2
1
3
1
1
4
1
1
1


For more games that might be playable and a list of all games and graphics cards visit our Gaming List

v1.26
log 25. 15:29:03

#0 no ids found in url (should be separated by "_") +0s ... 0s

#1 not redirecting to Ajax server +0s ... 0s

#2 did not recreate cache, as it is less than 5 days old! Created at Thu, 25 Apr 2024 05:40:10 +0200 +0.001s ... 0.001s

#3 no comparison url found in template nbc.compare_page_1 needed +0.041s ... 0.042s

#4 no comparison url found in template nbc.compare_page_1 needed +0s ... 0.043s

#5 no comparison url found in template nbc.compare_page_1 needed +0s ... 0.043s

#6 no comparison url found in template nbc.compare_page_1 needed +0s ... 0.043s

#7 no comparison url found in template nbc.compare_page_1 needed +0s ... 0.043s

#8 composed specs +0s ... 0.043s

#9 did output specs +0s ... 0.043s

#10 start showIntegratedCPUs +0s ... 0.043s

#11 getting avg benchmarks for device 11568 +0.013s ... 0.056s

#12 got single benchmarks 11568 +0.009s ... 0.065s

#13 got avg benchmarks for devices +0s ... 0.065s

#14 min, max, avg, median took s +0.209s ... 0.274s

#15 before gaming benchmark output +0s ... 0.274s

#16 Got 41 rows for game benchmarks. +0.007s ... 0.281s

#17 composed SQL query for gamebenchmarks +0s ... 0.281s

#18 got data and put it in $dataArray +0.004s ... 0.286s

#19 benchmarks composed for output. +0.228s ... 0.514s

#20 no comparison url found in template nbc.compare_page_1 needed +0.002s ... 0.516s

#21 return log +0s ... 0.516s

Please share our article, every link counts!

» Comparison of GPUs
Detailed list of all laptop GPUs sorted by class and performance.

» Benchmark List
Sort and restrict laptop GPUs based on performance in synthetic benchmarks.

» Notebook Gaming List
Playable games for each graphics card and their average FPS results.

Class 1

GeForce RTX 2080 Super Mobile

Class 2

M1 Max 32-Core GPU *
GeForce RTX 2070 Super Mobile
M1 Max 24-Core GPU *
Quadro RTX 5000 Max-Q
Radeon RX 5700M *
GeForce GTX 1080 Mobile
Quadro RTX 4000 (Laptop)
M1 Pro 16-Core GPU *
Radeon PRO W6600M *
GeForce RTX 2070 Super Max-Q
Quadro RTX 4000 Max-Q *
M1 Pro 14-Core GPU *
Quadro P5200
Quadro RTX 3000 Max-Q *
Quadro P4200
Quadro P5000 Max-Q *
GeForce GTX 980 (Laptop)
Quadro P4000
Quadro P4000 Max-Q
Quadro P3200
Radeon RX 580X (Laptop) *
Radeon RX 580 (Laptop)
Radeon Pro 5300M
Radeon RX 5300M
Quadro P3000 Max-Q *
Quadro T2000 Max-Q *
Radeon Pro WX 7100 *
Radeon RX 570X (Laptop) *
Radeon RX 570 (Laptop) *
Radeon RX 470 (Laptop) *
Quadro T1000 Max-Q *

Class 3

Vega M GH
Quadro M5000M
GeForce GTX 1050 Ti Mobile
Radeon 680M
Quadro P2000
Quadro P2000 Max-Q
Quadro M4000M
T500 Laptop GPU *
Radeon R9 M395X
GeForce GTX 1050 Ti Max-Q *
Radeon Pro Vega 16
WX Vega M GL
Radeon R9 M485X
Quadro M3000M
FirePro W7170M
Radeon R9 M395
GeForce GTX 1050 Max-Q *
Radeon 660M
Radeon Pro WX 4150 *
Radeon RX 560X (Laptop)
Radeon RX 560 (Laptop)
Radeon RX 460 (Laptop)
Quadro P1000
Radeon R9 M390
Xe MAX
Radeon Pro 560X
Radeon Pro 560
Radeon Pro 460
Radeon Pro WX 4130 *
GeForce GTX 960M
Quadro P620 *
Radeon RX 550X (Laptop)
Radeon Pro WX 3200 *
Radeon Pro 555X
Radeon Pro 555
Radeon Pro 455
Quadro P600
Quadro M2000M
Radeon RX 540X *
Radeon Pro WX 2100 *
Radeon Pro WX 3100 *
GeForce GTX 950M
Radeon Pro 450
Radeon 630
Radeon 540X *
Radeon R9 M385X
Quadro P520
Quadro M1000M
GeForce 945M
Quadro P500 *
Iris Plus Graphics G7 (Ice Lake 64 EU) *
Vega 10 *
Iris Pro Graphics 580
FirePro W5170M *
Radeon R9 M370X
Vega 9
FirePro W5130M
UHD Graphics Xe G4 48EUs *
UHD Graphics 32EUs
UHD Graphics Xe 32EUs (Tiger Lake-H) *
UHD Graphics 750
Vega 7
Radeon R7 M465
Iris Pro Graphics 6200
Vega 8
GeForce 940M
Iris Plus Graphics G4 (Ice Lake 48 EU)
Quadro M600M
FirePro W4190M
Radeon R9 M375
Radeon R7 M445
Iris Plus Graphics 650
Iris Graphics 550
Radeon 625
Vega 6 *
Iris Plus Graphics 640
Iris Graphics 540
UHD Graphics 24EUs (Alder Lake-N) *
Radeon R7 M360
GeForce 920M
Radeon 620
Radeon R7 M340
Radeon 610
Radeon 610M *
Vega 6 *
UHD Graphics G1 (Ice Lake 32 EU)
UHD Graphics Xe 16EUs (Tiger Lake-H) *
HD Graphics 530
Radeon R5 (Bristol Ridge)
Adreno 690 *
Adreno 685 *
Adreno 680 *
Radeon R5 M330
GeForce 910M
HD Graphics 520

Class 4

UHD Graphics 730
Radeon R5 M320 *
Radeon R5 M315 *
Radeon R5 M420 *
Vega 2 *
Xclipse 530
UHD Graphics 617
UHD Graphics 615
HD Graphics 515
UHD Graphics 610
HD Graphics 510
UHD Graphics 605
Radeon R4 (Stoney Ridge)
Radeon R2 (Stoney Ridge)
HD Graphics (Broadwell)
UHD Graphics 600
HD Graphics (Braswell)

Class 5

* Approximate position of the graphics adapter