


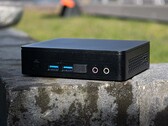
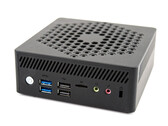
英特尔NUC11基本套件别名Atlas Canyon,配备英特尔奔腾银N6005和英特尔赛扬N4505评测
英特尔的NUC11基本套件基于英特尔Jasper Lake SoC,非常适合办公室工作。我们仔细观察了这款迷你PC,它采用了英特尔奔腾银N6005和英特尔赛扬N4505。在这篇评论中,你可以了解到这两个系统的特点。
Intel Pentium Silver N6005, UHD Graphics (Jasper Lake 32 EU), 530 g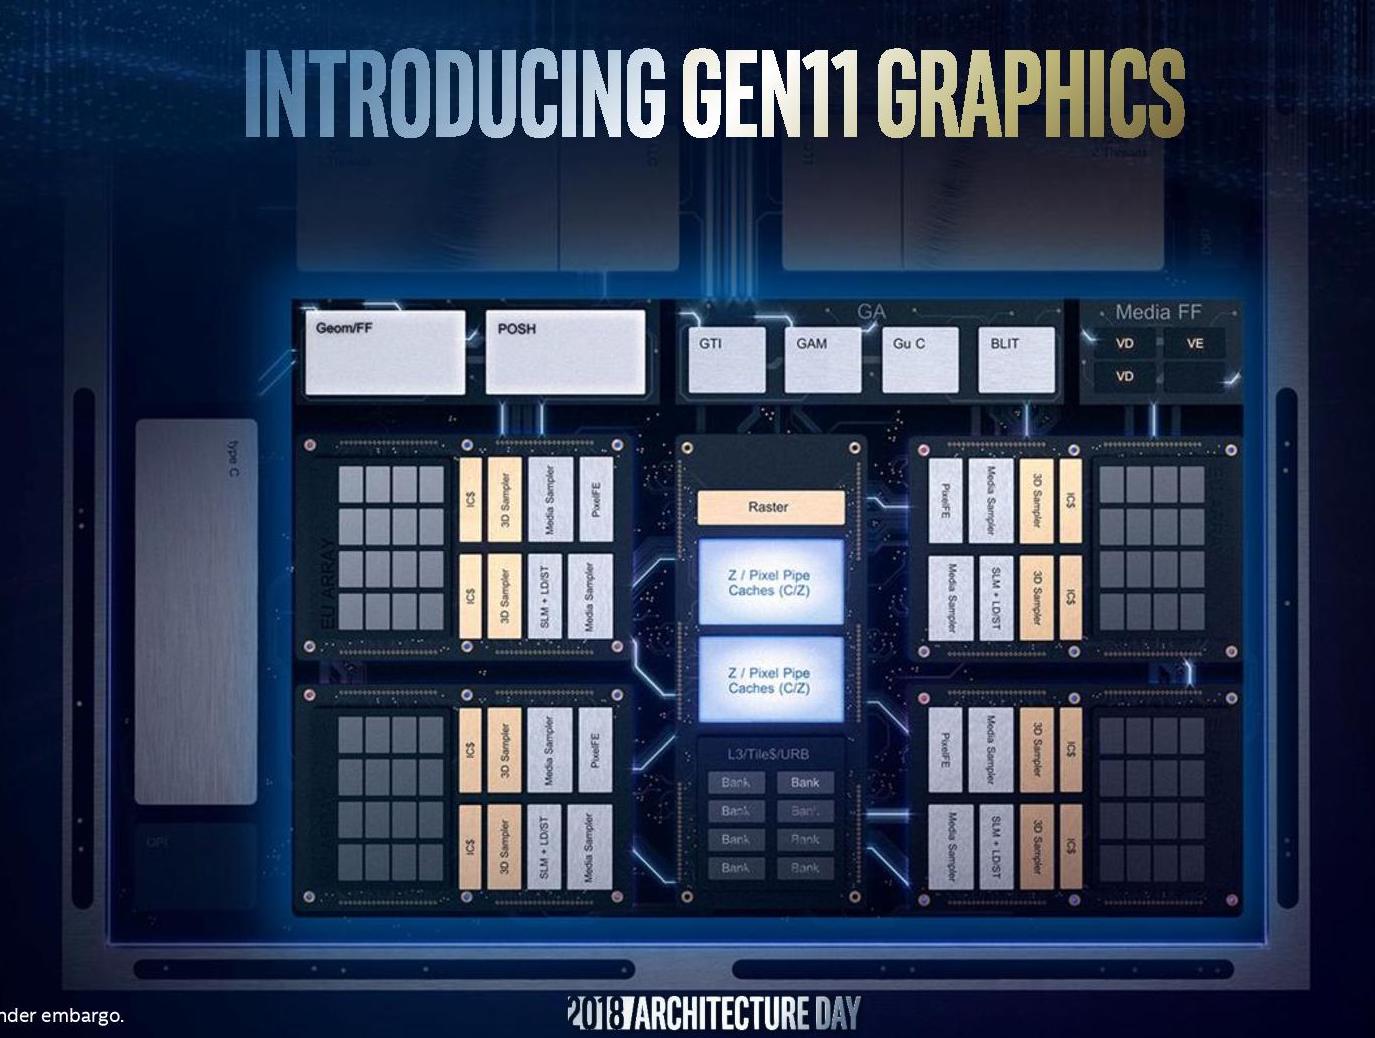
英特尔 UHD 图形 32 EU(Jasper Lake,第 11 代)是 Jasper Lake Pentium SoC 的集成显卡,适用于笔记本电脑和小型台式机。 这是 Jasper Lake 系列 (Pentium Silver) 中速度最快的 GPU 版本,提供所有 32 个 EU(执行单元 / 着色器块)。 没有专用图形内存,时钟速率因处理器型号而异。 上市时,Pentium Silver型号(6W N6000和10W N6005)为350~900MHz。
随着体系结构的改进和欧盟数量的增加,UHD显卡明显比旧的Gemini Lake SoC(例如N5000)更快。 英特尔表示,火箭联赛的3D Mark Fire Strike分数最高提高78%,FPS最高提高22%。 即使这样,也只能玩要求非常低的游戏。
Gen11显卡的新特点是新的Variable Rate Shading(VRS;可变速率阴影)支持。 使用此功能,您可以以较低的分辨率(最多 4x4 块使用一个源)确定阴影时间和阴影对象(例如,背景或雾后)。 使用此技术的早期结果,Unreal Engine POC 性能最高可达 1.3 倍,Civ 6 速度最高可达 1.2 倍。到目前为止,VRS仅支持新的 Nvidia Turing 体系结构(GTX 1650 或更高版本)。
另一个改进的硬件是内置视频解码器和编码器,英特尔大幅改进。 虽然未指定详细内容,但上一代使用专用硬件,以 10 位颜色深度解码主 10 配置文件的 VP9 和 H.265/HEVC。
Jasper Lake SoCs 和集成 GPU 在 Intel 的 10nm 工艺(如 Ice Lake)中制造,与 TSMC 的 7nm 工艺相当。
Gen. 11 Series
| |||||||||||||||||||||||||||||||
| Codename | Gen. 11 | ||||||||||||||||||||||||||||||
| Architecture | Gen. 11 | ||||||||||||||||||||||||||||||
| iGPU | Integrated Graphics | ||||||||||||||||||||||||||||||
| Pipelines | 32 - unified | ||||||||||||||||||||||||||||||
| Core Speed | 350 - 900 (Boost) MHz | ||||||||||||||||||||||||||||||
| Shared Memory | yes | ||||||||||||||||||||||||||||||
| API | DirectX 12_1, OpenGL 4.5 | ||||||||||||||||||||||||||||||
| Power Consumption | 4.8 - 10 Watt | ||||||||||||||||||||||||||||||
| Man. Technology | 10 nm | ||||||||||||||||||||||||||||||
| Features | QuickSync | ||||||||||||||||||||||||||||||
| Date of Announcement | 11.01.2021 | ||||||||||||||||||||||||||||||
| ||||||||||||||||
The following benchmarks stem from our benchmarks of review laptops. The performance depends on the used graphics memory, clock rate, processor, system settings, drivers, and operating systems. So the results don't have to be representative for all laptops with this GPU. For detailed information on the benchmark results, click on the fps number.


| low | med. | high | ultra | QHD | 4K | |
|---|---|---|---|---|---|---|
| Tiny Tina's Wonderlands | 5.43 | 6.63 | 4.25 | |||
| Farming Simulator 22 | 20.5 | |||||
| Back 4 Blood | 12.8 | |||||
| Alan Wake Remastered | 10.6 | |||||
| New World | 17 | |||||
| F1 2021 | 37.6 | 15.8 | 12.7 | |||
| Monster Hunter Stories 2 | 18.8 | |||||
| Mass Effect Legendary Edition | 4.39 | |||||
| Serious Sam 4 | 6.75 | |||||
| F1 2020 | 23 | 14.7 | 10.5 | 6.41 | ||
| Borderlands 3 | 12 | 7.96 | 4.68 | |||
| Apex Legends | 5.2 | |||||
| Strange Brigade | 21 | 10 | 9 | 13.3 | ||
| Far Cry 5 | 3 | 1 | 1 | 1 | ||
| World of Tanks enCore | 91.2 | 13.3 | ||||
| X-Plane 11.11 | 18 | 11 | 11 | |||
| Final Fantasy XV Benchmark | 10 | 4 | 2 | |||
| Dota 2 Reborn | 55 | 23 | 13 | 12 | ||
| The Witcher 3 | 13 | 9 | 4 | 3 | ||
| GTA V | 17 | 15 | 6 | |||
| Sims 4 | 71.2 | 18.3 | ||||
| BioShock Infinite | 35 | 20.6 | 15.5 | |||
| StarCraft II: Heart of the Swarm | 106 | 15.3 | ||||
| Tomb Raider | 45.4 | 25.5 | 16.1 | |||
| Diablo III | 44.6 | 32.6 | 21.4 | 14.9 | ||
| low | med. | high | ultra | QHD | 4K | < 30 fps < 60 fps < 120 fps ≥ 120 fps | 17 5 3 | 16 1 | 14 | 6 | | |
For more games that might be playable and a list of all games and graphics cards visit our Gaming List
Asus Vivobook 13 Slate: Intel Pentium Silver N6000, 13.30", 1.4 kg
Review » 华硕Vivobook 13 Slate平板电脑的回顾。OLED的最佳表现
HP 14s-dr3000: Intel Pentium Silver N6000, 14.00", 1.5 kg
External Review » HP 14s-dr3000
Acer Chromebook 14 CB314-3HT: Intel Pentium Silver N6000, 14.00", 1.5 kg
External Review » Acer Chromebook 14 CB314-3HT
Acer Chromebook Spin 314 CP314-1H: Intel Pentium Silver N6000, 14.00", 1.6 kg
External Review » Acer Chromebook Spin 314 CP314-1H
Acer Swift 1 SF114-34-P6U1: Intel Pentium Silver N6000, 14.00", 1.3 kg
External Review » Acer Swift 1 SF114-34-P6U1
Acer Chromebook 315 CB315-4HT: Intel Pentium Silver N6000, 15.60", 1.6 kg
External Review » Acer Chromebook 315 CB315-4HT
Nokia PureBook Fold 14: Intel Pentium Silver N6000, 14.10", 1.7 kg
External Review » Nokia PureBook Fold 14
Lenovo IdeaPad 1 15, Pentium Silver N6000: Intel Pentium Silver N6000, 15.60", 1.6 kg
External Review » Lenovo IdeaPad 1 15, Pentium Silver N6000
HP Tablet 11-be0097nr: Intel Pentium Silver N6000, 11.00", 0.6 kg
External Review » HP Tablet 11-be0097nr
Acer Aspire 1 A114-33-P2EY: Intel Pentium Silver N6000, 14.00", 1.6 kg
External Review » Acer Aspire 1 A114-33-P2EY
Asus BR1100CKA-GJ0100RA: Intel Pentium Silver N6000, 11.60", 1.3 kg
External Review » Asus BR1100CKA-GJ0100RA
HP Chromebook 14a-na1005ns: Intel Pentium Silver N6000, 14.00", 1.5 kg
External Review » HP Chromebook 14a-na1005ns
Asus Vivobook 13 Slate: Intel Pentium Silver N6000, 13.30", 1.4 kg
External Review » Asus Vivobook 13 Slate
Acer Aspire 3 A315-35-P9GR: Intel Pentium Silver N6000, 15.60", 1.7 kg
External Review » Acer Aspire 3 A315-35-P9GR
Acer Chromebook 317 CB317-1HT-P5PF: Intel Pentium Silver N6000, 17.30", 2.2 kg
External Review » Acer Chromebook 317 CB317-1HT-P5PF
Asus BR1100FKA-BP0491RA: Intel Pentium Silver N6000, 11.60", 1.4 kg
External Review » Asus BR1100FKA-BP0491RA
Acer Aspire 3 A317-33-P1QX: Intel Pentium Silver N6000, 17.30", 2.6 kg
External Review » Acer Aspire 3 A317-33-P1QX
Acer Swift 1 SF114-34 P2VU: Intel Pentium Silver N6000, 14.00", 1.3 kg
External Review » Acer Swift 1 SF114-34 P2VU
» Comparison of GPUs
Detailed list of all laptop GPUs sorted by class and performance.
» Benchmark List
Sort and restrict laptop GPUs based on performance in synthetic benchmarks.
» Notebook Gaming List
Playable games for each graphics card and their average FPS results.
* Approximate position of the graphics adapter
» Notebookcheck多媒体笔记本电脑Top 10排名
» Notebookcheck游戏笔记本电脑Top 10排名
» Notebookcheck低价办公/商务笔记本电脑Top 10排名
» Notebookcheck高端办公/商务笔记本电脑Top 10排名
» Notebookcheck工作站笔记本电脑Top 10排名
» Notebookcheck亚笔记本电脑Top 10排名
» Notebookcheck超级本产品Top 10排名
» Notebookcheck变形本产品Top 10排名
» Notebookcheck平板电脑Top 10排名
» Notebookcheck智能手机Top 10排名
» Notebookcheck评测过最出色的笔记本电脑屏幕
» Notebookcheck售价500欧元以下笔记本电脑Top 10排名
» Notebookcheck售价300欧元以下笔记本电脑Top 10排名