


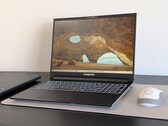
Geekom GeekBook M16 评测:这款 16 英寸笔记本电脑的续航能力令人惊喜
超长续航、英特尔酷睿Ultra 9处理器以及16英寸显示屏:Geekom GeekBook M16旨在凭借其出色的续航能力和现代化的功能,在日常使用中给人留下深刻印象。我们的深度评测将揭示这款笔记本在性能、显示效果和做工方面是否表现出色——或者它是否存在任何不足之处。
Intel Core Ultra 9 185H, Arc 8-Core, 16", 1.8 kg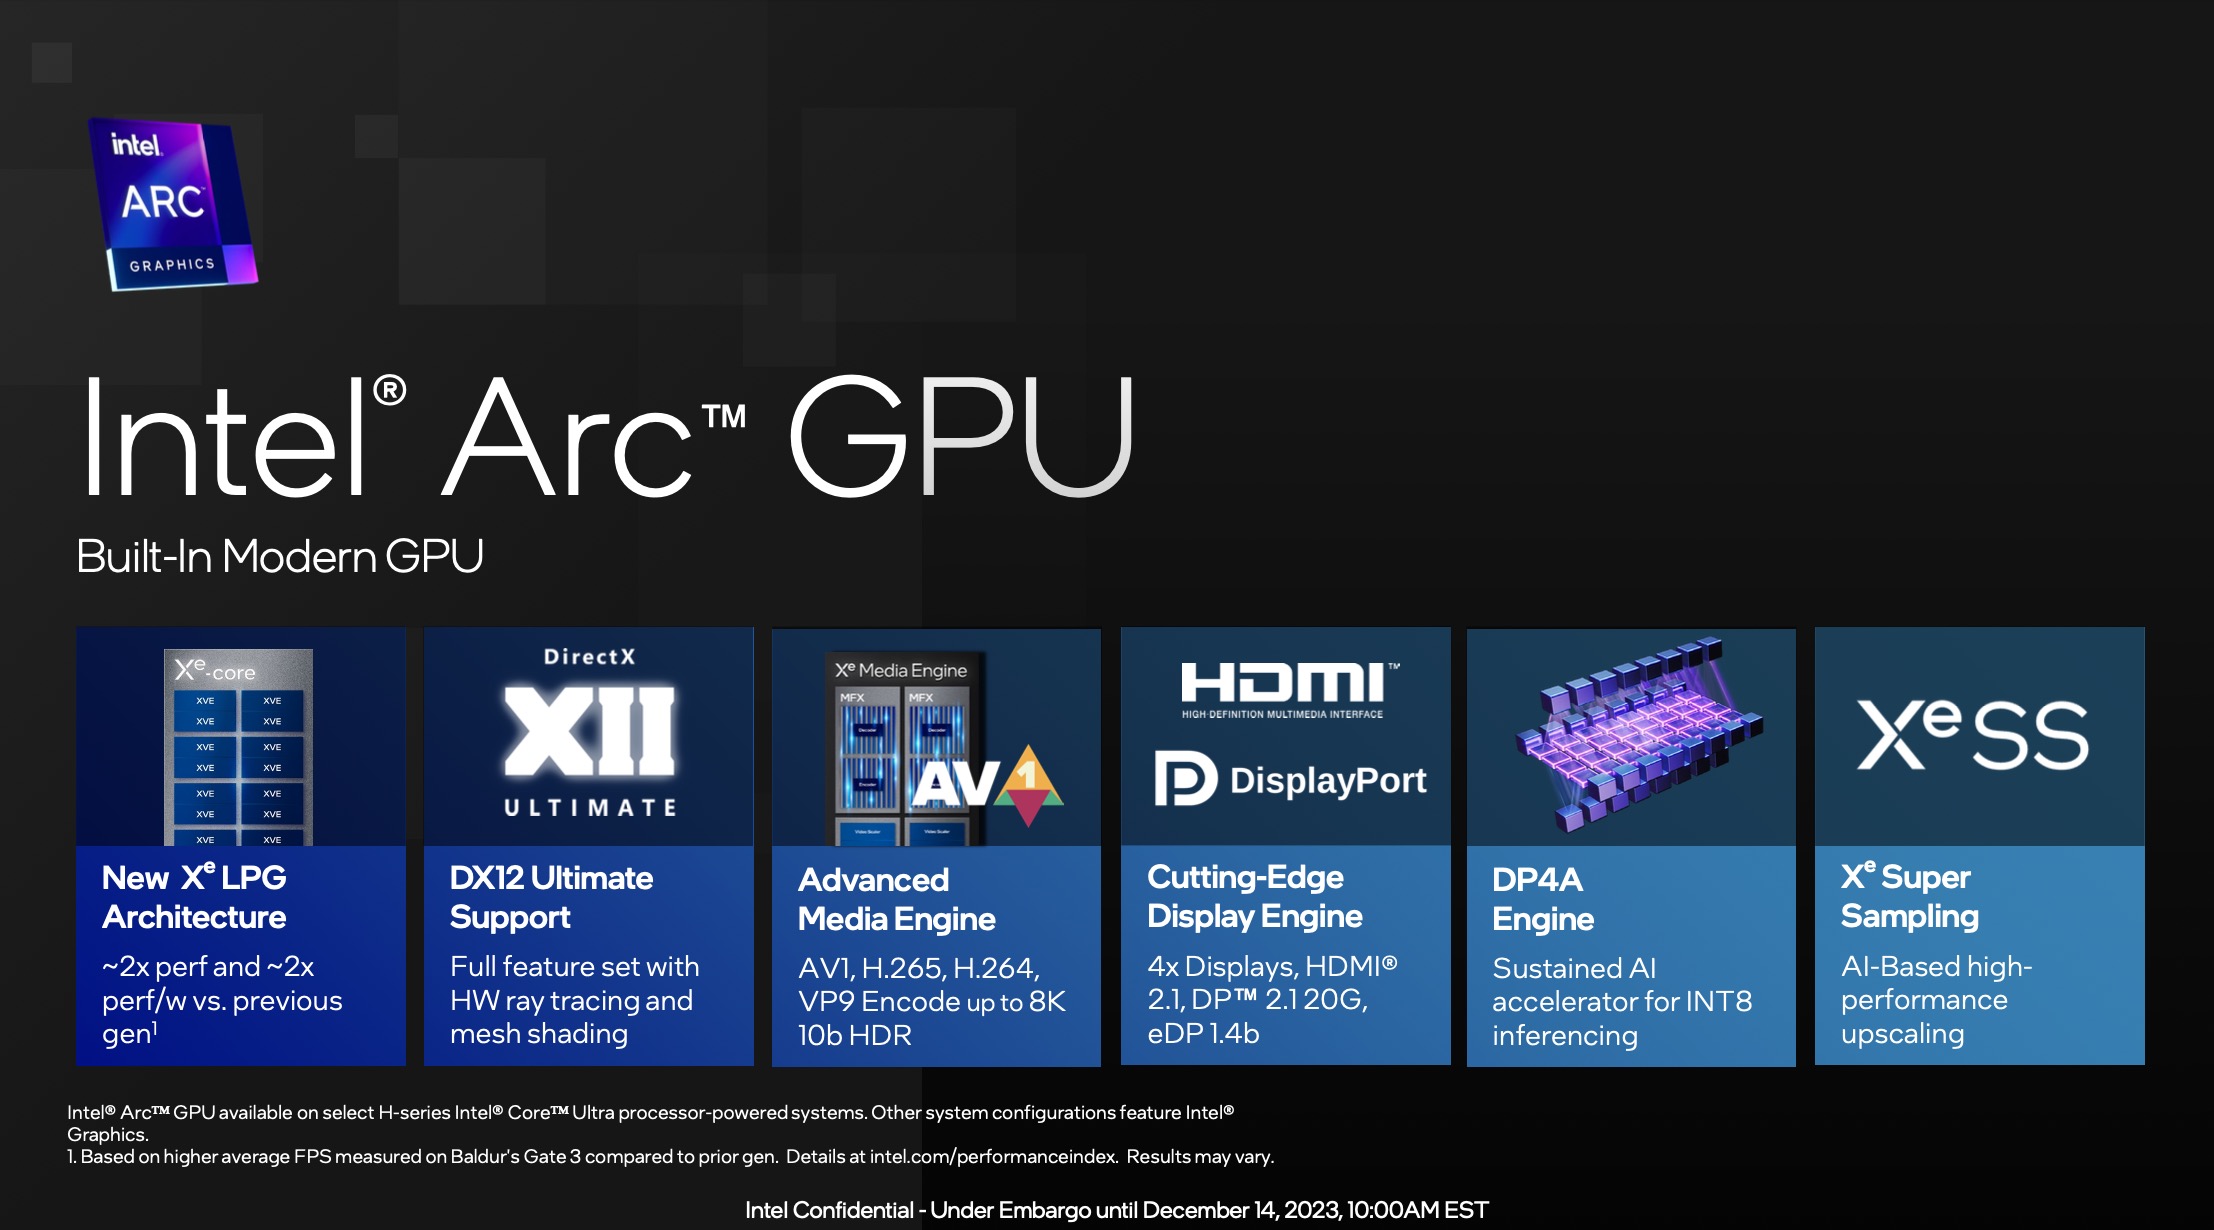
配备 8 个内核的 Intel Arc iGPU(ID 7D55)是Meteor Lake SoC 中的一款集成显卡,基于 Xe LPG 架构(与专用 Arc GPU 相似,但更注重效率)。它提供全部 8 个 Xe 内核(128 个 Xe 向量引擎)、8 个光线追踪单元、8 个采样器和 4 个像素后端。
只有在双通道模式下使用至少 16GB 内存时,才能使用 Arc 名称。否则,唯一的 iGPU 被称为"Intel Graphics",而且速度也明显较慢。
据英特尔公司称,与上一代产品相比,性能提高了一倍(可能还在 Alder Lake 阶段)。
iGPU 支持 DirectX 12 Ultimate(可能与桌面 Arc GPU 一样支持 DX 12_2)。图形处理器还支持 XeSS AI 超级采样。
Meteor Lake 的媒体引擎位于 SOC 芯片中,支持高达 8k60 10 位 HDR 的 MPEG2、AVC、VP9、HEVC 和 AV1 编码和解码。显示引擎也在 SoC 芯片中,支持 HDMI 2.1 和 DisplayPort 2.1 20G,最高支持 8K60 HDR。
Meteor Lake 芯片的 GPU 芯片在台积电以 5 纳米(5N 工艺)制造。
Arc Xe-LPG Series
| |||||||||||||
| Codename | Meteor Lake iGPU | ||||||||||||
| Architecture | Xe LPG | ||||||||||||
| iGPU | Integrated Graphics | ||||||||||||
| Pipelines | 8 - unified | ||||||||||||
| Raytracing Cores | 8 | ||||||||||||
| Core Speed | 2300 (Boost) MHz | ||||||||||||
| Cache | L1: 1.5 MB | ||||||||||||
| Shared Memory | yes | ||||||||||||
| API | DirectX 12_2, OpenGL 4.6, Vulkan 1.3 | ||||||||||||
| Man. Technology | 5 nm | ||||||||||||
| Displays | HDMI 2.1b, DisplayPort 2.0 20G | ||||||||||||
| Date of Announcement | 14.12.2023 | ||||||||||||
| ||||||||||||||||||||||||
The following benchmarks stem from our benchmarks of review laptops. The performance depends on the used graphics memory, clock rate, processor, system settings, drivers, and operating systems. So the results don't have to be representative for all laptops with this GPU. For detailed information on the benchmark results, click on the fps number.


For more games that might be playable and a list of all games and graphics cards visit our Gaming List
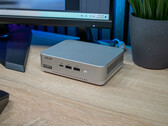
Geekom GT1 Mega: Intel Core Ultra 9 185H, 0.7 kg
Review » Geekom GT1 Mega 评测:Geekom 的首款 AI 迷你 PC 在各方面都不尽如人意
Lenovo ThinkBook Plus Gen5 Hybrid: Intel Core Ultra 7 155H, 14.00", 1.7 kg
Review » 联想 ThinkBook Plus 5 代混合型二合一电脑评测:双启动 Windows 11 和Android 13
Khadas Mind 2: Intel Core Ultra 7 155H, 0.4 kg
Review » Khadas Mind 2 评测:配备英特尔酷睿 7 155H、雷电 4 和 USB4 的便携式迷你 PC
Honor MagicBook Art 14: Intel Core Ultra 7 155H, 14.60", 1 kg
Review » Honor MagicBook Art 14 笔记本电脑 - 配备蒸发腔和创新摄像头的 OLED 超薄笔记本电脑
Medion S17431-MD62640: Intel Core Ultra 7 155H, 17.30", 2.1 kg
Review » Medion S20 笔记本电脑评测:配备 Intel Core Ultra 7 处理器的 17 英寸多媒体笔记本电脑
HP EliteBook x360 1040 G11: Intel Core Ultra 7 165H, 14.00", 1.5 kg
Review » 惠普 Elite x360 1040 G11 二合一笔记本评测:适合商务人士使用
Framework Laptop 13.5 Core Ultra 7 155H: Intel Core Ultra 7 155H, 13.50", 1.4 kg
Review » Framework 13.5 Core Ultra 7 笔记本电脑评测:全新 2.8K 120 Hz 显示屏与 Arc 8 图形处理器
Schenker XMG Evo 15 (M24): Intel Core Ultra 7 155H, 15.30", 1.7 kg
Review » 申克 XMG Evo 15 (M24) 笔记本电脑评测 - 拥有明亮显示屏和出色维护选项的德国超极本
Medion S10 OLED: Intel Core Ultra 7 155H, 16.00", 1.6 kg
Review » Medion S10 OLED 评测:配备 OLED 面板和酷睿 7 处理器的多媒体笔记本电脑
Dell Inspiron 16 7640 2-in-1: Intel Core Ultra 7 155H, 16.00", 2.1 kg
Review » 16 英寸可转换机上的迷你 LED:戴尔 Inspiron 16 7640 2 合 1 评测
Xiaomi RedmiBook Pro 14 2024: Intel Core Ultra 7 155H, 14.00", 1.4 kg
Review » 小米 RedmiBook Pro 14 2024 笔记本电脑评测--性能强劲、价格实惠的超极本
LG gram Pro 2-in-1 16T90SP: Intel Core Ultra 7 155H, 16.00", 1.4 kg
Review » LG gram Pro 二合一 16T90SP 评测--轻巧、功能强大
MSI Claw: Intel Core Ultra 7 155H, 7.00", 0.7 kg
Review » 微星Claw评测--搭载英特尔酷睿Ultra处理器的游戏掌上电脑令人失望
Huawei MateBook 14 FLMH-W7611T: Intel Core Ultra 7 155H, 14.20", 1.3 kg
Review » 华为 MateBook 14 (2024) 3:2 屏幕笔记本电脑评测--一些小问题让人失望
Huawei MateBook X Pro 2024: Intel Core Ultra 9 185H, 14.20", 1 kg
Review » 华为 MateBook X Pro 2024 笔记本电脑评测--980 克重的镁合金超极本,令人印象深刻的 OLED 面板
Minisforum AtomMan X7 Ti: Intel Core Ultra 9 185H, 0.9 kg
Review » Minisforum AtomMan X7 Ti 与 Intel Core Ultra 9 185H 评测:配备触摸显示屏、摄像头和 OCuLink 的 AI 迷你 PC
Dell XPS 13 9340 Core Ultra 7: Intel Core Ultra 7 155H, 13.40", 1.2 kg
Review » 戴尔 XPS 13 9340 笔记本电脑评测--运行时间长、缺陷多的紧凑型超极本
Lenovo IdeaPad Pro 5 16IMH G9: Intel Core Ultra 7 155H, 16.00", 1.9 kg
Review » 联想 IdeaPad Pro 5 16 G9 评测--配备 120 Hz 显示屏和酷睿 7 处理器的多媒体笔记本电脑
Xiaomi RedmiBook Pro 16 2024: Intel Core Ultra 7 155H, 16.00", 1.9 kg
Review » 小米红米本 Pro 16 2024 评测--也许是电池续航时间最长的流星湖笔记本电脑
Samsung Galaxy Book4 Pro 14: Intel Core Ultra 7 155H, 14.00", 1.2 kg
Review » 三星Galaxy Book4 Pro 14 评论--配备 OLED 触摸屏的昂贵日常笔记本电脑
LG Gram 17 17Z90S-G.AA79G: Intel Core Ultra 7 155H, 17.00", 1.3 kg
Review » LG Gram 17 (2024) 笔记本电脑评测--小幅改进和全新酷睿 Ultra 7
Lenovo Yoga 9 2-in-1 14IMH9: Intel Core Ultra 7 155H, 14.00", 1.3 kg
Review » 联想 Yoga 9 2 合 1 14IMH9 评测:更小、更轻、更快的 Arc 图形处理器
Acemagic F2A: Intel Core Ultra 7 155H, 0.8 kg
Review » Acemagic F2A 评测:AI 迷你 PC 配备英特尔流星湖酷睿 7 155H 处理器、32 GB DDR5 内存和 Wi-Fi 7
Samsung Galaxy Book4 Pro 16: Intel Core Ultra 7 155H, 16.00", 1.5 kg
Review » Galaxy Book4 Pro 16 笔记本电脑评测: MacBook Air 15 的三星替代产品Apple
AcePC Wizbox AI: Intel Core Ultra 7 155H, 0.8 kg
Review » AcePC Wizbox AI mini PC 评测:英特尔流星湖迷你电脑
Dell Inspiron 14 Plus 7440: Intel Core Ultra 7 155H, 14.00", 1.6 kg
Review » 戴尔 Inspiron 14 Plus 7440 笔记本电脑评测:放弃GeForce RTX,采用集成式英特尔弧光灯
Lenovo Yoga Slim 7 14IMH9: Intel Core Ultra 7 155H, 14.00", 1.4 kg
Review » 联想 Yoga Slim 7 14 G9 笔记本电脑评测:全新小尺寸,集成 Co-Pilot 键
Lenovo Yoga Pro 7 14IMH9: Intel Core Ultra 7 155H, 14.50", 1.6 kg
Review » 联想 Yoga Pro 7 14 笔记本电脑评测:英特尔 Arc 对决 Radeon 780M
MSI Prestige 13 AI Evo: Intel Core Ultra 7 155H, 13.30", 1 kg
Review » 微星 Prestige 13 AI Evo 笔记本电脑评测--酷睿至尊 7 处理器和 OLED 显示屏,重量不足 1 千克
Asus Zenbook Duo OLED UX8406MA: Intel Core Ultra 9 185H, 14.00", 1.7 kg
Review » 华硕 Zenbook Duo OLED (2024) 可折叠本评测:配备酷睿 Ultra 9 的多任务处理冠军
HP Spectre x360 16-aa0074ng: Intel Core Ultra 7 155H, 16.00", 1.9 kg
Review » 二合一可折叠 HP Spectre x360 16 (2024) 笔记本电脑评测:功能强大的酷睿-超强全能型 OLED 笔记本电脑
Lenovo ThinkPad X1 Carbon G12: Intel Core Ultra 7 155H, 14.00", 1.1 kg
Review » 联想 ThinkPad X1 Carbon G12 笔记本电脑评测:三年来首次重大更新
Asus ZenBook 14 UX3405MA: Intel Core Ultra 7 155H, 14.00", 1.2 kg
Review » 华硕 Zenbook 14 OLED 评测--配备 120Hz OLED 和酷睿 Ultra 7 处理器、重量仅 1.2 千克的超轻型笔记本电脑
HP Spectre x360 14-eu0078ng: Intel Core Ultra 7 155H, 14.00", 1.5 kg
Review » 惠普 Spectre x360 14 评测--配备更大的 120-Hz OLED 的高端可折叠设备
MSI Prestige 16 B1MG-001US: Intel Core Ultra 7 155H, 16.00", 1.6 kg
Review » 微星 Prestige 16 B1MG 笔记本电脑评测:从酷睿 i7 Xe 到酷睿 Ultra 7 Arc
Acer Swift Go 14 SFG14-72: Intel Core Ultra 7 155H, 14.00", 1.3 kg
Review » 宏碁 Swift Go 14 评测--Meteor Lake Core Ultra 7 的人工智能内核令人印象深刻
Review » 英特尔流星湖分析 - 酷睿至尊 7 155H 仅在 GPU 性能方面令人信服
Asus ZenBook 14 UX3405MA: Intel Core Ultra 7 155H
Review » 英特尔流星湖分析 - 酷睿至尊 7 155H 仅在 GPU 性能方面令人信服
MSI Claw A1M-036: Intel Core Ultra 5 135H, 7.00", 0.7 kg
External Review » MSI Claw A1M-036 - 评测与配置
Huawei MateBook GT 14 (2026): Intel Core Ultra 7 155H, 14.20", 1.5 kg
External Review » 华为 MateBook GT 14 (2026)
MSI Venture 14 AI A1MG: Intel Core Ultra 7 155H, 14.00", 1.7 kg
External Review » MSI Venture 14 AI A1MG
Lenovo ThinkPad P16s G3: Intel Core Ultra 9 185H, 16.00", 1.8 kg
External Review » Lenovo ThinkPad P16s G3
Lenovo IdeaPad Pro 5 16IMH9, Ultra 9 185H: Intel Core Ultra 9 185H, 16.00", 1.9 kg
External Review » Lenovo IdeaPad Pro 5 16IMH9, Ultra 9 185H
VAIO SX14-R: Intel Core Ultra 7 155H, 14.00", 0.9 kg
External Review » VAIO SX14-R
HP Elite x360 1040 G11: Intel Core Ultra 7 155H, 14.00", 1.4 kg
External Review » HP Elite x360 1040 G11
LG Gram SuperSlim 15 2024: Intel Core Ultra 7 155H, 15.60", 1 kg
External Review » LG Gram SuperSlim 15 2024
Lenovo IdeaPad Pro 5 16IMH9: Intel Core Ultra 7 155H, 16.00", 1.9 kg
External Review » Lenovo IdeaPad Pro 5 16IMH9
Lenovo ThinkPad E16 Gen 2: Intel Core Ultra 7 155H, 16.00", 1.8 kg
External Review » Lenovo ThinkPad E16 Gen 2
Lenovo ThinkBook 14 G7 IML: Intel Core Ultra 7 155H, 14.00", 1.4 kg
External Review » Lenovo ThinkBook 14 G7 IML
Lenovo ThinkBook Plus Gen5 Hybrid: Intel Core Ultra 7 155H, 14.00", 1.7 kg
External Review » Lenovo ThinkBook Plus Gen5 Hybrid
Framework Laptop 13.5 Core Ultra 7 155H: Intel Core Ultra 7 155H, 13.50", 1.4 kg
External Review » Framework Laptop 13.5 Core Ultra 7 155H
HP EliteBook x360 1040 G11: Intel Core Ultra 7 165H, 14.00", 1.5 kg
External Review » HP EliteBook x360 1040 G11
Honor MagicBook Art 14: Intel Core Ultra 7 155H, 14.60", 1 kg
External Review » Honor MagicBook Art 14
Lenovo IdeaPad Slim 5 16IMH9: Intel Core Ultra 7 155H, 16.00", 1.9 kg
External Review » Lenovo IdeaPad Slim 5 16IMH9
Asus Vivobook S16 S5606M: Intel Core Ultra 7 155H, 16.00", 1.6 kg
External Review » Asus Vivobook S16 S5606M
Lenovo ThinkBook 16 G7 IML: Intel Core Ultra 7 155H, 16.00", 1.7 kg
External Review » Lenovo ThinkBook 16 G7 IML
Asus Vivobook S15 S5506: Intel Core Ultra 7 165H, 15.60", 1.5 kg
External Review » Asus Vivobook S15 S5506
Lenovo Yoga 9 2-in-1 14IMH9: Intel Core Ultra 7 155H, 14.00", 1.3 kg
External Review » Lenovo Yoga 9 2-in-1 14IMH9
Acer TravelMate P6 TMP614-73: Intel Core Ultra 7 155H, 14.00", 1.2 kg
External Review » Acer TravelMate P6 TMP614-73
Panasonic Toughbook 40 Mk2: Intel Core Ultra 7 165H, 14.00", 3.4 kg
External Review » Panasonic Toughbook 40 Mk2
Acer Swift Go 16 OLED SFG16-72, Core Ultra 7 155H: Intel Core Ultra 7 155H, 16.00", 1.6 kg
External Review » Acer Swift Go 16 OLED SFG16-72, Core Ultra 7 155H
Medion S10 OLED: Intel Core Ultra 7 155H, 16.00", 1.6 kg
External Review » Medion S10 OLED
Dell Inspiron 16 7640 2-in-1: Intel Core Ultra 7 155H, 16.00", 2.1 kg
External Review » Dell Inspiron 16 7640 2-in-1
Acer Swift Go 16 OLED SFG16-72: Intel Core Ultra 9 185H, 16.00", 1.6 kg
External Review » Acer Swift Go 16 OLED SFG16-72
Lenovo ThinkBook 13x IMH G4, Ultra 9 185H: Intel Core Ultra 9 185H, 13.50", 1.2 kg
External Review » Lenovo ThinkBook 13x IMH G4, Ultra 9 185H
Asus VivoBook S 14 OLED S5406MA, Ultra 7 155H: Intel Core Ultra 7 155H, 14.00", 1.3 kg
External Review » Asus VivoBook S 14 OLED S5406MA, Ultra 7 155H
MSI Modern 15 H AI C1MG: Intel Core Ultra 7 155H, 15.60", 1.9 kg
External Review » MSI Modern 15 H AI C1MG
HP EliteBook 1040 G11: Intel Core Ultra 7 165H, 14.00", 1.2 kg
External Review » HP EliteBook 1040 G11
Asus ZenBook 14 UX3405MA, Ultra 9: Intel Core Ultra 9 185H, 14.00", 1.2 kg
External Review » Asus ZenBook 14 UX3405MA, Ultra 9
Lenovo ThinkBook 16 G6+ IMH: Intel Core Ultra 7 155H, 16.00", 1.9 kg
External Review » Lenovo ThinkBook 16 G6+ IMH
MSI Prestige 16 AI EVO B1MG: Intel Core Ultra 7 155H, 16.00", 1.5 kg
External Review » MSI Prestige 16 AI EVO B1MG
Acer Swift Go 14 OLED SFG14-73: Intel Core Ultra 7 155H, 14.00", 1.3 kg
External Review » Acer Swift Go 14 OLED SFG14-73
Asus VivoBook S 16 OLED S5606MA: Intel Core Ultra 7 155H, 16.00", 1.5 kg
External Review » Asus VivoBook S 16 OLED S5606MA
Asus VivoBook S 14 OLED S5406MA, Ultra 9 185H: Intel Core Ultra 9 185H, 14.00", 1.3 kg
External Review » Asus VivoBook S 14 OLED S5406MA, Ultra 9 185H
MSI Summit E13 AI Evo A1M: Intel Core Ultra 7 155H, 13.30", 1.4 kg
External Review » MSI Summit E13 AI Evo A1M
Lenovo Yoga 7 14IML9: Intel Core Ultra 7 155H, 14.00", 1.5 kg
External Review » Lenovo Yoga 7 14IML9
Huawei MateBook 14 2024: Intel Core Ultra 7 155H, 14.20", 1.3 kg
External Review » Huawei MateBook 14 2024
Asus Zenbook Duo OLED UX8406MA, Ultra 7: Intel Core Ultra 7 155H, 14.00", 1.7 kg
External Review » Asus Zenbook Duo OLED UX8406MA, Ultra 7
Huawei MateBook X Pro 2024: Intel Core Ultra 9 185H, 14.20", 1 kg
External Review » Huawei MateBook X Pro 2024
Acer Swift Go 14 SFG14-72, Ultra 9: Intel Core Ultra 9 185H, 14.00", 1.3 kg
External Review » Acer Swift Go 14 SFG14-72, Ultra 9
Dell XPS 13 9340 Core Ultra 7: Intel Core Ultra 7 155H, 13.40", 1.2 kg
External Review » Dell XPS 13 9340 Core Ultra 7
Dell XPS 14 9440: Intel Core Ultra 7 155H, 14.50", 1.7 kg
External Review » Dell XPS 14 9440
LG Gram 17 17Z90S-G.AA79G: Intel Core Ultra 7 155H, 17.00", 1.3 kg
External Review » LG Gram 17 17Z90S-G.AA79G
Asus Zenbook 14 OLED Q425: Intel Core Ultra 7 155H, 14.00", 1.3 kg
External Review » Asus Zenbook 14 OLED Q425
LG gram Pro 17Z90SP: Intel Core Ultra 7 155H, 17.00", 1.3 kg
External Review » LG gram Pro 17Z90SP
Dell Inspiron 14 Plus 7440: Intel Core Ultra 7 155H, 14.00", 1.6 kg
External Review » Dell Inspiron 14 Plus 7440
Lenovo Yoga Pro 7 14IMH9: Intel Core Ultra 7 155H, 14.50", 1.6 kg
External Review » Lenovo Yoga Pro 7 14IMH9
LG gram Pro 2-in-1 16T90SP: Intel Core Ultra 7 155H, 16.00", 1.4 kg
External Review » LG gram Pro 2-in-1 16T90SP
Xiaomi RedmiBook Pro 16 2024: Intel Core Ultra 7 155H, 16.00", 1.9 kg
External Review » Xiaomi RedmiBook Pro 16 2024
Lenovo Yoga Slim 7 14IMH9: Intel Core Ultra 7 155H, 14.00", 1.4 kg
External Review » Lenovo Yoga Slim 7 14IMH9
Samsung Galaxy Book4 Pro 360, Ultra 7 155H: Intel Core Ultra 7 155H, 16.00", 1.7 kg
External Review » Samsung Galaxy Book4 Pro 360, Ultra 7 155H
Lenovo ThinkPad X1 Carbon G12: Intel Core Ultra 7 155H, 14.00", 1.1 kg
External Review » Lenovo ThinkPad X1 Carbon G12
Samsung Galaxy Book4 Pro 14: Intel Core Ultra 7 155H, 14.00", 1.2 kg
External Review » Samsung Galaxy Book4 Pro 14
Samsung Galaxy Book4 Pro 16: Intel Core Ultra 7 155H, 16.00", 1.5 kg
External Review » Samsung Galaxy Book4 Pro 16
MSI Claw: Intel Core Ultra 7 155H, 7.00", 0.7 kg
External Review » MSI Claw
HP Spectre x360 16-aa0074ng: Intel Core Ultra 7 155H, 16.00", 1.9 kg
External Review » HP Spectre x360 16-aa0074ng
Lenovo Yoga 9 14IMH9: Intel Core Ultra 7 155H, 14.00", 1.3 kg
External Review » Lenovo Yoga 9 14IMH9
HP Spectre x360 14-eu0078ng: Intel Core Ultra 7 155H, 14.00", 1.5 kg
External Review » HP Spectre x360 14-eu0078ng
MSI Prestige 16 B1MG-001US: Intel Core Ultra 7 155H, 16.00", 1.6 kg
External Review » MSI Prestige 16 B1MG-001US
Acer Swift Go 14 SFG14-72: Intel Core Ultra 7 155H, 14.00", 1.3 kg
External Review » Acer Swift Go 14 SFG14-72
Medion E15443: Intel Core Ultra 7 155H, 15.60", 1.8 kg
External Review » Medion E15443
MSI Prestige 13 AI Evo: Intel Core Ultra 7 155H, 13.30", 1 kg
External Review » MSI Prestige 13 AI Evo
Asus Zenbook Duo OLED UX8406MA: Intel Core Ultra 9 185H, 14.00", 1.7 kg
External Review » Asus Zenbook Duo OLED UX8406MA
Asus ZenBook 14 UX3405MA: Intel Core Ultra 7 155H, 14.00", 1.2 kg
External Review » Asus ZenBook 14 UX3405MA
Geekom GeekBook M16: Intel Core Ultra 9 185H, 16.00", 1.8 kg
» Geekom GeekBook M16 评测:配备超大电池和 Core Ultra 9 处理器,性价比极高的选择
Acemagic F2A: Intel Core Ultra 7 155H, 0.8 kg
» Acemagic 2026 周年庆:迷你 PC、笔记本电脑和 NAS 系统大折扣活动
Geekom GeekBook X14 Pro: Intel Core Ultra 9 185H, 14.00", 1 kg
» GeekBook X14 Pro:来自 Geekom 的超轻 14 英寸 OLED 笔记本电脑评测,搭载酷睿 Ultra 9 处理器
Asus Vivobook S16 S5606M: Intel Core Ultra 7 155H, 16.00", 1.6 kg
» 华硕 Vivobook S 16 (S5606CA) 发布,配备最新英特尔酷睿 Ultra 200H Arrow Lake 移动 CPU 和 Lumina OLED 显示屏
Asus ZenBook 14 UX3405MA: Intel Core Ultra 7 155H
» 2025 华硕 Zenbook 14 OLED 笔记本现配备英特尔酷睿 Ultra 200H 和 Ryzen AI 300 APU
MSI Claw: Intel Core Ultra 7 155H, 7.00", 0.7 kg
» 微星 Claw 8 AI+ 与罗杰 Ally X:据报道,Lunar Lake APU 让微星在性能和电池续航时间方面缩小差距
Framework Laptop 13.5 Core Ultra 7 155H: Intel Core Ultra 7 155H, 13.50", 1.4 kg
» Framework 笔记本电脑砖系统可利用乐高脚垫、轮子、电缆支架等扩展笔记本电脑
Minisforum AtomMan X7 Ti: Intel Core Ultra 9 185H, 0.9 kg
» Minisforum 曝光支持 OCuLink、液冷和高达 64 GB 内存的 AMD AtomMan X7 Pt
» Minisforum 推出全 AMD AtomMan G7 Pt 迷你 PC,配备 16 核 Ryzen 9、RX 7600M XT 独立 GPU 和高达 96 GB 内存
Samsung Galaxy Book4 Pro 16: Intel Core Ultra 7 155H, 16.00", 1.5 kg
» 三星Galaxy Book4 Pro 16 太贵且内存仅限 16GB
Asus Zenbook Duo OLED UX8406MA: Intel Core Ultra 9 185H, 14.00", 1.7 kg
» 华硕 Zenbook Duo OLED(2024)目前是市场上最好的多屏设备
» Comparison of GPUs
Detailed list of all laptop GPUs sorted by class and performance.
» Benchmark List
Sort and restrict laptop GPUs based on performance in synthetic benchmarks.
» Notebook Gaming List
Playable games for each graphics card and their average FPS results.
* Approximate position of the graphics adapter
» Notebookcheck多媒体笔记本电脑Top 10排名
» Notebookcheck游戏笔记本电脑Top 10排名
» Notebookcheck低价办公/商务笔记本电脑Top 10排名
» Notebookcheck高端办公/商务笔记本电脑Top 10排名
» Notebookcheck工作站笔记本电脑Top 10排名
» Notebookcheck亚笔记本电脑Top 10排名
» Notebookcheck超级本产品Top 10排名
» Notebookcheck变形本产品Top 10排名
» Notebookcheck平板电脑Top 10排名
» Notebookcheck智能手机Top 10排名
» Notebookcheck评测过最出色的笔记本电脑屏幕
» Notebookcheck售价500欧元以下笔记本电脑Top 10排名
» Notebookcheck售价300欧元以下笔记本电脑Top 10排名