


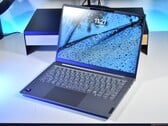
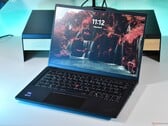
配备 32 GB DDR5 内存且价格亲民:联想 ThinkBook 14 G9 IPL 笔记本评测
售价超过1,000欧元的笔记本电脑很难算作平价机型,但在2026年,它或许会被视为平价机型——尤其是如果它配备了32 GB内存的话。 联想 ThinkBook 14 G9 IPL 是一款内存容量充足且许多人仍能负担得起的笔记本电脑,在当前内存短缺的时期,这实属难得。
Intel Core Ultra 5 325, Intel Graphics 4 Xe3 PTL, 14", 1.4 kg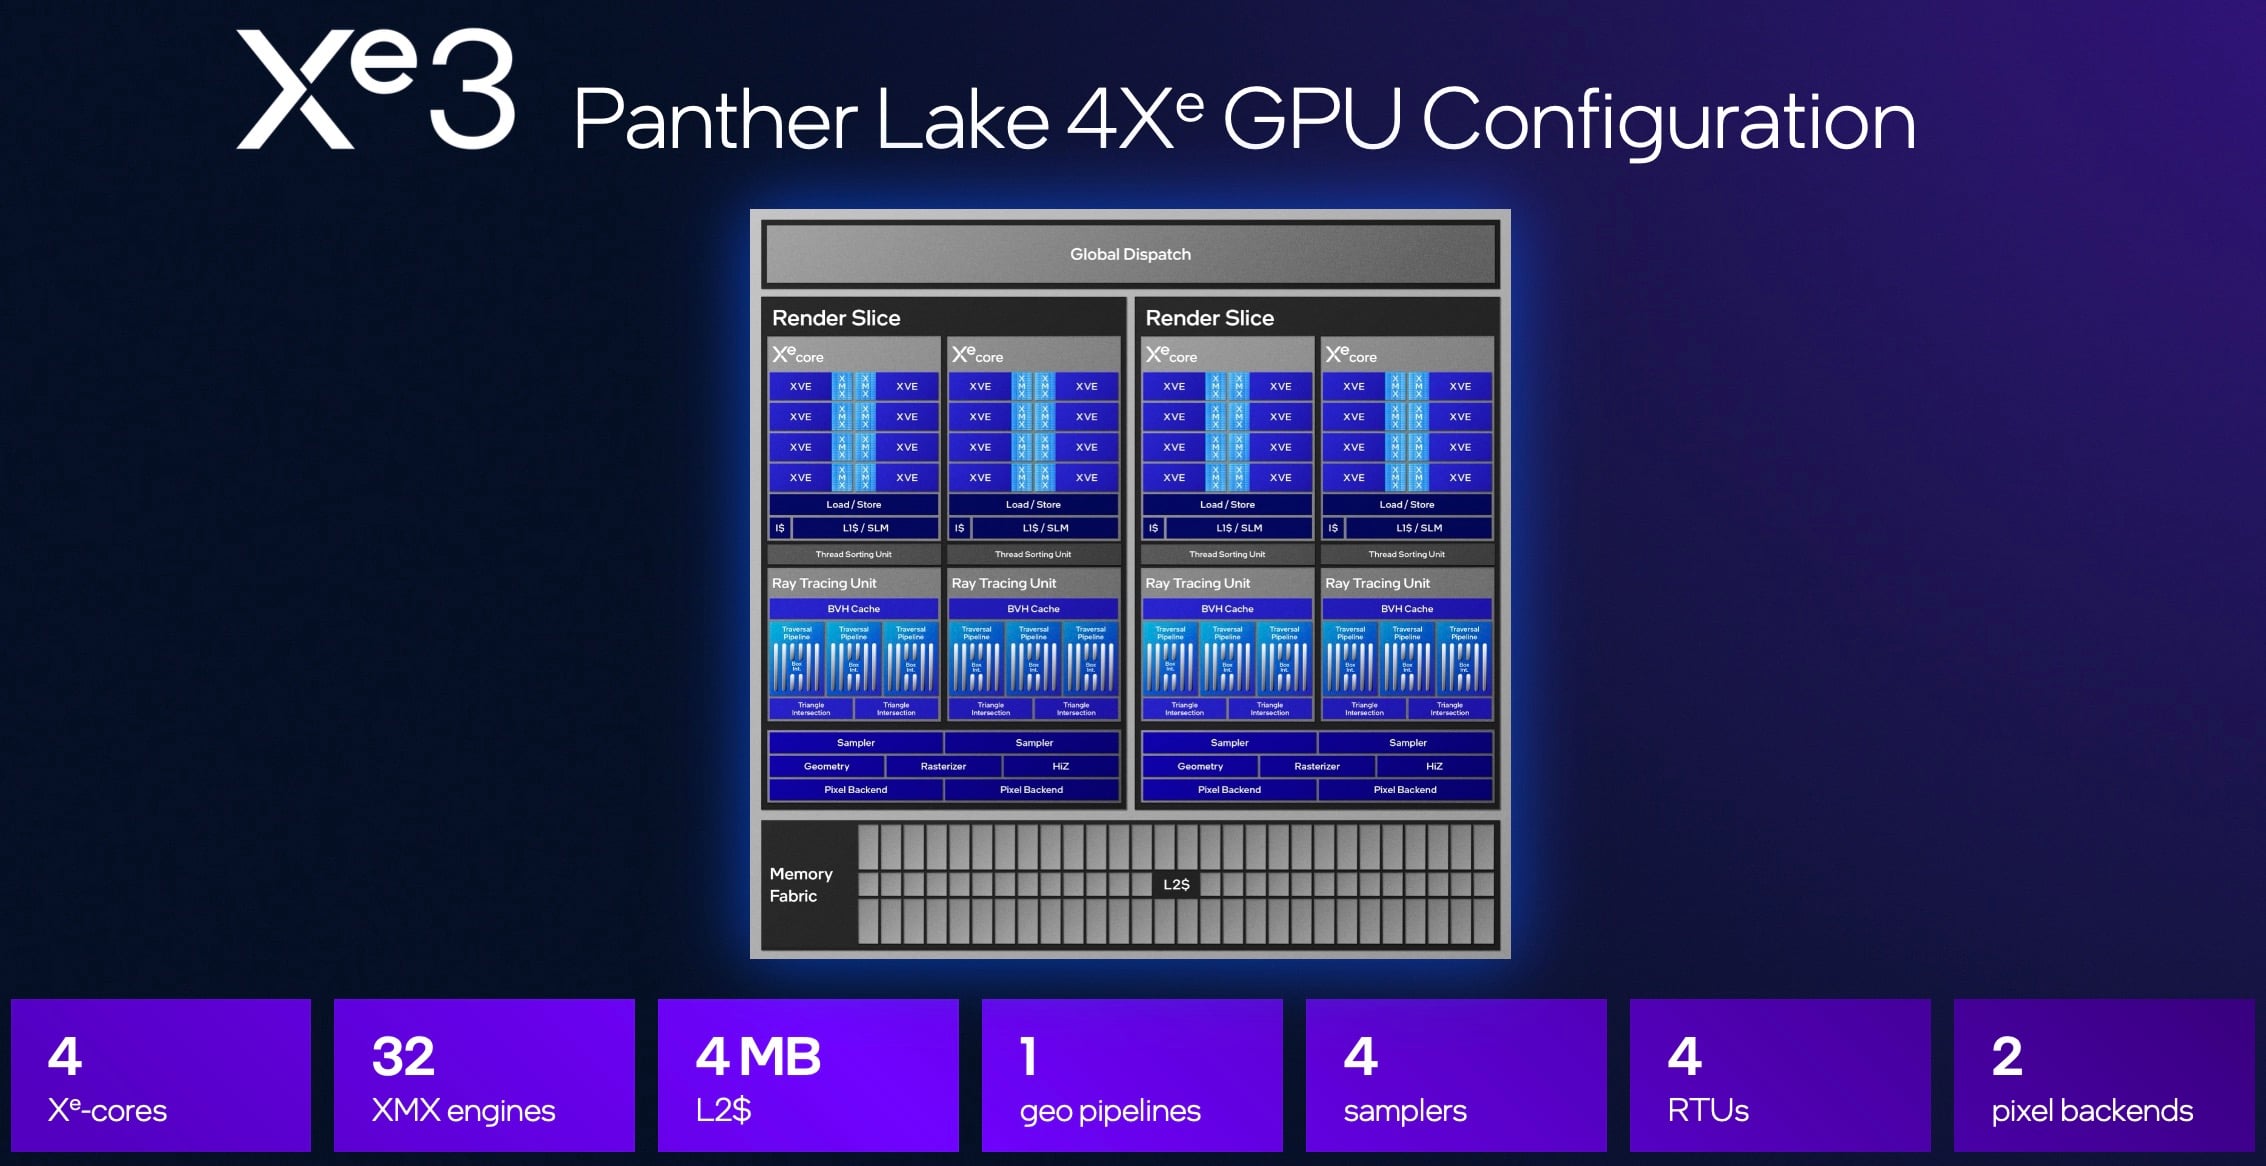
英特尔图形 4 Xe3 是 Panther Lake SoC 中的集成显卡,具有 4 个 Xe3 内核(32 个 EU / 512 个 ALU)、4 个光线追踪内核和高达 2450 MHz 的时钟频率。与大型 12 核 Arc B390 变体不同的是,GPU 瓦片不是由台积电制造,而是由英特尔制造(ev Intel 4)。
尽管对架构进行了内部改进,但游戏性能应与 AMD Radeon 760M的性能,明显低于 Arc Graphics 140V明显低于 Lunar Lake 中的 Arc Graphics 140V。在 箭湖中的 4 核变体,被称为英特尔图形处理器的 4 核变体应明显胜出。
新的媒体引擎现在支持 AV1 编解码、VVC 解码、AVC 10 位和 eDP 1.5。
芯片组由英特尔公司采用英特尔 3 处理器制造。
Arc Xe3 Series
| |||||||||||||
| Codename | Panther Lake | ||||||||||||
| iGPU | Integrated Graphics | ||||||||||||
| Pipelines | 32 - unified | ||||||||||||
| Raytracing Cores | 4 | ||||||||||||
| Core Speed | 2500 (Boost) MHz | ||||||||||||
| AI GPU | 40 TOPS INT8 | ||||||||||||
| Cache | L2: 4 MB | ||||||||||||
| Shared Memory | yes | ||||||||||||
| API | DirectX 12_2, OpenGL 4.6, OpenCL 3.0 | ||||||||||||
| Man. Technology | 5 nm | ||||||||||||
| Displays | 4 Displays (max.), HDMI 2.1 FRL, DisplayPort 2.1 UHBR20 | ||||||||||||
| Date of Announcement | 05.01.2026 | ||||||||||||
| ||||||||||||||||||||||||
The following benchmarks stem from our benchmarks of review laptops. The performance depends on the used graphics memory, clock rate, processor, system settings, drivers, and operating systems. So the results don't have to be representative for all laptops with this GPU. For detailed information on the benchmark results, click on the fps number.


| low | med. | high | ultra | QHD | 4K | |
|---|---|---|---|---|---|---|
| 007 First Light | 17 | 14.8 | 13.6 | 12.8 | ||
| Pragmata | 27.7 | 20.8 | 16.6 | |||
| Crimson Desert | 16.5 | 13.9 | 13 | 12.4 | ||
| Resident Evil Requiem | 25.3 | 18.8 | 16.2 | 8.21 | ||
| Call of Duty Black Ops 7 | 52 | 47 | 33 | 9 | ||
| ARC Raiders | 48.8 | 23.5 | 17.5 | 11.4 | ||
| F1 25 | 61 | 52 | 39 | 10 | ||
| Kingdom Come Deliverance 2 | 32.7 | 23.7 | 18.8 | 12.6 | ||
| Black Myth: Wukong | 18 | 14 | 11 | 6 | ||
| F1 24 | 65 | 61 | 45 | 14 | ||
| Counter-Strike 2 | 78.8 | 59.1 | 33.4 | 20.9 | ||
| Cyberpunk 2077 | 36 | 28 | 24 | 20 | ||
| Baldur's Gate 3 | 31 | 24 | 21 | 21 | ||
| Strange Brigade | 174 | 65 | 55 | 50 | ||
| X-Plane 11.11 | 41 | 31 | 28 | |||
| Final Fantasy XV Benchmark | 66 | 35 | 25 | |||
| Dota 2 Reborn | 113 | 86 | 79 | 75 | ||
| GTA V | 163 | 158 | 52 | 21 | ||
| low | med. | high | ultra | QHD | 4K | < 30 fps < 60 fps < 120 fps ≥ 120 fps | 5 6 5 2 | 9 5 3 1 | 11 6 1 | 13 1 1 | | |
For more games that might be playable and a list of all games and graphics cards visit our Gaming List
Lenovo Yoga Slim 7 Ultra 14IPH11: Intel Core Ultra 7 355, 14.00", 1 kg
Review » 联想 Yoga Slim 7 Ultra 14IPH11 评测:XPS 14 的最佳替代品
Samsung Galaxy Book6 Pro: Intel Core Ultra 7 356H, 16.00", 1.6 kg
Review » 三星Galaxy Book6 Pro 笔记本电脑评测--优于新款 XPS 16
Dell XPS 16 Core Ultra 5 325: Intel Core Ultra 5 325, 16.00", 1.7 kg
Review » 戴尔 XPS 16 评测:前进两步,后退一步
Dell XPS 14 Core Ultra 7 355: Intel Core Ultra 7 355, 14.00", 1.5 kg
Review » 戴尔 XPS 14 Core Ultra 7 355 评测:依然出色,但不再特别
Lenovo ThinkPad T14 G7: Intel Core Ultra 7 355, 14.00", 1.3 kg
External Review » Lenovo ThinkPad T14 G7 - 评测与配置
HP OmniBook Ultra AI 14-kd0000: Intel Core Ultra 7 356H, 14.00", 1.3 kg
External Review » HP OmniBook Ultra AI 14-kd0000 - 评测与配置
HP OmniBook 5 16-bm0000: Intel Core Ultra 7 355, 16.00", 1.7 kg
External Review » HP OmniBook 5 16-bm0000 - 评测与配置
Honor MagicBook 16 2026: Intel Core Ultra 5 325, 16.00", 1.6 kg
External Review » Honor MagicBook 16 2026 - 评测与配置
Asus Vivobook 14 X1407AA: Intel Core Ultra 5 325, 14.00", 1.5 kg
External Review » Asus Vivobook 14 X1407AA - 评测与配置
HP OmniBook X 14-ka0000ng: Intel Core Ultra 5 325, 14.00", 1.3 kg
External Review » HP OmniBook X 14-ka0000ng - 评测与配置
Lenovo ThinkBook 14 G9 IPL: Intel Core Ultra 5 325, 14.00", 1.4 kg
External Review » Lenovo ThinkBook 14 G9 IPL - 评测与配置
Lenovo ThinkPad X1 Carbon G14: Intel Core Ultra 7 355, 14.00", 1 kg
External Review » Lenovo ThinkPad X1 Carbon G14 - 评测与配置
Microsoft Surface Laptop 8 13.8: Intel Core Ultra 5 335, 13.80", 1.4 kg
External Review » 微软 Surface 8 13.8 笔记本电脑
HP OmniBook X 14-ka: Intel Core Ultra 7 356H, 14.00", 1.3 kg
External Review » HP OmniBook X 14-ka
Asus Vivobook 16 X1607AA: Intel Core Ultra 5 325, 16.00", 1.9 kg
External Review » Asus Vivobook 16 X1607AA
Microsoft Surface Pro 13 (2026): Intel Core Ultra 5 335, 13.00", 0.9 kg
External Review » 微软 Surface Pro 13 (2026)
Lenovo Yoga 7 2-in-1 14IPH11: Intel Core Ultra 7 355, 14.00", 1.4 kg
External Review » Lenovo Yoga 7 2-in-1 14IPH11
Lenovo Yoga Slim 7 Ultra 14IPH11: Intel Core Ultra 7 355, 14.00", 1 kg
External Review » 联想 Yoga Slim 7 Ultra 14IPH11
MSI Prestige 14 AI+ D3M: Intel Core Ultra 7 355, 14.00", 1.3 kg
External Review » MSI Prestige 14 AI+ D3M
Samsung Galaxy Book6 Pro: Intel Core Ultra 7 356H, 16.00", 1.6 kg
External Review » Samsung Galaxy Book6 Pro
Samsung Galaxy Book6 NP760VJG-KG5DE: Intel Core Ultra 7 355, 16.00", 1.8 kg
External Review » Samsung Galaxy Book6 NP760VJG-KG5DE
MSI Prestige 14 Flip AI+ D3MTG: Intel Core Ultra 9 386H, 14.00", 1.4 kg
External Review » 微星 Prestige 14 Flip AI+ D3MTG
Acer Aspire 14 AI A14-I71M: Intel Core Ultra 9 386H, 14.00", 1.4 kg
External Review » Acer Aspire 14 AI A14-I71M
MSI Prestige 13 AI+ A3MG: Intel Core Ultra 9 386H, 13.30", 0.9 kg
External Review » MSI Prestige 13 AI+ A3MG
MSI Prestige 16 AI+ C3MG: Intel Core Ultra 7 355, 16.00", 1.6 kg
External Review » 微星 Prestige 16 AI+ C3MG
MSI Prestige 16 Flip AI+ C3MTG (2026): Intel Core Ultra 9 386H, 16.00", 1.7 kg
External Review » MSI Prestige 16 Flip AI+ C3MTG (2026)
Asus ZenBook S14 UX5406AA: Intel Core Ultra 9 386H, 14.00", 1.2 kg
External Review » Asus ZenBook S14 UX5406AA
Dell XPS 14 (2026) DA14260: Intel Core Ultra X7 358H, 14.00", 1.4 kg
External Review » 戴尔 XPS 14 (2026) DA14260
Lenovo Yoga Slim 7i 14IPH11: Intel Core Ultra 7 355, 14.00", 1 kg
External Review » 联想 Yoga Slim 7i 14IPH11
Dell XPS 16 (2026) DA16260: Intel Core Ultra 7 355, 16.00", 1.7 kg
External Review » 戴尔 XPS 16 (2026) DA16260
Lenovo ThinkBook 14 G9 IPL 21UX005PGE: Intel Core Ultra 5 325, 14.00", 1.4 kg
» 这款14英寸的联想笔记本电脑表明,配备32 GB内存的电脑价格正变得越来越高
» 存储新时代:中国制造的笔记本电脑固态硬盘首次在联想笔记本电脑上进行测试
» ThinkBook 还是 ThinkPad?我们对比了两款热门的 14 英寸联想笔记本电脑
Lenovo ThinkPad X1 2-in-1 Gen 11: Intel Core Ultra 7 355, 14.00", 1.3 kg
» ThinkPad X1 第11代二合一笔记本的触控笔充电功能虽然很棒,但缺点也很明显
» 仅有一款 ThinkPad X1 2-in-1 第 11 代机型在图形性能方面实现了显著提升
MSI Cubi NUC AI+ 3MG: Intel Core Ultra 9 386H, 0.6 kg
» 微星Cubi AI+ 3MG比以前快了60%以上,但它本可以做得更好
» 微星 Cubi NUC AI+ 3MG 微型电脑支持 128 GB 超大可移动内存
» 微星 Cubi NUC AI+ 3MG 与 Cubi NUC AI+ 2MG:几乎无处不在的改进
Lenovo ThinkPad T14 Gen 7 21WN00A0GE: Intel Core Ultra 5 325, 14.00", 1.4 kg
» 内存危机的后果联想ThinkPad T14 7代的屏幕降级
» Lunar Lake 仍是英特尔电池续航时间之王:ThinkPad T14 第七代与 T14 第六代对比
» 新款 ThinkPad T14 7 代终于解决了键盘问题
» 一个有争议的设计变更:联想 ThinkPad T14 7 代与 T14 6 代照片对比
» ThinkPad T14 第 7 代:这些功能可在 Linux 下使用,而这些功能不能在 Linux 下使用
Lenovo Yoga Slim 7 Ultra 14IPH11: Intel Core Ultra 7 355, 14.00", 1 kg
» 联想笔记本电脑的高刷新率显示器一直设置为 60 赫兹。以下是简单的修复方法
» 联想 Yoga Slim 7 Ultra 14 Aura 是采用酷睿 Ultra X7 处理器的最轻便笔记本之一,但有一个问题
» 联想 Yoga Slim 7i Ultra Aura 比戴尔 XPS 14 便宜 300 多美元,内存是后者的两倍
Samsung Galaxy Book6 Pro: Intel Core Ultra 7 356H, 16.00", 1.6 kg
» 三星Galaxy Book6 Pro 是一款不错的多媒体笔记本电脑,但 2100 美元太贵了
Dell XPS 16 Core Ultra 5 325: Intel Core Ultra 5 325, 16.00", 1.7 kg
» 2026 戴尔 XPS 16 运行温度明显高于上一代机型
» Panther Lake XPS 16 非常高效,空闲时功耗仅为 1.5 瓦,电池寿命超长
» Core Ultra 5 325 的首次基准测试结果与 Core Ultra 7 355 几乎完全相同。
Dell XPS 14 Core Ultra 7 355: Intel Core Ultra 7 355, 14.00", 1.5 kg
» 根据首次基准测试,英特尔 4 Xe3 GPU 比旗舰产品 Arc B390 慢 50% 以上
» 首批酷睿至尊 7 355 基准测试结果出炉,其性能远不及酷睿至尊 X7
Samsung Galaxy Book6 NP760VJG-KG5DE: Intel Core Ultra 7 355, 16.00", 1.8 kg
» 三星Galaxy Book6 系列上手体验:所有型号、价格和上市日期
» Comparison of GPUs
Detailed list of all laptop GPUs sorted by class and performance.
» Benchmark List
Sort and restrict laptop GPUs based on performance in synthetic benchmarks.
» Notebook Gaming List
Playable games for each graphics card and their average FPS results.
* Approximate position of the graphics adapter
» Notebookcheck多媒体笔记本电脑Top 10排名
» Notebookcheck游戏笔记本电脑Top 10排名
» Notebookcheck低价办公/商务笔记本电脑Top 10排名
» Notebookcheck高端办公/商务笔记本电脑Top 10排名
» Notebookcheck工作站笔记本电脑Top 10排名
» Notebookcheck亚笔记本电脑Top 10排名
» Notebookcheck超级本产品Top 10排名
» Notebookcheck变形本产品Top 10排名
» Notebookcheck平板电脑Top 10排名
» Notebookcheck智能手机Top 10排名
» Notebookcheck评测过最出色的笔记本电脑屏幕
» Notebookcheck售价500欧元以下笔记本电脑Top 10排名
» Notebookcheck售价300欧元以下笔记本电脑Top 10排名