


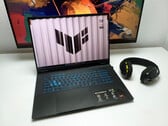
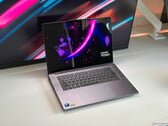
是过度设计还是别出心裁?华硕 TUF Gaming A18 评测
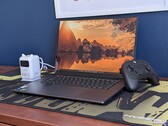
华硕推出的TUF Gaming A18是一款价格相对亲民的XXL笔记本电脑,其宽阔的显示屏不仅适合观看电影,也非常适合游戏。我们测试了一款搭载Ryzen 7 260和GeForce RTX 5060的配置,并将其与最新的18英寸竞品进行了对比。
AMD Ryzen 7 260, NVIDIA GeForce RTX 5060 Laptop, 18", 2.7 kg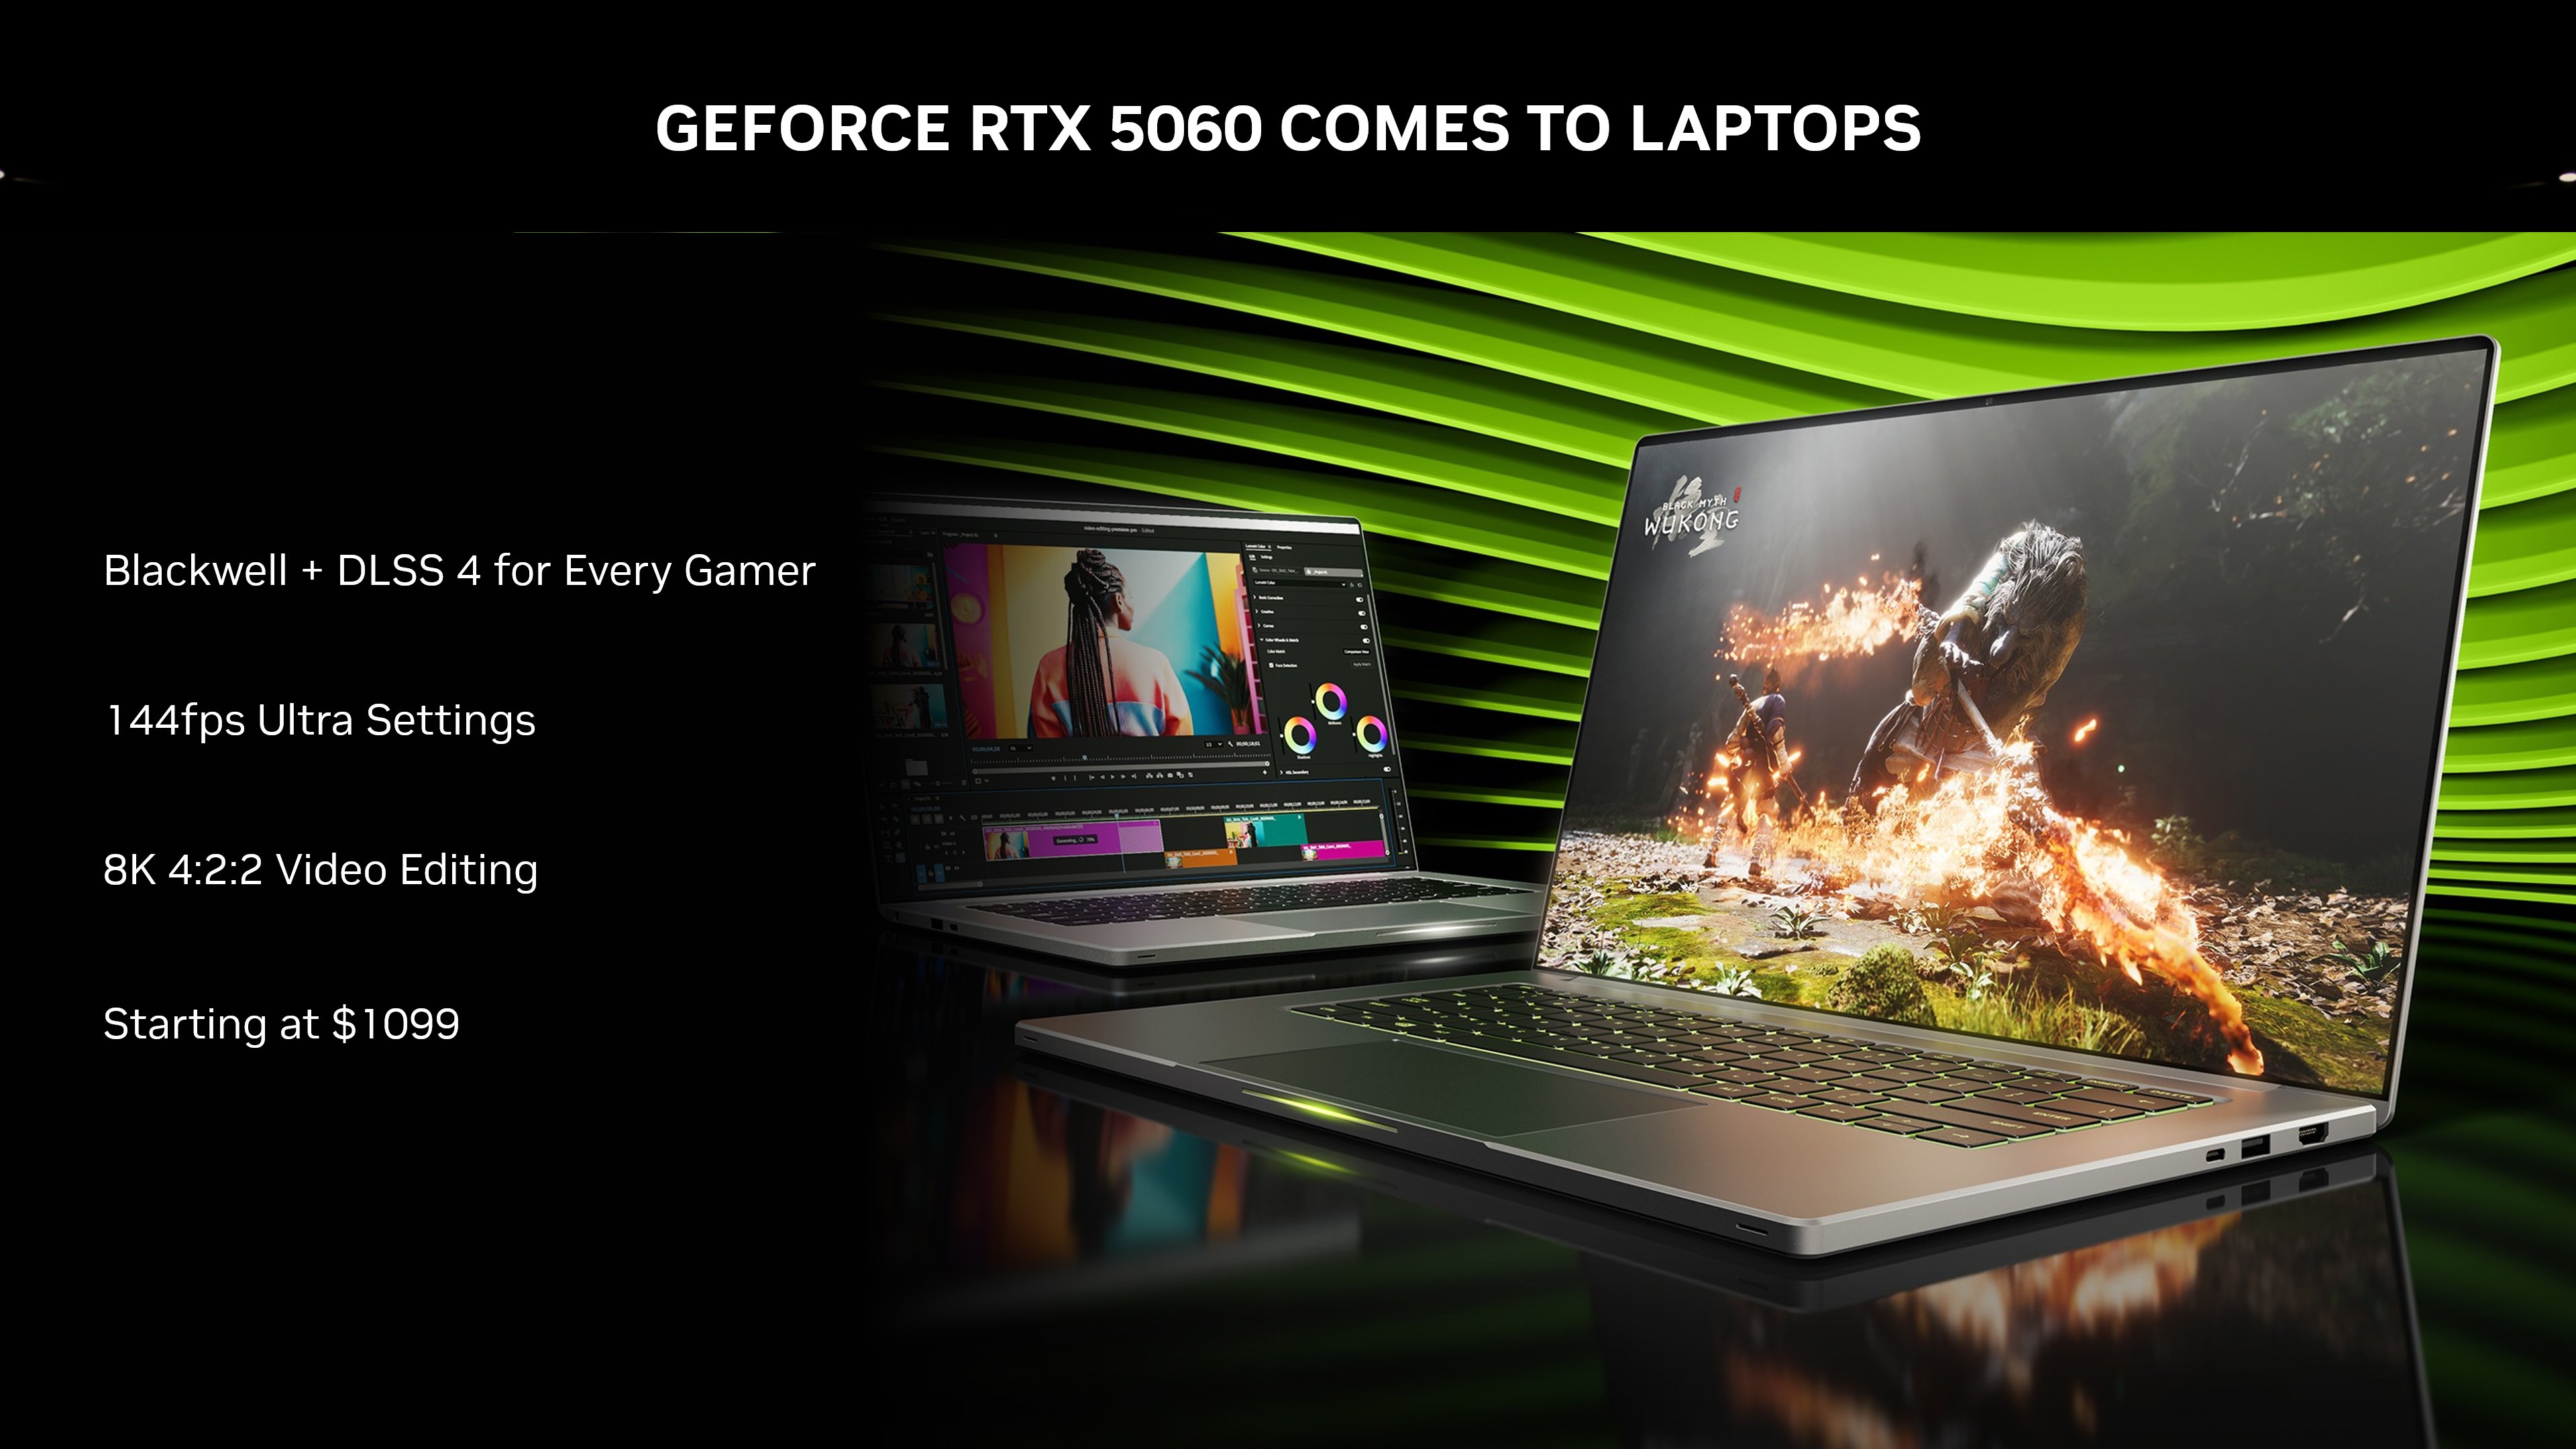
NvidiaGeForce RTX 5060 Laptop 是一款用于笔记本电脑的 Blackwell 系列移动显卡,Team Green 于 2025 年 4 月推出,并于 5 月上市。它基于 GB206 芯片,提供 3328 个着色器/CUDA 内核、104 个张量内核和 26 个光线追踪单元。8 GB GDDR7 显存通过 128 位内存总线连接。GPU 的其他功能还包括原生 PCIe 5 支持、DisplayPort 2.1a、DirectX 12_2 Ultimate 以及 DLSS4 和 Reflex 2 支持。
性能
一如既往,性能取决于 RTX 5060 Laptop 的散热和最大功耗(TGP)。在合成基准测试中,新显卡仅领先于旧显卡 RTX 4070 笔记本电脑 GPU在合成基准测试中。不过,在我们的游戏测试中,移动 RTX 4070 仍然略胜一筹。因此,建议在要求苛刻的游戏(如《F1 25》)中以最高设置和 DLSS 或略微降低的细节级别进行 QHD 游戏。
功耗
该芯片的 TGP 可配置为 45 瓦至 100 瓦,并可相应地采用不同的时钟频率。例如,在 45 瓦 TGP 的情况下,GP 的时钟频率为 952 - 1455 MHz,在 100 瓦的情况下,时钟频率为 1950 - 2310 MHz。
该芯片采用台积电 5 纳米工艺(4N FinFET)生产。
GeForce RTX 5000 Laptop GPU Series
| |||||||||||||||||||
| Codename | GN22-X4 | ||||||||||||||||||
| Architecture | Blackwell | ||||||||||||||||||
| Pipelines | 3328 - unified | ||||||||||||||||||
| TMUs | 104 | ||||||||||||||||||
| ROPs | 48 | ||||||||||||||||||
| Raytracing Cores | 26 | ||||||||||||||||||
| Tensor / AI Cores | 104 | ||||||||||||||||||
| Core Speed | 952 - 1455 (Boost) MHz | ||||||||||||||||||
| Theoretical Performance | 9.684 TFLOPS FP16, 9.684 TFLOPS FP32 | ||||||||||||||||||
| AI GPU | 572 TOPS INT8 | ||||||||||||||||||
| Cache | L1: 3.3 MB, L2: 32 MB | ||||||||||||||||||
| Memory Speed | 24000 effective = 1500 MHz | ||||||||||||||||||
| Memory Bus Width | 128 Bit | ||||||||||||||||||
| Memory Type | GDDR7 | ||||||||||||||||||
| Max. Amount of Memory | 8 GB | ||||||||||||||||||
| Shared Memory | no | ||||||||||||||||||
| Memory Bandwidth | 384 GB/s | ||||||||||||||||||
| API | DirectX 12_2, Shader 6.8, OpenGL 4.6, OpenCL 3.0, Vulkan 1.4 | ||||||||||||||||||
| Power Consumption | 100 Watt (45 - 100 Watt TGP) | ||||||||||||||||||
| Transistor Count | 21.9 Billion | ||||||||||||||||||
| Die Size | 181 mm² | ||||||||||||||||||
| Man. Technology | 5 nm | ||||||||||||||||||
| PCIe | 5 | ||||||||||||||||||
| Displays | 4 Displays (max.), DisplayPort 2.1a | ||||||||||||||||||
| Features | DLSS4, Reflex 2, CUDA 12.8 | ||||||||||||||||||
| Notebook Size | medium sized | ||||||||||||||||||
| Date of Announcement | 02.01.2025 | ||||||||||||||||||
| Link to Manufacturer Page | www.nvidia.com | ||||||||||||||||||
| Predecessor | GeForce RTX 4060 Laptop GPU | ||||||||||||||||||
The following benchmarks stem from our benchmarks of review laptops. The performance depends on the used graphics memory, clock rate, processor, system settings, drivers, and operating systems. So the results don't have to be representative for all laptops with this GPU. For detailed information on the benchmark results, click on the fps number.


For more games that might be playable and a list of all games and graphics cards visit our Gaming List
Lenovo Legion 7 16 AGP11: AMD Ryzen AI 9 HX 470, 16.00", 1.8 kg
Review » 联想Legion 7a 16 G11 评测 - 配备 AMD Ryzen 400 的轻型 OLED 游戏笔记本电脑
Medion Erazer Deputy 15 P1 MD62761: Intel Core 7 250H, 15.60", 2.2 kg
Review » Medion Erazer Deputy 15 P1 评测:德国经济型游戏笔记本电脑能否与大型厂商一较高下?
MSI Cyborg 17 B13WFKG: Intel Core i7-13620H, 17.30", 2.6 kg
Review » 面向大众的平价游戏?微星 Cyborg 17 与竞争对手一较高下
Schenker XMG Apex 17 M25: AMD Ryzen 9 9955HX, 17.30", 2.8 kg
Review » XMG Apex 17 评测:搭载 Ryzen 9 9955HX 的 RTX 5060 笔记本电脑甚至超越了某些 RTX 5070 竞争对手
Schenker XMG Core 16 VE M25: AMD Ryzen 7 255, 16.00", 2.1 kg
Review » 挑战联想Legion :XMG 酷睿 16 VE (M25) 游戏笔记本电脑评测
Lenovo ThinkBook 16p G6 21R00013GE: Intel Core Ultra 7 255HX, 16.00", 2.1 kg
Review » 联想 ThinkBook 16p G6 评测--最佳 16 英寸多媒体笔记本电脑之一
Tulpar T6 V3.5: Intel Core i7-14700HX, 16.00", 2.4 kg
Review » 配备 RTX 5060 的经济型游戏笔记本电脑:Tulpar T6 V3.5 评测
HP Omen 16-ap0091ng: AMD Ryzen 9 8940HX, 16.00", 2.4 kg
Review » 最佳经济型游戏玩家?惠普 Omen 16 笔记本电脑评测
Lenovo Legion 7 16IAX10: Intel Core Ultra 7 255HX, 16.00", 2 kg
Review » 联想Legion 7 16IAX10 评测:强大的 Razer Blade 16 竞争对手
Schenker XMG Core 15 (M25): AMD Ryzen AI 7 350, 15.30", 1.9 kg
Review » Legion 5 的德国竞争对手:XMG 酷睿 15(M25)游戏笔记本电脑评测
Lenovo Yoga Pro 9 16IAH G10 RTX 5060: Intel Core Ultra 7 255H, 16.00", 1.9 kg
Review » 联想 Yoga Pro 9i 16IAH G10 灵光版评测:出色的多媒体笔记本电脑,1,100 尼特 OLED 给人留下深刻印象
Lenovo LOQ 15AHP10: AMD Ryzen 7 250, 15.60", 2.4 kg
Review » 联想LOQ 15笔记本电脑评测:移动 RTX 5060 首次亮相
Lenovo Legion 5 15AHP G10: AMD Ryzen 7 260, 15.10", 1.9 kg
Review » 2025 年最佳主流游戏玩家 - 联想Legion 5 15 笔记本电脑评测
MSI Stealth A16 5060 Engineering Sample: AMD Ryzen AI 7 350, 16.00"
Review » NvidiaGeForce RTX 5060 笔记本电脑性能预览--几乎达到 RTX 5070 笔记本电脑的水平
Acer Predator Helios Neo 16S AI PHN16S-I51: Intel Core Ultra 9 386H, 16.00", 2.2 kg
External Review » Acer Predator Helios Neo 16S AI PHN16S-I51 - 评测与配置
Lenovo Yoga Pro 9i 16 Gen 11: Intel Core Ultra 9 386H, 16.00", 1.9 kg
External Review » Lenovo Yoga Pro 9 16i Gen 11 - 评测与配置
Lenovo Legion 7 16 AGP11: AMD Ryzen AI 9 HX 470, 16.00", 1.8 kg
External Review » Lenovo Legion 7 16 AGP11 - 评测与配置
MSI Cyborg 17 B13WFKG: Intel Core i7-13620H, 17.30", 2.6 kg
External Review » MSI Cyborg 17 B13WFKG - 评测与配置
Gigabyte Gaming A18: AMD Ryzen 7 260, 18.00", 2.8 kg
External Review » Gigabyte Gaming A18
MSI Stealth 16 AI+ B3WF: Intel Core Ultra 9 386H, 16.00", 2 kg
External Review » 微星 Stealth 16 AI+ B3WF
Lenovo Pro 9 16IPH11: Intel Core Ultra 9 386H, 16.00", 1.9 kg
External Review » 联想 Pro 9 16IPH11
Lenovo Yoga Pro 7 15IPH11: Intel Core Ultra 9 386H, 15.30", 1.7 kg
External Review » 联想 Yoga Pro 7 15IPH11
Lenovo Legion 5i 15IPH11: Intel Core Ultra 7 356H, 15.30", 1.9 kg
External Review » 联想 Legion 5i 15IPH11
Lenovo Legion 7a 16AGP11: AMD Ryzen AI 7 450, 16.00", 1.8 kg
External Review » 联想Legion 7a 16AGP11
Lenovo Legion 5a 15AGP11: AMD Ryzen AI 9 465, 15.30", 1.9 kg
External Review » Lenovo Legion 5a 15AGP11
MSI Cyborg 15 B2RWFKG: Intel Core 7 240H, 15.60", 2.1 kg
External Review » MSI Cyborg 15 B2RWFKG
HP Omen 16-am0000ng: Intel Core i9-14900HX, 16.00", 2.4 kg
External Review » HP Omen 16-am0000ng
Acer Swift X 14 AI SFX14-61G, Ryzen AI 7 350: AMD Ryzen AI 7 350, 14.50", 1.6 kg
External Review » Acer Swift X 14 AI SFX14-61G, Ryzen AI 7 350
Asus TUF Gaming A14 FA401GM: AMD Ryzen AI 9 465, 14.00", 1.5 kg
External Review » Asus TUF Gaming A14 FA401GM
Acer Swift X 14 OLED SFX14-73G: Intel Core Ultra 7 255H, 14.50", 1.6 kg
External Review » Acer Swift X 14 OLED SFX14-73G
Gigabyte Aero X16 1WH: AMD Ryzen AI 7 350, 16.00"
External Review » Gigabyte Aero X16 1WH
Asus ROG Zephyrus G14 GA403: AMD Ryzen AI 9 465, 14.00", 1.5 kg
External Review » Asus ROG Zephyrus G14 GA403
Acer Nitro 16S AI AN16S-61: AMD Ryzen AI 7 350, 16.00", 2.2 kg
External Review » 宏碁 Nitro 16S AI AN16S-61
Medion Erazer Deputy 15 P1 MD62761: Intel Core 7 250H, 15.60", 2.2 kg
External Review » Medion Erazer Deputy 15 P1 MD62761
Asus ROG Zephyrus G14 GU405: Intel Core Ultra 9 386H, 14.00", 1.5 kg
External Review » Asus ROG Zephyrus G14 GU405
HP Victus 15-fb3000ng: AMD Ryzen AI 7 350, 15.60", 2.3 kg
External Review » HP Victus 15-fb3000ng
MSI Katana 15 HX B14WFK: Intel Core i7-14650HX, 15.60", 2.4 kg
External Review » MSI Katana 15 HX B14WFK
Acer Nitro V 17 AI ANV17-61: AMD Ryzen AI 7 350, 17.30", 2.7 kg
External Review » Acer Nitro V 17 AI ANV17-61
Lenovo LOQ 15IRX10, i7-14700HX: Intel Core i7-14700HX, 15.60", 2.4 kg
External Review » Lenovo LOQ 15IRX10, i7-14700HX
Acer Predator Helios Neo 14 AI PHN14-71, RTX 5060: Intel Core Ultra 9 285H, 14.50", 1.9 kg
External Review » Acer Predator Helios Neo 14 AI PHN14-71, RTX 5060
Acer Predator Helios Neo 16S AI PHN16S-71, RTX 5060: Intel Core Ultra 7 255HX, 16.00", 2.3 kg
External Review » Acer Predator Helios Neo 16S AI PHN16S-71, RTX 5060
Dell 16 Premium, RTX 5060: Intel Core Ultra 7 255H, 16.30", 2.3 kg
External Review » Dell 16 Premium, RTX 5060
Gigabyte Gaming A16 3VH: AMD Ryzen 7 260, 16.00", 2.2 kg
External Review » Gigabyte Gaming A16 3VH
Lenovo ThinkBook 16p G6 IAX: Intel Core Ultra 9 275HX, 16.00", 2.1 kg
External Review » Lenovo ThinkBook 16p G6 IAX
Acer Nitro V 16S AI ANV16S-61: AMD Ryzen AI 7 350, 16.00", 2.2 kg
External Review » Acer Nitro V 16S AI ANV16S-61
HP Victus 15-fa2000ng: Intel Core i7-13620H, 15.60", 2.3 kg
External Review » HP Victus 15-fa2000ng
Asus TUF Gaming A16 FA608UM: AMD Ryzen 7 260, 16.00", 2.2 kg
External Review » Asus TUF Gaming A16 FA608UM
Lenovo Legion Y7000 2025: Intel Core Ultra 7 155H, 15.30", 2 kg
External Review » Lenovo Legion Y7000 2025
Lenovo Legion 5 15AHP G10: AMD Ryzen 7 260, 15.10", 1.9 kg
External Review » Lenovo Legion 5 15AHP G10
HP Omen 16-ap0091ng: AMD Ryzen 9 8940HX, 16.00", 2.4 kg
External Review » HP Omen 16-ap0091ng
HP Omen 16-ap0000ng: AMD Ryzen AI 7 350, 16.00", 2.4 kg
External Review » HP Omen 16-ap0000ng
Acer Nitro V16 AI ANV16-42, RTX 5060: AMD Ryzen 7 260, 16.00", 2.4 kg
External Review » Acer Nitro V16 AI ANV16-42, RTX 5060
Alienware 16 Aurora, RTX 5060 : Intel Core 7 240H, 16.00", 2.6 kg
External Review » Alienware 16 Aurora, RTX 5060
Asus TUF Gaming A18 FA808UM: AMD Ryzen 7 260, 18.00", 2.7 kg
External Review » Asus TUF Gaming A18 FA808UM
Gigabyte Gaming A16 CVH: Intel Core i7-13620H, 16.00", 2.2 kg
External Review » Gigabyte Gaming A16 CVH
HP Victus 15-fa2000na: Intel Core 7 240H, 15.60", 2.2 kg
External Review » HP Victus 15-fa2000na
Asus Zephyrus G16 GA605KM: AMD Ryzen AI 7 350, 16.00", 1.9 kg
External Review » Asus Zephyrus G16 GA605KM
Lenovo Legion Pro 5 16ADR10: AMD Ryzen 7 8745HX, 16.00", 2.3 kg
External Review » 联想Legion Pro 5 16ADR10
Acer Nitro V 15 ANV15-52: Intel Core i7-13620H, 15.60", 2.1 kg
External Review » Acer Nitro V 15 ANV15-52
Lenovo LOQ 17IRX10, RTX 5060: Intel Core i7-14700HX, 17.30", 2.9 kg
External Review » Lenovo LOQ 17IRX10, RTX 5060
Lenovo LOQ 15AHP10: AMD Ryzen 7 250, 15.60", 2.4 kg
External Review » 联想 LOQ 15AHP10
Lenovo Legion 5 15IRX10, i7-14700HX RTX 5060: Intel Core i7-14700HX, 15.10", 1.9 kg
External Review » 联想Legion 5 15IRX10, i7-14700HX RTX 5060
Asus ROG Zephyrus G14 GA403UM: AMD Ryzen 9 270, 14.00", 1.5 kg
External Review » Asus ROG Zephyrus G14 GA403UM
Lenovo Yoga Pro 9 16IAH10, Ultra 9 285H: Intel Core Ultra 9 285H, 16.00", 2.1 kg
External Review » Lenovo Yoga Pro 9 16IAH10, Ultra 9 285H
Honor MagicBook Pro 16 Hunter 2025: Intel Core Ultra 9 285H, 16.00", 1.9 kg
External Review » Honor MagicBook Pro 16 Hunter 2025
Lenovo Legion 5 15IRX10, i7-13650HX RTX 5060: Intel Core i7-13650HX, 15.10", 1.9 kg
External Review » Lenovo Legion 5 15IRX10, i7-13650HX RTX 5060
Asus TUF Gaming F16 FX608JMR: Intel Core i7-14650HX, 16.00", 2.2 kg
External Review » Asus TUF Gaming F16 FX608JMR
Lenovo LOQ 15IRX10: Intel Core i5-13450HX, 15.60", 2.4 kg
External Review » Lenovo LOQ 15IRX10
MSI Crosshair 16 HX AI D2XWFKG: Intel Core Ultra 9 285HX, 16.00", 2.5 kg
External Review » MSI Crosshair 16 HX AI D2XWFKG
Asus V16 V3607VM: Intel Core 7 240H, 16.00", 2 kg
External Review » Asus V16 V3607VM
Asus TUF Gaming A14 FA401KM, R7 260: AMD Ryzen 7 260, 14.00", 1.5 kg
External Review » Asus TUF Gaming A14 FA401KM, R7 260
Gigabyte Aero X16 1VH: AMD Ryzen AI 7 350, 16.00", 1.9 kg
External Review » Gigabyte Aero X16 1VH
Monster Tulpar T7 V26.2.5: Intel Core i7-13620H, 17.30", 2.7 kg
External Review » Monster Tulpar T7 V26.2.5
Lenovo Yoga Pro 9 16IAH G10 RTX 5060: Intel Core Ultra 7 255H, 16.00", 1.9 kg
External Review » Lenovo Yoga Pro 9 16IAH G10 RTX 5060
Asus ROG Strix G16 G615JMR: Intel Core i7-14650HX, 16.00", 2.7 kg
External Review » Asus ROG Strix G16 G615JMR
Lenovo Legion 7 16IAX10: Intel Core Ultra 7 255HX, 16.00", 2 kg
External Review » Lenovo Legion 7 16IAX10
Acer Nitro V14 AI ANV14-62: AMD Ryzen AI 7 350, 14.50", 1.7 kg
External Review » Acer Nitro V14 AI ANV14-62
Asus TUF Gaming A14 FA401KM: AMD Ryzen AI 7 350, 14.00", 1.5 kg
External Review » Asus TUF Gaming A14 FA401KM
Alienware 16X Aurora: Intel Core Ultra 7 255HX, 16.00", 2.7 kg
External Review » Alienware 16X Aurora
Asus ROG Strix G16 G615LM: Intel Core Ultra 9 275HX, 16.00", 2.7 kg
External Review » Asus ROG Strix G16 G615LM
Lenovo Legion 5 15AGP11: AMD Ryzen AI 7 450, 15.30", 1.9 kg
» 这款联想Legion游戏本是一款相当不错的“工作马”——只有一个例外
» 联想Legion 5还是LOQ:哪款AMD游戏本更胜一筹?
Lenovo Yoga Pro 7 15IPH11: Intel Core Ultra 9 386H, 15.30", 1.7 kg
» 当Apple 的 MacBook Pro 突然成为廉价替代品时,联想 Yoga Pro 7i 15 等笔记本电脑就有了问题
» 联想 Yoga Pro 7i 15 售价超过 2600 美元,这是新的现实吗?
» 联想 Yoga Pro 7i 15 G11 是首批配备全新 RTX 5070 12 GB 的多媒体笔记本电脑之一
Lenovo Pro 9 16IPH11: Intel Core Ultra 9 386H, 16.00", 1.9 kg
» 联想 Pro 9 16 Aura OLED 显示屏的亮度接近 1600 nits,是用钱能买到的最亮的显示屏之一。
Lenovo Legion 7 16 AGP11: AMD Ryzen AI 9 HX 470, 16.00", 1.8 kg
» 联想Legion 7a 16 2049 美元的价格太贵了,而Legion 5 15 的游戏性能与之相当,只需 1350 美元。
Lenovo Pro 9 16IPH11: Intel Core Ultra 9 386H, 16.00", 1.9 kg
» 联想颗粒感强、分辨率低的产品页面让原本光滑的 Pro 9i 16 Aura 看起来很糟糕
» 联想 Pro 9 16 G11 Aura 在平衡模式下运行更安静,但对图形的影响很小。
» 在首次基准测试中,酷睿 Ultra 9 386H 的速度几乎没有超过酷睿 Ultra 9 285H
Lenovo Legion 7 16 AGP11: AMD Ryzen AI 9 HX 470, 16.00", 1.8 kg
» 联想新款Legion 7a 16 游戏笔记本电脑比以前更轻,但牺牲了性能
Schenker XMG Apex 17 M25: AMD Ryzen 9 9955HX, 17.30", 2.8 kg
» 内容创作者的隐藏精品?XMG Apex 17 的 QHD 显示屏经过校准后色彩极为准确
» 在娱乐模式下,RTX 5060 笔记本电脑的运行噪音降低了 60%,性能损失仅为 12%:XMG Apex 17 测试
» XMG Apex 17 价格大幅上涨:最快的 RTX 5060 笔记本电脑现在起价超过 2000 欧元
» 游戏笔记本电脑的 CPU 之王:搭载 Ryzen 9 9955HX 的 XMG Apex 17 战胜所有 RTX 5060 和 RTX 5070 竞争对手
» RTX 5060 战胜 RTX 5070:XMG Apex 17 的游戏性能出乎意料地强劲,令人惊喜
Lenovo ThinkBook 16p G6 21R00013GE: Intel Core Ultra 7 255HX, 16.00", 2.1 kg
» 联想 ThinkBook 16p G6 是一款出色的多媒体笔记本电脑
HP Omen 16-ap0091ng: AMD Ryzen 9 8940HX, 16.00", 2.4 kg
» 今年预兆玩家的重大变化--惠普预兆 16 评测
Lenovo Legion 7 16IAX10: Intel Core Ultra 7 255HX, 16.00", 2 kg
» 联想Legion 7i 16 Gen 10 超越了大多数配备类似 RTX 5060 显卡的其他超薄笔记本电脑
» 联想推出Legion 笔记本电脑,重量甚至比雷蛇刀锋 16 或微星隐形 16 AI 还轻
Lenovo Legion 5 15AHP G10: AMD Ryzen 7 260, 15.10", 1.9 kg
» 不一定非得是 Pro:联想Legion 5 15 几乎满足游戏玩家的一切需求
» 联想推出配备最佳 OLED 面板之一的Legion 5 15
HP Omen 16-ap0091ng: AMD Ryzen 9 8940HX, 16.00", 2.4 kg
» 预兆 16》:经济实惠的游戏机,控制中心广告满天飞
» Comparison of GPUs
Detailed list of all laptop GPUs sorted by class and performance.
» Benchmark List
Sort and restrict laptop GPUs based on performance in synthetic benchmarks.
» Notebook Gaming List
Playable games for each graphics card and their average FPS results.
* Approximate position of the graphics adapter
» Notebookcheck多媒体笔记本电脑Top 10排名
» Notebookcheck游戏笔记本电脑Top 10排名
» Notebookcheck低价办公/商务笔记本电脑Top 10排名
» Notebookcheck高端办公/商务笔记本电脑Top 10排名
» Notebookcheck工作站笔记本电脑Top 10排名
» Notebookcheck亚笔记本电脑Top 10排名
» Notebookcheck超级本产品Top 10排名
» Notebookcheck变形本产品Top 10排名
» Notebookcheck平板电脑Top 10排名
» Notebookcheck智能手机Top 10排名
» Notebookcheck评测过最出色的笔记本电脑屏幕
» Notebookcheck售价500欧元以下笔记本电脑Top 10排名
» Notebookcheck售价300欧元以下笔记本电脑Top 10排名