Notebook reviews with NVIDIA GeForce RTX 5070 Laptop graphics card
微星 Crosshair A16 HX E8WGK 评测:锐龙 9 Zen 4 的性能超越了锐龙 9 AI Zen 5
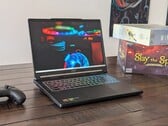
Crosshair A16 HX 专注于优化 CPU 和 GPU 性能,并配备高品质 IPS 显示屏,同时舍弃了 RGB 灯效、长续航、优质扬声器、G-Sync 以及 Advanced Optimus 等“奢侈”功能。预算有限的玩家可能会觉得 Crosshair 物有所值。
AMD Ryzen 9 8940HX, NVIDIA GeForce RTX 5070 Laptop, 16", 2.3 kg在 18 英寸笔记本上获得最佳游戏体验?宏碁 Nitro 18 AI 游戏笔记本电脑评测
虽然 15 至 17 英寸的游戏笔记本很多,但 18 英寸的大尺寸产品却相当有限。凭借 Nitro 18 AI,宏碁正试图与华硕和微星展开竞争。对比结果如何?
AMD Ryzen AI 7 350, NVIDIA GeForce RTX 5070 Laptop, 18", 3 kg三星Galaxy Book6 Ultra 评测--配备华丽 OLED 和 RTX 5070 的多媒体笔记本电脑令人印象深刻
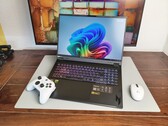
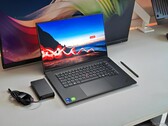
三星新推出的Galaxy Book6 Ultra 是一款功能强大的 16 英寸多媒体笔记本电脑,配备了令人惊叹的 OLED 屏幕、Panther Lake 处理器和GeForce RTX 5070。与Apple MacBook Pro 16 也有许多相似之处,但它足以击败Apple 的机器吗?
Intel Core Ultra 7 356H, NVIDIA GeForce RTX 5070 Laptop, 16", 1.9 kgThinkPad X1 Extreme 当之无愧的继任者 - 联想 ThinkPad T1g 8 代评测
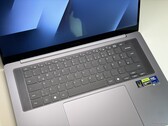
联想推出的 ThinkPad T1g Gen 8 是备受喜爱的 ThinkPad X1 Extreme 的继任者,它是一款功能强大的多媒体笔记本电脑,拥有强大的硬件、雾面串联 OLED 触摸显示屏和联想有史以来为 ThinkPad 配置的最出色的键盘。
Intel Core Ultra 9 285H, NVIDIA GeForce RTX 5070 Laptop, 16", 1.9 kg宏碁 Nitro V 17 AI 评测:这款经济实惠的 17 英寸 RTX 5070 游戏笔记本性能如何?
宏碁 Nitro V 17 ANV17-41-R4CJ 的目标用户是以尽可能低的价格购买大型游戏笔记本电脑。在这篇简短的评测中,我们将考察这款笔记本在日常使用和游戏中的性能、噪音水平和电池续航能力,以及与噪音更大、功耗更高的竞争对手相比如何。
AMD Ryzen 7 260, NVIDIA GeForce RTX 5070 Laptop, 17.3", 2.7 kgSchenker XMG FUSION 16 (M25): Intel Core Ultra 9 275HX, 16.00", 2.1 kg
Review » XMG Fusion 16 OLED 评测 - 首款配备 OLED 屏幕的 XMG 笔记本电脑
Acer Predator Triton 14 AI PT14-52: Intel Core Ultra 9 288V, 14.50", 1.6 kg
Review » 配备 RTX 5070 和月亮湖技术的超薄 OLED 游戏机--宏碁掠夺者 Triton 14 AI 评测
Asus TUF Gaming A18 FA808UP-S8022W: AMD Ryzen 7 260, 18.00", 2.6 kg
Review » 平整、安静、高效--18 英寸华硕 TUF Gaming A18 评测
MSI Crosshair 16 HX AI D2XWGKG: Intel Core Ultra 9 275HX, 16.00", 2.5 kg
Review » 微星 Crosshair 16 HX AI 笔记本电脑评测:性能稳定,但也有不足之处,但不会影响核心游戏体验
Dell 16 Premium DA16250: Intel Core Ultra 7 255H, 16.30", 2.3 kg
Review » 戴尔 16 Premium 笔记本电脑评测:比 XPS 16 更快、更高效
HP Omen 17z-db100: AMD Ryzen AI 7 350, 17.30", 2.9 kg
Review » 惠普 Omen 17z 游戏笔记本电脑评测:性能强劲,温度适宜
Lenovo Legion 5 15IRX10 5070: Intel Core i7-13650HX, 15.10", 1.9 kg
Review » 联想Legion 5 15IRX10 游戏笔记本评测--绚丽 OLED 和 RTX 5070,售价 1,499 欧元(约合人民币 1,742 元)
Lenovo Legion Pro 5 16IAX10, RTX 5070: Intel Core Ultra 7 255HX, 16.00", 2.3 kg
Review » 经济实惠、更安静、更低温、更高效--配备 RTX 5070(非 Ti)的联想Legion Pro 5 16 评测
Lenovo LOQ 17IRX10: Intel Core i7-14700HX, 17.30", 2.9 kg
Review » 更快、更高、更远,归功于 OC:联想 LOQ 17 RTX 5070 游戏笔记本评测
Lenovo Yoga Pro 9i 16 RTX 5070: Intel Core Ultra 9 285H, 16.00", 1.9 kg
Review » 出色的串联 OLED 显示屏,1600 尼特--联想 Yoga Pro 9i 16 G10 灵光版评测
Schenker XMG Core 16 M25: AMD Ryzen AI 9 HX 370, 16.00", 2.1 kg
Review » XMG Core 16 M25 评测 - 配备 300 Hz 显示屏和 RTX 5070 的 AMD 游戏笔记本电脑
Asus TUF Gaming A16 FA608UP: AMD Ryzen 7 260, 16.00", 2.2 kg
Review » 华硕 TUF Gaming A16 笔记本电脑评测:2,200 欧元豪赌 Zen 4 Hawk Point 和 RTX 5070
MSI Crosshair 18 HX AI A2XW: Intel Core Ultra 9 275HX, 18.00", 3.1 kg
Review » 微星Crosshair 18 HX AI A2XW评测:大屏而不贵
MSI Crosshair A17 HX D8WGKG: AMD Ryzen 9 8940HX, 17.00", 2.9 kg
Review » Zen 4 的极限:配备 Ryzen 9 8940HX 的微星 Crosshair A17 HX 游戏笔记本电脑评测
Alienware 16X Aurora, RTX 5070: Intel Core Ultra 9 275HX, 16.00", 2.5 kg
Review » Alienware 16X Aurora 评测:兼顾高端制造与中端 GPU
Asus ROG Strix G18 2025 G814: AMD Ryzen 9 9955HX, 18.00", 2.9 kg
Review » 华硕 ROG Strix G18 2025 评论--配备强大 AMD 9955HX 和 RTX 5070 的 18 英寸游戏笔记本电脑
Aorus Elite 16 AE6H: Intel Core Ultra 9 275HX, 16.00", 2.4 kg
Review » Aorus Elite 16 评论:高端 RTX 5070 游戏笔记本电脑值得购买吗?
Gigabyte Gaming A16 GA6H: Intel Core i7-13620H, 16.00", 2.3 kg
Review » 经济实惠的 RTX 5070 笔记本电脑?技嘉游戏本 A16 评测
Razer Blade 14 2025: AMD Ryzen AI 9 365, 14.00", 1.6 kg
Review » 更薄且配备 OLED,但只有 RTX 5070 笔记本电脑 - Razer Blade 14 2025 评论
MSI Katana 17 HX B14WGK: Intel Core i7-14650HX, 17.30", 2.7 kg
Review » 微星 Katana 17 HX 笔记本电脑评测:RTX 5070 玩家的改进空间
Asus ProArt P16 H7606WP: AMD Ryzen AI 9 HX 370, 16.00", 1.8 kg
Review » 4K OLED 被 120 Hz 2.8K OLED 取代 - 华硕 ProArt P16 配 RTX 5070 笔记本电脑评测
Gigabyte Aero X16 1WH: AMD Ryzen AI 7 350, 16.00", 2 kg
Review » 技嘉 Aero X16 评测:配备 Nvidia RTX 5070 笔记本电脑和可升级内存的时尚 AMD Zen 5 游戏机
Gigabyte Gaming A16 3WH: AMD Ryzen 7 260, 16.00", 2.2 kg
External Review » Gigabyte Gaming A16 3WH - 评测与配置
Acer Predator Helios Neo 16S AI PHN16S-I51, RTX 5070: Intel Core Ultra 7 356H, 16.00", 2.2 kg
External Review » Acer Predator Helios Neo 16S AI PHN16S-I51, RTX 5070 - 评测与配置
Lenovo Pro 9 16IPH11, RTX 5070: Intel Core Ultra 9 386H, 16.00", 1.9 kg
External Review » Lenovo Pro 9 16IPH11, RTX 5070 - 评测与配置
Lenovo Legion 7i 16 Gen 11: Intel Core Ultra 9 290HX Plus, 16.00", 1.8 kg
External Review » Lenovo Legion 7i 16 Gen 11 - 评测与配置
Lenovo LOQ 15IRX10, RTX 5070: Intel Core i7-13650HX, 15.60", 2.4 kg
External Review » Lenovo LOQ 15IRX10, RTX 5070 - 评测与配置
Acer Predator Helios 16S AI PHN16S-I51-94NV: Intel Core Ultra 9 386H, 16.00", 2.2 kg
External Review » Acer Predator Helios 16S AI PHN16S-I51-94NV - 评测与配置
Lenovo ThinkPad T1g Gen 8 21TD003GE: Intel Core Ultra 9 285H, 16.00", 1.9 kg
External Review » 联想 ThinkPad T1g 第 8 代 21TD003GE
Lenovo Legion Pro 5 16AFR10: AMD Ryzen 9 9955HX, 16.00", 2.3 kg
External Review » Lenovo Legion Pro 5 16AFR10
Lenovo Legion Pro 5 16IAX10, RTX 5070: Intel Core Ultra 7 255HX, 16.00", 2.3 kg
External Review » Lenovo Legion Pro 5 16IAX10, RTX 5070
Lenovo Legion 5 15IRX10 5070: Intel Core i7-13650HX, 15.10", 1.9 kg
External Review » Lenovo Legion 5 15IRX10 5070
MSI Katana 15 HX B14WGK, i7-14650HX: Intel Core i7-14650HX, 15.60", 2.4 kg
External Review » 微星 Katana 15 HX B14WGK, i7-14650HX
Asus ROG Zephyrus G16 GU606: Intel Core Ultra 9 386H, 16.00"
External Review » Asus ROG Zephyrus G16 GU606
Samsung Galaxy Book6 Ultra: Intel Core Ultra 7 356H, 16.00", 1.9 kg
External Review » 三星Galaxy Book6 Ultra
Lenovo Yoga Pro 9 16IAH10, RTX 5070: Intel Core Ultra 9 285H, 16.00", 2.1 kg
External Review » 联想 Yoga Pro 9 16IIAH10、RTX 5070
MSI Katana 17 HX B14WGK: Intel Core i7-14650HX, 17.30", 2.7 kg
External Review » MSI Katana 17 HX B14WGK
Asus TUF Gaming F16 FX608JPR: Intel Core i7-14650HX, 16.00", 2.2 kg
External Review » Asus TUF Gaming F16 FX608JPR
Acer Nitro V 16S ANV16S-41: AMD Ryzen 7 260, 16.00", 2.1 kg
External Review » 碁宏 Nitro V 16S ANV16S-41
Lenovo Legion 7 16IAX10, RTX 5070: Intel Core Ultra 9 275HX, 16.00", 2.5 kg
External Review » 联想Legion 7 16IAX10、RTX 5070
Acer Nitro 18 AI AN18-61: AMD Ryzen AI 9 365, 18.00", 3 kg
External Review » 宏碁 Nitro 18 AI AN18-61
MSI Crosshair A16 HX D8WGKG: AMD Ryzen 9 8940HX, 16.00", 2.5 kg
External Review » 微星 Crosshair A16 HX D8WGKG
HP Omen 16-am0000: Intel Core Ultra 7 255H, 16.00", 2.4 kg
External Review » HP Omen 16-am0000
HP Omen Transcend 14-fb1000: Intel Core Ultra 9 285H, 14.00", 1.6 kg
External Review » HP Omen Transcend 14-fb1000
Acer Nitro V 17 AI ANV17-41: AMD Ryzen 7 260, 17.30", 2.7 kg
External Review » Acer Nitro V 17 AI ANV17-41
Dell 16 Premium: Intel Core Ultra 9 285H, 16.30", 2.3 kg
External Review » Dell 16 Premium
Acer Nitro V16 ANV16-72: Intel Core 9 270H, 16.00", 2.4 kg
External Review » Acer Nitro V16 ANV16-72
Lenovo LOQ 17IRX10: Intel Core i7-14700HX, 17.30", 2.9 kg
External Review » Lenovo LOQ 17IRX10
Acer Predator Helios Neo 14 AI PHN14-71: Intel Core Ultra 7 255H, 14.50", 1.9 kg
External Review » Acer Predator Helios Neo 14 AI PHN14-71
Acer Nitro V 16S ANV16S-71: Intel Core 9 270H, 16.00", 2.1 kg
External Review » Acer Nitro V 16S ANV16S-71
Asus TUF Gaming A16 FA608UP: AMD Ryzen 7 260, 16.00", 2.2 kg
External Review » Asus TUF Gaming A16 FA608UP
Lenovo Legion 5 15IRX10: Intel Core i7-14700HX, 15.10", 1.9 kg
External Review » Lenovo Legion 5 15IRX10
Gigabyte Gaming A16 CWH: Intel Core i7-13620H, 16.00", 2.2 kg
External Review » Gigabyte Gaming A16 CWH
Gigabyte Gaming A16 GA6H: Intel Core i7-13620H, 16.00", 2.3 kg
External Review » Gigabyte Gaming A16 GA6H
Aorus Elite 16 AE6H: Intel Core Ultra 9 275HX, 16.00", 2.4 kg
External Review » Aorus Elite 16 AE6H
MSI Katana 15 HX B14WGK: Intel Core i9-14900HX, 15.60", 2.4 kg
External Review » 微星 Katana 15 HX B14WGK
Lenovo Legion 5 15IAX10: Intel Core Ultra 9 275HX, 15.10", 1.9 kg
External Review » Lenovo Legion 5 15IAX10
Lenovo Legion 5 15AKP10: AMD Ryzen AI 7 350, 15.10", 2 kg
External Review » Lenovo Legion 5 15AKP10
Acer Nitro V16 AI ANV16-42: AMD Ryzen 7 260, 16.00", 2.4 kg
External Review » Acer Nitro V16 AI ANV16-42
MSI Stealth A16 AI+ A3XWGG: AMD Ryzen AI 9 HX 370, 16.00", 2.1 kg
External Review » MSI Stealth A16 AI+ A3XWGG
Asus ROG Zephyrus G16 GU605CP: Intel Core Ultra 9 285H, 16.00", 1.9 kg
External Review » Asus ROG Zephyrus G16 GU605CP
Asus TUF Gaming A18 FA808UP: AMD Ryzen 7 260, 18.00", 2.6 kg
External Review » Asus TUF Gaming A18 FA808UP
HP Omen 16-ap0000: AMD Ryzen AI 9 365, 16.00", 2.4 kg
External Review » HP Omen 16-ap0000
MSI Crosshair 17 HX AI D2XWGKG: Intel Core Ultra 7 255HX, 17.00", 2.8 kg
External Review » MSI Crosshair 17 HX AI D2XWGKG
Gigabyte Aero X16 2WHA: AMD Ryzen AI 9 HX 370, 16.00", 1.9 kg
External Review » Gigabyte Aero X16 2WHA
Asus ROG Strix G18 G815LP: Intel Core Ultra 9 275HX, 18.00", 3.2 kg
External Review » Asus ROG Strix G18 G815LP
Lenovo Yoga Pro 9 16IAH10: Intel Core Ultra 7 255H, 16.00", 1.9 kg
External Review » Lenovo Yoga Pro 9 16IAH10
Lenovo Legion 5 15AHP10: AMD Ryzen AI 7 350, 15.10", 1.9 kg
External Review » Lenovo Legion 5 15AHP10
Lenovo Legion 5 15IRX10: Intel Core i9-14900HX, 15.10", 1.9 kg
External Review » Lenovo Legion 5 15IRX10
Lenovo Legion Pro 5 16IAX10: Intel Core Ultra 9 275HX, 16.00", 2.4 kg
External Review » Lenovo Legion Pro 5 16IAX10
Dell 16 Premium DA16250: Intel Core Ultra 7 255H, 16.30", 2.3 kg
External Review » Dell 16 Premium DA16250
Alienware 16X Aurora, RTX 5070: Intel Core Ultra 9 275HX, 16.00", 2.5 kg
External Review » Alienware 16X Aurora, RTX 5070
MSI Crosshair 16 HX AI D2XWGKG: Intel Core Ultra 9 275HX, 16.00", 2.5 kg
External Review » MSI Crosshair 16 HX AI D2XWGKG
Razer Blade 14 2025: AMD Ryzen AI 9 365, 14.00", 1.6 kg
External Review » Razer Blade 14 2025
Acer Predator Triton 14 AI PT14-52: Intel Core Ultra 9 288V, 14.50", 1.6 kg
External Review » Acer Predator Triton 14 AI PT14-52
Gigabyte Aero X16 1WH: AMD Ryzen AI 7 350, 16.00", 2 kg
External Review » Gigabyte Aero X16 1WH
Asus ProArt P16 H7606WP: AMD Ryzen AI 9 HX 370, 16.00", 1.8 kg
External Review » Asus ProArt P16 H7606WP
MSI Crosshair A16 HX E8WGK: AMD Ryzen 9 8940HX, 16.00", 2.3 kg
» 鲜为人知的锐龙 9 8940HX Zen 4 处理器比许多搭载锐龙 Zen 5 处理器的笔记本电脑性能更强
» 240 W 交流适配器对 MSI Crosshair A16 HX 来说勉强够用
Samsung Galaxy Book6 Ultra: Intel Core Ultra 7 356H, 16.00", 1.9 kg
» 三星Galaxy Book6 Ultra 在价格方面被联想 Yoga Pro 9i 16 击败
» 三星终于在Galaxy Book6 Ultra 上采用了更好的 OLED 面板,亮度超过 1000 尼特,但竞争对手仍然更胜一筹
» 三星抄袭Apple MacBook Pro 16,结果是一款非常出色的多媒体笔记本电脑
» 三星Galaxy Book6 系列上手体验:所有型号、价格和上市日期
Lenovo ThinkPad T1g Gen 8 21TD003GE: Intel Core Ultra 9 285H, 16.00", 1.9 kg
» 高品质、出色的键盘、CAMM2-RAM、哑光 Tandem-OLED - ThinkPad T1g Gen 8 是联想的旗舰笔记本电脑
» 联想 ThinkPad T1g Gen 8 是一款出色的多媒体笔记本电脑,几乎无人知晓
Acer Nitro v 17 (ANV17-41-R4CJ): AMD Ryzen 7 260, 17.30", 2.7 kg
» 除了宏碁 Nitro V 17 之外,几乎所有经济型游戏笔记本电脑都没有这项功能。
» 太暗、太慢:宏碁 Nitro V 17 显示屏的真正问题所在
» 宏碁 Nitro V 17 更高效:RTX 5070 游戏功耗降低 56
» 低于 1400 美元的 RTX 5070 游戏:宏碁 Nitro V 17 经济实惠,比预期更好
Schenker XMG FUSION 16 (M25): Intel Core Ultra 9 275HX, 16.00", 2.1 kg
» 评测结果 XMG Fusion 16 (M25) - 配备 OLED 的优秀游戏笔记本电脑
Acer Predator Triton 14 AI PT14-52: Intel Core Ultra 9 288V, 14.50", 1.6 kg
» 紧凑型强机之战--宏碁掠夺者 Triton vs. 华硕 ROG Zephyrus G14 和 Razer Blade 14
Schenker XMG FUSION 16 (M25): Intel Core Ultra 9 275HX, 16.00", 2.1 kg
» 配备 OLED 屏幕的 XMG Fusion 16 可提高图像质量
Acer Predator Triton 14 AI PT14-52: Intel Core Ultra 9 288V, 14.50", 1.6 kg
» 宏碁掠夺者 Triton 14 AI 配备 RTX 5070,售价 2599 美元,实在太贵了
Asus TUF Gaming A18 FA808UP-S8022W: AMD Ryzen 7 260, 18.00", 2.6 kg
» 适合创意人士的经济型笔记本电脑?华硕 TUF Gaming A18 为您提供机会
» 华硕在 TUF Gaming A18 中大力推广省电模式:不寻常的性能模式是好是坏?
» 经济型笔记本电脑,真的不是--还是不想成为?华硕 TUF Gaming A18 评论
Lenovo Legion 5 15IRX10 5070: Intel Core i7-13650HX, 15.10", 1.9 kg
» 联想Legion 5 的游戏性能几乎与更昂贵的Legion Pro 5 相同
Dell 16 Premium DA16250: Intel Core Ultra 7 255H, 16.30", 2.3 kg
» 小型 130 W USB-C 适配器为配备酷睿 Ultra H 和 RTX 5070 图形处理器的戴尔 16 Premium 提供动力
» 戴尔 16 Premium CPU 的运行速度比 XPS 16 9640 快 15% 到 20%,但也有一个问题
» 戴尔 16 Premium 60 WGeForce RTX 5070 既令人惊叹又令人失望
Lenovo Legion Pro 5 16IAX10, RTX 5070: Intel Core Ultra 7 255HX, 16.00", 2.3 kg
» 游戏笔记本,创意无限:Legion Pro 5 的显示屏为何不仅适用于游戏
» 少花钱多办事:在联想Legion Pro 中,使用 Ultra 7 而不是 Ultra 9 究竟会损失多少性能?
Lenovo Legion 5 15IRX10 5070: Intel Core i7-13650HX, 15.10", 1.9 kg
» 联想Legion 5 15 搭载 RTX 5070,1500 欧元的售价难以望其项背
Lenovo Legion Pro 5 16IAX10, RTX 5070: Intel Core Ultra 7 255HX, 16.00", 2.3 kg
» 8GB VRAM:现在还可以用,还是已经过时了?Legion Pro 5 16
HP Omen 17z-db100: AMD Ryzen AI 7 350, 17.30", 2.9 kg
» 搭载 AMD Zen 5 的惠普 Omen 17 只比去年的 Zen 4 略快一点
» 2025 配备 AMD Zen 5 的惠普 Omen 17 比普通游戏笔记本电脑运行更凉爽、更安静
Lenovo Legion Pro 5 16IAX10, RTX 5070: Intel Core Ultra 7 255HX, 16.00", 2.3 kg
» 85% 对 86%:RTX 5070Legion Pro 的得分为何高于速度更快的 5070 Ti 型号?
Lenovo Yoga Pro 9i 16 RTX 5070: Intel Core Ultra 9 285H, 16.00", 1.9 kg
» 联想 Yoga Pro 9i 16 G10 是最好的 Windows 多媒体笔记本电脑吗?
» 联想 Yoga Pro 9i 采用的全新 Tandem-OLED 面板是目前最好的笔记本显示屏
Schenker XMG Core 16 M25: AMD Ryzen AI 9 HX 370, 16.00", 2.1 kg
» XMG 的酷睿 16 M25 AMD 是一款适合游戏和工作的全能机型
Acer Predator Triton 14 AI PT14-52: Intel Core Ultra 9 288V, 14.50", 1.6 kg
» 宏碁掠夺者 Triton 14 AI 配备触觉触控板、Lunar Lake 和轻型机箱,在更多市场上市
Schenker XMG Core 16 M25: AMD Ryzen AI 9 HX 370, 16.00", 2.1 kg
» 谁能以 2200 欧元的价格提供更好的 RTX 5070 游戏笔记本电脑? - XMG Core 16 对比华硕 TUF Gaming A16
Asus TUF Gaming A16 FA608UP: AMD Ryzen 7 260, 16.00", 2.2 kg
» 华硕 TUF Gaming A16 在性能和功能方面不平衡
» 华硕为新款 TUF Gaming A16 配备了经过改进的 165 Hz 显示屏和可更换内存
MSI Crosshair 18 HX AI A2XW: Intel Core Ultra 9 275HX, 18.00", 3.1 kg
» 微星Crosshair 18 HX省略了这一本可使其更具吸引力的功能
» 微星 Crosshair 18 AX 是最经济实惠的 18 英寸游戏笔记本电脑之一,配备 Core Ultra 9 275HX
Alienware 16X Aurora, RTX 5070: Intel Core Ultra 9 275HX, 16.00", 2.5 kg
» Alienware 16X Aurora 上的 "大声超速 "模式不值得在性能上稍有提升
» 戴尔 Alienware 16X 极光是一款面向大众的精简版 Area-51 游戏笔记本电脑
Asus ROG Strix G18 2025 G814: AMD Ryzen 9 9955HX, 18.00", 2.9 kg
» 配备 RTX 5070 图形处理器的华硕 ROG Strix G18 2025 2300 欧元太贵了
» 对于游戏笔记本电脑来说,性能和功能哪个更重要?
Razer Blade 14 2025: AMD Ryzen AI 9 365, 14.00", 1.6 kg
» 对于 Blade 14 而言,8 GB VRAM 是否足够?对于 1080p 游戏来说,是的
» Razer 的 Blade 14 在性能上无法与华硕 ROG Zephyrus G14 相媲美,但价格却更实惠。
Asus ProArt P16 H7606WP: AMD Ryzen AI 9 HX 370, 16.00", 1.8 kg
» 华硕只为 ProArt P16 提供 RTX 5070 笔记本电脑是个错误。
» 华硕 ProArt P16 发布,配备 OLED 触摸屏、最高 64GB 内存和 RTX 5070