


惠普 Envy 17 多媒体笔记本电脑评测--偷工减料
惠普更新了其 Envy 17,并配备了最新的英特尔酷睿 Ultra 7 和 RTX 3050。但硬件升级的同时也带来了降级。这是我们难以接受的。这款顶级设备的显示屏被剥夺了一项重要功能。
Intel Core Ultra 7 155U, NVIDIA GeForce RTX 3050 4GB Laptop GPU, 17", 2.5 kg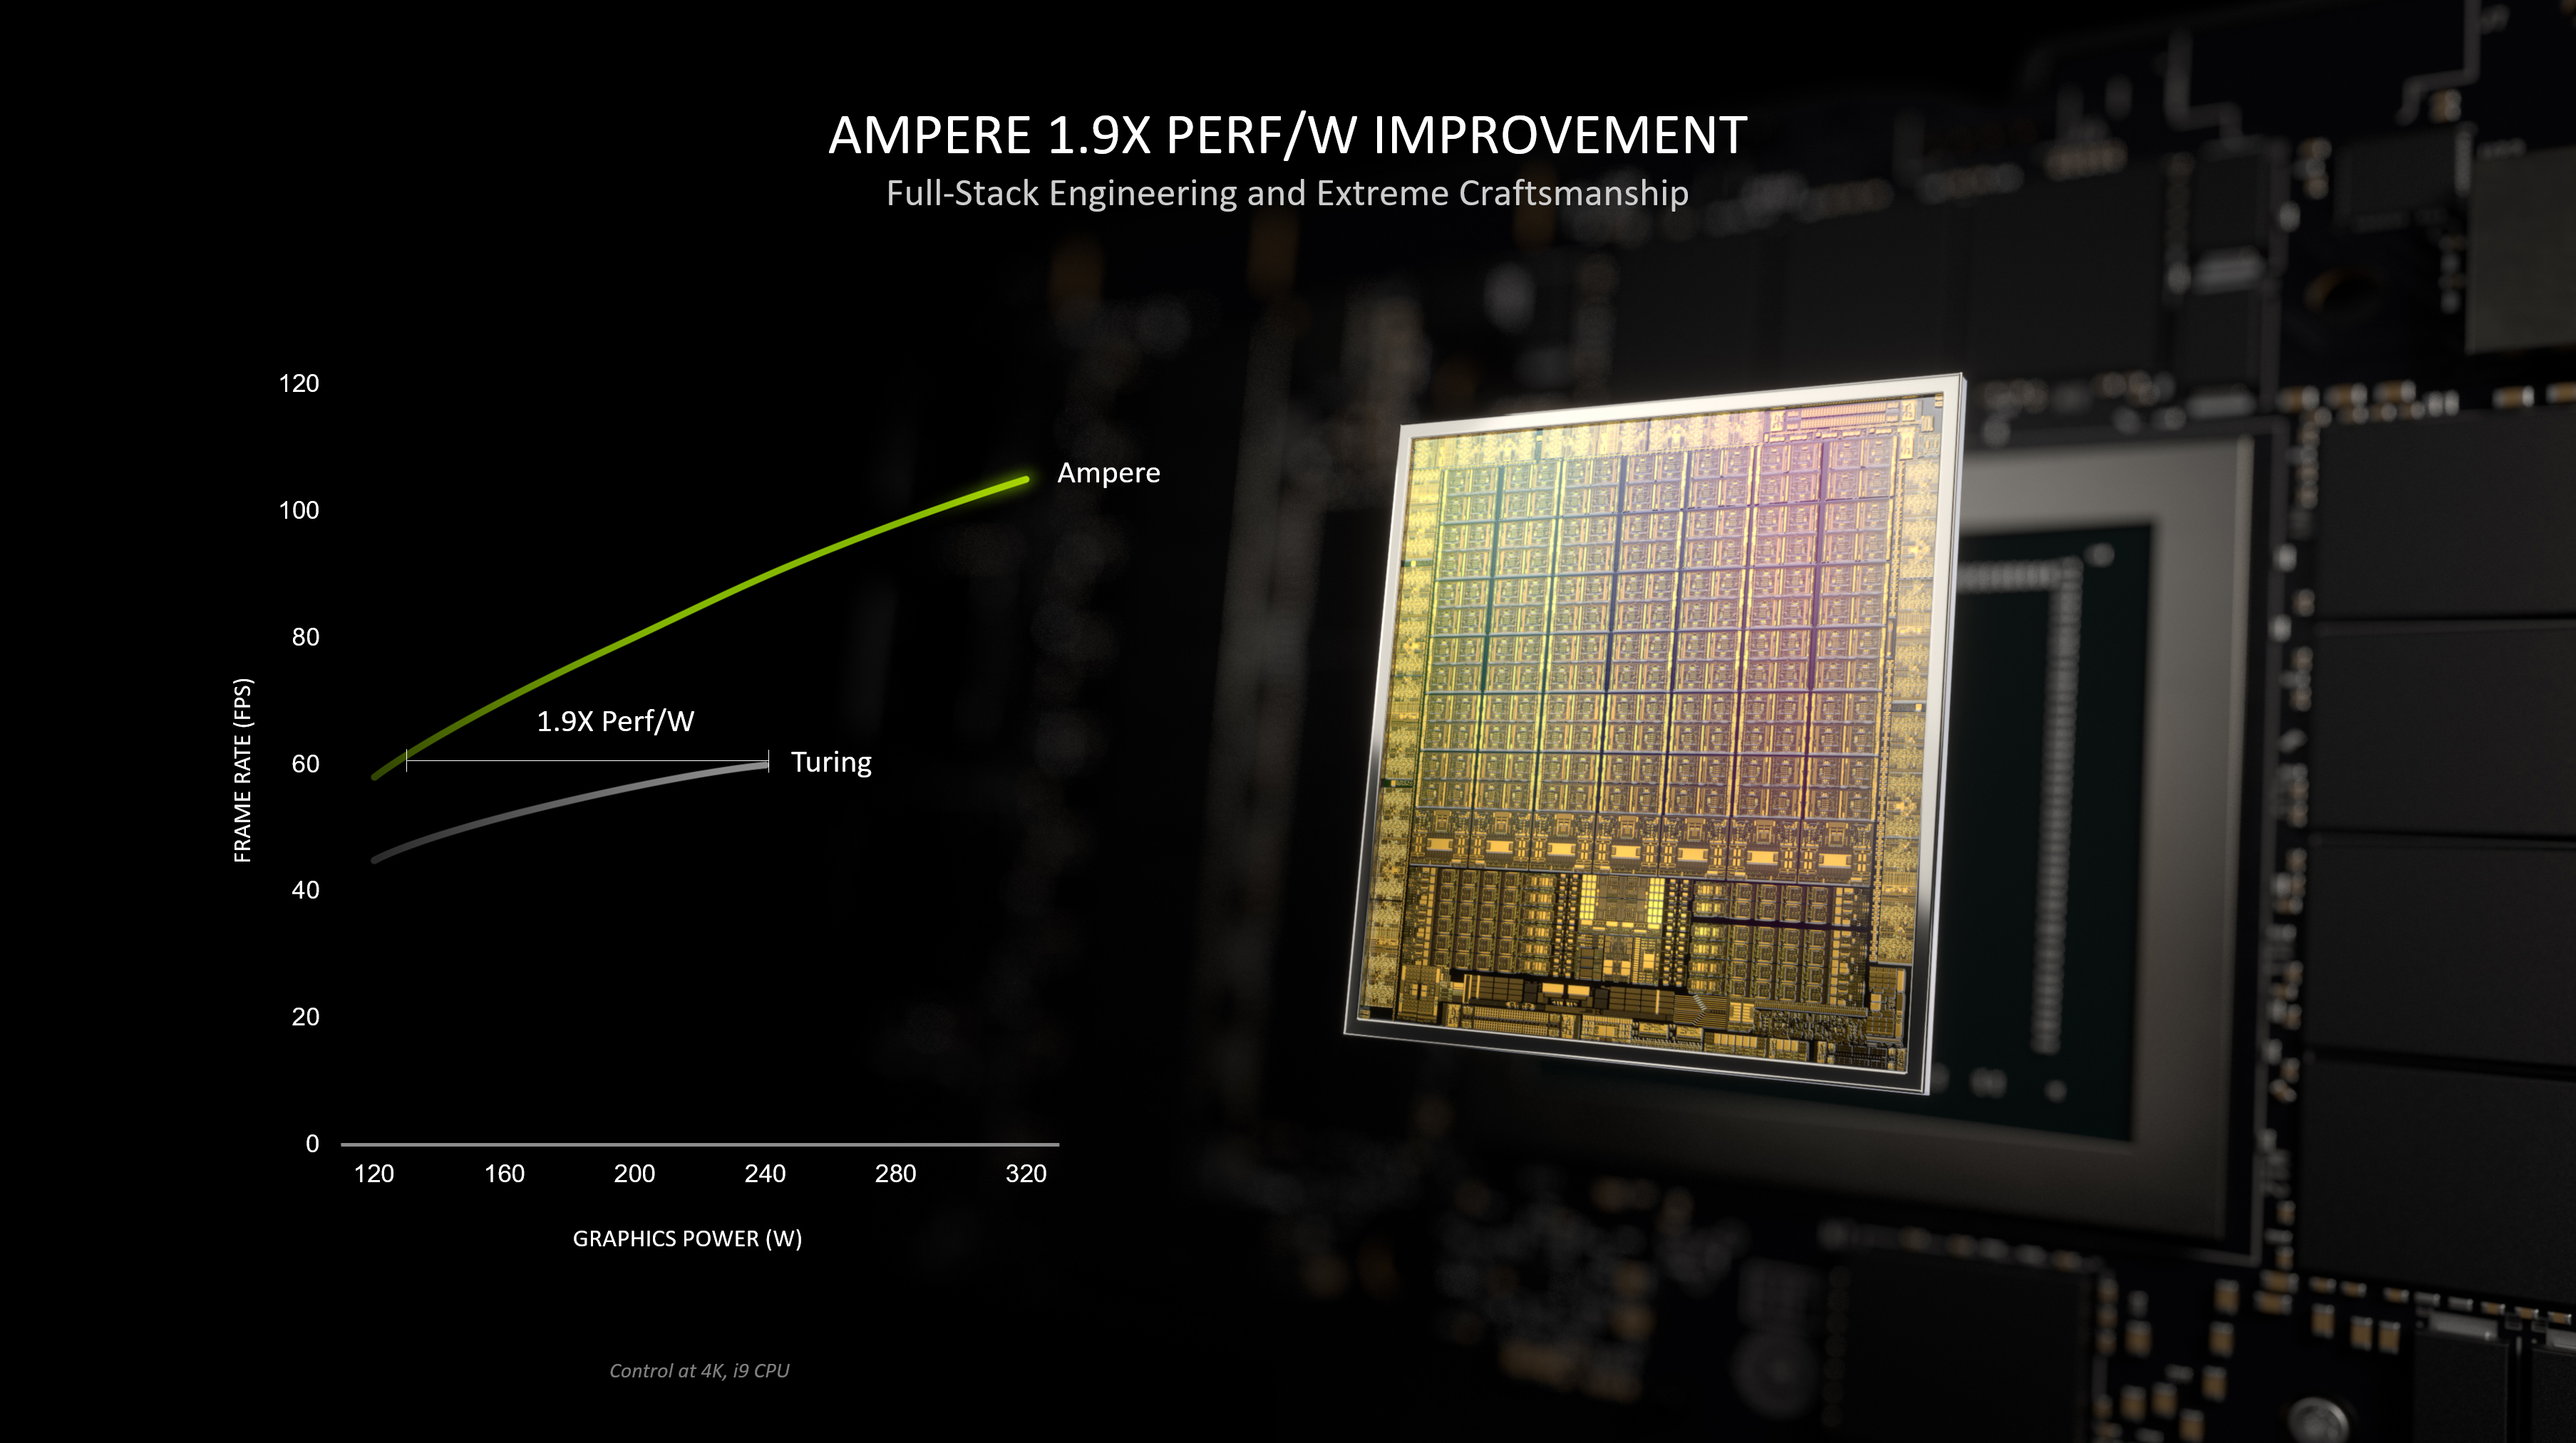
Nvidia GeForce RTX 3050 Laptop GPU(移动、NVIDIA_DEV.2583、GN20-P0)是最慢的RTX 3000移动卡,基于GA107安培芯片。 提供 2048 CUDA、16 条光线跟踪和 64 个张量核心。 内存总线限制为128位,支持4GB的GDDR6专用图形内存。时钟速度因TGP变体而异,35~80瓦特的TGP变体为735~1463(基本)和1035~1695(升压)的范围(请参阅下表)。
暂定时钟速率
TGP(功耗)35W 40W 45W 50W 60W 70W 80W
基本时钟速度 (MHz)713938 1065 1178 1238 1403 1530
Boost Clock Speed (MHz) 10581223 13431455 1500 16351740
性能必须介于旧的 GTX 1650 Ti 和 1660 Ti Max-Q 之间,具体取决于所使用的 TGP 变型。 因此,它最适合全高清游戏(1920 x 1080),在要求苛刻的游戏中设置高细节。 此性能不足以在大多数游戏中启用 Raytracing,但某些游戏可以使用 Tensor 核心作为 DLSS(并且性能略有下降)。 请注意,低TGP变型可能会导致性能大幅下降。
高速RTX 3050 Ti以相似的时钟速度和TGP设置提供25%的内核。
GA107芯片提供3,072个FP32ALU,其中一半可以执行INT32指令(1,536个INT32ALU)。 但是,RTX 3050 可能不使用芯片上的所有 ALU。 如果使用 Turing,则所有着色器都可以执行 FP32 或 INT32 指令。 Nvidia还改善了芯片上的光线跟踪和张量核。 安培芯片还包括改进的第 5代视频编码器 (H.264和 H.265的 NVENC)和第 7代解码器 (包括 AV1的各种格式 )。
GA107芯片由Samsung以8nm(8N)制造,与TSMC的7nm节点(AMD、专业GA100安培芯片等)相比,性能差很多。
GeForce RTX 3000 Series
| |||||||||||||||||||||||||||||||||||||||||||||||||||||||||||||||||||
| Codename | GN20-P0 | ||||||||||||||||||||||||||||||||||||||||||||||||||||||||||||||||||
| Architecture | Ampere | ||||||||||||||||||||||||||||||||||||||||||||||||||||||||||||||||||
| Pipelines | 2048 - unified | ||||||||||||||||||||||||||||||||||||||||||||||||||||||||||||||||||
| TMUs | 64 | ||||||||||||||||||||||||||||||||||||||||||||||||||||||||||||||||||
| ROPs | 32 | ||||||||||||||||||||||||||||||||||||||||||||||||||||||||||||||||||
| Raytracing Cores | 16 | ||||||||||||||||||||||||||||||||||||||||||||||||||||||||||||||||||
| Tensor / AI Cores | 64 | ||||||||||||||||||||||||||||||||||||||||||||||||||||||||||||||||||
| Core Speed | 1238 - 1500 (Boost) MHz | ||||||||||||||||||||||||||||||||||||||||||||||||||||||||||||||||||
| Memory Speed | 12000 effective = 1500 MHz | ||||||||||||||||||||||||||||||||||||||||||||||||||||||||||||||||||
| Memory Bus Width | 128 Bit | ||||||||||||||||||||||||||||||||||||||||||||||||||||||||||||||||||
| Memory Type | GDDR6 | ||||||||||||||||||||||||||||||||||||||||||||||||||||||||||||||||||
| Max. Amount of Memory | 4 GB | ||||||||||||||||||||||||||||||||||||||||||||||||||||||||||||||||||
| Shared Memory | no | ||||||||||||||||||||||||||||||||||||||||||||||||||||||||||||||||||
| Memory Bandwidth | 192 GB/s | ||||||||||||||||||||||||||||||||||||||||||||||||||||||||||||||||||
| API | DirectX 12_2, Shader 6.7, OpenGL 4.6 | ||||||||||||||||||||||||||||||||||||||||||||||||||||||||||||||||||
| Power Consumption | 60 Watt (35 - 80 Watt TGP) | ||||||||||||||||||||||||||||||||||||||||||||||||||||||||||||||||||
| Man. Technology | 8 nm | ||||||||||||||||||||||||||||||||||||||||||||||||||||||||||||||||||
| PCIe | 4.0 | ||||||||||||||||||||||||||||||||||||||||||||||||||||||||||||||||||
| Displays | HDMI 2.1, DisplayPort 1.4a | ||||||||||||||||||||||||||||||||||||||||||||||||||||||||||||||||||
| Features | NVIDIA DLSS, NVIDIA Reflex, Resizable BAR, NVIDIA Broadcast, NVIDIA Ansel, NVIDIA ShadowPlay®, NVIDIA G-SYNC®, Advanced Optimus, Nvidia Max-Q, Dynamic Boost | ||||||||||||||||||||||||||||||||||||||||||||||||||||||||||||||||||
| Notebook Size | large | ||||||||||||||||||||||||||||||||||||||||||||||||||||||||||||||||||
| Date of Announcement | 11.05.2021 | ||||||||||||||||||||||||||||||||||||||||||||||||||||||||||||||||||
The following benchmarks stem from our benchmarks of review laptops. The performance depends on the used graphics memory, clock rate, processor, system settings, drivers, and operating systems. So the results don't have to be representative for all laptops with this GPU. For detailed information on the benchmark results, click on the fps number.


For more games that might be playable and a list of all games and graphics cards visit our Gaming List
Asus VivoBook Pro 16X OLED N7600PC-L2026X: Intel Core i7-11370H, 16.00", 2 kg
Review » 华硕Vivobook Pro 16X笔记本电脑回顾。拥有顶级OLED显示屏的华硕系统
Acer Swift X SFX14-51G-5876: Intel Core i5-1240P, 14.00", 1.4 kg
Review » 宏碁Swift X 14笔记本电脑评论与RTX 3050。挑战不足的i5-1240P
Lenovo IdeaPad Gaming 3 15ARH7: AMD Ryzen 5 6600H, 15.60", 2.4 kg
Review » Ryzen 5 6600H性能首次亮相。联想IdeaPad Gaming 3 15ARH7笔记本电脑评测
Dell Inspiron 14 Plus 7420: Intel Core i7-12700H, 14.00", 1.7 kg
Review » 戴尔Inspiron 14 Plus 7420笔记本电脑评论。适用于预算有限的电力用户
Asus TUF Dash F15 FX517ZC: Intel Core i7-12650H, 15.60", 1.9 kg
Review » 华硕TUF Dash F15 FX517ZC笔记本评测。1440p、165赫兹和全P3颜色,价格低于1000美元
Acer Swift X SFX16-51G-5388: Intel Core i5-11320H, 16.10", 1.8 kg
Review » 宏碁Swift X 16评论。RTX 3050在多媒体笔记本电脑中大放异彩
Dell Inspiron 15 Plus: Intel Core i5-11400H, 15.60", 1.9 kg
Review » 戴尔Inspiron 15 Plus笔记本电脑评测。接近于完美的全能型产品
Asus Vivobook Pro 14 M3401QC-KM007T: AMD Ryzen 5 5600H, 14.00", 1.5 kg
Review » 华硕Vivobook Pro 14 OLED在审查。潘多拉验证的笔记本电脑包含了大量的处理能力
Dell G15 5510: Intel Core i5-10500H, 15.60", 2.5 kg
Review » 戴尔G15 5510笔记本电脑回顾。配备RTX 3050的经济型游戏笔记本
Dell XPS 17 9720: Intel Core i7-12700H, 17.00", 2.5 kg
Review » 戴尔XPS 17 9720评测--高端多媒体笔记本电脑开始显示其年龄
Gigabyte G5 GD: Intel Core i5-11400H, 15.60", 2.1 kg
Review » 技嘉G5 GD在回顾。经济实惠的游戏笔记本电脑,没有Windows
Asus VivoBook 15 Pro M3500QC-L1062: AMD Ryzen 5 5600H, 15.60", 1.7 kg
Review » 华硕VivoBook 15 Pro OLED回顾。负担得起的多媒体笔记本电脑,性能高
Acer Nitro 5 AN517-53-54DQ: Intel Core i5-11300H, 17.30", 2.6 kg
Review » 宏碁Nitro 5 AN517-53评论:经济实惠的游戏笔记本电脑与RTX 3050
MSI Cyborg 15 A13UC: Intel Core i5-13420H, 15.60", 2 kg
External Review » MSI Cyborg 15 A13UC
Acer Aspire 7 A715-76G, i7-12650H RTX 3050: Intel Core i7-12650H, 15.60", 2.1 kg
External Review » Acer Aspire 7 A715-76G, i7-12650H RTX 3050
Dell G15 5510: Intel Core i5-10500H, 15.60", 2.5 kg
External Review » Dell G15 5510
MSI Thin 15 B13UC: Intel Core i5-13420H, 15.60", 1.9 kg
External Review » MSI Thin 15 B13UC
Chuwi GTBook: Intel Core i5-12450H, 15.60", 1.5 kg
External Review » Chuwi GTBook
Asus Vivobook 16X K3605ZC, i5-12500H: Intel Core i5-12500H, 16.00", 1.8 kg
External Review » Asus Vivobook 16X K3605ZC, i5-12500H
MSI Thin 15 B12UX: Intel Core i5-12450H, 15.60", 1.9 kg
External Review » MSI Thin 15 B12UX
Asus TUF Gaming A15 FA506NC: AMD Ryzen 5 7535HS, 15.60", 2.3 kg
External Review » Asus TUF Gaming A15 FA506NC
MSI Thin A15 B7UC: AMD Ryzen 5 7535HS, 15.60", 1.9 kg
External Review » MSI Thin A15 B7UC
LG gram Pro 16Z90SP: Intel Core Ultra 7 155H, 16.00", 1.3 kg
External Review » LG gram Pro 16Z90SP
HP Envy 17-cw0000ng: Intel Core i7-1355U, 17.30", 2.5 kg
External Review » HP Envy 17-cw0000ng
Asus TUF Gaming F15 FX507ZC, i5-12500H: Intel Core i5-12500H, 15.60", 2.7 kg
External Review » Asus TUF Gaming F15 FX507ZC, i5-12500H
VAIO FH15: Intel Core i7-13700H, 15.60", 2 kg
External Review » VAIO FH15
MSI Katana GF66 12UCK: Intel Core i7-12650H, 15.60", 2.3 kg
External Review » MSI Katana GF66 12UCK
Acer Nitro 5 AN515-58-54UH: Intel Core i5-12450H, 15.60", 2.5 kg
External Review » Acer Nitro 5 AN515-58-54UH
HP Victus 15-fa0054ns: Intel Core i5-12450H, 15.60", 2.3 kg
External Review » HP Victus 15-fa0054ns
Acer Aspire 7 A715-76G, i5-12450H RTX 3050: Intel Core i5-12450H, 15.60", 2.1 kg
External Review » Acer Aspire 7 A715-76G, i5-12450H RTX 3050
Asus Vivobook 16X K3605ZC: Intel Core i7-12650H, 16.00", 1.8 kg
External Review » Asus Vivobook 16X K3605ZC
Medion Erazer Crawler E30: Intel Core i5-12500H, 15.60", 2 kg
External Review » Medion Erazer Crawler E30
HP Victus 15-fa1000: Intel Core i5-13500H, 15.60", 2.3 kg
External Review » HP Victus 15-fa1000
MSI GF63 12UC: Intel Core i5-12450H, 15.60", 1.9 kg
External Review » MSI GF63 12UC
Lenovo LOQ 16IRH8, i5-13420H RTX 3050: Intel Core i5-13420H, 16.00", 2.6 kg
External Review » Lenovo LOQ 16IRH8, i5-13420H RTX 3050
HP Victus 16-e0087ns: AMD Ryzen 7 5800H, 16.10", 2.5 kg
External Review » HP Victus 16-e0087ns
Lenovo Legion 5 15ARH7H: AMD Ryzen 5 6600H, 15.60", 2.4 kg
External Review » Lenovo Legion 5 15ARH7H
HP Victus 15-fa0000TX: Intel Core i5-12450H, 15.60", 2.3 kg
External Review » HP Victus 15-fa0000TX
MSI GF63 Thin 11UC: Intel Core i7-11800H, 15.60", 1.9 kg
External Review » MSI GF63 Thin 11UC
Asus Vivobook 14X K3405VC: Intel Core i9-13900H, 14.00", 1.4 kg
External Review » Asus Vivobook 14X K3405VC
Asus VivoBook Pro 16 K6602ZC, i7-12650H: Intel Core i7-12650H, 16.00", 1.7 kg
External Review » Asus VivoBook Pro 16 K6602ZC, i7-12650H
Asus VivoBook Pro 15 D3500QC-L1456W: AMD Ryzen 9 5900HX, 15.60", 1.9 kg
External Review » Asus VivoBook Pro 15 D3500QC-L1456W
Lenovo IdeaPad Gaming 3 15IAH7, i5-12500H RXT 3050: Intel Core i5-12500H, 15.60", 2.3 kg
External Review » Lenovo IdeaPad Gaming 3 15IAH7, i5-12500H. RXT 3050
Asus Vivobook Pro 15 K6502, i7-13650HX RTX 3050: Intel Core i7-13650HX, 15.60", 1.8 kg
External Review » Asus Vivobook Pro 15 K6502, i7-13650HX RTX 3050
Acer Nitro 5 AN515-47: AMD Ryzen 5 7535HS, 15.60", 2.5 kg
External Review » Acer Nitro 5 AN515-47
Asus Zenbook 14X UX3404VC, i7-13700H: Intel Core i7-13700H, 14.50", 1.6 kg
External Review » Asus Zenbook 14X UX3404VC, i7-13700H
MSI Katana GF66 12UC: Intel Core i7-12700H, 15.60", 2.3 kg
External Review » MSI Katana GF66 12UC
HP Victus 16-d1021ns: Intel Core i7-12700H, 16.10", 2.5 kg
External Review » HP Victus 16-d1021ns
HP Victus 16-e1021ns: AMD Ryzen 7 6800H, 16.10", 2.5 kg
External Review » HP Victus 16-e1021ns
Asus VivoBook Pro 16 K6602ZC: Intel Core i5-12450H, 16.00", 1.9 kg
External Review » Asus VivoBook Pro 16 K6602ZC
Acer Nitro 5 AN515-57-79TD: Intel Core i7-11800H, 15.60", 2.3 kg
External Review » Acer Nitro 5 AN515-57-79TD
Gigabyte G5 GE: Intel Core i5-12500H, 15.60", 1.9 kg
External Review » Gigabyte G5 GE
Asus Vivobook Pro 15 K6502, i9-11900H RTX 3050: Intel Core i9-11900H, 15.60", 1.8 kg
External Review » Asus Vivobook Pro 15 K6502, i9-11900H RTX 3050
LG Gram 17 2023 17Z90R: Intel Core i7-1360P, 17.00", 1.5 kg
External Review » LG Gram 17 2023 17Z90R
Asus Zenbook 14X UX3404VC-M3145X: Intel Core i9-13900H, 14.50", 1.6 kg
External Review » Asus Zenbook 14X UX3404VC-M3145X
Acer Nitro 5 AN515-47-R79X: AMD Ryzen 7 7735HS, 15.60", 2.5 kg
External Review » Acer Nitro 5 AN515-47-R79X
Asus Vivobook Pro 16 K6602HC, i9-11900H RTX 3050: Intel Core i9-11900H, 16.00", 1.9 kg
External Review » Asus Vivobook Pro 16 K6602HC, i9-11900H RTX 3050
Asus ROG Flow X13 GV301QC-K6001T: AMD Ryzen 7 5800HS, 13.40", 1.3 kg
External Review » Asus ROG Flow X13 GV301QC-K6001T
Asus Vivobook Pro 15 K6502, i5-12450H RTX 3050: Intel Core i5-12450H, 15.60", 1.8 kg
External Review » Asus Vivobook Pro 15 K6502, i5-12450H RTX 3050
Lenovo IdeaPad Gaming 3 15IAH7, i5-12450H RXT 3050: Intel Core i5-12450H, 15.60", 2.3 kg
External Review » Lenovo IdeaPad Gaming 3 15IAH7, i5-12450H RXT 3050
MSI GF63 Thin 11UC-680NL: Intel Core i5-11400H, 15.60", 1.9 kg
External Review » MSI GF63 Thin 11UC-680NL
Asus TUF Gaming F17 FX706HC-HX007W: Intel Core i5-11400H, 17.30", 2.6 kg
External Review » Asus TUF Gaming F17 FX706HC-HX007W
Asus TUF Gaming A15 FA506ICB-HN119W: AMD Ryzen 5 4600H, 15.60", 2.3 kg
External Review » Asus TUF Gaming A15 FA506ICB-HN119W
Asus Vivobook Pro 14 M6400, 6800H RTX 3050: AMD Ryzen 7 6800H, 14.00", 1.5 kg
External Review » Asus Vivobook Pro 14 M6400, 6800H RTX 3050
Asus TUF Gaming F15 FX506HC-HN004: Intel Core i5-11400H, 15.60", 2.3 kg
External Review » Asus TUF Gaming F15 FX506HC-HN004
Asus TUF Dash F15 FX517ZC, i5-12450H: Intel Core i5-12450H, 15.60", 2 kg
External Review » Asus TUF Dash F15 FX517ZC, i5-12450H
Dell G15 5511-5100BLK: Intel Core i5-11260H, 15.60", 2.8 kg
External Review » Dell G15 5511-5100BLK
Lenovo IdeaPad 5 Pro 16ARH7, R5 6600HS RTX 3050: AMD Ryzen 5 6600HS, 16.00", 2 kg
External Review » Lenovo IdeaPad 5 Pro 16ARH7, R5 6600HS RTX 3050
Asus Vivobook Pro 15 K6502, i7-12700H RTX 3050: Intel Core i7-12700H, 15.60", 1.8 kg
External Review » Asus Vivobook Pro 15 K6502, i7-12700H RTX 3050
Lenovo Yoga Slim 7 ProX 14IAH7, i5-12500H RTX 3050: Intel Core i5-12500H, 14.50", 1.4 kg
External Review » Lenovo Yoga Slim 7 ProX 14IAH7, i5-12500H RTX 3050
Acer Nitro 5 AN515-58-521S: Intel Core i5-12500H, 15.60", 2.5 kg
External Review » Acer Nitro 5 AN515-58-521S
Asus Vivobook Pro 15 K3500PC-L1293: Intel Core i5-11300H, 15.60", 1.7 kg
External Review » Asus Vivobook Pro 15 K3500PC-L1293
Asus ROG Strix G15 G513IC-HN100W: AMD Ryzen 7 4800H, 15.60", 2.1 kg
External Review » Asus ROG Strix G15 G513IC-HN100W
MSI Katana GF66 11UC-809NL: Intel Core i7-11800H, 15.60", 2.3 kg
External Review » MSI Katana GF66 11UC-809NL
MSI Prestige 14 A12UC-006: Intel Core i7-1260P, 14.00", 1.3 kg
External Review » MSI Prestige 14 A12UC-006
Asus VivoBook Pro 15 M6500QC-L1010W: AMD Ryzen 7 5800H, 15.60", 1.8 kg
External Review » Asus VivoBook Pro 15 M6500QC-L1010W
Lenovo Yoga Slim 7 Pro X 14IAH7 82TK006CGE: Intel Core i7-12700H, 14.50", 1.5 kg
External Review » Lenovo Yoga Slim 7 Pro X 14IAH7 82TK006CGE
Lenovo Yoga Slim 7 ProX 14IAH7-82TK0079GE: Intel Core i7-12700H, 14.50", 1.5 kg
External Review » Lenovo Yoga Slim 7 ProX 14IAH7-82TK0079GE
HP Victus 16-e1007ns: AMD Ryzen 7 6800H, 16.10", 2.5 kg
External Review » HP Victus 16-e1007ns
Acer Nitro 5 AN515-58-781E: Intel Core i7-12700H, 15.60", 2.5 kg
External Review » Acer Nitro 5 AN515-58-781E
Acer Aspire 7 A715-51G-529E: Intel Core i5-1240P, 15.60", 2.1 kg
External Review » Acer Aspire 7 A715-51G-529E
Dell Inspiron 14 Plus 7420: Intel Core i7-12700H, 14.00", 1.7 kg
External Review » Dell Inspiron 14 Plus 7420
MSI Prestige 14 A12UC-228: Intel Core i5-1240P, 14.00", 1.3 kg
External Review » MSI Prestige 14 A12UC-228
HP Victus 16-e0031ns: AMD Ryzen 7 5800H, 16.10", 0.5 kg
External Review » HP Victus 16-e0031ns
HP Victus 15-fb0009AX: AMD Ryzen 5 5600H, 15.60", 2.9 kg
External Review » HP Victus 15-fb0009AX
Lenovo Legion 5 15ACH6H-82QJ0000BR: AMD Ryzen 7 5800H, 15.60", 2.4 kg
External Review » Lenovo Legion 5 15ACH6H-82QJ0000BR
HP Victus 15-fa0011TX: Intel Core i5-12500H, 15.60", 2.3 kg
External Review » HP Victus 15-fa0011TX
Acer Swift X SFX14-41G-R0FB: AMD Ryzen 5 5500U, 14.00", 1.5 kg
External Review » Acer Swift X SFX14-41G-R0FB
Lenovo Legion 5 17ACH6-82K0008LMH: AMD Ryzen 7 5800H, 17.30", 3 kg
External Review » Lenovo Legion 5 17ACH6-82K0008LMH
Lenovo IdeaPad Gaming 3 15ARH7: AMD Ryzen 5 6600H, 15.60", 2.4 kg
External Review » Lenovo IdeaPad Gaming 3 15ARH7
Asus VivoBook Pro 15 M3500QC-L1297W: AMD Ryzen 7 5800H, 15.60", 1.7 kg
External Review » Asus VivoBook Pro 15 M3500QC-L1297W
Asus VivoBook Pro 16X N7600PC-L2010W: Intel Core i7-11370H, 16.10", 2 kg
External Review » Asus VivoBook Pro 16X N7600PC-L2010W
MSI Katana GF66 12UC-077: Intel Core i5-12500H, 15.60", 2.3 kg
External Review » MSI Katana GF66 12UC-077
Lenovo Yoga Slim 7 ProX 14ARH7-82TL000BGE: AMD Ryzen 9 6900HS, 14.50", 1.5 kg
External Review » Lenovo Yoga Slim 7 ProX 14ARH7-82TL000BGE
MSI Prestige 14 A12UC, i7-1280P: Intel Core i7-1280P, 14.00", 1.3 kg
External Review » MSI Prestige 14 A12UC, i7-1280P
Gigabyte G7 GD: Intel Core i5-11400H, 17.30", 2.4 kg
External Review » Gigabyte G7 GD
Lenovo IdeaPad Gaming 3 15ACH6, 5800H RTX 3050: AMD Ryzen 7 5800H, 15.60", 2.2 kg
External Review » Lenovo IdeaPad Gaming 3 15ACH6, 5800H RTX 3050
HP Victus 16-e0033ns: AMD Ryzen 7 5800H, 16.10", 2.5 kg
External Review » HP Victus 16-e0033ns
Acer Aspire 7 A715-42G-R8BV: AMD Ryzen 5 5500U, 15.60", 2.2 kg
External Review » Acer Aspire 7 A715-42G-R8BV
Asus ROG Zephyrus G14 GA401QC-K2175: AMD Ryzen 7 5800HS, 14.00", 1.6 kg
External Review » Asus ROG Zephyrus G14 GA401QC-K2175
Lenovo IdeaPad 5 Pro 16ACH6-82L5009DMH: AMD Ryzen 9 5900HX, 16.00", 1.9 kg
External Review » Lenovo IdeaPad 5 Pro 16ACH6-82L5009DMH
Lenovo IdeaPad Gaming 3 15IAH7-82S9006JGE: Intel Core i5-12500H, 15.60", 2.3 kg
External Review » Lenovo IdeaPad Gaming 3 15IAH7-82S9006JGE
Asus Vivobook Pro 16X M7600QC-L2002T: AMD Ryzen 7 5800H, 16.00", 2 kg
External Review » Asus Vivobook Pro 16X M7600QC-L2002T
Asus VivoBook Pro 15 M3500QC-L1063: AMD Ryzen 5 5600H, 15.60", 1.7 kg
External Review » Asus VivoBook Pro 15 M3500QC-L1063
HP Victus 16-e0350nd: AMD Ryzen 7 5800H, 16.10", 2.5 kg
External Review » HP Victus 16-e0350nd
Asus ROG Zephyrus G14 GA401QC-HZ018: AMD Ryzen 7 5800HS, 14.00", 1.6 kg
External Review » Asus ROG Zephyrus G14 GA401QC-HZ018
HP Spectre x360 16-f0035: Intel Core i7-11390H, 16.00", 2 kg
External Review » HP Spectre x360 16-f0035
MSI GF63 Thin 11UC-447XES: Intel Core i5-11400H, 15.60", 1.9 kg
External Review » MSI GF63 Thin 11UC-447XES
MSI Prestige 15 A12UC: Intel Core i7-1280P, 15.60", 1.7 kg
External Review » MSI Prestige 15 A12UC
Acer Nitro 5 AN515-58-58BN: Intel Core i5-12500H, 15.60", 2.5 kg
External Review » Acer Nitro 5 AN515-58-58BN
Lenovo Yoga Slim 7 ProX 14ARH7-82TL0042GE: AMD Ryzen 7 6800HS, 14.50", 1.5 kg
External Review » Lenovo Yoga Slim 7 ProX 14ARH7-82TL0042GE
MSI Creator M16 A12UC-284: Intel Core i7-12700H, 16.00", 2.3 kg
External Review » MSI Creator M16 A12UC-284
Dell XPS 17 9720: Intel Core i7-12700H, 17.00", 2.5 kg
External Review » Dell XPS 17 9720
HP Victus 16-e0029ns: AMD Ryzen 7 5800H, 16.10", 2.5 kg
External Review » HP Victus 16-e0029ns
HP Envy 15-ep1008ns: Intel Core i5-11400H, 15.60", 2.2 kg
External Review » HP Envy 15-ep1008ns
HP Victus 16-d0018ns: Intel Core i7-11800H, 15.60", 2.5 kg
External Review » HP Victus 16-d0018ns
Lenovo Legion 5 15ITH6, i7-11800H RTX 3050: Intel Core i7-11800H, 15.60", 2.4 kg
External Review » Lenovo Legion 5 15ITH6, i7-11800H RTX 3050
Asus VivoBook Pro 14 M3401QC-KM007W: AMD Ryzen 5 5600H, 14.00", 1.5 kg
External Review » Asus VivoBook Pro 14 M3401QC-KM007W
Lenovo IdeaPad Slim 7 Pro 16: AMD Ryzen 7 5800H, 16.00", 2.1 kg
External Review » Lenovo IdeaPad Slim 7 Pro 16
Lenovo IdeaPad Gaming 3 15IHU6-82K100QHGE: Intel Core i5-11300H, 15.60", 2.3 kg
External Review » Lenovo IdeaPad Gaming 3 15IHU6-82K100QHGE
HP Envy 14-eb1035nr: Intel Core i7-11390H, 14.00", 1.5 kg
External Review » HP Envy 14-eb1035nr
Asus TUF Gaming F15 FX506HCB-HN256T: Intel Core i5-11400H, 15.60", 2.3 kg
External Review » Asus TUF Gaming F15 FX506HCB-HN256T
Asus ROG Strix G15 G513RC: AMD Ryzen 7 6800H, 15.60", 2.1 kg
External Review » Asus ROG Strix G15 G513RC
Asus TUF Gaming F15 FX507ZC: Intel Core i7-12700H, 15.60", 2.2 kg
External Review » Asus TUF Gaming F15 FX507ZC
Asus TUF Dash F15 FX517ZC: Intel Core i7-12650H, 15.60", 1.9 kg
External Review » Asus TUF Dash F15 FX517ZC
Dell Vostro 15 7510, i5-11400H RTX 3050: Intel Core i5-11400H, 15.60", 1.9 kg
External Review » Dell Vostro 15 7510, i5-11400H RTX 3050
Asus VivoBook Pro 15 M3500QC-KJ161T: AMD Ryzen 7 5800H, 15.60", 1.7 kg
External Review » Asus VivoBook Pro 15 M3500QC-KJ161T
HP Victus 16-d0021ns: Intel Core i7-11800H, 16.10", 2.5 kg
External Review » HP Victus 16-d0021ns
Asus Vivobook Pro 14X M7400, 5800H 3050: AMD Ryzen 7 5800H, 14.00", 1.5 kg
External Review » Asus Vivobook Pro 14X M7400, 5800H 3050
Acer Aspire 7 A715-42G-R69L: AMD Ryzen 5 5500U, 15.60", 2.2 kg
External Review » Acer Aspire 7 A715-42G-R69L
HP Pavilion Gaming 15-ec2010AX: AMD Ryzen 5 5600H, 15.60", 2 kg
External Review » HP Pavilion Gaming 15-ec2010AX
Lenovo IdeaPad Gaming 3 15ACH6, 5600H RTX 3050: AMD Ryzen 5 5600H, 15.60", 2.2 kg
External Review » Lenovo IdeaPad Gaming 3 15ACH6, 5600H RTX 3050
HP Victus 16-e0914ng: AMD Ryzen 5 5600H, 16.10", 2.5 kg
External Review » HP Victus 16-e0914ng
Asus ROG Flow Z13 GZ301ZC-LD027W: Intel Core i7-12700H, 13.40", 1.2 kg
External Review » Asus ROG Flow Z13 GZ301ZC-LD027W
Asus Vivobook Pro 14X M7400QC-KM018: AMD Ryzen 7 5800H, 14.00", 1.5 kg
External Review » Asus Vivobook Pro 14X M7400QC-KM018
HP Victus 16-e0026ns: AMD Ryzen 7 5800H, 16.10", 2.5 kg
External Review » HP Victus 16-e0026ns
MSI Katana GF66 11UC-231ES: Intel Core i7-11800H, 15.60", 2.1 kg
External Review » MSI Katana GF66 11UC-231ES
Asus Vivobook Pro 16X N7600PC-L2012R: Intel Core i5-11300H, 16.10", 2 kg
External Review » Asus Vivobook Pro 16X N7600PC-L2012R
Dell G15 5510-5889BLK: Intel Core i5-10500H, 15.60", 2.7 kg
External Review » Dell G15 5510-5889BLK
Dell G15 5510, i5-10200H RTX 3050: Intel Core i5-10200H, 15.60", 2.7 kg
External Review » Dell G15 5510, i5-10200H RTX 3050
Dell G15 5510-5964BLK: Intel Core i5-10200H, 15.60", 2.5 kg
External Review » Dell G15 5510-5964BLK
Xiaomi Mi Notebook Pro X14: Intel Core i7-11370H, 14.00", 1.6 kg
External Review » Xiaomi Mi Notebook Pro X14
HP Spectre x360 16-f0008ca: Intel Core i7-11390H, 16.00", 2 kg
External Review » HP Spectre x360 16-f0008ca
HP Pavilion Gaming 15-dk2002TX: Intel Core i5-11300H, 15.60", 2.2 kg
External Review » HP Pavilion Gaming 15-dk2002TX
Asus VivoBook Pro 14X N7400, i5-11300H RTX 3050: Intel Core i5-11300H, 14.00", 1.5 kg
External Review » Asus VivoBook Pro 14X N7400, i5-11300H RTX 3050
Acer Nitro 5 AN515-57-77QK: Intel Core i7-11800H, 15.60", 2.3 kg
External Review » Acer Nitro 5 AN515-57-77QK
Asus VivoBook Pro 14X N7400PC-KM012T: Intel Core i7-11370H, 14.00", 1.5 kg
External Review » Asus VivoBook Pro 14X N7400PC-KM012T
MSI Katana GF76 11UC-080ES: Intel Core i7-11800H, 17.30", 2.3 kg
External Review » MSI Katana GF76 11UC-080ES
Lenovo IdeaPad 5 Pro 16ACH6-82L5006TGE: AMD Ryzen 9 5900HX, 16.00", 1.9 kg
External Review » Lenovo IdeaPad 5 Pro 16ACH6-82L5006TGE
Acer Swift X SFX14-41G-R0SG: AMD Ryzen 5 5600U, 14.00", 1.5 kg
External Review » Acer Swift X SFX14-41G-R0SG
Asus VivoBook Pro 14X M7400QC, 5600H RTX 3050: AMD Ryzen 5 5600H, 14.00", 1.5 kg
External Review » Asus VivoBook Pro 14X M7400QC, 5600H RTX 3050
MSI Katana GF66 11UC-072XES: Intel Core i7-11800H, 15.60", 2.1 kg
External Review » MSI Katana GF66 11UC-072XES
Asus Vivobook Pro 16X M7600, 5800H 3050: AMD Ryzen 7 5800H, 16.00", 2 kg
External Review » Asus Vivobook Pro 16X M7600, 5800H 3050
Asus VivoBook Pro 15 M3500QC-L1062: AMD Ryzen 5 5600H, 15.60", 1.7 kg
External Review » Asus VivoBook Pro 15 M3500QC-L1062
Acer Swift X SFX14-41G-R5EM: AMD Ryzen 7 5800U, 14.00", 1.5 kg
External Review » Acer Swift X SFX14-41G-R5EM
Lenovo Legion 5 Pro 16ITH6H, i7-11800H RTX 3050: Intel Core i7-11800H, 16.00", 2.3 kg
External Review » Lenovo Legion 5 Pro 16ITH6H, i7-11800H RTX 3050
Asus VivoBook Pro 14X N7400PC-KM142W: Intel Core i7-11370H, 14.00", 1.5 kg
External Review » Asus VivoBook Pro 14X N7400PC-KM142W
HP Victus 16-d0108TX: Intel Core i7-11800H, 16.10", 2.5 kg
External Review » HP Victus 16-d0108TX
Asus ROG Zephyrus G14 GA401QC-K2123T: AMD Ryzen 7 5800HS, 14.00", 1.6 kg
External Review » Asus ROG Zephyrus G14 GA401QC-K2123T
Asus VivoBook Pro 15 K3500PC-L1009T: Intel Core i5-11300H, 15.60", 1.7 kg
External Review » Asus VivoBook Pro 15 K3500PC-L1009T
Asus VivoBook 15 Pro M3500QC-L1062: AMD Ryzen 5 5600H, 15.60", 1.7 kg
External Review » Asus VivoBook 15 Pro M3500QC-L1062
MSI Summit E16 Flip Evo A11UCT-028: Intel Core i7-1195G7, 16.00", 2 kg
External Review » MSI Summit E16 Flip Evo A11UCT-028
Asus VivoBook Pro 15 D3500QC-L1103T: AMD Ryzen 7 5800H, 15.60", 1.7 kg
External Review » Asus VivoBook Pro 15 D3500QC-L1103T
Acer Nitro 5 AN517-54-706P: Intel Core i7-11800H, 17.30", 2.7 kg
External Review » Acer Nitro 5 AN517-54-706P
Acer Nitro 5 AN515-45-NH.QCLSI.001: AMD Ryzen 5 5600H, 15.60", 2.3 kg
External Review » Acer Nitro 5 AN515-45-NH.QCLSI.001
Asus VivoBook Pro 15 K3500PC, i7-11370H RTX 3050: Intel Core i7-11370H, 15.60", 1.7 kg
External Review » Asus VivoBook Pro 15 K3500PC, i7-11370H RTX 3050
Gigabyte G5 GD: Intel Core i5-11400H, 15.60", 2.1 kg
External Review » Gigabyte G5 GD
Lenovo IdeaPad Gaming 3 15IHU6-82K1002QGE: Intel Core i5-11300H, 15.60", 2.3 kg
External Review » Lenovo IdeaPad Gaming 3 15IHU6-82K1002QGE
Asus VivoBook Pro 16X N7600PC: Intel Core i7-11370H, 16.10", 1.9 kg
External Review » Asus VivoBook Pro 16X N7600PC
HP Victus 16-e0011ns: AMD Ryzen 7 5800H, 16.10", 2.5 kg
External Review » HP Victus 16-e0011ns
Asus Vivobook Pro 14X M7400, 5900HX 3050: AMD Ryzen 9 5900HX, 14.00", 1.5 kg
External Review » Asus Vivobook Pro 14X M7400, 5900HX 3050
Acer Nitro 5 AN515-55-53E5: Intel Core i5-10300H, 15.60", 2.3 kg
External Review » Acer Nitro 5 AN515-55-53E5
Asus TUF Gaming F17 FX706HC-HX008T: Intel Core i7-11800H, 17.30", 2.6 kg
External Review » Asus TUF Gaming F17 FX706HC-HX008T
Dell G15 5515, 5600H RTX 3050: AMD Ryzen 5 5600H, 15.60", 2.6 kg
External Review » Dell G15 5515, 5600H RTX 3050
HP Pavilion Gaming 17-cd2023ur: Intel Core i7-11370H, 17.30", 2.8 kg
External Review » HP Pavilion Gaming 17-cd2023ur
Asus Vivobook Pro 14 M3401, 5900HX: AMD Ryzen 9 5900HX, 14.00", 1.4 kg
External Review » Asus Vivobook Pro 14 M3401, 5900HX
Acer Nitro 5 AN515-57-56HH: Intel Core i5-11400H, 15.60", 2.3 kg
External Review » Acer Nitro 5 AN515-57-56HH
HP Victus 16-d0146ng: Intel Core i5-11400H, 16.10", 2.5 kg
External Review » HP Victus 16-d0146ng
Acer Swift X SFX14-41G-R7PP: AMD Ryzen 5 5600U, 14.00", 1.5 kg
External Review » Acer Swift X SFX14-41G-R7PP
Dell Inspiron 16 Plus 7610: Intel Core i7-11800H, 16.00", 2 kg
External Review » Dell Inspiron 16 Plus 7610
Asus Vivobook Pro 16X-M7600QC: AMD Ryzen 5 5600H, 16.00", 2 kg
External Review » Asus Vivobook Pro 16X-M7600QC
HP Victus 16-d0057ng: Intel Core i5-11400H, 16.10", 2.5 kg
External Review » HP Victus 16-d0057ng
Dell G15 5510-Y4V8G: Intel Core i7-10870H, 15.60", 2.7 kg
External Review » Dell G15 5510-Y4V8G
Lenovo IdeaPad 5 Pro 16ACH6, R7 5800H RTX 3050: AMD Ryzen 7 5800H, 16.00", 1.9 kg
External Review » Lenovo IdeaPad 5 Pro 16ACH6, R7 5800H RTX 3050
MSI Katana GF66 11UC-011NL: Intel Core i7-11800H, 15.60", 2.1 kg
External Review » MSI Katana GF66 11UC-011NL
Asus ROG Strix G17 G713QС-HX052T: AMD Ryzen 7 5800H, 17.30", 2.7 kg
External Review » Asus ROG Strix G17 G713QС-HX052T
MSI Katana GF66 11UC-228: Intel Core i7-11800H, 15.60", 2.1 kg
External Review » MSI Katana GF66 11UC-228
MSI Katana GF66 11UC-093: Intel Core i5-11400H, 15.60", 2.1 kg
External Review » MSI Katana GF66 11UC-093
Dell XPS 17 9720: Intel Core i7-12700H, 17.00", 2.5 kg
» 戴尔XPS 17 9730:宣布配备英特尔猛禽湖H处理器和NvidiaGeForce RTX 4000显卡的高级笔记本电脑
Asus VivoBook Pro 16X OLED N7600PC-L2026X: Intel Core i7-11370H, 16.00", 2 kg
» 华硕Vivobook Pro 16X的评论。有一些弱点的全能型产品
Lenovo IdeaPad Gaming 3 15ARH7: AMD Ryzen 5 6600H, 15.60", 2.4 kg
» Ryzen 5 6600H仅比Ryzen 5 5600H快5%,以在许多方面感觉是一个重塑的品牌
» Comparison of GPUs
Detailed list of all laptop GPUs sorted by class and performance.
» Benchmark List
Sort and restrict laptop GPUs based on performance in synthetic benchmarks.
» Notebook Gaming List
Playable games for each graphics card and their average FPS results.
* Approximate position of the graphics adapter
» Notebookcheck多媒体笔记本电脑Top 10排名
» Notebookcheck游戏笔记本电脑Top 10排名
» Notebookcheck低价办公/商务笔记本电脑Top 10排名
» Notebookcheck高端办公/商务笔记本电脑Top 10排名
» Notebookcheck工作站笔记本电脑Top 10排名
» Notebookcheck亚笔记本电脑Top 10排名
» Notebookcheck超级本产品Top 10排名
» Notebookcheck变形本产品Top 10排名
» Notebookcheck平板电脑Top 10排名
» Notebookcheck智能手机Top 10排名
» Notebookcheck评测过最出色的笔记本电脑屏幕
» Notebookcheck售价500欧元以下笔记本电脑Top 10排名
» Notebookcheck售价300欧元以下笔记本电脑Top 10排名