


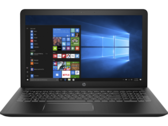
惠普 Pavilion Power 15t-cb2000 (i7-7700HQ, Radeon RX 550) 笔记本电脑简短测评
有能量...... 承受能力很强?惠普Pavilion Power 15t已经回来,这次搭配了AMD RX 550显卡,价格比以前更低。不幸的是,我们的测试机型遇到了一些意想不到的挑战。
Intel Core i7-7700HQ, AMD Radeon RX 550 (Laptop), 15.6", 2.3 kg
AMD Radeon RX 550是基于Polaris 12芯片的移动中端显卡,为笔记本二设计。它在代工厂或三星,采用改进后的14 nm FinFET工艺制造。Polaris 12芯片(代号Lexa)是比Polaris 11和21更小的芯片,采用改进的14nm工艺,比第一代(Radeon RX 400系列)具有更高的时钟频率。它具有640个着色器(10个CU),并且(至少在Pavilion 15t中)所有核心在移动版本中都激活了(其中512个在桌面版本RX 550中激活)。
根据指定的峰值性能,该芯片应该与MacBook Pro 2016中的Radeon Pro 455类似。在我们的测试中,它到达了Radeon Pro 455,最好的情况是英伟达 GeForce MX150的程度,但是仍然落后于GeForce GTX 1050。
Radeon RX 550的功能与速度更快的RX 460和所有其他Polaris芯片相同。在这里查看Polaris构架的更多细节。
根据AMD的博客文章,速度更快的Radeon Pro 460的功耗是35瓦。在“巫师3”的测试中,笔记本Pavilion 15t中的显卡为80瓦。它的位置处于更为高效能的MX150和GTX 1050之间。
Radeon RX 500 Series
| |||||||||||||||||||||||||||||||
| Codename | Polaris 12 | ||||||||||||||||||||||||||||||
| Architecture | Polaris | ||||||||||||||||||||||||||||||
| Pipelines | 640 - unified | ||||||||||||||||||||||||||||||
| Core Speed | 1287 - 1476 (Boost) MHz | ||||||||||||||||||||||||||||||
| Memory Speed | 6000 MHz | ||||||||||||||||||||||||||||||
| Memory Bus Width | 128 Bit | ||||||||||||||||||||||||||||||
| Memory Type | GDDR5 | ||||||||||||||||||||||||||||||
| Max. Amount of Memory | 4 GB | ||||||||||||||||||||||||||||||
| Shared Memory | no | ||||||||||||||||||||||||||||||
| API | DirectX 12, OpenGL Vulkan | ||||||||||||||||||||||||||||||
| Power Consumption | 50 Watt | ||||||||||||||||||||||||||||||
| Man. Technology | 14 nm | ||||||||||||||||||||||||||||||
| Features | DisplayPort 1.3 HBR / 1.4 HDR Ready, HDMI 2.0, AMD FreeSync | ||||||||||||||||||||||||||||||
| Notebook Size | large | ||||||||||||||||||||||||||||||
| Date of Announcement | 21.03.2017 | ||||||||||||||||||||||||||||||
| Link to Manufacturer Page | www.amd.com | ||||||||||||||||||||||||||||||
The following benchmarks stem from our benchmarks of review laptops. The performance depends on the used graphics memory, clock rate, processor, system settings, drivers, and operating systems. So the results don't have to be representative for all laptops with this GPU. For detailed information on the benchmark results, click on the fps number.


For more games that might be playable and a list of all games and graphics cards visit our Gaming List
Lenovo ThinkPad E580-20KS001RGE: Intel Core i7-8550U, 15.60", 2.1 kg
External Review » Lenovo ThinkPad E580-20KS001RGE
Lenovo ThinkPad E480-20KN001NGE: Intel Core i7-8550U, 14.00", 1.8 kg
External Review » Lenovo ThinkPad E480-20KN001NGE
Acer Aspire Nitro 5 AN515-41-F1XF: AMD FX-9830P, 15.60", 2.7 kg
External Review » Acer Aspire Nitro 5 AN515-41-F1XF
» Comparison of GPUs
Detailed list of all laptop GPUs sorted by class and performance.
» Benchmark List
Sort and restrict laptop GPUs based on performance in synthetic benchmarks.
» Notebook Gaming List
Playable games for each graphics card and their average FPS results.
* Approximate position of the graphics adapter
» Notebookcheck多媒体笔记本电脑Top 10排名
» Notebookcheck游戏笔记本电脑Top 10排名
» Notebookcheck低价办公/商务笔记本电脑Top 10排名
» Notebookcheck高端办公/商务笔记本电脑Top 10排名
» Notebookcheck工作站笔记本电脑Top 10排名
» Notebookcheck亚笔记本电脑Top 10排名
» Notebookcheck超级本产品Top 10排名
» Notebookcheck变形本产品Top 10排名
» Notebookcheck平板电脑Top 10排名
» Notebookcheck智能手机Top 10排名
» Notebookcheck评测过最出色的笔记本电脑屏幕
» Notebookcheck售价500欧元以下笔记本电脑Top 10排名
» Notebookcheck售价300欧元以下笔记本电脑Top 10排名