


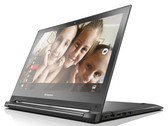
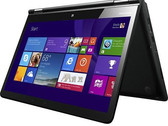
联想 Flex 2 Pro 15 笔记本电脑简短评测
Flexible all-rounder. 联想的15.6寸Flex 2 Pro 15多模式笔记本电脑没有什么弱点,是一款表现全面的设备。不过它的较高配置型号(固态硬盘,16 GB内存)售价接近1000欧元(约6993人民币)。
Intel Core i7-4510U, NVIDIA GeForce 840M, 15.6", 2.3 kg
2014年3月发布的NVIDIA GeForce 840M是一款支持DirectX 11的中端显卡。它是最早一批基于Nvidia的新Maxwell架构(GM108核心)的显卡之一,但仍使用了28纳米制程技术制造。840M提供了频率为1029MHz(最大速度)的384个着色器单元,和2GB DDR3显存(64位显存位宽,2000MHz有效频率)。 架构 相较于Kepler架构,Maxwell架构提供了一些细节优化改进,提供了更高的功效。一个更小的只使用了128个ALU算数逻辑单元(Kepler为192个)的流处理器(SMM)和一个可以提高着色器使用效率的优化了的调度器。Nvidia承诺了Maxwell的128算数逻辑单元流处理器可以提供Kepler的192算数逻辑单元SMX的90%性能。GM108核心提供了5个SMM,即384个着色器核心,24个TMU,和8个ROP(64位界面)。 另外一个优化是大大增加了的二级缓存容量(GM107有2MB)。更大的缓存容量可以提供对显存数据的更好管理,从而并不因相对较窄的显存带宽而性能明显降低。 和Fermi和Kepler相似,Maxwell的GM107核心支持DirectX 11.2的11.0功能级。 性能 根据我们的基准测试成绩,GeForce 840M性能超出上代的GT 740M约30%,仅略低于GeForce GT 750M(DDR3版本)。很多2013和2014年发布的游戏(如古墓丽影和生化奇兵无限)可以在WXGA分辨率(1366 x 768)和中高细节设定下流畅运行。不过一些非常大型的游戏如孤岛危机3或战地4需要使用更低分辨率和/或细节设定运行。 特性 GM108核心集成了第六代的PureVideo HD视频引擎(VP6),提供了对H.264和MPEG-2视频的更好解码性能。当然,VP6支持所有前代的功能(4K支持,PIP,VCENC API视频编码)。遗憾的是,仍未提供对HDMI 2.0的支持。 功耗 GeForce 840M的功耗通常是30W或更低。因此,这款显卡最适合于13到14寸或更大的笔记本电脑。800M系列同样支持Optimus技术,笔记本可以在CPU的集成显卡和Nvidia独立显卡间自动切换。
GeForce 800M Series
| ||||||||||||||||
| Codename | N15S-GT | |||||||||||||||
| Architecture | Maxwell | |||||||||||||||
| Pipelines | 384 - unified | |||||||||||||||
| Core Speed | 1029 MHz | |||||||||||||||
| Memory Speed | 2000 MHz | |||||||||||||||
| Memory Bus Width | 64 Bit | |||||||||||||||
| Memory Type | DDR3 | |||||||||||||||
| Max. Amount of Memory | 4 GB | |||||||||||||||
| Shared Memory | no | |||||||||||||||
| API | DirectX 12 (FL 11_0), Shader 5.0, OpenGL 4.5 | |||||||||||||||
| Man. Technology | 28 nm | |||||||||||||||
| Features | GPU Boost 2.0, Optimus, PhysX, CUDA, GeForce Experience, GameWorks | |||||||||||||||
| Notebook Size | medium sized | |||||||||||||||
| Date of Announcement | 12.03.2014 | |||||||||||||||
| Link to Manufacturer Page | www.nvidia.de | |||||||||||||||
The following benchmarks stem from our benchmarks of review laptops. The performance depends on the used graphics memory, clock rate, processor, system settings, drivers, and operating systems. So the results don't have to be representative for all laptops with this GPU. For detailed information on the benchmark results, click on the fps number.


For more games that might be playable and a list of all games and graphics cards visit our Gaming List
Asus Zenbook UX303LN-R4141H: Intel Core i7-4510U, 13.30", 1.4 kg
Review » 华硕 Zenbook UX303LN-R4141H 亚笔记本电脑简短评测
Asus Transformer Book Flip TP500LN: Intel Core i5-4210U, 15.60", 2.3 kg
Review » 华硕 Transformer Book Flip TP500LN 变形本简短评测
HP Pavilion 15-p008ng: Intel Core i5-4210U, 15.60", 2.4 kg
Review » 惠普 Pavilion 15-p008ng 笔记本电脑简短评测
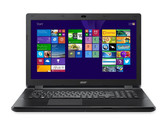
Acer Aspire E5-571G-536E: Intel Core i5-4210U, 15.60", 2.4 kg
Review » Acer Aspire E5-571G-536E 笔记本电脑简短评测
Lenovo IdeaPad Z50-70 (59427656): Intel Core i7-4510U, 15.60", 2.3 kg
Review » 联想 IdeaPad Z50-70 (59427656) 笔记本电脑简短评测
Lenovo Flex 2 14: Intel Core i3-4010U, 14.00", 1.9 kg
Review » 联想 IdeaPad Flex 2 14 笔记本电脑简短评测
Asus Pro B551LG-CN009G: Intel Core i7-4650U, 15.60", 2.5 kg
Review » 华硕 AsusPro B551LG-CN009G 笔记本电脑简短评测
MSI GP60-2PEi585: Intel Core i5-4200H, 15.60", 2.4 kg
Review » 微星 GP60-2PEi585 笔记本电脑简短评测
Asus UX32LN: Intel Core i5-4200U, 13.30", 1.4 kg
Review » 华硕 Zenbook UX32LN-R4053H 超级本简短评测
HP Pavilion 15-P265Ur : Intel Core i7-5500U, 15.60", 2.3 kg
External Review » HP Pavilion 15-P265Ur
Lenovo Z70-80-FG006JBM: Intel Core i7-5500U, 17.30", 3 kg
External Review » Lenovo Z70-80-FG006JBM
Lenovo ThinkPad Yoga 15-20DQ003RGE: Intel Core i5-5200U, 15.60", 2.3 kg
External Review » Lenovo ThinkPad Yoga 15-20DQ003RGE
Acer Aspire V3-572G-543S: Intel Core i5-5200U, 15.60", 2.5 kg
External Review » Acer Aspire V3-572G-543S
HP Pavilion 15-p159nr: Intel Core i5-4210U, 15.60", 2.3 kg
External Review » HP Pavilion 15-p159nr
Asus F555LN-XO010D: Intel Core i7-4510U, 15.60", 2.3 kg
External Review » Asus F555LN-XO010D
Asus X555LN-DM473H: Intel Core i7-5500U, 15.60", 2.3 kg
External Review » Asus X555LN-DM473H
Dell Inspiron 15 3543-8208: Intel Core i5-5200U, 15.60", 2.2 kg
External Review » Dell Inspiron 15 3543-8208
Asus K555LN-DM091D: Intel Core i7-4510U, 15.60", 2.3 kg
External Review » Asus K555LN-DM091D
Asus ZenBook UX303LN-R4359H: Intel Core i5-5200U, 13.30", 1.5 kg
External Review » Asus ZenBook UX303LN-R4359H
Lenovo Z70-80-FG008LGE: Intel Core i5-5200U, 17.30", 3 kg
External Review » Lenovo Z70-80-FG008LGE
Asus ET2323I: Intel Core i7-5500U, 23.00", 9 kg
External Review » Asus ET2323I
Lenovo Z50-70-59427408: Intel Core i5-4210U, 15.60", 2.5 kg
External Review » Lenovo Z50-70-59427408
Asus Zenbook UX303LN-R4290P: Intel Core i7-5500U, 13.30", 1.5 kg
External Review » Asus Zenbook UX303LN-R4290P
Lenovo Ideapad Flex 2 Pro 15-80FL0019GE: Intel Core i7-4510U, 15.60", 2.6 kg
External Review » Lenovo Ideapad Flex 2 Pro 15-80FL0019GE
Asus UX303LN-DQ148P: Intel Core i7-4510U, 13.30", 1.5 kg
External Review » Asus UX303LN-DQ148P
Dell Inspiron 17-5749: Intel Core i7-5500U, 17.30", 3 kg
External Review » Dell Inspiron 17-5749
Acer Aspire VN7-571G-33J0: Intel Core i3-4030U, 15.60", 2.4 kg
External Review » Acer Aspire VN7-571G-33J0
Asus Transformer Book Flip TP500LN-CJ035H: Intel Core i7-4510U, 15.60", 2.3 kg
External Review » Asus Transformer Book Flip TP500LN-CJ035H
Asus X555LN-XO022D: Intel Core i3-4030U, 15.60", 2.3 kg
External Review » Asus X555LN-XO022D
Acer Aspire V 15 Nitro VN7-571G-56NX: Intel Core i5-4210U, 15.60", 2.2 kg
External Review » Acer Aspire V 15 Nitro VN7-571G-56NX
Lenovo Flex 2 14: Intel Core i3-4010U, 14.00", 1.9 kg
External Review » Lenovo Flex 2 14
Asus Transformer Book Flip TP500LN-DN051H: Intel Core i5-4210U, 15.60", 2.2 kg
External Review » Asus Transformer Book Flip TP500LN-DN051H
Asus X550LN-XX030H: Intel Core i7-4510U, 15.60", 2.3 kg
External Review » Asus X550LN-XX030H
Asus UX32LN: Intel Core i5-4200U, 13.30", 1.4 kg
External Review » Asus UX32LN
Asus Transformer Book Flip TP500LN: Intel Core i5-4210U, 15.60", 2.3 kg
External Review » Asus Transformer Book Flip TP500LN
Asus X555LN-XO112H: Intel Core i5-4210U, 15.60", 2.3 kg
External Review » Asus X555LN-XO112H
Lenovo IdeaPad Flex 2 14-59427350: Intel Core i3-4030U, 14.00", 2 kg
External Review » Lenovo IdeaPad Flex 2 14-59427350
Acer Aspire E5-572G-50FB: Intel Core i5-4210M, 15.60", 2.4 kg
External Review » Acer Aspire E5-572G-50FB
Lenovo IdeaCentre Horizon 27, Haswell: Intel Core i5-3210M, 27.00", 8.3 kg
External Review » Lenovo IdeaCentre Horizon 27, Haswell
Acer Aspire VN7-571G-55ZA: Intel Core i5-4210U, 15.00", 2.4 kg
External Review » Acer Aspire VN7-571G-55ZA
Asus Transformer Book Flip TP500LN-DN075H: Intel Core i7-4510U, 15.60", 2.3 kg
External Review » Asus Transformer Book Flip TP500LN-DN075H
Asus ZenBook UX303LN-R4215H: Intel Core i5-4210U, 13.30", 1.5 kg
External Review » Asus ZenBook UX303LN-R4215H
Lenovo ThinkPad Yoga 14: Intel Core i5-4210U, 14.00", 1.9 kg
External Review » Lenovo ThinkPad Yoga 14
Asus VivoBook S451LN: Intel Core i5-4200U, 14.00", 2.2 kg
External Review » Asus VivoBook S451LN
HP Envy 15-k050sr: Intel Core i5-4210U, 15.60", 2.8 kg
External Review » HP Envy 15-k050sr
Acer Aspire E5-571PG-624L: Intel Core i5-4210U, 15.60", 2.6 kg
External Review » Acer Aspire E5-571PG-624L
Asus X550LN-XX031H: Intel Core i5-4200U, 15.60"
External Review » Asus X550LN-XX031H
Acer Aspire E5-571G-520X: Intel Core i5-5200U, 15.60", 2.5 kg
External Review » Acer Aspire E5-571G-611H
Asus X555LN-XO113H: Intel Core i7-4510U, 15.60", 2.3 kg
External Review » Asus X555LN-XO113H
HP Pavilion 15-p006tx: Intel Core i7-4510U, 15.60", 2.7 kg
External Review » HP Pavilion 15-p006tx
Asus K551LN: Intel Core i5-4200U, 15.60", 2.2 kg
External Review » Asus K551LN
Acer Aspire E5-571G-536E: Intel Core i5-4210U, 15.60", 2.4 kg
External Review » Acer Aspire E5-571G-536E
Lenovo IdeaPad Z50-70: Intel Core i5-4210U, 15.60", 2.5 kg
External Review » Lenovo IdeaPad Z50-70
Asus UX303LN-DB71T: Intel Core i7-4510U, 13.30", 1.5 kg
External Review » Asus UX303LN-DB71T
MSI GP60 2PE-222UK: Intel Core i7-4710HQ, 15.60", 2.4 kg
External Review » MSI GP60 2PE-222UK
Acer Aspire E5-771G-71PT: Intel Core i7-5500U, 17.30", 3 kg
External Review » Acer Aspire E5-771G-51T2
Asus R453LN-WX085: Intel Core i3-4010U, 14.00", 2 kg
External Review » Asus R453LN-WX085
Asus ASUSPRO ADVANCED B551LG: Intel Core i7-4650U, 15.60", 2.5 kg
External Review » Asus ASUSPRO ADVANCED B551LG
HP Pavilion 15-J6Z61EA: Intel Core i7-4510U, 15.60", 2.4 kg
External Review » HP Pavilion 15-J6Z61EA
MSI GP60 2PE-008RU: Intel Core i7-4700HQ, 15.60", 2.4 kg
External Review » MSI GP60 2PE-008RU
Asus R510LN: Intel Core i3-4010U, 15.60", 2.3 kg
External Review » Asus R510LN
MSI GP60-2PEi585: Intel Core i5-4200H, 15.60", 2.4 kg
External Review » MSI GP60-2PEi585
Asus Zenbook UX32LN-R4029H: Intel Core i7-4500U, 13.30", 1.4 kg
External Review » Asus Zenbook UX32LN-R4029H
» Comparison of GPUs
Detailed list of all laptop GPUs sorted by class and performance.
» Benchmark List
Sort and restrict laptop GPUs based on performance in synthetic benchmarks.
» Notebook Gaming List
Playable games for each graphics card and their average FPS results.
* Approximate position of the graphics adapter
» Notebookcheck多媒体笔记本电脑Top 10排名
» Notebookcheck游戏笔记本电脑Top 10排名
» Notebookcheck低价办公/商务笔记本电脑Top 10排名
» Notebookcheck高端办公/商务笔记本电脑Top 10排名
» Notebookcheck工作站笔记本电脑Top 10排名
» Notebookcheck亚笔记本电脑Top 10排名
» Notebookcheck超级本产品Top 10排名
» Notebookcheck变形本产品Top 10排名
» Notebookcheck平板电脑Top 10排名
» Notebookcheck智能手机Top 10排名
» Notebookcheck评测过最出色的笔记本电脑屏幕
» Notebookcheck售价500欧元以下笔记本电脑Top 10排名
» Notebookcheck售价300欧元以下笔记本电脑Top 10排名