


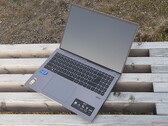
Acer Swift X 16 (2022)回顾。具有强大更新的16英寸笔记本电脑
宏碁Swift X 16 (2022)是一款轻型16英寸笔记本电脑,具有额外的图形性能。明亮的显示屏最终以16:10的格式出现,并提供高分辨率。英特尔的Alder Lake P-Core i7 CPU帮助这款多媒体笔记本电脑形成了强大的性能。但是,英特尔的A370M表现如何?
Intel Core i7-1260P, A370M, 16", 1.8 kg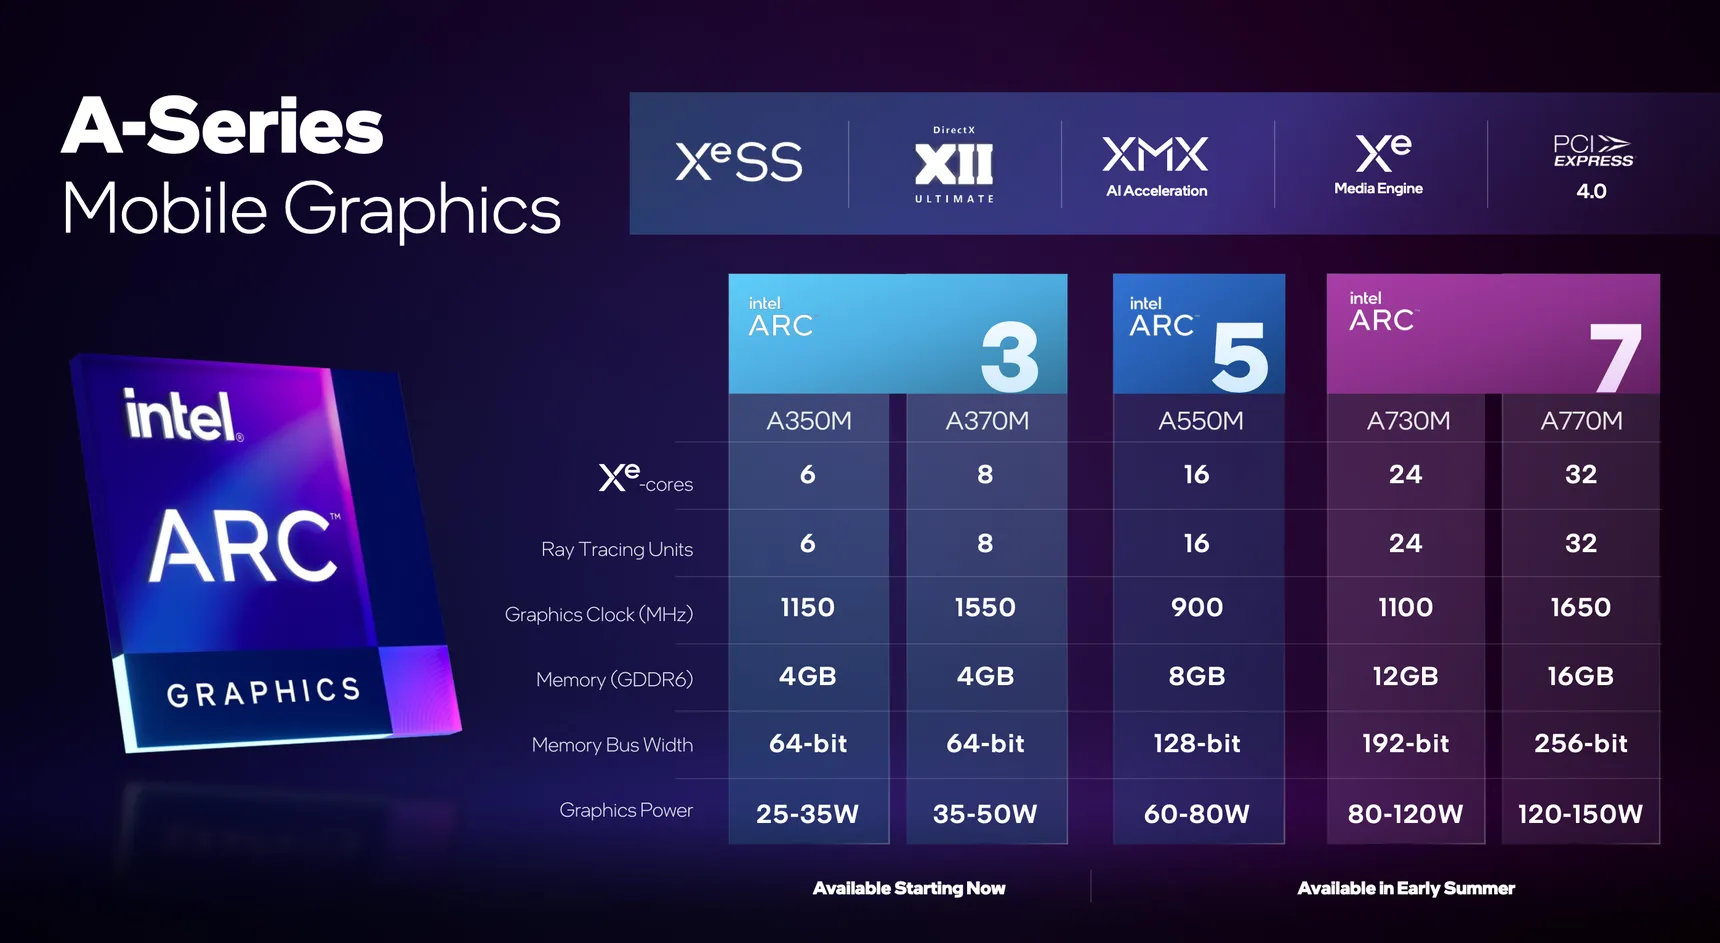
Intel Arc A370M 是基于 Xe HPG 微架构的笔记本电脑专用移动入门级显卡。它采用 ACM-G11 芯片,提供全部 8 个 Xe 核心(128 个 ALU)、8 个光线追踪单元和一条 64 位显存总线,可支持 4GB GDDR6 显存。该芯片集成了 72 亿个晶体管,芯片尺寸为 157 平方毫米。
其性能处于 2022 年笔记本电脑专用显卡的入门级水平。AMD 曾发布过一些游戏基准测试,在 5 款游戏的中等设置下显示 Radeon RX 6500M明显更快。英特尔只将 A370M(CPU 速度更快)与速度较慢的 i7-1280P 的 Iris iGPU 进行了比较(见下文)。(由于多了 2 个内核和更高的时钟频率,入门级 Arc A350M明显落后。
该芯片还集成了两个媒体引擎,用于 VP9、AVC、HEVC 和 AV1 8k en- 解码。4 个显示管道通过 DMI 2.0B 或 DisplayPort 2.0 10G 支持多达 4x 4k120 HDR。
A370M 采用台积电 6 纳米(N6 工艺)制造,支持与第 12 代英特尔 CPU(Alder Lake)动态功耗共享(使用 Deep Link)。
Arc Xe-HPG Series
| |||||||||||||||||||||||||||||||||||||||||||
| Codename | Alchemist | ||||||||||||||||||||||||||||||||||||||||||
| Architecture | Xe HPG | ||||||||||||||||||||||||||||||||||||||||||
| Pipelines | 8 - unified | ||||||||||||||||||||||||||||||||||||||||||
| Raytracing Cores | 8 | ||||||||||||||||||||||||||||||||||||||||||
| Core Speed | 1550 MHz | ||||||||||||||||||||||||||||||||||||||||||
| Cache | L1: 1.5 MB, L2: 4 MB | ||||||||||||||||||||||||||||||||||||||||||
| Memory Speed | 14000 MHz | ||||||||||||||||||||||||||||||||||||||||||
| Memory Bus Width | 64 Bit | ||||||||||||||||||||||||||||||||||||||||||
| Memory Type | GDDR6 | ||||||||||||||||||||||||||||||||||||||||||
| Max. Amount of Memory | 4 GB | ||||||||||||||||||||||||||||||||||||||||||
| Shared Memory | no | ||||||||||||||||||||||||||||||||||||||||||
| Memory Bandwidth | 112 GB/s | ||||||||||||||||||||||||||||||||||||||||||
| API | DirectX 12_2, OpenGL 4.6, Vulkan 1.3 | ||||||||||||||||||||||||||||||||||||||||||
| Power Consumption | 50 Watt (35 - 50 Watt TGP) | ||||||||||||||||||||||||||||||||||||||||||
| Transistor Count | 7.2 Billion | ||||||||||||||||||||||||||||||||||||||||||
| Die Size | 157 mm² | ||||||||||||||||||||||||||||||||||||||||||
| Man. Technology | 6 nm | ||||||||||||||||||||||||||||||||||||||||||
| PCIe | 4 8x | ||||||||||||||||||||||||||||||||||||||||||
| Displays | 4 Displays (max.), HDMI 2.0b, DisplayPort 2.0 10G Ready | ||||||||||||||||||||||||||||||||||||||||||
| Date of Announcement | 30.03.2022 | ||||||||||||||||||||||||||||||||||||||||||
| Link to Manufacturer Page | www.intel.com | ||||||||||||||||||||||||||||||||||||||||||
The following benchmarks stem from our benchmarks of review laptops. The performance depends on the used graphics memory, clock rate, processor, system settings, drivers, and operating systems. So the results don't have to be representative for all laptops with this GPU. For detailed information on the benchmark results, click on the fps number.


| low | med. | high | ultra | QHD | 4K | |
|---|---|---|---|---|---|---|
| Diablo 4 | 67.1 | 60.9 | 39.2 | |||
| Star Wars Jedi Survivor | 23 | 19.7 | 19.2 | 17.7 | ||
| Resident Evil 4 Remake | 45.7 | 26.3 | 11.6 | 3.52 | ||
| Company of Heroes 3 | 55.7 | 47.8 | 37.2 | 37.1 | ||
| Sons of the Forest | 27.6 | 17.4 | 11.5 | 11.4 | ||
| Atomic Heart | 55.5 | 42.4 | 24 | 20.2 | ||
| Returnal | 27 | 26 | 22 | 10 | ||
| Hogwarts Legacy | 43.2 | 30.3 | 19.6 | 12.7 | ||
| Dead Space Remake | 22.6 | 17.8 | 12.1 | 8.86 | ||
| High On Life | 73.4 | 44.6 | 40.8 | 32.6 | ||
| A Plague Tale Requiem | 22.9 | 19.5 | 16.6 | 14.3 | ||
| FIFA 23 | 70 | 62 | 40 | 41 | 30 | |
| F1 22 | 127.2 | 49.5 | 46.3 | 33 | 2.85 | |
| Vampire Bloodhunt | 127 | 87 | 62 | 55 | 34 | |
| Cyberpunk 2077 1.6 | 46.1 | 37.1 | 25.4 | 21 | ||
| GRID Legends | 97 | 69 | 56 | 42 | 33 | |
| God of War | 35 | 31 | 25 | 19 | 12 | |
| Guardians of the Galaxy | 23 | 14 | 12 | |||
| Far Cry 6 | 86 | 44 | 36 | 24 | ||
| F1 2021 | 192 | 89 | 62 | 25 | ||
| Hitman 3 | 85.7 | 54.9 | 50 | 46.2 | 23.4 | |
| Assassin´s Creed Valhalla | 62 | 33 | 20 | 18 | 13 | |
| Dirt 5 | 80.4 | 40.7 | 32 | 23.1 | 15.2 | |
| Watch Dogs Legion | 77 | 45 | 34 | 15 | 11 | |
| Horizon Zero Dawn | 57 | 40 | 35 | 31 | 23 | |
| Gears Tactics | 189 | 76.8 | 48.8 | 38.4 | 27.7 | |
| Borderlands 3 | 76.4 | 47.5 | 29.5 | 22 | 14.5 | |
| Metro Exodus | 92.1 | 44.1 | 31.3 | 25.5 | 19.8 | |
| Shadow of the Tomb Raider | 67 | 49 | 41 | 32 | 20 | |
| Strange Brigade | 179 | 75 | 63 | 53 | 37.2 | |
| Far Cry 5 | 89 | 49 | 46 | 43 | 29 | |
| X-Plane 11.11 | 38 | 30 | 26 | 22.2 | ||
| Final Fantasy XV Benchmark | 69 | 37 | 24 | 23 | ||
| Middle-earth: Shadow of War | 44 | |||||
| Dota 2 Reborn | 95 | 82 | 68 | 64 | 39.5 | |
| The Witcher 3 | 152 | 95 | 51 | 26 | ||
| GTA V | 150 | 140 | 41 | 11 | 10 | |
| low | med. | high | ultra | QHD | 4K | < 30 fps < 60 fps < 120 fps ≥ 120 fps | 6 8 15 7 | 7 19 9 1 | 15 18 4 | 19 12 1 | 14 4 | 1 1 |
For more games that might be playable and a list of all games and graphics cards visit our Gaming List
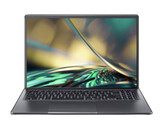
Dell XPS 15 9530, Intel Arc A370M: Intel Core i7-13700H, 15.60", 1.9 kg
External Review » Dell XPS 15 9530, Intel Arc A370M
Lenovo Yoga 7 16IAH7, i5-12500H: Intel Core i5-12500H, 16.00", 2.2 kg
External Review » Lenovo Yoga 7 16IAH7, i5-12500H
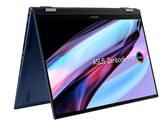
Asus ZenBook Pro 15 Flip UP6502ZD, i7-12700H: Intel Core i7-12700H, 15.60", 1.8 kg
External Review » Asus ZenBook Pro 15 Flip UP6502ZD, i7-12700H
HP Spectre x360 16-f1180ng: Intel Core i7-1260P, 16.00", 2 kg
External Review » HP Spectre x360 16-f1180ng
Acer Swift X SFX16-52G-77RX: Intel Core i7-1260P, 16.00", 1.8 kg
External Review » Acer Swift X SFX16-52G-77RX
» Comparison of GPUs
Detailed list of all laptop GPUs sorted by class and performance.
» Benchmark List
Sort and restrict laptop GPUs based on performance in synthetic benchmarks.
» Notebook Gaming List
Playable games for each graphics card and their average FPS results.
* Approximate position of the graphics adapter
» Notebookcheck多媒体笔记本电脑Top 10排名
» Notebookcheck游戏笔记本电脑Top 10排名
» Notebookcheck低价办公/商务笔记本电脑Top 10排名
» Notebookcheck高端办公/商务笔记本电脑Top 10排名
» Notebookcheck工作站笔记本电脑Top 10排名
» Notebookcheck亚笔记本电脑Top 10排名
» Notebookcheck超级本产品Top 10排名
» Notebookcheck变形本产品Top 10排名
» Notebookcheck平板电脑Top 10排名
» Notebookcheck智能手机Top 10排名
» Notebookcheck评测过最出色的笔记本电脑屏幕
» Notebookcheck售价500欧元以下笔记本电脑Top 10排名
» Notebookcheck售价300欧元以下笔记本电脑Top 10排名