Notebookcheck Logo

NVIDIA GeForce GTX 1660 Ti Mobile

NVIDIA GeForce GTX 1660 Ti Mobile

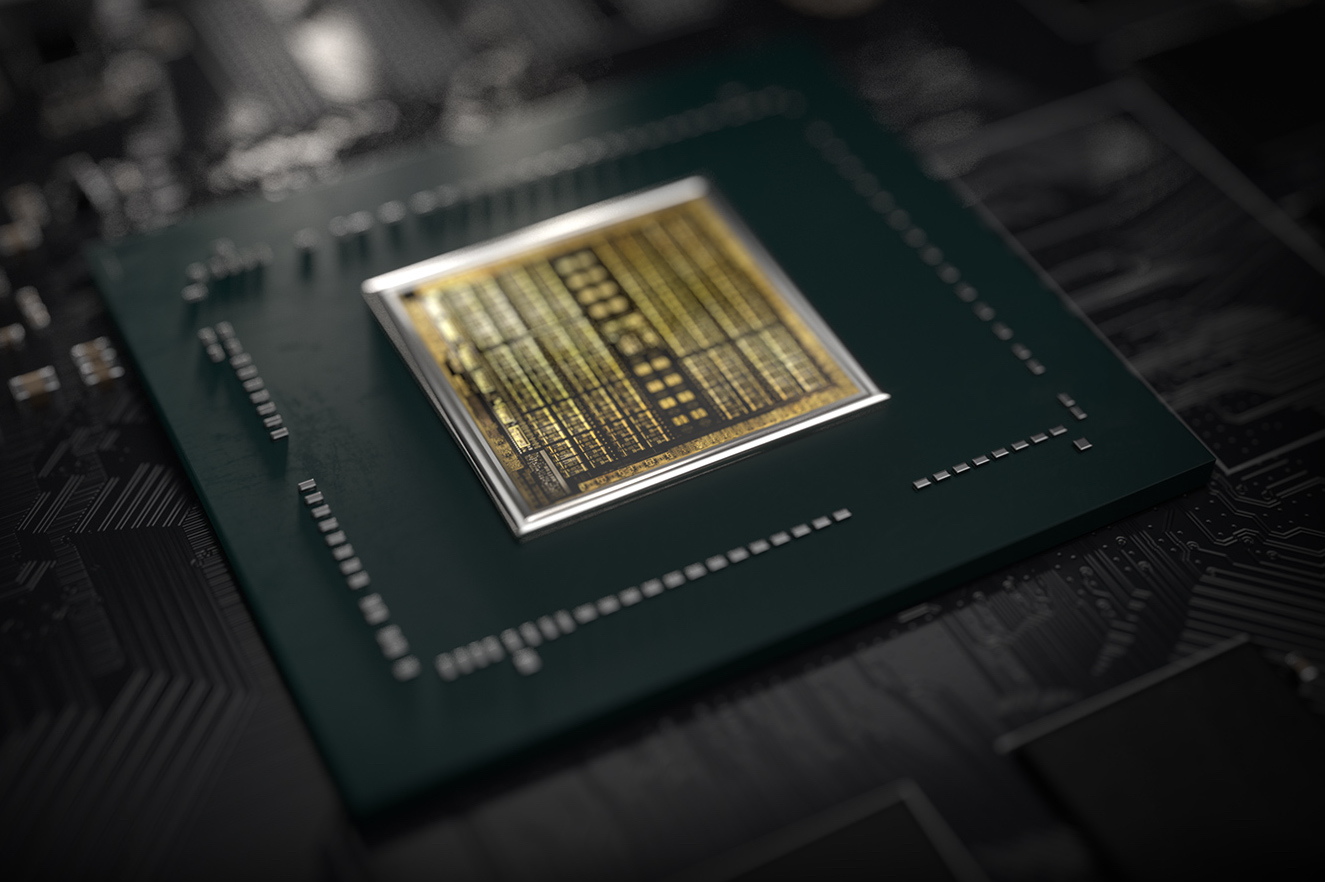
用于笔记本电脑的Nvidia GeForce GTX 1660 Ti是基于Turing架构(TU116芯片)的移动图形卡。与更快的RTX 2000 GPU(例如RTX 2060)相比,1660Ti没有集成光线追踪或Tensor内核。性能类似于旧的GTX 1070(笔记本电脑),但TGP仅为80瓦(相比GTX1070的115瓦)。与台式机GTX 1660 Ti相比,频率降低了(基准频率降低3%,睿频降低10%)。

Turing一代不仅为RTX卡引入了光追,而且还优化了内核和缓存的体系结构。根据Nvidia的说法,CUDA内核现在可以同时执行浮点和整数运算,以提高现代游戏中计算繁重的工作负载的性能。此外,也对缓存进行了重新设计(新的统一内存体系结构的缓存是Pascal的两倍)。与Pascal相比,这使得每个时钟指令最多增加50%,能耗提高40%。

Nvidia指定用于笔记本电脑的1660Ti的功耗为8​​0瓦TGP(总图形功率),比1660 Ti的Max-Q型号高20瓦。 TU116芯片采用12nm FFN台积电工艺。

GeForce GTX 1600 Series

GeForce GTX 1660 Ti (Desktop) 1536 @ 1.5 - 1.77 GHz192 Bit @ 12000 MHz
GeForce GTX 1660 Super (Desktop) 1408 @ 1.53 - 1.79 GHz192 Bit @ 14000 MHz
GeForce GTX 1660 Ti Mobile 1536 @ 1.46 - 1.59 GHz192 Bit @ 12000 MHz
GeForce GTX 1660 (Desktop) 1408 @ 1.53 - 1.79 GHz192 Bit @ 8000 MHz
GeForce GTX 1650 Super (Desktop) 1280 @ 1.53 GHz192 Bit @ 14000 MHz
GeForce GTX 1660 Ti Max-Q 1536 @ 1.14 - 1.34 GHz192 Bit @ 12000 MHz
GeForce GTX 1650 Ti Mobile 1024 @ 1.35 - 1.49 GHz128 Bit @ 12000 MHz
GeForce GTX 1650 (Desktop) 896 @ 1.49 - 1.67 GHz128 Bit @ 8000 MHz
GeForce GTX 1650 Mobile 1024 @ 1.38 - 1.56 GHz128 Bit @ 12000 MHz
GeForce GTX 1650 Ti Max-Q 1024 @ 1.04 - 1.2 GHz128 Bit @ 10000 MHz
GeForce GTX 1650 Max-Q 1024 @ 1.02 - 1.25 GHz128 Bit @ 8000 MHz
CodenameN18E-G0
ArchitectureTuring
Pipelines1536 - unified
Core Speed1455 - 1590 (Boost) MHz
Memory Speed12000 MHz
Memory Bus Width192 Bit
Memory TypeGDDR6
Max. Amount of Memory6 GB
Shared Memoryno
APIDirectX 12_1, OpenGL 4.6
Power Consumption80 Watt
Transistor Count6.6 Billion
technology12 nm
Notebook Sizemedium sized
Date of Announcement23.04.2019
Link to Manufacturer Pagewww.nvidia.com

Benchmarks

Performance Rating - 3DMark 11 + Fire Strike + Time Spy
6.8 pt (20%)
AMD Radeon HD 8180
0.06605 -99%
...
NVIDIA Quadro P3200
5.72 -15%
NVIDIA GeForce GTX 980 (Laptop)
5.94 -12%
5.99 -11%
6.08 -10%
6.09 -10%
NVIDIA Quadro RTX 3000 Max-Q
6.2 -8%
6.68 -1%
6.69 -1%
6.72 0%
NVIDIA GeForce GTX 1660 Ti Mobile
6.75
6.76 0%
6.79 1%
7.44 10%
NVIDIA Quadro RTX 4000 Max-Q
7.77 15%
7.85 16%
7.9 17%
8.04 19%
8.29 23%
NVIDIA Quadro P5200
8.41 25%
...
21.1 213%
max:
33.3 393%
0%
100%
3DMark - 3DMark Time Spy Score
min: 4946     avg: 5717     median: 5697 (16%)     max: 6261 Points
3DMark - 3DMark Time Spy Graphics
min: 5335     avg: 5653     median: 5659 (15%)     max: 6123 Points
Intel UHD Graphics 605
113 -98%
...
4546 -20%
4661 -18%
4687 -17%
5089 -10%
NVIDIA Quadro RTX 3000 Max-Q
5132 -9%
5151 -9%
5177 -8%
5464 -3%
5637 0%
NVIDIA GeForce GTX 1660 Ti Mobile
5653
5702 1%
5830 3%
5869 4%
5934 5%
6206 10%
NVIDIA Quadro P5200
6422 14%
6745 19%
NVIDIA Quadro RTX 4000 Max-Q
6764 20%
NVIDIA GeForce GTX 1080 Mobile
6867 21%
...
19434 244%
max:
36485 545%
0%
100%
3DMark - 3DMark Ice Storm Unlimited Graphics
min: 412820     avg: 418846     median: 419800 (48%)     max: 424615 Points
3DMark - 3DMark Ice Storm Extreme Graphics
min: 129343     avg: 199337     median: 162584 (21%)     max: 316086 Points
3DMark - 3DMark Cloud Gate Score
min: 29390     avg: 34346     median: 35118.5 (38%)     max: 38136 Points
3DMark - 3DMark Cloud Gate Graphics
min: 59839     avg: 94171     median: 97517 (26%)     max: 104780 Points
3DMark - 3DMark Fire Strike Standard Score
min: 12263     avg: 13237     median: 13140 (23%)     max: 14649 Points
3DMark - 3DMark Fire Strike Standard Graphics
min: 14186     avg: 14867     median: 14818 (17%)     max: 16488 Points
3DMark - 3DMark Ice Storm Graphics
min: 129020     avg: 194329     median: 163522 (20%)     max: 359516 Points
3DMark - 3DMark Night Raid
min: 32203     avg: 33044     median: 33043.5 (31%)     max: 33884 Points
3DMark - 3DMark Night Raid Graphics Score
min: 63349     avg: 66325     median: 66325 (26%)     max: 69301 Points
3DMark 11 - 3DM11 Performance Score
min: 15912     avg: 17361     median: 17351 (24%)     max: 19342 Points
3DMark 11 - 3DM11 Performance GPU
min: 18610     avg: 20096     median: 20118.5 (17%)     max: 22670 Points
171.8 -99%
...
17562 -13%
17690 -12%
17711 -12%
17889 -11%
NVIDIA Quadro RTX 3000 Max-Q
18037 -10%
19016 -5%
19109 -5%
19467 -3%
19881 -1%
NVIDIA GeForce GTX 1660 Ti Mobile
20096
20506 2%
21459 7%
22133 10%
22405 11%
22548 12%
23358 16%
NVIDIA Quadro RTX 4000 Max-Q
23574 17%
24213 20%
NVIDIA Quadro P5200
25100 25%
...
59943 198%
max:
106023 428%
0%
100%
3DMark Vantage
3DM Vant. Perf. total +
3DMark Vantage - 3DM Vant. Perf. total
49309 Points (14%)
3DM Vant. Perf. GPU no PhysX +
3DMark Vantage - 3DM Vant. Perf. GPU no PhysX
52230 Points (30%)
ATI Radeon HD 3200
62 -100%
...
NVIDIA GeForce GTX 980 (Laptop)
45346 -13%
45988 -12%
NVIDIA Quadro P3200
46624 -11%
46945 -10%
47209 -10%
47227 -10%
49207 -6%
51344 -2%
51396 -2%
NVIDIA GeForce GTX 1660 Ti Mobile
52230
52733 1%
52917 1%
53510 2%
54830 5%
58792 13%
60089 15%
60439 16%
NVIDIA Quadro RTX 4000 (Laptop)
62557 20%
NVIDIA Quadro RTX 5000 Max-Q
62862 20%
...
132443 154%
max:
170928 227%
0%
100%
3DMark 06 3DMark 06 - Standard 1280x1024 +
3DMark 06
min: 36563     avg: 37825     median: 38153.5 (50%)     max: 38429 Points
SPECviewperf 12
specvp12 sw-03 +
SPECviewperf 12 - specvp12 sw-03
44.7 fps (11%)
specvp12 snx-02 +
SPECviewperf 12 - specvp12 snx-02
8.2 fps (1%)
specvp12 showcase-01 +
SPECviewperf 12 - specvp12 showcase-01
74.4 fps (16%)
specvp12 mediacal-01 +
SPECviewperf 12 - specvp12 mediacal-01
34.5 fps (9%)
specvp12 maya-04 +
SPECviewperf 12 - specvp12 maya-04
71.5 fps (19%)
specvp12 energy-01 +
SPECviewperf 12 - specvp12 energy-01
7.7 fps (7%)
specvp12 creo-01 +
SPECviewperf 12 - specvp12 creo-01
38.4 fps (15%)
specvp12 catia-04 +
SPECviewperf 12 - specvp12 catia-04
61.5 fps (10%)
specvp12 3dsmax-05 +
SPECviewperf 12 - specvp12 3dsmax-05
146.5 fps (26%)
SPECviewperf 13 specvp13 sw-04 +
SPECviewperf 13 - specvp13 sw-04
min: 64.8     avg: 65     median: 65 (17%)     max: 65.1 fps
specvp13 snx-03 +
SPECviewperf 13 - specvp13 snx-03
min: 14.49     avg: 14.7     median: 14.7 (2%)     max: 14.81 fps
specvp13 showcase-02 +
SPECviewperf 13 - specvp13 showcase-02
min: 73.8     avg: 74.2     median: 74.2 (16%)     max: 74.6 fps
specvp13 medical-02 +
SPECviewperf 13 - specvp13 medical-02
min: 38.27     avg: 38.6     median: 38.6 (8%)     max: 38.99 fps
specvp13 maya-05 +
SPECviewperf 13 - specvp13 maya-05
min: 165.2     avg: 166.2     median: 166.2 (19%)     max: 167.1 fps
specvp13 energy-02 +
SPECviewperf 13 - specvp13 energy-02
min: 10.18     avg: 10.5     median: 10.5 (3%)     max: 10.81 fps
specvp13 creo-02 +
SPECviewperf 13 - specvp13 creo-02
min: 117.1     avg: 118.9     median: 118.9 (17%)     max: 120.7 fps
specvp13 catia-05 +
SPECviewperf 13 - specvp13 catia-05
min: 85.4     avg: 86.4     median: 86.4 (10%)     max: 87.4 fps
specvp13 3dsmax-06 +
SPECviewperf 13 - specvp13 3dsmax-06
min: 138.8     avg: 140.7     median: 140.7 (24%)     max: 142.5 fps
Cinebench R10 Cinebench R10 Shading (32bit) +
Cinebench R10 - Cinebench R10 Shading (32bit)
min: 4020     avg: 8599     median: 8212 (6%)     max: 12878 points
Cinebench R11.5 Cinebench R11.5 OpenGL 64 Bit +
Cinebench R11.5 - Cinebench R11.5 OpenGL 64 Bit
min: 73.8     avg: 76.5     median: 76.9 (27%)     max: 78.3 fps
Cinebench R15
Cinebench R15 OpenGL 64 Bit +
Cinebench R15 - Cinebench R15 OpenGL 64 Bit
min: 95.5     avg: 122.8     median: 120.6 (7%)     max: 148.2 fps
Cinebench R15 OpenGL Ref. Match 64 Bit +
Cinebench R15 - Cinebench R15 OpenGL Ref. Match 64 Bit
min: 99.6     avg: 99.6     median: 99.6 (100%)     max: 100 %
GFXBench - GFXBench Car Chase Offscreen
250.7 fps (28%)
LuxMark v2.0 64Bit - LuxMark v2.0 Room GPU
2416 Samples/s (11%)
LuxMark v2.0 64Bit - LuxMark v2.0 Sala GPU
4827 Samples/s (8%)
ComputeMark v2.1 - ComputeMark v2.1 Result
10148 points (11%)
Power Consumption - Furmark Stress Test Power Consumption - external Monitor *
139 Watt (20%)
Power Consumption - The Witcher 3 Power Consumption - external Monitor *
min: 139     avg: 146.5     median: 146.5 (20%)     max: 154 Watt
Power Consumption - Witcher 3 Power Consumption *
min: 126     avg: 138.5     median: 134.1 (29%)     max: 158.9 Watt
Power Consumption - Witcher 3 ultra Power Efficiency
min: 0.3247     avg: 0.4     median: 0.4 (41%)     max: 0.4546 fps per Watt
Power Consumption - Witcher 3 ultra Power Efficiency - external Monitor
min: 0.3591     avg: 0.4     median: 0.4 (31%)     max: 0.3899 fps per Watt
Emissions Witcher 3 Fan Noise +
Emissions - Witcher 3 Fan Noise
min: 44     avg: 50.7     median: 50.1 (80%)     max: 60.8 dB(A)
Clock Speed - GPU Clock Witcher 3 ultra
min: 1545     avg: 1661     median: 1650 (65%)     max: 1815 MHz
Clock Speed - GPU Clock Speed Furmark
855 MHz (34%)
- Range of benchmark values for this graphics card
- Average benchmark values for this graphics card
* Smaller numbers mean a higher performance

Game Benchmarks

The following benchmarks stem from our benchmarks of review laptops. The performance depends on the used graphics memory, clock rate, processor, system settings, drivers, and operating systems. So the results don't have to be representative for all laptops with this GPU. For detailed information on the benchmark results, click on the fps number.

Skull & Bones

Skull & Bones

2024
low 1920x1080
79  fps    + Compare
med. 1920x1080
71  fps    + Compare
high 1920x1080
55  fps    + Compare
ultra 1920x1080
48  fps    + Compare
» With all tested laptops playable in detail settings ultra.
Enshrouded

Enshrouded

2024
low 1920x1080
49.5  fps    + Compare + 📈 Graph
med. 1920x1080
41.2  fps    + Compare + 📈 Graph
high 1920x1080
34.2  fps    + Compare + 📈 Graph
ultra 1920x1080
26.9  fps    + Compare + 📈 Graph
» With all tested laptops playable in detail settings med..
Palworld

Palworld

2024
low 1920x1080
80.5  fps    + Compare + 📈 Graph
med. 1920x1080
69.9  fps    + Compare + 📈 Graph
high 1920x1080
55.3  fps    + Compare + 📈 Graph
ultra 1920x1080
50.7  fps    + Compare + 📈 Graph
» With all tested laptops playable in detail settings ultra.
Prince of Persia The Lost Crown

Prince of Persia The Lost Crown

2024
med. 1920x1080
302  fps    + Compare + 📈 Graph
high 1920x1080
291  fps    + Compare + 📈 Graph
ultra 1920x1080
283  fps    + Compare + 📈 Graph
» With all tested laptops playable in detail settings ultra.
Ready or Not

Ready or Not

2023
low 1920x1080
143  fps    + Compare + 📈 Graph
med. 1920x1080
105.6  fps    + Compare + 📈 Graph
high 1920x1080
101.4  fps    + Compare + 📈 Graph
ultra 1920x1080
74.4  fps    + Compare + 📈 Graph
» With all tested laptops playable in detail settings ultra.
The Finals

The Finals

2023
low 1920x1080
136.3  fps    + Compare + 📈 Graph
med. 1920x1080
112.2  fps    + Compare + 📈 Graph
high 1920x1080
98.6  fps    + Compare + 📈 Graph
ultra 1920x1080
72.3  fps    + Compare + 📈 Graph
» With all tested laptops playable in detail settings ultra.
Additional Benchmarks
Low Preset 1280x720
154
Epic Preset + Epic RTX Global Illumination 1920x1080
63.6
Avatar Frontiers of Pandora

Avatar Frontiers of Pandora

2023
low 1920x1080
40  fps    + Compare
med. 1920x1080
36  fps    + Compare
high 1920x1080
28  fps    + Compare
ultra 1920x1080
20  fps    + Compare
» With all tested laptops playable in detail settings med..
Additional Benchmarks
Low Preset TAA 1280x720
61
Call of Duty Modern Warfare 3 2023

Call of Duty Modern Warfare 3 2023

2023
low 1920x1080
84  fps    + Compare
med. 1920x1080
75  fps    + Compare
high 1920x1080
57  fps    + Compare
ultra 1920x1080
53  fps    + Compare
» With all tested laptops playable in detail settings ultra.
Additional Benchmarks
Minimum Preset 1280x720
131
EA Sports WRC

EA Sports WRC

2023
low 1920x1080
77.9  fps    + Compare + 📈 Graph
med. 1920x1080
56.8  fps    + Compare + 📈 Graph
high 1920x1080
51.8  fps    + Compare + 📈 Graph
ultra 1920x1080
46.9  fps    + Compare + 📈 Graph
» With all tested laptops playable in detail settings ultra.
Alan Wake 2

Alan Wake 2

2023
low 1920x1080
38.3  fps    + Compare + 📈 Graph
med. 1920x1080
31.2  fps    + Compare + 📈 Graph
high 1920x1080
29.5  fps    + Compare + 📈 Graph
» With all tested laptops playable in detail settings low.
Additional Benchmarks
Low Preset 1280x720
62.2
Lords of the Fallen

Lords of the Fallen

2023
low 1920x1080
51  fps    + Compare + 📈 Graph
med. 1920x1080
41.3  fps    + Compare + 📈 Graph
high 1920x1080
30.3  fps    + Compare + 📈 Graph
ultra 1920x1080
20.2  fps    + Compare + 📈 Graph
» With all tested laptops playable in detail settings med..
Additional Benchmarks
Low Preset 1280x720
83
Total War Pharaoh

Total War Pharaoh

2023
low 1920x1080
183.5  fps    + Compare
med. 1920x1080
127.2  fps    + Compare
high 1920x1080
82.4  fps    + Compare
ultra 1920x1080
66.3  fps    + Compare
» With all tested laptops playable in detail settings ultra.
Assassin's Creed Mirage

Assassin's Creed Mirage

2023
low 1920x1080
76  fps    + Compare
med. 1920x1080
70  fps    + Compare
high 1920x1080
66  fps    + Compare
ultra 1920x1080
50  fps    + Compare
» With all tested laptops playable in detail settings ultra.
EA Sports FC 24

EA Sports FC 24

2023
ultra 1920x1080
93.9  fps    + Compare + 📈 Graph
» With all tested laptops playable in detail settings ultra.
Counter-Strike 2

Counter-Strike 2

2023
low 1920x1080
146.7  fps    + Compare + 📈 Graph
med. 1920x1080
132.6  fps    + Compare + 📈 Graph
high 1920x1080
104.4  fps    + Compare + 📈 Graph
ultra 1920x1080
98.2  fps    + Compare + 📈 Graph
» With all tested laptops playable in detail settings ultra.
Cyberpunk 2077 2.0 Phantom Liberty

Cyberpunk 2077 2.0 Phantom Liberty

2023
low 1920x1080
73.3  fps    + Compare
med. 1920x1080
57.4  fps    + Compare
high 1920x1080
49.1  fps    + Compare
ultra 1920x1080
41.7  fps    + Compare
» With all tested laptops playable in detail settings ultra.
Additional Benchmarks
Low Preset (FSR off) 1280x720
98.4
Steam Deck 1280x720
103.6
Ultra Preset (FSR on) 1920x1080
51.6
Lies of P

Lies of P

2023
low 1920x1080
103.3  fps    + Compare + 📈 Graph
med. 1920x1080
89.5  fps    + Compare + 📈 Graph
high 1920x1080
76.8  fps    + Compare + 📈 Graph
ultra 1920x1080
68.2  fps    + Compare + 📈 Graph
» With all tested laptops playable in detail settings ultra.
The Crew Motorfest

The Crew Motorfest

2023
low 1920x1080
59  fps    + Compare
med. 1920x1080
59  fps    + Compare
high 1920x1080
52  fps    + Compare
ultra 1920x1080
46  fps    + Compare
» With all tested laptops playable in detail settings ultra.
Starfield

Starfield

2023
low 1920x1080
44.7  fps    + Compare + 📈 Graph
med. 1920x1080
37.5  fps    + Compare + 📈 Graph
high 1920x1080
29.6  fps    + Compare + 📈 Graph
ultra 1920x1080
26.3  fps    + Compare + 📈 Graph
» With all tested laptops playable in detail settings med..
Additional Benchmarks
Low Preset 1280x720
61.7
low 1920x1080
69.3  fps    + Compare + 📈 Graph
med. 1920x1080
67.5  fps    + Compare + 📈 Graph
high 1920x1080
64.2  fps    + Compare + 📈 Graph
ultra 1920x1080
60.4  fps    + Compare + 📈 Graph
» With all tested laptops playable in detail settings ultra.
Additional Benchmarks
Low Preset 1280x720
69.5
low 1920x1080
51.6  fps    + Compare + 📈 Graph
high 1920x1080
44.4  fps    + Compare + 📈 Graph
ultra 1920x1080
37.8  fps    + Compare + 📈 Graph
» With all tested laptops playable in detail settings ultra.
Additional Benchmarks
Low 1280x720
73.5
low 1920x1080
85.2  fps    + Compare + 📈 Graph
med. 1920x1080
80.5  fps    + Compare + 📈 Graph
high 1920x1080
73.9  fps    + Compare + 📈 Graph
ultra 1920x1080
62.3  fps    + Compare + 📈 Graph
» With all tested laptops playable in detail settings ultra.
Additional Benchmarks
Low Preset 1280x720
138.3
low 1920x1080
81.6  fps    + Compare + 📈 Graph
med. 1920x1080
63.2  fps    + Compare + 📈 Graph
high 1920x1080
54.1  fps    + Compare + 📈 Graph
ultra 1920x1080
53.6  fps    + Compare + 📈 Graph
» With all tested laptops playable in detail settings ultra.
low 1920x1080
58  fps    + Compare + 📈 Graph
med. 1920x1080
49.6  fps    + Compare + 📈 Graph
high 1920x1080
40.3  fps    + Compare + 📈 Graph
ultra 1920x1080
36.3  fps    + Compare + 📈 Graph
» With all tested laptops playable in detail settings ultra.
Additional Benchmarks
Very Low Preset 1280x720
58.7
F1 23

F1 23

2023
low 1920x1080
158.4  fps    + Compare
med. 1920x1080
149.4  fps    + Compare
high 1920x1080
108.5  fps    + Compare
ultra 1920x1080
80.1  fps    + Compare
» With all tested laptops playable in detail settings ultra.
Additional Benchmarks
Ultra Low Preset TAA 1280x720
196.2
Diablo 4

Diablo 4

2023
low 1920x1080
148.4  fps    + Compare + 📈 Graph
med. 1920x1080
129.4  fps    + Compare + 📈 Graph
high 1920x1080
112.8  fps    + Compare + 📈 Graph
ultra 1920x1080
94.3  fps    + Compare + 📈 Graph
» With all tested laptops playable in detail settings ultra.
low 1920x1080
48.2  fps    + Compare + 📈 Graph
med. 1920x1080
41.5  fps    + Compare + 📈 Graph
high 1920x1080
39.2  fps    + Compare + 📈 Graph
ultra 1920x1080
37  fps    + Compare + 📈 Graph
» With all tested laptops playable in detail settings ultra.
Additional Benchmarks
Low Preset 1280x720
78.8
Dead Island 2

Dead Island 2

2023
low 1920x1080
134.3  fps    + Compare + 📈 Graph
med. 1920x1080
119.1  fps    + Compare + 📈 Graph
high 1920x1080
86.1  fps    + Compare + 📈 Graph
ultra 1920x1080
63.9  fps    + Compare + 📈 Graph
» With all tested laptops playable in detail settings ultra.
The Last of Us

The Last of Us

2023
low 1920x1080
59.6  fps    + Compare + 📈 Graph
med. 1920x1080
48.4  fps    + Compare + 📈 Graph
high 1920x1080
42.2  fps    + Compare + 📈 Graph
ultra 1920x1080
31.6  fps    + Compare + 📈 Graph
» With all tested laptops playable in detail settings high.
low 1920x1080
75.1  fps    + Compare + 📈 Graph
med. 1920x1080
56.1  fps    + Compare + 📈 Graph
high 1920x1080
49.7  fps    + Compare + 📈 Graph
ultra 1920x1080
43.6  fps    + Compare + 📈 Graph
» With all tested laptops playable in detail settings ultra.
low 1920x1080
98.5  fps    + Compare
med. 1920x1080
89.1  fps    + Compare
high 1920x1080
52.3  fps    + Compare
ultra 1920x1080
52.7  fps    + Compare
» With all tested laptops playable in detail settings ultra.
low 1920x1080
72.9  fps    + Compare + 📈 Graph
med. 1920x1080
55.8  fps    + Compare + 📈 Graph
high 1920x1080
55  fps    + Compare + 📈 Graph
ultra 1920x1080
54  fps    + Compare + 📈 Graph
» With all tested laptops playable in detail settings ultra.
Additional Benchmarks
Ultra Low Preset 1280x720
77.3
low 1920x1080
109  fps    + Compare + 📈 Graph
med. 1920x1080
81.4  fps    + Compare + 📈 Graph
high 1920x1080
49.6  fps    + Compare + 📈 Graph
ultra 1920x1080
38  fps    + Compare + 📈 Graph
» With all tested laptops playable in detail settings ultra.
Additional Benchmarks
Low Preset 1280x720
153.7
Returnal

Returnal

2023
low 1920x1080
62  fps    + Compare
med. 1920x1080
59  fps    + Compare
high 1920x1080
52  fps    + Compare
ultra 1920x1080
44  fps    + Compare
» With all tested laptops playable in detail settings ultra.
low 1920x1080
73.8  fps    + Compare + 📈 Graph
med. 1920x1080
62.1  fps    + Compare + 📈 Graph
high 1920x1080
47.6  fps    + Compare + 📈 Graph
ultra 1920x1080
35.4  fps    + Compare + 📈 Graph
» With all tested laptops playable in detail settings ultra.
low 1920x1080
50.7  fps    + Compare + 📈 Graph
med. 1920x1080
47.1  fps    + Compare + 📈 Graph
high 1920x1080
40.4  fps    + Compare + 📈 Graph
ultra 1920x1080
39.8  fps    + Compare + 📈 Graph
» With all tested laptops playable in detail settings ultra.
Additional Benchmarks
Low Preset TAA 1280x720
80.2
low 1920x1080
134  fps    + Compare + 📈 Graph
med. 1920x1080
101.4  fps    + Compare + 📈 Graph
high 1920x1080
43.2  fps    + Compare + 📈 Graph
ultra 1920x1080
37  fps    + Compare + 📈 Graph
» With all tested laptops playable in detail settings ultra.
low 1920x1080
143.6  fps    + Compare + 📈 Graph
med. 1920x1080
95.8  fps    + Compare + 📈 Graph
high 1920x1080
77.7  fps    + Compare + 📈 Graph
ultra 1920x1080
61.2  fps    + Compare + 📈 Graph
» With all tested laptops playable in detail settings ultra.
low 1920x1080
81.3  fps    + Compare
med. 1920x1080
81.6  fps    + Compare
high 1920x1080
81  fps    + Compare
ultra 1920x1080
81.4  fps    + Compare
» With all tested laptops playable in detail settings ultra.
low 1920x1080
92.7  fps    + Compare + 📈 Graph
med. 1920x1080
83.8  fps    + Compare + 📈 Graph
high 1920x1080
67  fps    + Compare + 📈 Graph
ultra 1920x1080
57  fps    + Compare + 📈 Graph
» With all tested laptops playable in detail settings ultra.
Additional Benchmarks
Low Preset 1280x720
103.7
low 1920x1080
81.7  fps    + Compare + 📈 Graph
med. 1920x1080
80.8  fps    + Compare + 📈 Graph
high 1920x1080
75.6  fps    + Compare + 📈 Graph
ultra 1920x1080
67.2  fps    + Compare + 📈 Graph
» With all tested laptops playable in detail settings ultra.
low 1920x1080
57.6  fps    + Compare + 📈 Graph
med. 1920x1080
54.6  fps    + Compare + 📈 Graph
high 1920x1080
50.7  fps    + Compare + 📈 Graph
ultra 1920x1080
47.4  fps    + Compare + 📈 Graph
» With all tested laptops playable in detail settings ultra.
Additional Benchmarks
Low Preset 1280x720
57.9
med. 1920x1080
53.8  fps    + Compare + 📈 Graph
high 1920x1080
44.6  fps    + Compare + 📈 Graph
ultra 1920x1080
38  fps    + Compare + 📈 Graph
» With all tested laptops playable in detail settings ultra.
FIFA 23

FIFA 23

2022
ultra 1920x1080
95.6  fps    + Compare + 📈 Graph
» With all tested laptops playable in detail settings ultra.
low 1920x1080
91.7  fps    + Compare + 📈 Graph
med. 1920x1080
69  fps    + Compare + 📈 Graph
high 1920x1080
56.2  fps    + Compare + 📈 Graph
ultra 1920x1080
42.8  fps    + Compare + 📈 Graph
» With all tested laptops playable in detail settings ultra.
F1 22

F1 22

2022
low 1920x1080
160.5  fps    + Compare
med. 1920x1080
148.3  fps    + Compare
high 1920x1080
117.2  fps    + Compare
ultra 1920x1080
90.9  fps    + Compare
» With all tested laptops playable in detail settings ultra.
Additional Benchmarks
Ultra Low Preset 16xAF TAA 1280x720
204
med. 1920x1080
133.2  fps    + Compare + 📈 Graph
high 1920x1080
123.8  fps    + Compare + 📈 Graph
ultra 1920x1080
118.8  fps    + Compare + 📈 Graph
QHD 2560x1440
74  fps    + Compare + 📈 Graph
4K 3840x2160
35.6  fps    + Compare + 📈 Graph
» With all tested laptops playable in detail settings ultra.
low 1920x1080
96.9  fps    + Compare + 📈 Graph
med. 1920x1080
90.2  fps    + Compare + 📈 Graph
high 1920x1080
88.6  fps    + Compare + 📈 Graph
ultra 1920x1080
88.4  fps    + Compare + 📈 Graph
QHD 2560x1440
51  fps    + Compare + 📈 Graph
4K 3840x2160
23.6  fps    + Compare + 📈 Graph
» With all tested laptops playable in detail settings ultra.
low 1920x1080
117  fps    + Compare
med. 1920x1080
99.7  fps    + Compare
high 1920x1080
67.3  fps    + Compare
ultra 1920x1080
51.7  fps    + Compare
QHD 2560x1440
34.5  fps    + Compare
» With all tested laptops playable in detail settings ultra.
low 1920x1080
85.7  fps    + Compare
med. 1920x1080
67.8  fps    + Compare
high 1920x1080
53.9  fps    + Compare
ultra 1920x1080
51.7  fps    + Compare
QHD 2560x1440
25  fps    + Compare
4K 3840x2160
10.3  fps    + Compare
» With all tested laptops playable in detail settings ultra.
Additional Benchmarks
Low Preset 1280x720
121
Elex 2

Elex 2

2022
med. 1920x1080
61.2  fps    + Compare + 📈 Graph
high 1920x1080
53  fps    + Compare + 📈 Graph
ultra 1920x1080
48.4  fps    + Compare + 📈 Graph
QHD 2560x1440
33.8  fps    + Compare + 📈 Graph
4K 3840x2160
17.7  fps    + Compare + 📈 Graph
» With all tested laptops playable in detail settings ultra.
med. 1920x1080
139  fps    + Compare
high 1920x1080
118  fps    + Compare
ultra 1920x1080
79.1  fps    + Compare
QHD 2560x1440
60.1  fps    + Compare
4K 3840x2160
35.8  fps    + Compare
» With all tested laptops playable in detail settings ultra.
med. 1920x1080
58  fps    + Compare + 📈 Graph
high 1920x1080
57.3  fps    + Compare + 📈 Graph
ultra 1920x1080
56.9  fps    + Compare + 📈 Graph
QHD 2560x1440
47.9  fps    + Compare + 📈 Graph
4K 3840x2160
27.6  fps    + Compare + 📈 Graph
» With all tested laptops playable in detail settings ultra.
low 1920x1080
59.4  fps    + Compare + 📈 Graph
med. 1920x1080
47  fps    + Compare + 📈 Graph
high 1920x1080
40.1  fps    + Compare + 📈 Graph
QHD 2560x1440
26.5  fps    + Compare + 📈 Graph
4K 3840x2160
13  fps    + Compare + 📈 Graph
» With all tested laptops playable in detail settings high.
med. 1920x1080
116  fps    + Compare
high 1920x1080
105  fps    + Compare
ultra 1920x1080
85  fps    + Compare
QHD 2560x1440
54  fps    + Compare
4K 3840x2160
26  fps    + Compare
» With all tested laptops playable in detail settings ultra.
med. 1920x1080
66.2  fps    + Compare + 📈 Graph
high 1920x1080
52.4  fps    + Compare + 📈 Graph
ultra 1920x1080
35  fps    + Compare + 📈 Graph
QHD 2560x1440
28.3  fps    + Compare + 📈 Graph
4K 3840x2160
18.4  fps    + Compare + 📈 Graph
» With all tested laptops playable in detail settings high.
med. 1920x1080
83.1  fps    + Compare + 📈 Graph
high 1920x1080
70.3  fps    + Compare + 📈 Graph
ultra 1920x1080
66.1  fps    + Compare + 📈 Graph
QHD 2560x1440
43.4  fps    + Compare + 📈 Graph
4K 3840x2160
19.7  fps    + Compare + 📈 Graph
» With all tested laptops playable in detail settings ultra.
med. 1920x1080
148  fps    + Compare + 📈 Graph
high 1920x1080
121  fps    + Compare + 📈 Graph
ultra 1920x1080
98.9  fps    + Compare + 📈 Graph
QHD 2560x1440
72.6  fps    + Compare + 📈 Graph
4K 3840x2160
42.4  fps    + Compare + 📈 Graph
» With all tested laptops playable in detail settings ultra.
med. 1920x1080
82.7  fps    + Compare + 📈 Graph
high 1920x1080
70.8  fps    + Compare + 📈 Graph
ultra 1920x1080
58  fps    + Compare + 📈 Graph
QHD 2560x1440
29.8  fps    + Compare + 📈 Graph
4K 3840x2160
4.3  fps    + Compare + 📈 Graph
» With all tested laptops playable in detail settings ultra.
Additional Benchmarks
Low Preset 1920x1080
101
med. 1920x1080
100  fps    + Compare
high 1920x1080
90  fps    + Compare
ultra 1920x1080
44  fps    + Compare
QHD 2560x1440
36  fps    + Compare
4K 3840x2160
24  fps    + Compare
» With all tested laptops playable in detail settings ultra.
Additional Benchmarks
Low Preset 1920x1080
123
med. 1920x1080
72.9  fps    + Compare + 📈 Graph
high 1920x1080
59.7  fps    + Compare + 📈 Graph
ultra 1920x1080
55.8  fps    + Compare + 📈 Graph
QHD 2560x1440
42.2  fps    + Compare + 📈 Graph
4K 3840x2160
22  fps    + Compare + 📈 Graph
» With all tested laptops playable in detail settings ultra.
Additional Benchmarks
Low Preset 1920x1080
76.6
med. 1920x1080
69  fps    + Compare
high 1920x1080
55  fps    + Compare
ultra 1920x1080
50  fps    + Compare
QHD 2560x1440
35  fps    + Compare
4K 3840x2160
20  fps    + Compare
» With all tested laptops playable in detail settings ultra.
Additional Benchmarks
Low Preset 1920x1080
90
med. 1920x1080
74  fps    + Compare
high 1920x1080
72  fps    + Compare
ultra 1920x1080
70  fps    + Compare
QHD 2560x1440
51  fps    + Compare
4K 3840x2160
26  fps    + Compare
» With all tested laptops playable in detail settings ultra.
Additional Benchmarks
Low Preset 1920x1080
94
med. 1920x1080
146  fps    + Compare + 📈 Graph
high 1920x1080
126  fps    + Compare + 📈 Graph
ultra 1920x1080
115  fps    + Compare + 📈 Graph
QHD 2560x1440
74.3  fps    + Compare + 📈 Graph
4K 3840x2160
37.4  fps    + Compare + 📈 Graph
» With all tested laptops playable in detail settings ultra.
Additional Benchmarks
Low Preset (DX12) 1920x1080
197
Far Cry 6

Far Cry 6

2021
med. 1920x1080
89  fps    + Compare
high 1920x1080
78  fps    + Compare
ultra 1920x1080
68  fps    + Compare
QHD 2560x1440
48  fps    + Compare
» With all tested laptops playable in detail settings ultra.
Additional Benchmarks
Low Graphics Quality 1920x1080
102
med. 1920x1080
87.6  fps    + Compare + 📈 Graph
high 1920x1080
82.6  fps    + Compare + 📈 Graph
QHD 2560x1440
65.5  fps    + Compare + 📈 Graph
4K 3840x2160
34.9  fps    + Compare + 📈 Graph
» With all tested laptops playable in detail settings high.
Additional Benchmarks
Low Preset 1920x1080
92.8
FIFA 22

FIFA 22

2021
med. 1920x1080
224  fps    + Compare + 📈 Graph
high 1920x1080
215  fps    + Compare + 📈 Graph
ultra 1920x1080
214  fps    + Compare + 📈 Graph
QHD 2560x1440
203  fps    + Compare + 📈 Graph
4K 3840x2160
135  fps    + Compare + 📈 Graph
» With all tested laptops playable in detail settings ultra.
Additional Benchmarks
Low Rendering Quality 1920x1080
227
New World

New World

2021
med. 1920x1080
57.9  fps    + Compare + 📈 Graph
high 1920x1080
55.9  fps    + Compare + 📈 Graph
ultra 1920x1080
50  fps    + Compare + 📈 Graph
QHD 2560x1440
38  fps    + Compare + 📈 Graph
4K 3840x2160
17.8  fps    + Compare + 📈 Graph
» With all tested laptops playable in detail settings ultra.
Additional Benchmarks
Low Video Quality 1920x1080
66.8
Deathloop

Deathloop

2021
med. 1920x1080
81.5  fps    + Compare + 📈 Graph
high 1920x1080
65.6  fps    + Compare + 📈 Graph
ultra 1920x1080
57.4  fps    + Compare + 📈 Graph
QHD 2560x1440
40.1  fps    + Compare + 📈 Graph
4K 3840x2160
21  fps    + Compare + 📈 Graph
» With all tested laptops playable in detail settings ultra.
Additional Benchmarks
Low Preset 1920x1080
92.8
F1 2021

F1 2021

2021
med. 1920x1080
149  fps    + Compare
high 1920x1080
120  fps    + Compare
» With all tested laptops playable in detail settings high.
Additional Benchmarks
Ultra Low Preset 1920x1080
181
med. 1920x1080
135  fps    + Compare + 📈 Graph
high 1920x1080
134  fps    + Compare + 📈 Graph
QHD 2560x1440
117  fps    + Compare + 📈 Graph
4K 3840x2160
68.2  fps    + Compare + 📈 Graph
» With all tested laptops playable in detail settings high.
Additional Benchmarks
Low Preset 1920x1080
136
Days Gone

Days Gone

2021
med. 1920x1080
95  fps    + Compare + 📈 Graph
high 1920x1080
83.3  fps    + Compare + 📈 Graph
ultra 1920x1080
60.7  fps    + Compare + 📈 Graph
QHD 2560x1440
43.4  fps    + Compare + 📈 Graph
4K 3840x2160
24.1  fps    + Compare + 📈 Graph
» With all tested laptops playable in detail settings ultra.
Additional Benchmarks
Low Preset 1920x1080
114
low 1280x720
115  fps    + Compare + 📈 Graph
ultra 1920x1080
110  fps    + Compare + 📈 Graph
QHD 2560x1440
96.2  fps    + Compare + 📈 Graph
4K 3840x2160
53.6  fps    + Compare + 📈 Graph
» With all tested laptops playable in detail settings ultra.
med. 1920x1080
105  fps    + Compare + 📈 Graph
high 1920x1080
99  fps    + Compare + 📈 Graph
ultra 1920x1080
86.4  fps    + Compare + 📈 Graph
QHD 2560x1440
52.4  fps    + Compare + 📈 Graph
4K 3840x2160
28.6  fps    + Compare + 📈 Graph
» With all tested laptops playable in detail settings ultra.
Additional Benchmarks
Prioritize Performance Preset 1920x1080
111
Outriders

Outriders

2021
med. 1920x1080
98.9  fps    + Compare + 📈 Graph
high 1920x1080
83.7  fps    + Compare + 📈 Graph
ultra 1920x1080
71.7  fps    + Compare + 📈 Graph
QHD 2560x1440
46.6  fps    + Compare + 📈 Graph
4K 3840x2160
31.7  fps    + Compare + 📈 Graph
» With all tested laptops playable in detail settings ultra.
Additional Benchmarks
Low Preset 1920x1080
111
Hitman 3

Hitman 3

2021
med. 1920x1080
116  fps    + Compare
high 1920x1080
99.3  fps    + Compare
ultra 1920x1080
91  fps    + Compare
QHD 2560x1440
59.2  fps    + Compare
4K 3840x2160
31.2  fps    + Compare
» With all tested laptops playable in detail settings ultra.
Additional Benchmarks
Minimum Settings 1920x1080
159
med. 1920x1080
57.3  fps    + Compare + 📈 Graph
high 1920x1080
46.6  fps    + Compare + 📈 Graph
ultra 1920x1080
39.1  fps    + Compare + 📈 Graph
QHD 2560x1440
24  fps    + Compare + 📈 Graph
4K 3840x2160
10.3  fps    + Compare + 📈 Graph
» With all tested laptops playable in detail settings ultra.
Additional Benchmarks
Low Preset 1920x1080
70.4
Ray Tracing Ultra Preset (DLSS off) 1920x1080
6
med. 1920x1080
73  fps    + Compare
high 1920x1080
59  fps    + Compare
ultra 1920x1080
55  fps    + Compare
QHD 2560x1440
43  fps    + Compare
4K 3840x2160
25  fps    + Compare
» With all tested laptops playable in detail settings ultra.
med. 1920x1080
76.7  fps    + Compare + 📈 Graph
high 1920x1080
74.2  fps    + Compare + 📈 Graph
ultra 1920x1080
62.9  fps    + Compare + 📈 Graph
QHD 2560x1440
41.2  fps    + Compare + 📈 Graph
4K 3840x2160
20.4  fps    + Compare + 📈 Graph
» With all tested laptops playable in detail settings ultra.
med. 1920x1080
82.7  fps    + Compare + 📈 Graph
high 1920x1080
67.7  fps    + Compare + 📈 Graph
ultra 1920x1080
60.3  fps    + Compare + 📈 Graph
QHD 2560x1440
39.6  fps    + Compare + 📈 Graph
4K 3840x2160
19.8  fps    + Compare + 📈 Graph
» With all tested laptops playable in detail settings ultra.
Additional Benchmarks
Highest Settings + Ultra Ray Tracing 1920x1080
21.3
med. 1920x1080
66  fps    + Compare
high 1920x1080
49  fps    + Compare
ultra 1920x1080
42  fps    + Compare
QHD 2560x1440
32  fps    + Compare
4K 3840x2160
13  fps    + Compare
» With all tested laptops playable in detail settings ultra.
Dirt 5

Dirt 5

2020
med. 1920x1080
74.5  fps    + Compare
high 1920x1080
56.4  fps    + Compare
ultra 1920x1080
32.5  fps    + Compare
QHD 2560x1440
28  fps    + Compare
4K 3840x2160
20.4  fps    + Compare
» With all tested laptops playable in detail settings high.
med. 1920x1080
81.5  fps    + Compare + 📈 Graph
high 1920x1080
70.9  fps    + Compare + 📈 Graph
ultra 1920x1080
33.1  fps    + Compare + 📈 Graph
QHD 2560x1440
23.2  fps    + Compare + 📈 Graph
4K 3840x2160
13  fps    + Compare + 📈 Graph
» With all tested laptops playable in detail settings high.
Additional Benchmarks
Ultra Preset + Ultra Ray Tracing (DX12) 1920x1080
14.5
FIFA 21

FIFA 21

2020
low 1280x720
227  fps    + Compare + 📈 Graph
med. 1920x1080
225  fps    + Compare + 📈 Graph
high 1920x1080
214  fps    + Compare + 📈 Graph
ultra 1920x1080
209  fps    + Compare + 📈 Graph
QHD 2560x1440
203  fps    + Compare + 📈 Graph
4K 3840x2160
136  fps    + Compare + 📈 Graph
» With all tested laptops playable in detail settings ultra.
low 1280x720
237  fps    + Compare + 📈 Graph
med. 1920x1080
219  fps    + Compare + 📈 Graph
high 1920x1080
159 185 ~ 172 fps    + Compare + 📈 Graph
ultra 1920x1080
156 168 ~ 162 fps    + Compare + 📈 Graph
QHD 2560x1440
107  fps    + Compare + 📈 Graph
4K 3840x2160
59.1  fps    + Compare + 📈 Graph
» With all tested laptops playable in detail settings ultra.
low 1280x720
119  fps    + Compare + 📈 Graph
med. 1920x1080
77  fps    + Compare + 📈 Graph
high 1920x1080
66.8 70 ~ 68 fps    + Compare + 📈 Graph
QHD 2560x1440
46.6  fps    + Compare + 📈 Graph
4K 3840x2160
23.7  fps    + Compare + 📈 Graph
» With all tested laptops playable in detail settings high.
low 1280x720
103  fps    + Compare + 📈 Graph
med. 1920x1080
69  fps    + Compare + 📈 Graph
high 1920x1080
67.1 68.3 ~ 68 fps    + Compare + 📈 Graph
ultra 1920x1080
51.5 52.3 ~ 52 fps    + Compare + 📈 Graph
QHD 2560x1440
39.6  fps    + Compare + 📈 Graph
» With all tested laptops playable in detail settings ultra.
med. 1920x1080
99.5  fps    + Compare + 📈 Graph
high 1920x1080
55.1  fps    + Compare + 📈 Graph
ultra 1920x1080
41.7  fps    + Compare + 📈 Graph
QHD 2560x1440
22.5  fps    + Compare + 📈 Graph
4K 3840x2160
13.4  fps    + Compare + 📈 Graph
» With all tested laptops playable in detail settings ultra.
low 1280x720
72.7  fps    + Compare + 📈 Graph
med. 1920x1080
56.9  fps    + Compare + 📈 Graph
high 1920x1080
39.4 41.3 ~ 40 fps    + Compare + 📈 Graph
ultra 1920x1080
26.8 28.2 ~ 28 fps    + Compare + 📈 Graph
QHD 2560x1440
20.6  fps    + Compare + 📈 Graph
4K 3840x2160
11.6  fps    + Compare + 📈 Graph
» With all tested laptops playable in detail settings high.
low 1280x720
125  fps    + Compare
med. 1920x1080
83  fps    + Compare
high 1920x1080
70 75 ~ 73 fps    + Compare
ultra 1920x1080
55 58 ~ 57 fps    + Compare
QHD 2560x1440
43  fps    + Compare
4K 3840x2160
23  fps    + Compare
» With all tested laptops playable in detail settings ultra.
low 1280x720
151  fps    + Compare
med. 1920x1080
99.4  fps    + Compare
high 1920x1080
88.3 92.1 ~ 90 fps    + Compare
ultra 1920x1080
85.5 89 ~ 87 fps    + Compare
QHD 2560x1440
59.9  fps    + Compare
4K 3840x2160
31.5  fps    + Compare
» With all tested laptops playable in detail settings ultra.
F1 2020

F1 2020

2020
low 1280x720
227  fps    + Compare
med. 1920x1080
143  fps    + Compare
high 1920x1080
122 126 ~ 124 fps    + Compare
ultra 1920x1080
87 92 ~ 90 fps    + Compare
QHD 2560x1440
65  fps    + Compare
4K 3840x2160
37  fps    + Compare
» With all tested laptops playable in detail settings ultra.
Valorant

Valorant

2020
low 1280x720
249  fps    + Compare
med. 1920x1080
209  fps    + Compare
high 1920x1080
207  fps    + Compare
QHD 2560x1440
197  fps    + Compare
4K 3840x2160
152  fps    + Compare
» With all tested laptops playable in detail settings high.
low 1280x720
262  fps    + Compare
med. 1920x1080
159  fps    + Compare
high 1920x1080
90.2 101 ~ 96 fps    + Compare
ultra 1920x1080
63.6 70.1 ~ 67 fps    + Compare
QHD 2560x1440
44.9  fps    + Compare
4K 3840x2160
21.8  fps    + Compare
» With all tested laptops playable in detail settings ultra.
low 1280x720
197  fps    + Compare
med. 1920x1080
148  fps    + Compare
high 1920x1080
133  fps    + Compare
ultra 1920x1080
120 129 ~ 125 fps    + Compare
QHD 2560x1440
80.9  fps    + Compare
4K 3840x2160
38.8  fps    + Compare
» With all tested laptops playable in detail settings ultra.
low 1280x720
166  fps    + Compare
med. 1920x1080
89.3  fps    + Compare
high 1920x1080
69.1 73.5 ~ 71 fps    + Compare
QHD 2560x1440
47.4  fps    + Compare
4K 3840x2160
21.2  fps    + Compare
» With all tested laptops playable in detail settings high.
low 1280x720
121  fps    + Compare
med. 1920x1080
117  fps    + Compare
high 1920x1080
97.8  fps    + Compare
ultra 1920x1080
90  fps    + Compare
QHD 2560x1440
51.5  fps    + Compare
4K 3840x2160
26.2  fps    + Compare
» With all tested laptops playable in detail settings ultra.
low 1280x720
103  fps    + Compare
med. 1920x1080
75.3 78.6 ~ 77 fps    + Compare
high 1920x1080
50.5 52.1 ~ 51 fps    + Compare
ultra 1920x1080
31.2 32 ~ 32 fps    + Compare
QHD 2560x1440
25.6  fps    + Compare
4K 3840x2160
17.3  fps    + Compare
» With all tested laptops playable in detail settings high.
med. 1920x1080
94.7 104 ~ 99 fps    + Compare
high 1920x1080
84.9 91.4 ~ 88 fps    + Compare
ultra 1920x1080
77.7 82.9 ~ 80 fps    + Compare
QHD 2560x1440
56  fps    + Compare
4K 3840x2160
27.1  fps    + Compare
» With all tested laptops playable in detail settings ultra.
low 1280x720
99  fps    + Compare
med. 1920x1080
87.9 93 ~ 90 fps    + Compare
high 1920x1080
79.7 86.2 ~ 83 fps    + Compare
ultra 1920x1080
67.4 70.3 ~ 69 fps    + Compare
QHD 2560x1440
50.3  fps    + Compare
4K 3840x2160
27  fps    + Compare
» With all tested laptops playable in detail settings ultra.
low 1280x720
179  fps    + Compare
med. 1920x1080
99 109 ~ 104 fps    + Compare
high 1920x1080
88.1 103 ~ 96 fps    + Compare
ultra 1920x1080
71.9 84.1 ~ 78 fps    + Compare
QHD 2560x1440
58.8  fps    + Compare
4K 3840x2160
32.8  fps    + Compare
» With all tested laptops playable in detail settings ultra.
Additional Benchmarks
Maximum Settings with Raytracing T2X Filmic SMAA 1920x1080
37.8
GRID 2019

GRID 2019

2019
low 1280x720
192  fps    + Compare
med. 1920x1080
116 119 ~ 118 fps    + Compare
high 1920x1080
90.5 94.3 ~ 92 fps    + Compare
ultra 1920x1080
61.7 64.1 ~ 63 fps    + Compare
QHD 2560x1440
51.3  fps    + Compare
4K 3840x2160
31.2  fps    + Compare
» With all tested laptops playable in detail settings ultra.
low 1280x720
119  fps    + Compare
med. 1920x1080
79 84 ~ 82 fps    + Compare
high 1920x1080
70 76 ~ 73 fps    + Compare
ultra 1920x1080
51 55 ~ 53 fps    + Compare
QHD 2560x1440
38  fps    + Compare
4K 3840x2160
19  fps    + Compare
» With all tested laptops playable in detail settings ultra.
FIFA 20

FIFA 20

2019
low 1280x720
255  fps    + Compare
med. 1920x1080
192 249 ~ 221 fps    + Compare
high 1920x1080
181 241 ~ 211 fps    + Compare
ultra 1920x1080
179 237 ~ 208 fps    + Compare
QHD 2560x1440
219  fps    + Compare
4K 3840x2160
138  fps    + Compare
» With all tested laptops playable in detail settings ultra.
low 1280x720
107.9 131 ~ 119 fps    + Compare
med. 1920x1080
87.5 91.7 96 ~ 92 fps    + Compare
high 1920x1080
61.7 61.7 64.2 ~ 63 fps    + Compare
ultra 1920x1080
46.6 47.8 48.6 ~ 48 fps    + Compare
QHD 2560x1440
32.1  fps    + Compare
4K 3840x2160
11.8  fps    + Compare
» With all tested laptops playable in detail settings ultra.
Control

Control

2019
low 1280x720
210  fps    + Compare
med. 1920x1080
69.2 72.3 ~ 71 fps    + Compare
high 1920x1080
50.7 52.8 ~ 52 fps    + Compare
QHD 2560x1440
33.1  fps    + Compare
4K 3840x2160
15.1  fps    + Compare
» With all tested laptops playable in detail settings high.
Additional Benchmarks
High Quality Preset & High Ray Tracing Preset (DX12) 1920x1080
18.2
F1 2019

F1 2019

2019
low 1280x720
181 193 210 230 ~ 204 fps    + Compare
med. 1920x1080
141 144 154 157 ~ 149 fps    + Compare
high 1920x1080
121 122 131 141 ~ 129 fps    + Compare
ultra 1920x1080
91 92 93 99 ~ 94 fps    + Compare
QHD 2560x1440
68  fps    + Compare
4K 3840x2160
43  fps    + Compare
» With all tested laptops playable in detail settings ultra.
low 1280x720
202.9  fps    + Compare
med. 1920x1080
101.5  fps    + Compare
high 1920x1080
63.9  fps    + Compare
ultra 1920x1080
46.1  fps    + Compare
» With all tested laptops playable in detail settings ultra.
Rage 2

Rage 2

2019
low 1280x720
162.7 175.1 ~ 169 fps    + Compare
med. 1920x1080
81.6 83.3 ~ 82 fps    + Compare
high 1920x1080
69.5 69.9 ~ 70 fps    + Compare
ultra 1920x1080
67.9 68.8 ~ 68 fps    + Compare
» With all tested laptops playable in detail settings ultra.
Anno 1800

Anno 1800

2019
low 1280x720
94.6  fps    + Compare
med. 1920x1080
89.6 105 ~ 97 fps    + Compare
high 1920x1080
69.2 70.4 75.9 ~ 72 fps    + Compare
ultra 1920x1080
31.1 35.9 39.6 54 ~ 40 fps    + Compare
QHD 2560x1440
22.2  fps    + Compare
4K 3840x2160
13.4  fps    + Compare
» With most tested laptops playable in detail settings ultra.
med. 1920x1080
98 104 ~ 101 fps    + Compare
high 1920x1080
78 81 ~ 80 fps    + Compare
ultra 1920x1080
57 63 ~ 60 fps    + Compare
QHD 2560x1440
43  fps    + Compare
4K 3840x2160
23  fps    + Compare
» With all tested laptops playable in detail settings ultra.
med. 1920x1080
138 144 ~ 141 fps    + Compare
high 1920x1080
107 123 ~ 115 fps    + Compare
ultra 1920x1080
62.3 65.6 ~ 64 fps    + Compare
QHD 2560x1440
46.4  fps    + Compare
» With all tested laptops playable in detail settings ultra.
Anthem

Anthem

2019
med. 1920x1080
75.2 88.2 ~ 82 fps    + Compare
high 1920x1080
73.2 76.8 ~ 75 fps    + Compare
ultra 1920x1080
71 71.8 ~ 71 fps    + Compare
QHD 2560x1440
49.6  fps    + Compare
4K 3840x2160
26.6  fps    + Compare
» With all tested laptops playable in detail settings ultra.
low 1280x720
104 105 106 106 106 109 ~ 106 fps    + Compare + 📈 Graph
med. 1920x1080
83 86 87 88 90 90 94 ~ 88 fps    + Compare + 📈 Graph
high 1920x1080
79 83 83 85 86 86 89 ~ 84 fps    + Compare + 📈 Graph
ultra 1920x1080
73 74 75 76 78 78 81 ~ 76 fps    + Compare + 📈 Graph
QHD 2560x1440
60 60 ~ 60 fps    + Compare + 📈 Graph
4K 3840x2160
31 32 ~ 32 fps    + Compare + 📈 Graph
» With all tested laptops playable in detail settings ultra.
low 1280x720
112.4 123.9 129 ~ 122 fps    + Compare
med. 1920x1080
64 64.1 72.5 73.7 ~ 69 fps    + Compare
high 1920x1080
47.2 48.7 54.4 54.9 ~ 51 fps    + Compare
ultra 1920x1080
38.2 39.6 42.6 43.1 ~ 41 fps    + Compare
QHD 2560x1440
29.5  fps    + Compare
4K 3840x2160
18.5  fps    + Compare
» With all tested laptops playable in detail settings ultra.
med. 1920x1080
120 131 ~ 126 fps    + Compare
high 1920x1080
102 108 ~ 105 fps    + Compare
ultra 1920x1080
98.6 107 ~ 103 fps    + Compare
QHD 2560x1440
72.2  fps    + Compare
4K 3840x2160
41.3  fps    + Compare
» With all tested laptops playable in detail settings ultra.
med. 1920x1080
102  fps    + Compare
high 1920x1080
73.1  fps    + Compare
ultra 1920x1080
67.6  fps    + Compare
QHD 2560x1440
46.4  fps    + Compare
4K 3840x2160
25  fps    + Compare
» With all tested laptops playable in detail settings ultra.
med. 1920x1080
82.7  fps    + Compare
high 1920x1080
75.1  fps    + Compare
ultra 1920x1080
72.3  fps    + Compare
QHD 2560x1440
54.7  fps    + Compare
4K 3840x2160
20.5  fps    + Compare
» With all tested laptops playable in detail settings ultra.
med. 1920x1080
111  fps    + Compare
high 1920x1080
101 104 ~ 103 fps    + Compare
ultra 1920x1080
93.2 95.7 ~ 94 fps    + Compare
QHD 2560x1440
68.7  fps    + Compare
4K 3840x2160
38.3  fps    + Compare
» With all tested laptops playable in detail settings ultra.
med. 1920x1080
182  fps    + Compare
high 1920x1080
145  fps    + Compare
ultra 1920x1080
113  fps    + Compare
QHD 2560x1440
77.8  fps    + Compare
4K 3840x2160
41.1  fps    + Compare
» With all tested laptops playable in detail settings ultra.
Hitman 2

Hitman 2

2018
med. 1920x1080
89  fps    + Compare
high 1920x1080
82.2  fps    + Compare
ultra 1920x1080
78.1  fps    + Compare
QHD 2560x1440
54.5  fps    + Compare
4K 3840x2160
26.6  fps    + Compare
» With all tested laptops playable in detail settings ultra.
med. 1920x1080
129  fps    + Compare
high 1920x1080
112  fps    + Compare
ultra 1920x1080
105  fps    + Compare
QHD 2560x1440
66  fps    + Compare
4K 3840x2160
30.8  fps    + Compare
» With all tested laptops playable in detail settings ultra.
med. 1920x1080
80  fps    + Compare
high 1920x1080
69  fps    + Compare
ultra 1920x1080
47 59 ~ 53 fps    + Compare
QHD 2560x1440
36  fps    + Compare
4K 3840x2160
22  fps    + Compare
» With all tested laptops playable in detail settings ultra.
low 1280x720
161  fps    + Compare
med. 1920x1080
134  fps    + Compare
high 1920x1080
125  fps    + Compare
ultra 1920x1080
99  fps    + Compare
» With all tested laptops playable in detail settings ultra.
FIFA 19

FIFA 19

2018
med. 1920x1080
304  fps    + Compare
high 1920x1080
256  fps    + Compare
ultra 1920x1080
248  fps    + Compare
QHD 2560x1440
182  fps    + Compare
4K 3840x2160
106  fps    + Compare
» With all tested laptops playable in detail settings ultra.
low 1280x720
88 108 115 135 135 151 ~ 122 fps    + Compare
med. 1920x1080
68 79 81 83 87 90 93 ~ 83 fps    + Compare
high 1920x1080
67 72 73 75 79 81 82 83 ~ 77 fps    + Compare
ultra 1920x1080
62 64 65 67 70 73 73 73 ~ 68 fps    + Compare
QHD 2560x1440
46  fps    + Compare
4K 3840x2160
24  fps    + Compare
» With all tested laptops playable in detail settings ultra.
Additional Benchmarks
Lowest Preset 1920x1080
104
Strange Brigade

Strange Brigade

2018
low 1280x720
292 311 ~ 302 fps    + Compare
med. 1920x1080
144 150 ~ 147 fps    + Compare
high 1920x1080
114 122 ~ 118 fps    + Compare
ultra 1920x1080
97.4 104 ~ 101 fps    + Compare
» With all tested laptops playable in detail settings ultra.
F1 2018

F1 2018

2018
med. 1920x1080
155  fps    + Compare
high 1920x1080
126  fps    + Compare
ultra 1920x1080
80  fps    + Compare
QHD 2560x1440
65  fps    + Compare
4K 3840x2160
38  fps    + Compare
» With all tested laptops playable in detail settings ultra.
med. 1920x1080
94.2  fps    + Compare
high 1920x1080
82.4  fps    + Compare
ultra 1920x1080
65.1  fps    + Compare
QHD 2560x1440
40.7  fps    + Compare
4K 3840x2160
19.7  fps    + Compare
» With all tested laptops playable in detail settings ultra.
med. 1920x1080
60  fps    + Compare
high 1920x1080
60  fps    + Compare
ultra 1920x1080
59.9  fps    + Compare
QHD 2560x1440
48.6  fps    + Compare
4K 3840x2160
24.1  fps    + Compare
» With all tested laptops playable in detail settings ultra.
Far Cry 5

Far Cry 5

2018
low 1280x720
107 117 119 124 ~ 117 fps    + Compare + 📈 Graph
med. 1920x1080
90 92 93 97 ~ 93 fps    + Compare + 📈 Graph
high 1920x1080
84 88 90 90 ~ 88 fps    + Compare + 📈 Graph
ultra 1920x1080
82 83 83 85 87 ~ 84 fps    + Compare + 📈 Graph
QHD 2560x1440
60  fps    + Compare + 📈 Graph
4K 3840x2160
31  fps    + Compare + 📈 Graph
» With all tested laptops playable in detail settings ultra.
World of Tanks enCore

World of Tanks enCore

2018
low 1366x768
559  fps    + Compare
med. 1920x1080
247.6  fps    + Compare
ultra 1920x1080
119.3  fps    + Compare
» With all tested laptops playable in detail settings ultra.
low 1280x720
83 85.7 91.5 92 93 101 105.3 107 108 111 117 ~ 100 fps    + Compare
med. 1920x1080
76 77.8 83.6 83.7 85 89 92.1 92.7 95 95.1 106 ~ 89 fps    + Compare
high 1920x1080
64 67.1 70.2 71 73 75.2 78.4 78.6 79.8 80.5 85 ~ 75 fps    + Compare
» With all tested laptops playable in detail settings high.
med. 1920x1080
97.8  fps    + Compare
high 1920x1080
76.8  fps    + Compare
ultra 1920x1080
57.2  fps    + Compare
QHD 2560x1440
36.4  fps    + Compare
4K 3840x2160
18.3  fps    + Compare
» With all tested laptops playable in detail settings ultra.
low 1280x720
120.9 129 133 137 ~ 130 fps    + Compare
med. 1920x1080
78.1 79.9 80.5 81.4 87.6 ~ 82 fps    + Compare
high 1920x1080
55.4 57.2 58.7 59.9 63.9 ~ 59 fps    + Compare
4K 3840x2160
24  fps    + Compare
» With all tested laptops playable in detail settings high.
Fortnite

Fortnite

2018
ultra 1920x1080
107  fps    + Compare
QHD 2560x1440
69.3  fps    + Compare
» With all tested laptops playable in detail settings ultra.
med. 1920x1080
110  fps    + Compare
high 1920x1080
95.4  fps    + Compare
ultra 1920x1080
82.8  fps    + Compare
QHD 2560x1440
54.7  fps    + Compare
4K 3840x2160
27.1  fps    + Compare
» With all tested laptops playable in detail settings ultra.
med. 1920x1080
127  fps    + Compare
high 1920x1080
113  fps    + Compare
ultra 1920x1080
106  fps    + Compare
QHD 2560x1440
72.7  fps    + Compare
4K 3840x2160
37.1  fps    + Compare
» With all tested laptops playable in detail settings ultra.
ELEX

ELEX

2017
med. 1920x1080
113  fps    + Compare
high 1920x1080
90  fps    + Compare
ultra 1920x1080
70.4  fps    + Compare
QHD 2560x1440
45.7  fps    + Compare
4K 3840x2160
23.8  fps    + Compare
» With all tested laptops playable in detail settings ultra.
med. 1920x1080
121  fps    + Compare
high 1920x1080
89  fps    + Compare
ultra 1920x1080
69  fps    + Compare
4K 3840x2160
28  fps    + Compare
» With all tested laptops playable in detail settings ultra.
ultra 1920x1080
109  fps    + Compare
» With all tested laptops playable in detail settings ultra.
low 1280x720
248  fps    + Compare
med. 1920x1080
247 249 ~ 248 fps    + Compare
high 1920x1080
209 221 ~ 215 fps    + Compare
4K 3840x2160
89.9  fps    + Compare
» With all tested laptops playable in detail settings high.
Prey

Prey

2017
med. 1920x1080
144  fps    + Compare
high 1920x1080
143  fps    + Compare
ultra 1920x1080
127  fps    + Compare
4K 3840x2160
44.1  fps    + Compare
» With all tested laptops playable in detail settings ultra.
low 1280x720
150.6  fps    + Compare
med. 1920x1080
84.7 88.7 ~ 87 fps    + Compare
high 1920x1080
78.5 82.6 ~ 81 fps    + Compare
ultra 1920x1080
45.4 47.8 ~ 47 fps    + Compare
4K 3840x2160
28.9  fps    + Compare
» With all tested laptops playable in detail settings ultra.
For Honor

For Honor

2017
low 1280x720
237.2 245.1 ~ 241 fps    + Compare
med. 1920x1080
126 126.1 128.6 ~ 127 fps    + Compare
high 1920x1080
120 120.4 121.5 ~ 121 fps    + Compare
ultra 1920x1080
92.6 92.6 93.1 ~ 93 fps    + Compare
4K 3840x2160
37.8  fps    + Compare
» With all tested laptops playable in detail settings ultra.
med. 1920x1080
281  fps    + Compare
high 1920x1080
147  fps    + Compare
ultra 1920x1080
122  fps    + Compare
4K 3840x2160
41.1  fps    + Compare
» With all tested laptops playable in detail settings ultra.
high 1920x1080
100  fps    + Compare
ultra 1920x1080
84.5  fps    + Compare
4K 3840x2160
41.4  fps    + Compare
» With all tested laptops playable in detail settings ultra.
high 1920x1080
79.4  fps    + Compare
ultra 1920x1080
44  fps    + Compare
4K 3840x2160
26.6  fps    + Compare
» With all tested laptops playable in detail settings ultra.
high 1920x1080
101  fps    + Compare
ultra 1920x1080
92.4  fps    + Compare
4K 3840x2160
33.7  fps    + Compare
» With all tested laptops playable in detail settings ultra.
Overwatch

Overwatch

2016
high 1920x1080
225  fps    + Compare
ultra 1920x1080
133  fps    + Compare
4K 3840x2160
75.3  fps    + Compare
» With all tested laptops playable in detail settings ultra.
Additional Benchmarks
Epic (Render Scale 100 %) 16xAF SMAA 2560x1440
92.1
Doom

Doom

2016
high 1920x1080
144  fps    + Compare
ultra 1920x1080
136  fps    + Compare
4K 3840x2160
49.5  fps    + Compare
» With all tested laptops playable in detail settings ultra.
low 1024x768
118 156 232 ~ 169 fps    + Compare
med. 1366x768
116 164 166 ~ 149 fps    + Compare
high 1920x1080
86 97.8 100 ~ 95 fps    + Compare
ultra 1920x1080
74 81 87.4 ~ 81 fps    + Compare
4K 3840x2160
38  fps    + Compare
» With all tested laptops playable in detail settings ultra.
high 1920x1080
201  fps    + Compare
ultra 1920x1080
175  fps    + Compare
4K 3840x2160
73.3  fps    + Compare
» With all tested laptops playable in detail settings ultra.
low 1366x768
220.1  fps    + Compare
med. 1366x768
179.7  fps    + Compare
high 1920x1080
148.2  fps    + Compare
ultra 1920x1080
141.1  fps    + Compare
» With all tested laptops playable in detail settings ultra.
low 1280x720
109 119.4 122 137.2 139 143 143 143.5 144 146 150 ~ 136 fps    + Compare
med. 1366x768
110.4 113 123.7 126.8 128.7 130.2 131 131 132 133 135 ~ 127 fps    + Compare
high 1920x1080
103.3 110 117.6 119 120.1 121.3 124 124 124 124 130 ~ 120 fps    + Compare
ultra 1920x1080
94.6 104 110.6 113.5 113.6 116 118 118 118 118.2 125 ~ 114 fps    + Compare
4K 3840x2160
85  fps    + Compare
» With all tested laptops playable in detail settings ultra.
low 1024x768
177.3 204 247.6 253 254 254 256 257.1 258.9 261.5 264 287.9 288.3 297.8 ~ 254 fps    + Compare
med. 1366x768
148 151 163.9 169.7 171 175.1 176.3 179 180.7 180.8 185 191.6 193.2 200 ~ 176 fps    + Compare
high 1920x1080
93 95.9 97.5 98.4 99.5 101 101 102.6 103 104 104.3 106 109.6 110.7 116 117.6 120.4 ~ 105 fps    + Compare + 📈 Graph
ultra 1920x1080
51.6 52.8 53.1 53.3 53.6 53.7 54.2 54.2 54.6 55.1 55.2 55.3 55.6 56.6 57.1 57.6 60 60.5 60.6 61.3 65.1 ~ 56 fps    + Compare + 📈 Graph
4K 3840x2160
32.9 36.9 ~ 35 fps    + Compare
» With all tested laptops playable in detail settings ultra.
GTA V

GTA V

2015
low 1024x768
152.7 176 178 178 ~ 171 fps    + Compare
med. 1366x768
142.5 164 168 170 171 ~ 163 fps    + Compare
high 1920x1080
123.7 133 137 139 140 ~ 135 fps    + Compare
ultra 1920x1080
68.1 71.8 73.8 74.1 76 ~ 73 fps    + Compare
» With all tested laptops playable in detail settings ultra.
Additional Benchmarks
Normal/Off 4xAF 1920x1080
165
159
166
169
Lowest Settings possible 1920x1080
173
168
174
175
low 1280x720
235.5 277.4 283 291.2 304.3 309 309.5 313.9 314.1 317.1 320.1 331.2 345.5 ~ 304 fps    + Compare
med. 1366x768
216.4 241 248.5 256.8 259.6 264 270 271.6 277.4 278.5 284.2 287.2 288.4 ~ 265 fps    + Compare
high 1366x768
201.6 226.8 237 241.3 247 248.7 250.9 252 258.1 260.1 263.3 265.6 274.5 ~ 248 fps    + Compare
ultra 1920x1080
121.6 128 128.6 132.5 136.2 137 137.4 138 138 138 140.3 140.8 142.2 144.2 ~ 136 fps    + Compare
» With all tested laptops playable in detail settings ultra.
lowmed.highultraQHD4K
Skull & Bones79715548
Enshrouded49.541.234.226.9
Palworld80.569.955.350.7
Prince of Persia The Lost Crown302291283
Ready or Not143105.6101.474.4
The Finals136.3112.298.672.3
Avatar Frontiers of Pandora40362820
Call of Duty Modern Warfare 3 202384755753
EA Sports WRC77.956.851.846.9
Alan Wake 238.331.229.5
Lords of the Fallen5141.330.320.2
Total War Pharaoh183.5127.282.466.3
Assassin's Creed Mirage76706650
EA Sports FC 2493.9
Counter-Strike 2146.7132.6104.498.2
Cyberpunk 2077 2.0 Phantom Liberty73.357.449.141.7
Lies of P103.389.576.868.2
The Crew Motorfest59595246
Starfield44.737.529.626.3
Armored Core 669.367.564.260.4
Immortals of Aveum51.644.437.8
Atlas Fallen85.280.573.962.3
Baldur's Gate 381.663.254.153.6
Ratchet & Clank Rift Apart5849.640.336.3
F1 23158.4149.4108.580.1
Diablo 4148.4129.4112.894.3
Star Wars Jedi Survivor48.241.539.237
Dead Island 2134.3119.186.163.9
The Last of Us59.648.442.231.6
Resident Evil 4 Remake75.156.149.743.6
Company of Heroes 398.589.152.352.7
Sons of the Forest72.955.85554
Atomic Heart10981.449.638
Returnal62595244
Hogwarts Legacy73.862.147.635.4
Dead Space Remake50.747.140.439.8
The Witcher 3 v4.00134101.443.237
High On Life143.695.877.761.2
The Callisto Protocol81.381.68181.4
Need for Speed Unbound92.783.86757
Spider-Man Miles Morales81.780.875.667.2
Uncharted Legacy of Thieves Collection57.654.650.747.4
A Plague Tale Requiem53.844.638
FIFA 2395.6
The Quarry91.76956.242.8
F1 22160.5148.3117.290.9
Vampire Bloodhunt133.2123.8118.87435.6
Ghostwire Tokyo96.990.288.688.45123.6
Tiny Tina's Wonderlands11799.767.351.734.5
Cyberpunk 2077 1.685.767.853.951.72510.3
Elex 261.25348.433.817.7
GRID Legends13911879.160.135.8
Elden Ring5857.356.947.927.6
Dying Light 259.44740.126.513
Rainbow Six Extraction116105855426
God of War66.252.43528.318.4
Halo Infinite83.170.366.143.419.7
Farming Simulator 2214812198.972.642.4
Battlefield 204282.770.85829.84.34
Forza Horizon 510090443624
Call of Duty Vanguard72.959.755.842.222
Riders Republic6955503520
Guardians of the Galaxy7472705126
Back 4 Blood14612611574.337.4
Far Cry 689786848
Alan Wake Remastered87.682.665.534.9
FIFA 22224215214203135
New World57.955.9503817.8
Deathloop81.565.657.440.121
F1 2021149120
Monster Hunter Stories 213513411768.2
Days Gone9583.360.743.424.1
Mass Effect Legendary Edition11511096.253.6
Resident Evil Village1059986.452.428.6
Outriders98.983.771.746.631.7
Hitman 311699.39159.231.2
Cyberpunk 2077 1.057.346.639.12410.3
Immortals Fenyx Rising7359554325
Yakuza Like a Dragon76.774.262.941.220.4
Call of Duty Black Ops Cold War82.767.760.339.619.8
Assassin´s Creed Valhalla6649423213
Dirt 574.556.432.52820.4
Watch Dogs Legion81.570.933.123.213
FIFA 21227225214209203136
Star Wars Squadrons23721917216210759.1
Mafia Definitive Edition119776846.623.7
Serious Sam 410369685239.6
Crysis Remastered99.555.141.722.513.4
Flight Simulator 202072.756.9402820.611.6
Horizon Zero Dawn1258373574323
Death Stranding15199.4908759.931.5
F1 2020227143124906537
Valorant249209207197152
Gears Tactics262159966744.921.8
Doom Eternal19714813312580.938.8
Hunt Showdown16689.37147.421.2
Escape from Tarkov12111797.89051.526.2
Red Dead Redemption 210377513225.617.3
Star Wars Jedi Fallen Order9988805627.1
Need for Speed Heat9990836950.327
Call of Duty Modern Warfare 2019179104967858.832.8
GRID 2019192118926351.331.2
Ghost Recon Breakpoint1198273533819
FIFA 20255221211208219138
Borderlands 311992634832.111.8
Control210715233.115.1
F1 2019204149129946843
Total War: Three Kingdoms202.9101.563.946.1
Rage 2169827068
Anno 180094.697724022.213.4
The Division 210180604323
Dirt Rally 2.01411156446.4
Anthem82757149.626.6
Far Cry New Dawn1068884766032
Metro Exodus12269514129.518.5
Apex Legends12610510372.241.3
Just Cause 410273.167.646.425
Darksiders III82.775.172.354.720.5
Battlefield V1111039468.738.3
Farming Simulator 1918214511377.841.1
Hitman 28982.278.154.526.6
Call of Duty Black Ops 41291121056630.8
Assassin´s Creed Odyssey8069533622
Forza Horizon 416113412599
FIFA 19304256248182106
Shadow of the Tomb Raider1228377684624
Strange Brigade302147118101
F1 2018155126806538
Monster Hunter World94.282.465.140.719.7
The Crew 2606059.948.624.1
Far Cry 51179388846031
World of Tanks enCore559247.6119.3
X-Plane 11.111008975
Kingdom Come: Deliverance97.876.857.236.418.3
Final Fantasy XV Benchmark130825924
Fortnite10769.3
Star Wars Battlefront 211095.482.854.727.1
Need for Speed Payback12711310672.737.1
ELEX1139070.445.723.8
Middle-earth: Shadow of War121896928
Playerunknown's Battlegrounds (PUBG)109
Rocket League24824821589.9
Prey14414312744.1
Ghost Recon Wildlands150.687814728.9
For Honor2411271219337.8
Resident Evil 728114712241.1
Dishonored 210084.541.4
Deus Ex Mankind Divided79.44426.6
Mirror's Edge Catalyst10192.433.7
Overwatch22513375.3
Doom14413649.5
Rise of the Tomb Raider169149958138
Rainbow Six Siege20117573.3
World of Warships220.1179.7148.2141.1
Dota 2 Reborn13612712011485
The Witcher 32541761055635
GTA V17116313573
BioShock Infinite304265248136
< 30 fps
< 60 fps
< 120 fps
≥ 120 fps

13
35
42

22
82
42
3
42
78
29
5
55
72
14
12
48
20
5
55
31
6
4

For more games that might be playable and a list of all games and graphics cards visit our Gaming List

v1.26
log 23. 08:07:08

#0 no ids found in url (should be separated by "_") +0s ... 0s

#1 not redirecting to Ajax server +0s ... 0s

#2 did not recreate cache, as it is less than 5 days old! Created at Mon, 22 Apr 2024 05:40:21 +0200 +0.001s ... 0.001s

#3 no comparison url found in template nbc.compare_page_1 needed +0.039s ... 0.041s

#4 no comparison url found in template nbc.compare_page_1 needed +0s ... 0.041s

#5 no comparison url found in template nbc.compare_page_1 needed +0s ... 0.041s

#6 no comparison url found in template nbc.compare_page_1 needed +0s ... 0.041s

#7 no comparison url found in template nbc.compare_page_1 needed +0s ... 0.041s

#8 no comparison url found in template nbc.compare_page_1 needed +0s ... 0.041s

#9 no comparison url found in template nbc.compare_page_1 needed +0s ... 0.042s

#10 no comparison url found in template nbc.compare_page_1 needed +0s ... 0.042s

#11 no comparison url found in template nbc.compare_page_1 needed +0s ... 0.043s

#12 no comparison url found in template nbc.compare_page_1 needed +0s ... 0.043s

#13 composed specs +0s ... 0.043s

#14 did output specs +0s ... 0.043s

#15 start showIntegratedCPUs +0s ... 0.043s

#16 getting avg benchmarks for device 9641 +0.029s ... 0.072s

#17 got single benchmarks 9641 +0.142s ... 0.214s

#18 got avg benchmarks for devices +0s ... 0.214s

#19 min, max, avg, median took s +1.034s ... 1.249s

#20 before gaming benchmark output +0s ... 1.249s

#21 Got 1105 rows for game benchmarks. +0.095s ... 1.344s

#22 composed SQL query for gamebenchmarks +0s ... 1.344s

#23 got data and put it in $dataArray +0.117s ... 1.461s

#24 benchmarks composed for output. +6.621s ... 8.082s

#25 no comparison url found in template nbc.compare_page_1 needed +0.013s ... 8.095s

#26 return log +0s ... 8.095s

Notebook reviews with NVIDIA GeForce GTX 1660 Ti Mobile graphics card

华硕TUF A17 FA706IU Ryzen 7笔记本电脑评测:$1100美元的i9性能

华硕TUF A17 FA706IU Ryzen 7笔记本电脑评测:$1100美元的i9性能

华硕已经从头到尾彻底改造了其TUF系列,并且变化很大。 如果您正在考虑购买较旧的FX705 / FX505系列,请忽略它们,而考虑购买较新的FA706 / FA506系列。...
AMD Ryzen 7 4800H | NVIDIA GeForce GTX 1660 Ti Mobile | 17.30" | 2.6 kg
MSI GF65 9SD笔记本电脑评测:不到1000刀的GTX 1660 Ti笔记本

MSI GF65 9SD笔记本电脑评测:不到1000刀的GTX 1660 Ti笔记本

GF65通过引入新的Nvidia Turing GPU选项,新的显示选项,更强大的散热解决方案和更快的无线网卡,替代了去年的GF63。 窄边框设计保持不变。 ...
Intel Core i7-9750H | NVIDIA GeForce GTX 1660 Ti Mobile | 15.60" | 1.9 kg
Lenovo Legion Y540 15IRH

联想Legion Y540-15IRH笔记本电脑评测:配备GeForce GTX 1660 Ti GPU的出色游戏笔记本电脑

Legion Y540可能更以RTX游戏笔记本电脑而知名,但联想同时也推出了GTX版本,可能更适合预算较低的游戏玩家。GeForce GTX 1660 Ti选项可使价格下降约20%,。 请继续阅读以了解联想是否进行了其他更改以降低价格,以及这款GTX 1660 Ti的游戏笔记本电脑如何与竞争对手抗衡。...
Intel Core i7-9750H | NVIDIA GeForce GTX 1660 Ti Mobile | 15.60" | 2.2 kg
联想Legion Y540-17IRH笔记本电脑评测:一台用尽i5一切的游戏本

联想Legion Y540-17IRH笔记本电脑评测:一台用尽i5一切的游戏本

凭借其酷睿i5-9300H处理器和GeForce GTX 1660 Ti显卡,联想的中端游戏笔记本电脑能够在其17.3英寸哑光屏幕(144 Hz,FHD,IPS)上流畅地运行所有当前的PC游戏。 维护舱口使用户可以轻松地更换RAM和存储。 可以通过BIOS启用默认情况下禁用的iGPU,以延长电池续航。...
Intel Core i5-9300H | NVIDIA GeForce GTX 1660 Ti Mobile | 17.30" | 2.8 kg
技嘉Aorus 15-SA (Core i7-9750H, GTX 1660 Ti, 144 Hz FHD)笔记本电脑评测

技嘉Aorus 15-SA (Core i7-9750H, GTX 1660 Ti, 144 Hz FHD)笔记本电脑评测

Gigabyte Aorus 15-SA凭借其酷睿i7-9750H处理器,GeForce GTX 1660 Ti GPU和16 GB RAM,可以轻松运行所有现代3A游戏。GB NVMe SSD和15.6英寸的144 Hz IPS面板更是锦上添花。 然而,屏幕具有较低的最大亮度,而15-SA的续航时间较短且缺少像Thu...
Intel Core i7-9750H | NVIDIA GeForce GTX 1660 Ti Mobile | 15.60" | 2.1 kg

Medion Erazer Deputy P10-MD62132: Intel Core i5-10300H, 15.60", 2.3 kg
  External Review » Medion Erazer Deputy P10-MD62132

Dell G3 15 3500-WDP8D: Intel Core i7-10750H, 15.60", 2.6 kg
  External Review » Dell G3 15 3500-WDP8D

MSI GS66 Stealth 10SD-614NL: Intel Core i7-10750H, 15.60", 2.1 kg
  External Review » MSI GS66 Stealth 10SD-614NL

Acer Predator Helios 300 PH315-53-70M2: Intel Core i7-10750H, 15.60", 2.3 kg
  External Review » Acer Predator Helios 300 PH315-53-70M2

HP Omen 15-en0006na: AMD Ryzen 7 4800H, 15.60", 2.4 kg
  External Review » HP Omen 15-en0006na

Asus TUF Gaming F15 FX506LU-HN106: Intel Core i7-10870H, 15.60", 2.3 kg
  External Review » Asus TUF Gaming F15 FX506LU-HN106

MSI GP75 Leopard 9SD-822BE: Intel Core i7-9750H, 17.30"
  External Review » MSI GP75 Leopard 9SD-822BE

Acer Nitro 5 AN517-52-79W0: Intel Core i7-10750H, 17.30", 2.2 kg
  External Review » Acer Nitro 5 AN517-52-79W0

HP Omen 15-ek0015ns: Intel Core i7-10750H, 15.60", 2.4 kg
  External Review » HP Omen 15-ek0015ns

MSI GL75 Leopard 10SDR-271NL: Intel Core i7-10750H, 17.30", 2.6 kg
  External Review » MSI GL75 Leopard 10SDR-271NL

Lenovo Legion 5 15ARH05H-82B1000AUS: AMD Ryzen 7 4800H, 15.60", 2.5 kg
  External Review » Lenovo Legion 5 15ARH05H-82B1000AUS

Acer Aspire Nitro 5 AN515-55-74RJ: Intel Core i7-10750H, 15.60"
  External Review » Acer Aspire Nitro 5 AN515-55-74RJ

MSI GF75 Thin 10SDR: Intel Core i7-10750H, 17.30", 2.2 kg
  External Review » MSI GF75 Thin 10SDR

Gigabyte Aorus 5 SB-7UK1131SH : Intel Core i7-10750H, 15.60"
  External Review » Gigabyte Aorus 5 SB-7UK1131SH

Acer Nitro 5 AN517-52-746S: Intel Core i7-10750H, 17.30", 2.2 kg
  External Review » Acer Nitro 5 AN517-52-746S

HP Pavilion Gaming 15-ec1076ax: AMD Ryzen 7 4800H, 15.60", 2.2 kg
  External Review » HP Pavilion Gaming 15-ec1076ax

Asus TUF A17 FX706IU-H7081T: AMD Ryzen 7 4800H, 17.30", 2.6 kg
  External Review » Asus TUF A17 FX706IU-H7081T

Asus TUF A15 FA566IU-HN244T: AMD Ryzen 7 4800H, 15.60", 2.3 kg
  External Review » Asus TUF A15 FA566IU-HN244T

HP Omen 15-en0029nr: AMD Ryzen 7 4800H, 15.60", 2.5 kg
  External Review » HP Omen 15-en0029nr

Asus TUF A17 FX706: AMD Ryzen 7 4800H, 17.30", 2.6 kg
  External Review » Asus TUF A17 FX706

Asus Strix G17 G712LU-H7092T: Intel Core i7-10750H, 17.30", 2.9 kg
  External Review » Asus Strix G17 G712LU-H7092T

Asus ROG Zephyrus M15 GU502LU-BI7N4: Intel Core i7-10750H, 15.60", 2 kg
  External Review » Asus Zephyrus M15 GU502LU-BI7N4

MSI GF65 Thin 10SDR-1022XES: Intel Core i7-10750H, 15.60", 1.9 kg
  External Review » MSI GF65 Thin 10SDR-1022XES

MSI GF65 Thin 9SD-657XES: Intel Core i7-9750H, 15.60", 1.9 kg
  External Review » MSI GF65 Thin 9SD-657XES

Asus Zephyrus G14 GA401IU-HE103T: AMD Ryzen 7 4800HS, 14.00", 1.6 kg
  External Review » Asus Zephyrus G14 GA401IU-HE103T

Asus TUF Gaming A15 FA506IU-HN278: AMD Ryzen 7 4800H, 15.60"
  External Review » Asus TUF A15 FA506IU-HN278

MSI GP75 Leopard 10SDK-023PL: Intel Core i7-10750H, 17.30", 2.6 kg
  External Review » MSI GP75 Leopard 10SDK-023PL

Acer Aspire Nitro 5 AN515-54-53CU: Intel Core i5-9300H, 15.60", 2.5 kg
  External Review » Acer Aspire Nitro 5 AN515-54-53CU

HP Omen 15-ek0456ng: Intel Core i5-10300H, 15.60", 2.1 kg
  External Review » HP Omen 15-ek0456ng

Medion Erazer P15811-i7-1024F16: Intel Core i7-9750H, 15.60", 2.1 kg
  External Review » Medion Erazer P15811-i7-1024F16

Clevo NH55: unknown, 15.60", 2.7 kg
  External Review » Clevo NH55

HP Omen 15-en0263ng: AMD Ryzen 7 4800H, 15.60", 2.4 kg
  External Review » HP Omen 15-en0263ng

Lenovo Legion 5 15IMH05H-81Y60044GE: Intel Core i7-10750H, 15.60", 2.5 kg
  External Review » Lenovo Legion 5 15IMH05H-81Y60044GE

Asus ROG Strix G15 G512LU-HN093: Intel Core i7-10750H, 15.60", 2.3 kg
  External Review » Asus ROG Strix G15 G512LU-HN093

Acer Nitro 7 AN715, i5-10300H: Intel Core i5-10300H, 15.60", 2.5 kg
  External Review » Acer Nitro 7 AN715, i5-10300H

HP Omen 15-ek0071ng: Intel Core i7-10750H, 15.60", 2.4 kg
  External Review » HP Omen 15-ek0071ng

Dell G5 15 5500-FMD52: Intel Core i7-10750H, 15.60", 2.4 kg
  External Review » Dell G5 15 5500-FMD52

Acer Nitro 5 AN517-51-748R: Intel Core i7-9750H, 17.30", 2.7 kg
  External Review » Acer Nitro 5 AN517-51-748R

Acer Predator Triton 300 PT315-52-51U8: Intel Core i5-10300H, 15.60", 2.3 kg
  External Review » Acer Predator Triton 300 PT315-52-51U8

Acer Nitro 5 AN515-55-7800: Intel Core i7-10750H, 15.60", 2.3 kg
  External Review » Acer Nitro 5 AN515-55-7800

Aorus 5 SB-7US1130SH: Intel Core i7-10750H, 15.60", 2.2 kg
  External Review » Aorus 5 SB-7US1130SH

MSI GL65 10SDK-032XES: Intel Core i7-10750H, 15.60", 2.3 kg
  External Review » MSI GL65 10SDK-032XES

MSI GL75 10SDK-041XES: Intel Core i7-10750H, 17.30", 2.6 kg
  External Review » MSI GL75 10SDK-041XES

Asus TUF A17 FA706IU-AS76: AMD Ryzen 7 4800H, 17.30", 2.6 kg
  External Review » Asus TUF A17 FA706IU-AS76

Asus TUF Gaming F15 FX506IU-AL109T: AMD Ryzen 7 4800H, 15.60", 2.3 kg
  External Review » Asus TUF Gaming A15 FX506IU-AL109T

MSI GL75 10SDR-222: Intel Core i7-10750H, 17.30", 2.6 kg
  External Review » MSI GL75 10SDR-222

Asus TUF Gaming F15 FX506IU-BQ225: AMD Ryzen 7 4800H, 15.60", 2.3 kg
  External Review » Asus TUF Gaming A15 FX506IU-BQ225

MSI GL75 9SDK-268XES: Intel Core i7-9750H, 17.30", 2.5 kg
  External Review » MSI GL75 9SDK-268XES

Acer Predator Helios 300 PH315-52-796B: Intel Core i7-9750H, 15.60", 2.4 kg
  External Review » Acer Predator Helios 300 PH315-52-796B

HP Pavilion Gaming 15-ec0012ng: AMD Ryzen 7 3750H, 15.60", 2.3 kg
  External Review » HP Pavilion Gaming 15-ec0012ng

Acer Nitro 5 AN515-54-71P8: Intel Core i7-9750H, 15.60", 2.2 kg
  External Review » Acer Nitro 5 AN515-54-71P8

MSI GL75 9SD-032: Intel Core i7-9750H, 17.30", 2.5 kg
  External Review » MSI GL75 9SD-032

MSI GL65 9SD-007NL: Intel Core i7-9750H, 15.60", 2.3 kg
  External Review » MSI GL65 9SD-007NL

Asus ROG Strix G731GU-H7154: Intel Core i7-9750H, 17.30", 2.9 kg
  External Review » Asus ROG Strix G731GU-H7154

HP Pavilion Gaming 15-dk0760nd: Intel Core i7-9750H, 15.60", 2.3 kg
  External Review » HP Pavilion Gaming 15-dk0760nd

Lenovo Legion Y540-15IRH-81SX004UGE: Intel Core i5-9300H, 15.60", 2.3 kg
  External Review » Lenovo Legion Y540-15IRH-81SX004UGE

Acer Aspire Nitro 5 AN515-54-56MH: Intel Core i5-9300H, 15.60", 2.5 kg
  External Review » Acer Aspire Nitro 5 AN515-54-56MH

Lenovo Legion Y540-15-81SX0034TX: Intel Core i7-9750H, 15.60", 2.3 kg
  External Review » Lenovo Legion Y540-15-81SX0034TX

Acer Aspire Nitro 5 AN515-54-57M8: Intel Core i5-9300H, 15.60", 2.5 kg
  External Review » Acer Aspire Nitro 5 AN515-54-57M8

MSI GF65 10SDR-478 Thin: Intel Core i7-10750H, 15.60", 1.9 kg
  External Review » MSI GF65 10SDR-478 Thin

Asus ROG Strix GL531GU-AL061T: Intel Core i7-9750H, 15.60", 2.4 kg
  External Review » Asus ROG Strix GL531GU-AL061T

Dell G5 15 5590-YWTRF: Intel Core i7-9750H, 15.60", 2.9 kg
  External Review » Dell G5 15 5590-YWTRF

Asus TUF Gaming A15 FA506UI: AMD Ryzen 7 4800H, 15.60", 2.3 kg
  External Review » Asus TUF Gaming A15 FA506UI

Asus ROG Strix G731GU-EV038T: Intel Core i7-9750H, 17.30", 2.9 kg
  External Review » Asus ROG Strix G731GU-EV038T

HP Pavilion Gaming 15-dk0040nf: Intel Core i7-9750H, 15.60", 2.3 kg
  External Review » HP Pavilion Gaming 15-dk0040nf

Asus TUF Gaming A15 FA506, Ryzen 5 4600H: AMD Ryzen 5 4600H, 15.60", 2.3 kg
  External Review » Asus TUF Gaming A15 FA506, Ryzen 5 4600H

Acer Nitro 7 AN715-51-76LS: Intel Core i7-9750H, 15.60", 2.5 kg
  External Review » Acer Nitro 7 AN715-51-76LS

MSI Prestige P75 9SD Creator 625: Intel Core i7-9750H, 17.30", 2.3 kg
  External Review » MSI Prestige P75 9SD Creator 625

Lenovo Legion Y540-17IRH-81Q4002DGE: Intel Core i5-9300H, 17.30", 2.8 kg
  External Review » Lenovo Legion Y540-17IRH-81Q4002DGE

Acer Nitro 5 AN517-51-76B3: Intel Core i7-9750H, 17.30", 2.7 kg
  External Review » Acer Nitro 5 AN517-51-76B3

Razer Blade 15 GTX 1660 Ti: Intel Core i7-9750H, 15.60", 2.1 kg
  External Review » Razer Blade 15 GTX 1660 Ti

MSI GL63 9SD-1041IN: Intel Core i7-9750H, 15.60", 2.3 kg
  External Review » MSI GL63 9SD-1041IN

MSI GF65 Thin 9SD-072XES: Intel Core i7-9750H, 15.60", 0.2 kg
  External Review » MSI GF65 Thin 9SD-072XES

HP Omen 15-dc1036ns: Intel Core i7-9750H, 15.60", 2.3 kg
  External Review » HP Omen 15-dc1036ns

SCHENKER XMG Fusion 15-L19jby: Intel Core i7-9750H, 15.60", 1.9 kg
  External Review » Schenker XMG Fusion 15-L19jby

Asus ROG STRIX G531GU-AL003: Intel Core i7-9750H, 15.60", 2.4 kg
  External Review » Asus ROG STRIX G531GU-AL003

HP Pavilion Gaming 15-ec0022ax: AMD Ryzen 7 3750H, 15.60", 2 kg
  External Review » HP Pavilion Gaming 15-ec0022ax

Acer Predator Helios 300 PH317-53-75B4: Intel Core i7-9750H, 15.60", 3 kg
  External Review » Acer Predator Helios 300 PH317-53-75B4

HP Pavilion Gaming 15-dk0052tx: Intel Core i7-9750H, 15.60", 2.3 kg
  External Review » HP Pavilion Gaming 15-dk0052tx

MSI GL65 9SD-043IT: Intel Core i5-9300H, 15.60", 3 kg
  External Review » MSI GL65 9SD-043IT

Acer Predator Helios 300 PH315-52-52ZM: Intel Core i5-9300H, 15.60", 2.4 kg
  External Review » Acer Predator Helios 300 PH315-52-52ZM

Asus ROG Strix G531GU-AL018: Intel Core i7-9750H, 15.60", 2.4 kg
  External Review » Asus ROG Strix G531GU-AL018

MSI GL63 8SD-269ES: Intel Core i7-8750H, 15.60", 2.2 kg
  External Review » MSI GL63 8SD-269ES

Asus ROG Strix Scar III G731GU-EV044: Intel Core i7-9750H, 17.30", 2.9 kg
  External Review » Asus ROG Strix Scar III G731GU-EV044

MSI GP75 Leopard 9SD: Intel Core i7-9750H, 17.30", 2.6 kg
  External Review » MSI GP75 Leopard 9SD

Acer Predator Helios 300 PH315-52-NH.Q53EA.007: Intel Core i5-9300H, 15.60", 2.5 kg
  External Review » Acer Predator Helios 300 PH315-52-NH.Q53EA.007

Lenovo Legion Y7000 2019-81NSCTO1WW: Intel Core i7-9750H, 15.60", 2.3 kg
  External Review » Lenovo Legion Y7000 2019-81NSCTO1WW

Acer Aspire Nitro 7 AN715-51-70D6: Intel Core i7-9750H, 15.60", 2.7 kg
  External Review » Acer Aspire Nitro 7 AN715-51-70D6

Dell G3 15 3590-cn35907: Intel Core i5-9300H, 15.60", 2.4 kg
  External Review » Dell G3 15 3590-cn35907

HP Omen 15-dh0015ns: Intel Core i7-9750H, 15.60", 2.6 kg
  External Review » HP Omen 15-dh0015ns

Lenovo Legion Y545-15-81Q6CTO1WWENMY0: Intel Core i7-9750H, 15.60", 2.3 kg
  External Review » Lenovo Legion Y545-15-81Q6CTO1WWENMY0

HP Gaming Pavilion 15-dk0205ng: Intel Core i7-9750H, 15.60", 2.3 kg
  External Review » HP Gaming Pavilion 15-dk0205ng

Asus ROG Zephyrus G15 GA502DU-BQ015: AMD Ryzen 7 3750H, 15.60", 2.1 kg
  External Review » Asus ROG Zephyrus G GA502DU-BQ015

Acer Nitro 7 AN715-51-786X: Intel Core i7-9750H, 15.60", 2.7 kg
  External Review » Acer Nitro 7 AN715-51-786X

Dell G3 15 3590-G1DFD: Intel Core i7-9750H, 15.60", 2.3 kg
  External Review » Dell G3 15 3590-G1DFD

Asus ROG Strix G531GU-AL008T: Intel Core i7-9750H, 15.60", 2.4 kg
  External Review » Asus ROG Strix G531GU-AL008T

MSI GL63 8SD-270XES: Intel Core i7-8750H, 15.60", 2.3 kg
  External Review » MSI GL63 8SD-270XES

Acer Predator Helios 300 PH315-52-78VL: Intel Core i7-9750H, 15.60", 2.5 kg
  External Review » Acer Predator Helios 300 PH315-52-78VL

Aorus 15-SA: Intel Core i7-9750H, 15.60", 2.1 kg
  External Review » Aorus 15-SA

Lenovo Legion Y540-15IRH-81SX00B2GE: Intel Core i7-9750H, 15.60", 2.2 kg
  External Review » Lenovo Legion Y540-15IRH-81SX00B2GE

Asus ROG Zephyrus M15 GU502GU-XB74: Intel Core i7-9750H, 15.60", 2 kg
  External Review » Asus Zephyrus M GU502GU-XB74

Asus TUF Gaming FX505DU-AL085T: AMD Ryzen 7 3750H, 15.60", 2.2 kg
  External Review » Asus TUF Gaming FX505DU-AL085T

Acer Nitro 5 AN515-54-72T8: Intel Core i7-9750H, 15.60", 2.7 kg
  External Review » Acer Nitro 5 AN515-54-72T8

Asus TUF FX705DU-AU029T: AMD Ryzen 7 3750H, 17.30", 2.7 kg
  External Review » Asus TUF FX705DU-AU029T

Asus ROG Strix G G531GU-AL061T: Intel Core i7-9750H, 15.60", 2.4 kg
  External Review » Asus ROG Strix G G531GU-AL061T

Asus ROG Strix G G531GU-AL001: Intel Core i7-9750H, 15.60", 2.4 kg
  External Review » Asus ROG Strix G G531GU-AL001

Gigabyte Aorus 7 SA: Intel Core i7-9750H, 17.30", 2.5 kg
  External Review » Gigabyte Aorus 7 SA

MSI GS75 Stealth 9SD-604ES: Intel Core i7-9750H, 17.30", 2.3 kg
  External Review » MSI GS75 Stealth 9SD-604ES

Acer Predator Helios 300 PH315-52-79TY: Intel Core i7-9750H, 15.60", 2.3 kg
  External Review » Acer Predator Helios 300 PH315-52-79TY

Acer Aspire Nitro 5 AN517-51-754T: Intel Core i7-9750H, 17.30", 2.7 kg
  External Review » Acer Aspire Nitro 5 AN517-51-754T

Asus ROG Zephyrus G15 GA502DU-AL025T: AMD Ryzen 7 3750H, 15.60", 2.1 kg
  External Review » Asus Zephyrus G GA502DU-AL025T

Asus TUF FX505DU-BQ045: AMD Ryzen 7 3750H, 15.60", 2.2 kg
  External Review » Asus TUF FX505DU-BQ045

Asus ROG Strix G G731GU-EV032T: Intel Core i7-9750H, 17.30", 2.9 kg
  External Review » Asus ROG Strix G G731GU-EV032T

Lenovo Legion Y540-15IRH-81SX00B2GE: Intel Core i5-9300H, 15.60", 2.3 kg
  External Review » Lenovo Legion Y540-15IRH-81SX00B2GE

MSI GL73 8SD-044ES: Intel Core i7-8750H, 17.30", 2.9 kg
  External Review » MSI GL73 8SD-044ES

HP Pavilion 17-cd0228ng: Intel Core i7-9750H, 17.30", 2.8 kg
  External Review » HP Pavilion 17-cd0228ng

Asus TUF FX705DU-AU053T: AMD Ryzen 7 3750H, 17.30", 2.6 kg
  External Review » Asus TUF FX705DU-AU053T

MSI GL63 8SD-437ID: Intel Core i7-8750H, 15.60", 2.2 kg
  External Review » MSI GL63 8SD-437ID

Asus ROG Zephyrus M15 GU502GU-ES001T : Intel Core i7-9750H, 15.60", 2 kg
  External Review » Asus Zephyrus M GU502GU-ES001T

Asus TUF FX705DU-AU019T: AMD Ryzen 7 3750H, 17.30", 2.6 kg
  External Review » Asus TUF FX705DU-AU019T

Asus TUF FX505DU-MB74: AMD Ryzen 7 3750H, 15.60", 2.2 kg
  External Review » Asus TUF FX505DU-MB74

Gigabyte Aero 15 Classic-SA-F74ADW: Intel Core i7-9750H, 15.60", 2 kg
  External Review » Gigabyte Aero 15 Classic-SA-F74ADW

Acer Aspire Nitro 7 AN715-51-77D0: Intel Core i7-9750H, 15.60", 2.7 kg
  External Review » Acer Aspire Nitro 7 AN715-51-77D0

Acer Aspire Nitro 5 AN515-54-72B7: Intel Core i7-9750H, 15.60", 2.3 kg
  External Review » Acer Aspire Nitro 5 AN515-54-72B7

Please share our article, every link counts!

» Comparison of GPUs
Detailed list of all laptop GPUs sorted by class and performance.

» Benchmark List
Sort and restrict laptop GPUs based on performance in synthetic benchmarks.

» Notebook Gaming List
Playable games for each graphics card and their average FPS results.

Class 1

GeForce RTX 2080 Super Mobile

Class 2

M1 Max 32-Core GPU *
GeForce RTX 2070 Super Mobile
M1 Max 24-Core GPU *
Quadro RTX 5000 Max-Q
Radeon RX 5700M *
GeForce GTX 1080 Mobile
Quadro RTX 4000 (Laptop)
M1 Pro 16-Core GPU *
Radeon PRO W6600M *
GeForce RTX 2070 Super Max-Q
Quadro RTX 4000 Max-Q *
M1 Pro 14-Core GPU *
Quadro P5200
Quadro RTX 3000 Max-Q *
Quadro P4200
Quadro P5000 Max-Q *
GeForce GTX 980 (Laptop)
Quadro P4000
Quadro P4000 Max-Q
Quadro P3200
Radeon RX 580X (Laptop) *
Radeon RX 580 (Laptop)
Radeon Pro 5300M
Radeon RX 5300M
Quadro P3000 Max-Q *
Quadro T2000 Max-Q *
Radeon Pro WX 7100 *
Radeon RX 570X (Laptop) *
Radeon RX 570 (Laptop) *
Radeon RX 470 (Laptop) *
Quadro T1000 Max-Q *

Class 3

Vega M GH
Quadro M5000M
GeForce GTX 1050 Ti Mobile
Radeon 680M
Quadro P2000
Quadro P2000 Max-Q
Quadro M4000M
T500 Laptop GPU *
Radeon R9 M395X
GeForce GTX 1050 Ti Max-Q *
Radeon Pro Vega 16
WX Vega M GL
Radeon R9 M485X
Quadro M3000M
FirePro W7170M
Radeon R9 M395
GeForce GTX 1050 Max-Q *
Radeon 660M
Radeon Pro WX 4150 *
Radeon RX 560X (Laptop)
Radeon RX 560 (Laptop)
Radeon RX 460 (Laptop)
Quadro P1000
Radeon R9 M390
Xe MAX
Radeon Pro 560X
Radeon Pro 560
Radeon Pro 460
Radeon Pro WX 4130 *
GeForce GTX 960M
Quadro P620 *
Radeon RX 550X (Laptop)
Radeon Pro WX 3200 *
Radeon Pro 555X
Radeon Pro 555
Radeon Pro 455
Quadro P600
Quadro M2000M
Radeon RX 540X *
Radeon Pro WX 2100 *
Radeon Pro WX 3100 *
GeForce GTX 950M
Radeon Pro 450
Radeon 630
Radeon 540X *
Radeon R9 M385X
Quadro P520
Quadro M1000M
GeForce 945M
Quadro P500 *
Iris Plus Graphics G7 (Ice Lake 64 EU) *
Vega 10 *
Iris Pro Graphics 580
FirePro W5170M *
Radeon R9 M370X
Vega 9
FirePro W5130M
UHD Graphics Xe G4 48EUs *
UHD Graphics 32EUs
UHD Graphics Xe 32EUs (Tiger Lake-H) *
UHD Graphics 750
Vega 7
Radeon R7 M465
Iris Pro Graphics 6200
Vega 8
GeForce 940M
Iris Plus Graphics G4 (Ice Lake 48 EU)
Quadro M600M
FirePro W4190M
Radeon R9 M375
Radeon R7 M445
Iris Plus Graphics 650
Iris Graphics 550
Radeon 625
Vega 6 *
Iris Plus Graphics 640
Iris Graphics 540
UHD Graphics 24EUs (Alder Lake-N) *
Radeon R7 M360
GeForce 920M
Radeon 620
Radeon R7 M340
Radeon 610
Radeon 610M *
Vega 6 *
UHD Graphics G1 (Ice Lake 32 EU)
UHD Graphics Xe 16EUs (Tiger Lake-H) *
HD Graphics 530
Radeon R5 (Bristol Ridge)
Adreno 690 *
Adreno 685 *
Adreno 680 *
Radeon R5 M330
GeForce 910M
HD Graphics 520

Class 4

UHD Graphics 730
Radeon R5 M320 *
Radeon R5 M315 *
Radeon R5 M420 *
Vega 2 *
UHD Graphics 617
UHD Graphics 615
HD Graphics 515
UHD Graphics 610
HD Graphics 510
UHD Graphics 605
Radeon R4 (Stoney Ridge)
Radeon R2 (Stoney Ridge)
HD Graphics (Broadwell)
UHD Graphics 600
HD Graphics (Braswell)

Class 5

* Approximate position of the graphics adapter

> Notebookcheck中文版(NBC中国) > FAQ / 小提示/ 技术参数 > 移动显示芯片——基准测试成绩列表 > NVIDIA GeForce GTX 1660 Ti (Laptop)
Klaus Hinum (Update: 2020-01-22)