Notebookcheck Logo

Intel UHD Graphics 630

Intel UHD Graphics 630

英特尔UHD Graphics 630(GT2)是一个集成显卡,可以在各种Coffee-Lake代台式机和笔记本处理器中找到。GT2 "版本的GPU提供24个执行单元(EUs),时钟取决于CPU型号。由于缺乏专用的图形存储器或eDRAM缓存,UHD 630必须访问主存储器(2个64位DDR3L-1600 / DDR4-2133)。与旧的HD Graphics 630(Kaby-Lake)相比,新的UHD GPU是相同的,但时钟可以略高。

性能表现

UHD Graphics 630的确切性能取决于各种因素,如TDP、L3 Cache、内存(DDR3/DDR4)和特定型号的最大时钟频率。然而,它应该与HD Graphics 530和HD Graphics 630相当相似,因此只适合于要求不高的游戏,如《守望先锋》或《模拟农场2017》(低细节)。

特点

UHD 630的功能与HD 630相同,因此硬件上支持H.265/HEVC Main10 10位色深配置文件。此外,所有芯片都支持HDCP 2.2,例如,允许Netflix 4K视频。然而,HDMI 2.0仍然只能通过外部转换芯片(LSPCon)来支持。

电源消耗

UHD Graphics 630可以在不同TDP等级(35 - 91 W)的多个笔记本和台式机处理器中找到。

Gen. 9.5 Series

Iris Plus Graphics 655 48 @ 0.3 - 1.2 GHz
Iris Plus Graphics 650 48 @ 0.3 - 1.1 GHz64/128 Bit
Iris Plus Graphics 645 48 @ 0.3 - 1.15 GHz
Iris Plus Graphics 640 48 @ 0.3 - 1.05 GHz64/128 Bit
UHD Graphics 630 24 @ 0.3 - 1.15 GHz64/128 Bit
UHD Graphics P630 24 @ 0.3 - 1.2 GHz64/128 Bit
HD Graphics 630 24 @ 0.3 - 1.15 GHz64/128 Bit
HD Graphics P630 24 64/128 Bit
UHD Graphics 620 24 @ 0.3 - 1.15 GHz
HD Graphics 620 24 @ 0.3 - 1.05 GHz64/128 Bit
UHD Graphics 617 24 @ 0.3 - 1.15 GHz64/128 Bit
UHD Graphics 615 24 @ 0.3 - 1 GHz64/128 Bit
HD Graphics 615 24 @ 0.3 - 1.05 GHz64/128 Bit
CodenameKaby-Lake-H-GT2
ArchitectureGen. 9.5
Pipelines24 - unified
Core Speed300 - 1150 (Boost) MHz
Memory Bus Width64/128 Bit
Shared Memoryyes
APIDirectX 12_1, OpenGL 4.4
technology14 nm
FeaturesQuickSync
Date of Announcement01.10.2017
CPU in UHD Graphics 630GPU Base SpeedGPU Boost / Turbo
Intel Core i9-10900K10 x 3700 MHz, 125 W350 MHz1200 MHz
Intel Core i9-10850K10 x 3600 MHz, 125 W? MHz? MHz
Intel Core i9-1091010 x 3600 MHz, 125 W? MHz? MHz
min. - max.350 MHz1000 - 1250 MHz

Benchmarks

Performance Rating - 3DMark 11 + Fire Strike + Time Spy
0.6 pt (2%)
AMD Radeon HD 8180
0.06605 -88%
...
NVIDIA GeForce 920M
0.529 -4%
0.532 -4%
0.534 -3%
0.536 -3%
Intel UHD Graphics 24EUs (Alder Lake-N)
0.539 -2%
0.546 -1%
Intel UHD Graphics Xe 16EUs (Tiger Lake-H)
0.548 -1%
AMD Radeon R7 M340
0.551 0%
0.551 0%
Intel UHD Graphics 630
0.552
NVIDIA GeForce GT 640M
0.558 1%
AMD Radeon R7 M270
0.573 4%
0.581 5%
AMD Radeon R5 (Bristol Ridge)
0.585 6%
0.59 7%
AMD Radeon HD 8550G + HD 8750M Dual Graphics
0.594 8%
0.601 9%
0.609 10%
NVIDIA Quadro K1100M
0.611 11%
...
21.1 3722%
max:
33.3 5933%
0%
100%
3DMark - 3DMark Time Spy Score
min: 425     avg: 474.5     median: 479.5 (1%)     max: 534 Points
3DMark - 3DMark Time Spy Graphics
min: 367     avg: 409.5     median: 414.5 (1%)     max: 459 Points
Intel UHD Graphics 605
113 -72%
...
343.7 -16%
Intel UHD Graphics Xe 16EUs (Tiger Lake-H)
344.7 -16%
349 -15%
Intel HD Graphics 630
368 -10%
371.8 -9%
377 -8%
381 -7%
389.1 -5%
397 -3%
Intel UHD Graphics 630
409.5
AMD Radeon R7 M360
410 0%
417 2%
Intel UHD Graphics G1 (Ice Lake 32 EU)
419.6 2%
Intel Iris Plus Graphics 640
442.5 8%
450.5 10%
452.3 10%
AMD Radeon 610M
458.3 12%
AMD Radeon R7 M445
471 15%
493 20%
...
19434 4646%
max:
36485 8810%
0%
100%
3DMark - 3DMark Ice Storm Unlimited Graphics
min: 37815     avg: 97120     median: 106362 (12%)     max: 122355 Points
3DMark - 3DMark Ice Storm Extreme Graphics
min: 19075     avg: 40640     median: 45176 (6%)     max: 48377 Points
3DMark - 3DMark Cloud Gate Score
min: 3712     avg: 9196     median: 9545 (10%)     max: 11286 Points
3DMark - 3DMark Cloud Gate Graphics
min: 3863     avg: 9333     median: 9798 (3%)     max: 11199 Points
3DMark - 3DMark Fire Strike Standard Score
min: 779     avg: 1143     median: 1115 (2%)     max: 1355 Points
3DMark - 3DMark Fire Strike Standard Graphics
min: 722     avg: 1228     median: 1211 (1%)     max: 1472 Points
3DMark - 3DMark Ice Storm Graphics
min: 43334     avg: 63184     median: 68228 (8%)     max: 74772 Points
3DMark - 3DMark Wild Life Unlimited
3195 Points (2%)
3DMark - 3DMark Wild Life Extreme Unlimited
882 Points (1%)
3DMark - 3DMark Night Raid
6929 Points (7%)
3DMark - 3DMark Night Raid Graphics Score
6446 Points (2%)
3DMark 11 - 3DM11 Performance Score
min: 790     avg: 1990     median: 2030 (3%)     max: 2326 Points
3DMark 11 - 3DM11 Performance GPU
min: 642     avg: 1742     median: 1789.5 (2%)     max: 2025 Points
171.8 -90%
...
Intel HD Graphics 630
1696 -3%
NVIDIA GeForce GT 735M
1703 -2%
AMD Radeon R5 (Bristol Ridge)
1708 -2%
NVIDIA GeForce GT 640M
1708 -2%
AMD Radeon R5 (Carrizo)
1711 -2%
NVIDIA GeForce 920M
1711 -2%
AMD FirePro M4100
1728 -1%
1734 0%
1741 0%
Intel UHD Graphics 630
1742
1749 0%
1749 0%
1757 1%
AMD Radeon R5 M335
1784 2%
1792 3%
AMD Radeon R7 (Carrizo)
1793 3%
1807 4%
NVIDIA Quadro K1100M
1819 4%
1823 5%
...
59943 3341%
max:
106023 5986%
0%
100%
3DMark Vantage
3DM Vant. Perf. total +
3DMark Vantage - 3DM Vant. Perf. total
7704 Points (2%)
3DM Vant. Perf. GPU no PhysX +
3DMark Vantage - 3DM Vant. Perf. GPU no PhysX
6111 Points (3%)
ATI Radeon HD 3200
62 -99%
...
5948 -3%
5957 -3%
AMD Radeon HD 8550G + HD 8750M Dual Graphics
5961 -2%
5977 -2%
5987 -2%
NVIDIA GeForce 8800M GTX SLI
5995 -2%
AMD Radeon R7 M445
6000 -2%
AMD Radeon R7 M270
6027 -1%
AMD Radeon 610M
6032 -1%
Intel UHD Graphics 630
6111
ATI Mobility Radeon HD 4870
6139 0%
Intel HD Graphics 630
6208 2%
NVIDIA GeForce 9800M GTS SLI
6327 4%
6414 5%
6451 6%
ATI Mobility Radeon HD 3870 X2
6498 6%
6557 7%
NVIDIA GeForce GT 640M
6578 8%
6661 9%
...
132443 2067%
max:
170928 2697%
0%
100%
3DMark 06 3DMark 06 - Standard 1280x1024 +
3DMark 06
min: 11920     avg: 13425     median: 13216.5 (17%)     max: 15020 Points
Unigine Valley 1.0 - Unigine Valley 1.0 DX
min: 5.7     avg: 6.1     median: 6.1 (2%)     max: 6.4 fps
Unigine Heaven 3.0 - Unigine Heaven 3.0 DX 11
18.9 fps (6%)
SPECviewperf 12
specvp12 sw-03 +
SPECviewperf 12 - specvp12 sw-03
min: 28.56     avg: 28.8     median: 28.8 (7%)     max: 29.03 fps
specvp12 snx-02 +
SPECviewperf 12 - specvp12 snx-02
min: 3.14     avg: 3.3     median: 3.3 (0%)     max: 3.37 fps
specvp12 showcase-01 +
SPECviewperf 12 - specvp12 showcase-01
min: 7.98     avg: 8.2     median: 8.2 (2%)     max: 8.38 fps
specvp12 mediacal-01 +
SPECviewperf 12 - specvp12 mediacal-01
min: 2.96     avg: 3.1     median: 3.1 (1%)     max: 3.32 fps
specvp12 maya-04 +
SPECviewperf 12 - specvp12 maya-04
min: 14.66     avg: 15.2     median: 15.2 (4%)     max: 15.67 fps
specvp12 energy-01 +
SPECviewperf 12 - specvp12 energy-01
min: 0.29     avg: 0.3     median: 0.3 (0%)     max: 0.32 fps
specvp12 creo-01 +
SPECviewperf 12 - specvp12 creo-01
min: 13.57     avg: 14     median: 14 (6%)     max: 14.51 fps
specvp12 catia-04 +
SPECviewperf 12 - specvp12 catia-04
min: 15.36     avg: 16     median: 16 (3%)     max: 16.61 fps
specvp12 3dsmax-05 +
SPECviewperf 12 - specvp12 3dsmax-05
min: 11.27     avg: 12.6     median: 12.6 (2%)     max: 14 fps
SPECviewperf 13 specvp13 sw-04 +
SPECviewperf 13 - specvp13 sw-04
min: 35.74     avg: 36.9     median: 36.9 (10%)     max: 37.96 fps
specvp13 snx-03 +
SPECviewperf 13 - specvp13 snx-03
min: 5.64     avg: 5.9     median: 5.9 (1%)     max: 6.07 fps
specvp13 showcase-02 +
SPECviewperf 13 - specvp13 showcase-02
min: 7.91     avg: 8.1     median: 8.1 (2%)     max: 8.34 fps
specvp13 medical-02 +
SPECviewperf 13 - specvp13 medical-02
min: 2.13     avg: 2.2     median: 2.2 (0%)     max: 2.28 fps
specvp13 maya-05 +
SPECviewperf 13 - specvp13 maya-05
min: 21.35     avg: 22.2     median: 22.2 (3%)     max: 23.03 fps
specvp13 energy-02 +
SPECviewperf 13 - specvp13 energy-02
0.8 fps (0%)
specvp13 creo-02 +
SPECviewperf 13 - specvp13 creo-02
min: 17.54     avg: 18.2     median: 18.2 (3%)     max: 18.83 fps
specvp13 catia-05 +
SPECviewperf 13 - specvp13 catia-05
min: 21.7     avg: 22.5     median: 22.5 (3%)     max: 23.36 fps
specvp13 3dsmax-06 +
SPECviewperf 13 - specvp13 3dsmax-06
min: 14     avg: 14.5     median: 14.5 (3%)     max: 14.98 fps
Cinebench R10 Cinebench R10 Shading (32bit) +
Cinebench R10 - Cinebench R10 Shading (32bit)
min: 6430     avg: 8573     median: 8578 (6%)     max: 10435 points
Cinebench R11.5 Cinebench R11.5 OpenGL 64 Bit +
Cinebench R11.5 - Cinebench R11.5 OpenGL 64 Bit
min: 42.77     avg: 46.8     median: 46.9 (16%)     max: 50.6 fps
Cinebench R15
Cinebench R15 OpenGL 64 Bit +
Cinebench R15 - Cinebench R15 OpenGL 64 Bit
min: 17     avg: 52.2     median: 54.5 (3%)     max: 63.1 fps
Cinebench R15 OpenGL Ref. Match 64 Bit +
Cinebench R15 - Cinebench R15 OpenGL Ref. Match 64 Bit
min: 97.8     avg: 97.8     median: 97.8 (98%)     max: 98 %
Basemark GPU 1.2 - Basemark GPU 1.2 Vulkan Official Medium Offscreen 1080
105 fps (1%)
Geekbench 6.2 - Geekbench 6.2 GPU OpenCL
5449 points (2%)
Geekbench 6.2 - Geekbench 6.2 GPU Vulkan
5749 points (2%)
LuxMark v2.0 64Bit - LuxMark v2.0 Room GPU
363 Samples/s (2%)
LuxMark v2.0 64Bit - LuxMark v2.0 Sala GPU
696 Samples/s (1%)
ComputeMark v2.1 - ComputeMark v2.1 Result
894 points (1%)
Power Consumption - Furmark Stress Test Power Consumption - external Monitor *
min: 35.2     avg: 50.7     median: 54.9 (8%)     max: 61.9 Watt
0102030405060708090100110Tooltip
- Range of benchmark values for this graphics card
- Average benchmark values for this graphics card
* Smaller numbers mean a higher performance

Game Benchmarks

The following benchmarks stem from our benchmarks of review laptops. The performance depends on the used graphics memory, clock rate, processor, system settings, drivers, and operating systems. So the results don't have to be representative for all laptops with this GPU. For detailed information on the benchmark results, click on the fps number.

Palworld

Palworld

2024
low 1920x1080
6  fps    + Compare + 📈 Graph
» The benchmarks indicate that the game is not playable in the tested settings.
Additional Benchmarks
Very Low Preset 1280x720
12.3
Prince of Persia The Lost Crown

Prince of Persia The Lost Crown

2024
med. 1920x1080
42.7  fps    + Compare + 📈 Graph
high 1920x1080
22.4  fps    + Compare + 📈 Graph
ultra 1920x1080
22.1  fps    + Compare + 📈 Graph
» With all tested laptops playable in detail settings med..
Ready or Not

Ready or Not

2023
low 1920x1080
11.7  fps    + Compare + 📈 Graph
» The benchmarks indicate that the game is not playable in the tested settings.
Total War Pharaoh

Total War Pharaoh

2023
low 1920x1080
16.4  fps    + Compare
» The benchmarks indicate that the game is not playable in the tested settings.
Additional Benchmarks
Low Preset 1280x720
29.8
EA Sports FC 24

EA Sports FC 24

2023
low 1920x1080
13.1  fps    + Compare + 📈 Graph
» The benchmarks indicate that the game is not playable in the tested settings.
Additional Benchmarks
Low Preset 1280x720
24
Counter-Strike 2

Counter-Strike 2

2023
low 1920x1080
27.3  fps    + Compare + 📈 Graph
med. 1920x1080
19.3  fps    + Compare + 📈 Graph
high 1920x1080
8.6  fps    + Compare + 📈 Graph
» The benchmarks indicate that the game is not playable in the tested settings.
Additional Benchmarks
Low Preset 1280x720
43.1
Cyberpunk 2077 2.0 Phantom Liberty

Cyberpunk 2077 2.0 Phantom Liberty

2023
low 1920x1080
4.9  fps    + Compare
» The benchmarks indicate that the game is not playable in the tested settings.
Additional Benchmarks
Low Preset (FSR off) 1280x720
8.6
Steam Deck 1280x720
10.1
low 1920x1080
9.8  fps    + Compare + 📈 Graph
» The benchmarks indicate that the game is not playable in the tested settings.
Additional Benchmarks
Low Preset 1280x720
16.5
low 1920x1080
4.9  fps    + Compare + 📈 Graph
» The benchmarks indicate that the game is not playable in the tested settings.
Additional Benchmarks
Low Preset 1280x720
9.4
low 1920x1080
3.8  fps    + Compare + 📈 Graph
» The benchmarks indicate that the game is not playable in the tested settings.
Additional Benchmarks
Very Low Preset 1280x720
5.3
5.7
Diablo 4

Diablo 4

2023
low 1920x1080
9.8  fps    + Compare + 📈 Graph
» The benchmarks indicate that the game is not playable in the tested settings.
Additional Benchmarks
Low Preset 1280x720
17.4
Dead Island 2

Dead Island 2

2023
low 1920x1080
8.8  fps    + Compare + 📈 Graph
» The benchmarks indicate that the game is not playable in the tested settings.
Additional Benchmarks
Low Preset Low TAA 1280x720
18.9
low 1920x1080
2.6  fps    + Compare + 📈 Graph
» The benchmarks indicate that the game is not playable in the tested settings.
Additional Benchmarks
Prioritize Performance Preset 1280x720
4.5
low 1920x1080
8  fps    + Compare + 📈 Graph
» The benchmarks indicate that the game is not playable in the tested settings.
Additional Benchmarks
Low Preset 1280x720
13
low 1920x1080
5.3  fps    + Compare + 📈 Graph
» The benchmarks indicate that the game is not playable in the tested settings.
Additional Benchmarks
Low Preset Low TAA 1280x720
8.7
low 1920x1080
10.8  fps    + Compare + 📈 Graph
» The benchmarks indicate that the game is not playable in the tested settings.
Additional Benchmarks
Low Preset 1280x720
17
low 1920x1080
6.9  fps    + Compare
» The benchmarks indicate that the game is not playable in the tested settings.
Additional Benchmarks
Low Preset (without FSR Upscaling) 1280x720
11.9
low 1920x1080
6.7 (!)  fps    + Compare + 📈 Graph
» The benchmarks indicate that the game is not playable in the tested settings.
Additional Benchmarks
Low Preset 1280x720
9.7
10.9 (!)
low 1920x1080
4.6  fps    + Compare + 📈 Graph
» The benchmarks indicate that the game is not playable in the tested settings.
Additional Benchmarks
Low Preset 1280x720
5.9
FIFA 23

FIFA 23

2022
low 1920x1080
14.3  fps    + Compare + 📈 Graph
» The benchmarks indicate that the game is not playable in the tested settings.
Additional Benchmarks
Low Rendering Quality 1280x720
25.8
11.1
low 1920x1080
16.6  fps    + Compare + 📈 Graph
med. 1920x1080
10.7  fps    + Compare + 📈 Graph
high 1920x1080
8.4  fps    + Compare + 📈 Graph
» The benchmarks indicate that the game is not playable in the tested settings.
Additional Benchmarks
Low Preset 1280x720
28.8
low 1920x1080
8  fps    + Compare
» The benchmarks indicate that the game is not playable in the tested settings.
Additional Benchmarks
Lowest Preset (DX12) 1280x720
16
low 1920x1080
4.9  fps    + Compare
» The benchmarks indicate that the game is not playable in the tested settings.
Additional Benchmarks
Low Preset 1280x720
8.5
low 1920x1080
22  fps    + Compare
med. 1920x1080
16.2  fps    + Compare
high 1920x1080
12.8  fps    + Compare
» The benchmarks indicate that the game is not playable in the tested settings.
Additional Benchmarks
Low Preset 1280x720
31.1
low 1920x1080
10  fps    + Compare
» The benchmarks indicate that the game is not playable in the tested settings.
Additional Benchmarks
Ultra Low Preset (with Fixed Resolution Quality) 1280x720
17
low 1280x720
40.5  fps    + Compare + 📈 Graph
» With all tested laptops playable in detail settings low.
low 1280x720
18  fps    + Compare
» The benchmarks indicate that the game is not playable in the tested settings.
Additional Benchmarks
Low Preset 1920x1080
10
low 1280x720
10  fps    + Compare
» The benchmarks indicate that the game is not playable in the tested settings.
Additional Benchmarks
Low Preset 1920x1080
7
low 1280x720
21.3  fps    + Compare + 📈 Graph
med. 1920x1080
8.7  fps    + Compare + 📈 Graph
» The benchmarks indicate that the game is not playable in the tested settings.
Additional Benchmarks
Low Preset (DX12) 1920x1080
12.7
low 1280x720
21.6  fps    + Compare + 📈 Graph
» The benchmarks indicate that the game is not playable in the tested settings.
Additional Benchmarks
Low Preset 1920x1080
11.5
Days Gone

Days Gone

2021
low 1280x720
11.8  fps    + Compare + 📈 Graph
» The benchmarks indicate that the game is not playable in the tested settings.
Additional Benchmarks
Low Preset 1920x1080
7.9
low 1280x720
38.5  fps    + Compare + 📈 Graph
ultra 1920x1080
16.1  fps    + Compare + 📈 Graph
QHD 2560x1440
9.6  fps    + Compare + 📈 Graph
» With all tested laptops playable in detail settings low.
Outriders

Outriders

2021
low 1280x720
20.7  fps    + Compare + 📈 Graph
med. 1920x1080
13.2  fps    + Compare + 📈 Graph
» The benchmarks indicate that the game is not playable in the tested settings.
Additional Benchmarks
Low Preset 1920x1080
14.5
Hitman 3

Hitman 3

2021
low 1280x720
21.8  fps    + Compare
med. 1920x1080
8  fps    + Compare
» The benchmarks indicate that the game is not playable in the tested settings.
Additional Benchmarks
Minimum Settings 1920x1080
11.8
low 1280x720
16  fps    + Compare + 📈 Graph
med. 1920x1080
5.7  fps    + Compare + 📈 Graph
» The benchmarks indicate that the game is not playable in the tested settings.
FIFA 21

FIFA 21

2020
low 1280x720
59.1  fps    + Compare + 📈 Graph
med. 1920x1080
29.8  fps    + Compare + 📈 Graph
high 1920x1080
27.5  fps    + Compare + 📈 Graph
» With all tested laptops playable in detail settings low.
low 1280x720
11.9  fps    + Compare + 📈 Graph
» The benchmarks indicate that the game is not playable in the tested settings.
low 1280x720
31.9  fps    + Compare + 📈 Graph
med. 1920x1080
7  fps    + Compare + 📈 Graph
» The benchmarks indicate that the game is not playable in the tested settings.
low 1280x720
21.6  fps    + Compare + 📈 Graph
med. 1920x1080
4.9  fps    + Compare + 📈 Graph
» The benchmarks indicate that the game is not playable in the tested settings.
low 1280x720
11.7  fps    + Compare + 📈 Graph
» The benchmarks indicate that the game is not playable in the tested settings.
low 1280x720
13.7  fps    + Compare + 📈 Graph
med. 1920x1080
7.8  fps    + Compare + 📈 Graph
» The benchmarks indicate that the game is not playable in the tested settings.
F1 2020

F1 2020

2020
low 1280x720
23  fps    + Compare
med. 1920x1080
12  fps    + Compare
» The benchmarks indicate that the game is not playable in the tested settings.
low 1280x720
38.1   fps    + Compare
med. 1920x1080
13.2  fps    + Compare
high 1920x1080
7.5  fps    + Compare
ultra 1920x1080
5.4  fps    + Compare
» With all tested laptops playable in detail settings low.
low 1280x720
16.8  fps    + Compare + 📈 Graph
med. 1920x1080
8.4  fps    + Compare + 📈 Graph
» The benchmarks indicate that the game is not playable in the tested settings.
low 1280x720
17.3  fps    + Compare
» The benchmarks indicate that the game is not playable in the tested settings.
low 1280x720
13.4  fps    + Compare
med. 1920x1080
7.4  fps    + Compare
» The benchmarks indicate that the game is not playable in the tested settings.
med. 1920x1080
9  fps    + Compare + 📈 Graph
high 1920x1080
7.5  fps    + Compare + 📈 Graph
» The benchmarks indicate that the game is not playable in the tested settings.
FIFA 20

FIFA 20

2019
low 1280x720
73.7  fps    + Compare
med. 1920x1080
37.4  fps    + Compare
high 1920x1080
34.4  fps    + Compare
ultra 1920x1080
27  fps    + Compare
» With all tested laptops playable in detail settings med..
low 1280x720
17.8  fps    + Compare
med. 1920x1080
6.8  fps    + Compare
» The benchmarks indicate that the game is not playable in the tested settings.
Control

Control

2019
low 1280x720
16.2  fps    + Compare
» The benchmarks indicate that the game is not playable in the tested settings.
F1 2019

F1 2019

2019
low 1280x720
35  fps    + Compare
med. 1920x1080
13  fps    + Compare
» The benchmarks indicate that the game is not playable in the tested settings.
low 1280x720
177.9  fps    + Compare
med. 1920x1080
149.2  fps    + Compare
high 1920x1080
111.4  fps    + Compare
ultra 1920x1080
103.7  fps    + Compare
» With all tested laptops playable in detail settings ultra.
low 1280x720
43.2  fps    + Compare
med. 1920x1080
12.4  fps    + Compare
» With all tested laptops playable in detail settings low.
Rage 2

Rage 2

2019
low 1280x720
16.6  fps    + Compare
» The benchmarks indicate that the game is not playable in the tested settings.
low 1280x720
23  fps    + Compare
med. 1920x1080
9  fps    + Compare
» The benchmarks indicate that the game is not playable in the tested settings.
low 1280x720
52.1  fps    + Compare
med. 1920x1080
16  fps    + Compare
» With all tested laptops playable in detail settings low.
Anthem

Anthem

2019
low 1280x720
12.9  fps    + Compare
» The benchmarks indicate that the game is not playable in the tested settings.
low 1280x720
17  fps    + Compare
med. 1920x1080
8  fps    + Compare
» The benchmarks indicate that the game is not playable in the tested settings.
low 1280x720
15.4  fps    + Compare
med. 1920x1080
7.6  fps    + Compare
» The benchmarks indicate that the game is not playable in the tested settings.
low 1280x720
35.1  fps    + Compare
med. 1920x1080
13.1  fps    + Compare
» With all tested laptops playable in detail settings low.
low 1280x720
15.5  fps    + Compare
med. 1920x1080
8.9  fps    + Compare
» The benchmarks indicate that the game is not playable in the tested settings.
low 1280x720
22.6  fps    + Compare
» The benchmarks indicate that the game is not playable in the tested settings.
low 1280x720
71.1  fps    + Compare
med. 1920x1080
23.9  fps    + Compare
high 1920x1080
11.3  fps    + Compare
» With all tested laptops playable in detail settings low.
low 1280x720
16.7  fps    + Compare
med. 1920x1080
8.1  fps    + Compare
» The benchmarks indicate that the game is not playable in the tested settings.
Hitman 2

Hitman 2

2018
low 1280x720
12.8  fps    + Compare
med. 1920x1080
7.5  fps    + Compare
» The benchmarks indicate that the game is not playable in the tested settings.
low 1280x720
25.9  fps    + Compare
med. 1920x1080
9.7  fps    + Compare
» The benchmarks indicate that the game is not playable in the tested settings.
low 1280x720
11  fps    + Compare
med. 1920x1080
7  fps    + Compare
» The benchmarks indicate that the game is not playable in the tested settings.
FIFA 19

FIFA 19

2018
low 1280x720
57.1  fps    + Compare
med. 1920x1080
29.9  fps    + Compare
high 1920x1080
27.2  fps    + Compare
» With all tested laptops playable in detail settings low.
low 1280x720
17  fps    + Compare
med. 1920x1080
6  fps    + Compare
» The benchmarks indicate that the game is not playable in the tested settings.
Strange Brigade

Strange Brigade

2018
low 1280x720
31.1 31.3 ~ 31 fps    + Compare
med. 1920x1080
12.6 14.1 ~ 13 fps    + Compare
high 1920x1080
12.3  fps    + Compare
ultra 1920x1080
10.9  fps    + Compare
» The benchmarks indicate that the game is not playable in the tested settings.
F1 2018

F1 2018

2018
low 1280x720
35  fps    + Compare
med. 1920x1080
16  fps    + Compare
» The benchmarks indicate that the game is not playable in the tested settings.
low 1280x720
20.3  fps    + Compare
med. 1920x1080
7.7  fps    + Compare
» The benchmarks indicate that the game is not playable in the tested settings.
low 1280x720
16.6  fps    + Compare
med. 1920x1080
6.8  fps    + Compare
» The benchmarks indicate that the game is not playable in the tested settings.
Far Cry 5

Far Cry 5

2018
low 1280x720
13 14 15 ~ 14 fps    + Compare
med. 1920x1080
6  fps    + Compare
» The benchmarks indicate that the game is not playable in the tested settings.
World of Tanks enCore

World of Tanks enCore

2018
low 1366x768
207.9  fps    + Compare
med. 1920x1080
25.2  fps    + Compare
ultra 1920x1080
9.6  fps    + Compare
» With all tested laptops playable in detail settings low.
low 1280x720
11.6 12.7 14.3 14.8 17.6 22.4 24.5 29.7 31.3 31.3 ~ 21 fps    + Compare
med. 1920x1080
10.7 11 11.2 12.2 14.3 14.9 15.1 18.9 20.1 20.1 ~ 15 fps    + Compare
high 1920x1080
10.3 11 11 12.1 12.8 13.3 13.3 17.2 18.3 18.3 ~ 14 fps    + Compare
4K 3840x2160
7  fps    + Compare
» The benchmarks indicate that the game is not playable in the tested settings.
low 1280x720
16.9  fps    + Compare
med. 1920x1080
6.9  fps    + Compare
» The benchmarks indicate that the game is not playable in the tested settings.
low 1280x720
9.5 11.3 14 ~ 12 fps    + Compare
med. 1920x1080
4.8  fps    + Compare
» The benchmarks indicate that the game is not playable in the tested settings.
low 1280x720
19.9  fps    + Compare
med. 1920x1080
6.5  fps    + Compare
» The benchmarks indicate that the game is not playable in the tested settings.
low 1280x720
19.3  fps    + Compare
med. 1920x1080
8.9  fps    + Compare
» The benchmarks indicate that the game is not playable in the tested settings.
low 1280x720
29.8  fps    + Compare
med. 1920x1080
17.4  fps    + Compare
» The benchmarks indicate that the game is not playable in the tested settings.
low 1280x720
17.7  fps    + Compare
med. 1920x1080
9.1  fps    + Compare
» The benchmarks indicate that the game is not playable in the tested settings.
low 1280x720
10  fps    + Compare
med. 1920x1080
7  fps    + Compare
» The benchmarks indicate that the game is not playable in the tested settings.
Destiny 2

Destiny 2

2017
low 1280x720
17  fps    + Compare
med. 1920x1080
9.2  fps    + Compare
» The benchmarks indicate that the game is not playable in the tested settings.
ELEX

ELEX

2017
low 1280x720
14.5  fps    + Compare
med. 1920x1080
6.8  fps    + Compare
» The benchmarks indicate that the game is not playable in the tested settings.
low 1280x720
11.4  fps    + Compare
med. 1920x1080
6.1  fps    + Compare
» The benchmarks indicate that the game is not playable in the tested settings.
low 1280x720
20  fps    + Compare
med. 1920x1080
12  fps    + Compare
» The benchmarks indicate that the game is not playable in the tested settings.
FIFA 18

FIFA 18

2017
low 1280x720
67.3 82 ~ 75 fps    + Compare
med. 1920x1080
39.4 44 ~ 42 fps    + Compare
high 1920x1080
30.9 33.7 ~ 32 fps    + Compare
ultra 1920x1080
25.1 28.8 ~ 27 fps    + Compare
» With all tested laptops playable in detail settings med..
F1 2017

F1 2017

2017
low 1280x720
36 41 ~ 39 fps    + Compare
» With all tested laptops playable in detail settings low.
low 1280x720
24.9  fps    + Compare
» The benchmarks indicate that the game is not playable in the tested settings.
low 1280x720
113  fps    + Compare
med. 1366x768
88 97 ~ 93 fps    + Compare
high 1920x1080
51.6 (!)  fps    + Compare
ultra 1920x1080
26 (!)  fps    + Compare
» With all tested laptops playable in detail settings high.
Dirt 4

Dirt 4

2017
low 1280x720
52  fps    + Compare
med. 1920x1080
13.8  fps    + Compare
» With all tested laptops playable in detail settings low.
low 1280x720
67.8  fps    + Compare
med. 1920x1080
38.6  fps    + Compare
high 1920x1080
24.9 27.9 ~ 26 fps    + Compare
» With all tested laptops playable in detail settings med..
Prey

Prey

2017
low 1280x720
28.9  fps    + Compare
med. 1920x1080
11.3  fps    + Compare
» The benchmarks indicate that the game is not playable in the tested settings.
low 1280x720
43.7  fps    + Compare
» With all tested laptops playable in detail settings low.
low 1280x720
18.3  fps    + Compare
» The benchmarks indicate that the game is not playable in the tested settings.
low 1280x720
19.1  fps    + Compare
» The benchmarks indicate that the game is not playable in the tested settings.
For Honor

For Honor

2017
low 1280x720
30.7  fps    + Compare
med. 1920x1080
11.6  fps    + Compare
» The benchmarks indicate that the game is not playable in the tested settings.
low 1280x720
29.5  fps    + Compare
med. 1920x1080
12.6  fps    + Compare
» The benchmarks indicate that the game is not playable in the tested settings.
low 1280x720
93  fps    + Compare
med. 1366x768
66  fps    + Compare
high 1920x1080
24.6 28.4 ~ 27 fps    + Compare
ultra 1920x1080
12.4 14.9 ~ 14 fps    + Compare
» With all tested laptops playable in detail settings med..
low 1280x720
39.3  fps    + Compare
med. 1366x768
23.5  fps    + Compare
» With all tested laptops playable in detail settings low.
low 1024x768
0 (!) 39.6 ~ 20 fps    + Compare
med. 1366x768
14.4  fps    + Compare
» With all tested laptops playable in detail settings low.
low 1280x720
18.8 21.7 ~ 20 fps    + Compare
» The benchmarks indicate that the game is not playable in the tested settings.
low 1280x720
19.8  fps    + Compare
med. 1366x768
13.7  fps    + Compare
» The benchmarks indicate that the game is not playable in the tested settings.
Overwatch

Overwatch

2016
low 1280x720
62  fps    + Compare
med. 1366x768
41.5  fps    + Compare
high 1920x1080
19.5  fps    + Compare
» With all tested laptops playable in detail settings med..
Doom

Doom

2016
low 1280x720
23.3  fps    + Compare
med. 1366x768
18.1  fps    + Compare
» The benchmarks indicate that the game is not playable in the tested settings.
low 1280x720
27.1  fps    + Compare
» The benchmarks indicate that the game is not playable in the tested settings.
low 1280x720
23 26 ~ 25 fps    + Compare
» The benchmarks indicate that the game is not playable in the tested settings.
low 1024x768
21.9 27.4 ~ 25 fps    + Compare
» The benchmarks indicate that the game is not playable in the tested settings.
low 1024x768
51.7  fps    + Compare
med. 1366x768
32.5  fps    + Compare
» With all tested laptops playable in detail settings low.
Anno 2205

Anno 2205

2015
low 1024x768
32.4  fps    + Compare
med. 1366x768
16.9  fps    + Compare
» The benchmarks indicate that the game is not playable in the tested settings.
low 1366x768
83.7  fps    + Compare
med. 1366x768
51.4  fps    + Compare
high 1920x1080
23.2  fps    + Compare
» With all tested laptops playable in detail settings med..
low 1024x768
60  fps    + Compare
med. 1366x768
40.7  fps    + Compare
high 1920x1080
13.4  fps    + Compare
» With all tested laptops playable in detail settings med..
low 1280x720
70.4 70.7 76.7 77 78 79 81.1 83 83.1 89 99.1 ~ 81 fps    + Compare
med. 1366x768
44.8 45.8 48 48 49.5 49.7 50 50.1 52.1 55.8 60.3 ~ 50 fps    + Compare
high 1920x1080
7.8 19.7 20 20 20.2 21 21 21.3 22.9 23.7 23.8 ~ 20 fps    + Compare
ultra 1920x1080
6.8 17.4 17.5 17.6 17.9 18.8 19.1 19.1 20.1 20.9 21 ~ 18 fps    + Compare
4K 3840x2160
6.5 7.5 ~ 7 fps    + Compare
» With all tested laptops playable in detail settings med..
low 1024x768
15.2 16 17.3 ~ 16 fps    + Compare
med. 1366x768
9.9 10.8 ~ 10 fps    + Compare
» The benchmarks indicate that the game is not playable in the tested settings.
low 1024x768
153.6  fps    + Compare
med. 1366x768
35.6  fps    + Compare
high 1920x1080
15.2  fps    + Compare
» With all tested laptops playable in detail settings med..
GTA V

GTA V

2015
low 1024x768
44.9 57.7 ~ 51 fps    + Compare
med. 1366x768
34.6 45.9 ~ 40 fps    + Compare
high 1920x1080
7.9 10.2 ~ 9 fps    + Compare
ultra 1920x1080
4.2  fps    + Compare
» With most tested laptops playable in detail settings med..
Additional Benchmarks
Normal/Off 4xAF 1920x1080
29.3
Lowest Settings possible 1920x1080
30.8
low 1024x768
41.8  fps    + Compare
med. 1366x768
28.7  fps    + Compare
high 1920x1080
9.8  fps    + Compare
» With all tested laptops playable in detail settings low.
low 1280x720
39.6  fps    + Compare
med. 1344x756
23.7  fps    + Compare
» With all tested laptops playable in detail settings low.
Sims 4

Sims 4

2014
low 1024x768
171  fps    + Compare
med. 1366x768
65  fps    + Compare
high 1920x1080
29.1  fps    + Compare
» With all tested laptops playable in detail settings med..
low 1280x720
58.7 64.6 69.8 82.4 ~ 69 fps    + Compare
med. 1366x768
34.4 34.7 40.1 41.8 41.8 ~ 39 fps    + Compare
high 1366x768
27.3 29.9 33.9 37.1 ~ 32 fps    + Compare
ultra 1920x1080
8.1 9.8 10.8 15 ~ 11 fps    + Compare
» With most tested laptops playable in detail settings med..
low 1024x768
100.1  fps    + Compare
med. 1366x768
49.1  fps    + Compare
high 1366x768
28.7  fps    + Compare
» With all tested laptops playable in detail settings med..
low 1024x768
146.8  fps    + Compare
med. 1366x768
102.4  fps    + Compare
high 1366x768
54.1  fps    + Compare
ultra 1920x1080
28.6  fps    + Compare
» With all tested laptops playable in detail settings high.
low 1024x768
93.3  fps    + Compare
med. 1366x768
59.9  fps    + Compare
high 1366x768
56.6  fps    + Compare
ultra 1920x1080
31.5  fps    + Compare
» With all tested laptops playable in detail settings high.
low 1280x720
63.3  fps    + Compare
med. 1366x768
31.9  fps    + Compare
high 1366x768
18.5  fps    + Compare
ultra 1920x1080
9.7  fps    + Compare
» With all tested laptops playable in detail settings low.
low 1024x768
241.5  fps    + Compare
med. 1360x768
59.5  fps    + Compare
high 1360x768
34.9  fps    + Compare
» With all tested laptops playable in detail settings med..
lowmed.highultraQHD4K
Palworld5.96
Prince of Persia The Lost Crown42.722.422.1
Ready or Not11.7
Total War Pharaoh16.4
EA Sports FC 2413.1
Counter-Strike 227.319.38.56
Cyberpunk 2077 2.0 Phantom Liberty4.88
Armored Core 69.76
Atlas Fallen4.94
Ratchet & Clank Rift Apart3.81
Diablo 49.77
Dead Island 28.81
Resident Evil 4 Remake2.56
Atomic Heart7.98
Hogwarts Legacy5.33
High On Life10.8
The Callisto Protocol6.9
Need for Speed Unbound6.65
Uncharted Legacy of Thieves Collection4.58
FIFA 2314.3
Vampire Bloodhunt16.610.78.43
Tiny Tina's Wonderlands8
Cyberpunk 2077 1.64.9
GRID Legends2216.212.8
Rainbow Six Extraction10
Farming Simulator 2240.5
Forza Horizon 518
Riders Republic10
Back 4 Blood21.38.71
Alan Wake Remastered21.6
Days Gone11.8
Mass Effect Legendary Edition38.516.19.59
Outriders20.713.2
Hitman 321.88
Yakuza Like a Dragon165.7
FIFA 2159.129.827.5
Mafia Definitive Edition11.9
Serious Sam 431.96.96
Crysis Remastered21.64.93
Flight Simulator 202011.7
Death Stranding13.77.78
F1 20202312
Gears Tactics38.113.27.55.4
Doom Eternal16.88.39
Escape from Tarkov17.3
Red Dead Redemption 213.47.4
Star Wars Jedi Fallen Order97.48
FIFA 2073.737.434.427
Borderlands 317.86.8
Control16.2
F1 20193513
League of Legends177.9149.2111.4103.7
Total War: Three Kingdoms43.212.4
Rage 216.6
The Division 2239
Dirt Rally 2.052.116
Anthem12.9
Far Cry New Dawn178
Metro Exodus15.47.6
Apex Legends35.113.1
Just Cause 415.58.9
Battlefield V22.6
Farming Simulator 1971.123.911.3
Fallout 7616.78.1
Hitman 212.87.5
Call of Duty Black Ops 425.99.7
Assassin´s Creed Odyssey117
FIFA 1957.129.927.2
Shadow of the Tomb Raider176
Strange Brigade311312.310.9
F1 20183516
Monster Hunter World20.37.7
The Crew 216.66.8
Far Cry 5146
World of Tanks enCore207.925.29.6
X-Plane 11.112115146.96
Kingdom Come: Deliverance16.96.9
Final Fantasy XV Benchmark124.8
Star Wars Battlefront 219.96.5
Need for Speed Payback19.38.9
Call of Duty WWII29.817.4
Wolfenstein II: The New Colossus17.79.1
Assassin´s Creed Origins107
Destiny 2179.2
ELEX14.56.8
The Evil Within 211.46.1
Middle-earth: Shadow of War2012
FIFA 1875423227
F1 201739
Playerunknown's Battlegrounds (PUBG)24.9
Team Fortress 21139351.626
Dirt 45213.8
Rocket League67.838.626
Prey28.911.3
Warhammer 40.000: Dawn of War III43.7
Mass Effect Andromeda18.3
Ghost Recon Wildlands19.1
For Honor30.711.6
Resident Evil 729.512.6
Farming Simulator 1793662714
Battlefield 139.323.5
Civilization VI2014.4
Deus Ex Mankind Divided20
Mirror's Edge Catalyst19.813.7
Overwatch6241.519.5
Doom23.318.1
The Division27.1
Far Cry Primal25
Rise of the Tomb Raider25
Rainbow Six Siege51.732.5
Anno 220532.416.9
World of Warships83.751.423.2
Metal Gear Solid V6040.713.4
Dota 2 Reborn815020187
The Witcher 31610
Dirt Rally153.635.615.2
GTA V514094.18
Dragon Age: Inquisition41.828.79.8
Middle-earth: Shadow of Mordor39.623.7
Sims 41716529.1
BioShock Infinite69393211
Tomb Raider100.149.128.7
Counter-Strike: GO146.8102.454.128.6
Diablo III93.359.956.631.5
The Elder Scrolls V: Skyrim63.331.918.59.7
StarCraft 2241.559.534.9
< 30 fps
< 60 fps
< 120 fps
≥ 120 fps
82
22
14
6
62
16
4
1
23
7
1
14
1
1
1


2


For more games that might be playable and a list of all games and graphics cards visit our Gaming List

v1.26
log 27. 08:40:29

#0 no ids found in url (should be separated by "_") +0s ... 0s

#1 not redirecting to Ajax server +0s ... 0s

#2 did not recreate cache, as it is less than 5 days old! Created at Mon, 25 Mar 2024 05:39:57 +0100 +0.001s ... 0.001s

#3 no comparison url found in template nbc.compare_page_1 needed +0.04s ... 0.041s

#4 no comparison url found in template nbc.compare_page_1 needed +0s ... 0.042s

#5 no comparison url found in template nbc.compare_page_1 needed +0s ... 0.042s

#6 no comparison url found in template nbc.compare_page_1 needed +0s ... 0.042s

#7 no comparison url found in template nbc.compare_page_1 needed +0s ... 0.042s

#8 no comparison url found in template nbc.compare_page_1 needed +0s ... 0.042s

#9 no comparison url found in template nbc.compare_page_1 needed +0.001s ... 0.042s

#10 no comparison url found in template nbc.compare_page_1 needed +0s ... 0.043s

#11 no comparison url found in template nbc.compare_page_1 needed +0s ... 0.043s

#12 no comparison url found in template nbc.compare_page_1 needed +0s ... 0.043s

#13 no comparison url found in template nbc.compare_page_1 needed +0s ... 0.043s

#14 no comparison url found in template nbc.compare_page_1 needed +0s ... 0.043s

#15 composed specs +0s ... 0.043s

#16 did output specs +0s ... 0.043s

#17 start showIntegratedCPUs +0s ... 0.043s

#18 getting avg benchmarks for device 8126 +0.042s ... 0.085s

#19 got single benchmarks 8126 +0.045s ... 0.13s

#20 got avg benchmarks for devices +0s ... 0.13s

#21 min, max, avg, median took s +0.811s ... 0.942s

#22 before gaming benchmark output +0s ... 0.942s

#23 Got 363 rows for game benchmarks. +0.025s ... 0.966s

#24 composed SQL query for gamebenchmarks +0s ... 0.966s

#25 got data and put it in $dataArray +0.082s ... 1.048s

#26 benchmarks composed for output. +2.426s ... 3.474s

#27 no comparison url found in template nbc.compare_page_1 needed +0.005s ... 3.479s

#28 return log +0s ... 3.479s

Notebook reviews with Intel UHD Graphics 630 graphics card

Dell XPS 15 9500笔记本电脑评测:现在更像MacBook Pro了

Dell XPS 15 9500笔记本电脑评测:现在更像MacBook Pro了

这是自2016年以来最大的XPS 15更新,但这是否是XPS用户想要的一切? 当然不是——思想顽固的人总是会发现一些可以抱怨的地方。 对于其他人来说,重大的改进和新的16:10显示屏都有助于使该电脑变得比以往任何时候都更好用。...
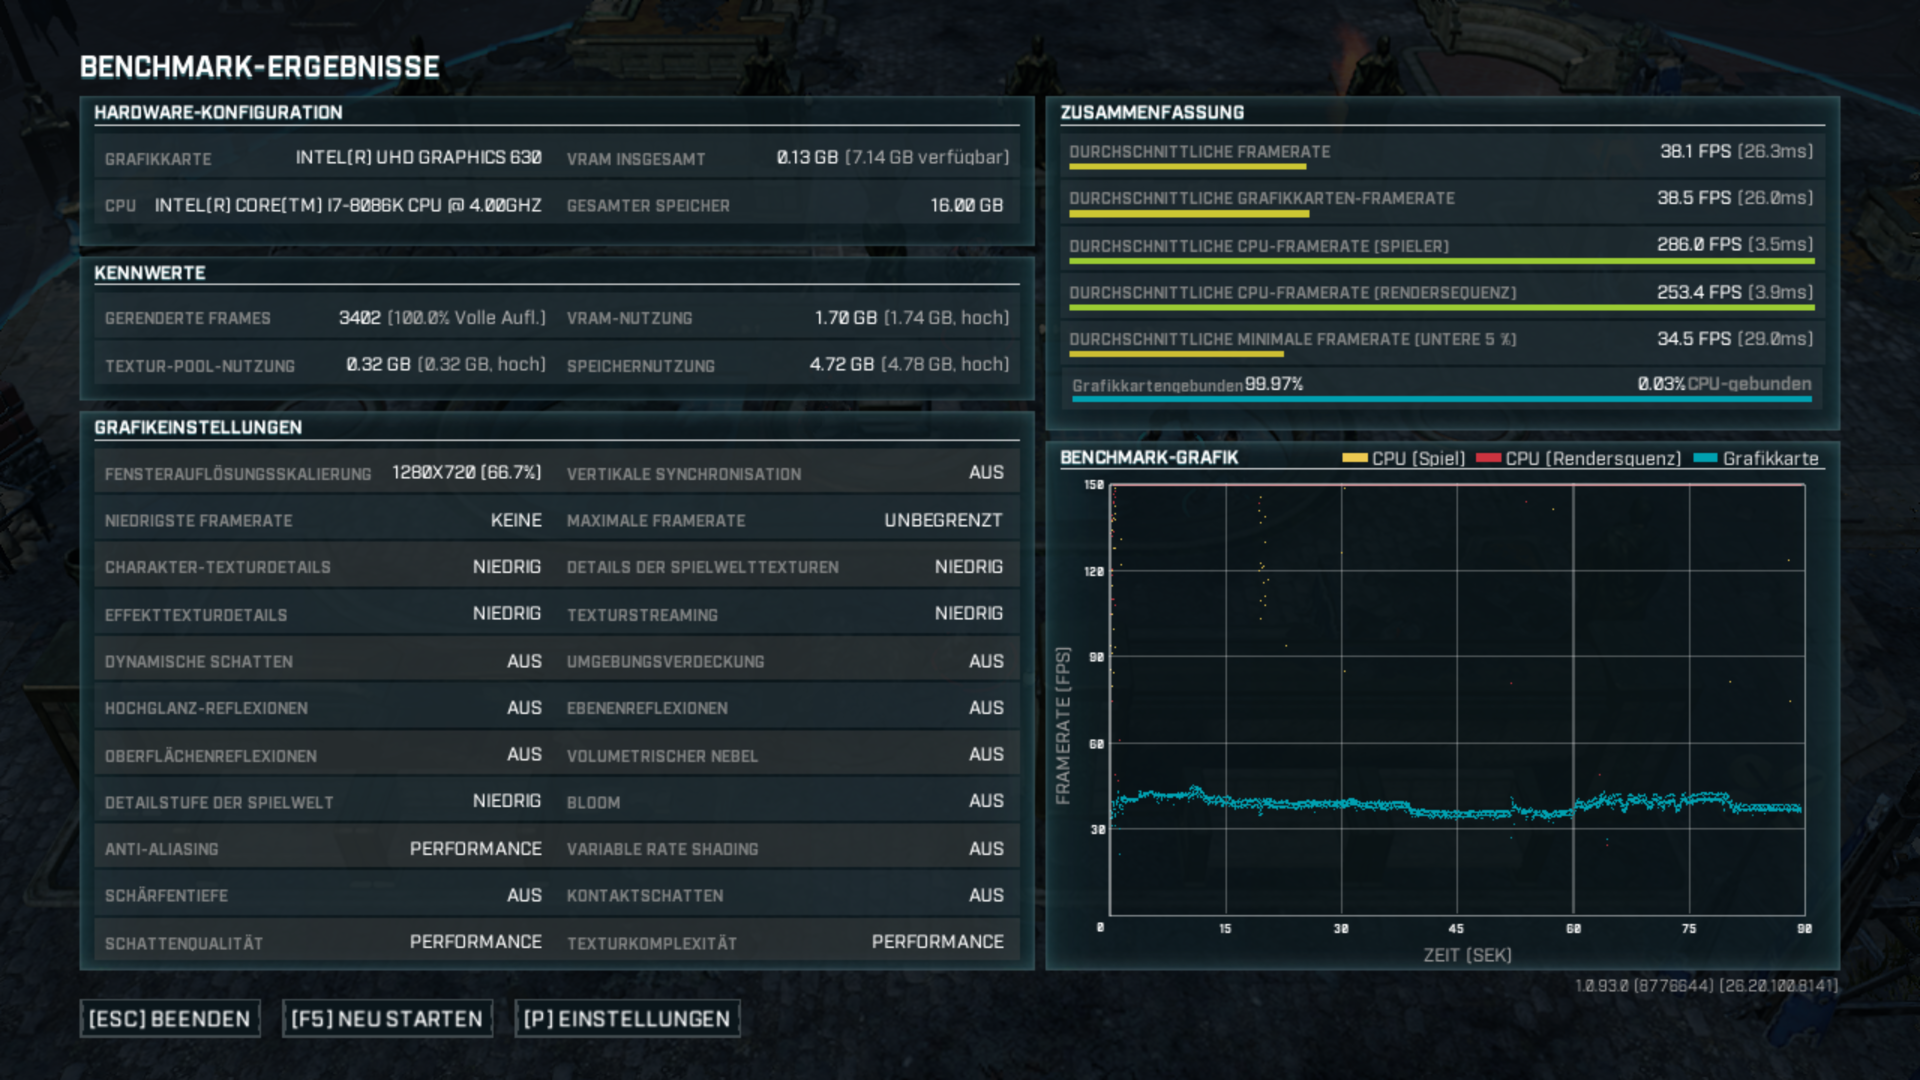
Intel Core i5-10300H | Intel UHD Graphics 630 | 15.60" | 1.8 kg
Dell XPS 15 7590笔记本电脑评测:基础款i5处理器FHD屏幕型号是否足够

Dell XPS 15 7590笔记本电脑评测:基础款i5处理器FHD屏幕型号是否足够

戴尔是少数几家提供不带独显的15英寸高级笔记本电脑的制造商之一。 如果您不想使用笔记本电脑打游戏,那么集成GPU的版本是否可能是更好的选择?...
Intel Core i5-9300H | Intel UHD Graphics 630 | 15.60" | 1.9 kg

Dell Latitude 14 5411, i5-10400H: Intel Core i5-10400H, 14.00", 1.5 kg
  External Review » Dell Latitude 14 5411, i5-10400H

Dell Latitude 15 5511, i5-10400H: Intel Core i5-10400H, 15.60", 1.9 kg
  External Review » Dell Latitude 15 5511, i5-10400H

Dell XPS 17 9700 i5-10300H: Intel Core i5-10300H, 17.30", 2.3 kg
  External Review » Dell XPS 17 9700 i5-10300H

Dell XPS 15 9500 Core i5: Intel Core i5-10300H, 15.60", 1.8 kg
  External Review » Dell XPS 15 9500 Core i5

Dell Latitude 14 5401-P8TG4: Intel Core i7-9850H, 14.00", 1.5 kg
  External Review » Dell Latitude 5401-P8TG4

HP Pavilion 15-dk0010ns: Intel Core i5-9300H, 15.60", 2.3 kg
  External Review » HP Pavilion 15-dk0010ns

Lenovo IdeaPad 530S-14IKB-81EU00SXMH: Intel Core i5-8250U, 14.00", 1.6 kg
  External Review » Lenovo IdeaPad 530S-14IKB-81EU00SXMH

HP EliteBook 1050 G1-3ZH19EA: Intel Core i5-8300H, 15.60", 2.1 kg
  External Review » HP EliteBook 1050 G1-3ZH19EA

Dell Latitude 5491 (8850H, UHD 630): Intel Core i7-8850H, 14.00", 1.8 kg
  External Review » Dell Latitude 5491 (8850H, UHD 630)

Please share our article, every link counts!

» Comparison of GPUs
Detailed list of all laptop GPUs sorted by class and performance.

» Benchmark List
Sort and restrict laptop GPUs based on performance in synthetic benchmarks.

» Notebook Gaming List
Playable games for each graphics card and their average FPS results.

Class 0

Arc A380

Class 1

NVIDIA RTX A6000 Desktop
Radeon Pro W6800 Desktop
NVIDIA Titan RTX Desktop
GeForce RTX 3070 Ti Desktop
Radeon RX 6750 XT Desktop
Radeon RX 6700 XT Desktop
NVIDIA GeForce RTX 3060 Ti Desktop
Radeon RX 6650 XT Desktop
GeForce RTX 2080 (Desktop) Desktop
GeForce RTX 2080 Super Mobile
Arc A580 Desktop

Class 2

NVIDIA GeForce RTX 3060 Desktop
Titan X Pascal Desktop
Radeon VII Desktop
Radeon RX 5700 XT (Desktop) Desktop
M1 Max 32-Core GPU *
GeForce RTX 2070 Super Mobile
GeForce GTX 1080 (Desktop) Desktop
M1 Max 24-Core GPU *
GeForce RTX 2060 Super (Desktop) Desktop
Radeon RX 5700 (Desktop) Desktop
Quadro RTX 5000 Max-Q
GeForce RTX 2060 (Desktop) Desktop
Radeon RX 5700M *
RX Vega 64 Desktop
GeForce GTX 1080 Mobile
Quadro RTX 4000 (Laptop)
M1 Pro 16-Core GPU *
Radeon PRO W6600M *
GeForce RTX 2070 Super Max-Q
Quadro RTX 4000 Max-Q *
M1 Pro 14-Core GPU *
RX Vega 56 Desktop
Quadro P5200
Radeon RX 5600 XT (Desktop) Desktop
Quadro RTX 3000 Max-Q *
Pro Vega 56 Desktop
Quadro P4200
GeForce GTX 1660 Ti (Desktop) Desktop
GeForce GTX 1660 Super (Desktop) Desktop
GeForce GTX 1660 (Desktop) Desktop
GeForce GTX 1650 Super (Desktop) Desktop
Quadro P5000 Max-Q *
Radeon R9 Fury Desktop
Radeon R9 Nano Desktop
Radeon RX 580 Desktop
GeForce GTX 980 (Laptop)
GeForce GTX 1060 (Desktop) Desktop
Radeon RX 570 Desktop
Quadro P4000
Radeon RX 480 Desktop
Quadro P4000 Max-Q
Quadro P3200
Radeon RX 580X (Laptop) *
Radeon RX 580 (Laptop)
Radeon Pro 5300M
Radeon RX 5300M
GeForce GTX 970 Desktop
Quadro P3000 Max-Q *
Quadro T2000 Max-Q *
Radeon Pro WX 7100 *
Radeon RX 570X (Laptop) *
Radeon RX 570 (Laptop) *
Radeon RX 470 (Laptop) *
Quadro T1000 Max-Q *

Class 3

Vega M GH
Quadro M5000M
GeForce GTX 960 Desktop
GeForce GTX 1050 Ti Mobile
Radeon 680M
Quadro P2000
Quadro P2000 Max-Q
Quadro M4000M
T500 Laptop GPU *
Radeon R9 M395X
GeForce GTX 1050 Ti Max-Q *
Radeon Pro Vega 16
WX Vega M GL
Radeon R9 M485X
Quadro M3000M
FirePro W7170M
Radeon R9 M395
Radeon R7 370 Desktop
GeForce GTX 1050 Max-Q *
GeForce GTX 950 Desktop
T600 Desktop
Radeon 660M
Radeon Pro WX 4150 *
Radeon RX 560X (Laptop)
Radeon RX 560 (Laptop)
Radeon RX 460 (Laptop)
Quadro P1000
Radeon R9 M390
Xe MAX
Radeon Pro 560X
Radeon Pro 560
Radeon Pro 460
Radeon Pro WX 4130 *
GeForce GTX 960M
Quadro P620 *
Radeon RX 550X (Laptop)
Radeon Pro WX 3200 *
Radeon Pro 555X
Radeon Pro 555
Radeon Pro 455
Quadro P600
Quadro M2000M
Radeon RX 540X *
Radeon Pro WX 2100 *
Radeon Pro WX 3100 *
GeForce GTX 950M
Radeon Pro 450
Radeon 630
Radeon 540X *
Radeon R9 M385X
Quadro P520
Quadro M1000M
GeForce 945M
Quadro P500 *
Iris Plus Graphics G7 (Ice Lake 64 EU) *
Vega 10 *
Iris Pro Graphics 580
FirePro W5170M *
Radeon R9 M370X
Vega 9
FirePro W5130M
UHD Graphics Xe G4 48EUs *
UHD Graphics 32EUs
UHD Graphics Xe 32EUs (Tiger Lake-H) *
UHD Graphics 750
UHD Graphics Xe 750 32EUs * Desktop
Vega 7
Radeon R7 M465
FirePro W4100 Desktop
Iris Pro Graphics 6200
Vega 8
GeForce 940M
Iris Plus Graphics G4 (Ice Lake 48 EU)
Quadro M600M
FirePro W4190M
Radeon R9 M375
Radeon R7 M445
Iris Plus Graphics 650
Iris Graphics 550
Radeon 625
Vega 6 *
Iris Plus Graphics 640
Iris Graphics 540
UHD Graphics 24EUs (Alder Lake-N) *
Radeon R7 M360
GeForce 920M
Radeon 620
Radeon R7 M340
Radeon 610
Radeon 610M *
Vega 6 *
UHD Graphics G1 (Ice Lake 32 EU)
UHD Graphics P630 Desktop
UHD Graphics Xe 16EUs (Tiger Lake-H) *
HD Graphics 630 Desktop
HD Graphics 530
Radeon R5 (Bristol Ridge)
Adreno 690 *
Adreno 685 *
Adreno 680 *
FirePro W2100 Desktop
Radeon R5 M330
GeForce 910M
HD Graphics 520

Class 4

UHD Graphics 730
Radeon R5 M320 *
Radeon R5 M315 *
Radeon R5 M420 *
Vega 2 *
UHD Graphics (Elkhart Lake 32 EU) Desktop
UHD Graphics 617
UHD Graphics 615
HD Graphics 515
UHD Graphics 610
HD Graphics 510
UHD Graphics (Elkhart Lake 16 EU) Desktop
UHD Graphics 605
Radeon R4 (Stoney Ridge)
Radeon R2 (Stoney Ridge)
HD Graphics (Broadwell)
UHD Graphics 600
HD Graphics (Braswell)

Class 5

* Approximate position of the graphics adapter