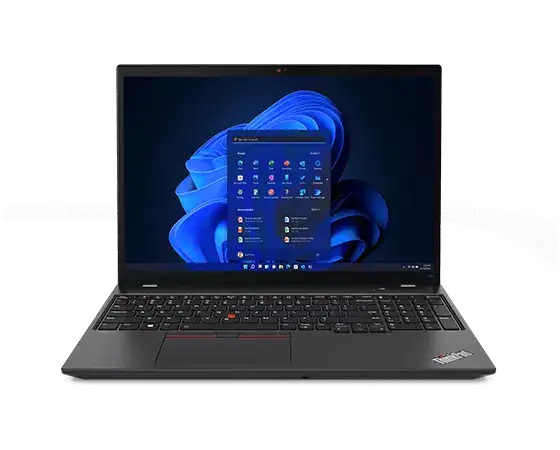
联想ThinkPad T16 Gen 1酷睿i7笔记本电脑评测。以性能为代价的安静
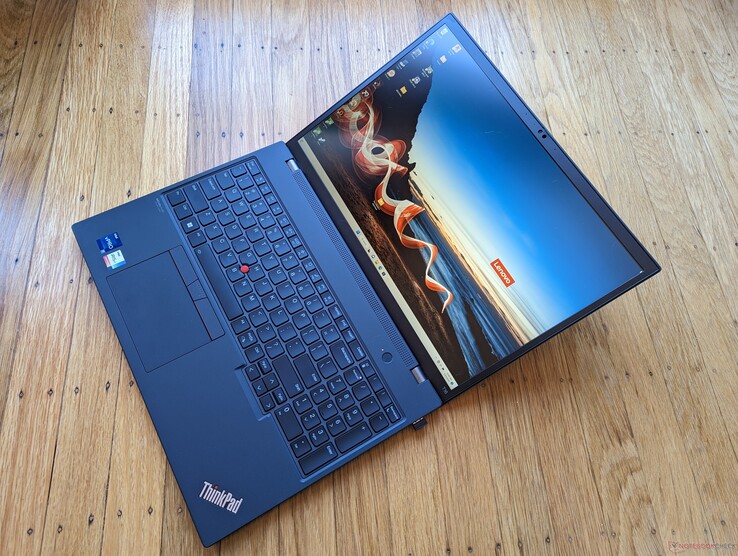
ThinkPad T16 G1是联想的第二款16英寸ThinkPad,旨在比现有的专业消费者ThinkBook 16系列更进一步。它搭载了第12代酷睿U和酷睿P的CPU选项,并在部分SKU上配备了独立的GeForce MX550 GPU。
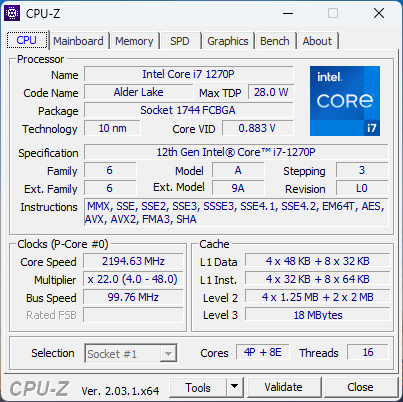
我们最近审查了Core i5-1240P和Ryzen 5 Pro 6650U配置,因此这次审查将侧重于Core i7-1270P配置。我们建议查看我们现有的关于 酷睿i5版本以了解更多关于ThinkPad T16 G1的机箱和其他物理特征。当升级到成本较高的酷睿i7选项时,用户可以期待有多大的性能差异?
ThinkPad T16 G1的竞争者包括16英寸的 LG Gram 16, MSI Summit E16,或 HP EliteBook 860/865 G9.在撰写本文时,戴尔还没有推出直接的16英寸Latitude 竞争对手。我们审查的配置售价约为1800美元。
更多联想的评论。
潜在的竞争对手比较
Rating | Date | Model | Weight | Height | Size | Resolution | Price |
|---|---|---|---|---|---|---|---|
| 88.6 % v7 (old) | 01 / 2023 | Lenovo ThinkPad T16 Gen 1 Core i7-1270P i7-1270P, Iris Xe G7 96EUs | 2 kg | 20.5 mm | 16.00" | 1920x1200 | |
| 90.2 % v7 (old) | 02 / 2023 | Lenovo ThinkPad T16 G1 21CH004MGE R5 PRO 6650U, Radeon 660M | 1.8 kg | 20.5 mm | 16.00" | 2560x1600 | |
| 86.6 % v7 (old) | 01 / 2023 | LG Gram 16Z90Q i7-1260P, Iris Xe G7 96EUs | 1.2 kg | 16.8 mm | 16.00" | 2560x1600 | |
| 87.2 % v7 (old) | 12 / 2022 | HP EliteBook 865 G9 R7 PRO 6850U, Radeon 680M | 1.9 kg | 19 mm | 16.00" | 1920x1200 | |
| 86.4 % v7 (old) | 07 / 2022 | Huawei MateBook 16s i7 i7-12700H, Iris Xe G7 96EUs | 2 kg | 17.8 mm | 16.00" | 2520x1680 | |
| 93.2 % v7 (old) | 11 / 2021 | Apple MacBook Pro 16 2021 M1 Pro M1 Pro, M1 Pro 16-Core GPU | 2.2 kg | 16.8 mm | 16.20" | 3456x2234 |
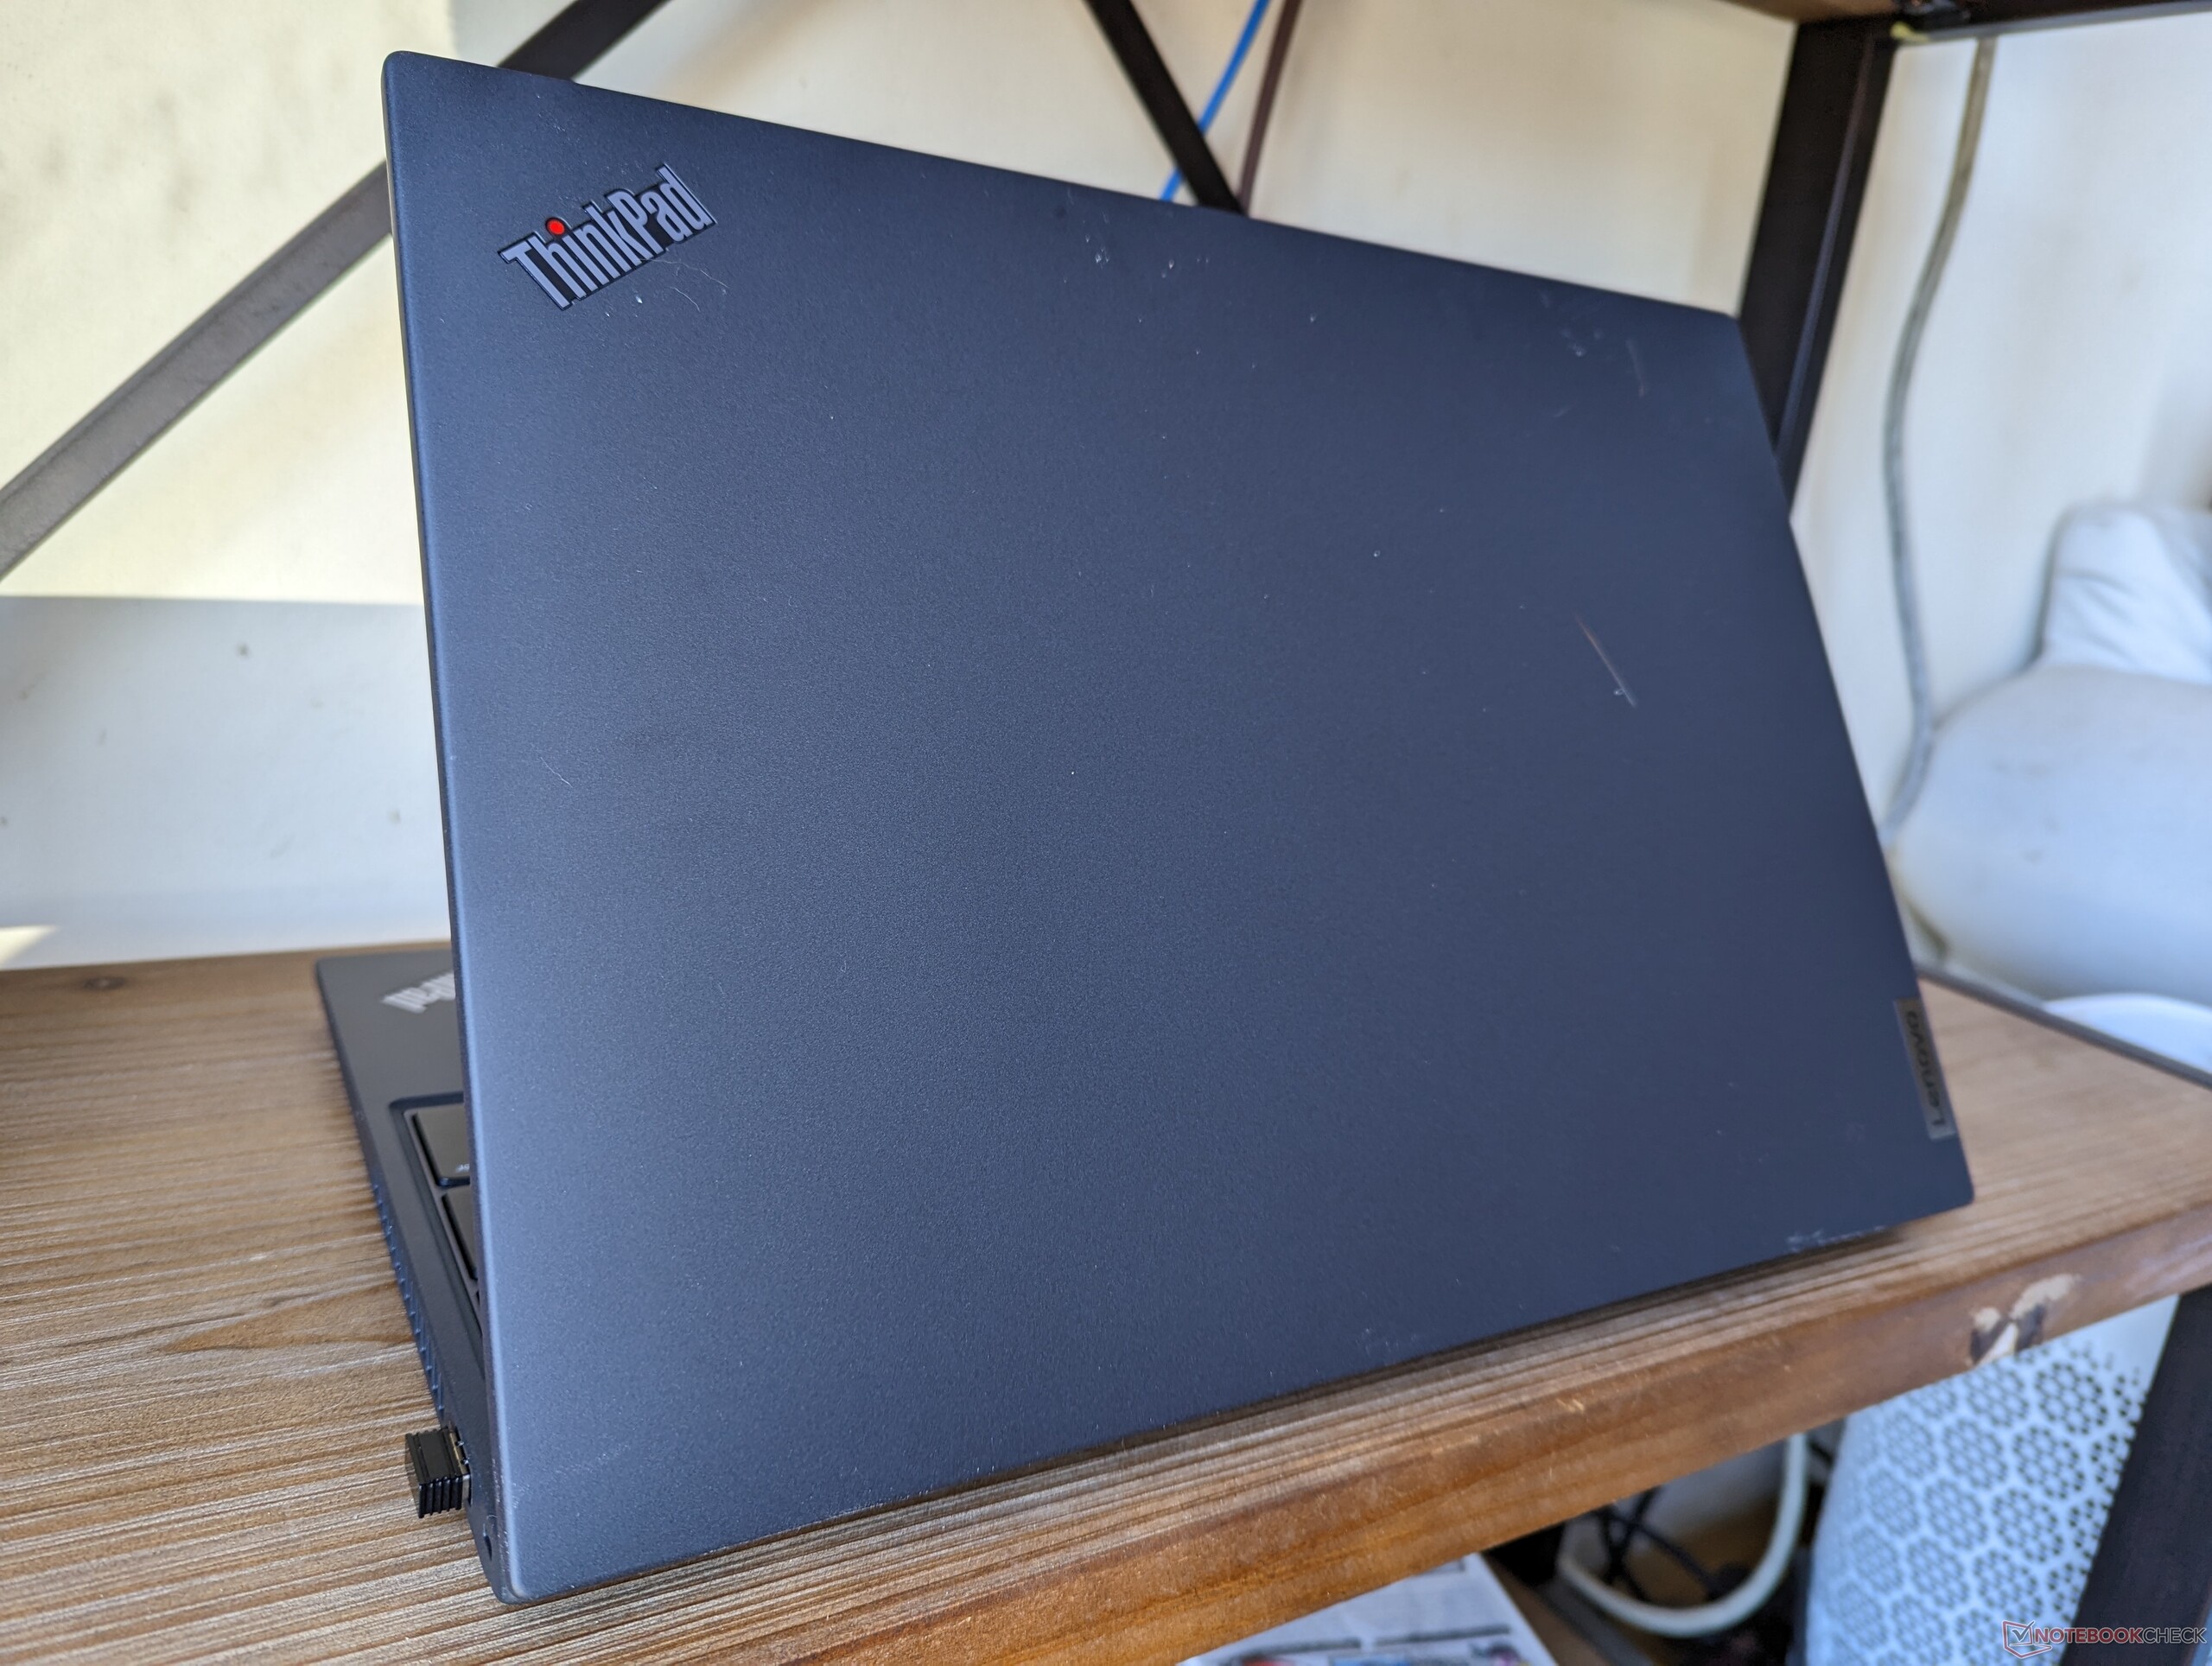
案例 - 有点大
虽然该机型只有几个月的历史,但与惠普EliteBook 865 G9或其他竞争性16英寸笔记本电脑相比,其机箱设计在所有尺寸上都略大。 Apple MacBook Pro 16.尤其是LG Gram 16的重量更轻,达到800克。
预计油脂和指纹会很快在哑光的黑色表面积累起来。这里的深色碳纤维、玻璃纤维和塑料方法与竞争性的惠普EliteBook的亮灰色金属合金方法形成鲜明对比。
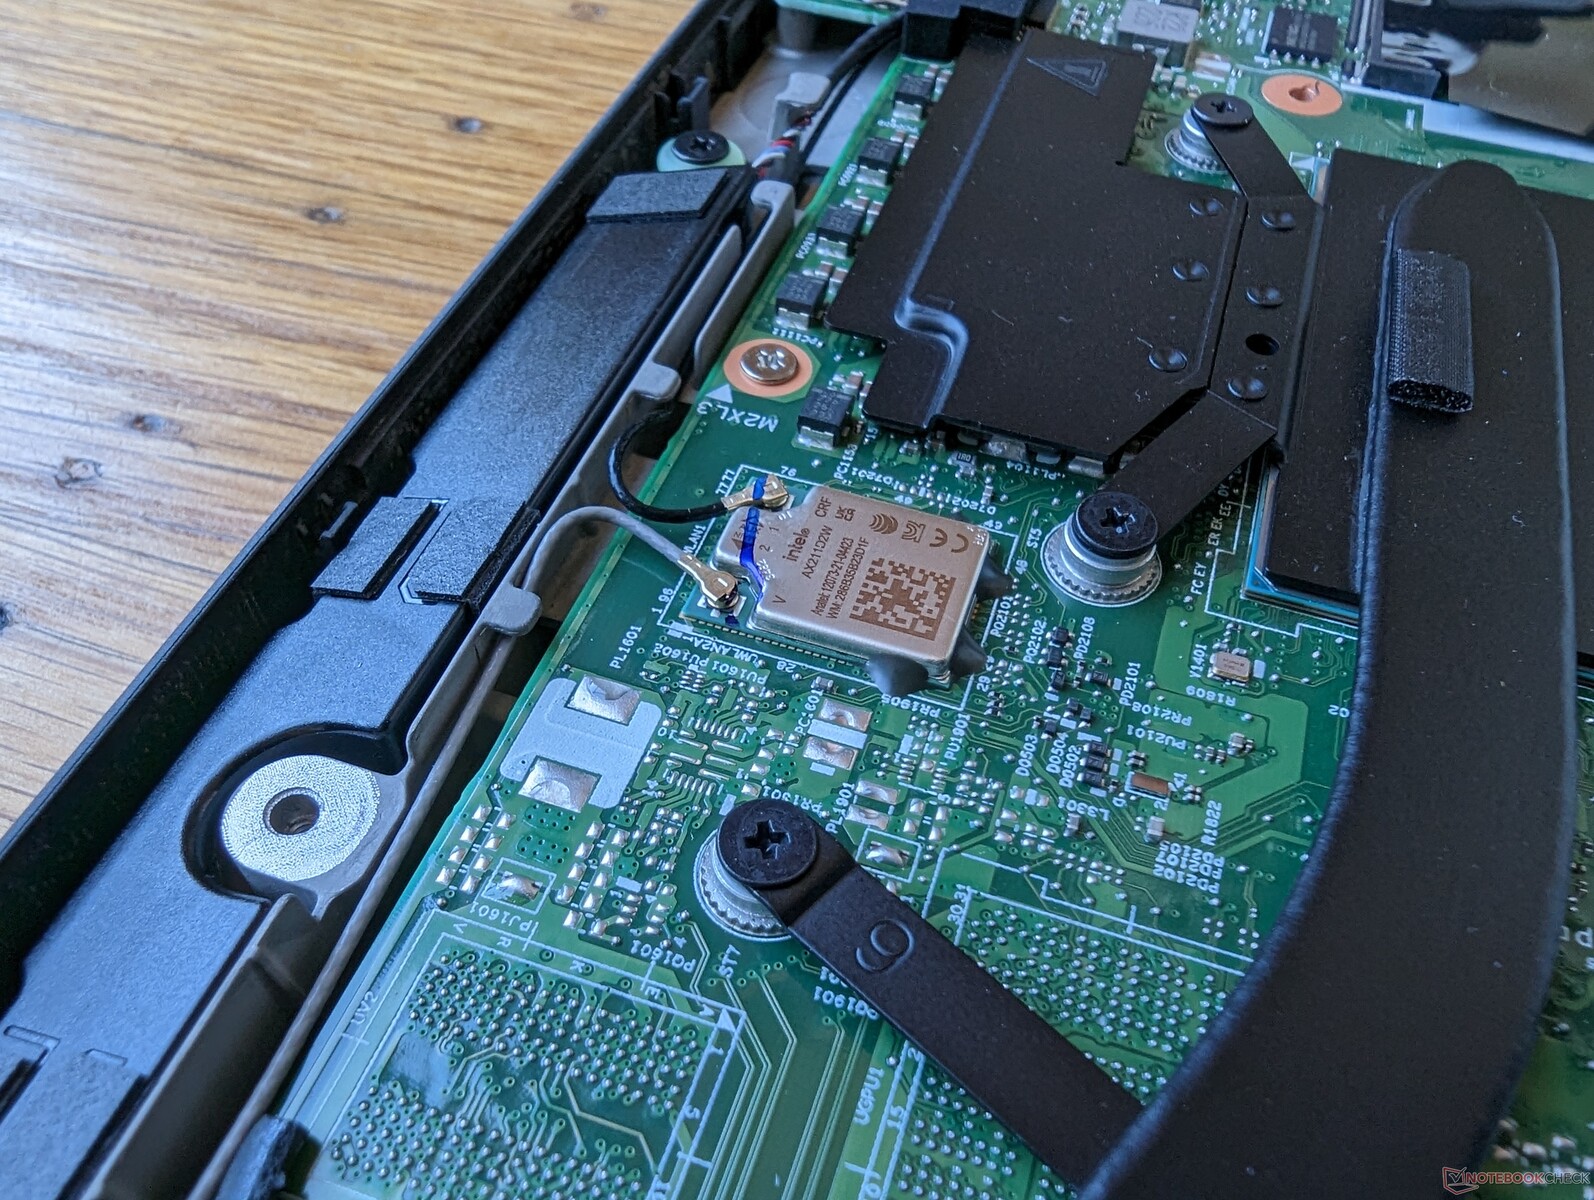
沟通
英特尔AX211是蓝牙5.2和Wi-Fi 6E连接的标准配置。当与我们的华硕AXE11000测试路由器配对时,传输率很稳定。
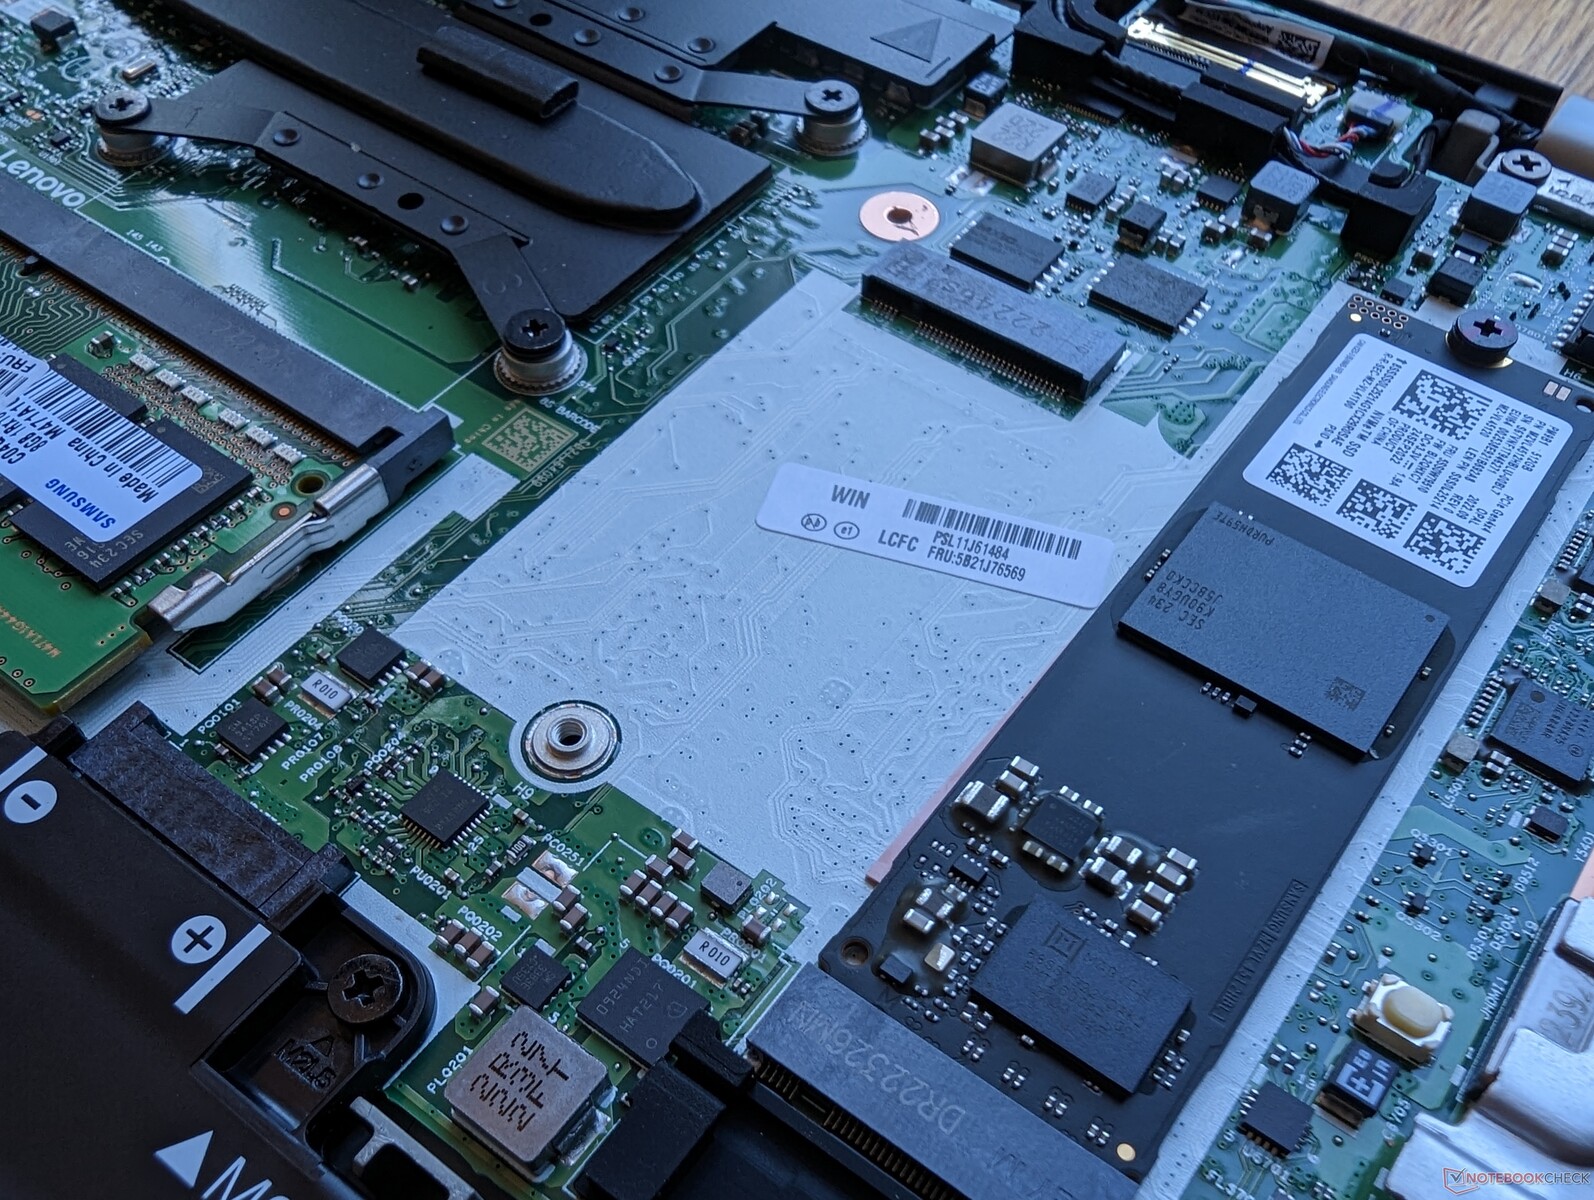
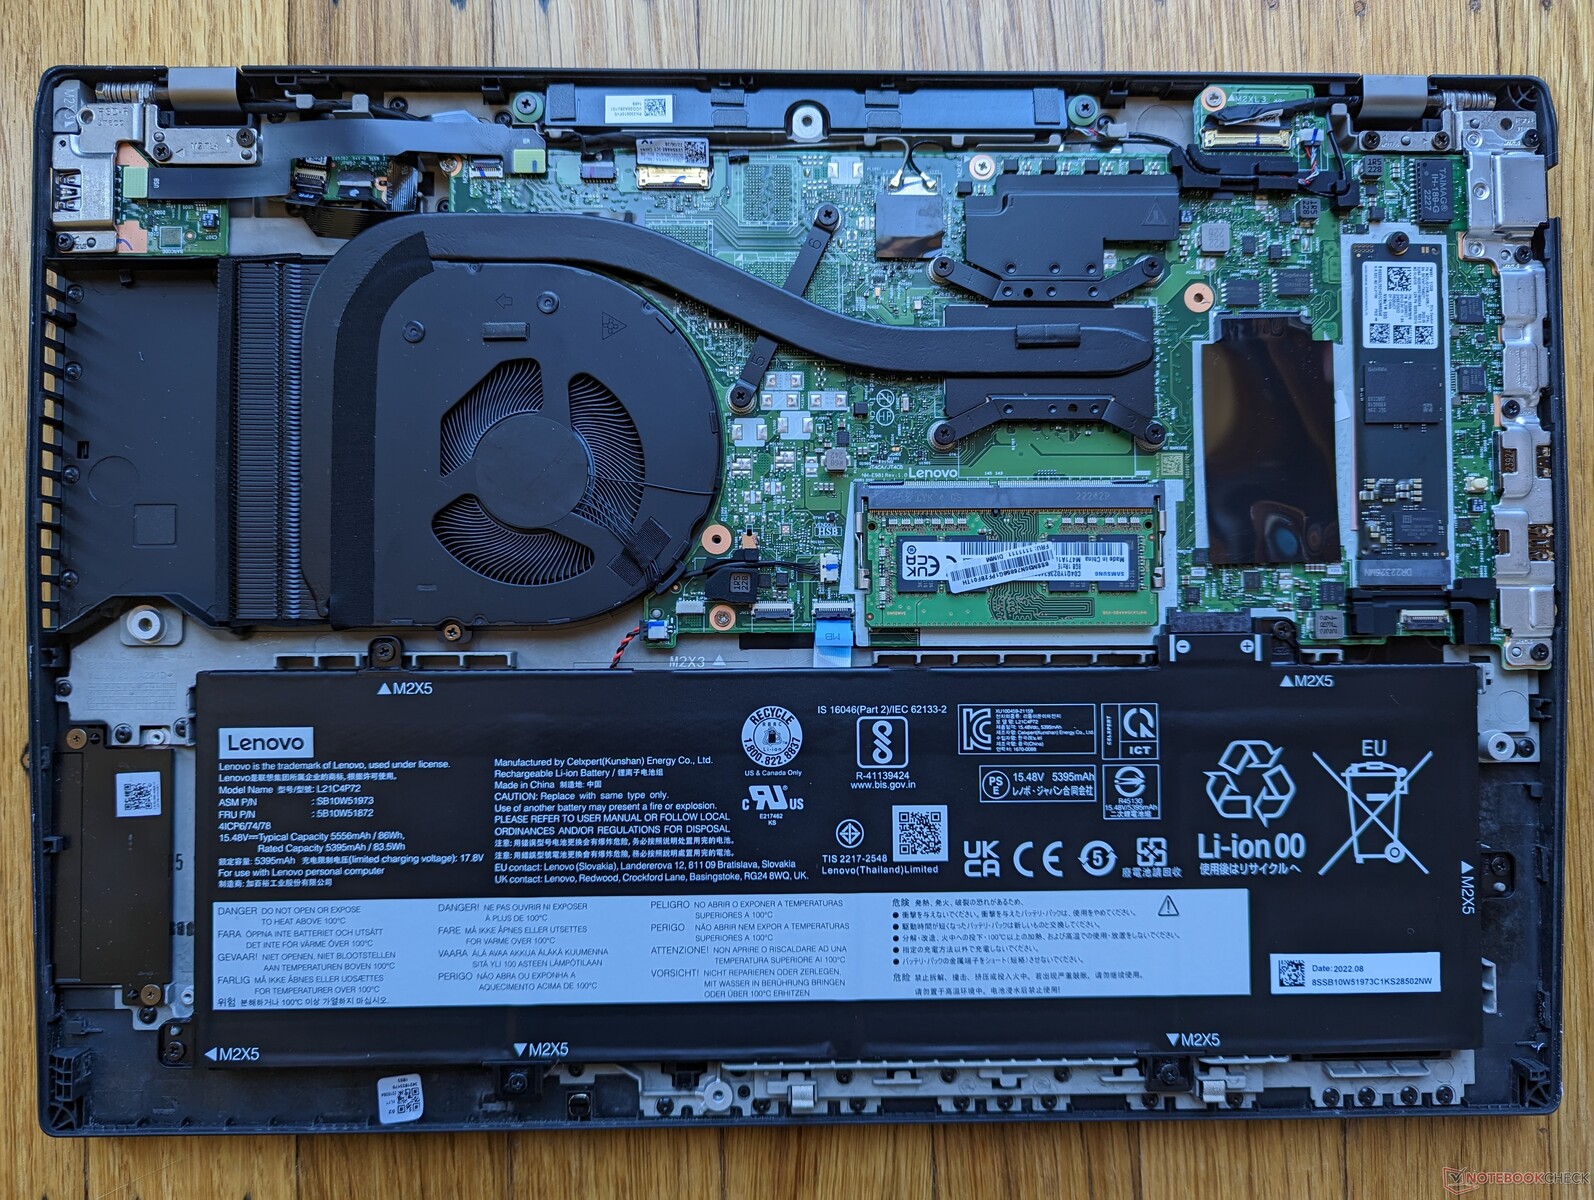
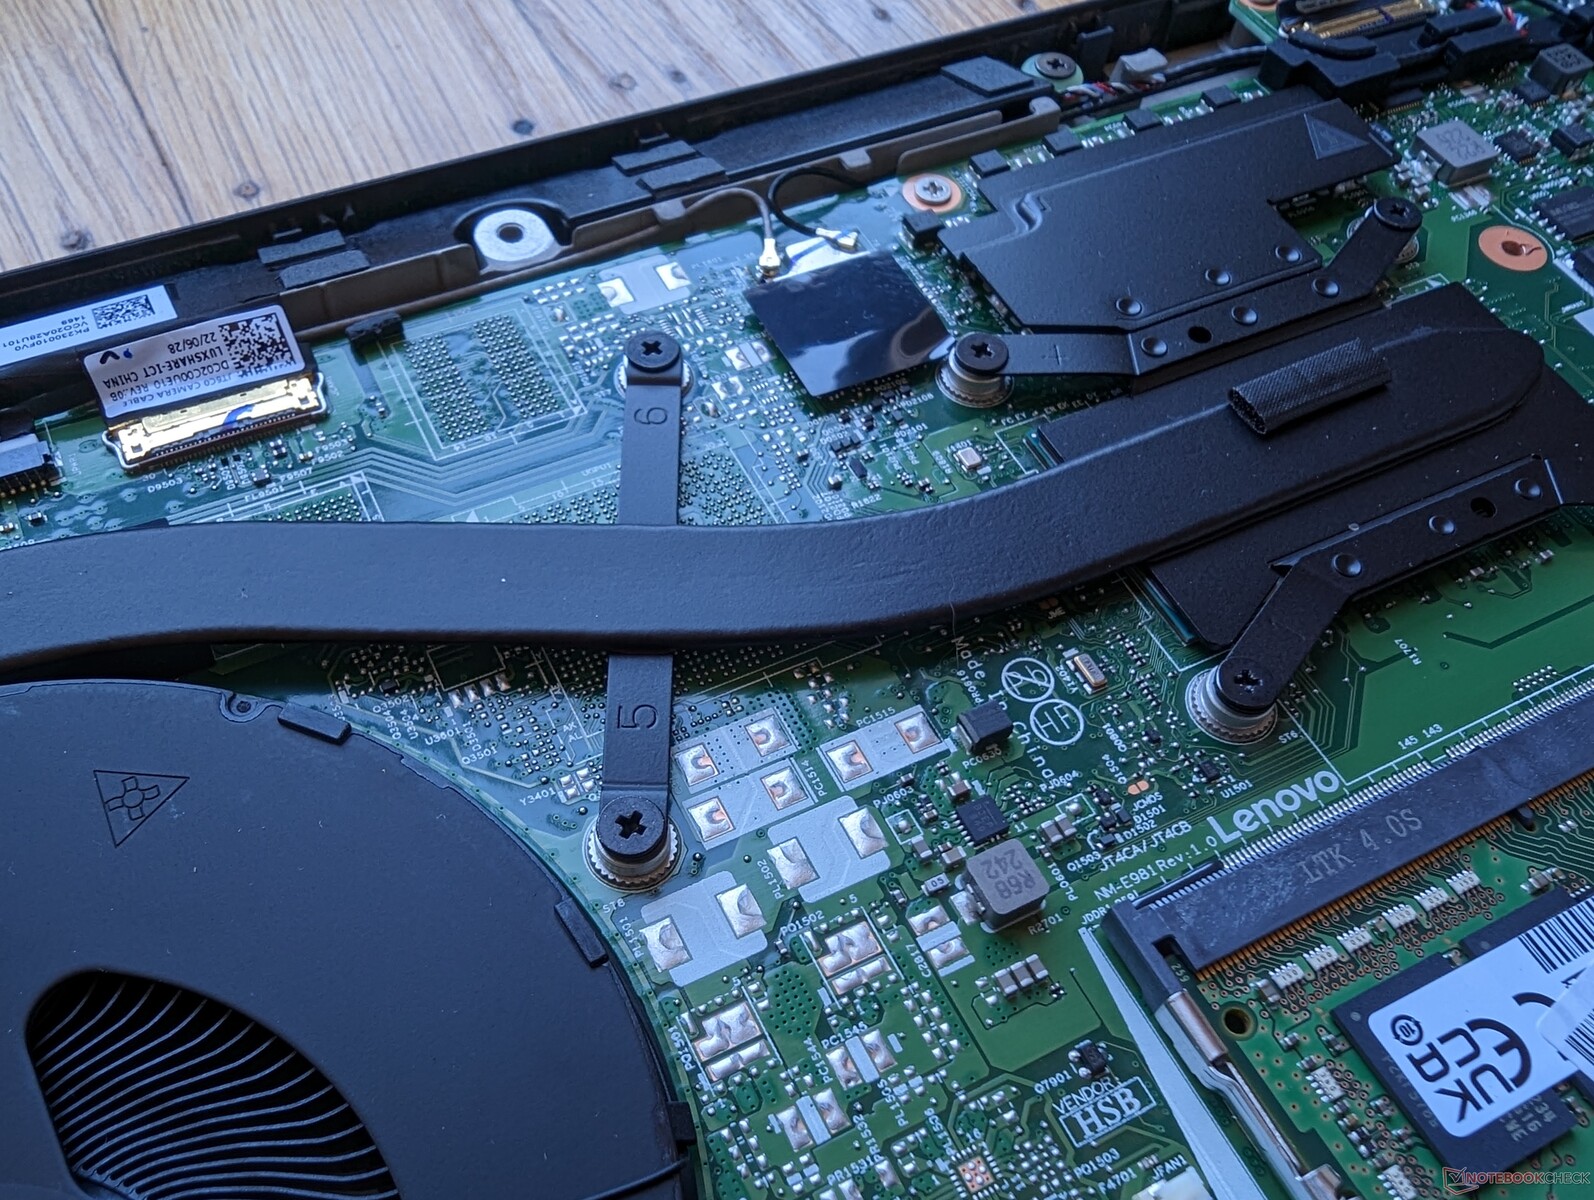
如下图所示,在我们的具体配置中,M.2 WWAN插槽是空的。不幸的是,如果不配置WWAN,联想并不包括天线。
| Networking | |
| iperf3 transmit AX12 | |
| Apple MacBook Pro 16 2021 M1 Pro | |
| iperf3 receive AX12 | |
| Apple MacBook Pro 16 2021 M1 Pro | |
| iperf3 receive AXE11000 6GHz | |
| Lenovo ThinkPad T16 G1 21CH004MGE | |
| Huawei MateBook 16s i7 | |
| Lenovo ThinkPad T16 Gen 1 Core i7-1270P | |
| iperf3 receive AXE11000 | |
| Lenovo ThinkPad T16 G1 21CH004MGE | |
| HP EliteBook 865 G9 | |
| LG Gram 16Z90Q | |
| Lenovo ThinkPad T16 Gen 1 Core i7-1270P | |
| Apple MacBook Pro 16 2021 M1 Pro | |
| iperf3 transmit AXE11000 | |
| Lenovo ThinkPad T16 G1 21CH004MGE | |
| HP EliteBook 865 G9 | |
| LG Gram 16Z90Q | |
| Lenovo ThinkPad T16 Gen 1 Core i7-1270P | |
| Apple MacBook Pro 16 2021 M1 Pro | |
| iperf3 transmit AXE11000 6GHz | |
| Lenovo ThinkPad T16 G1 21CH004MGE | |
| Huawei MateBook 16s i7 | |
| Lenovo ThinkPad T16 Gen 1 Core i7-1270P | |
网络摄像头
200万像素的网络摄像头与现在许多机型上的500万像素网络摄像头相比,相形见绌。 惠普EliteBook型号.ThinkPad T16上包括红外和物理快门。


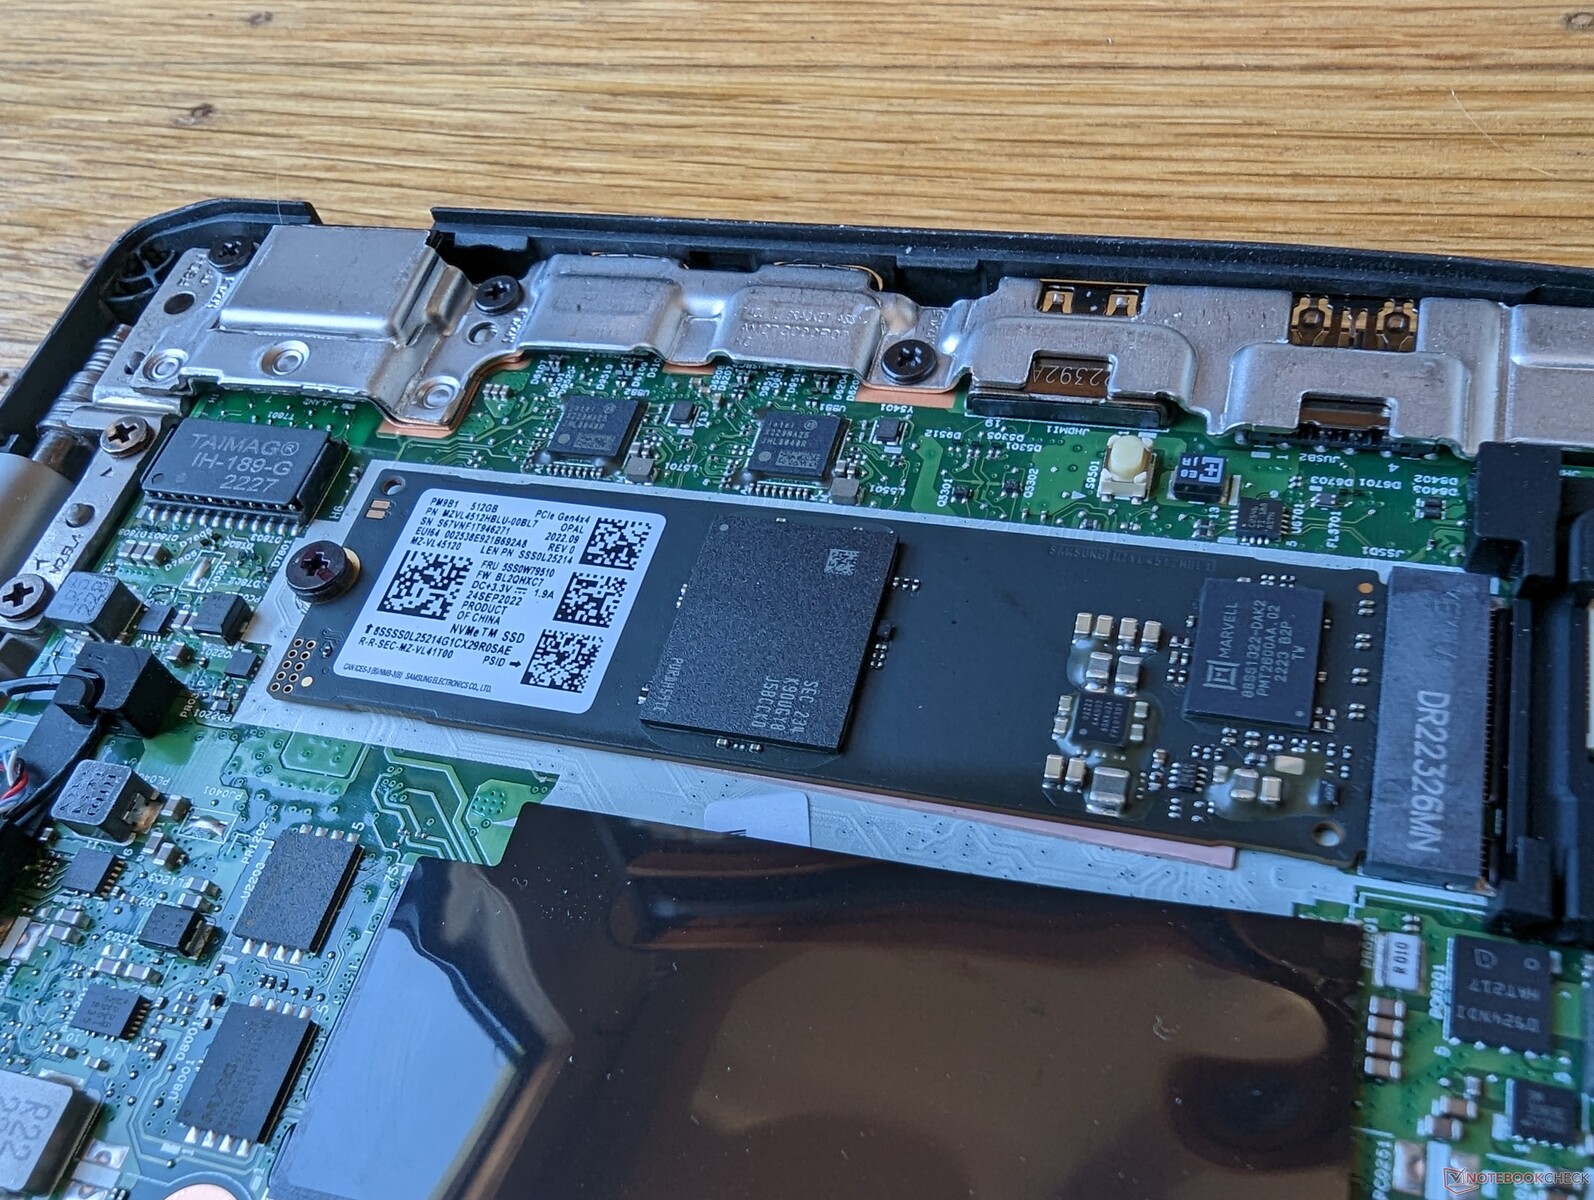
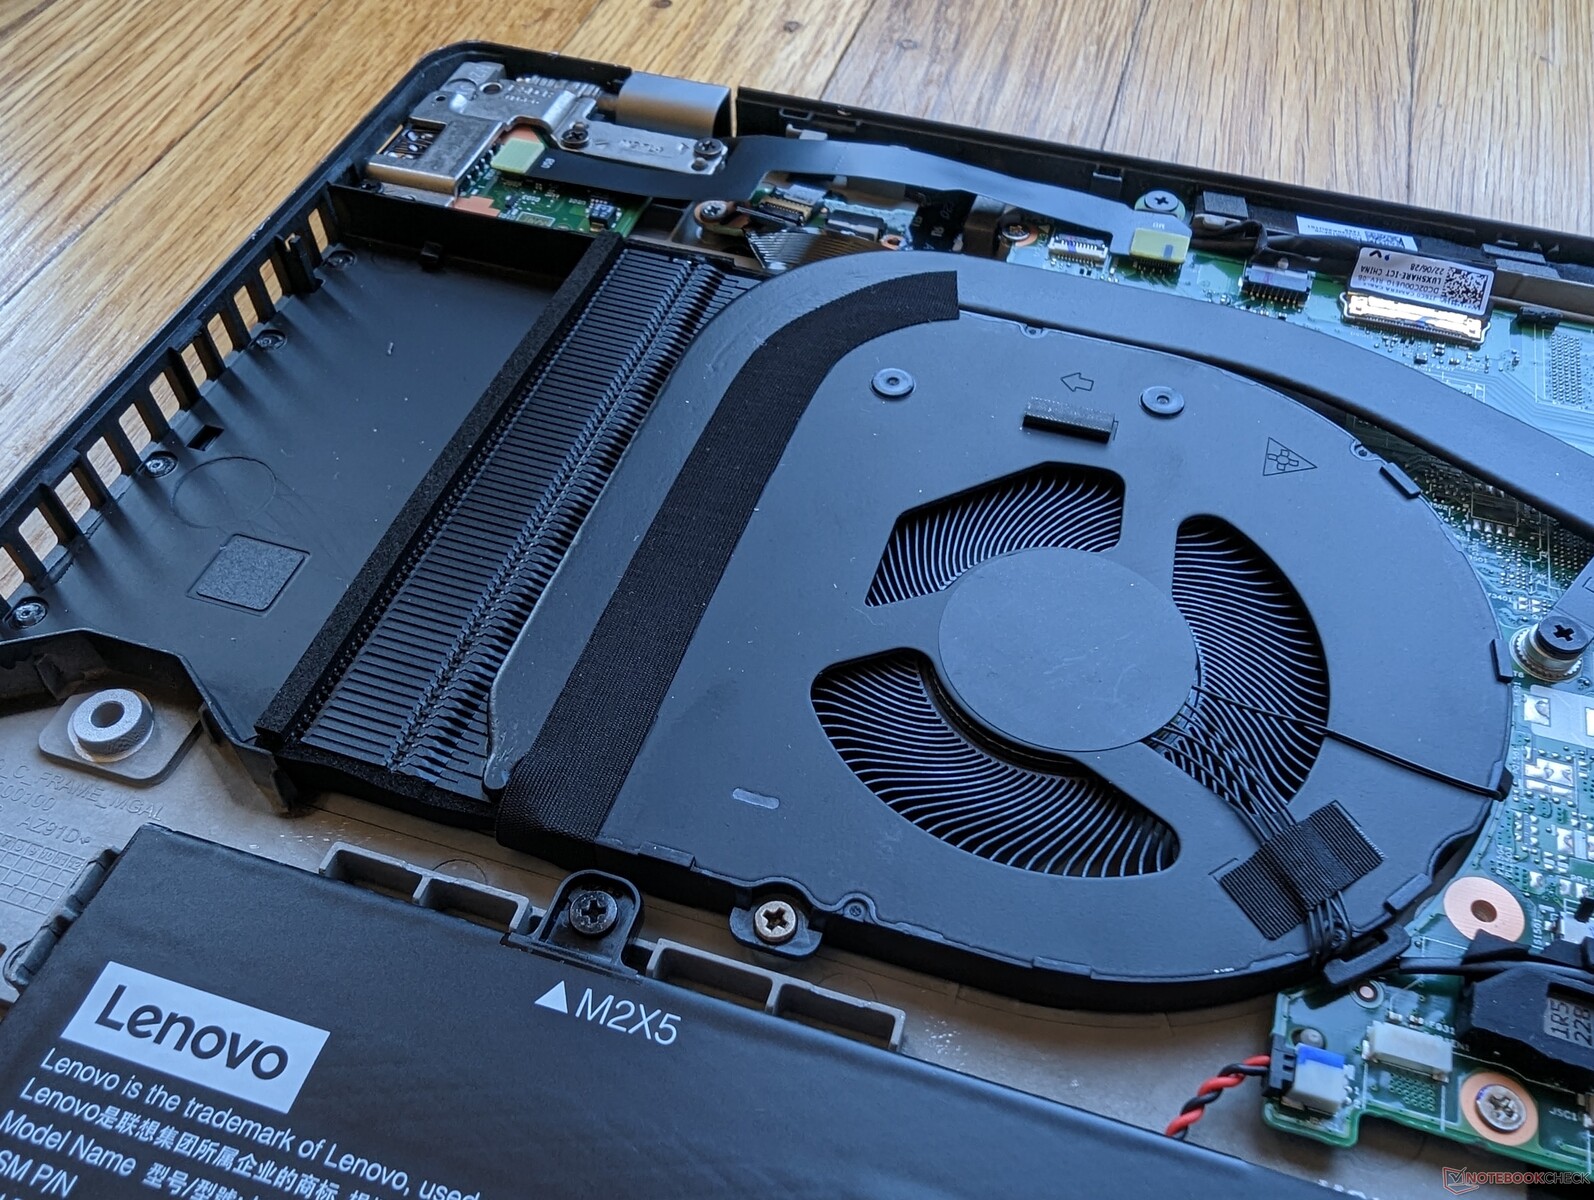
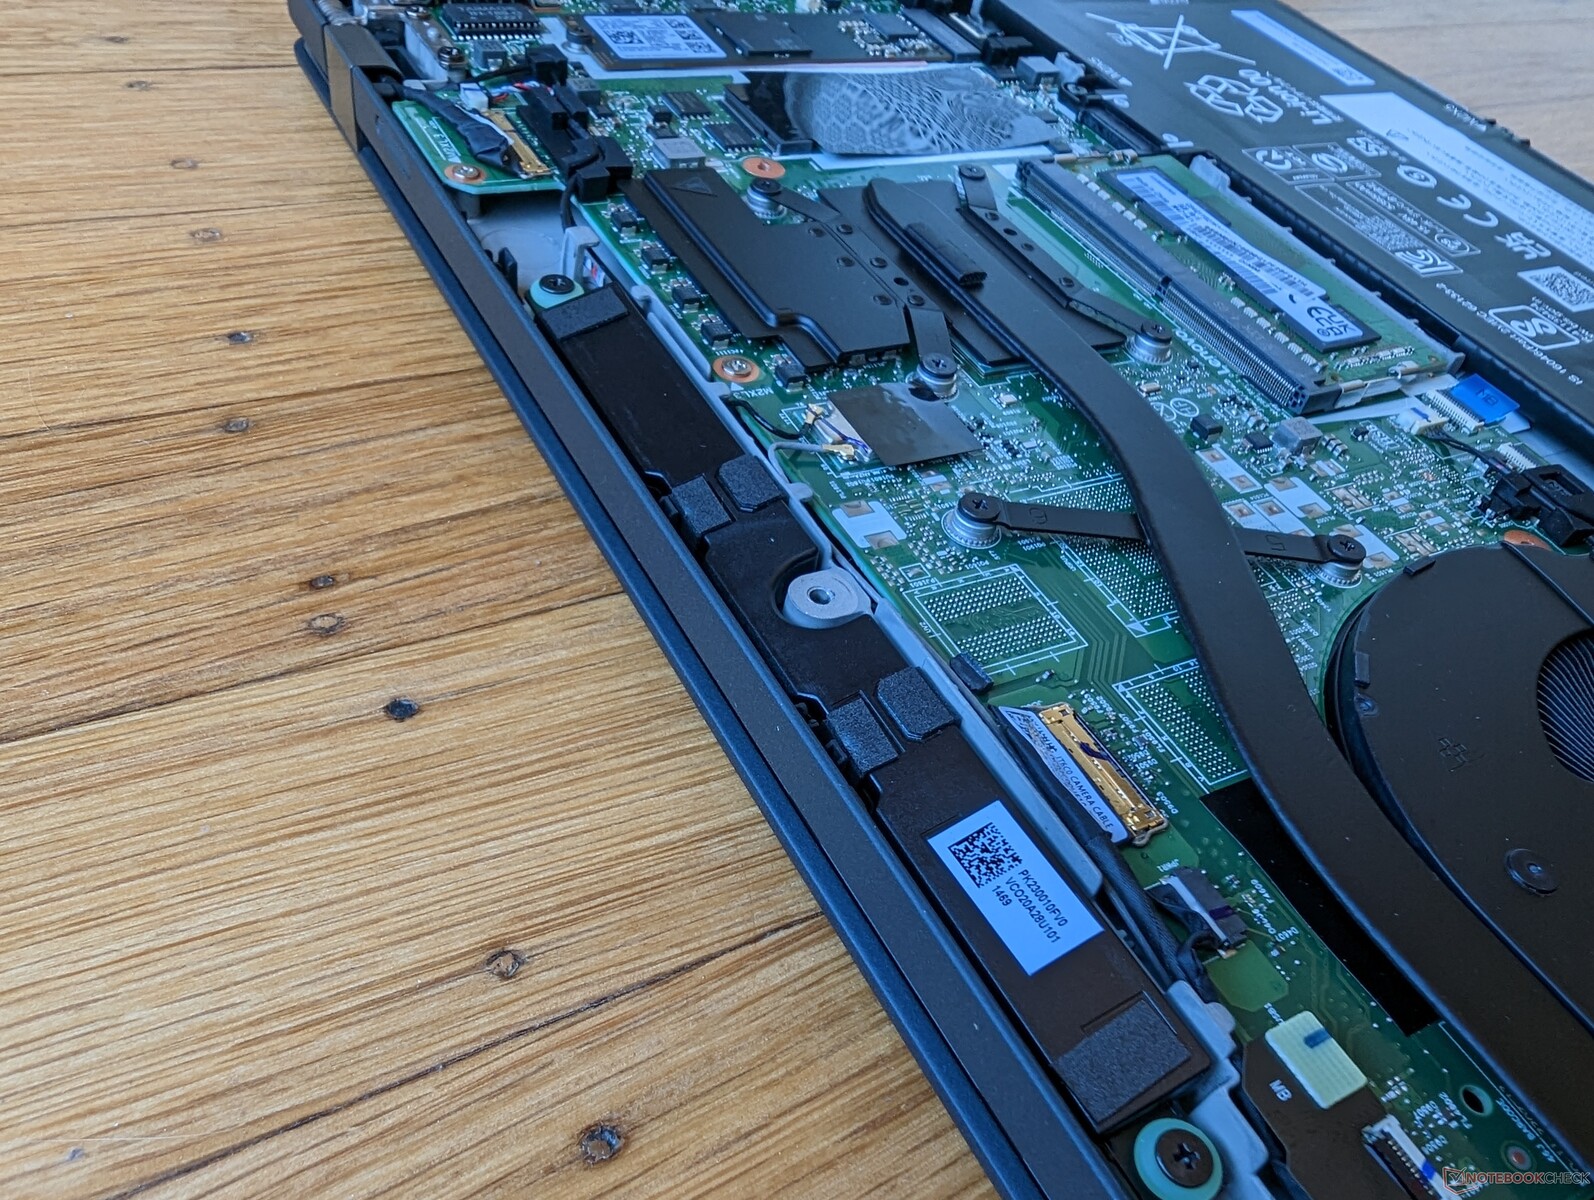
维护
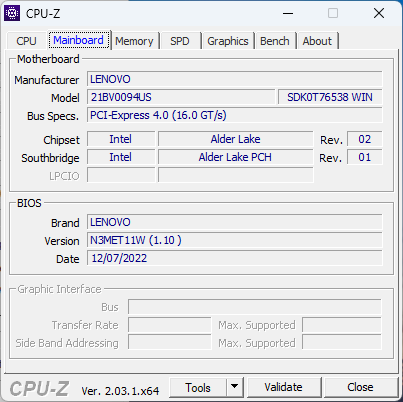
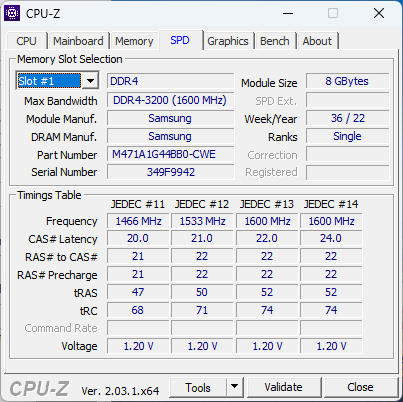
底部面板由八个飞利浦螺钉固定,便于维修。请记住,该机型配有8GB焊接内存和1个SODIMM插槽用于扩展,而其他大多数笔记本电脑只使用焊接内存或2个SODIMM。某些SKU可能配有16GB的焊接内存。
配件和保修
除了交流电适配器和文件外,零售盒中没有其他额外的东西。如果在美国购买,则适用一年的有限制造商。
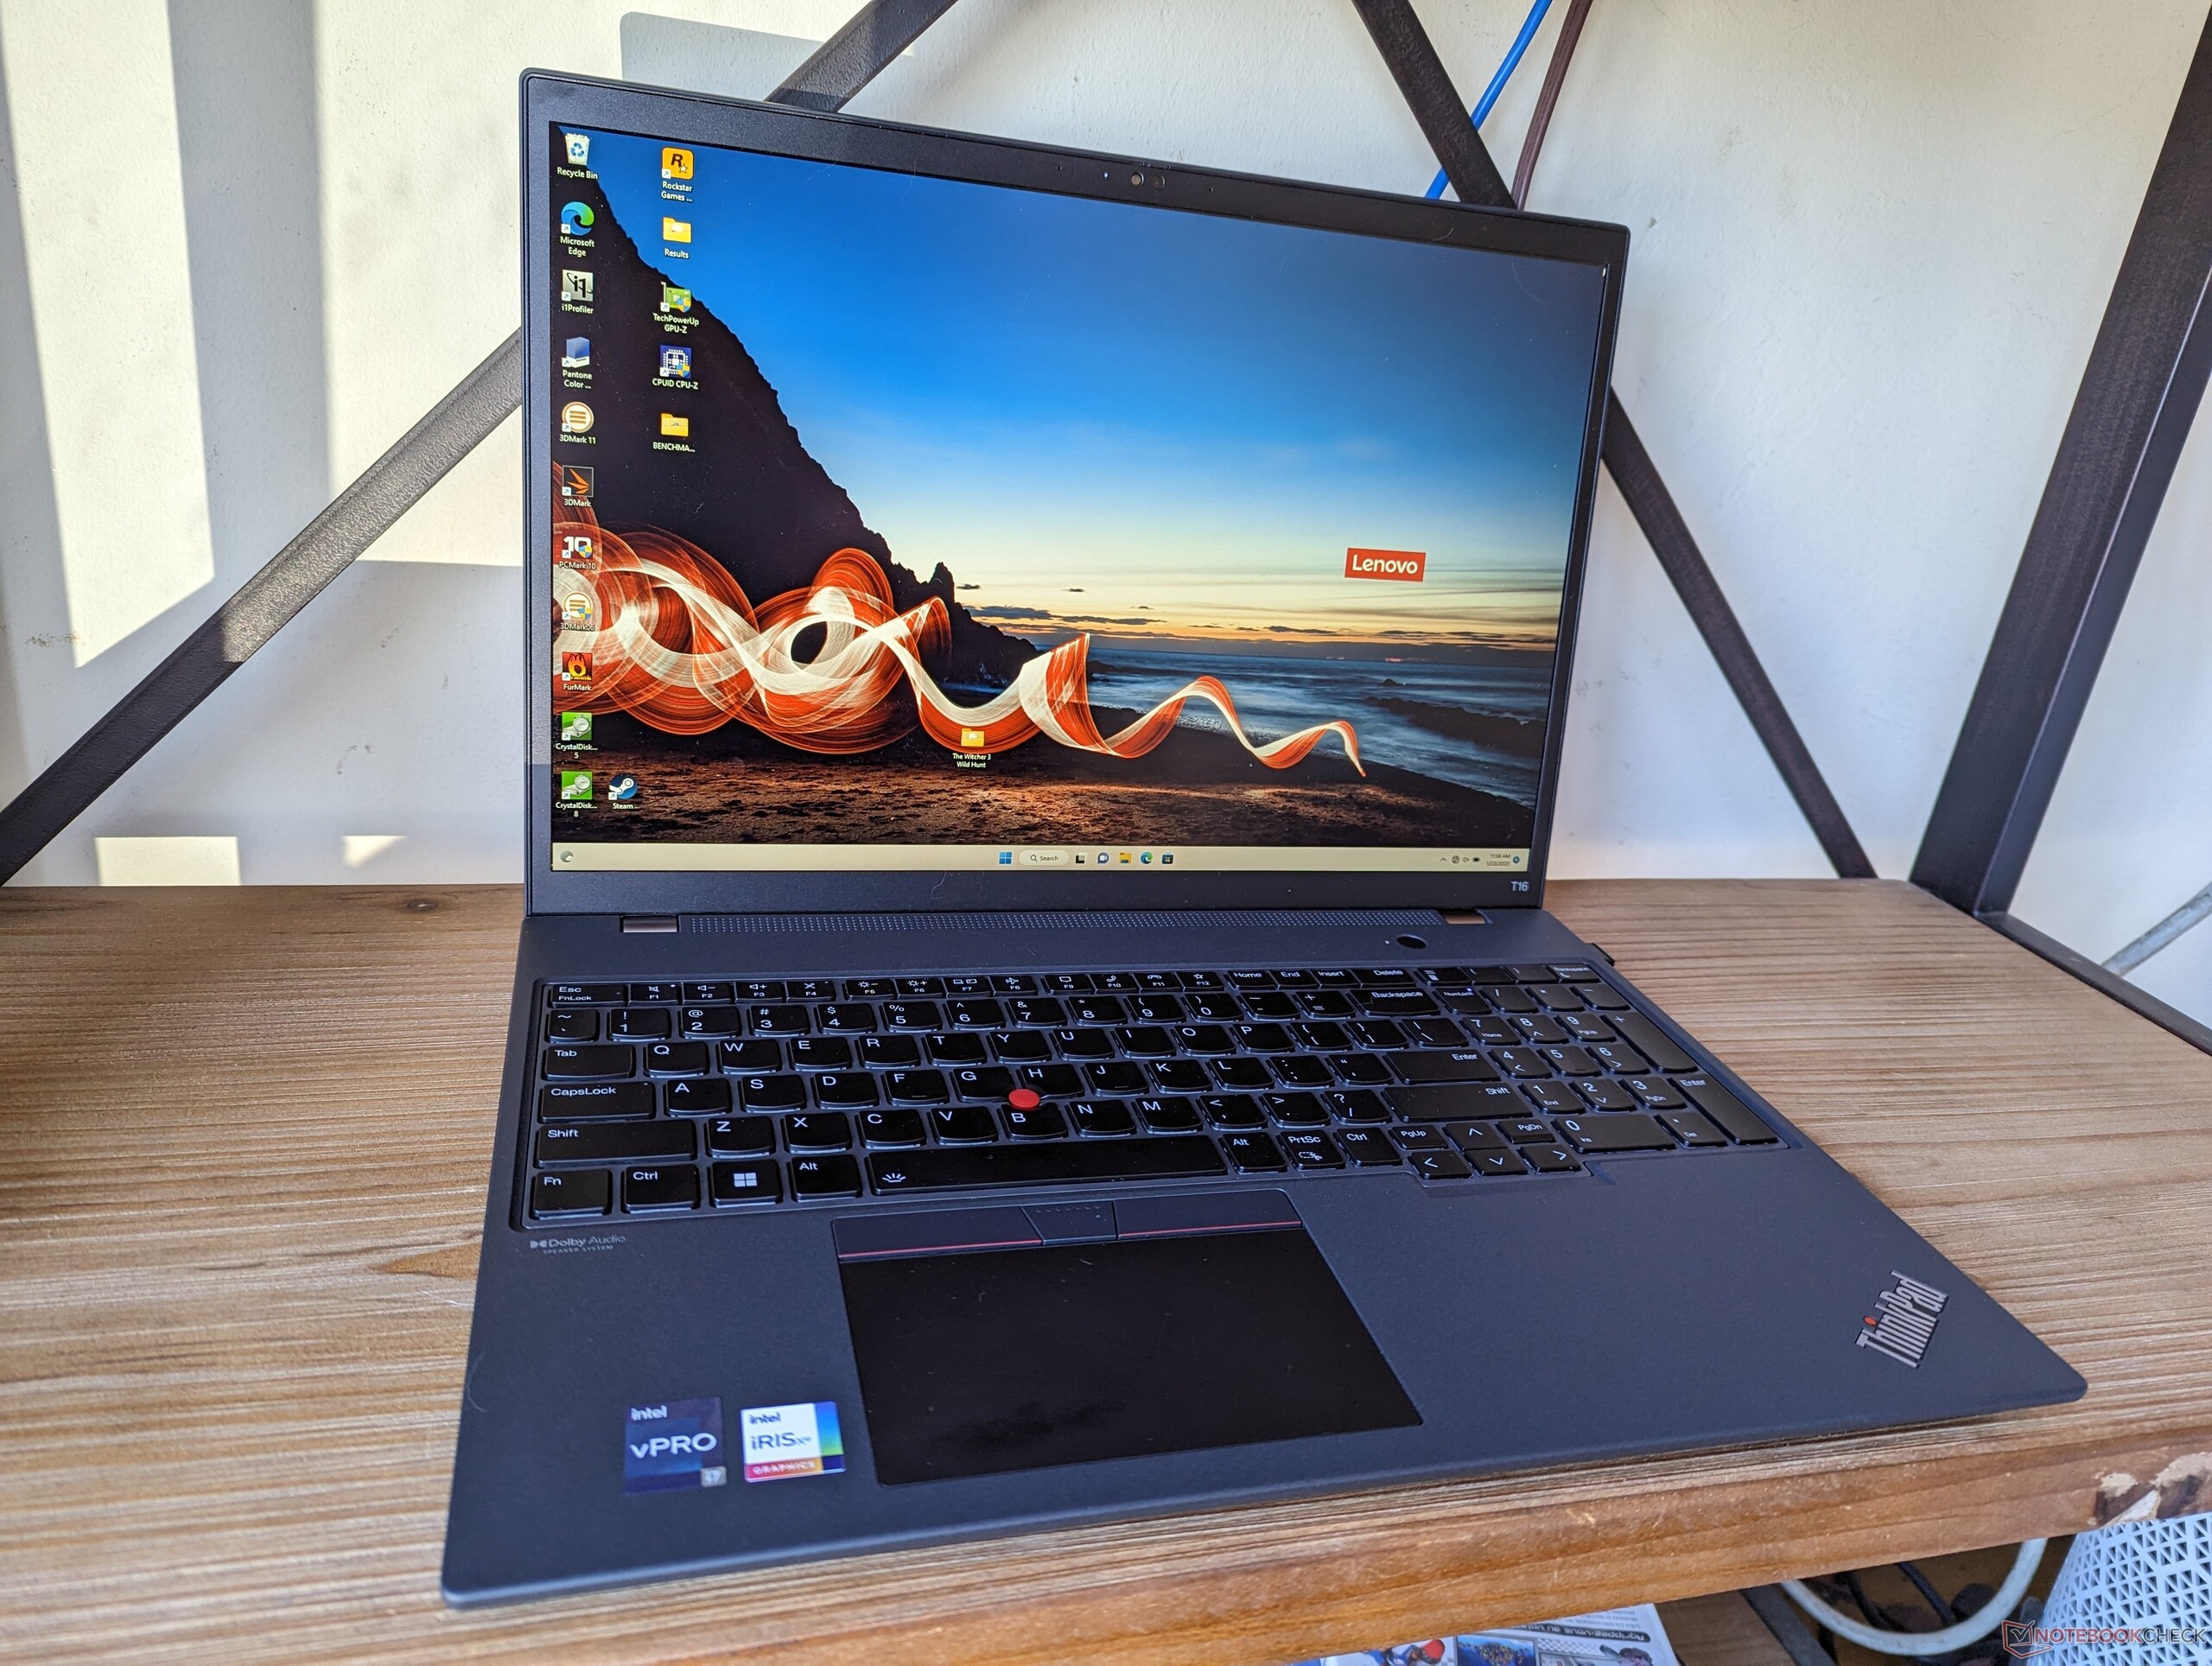
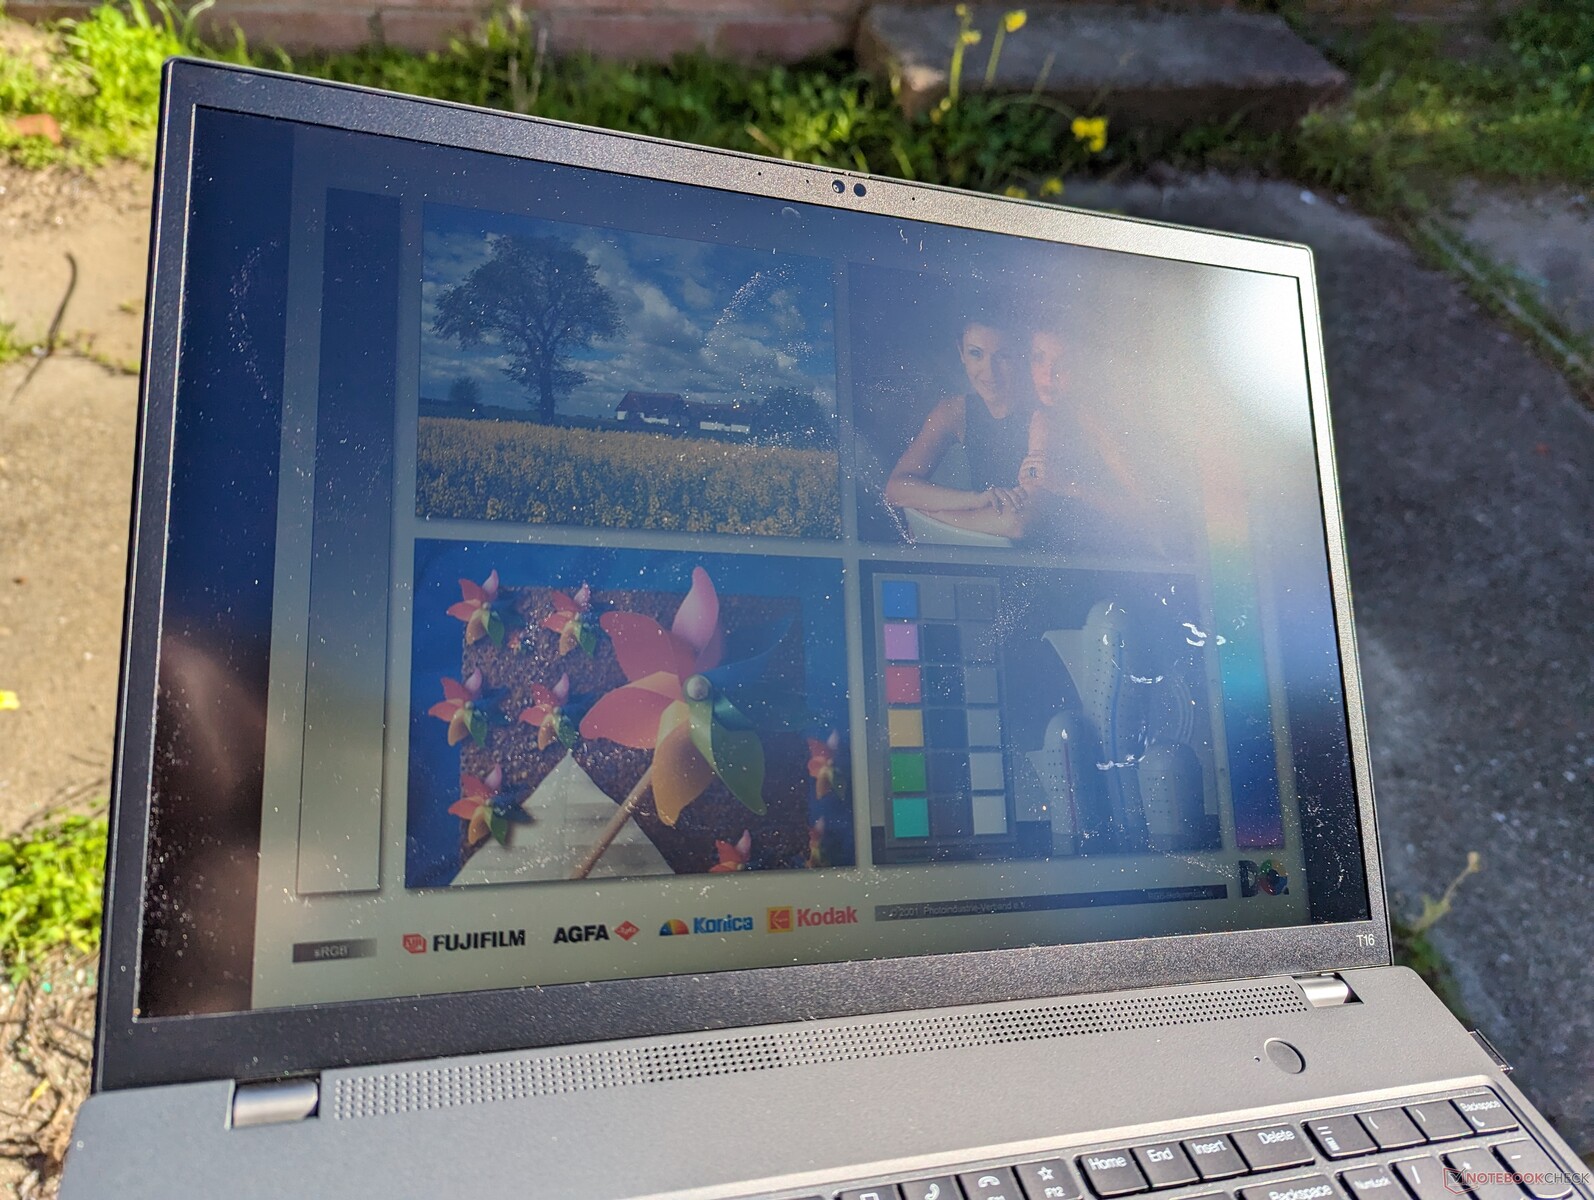
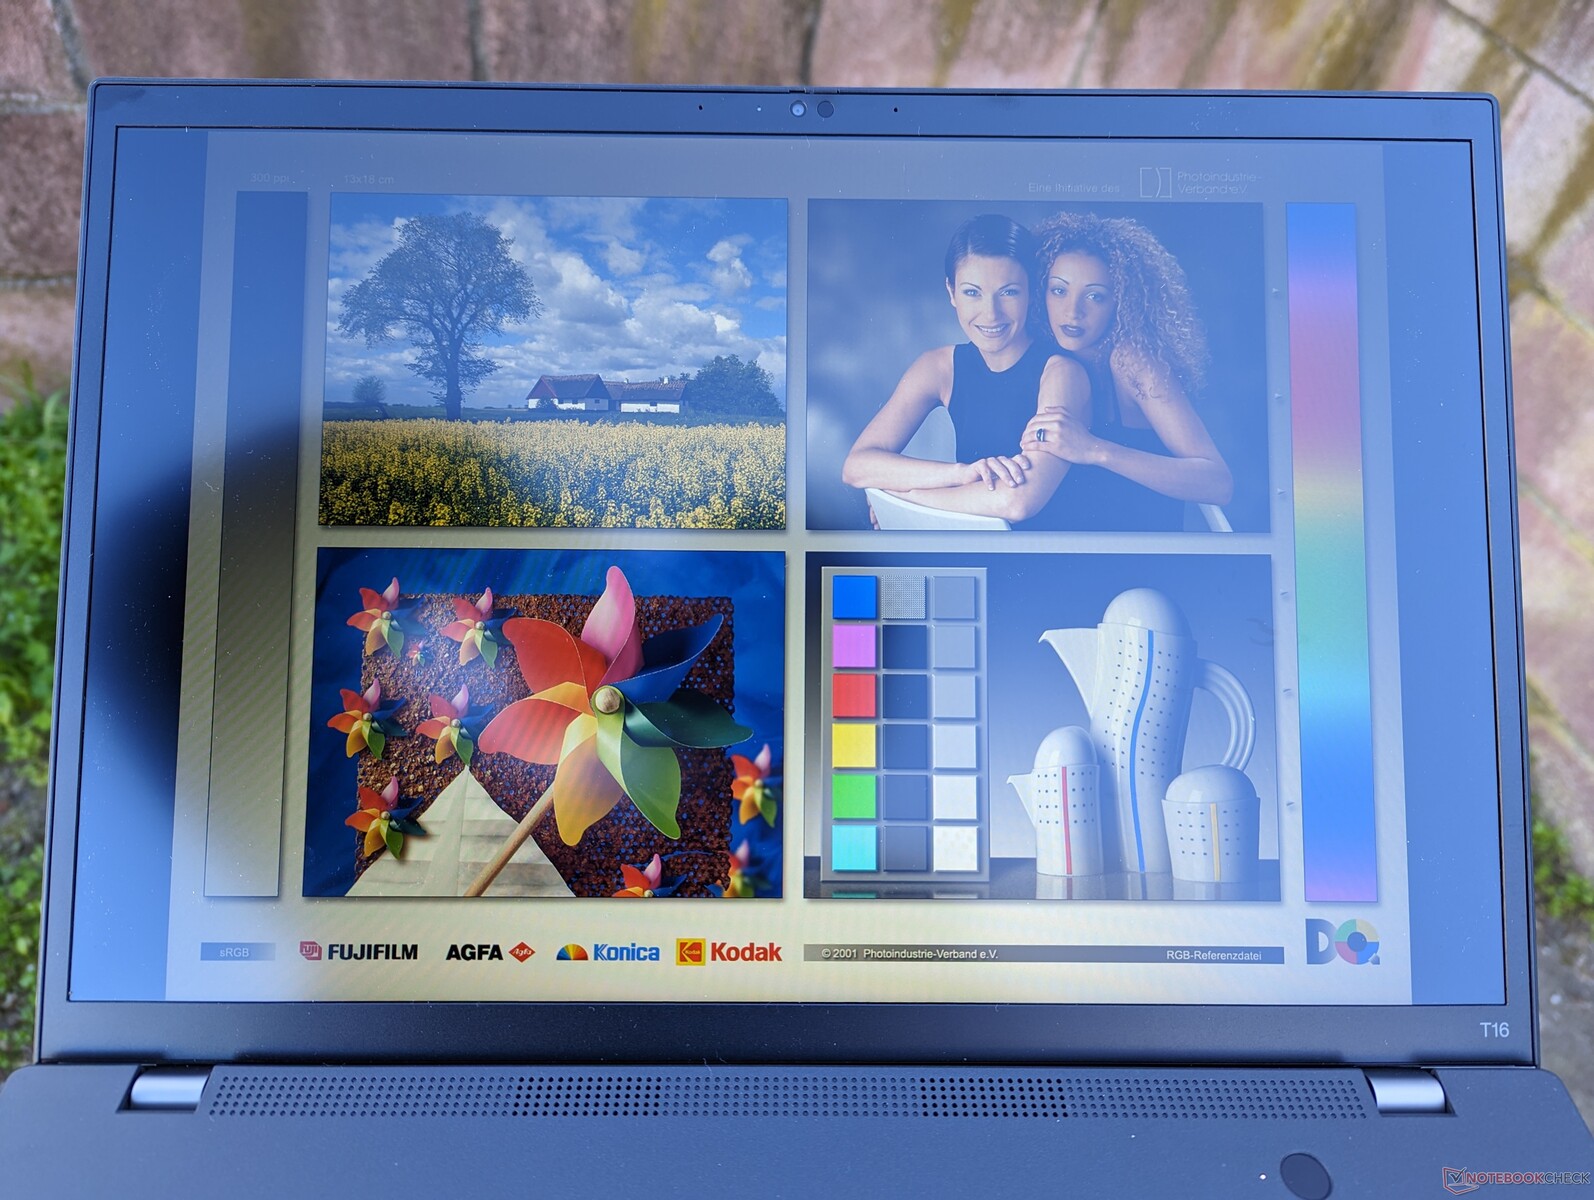
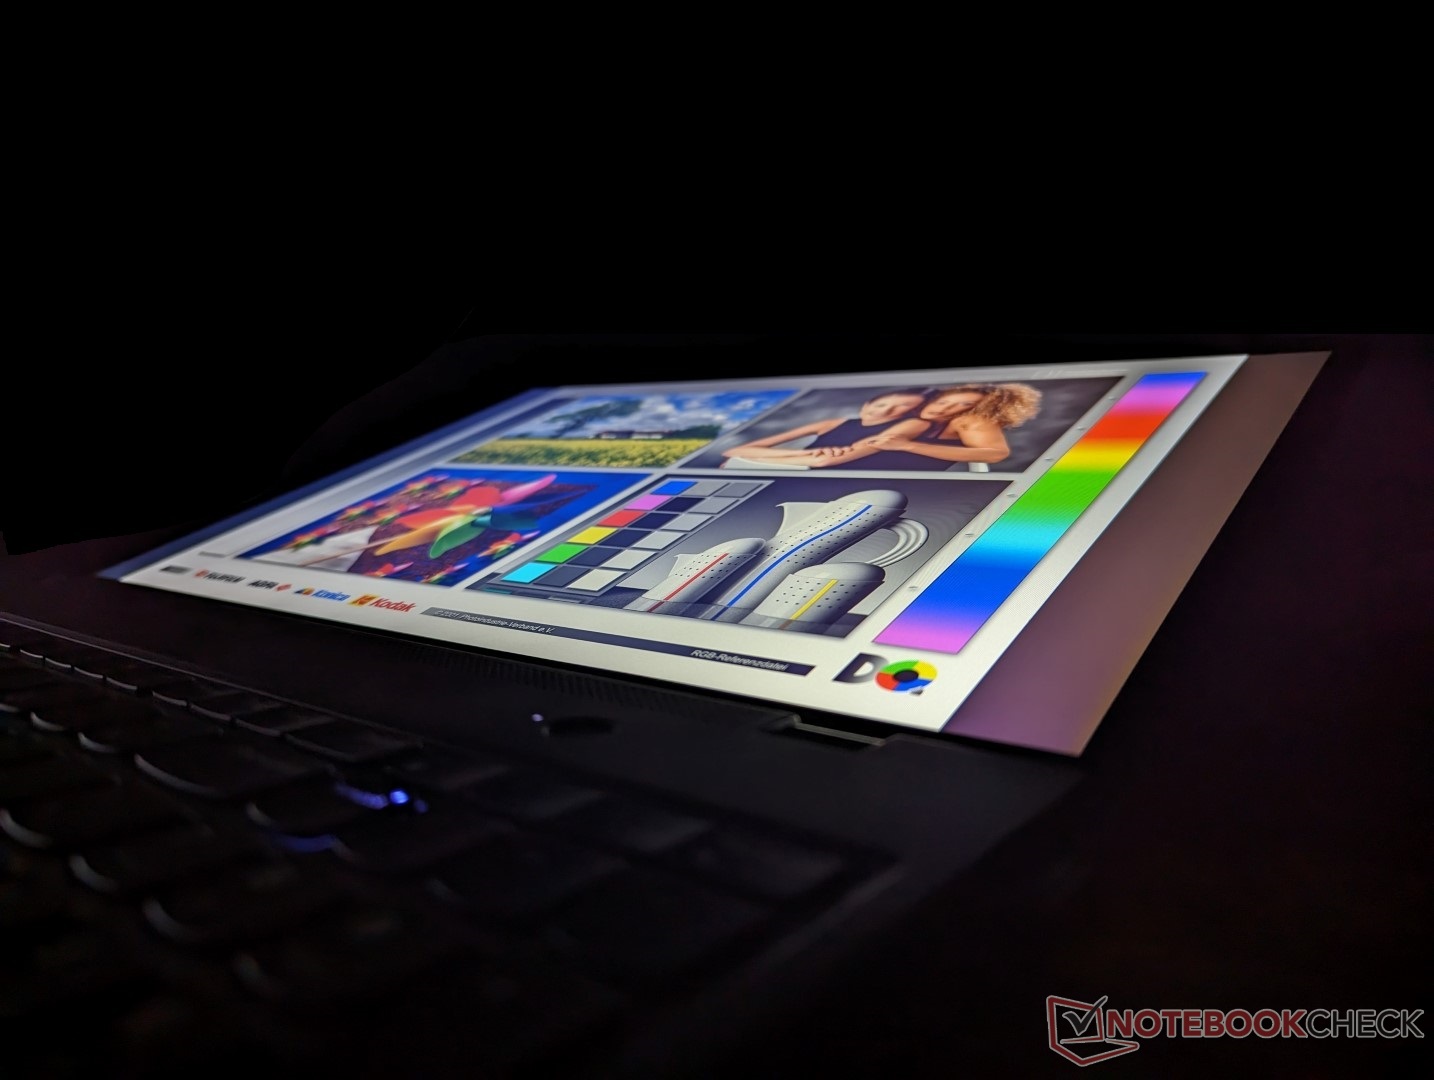
显示 - 从低端到高端
联想目前提供以下五种不同的哑光IPS显示屏选择。
- 1920 x 1200,300尼特,45% NTSC
- 1920 x 1200,300尼特,触摸屏,45% NTSC
- 1920 x 1200,低功率,400尼特,100% sRGB,低蓝光
- 1920 x 1200,带隐私保护的触摸屏,500尼特,100% sRGB,低蓝光
- 2560 x 1600,400尼特,低蓝光,经国际色彩协会校准
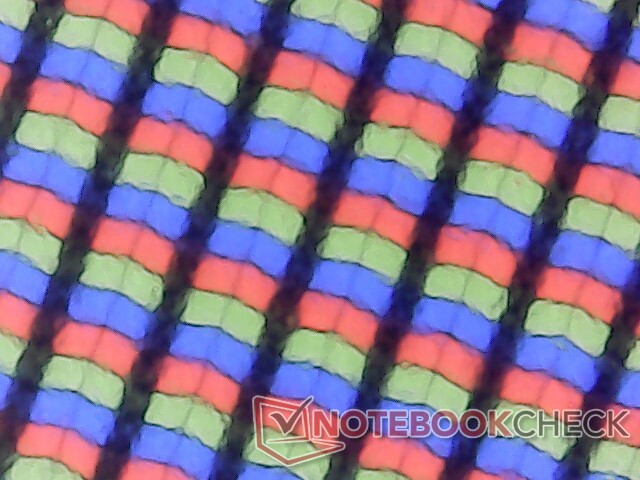
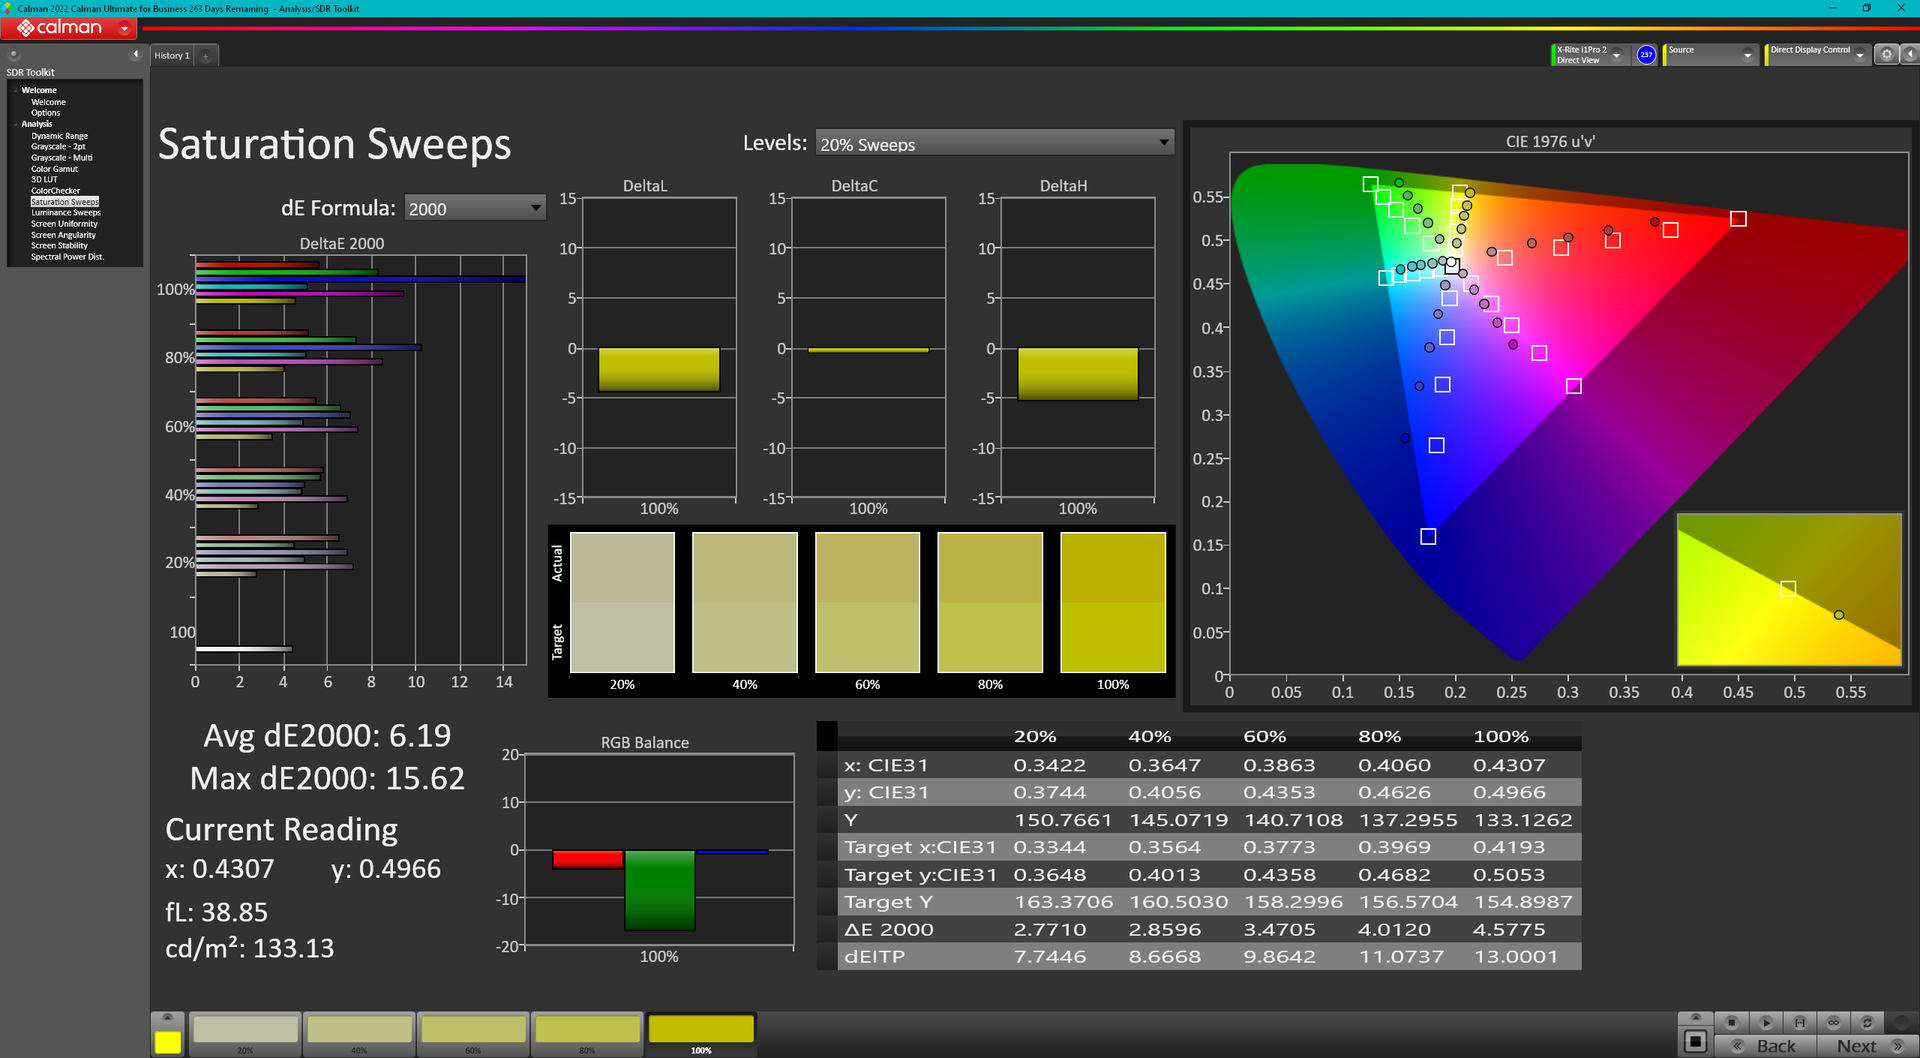
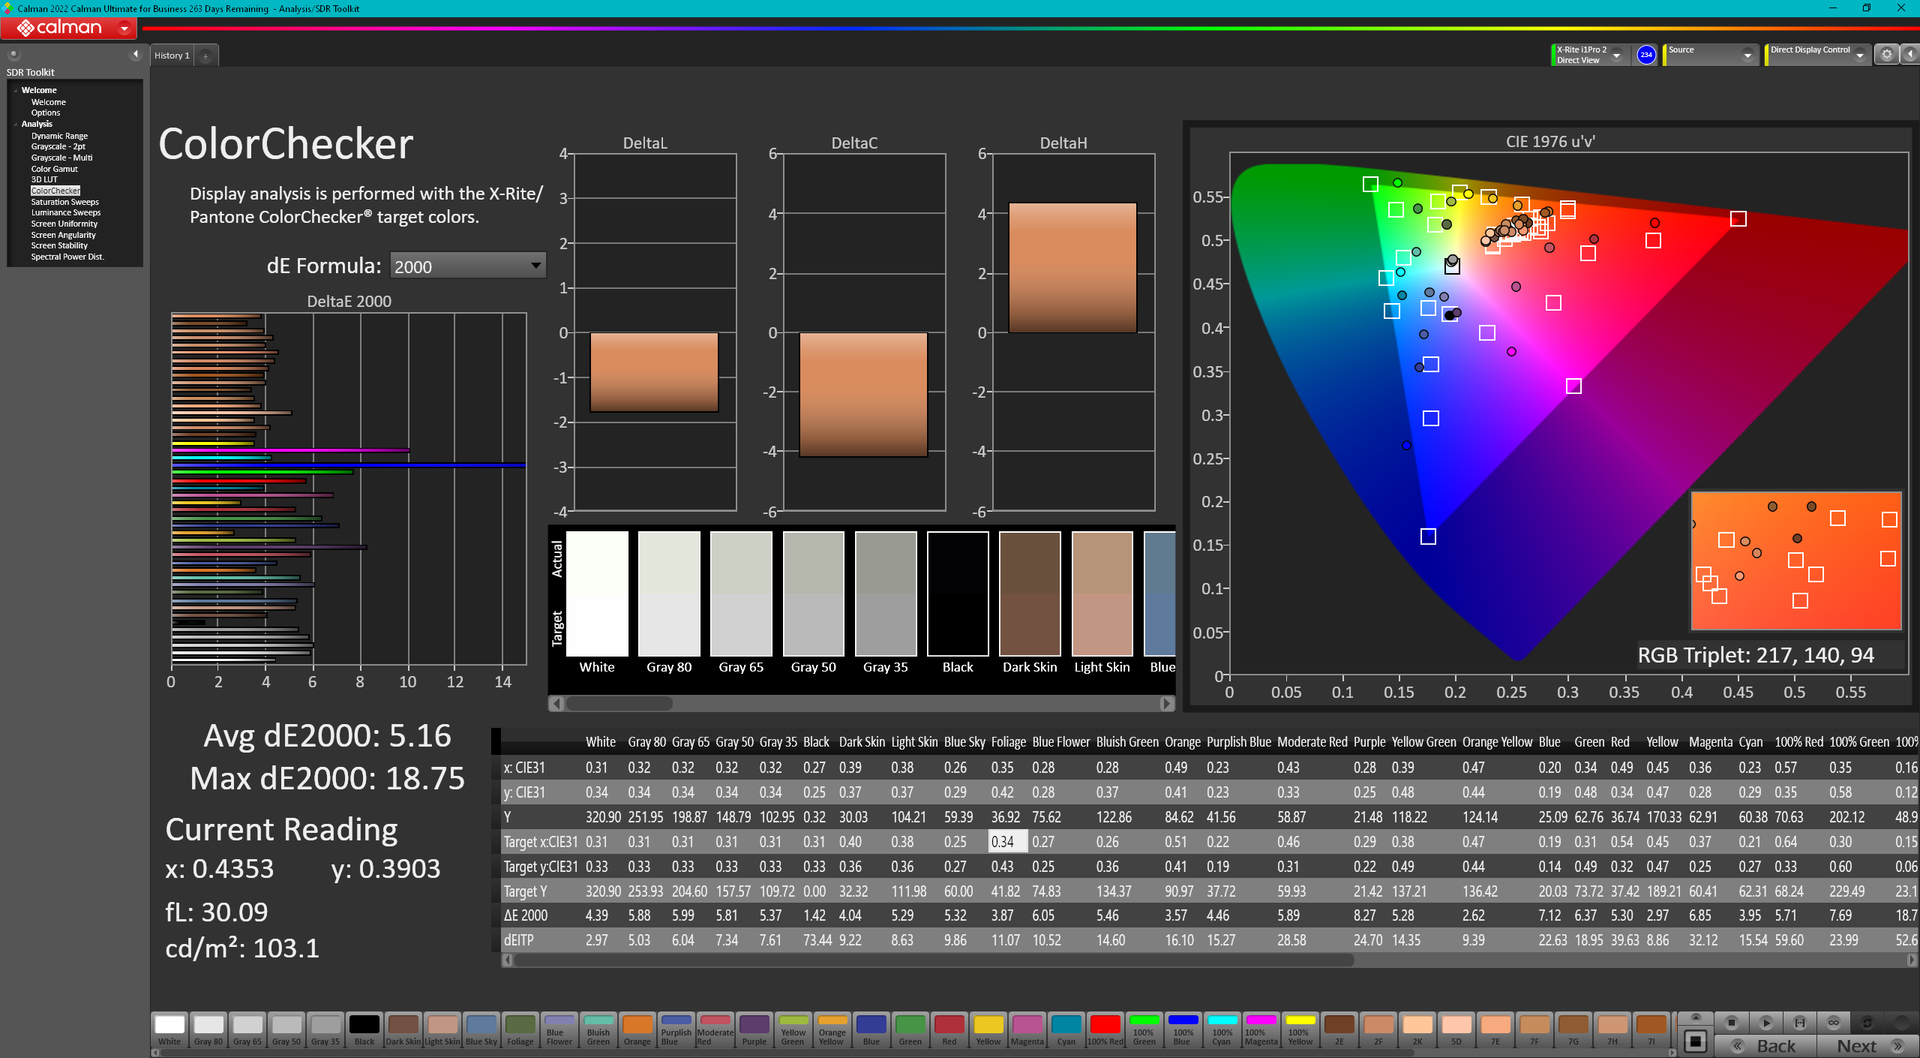
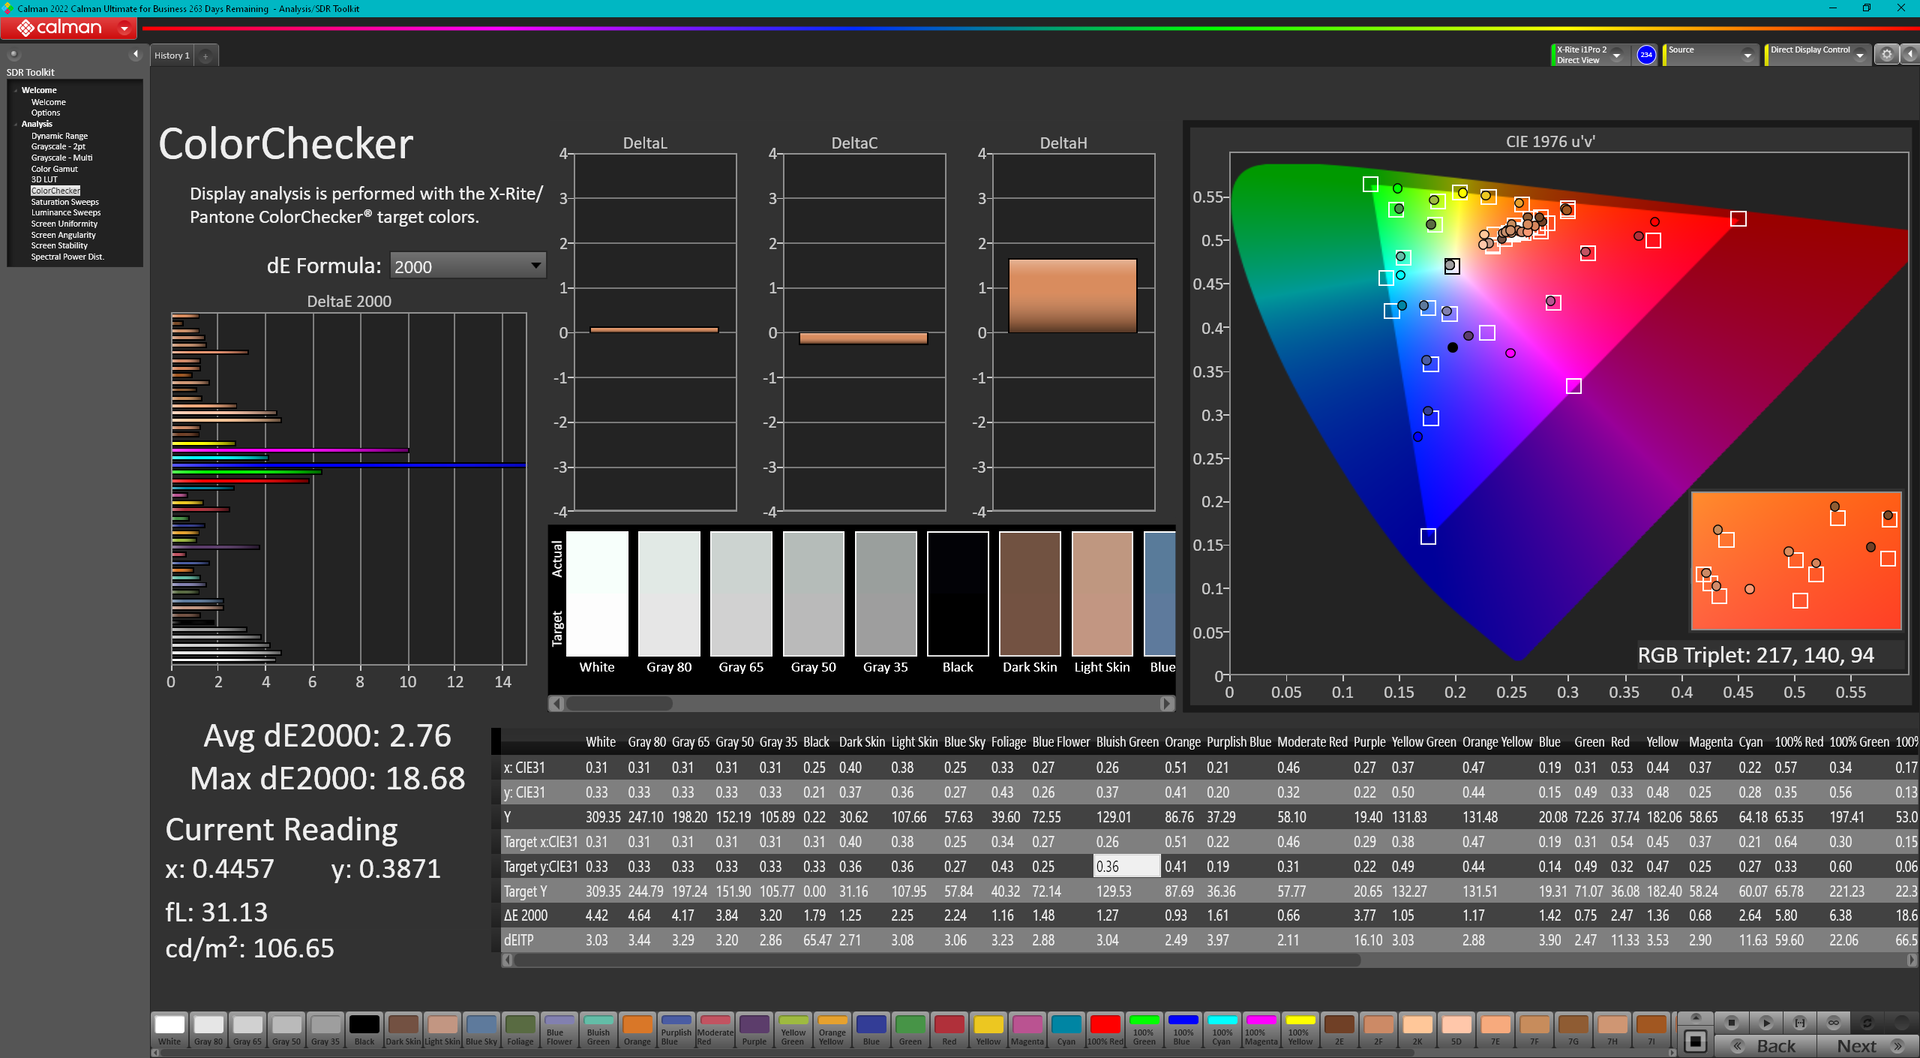
我们的配置配备了上面加粗的B160UAN03.2面板,这是价格最低的选择。与更高端的1600p面板相比,我们的1200p面板在色彩和清晰度上都有明显的差距。然而,它仍然是一个体面的显示器,特别是与其他具有类似的60%sRGB色域的面板相比,但你会想选择全sRGB覆盖,用于任何类型的视频或图形编辑。

| |||||||||||||||||||||||||
Brightness Distribution: 82 %
Center on Battery: 321.3 cd/m²
Contrast: 1036:1 (Black: 0.31 cd/m²)
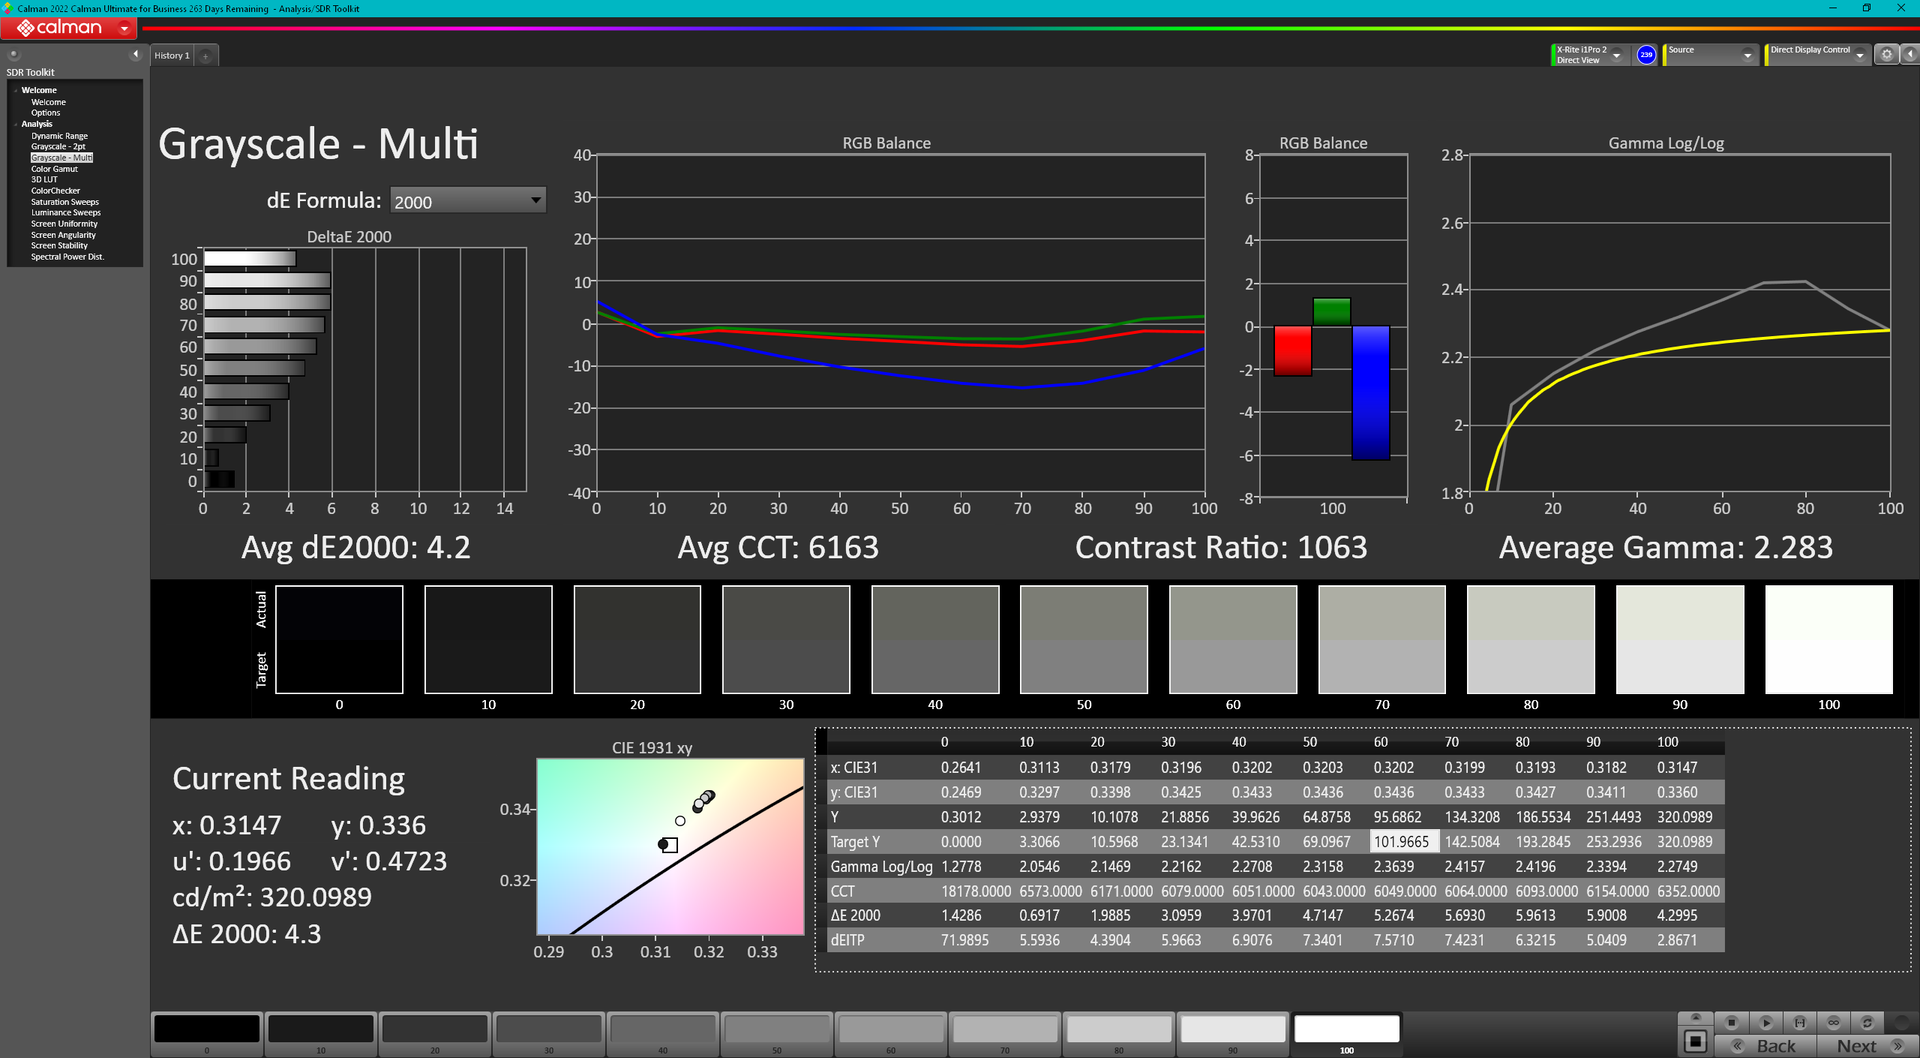
ΔE ColorChecker Calman: 5.16 | ∀{0.5-29.43 Ø4.71}
calibrated: 2.76
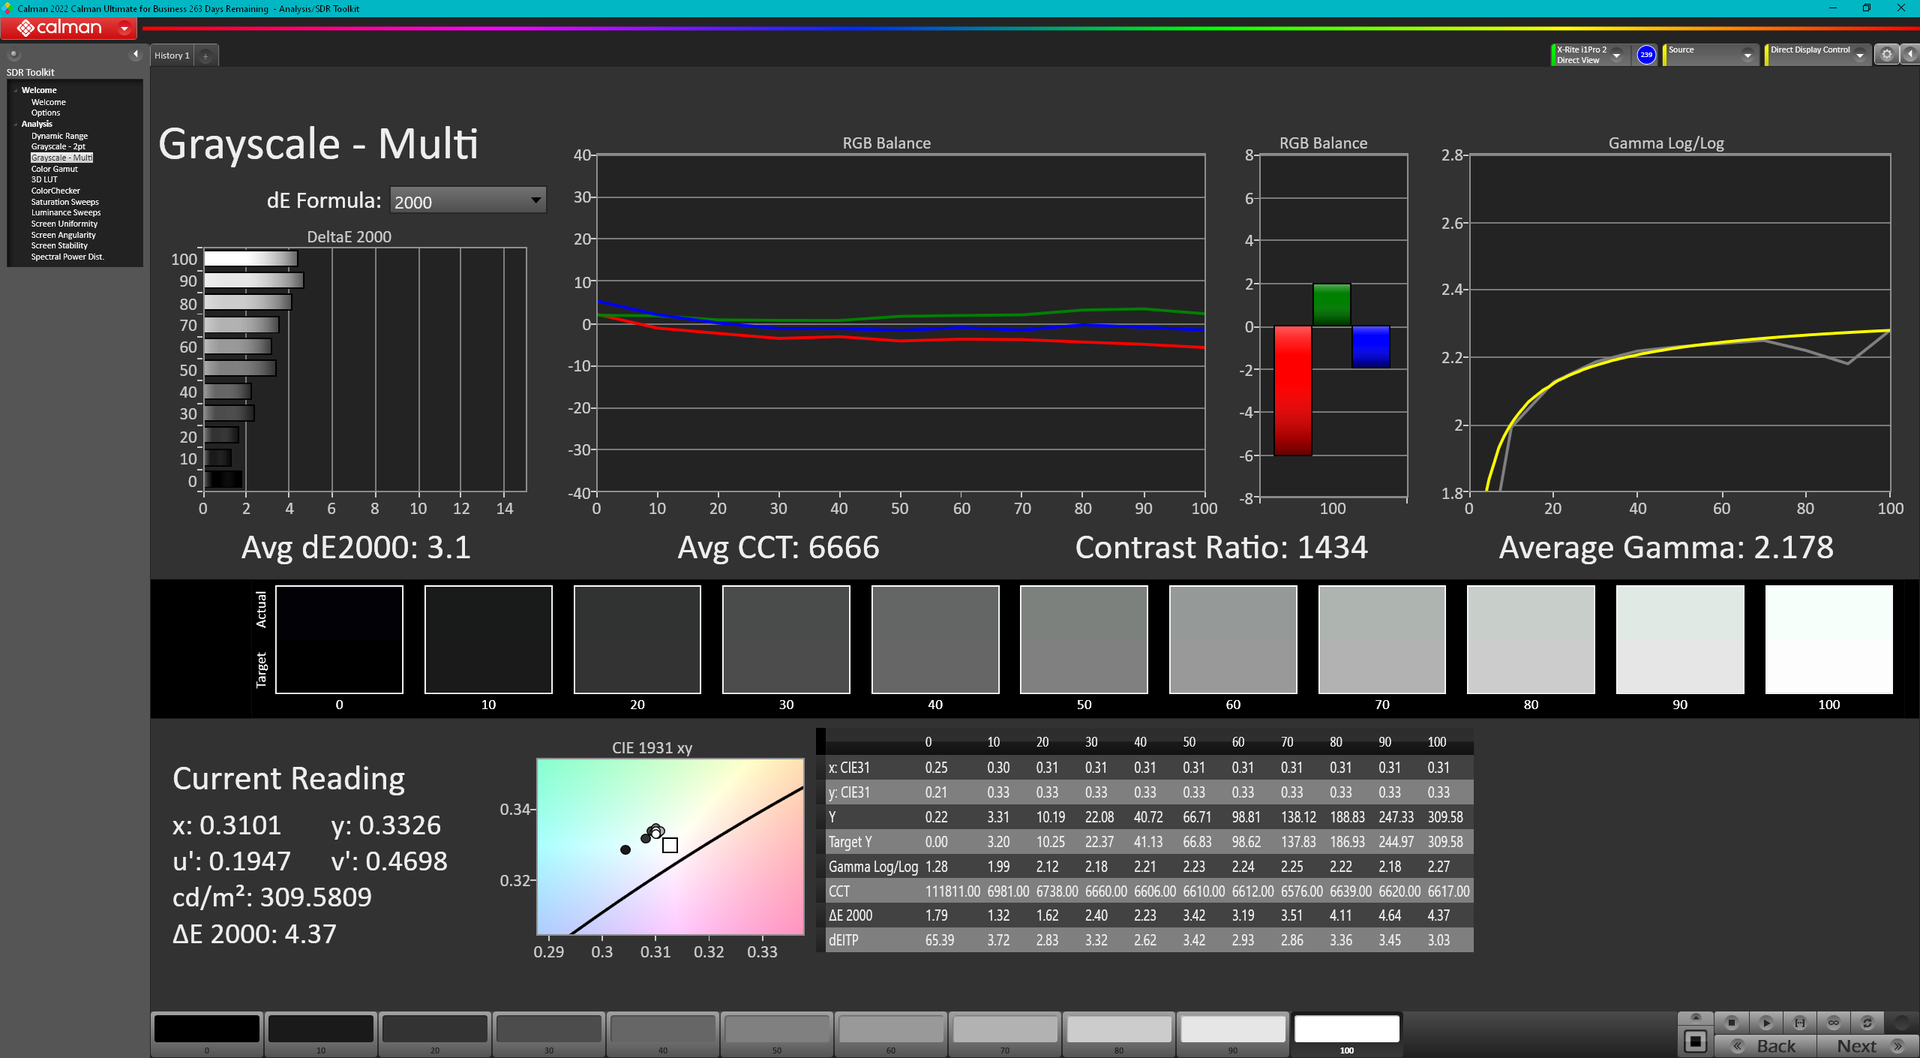
ΔE Greyscale Calman: 4.2 | ∀{0.09-98 Ø4.96}
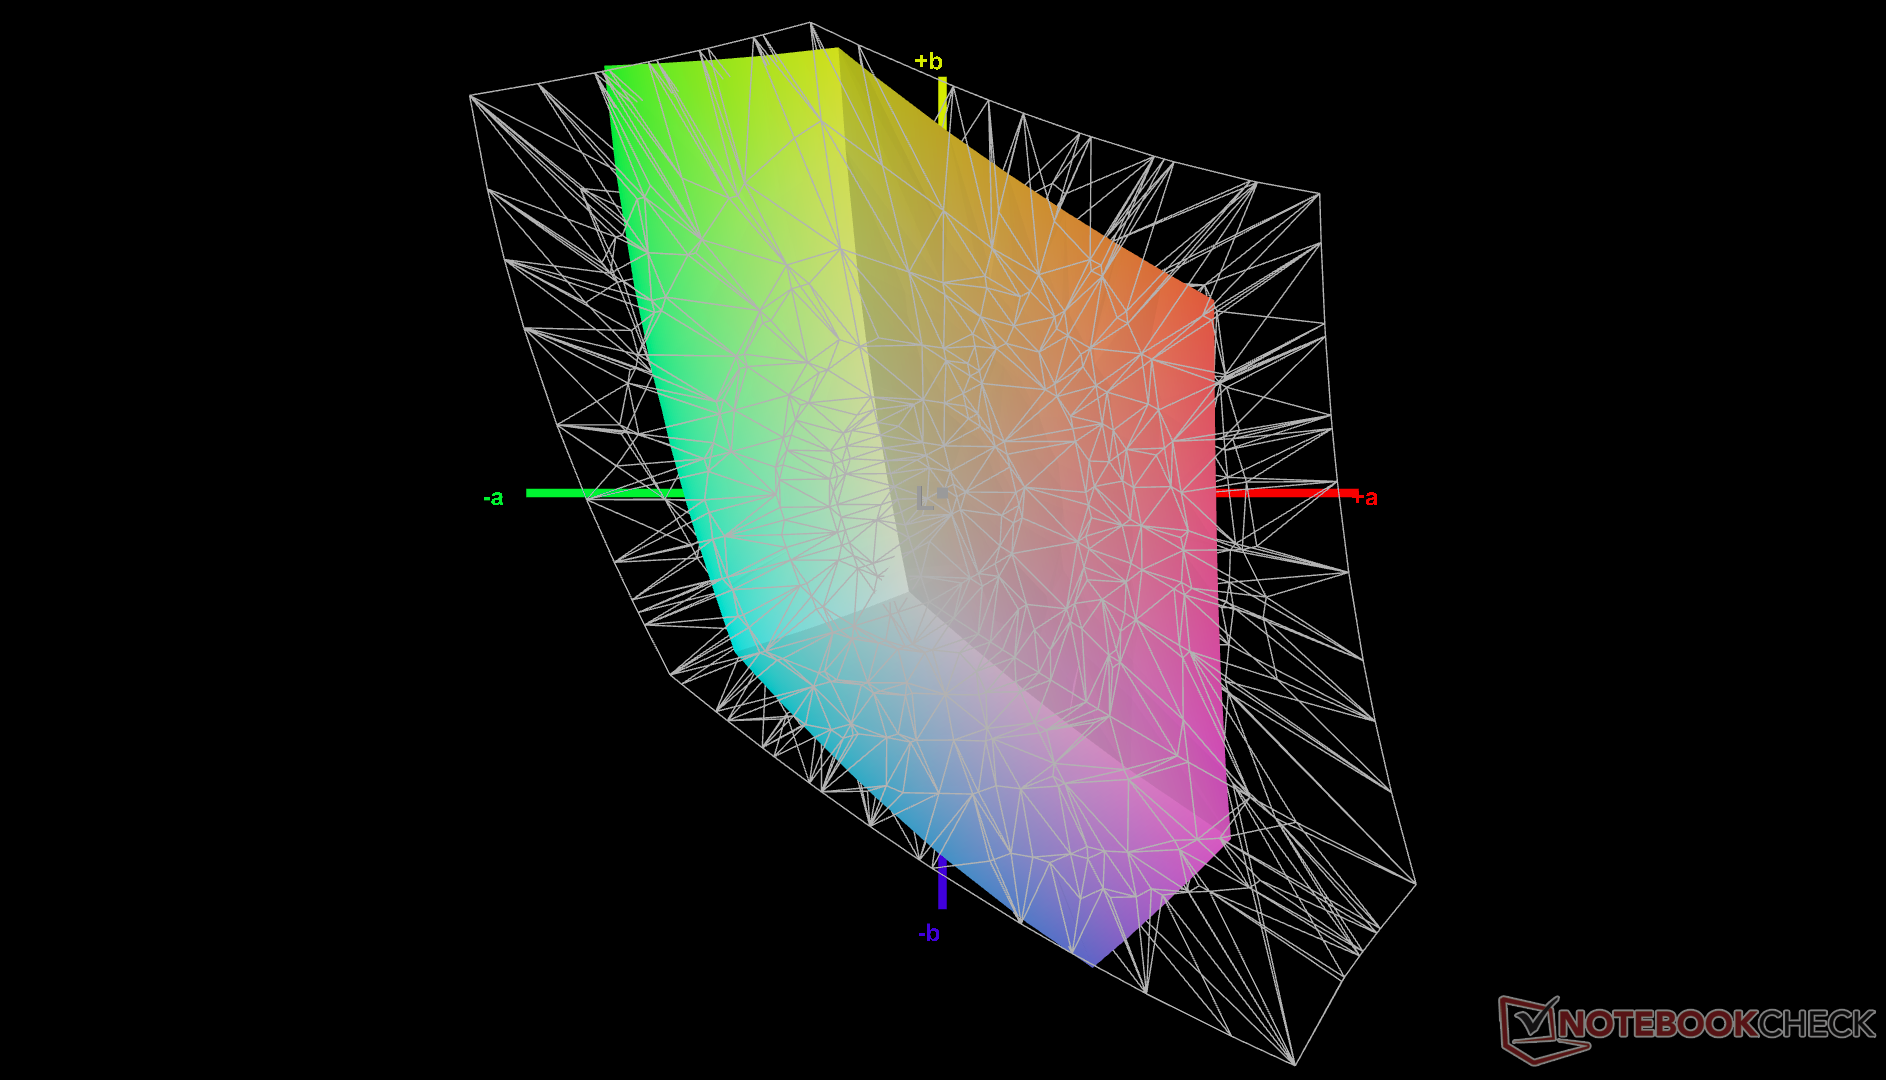
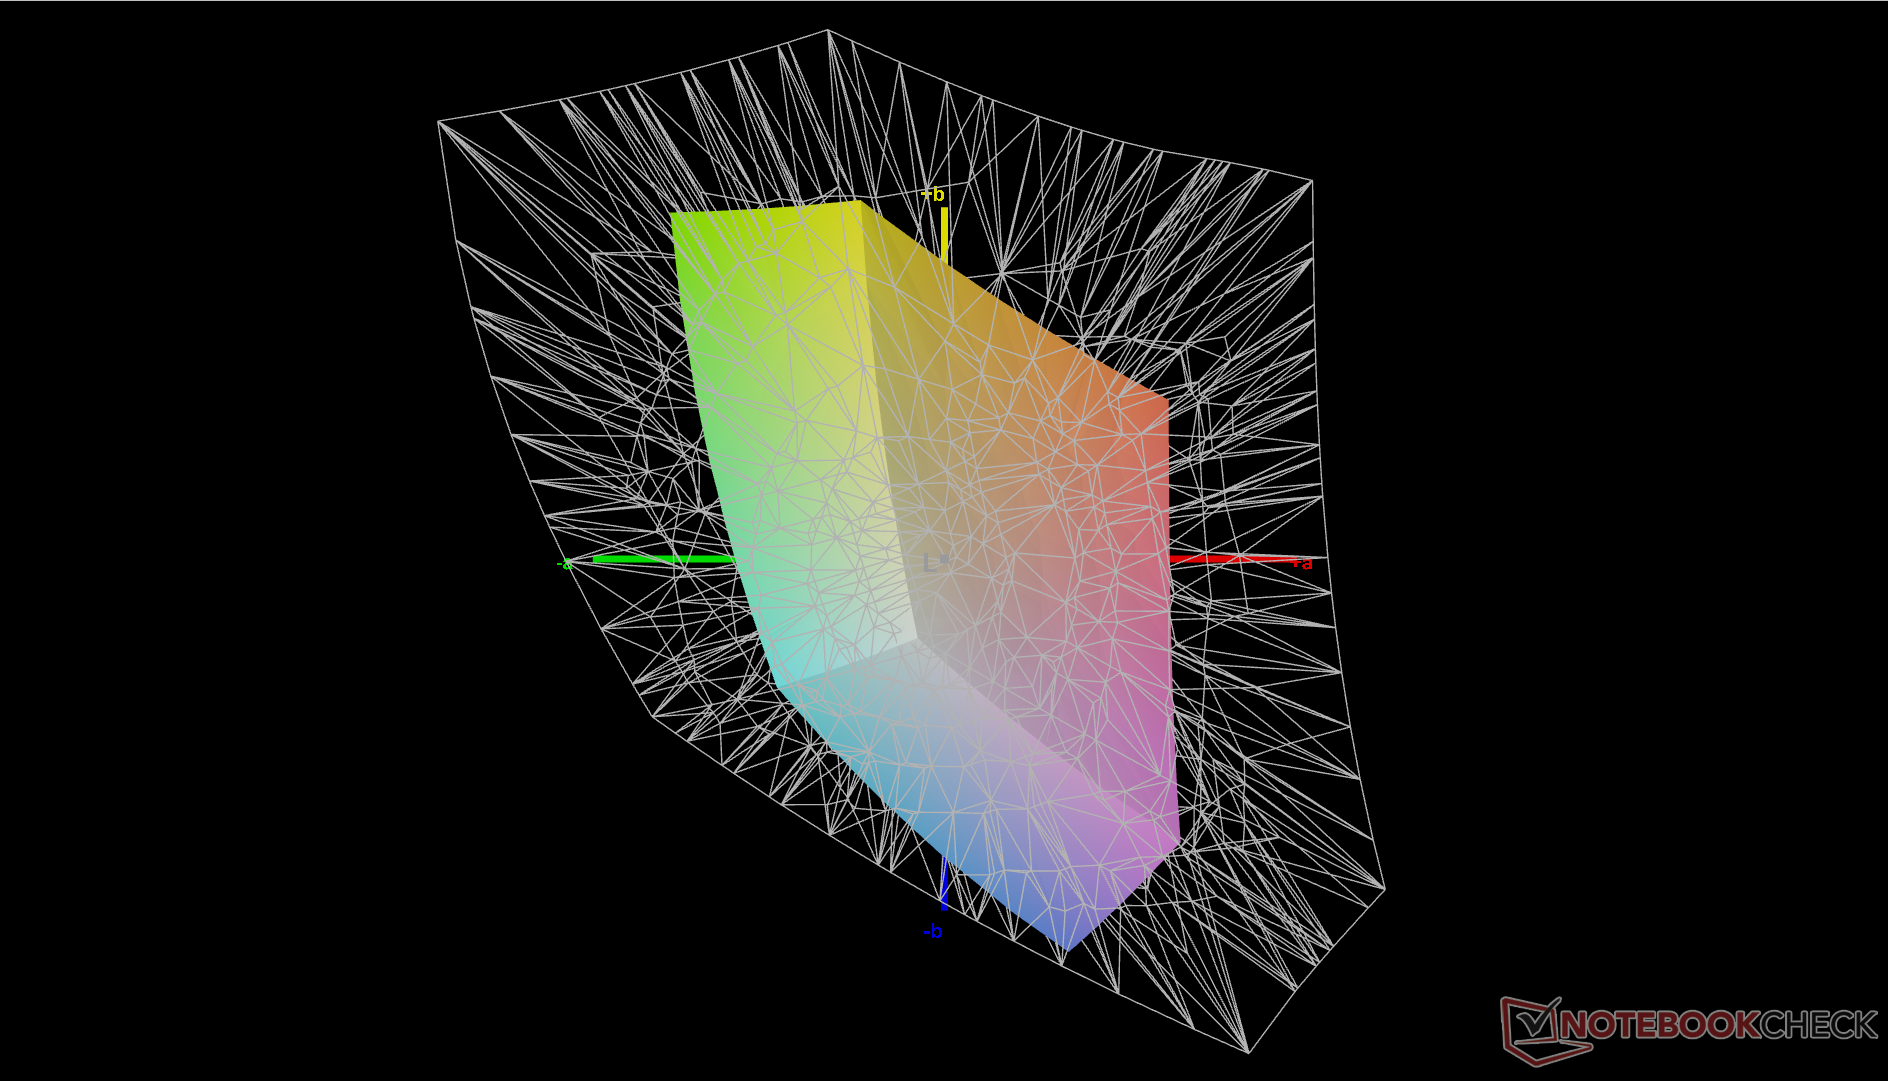
41% AdobeRGB 1998 (Argyll 3D)
59% sRGB (Argyll 3D)
39.7% Display P3 (Argyll 3D)
Gamma: 2.28
CCT: 6163 K
| Lenovo ThinkPad T16 Gen 1 Core i7-1270P B160UAN3.2, IPS, 1920x1200, 16" | Lenovo ThinkPad T16 G1 21CH004MGE MNG007DA1-C, IPS-LED, 2560x1600, 16" | LG Gram 16Z90Q LG LP160WQ1-SPB2 (LGD06EB), IPS, 2560x1600, 16" | HP EliteBook 865 G9 X160NV42, IPS, 1920x1200, 16" | Huawei MateBook 16s i7 BOE XS TV160DKT-NH0, IPS, 2520x1680, 16" | Apple MacBook Pro 16 2021 M1 Pro Liquid Retina XDR, Mini-LED, 3456x2234, 16.2" | |
|---|---|---|---|---|---|---|
| Display | 66% | 106% | 76% | 63% | 111% | |
| Display P3 Coverage (%) | 39.7 | 66.7 68% | 96.8 144% | 71.4 80% | 64.5 62% | 99.1 150% |
| sRGB Coverage (%) | 59 | 95.7 62% | 99.9 69% | 99.3 68% | 96.7 64% | 100 69% |
| AdobeRGB 1998 Coverage (%) | 41 | 69.1 69% | 84.6 106% | 73.2 79% | 66.6 62% | 88 115% |
| Response Times | 7% | -19% | -9% | -9% | -161% | |
| Response Time Grey 50% / Grey 80% * (ms) | 29.2 ? | 32.1 ? -10% | 45.7 ? -57% | 35.5 ? -22% | 35.7 ? -22% | 42.8 ? -47% |
| Response Time Black / White * (ms) | 24.4 ? | 18.9 ? 23% | 19.7 ? 19% | 23.5 ? 4% | 23.2 ? 5% | 91.6 ? -275% |
| PWM Frequency (Hz) | 56.7 | 14880 | ||||
| Screen | 43% | 23% | 73% | 49% | 352% | |
| Brightness middle (cd/m²) | 321.3 | 417 30% | 366 14% | 865 169% | 311 -3% | 514 60% |
| Brightness (cd/m²) | 315 | 388 23% | 347 10% | 771 145% | 319 1% | 497 58% |
| Brightness Distribution (%) | 82 | 81 -1% | 89 9% | 72 -12% | 91 11% | 95 16% |
| Black Level * (cd/m²) | 0.31 | 0.24 23% | 0.32 -3% | 0.3 3% | 0.17 45% | 0.02 94% |
| Contrast (:1) | 1036 | 1738 68% | 1144 10% | 2883 178% | 1829 77% | 25700 2381% |
| Colorchecker dE 2000 * | 5.16 | 1.7 67% | 2.82 45% | 2.4 53% | 1 81% | 1.4 73% |
| Colorchecker dE 2000 max. * | 18.75 | 3.5 81% | 4.65 75% | 5.8 69% | 1.7 91% | 2.8 85% |
| Colorchecker dE 2000 calibrated * | 2.76 | 1.4 49% | 2.69 3% | 1.5 46% | 0.8 71% | |
| Greyscale dE 2000 * | 4.2 | 2.4 43% | 2.3 45% | 3.8 10% | 1.5 64% | 2.3 45% |
| Gamma | 2.28 96% | 2.16 102% | 1.971 112% | 2.36 93% | 2.15 102% | 2.27 97% |
| CCT | 6163 105% | 6924 94% | 6796 96% | 6922 94% | 6432 101% | 6792 96% |
| Total Average (Program / Settings) | 39% /
43% | 37% /
35% | 47% /
62% | 34% /
44% | 101% /
217% |
* ... smaller is better
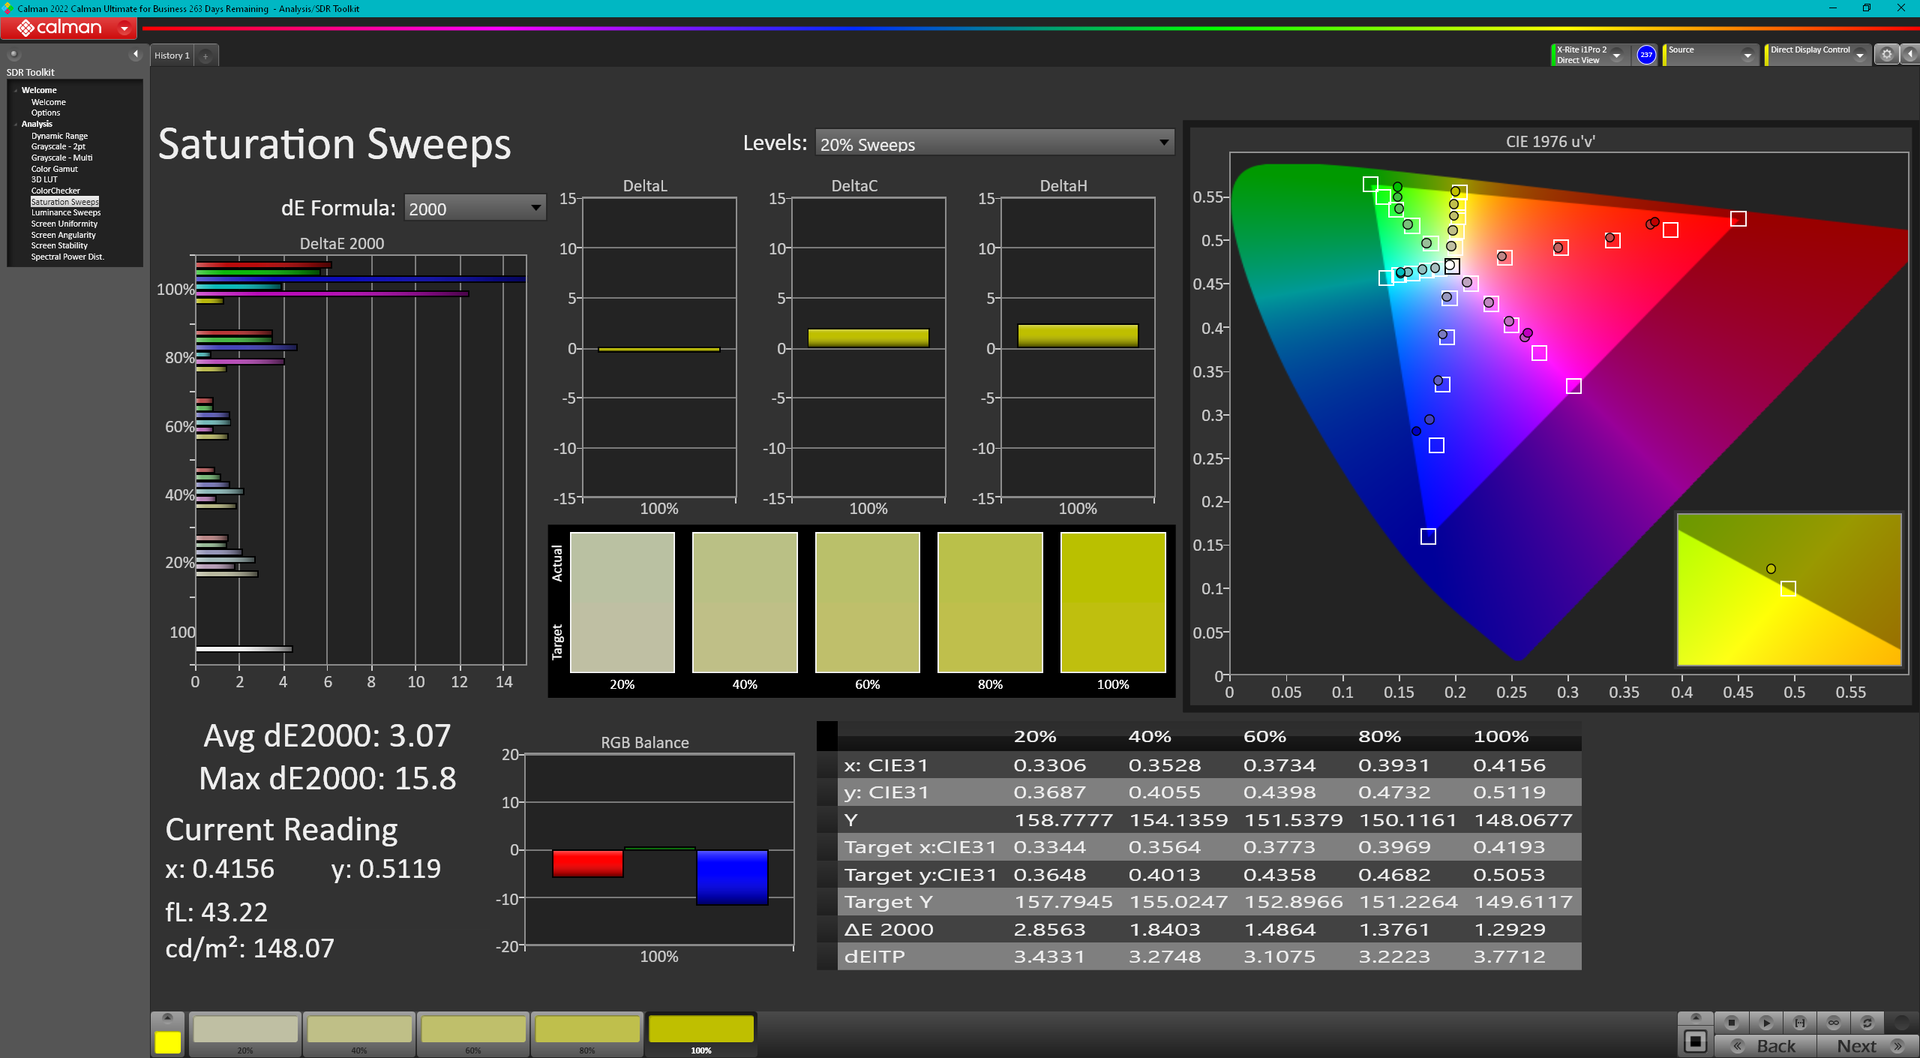
色温在开箱后过于温暖,幸运的是可以通过适当的校准来解决。平均色彩DeltaE将从5.05提高到2.23,但由于面板的色彩覆盖面有限,在高饱和度水平上色彩仍然不准确。我们建议应用我们上述校准过的ICM配置文件,因为该显示器在出厂时没有校准。
Display Response Times
| ↔ Response Time Black to White | ||
|---|---|---|
| 24.4 ms ... rise ↗ and fall ↘ combined | ↗ 14 ms rise | 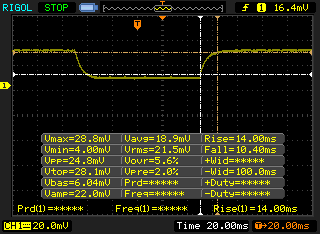 |
| ↘ 10.4 ms fall | ||
| The screen shows good response rates in our tests, but may be too slow for competitive gamers. In comparison, all tested devices range from 0.1 (minimum) to 240 (maximum) ms. » 58 % of all devices are better. This means that the measured response time is worse than the average of all tested devices (19.8 ms). | ||
| ↔ Response Time 50% Grey to 80% Grey | ||
| 29.2 ms ... rise ↗ and fall ↘ combined | ↗ 15.6 ms rise | 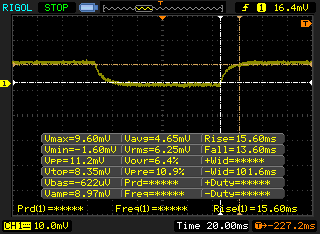 |
| ↘ 13.6 ms fall | ||
| The screen shows relatively slow response rates in our tests and may be too slow for gamers. In comparison, all tested devices range from 0.165 (minimum) to 636 (maximum) ms. » 40 % of all devices are better. This means that the measured response time is similar to the average of all tested devices (30.9 ms). | ||
Screen Flickering / PWM (Pulse-Width Modulation)
| Screen flickering / PWM not detected | 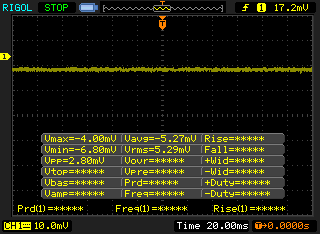 | ||
In comparison: 52 % of all tested devices do not use PWM to dim the display. If PWM was detected, an average of 7748 (minimum: 5 - maximum: 343500) Hz was measured. | |||
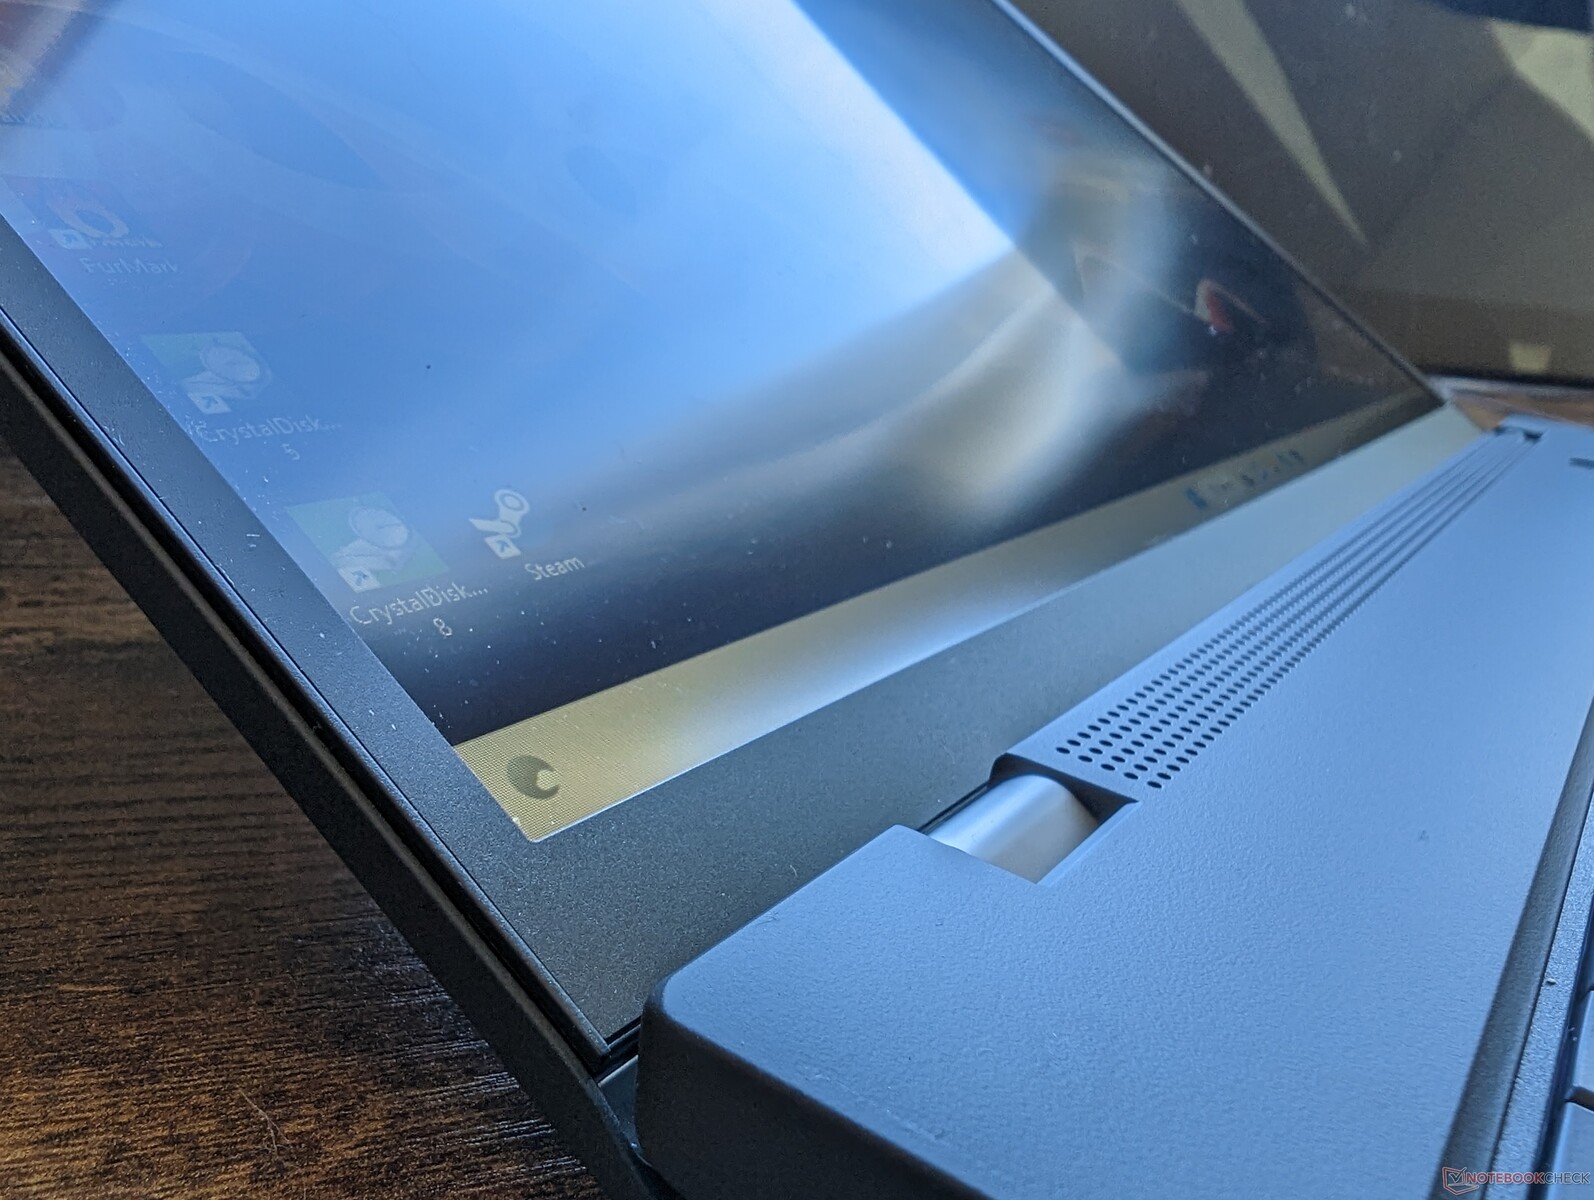
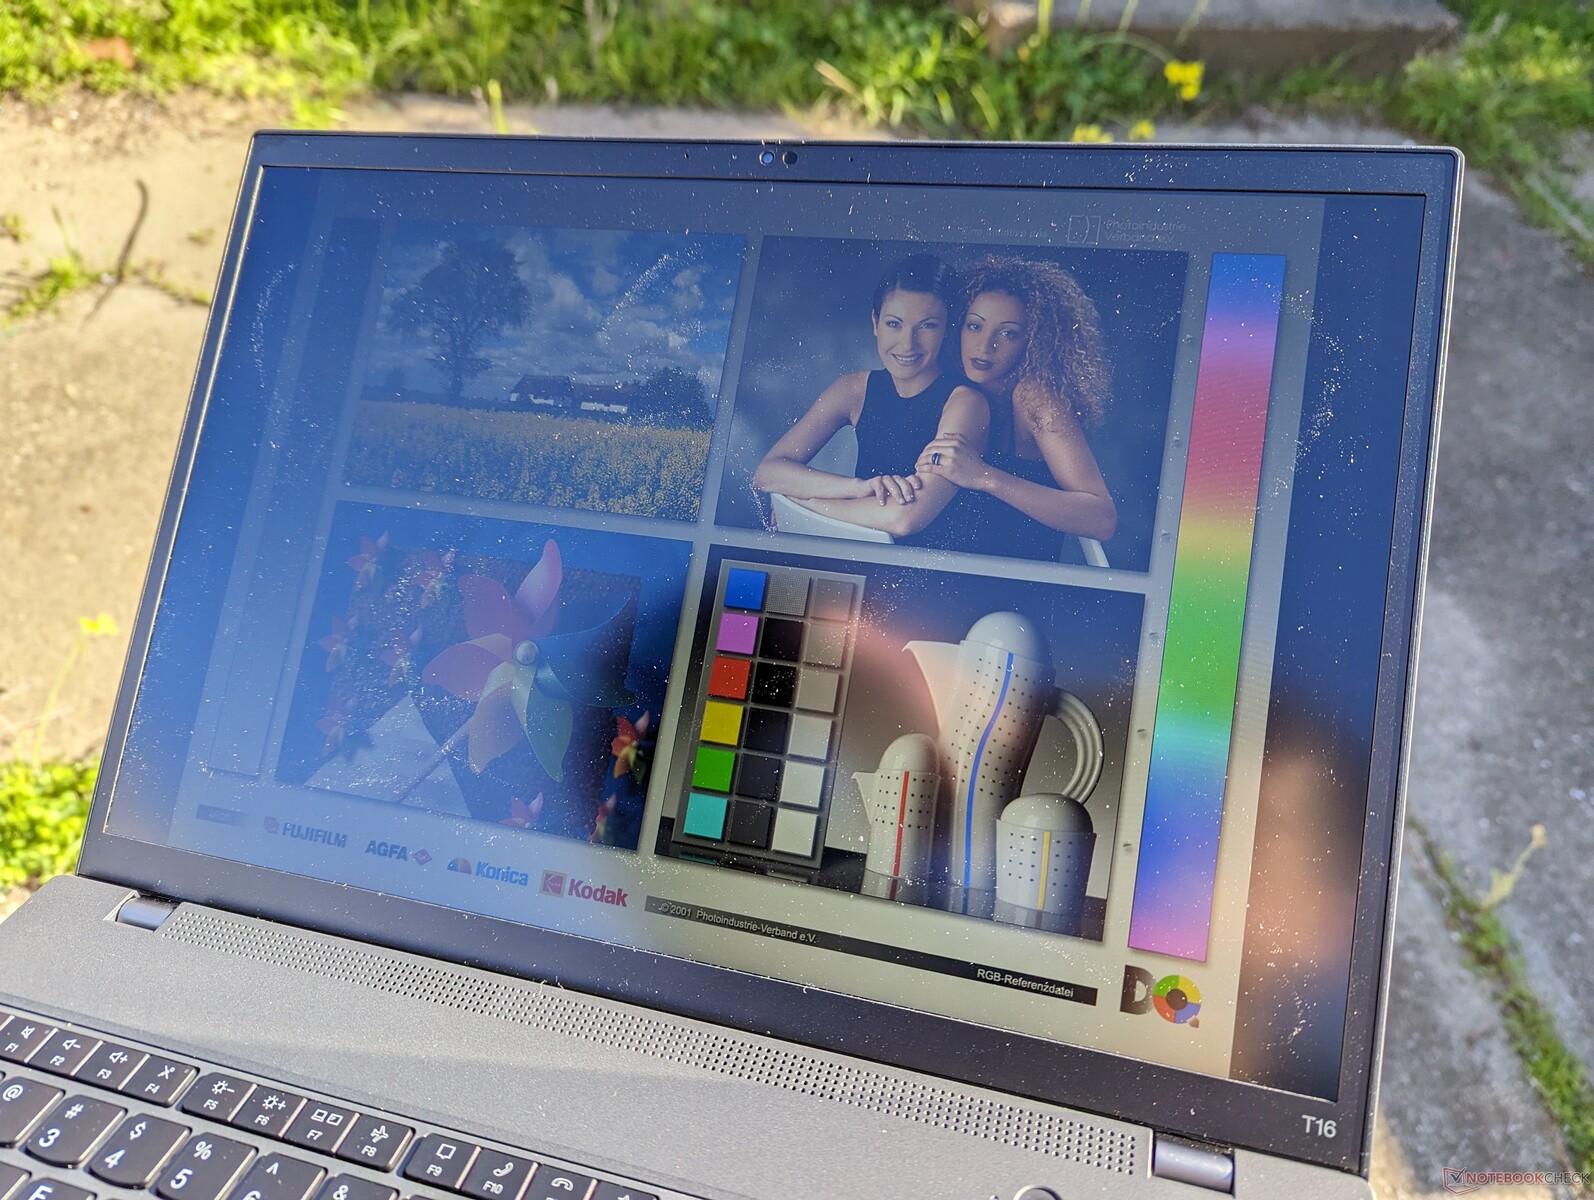
在我们的300尼特面板上,户外能见度最好是平均水平。用户可能要考虑500尼特的选项,以减少眩光的影响。如果能见度是一个问题,那么我们建议看看惠普EliteBook 860/865 G9及其更明亮的1000尼特面板选项。

性能 - 第12代英特尔选项
测试条件
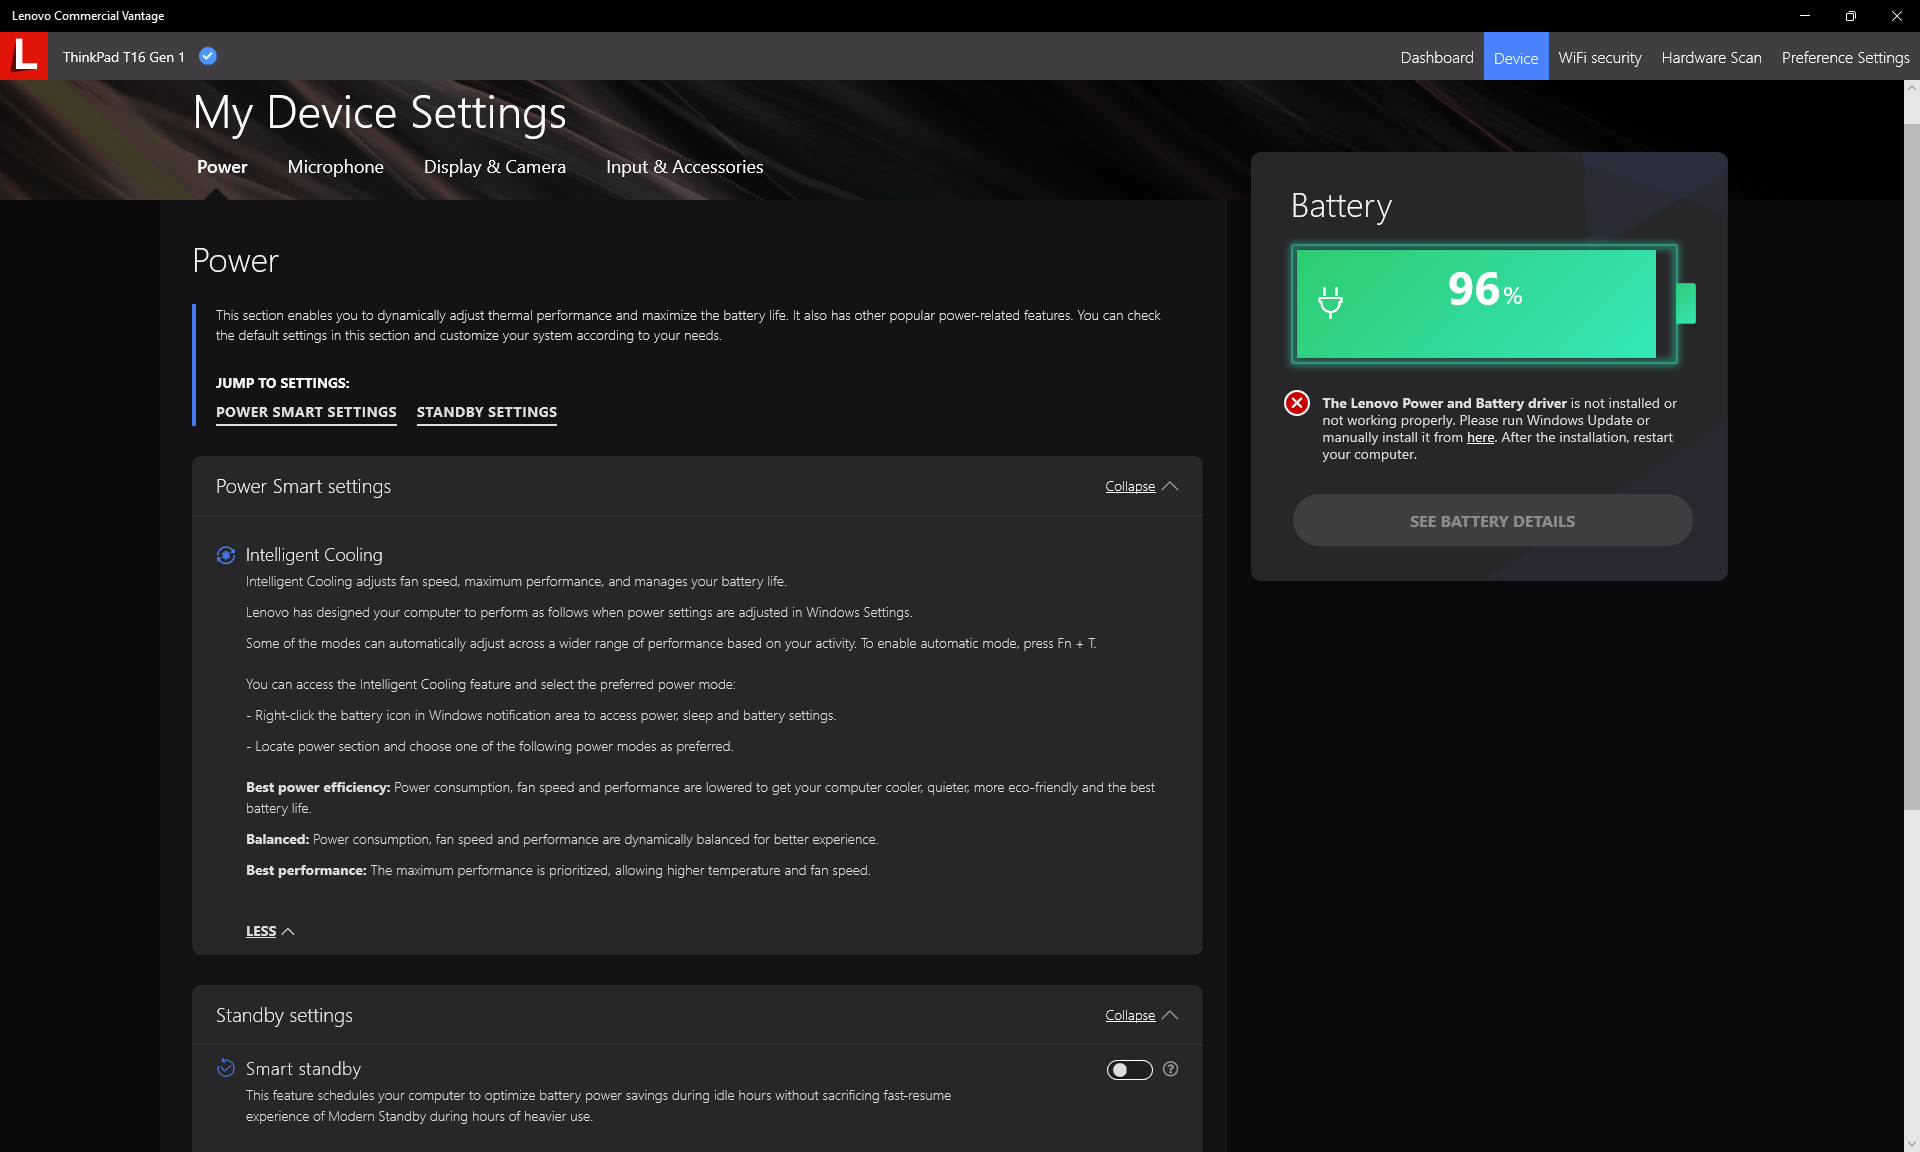
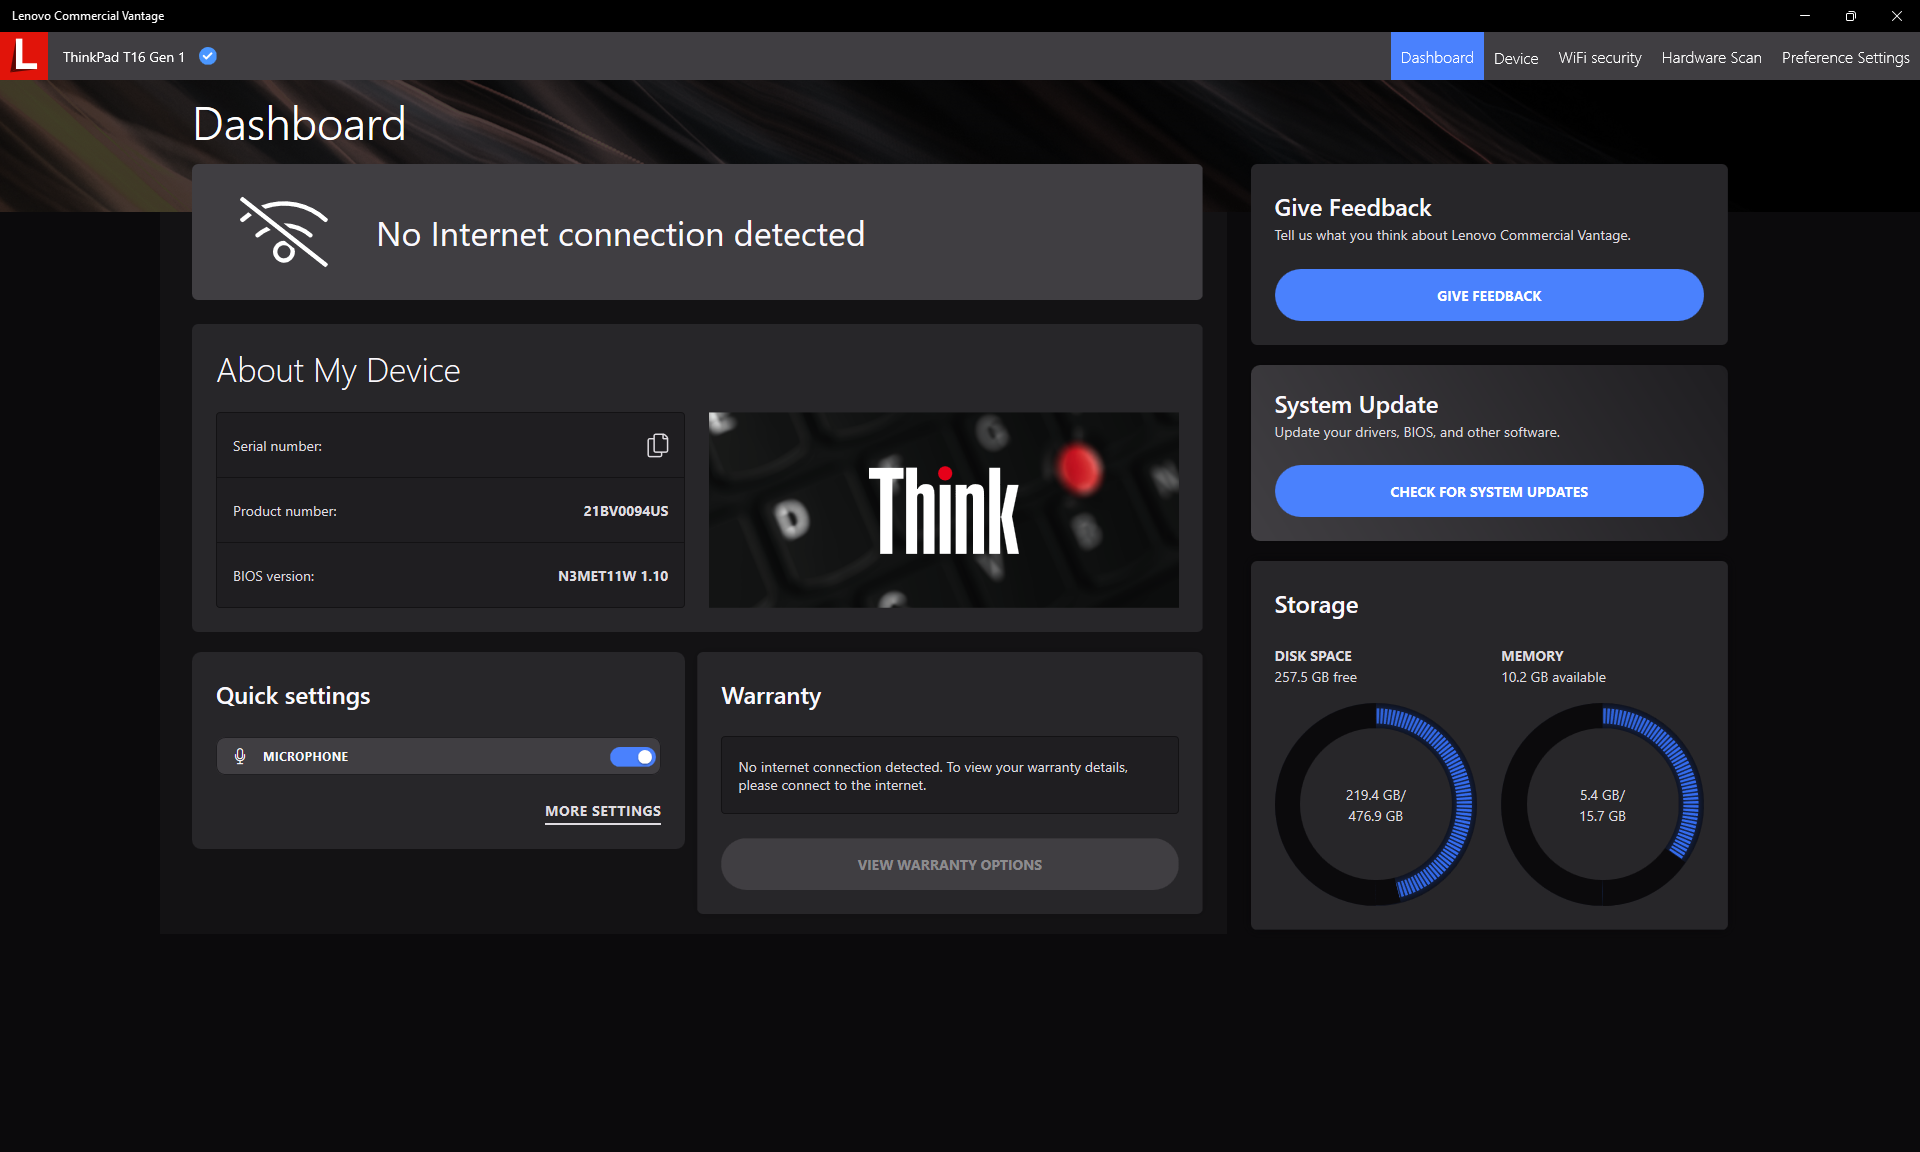
在运行以下任何基准测试之前,我们通过Windows将我们的设备设置为性能模式。用户应该熟悉联想商用Vantage软件,因为它是与更新、保修、安全等相关的其他设置的枢纽。下面的屏幕截图显示了一些选项。
处理器 - 涡轮增压可以做得更好
我们的 酷睿i7-1270P设备将表现出类似于我们在以下设备上观察到的节流行为 酷睿i5-1240PSKU。例如,当循环运行CineBench R15 xT时,最初的1782分将随着时间的推移而下降44%,这明显超过了大多数其他笔记本电脑的得分。与之相比,Ryzen 5 PRO 6650USKU在循环测试的几分钟内会比较慢,但是它能够在更长的时间内保持更快的时钟速率和性能,正如我们的下图所示。因此,Core i7-1270P的Turbo Boost优势在ThinkPad T16 G1上是非常短暂的。
如果需要的话,用户可以安装ThrottleStop,将性能节流减少约20%。即便如此,令人失望的是,联想没有提供这样的性能选项,而没有诉诸第三方软件。
Cinebench R15 Multi Loop
Cinebench R20: CPU (Multi Core) | CPU (Single Core)
Cinebench R23: Multi Core | Single Core
Cinebench R15: CPU Multi 64Bit | CPU Single 64Bit
Blender: v2.79 BMW27 CPU
7-Zip 18.03: 7z b 4 | 7z b 4 -mmt1
Geekbench 5.5: Multi-Core | Single-Core
HWBOT x265 Benchmark v2.2: 4k Preset
LibreOffice : 20 Documents To PDF
R Benchmark 2.5: Overall mean
| CPU Performance rating | |
| Huawei MateBook 16s i7 | |
| MSI Summit E16 Flip A12UDT-031 | |
| Apple MacBook Pro 16 2021 M1 Pro -5! | |
| Lenovo Yoga 7-14ARB G7 | |
| Lenovo ThinkPad T16 Gen 1 Core i7-1270P | |
| Average Intel Core i7-1270P | |
| HP EliteBook 865 G9 | |
| Lenovo ThinkPad T16 G1 21CH004MGE | |
| Lenovo ThinkBook 13s G3 20YA0005GE | |
| LG Gram 16Z90Q | |
| Lenovo ThinkPad T16 G1 21BWS00200 | |
| Asus ZenBook Flip 15 Q508U | |
| LG Gram 16 (2021) | |
| Asus ZenBook 14 UX434FL-DB77 -2! | |
| Cinebench R20 / CPU (Multi Core) | |
| Huawei MateBook 16s i7 | |
| MSI Summit E16 Flip A12UDT-031 | |
| Lenovo Yoga 7-14ARB G7 | |
| Lenovo ThinkPad T16 Gen 1 Core i7-1270P | |
| HP EliteBook 865 G9 | |
| Lenovo ThinkPad T16 G1 21CH004MGE | |
| Asus ZenBook Flip 15 Q508U | |
| Average Intel Core i7-1270P (3167 - 3905, n=2) | |
| LG Gram 16Z90Q | |
| Lenovo ThinkBook 13s G3 20YA0005GE | |
| Lenovo ThinkPad T16 G1 21BWS00200 | |
| Apple MacBook Pro 16 2021 M1 Pro | |
| LG Gram 16 (2021) | |
| Asus ZenBook 14 UX434FL-DB77 | |
| Cinebench R20 / CPU (Single Core) | |
| Huawei MateBook 16s i7 | |
| MSI Summit E16 Flip A12UDT-031 | |
| Lenovo ThinkPad T16 Gen 1 Core i7-1270P | |
| Average Intel Core i7-1270P (595 - 627, n=2) | |
| LG Gram 16Z90Q | |
| Lenovo Yoga 7-14ARB G7 | |
| HP EliteBook 865 G9 | |
| Lenovo ThinkPad T16 G1 21BWS00200 | |
| Lenovo ThinkPad T16 G1 21CH004MGE | |
| Lenovo ThinkBook 13s G3 20YA0005GE | |
| LG Gram 16 (2021) | |
| Asus ZenBook Flip 15 Q508U | |
| Asus ZenBook 14 UX434FL-DB77 | |
| Apple MacBook Pro 16 2021 M1 Pro | |
| Cinebench R15 / CPU Single 64Bit | |
| Huawei MateBook 16s i7 | |
| Lenovo Yoga 7-14ARB G7 | |
| MSI Summit E16 Flip A12UDT-031 | |
| Lenovo ThinkPad T16 Gen 1 Core i7-1270P | |
| Lenovo ThinkPad T16 G1 21CH004MGE | |
| HP EliteBook 865 G9 | |
| Average Intel Core i7-1270P (226 - 233, n=2) | |
| Lenovo ThinkBook 13s G3 20YA0005GE | |
| Lenovo ThinkPad T16 G1 21BWS00200 | |
| LG Gram 16Z90Q | |
| Apple MacBook Pro 16 2021 M1 Pro | |
| LG Gram 16 (2021) | |
| Asus ZenBook Flip 15 Q508U | |
| Asus ZenBook 14 UX434FL-DB77 | |
| Blender / v2.79 BMW27 CPU | |
| LG Gram 16 (2021) | |
| Asus ZenBook 14 UX434FL-DB77 | |
| LG Gram 16Z90Q | |
| Lenovo ThinkPad T16 G1 21BWS00200 | |
| Lenovo ThinkBook 13s G3 20YA0005GE | |
| Average Intel Core i7-1270P (372 - 375, n=2) | |
| Lenovo ThinkPad T16 Gen 1 Core i7-1270P | |
| Lenovo ThinkPad T16 G1 21CH004MGE | |
| Asus ZenBook Flip 15 Q508U | |
| MSI Summit E16 Flip A12UDT-031 | |
| HP EliteBook 865 G9 | |
| Lenovo Yoga 7-14ARB G7 | |
| Huawei MateBook 16s i7 | |
| Apple MacBook Pro 16 2021 M1 Pro | |
| 7-Zip 18.03 / 7z b 4 | |
| Huawei MateBook 16s i7 | |
| Lenovo Yoga 7-14ARB G7 | |
| MSI Summit E16 Flip A12UDT-031 | |
| HP EliteBook 865 G9 | |
| Asus ZenBook Flip 15 Q508U | |
| Lenovo ThinkPad T16 G1 21CH004MGE | |
| Lenovo ThinkBook 13s G3 20YA0005GE | |
| Lenovo ThinkPad T16 Gen 1 Core i7-1270P | |
| Average Intel Core i7-1270P (38099 - 38449, n=2) | |
| LG Gram 16Z90Q | |
| Lenovo ThinkPad T16 G1 21BWS00200 | |
| LG Gram 16 (2021) | |
| Asus ZenBook 14 UX434FL-DB77 | |
| 7-Zip 18.03 / 7z b 4 -mmt1 | |
| Huawei MateBook 16s i7 | |
| Lenovo ThinkPad T16 Gen 1 Core i7-1270P | |
| HP EliteBook 865 G9 | |
| Lenovo Yoga 7-14ARB G7 | |
| Lenovo ThinkBook 13s G3 20YA0005GE | |
| Average Intel Core i7-1270P (4874 - 5684, n=2) | |
| Lenovo ThinkPad T16 G1 21CH004MGE | |
| MSI Summit E16 Flip A12UDT-031 | |
| LG Gram 16Z90Q | |
| LG Gram 16 (2021) | |
| Lenovo ThinkPad T16 G1 21BWS00200 | |
| Asus ZenBook Flip 15 Q508U | |
| Asus ZenBook 14 UX434FL-DB77 | |
| Geekbench 5.5 / Multi-Core | |
| Huawei MateBook 16s i7 | |
| Apple MacBook Pro 16 2021 M1 Pro | |
| MSI Summit E16 Flip A12UDT-031 | |
| LG Gram 16Z90Q | |
| Lenovo Yoga 7-14ARB G7 | |
| Average Intel Core i7-1270P (8610 - 8710, n=2) | |
| Lenovo ThinkPad T16 Gen 1 Core i7-1270P | |
| Lenovo ThinkPad T16 G1 21CH004MGE | |
| Lenovo ThinkPad T16 G1 21BWS00200 | |
| HP EliteBook 865 G9 | |
| Lenovo ThinkBook 13s G3 20YA0005GE | |
| Asus ZenBook Flip 15 Q508U | |
| LG Gram 16 (2021) | |
| Asus ZenBook 14 UX434FL-DB77 | |
| Geekbench 5.5 / Single-Core | |
| Huawei MateBook 16s i7 | |
| Apple MacBook Pro 16 2021 M1 Pro | |
| Lenovo ThinkPad T16 Gen 1 Core i7-1270P | |
| LG Gram 16Z90Q | |
| Average Intel Core i7-1270P (1564 - 1724, n=2) | |
| MSI Summit E16 Flip A12UDT-031 | |
| Lenovo Yoga 7-14ARB G7 | |
| Lenovo ThinkPad T16 G1 21BWS00200 | |
| LG Gram 16 (2021) | |
| Lenovo ThinkPad T16 G1 21CH004MGE | |
| Lenovo ThinkBook 13s G3 20YA0005GE | |
| HP EliteBook 865 G9 | |
| Asus ZenBook Flip 15 Q508U | |
| Asus ZenBook 14 UX434FL-DB77 | |
| HWBOT x265 Benchmark v2.2 / 4k Preset | |
| Huawei MateBook 16s i7 | |
| Lenovo Yoga 7-14ARB G7 | |
| MSI Summit E16 Flip A12UDT-031 | |
| Lenovo ThinkPad T16 G1 21CH004MGE | |
| HP EliteBook 865 G9 | |
| Lenovo ThinkPad T16 Gen 1 Core i7-1270P | |
| Average Intel Core i7-1270P (9.56 - 11.3, n=2) | |
| Lenovo ThinkBook 13s G3 20YA0005GE | |
| Asus ZenBook Flip 15 Q508U | |
| Lenovo ThinkPad T16 G1 21BWS00200 | |
| LG Gram 16Z90Q | |
| LG Gram 16 (2021) | |
| Asus ZenBook 14 UX434FL-DB77 | |
| LibreOffice / 20 Documents To PDF | |
| Asus ZenBook 14 UX434FL-DB77 | |
| Asus ZenBook Flip 15 Q508U | |
| Lenovo Yoga 7-14ARB G7 | |
| LG Gram 16Z90Q | |
| HP EliteBook 865 G9 | |
| MSI Summit E16 Flip A12UDT-031 | |
| Lenovo ThinkBook 13s G3 20YA0005GE | |
| Lenovo ThinkPad T16 G1 21CH004MGE | |
| Average Intel Core i7-1270P (47.1 - 48.6, n=2) | |
| Lenovo ThinkPad T16 G1 21BWS00200 | |
| Lenovo ThinkPad T16 Gen 1 Core i7-1270P | |
| LG Gram 16 (2021) | |
| Huawei MateBook 16s i7 | |
| R Benchmark 2.5 / Overall mean | |
| Asus ZenBook 14 UX434FL-DB77 | |
| LG Gram 16 (2021) | |
| Asus ZenBook Flip 15 Q508U | |
| Lenovo ThinkBook 13s G3 20YA0005GE | |
| LG Gram 16Z90Q | |
| Average Intel Core i7-1270P (0.4926 - 0.575, n=2) | |
| Lenovo ThinkPad T16 G1 21CH004MGE | |
| Lenovo ThinkPad T16 G1 21BWS00200 | |
| HP EliteBook 865 G9 | |
| MSI Summit E16 Flip A12UDT-031 | |
| Lenovo Yoga 7-14ARB G7 | |
| Lenovo ThinkPad T16 Gen 1 Core i7-1270P | |
| Huawei MateBook 16s i7 | |
Cinebench R20: CPU (Multi Core) | CPU (Single Core)
Cinebench R23: Multi Core | Single Core
Cinebench R15: CPU Multi 64Bit | CPU Single 64Bit
Blender: v2.79 BMW27 CPU
7-Zip 18.03: 7z b 4 | 7z b 4 -mmt1
Geekbench 5.5: Multi-Core | Single-Core
HWBOT x265 Benchmark v2.2: 4k Preset
LibreOffice : 20 Documents To PDF
R Benchmark 2.5: Overall mean
* ... smaller is better
* ... smaller is better
AIDA64: FP32 Ray-Trace | FPU Julia | CPU SHA3 | CPU Queen | FPU SinJulia | FPU Mandel | CPU AES | CPU ZLib | FP64 Ray-Trace | CPU PhotoWorxx
| Performance rating | |
| HP EliteBook 865 G9 | |
| Lenovo ThinkPad T16 G1 21CH004MGE | |
| Huawei MateBook 16s i7 | |
| Lenovo ThinkPad T16 Gen 1 Core i7-1270P | |
| LG Gram 16Z90Q | |
| Average Intel Core i7-1270P | |
| AIDA64 / FP32 Ray-Trace | |
| HP EliteBook 865 G9 | |
| Lenovo ThinkPad T16 G1 21CH004MGE | |
| Lenovo ThinkPad T16 Gen 1 Core i7-1270P | |
| LG Gram 16Z90Q | |
| Huawei MateBook 16s i7 | |
| Average Intel Core i7-1270P (4789 - 6722, n=2) | |
| AIDA64 / FPU Julia | |
| HP EliteBook 865 G9 | |
| Lenovo ThinkPad T16 G1 21CH004MGE | |
| Lenovo ThinkPad T16 Gen 1 Core i7-1270P | |
| Average Intel Core i7-1270P (22017 - 37567, n=2) | |
| Huawei MateBook 16s i7 | |
| LG Gram 16Z90Q | |
| AIDA64 / CPU SHA3 | |
| HP EliteBook 865 G9 | |
| Lenovo ThinkPad T16 G1 21CH004MGE | |
| Huawei MateBook 16s i7 | |
| Lenovo ThinkPad T16 Gen 1 Core i7-1270P | |
| Average Intel Core i7-1270P (1543 - 1853, n=2) | |
| LG Gram 16Z90Q | |
| AIDA64 / CPU Queen | |
| Huawei MateBook 16s i7 | |
| HP EliteBook 865 G9 | |
| Lenovo ThinkPad T16 G1 21CH004MGE | |
| Lenovo ThinkPad T16 Gen 1 Core i7-1270P | |
| LG Gram 16Z90Q | |
| Average Intel Core i7-1270P (61703 - 76671, n=2) | |
| AIDA64 / FPU SinJulia | |
| HP EliteBook 865 G9 | |
| Lenovo ThinkPad T16 G1 21CH004MGE | |
| Huawei MateBook 16s i7 | |
| Average Intel Core i7-1270P (5059 - 5210, n=2) | |
| Lenovo ThinkPad T16 Gen 1 Core i7-1270P | |
| LG Gram 16Z90Q | |
| AIDA64 / FPU Mandel | |
| HP EliteBook 865 G9 | |
| Lenovo ThinkPad T16 G1 21CH004MGE | |
| Lenovo ThinkPad T16 Gen 1 Core i7-1270P | |
| Huawei MateBook 16s i7 | |
| Average Intel Core i7-1270P (12876 - 17891, n=2) | |
| LG Gram 16Z90Q | |
| AIDA64 / CPU AES | |
| Lenovo ThinkPad T16 G1 21CH004MGE | |
| Huawei MateBook 16s i7 | |
| HP EliteBook 865 G9 | |
| Lenovo ThinkPad T16 Gen 1 Core i7-1270P | |
| Average Intel Core i7-1270P (33137 - 39956, n=2) | |
| LG Gram 16Z90Q | |
| AIDA64 / CPU ZLib | |
| Huawei MateBook 16s i7 | |
| HP EliteBook 865 G9 | |
| Lenovo ThinkPad T16 G1 21CH004MGE | |
| Lenovo ThinkPad T16 Gen 1 Core i7-1270P | |
| Average Intel Core i7-1270P (553 - 579, n=2) | |
| LG Gram 16Z90Q | |
| AIDA64 / FP64 Ray-Trace | |
| HP EliteBook 865 G9 | |
| Lenovo ThinkPad T16 G1 21CH004MGE | |
| LG Gram 16Z90Q | |
| Lenovo ThinkPad T16 Gen 1 Core i7-1270P | |
| Huawei MateBook 16s i7 | |
| Average Intel Core i7-1270P (2603 - 3521, n=2) | |
| AIDA64 / CPU PhotoWorxx | |
| Huawei MateBook 16s i7 | |
| LG Gram 16Z90Q | |
| Average Intel Core i7-1270P (21056 - 34745, n=2) | |
| Lenovo ThinkPad T16 G1 21CH004MGE | |
| Lenovo ThinkPad T16 Gen 1 Core i7-1270P | |
| HP EliteBook 865 G9 | |
系统性能
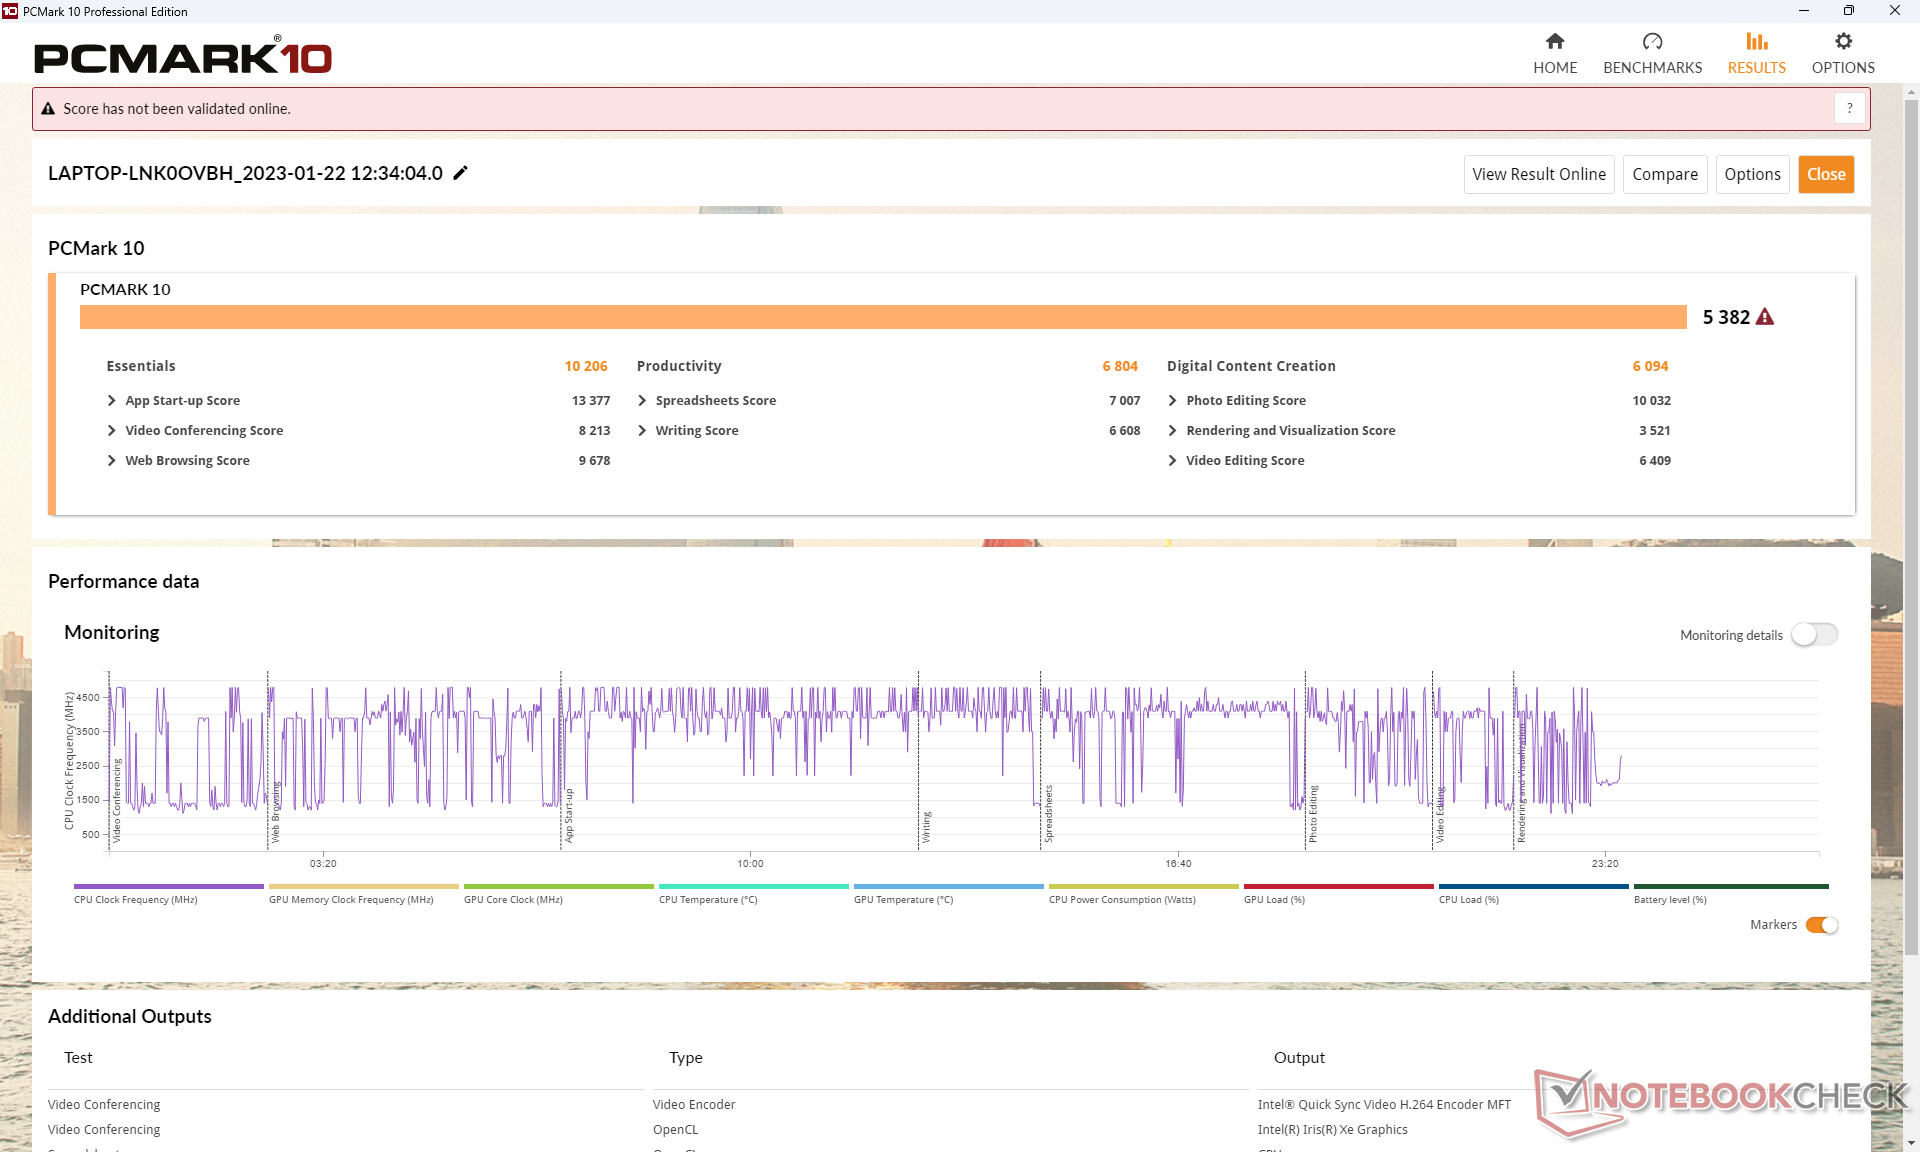
如下图所示,PCMark的平均结果介于搭载Core i5的慢速SKU和搭载Ryzen 5的快速SKU之间。在生产力分测试中,AMD SKU明显领先,这可能是由于与英特尔SKU相比,其多线程性能和集成GPU更快。
CrossMark: Overall | Productivity | Creativity | Responsiveness
| PCMark 10 / Score | |
| Huawei MateBook 16s i7 | |
| Lenovo ThinkPad T16 G1 21CH004MGE | |
| HP EliteBook 865 G9 | |
| Average Intel Core i7-1270P, Intel Iris Xe Graphics G7 96EUs (5382 - 5647, n=2) | |
| Lenovo ThinkPad T16 Gen 1 Core i7-1270P | |
| LG Gram 16Z90Q | |
| Lenovo ThinkPad T16 G1 21BWS00200 | |
| PCMark 10 / Essentials | |
| Huawei MateBook 16s i7 | |
| Average Intel Core i7-1270P, Intel Iris Xe Graphics G7 96EUs (10206 - 11224, n=2) | |
| Lenovo ThinkPad T16 Gen 1 Core i7-1270P | |
| LG Gram 16Z90Q | |
| Lenovo ThinkPad T16 G1 21CH004MGE | |
| Lenovo ThinkPad T16 G1 21BWS00200 | |
| HP EliteBook 865 G9 | |
| PCMark 10 / Productivity | |
| Lenovo ThinkPad T16 G1 21CH004MGE | |
| HP EliteBook 865 G9 | |
| Huawei MateBook 16s i7 | |
| Average Intel Core i7-1270P, Intel Iris Xe Graphics G7 96EUs (6804 - 6805, n=2) | |
| Lenovo ThinkPad T16 Gen 1 Core i7-1270P | |
| LG Gram 16Z90Q | |
| Lenovo ThinkPad T16 G1 21BWS00200 | |
| PCMark 10 / Digital Content Creation | |
| Huawei MateBook 16s i7 | |
| HP EliteBook 865 G9 | |
| Lenovo ThinkPad T16 G1 21CH004MGE | |
| Average Intel Core i7-1270P, Intel Iris Xe Graphics G7 96EUs (6094 - 6398, n=2) | |
| Lenovo ThinkPad T16 Gen 1 Core i7-1270P | |
| LG Gram 16Z90Q | |
| Lenovo ThinkPad T16 G1 21BWS00200 | |
| CrossMark / Overall | |
| Huawei MateBook 16s i7 | |
| Average Intel Core i7-1270P, Intel Iris Xe Graphics G7 96EUs (1585 - 1712, n=2) | |
| Lenovo ThinkPad T16 Gen 1 Core i7-1270P | |
| Apple MacBook Pro 16 2021 M1 Pro | |
| Lenovo ThinkPad T16 G1 21CH004MGE | |
| Lenovo ThinkPad T16 G1 21BWS00200 | |
| HP EliteBook 865 G9 | |
| CrossMark / Productivity | |
| Huawei MateBook 16s i7 | |
| Average Intel Core i7-1270P, Intel Iris Xe Graphics G7 96EUs (1567 - 1636, n=2) | |
| Lenovo ThinkPad T16 Gen 1 Core i7-1270P | |
| Lenovo ThinkPad T16 G1 21CH004MGE | |
| Lenovo ThinkPad T16 G1 21BWS00200 | |
| HP EliteBook 865 G9 | |
| Apple MacBook Pro 16 2021 M1 Pro | |
| CrossMark / Creativity | |
| Apple MacBook Pro 16 2021 M1 Pro | |
| Huawei MateBook 16s i7 | |
| Average Intel Core i7-1270P, Intel Iris Xe Graphics G7 96EUs (1684 - 1839, n=2) | |
| Lenovo ThinkPad T16 Gen 1 Core i7-1270P | |
| Lenovo ThinkPad T16 G1 21CH004MGE | |
| Lenovo ThinkPad T16 G1 21BWS00200 | |
| HP EliteBook 865 G9 | |
| CrossMark / Responsiveness | |
| Huawei MateBook 16s i7 | |
| Average Intel Core i7-1270P, Intel Iris Xe Graphics G7 96EUs (1365 - 1584, n=2) | |
| Lenovo ThinkPad T16 Gen 1 Core i7-1270P | |
| Lenovo ThinkPad T16 G1 21BWS00200 | |
| Lenovo ThinkPad T16 G1 21CH004MGE | |
| HP EliteBook 865 G9 | |
| Apple MacBook Pro 16 2021 M1 Pro | |
| PCMark 10 Score | 5382 points | |
Help | ||
| AIDA64 / Memory Copy | |
| Huawei MateBook 16s i7 | |
| LG Gram 16Z90Q | |
| Average Intel Core i7-1270P (39471 - 62300, n=2) | |
| Lenovo ThinkPad T16 G1 21CH004MGE | |
| Lenovo ThinkPad T16 Gen 1 Core i7-1270P | |
| HP EliteBook 865 G9 | |
| AIDA64 / Memory Read | |
| Huawei MateBook 16s i7 | |
| LG Gram 16Z90Q | |
| Average Intel Core i7-1270P (42289 - 72572, n=2) | |
| Lenovo ThinkPad T16 Gen 1 Core i7-1270P | |
| Lenovo ThinkPad T16 G1 21CH004MGE | |
| HP EliteBook 865 G9 | |
| AIDA64 / Memory Write | |
| LG Gram 16Z90Q | |
| Huawei MateBook 16s i7 | |
| Average Intel Core i7-1270P (43051 - 61340, n=2) | |
| Lenovo ThinkPad T16 G1 21CH004MGE | |
| Lenovo ThinkPad T16 Gen 1 Core i7-1270P | |
| HP EliteBook 865 G9 | |
| AIDA64 / Memory Latency | |
| Lenovo ThinkPad T16 G1 21CH004MGE | |
| Huawei MateBook 16s i7 | |
| LG Gram 16Z90Q | |
| HP EliteBook 865 G9 | |
| Lenovo ThinkPad T16 Gen 1 Core i7-1270P | |
| Average Intel Core i7-1270P (89.3 - 89.3, n=2) | |
* ... smaller is better
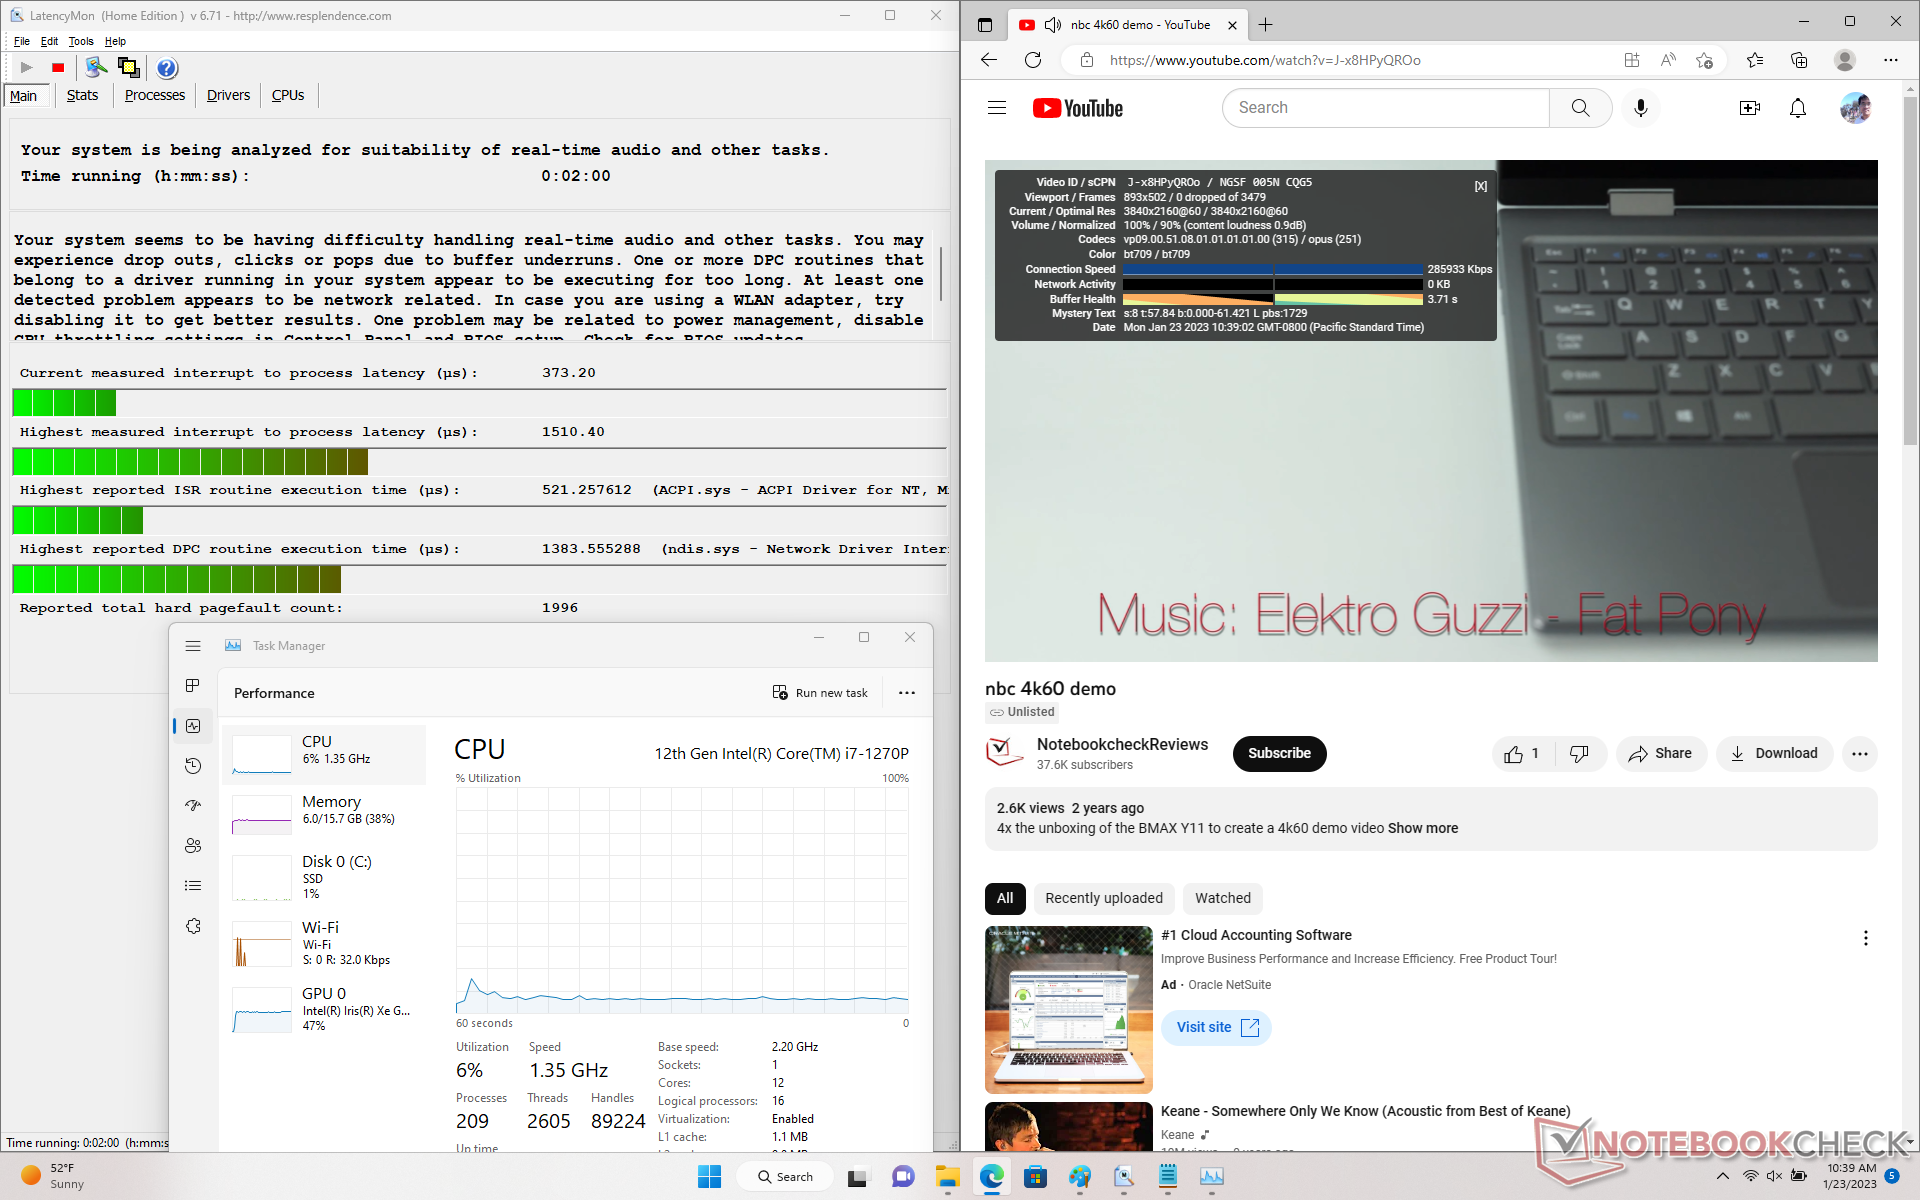
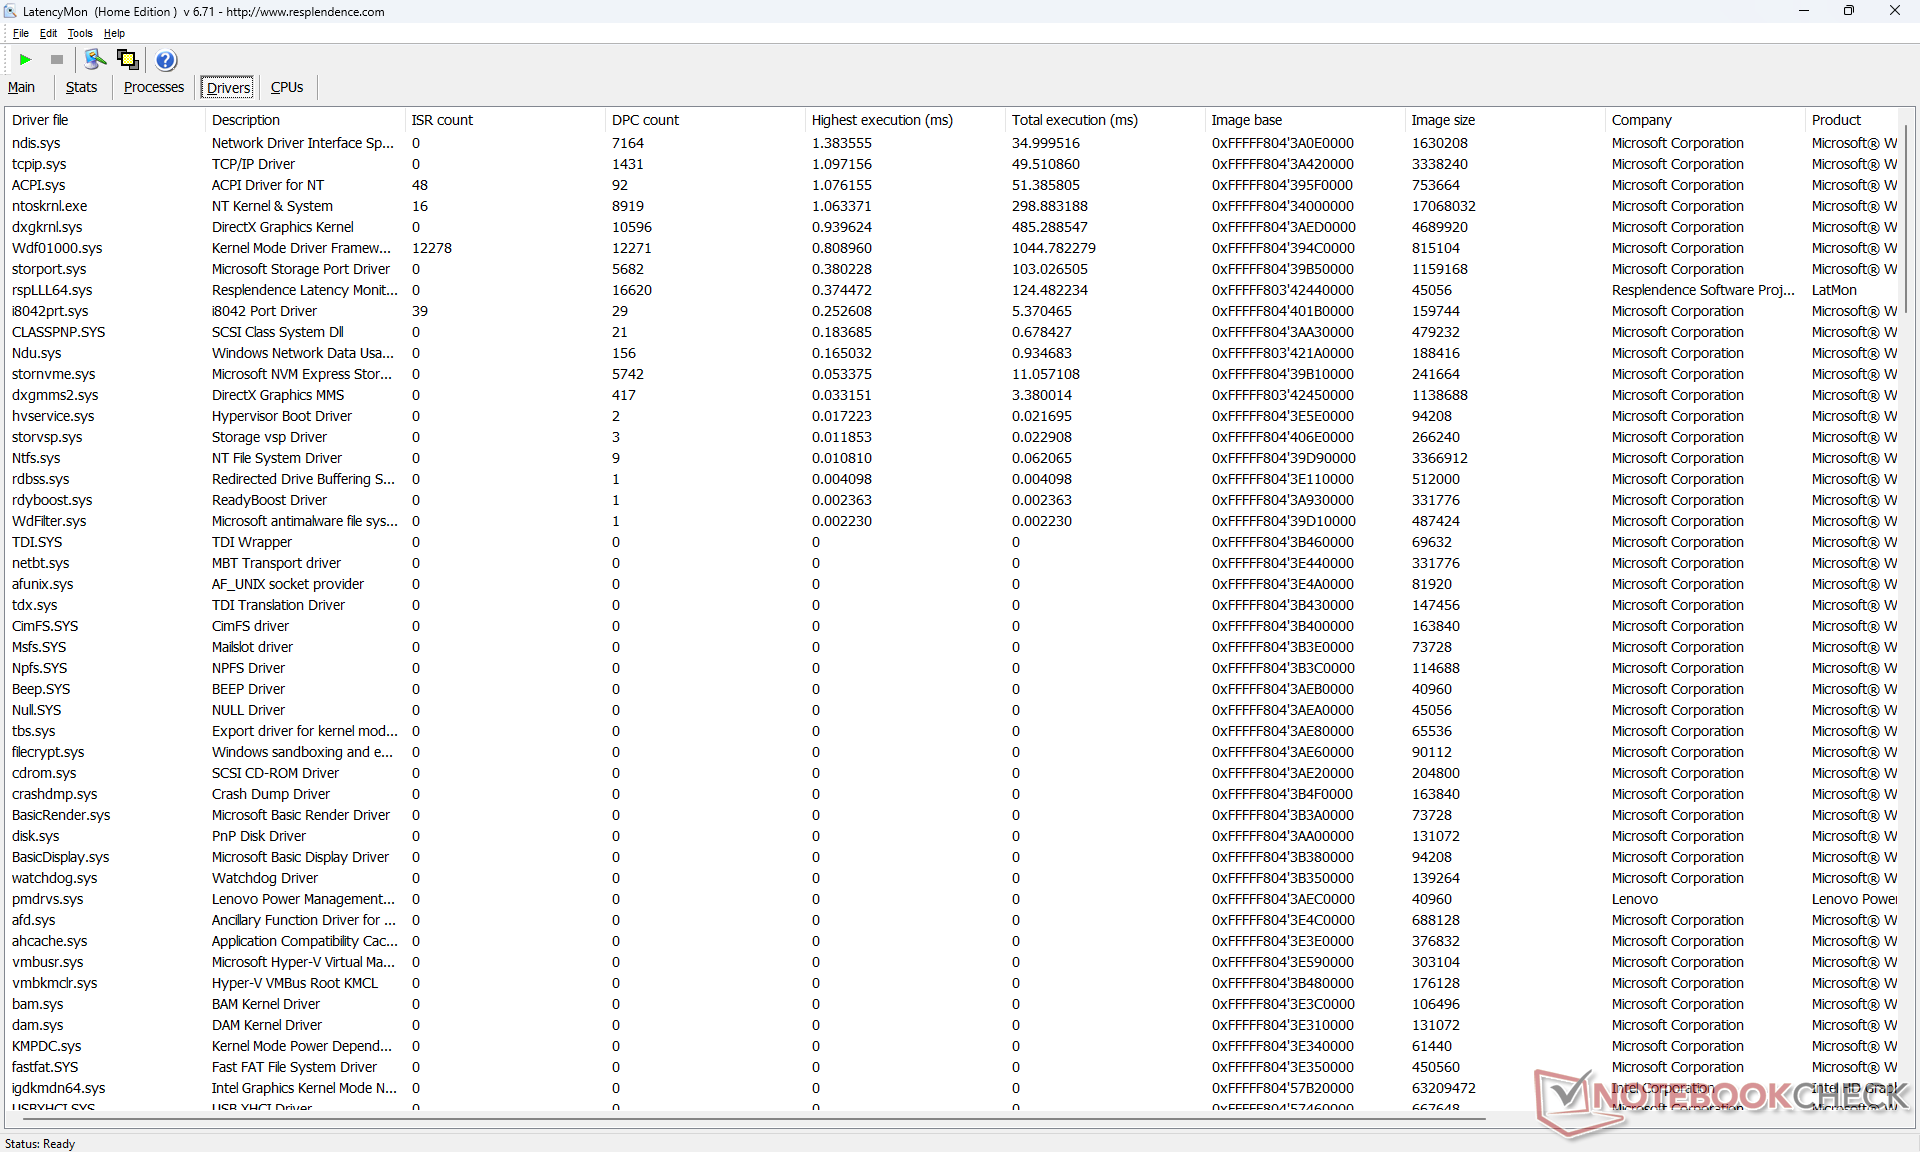
DPC延时
LatencyMon在打开我们主页的多个浏览器标签时显示了DPC问题。在60FPS下的4K视频播放在其他方面是完美的,没有任何丢帧。
| DPC Latencies / LatencyMon - interrupt to process latency (max), Web, Youtube, Prime95 | |
| LG Gram 16Z90Q | |
| Lenovo ThinkPad T16 Gen 1 Core i7-1270P | |
| Lenovo ThinkPad T16 G1 21CH004MGE | |
| HP EliteBook 865 G9 | |
* ... smaller is better
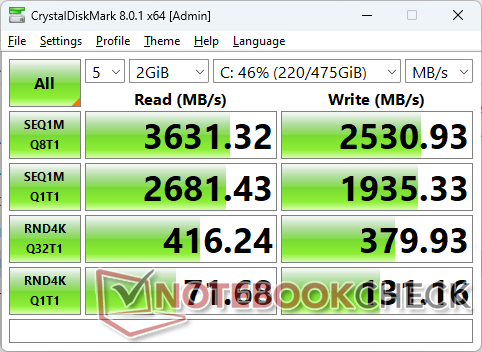
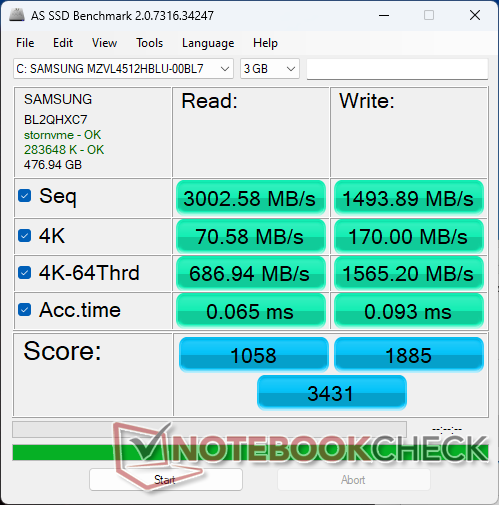
存储设备
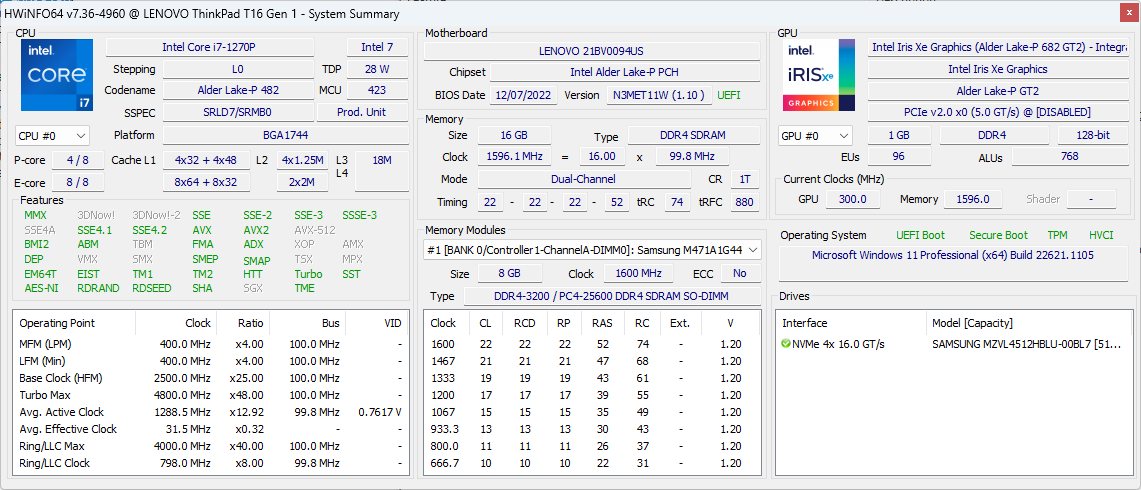
我们的设备配备了一个512GB的 三星PM9B1PCIe4 x4 NVMe SSD,而不是更常见的三星PM9A1。PM9B1系列的传输速率几乎慢了一半;在我们的设备上,连续读取速率最高为~3600 MB/s,而在LG Gram 16上则是~6300 MB/s。 LG Gram 16使用三星PM9A1。

| Drive Performance rating - Percent | |
| Huawei MateBook 16s i7 | |
| LG Gram 16Z90Q | |
| Lenovo ThinkPad T16 G1 21CH004MGE | |
| Lenovo ThinkPad T16 Gen 1 Core i7-1270P | |
| HP EliteBook 865 G9 | |
* ... smaller is better
Disk Throttling: DiskSpd Read Loop, Queue Depth 8
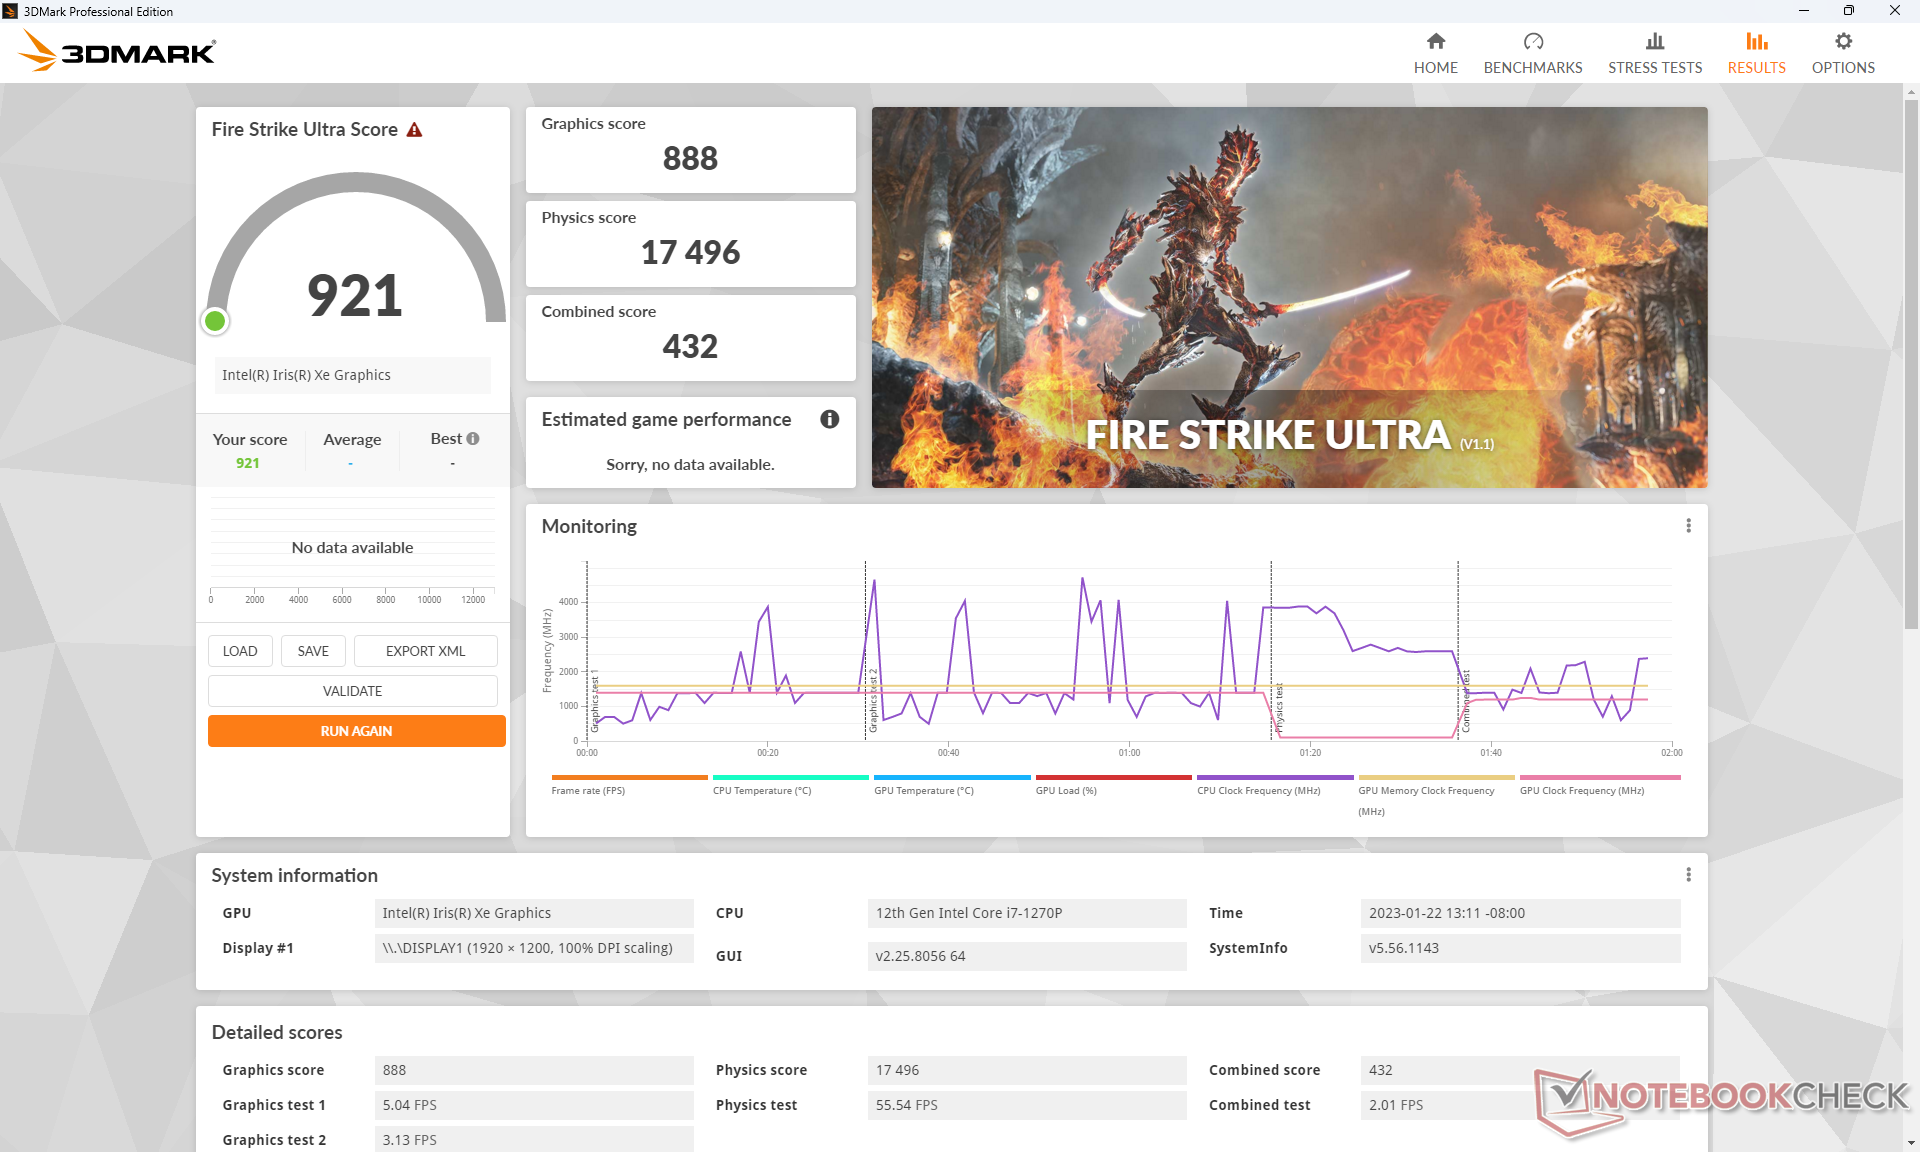
GPU性能--受制于缓慢的RAM
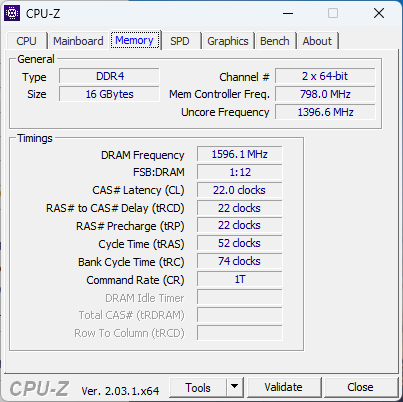
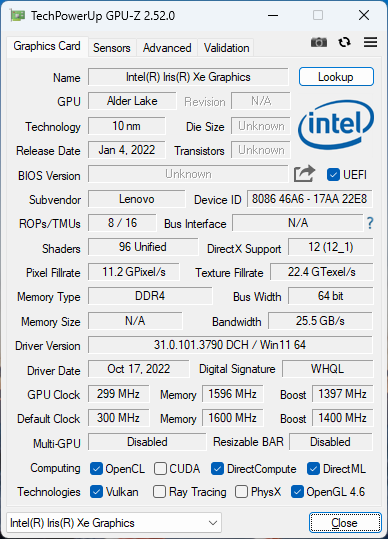
图形性能比我们数据库中配备相同的笔记本电脑平均慢10%左右。 Iris Xe 96 EUsGPU。性能不足的部分原因是相对于大多数其他由第12代英特尔CPU驱动的笔记本电脑,DDR4-3200内存速度较慢。该 LG Gram 16例如,它的标准配置是更快的LPDDR5-5200内存。
此外,当长时间运行高负荷时,图形性能可能会逐渐变慢。例如,当闲置在 Witcher 3例如,由于系统的Turbo Boost潜力有限,帧率会从测试开始时的84 FPS下降到几分钟后的约70 FPS,如下图所示。
升级到Ryzen 5 Radeon 660M同一型号的SKU将提高图形性能约10%至15%。
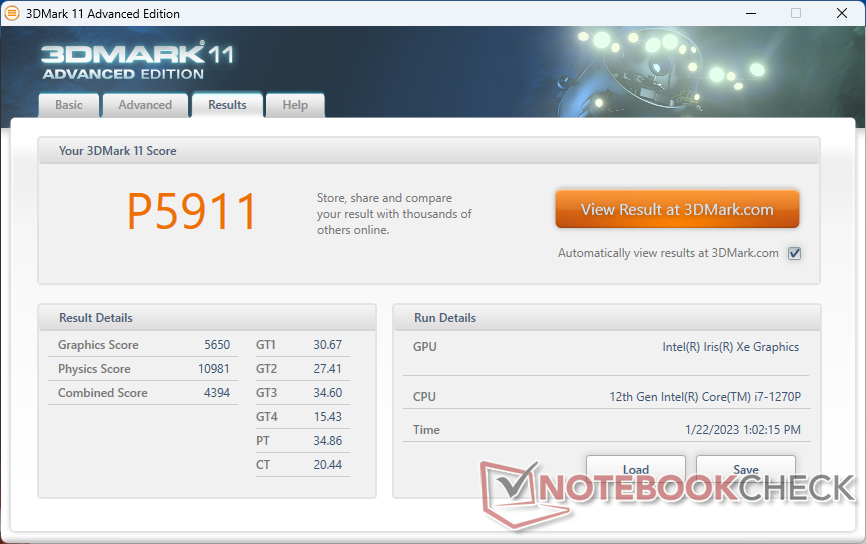
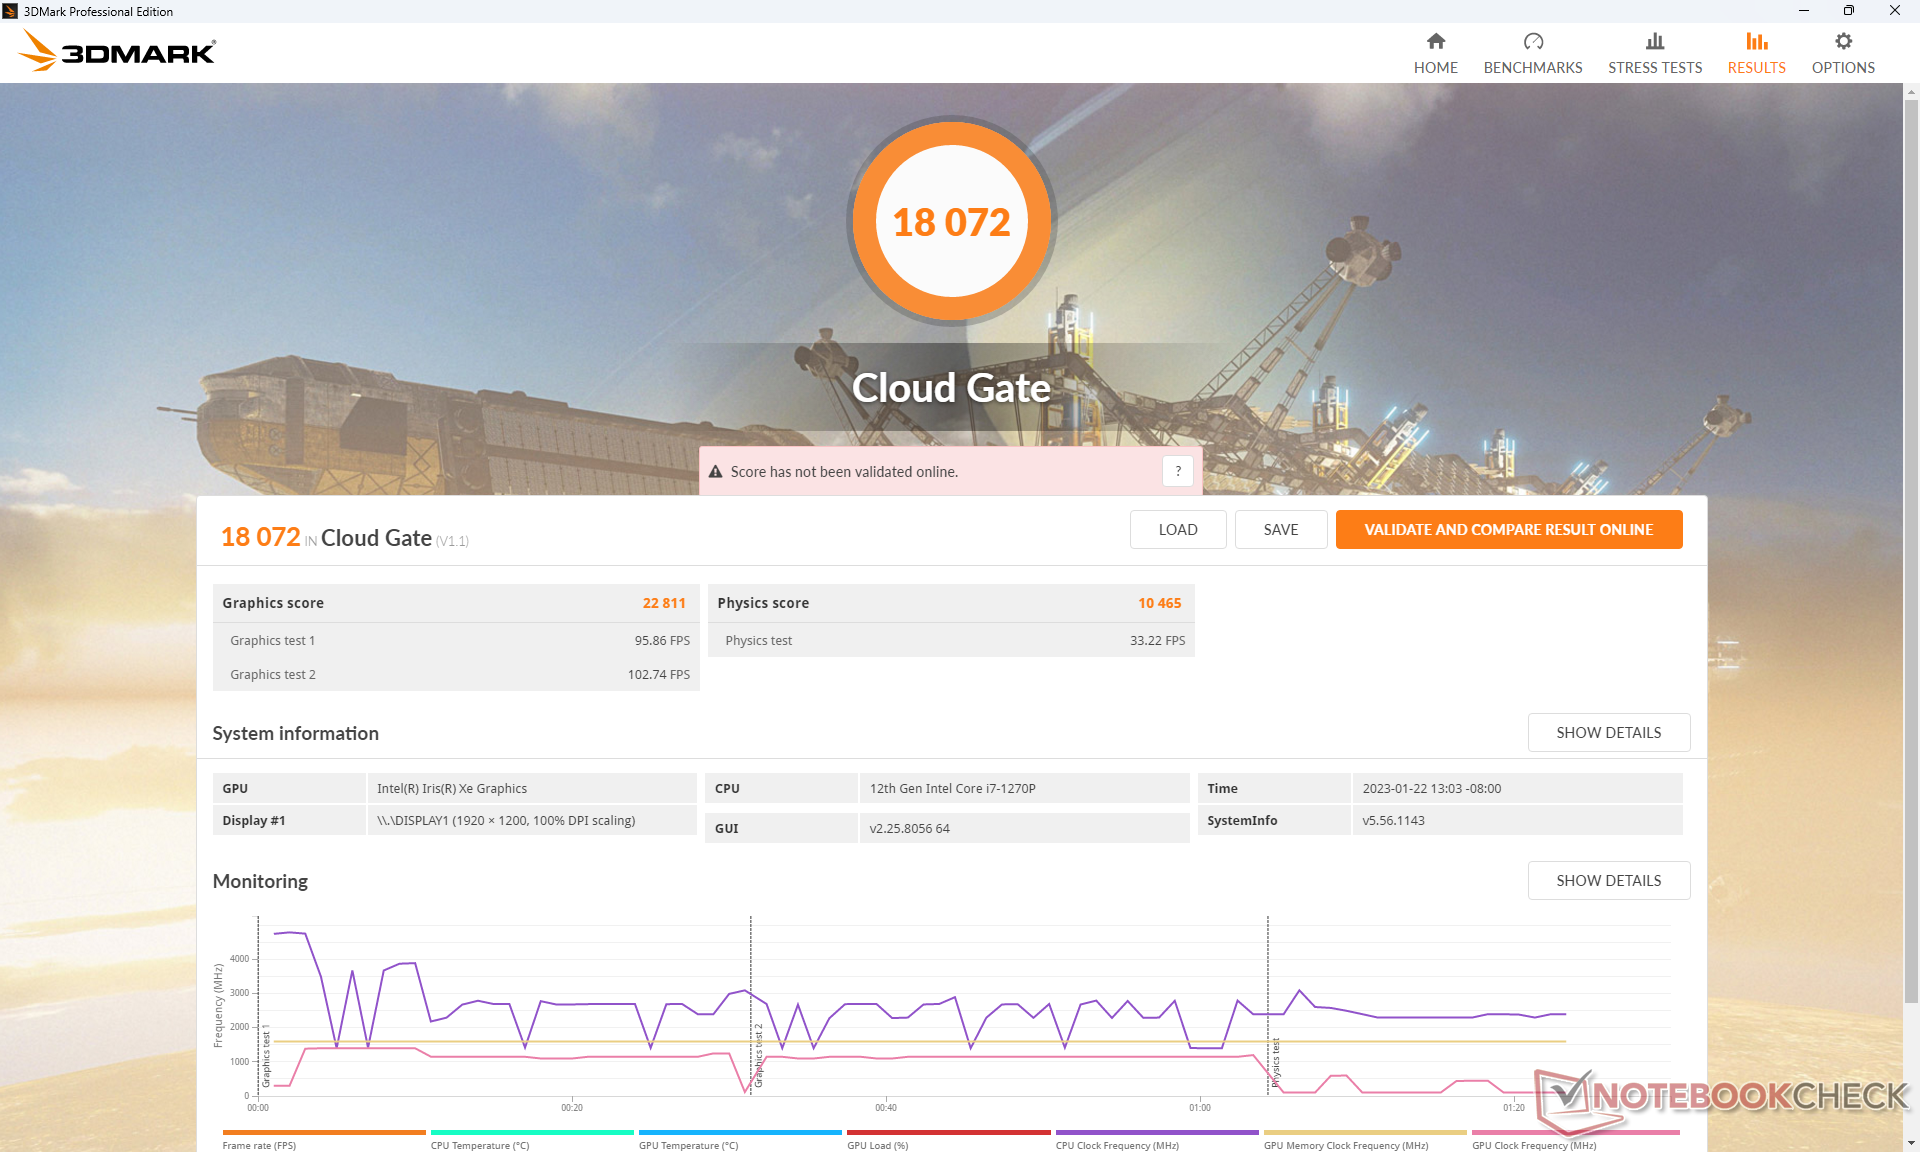
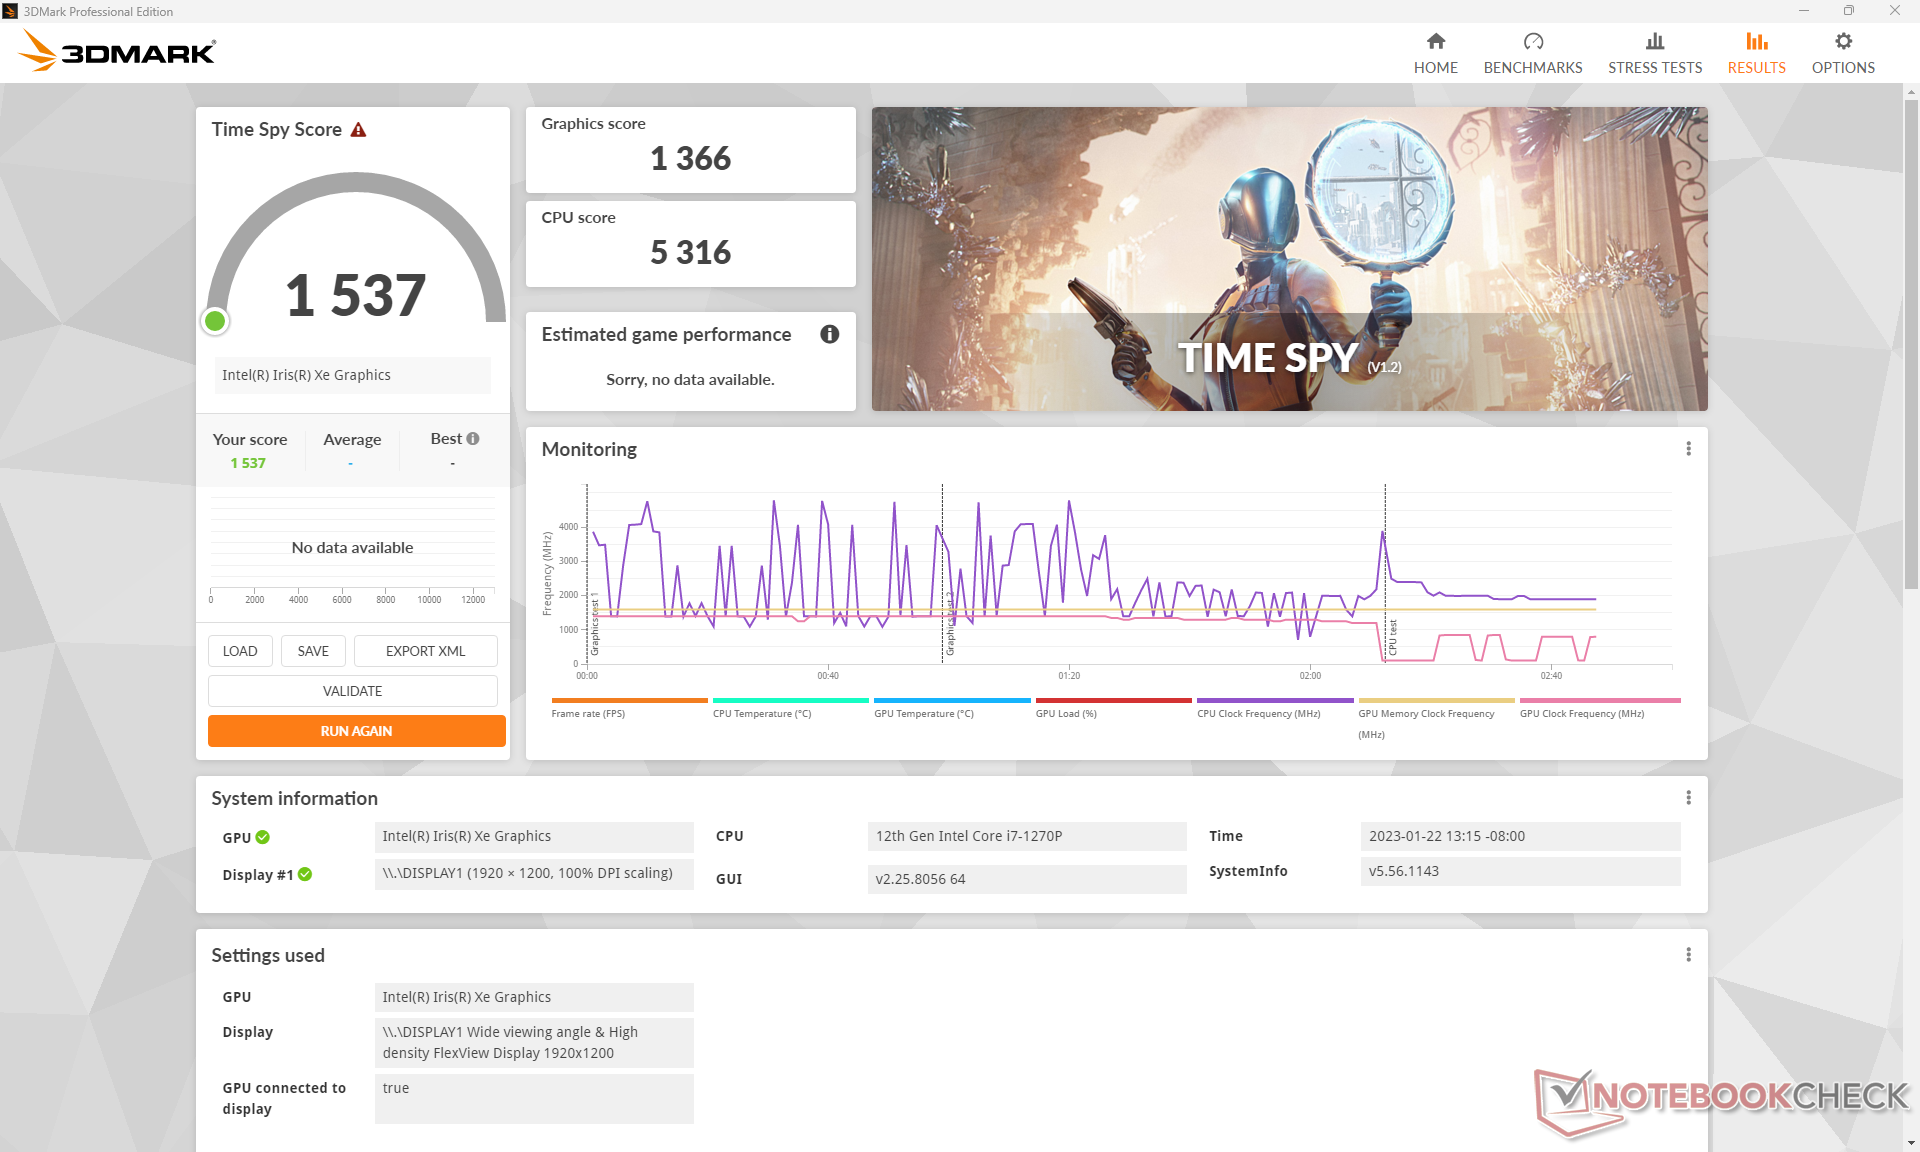
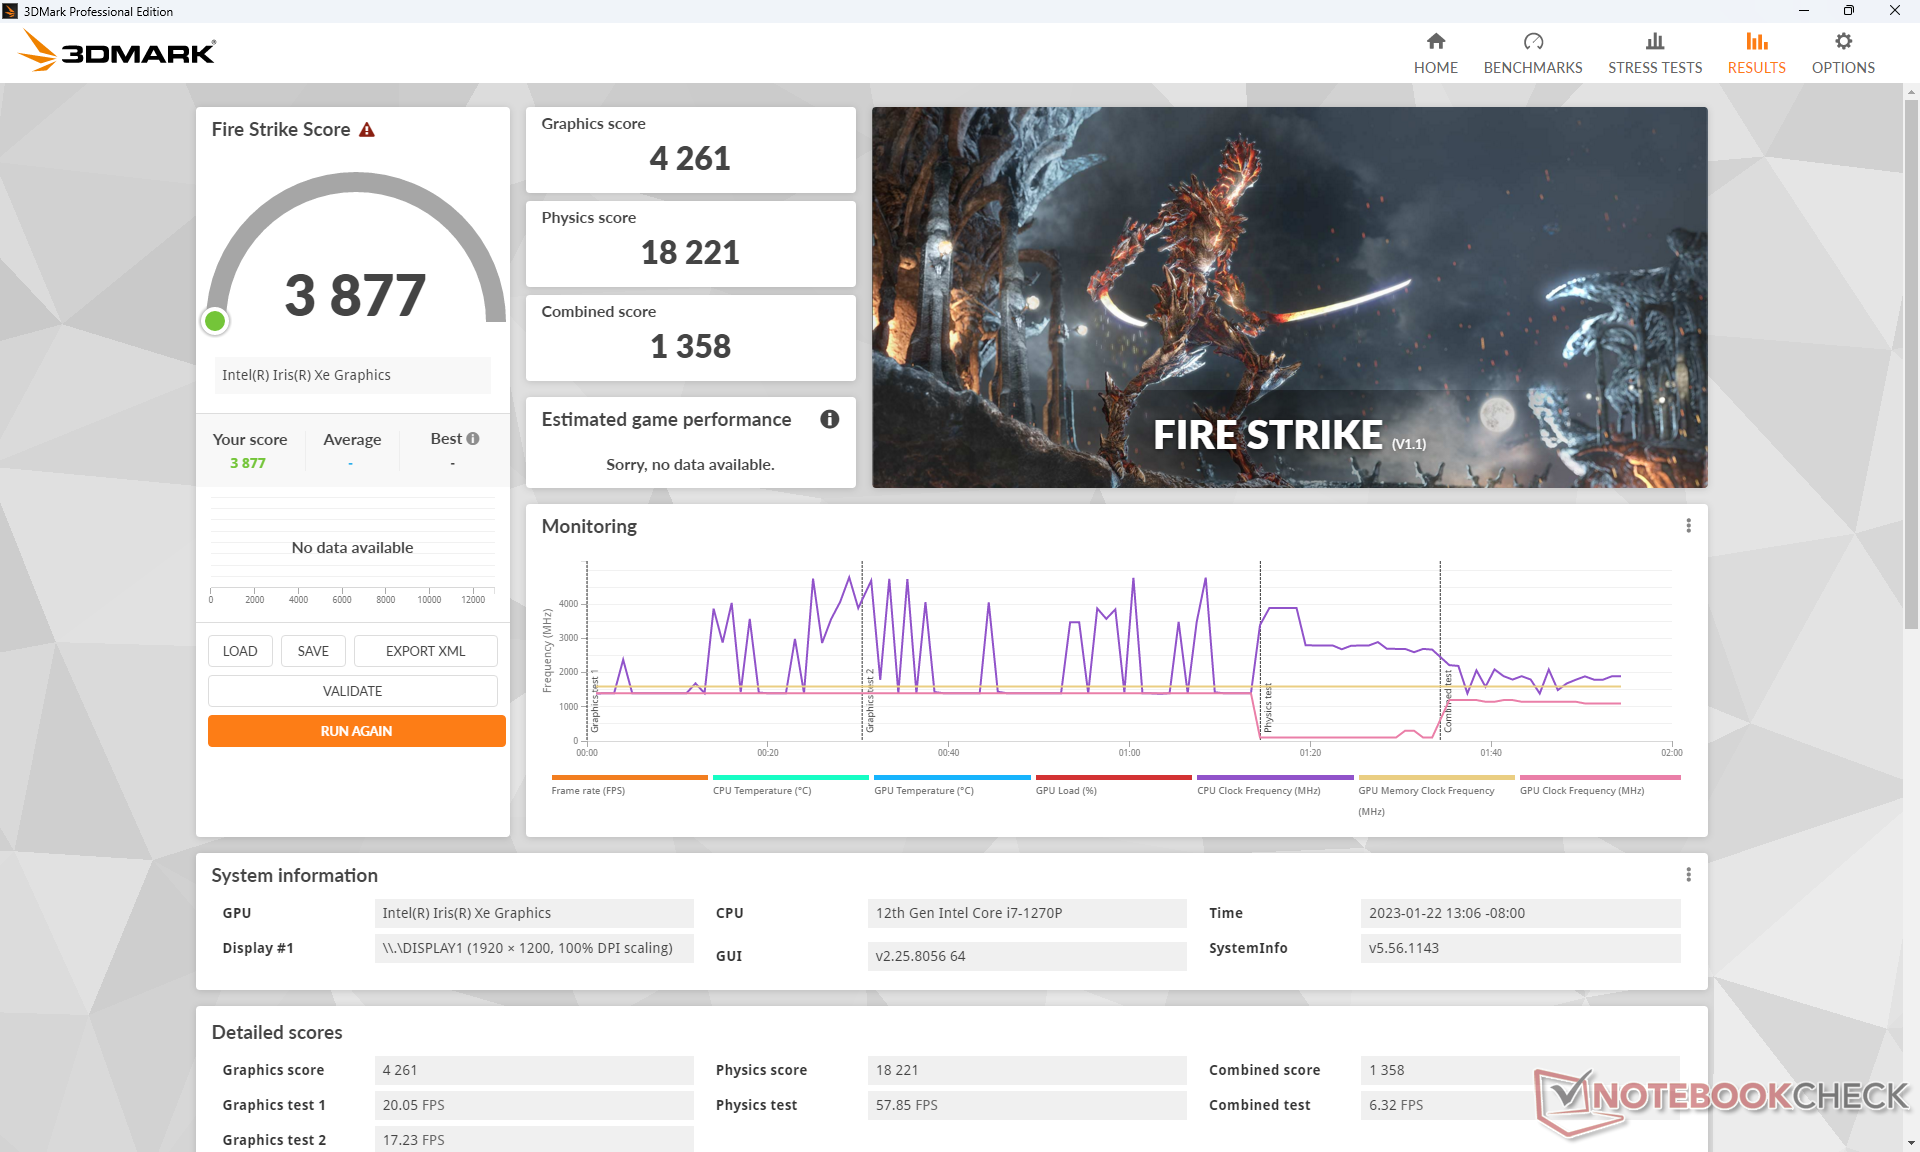
| 3DMark 11 Performance | 5911 points | |
| 3DMark Cloud Gate Standard Score | 18072 points | |
| 3DMark Fire Strike Score | 3877 points | |
| 3DMark Time Spy Score | 1537 points | |
Help | ||
| Cyberpunk 2077 1.6 - 1920x1080 Low Preset | |
| Lenovo Yoga 7-14ARB G7 | |
| Asus ZenBook Flip 15 Q508U | |
| Average Intel Iris Xe Graphics G7 96EUs (13 - 25.9, n=42) | |
| Lenovo ThinkPad T16 Gen 1 Core i7-1270P | |
Witcher 3 FPS Chart
| low | med. | high | ultra | |
|---|---|---|---|---|
| GTA V (2015) | 97.8 | 74.8 | 14.1 | 4.85 |
| The Witcher 3 (2015) | 82.1 | 50.4 | 24.4 | 11.2 |
| Dota 2 Reborn (2015) | 110.6 | 71.9 | 48.9 | 44.6 |
| Final Fantasy XV Benchmark (2018) | 31.4 | 16.8 | 12.6 | |
| X-Plane 11.11 (2018) | 39.7 | 31.9 | 29.2 | |
| Strange Brigade (2018) | 79.2 | 29.8 | 24.2 | 19.1 |
| Cyberpunk 2077 1.6 (2022) | 18.4 |
排放
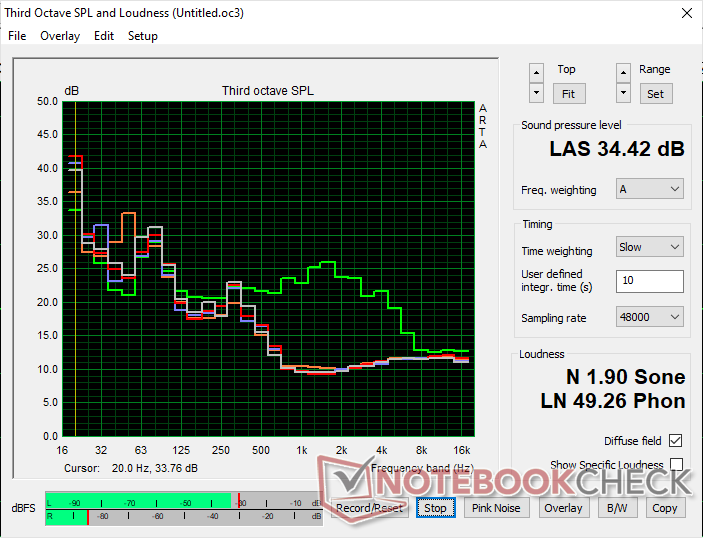
系统噪音 - 几乎总是安静的
风扇噪音是这个屏幕尺寸中最安静的之一,这部分解释了该处理器在上述基准测试中的性能可持续性较差。即使在设置为性能模式并运行游戏等高要求负载时,内部风扇也几乎听不到。它可能每隔一段时间就会脉冲式地达到34 dB(A),然后再恢复到近乎无声的状态,但即使是这个最大值也比大多数笔记本电脑的声音要小。笔记本HP EliteBook 865 G9也采取了类似的方法来处理风扇噪音,以获得非常安静的用户体验。因此,几乎没有理由选择性能以外的任何模式来控制风扇噪音。
Noise level
| Idle |
| 24.7 / 24.7 / 24.7 dB(A) |
| Load |
| 24.5 / 34.4 dB(A) |
 | ||
30 dB silent 40 dB(A) audible 50 dB(A) loud |
||
min: | ||
| Lenovo ThinkPad T16 Gen 1 Core i7-1270P Iris Xe G7 96EUs, i7-1270P, Samsung PM9B1 512GB MZAL4512HBLU | Lenovo ThinkPad T16 G1 21CH004MGE Radeon 660M, R5 PRO 6650U, Micron 2450 512GB MTFDKBA512TFK | LG Gram 16Z90Q Iris Xe G7 96EUs, i7-1260P, Samsung PM9A1 MZVL21T0HCLR | HP EliteBook 865 G9 Radeon 680M, R7 PRO 6850U, Samsung PM991 MZVLQ512HBLU | Huawei MateBook 16s i7 Iris Xe G7 96EUs, i7-12700H, Silicon Motion PCIe-8 SSD | Apple MacBook Pro 16 2021 M1 Pro M1 Pro 16-Core GPU, M1 Pro, Apple SSD AP1024R | |
|---|---|---|---|---|---|---|
| Noise | -6% | -21% | -1% | -15% | -3% | |
| off / environment * (dB) | 24.7 | 23.1 6% | 25 -1% | 23 7% | 24 3% | 24.7 -0% |
| Idle Minimum * (dB) | 24.7 | 23.1 6% | 26 -5% | 23 7% | 24 3% | 24.7 -0% |
| Idle Average * (dB) | 24.7 | 23.1 6% | 27 -9% | 23 7% | 25.2 -2% | 24.7 -0% |
| Idle Maximum * (dB) | 24.7 | 23.1 6% | 28 -13% | 23 7% | 27.2 -10% | 24.7 -0% |
| Load Average * (dB) | 24.5 | 25.4 -4% | 38 -55% | 29.1 -19% | 34.8 -42% | 26.1 -7% |
| Witcher 3 ultra * (dB) | 24.3 | 35.93 -48% | 37 -52% | 29.1 -20% | 34.8 -43% | |
| Load Maximum * (dB) | 34.4 | 39.1 -14% | 38 -10% | 32.9 4% | 39 -13% | 37.4 -9% |
* ... smaller is better
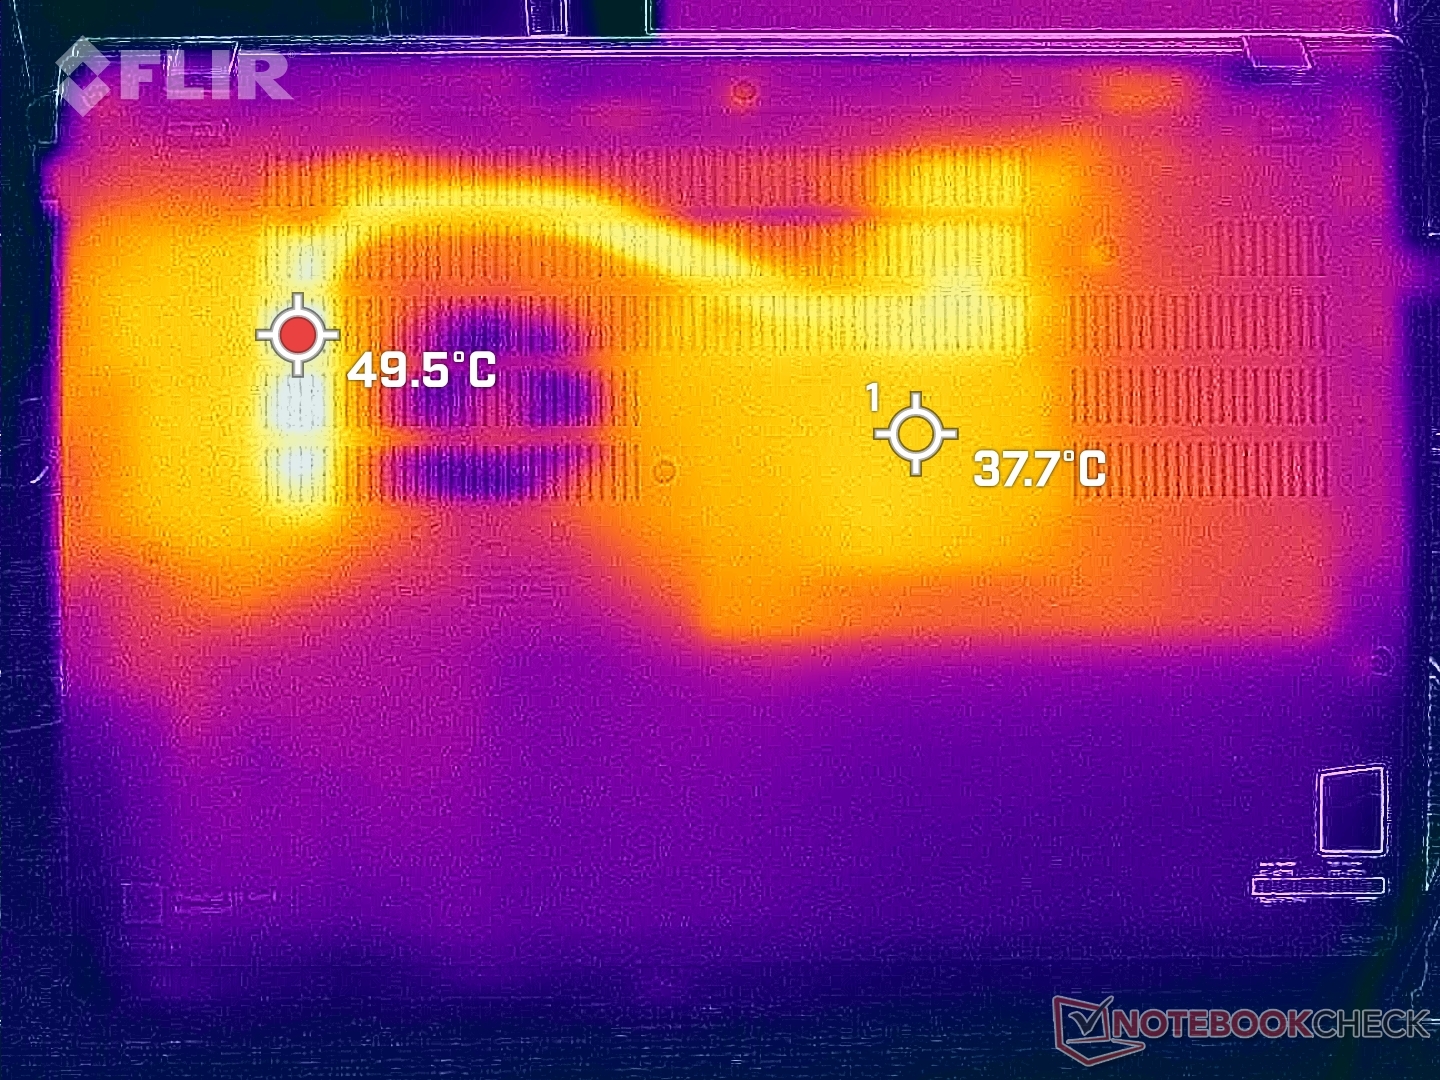
温度
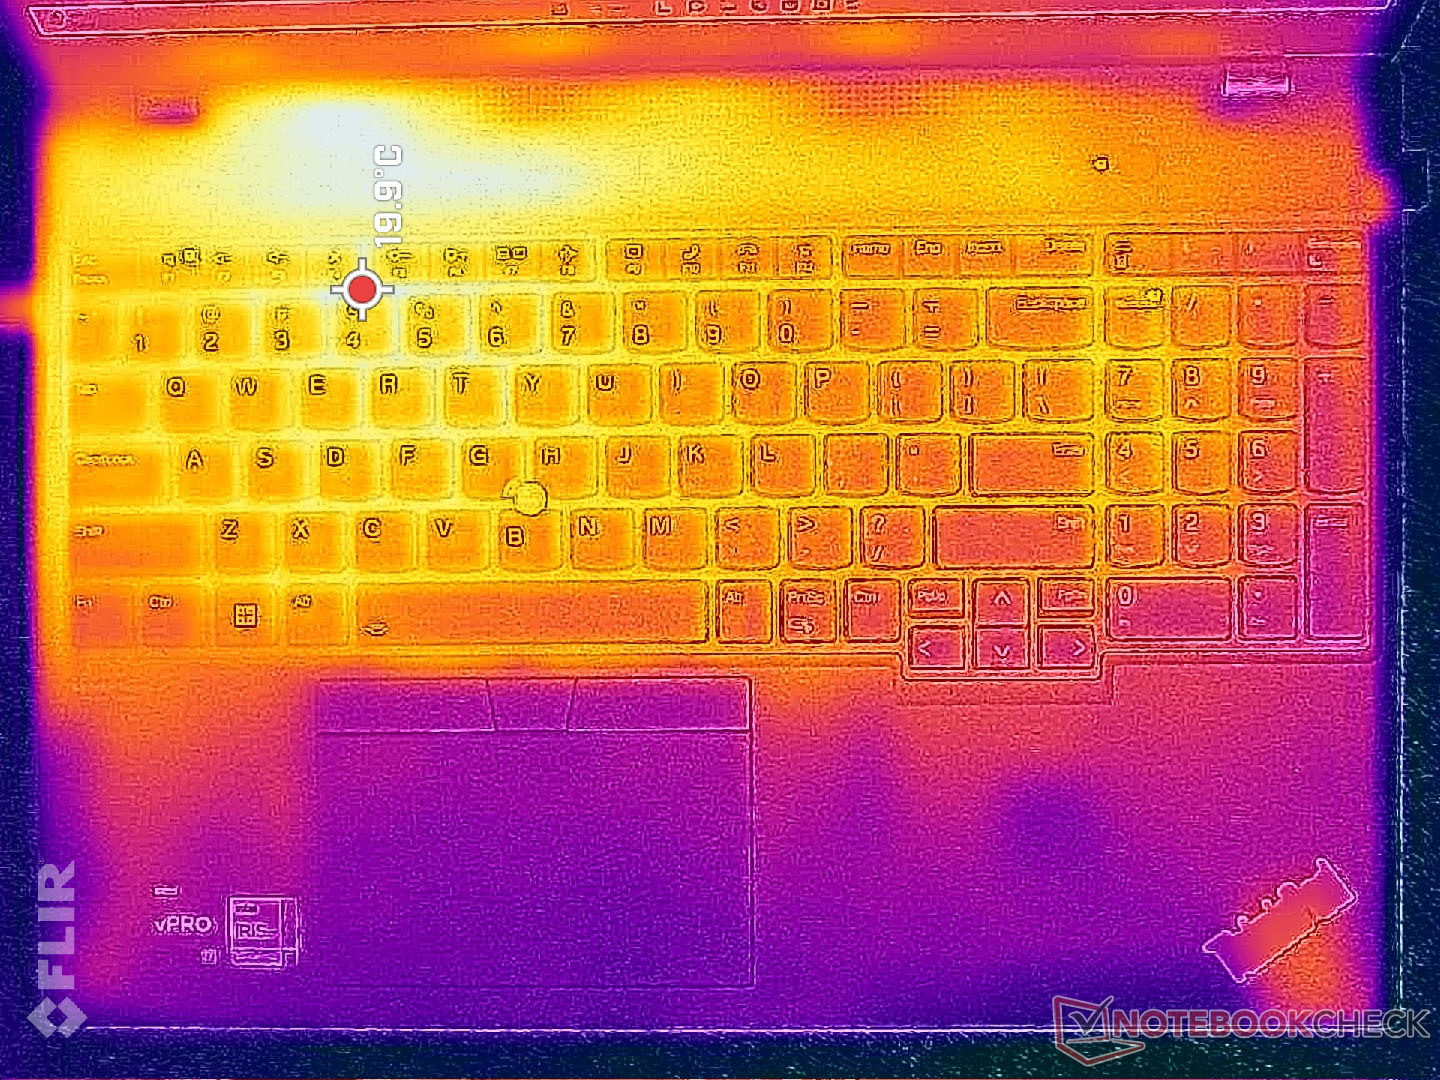
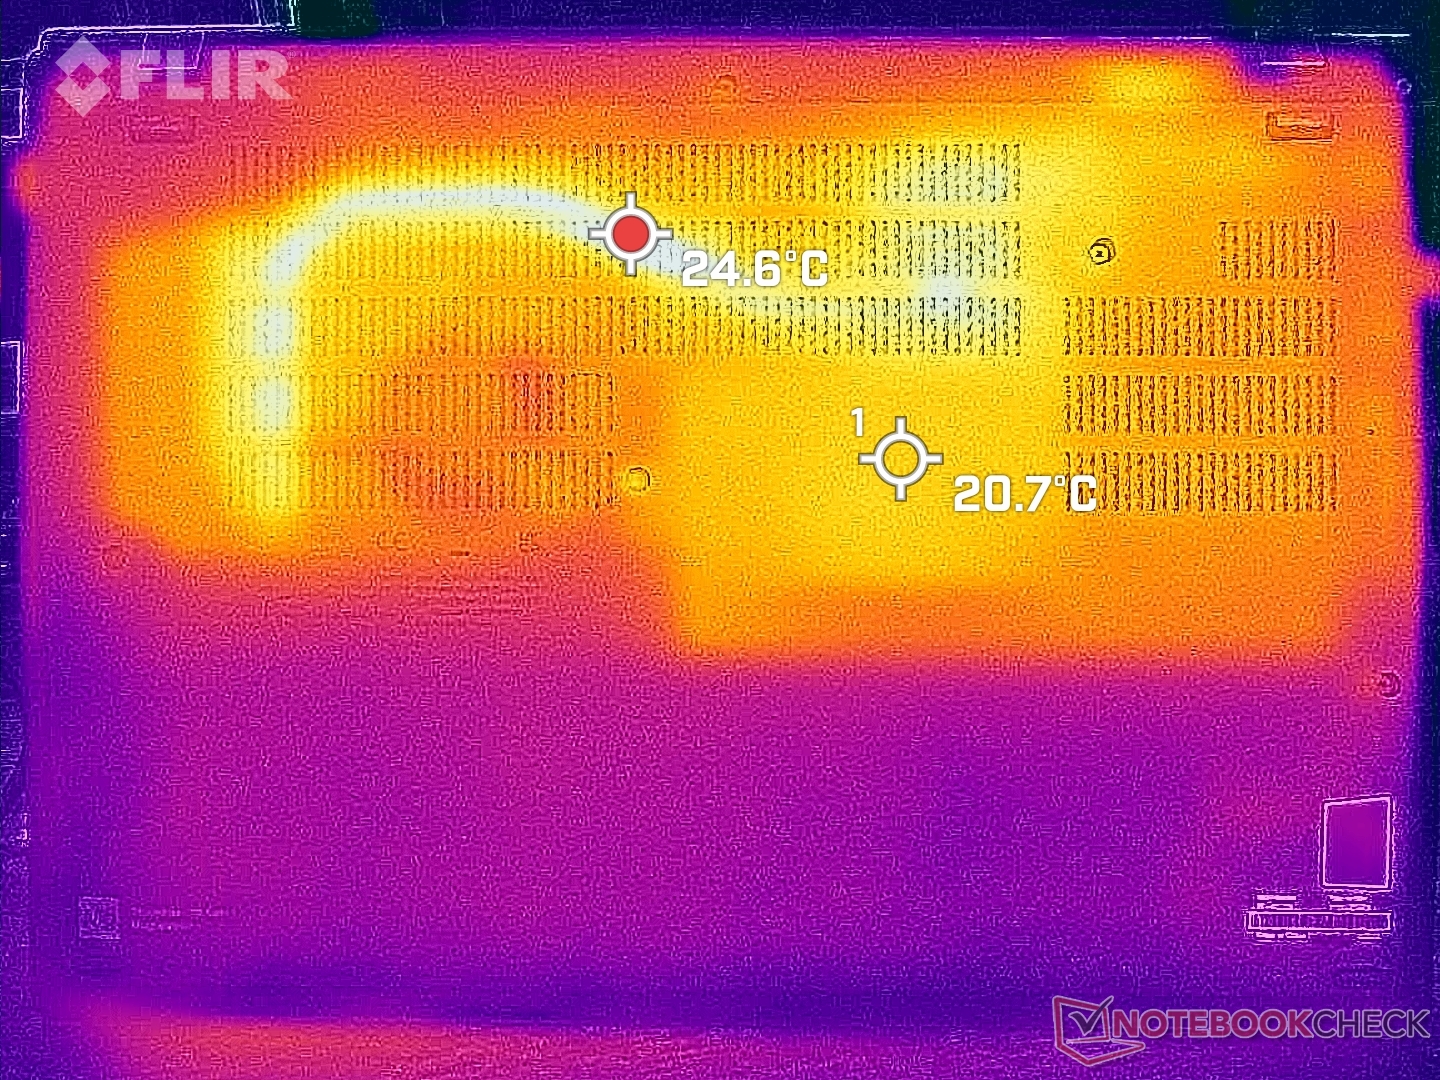
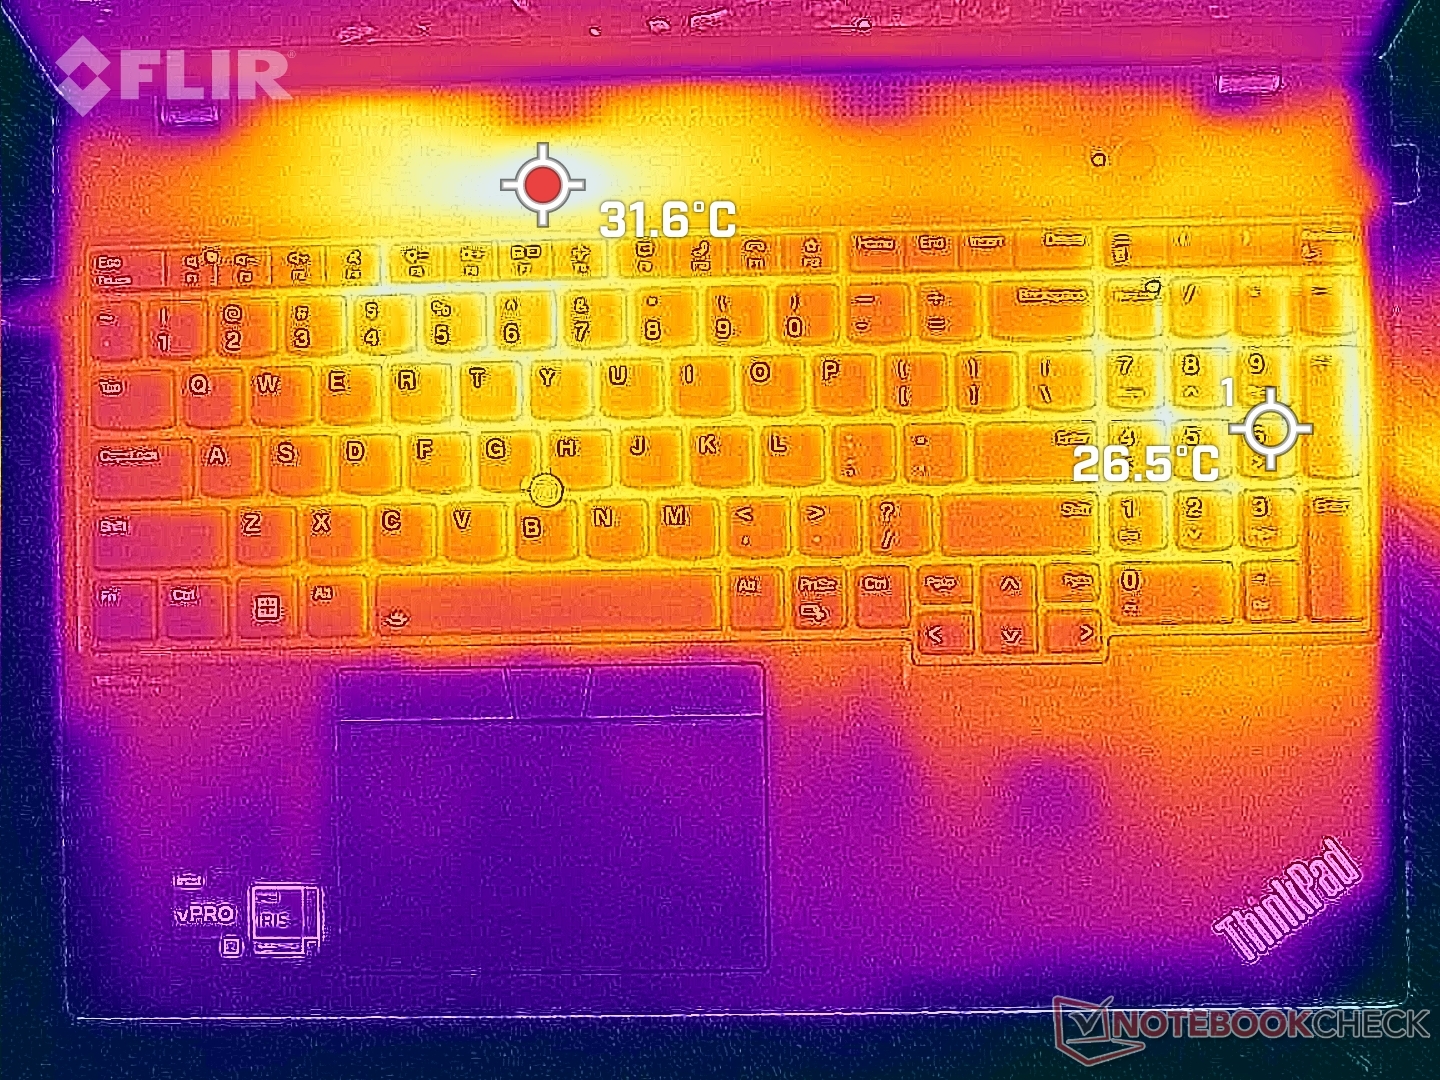
顶层甲板的表面温度比底层的要低得多。在运行高要求的负载时,键盘甲板和掌托上的平均温度约为29℃,而底层表面的温度为36℃。这与大多数其他笔记本电脑相比,如在 LG Gram 16那里的键盘中心可以达到44℃,比我们的ThinkPad T16 G1的温度高10℃以上。
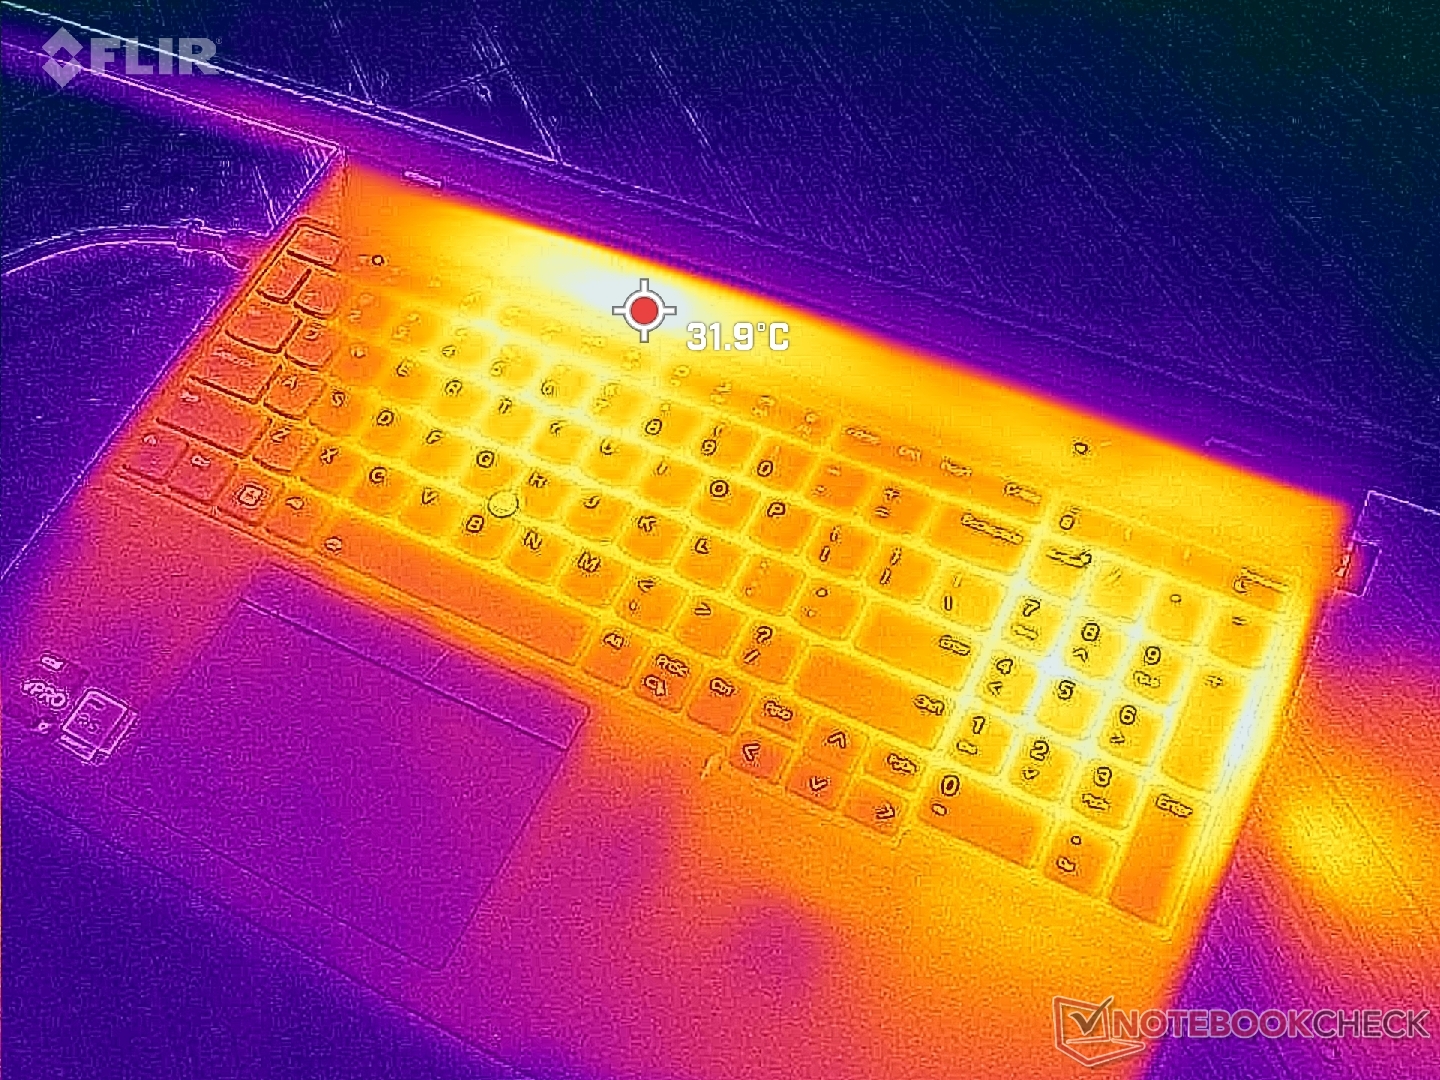
(+) The maximum temperature on the upper side is 33.8 °C / 93 F, compared to the average of 34.3 °C / 94 F, ranging from 21.2 to 62.5 °C for the class Office.
(-) The bottom heats up to a maximum of 47 °C / 117 F, compared to the average of 36.8 °C / 98 F
(+) In idle usage, the average temperature for the upper side is 22.6 °C / 73 F, compared to the device average of 29.5 °C / 85 F.
(+) The palmrests and touchpad are cooler than skin temperature with a maximum of 24.6 °C / 76.3 F and are therefore cool to the touch.
(+) The average temperature of the palmrest area of similar devices was 27.5 °C / 81.5 F (+2.9 °C / 5.2 F).
| Lenovo ThinkPad T16 Gen 1 Core i7-1270P Intel Core i7-1270P, Intel Iris Xe Graphics G7 96EUs | Lenovo ThinkPad T16 G1 21BWS00200 Intel Core i5-1240P, Intel Iris Xe Graphics G7 80EUs | LG Gram 16Z90Q Intel Core i7-1260P, Intel Iris Xe Graphics G7 96EUs | HP EliteBook 865 G9 AMD Ryzen 7 PRO 6850U, AMD Radeon 680M | Huawei MateBook 16s i7 Intel Core i7-12700H, Intel Iris Xe Graphics G7 96EUs | Apple MacBook Pro 16 2021 M1 Pro Apple M1 Pro, Apple M1 Pro 16-Core GPU | |
|---|---|---|---|---|---|---|
| Heat | -19% | -6% | 0% | -13% | 3% | |
| Maximum Upper Side * (°C) | 33.8 | 45 -33% | 45 -33% | 39.4 -17% | 40.9 -21% | 41 -21% |
| Maximum Bottom * (°C) | 47 | 42.8 9% | 43 9% | 47.6 -1% | 48.3 -3% | 39 17% |
| Idle Upper Side * (°C) | 24.6 | 33 -34% | 26 -6% | 23.6 4% | 29.2 -19% | 24 2% |
| Idle Bottom * (°C) | 28.2 | 33.6 -19% | 26 8% | 24.1 15% | 30.4 -8% | 24 15% |
* ... smaller is better
压力测试
在我们的测试过程中,性能急剧下降。 Witcher 3和CineBench R15 xT循环测试中,可以通过WiNFO观察到。例如,当运行Prime95时,CPU时钟速率和电路板功耗将分别提升到3.5 GHz和48 W。然而,一旦核心温度在几秒钟后达到97℃,时钟频率和板卡功耗将开始稳步下降,分别低至1.7 GHz和22 W,以保持69℃的较低核心温度。
运行时的GPU时钟速率和温度 Witcher 3将分别稳定在998兆赫和67摄氏度,而在较小的GPU上则为1100兆赫和58摄氏度。 HP Dragonfly Folio 13.5 G3.用电池供电运行似乎并不影响性能。
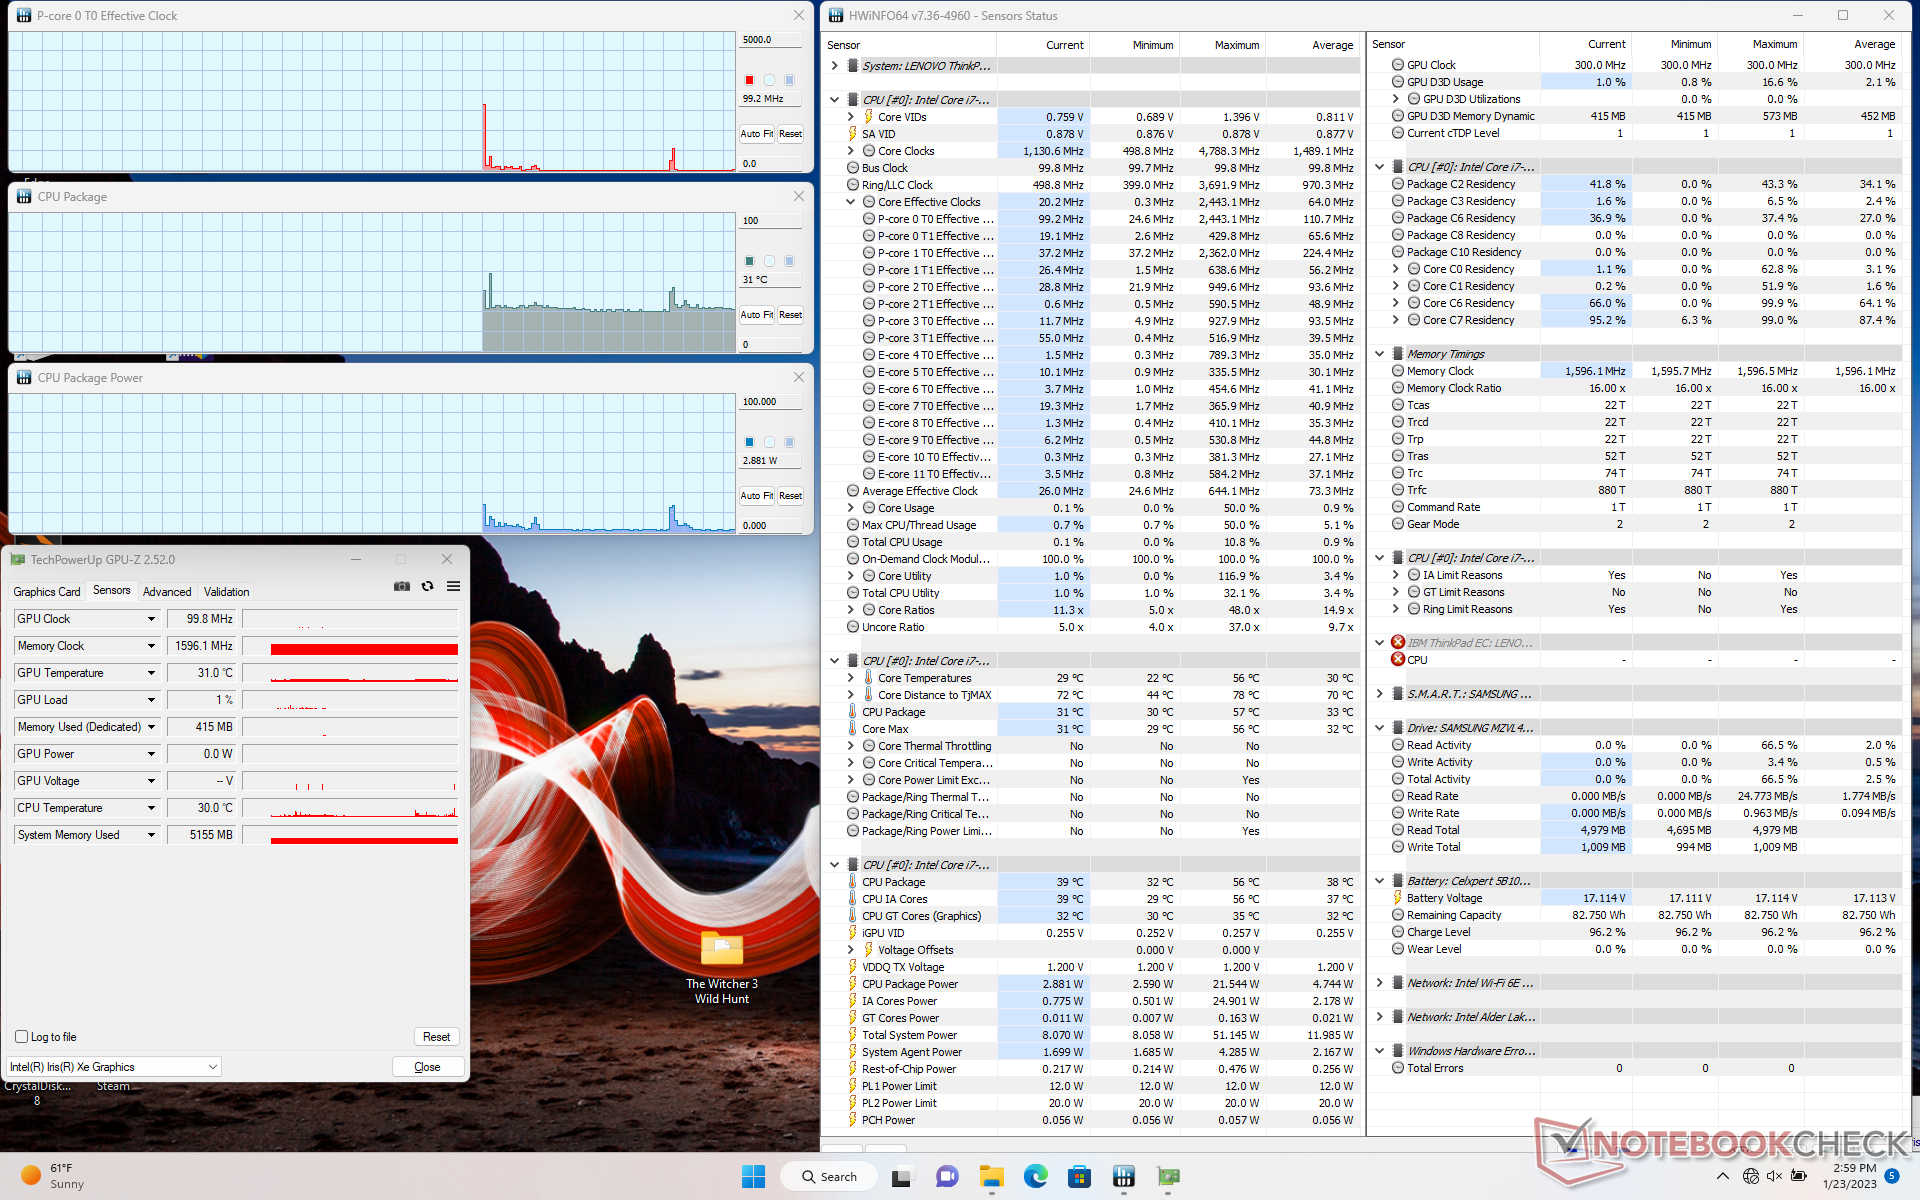
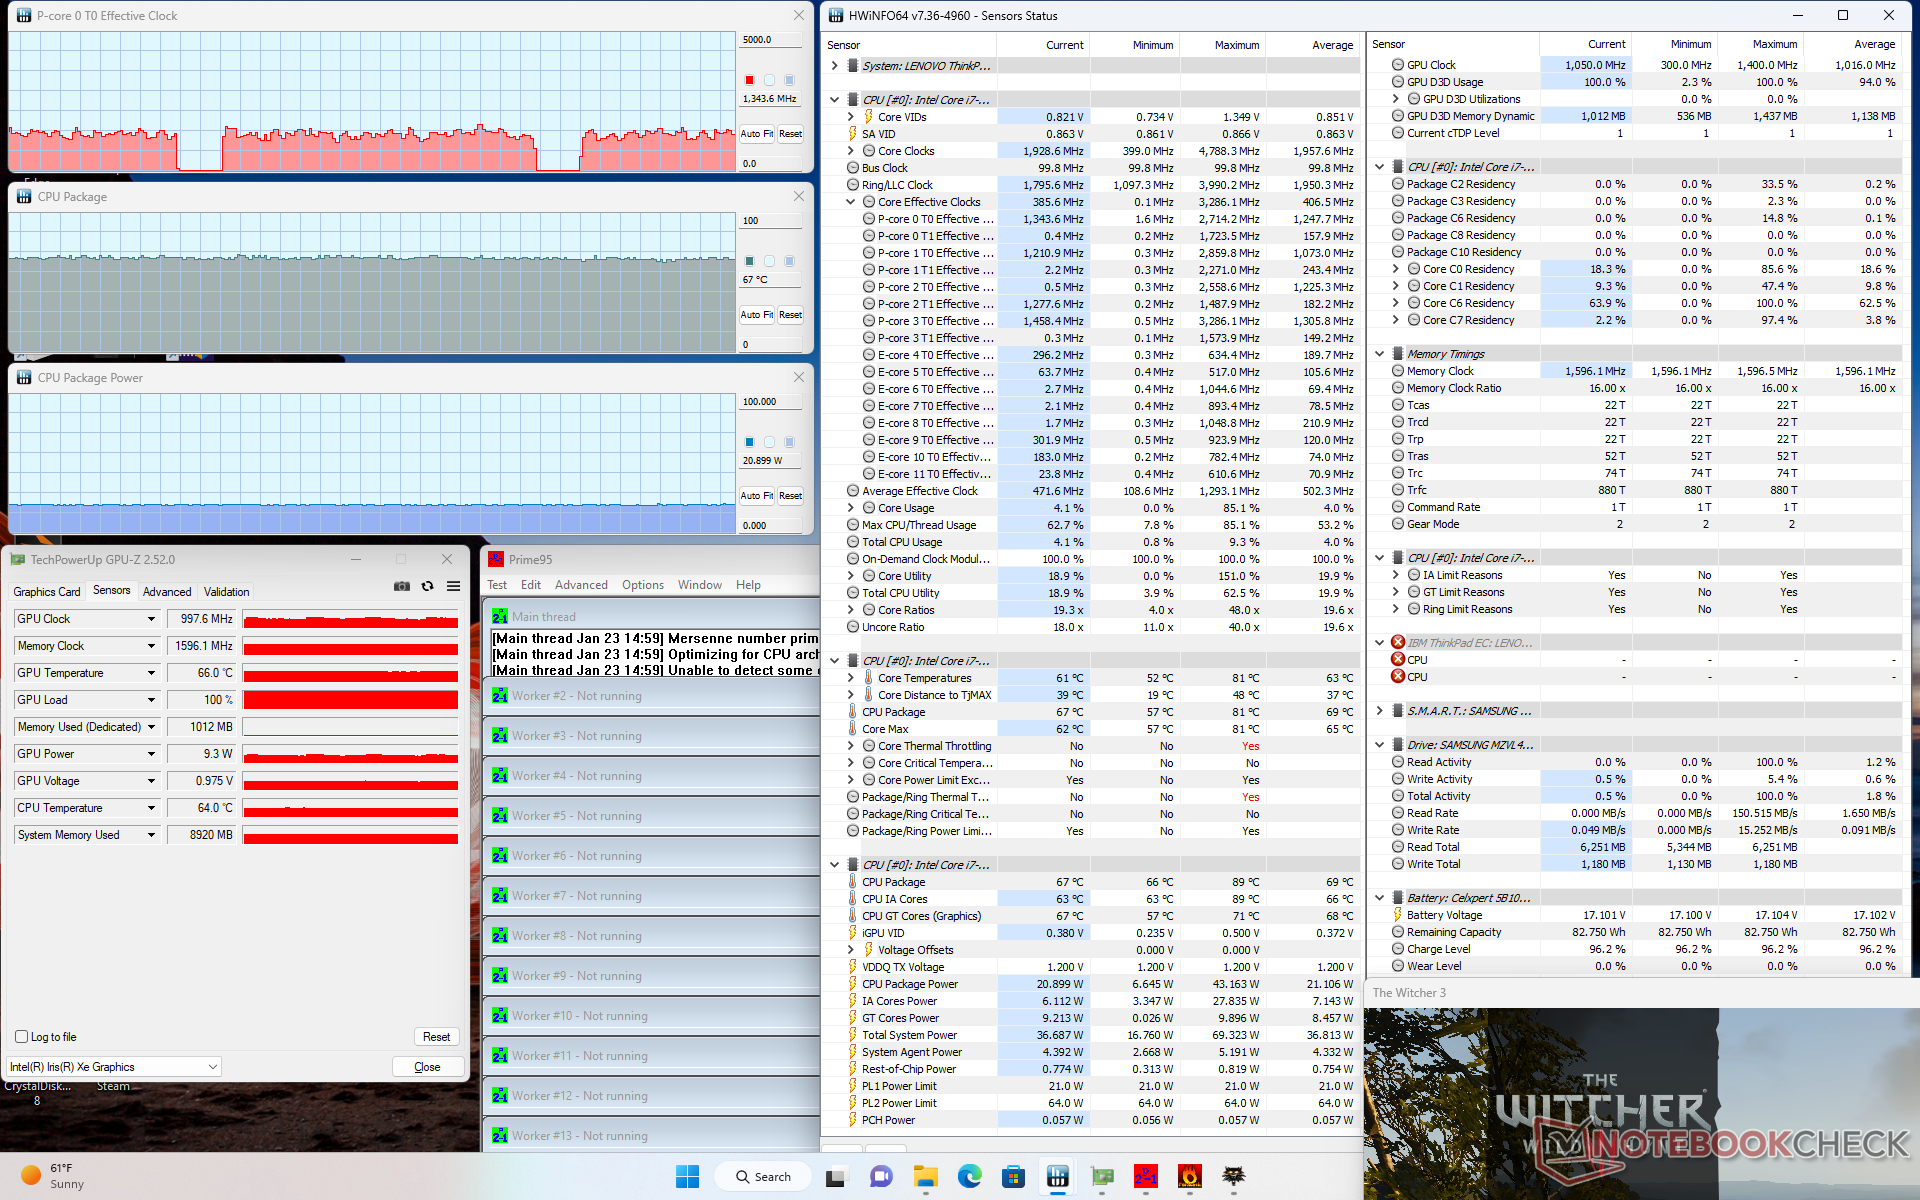
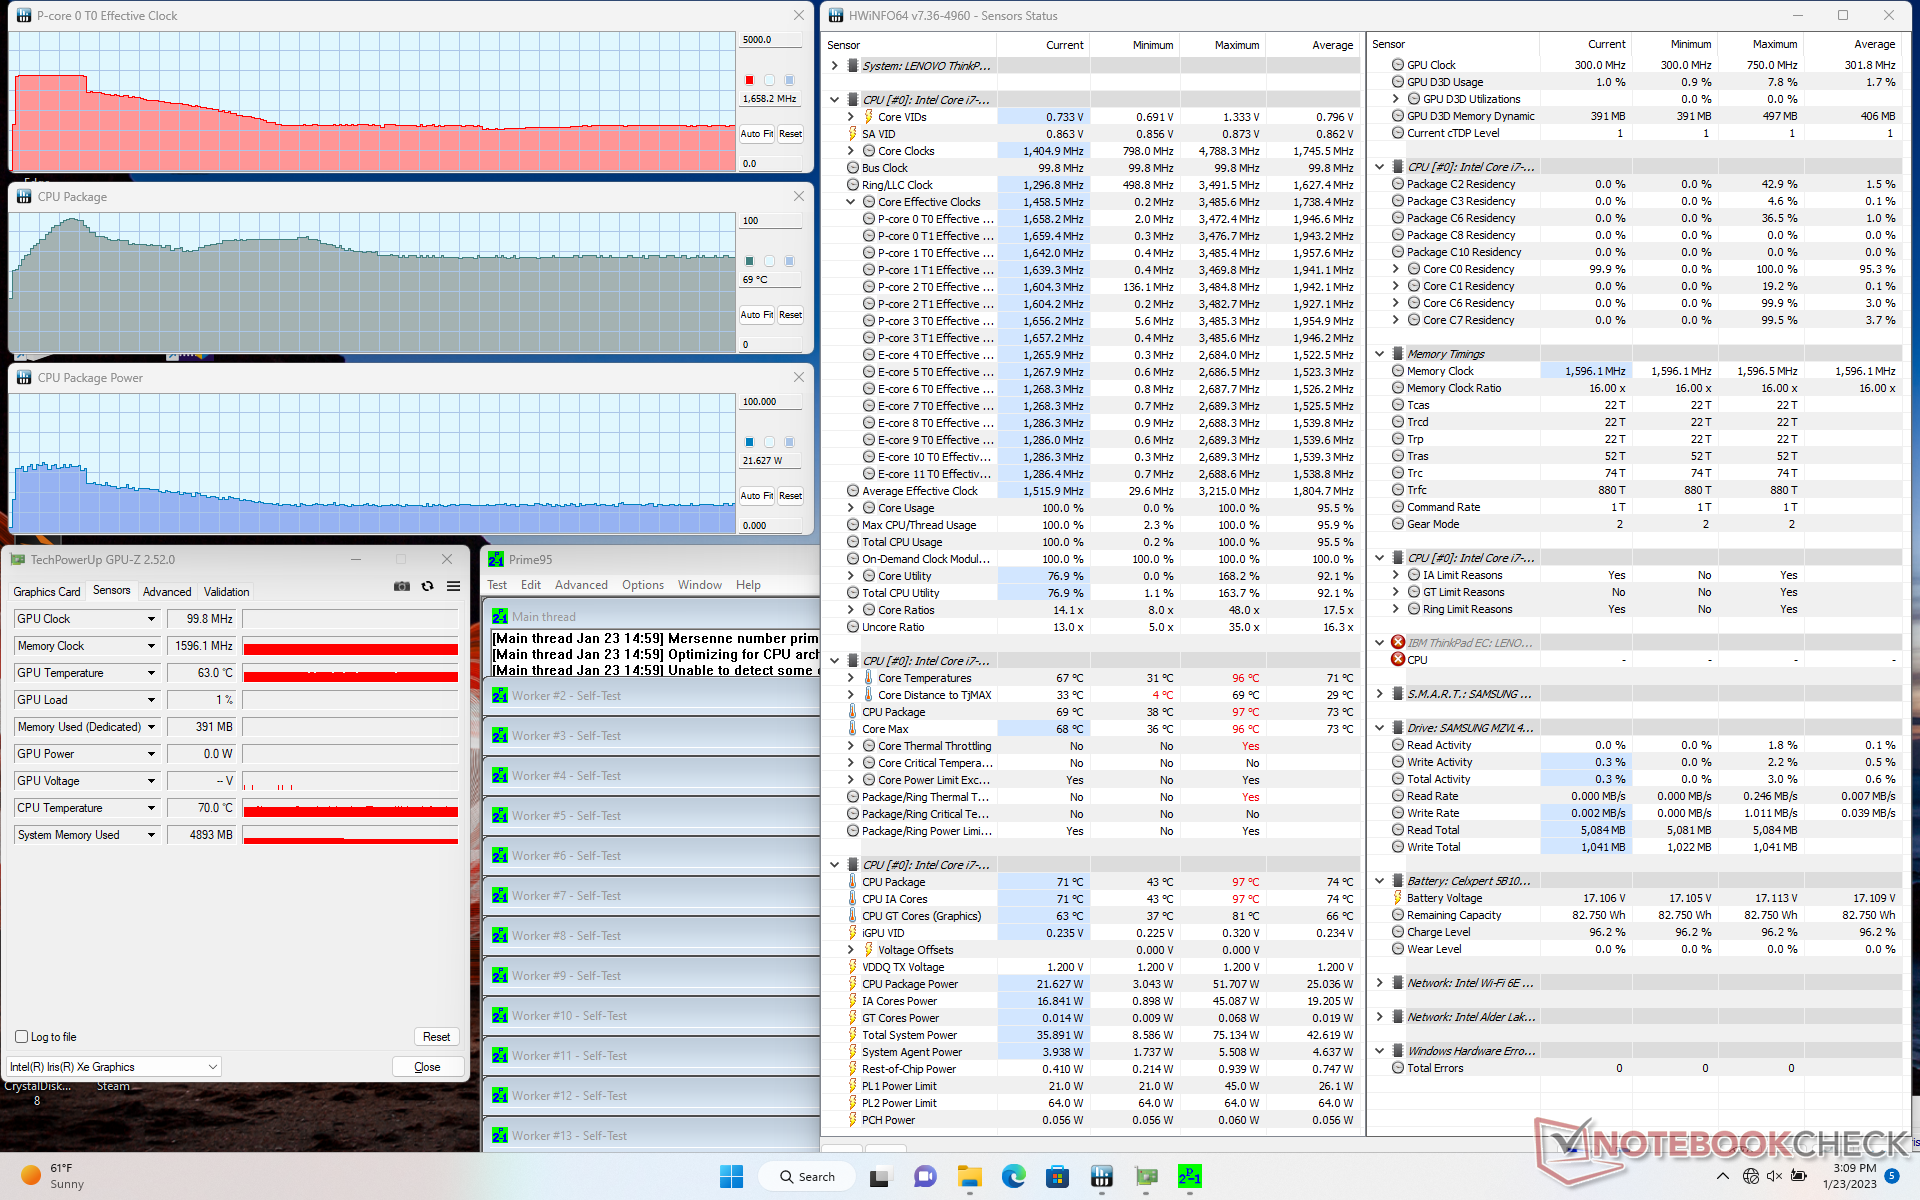
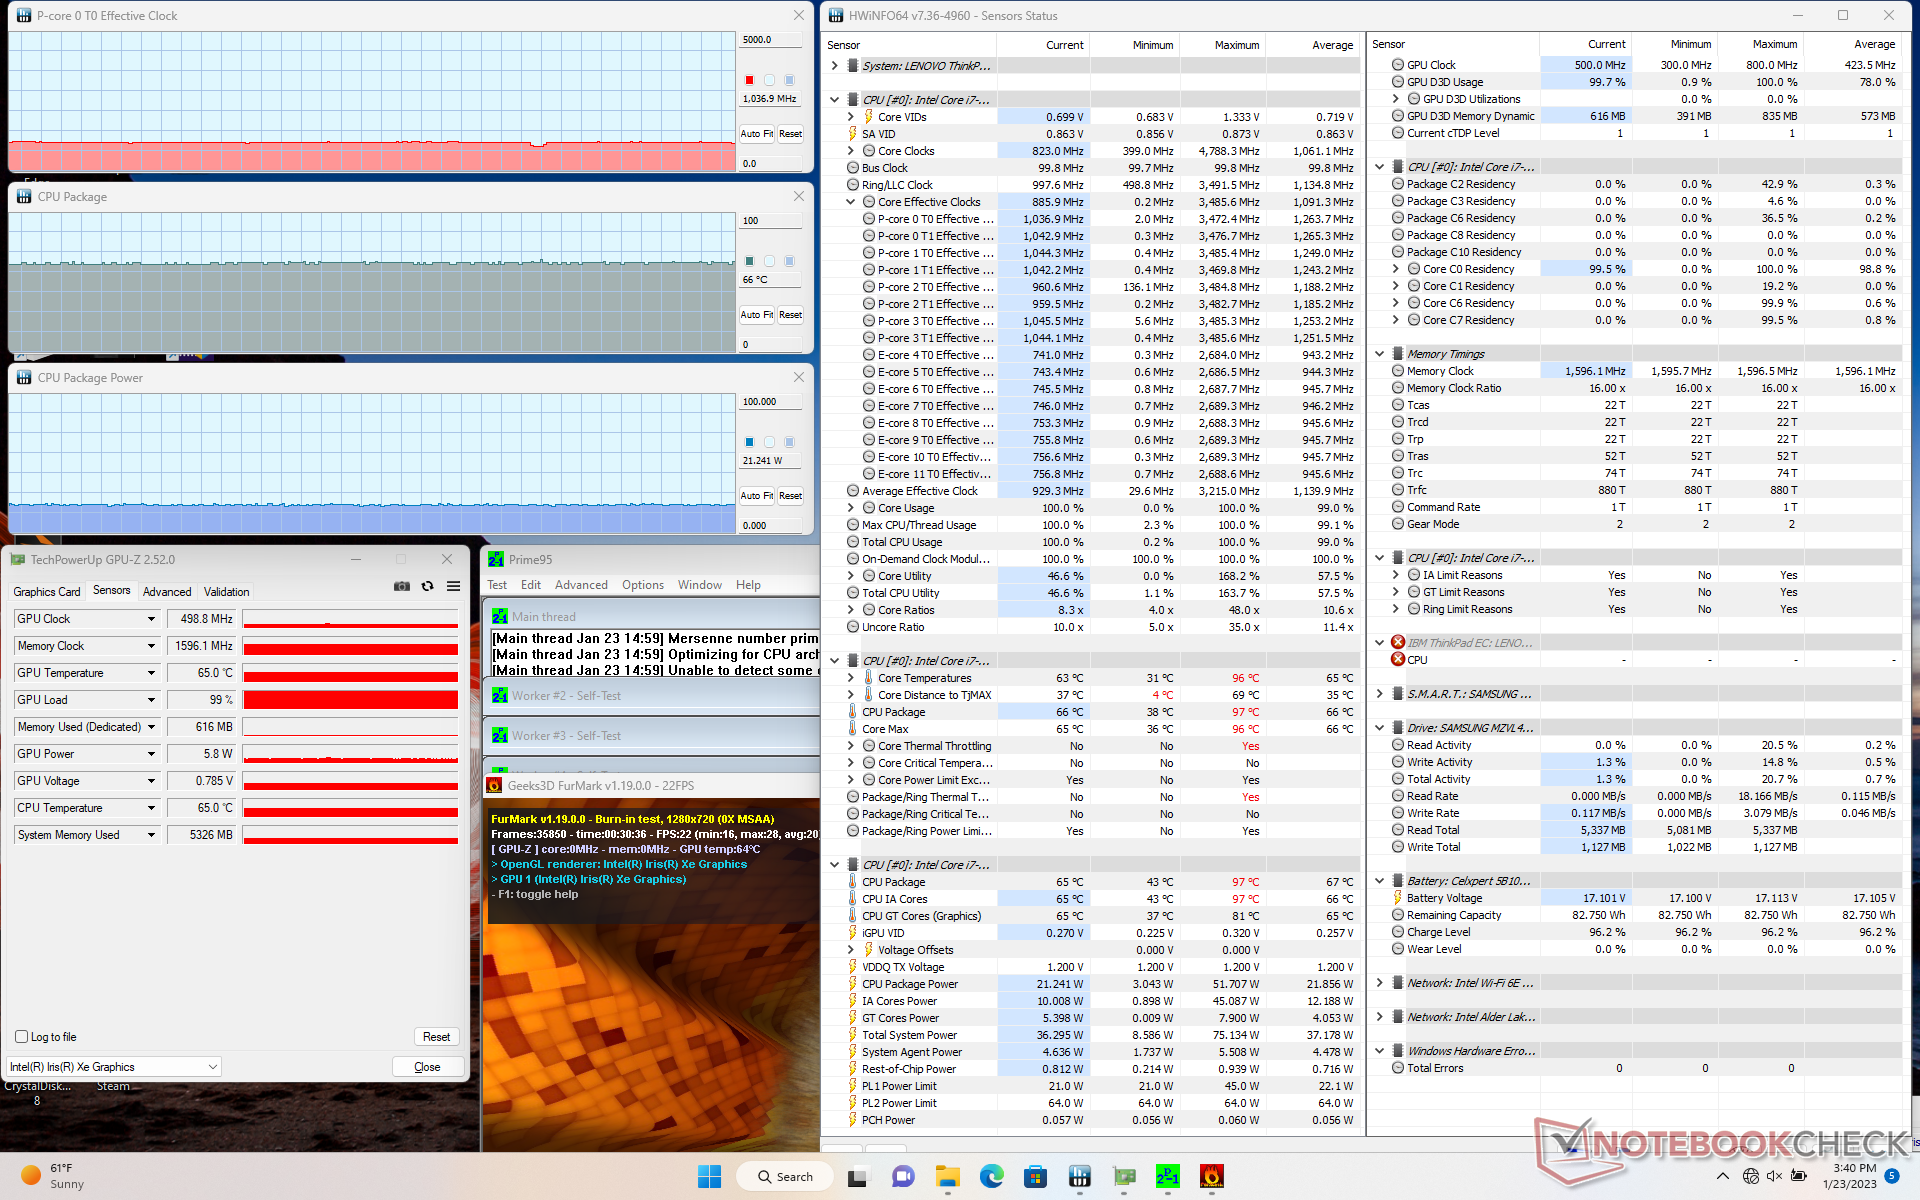
| CPU时钟(GHz) | GPU时钟(MHz) | CPU平均温度(°C) | |
| 系统空闲 | -- | -- | 31 |
| Prime95压力 | 1.7 | -- | 69 |
| Prime95 + FurMark 压力 | 1.0 | 499 | 66 |
| Witcher 3 应力 | ~1.3 | 998 | 67 |
发言人
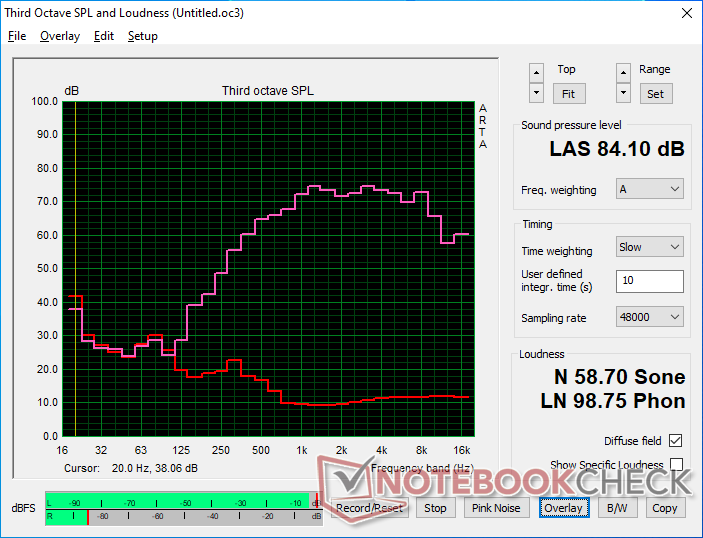
Lenovo ThinkPad T16 Gen 1 Core i7-1270P audio analysis
(+) | speakers can play relatively loud (84.1 dB)
Bass 100 - 315 Hz
(-) | nearly no bass - on average 26.3% lower than median
(±) | linearity of bass is average (11.1% delta to prev. frequency)
Mids 400 - 2000 Hz
(+) | balanced mids - only 4.5% away from median
(+) | mids are linear (5.1% delta to prev. frequency)
Highs 2 - 16 kHz
(±) | higher highs - on average 5.8% higher than median
(+) | highs are linear (4.8% delta to prev. frequency)
Overall 100 - 16.000 Hz
(±) | linearity of overall sound is average (20.1% difference to median)
Compared to same class
» 43% of all tested devices in this class were better, 10% similar, 47% worse
» The best had a delta of 7%, average was 21%, worst was 53%
Compared to all devices tested
» 52% of all tested devices were better, 8% similar, 40% worse
» The best had a delta of 4%, average was 23%, worst was 134%
Apple MacBook Pro 16 2021 M1 Pro audio analysis
(+) | speakers can play relatively loud (84.7 dB)
Bass 100 - 315 Hz
(+) | good bass - only 3.8% away from median
(+) | bass is linear (5.2% delta to prev. frequency)
Mids 400 - 2000 Hz
(+) | balanced mids - only 1.3% away from median
(+) | mids are linear (2.1% delta to prev. frequency)
Highs 2 - 16 kHz
(+) | balanced highs - only 1.9% away from median
(+) | highs are linear (2.7% delta to prev. frequency)
Overall 100 - 16.000 Hz
(+) | overall sound is linear (4.6% difference to median)
Compared to same class
» 0% of all tested devices in this class were better, 0% similar, 100% worse
» The best had a delta of 5%, average was 17%, worst was 45%
Compared to all devices tested
» 0% of all tested devices were better, 0% similar, 100% worse
» The best had a delta of 4%, average was 23%, worst was 134%
能源管理
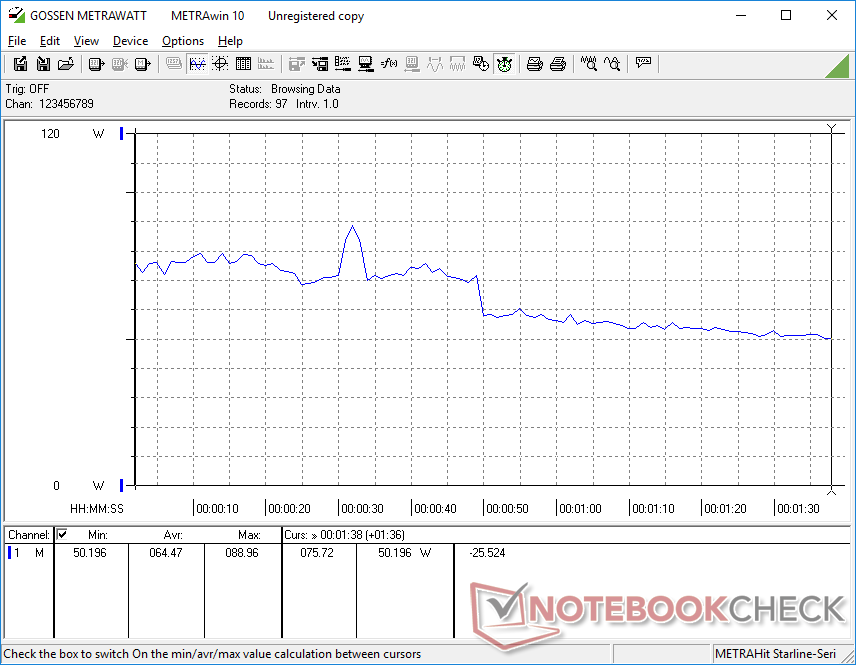
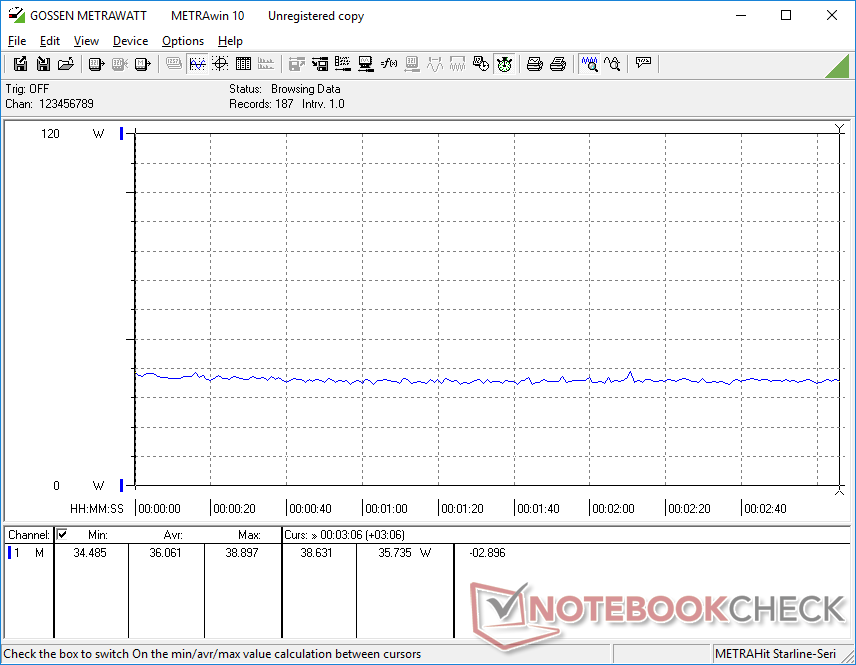
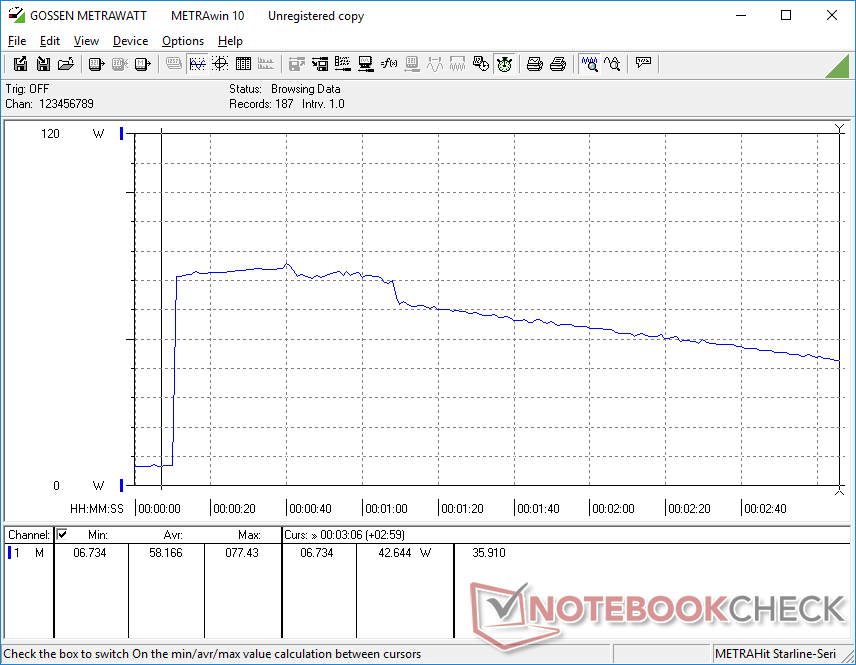
消耗功率
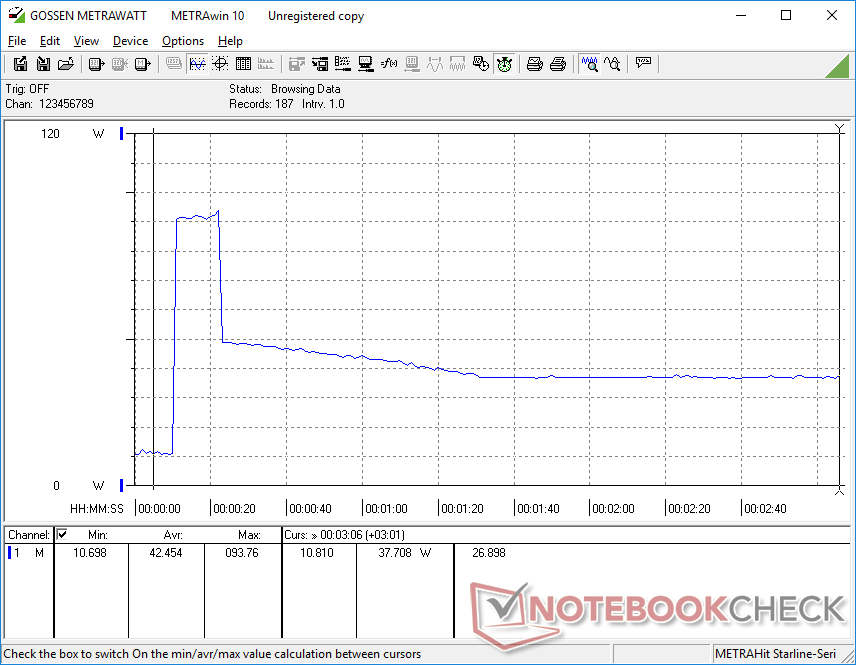
运行更高的负载时的功耗反映了我们上述的时钟速率和性能观察。也就是说,在压力的最初几个时刻,它可能很高,然后由于性能节流而从悬崖上跌落到较低水平。例如,当运行Prime95时,在大约60秒内,消耗量会很高,约为77W,然后随着时间的推移下降到42W或更低。即使设置为高性能模式也会出现这种情况。
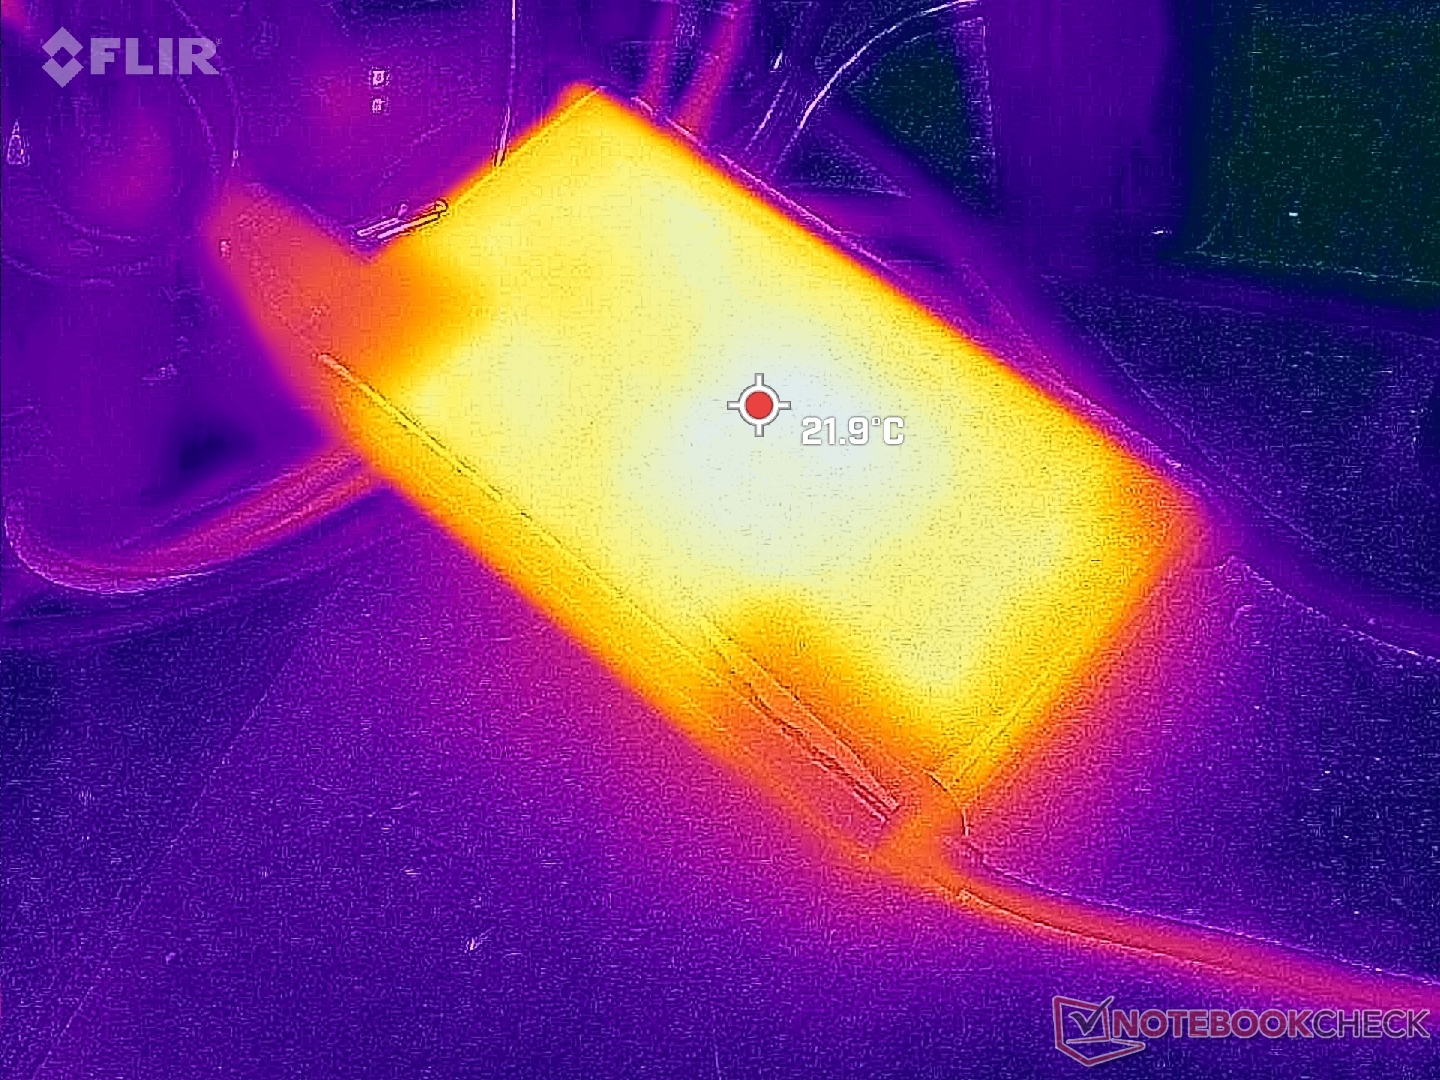
当CPU和集成GPU各自处于100%的利用率时,我们能够从中小型(约14.6 x 7.7 x 2.5厘米)135瓦的USB-C交流适配器中记录到94瓦的最大消耗。然而,这个比率只是暂时的,如下图所示。相对较高的开销允许笔记本电脑为要求更高的Thunderbolt设备供电,如某些底座和显示器。联想提供了一个更小、更便携的65W交流适配器作为替代。
| Off / Standby | |
| Idle | |
| Load |
|
Key:
min: | |
| Lenovo ThinkPad T16 Gen 1 Core i7-1270P i7-1270P, Iris Xe G7 96EUs, Samsung PM9B1 512GB MZAL4512HBLU, IPS, 1920x1200, 16" | Lenovo ThinkPad T16 G1 21BWS00200 i5-1240P, Iris Xe G7 80EUs, Samsung PM9A1 MZVL2512HCJQ, IPS, 1920x1200, 16" | LG Gram 16Z90Q i7-1260P, Iris Xe G7 96EUs, Samsung PM9A1 MZVL21T0HCLR, IPS, 2560x1600, 16" | HP EliteBook 865 G9 R7 PRO 6850U, Radeon 680M, Samsung PM991 MZVLQ512HBLU, IPS, 1920x1200, 16" | Huawei MateBook 16s i7 i7-12700H, Iris Xe G7 96EUs, Silicon Motion PCIe-8 SSD, IPS, 2520x1680, 16" | Apple MacBook Pro 16 2021 M1 Pro M1 Pro, M1 Pro 16-Core GPU, Apple SSD AP1024R, Mini-LED, 3456x2234, 16.2" | |
|---|---|---|---|---|---|---|
| Power Consumption | 21% | -3% | -21% | -45% | -34% | |
| Idle Minimum * (Watt) | 3.5 | 2.9 17% | 5 -43% | 5.3 -51% | 6.8 -94% | 5 -43% |
| Idle Average * (Watt) | 7.4 | 6 19% | 8 -8% | 12.8 -73% | 13.2 -78% | 15.1 -104% |
| Idle Maximum * (Watt) | 10.7 | 6.9 36% | 14 -31% | 14.1 -32% | 13.8 -29% | 15.5 -45% |
| Load Average * (Watt) | 64.5 | 27.3 58% | 47 27% | 48.5 25% | 75.2 -17% | 54 16% |
| Witcher 3 ultra * (Watt) | 36.1 | 42.6 -18% | 37.8 -5% | 48.7 -35% | 56.1 -55% | |
| Load Maximum * (Watt) | 93.8 | 81.53 13% | 56 40% | 56.6 40% | 90.6 3% | 90 4% |
* ... smaller is better
Power Consumption Witcher 3 / Stresstest
Power Consumption external Monitor
电池寿命 - 全天浏览网页
如下表所示,WLAN运行时间明显短于我们在Thinkpad T16 G1的Core i5 SKU上记录的时间。我们确保在两种配置之间以相同的平衡电源配置文件设置运行测试,结果不会改变。即便如此,8小时的实际浏览使用时间对大多数用户来说可能是足够的。
使用随附的交流适配器,从空电到满电大约需要90分钟。
| Lenovo ThinkPad T16 Gen 1 Core i7-1270P i7-1270P, Iris Xe G7 96EUs, 86 Wh | Lenovo ThinkPad T16 G1 21BWS00200 i5-1240P, Iris Xe G7 80EUs, 86 Wh | LG Gram 16Z90Q i7-1260P, Iris Xe G7 96EUs, 80 Wh | HP EliteBook 865 G9 R7 PRO 6850U, Radeon 680M, 76 Wh | Huawei MateBook 16s i7 i7-12700H, Iris Xe G7 96EUs, 84 Wh | Apple MacBook Pro 16 2021 M1 Pro M1 Pro, M1 Pro 16-Core GPU, 99.6 Wh | |
|---|---|---|---|---|---|---|
| Battery runtime | 76% | 26% | 88% | 1% | 111% | |
| WiFi v1.3 (h) | 8 | 14.1 76% | 10.1 26% | 15 88% | 8.1 1% | 16.9 111% |
| H.264 (h) | 10.4 | 18.5 | 9.3 | 17.5 | ||
| Load (h) | 3.5 | 2.6 | 1.8 | 1.9 | ||
| Reader / Idle (h) | 18.1 |
Pros
Cons
结论 - 不适合极端性能用户
虽然ThinkPad T16 G1并不是为高性能用户设计的,但在运行要求较高的负载时,看到如此陡峭的CPU节流率还是令人失望的。这种节流足够显著,以至于我们的酷睿i7-1270P的性能在一定时期后可以下降到与便宜的酷睿i5-1240P SKU一样慢。这样的行为意味着酷睿i7-1270P选项只在短时间内的高性能爆发中处于最佳状态,例如在启动应用程序或处理图像时,而不是在长时间的视频编码或重度图形工作中,在这种情况下会出现节流现象。
以更大的风扇噪音和/或更高的温度为代价来提高处理器性能的内置选项会在一定程度上缓解节流现象。
Ryzen 5 Pro 6650U选项比Core i7-1270P选项提供更稳定的性能。性能节流是使用酷睿P系列CPU配置的更重。
除了处理器之外,用户还应该注意缓慢的系统内存和一些可用的显示选项。前者对图形性能的影响高达10%,而一些面板可能没有图形专家所要求的颜色。竞争者HP EliteBook 865 G9是一个更苗条的替代品,拥有ThinkPad T16 G1所没有的选项,包括更亮的1000尼特显示屏和更高分辨率的5MP网络摄像头。
价格和可用性
Lenovo ThinkPad T16 Gen 1 Core i7-1270P
- 01/25/2023 v7 (old)
Allen Ngo
Transparency
The selection of devices to be reviewed is made by our editorial team. The test sample was provided to the author as a loan by the manufacturer or retailer for the purpose of this review. The lender had no influence on this review, nor did the manufacturer receive a copy of this review before publication. There was no obligation to publish this review. As an independent media company, Notebookcheck is not subjected to the authority of manufacturers, retailers or publishers.
This is how Notebookcheck is testing
Every year, Notebookcheck independently reviews hundreds of laptops and smartphones using standardized procedures to ensure that all results are comparable. We have continuously developed our test methods for around 20 years and set industry standards in the process. In our test labs, high-quality measuring equipment is utilized by experienced technicians and editors. These tests involve a multi-stage validation process. Our complex rating system is based on hundreds of well-founded measurements and benchmarks, which maintains objectivity. Further information on our test methods can be found here.
Price comparison

