Notebookcheck Logo

AMD Radeon Pro Vega 20

AMD Radeon Pro Vega 20

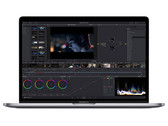
AMD Radeon Pro Vega 20是用于笔记本电脑的专用图形卡。它是作为2018 MacBook Pro的一个可选配置引入的。显卡提供20个CU(1,280个着色器)和4 GB HBM2内存。性能应该与Radeon RX Vega M GL(也是1,280个着色器)处于同一水平,因此应该在Nvidia GeForce GTX 1050和1050 Ti之间。

AMD Radeon Pro Vega Series

Pro Vega 56 3584 @ 1.25 GHz2048 Bit @ 786 MHz
Radeon Pro Vega 20 1280 @ 0.82 - 1.28 GHz
Radeon Pro Vega 16 1024
CodenameVega Mobile
ArchitectureVega
Pipelines1280 - unified
Core Speed815 - 1283 (Boost) MHz
Memory TypeHBM2
Max. Amount of Memory4 GB
Shared Memoryno
technology14 nm
Notebook Sizelarge
Date of Announcement15.11.2018

Benchmarks

3DMark - 3DMark Time Spy Score
min: 2732     avg: 2795     median: 2794.5 (8%)     max: 2857 Points
3DMark - 3DMark Time Spy Graphics
min: 2568     avg: 2601     median: 2600.5 (7%)     max: 2633 Points
Intel UHD Graphics 605
113 -96%
...
NVIDIA Quadro P2000 Max-Q
2049 -21%
AMD Radeon Pro WX Vega M GL
2062 -21%
2070 -20%
2116 -19%
AMD Radeon Pro Vega 16
2198 -15%
AMD Radeon 680M
2221 -15%
NVIDIA GeForce GTX 1050 Ti Max-Q
2245 -14%
NVIDIA GeForce GTX 1050 Ti Mobile
2309 -11%
2472 -5%
AMD Radeon Pro Vega 20
2601
2667 3%
2766 6%
2805 8%
AMD Radeon HD 8970M Crossfire
2827 9%
2864 10%
AMD Radeon RX Vega M GH
2908 12%
2993 15%
2998 15%
3074 18%
...
19434 647%
max:
36485 1303%
0%
100%
3DMark - 3DMark Ice Storm Unlimited Graphics
278586 Points (32%)
3DMark - 3DMark Cloud Gate Score
21984 Points (24%)
3DMark - 3DMark Cloud Gate Graphics
62318 Points (16%)
3DMark - 3DMark Fire Strike Standard Score
min: 7015     avg: 7448     median: 7558 (13%)     max: 7770 Points
3DMark - 3DMark Fire Strike Standard Graphics
min: 8979     avg: 9044     median: 9043.5 (10%)     max: 9108 Points
3DMark 11 - 3DM11 Performance Score
min: 11353     avg: 11935     median: 11934.5 (17%)     max: 12516 Points
3DMark 11 - 3DM11 Performance GPU
min: 12104     avg: 12289     median: 12289 (11%)     max: 12474 Points
171.8 -99%
...
11305 -8%
NVIDIA Quadro T2000 Max-Q
11461 -7%
11795 -4%
11796 -4%
11823 -4%
NVIDIA Quadro M5000M
11893 -3%
11915 -3%
12066 -2%
12196 -1%
AMD Radeon Pro Vega 20
12289
12479 2%
12583 2%
12708 3%
12797 4%
AMD Radeon HD 8970M Crossfire
13160 7%
13515 10%
13524 10%
13581 11%
13714 12%
...
59943 388%
max:
106023 763%
0%
100%
3DMark Vantage
3DM Vant. Perf. total +
3DMark Vantage - 3DM Vant. Perf. total
33590 Points (10%)
3DM Vant. Perf. GPU no PhysX +
3DMark Vantage - 3DM Vant. Perf. GPU no PhysX
32473 Points (18%)
ATI Radeon HD 3200
62 -100%
...
29214 -10%
NVIDIA GeForce GTX 1050 Ti Max-Q
29448 -9%
29844 -8%
AMD Radeon R9 M295X
29938 -8%
30252 -7%
NVIDIA Quadro P2000 Max-Q
30786 -5%
NVIDIA Quadro P2000
31451 -3%
31800 -2%
NVIDIA GeForce GTX 1050 Ti Mobile
32349 0%
AMD Radeon Pro Vega 20
32473
33179 2%
33321 3%
33740 4%
33810 4%
34450 6%
34680 7%
34951 8%
35209 8%
35286 9%
...
132443 308%
max:
170928 426%
0%
100%
3DMark 06 3DMark 06 - Standard 1280x1024 +
3DMark 06
32864 Points (43%)
Unigine Valley 1.0 - Unigine Valley 1.0 DX
35.1 fps (12%)
SPECviewperf 12
specvp12 sw-03 +
SPECviewperf 12 - specvp12 sw-03
70.7 fps (18%)
specvp12 snx-02 +
SPECviewperf 12 - specvp12 snx-02
19.5 fps (3%)
specvp12 showcase-01 +
SPECviewperf 12 - specvp12 showcase-01
44.6 fps (10%)
specvp12 mediacal-01 +
SPECviewperf 12 - specvp12 mediacal-01
20.7 fps (5%)
specvp12 maya-04 +
SPECviewperf 12 - specvp12 maya-04
60.6 fps (17%)
specvp12 energy-01 +
SPECviewperf 12 - specvp12 energy-01
5.5 fps (5%)
specvp12 creo-01 +
SPECviewperf 12 - specvp12 creo-01
49.2 fps (20%)
specvp12 catia-04 +
SPECviewperf 12 - specvp12 catia-04
78.4 fps (13%)
SPECviewperf 13 specvp13 sw-04 +
SPECviewperf 13 - specvp13 sw-04
min: 68.3     avg: 76.1     median: 76.1 (20%)     max: 83.9 fps
specvp13 snx-03 +
SPECviewperf 13 - specvp13 snx-03
min: 35.11     avg: 35.7     median: 35.7 (4%)     max: 36.27 fps
specvp13 showcase-02 +
SPECviewperf 13 - specvp13 showcase-02
min: 44.48     avg: 46.8     median: 46.8 (10%)     max: 49.03 fps
specvp13 medical-02 +
SPECviewperf 13 - specvp13 medical-02
min: 15.87     avg: 16.5     median: 16.5 (3%)     max: 17.03 fps
specvp13 maya-05 +
SPECviewperf 13 - specvp13 maya-05
min: 120.2     avg: 121.1     median: 121.1 (14%)     max: 122 fps
specvp13 energy-02 +
SPECviewperf 13 - specvp13 energy-02
min: 8.46     avg: 10.1     median: 10.1 (3%)     max: 11.82 fps
specvp13 creo-02 +
SPECviewperf 13 - specvp13 creo-02
min: 74.1     avg: 75.8     median: 75.8 (11%)     max: 77.4 fps
specvp13 catia-05 +
SPECviewperf 13 - specvp13 catia-05
min: 111     avg: 112.1     median: 112.1 (12%)     max: 113.1 fps
specvp13 3dsmax-06 +
SPECviewperf 13 - specvp13 3dsmax-06
min: 69.1     avg: 71.6     median: 71.6 (12%)     max: 74.1 fps
Cinebench R10 Cinebench R10 Shading (32bit) +
Cinebench R10 - Cinebench R10 Shading (32bit)
12230 points (9%)
Cinebench R11.5 Cinebench R11.5 OpenGL 64 Bit +
Cinebench R11.5 - Cinebench R11.5 OpenGL 64 Bit
96.1 fps (33%)
Cinebench R15
Cinebench R15 OpenGL 64 Bit +
Cinebench R15 - Cinebench R15 OpenGL 64 Bit
min: 124.8     avg: 129.5     median: 129.5 (8%)     max: 134.2 fps
Cinebench R15 OpenGL Ref. Match 64 Bit +
Cinebench R15 - Cinebench R15 OpenGL Ref. Match 64 Bit
min: 98     avg: 98.8     median: 98.8 (99%)     max: 99.5 %
GFXBench - GFXBench 5.0 Aztec Ruins High Tier Offscreen
65.5 fps (12%)
3.3 -95%
...
NVIDIA GeForce GTX 1050 Ti Max-Q
49.5 -24%
AMD Radeon RX 560X (Laptop)
52.4 -20%
58.3 -11%
61.4 -6%
62.7 -4%
62.7 -4%
62.8 -4%
63.8 -3%
NVIDIA Quadro T2000 Max-Q
64.8 -1%
AMD Radeon Pro Vega 20
65.5
Apple M1 7-Core GPU
72.4 11%
Apple M1 8-Core GPU
74.3 13%
78.8 20%
80.5 23%
83.4 27%
87.1 33%
89.3 36%
Apple M2 8-Core GPU
91 39%
93.2 42%
...
536 718%
0%
100%
GFXBench - GFXBench 5.0 Aztec Ruins Normal Tier Offscreen
167.1 fps (12%)
GFXBench - GFXBench Car Chase Offscreen
142.4 fps (16%)
GFXBench 3.1 - GFXBench Manhattan ES 3.1 Offscreen
117.8 fps (2%)
GFXBench 3.0 - GFXBench 3.0 Manhattan Offscreen
111.3 fps (7%)
GFXBench (DX / GLBenchmark) 2.7
GFXBench T-Rex HD Offscreen C24Z16 +
GFXBench (DX / GLBenchmark) 2.7 - GFXBench T-Rex HD Offscreen C24Z16
578 fps (5%)
LuxMark v2.0 64Bit - LuxMark v2.0 Room GPU
1091 Samples/s (5%)
LuxMark v2.0 64Bit - LuxMark v2.0 Sala GPU
2081 Samples/s (4%)
ComputeMark v2.1 - ComputeMark v2.1 Result
6431 points (7%)
- Range of benchmark values for this graphics card
- Average benchmark values for this graphics card
* Smaller numbers mean a higher performance

Game Benchmarks

The following benchmarks stem from our benchmarks of review laptops. The performance depends on the used graphics memory, clock rate, processor, system settings, drivers, and operating systems. So the results don't have to be representative for all laptops with this GPU. For detailed information on the benchmark results, click on the fps number.

low 1280x720
76.1  fps    + Compare
med. 1920x1080
50.7  fps    + Compare
high 1920x1080
47.2  fps    + Compare
ultra 1920x1080
43.9  fps    + Compare
» With all tested laptops playable in detail settings ultra.
low 1280x720
161.9  fps    + Compare
med. 1920x1080
52.6  fps    + Compare
high 1920x1080
44.2  fps    + Compare
ultra 1920x1080
37.1  fps    + Compare
» With all tested laptops playable in detail settings ultra.
low 1280x720
127.1  fps    + Compare
med. 1920x1080
73.7  fps    + Compare
high 1920x1080
62.6  fps    + Compare
ultra 1920x1080
59.6  fps    + Compare
» With all tested laptops playable in detail settings ultra.
Hitman 2

Hitman 2

2018
low 1280x720
64.2  fps    + Compare
med. 1920x1080
52.7  fps    + Compare
high 1920x1080
48.5  fps    + Compare
ultra 1920x1080
45.2  fps    + Compare
» With all tested laptops playable in detail settings ultra.
low 1280x720
111  fps    + Compare
med. 1920x1080
47  fps    + Compare
high 1920x1080
41  fps    + Compare
ultra 1920x1080
35  fps    + Compare
» With all tested laptops playable in detail settings high.
F1 2018

F1 2018

2018
low 1280x720
142  fps    + Compare
med. 1920x1080
76  fps    + Compare
high 1920x1080
65  fps    + Compare
ultra 1920x1080
44  fps    + Compare
» With all tested laptops playable in detail settings ultra.
Far Cry 5

Far Cry 5

2018
low 1280x720
59  fps    + Compare
med. 1920x1080
40  fps    + Compare
high 1920x1080
37  fps    + Compare
ultra 1920x1080
37  fps    + Compare
» With all tested laptops playable in detail settings ultra.
low 1280x720
72.3  fps    + Compare
med. 1920x1080
58  fps    + Compare
high 1920x1080
49.4  fps    + Compare
» With all tested laptops playable in detail settings high.
low 1280x720
236.8  fps    + Compare
med. 1920x1080
190.7  fps    + Compare
high 1920x1080
122.4  fps    + Compare
» With all tested laptops playable in detail settings high.
For Honor

For Honor

2017
low 1280x720
179.3  fps    + Compare
med. 1920x1080
64.9  fps    + Compare
high 1920x1080
61.3  fps    + Compare
ultra 1920x1080
49.1  fps    + Compare
» With all tested laptops playable in detail settings ultra.
low 1024x768
120.4  fps    + Compare
high 1920x1080
87.3  fps    + Compare
ultra 1920x1080
74.6  fps    + Compare
» With all tested laptops playable in detail settings ultra.
low 1280x720
102  fps    + Compare
med. 1366x768
105  fps    + Compare
high 1920x1080
84.5  fps    + Compare
ultra 1920x1080
78.3  fps    + Compare
4K 3840x2160
41.1  fps    + Compare
» With all tested laptops playable in detail settings ultra.
low 1024x768
119  fps    + Compare
high 1920x1080
49.6  fps    + Compare
ultra 1920x1080
29.4 31.8 ~ 31 fps    + Compare + 📈 Graph
» With all tested laptops playable in detail settings high.
lowmed.highultraQHD4K
Just Cause 476.150.747.243.9
Darksiders III161.952.644.237.1
Battlefield V127.173.762.659.6
Hitman 264.252.748.545.2
Shadow of the Tomb Raider111474135
F1 2018142766544
Far Cry 559403737
X-Plane 11.1172.35849.4
Rocket League236.8190.7122.4
For Honor179.364.961.349.1
Rise of the Tomb Raider120.487.374.6
Dota 2 Reborn10210584.578.341.1
The Witcher 311949.631
< 30 fps
< 60 fps
< 120 fps
≥ 120 fps

1
6
6

6
4
1

7
5
1

9
2


1

For more games that might be playable and a list of all games and graphics cards visit our Gaming List

v1.26
log 25. 09:26:05

#0 no ids found in url (should be separated by "_") +0s ... 0s

#1 not redirecting to Ajax server +0s ... 0s

#2 did not recreate cache, as it is less than 5 days old! Created at Thu, 25 Apr 2024 05:40:10 +0200 +0.001s ... 0.001s

#3 no comparison url found in template nbc.compare_page_1 needed +0.036s ... 0.037s

#4 no comparison url found in template nbc.compare_page_1 needed +0s ... 0.037s

#5 composed specs +0s ... 0.037s

#6 did output specs +0s ... 0.037s

#7 start showIntegratedCPUs +0s ... 0.037s

#8 getting avg benchmarks for device 9391 +0.013s ... 0.049s

#9 got single benchmarks 9391 +0.01s ... 0.059s

#10 got avg benchmarks for devices +0s ... 0.059s

#11 min, max, avg, median took s +0.745s ... 0.804s

#12 before gaming benchmark output +0s ... 0.804s

#13 Got 50 rows for game benchmarks. +0.006s ... 0.81s

#14 composed SQL query for gamebenchmarks +0s ... 0.81s

#15 got data and put it in $dataArray +0.009s ... 0.819s

#16 benchmarks composed for output. +0.558s ... 1.377s

#17 no comparison url found in template nbc.compare_page_1 needed +0.003s ... 1.38s

#18 return log +0s ... 1.38s

Please share our article, every link counts!

» Comparison of GPUs
Detailed list of all laptop GPUs sorted by class and performance.

» Benchmark List
Sort and restrict laptop GPUs based on performance in synthetic benchmarks.

» Notebook Gaming List
Playable games for each graphics card and their average FPS results.

Class 1

GeForce RTX 2080 Super Mobile

Class 2

M1 Max 32-Core GPU *
GeForce RTX 2070 Super Mobile
M1 Max 24-Core GPU *
Quadro RTX 5000 Max-Q
Radeon RX 5700M *
GeForce GTX 1080 Mobile
Quadro RTX 4000 (Laptop)
M1 Pro 16-Core GPU *
Radeon PRO W6600M *
GeForce RTX 2070 Super Max-Q
Quadro RTX 4000 Max-Q *
M1 Pro 14-Core GPU *
Quadro P5200
Quadro RTX 3000 Max-Q *
Quadro P4200
Quadro P5000 Max-Q *
GeForce GTX 980 (Laptop)
Quadro P4000
Quadro P4000 Max-Q
Quadro P3200
Radeon RX 580X (Laptop) *
Radeon RX 580 (Laptop)
Radeon Pro 5300M
Radeon RX 5300M
Quadro P3000 Max-Q *
Quadro T2000 Max-Q *
Radeon Pro WX 7100 *
Radeon RX 570X (Laptop) *
Radeon RX 570 (Laptop) *
Radeon RX 470 (Laptop) *
Quadro T1000 Max-Q *

Class 3

Vega M GH
Quadro M5000M
GeForce GTX 1050 Ti Mobile
Radeon 680M
Quadro P2000
Quadro P2000 Max-Q
Quadro M4000M
T500 Laptop GPU *
Radeon R9 M395X
GeForce GTX 1050 Ti Max-Q *
Radeon Pro Vega 16
WX Vega M GL
Radeon R9 M485X
Quadro M3000M
FirePro W7170M
Radeon R9 M395
GeForce GTX 1050 Max-Q *
Radeon 660M
Radeon Pro WX 4150 *
Radeon RX 560X (Laptop)
Radeon RX 560 (Laptop)
Radeon RX 460 (Laptop)
Quadro P1000
Radeon R9 M390
Xe MAX
Radeon Pro 560X
Radeon Pro 560
Radeon Pro 460
Radeon Pro WX 4130 *
GeForce GTX 960M
Quadro P620 *
Radeon RX 550X (Laptop)
Radeon Pro WX 3200 *
Radeon Pro 555X
Radeon Pro 555
Radeon Pro 455
Quadro P600
Quadro M2000M
Radeon RX 540X *
Radeon Pro WX 2100 *
Radeon Pro WX 3100 *
GeForce GTX 950M
Radeon Pro 450
Radeon 630
Radeon 540X *
Radeon R9 M385X
Quadro P520
Quadro M1000M
GeForce 945M
Quadro P500 *
Iris Plus Graphics G7 (Ice Lake 64 EU) *
Vega 10 *
Iris Pro Graphics 580
FirePro W5170M *
Radeon R9 M370X
Vega 9
FirePro W5130M
UHD Graphics Xe G4 48EUs *
UHD Graphics 32EUs
UHD Graphics Xe 32EUs (Tiger Lake-H) *
UHD Graphics 750
Vega 7
Radeon R7 M465
Iris Pro Graphics 6200
Vega 8
GeForce 940M
Iris Plus Graphics G4 (Ice Lake 48 EU)
Quadro M600M
FirePro W4190M
Radeon R9 M375
Radeon R7 M445
Iris Plus Graphics 650
Iris Graphics 550
Radeon 625
Vega 6 *
Iris Plus Graphics 640
Iris Graphics 540
UHD Graphics 24EUs (Alder Lake-N) *
Radeon R7 M360
GeForce 920M
Radeon 620
Radeon R7 M340
Radeon 610
Radeon 610M *
Vega 6 *
UHD Graphics G1 (Ice Lake 32 EU)
UHD Graphics Xe 16EUs (Tiger Lake-H) *
HD Graphics 530
Radeon R5 (Bristol Ridge)
Adreno 690 *
Adreno 685 *
Adreno 680 *
Radeon R5 M330
GeForce 910M
HD Graphics 520

Class 4

UHD Graphics 730
Radeon R5 M320 *
Radeon R5 M315 *
Radeon R5 M420 *
Vega 2 *
UHD Graphics 617
UHD Graphics 615
HD Graphics 515
UHD Graphics 610
HD Graphics 510
UHD Graphics 605
Radeon R4 (Stoney Ridge)
Radeon R2 (Stoney Ridge)
HD Graphics (Broadwell)
UHD Graphics 600
HD Graphics (Braswell)

Class 5

* Approximate position of the graphics adapter