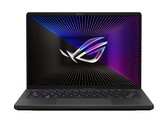
Notebookcheck Logo

AMD Radeon RX 6700S

AMD Radeon RX 6700S

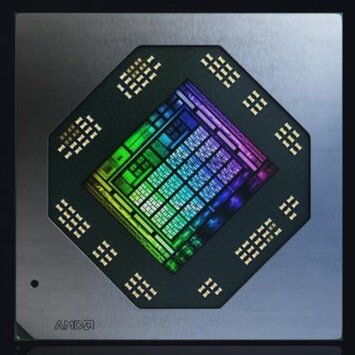
AMD Radeon RX 6700S是一款用于游戏笔记本电脑的移动高端显卡。它使用基于新RDNA 2架构的Navi 22芯片。它使用了2,560个着色器中的2,304个(=36个CU),144? TMU,和64个ROPs。160位内存系统连接10GB GDDR6,内存时钟为2GHz。此外,RX6800S包括80 MB的无限缓存。AMD指定2GHz游戏时钟,在80瓦的TDP下可获得7.9 TFLOPS的理论FP32性能。这意味着该GPU在理论上比Radeon RX 6650M(8,85 TFLOPS)要慢。6700S是RX 6700M的省电变体,具有较慢的时钟速度和较低的TDP。

RX 6700S的游戏性能应该与Radeon RX 6650M相似。AMD指定的性能类似于低功率的RTX 3060。当激活Raytracing效果时,它落后于GeForce GPU。

Navi 22芯片是在台积电以现代7纳米工艺制造的。

Radeon RX 6000M Series

Radeon RX 6850M XT 2560 @ 2.46 GHz192 Bit @ 18000 MHz
Radeon RX 6800M 2560 @ 2.12 - 2.3 GHz192 Bit @ 16000 MHz
Radeon RX 6800S 2048 @ 1.8 - 1.98 GHz128 Bit @ 16000 MHz
Radeon RX 6700M 2304 @ 2.3 GHz160 Bit @ 16000 MHz
Radeon RX 6650M XT 2048 @ 2.16 GHz128 Bit @ 18000 MHz
Radeon RX 6650M 1792 @ 2.22 GHz128 Bit @ 18000 MHz
Radeon RX 6600M 1792 @ 2.07 - 2.18 GHz128 Bit @ 14000 MHz
Radeon RX 6700S 1792 @ 1.7 - 1.89 GHz128 Bit @ 14000 MHz
Radeon PRO W6600M 1792 128 Bit @ 14000 MHz
Radeon RX 6600S 1792 @ 1.88 GHz128 Bit @ 16000 MHz
Radeon RX 6550M 1024 @ 2 - 2.56 GHz64 Bit @ 18000 MHz
Radeon RX 6500M 1024 @ 2.19 GHz64 Bit @ 18000 MHz
Radeon RX 6550S 1024 @ 2.17 GHz64 Bit @ 16000 MHz
Radeon RX 6450M 768 @ 2 - 2.22 GHz64 Bit @ 18000 MHz
Radeon RX 6300M 768 @ 1.51 GHz128 Bit @ 18000 MHz
ArchitectureRDNA 2
Pipelines1792 - unified
TMUs112
ROPs64
Raytracing Cores28
Core Speed1700 - 1890 (Boost) MHz
Theoretical Performance15.84 TFLOPS FP16, 7.92 TFLOPS FP32
CacheL2: 2 MB, L3: 32 MB
Memory Speed14000 effective = 1750 MHz
Memory Bus Width128 Bit
Memory TypeGDDR6
Max. Amount of Memory10 GB
Shared Memoryno
Memory Bandwidth224 GB/s
APIDirectX 12, Shader 6.4, OpenGL 4.6
Power Consumption80 Watt
Transistor Count17.2 Billion
technology7 nm
PCIe4.0 x8
FeaturesDisplayPort 1.4 w/DFSC, HDMI 2.0b, Radeon Media Engine (H.264 4K150 decode, 4K90 encode / H.265 4K90 decode, 4K60 encode / VP9 4K90 decode)
Notebook Sizemedium sized
Date of Announcement04.01.2022
Link to Manufacturer Pagewww.amd.com

Benchmarks

Performance Rating - 3DMark 11 + Fire Strike + Time Spy
11 pt (33%)
3DMark - 3DMark Time Spy Score
8547 Points (25%)
3DMark - 3DMark Time Spy Graphics
8316 Points (22%)
Intel UHD Graphics 605
113 -99%
...
NVIDIA Quadro RTX 5000 Max-Q
7432 -11%
NVIDIA GeForce RTX 2070 Super Max-Q
7445 -10%
7651 -8%
7763 -7%
7864 -5%
7903 -5%
8057 -3%
8210 -1%
NVIDIA GeForce RTX 2070 Super Mobile
8238 -1%
AMD Radeon RX 6700S
8316
8334 0%
8351 0%
8700 5%
8798 6%
8989 8%
9033 9%
9164 10%
9300 12%
9332 12%
...
19434 134%
max:
36485 339%
0%
100%
3DMark - 3DMark Cloud Gate Score
59135 Points (63%)
3DMark - 3DMark Cloud Gate Graphics
153853 Points (40%)
3DMark - 3DMark Fire Strike Standard Graphics
24135 Points (27%)
3DMark - 3DMark Ice Storm Graphics
457045 Points (55%)
3DMark 11 - 3DM11 Performance GPU
32662 Points (28%)
171.8 -99%
...
NVIDIA GeForce GTX 1080 Mobile
28106 -14%
28539 -13%
28692 -12%
29411 -10%
NVIDIA GeForce RTX 2070 Super Mobile
29416 -10%
29663 -9%
30077 -8%
31142 -5%
32331 -1%
AMD Radeon RX 6700S
32662
32846 1%
33169 2%
33497 3%
34188 5%
34335 5%
34842 7%
NVIDIA GeForce RTX 2080 Super Mobile
35153 8%
35286 8%
35743 9%
...
59943 84%
max:
106023 225%
0%
100%
3DMark Vantage
3DM Vant. Perf. total +
3DMark Vantage - 3DM Vant. Perf. total
75332 Points (22%)
3DM Vant. Perf. GPU no PhysX +
3DMark Vantage - 3DM Vant. Perf. GPU no PhysX
77766 Points (44%)
ATI Radeon HD 3200
62 -100%
...
68627 -12%
NVIDIA GeForce RTX 2070 Super Max-Q
69136 -11%
69467 -11%
74008 -5%
74946 -4%
NVIDIA GeForce RTX 2070 Super Mobile
75429 -3%
76250 -2%
NVIDIA GeForce RTX 2080 Super Mobile
77180 -1%
77533 0%
AMD Radeon RX 6700S
77766
80346 3%
80643 4%
82368 6%
85013 9%
85672 10%
86536 11%
88394 14%
88465 14%
93680 20%
...
132443 70%
max:
170928 120%
0%
100%
3DMark 06 3DMark 06 - Standard 1280x1024 +
Cinebench R10 Cinebench R10 Shading (32bit) +
Cinebench R11.5 Cinebench R11.5 OpenGL 64 Bit +
Cinebench R11.5 - Cinebench R11.5 OpenGL 64 Bit
169.4 fps (59%)
Cinebench R15
Cinebench R15 OpenGL 64 Bit +
Cinebench R15 - Cinebench R15 OpenGL 64 Bit
207 fps (12%)
Cinebench R15 OpenGL Ref. Match 64 Bit +
Cinebench R15 - Cinebench R15 OpenGL Ref. Match 64 Bit
98 % (98%)
GFXBench - GFXBench 5.0 4K Aztec Ruins High Tier Offscreen
78.3 fps (32%)
GFXBench - GFXBench 5.0 Aztec Ruins High Tier Offscreen
185.4 fps (34%)
3.3 -98%
...
109 -41%
110.2 -41%
Apple M3 10-Core GPU
118.5 -36%
Apple M1 Pro 14-Core GPU
147 -21%
NVIDIA Quadro RTX 5000 Max-Q
153 -17%
161.4 -13%
Apple M1 Pro 16-Core GPU
166 -10%
178.7 -4%
181.1 -2%
AMD Radeon RX 6700S
185.4
187 1%
208 12%
210.6 14%
219.7 19%
Apple M1 Max 24-Core GPU
240 29%
242.3 31%
248.5 34%
261.5 41%
288.5 56%
...
536 189%
0%
100%
GFXBench - GFXBench 5.0 Aztec Ruins Normal Tier Offscreen
424.1 fps (31%)
LuxMark v2.0 64Bit - LuxMark v2.0 Room GPU
7528 Samples/s (34%)
LuxMark v2.0 64Bit - LuxMark v2.0 Sala GPU
2530 Samples/s (4%)
ComputeMark v2.1 - ComputeMark v2.1 Result
15945 points (17%)
Power Consumption - Furmark Stress Test Power Consumption - external Monitor *
140.8 Watt (20%)
0102030405060708090100110120130140Tooltip
Power Consumption - The Witcher 3 Power Consumption - external Monitor *
151.1 Watt (21%)
0102030405060708090100110120130140150160170Tooltip
Power Consumption - Witcher 3 Power Consumption *
157.7 Watt (35%)
0102030405060708090100110120130140150160Tooltip
Emissions Witcher 3 Fan Noise +
Emissions - Witcher 3 Fan Noise
43 dB(A) (69%)
- Range of benchmark values for this graphics card
- Average benchmark values for this graphics card
* Smaller numbers mean a higher performance

Game Benchmarks

The following benchmarks stem from our benchmarks of review laptops. The performance depends on the used graphics memory, clock rate, processor, system settings, drivers, and operating systems. So the results don't have to be representative for all laptops with this GPU. For detailed information on the benchmark results, click on the fps number.

med. 1920x1080
95.3  fps    + Compare + 📈 Graph
high 1920x1080
76.1  fps    + Compare + 📈 Graph
ultra 1920x1080
54.8  fps    + Compare + 📈 Graph
QHD 2560x1440
35.3  fps    + Compare + 📈 Graph
» With all tested laptops playable in detail settings ultra.
F1 22

F1 22

2022
med. 1920x1080
211  fps    + Compare
high 1920x1080
161  fps    + Compare
ultra 1920x1080
37  fps    + Compare
QHD 2560x1440
21  fps    + Compare
» With all tested laptops playable in detail settings ultra.
med. 1920x1080
202  fps    + Compare + 📈 Graph
high 1920x1080
179.5  fps    + Compare + 📈 Graph
ultra 1920x1080
165.4  fps    + Compare + 📈 Graph
QHD 2560x1440
97.9  fps    + Compare + 📈 Graph
» With all tested laptops playable in detail settings ultra.
med. 1920x1080
116.4  fps    + Compare + 📈 Graph
high 1920x1080
115.3  fps    + Compare + 📈 Graph
ultra 1920x1080
115.2  fps    + Compare + 📈 Graph
QHD 2560x1440
59.8  fps    + Compare + 📈 Graph
» With all tested laptops playable in detail settings ultra.
Additional Benchmarks
Highest Settings + Maximum Ray Tracing 1920x1080
33.4
med. 1920x1080
133  fps    + Compare
high 1920x1080
82.4  fps    + Compare
ultra 1920x1080
62.4  fps    + Compare
QHD 2560x1440
39.1  fps    + Compare
» With all tested laptops playable in detail settings ultra.
med. 1920x1080
99.1  fps    + Compare
high 1920x1080
74  fps    + Compare
ultra 1920x1080
59.7  fps    + Compare
QHD 2560x1440
31.2  fps    + Compare
» With all tested laptops playable in detail settings ultra.
Additional Benchmarks
Ray Tracing Ultra Preset (DLSS off) 1920x1080
13.7
Elex 2

Elex 2

2022
med. 1920x1080
70.7  fps    + Compare + 📈 Graph
high 1920x1080
64.8  fps    + Compare + 📈 Graph
ultra 1920x1080
59.2  fps    + Compare + 📈 Graph
QHD 2560x1440
38.3  fps    + Compare + 📈 Graph
» With all tested laptops playable in detail settings ultra.
med. 1920x1080
194  fps    + Compare
high 1920x1080
147  fps    + Compare
ultra 1920x1080
114  fps    + Compare
QHD 2560x1440
88.1  fps    + Compare
» With all tested laptops playable in detail settings ultra.
med. 1920x1080
59.9  fps    + Compare + 📈 Graph
high 1920x1080
59.9  fps    + Compare + 📈 Graph
ultra 1920x1080
59.9  fps    + Compare + 📈 Graph
QHD 2560x1440
56.6  fps    + Compare + 📈 Graph
» With all tested laptops playable in detail settings ultra.
med. 1920x1080
64.8  fps    + Compare + 📈 Graph
high 1920x1080
50.9  fps    + Compare + 📈 Graph
QHD 2560x1440
31.1  fps    + Compare + 📈 Graph
» With all tested laptops playable in detail settings high.
Additional Benchmarks
High Quality Raytracing 1920x1080
22.7
med. 1920x1080
159  fps    + Compare
high 1920x1080
157  fps    + Compare
ultra 1920x1080
126  fps    + Compare
QHD 2560x1440
66  fps    + Compare
» With all tested laptops playable in detail settings ultra.
med. 1920x1080
79  fps    + Compare + 📈 Graph
high 1920x1080
69.4  fps    + Compare + 📈 Graph
ultra 1920x1080
50.5  fps    + Compare + 📈 Graph
QHD 2560x1440
38.9  fps    + Compare + 📈 Graph
» With all tested laptops playable in detail settings ultra.
med. 1920x1080
97.9  fps    + Compare + 📈 Graph
high 1920x1080
80.8  fps    + Compare + 📈 Graph
ultra 1920x1080
75.9  fps    + Compare + 📈 Graph
QHD 2560x1440
53.9  fps    + Compare + 📈 Graph
» With all tested laptops playable in detail settings ultra.
med. 1920x1080
155.9  fps    + Compare + 📈 Graph
high 1920x1080
134.2  fps    + Compare + 📈 Graph
ultra 1920x1080
119.8  fps    + Compare + 📈 Graph
QHD 2560x1440
104.5  fps    + Compare + 📈 Graph
» With all tested laptops playable in detail settings ultra.
med. 1920x1080
140  fps    + Compare
high 1920x1080
138  fps    + Compare
ultra 1920x1080
74  fps    + Compare
QHD 2560x1440
54  fps    + Compare
» With all tested laptops playable in detail settings ultra.
med. 1920x1080
100  fps    + Compare
high 1920x1080
91  fps    + Compare
ultra 1920x1080
88  fps    + Compare
QHD 2560x1440
59  fps    + Compare
» With all tested laptops playable in detail settings ultra.
med. 1920x1080
112  fps    + Compare
high 1920x1080
111  fps    + Compare
ultra 1920x1080
104  fps    + Compare
QHD 2560x1440
68  fps    + Compare
» With all tested laptops playable in detail settings ultra.
Additional Benchmarks
Ultra Preset + Ultra Ray-Tracing 1920x1080
37
med. 1920x1080
200  fps    + Compare + 📈 Graph
high 1920x1080
171.3  fps    + Compare + 📈 Graph
ultra 1920x1080
157.3  fps    + Compare + 📈 Graph
QHD 2560x1440
92.4  fps    + Compare + 📈 Graph
» With all tested laptops playable in detail settings ultra.
Far Cry 6

Far Cry 6

2021
med. 1920x1080
107  fps    + Compare
high 1920x1080
93  fps    + Compare
ultra 1920x1080
86  fps    + Compare
QHD 2560x1440
59  fps    + Compare
» With all tested laptops playable in detail settings ultra.
Additional Benchmarks
Ultra Graphics Quality + HD Textures + DXR TAA 1920x1080
56
med. 1920x1080
133.3  fps    + Compare + 📈 Graph
high 1920x1080
120.8  fps    + Compare + 📈 Graph
QHD 2560x1440
78.2  fps    + Compare + 📈 Graph
» With all tested laptops playable in detail settings high.
Deathloop

Deathloop

2021
med. 1920x1080
110.8  fps    + Compare + 📈 Graph
high 1920x1080
89  fps    + Compare + 📈 Graph
ultra 1920x1080
66.3  fps    + Compare + 📈 Graph
QHD 2560x1440
39.6  fps    + Compare + 📈 Graph
» With all tested laptops playable in detail settings ultra.
Days Gone

Days Gone

2021
med. 1920x1080
117.4  fps    + Compare + 📈 Graph
high 1920x1080
106.5  fps    + Compare + 📈 Graph
ultra 1920x1080
77.2  fps    + Compare + 📈 Graph
QHD 2560x1440
50.6  fps    + Compare + 📈 Graph
» With all tested laptops playable in detail settings ultra.
ultra 1920x1080
98.4  fps    + Compare + 📈 Graph
QHD 2560x1440
95.3  fps    + Compare + 📈 Graph
» With all tested laptops playable in detail settings ultra.
med. 1920x1080
195.7  fps    + Compare + 📈 Graph
high 1920x1080
180.1  fps    + Compare + 📈 Graph
ultra 1920x1080
142.8  fps    + Compare + 📈 Graph
QHD 2560x1440
92.3  fps    + Compare + 📈 Graph
» With all tested laptops playable in detail settings ultra.
Additional Benchmarks
Ray Tracing Preset 1920x1080
66.7
Outriders

Outriders

2021
med. 1920x1080
115.5  fps    + Compare + 📈 Graph
high 1920x1080
111.3  fps    + Compare + 📈 Graph
ultra 1920x1080
96.9  fps    + Compare + 📈 Graph
QHD 2560x1440
56.3  fps    + Compare + 📈 Graph
» With all tested laptops playable in detail settings ultra.
Hitman 3

Hitman 3

2021
med. 1920x1080
178  fps    + Compare
high 1920x1080
159  fps    + Compare
ultra 1920x1080
146  fps    + Compare
QHD 2560x1440
83.4  fps    + Compare
» With all tested laptops playable in detail settings ultra.
med. 1920x1080
98.5  fps    + Compare + 📈 Graph
high 1920x1080
94.7  fps    + Compare + 📈 Graph
ultra 1920x1080
83.5  fps    + Compare + 📈 Graph
QHD 2560x1440
48.9  fps    + Compare + 📈 Graph
» With all tested laptops playable in detail settings ultra.
med. 1920x1080
113  fps    + Compare
high 1920x1080
93  fps    + Compare
ultra 1920x1080
79  fps    + Compare
QHD 2560x1440
49  fps    + Compare
» With all tested laptops playable in detail settings ultra.
Dirt 5

Dirt 5

2020
med. 1920x1080
116  fps    + Compare
high 1920x1080
98  fps    + Compare
ultra 1920x1080
80.3  fps    + Compare
QHD 2560x1440
67.7  fps    + Compare
» With all tested laptops playable in detail settings ultra.
med. 1920x1080
109  fps    + Compare
high 1920x1080
96  fps    + Compare
ultra 1920x1080
59  fps    + Compare
QHD 2560x1440
38  fps    + Compare
» With all tested laptops playable in detail settings ultra.
Additional Benchmarks
Ultra Preset + Ultra Ray Tracing (DX12) 1920x1080
9
med. 1920x1080
286  fps    + Compare + 📈 Graph
high 1920x1080
245  fps    + Compare + 📈 Graph
ultra 1920x1080
224  fps    + Compare + 📈 Graph
QHD 2560x1440
146.7  fps    + Compare + 📈 Graph
» With all tested laptops playable in detail settings ultra.
med. 1920x1080
92  fps    + Compare + 📈 Graph
high 1920x1080
84.3  fps    + Compare + 📈 Graph
QHD 2560x1440
51.2  fps    + Compare + 📈 Graph
» With all tested laptops playable in detail settings high.
med. 1920x1080
102  fps    + Compare
high 1920x1080
94.9  fps    + Compare
ultra 1920x1080
82.9  fps    + Compare
QHD 2560x1440
73.1  fps    + Compare
» With all tested laptops playable in detail settings ultra.
med. 1920x1080
171.2  fps    + Compare + 📈 Graph
high 1920x1080
55  fps    + Compare + 📈 Graph
ultra 1920x1080
46.6  fps    + Compare + 📈 Graph
QHD 2560x1440
28.4  fps    + Compare + 📈 Graph
» With all tested laptops playable in detail settings ultra.
med. 1920x1080
139.8  fps    + Compare + 📈 Graph
high 1920x1080
129.8  fps    + Compare + 📈 Graph
ultra 1920x1080
128  fps    + Compare + 📈 Graph
QHD 2560x1440
85.4  fps    + Compare + 📈 Graph
» With all tested laptops playable in detail settings ultra.
med. 1920x1080
189  fps    + Compare
high 1920x1080
123  fps    + Compare
ultra 1920x1080
88.1  fps    + Compare
QHD 2560x1440
56.7  fps    + Compare
» With all tested laptops playable in detail settings ultra.
med. 1920x1080
218  fps    + Compare + 📈 Graph
high 1920x1080
194.7  fps    + Compare + 📈 Graph
ultra 1920x1080
189.7  fps    + Compare + 📈 Graph
QHD 2560x1440
120.8  fps    + Compare + 📈 Graph
» With all tested laptops playable in detail settings ultra.
med. 1920x1080
124.7  fps    + Compare + 📈 Graph
high 1920x1080
99.3  fps    + Compare + 📈 Graph
QHD 2560x1440
72  fps    + Compare + 📈 Graph
» With all tested laptops playable in detail settings high.
Strange Brigade

Strange Brigade

2018
med. 1920x1080
227  fps    + Compare
high 1920x1080
182.7  fps    + Compare
ultra 1920x1080
157.3  fps    + Compare
» With all tested laptops playable in detail settings ultra.
Far Cry 5

Far Cry 5

2018
med. 1920x1080
110  fps    + Compare
high 1920x1080
103  fps    + Compare
ultra 1920x1080
97  fps    + Compare
QHD 2560x1440
79  fps    + Compare
» With all tested laptops playable in detail settings ultra.
low 1280x720
65.4  fps    + Compare
med. 1920x1080
51.7  fps    + Compare
high 1920x1080
45.2  fps    + Compare
» With all tested laptops playable in detail settings high.
med. 1920x1080
106.7  fps    + Compare
high 1920x1080
78.6  fps    + Compare
» With all tested laptops playable in detail settings high.
low 1280x720
145.1  fps    + Compare
high 1920x1080
114.7  fps    + Compare
ultra 1920x1080
103  fps    + Compare
» With all tested laptops playable in detail settings ultra.
med. 1366x768
246  fps    + Compare
high 1920x1080
144  fps    + Compare
ultra 1920x1080
» With all tested laptops playable in detail settings ultra.
GTA V

GTA V

2015
med. 1366x768
170.9  fps    + Compare
high 1920x1080
154.7  fps    + Compare
ultra 1920x1080
81.3  fps    + Compare
» With all tested laptops playable in detail settings ultra.
Additional Benchmarks
Normal/Off 4xAF 1920x1080
170.6
lowmed.highultraQHD4K
The Quarry95.376.154.835.3
F1 222111613721
Vampire Bloodhunt202179.5165.497.9
Ghostwire Tokyo116.4115.3115.259.8
Tiny Tina's Wonderlands13382.462.439.1
Cyberpunk 2077 1.699.17459.731.2
Elex 270.764.859.238.3
GRID Legends19414711488.1
Elden Ring59.959.959.956.6
Dying Light 264.850.931.1
Rainbow Six Extraction15915712666
God of War7969.450.538.9
Halo Infinite97.980.875.953.9
Farming Simulator 22155.9134.2119.8104.5
Forza Horizon 51401387454
Riders Republic100918859
Guardians of the Galaxy11211110468
Back 4 Blood200171.3157.392.4
Far Cry 6107938659
Alan Wake Remastered133.3120.878.2
Deathloop110.88966.339.6
Days Gone117.4106.577.250.6
Mass Effect Legendary Edition98.495.3
Resident Evil Village195.7180.1142.892.3
Outriders115.5111.396.956.3
Hitman 317815914683.4
Yakuza Like a Dragon98.594.783.548.9
Assassin´s Creed Valhalla113937949
Dirt 51169880.367.7
Watch Dogs Legion109965938
Star Wars Squadrons286245224146.7
Mafia Definitive Edition9284.351.2
Serious Sam 410294.982.973.1
Crysis Remastered171.25546.628.4
Death Stranding139.8129.812885.4
Gears Tactics18912388.156.7
Doom Eternal218194.7189.7120.8
Hunt Showdown124.799.372
Strange Brigade227182.7157.3
Far Cry 51101039779
X-Plane 11.1165.451.745.2
Final Fantasy XV Benchmark106.778.6
Dota 2 Reborn145.1114.7103
The Witcher 324614484.3
GTA V170.9154.781.3
< 30 fps
< 60 fps
< 120 fps
≥ 120 fps


1
1

2
21
20

4
23
17

8
22
9
2
20
15
2


For more games that might be playable and a list of all games and graphics cards visit our Gaming List

v1.26
log 18. 04:54:15

#0 no ids found in url (should be separated by "_") +0s ... 0s

#1 not redirecting to Ajax server +0s ... 0s

#2 did not recreate cache, as it is less than 5 days old! Created at Tue, 16 Apr 2024 05:39:00 +0200 +0.001s ... 0.001s

#3 no comparison url found in template nbc.compare_page_1 needed +0.067s ... 0.068s

#4 no comparison url found in template nbc.compare_page_1 needed +0s ... 0.068s

#5 no comparison url found in template nbc.compare_page_1 needed +0s ... 0.068s

#6 no comparison url found in template nbc.compare_page_1 needed +0s ... 0.069s

#7 no comparison url found in template nbc.compare_page_1 needed +0s ... 0.069s

#8 no comparison url found in template nbc.compare_page_1 needed +0s ... 0.069s

#9 no comparison url found in template nbc.compare_page_1 needed +0s ... 0.069s

#10 no comparison url found in template nbc.compare_page_1 needed +0s ... 0.069s

#11 no comparison url found in template nbc.compare_page_1 needed +0s ... 0.07s

#12 no comparison url found in template nbc.compare_page_1 needed +0s ... 0.07s

#13 no comparison url found in template nbc.compare_page_1 needed +0s ... 0.07s

#14 no comparison url found in template nbc.compare_page_1 needed +0s ... 0.07s

#15 no comparison url found in template nbc.compare_page_1 needed +0s ... 0.071s

#16 no comparison url found in template nbc.compare_page_1 needed +0s ... 0.071s

#17 composed specs +0s ... 0.071s

#18 did output specs +0s ... 0.071s

#19 start showIntegratedCPUs +0s ... 0.071s

#20 getting avg benchmarks for device 11140 +0.03s ... 0.101s

#21 got single benchmarks 11140 +0.01s ... 0.111s

#22 got avg benchmarks for devices +0s ... 0.111s

#23 min, max, avg, median took s +0.597s ... 0.708s

#24 before gaming benchmark output +0s ... 0.708s

#25 Got 167 rows for game benchmarks. +0.028s ... 0.735s

#26 composed SQL query for gamebenchmarks +0s ... 0.735s

#27 got data and put it in $dataArray +0.035s ... 0.77s

#28 benchmarks composed for output. +1.53s ... 2.3s

#29 no comparison url found in template nbc.compare_page_1 needed +0.005s ... 2.305s

#30 return log +0s ... 2.305s

Please share our article, every link counts!

» Comparison of GPUs
Detailed list of all laptop GPUs sorted by class and performance.

» Benchmark List
Sort and restrict laptop GPUs based on performance in synthetic benchmarks.

» Notebook Gaming List
Playable games for each graphics card and their average FPS results.

Class 1

GeForce RTX 2080 Super Mobile

Class 2

M1 Max 32-Core GPU *
GeForce RTX 2070 Super Mobile
M1 Max 24-Core GPU *
Quadro RTX 5000 Max-Q
Radeon RX 5700M *
GeForce GTX 1080 Mobile
Quadro RTX 4000 (Laptop)
M1 Pro 16-Core GPU *
Radeon PRO W6600M *
GeForce RTX 2070 Super Max-Q
Quadro RTX 4000 Max-Q *
M1 Pro 14-Core GPU *
Quadro P5200
Quadro RTX 3000 Max-Q *
Quadro P4200
Quadro P5000 Max-Q *
GeForce GTX 980 (Laptop)
Quadro P4000
Quadro P4000 Max-Q
Quadro P3200
Radeon RX 580X (Laptop) *
Radeon RX 580 (Laptop)
Radeon Pro 5300M
Radeon RX 5300M
Quadro P3000 Max-Q *
Quadro T2000 Max-Q *
Radeon Pro WX 7100 *
Radeon RX 570X (Laptop) *
Radeon RX 570 (Laptop) *
Radeon RX 470 (Laptop) *
Quadro T1000 Max-Q *

Class 3

Vega M GH
Quadro M5000M
GeForce GTX 1050 Ti Mobile
Radeon 680M
Quadro P2000
Quadro P2000 Max-Q
Quadro M4000M
T500 Laptop GPU *
Radeon R9 M395X
GeForce GTX 1050 Ti Max-Q *
Radeon Pro Vega 16
WX Vega M GL
Radeon R9 M485X
Quadro M3000M
FirePro W7170M
Radeon R9 M395
GeForce GTX 1050 Max-Q *
Radeon 660M
Radeon Pro WX 4150 *
Radeon RX 560X (Laptop)
Radeon RX 560 (Laptop)
Radeon RX 460 (Laptop)
Quadro P1000
Radeon R9 M390
Xe MAX
Radeon Pro 560X
Radeon Pro 560
Radeon Pro 460
Radeon Pro WX 4130 *
GeForce GTX 960M
Quadro P620 *
Radeon RX 550X (Laptop)
Radeon Pro WX 3200 *
Radeon Pro 555X
Radeon Pro 555
Radeon Pro 455
Quadro P600
Quadro M2000M
Radeon RX 540X *
Radeon Pro WX 2100 *
Radeon Pro WX 3100 *
GeForce GTX 950M
Radeon Pro 450
Radeon 630
Radeon 540X *
Radeon R9 M385X
Quadro P520
Quadro M1000M
GeForce 945M
Quadro P500 *
Iris Plus Graphics G7 (Ice Lake 64 EU) *
Vega 10 *
Iris Pro Graphics 580
FirePro W5170M *
Radeon R9 M370X
Vega 9
FirePro W5130M
UHD Graphics Xe G4 48EUs *
UHD Graphics 32EUs
UHD Graphics Xe 32EUs (Tiger Lake-H) *
UHD Graphics 750
Vega 7
Radeon R7 M465
Iris Pro Graphics 6200
Vega 8
GeForce 940M
Iris Plus Graphics G4 (Ice Lake 48 EU)
Quadro M600M
FirePro W4190M
Radeon R9 M375
Radeon R7 M445
Iris Plus Graphics 650
Iris Graphics 550
Radeon 625
Vega 6 *
Iris Plus Graphics 640
Iris Graphics 540
UHD Graphics 24EUs (Alder Lake-N) *
Radeon R7 M360
GeForce 920M
Radeon 620
Radeon R7 M340
Radeon 610
Radeon 610M *
Vega 6 *
UHD Graphics G1 (Ice Lake 32 EU)
UHD Graphics Xe 16EUs (Tiger Lake-H) *
HD Graphics 530
Radeon R5 (Bristol Ridge)
Adreno 690 *
Adreno 685 *
Adreno 680 *
Radeon R5 M330
GeForce 910M
HD Graphics 520

Class 4

UHD Graphics 730
Radeon R5 M320 *
Radeon R5 M315 *
Radeon R5 M420 *
Vega 2 *
UHD Graphics 617
UHD Graphics 615
HD Graphics 515
UHD Graphics 610
HD Graphics 510
UHD Graphics 605
Radeon R4 (Stoney Ridge)
Radeon R2 (Stoney Ridge)
HD Graphics (Broadwell)
UHD Graphics 600
HD Graphics (Braswell)

Class 5

* Approximate position of the graphics adapter