联想ThinkBook Plus第三代笔记本电脑评测。21:10超宽生产力的助推器
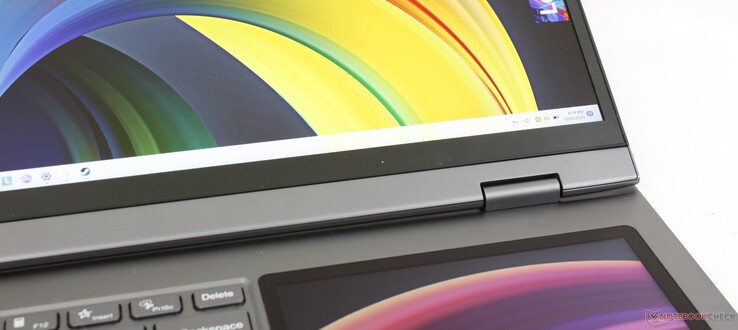
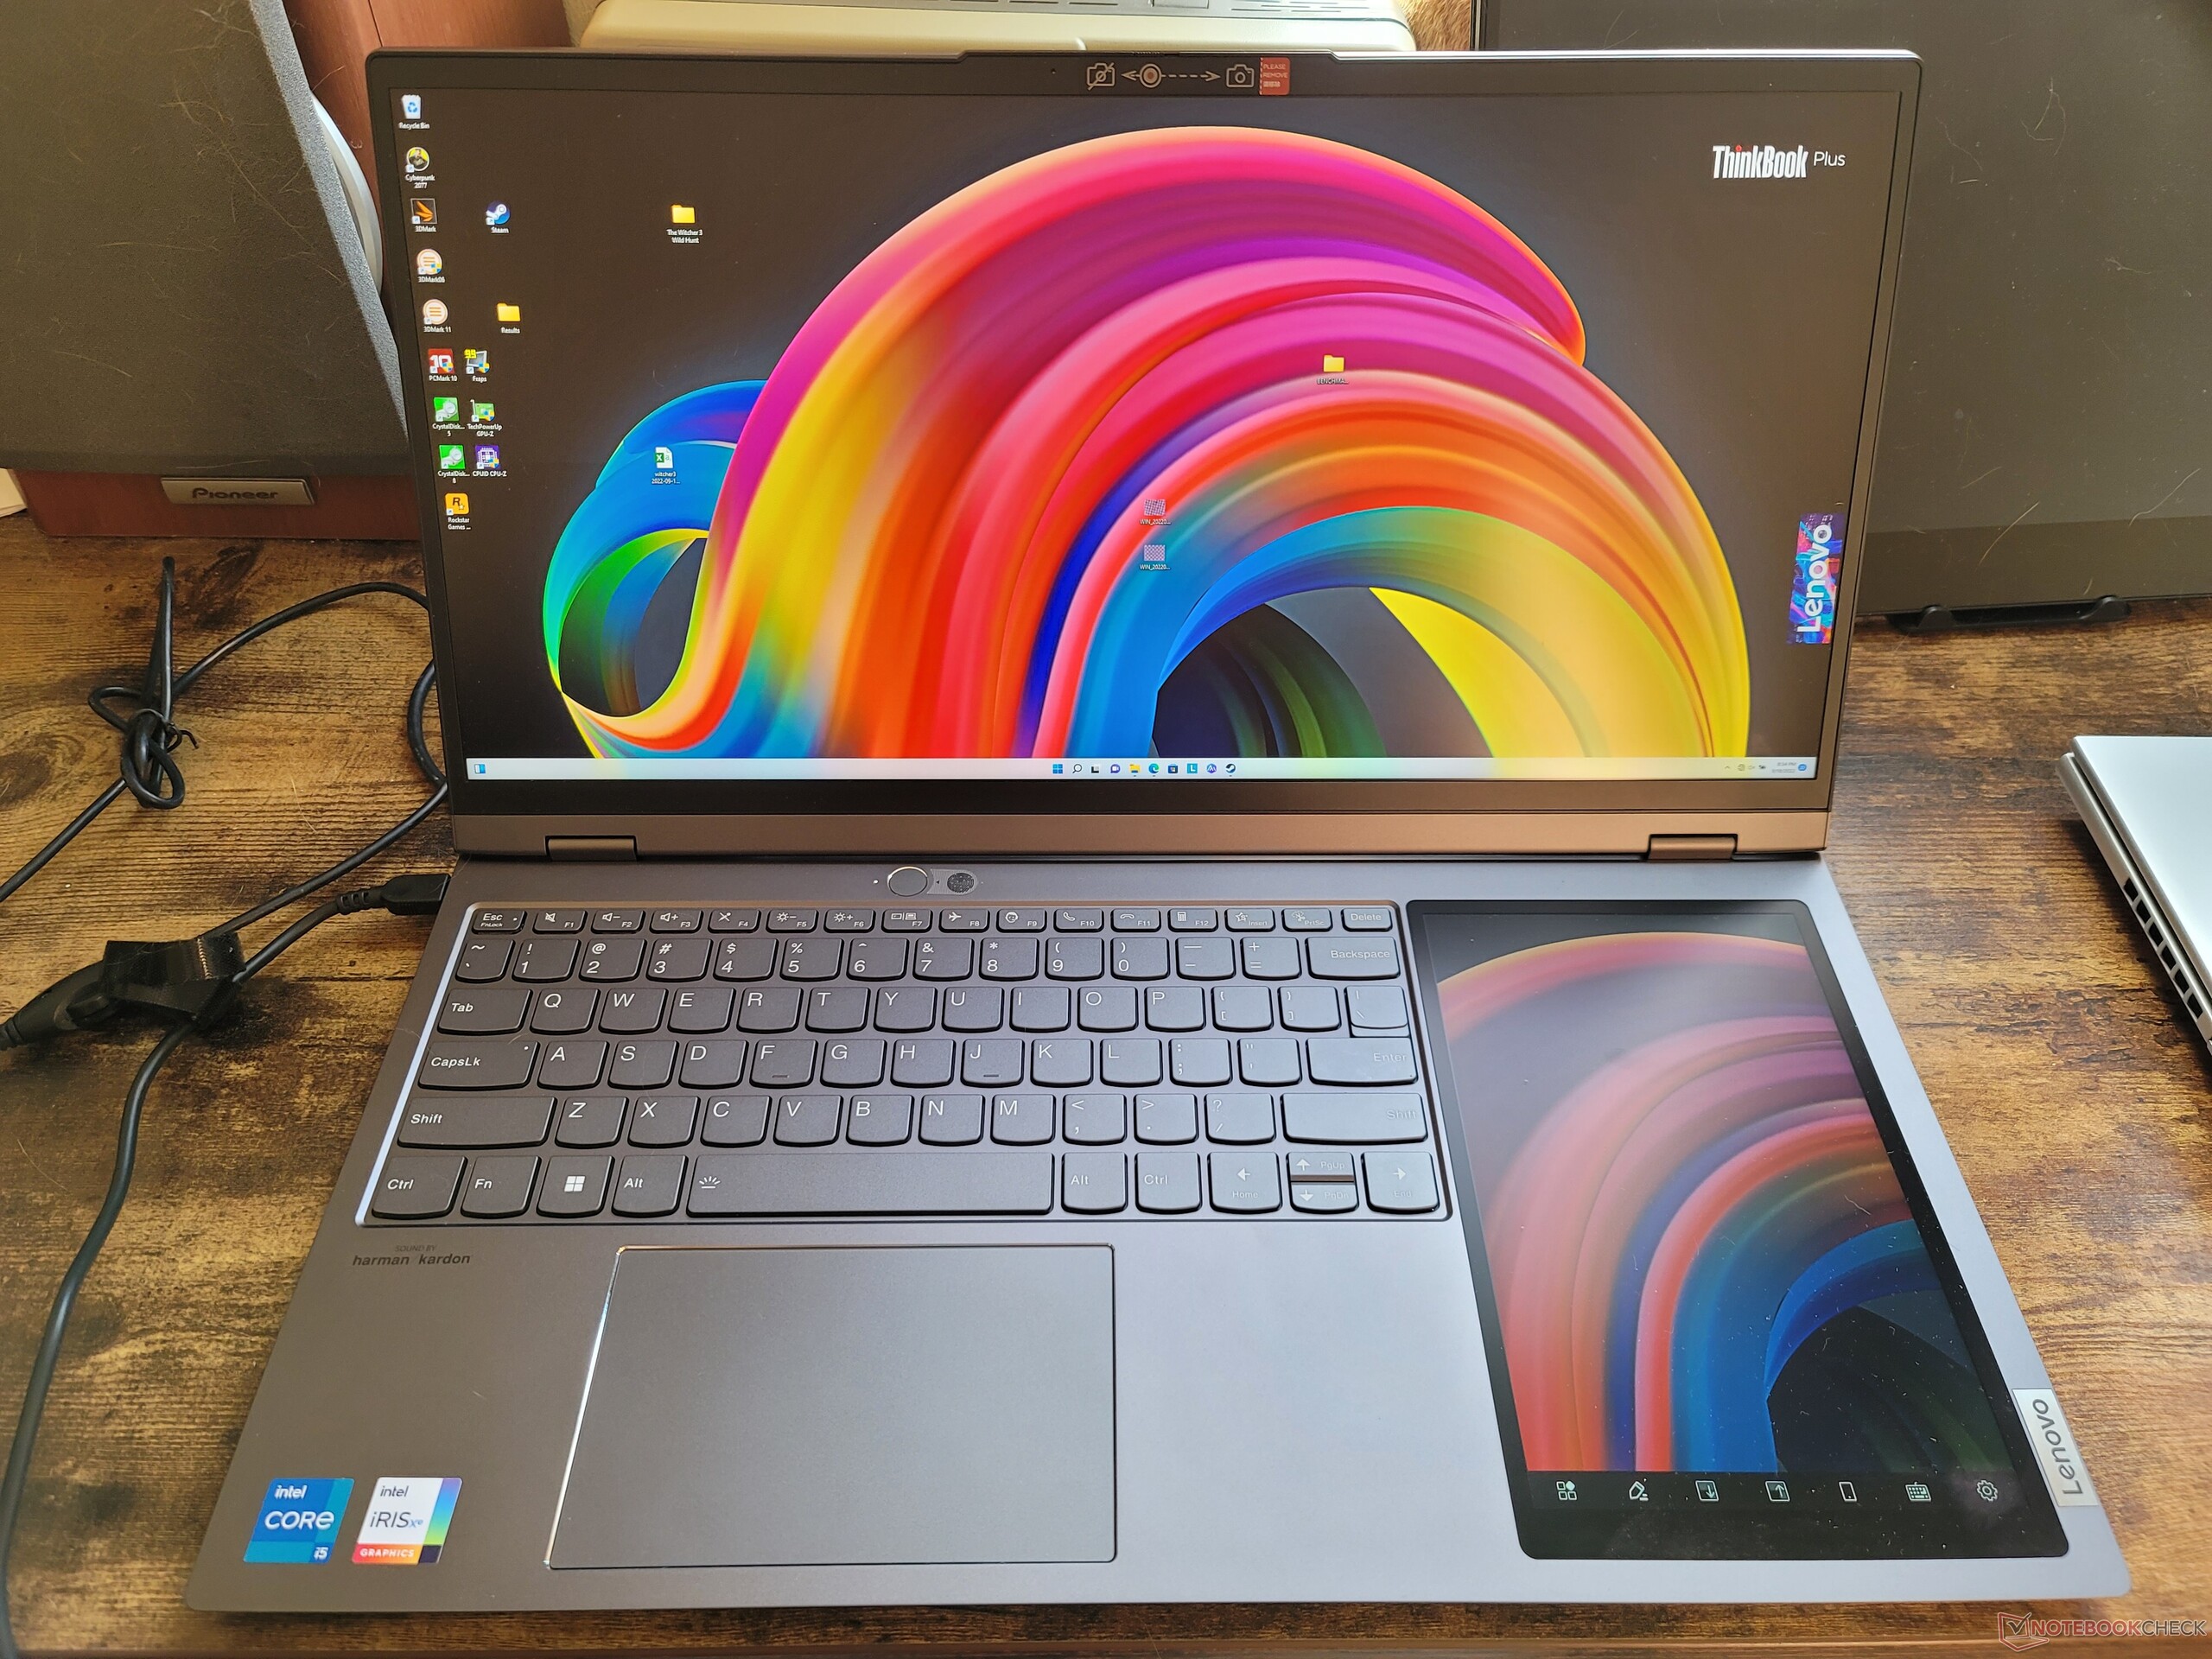
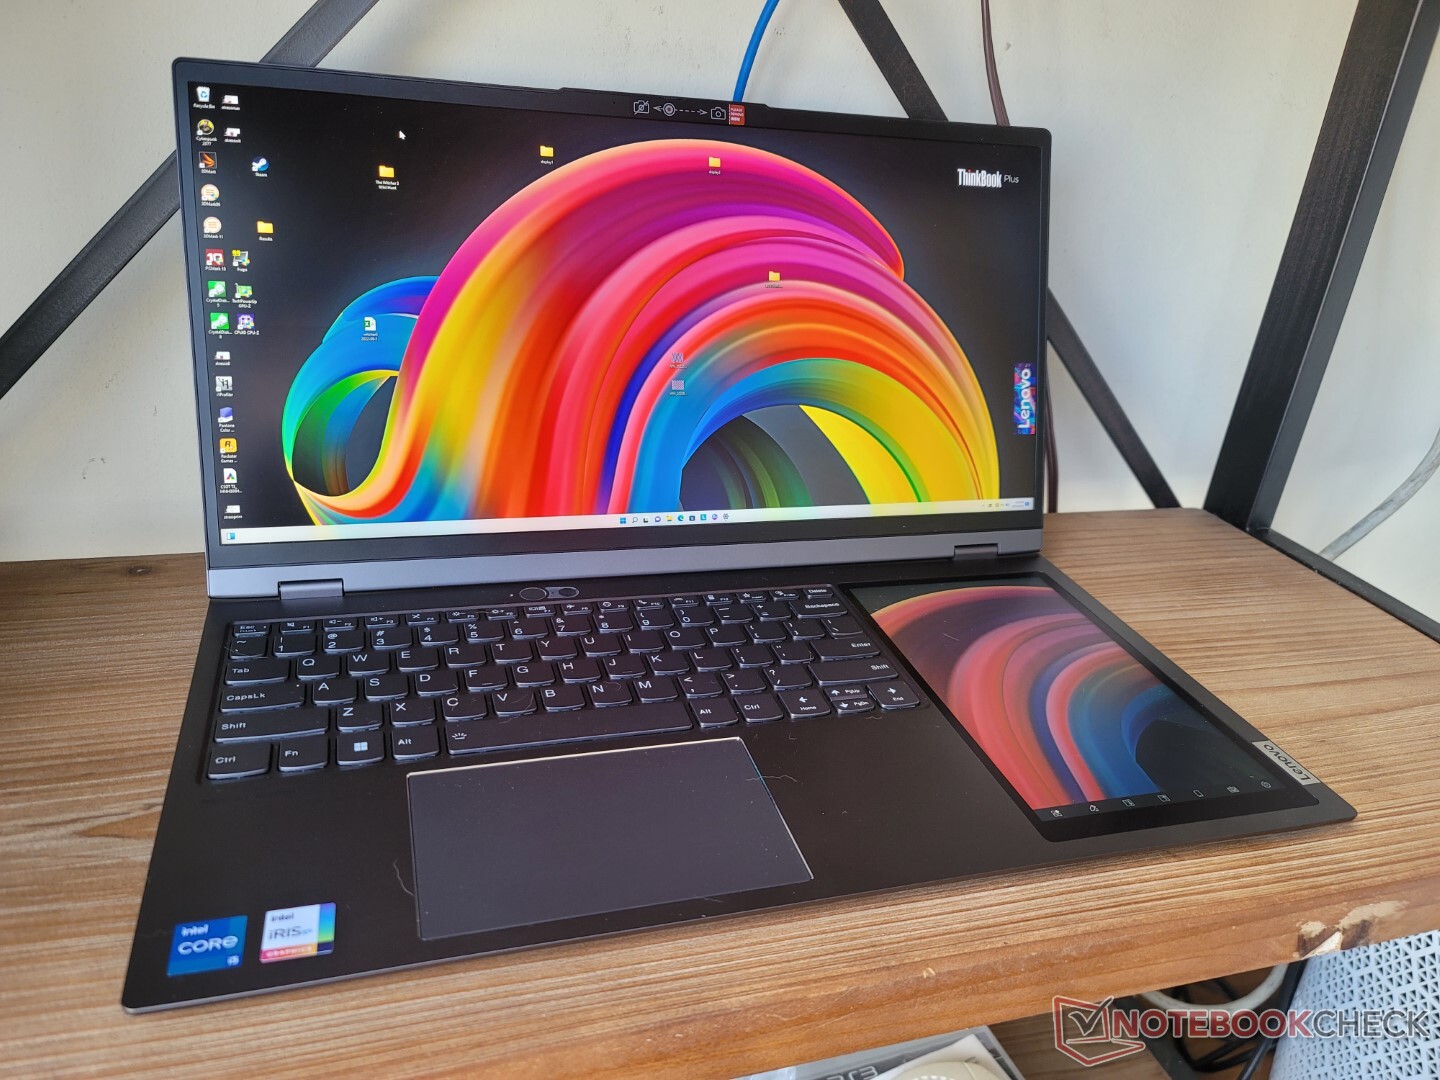
联想ThinkBook Plus第三代直接继承了去年的 笔记本Plus第二代.虽然单从名字上看不出来,但第3代机型在更多方面与前代机型相比有很大的变化,比其他大多数笔记本电脑都要好。第二代机型是一个16:10的13.3英寸的可折叠机,有一个辅助的12英寸E-Ink触摸屏,而第三代机型是一个21:10的17.3英寸蛤壳,有一个辅助的8英寸IPS触摸屏。这两款机型差别很大,以至于可以就第3代机型与第2代机型的命名进行争论,因为它们的用途都非常不同。
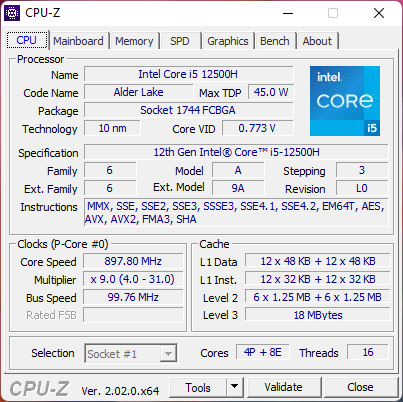
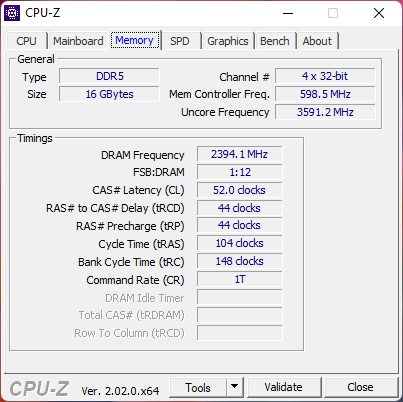
我们的第3代评测配置包括第12代酷睿i7-12700H处理器,配备16GB焊接内存和512GB PCIe4存储,价格约为1600美元。酷睿i5-12500H SKU是可用的,但所有选项都配有完全相同的主3072 x 1440雾面IPS触摸屏,副8英寸800 x 1280 IPS触摸屏,以及集成的Iris Xe图形。
ThinkBook Plus第三代的替代品包括15英寸的 华硕ZenBook Pro Duo系列和其他为内容创作者或办公效率设计的17英寸笔记本电脑,如LG Gram 17或 戴尔XPS 17.
更多联想评论。
潜在的竞争对手比较
Rating | Date | Model | Weight | Height | Size | Resolution | Price |
|---|---|---|---|---|---|---|---|
| 85.6 % v7 (old) | 09 / 2022 | Lenovo ThinkBook Plus Gen3 i7-12700H, Iris Xe G7 96EUs | 2 kg | 17.9 mm | 17.30" | 3072x1440 | |
| 86.1 % v7 (old) | 10 / 2021 | Lenovo ThinkBook Plus Gen2 Core i5 i5-1130G7, Iris Xe G7 80EUs | 1.2 kg | 13.9 mm | 13.30" | 2560x1600 | |
| 86.4 % v7 (old) | 03 / 2020 | Asus ProArt StudioBook Pro 17 W700G3T i7-9750H, Quadro RTX 3000 Max-Q | 2.5 kg | 18.4 mm | 17.00" | 1920x1200 | |
| 87.3 % v7 (old) | 08 / 2022 | LG Gram 17 (2022) i5-1240P, Iris Xe G7 80EUs | 1.4 kg | 17.7 mm | 17.00" | 2560x1600 | |
| 89.3 % v7 (old) | 06 / 2022 | Dell XPS 17 9720 i7-12700H, GeForce RTX 3050 4GB Laptop GPU | 2.5 kg | 19.5 mm | 17.00" | 3840x2400 | |
| 88 % v7 (old) | 09 / 2021 | Gigabyte Aero 17 HDR YD i9-11980HK, GeForce RTX 3080 Laptop GPU | 2.8 kg | 22 mm | 17.30" | 3840x2160 |
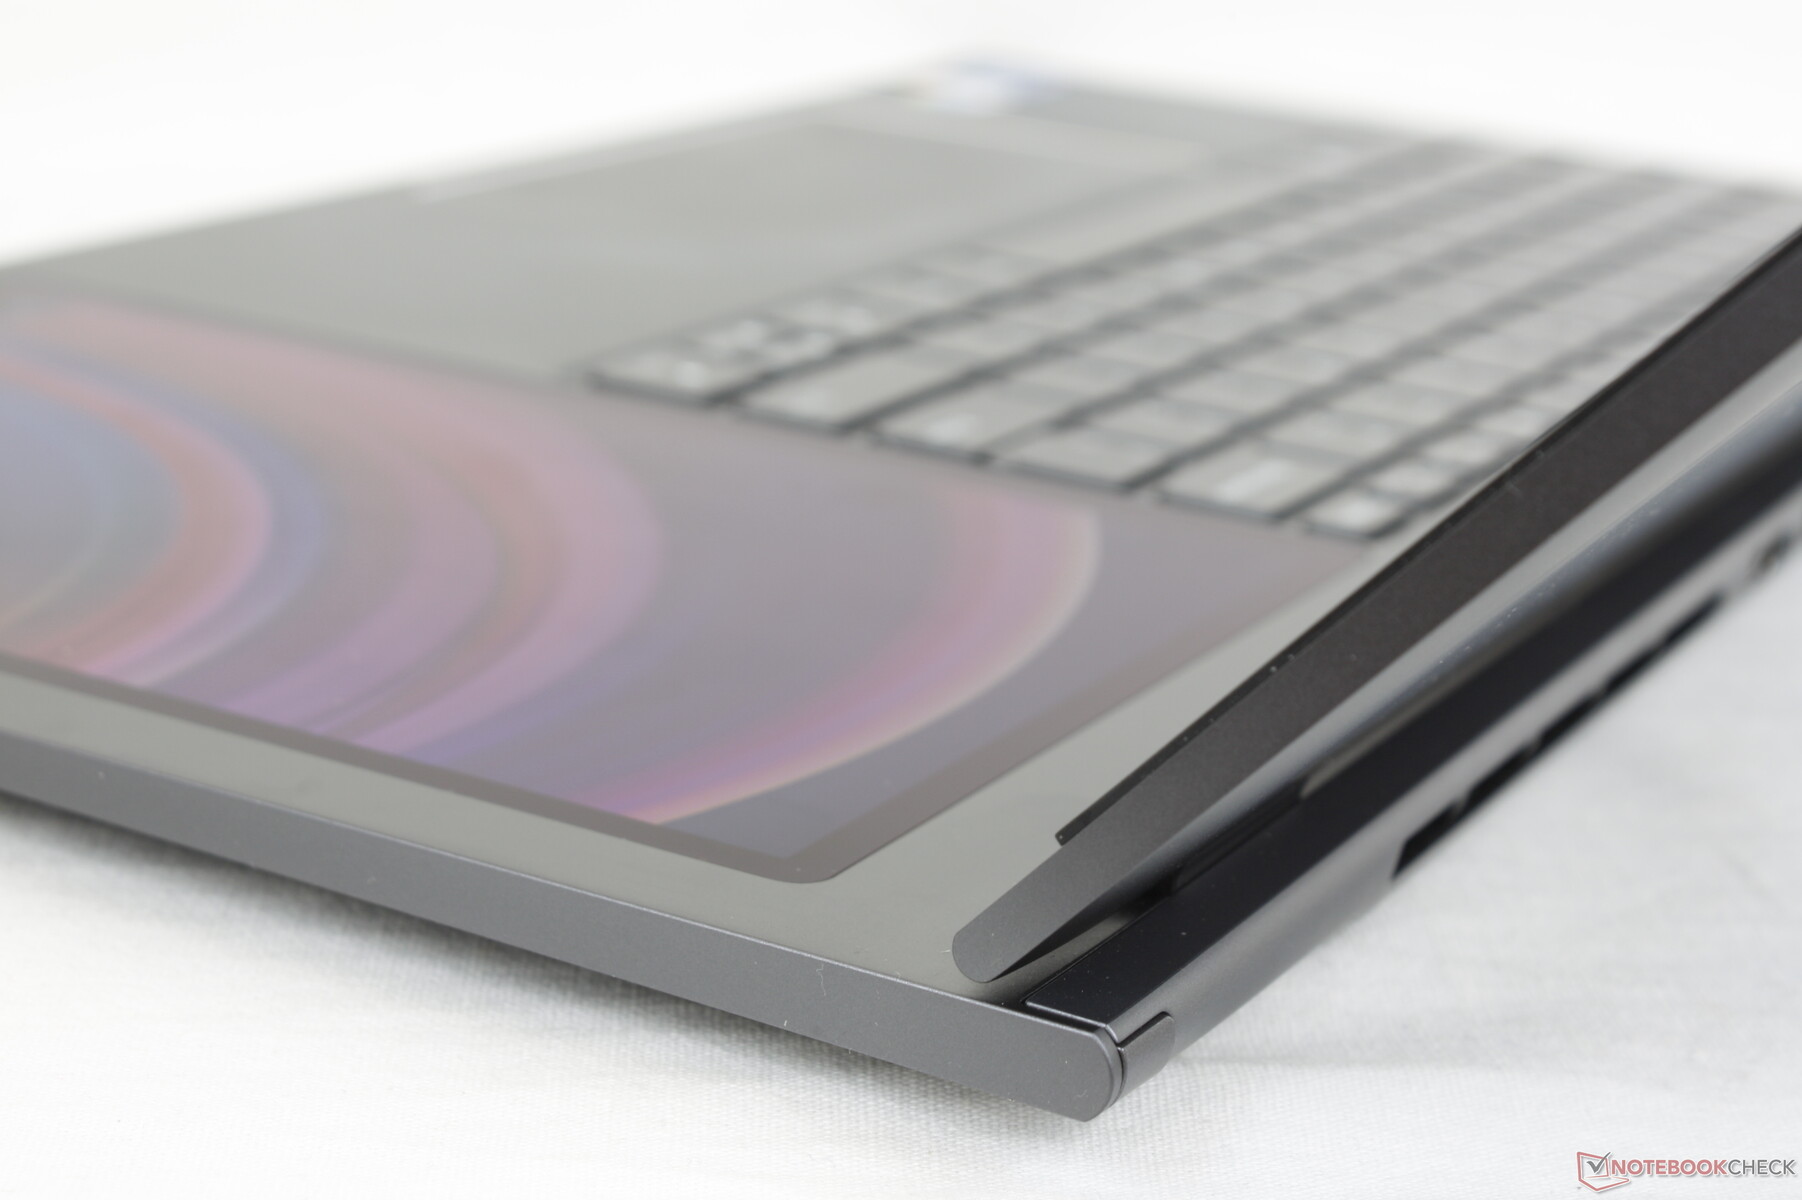
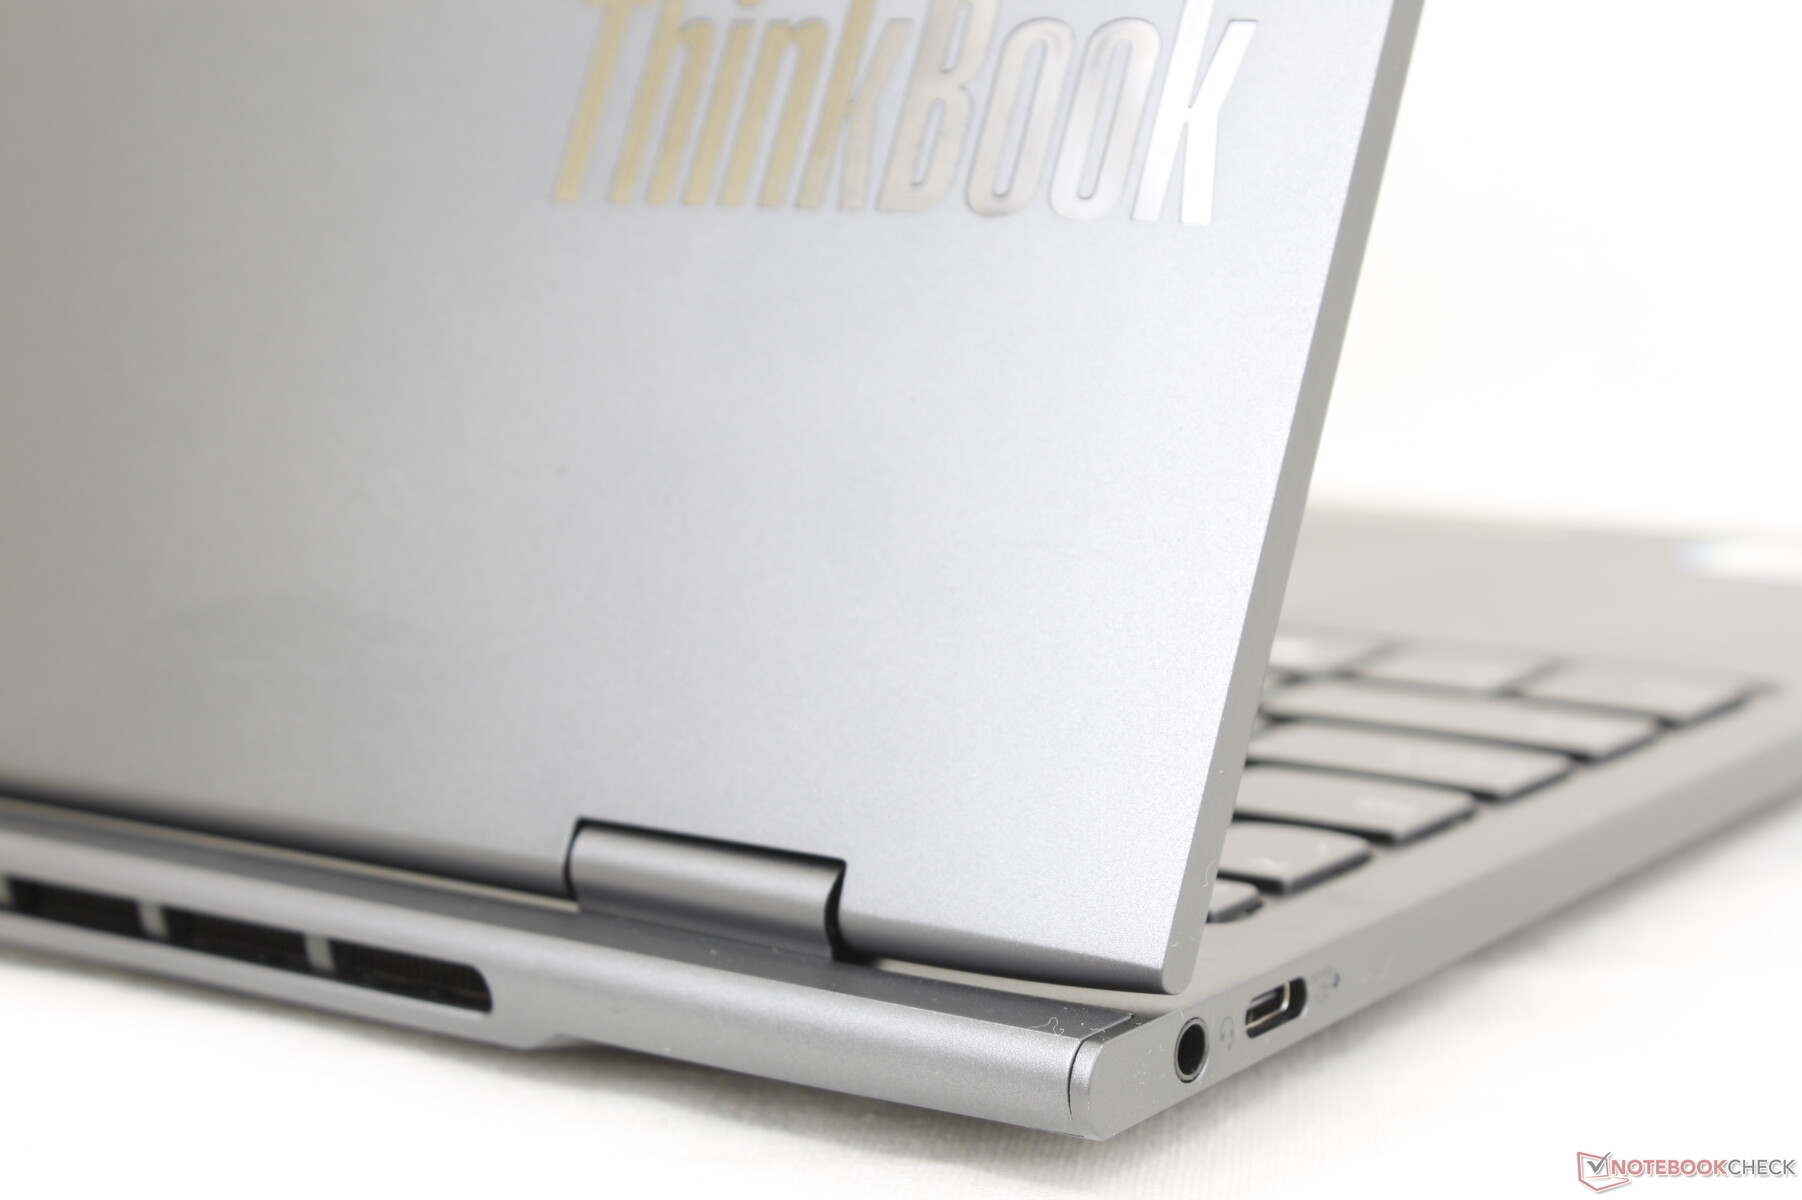
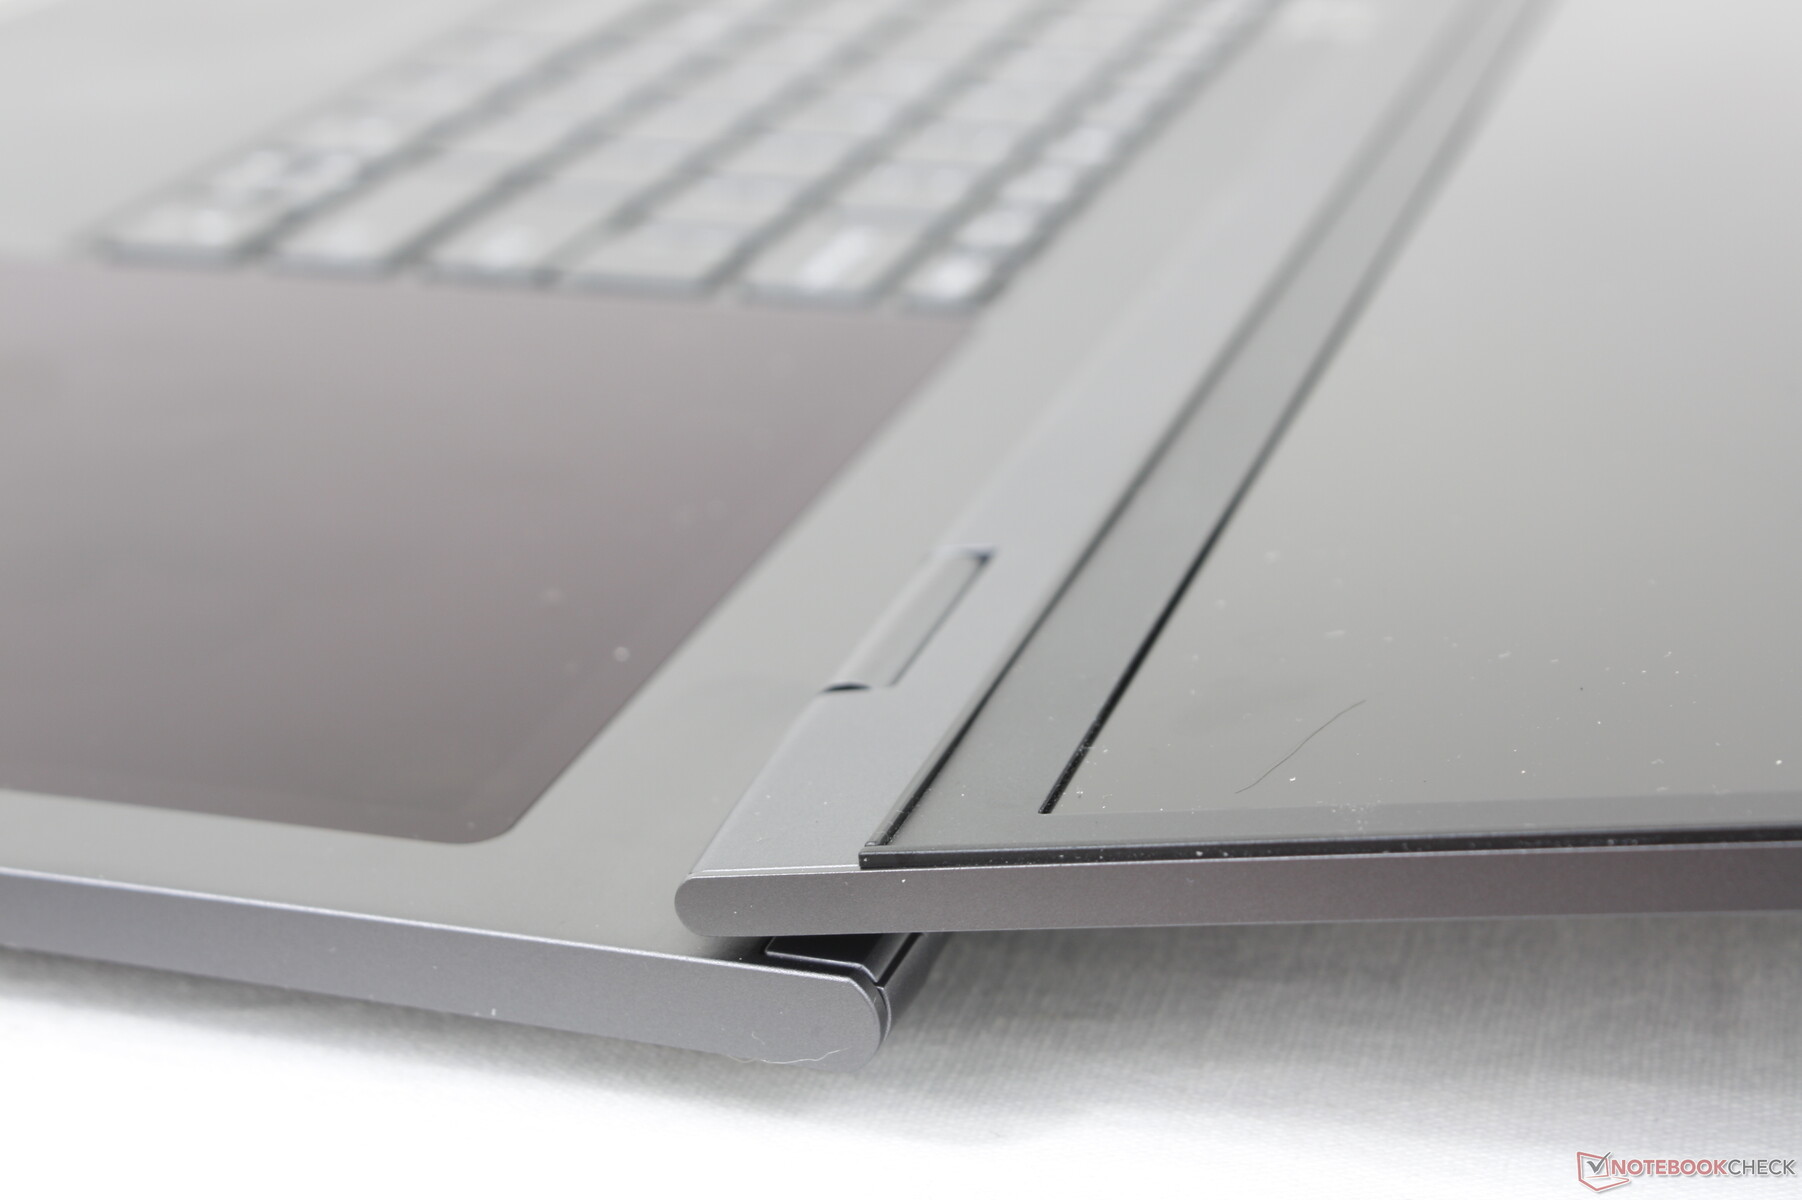
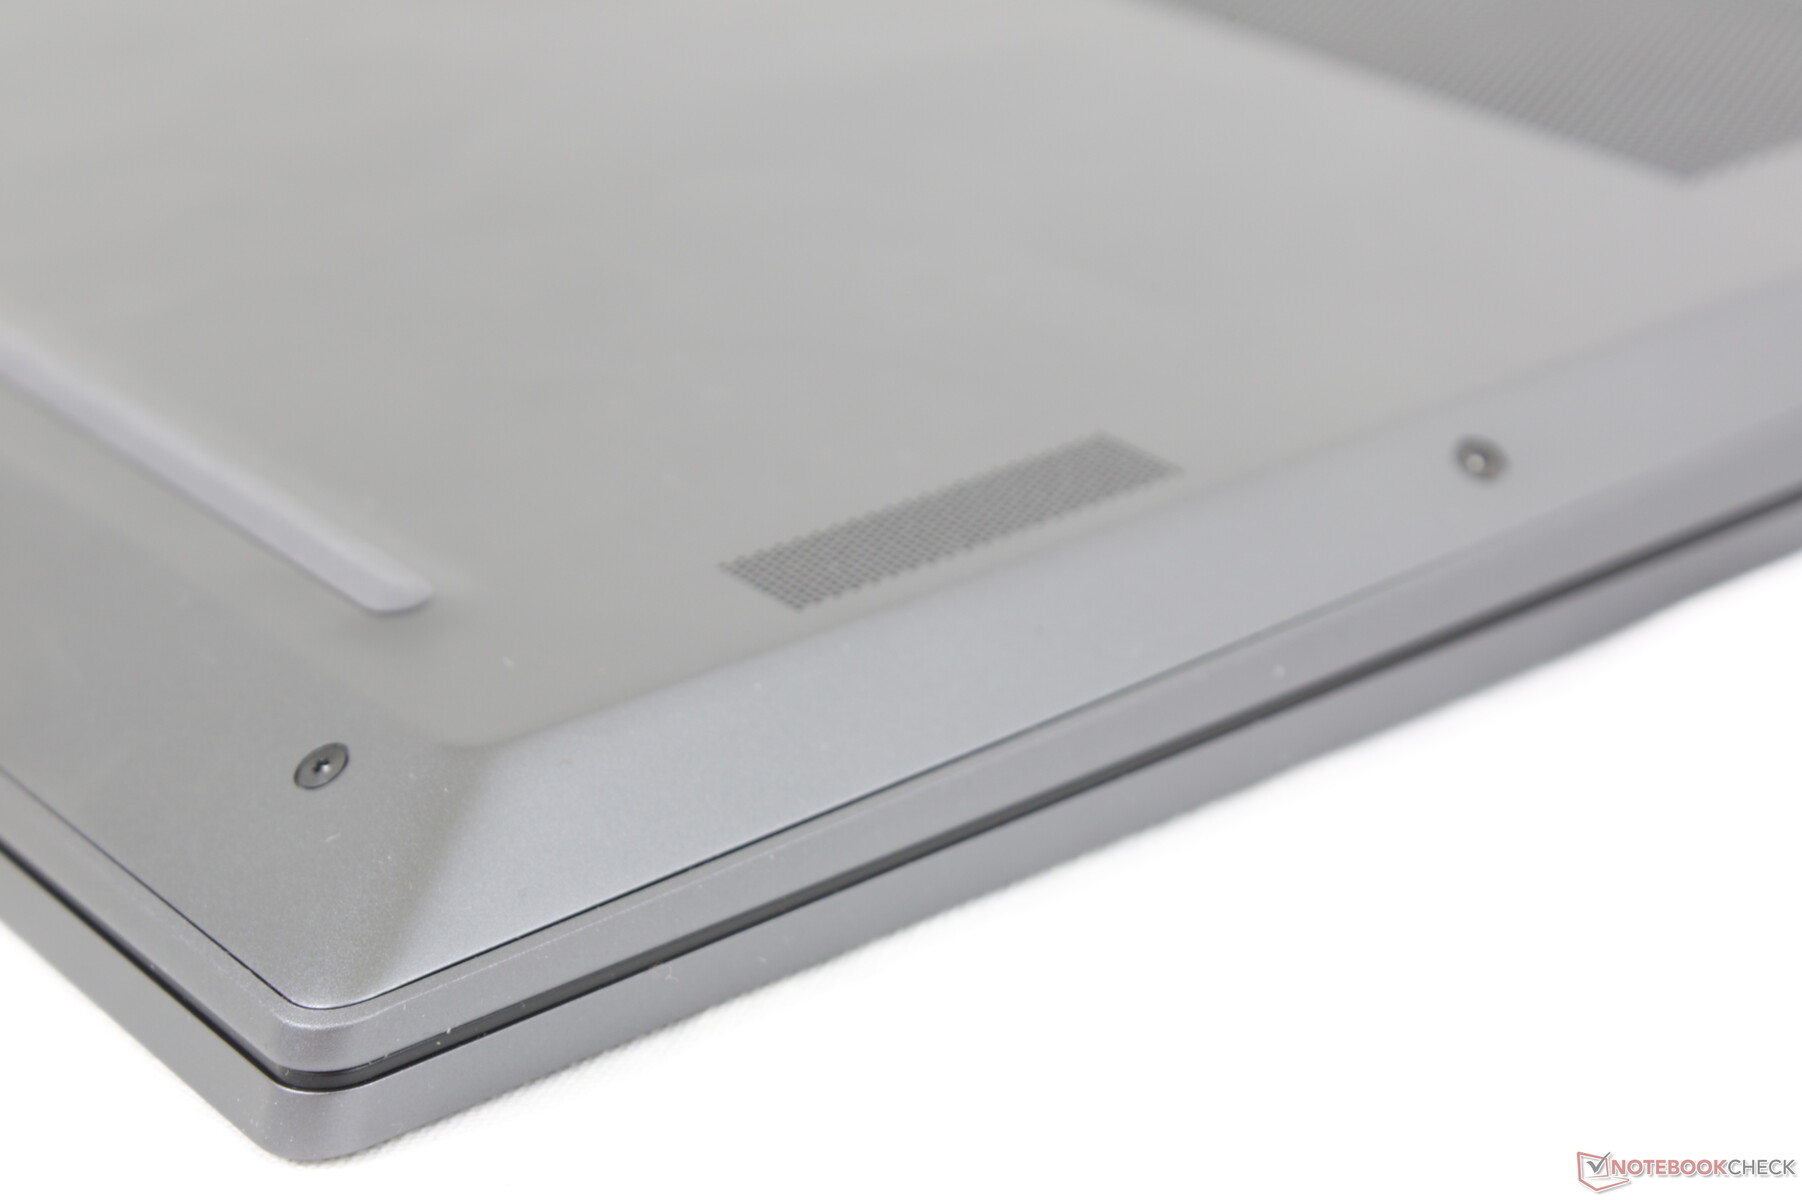
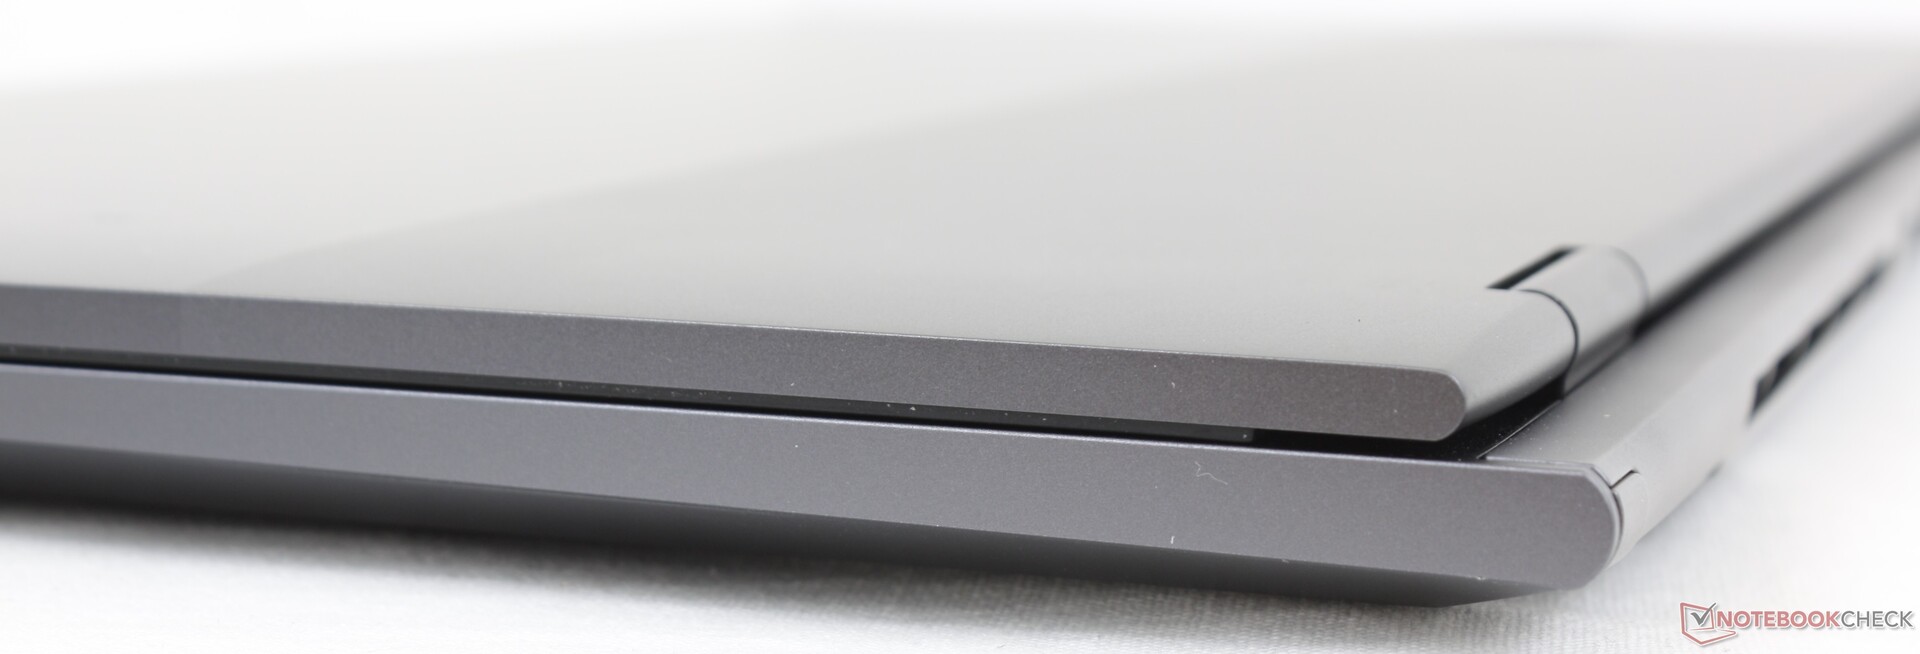
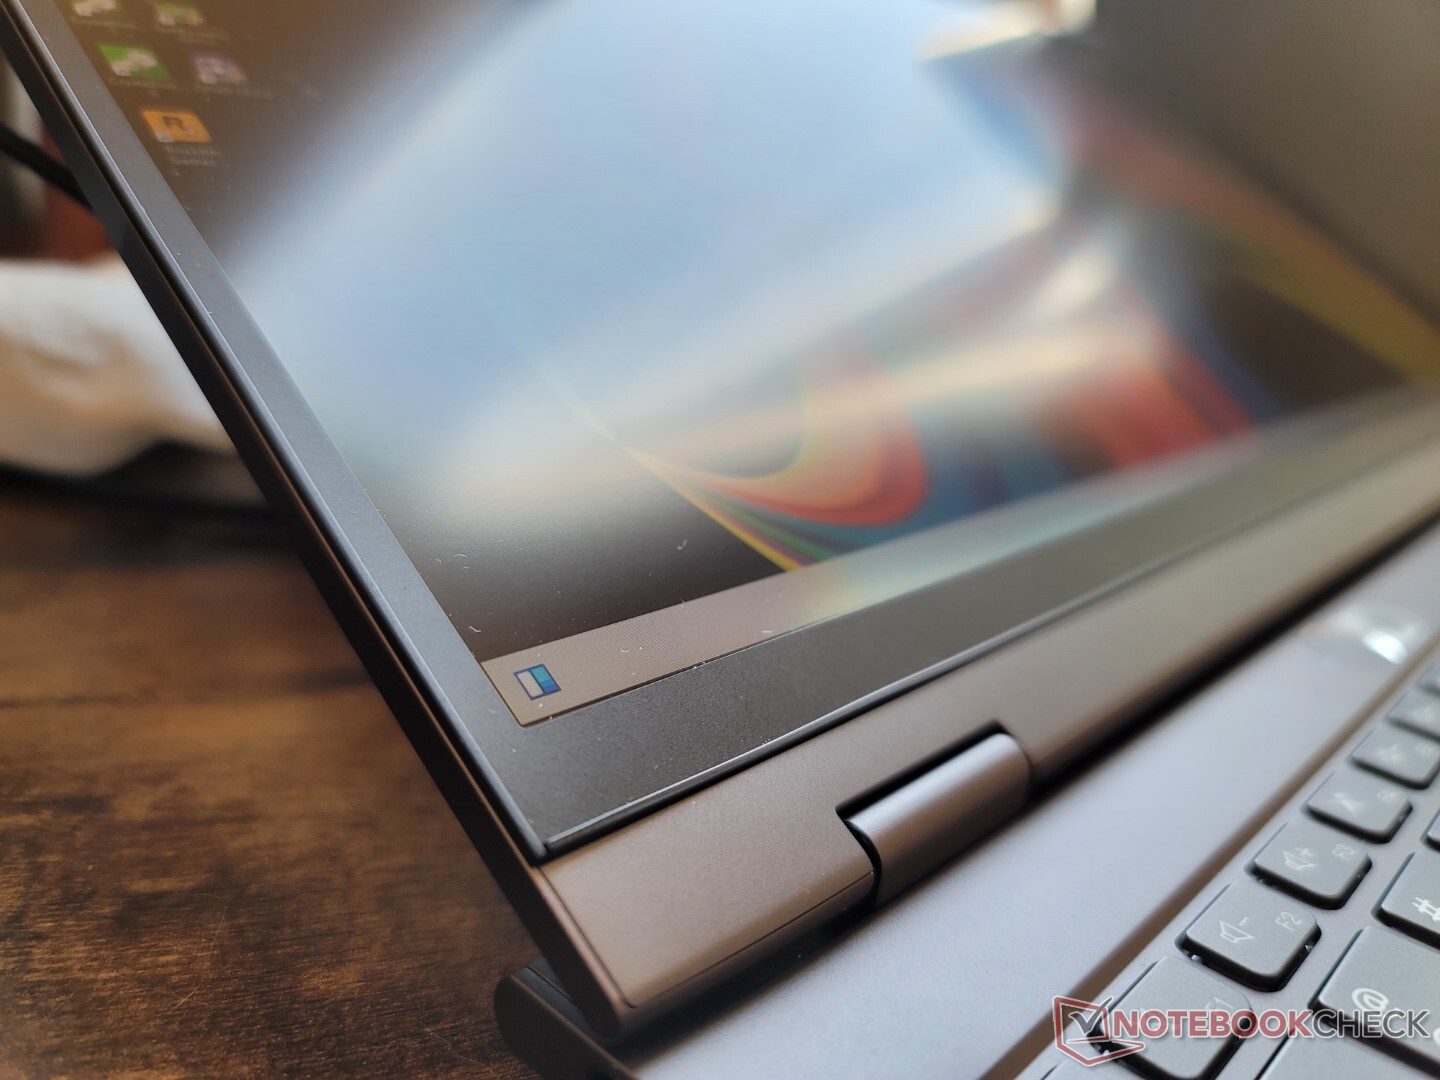
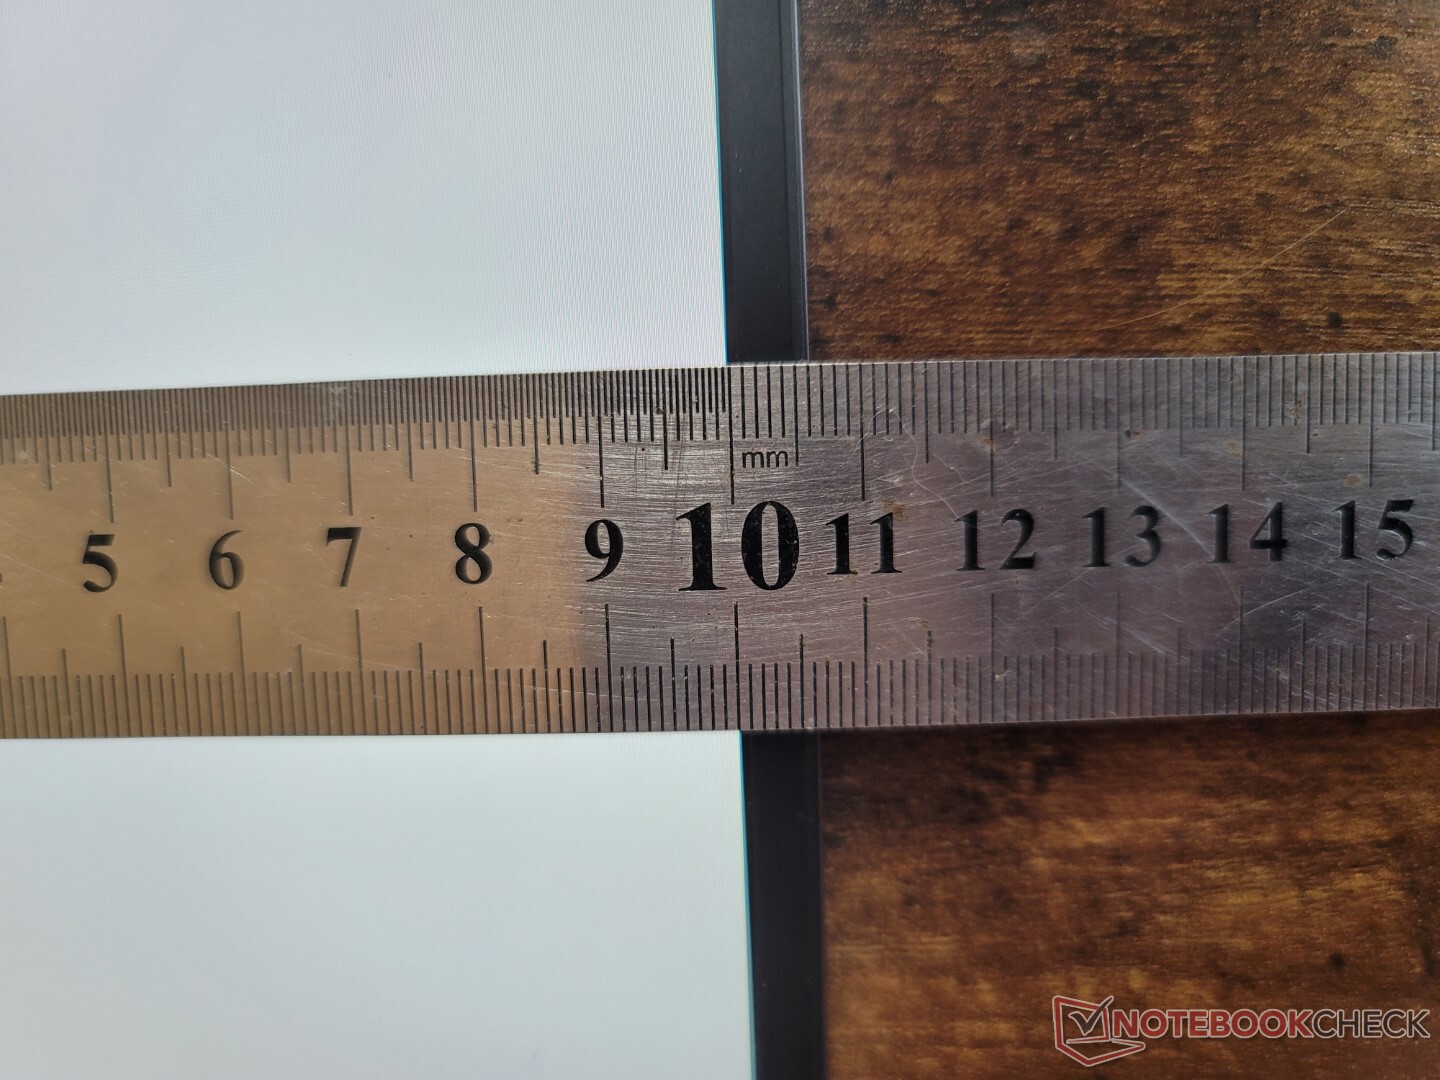
案例 - 长而薄
机箱与其他ThinkBook型号的铝合金材料相同,如最近的 笔记本16 G4 Plus.因此,如果你过去拿过ThinkBook机型,那么ThinkBook Plus第三代光滑的深灰色表面会让你立刻感到熟悉。该设计的目标是休闲办公和中小企业环境,介于以消费者为中心的Yoga和更传统的ThinkPad机型之间。
制造质量略低于Yoga或 ThinkPad X系列机型。盖子和底座更容易扭曲和吱吱作响,这可能是由于较大的17.3英寸外形尺寸和相对较薄的骨架。像较小的ZenBook Duo或较重的XPS 17这样的替代品,感觉更结实,特别是在铰链方面,感觉更牢固。
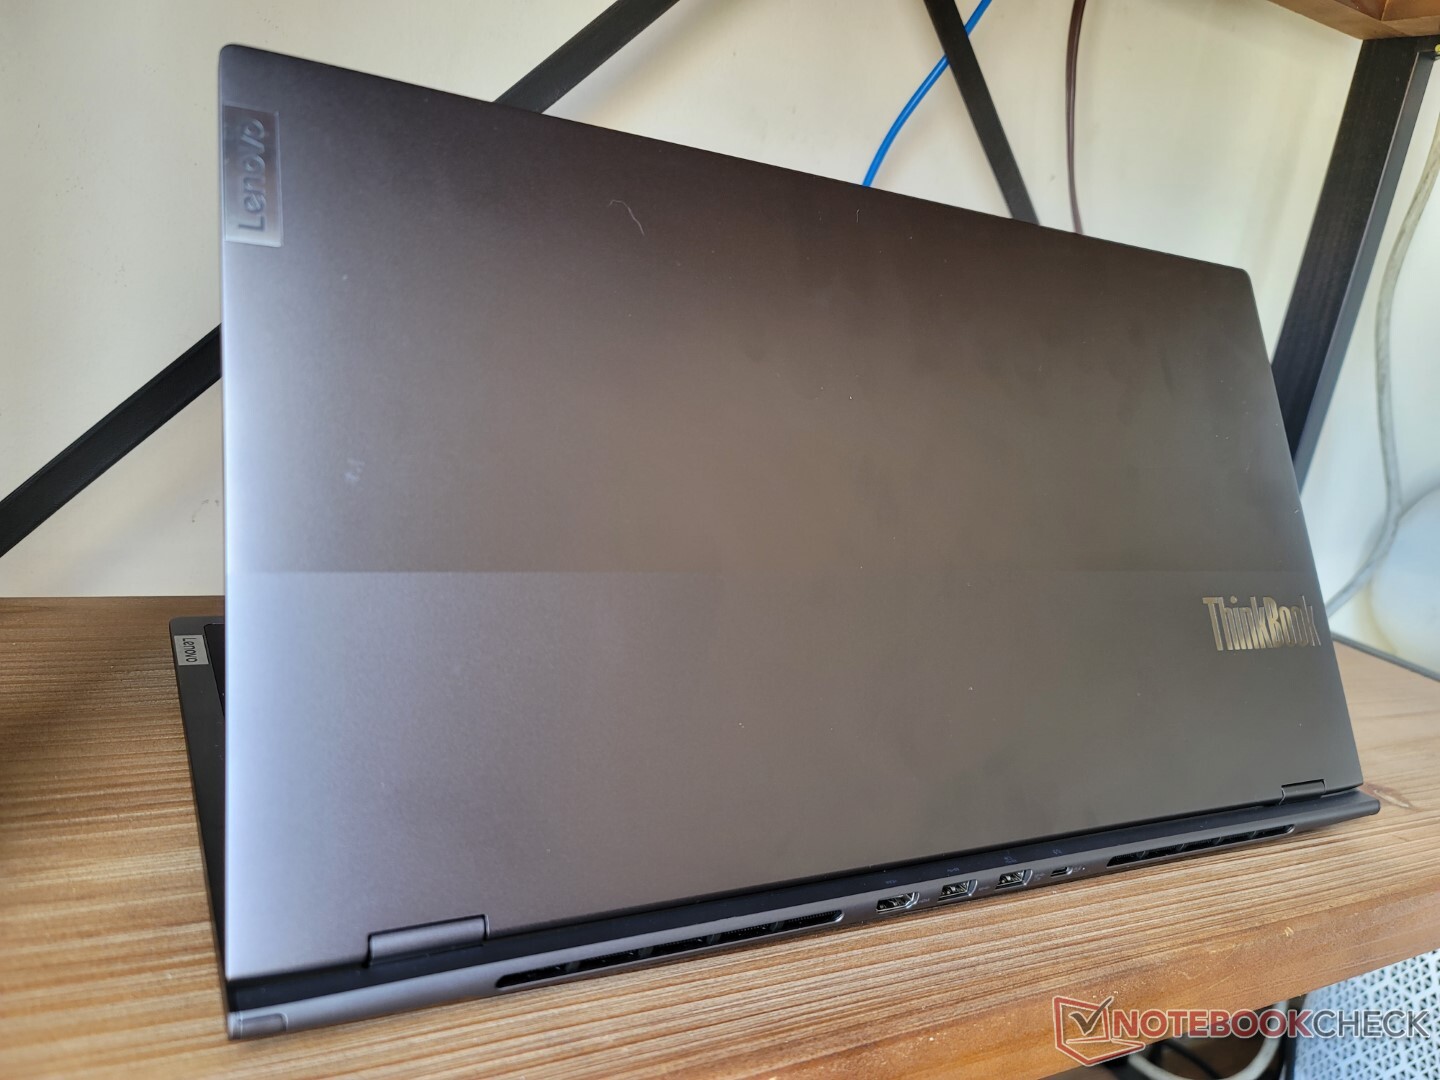
拉长的长宽比导致了一个比其他17英寸笔记本电脑更宽但更短的机箱。值得庆幸的是,考虑到它的尺寸类别,它仍然很薄很轻。例如,XPS 17就重了半公斤。
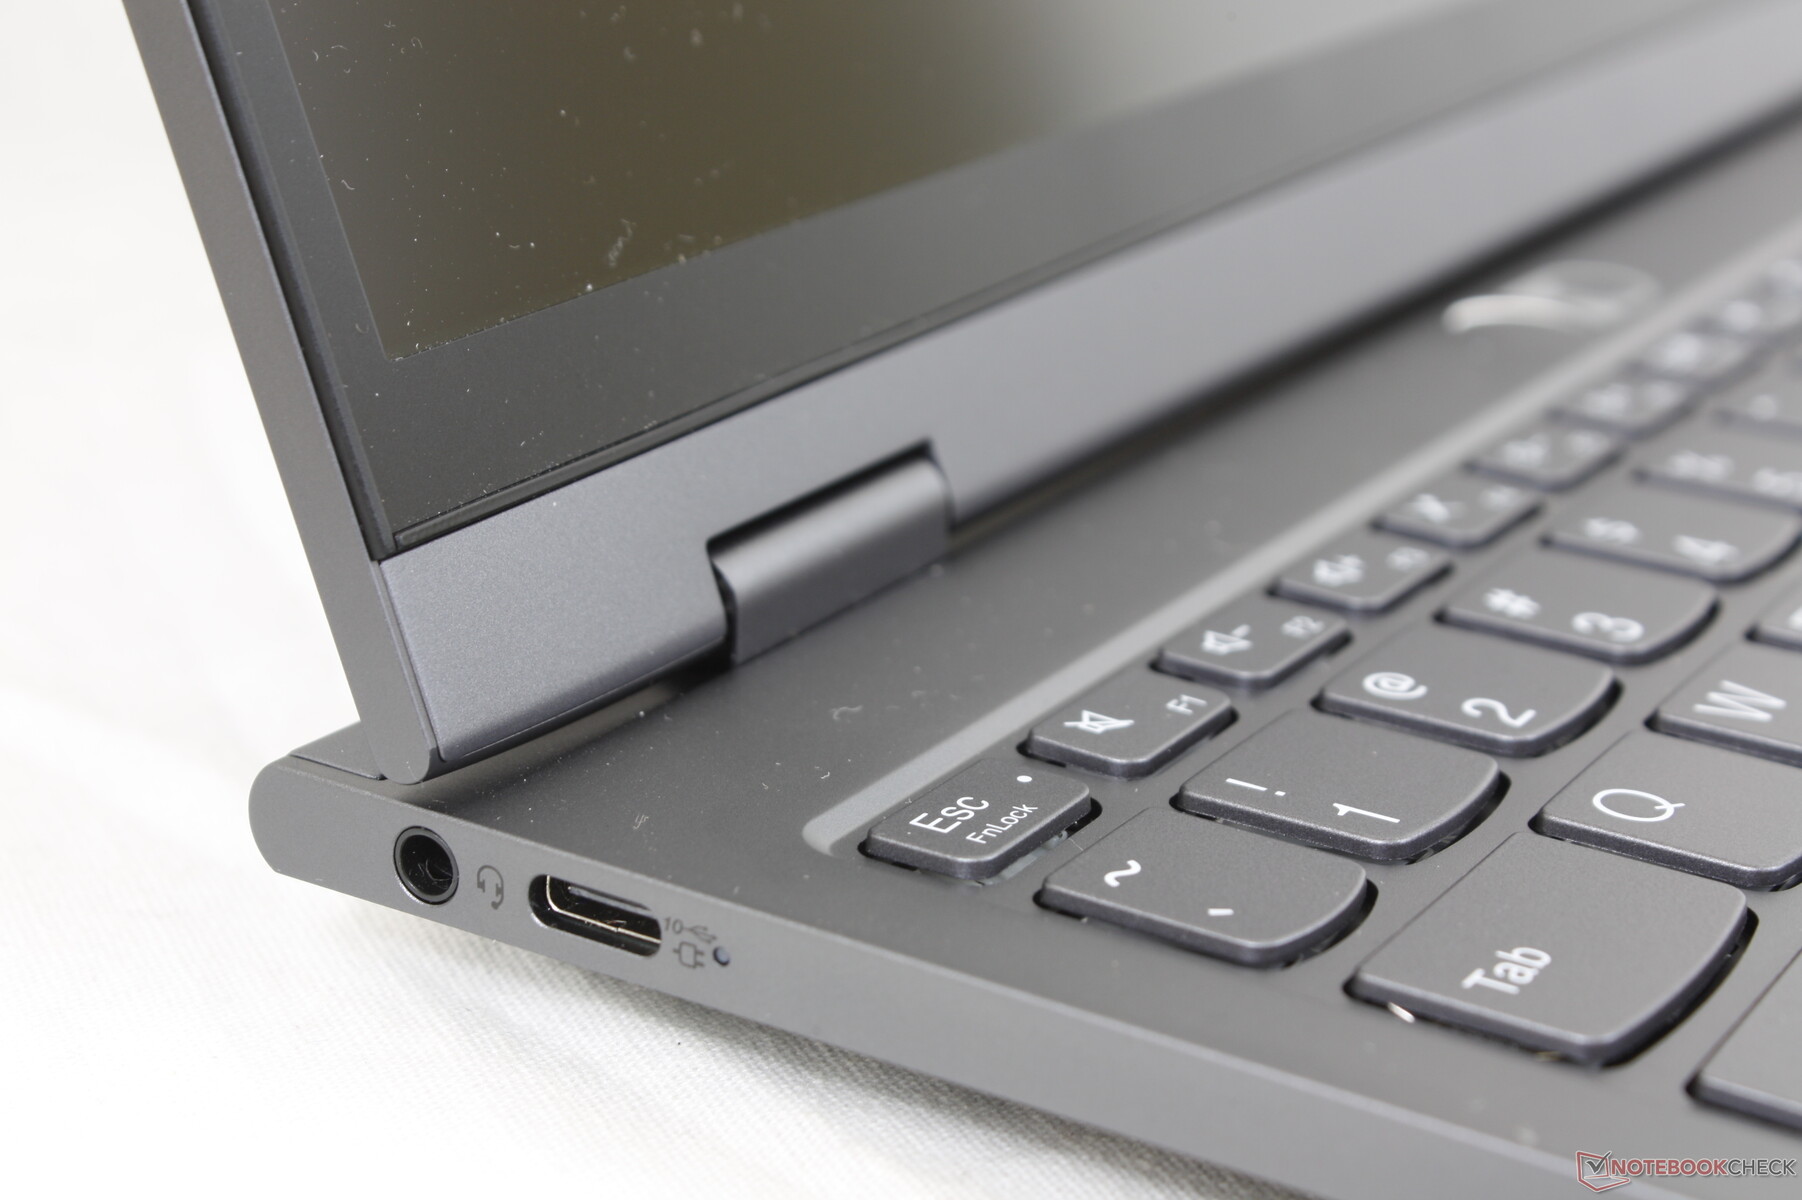
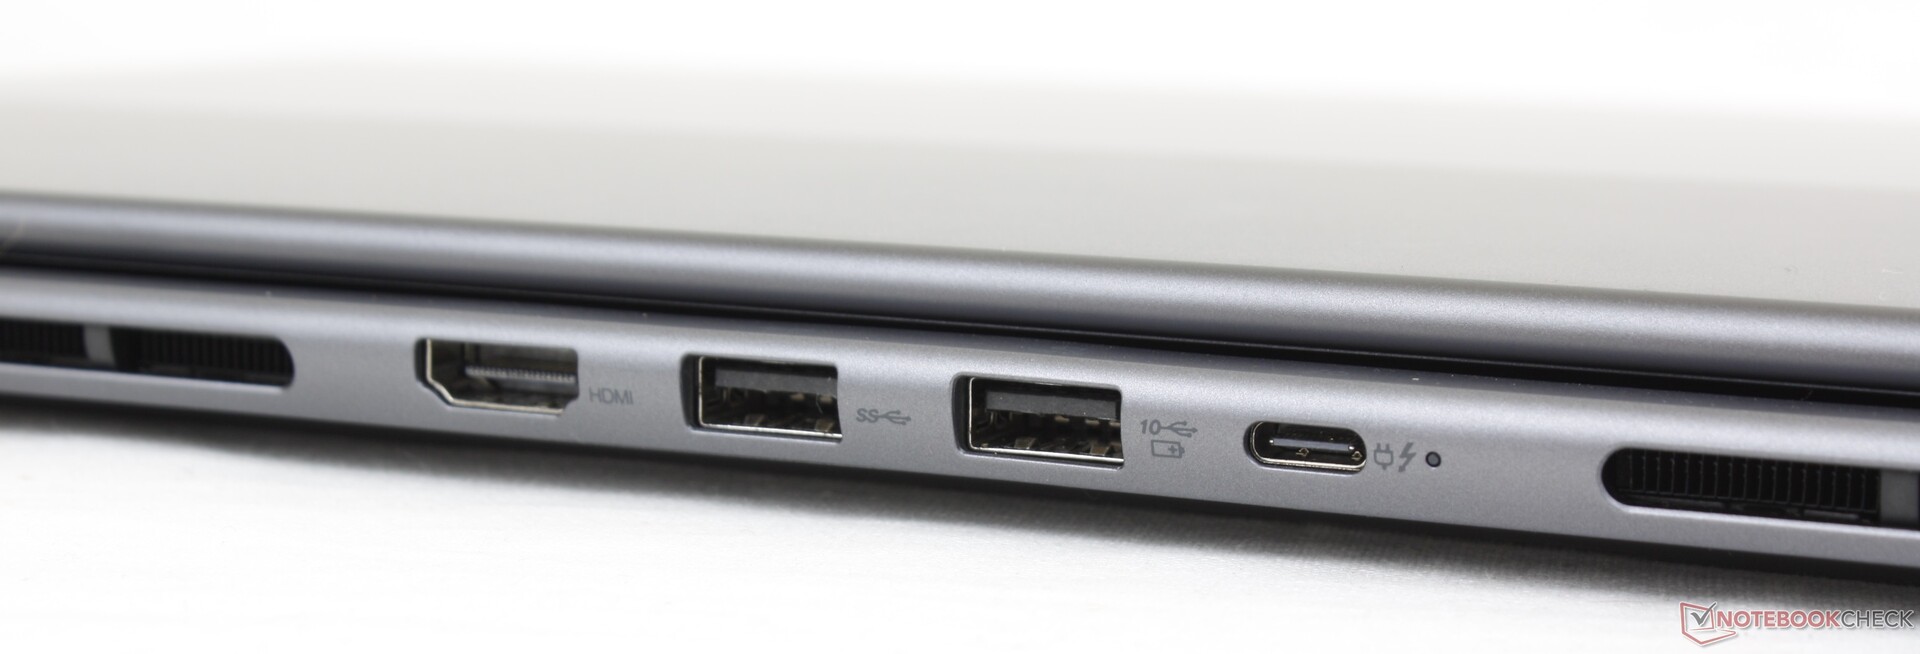
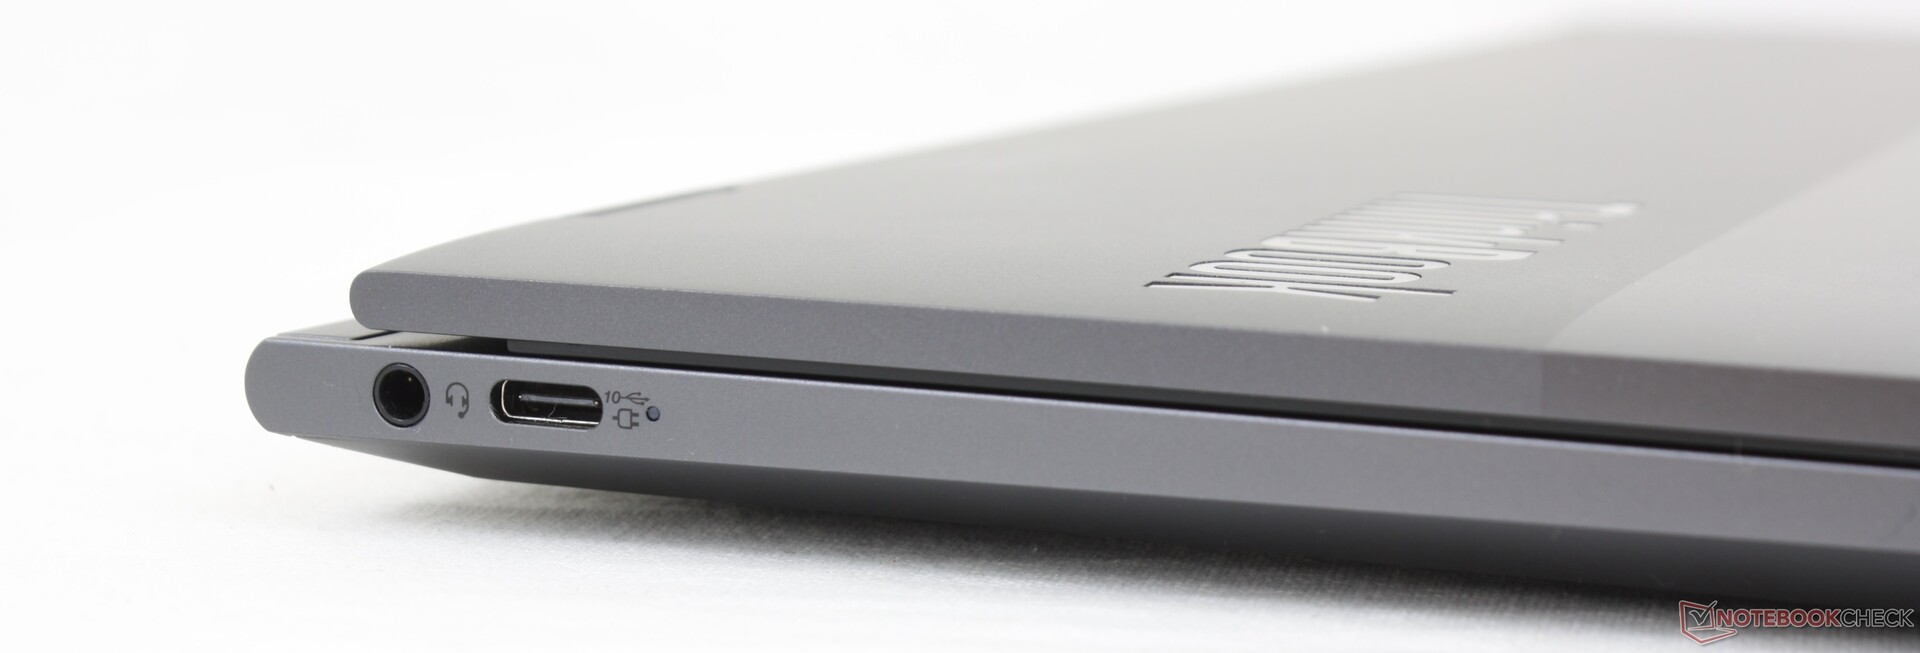
连接性 - 支持Thunderbolt 4
如果第三代机型的端口比上一代机型小得多,这将是一种犯罪。该系统集成了两个USB-C端口,就像它的前辈一样,加上新的USB-A和HDMI端口,可以有更多的选择。请注意,两个USB-C端口中只有一个与Thunderbolt兼容,但其中一个可以用于充电或DisplayPort。
没有SD卡读卡器,考虑到其大的外形尺寸和对办公/编辑任务的关注,这有点让人失望。
沟通
英特尔AX211是Wi-Fi 6E和蓝牙5.2连接的标准配置。当与我们的6GHz网络配对时,我们经历了稳定的传输速率。
| Networking | |
| iperf3 transmit AX12 | |
| Gigabyte Aero 17 HDR YD | |
| Asus ProArt StudioBook Pro 17 W700G3T | |
| Lenovo ThinkBook Plus Gen2 Core i5 | |
| iperf3 receive AX12 | |
| Asus ProArt StudioBook Pro 17 W700G3T | |
| Lenovo ThinkBook Plus Gen2 Core i5 | |
| Gigabyte Aero 17 HDR YD | |
| iperf3 receive AXE11000 6GHz | |
| Lenovo ThinkBook Plus Gen3 | |
| iperf3 receive AXE11000 | |
| LG Gram 17 (2022) | |
| Dell XPS 17 9720 | |
| iperf3 transmit AXE11000 6GHz | |
| Lenovo ThinkBook Plus Gen3 | |
| iperf3 transmit AXE11000 | |
| Dell XPS 17 9720 | |
| LG Gram 17 (2022) | |
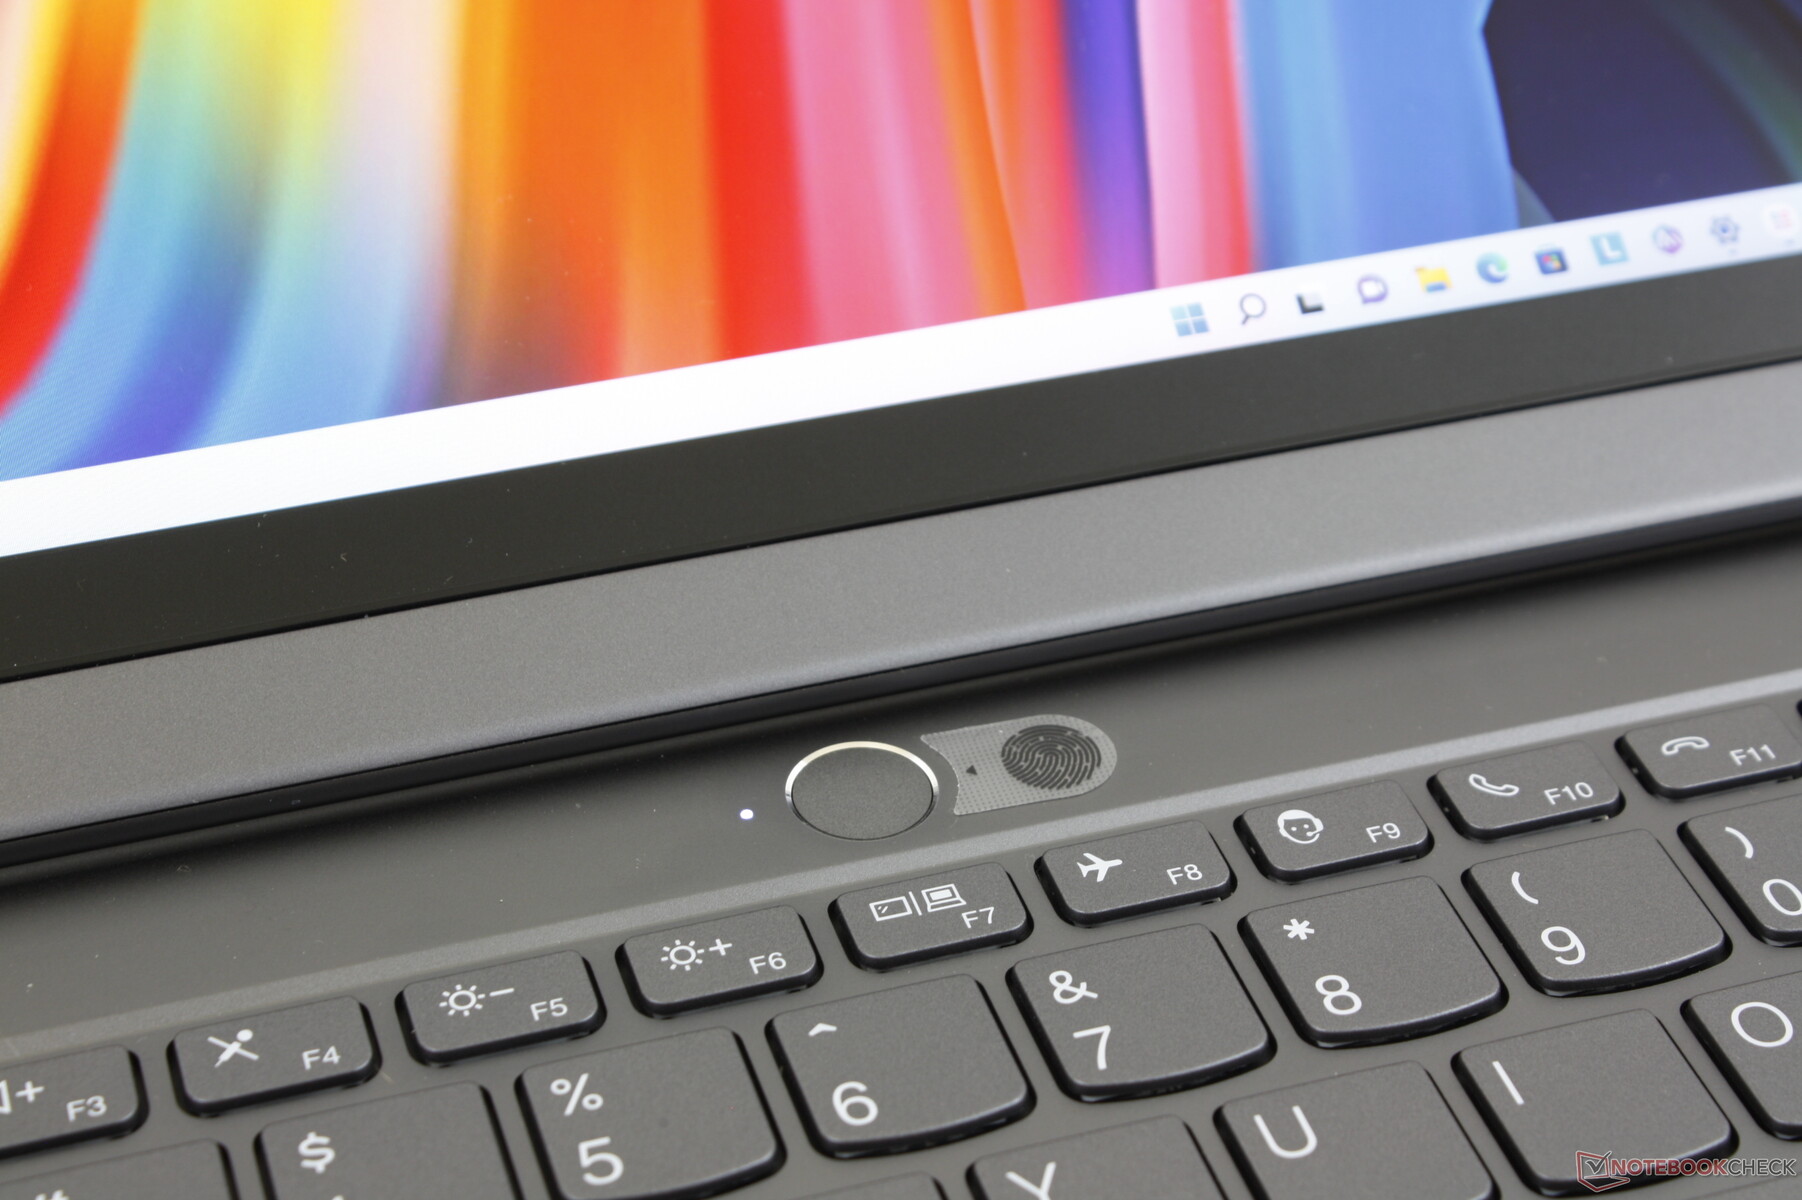
网络摄像头
200万像素的摄像头比XPS系列的更清晰,但仍然不如许多较新的惠普机型上的500万像素摄像头。 许多较新的惠普机型.红外传感器和快门都是为了支持你好和保护隐私而存在的。


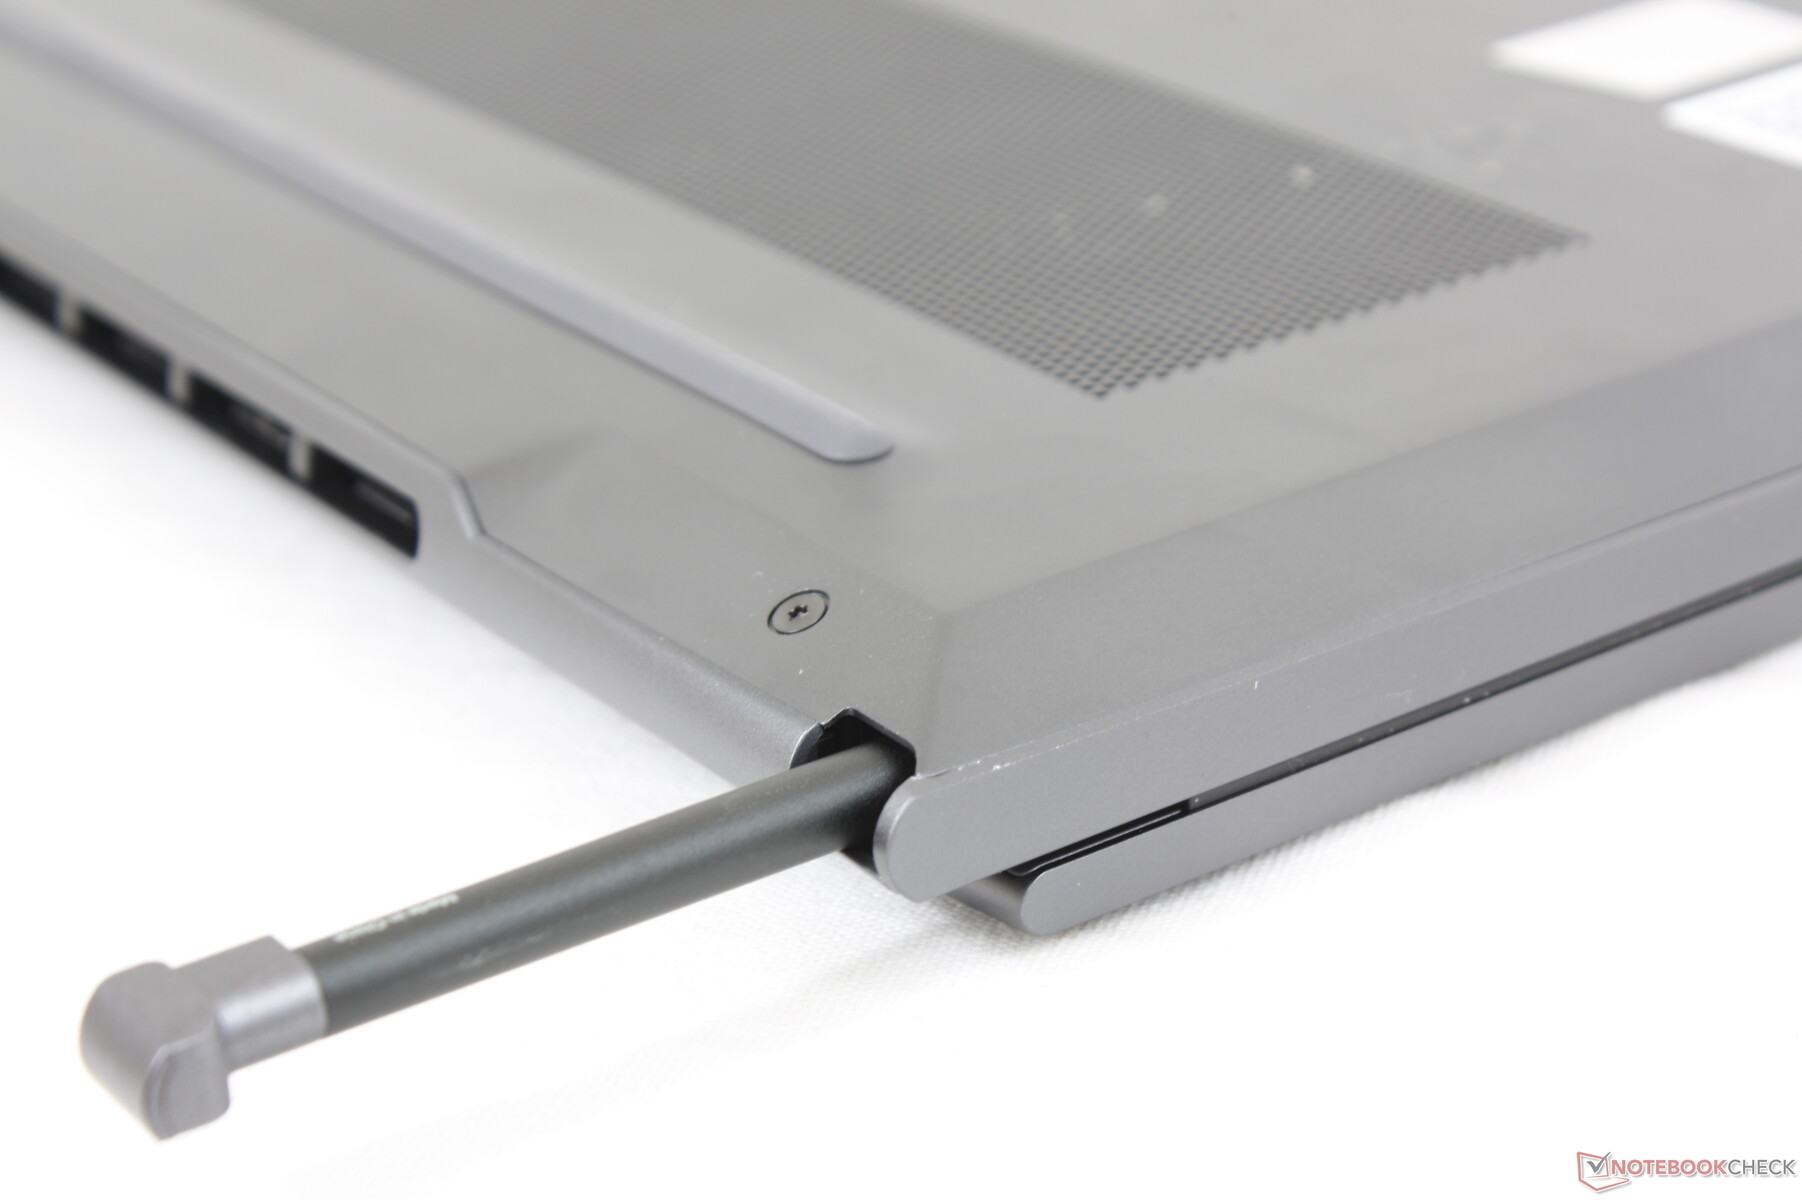
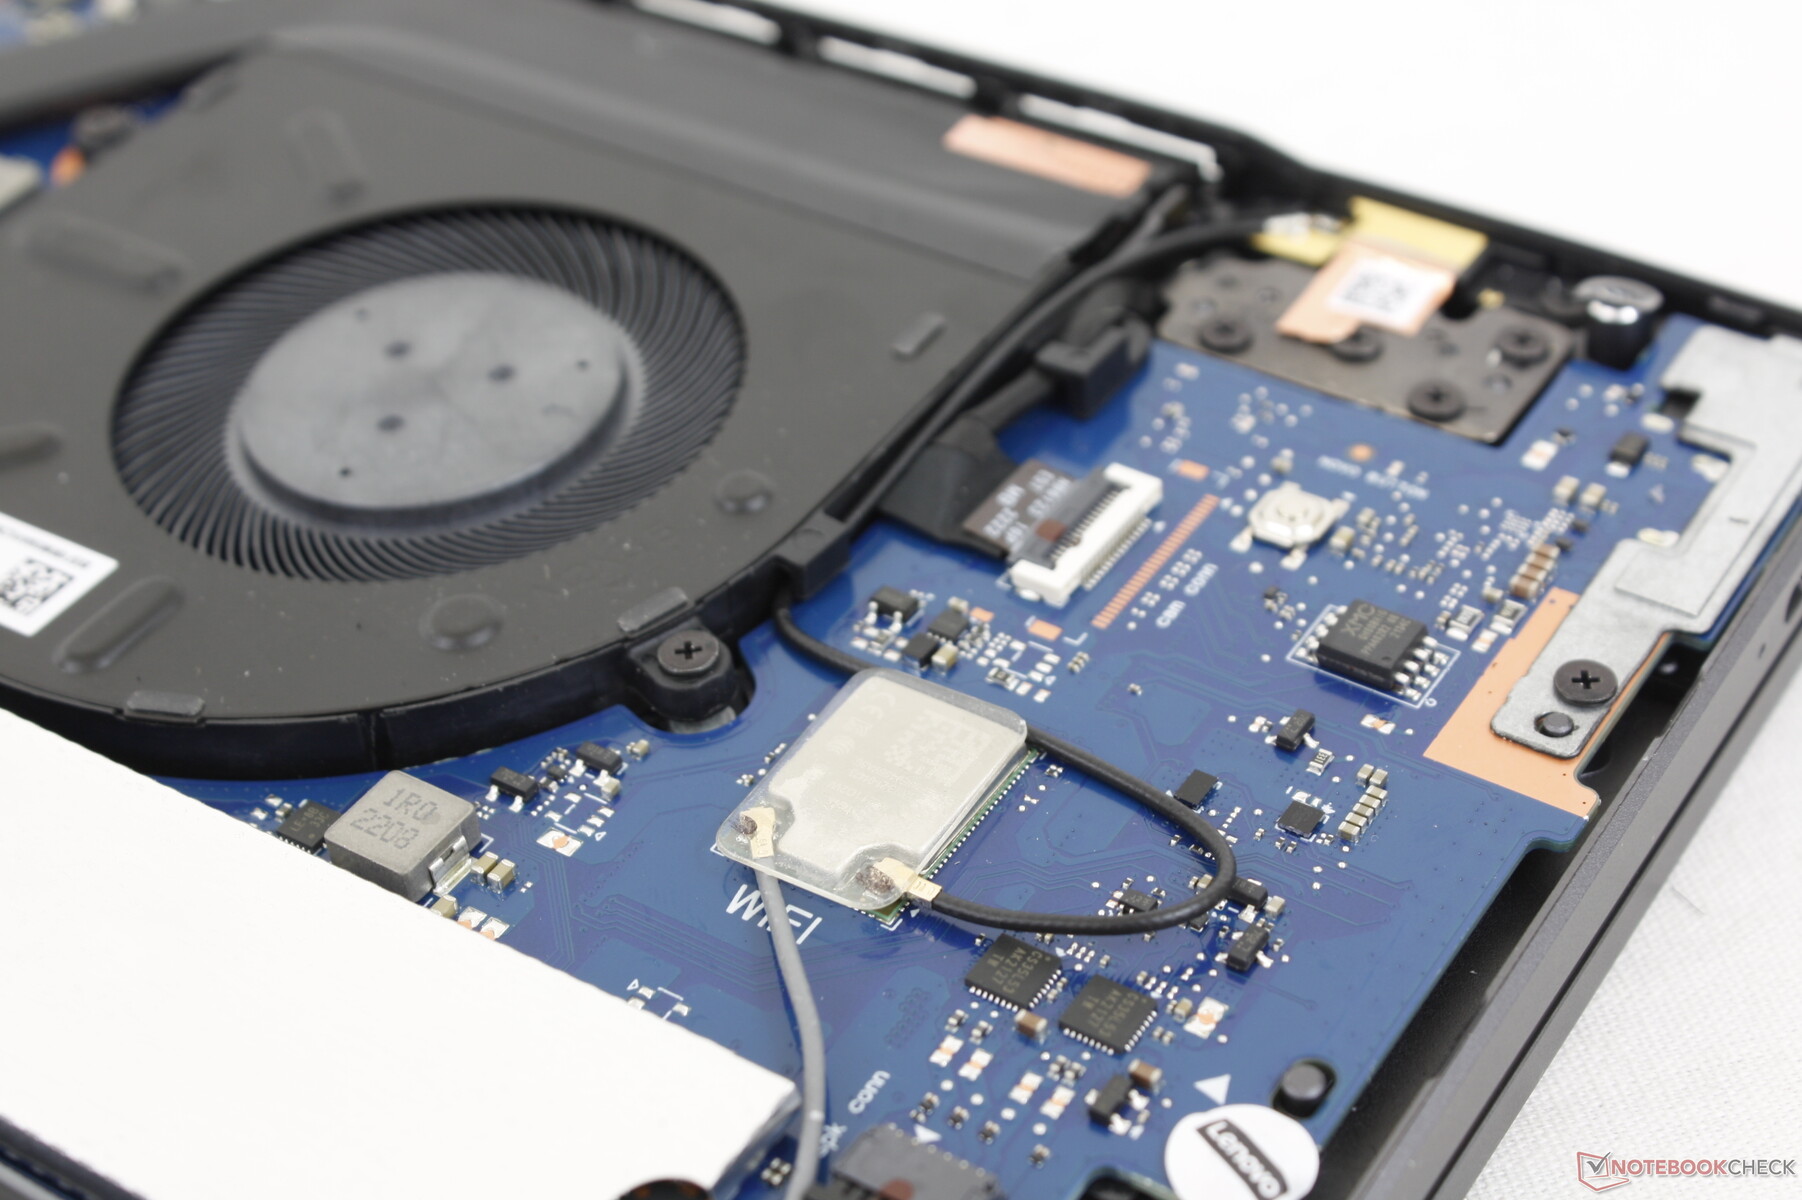
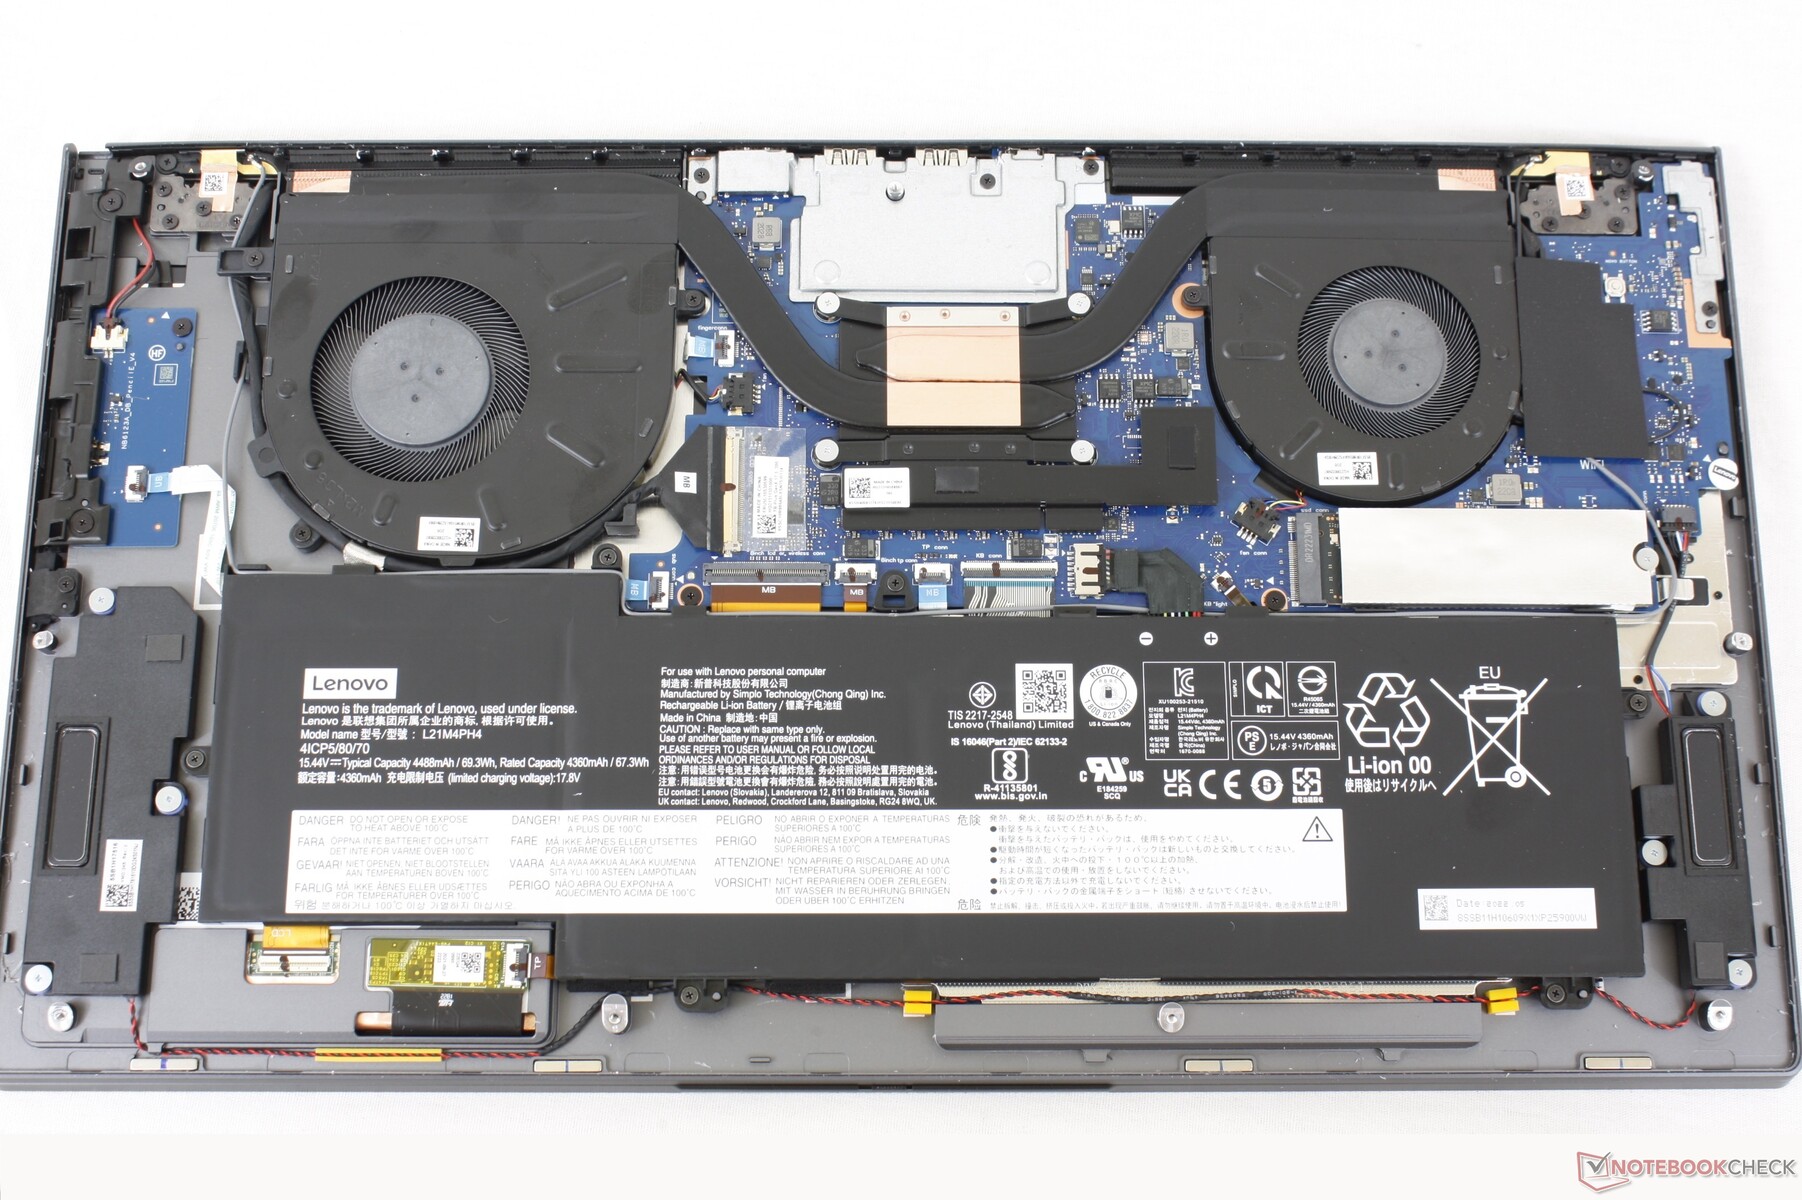
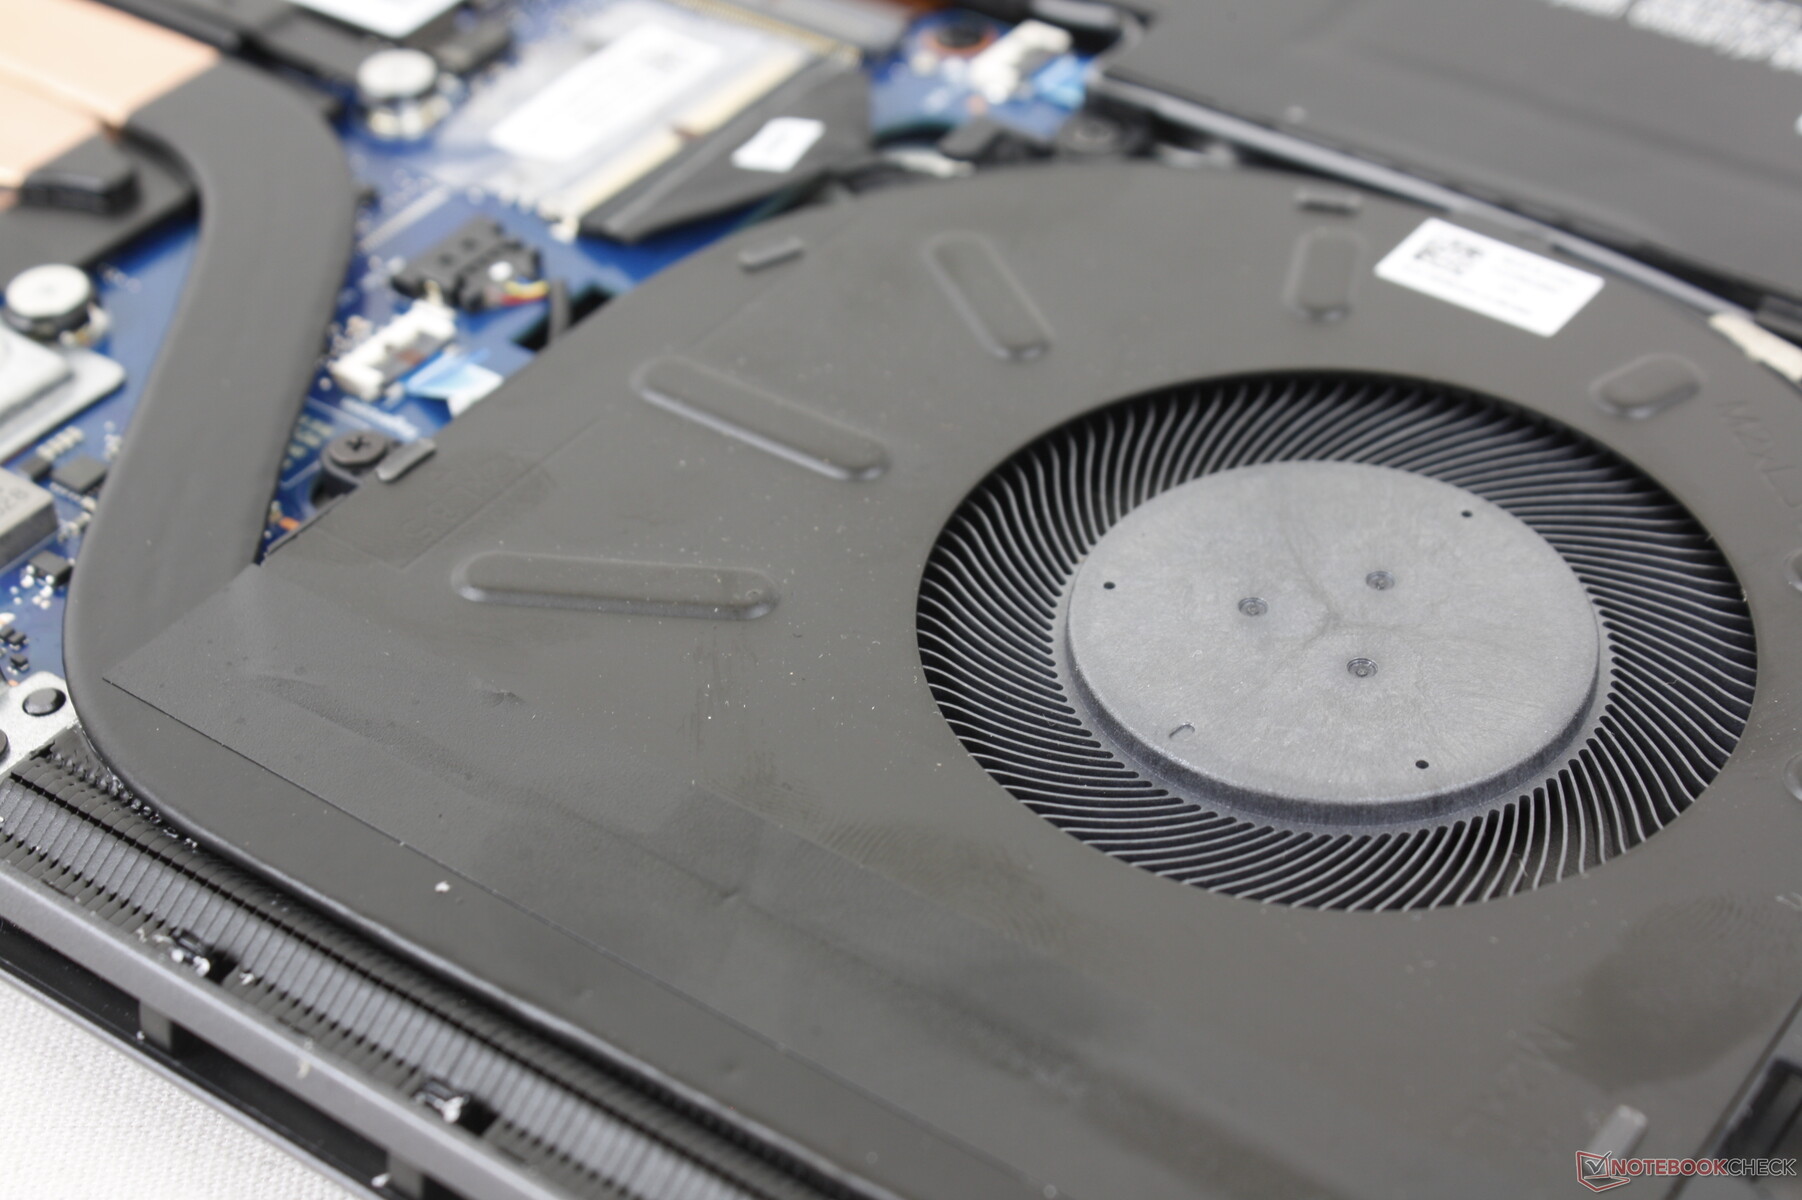
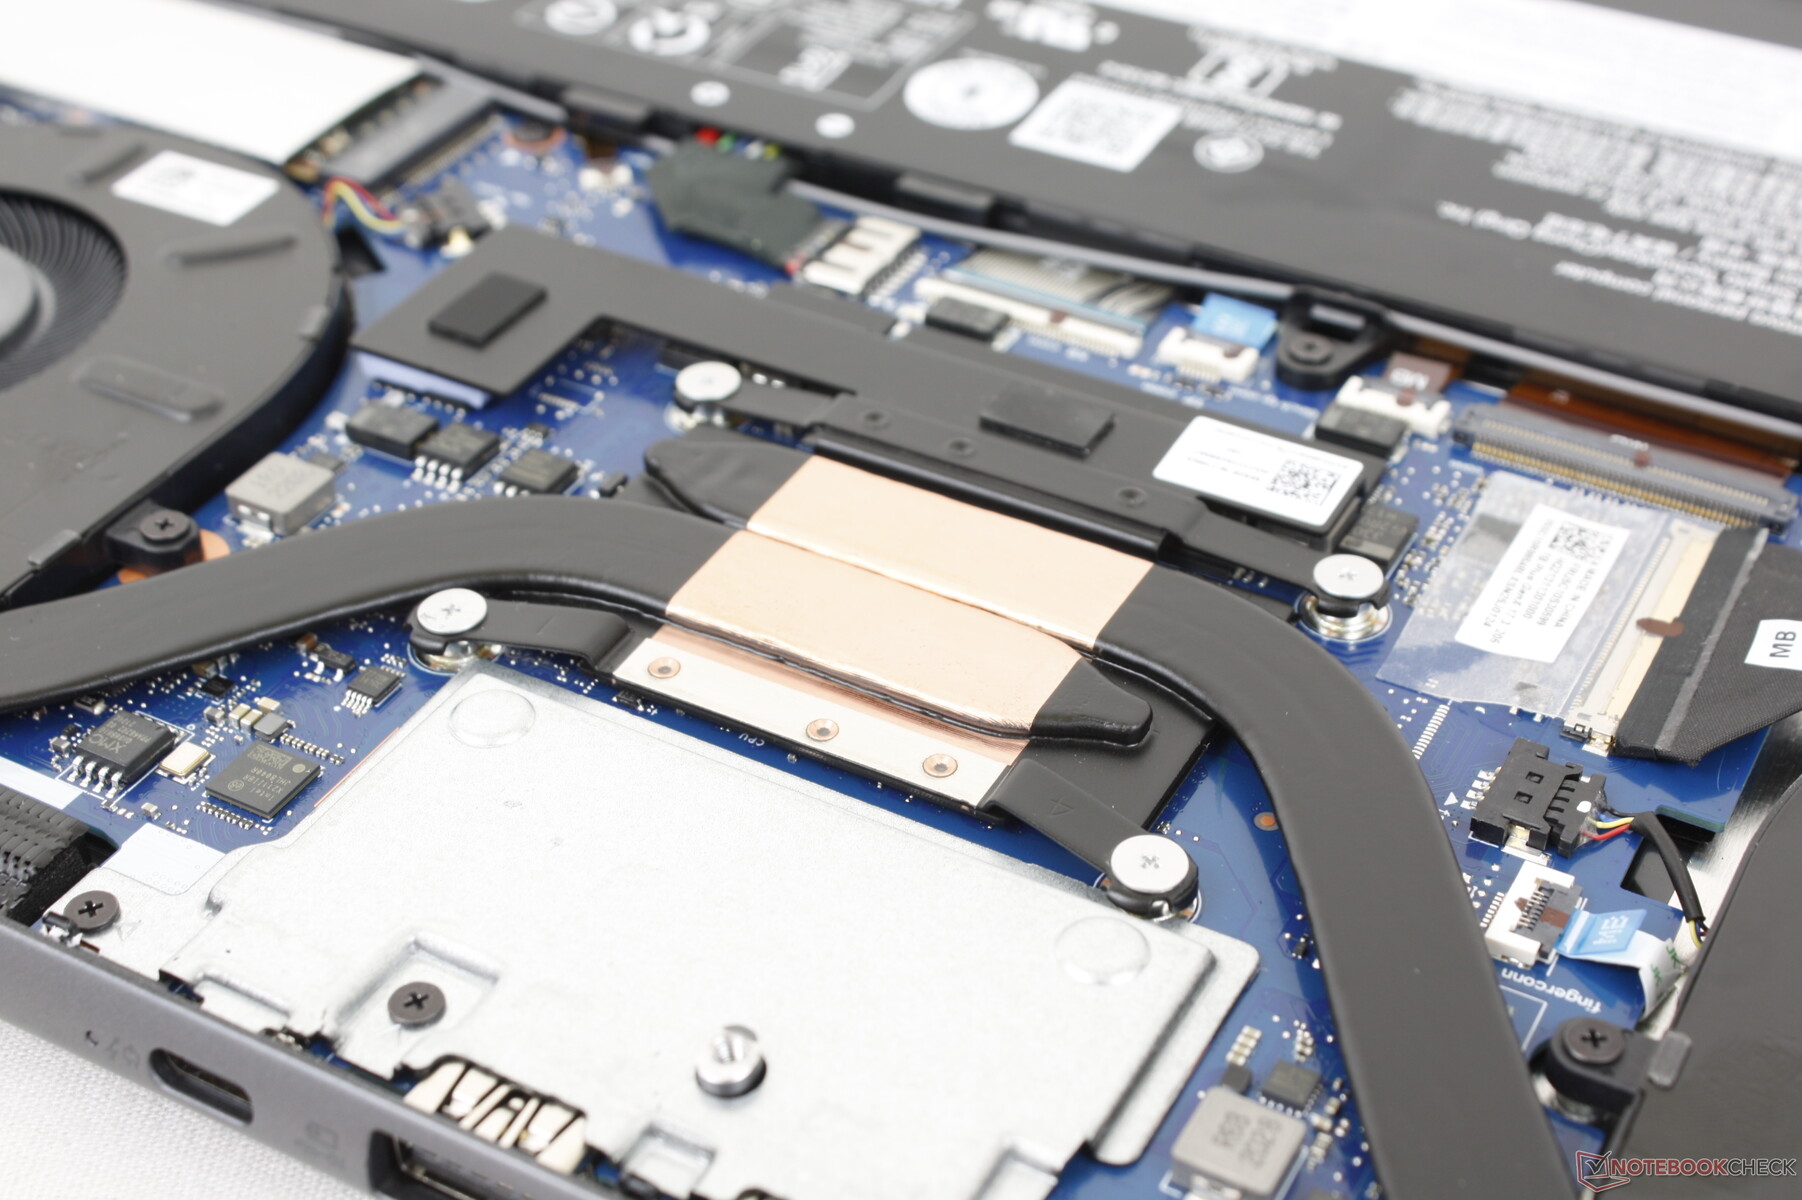
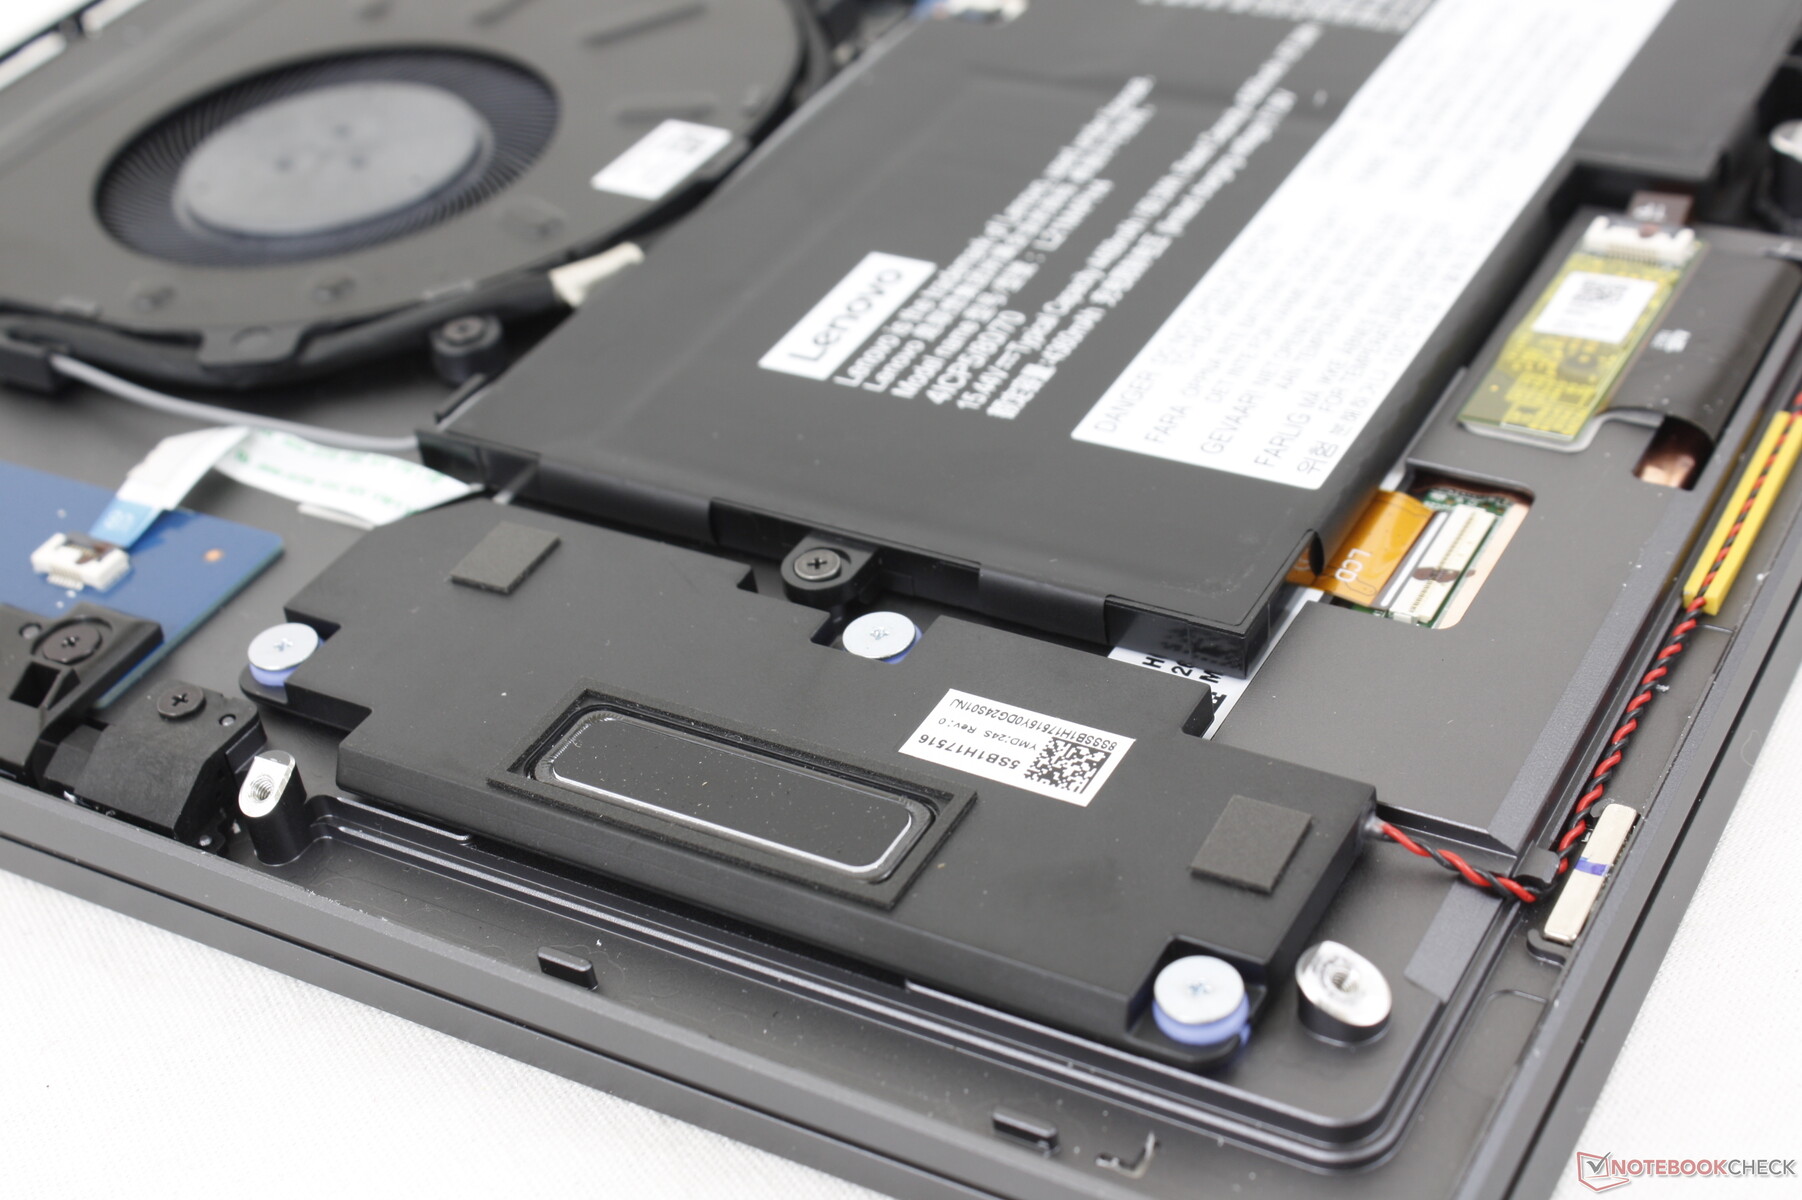
维护
底部面板由九个T5 Torx螺丝固定。我们建议先把笔从后面拆下来,然后用这个开口来更容易地把面板从底座上拆下来。
由于WLAN和RAM模块都是焊接的,所以进去后没有什么可升级的。
配件和保修
该系统集成了一个有源手写笔,与去年的第二代机型很相似。如果在美国购买,标准的一年有限制造商保修期适用。
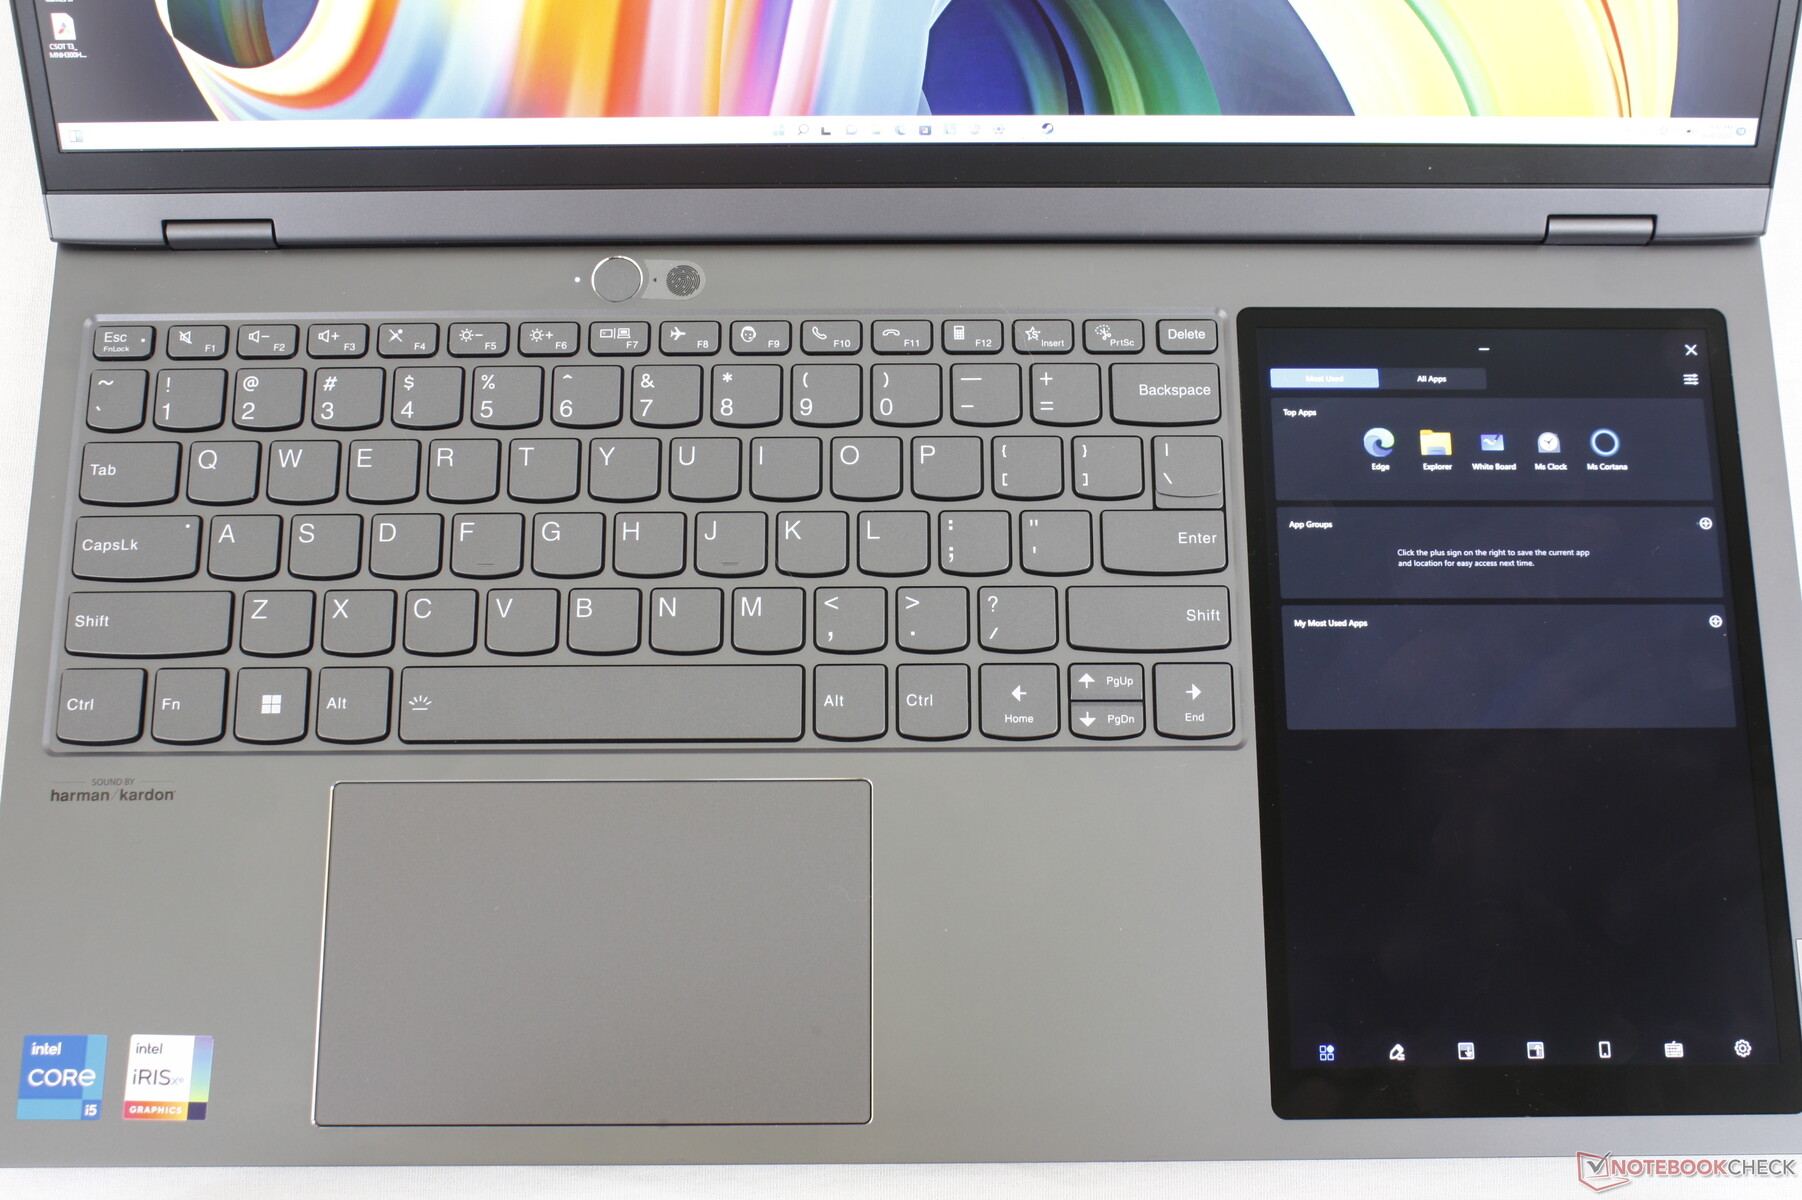
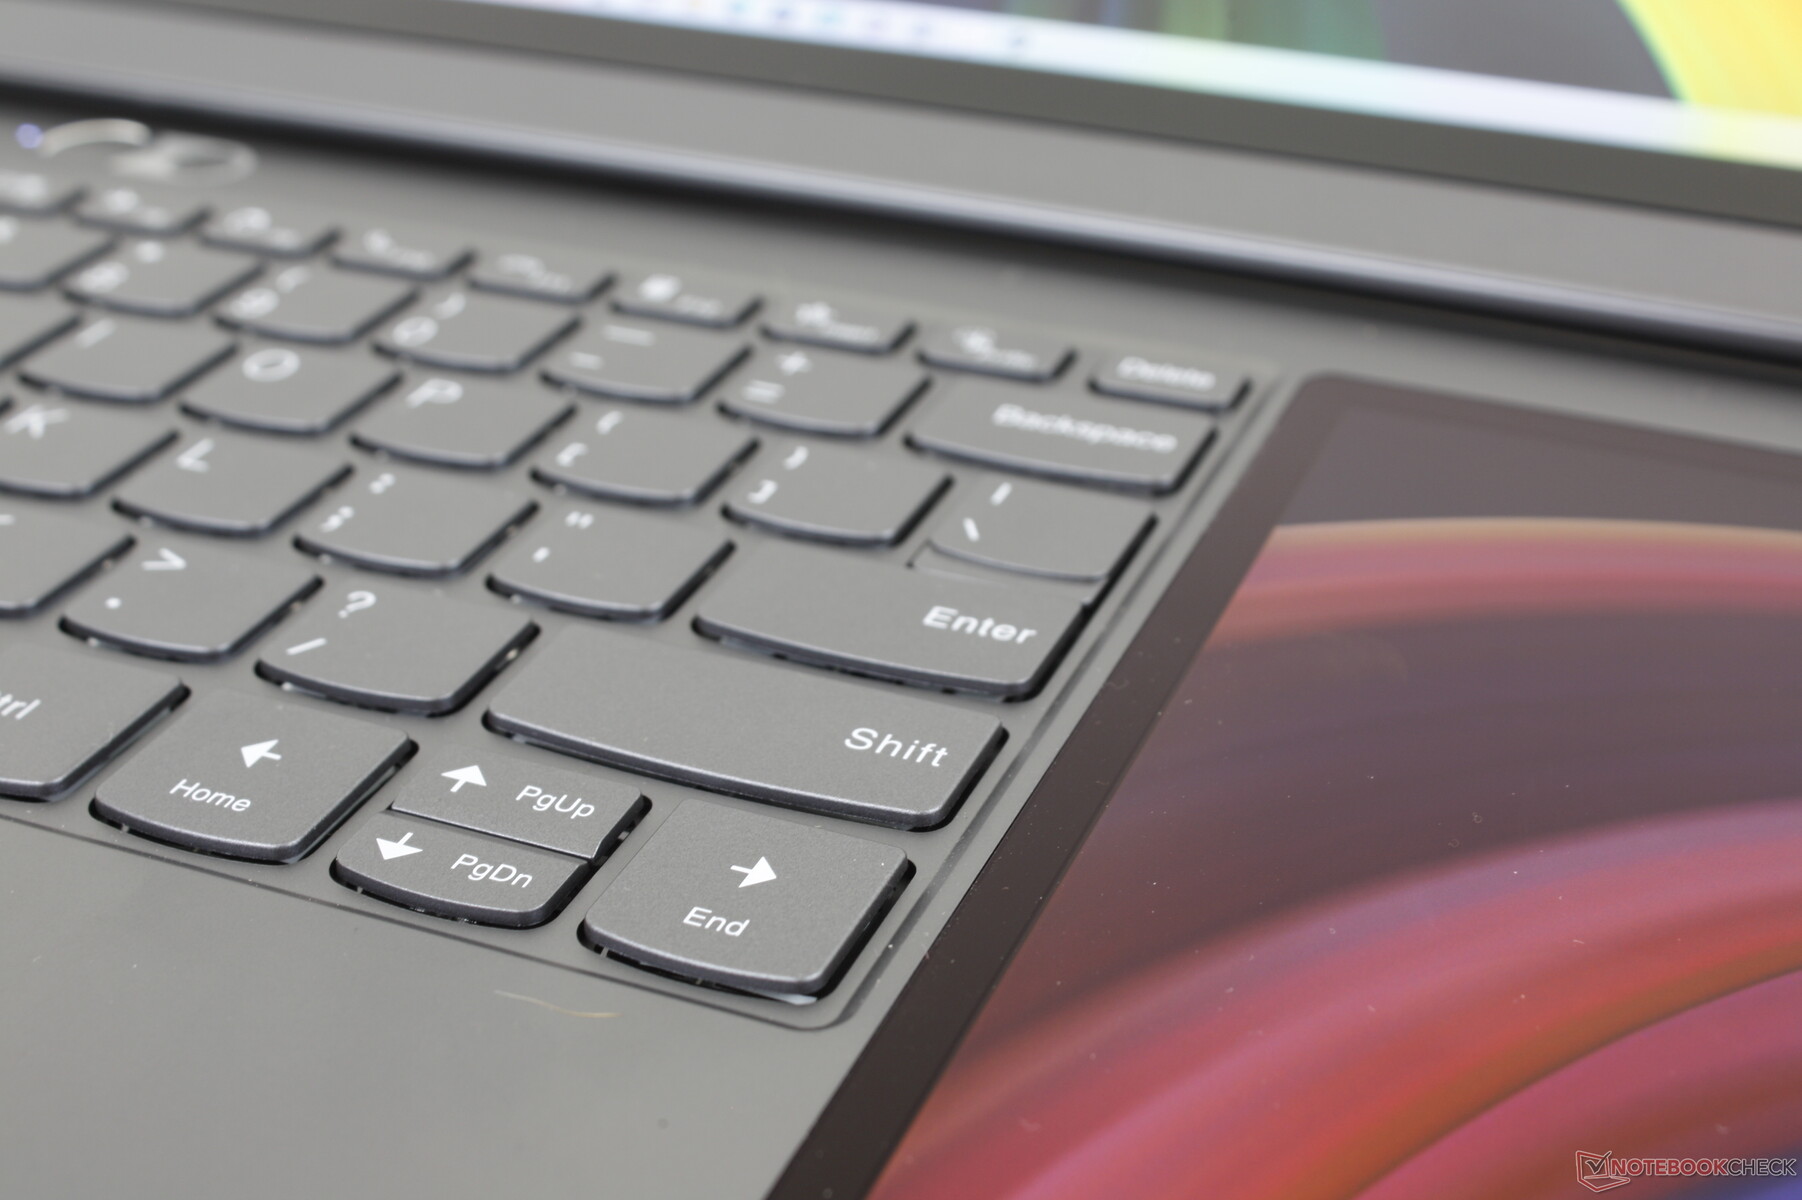
输入设备 - 宽敞的键盘台面
键盘
打字体验与其他ThinkBook笔记本电脑相同,包括 ThinkBook 14 G4尽管加入了副触摸屏。较宽的占地面积使一台笔记本电脑拥有相对宽敞的点击板、触摸屏和键盘,而在较小的14英寸或15英寸ZenBook上,它们会感觉很拥挤。
按键反馈浅而轻,与许多Yoga、IdeaPad或中端超极本机型的键盘不同。相比之下,ThinkPad的键盘通常更硬,键程也更深。
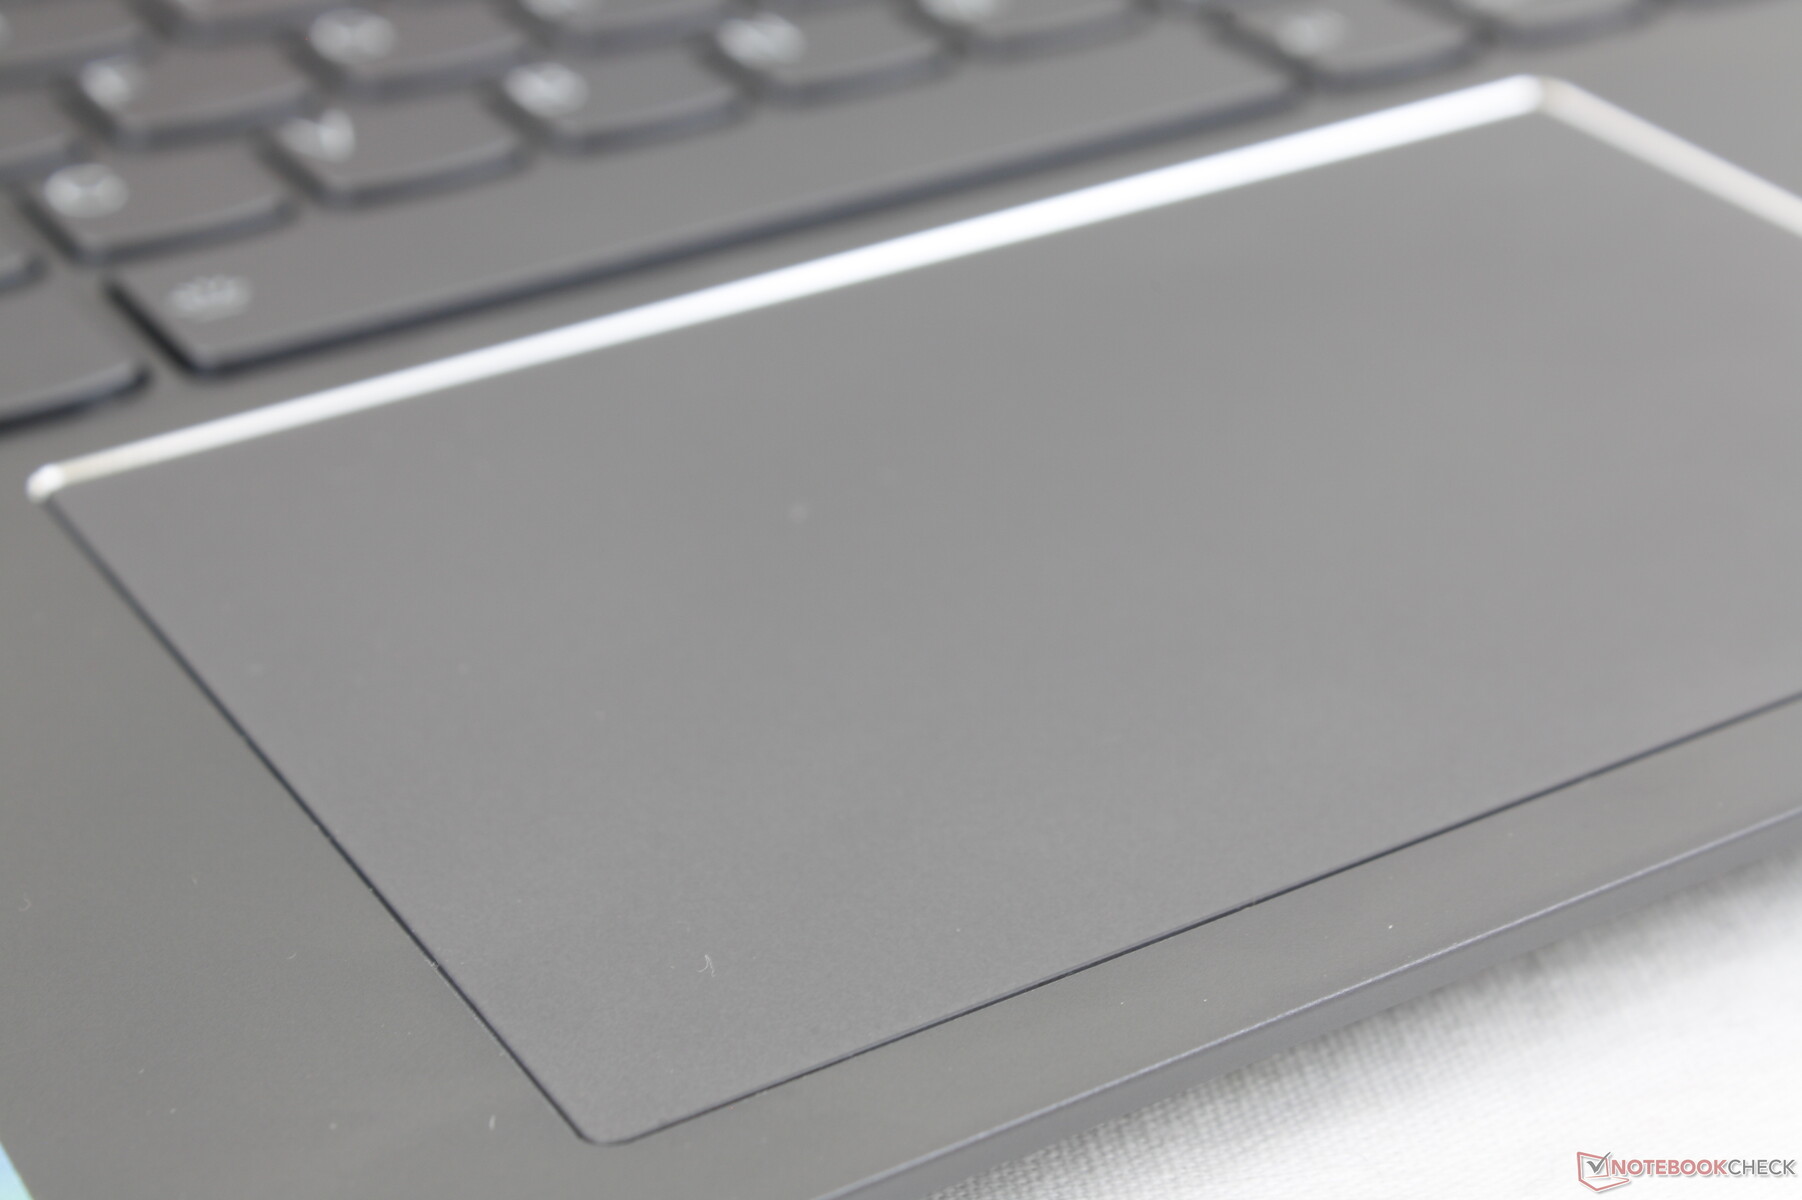
触摸板
与ZenBook Duo UX481上的小键盘不同,该键盘的尺寸很合适(12 x 7.5厘米,5.5 x 7厘米)。滑动流畅,反应迅速,部分原因是主显示屏的120赫兹原生刷新率更快。在点击板上的点击是坚定的,而且有响亮的听觉点击,反馈令人满意。

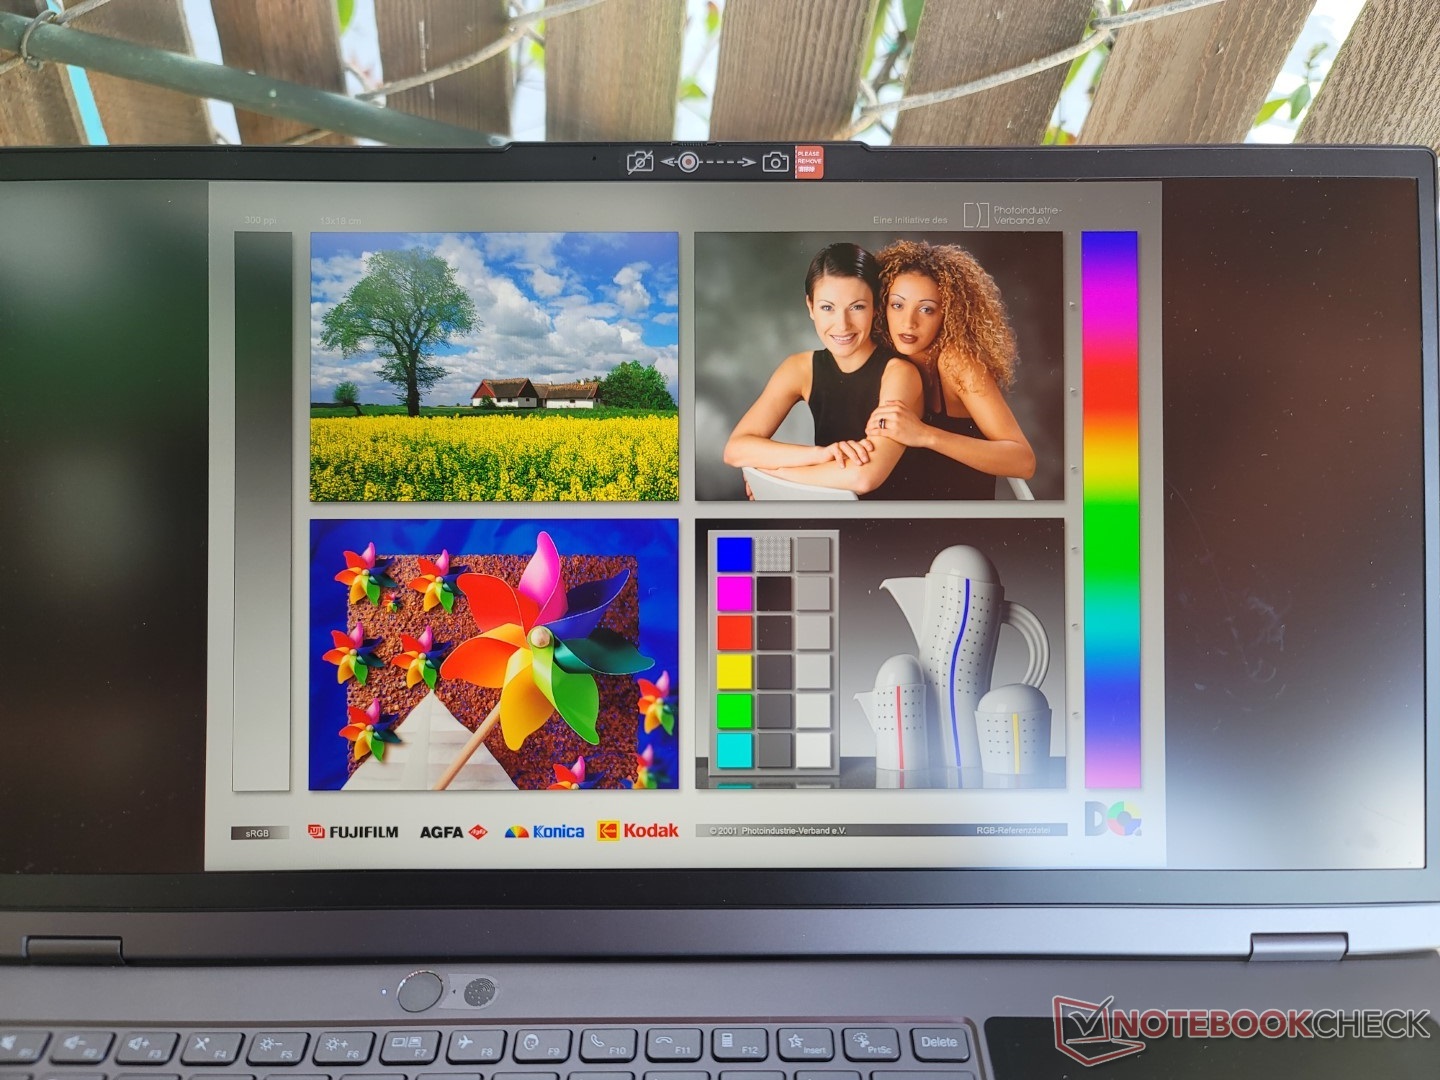
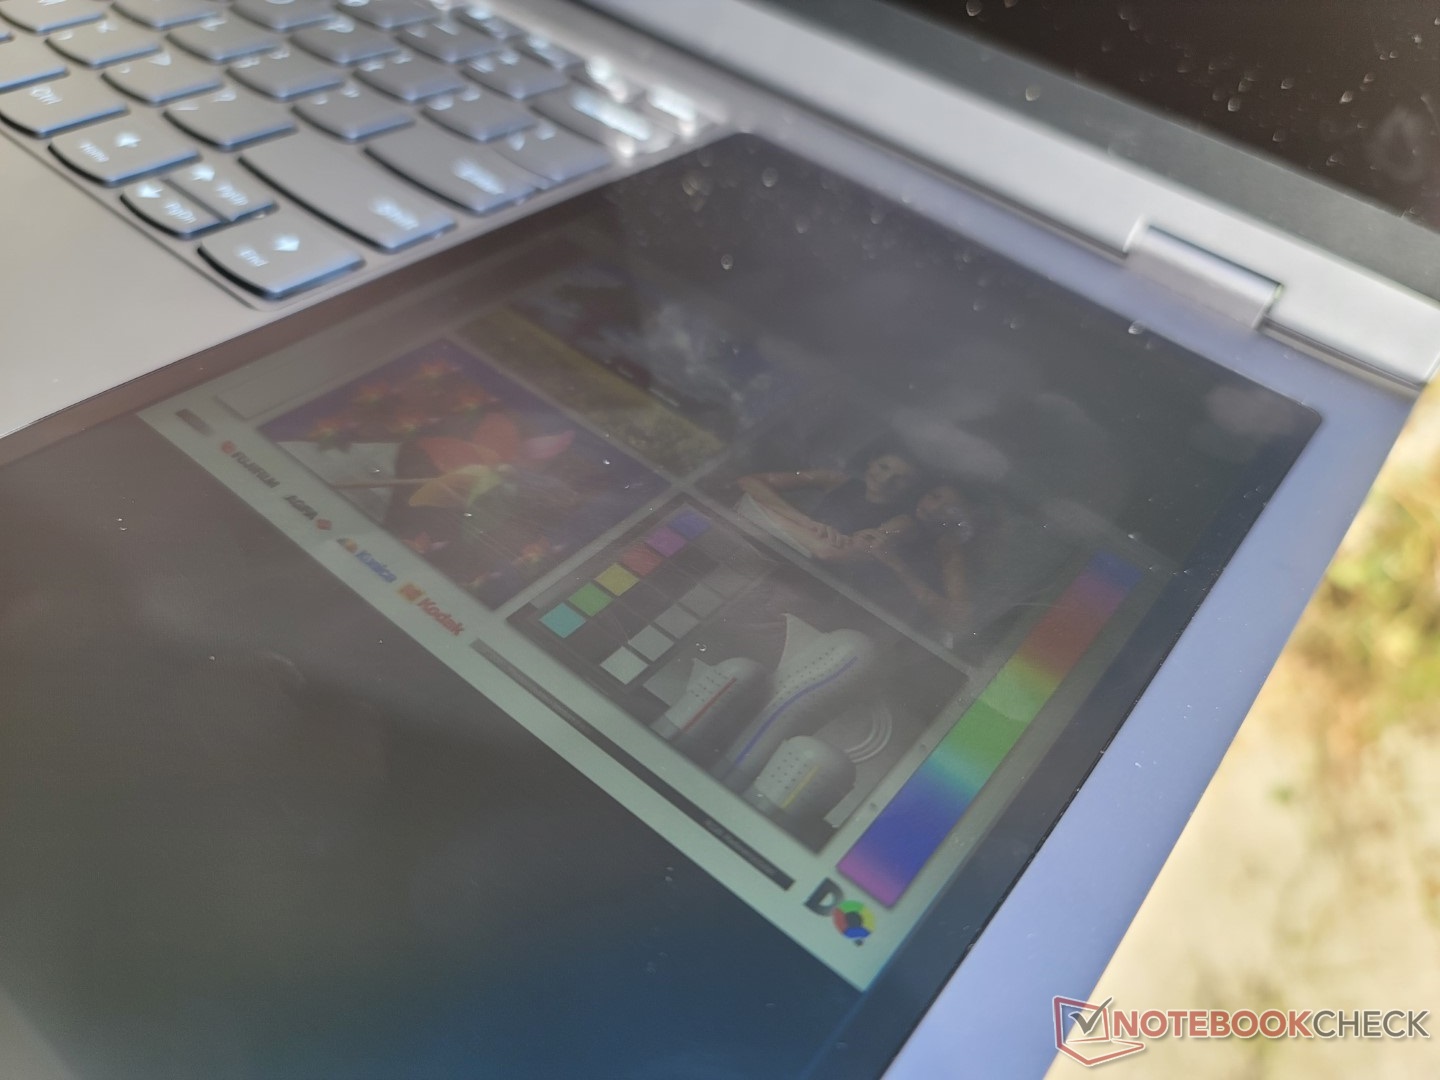
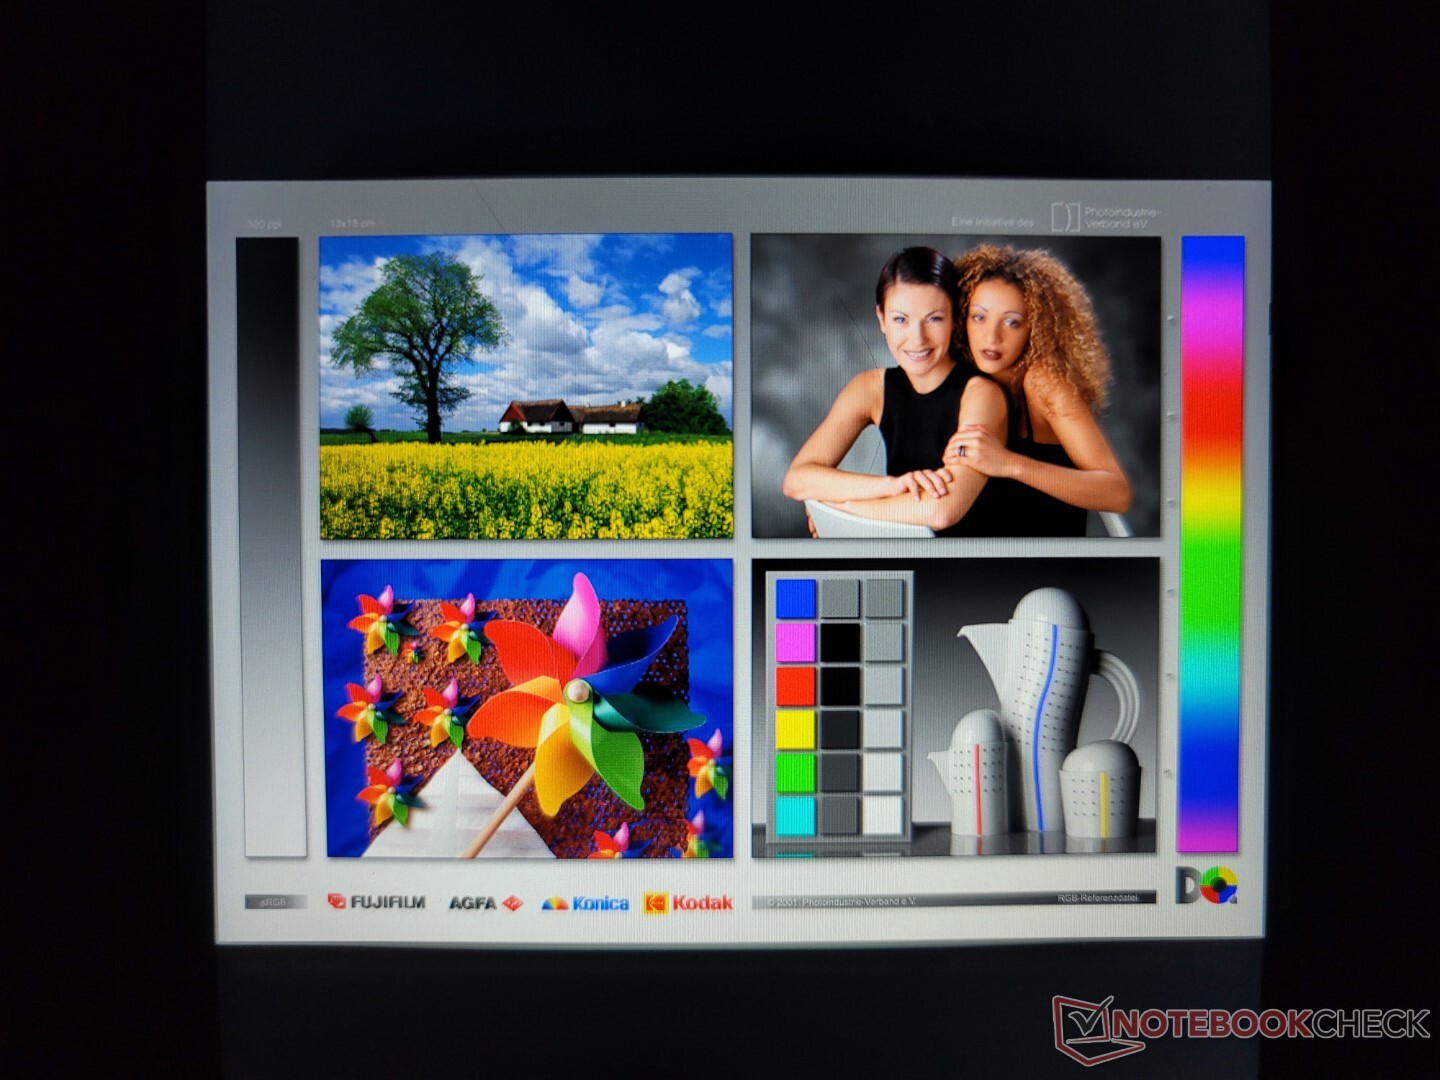
主显示屏 - P3,120赫兹,和IPS 21:10
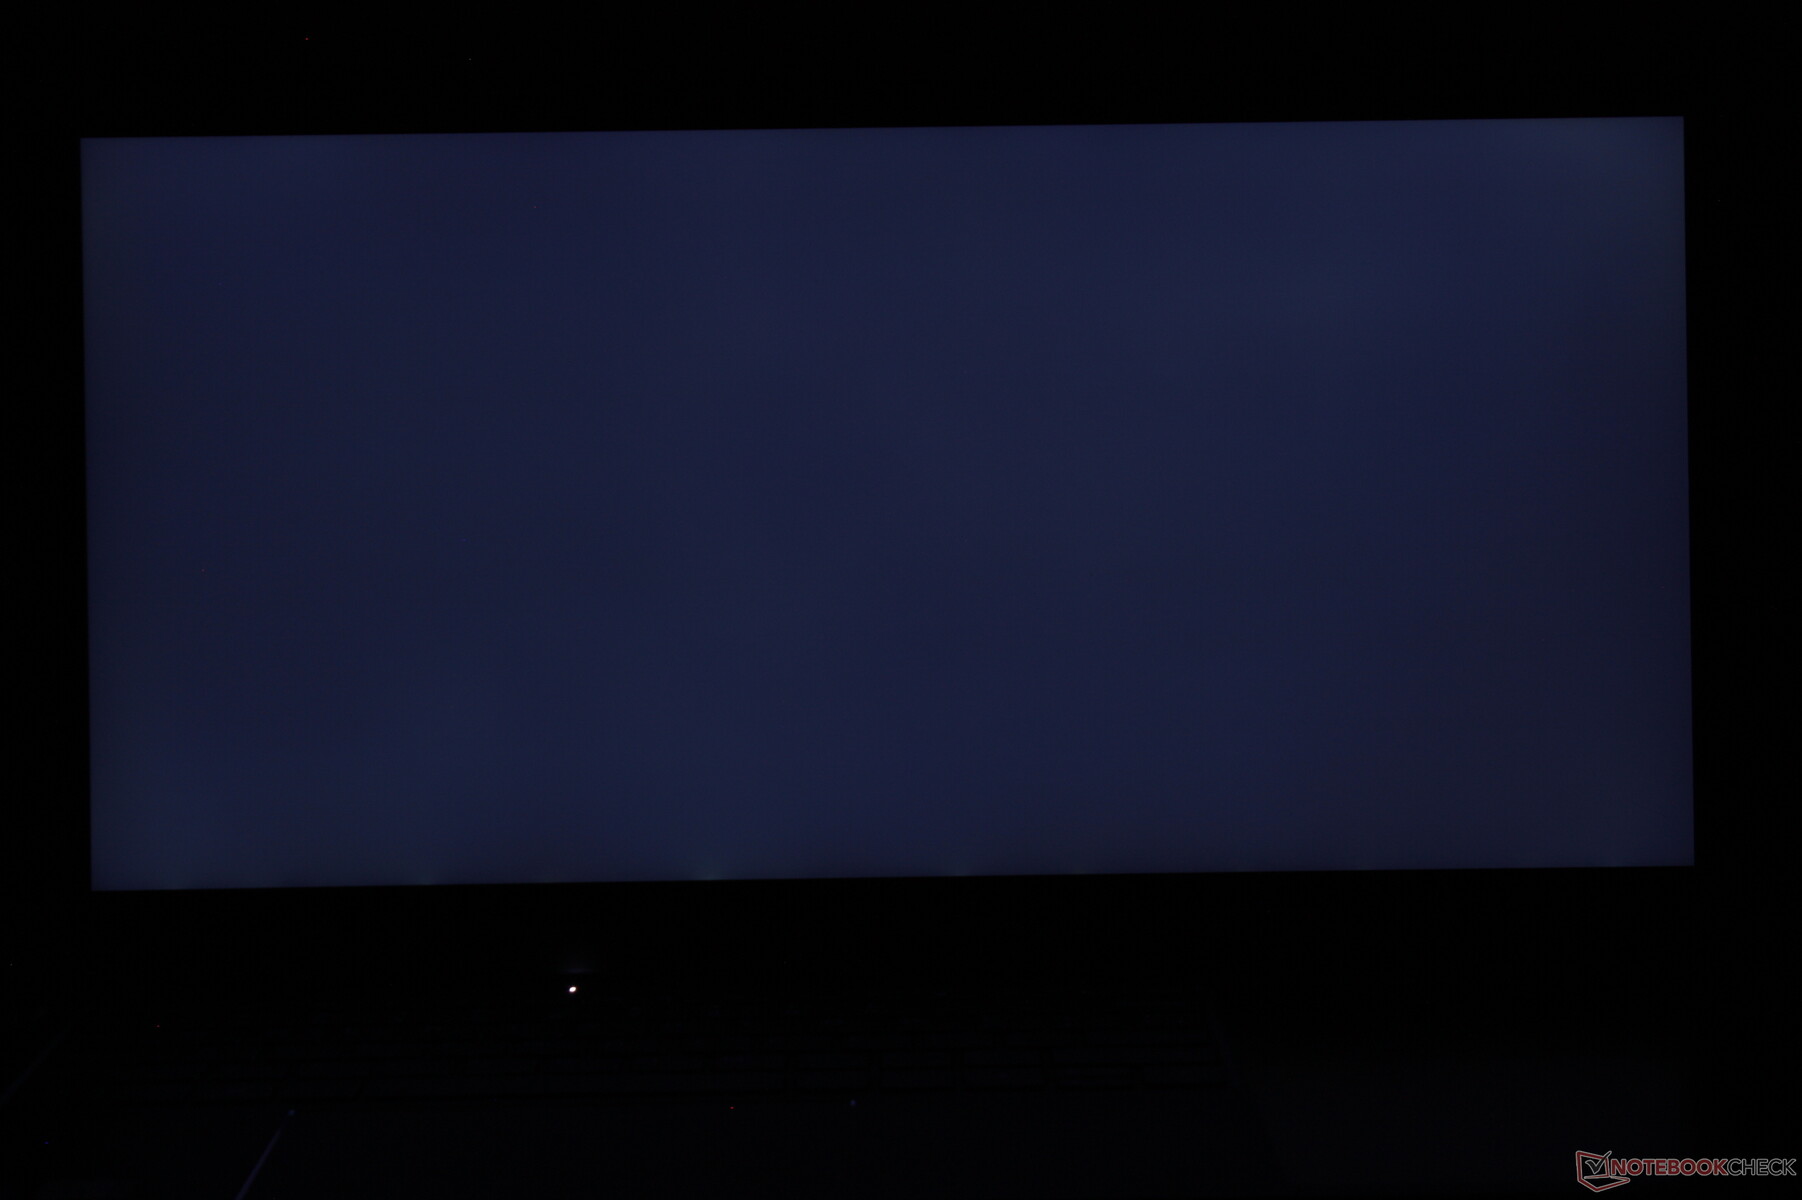
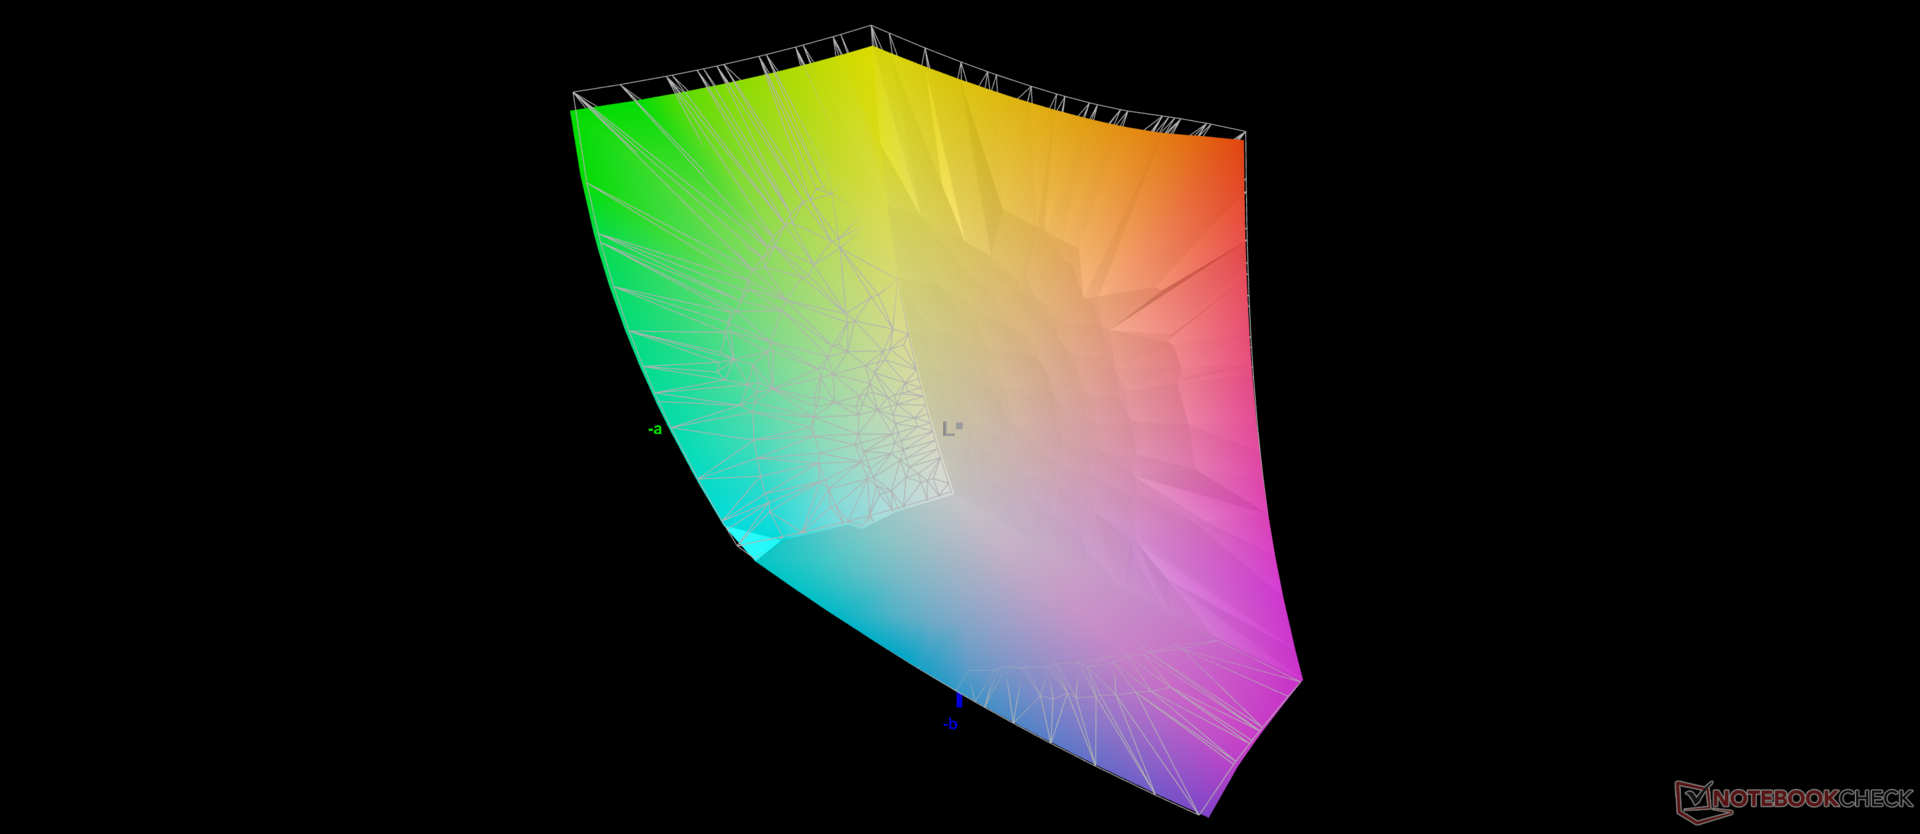
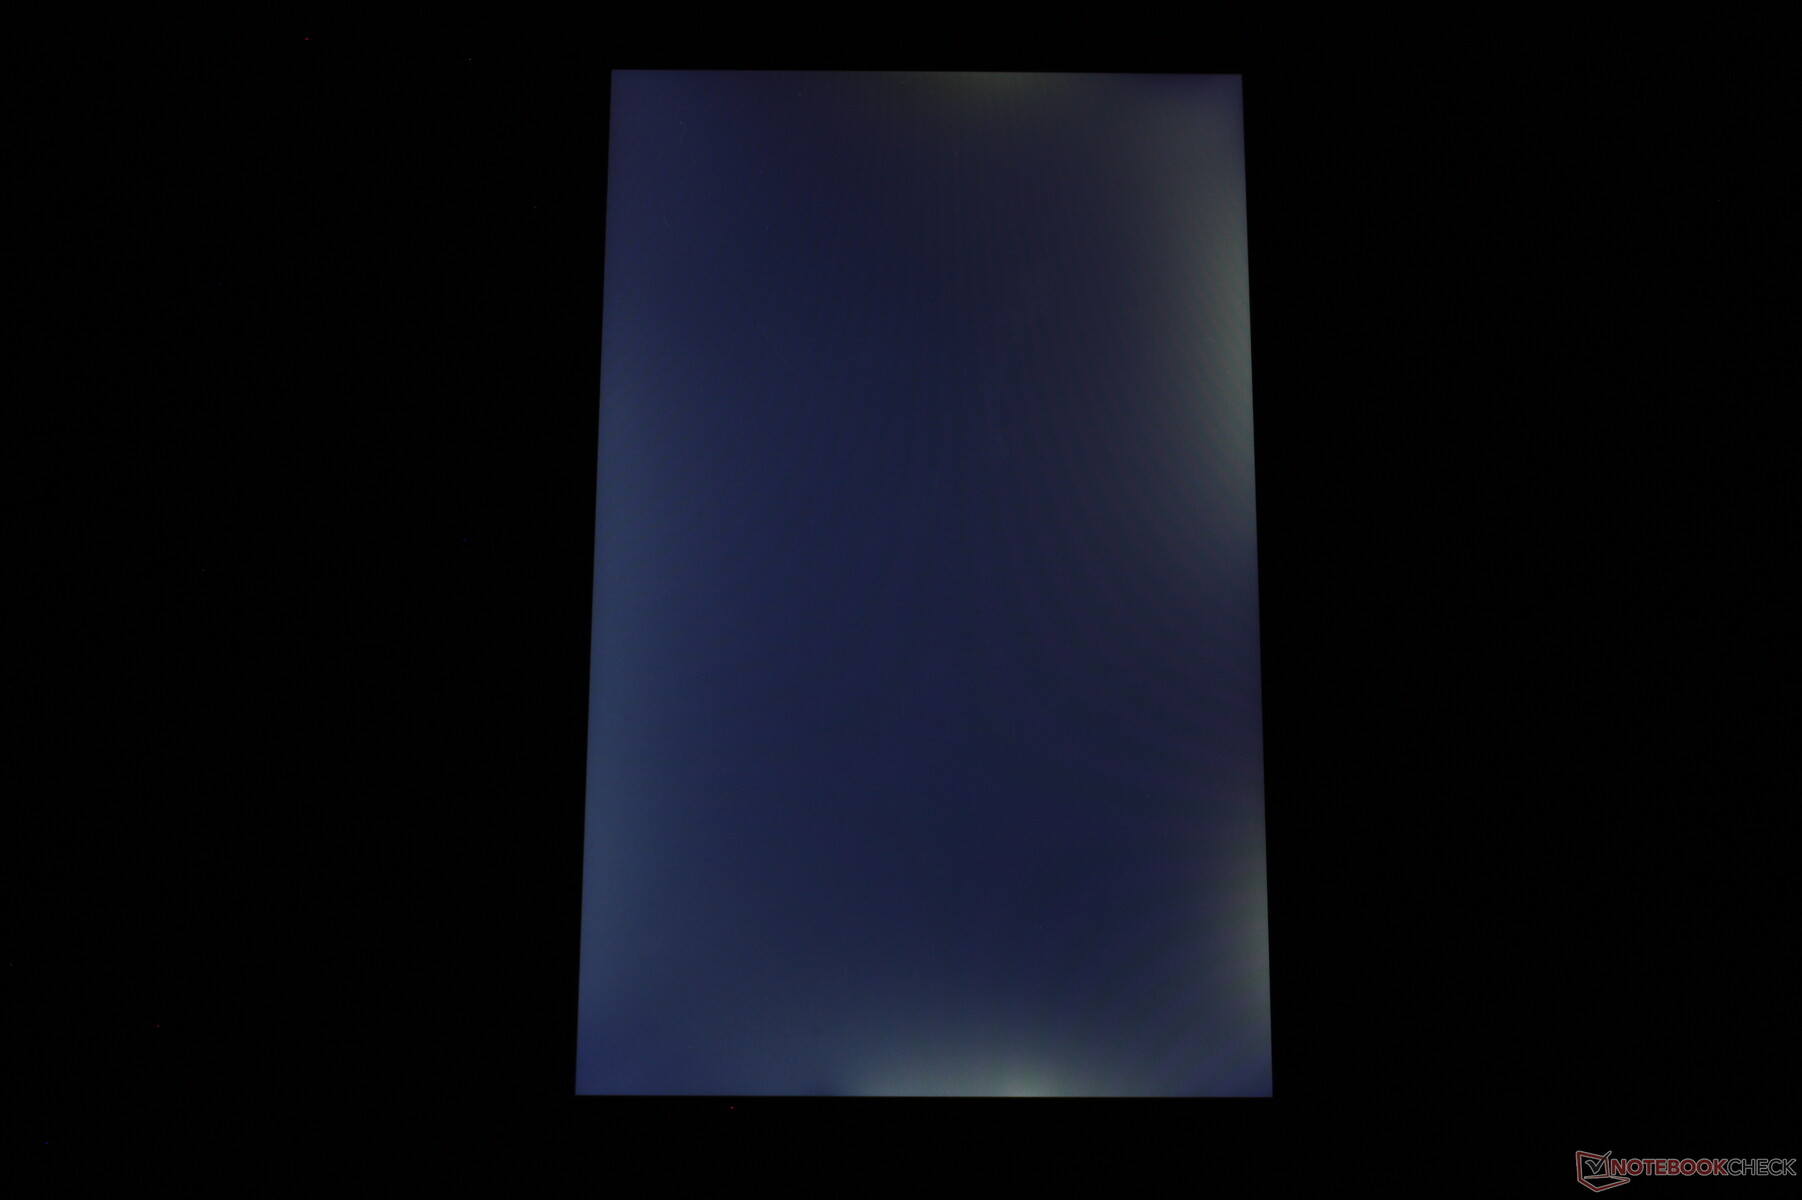
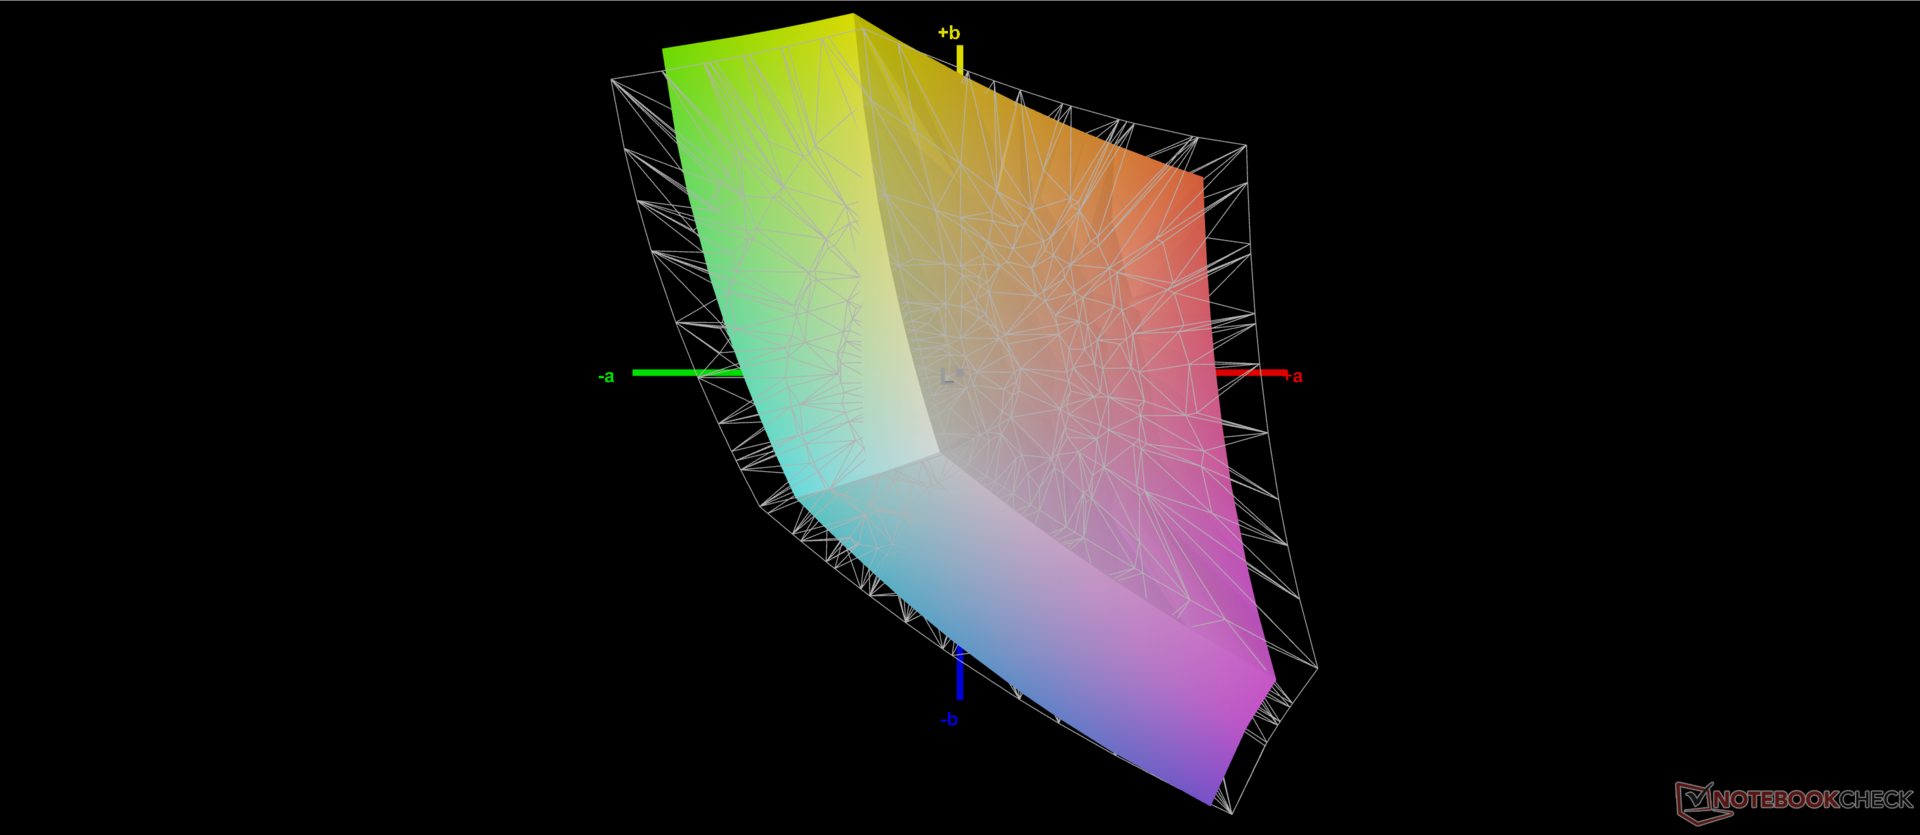
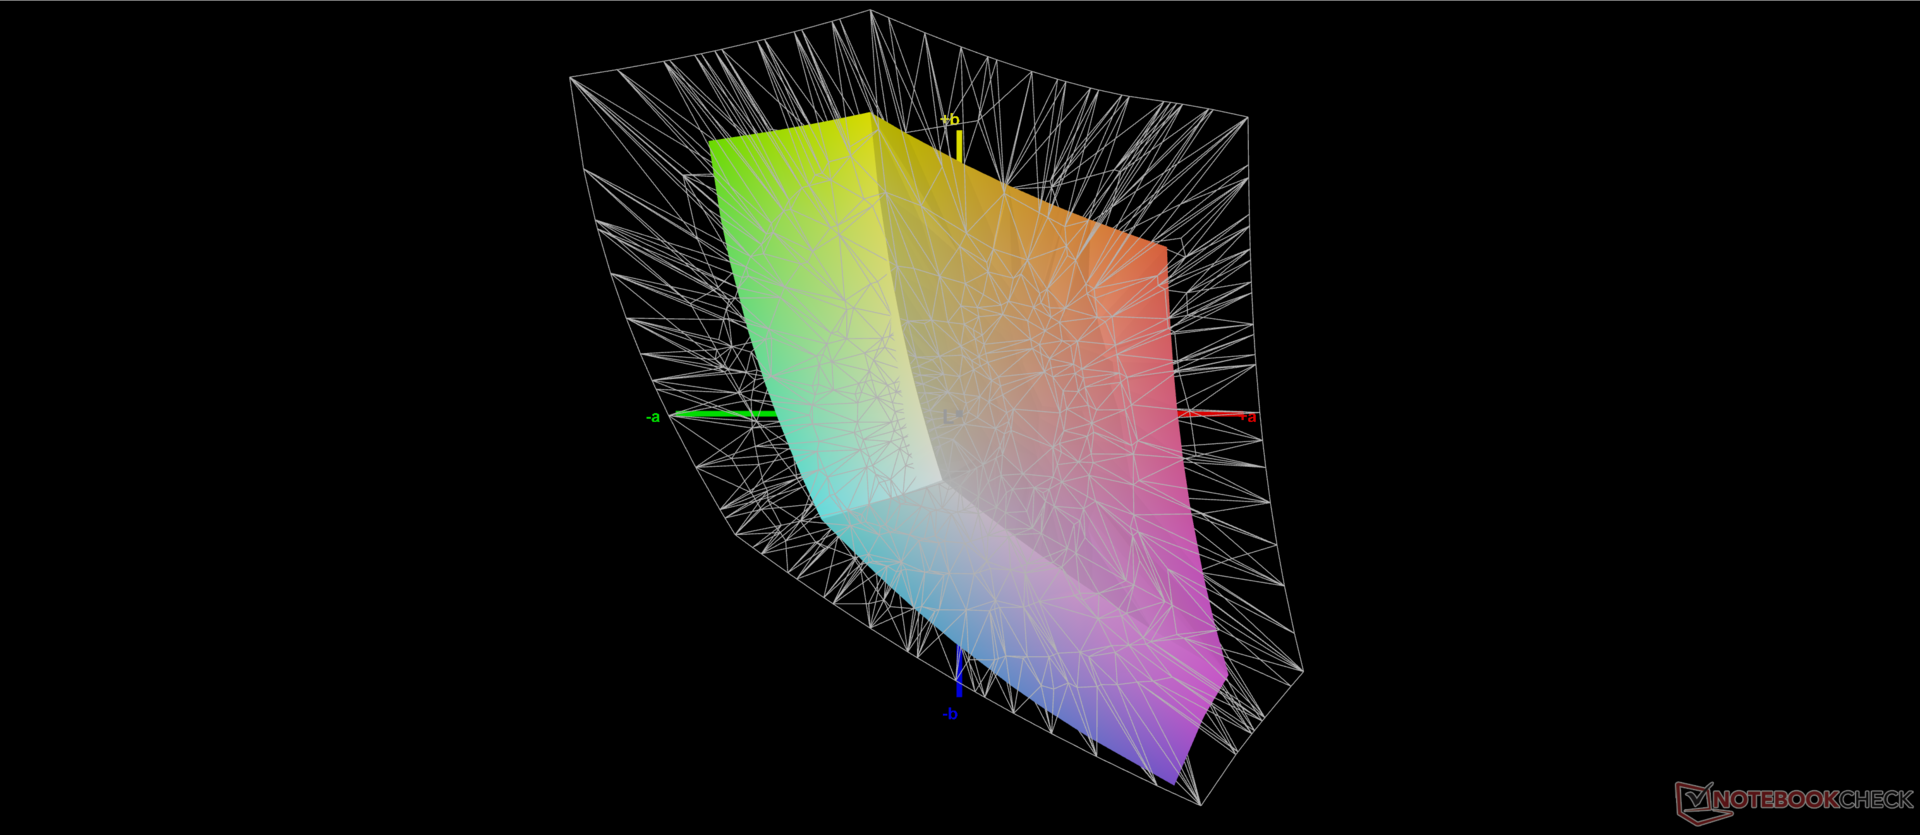
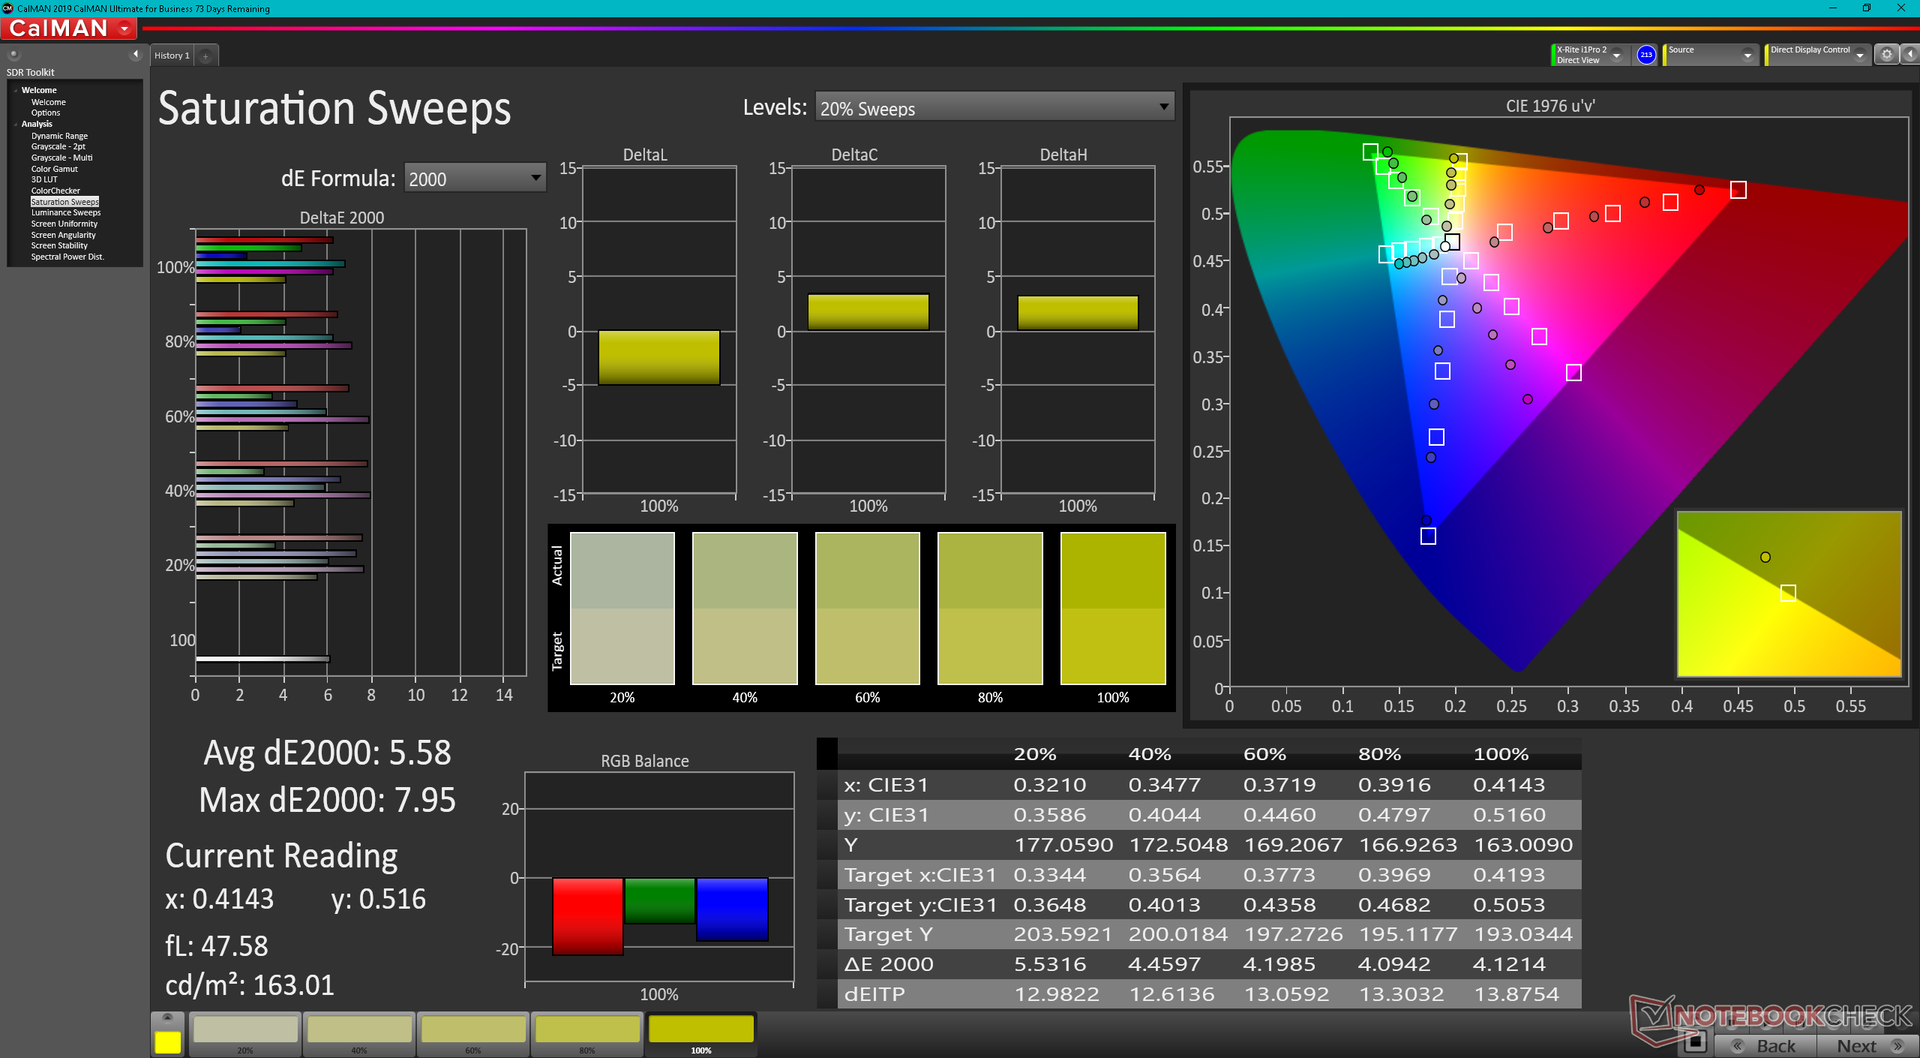
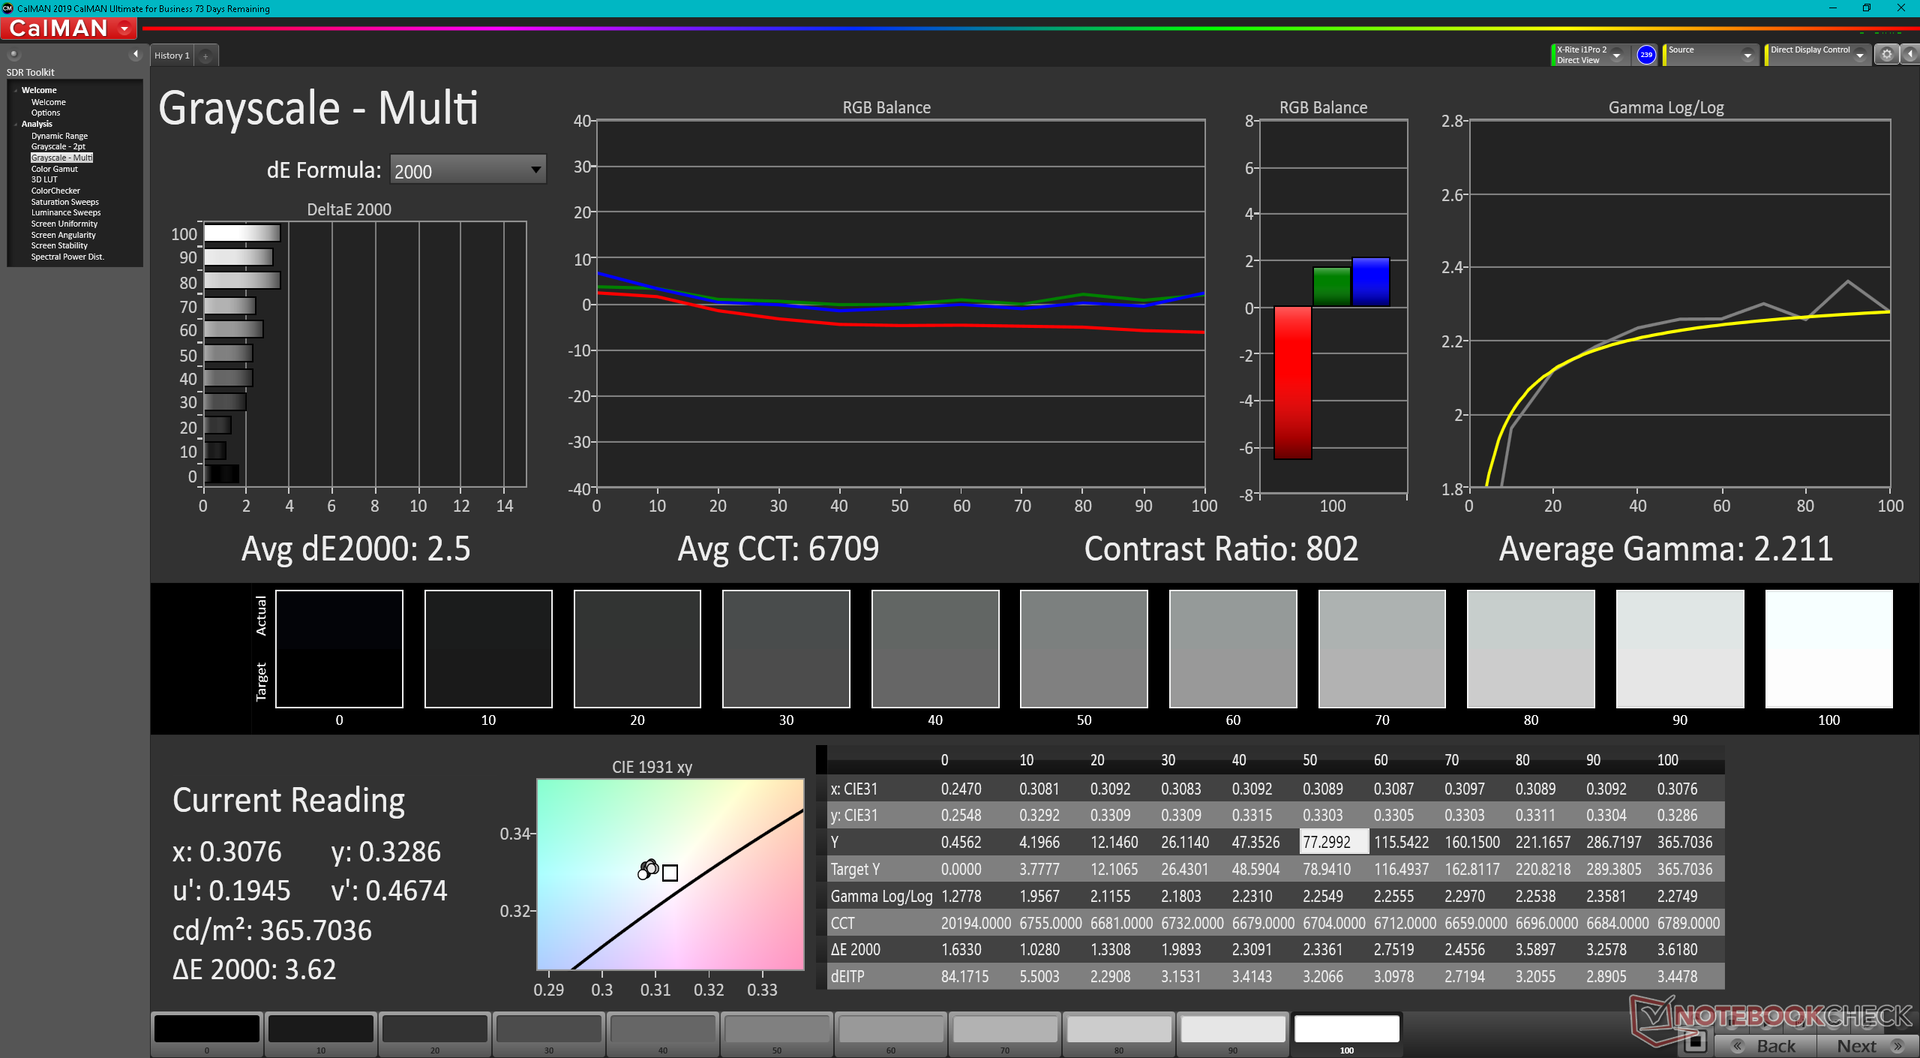
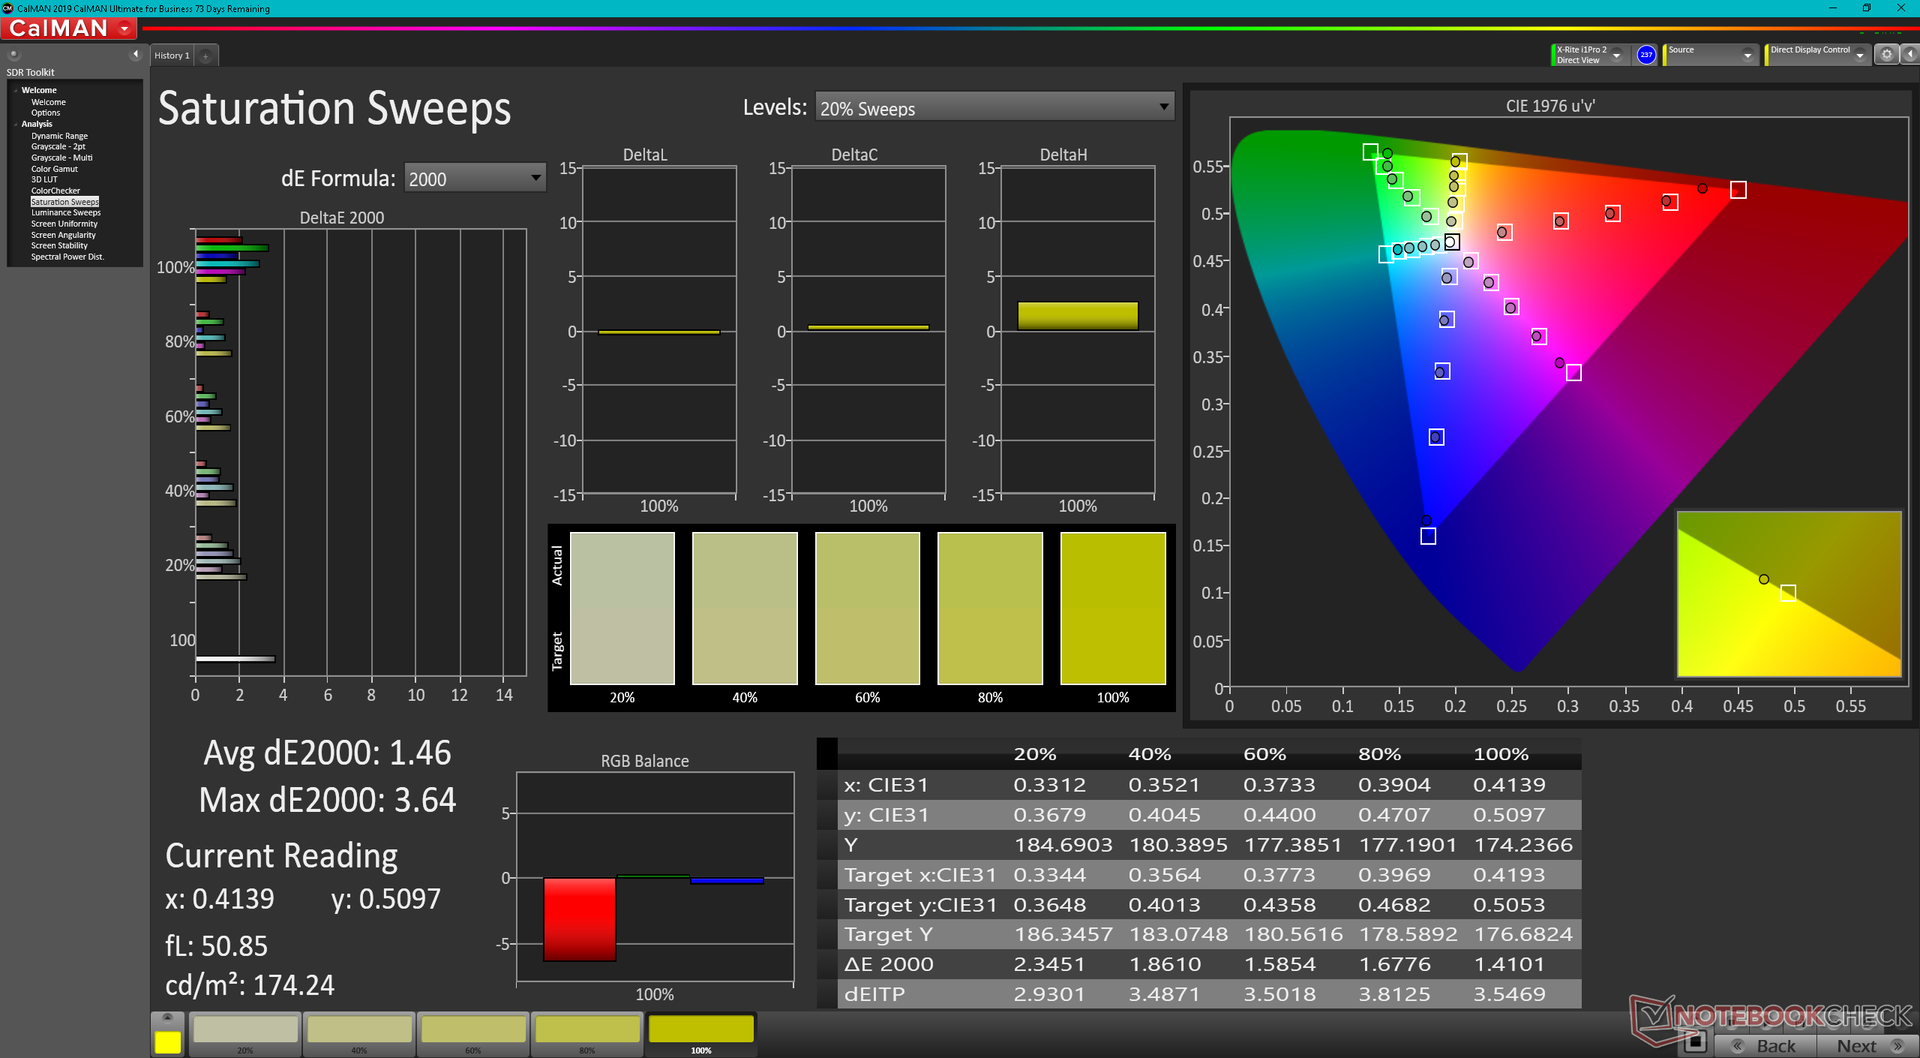
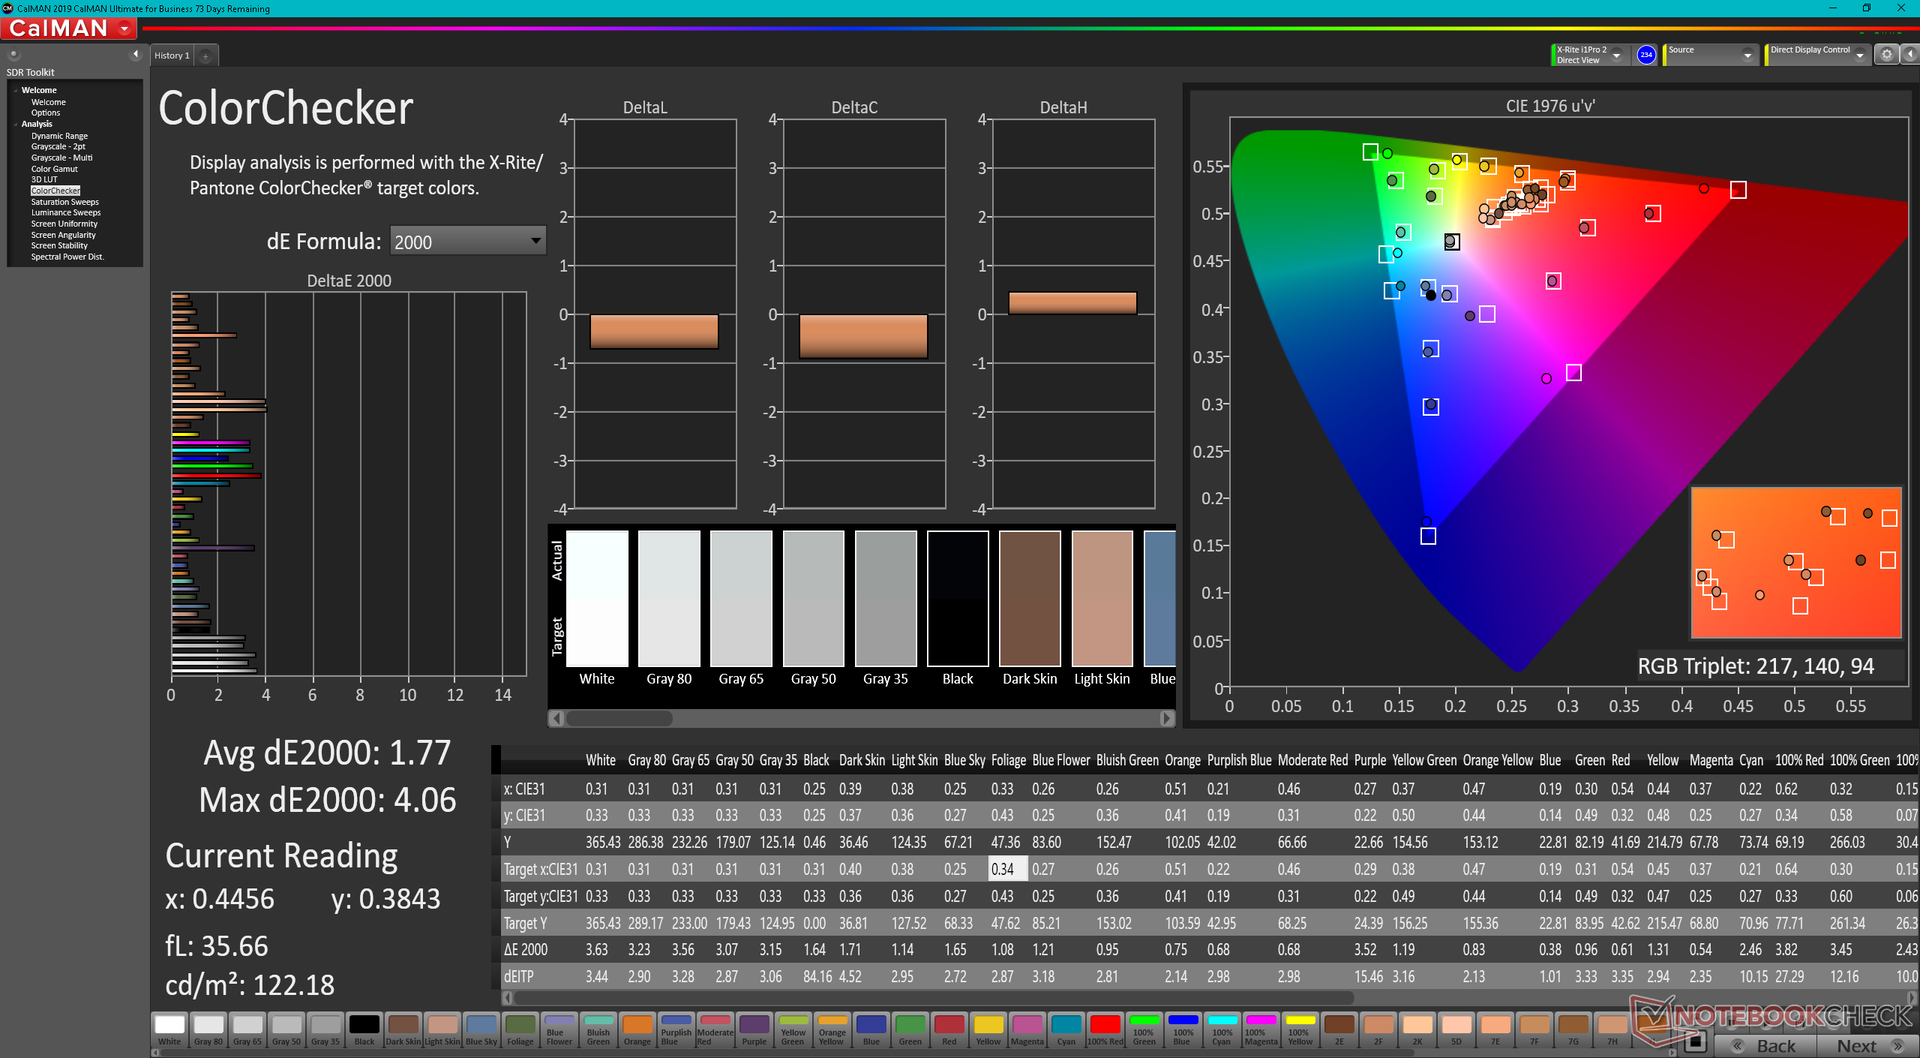
主要的IPS显示屏可能是一个非典型的长宽比,但它带有与大多数其他高端IPS面板相同的特性。1000:1的对比度,相当快的黑白响应时间,快速的120赫兹原生刷新率,以及>95%的P3色彩覆盖率,都使该显示器在图形、编辑以及两者之间的一切方面都有令人惊讶的表现。尤其是颜色和响应时间,分别比ThinkBook Plus 2代的面板更深更快。 ThinkBook Plus第二代而最大亮度保持不变。
| |||||||||||||||||||||||||
Brightness Distribution: 84 %
Center on Battery: 405 cd/m²
Contrast: 1191:1 (Black: 0.34 cd/m²)
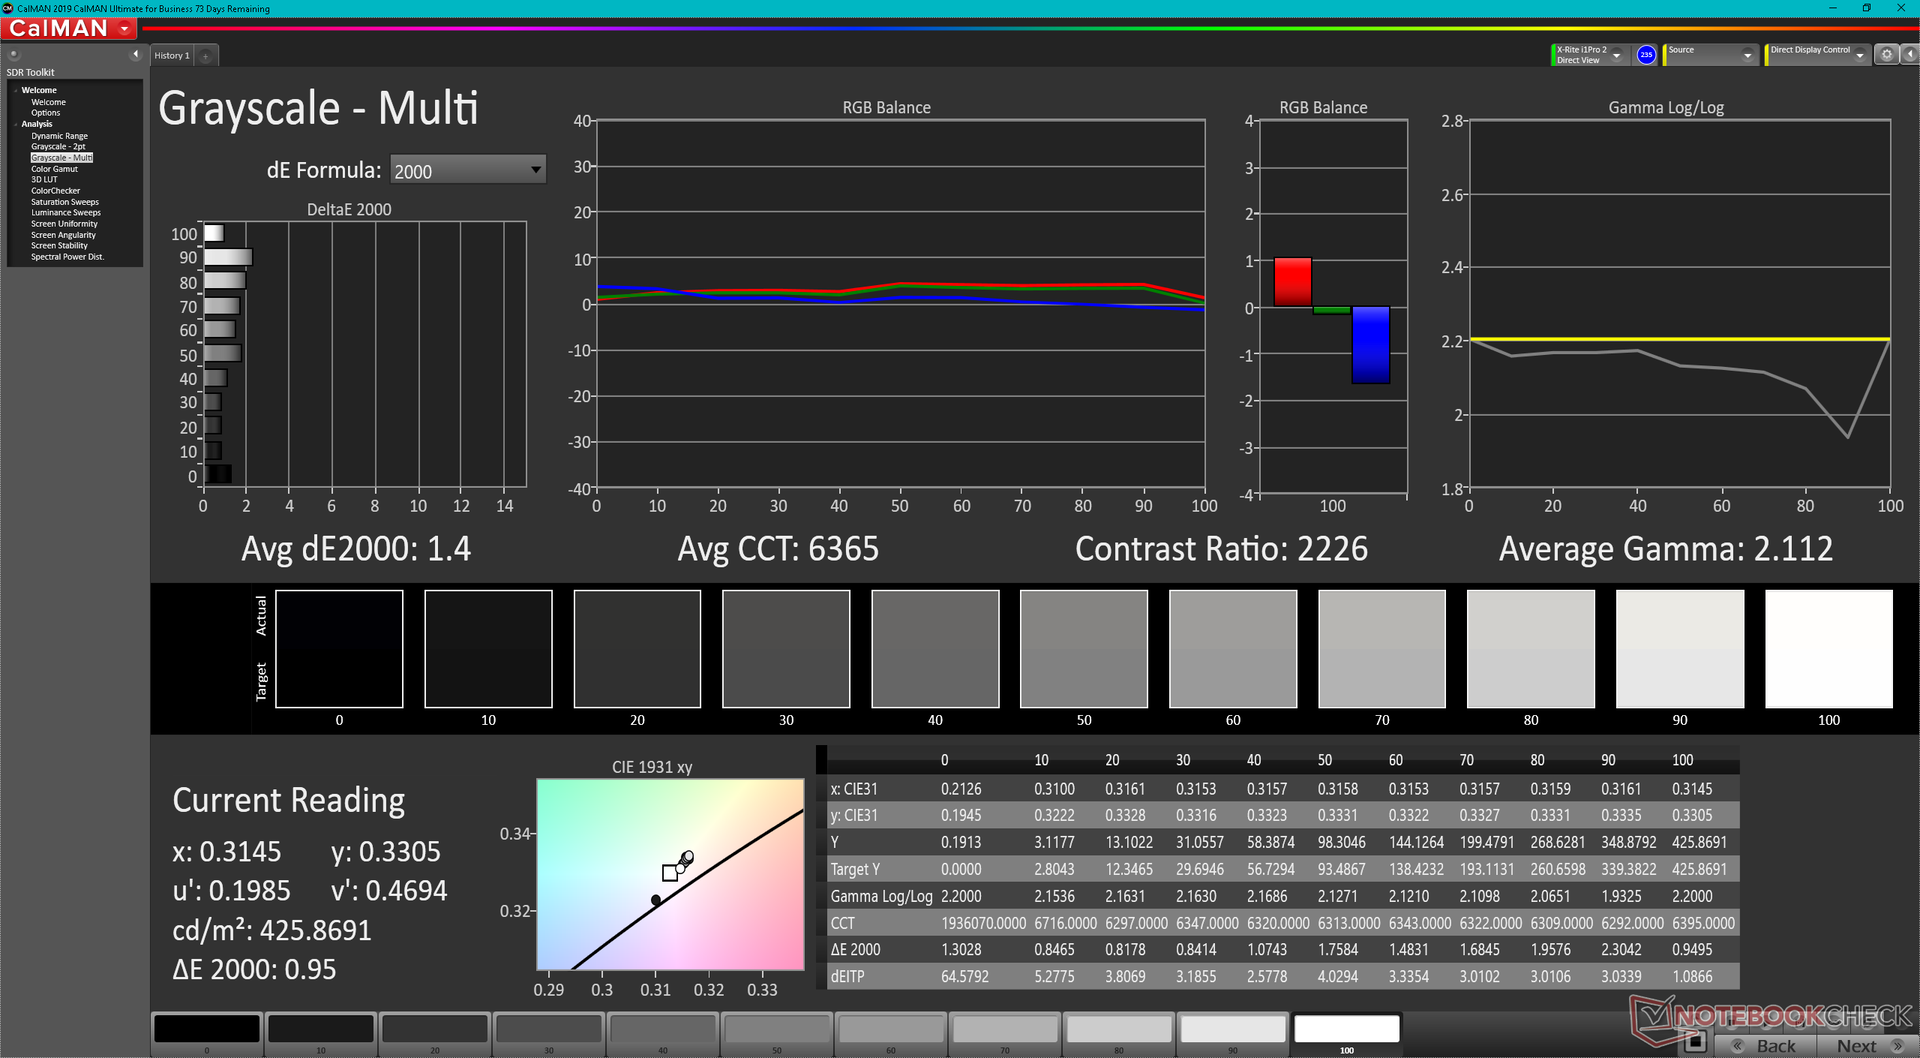
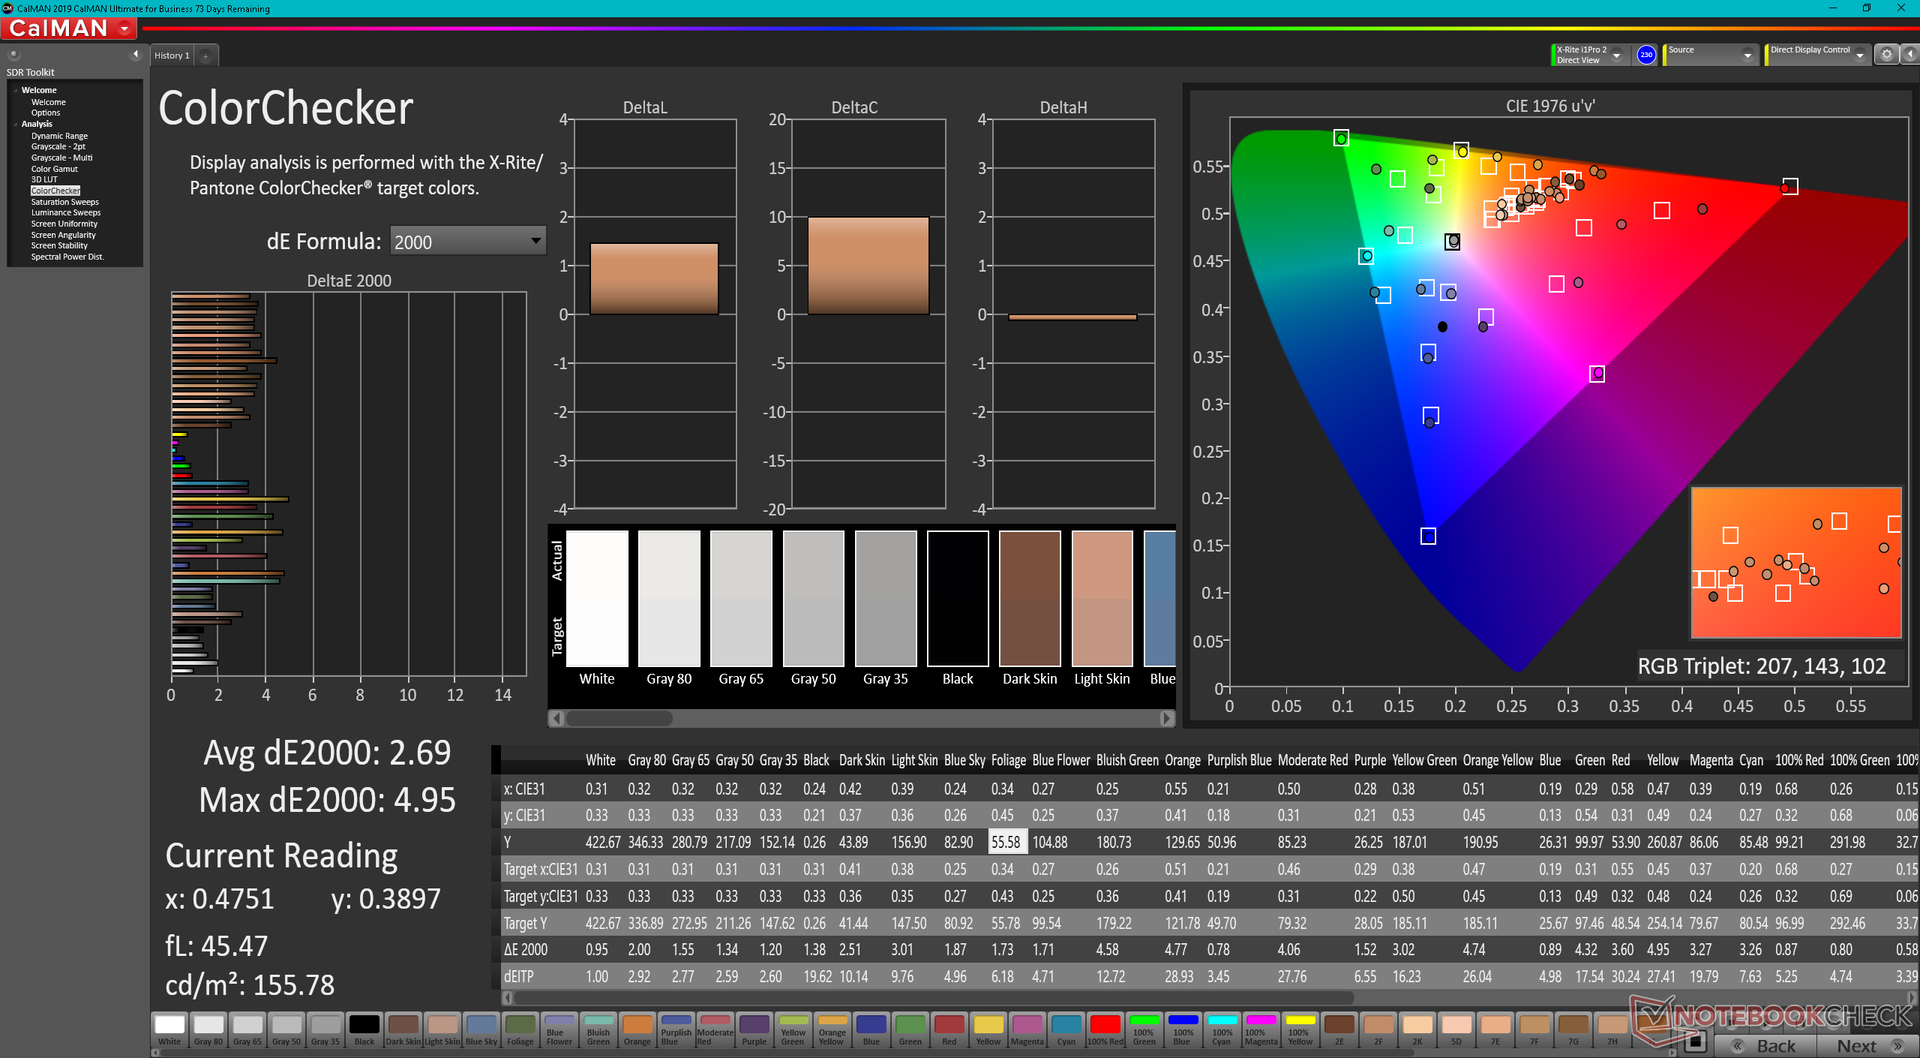
ΔE ColorChecker Calman: 2.69 | ∀{0.5-29.43 Ø4.71}
ΔE Greyscale Calman: 1.4 | ∀{0.09-98 Ø4.96}
87.8% AdobeRGB 1998 (Argyll 3D)
100% sRGB (Argyll 3D)
96.8% Display P3 (Argyll 3D)
Gamma: 2.1
CCT: 6365 K
| Lenovo ThinkBook Plus Gen3 MNH300HB1-1 CSOT T3, IPS, 3072x1440, 17.3" | Lenovo ThinkBook Plus Gen2 Core i5 CSOT T3 MND307DA1-5 (LCD), IPS, E-Ink, 2560x1600, 13.3" | Asus ProArt StudioBook Pro 17 W700G3T 170PUW1-A00, IPS, 1920x1200, 17" | LG Gram 17 (2022) LG Philips LP170WQ1-SPF2, IPS, 2560x1600, 17" | Dell XPS 17 9720 Sharp LQ170R1, IPS, 3840x2400, 17" | Gigabyte Aero 17 HDR YD AU Optronics AUO329B, IPS, 3840x2160, 17.3" | |
|---|---|---|---|---|---|---|
| Display | -16% | -2% | -0% | 4% | 1% | |
| Display P3 Coverage (%) | 96.8 | 70.1 -28% | 96.2 -1% | 98.1 1% | 94.8 -2% | 86.9 -10% |
| sRGB Coverage (%) | 100 | 98 -2% | 99.8 0% | 99.9 0% | 100 0% | 100 0% |
| AdobeRGB 1998 Coverage (%) | 87.8 | 72.2 -18% | 84.7 -4% | 85.9 -2% | 100 14% | 99.6 13% |
| Response Times | -44% | -45% | -28% | -64% | -56% | |
| Response Time Grey 50% / Grey 80% * (ms) | 28 ? | 42.8 ? -53% | 41.2 ? -47% | 46 ? -64% | 53.2 ? -90% | 52 ? -86% |
| Response Time Black / White * (ms) | 20.8 ? | 28 ? -35% | 29.6 ? -42% | 19 ? 9% | 28.4 ? -37% | 26 ? -25% |
| PWM Frequency (Hz) | 17990 ? | |||||
| Screen | -17% | 9% | -28% | -18% | 20% | |
| Brightness middle (cd/m²) | 405 | 404 0% | 323 -20% | 400 -1% | 438 8% | 488 20% |
| Brightness (cd/m²) | 389 | 388 0% | 308 -21% | 353 -9% | 411 6% | 467 20% |
| Brightness Distribution (%) | 84 | 94 12% | 88 5% | 81 -4% | 86 2% | 86 2% |
| Black Level * (cd/m²) | 0.34 | 0.24 29% | 0.36 -6% | 0.3 12% | 0.27 21% | 0.33 3% |
| Contrast (:1) | 1191 | 1683 41% | 897 -25% | 1333 12% | 1622 36% | 1479 24% |
| Colorchecker dE 2000 * | 2.69 | 3.1 -15% | 1.1 59% | 3.15 -17% | 2.5 7% | 1.23 54% |
| Colorchecker dE 2000 max. * | 4.95 | 6.9 -39% | 3.3 33% | 6.54 -32% | 6.3 -27% | 2.94 41% |
| Greyscale dE 2000 * | 1.4 | 3.7 -164% | 0.8 43% | 4 -186% | 4.2 -200% | 1.5 -7% |
| Gamma | 2.1 105% | 2.26 97% | 2.23 99% | 2.14 103% | 2.22 99% | 2.169 101% |
| CCT | 6365 102% | 5936 110% | 6479 100% | 7278 89% | 7034 92% | 6614 98% |
| Colorchecker dE 2000 calibrated * | 1.3 | 0.8 | 1.44 | 0.8 | 0.77 | |
| Color Space (Percent of AdobeRGB 1998) (%) | 75.7 | 99 | ||||
| Color Space (Percent of sRGB) (%) | 99.8 | 99 | ||||
| Total Average (Program / Settings) | -26% /
-21% | -13% /
-2% | -19% /
-22% | -26% /
-20% | -12% /
4% |
* ... smaller is better

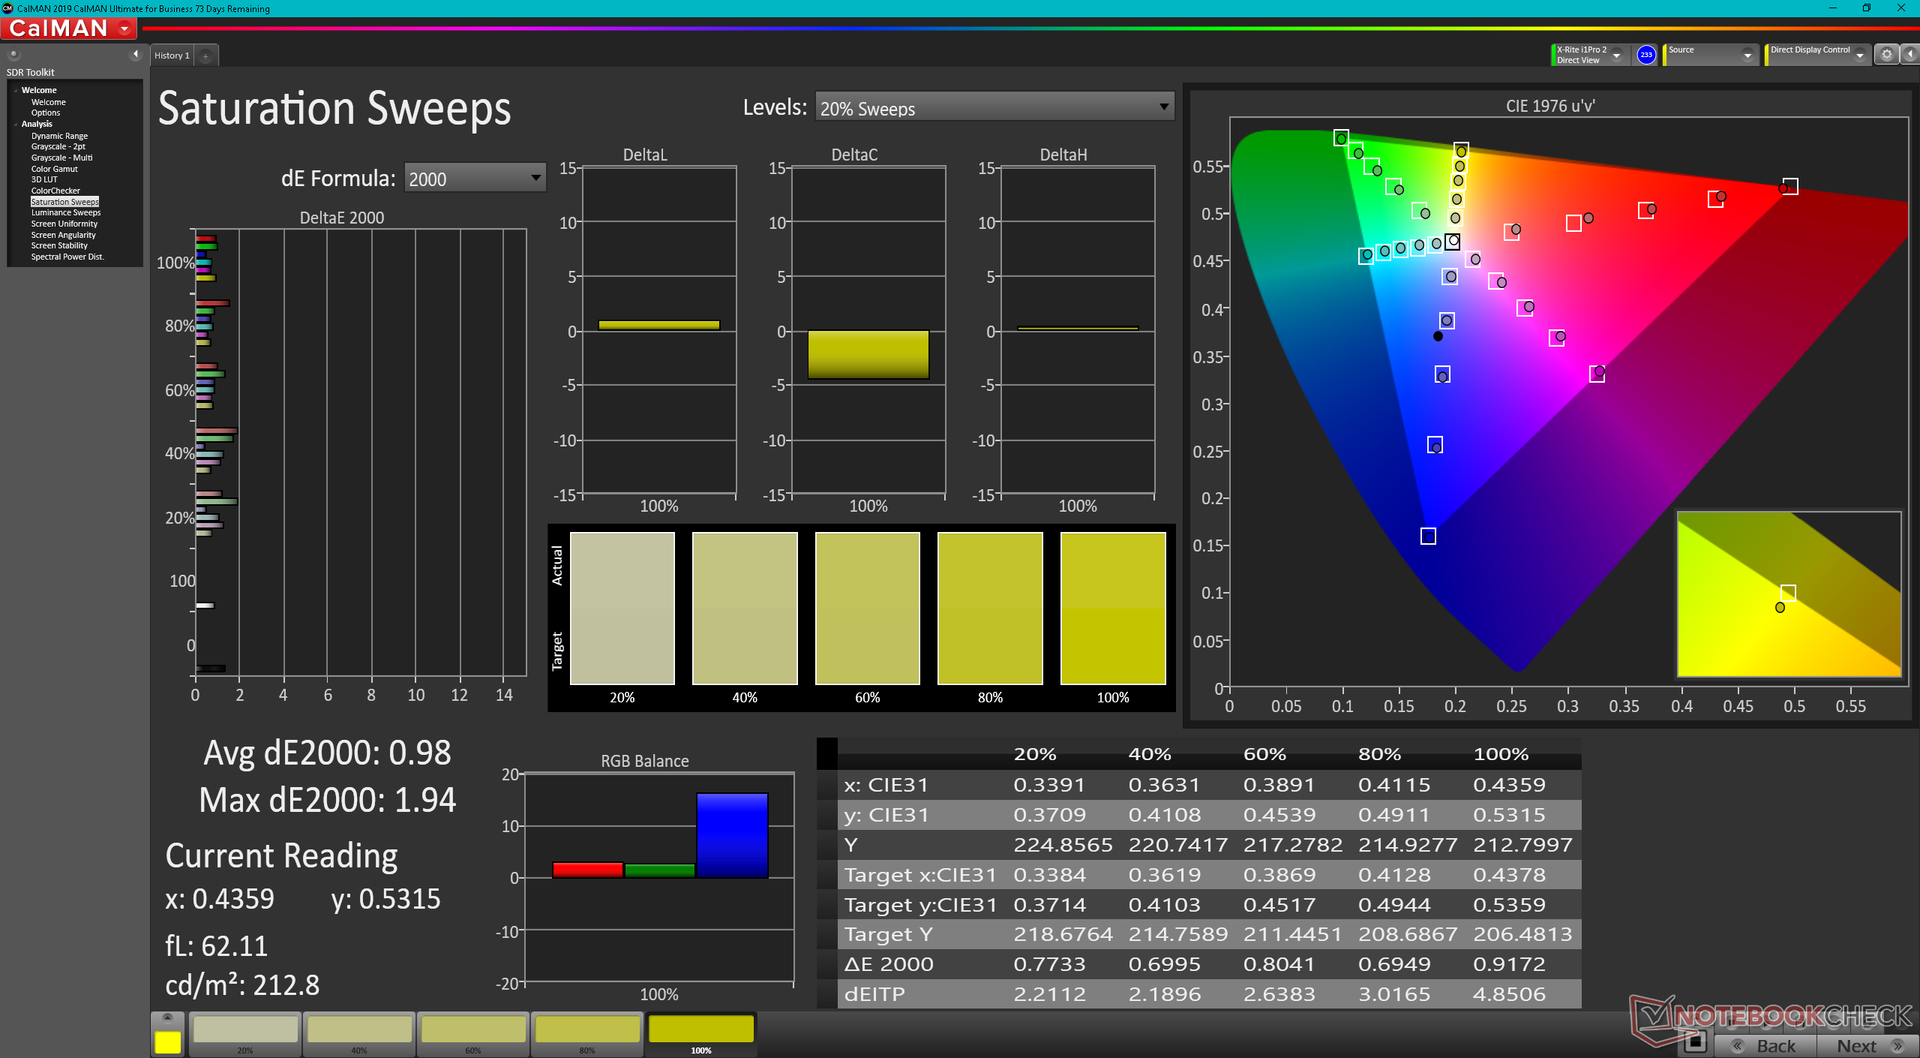
该显示器在开箱时就根据P3标准进行了很好的校准,平均灰度和彩色DeltaE值分别只有1.4和2.69。终端用户校准是没有必要的。
Display Response Times
| ↔ Response Time Black to White | ||
|---|---|---|
| 20.8 ms ... rise ↗ and fall ↘ combined | ↗ 10.8 ms rise |  |
| ↘ 10 ms fall | ||
| The screen shows good response rates in our tests, but may be too slow for competitive gamers. In comparison, all tested devices range from 0.1 (minimum) to 240 (maximum) ms. » 46 % of all devices are better. This means that the measured response time is similar to the average of all tested devices (19.8 ms). | ||
| ↔ Response Time 50% Grey to 80% Grey | ||
| 28 ms ... rise ↗ and fall ↘ combined | ↗ 13.2 ms rise |  |
| ↘ 14.8 ms fall | ||
| The screen shows relatively slow response rates in our tests and may be too slow for gamers. In comparison, all tested devices range from 0.165 (minimum) to 636 (maximum) ms. » 38 % of all devices are better. This means that the measured response time is similar to the average of all tested devices (30.9 ms). | ||
Screen Flickering / PWM (Pulse-Width Modulation)
| Screen flickering / PWM not detected |  | ||
In comparison: 52 % of all tested devices do not use PWM to dim the display. If PWM was detected, an average of 7741 (minimum: 5 - maximum: 343500) Hz was measured. | |||
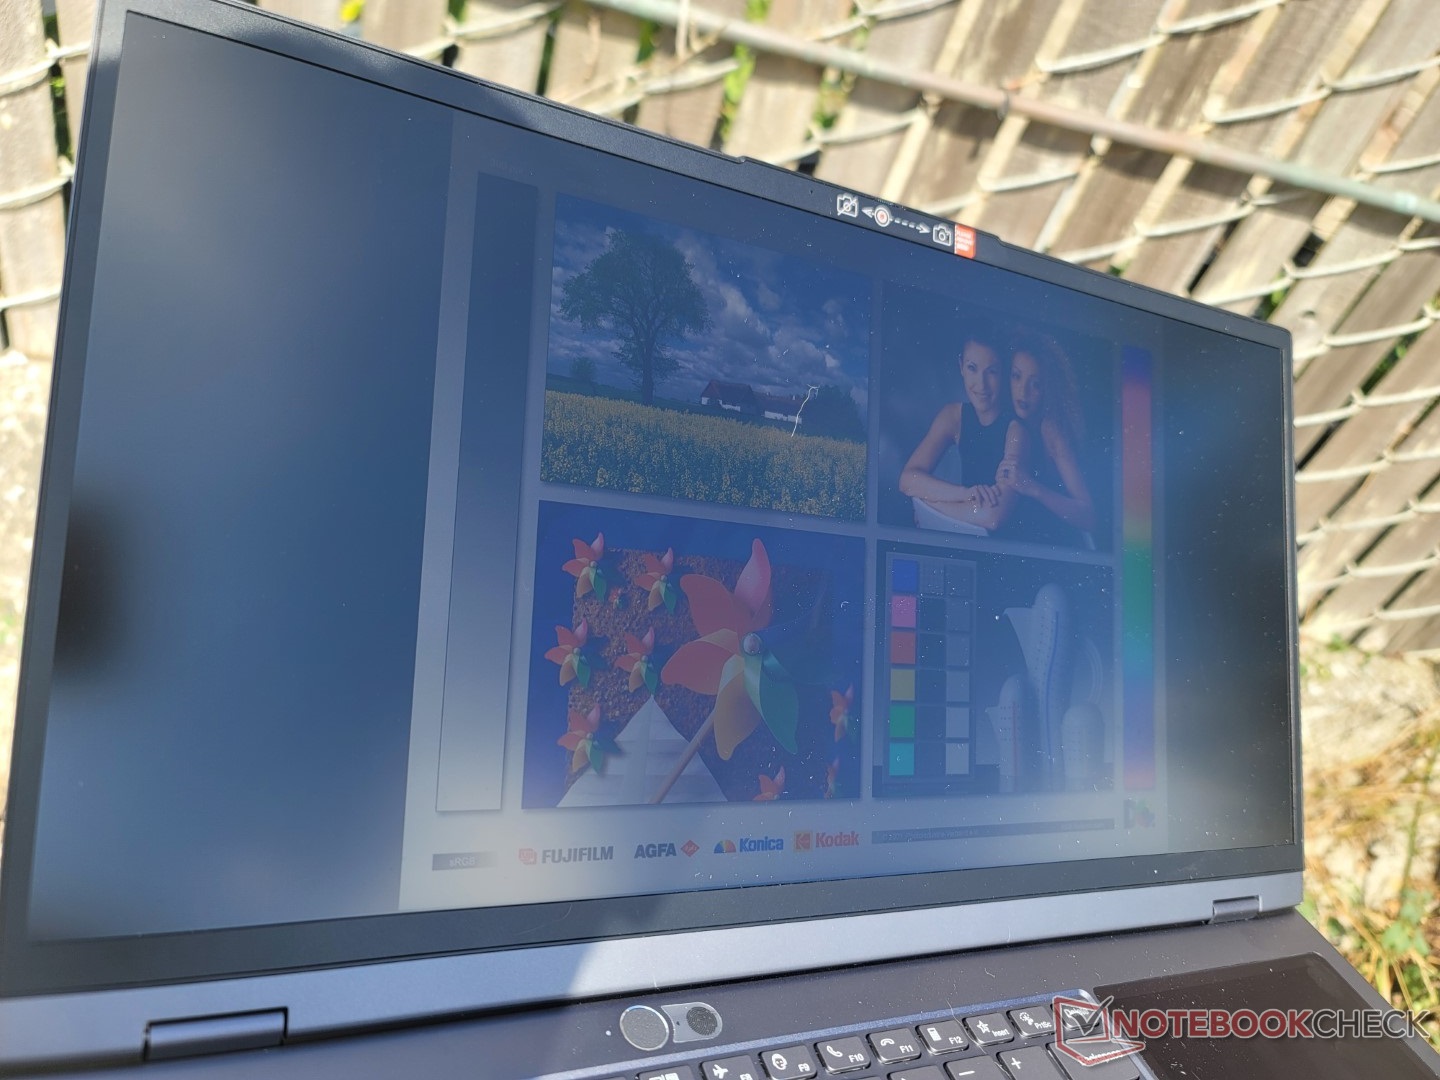
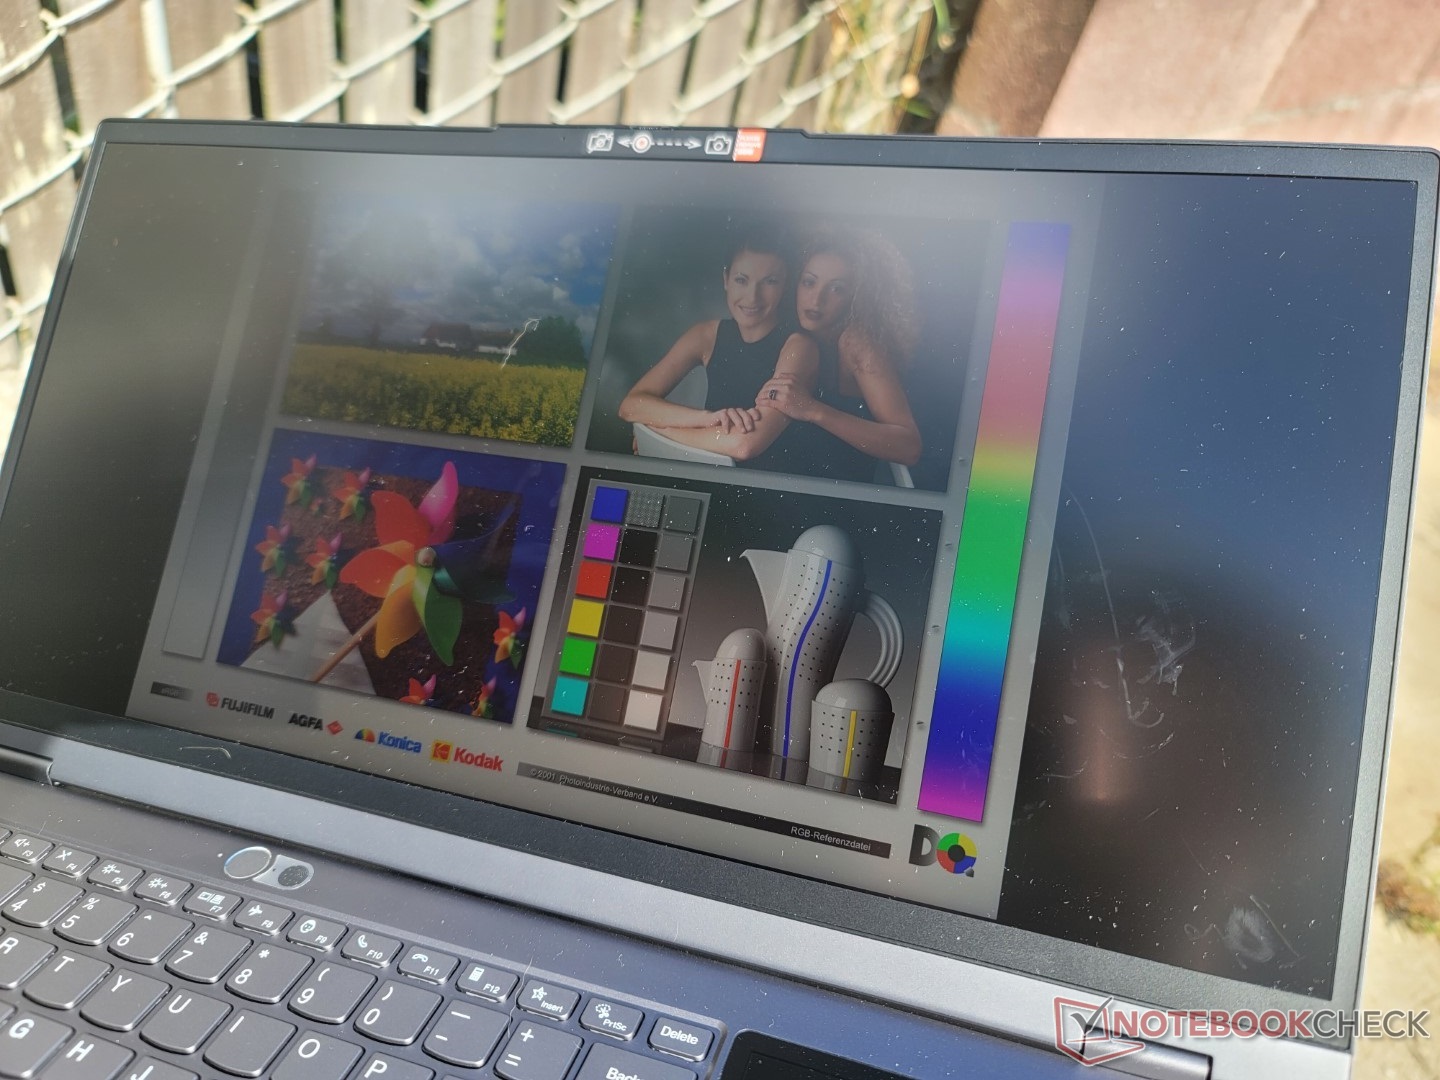
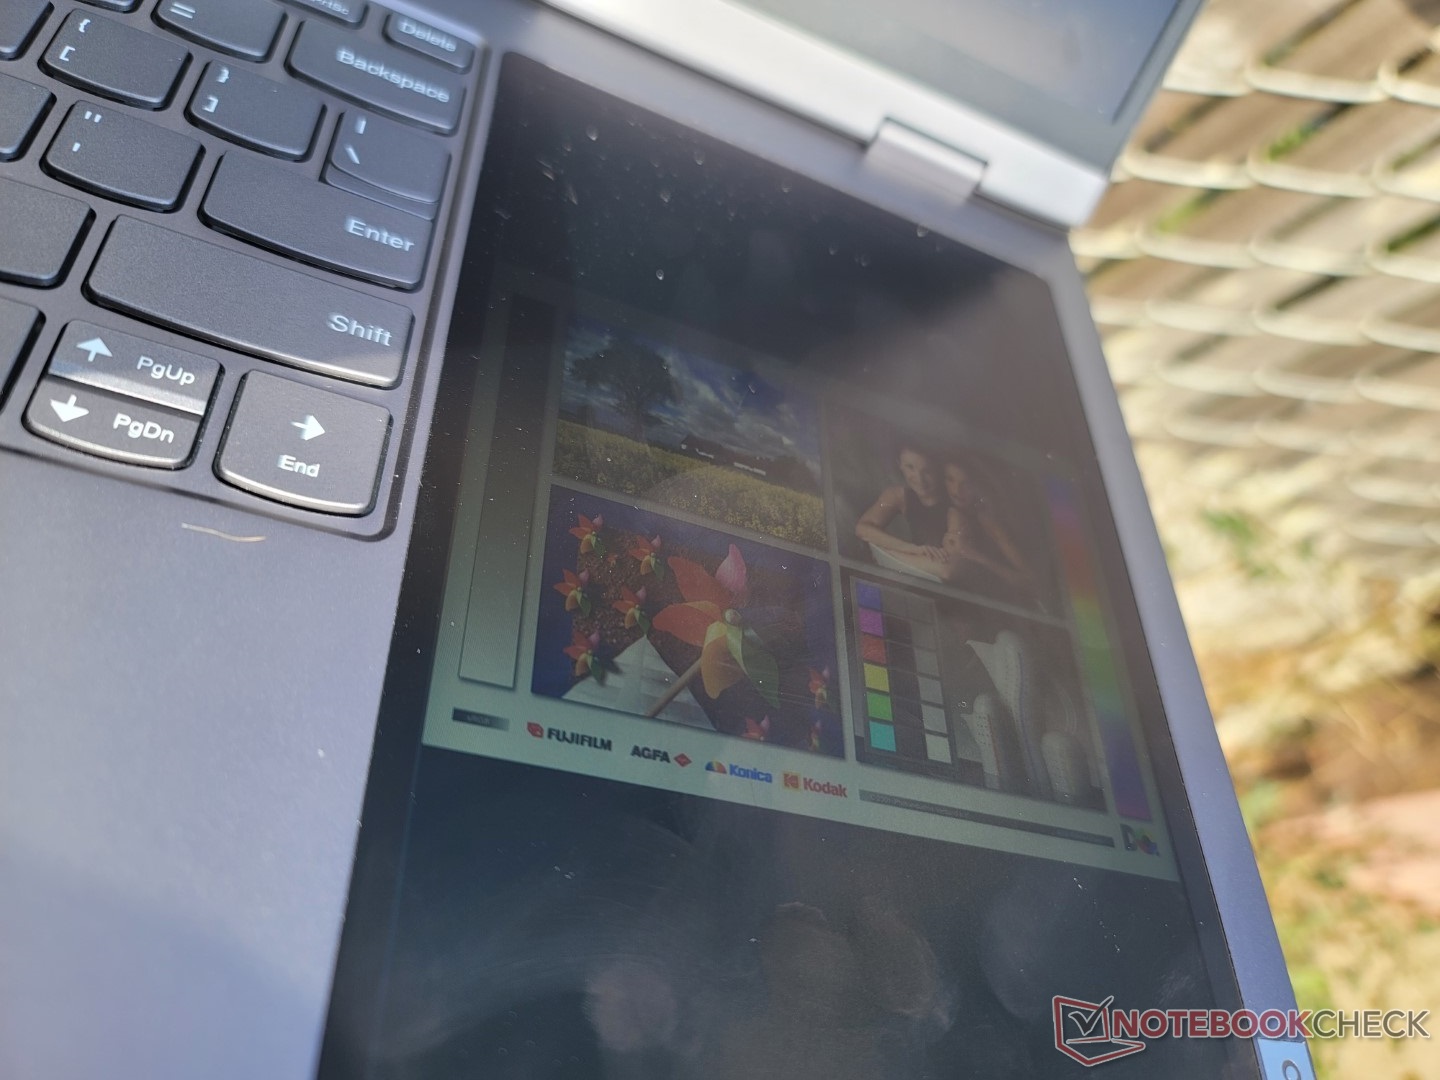
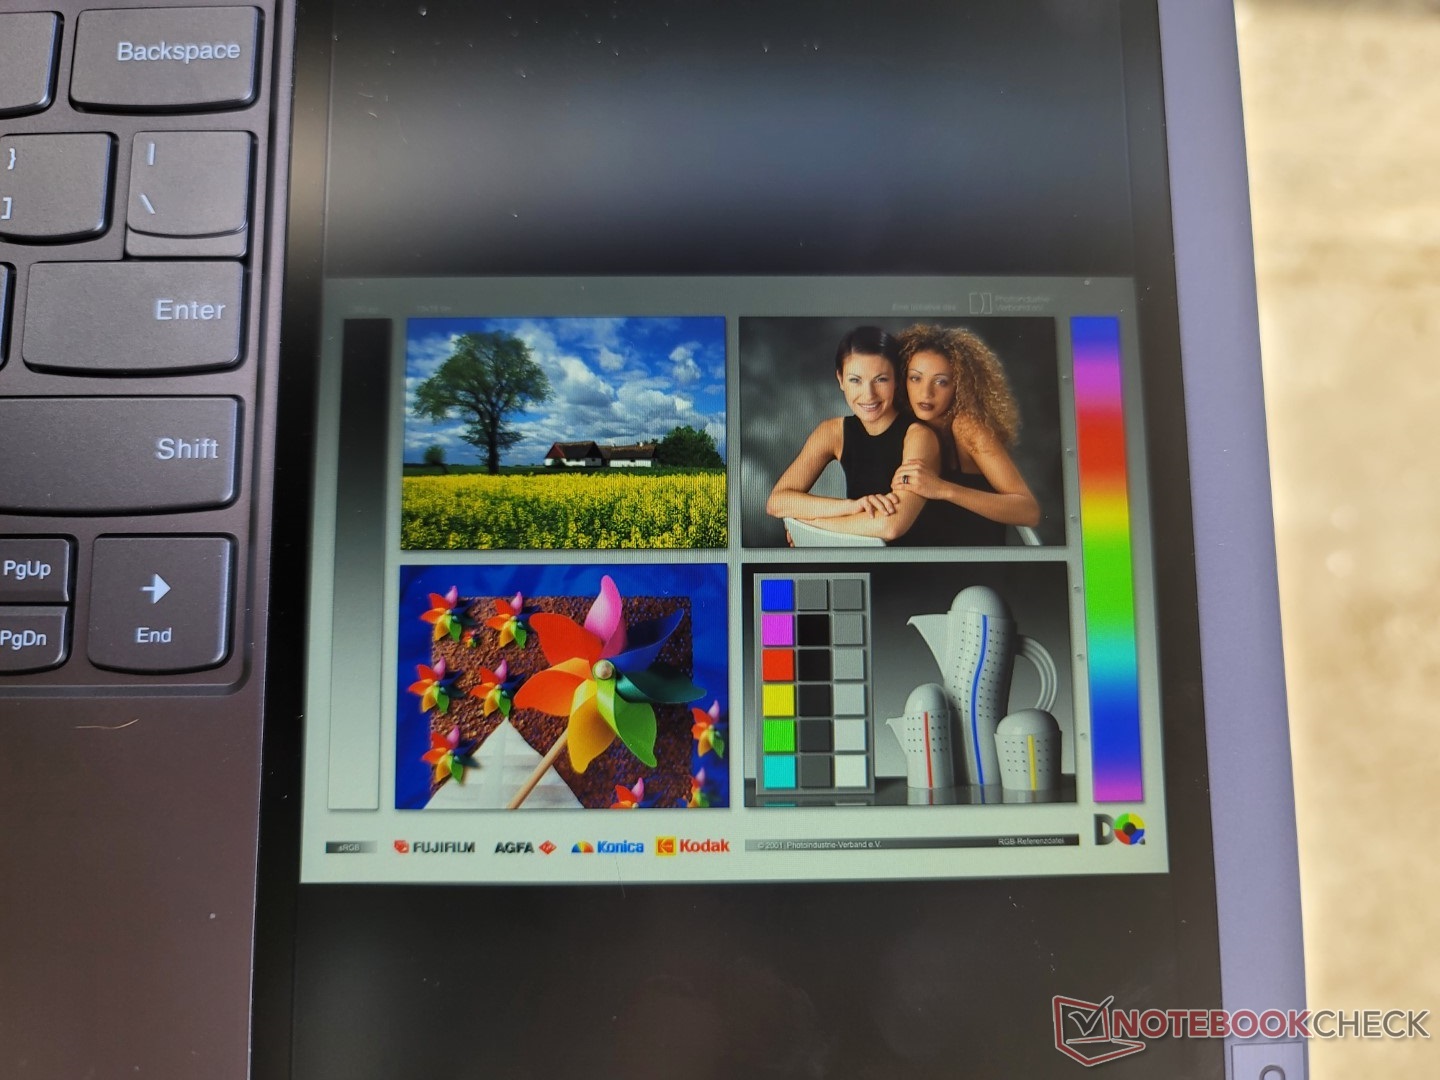
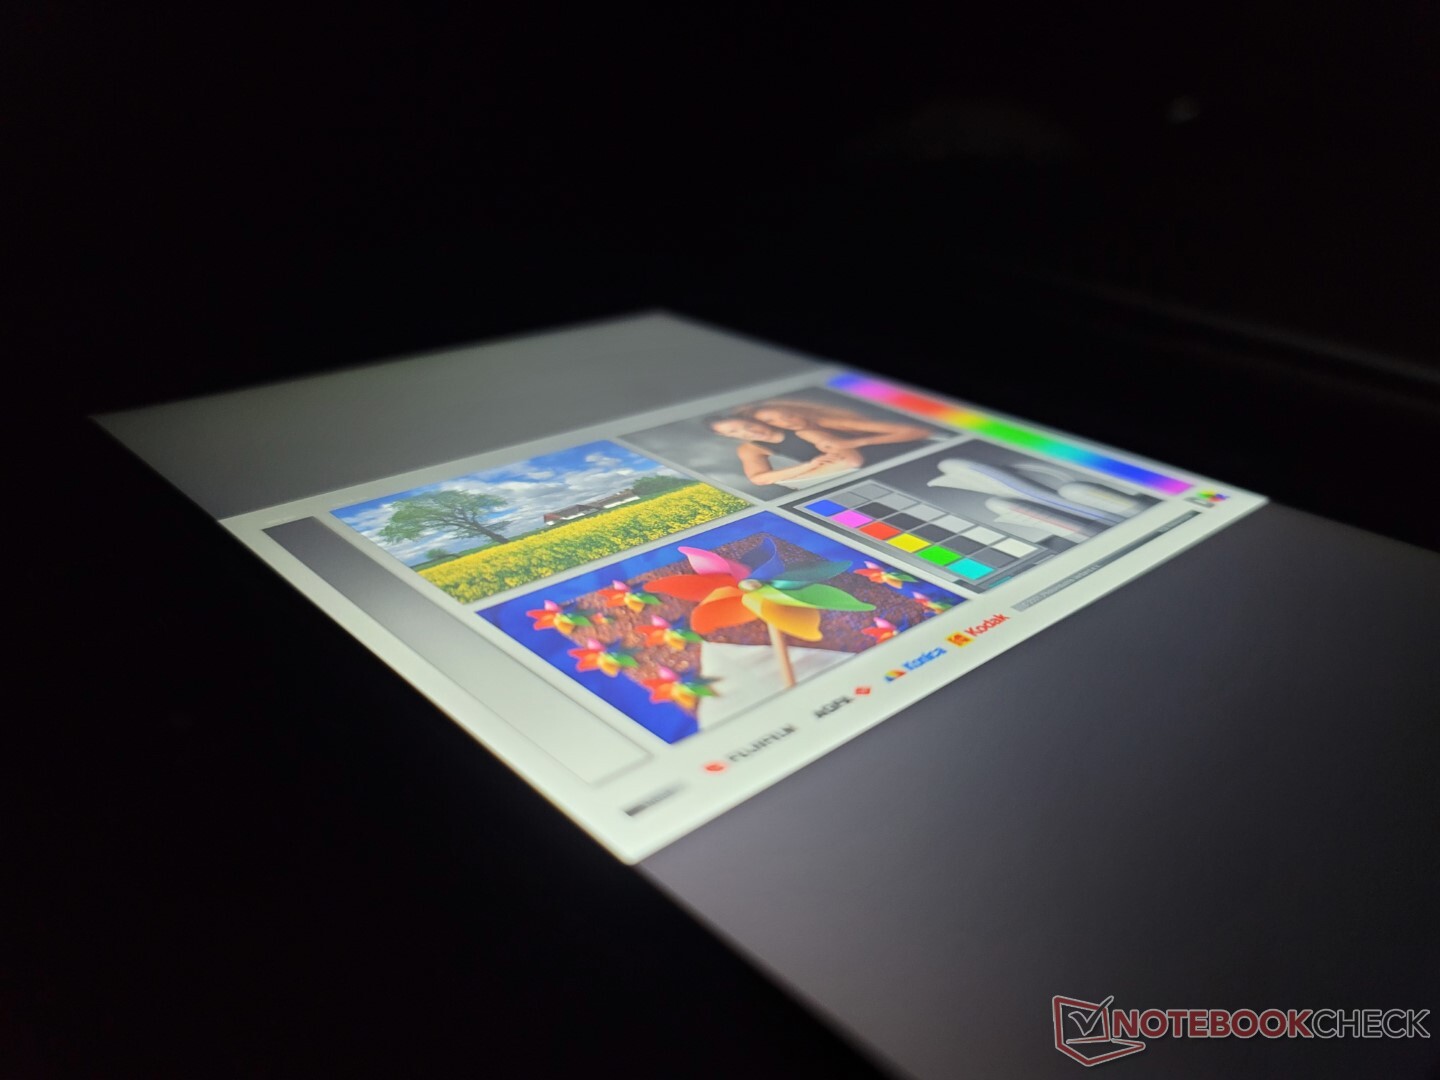
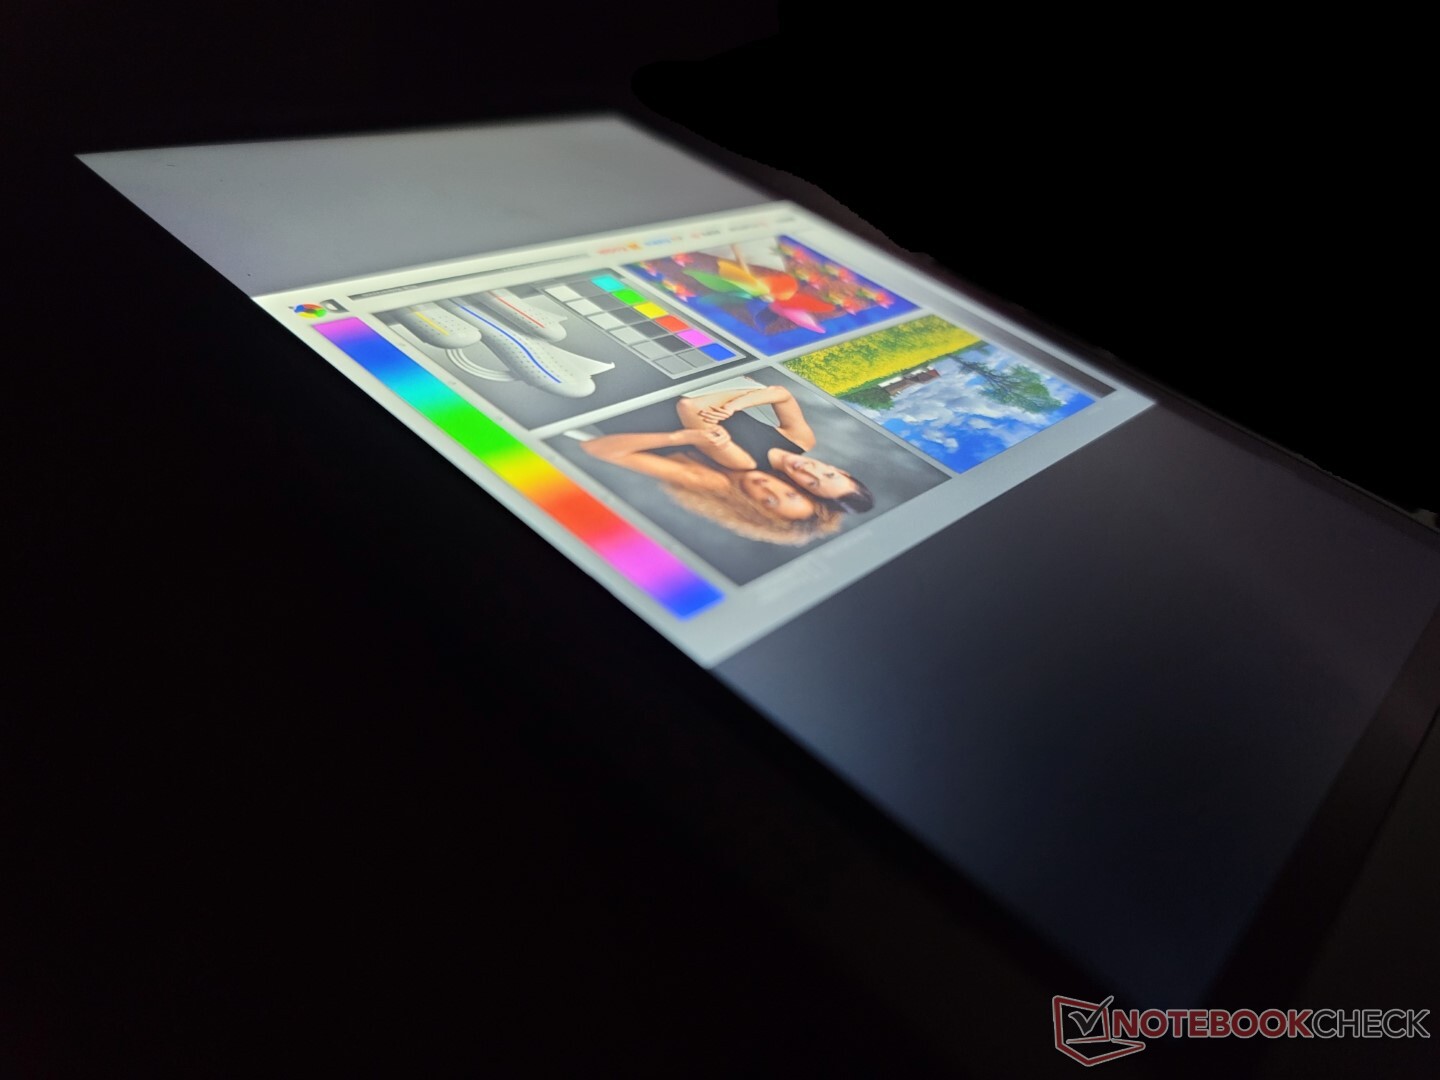
户外能见度类似于 LG Gram 17或XPS 17相似,因为它们都有类似的最大亮度水平。然而,在联想的屏幕上,由于其长宽比大于正常,沿屏幕两侧的眩光更明显。你仍然希望尽可能在阴凉处工作,以使能见度最大化。
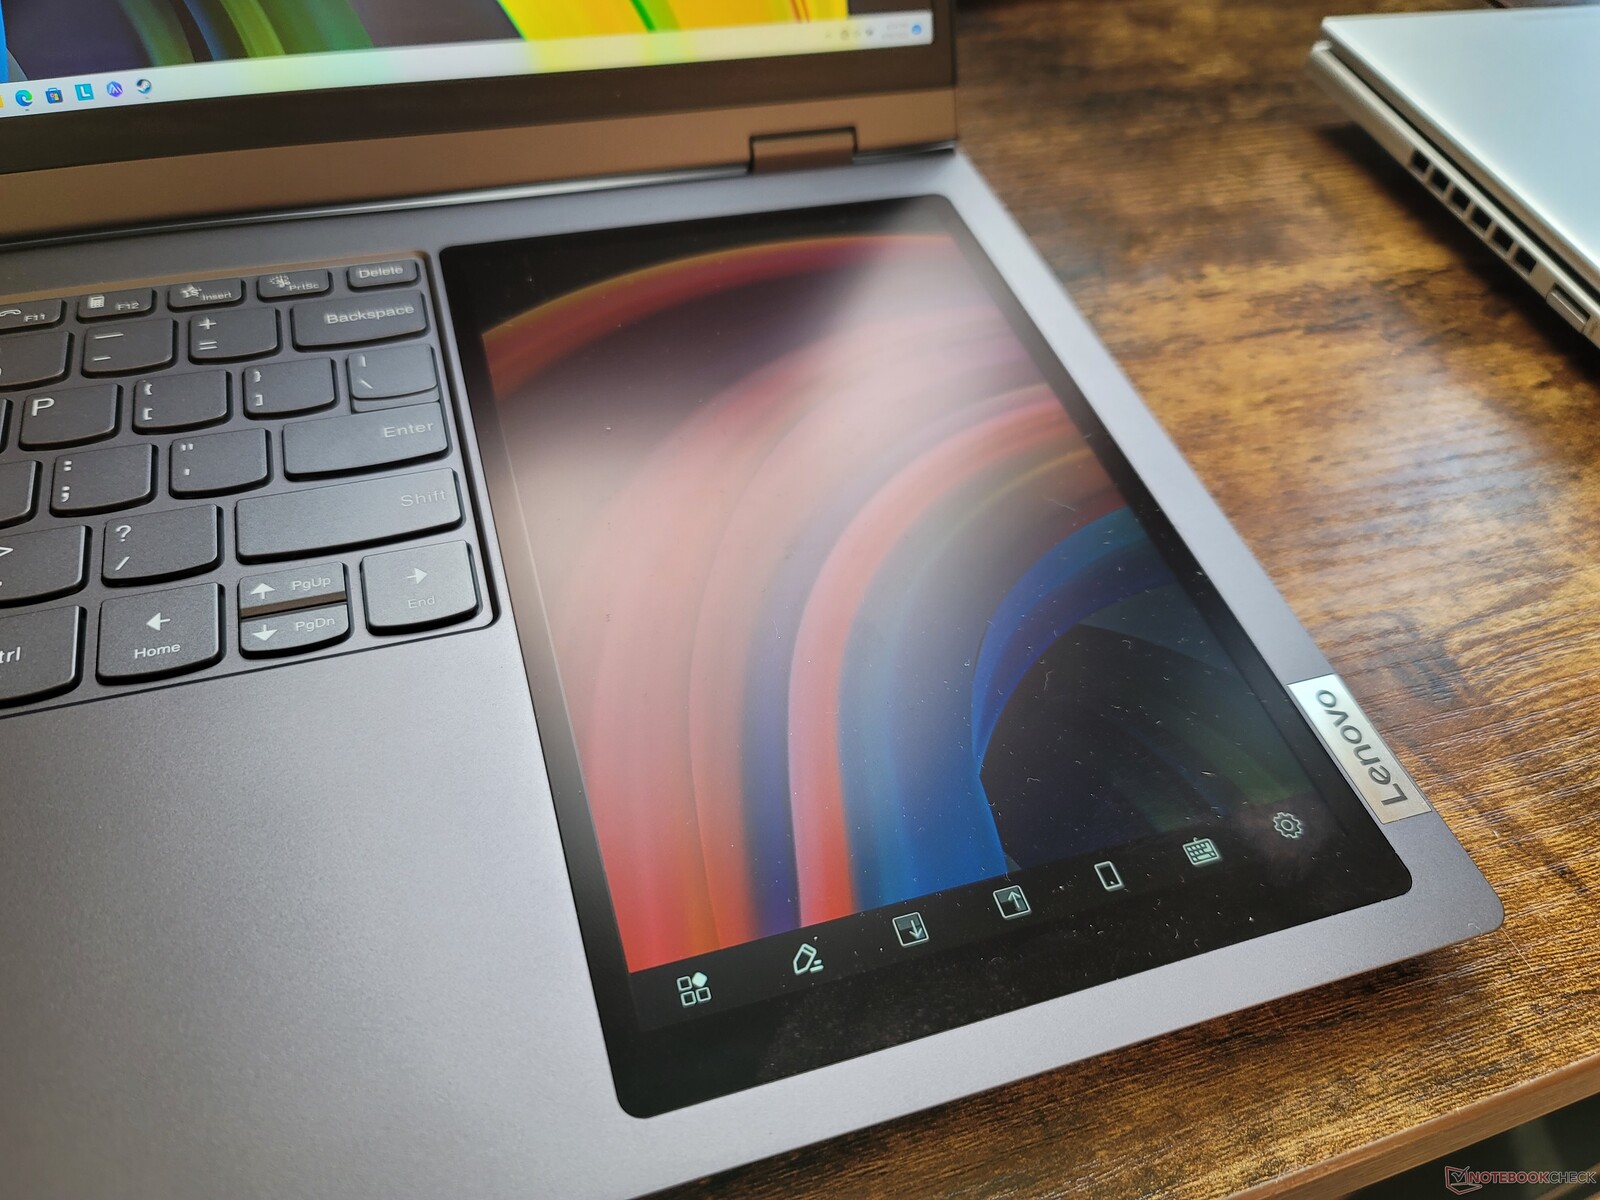
副显示屏--如此多的额外屏幕空间
从实用的角度来看,副屏可以顺利地、完美地将不同的窗口来回扣到主显示屏上。与竞争对手华硕ZenBook Duo系列上较窄的副显示屏相比,它的10:16长宽比尤其适合于更多的应用和程序。
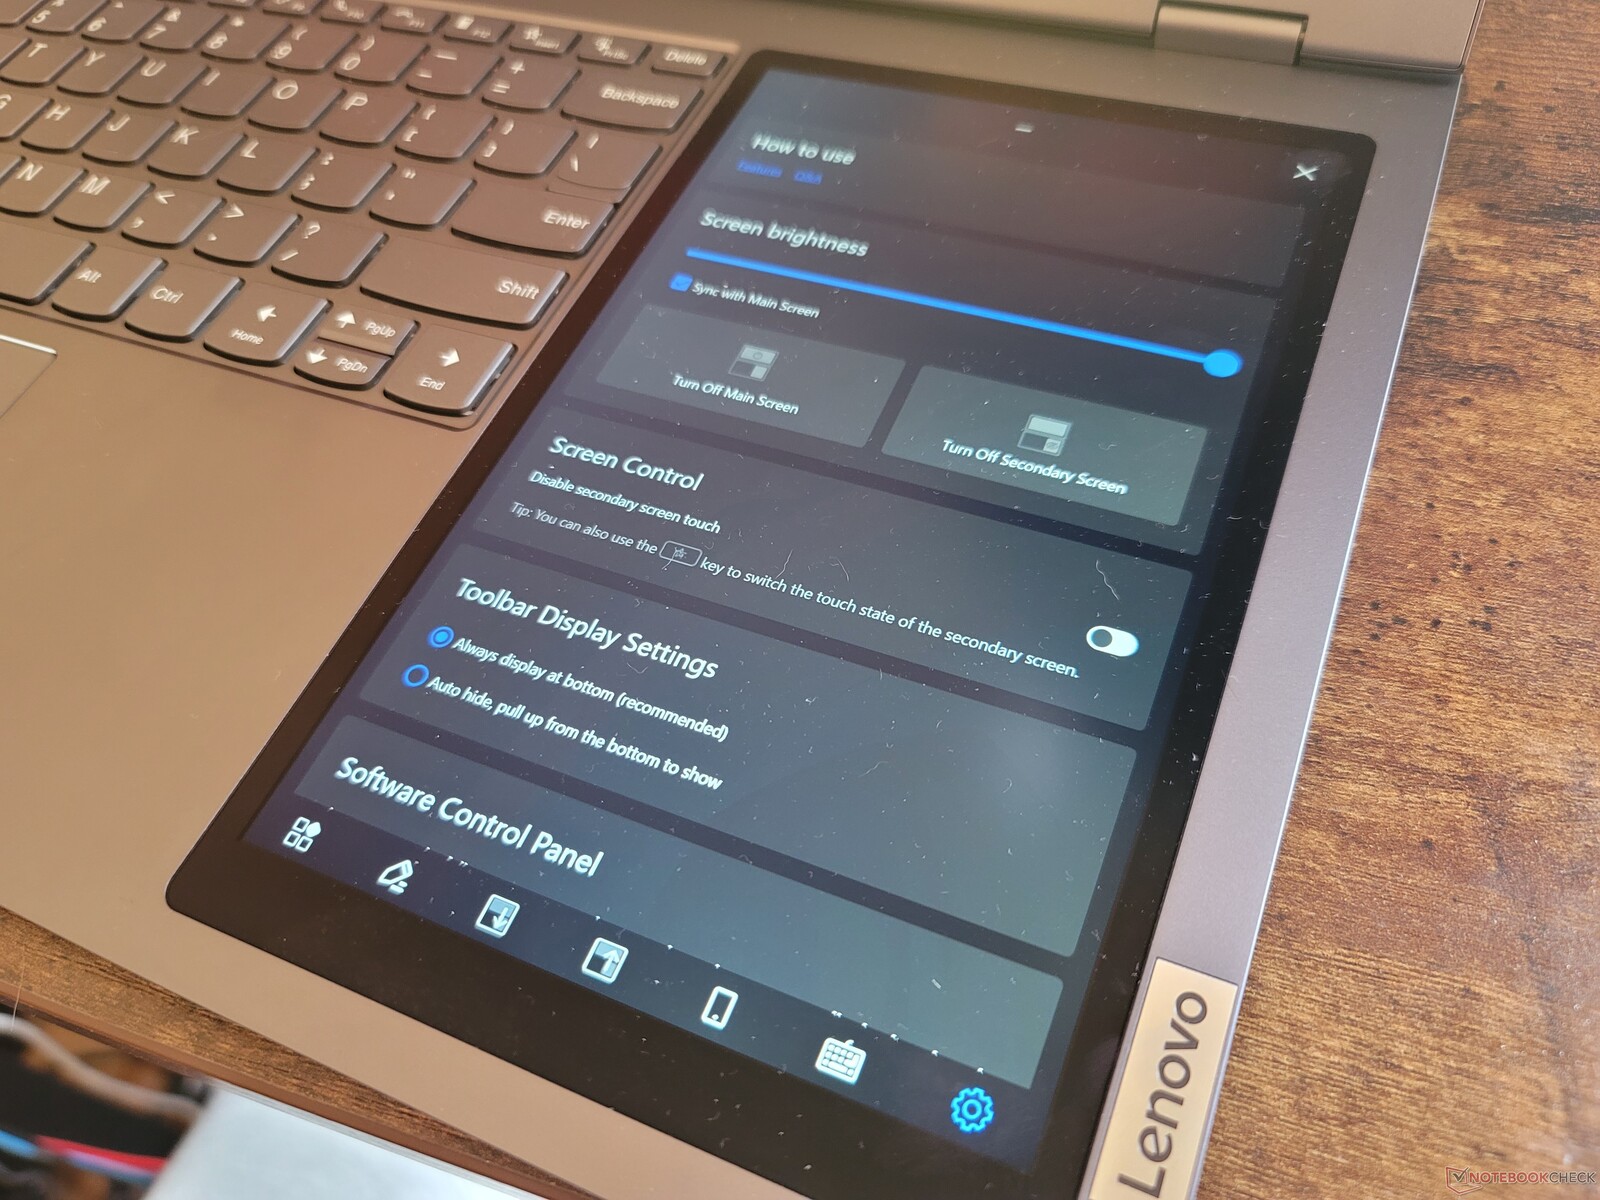
该屏幕还带有华硕机型上没有的独特辅助功能。例如,可以选择与主显示屏同步亮度,或只镜像主显示屏的特定800 x 1280像素部分。
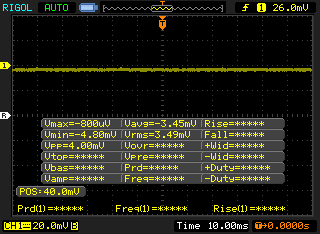
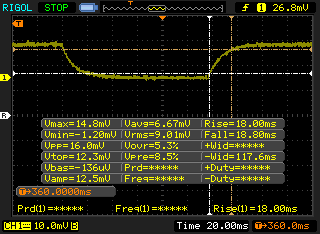
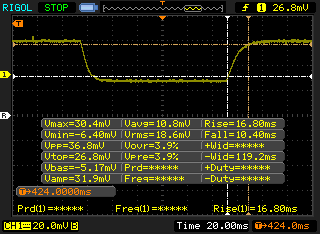
| 8英寸二级IPS触摸屏 | 800 x 1280分辨率 |
|---|---|
| 刷新率 | 60 Hz |
| 最大亮度 | 393.6尼特 |
| 黑到白的响应时间 | 16.8 ms上升,10.4 ms下降 |
| 灰色到灰色的响应时间 | 18.0 ms上升,18.8 ms下降 |
| 对比度 | 579:1 |
| sRGB覆盖率 | 80.6% |
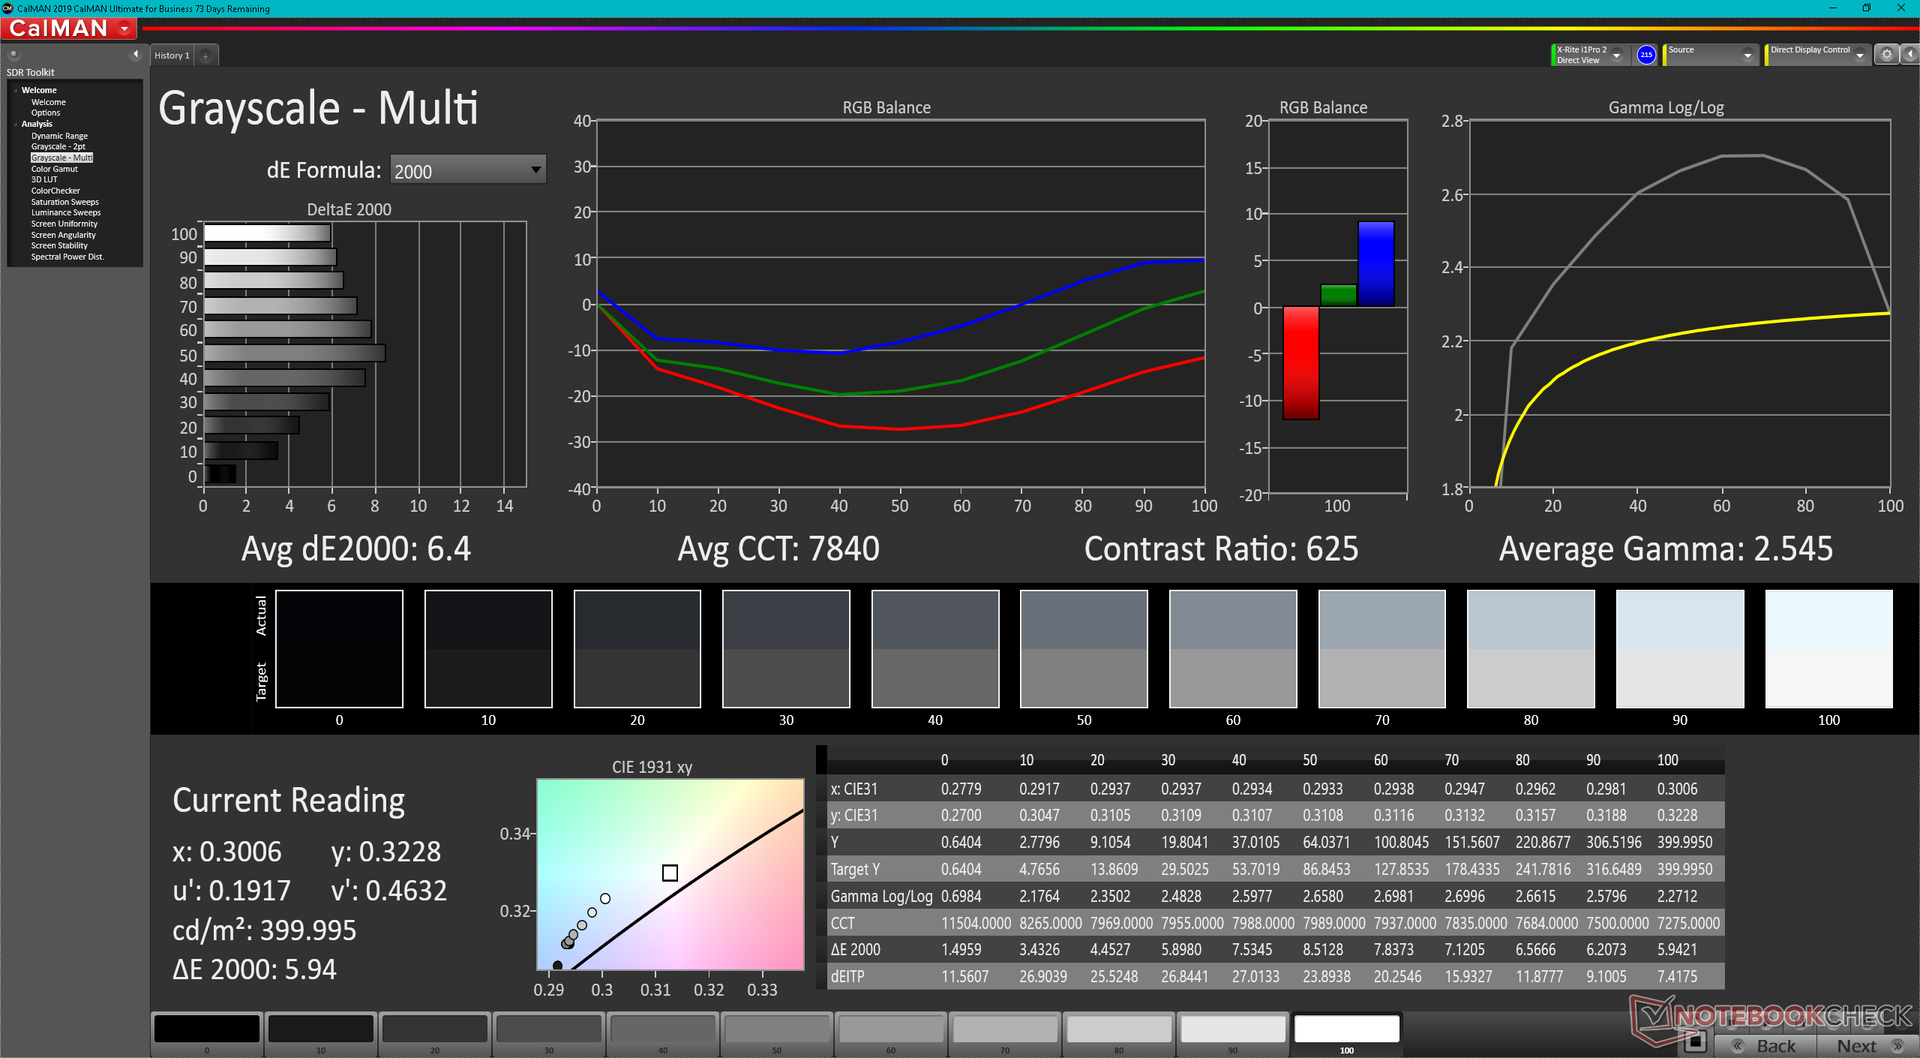
| 伽玛 | 2.55 |
| CCT | 7840 |
| 灰度平均值 DeltaE2000 | 6.4 |
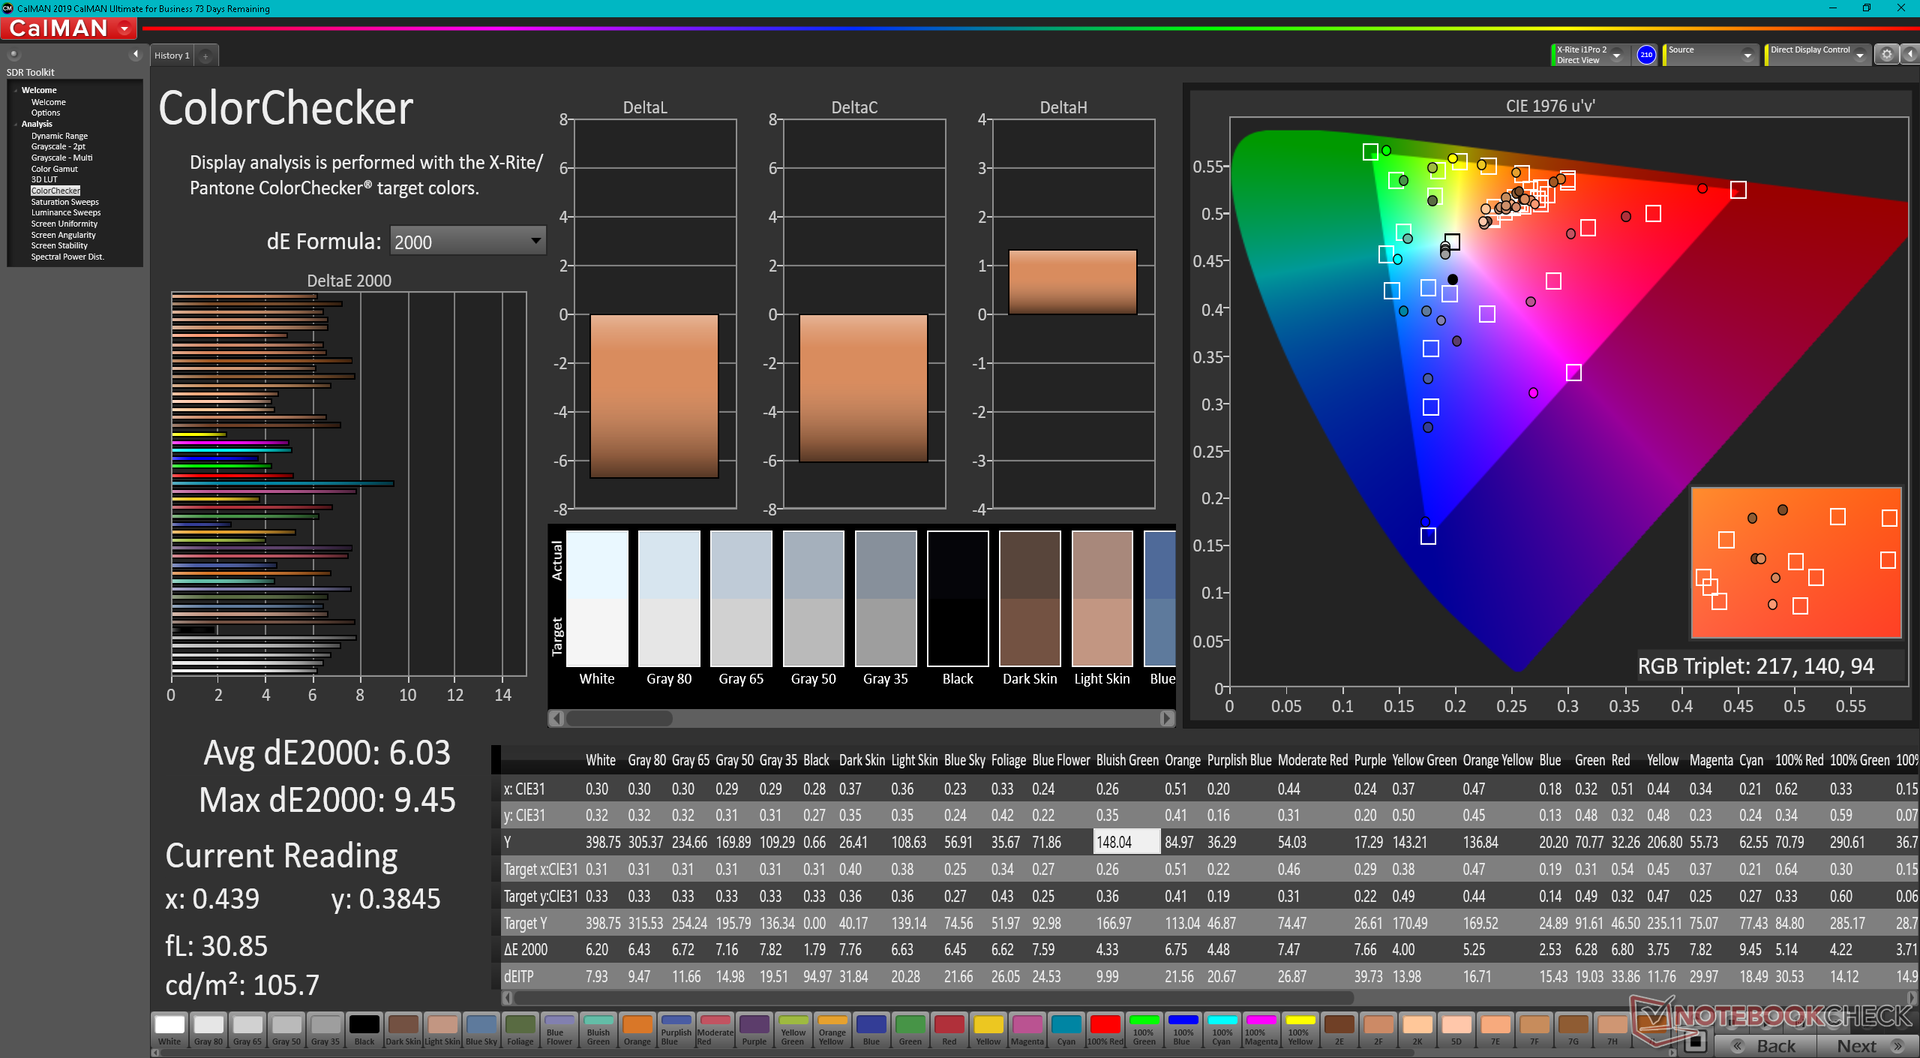
| Colorchecker dE 2000 | 6.03 |
| Colorchecker dE 2000最大值 | 9.45 |
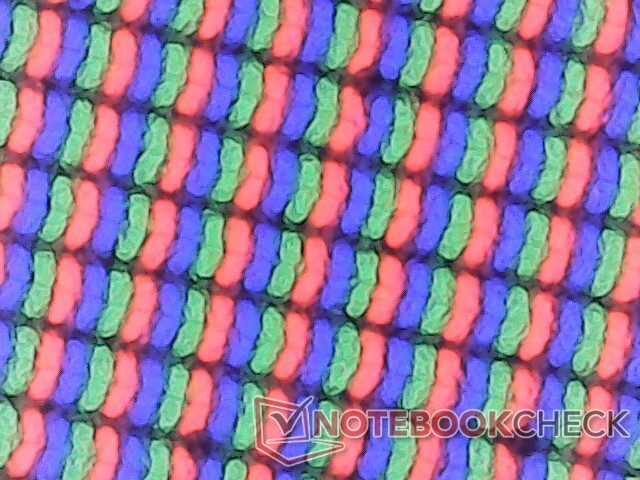
不幸的是,副显示屏也有类似的缺点,如一些 早期的ZenBook Duo机型.尤其是它的色彩、刷新率、对比度、颗粒度和视角眩光都明显不如主显示屏。图像质量更类似于廉价的8英寸Android 平板电脑,而不是iPad或三星Galaxy Tab S。如果主显示屏和副显示屏之间1:1的图像质量再现对你的工作负荷很重要,那么双外部显示屏仍将是你的最佳选择。
我们还在第二块屏幕上遇到了几个bug。首先,它的亮度有时会与主显示屏不同步。第二,当从睡眠中醒来时,主显示屏经常会被关闭,只留下第二块显示屏,即使在进入睡眠模式之前两块显示屏都处于活动状态。第三,即使通过Windows禁用了触摸功能,屏幕也会对其作出反应,这可能导致许多人意外地输入到主显示器。用户必须记住手动按下键盘上的 "S星 "键(或插入键)来切换触摸灵敏度。最后,许多输入在第二屏幕上没有被注册,这在使用过程中会变得令人沮丧。这些功能中的许多都显示出前景,但它们肯定可以从更多的开发时间中受益。
性能 - 英特尔第12代Alder Lake-H
测试条件
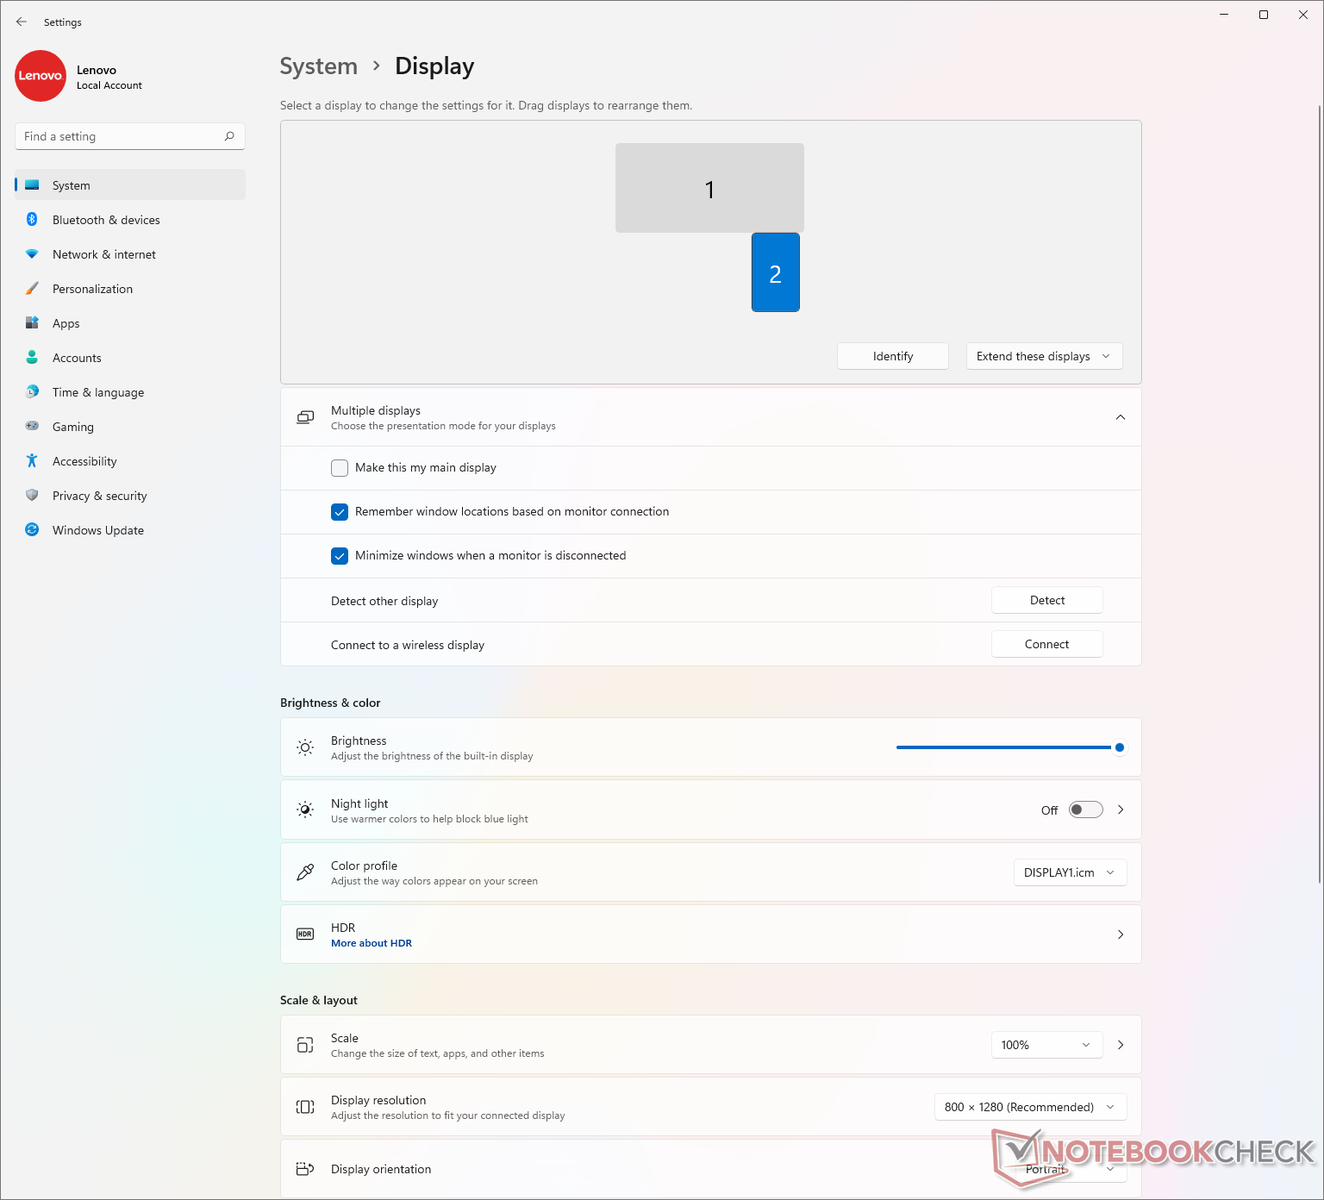
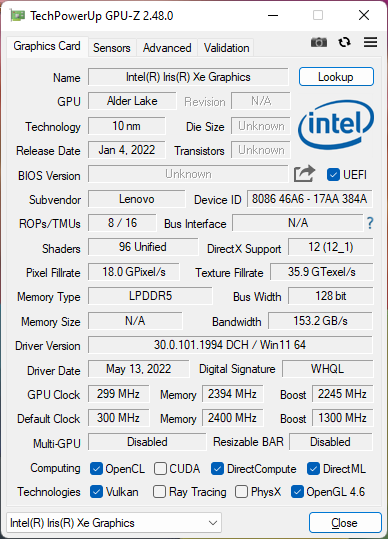
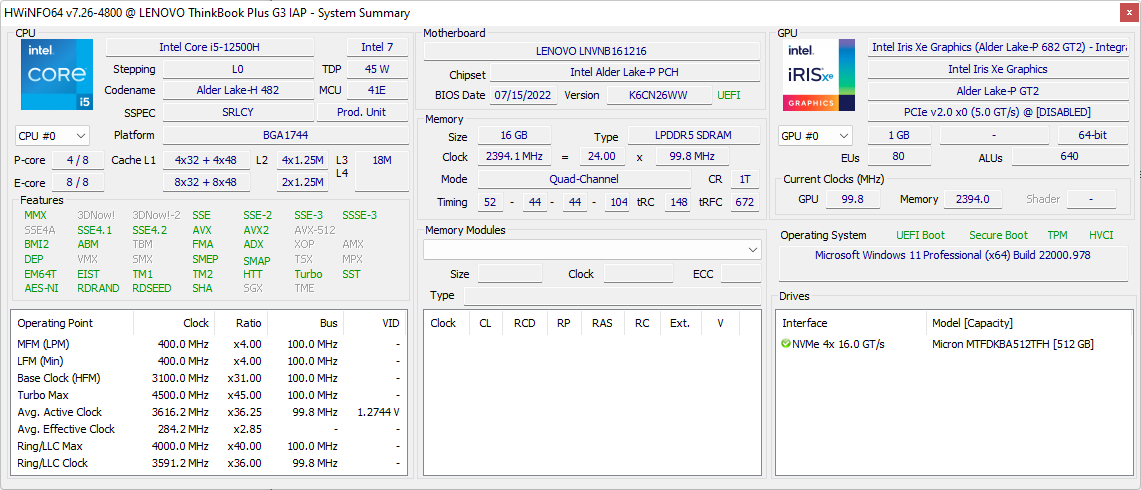
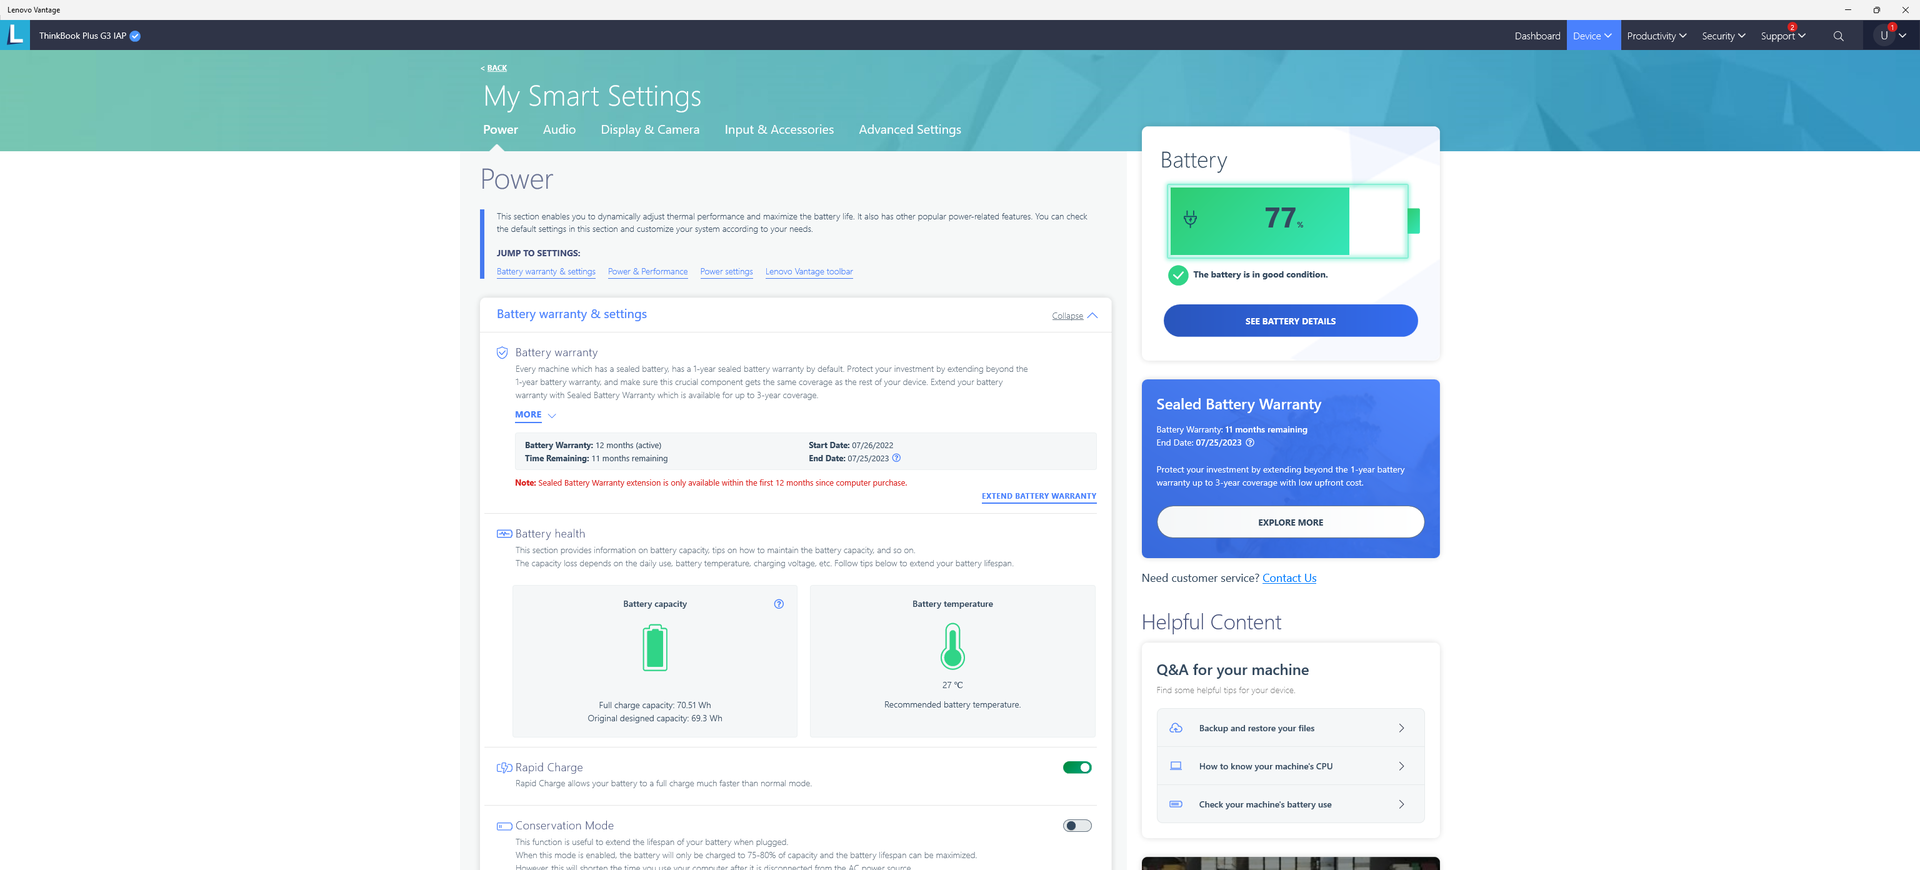
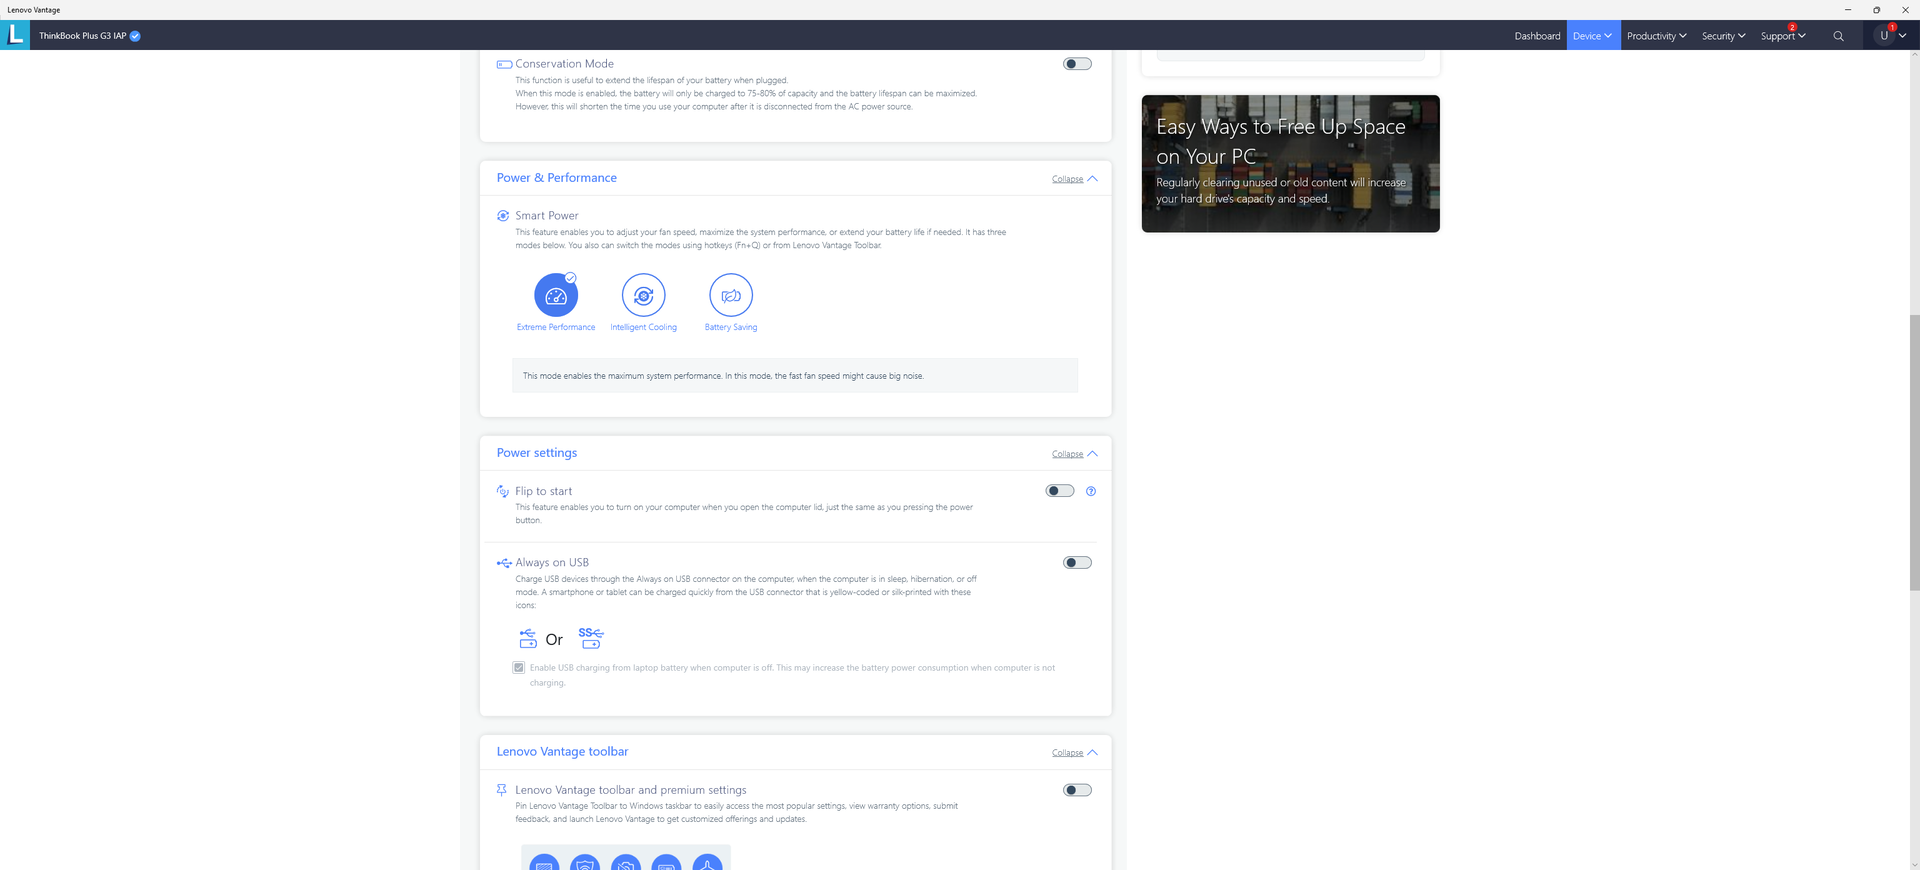
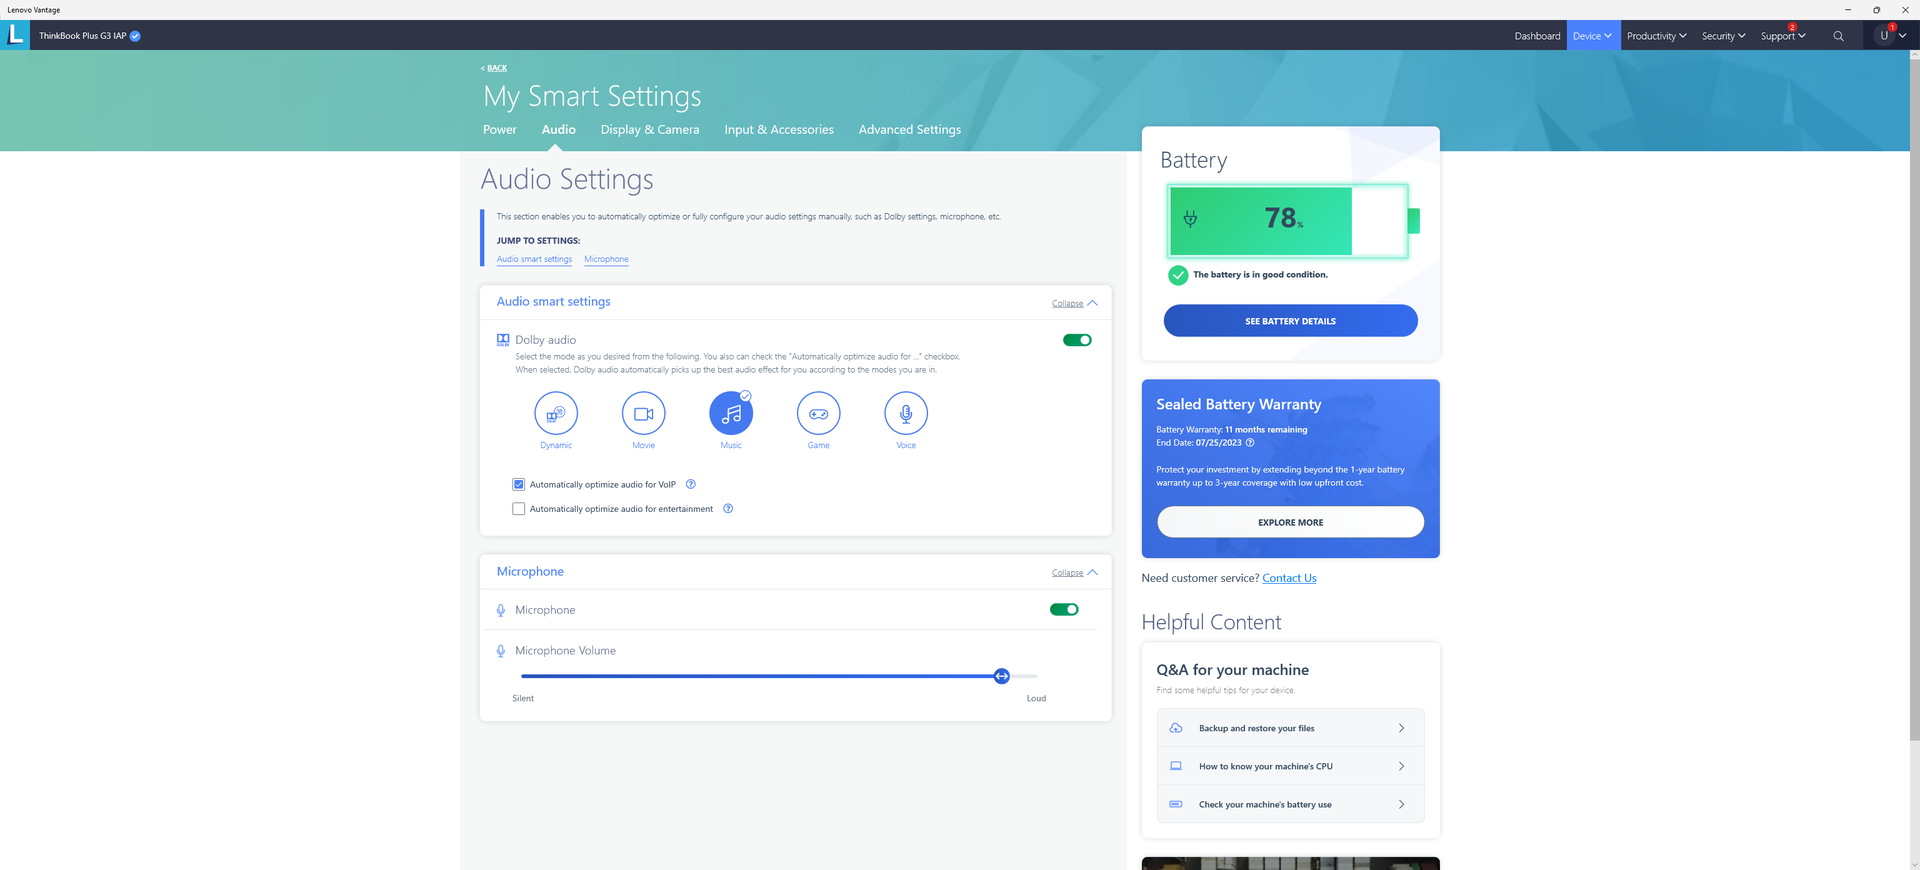
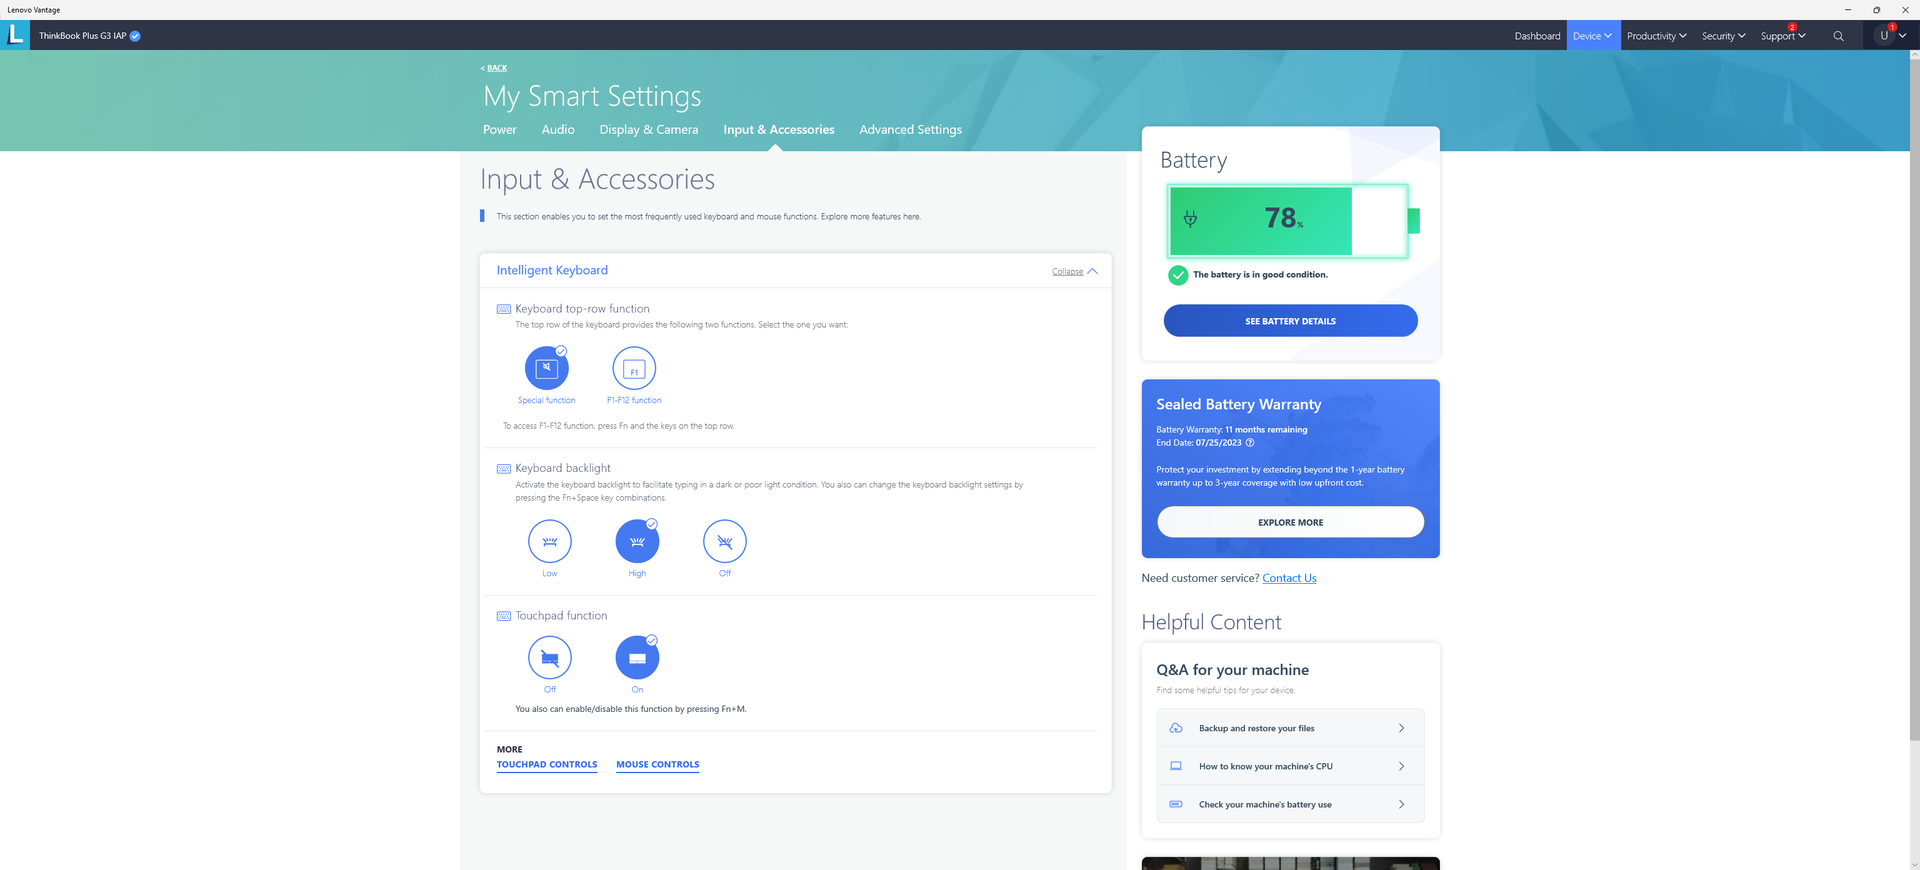
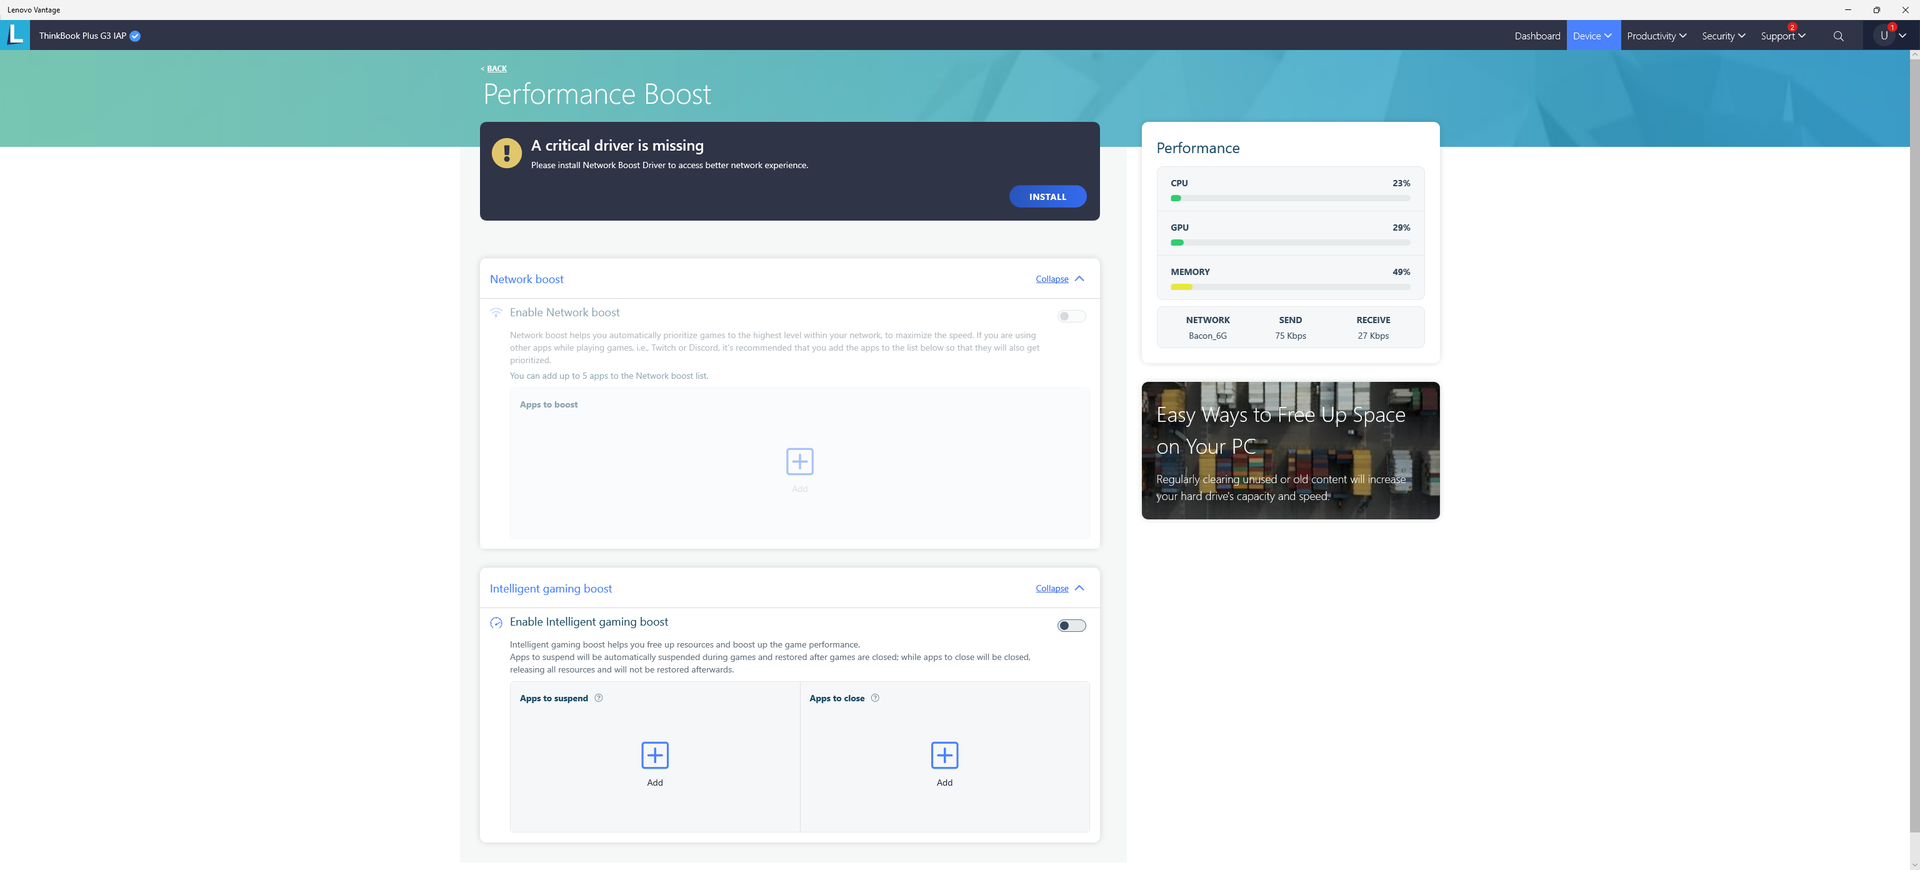
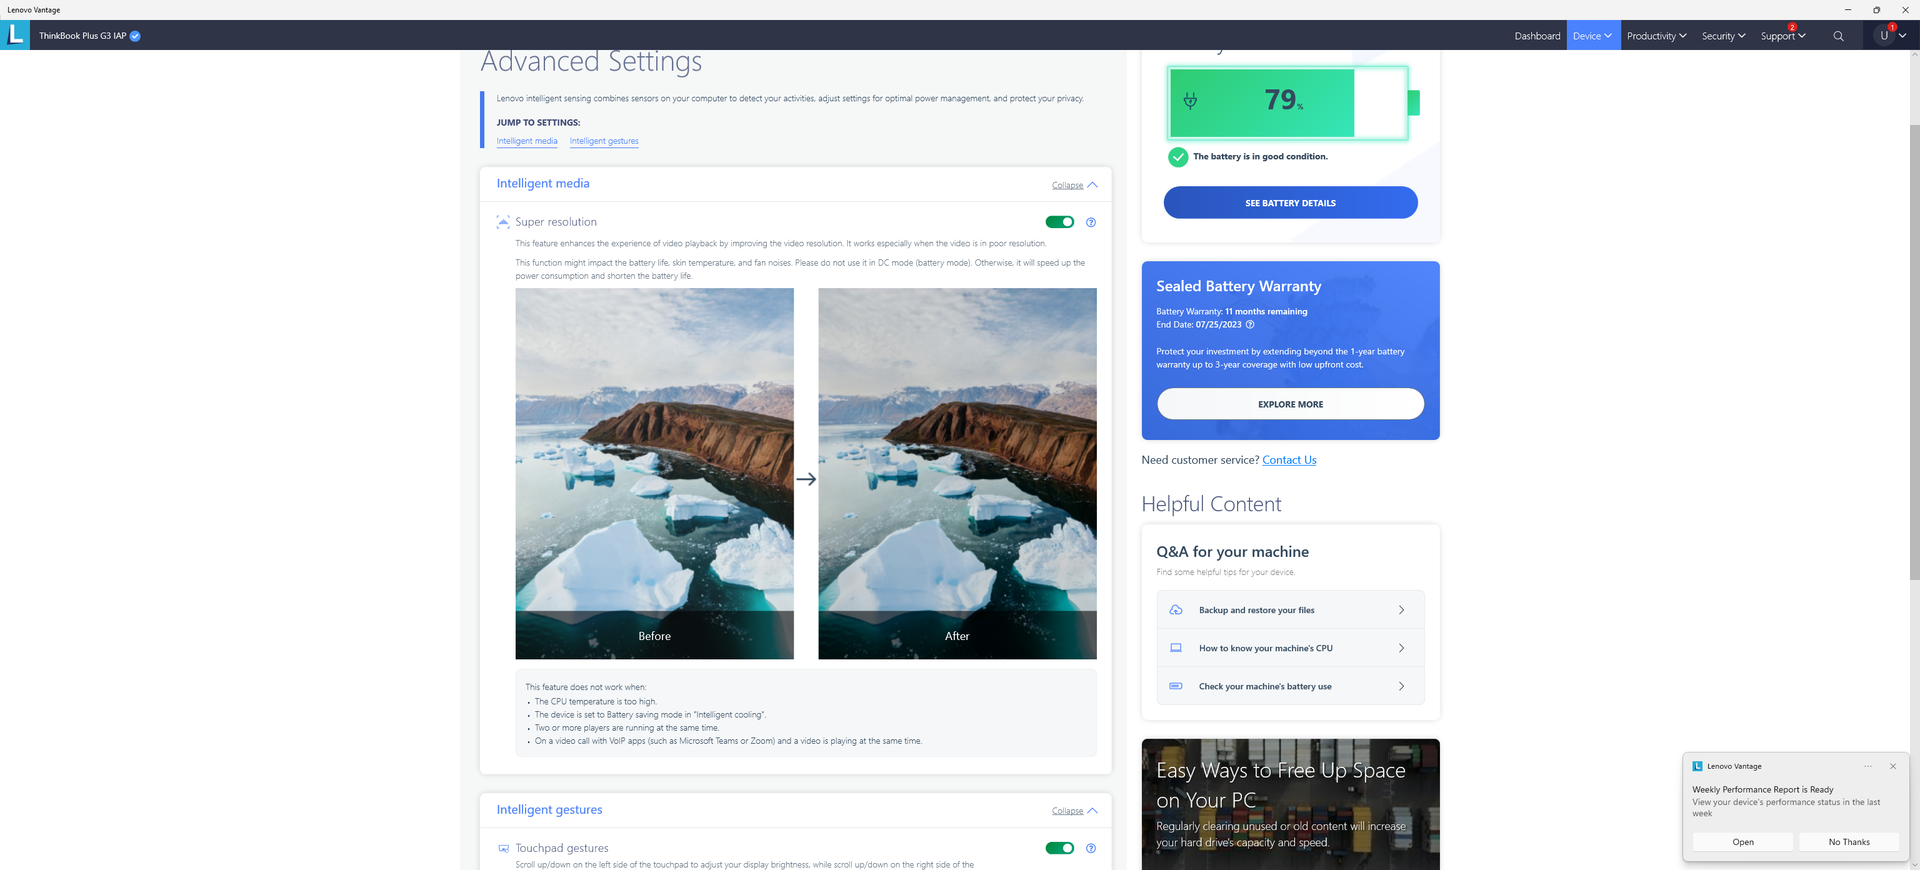
在运行下面的任何基准测试之前,我们通过联想Vantage将我们的设备设置为极限性能模式,通过Windows设置为性能模式。用户应该熟悉预装的Vantage软件,因为它是笔记本电脑的更新、性能和辅助功能的控制中心。下面的屏幕截图显示了该软件的一些可用功能。
处理器
CPU性能比平均水平慢20%至25%。 酷睿i7-12700H在我们的数据库中。性能上的差距大到足以让配备 "较慢 "的笔记本电脑 酷睿i5-12500H如Honor 魔法书15也能赶上或超过我们的联想。尽管如此,处理器性能仍然比低功率的 酷睿i7-1260P或 酷睿i7-1165G7.这一优势在与酷睿i5-1130G7相比时显得尤为广泛。酷睿i5-1130G7去年的ThinkBook Plus第二代机型相比,优势尤为明显。
Cinebench R15 Multi Loop
Cinebench R23: Multi Core | Single Core
Cinebench R15: CPU Multi 64Bit | CPU Single 64Bit
Blender: v2.79 BMW27 CPU
7-Zip 18.03: 7z b 4 | 7z b 4 -mmt1
Geekbench 5.5: Multi-Core | Single-Core
HWBOT x265 Benchmark v2.2: 4k Preset
LibreOffice : 20 Documents To PDF
R Benchmark 2.5: Overall mean
| Cinebench R20 / CPU (Multi Core) | |
| Average Intel Core i7-12700H (1576 - 7407, n=64) | |
| Schenker XMG Neo 17 M22 | |
| Gigabyte Aero 17 HDR YD | |
| Dell XPS 17 9720 | |
| Gigabyte A7 X1 | |
| Honor MagicBook 14 2022 | |
| Acer Nitro 5 AN517-41-R9S5 | |
| Lenovo ThinkBook Plus Gen3 | |
| Lenovo Legion 5 17ACH6H-82JY0003GE | |
| Samsung Galaxy Book2 15 | |
| Asus ProArt StudioBook Pro 17 W700G3T | |
| LG Gram 17 (2022) | |
| Acer Aspire 5 A517-52G-79Z5 | |
| Lenovo ThinkBook Plus Gen2 Core i5 | |
| Cinebench R20 / CPU (Single Core) | |
| Samsung Galaxy Book2 15 | |
| Average Intel Core i7-12700H (300 - 704, n=64) | |
| Lenovo ThinkBook Plus Gen3 | |
| Dell XPS 17 9720 | |
| Honor MagicBook 14 2022 | |
| Schenker XMG Neo 17 M22 | |
| Gigabyte Aero 17 HDR YD | |
| Gigabyte A7 X1 | |
| Acer Aspire 5 A517-52G-79Z5 | |
| Acer Nitro 5 AN517-41-R9S5 | |
| Lenovo Legion 5 17ACH6H-82JY0003GE | |
| LG Gram 17 (2022) | |
| Lenovo ThinkBook Plus Gen2 Core i5 | |
| Asus ProArt StudioBook Pro 17 W700G3T | |
| Cinebench R23 / Multi Core | |
| Dell XPS 17 9720 | |
| Average Intel Core i7-12700H (4032 - 19330, n=64) | |
| Schenker XMG Neo 17 M22 | |
| Gigabyte A7 X1 | |
| Honor MagicBook 14 2022 | |
| Acer Nitro 5 AN517-41-R9S5 | |
| Lenovo ThinkBook Plus Gen3 | |
| Lenovo Legion 5 17ACH6H-82JY0003GE | |
| Samsung Galaxy Book2 15 | |
| LG Gram 17 (2022) | |
| Acer Aspire 5 A517-52G-79Z5 | |
| Lenovo ThinkBook Plus Gen2 Core i5 | |
| Cinebench R23 / Single Core | |
| Samsung Galaxy Book2 15 | |
| Average Intel Core i7-12700H (778 - 1826, n=63) | |
| Dell XPS 17 9720 | |
| Lenovo ThinkBook Plus Gen3 | |
| Honor MagicBook 14 2022 | |
| Schenker XMG Neo 17 M22 | |
| Acer Aspire 5 A517-52G-79Z5 | |
| Gigabyte A7 X1 | |
| Acer Nitro 5 AN517-41-R9S5 | |
| LG Gram 17 (2022) | |
| Lenovo Legion 5 17ACH6H-82JY0003GE | |
| Lenovo ThinkBook Plus Gen2 Core i5 | |
| Cinebench R15 / CPU Multi 64Bit | |
| Dell XPS 17 9720 | |
| Dell XPS 17 9720 | |
| Average Intel Core i7-12700H (1379 - 2916, n=70) | |
| Schenker XMG Neo 17 M22 | |
| Honor MagicBook 14 2022 | |
| Honor MagicBook 14 2022 | |
| Gigabyte A7 X1 | |
| Gigabyte Aero 17 HDR YD | |
| Acer Nitro 5 AN517-41-R9S5 | |
| Lenovo ThinkBook Plus Gen3 | |
| Lenovo Legion 5 17ACH6H-82JY0003GE | |
| LG Gram 17 (2022) | |
| Samsung Galaxy Book2 15 | |
| Asus ProArt StudioBook Pro 17 W700G3T | |
| Asus ProArt StudioBook Pro 17 W700G3T | |
| Acer Aspire 5 A517-52G-79Z5 | |
| Lenovo ThinkBook Plus Gen2 Core i5 | |
| Lenovo ThinkBook Plus Gen2 Core i5 | |
| Cinebench R15 / CPU Single 64Bit | |
| Dell XPS 17 9720 | |
| Average Intel Core i7-12700H (113 - 263, n=65) | |
| Schenker XMG Neo 17 M22 | |
| Lenovo ThinkBook Plus Gen3 | |
| Samsung Galaxy Book2 15 | |
| Gigabyte A7 X1 | |
| Honor MagicBook 14 2022 | |
| Gigabyte Aero 17 HDR YD | |
| Acer Nitro 5 AN517-41-R9S5 | |
| Lenovo Legion 5 17ACH6H-82JY0003GE | |
| Acer Aspire 5 A517-52G-79Z5 | |
| Asus ProArt StudioBook Pro 17 W700G3T | |
| Lenovo ThinkBook Plus Gen2 Core i5 | |
| Lenovo ThinkBook Plus Gen2 Core i5 | |
| LG Gram 17 (2022) | |
| Blender / v2.79 BMW27 CPU | |
| Lenovo ThinkBook Plus Gen2 Core i5 | |
| Acer Aspire 5 A517-52G-79Z5 | |
| LG Gram 17 (2022) | |
| Asus ProArt StudioBook Pro 17 W700G3T | |
| Samsung Galaxy Book2 15 | |
| Lenovo Legion 5 17ACH6H-82JY0003GE | |
| Lenovo ThinkBook Plus Gen3 | |
| Honor MagicBook 14 2022 | |
| Acer Nitro 5 AN517-41-R9S5 | |
| Gigabyte A7 X1 | |
| Dell XPS 17 9720 | |
| Gigabyte Aero 17 HDR YD | |
| Average Intel Core i7-12700H (168 - 732, n=63) | |
| Schenker XMG Neo 17 M22 | |
| 7-Zip 18.03 / 7z b 4 | |
| Schenker XMG Neo 17 M22 | |
| Average Intel Core i7-12700H (22844 - 73067, n=63) | |
| Dell XPS 17 9720 | |
| Acer Nitro 5 AN517-41-R9S5 | |
| Gigabyte Aero 17 HDR YD | |
| Gigabyte A7 X1 | |
| Honor MagicBook 14 2022 | |
| Lenovo ThinkBook Plus Gen3 | |
| Lenovo Legion 5 17ACH6H-82JY0003GE | |
| Samsung Galaxy Book2 15 | |
| Asus ProArt StudioBook Pro 17 W700G3T | |
| LG Gram 17 (2022) | |
| Acer Aspire 5 A517-52G-79Z5 | |
| Lenovo ThinkBook Plus Gen2 Core i5 | |
| 7-Zip 18.03 / 7z b 4 -mmt1 | |
| Schenker XMG Neo 17 M22 | |
| Dell XPS 17 9720 | |
| Gigabyte A7 X1 | |
| Gigabyte Aero 17 HDR YD | |
| Average Intel Core i7-12700H (2743 - 5972, n=63) | |
| Acer Nitro 5 AN517-41-R9S5 | |
| Samsung Galaxy Book2 15 | |
| Acer Aspire 5 A517-52G-79Z5 | |
| Lenovo Legion 5 17ACH6H-82JY0003GE | |
| Honor MagicBook 14 2022 | |
| Lenovo ThinkBook Plus Gen3 | |
| Asus ProArt StudioBook Pro 17 W700G3T | |
| LG Gram 17 (2022) | |
| Lenovo ThinkBook Plus Gen2 Core i5 | |
| Geekbench 5.5 / Multi-Core | |
| Dell XPS 17 9720 | |
| Average Intel Core i7-12700H (5144 - 13745, n=64) | |
| Honor MagicBook 14 2022 | |
| Lenovo ThinkBook Plus Gen3 | |
| Schenker XMG Neo 17 M22 | |
| Gigabyte Aero 17 HDR YD | |
| Acer Nitro 5 AN517-41-R9S5 | |
| LG Gram 17 (2022) | |
| Gigabyte A7 X1 | |
| Samsung Galaxy Book2 15 | |
| Lenovo Legion 5 17ACH6H-82JY0003GE | |
| Asus ProArt StudioBook Pro 17 W700G3T | |
| Acer Aspire 5 A517-52G-79Z5 | |
| Lenovo ThinkBook Plus Gen2 Core i5 | |
| Geekbench 5.5 / Single-Core | |
| Dell XPS 17 9720 | |
| Samsung Galaxy Book2 15 | |
| Average Intel Core i7-12700H (803 - 1851, n=64) | |
| Honor MagicBook 14 2022 | |
| Lenovo ThinkBook Plus Gen3 | |
| Gigabyte Aero 17 HDR YD | |
| Schenker XMG Neo 17 M22 | |
| LG Gram 17 (2022) | |
| Acer Aspire 5 A517-52G-79Z5 | |
| Gigabyte A7 X1 | |
| Acer Nitro 5 AN517-41-R9S5 | |
| Lenovo Legion 5 17ACH6H-82JY0003GE | |
| Lenovo ThinkBook Plus Gen2 Core i5 | |
| Asus ProArt StudioBook Pro 17 W700G3T | |
| HWBOT x265 Benchmark v2.2 / 4k Preset | |
| Schenker XMG Neo 17 M22 | |
| Average Intel Core i7-12700H (4.67 - 21.8, n=64) | |
| Gigabyte Aero 17 HDR YD | |
| Acer Nitro 5 AN517-41-R9S5 | |
| Gigabyte A7 X1 | |
| Dell XPS 17 9720 | |
| Honor MagicBook 14 2022 | |
| Lenovo ThinkBook Plus Gen3 | |
| Lenovo Legion 5 17ACH6H-82JY0003GE | |
| Samsung Galaxy Book2 15 | |
| Asus ProArt StudioBook Pro 17 W700G3T | |
| LG Gram 17 (2022) | |
| Acer Aspire 5 A517-52G-79Z5 | |
| LibreOffice / 20 Documents To PDF | |
| Acer Nitro 5 AN517-41-R9S5 | |
| Asus ProArt StudioBook Pro 17 W700G3T | |
| Lenovo ThinkBook Plus Gen2 Core i5 | |
| Gigabyte A7 X1 | |
| Schenker XMG Neo 17 M22 | |
| LG Gram 17 (2022) | |
| Lenovo Legion 5 17ACH6H-82JY0003GE | |
| Acer Aspire 5 A517-52G-79Z5 | |
| Lenovo ThinkBook Plus Gen3 | |
| Average Intel Core i7-12700H (34.2 - 95.3, n=63) | |
| Dell XPS 17 9720 | |
| Samsung Galaxy Book2 15 | |
| Honor MagicBook 14 2022 | |
| Gigabyte Aero 17 HDR YD | |
| R Benchmark 2.5 / Overall mean | |
| Lenovo ThinkBook Plus Gen2 Core i5 | |
| Asus ProArt StudioBook Pro 17 W700G3T | |
| Acer Aspire 5 A517-52G-79Z5 | |
| LG Gram 17 (2022) | |
| Gigabyte Aero 17 HDR YD | |
| Lenovo Legion 5 17ACH6H-82JY0003GE | |
| Gigabyte A7 X1 | |
| Honor MagicBook 14 2022 | |
| Lenovo ThinkBook Plus Gen3 | |
| Schenker XMG Neo 17 M22 | |
| Average Intel Core i7-12700H (0.4441 - 1.052, n=63) | |
| Samsung Galaxy Book2 15 | |
| Dell XPS 17 9720 | |
Cinebench R23: Multi Core | Single Core
Cinebench R15: CPU Multi 64Bit | CPU Single 64Bit
Blender: v2.79 BMW27 CPU
7-Zip 18.03: 7z b 4 | 7z b 4 -mmt1
Geekbench 5.5: Multi-Core | Single-Core
HWBOT x265 Benchmark v2.2: 4k Preset
LibreOffice : 20 Documents To PDF
R Benchmark 2.5: Overall mean
* ... smaller is better
AIDA64: FP32 Ray-Trace | FPU Julia | CPU SHA3 | CPU Queen | FPU SinJulia | FPU Mandel | CPU AES | CPU ZLib | FP64 Ray-Trace | CPU PhotoWorxx
| Performance rating | |
| Average Intel Core i7-12700H | |
| Lenovo ThinkBook Plus Gen3 | |
| Dell XPS 17 9720 | |
| Asus ProArt StudioBook Pro 17 W700G3T | |
| LG Gram 17 (2022) | |
| Lenovo ThinkBook Plus Gen2 Core i5 | |
| Gigabyte Aero 17 HDR YD -9! | |
| AIDA64 / FP32 Ray-Trace | |
| Lenovo ThinkBook Plus Gen3 | |
| Average Intel Core i7-12700H (2585 - 17957, n=64) | |
| Asus ProArt StudioBook Pro 17 W700G3T | |
| Dell XPS 17 9720 | |
| LG Gram 17 (2022) | |
| Lenovo ThinkBook Plus Gen2 Core i5 | |
| AIDA64 / FPU Julia | |
| Lenovo ThinkBook Plus Gen3 | |
| Average Intel Core i7-12700H (12439 - 90760, n=64) | |
| Asus ProArt StudioBook Pro 17 W700G3T | |
| Dell XPS 17 9720 | |
| LG Gram 17 (2022) | |
| Lenovo ThinkBook Plus Gen2 Core i5 | |
| AIDA64 / CPU SHA3 | |
| Average Intel Core i7-12700H (833 - 4242, n=64) | |
| Lenovo ThinkBook Plus Gen3 | |
| Dell XPS 17 9720 | |
| Asus ProArt StudioBook Pro 17 W700G3T | |
| Lenovo ThinkBook Plus Gen2 Core i5 | |
| LG Gram 17 (2022) | |
| AIDA64 / CPU Queen | |
| Dell XPS 17 9720 | |
| Average Intel Core i7-12700H (57923 - 103202, n=63) | |
| Lenovo ThinkBook Plus Gen3 | |
| Asus ProArt StudioBook Pro 17 W700G3T | |
| LG Gram 17 (2022) | |
| Lenovo ThinkBook Plus Gen2 Core i5 | |
| AIDA64 / FPU SinJulia | |
| Average Intel Core i7-12700H (3249 - 9939, n=64) | |
| Dell XPS 17 9720 | |
| Lenovo ThinkBook Plus Gen3 | |
| Asus ProArt StudioBook Pro 17 W700G3T | |
| LG Gram 17 (2022) | |
| Lenovo ThinkBook Plus Gen2 Core i5 | |
| AIDA64 / FPU Mandel | |
| Lenovo ThinkBook Plus Gen3 | |
| Average Intel Core i7-12700H (7135 - 44760, n=64) | |
| Asus ProArt StudioBook Pro 17 W700G3T | |
| Dell XPS 17 9720 | |
| LG Gram 17 (2022) | |
| Lenovo ThinkBook Plus Gen2 Core i5 | |
| AIDA64 / CPU AES | |
| Average Intel Core i7-12700H (31839 - 144360, n=64) | |
| Dell XPS 17 9720 | |
| Lenovo ThinkBook Plus Gen3 | |
| Lenovo ThinkBook Plus Gen2 Core i5 | |
| LG Gram 17 (2022) | |
| Asus ProArt StudioBook Pro 17 W700G3T | |
| AIDA64 / CPU ZLib | |
| Average Intel Core i7-12700H (305 - 1171, n=64) | |
| Dell XPS 17 9720 | |
| Lenovo ThinkBook Plus Gen3 | |
| Asus ProArt StudioBook Pro 17 W700G3T | |
| LG Gram 17 (2022) | |
| Lenovo ThinkBook Plus Gen2 Core i5 | |
| Gigabyte Aero 17 HDR YD | |
| AIDA64 / FP64 Ray-Trace | |
| Lenovo ThinkBook Plus Gen3 | |
| Average Intel Core i7-12700H (1437 - 9692, n=64) | |
| Asus ProArt StudioBook Pro 17 W700G3T | |
| Dell XPS 17 9720 | |
| LG Gram 17 (2022) | |
| Lenovo ThinkBook Plus Gen2 Core i5 | |
| AIDA64 / CPU PhotoWorxx | |
| Dell XPS 17 9720 | |
| Lenovo ThinkBook Plus Gen3 | |
| Lenovo ThinkBook Plus Gen2 Core i5 | |
| LG Gram 17 (2022) | |
| Average Intel Core i7-12700H (12863 - 52207, n=64) | |
| Asus ProArt StudioBook Pro 17 W700G3T | |
系统性能
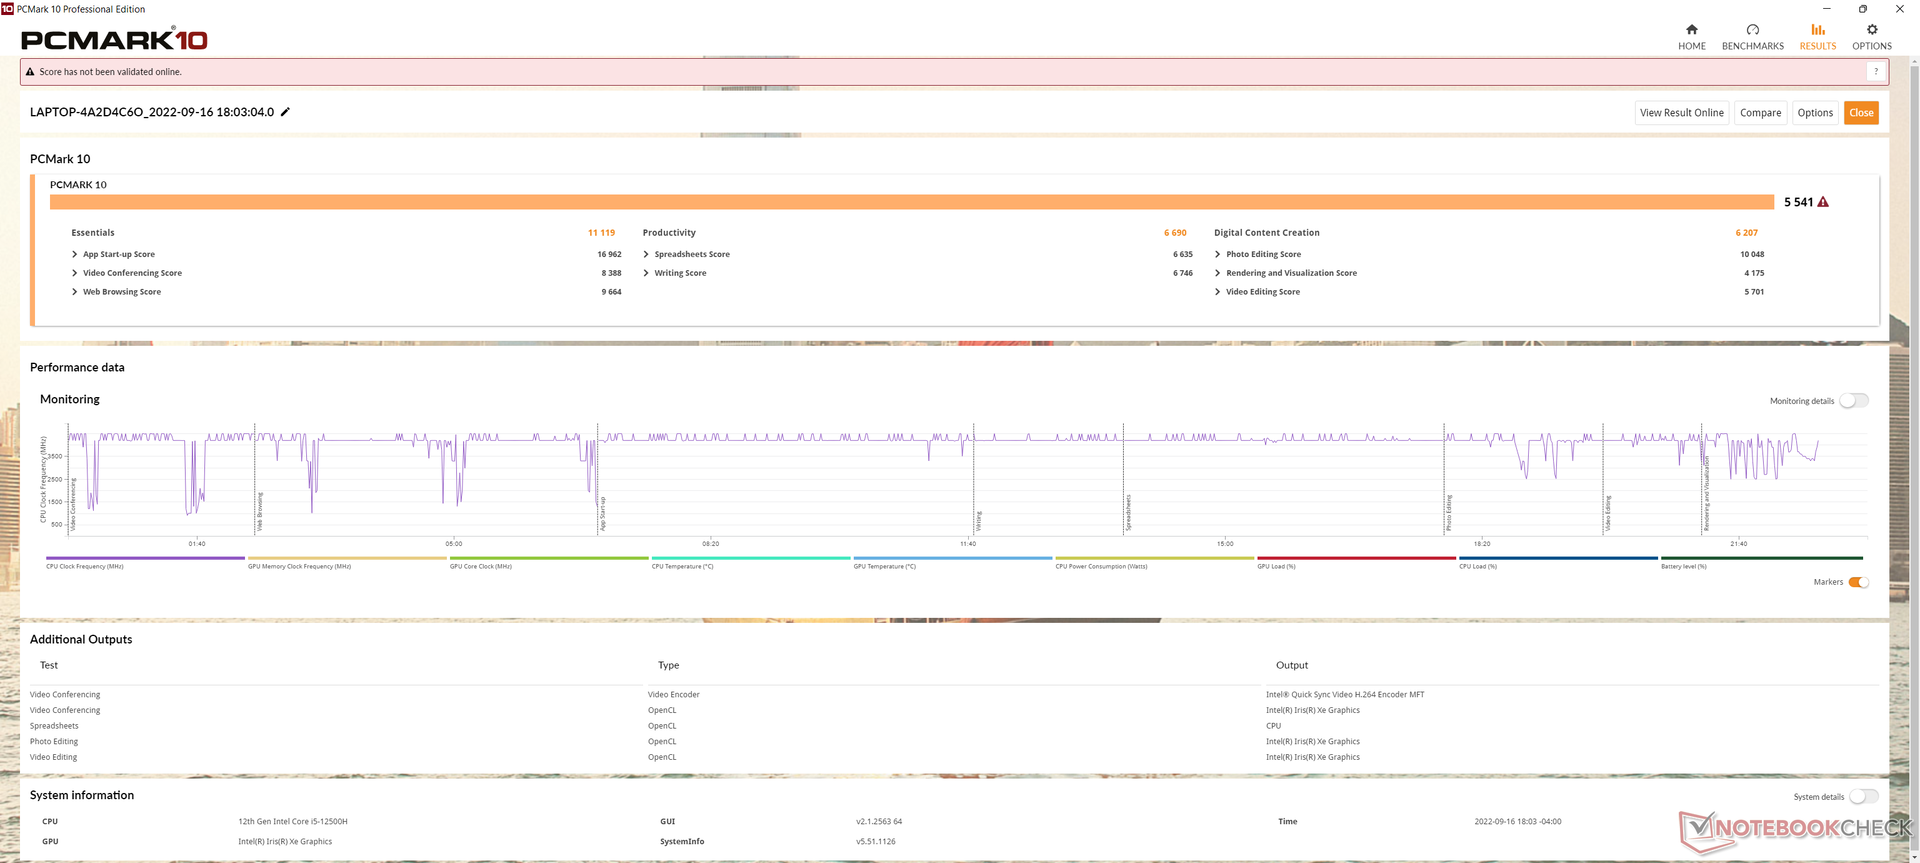
PCMark 10的结果高于许多运行在酷睿U系列或较早的H系列CPU上的笔记本电脑,而低于那些带有专用GPU的笔记本电脑,如XPS 17 9720.
CrossMark: Overall | Productivity | Creativity | Responsiveness
| PCMark 10 / Score | |
| Gigabyte Aero 17 HDR YD | |
| Dell XPS 17 9720 | |
| Average Intel Core i7-12700H, Intel Iris Xe Graphics G7 96EUs (5541 - 6281, n=8) | |
| Lenovo ThinkBook Plus Gen3 | |
| LG Gram 17 (2022) | |
| Asus ProArt StudioBook Pro 17 W700G3T | |
| Lenovo ThinkBook Plus Gen2 Core i5 | |
| PCMark 10 / Essentials | |
| Lenovo ThinkBook Plus Gen3 | |
| Average Intel Core i7-12700H, Intel Iris Xe Graphics G7 96EUs (9991 - 11699, n=8) | |
| Dell XPS 17 9720 | |
| Lenovo ThinkBook Plus Gen2 Core i5 | |
| Gigabyte Aero 17 HDR YD | |
| LG Gram 17 (2022) | |
| Asus ProArt StudioBook Pro 17 W700G3T | |
| PCMark 10 / Productivity | |
| Dell XPS 17 9720 | |
| Gigabyte Aero 17 HDR YD | |
| Asus ProArt StudioBook Pro 17 W700G3T | |
| Average Intel Core i7-12700H, Intel Iris Xe Graphics G7 96EUs (6690 - 8038, n=8) | |
| Lenovo ThinkBook Plus Gen3 | |
| LG Gram 17 (2022) | |
| Lenovo ThinkBook Plus Gen2 Core i5 | |
| PCMark 10 / Digital Content Creation | |
| Gigabyte Aero 17 HDR YD | |
| Dell XPS 17 9720 | |
| Average Intel Core i7-12700H, Intel Iris Xe Graphics G7 96EUs (6207 - 7401, n=8) | |
| Lenovo ThinkBook Plus Gen3 | |
| LG Gram 17 (2022) | |
| Asus ProArt StudioBook Pro 17 W700G3T | |
| Lenovo ThinkBook Plus Gen2 Core i5 | |
| CrossMark / Overall | |
| Dell XPS 17 9720 | |
| Average Intel Core i7-12700H, Intel Iris Xe Graphics G7 96EUs (1492 - 1907, n=8) | |
| Lenovo ThinkBook Plus Gen3 | |
| LG Gram 17 (2022) | |
| CrossMark / Productivity | |
| Dell XPS 17 9720 | |
| Average Intel Core i7-12700H, Intel Iris Xe Graphics G7 96EUs (1499 - 1832, n=8) | |
| Lenovo ThinkBook Plus Gen3 | |
| LG Gram 17 (2022) | |
| CrossMark / Creativity | |
| Dell XPS 17 9720 | |
| Lenovo ThinkBook Plus Gen3 | |
| Average Intel Core i7-12700H, Intel Iris Xe Graphics G7 96EUs (1507 - 2016, n=8) | |
| LG Gram 17 (2022) | |
| CrossMark / Responsiveness | |
| Dell XPS 17 9720 | |
| Average Intel Core i7-12700H, Intel Iris Xe Graphics G7 96EUs (1384 - 1831, n=8) | |
| LG Gram 17 (2022) | |
| Lenovo ThinkBook Plus Gen3 | |
| PCMark 10 Score | 5541 points | |
Help | ||
| AIDA64 / Memory Copy | |
| Dell XPS 17 9720 | |
| Lenovo ThinkBook Plus Gen3 | |
| LG Gram 17 (2022) | |
| Lenovo ThinkBook Plus Gen2 Core i5 | |
| Average Intel Core i7-12700H (25615 - 80511, n=64) | |
| Asus ProArt StudioBook Pro 17 W700G3T | |
| AIDA64 / Memory Read | |
| Lenovo ThinkBook Plus Gen3 | |
| Dell XPS 17 9720 | |
| LG Gram 17 (2022) | |
| Lenovo ThinkBook Plus Gen2 Core i5 | |
| Average Intel Core i7-12700H (25586 - 79442, n=64) | |
| Asus ProArt StudioBook Pro 17 W700G3T | |
| AIDA64 / Memory Write | |
| Dell XPS 17 9720 | |
| Lenovo ThinkBook Plus Gen2 Core i5 | |
| LG Gram 17 (2022) | |
| Lenovo ThinkBook Plus Gen3 | |
| Average Intel Core i7-12700H (23679 - 88660, n=64) | |
| Asus ProArt StudioBook Pro 17 W700G3T | |
| AIDA64 / Memory Latency | |
| Lenovo ThinkBook Plus Gen3 | |
| LG Gram 17 (2022) | |
| Lenovo ThinkBook Plus Gen2 Core i5 | |
| Dell XPS 17 9720 | |
| Average Intel Core i7-12700H (76.2 - 133.9, n=62) | |
| Asus ProArt StudioBook Pro 17 W700G3T | |
| Gigabyte Aero 17 HDR YD | |
* ... smaller is better
DPC延时
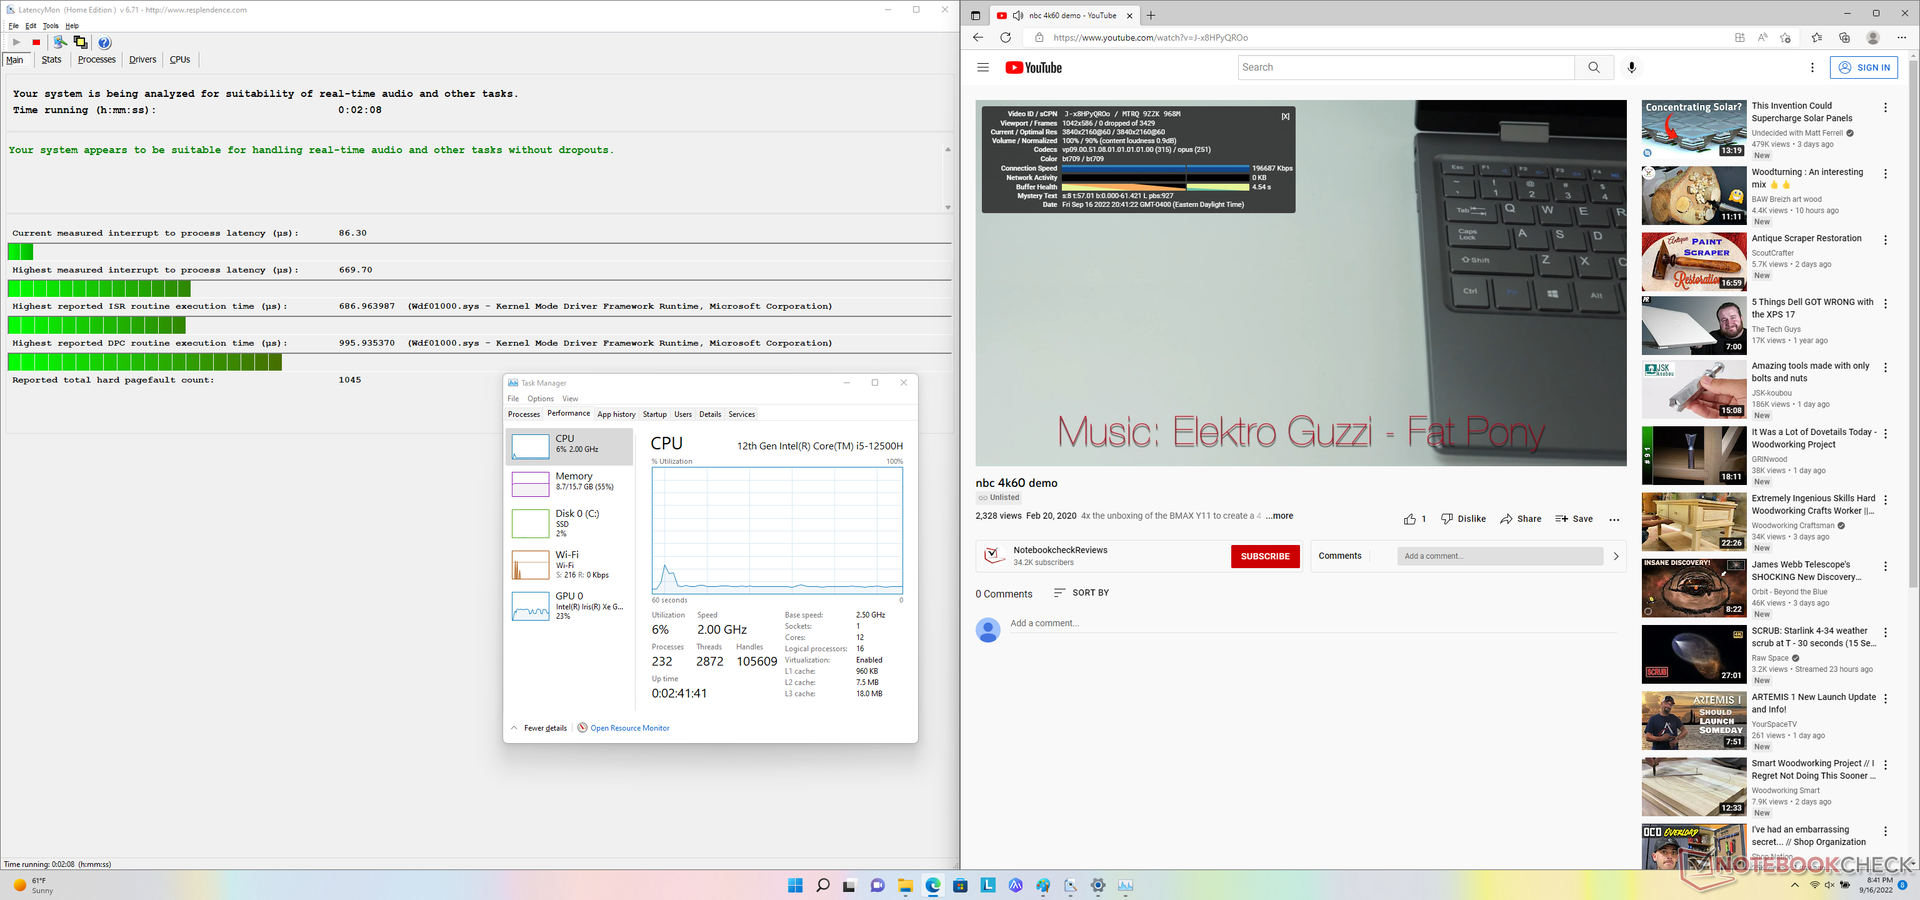
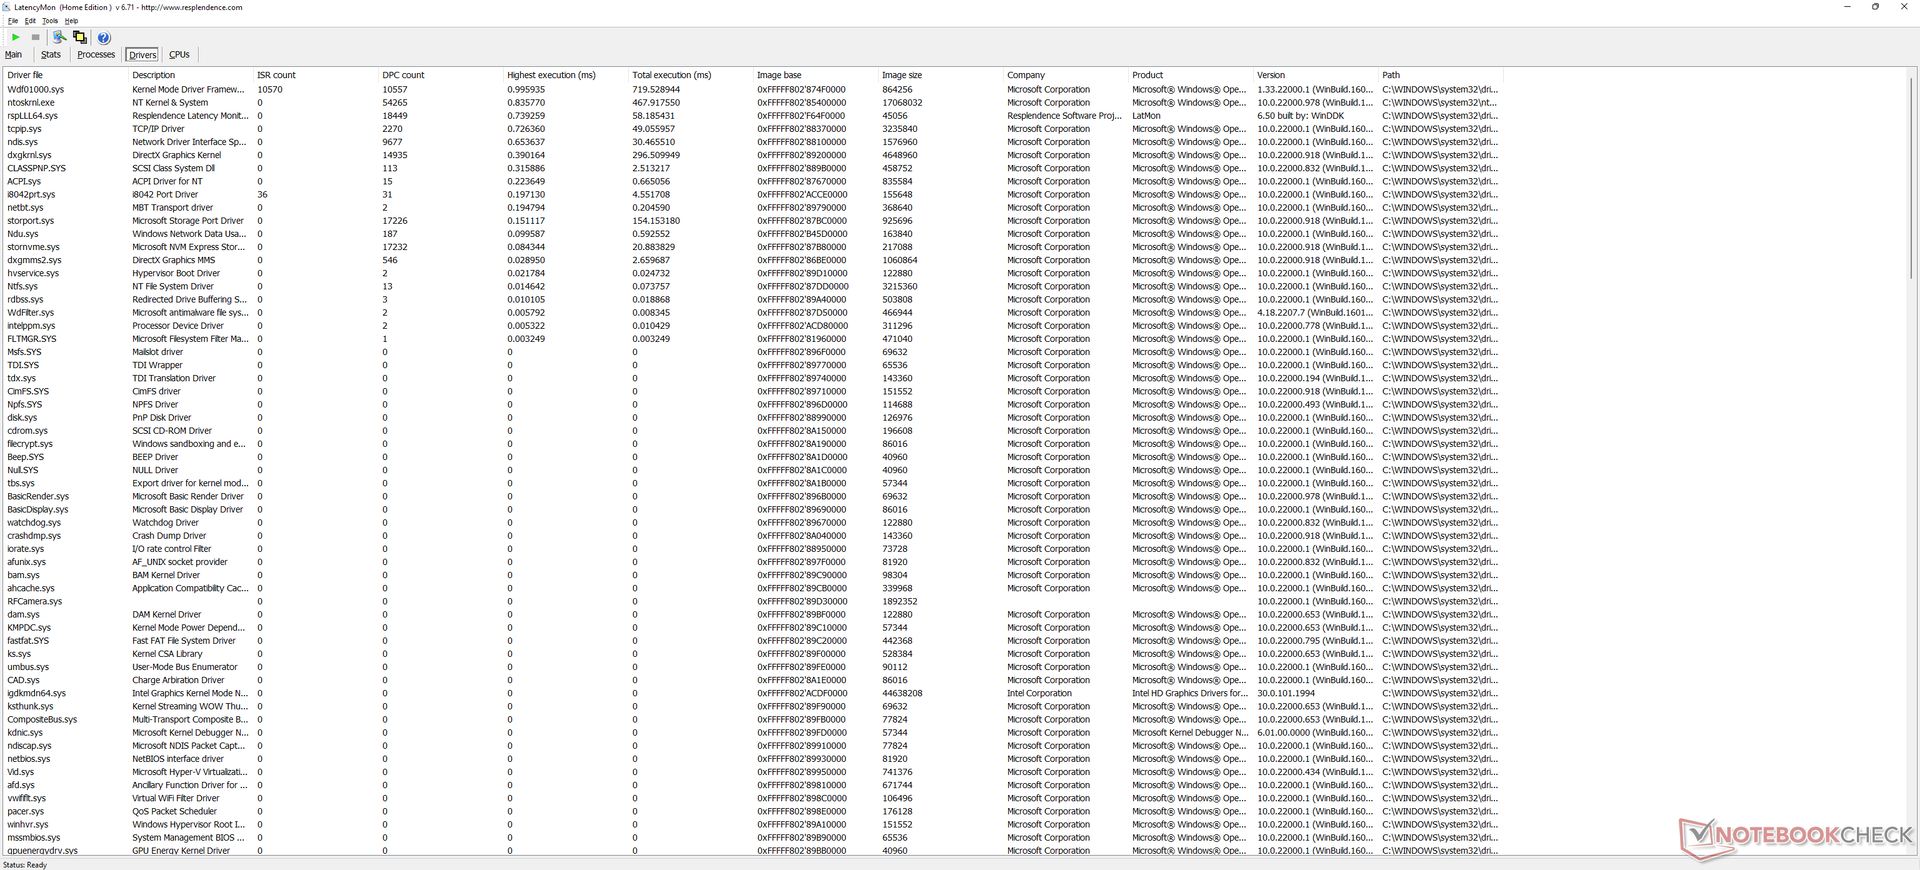
LatencyMon显示,在打开我们主页的多个浏览器标签或运行Prime95压力30秒时,没有重大的DPC问题。在60FPS下的4K视频播放也是完美的,没有掉帧。
| DPC Latencies / LatencyMon - interrupt to process latency (max), Web, Youtube, Prime95 | |
| Gigabyte Aero 17 HDR YD | |
| Lenovo ThinkBook Plus Gen2 Core i5 | |
| Dell XPS 17 9720 | |
| Lenovo ThinkBook Plus Gen3 | |
| LG Gram 17 (2022) | |
* ... smaller is better
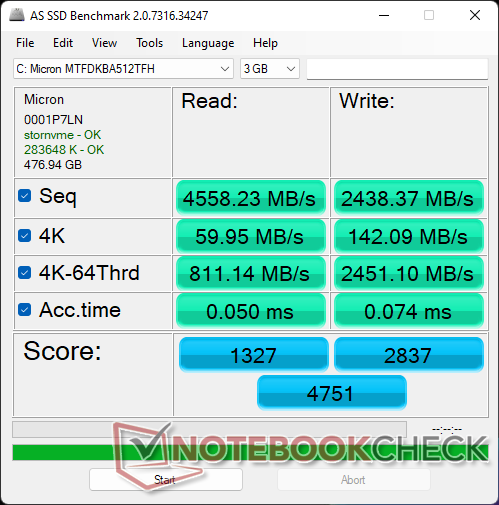
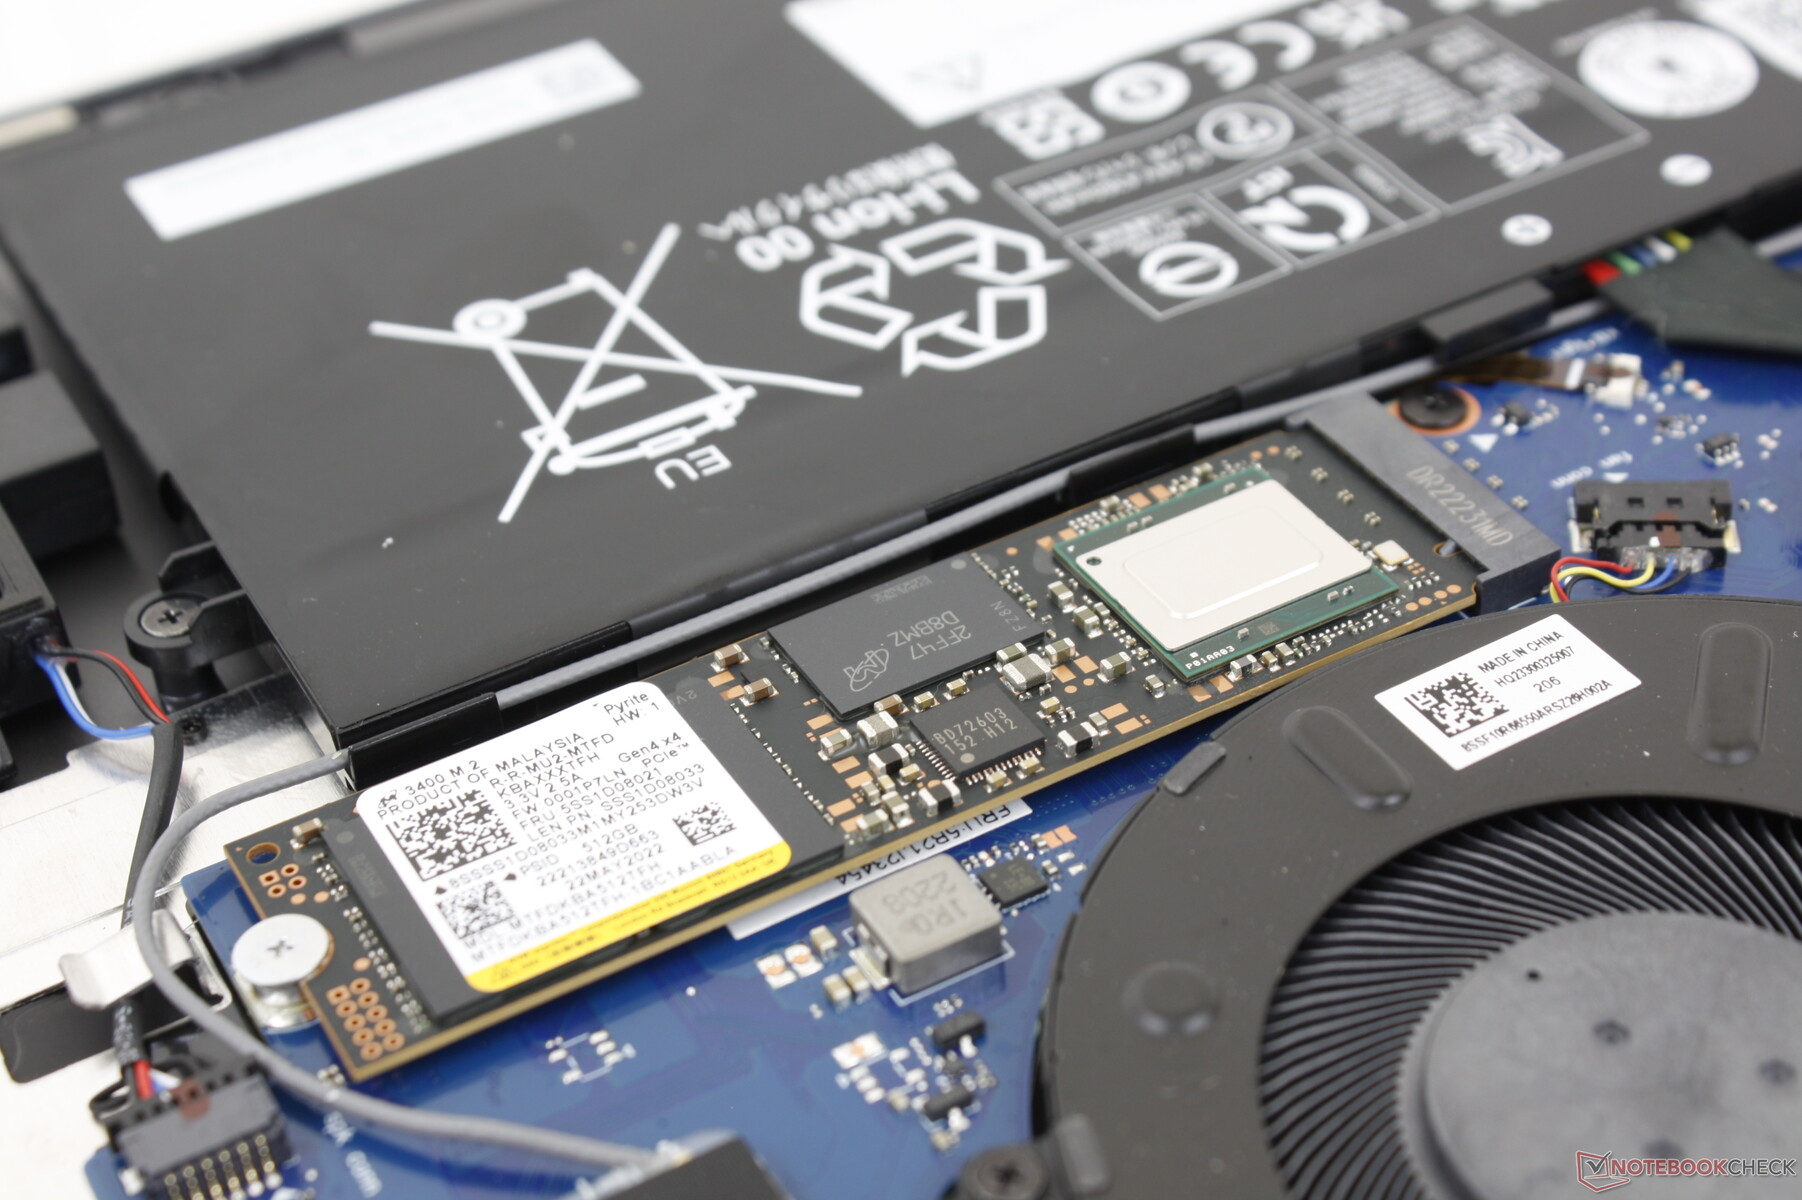
存储设备
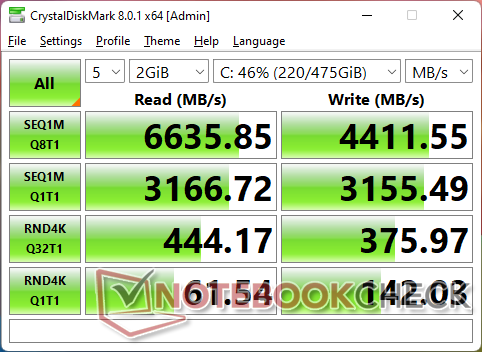
我们的测试设备配备了相同的512GB美光3400 MTFDKBA512TFH固态硬盘,与戴尔XPS 17 9720上的一样。虽然没有三星PM9A1系列那么快,但该驱动器没有表现出节流问题,即使在压力下也能保持稳定的性能水平。

| Drive Performance rating - Percent | |
| Gigabyte Aero 17 HDR YD | |
| LG Gram 17 (2022) | |
| Lenovo ThinkBook Plus Gen2 Core i5 | |
| Dell XPS 17 9720 | |
| Lenovo ThinkBook Plus Gen3 | |
| Asus ProArt StudioBook Pro 17 W700G3T | |
* ... smaller is better
Disk Throttling: DiskSpd Read Loop, Queue Depth 8
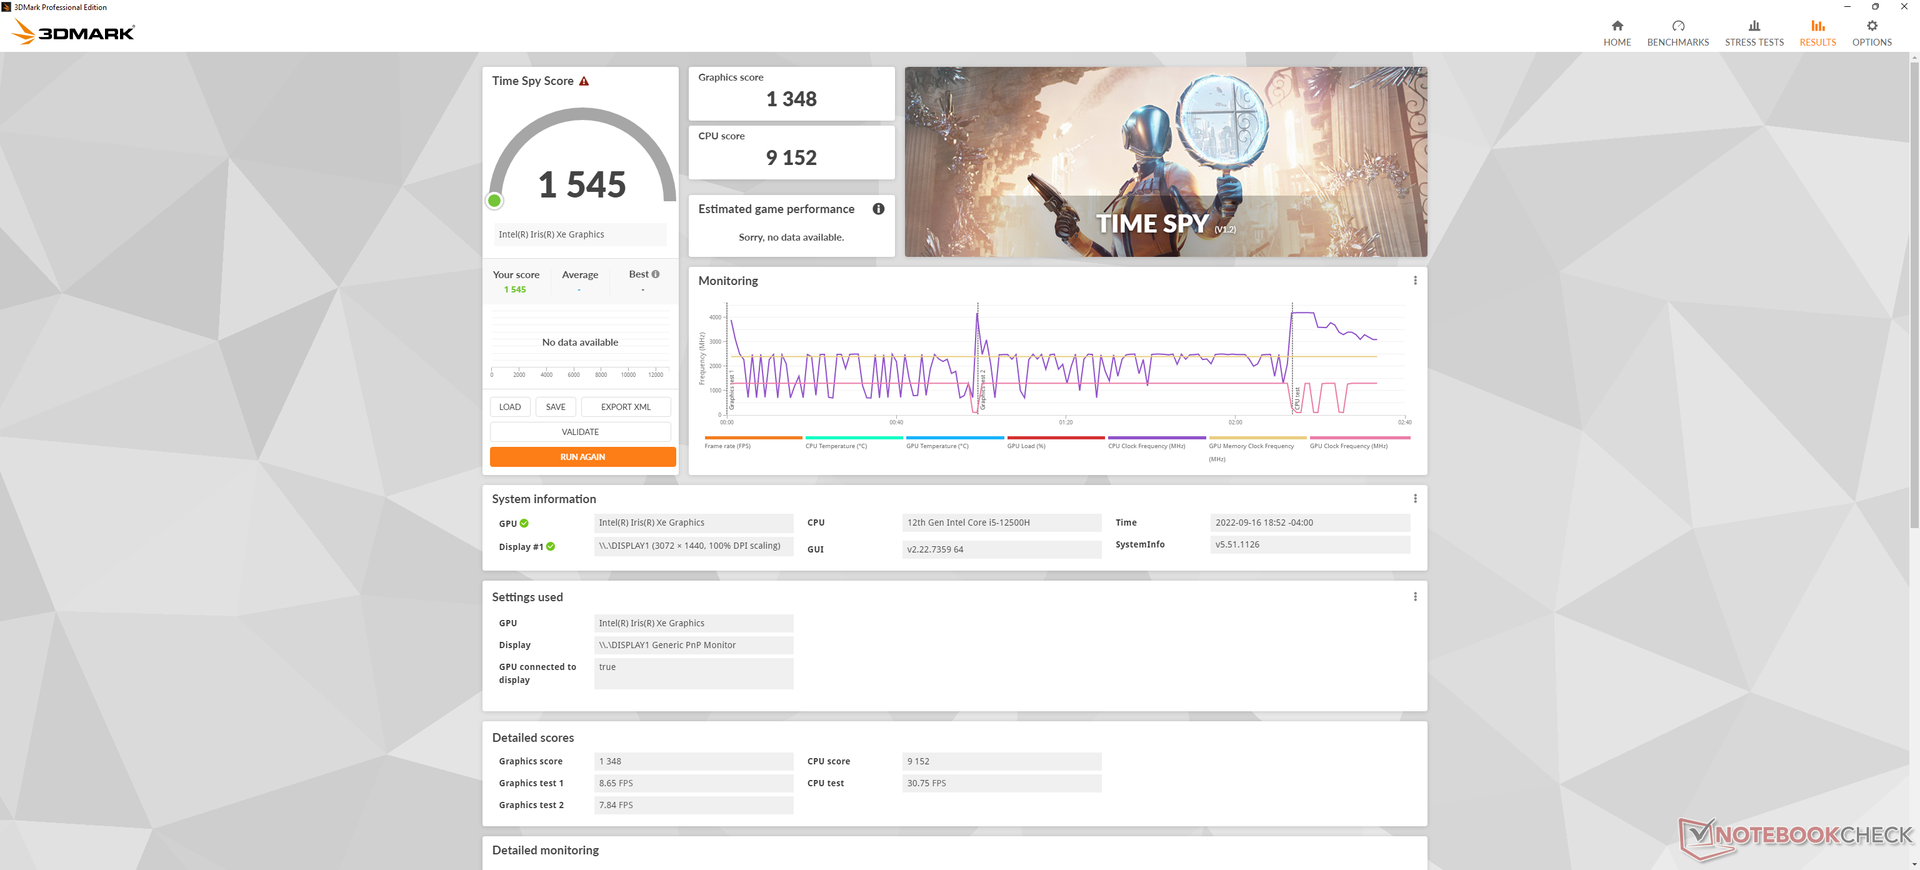
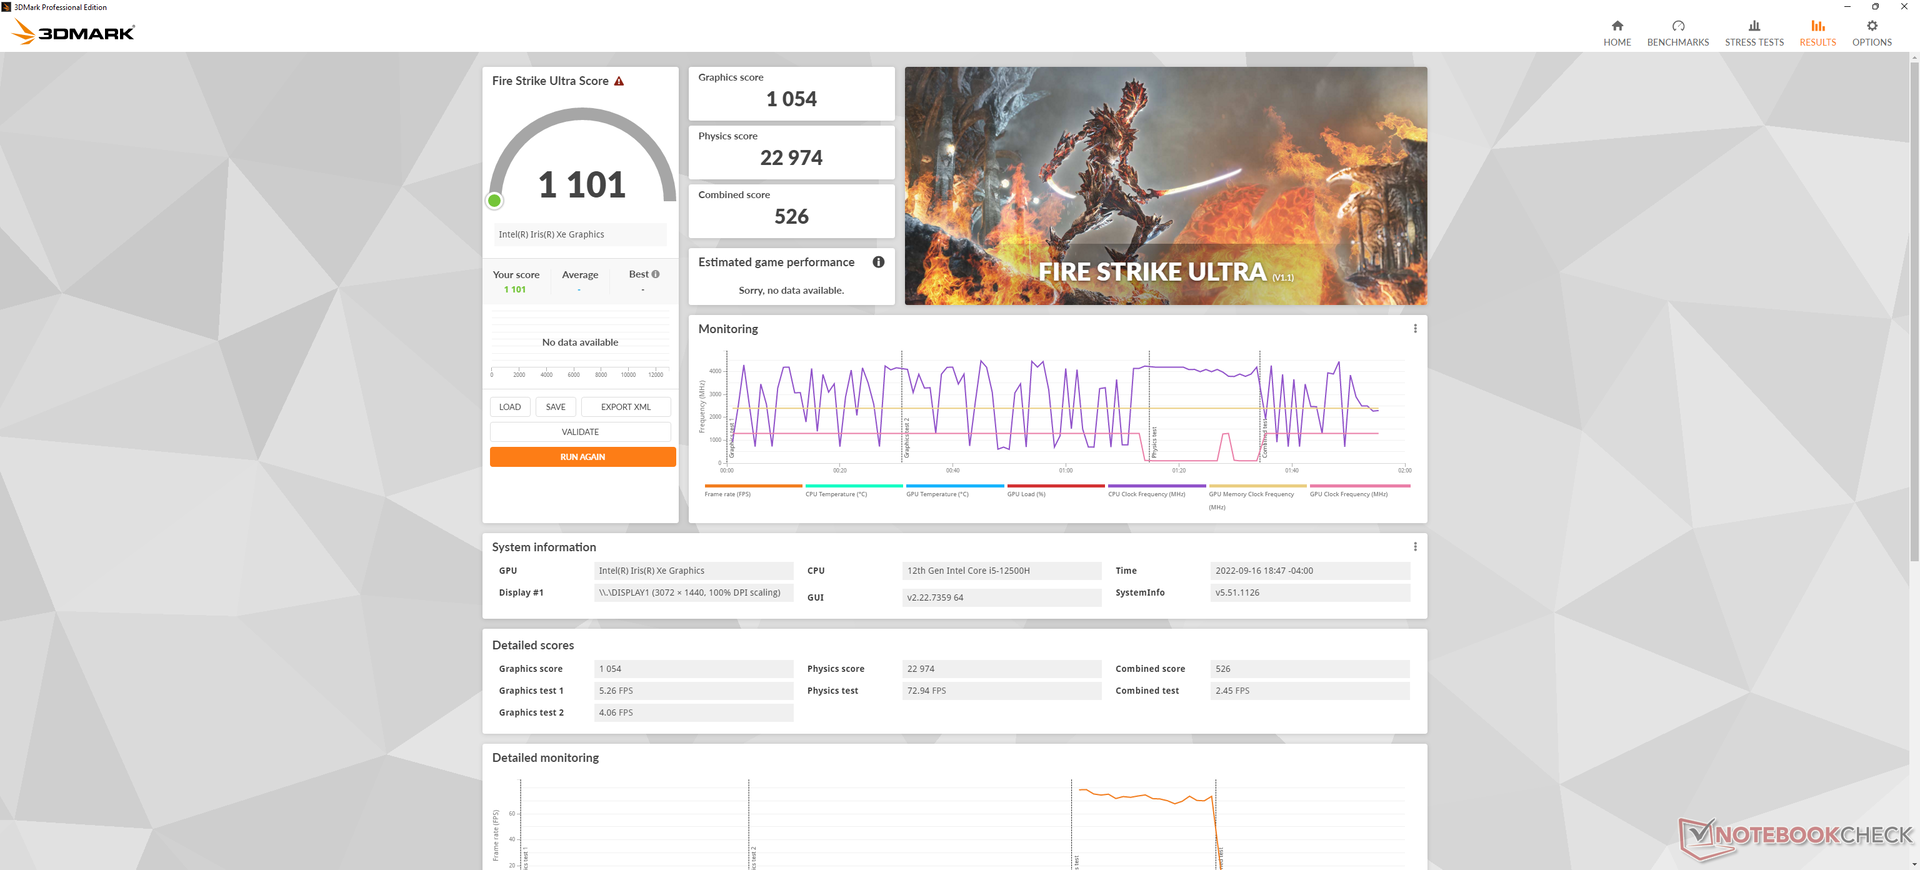
GPU性能 - 仅集成Iris Xe
原始图形性能比我们数据库中具有相同集成度的平均笔记本电脑慢几个百分点。 Iris Xe 96 EUsGPU。太糟糕了,没有独立的GeForce GTX/RTX甚至MX选项可供选择,这可以大大提升图形性能。考虑到大型17英寸类别,集成的英特尔解决方案是偏慢的。
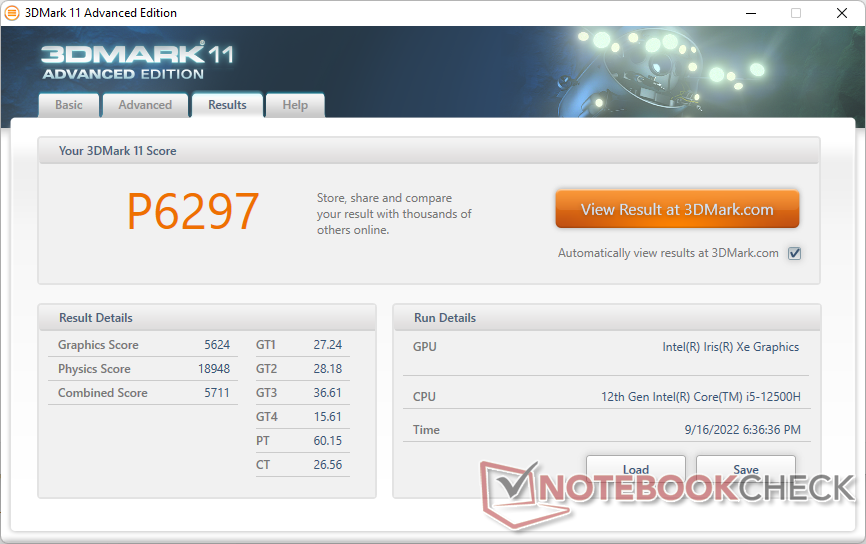
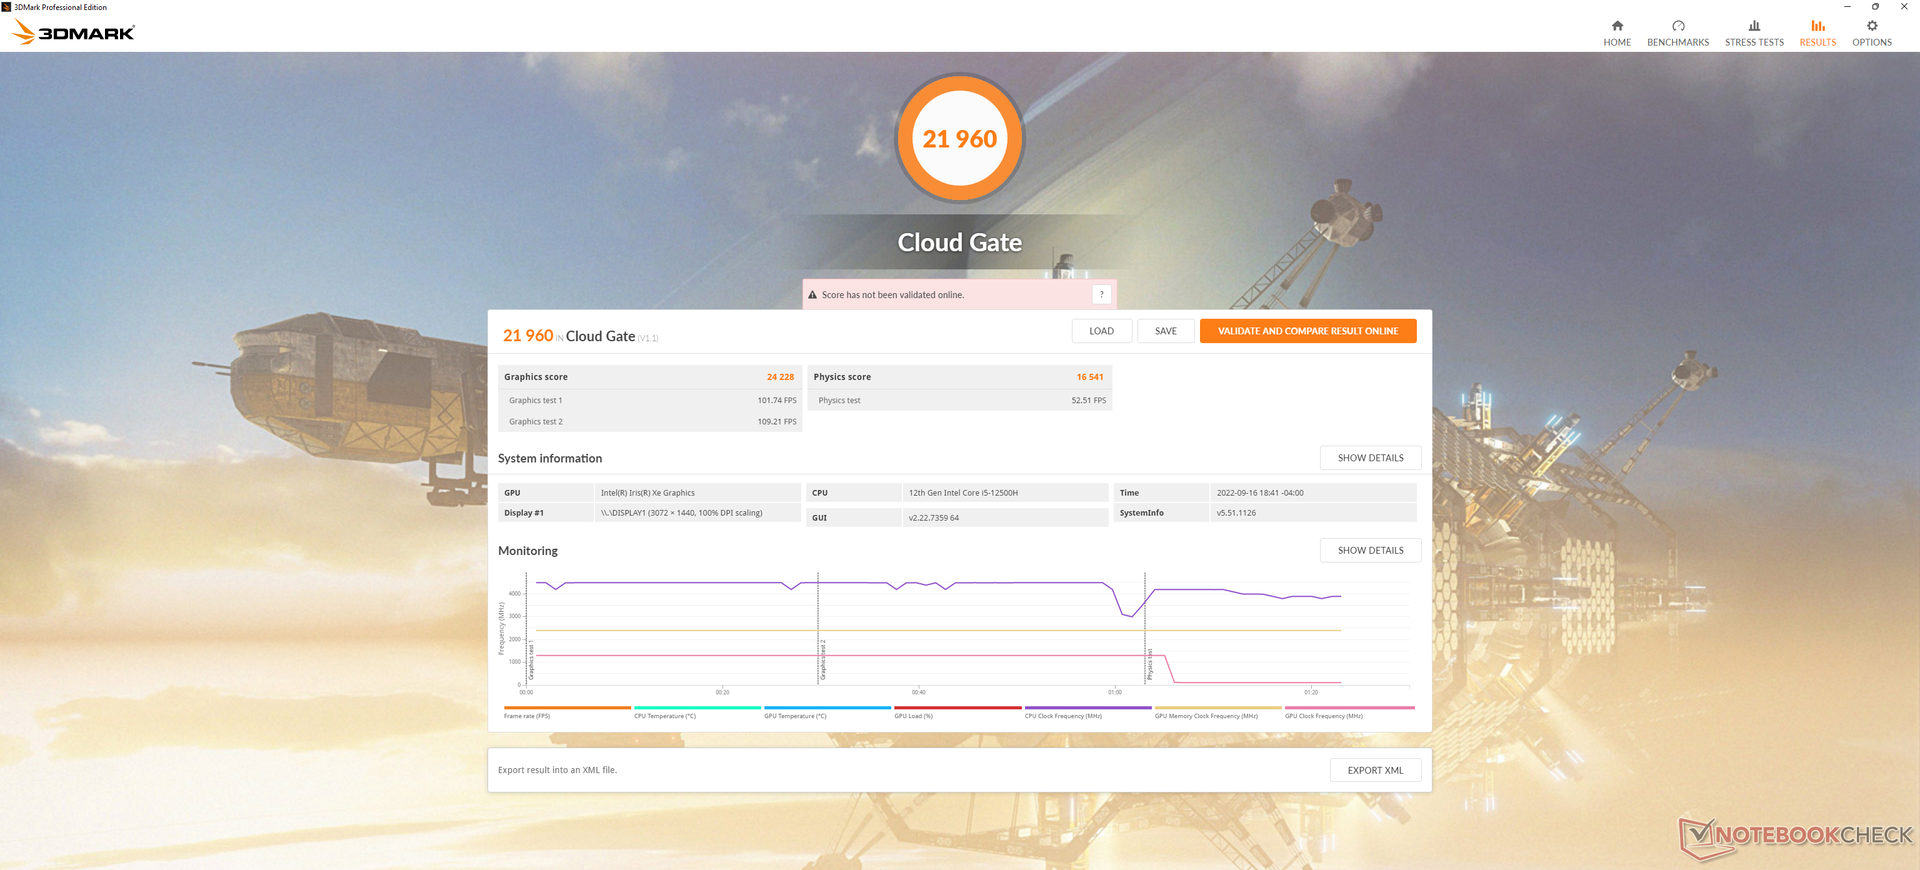
| 3DMark 11 Performance | 6297 points | |
| 3DMark Cloud Gate Standard Score | 21960 points | |
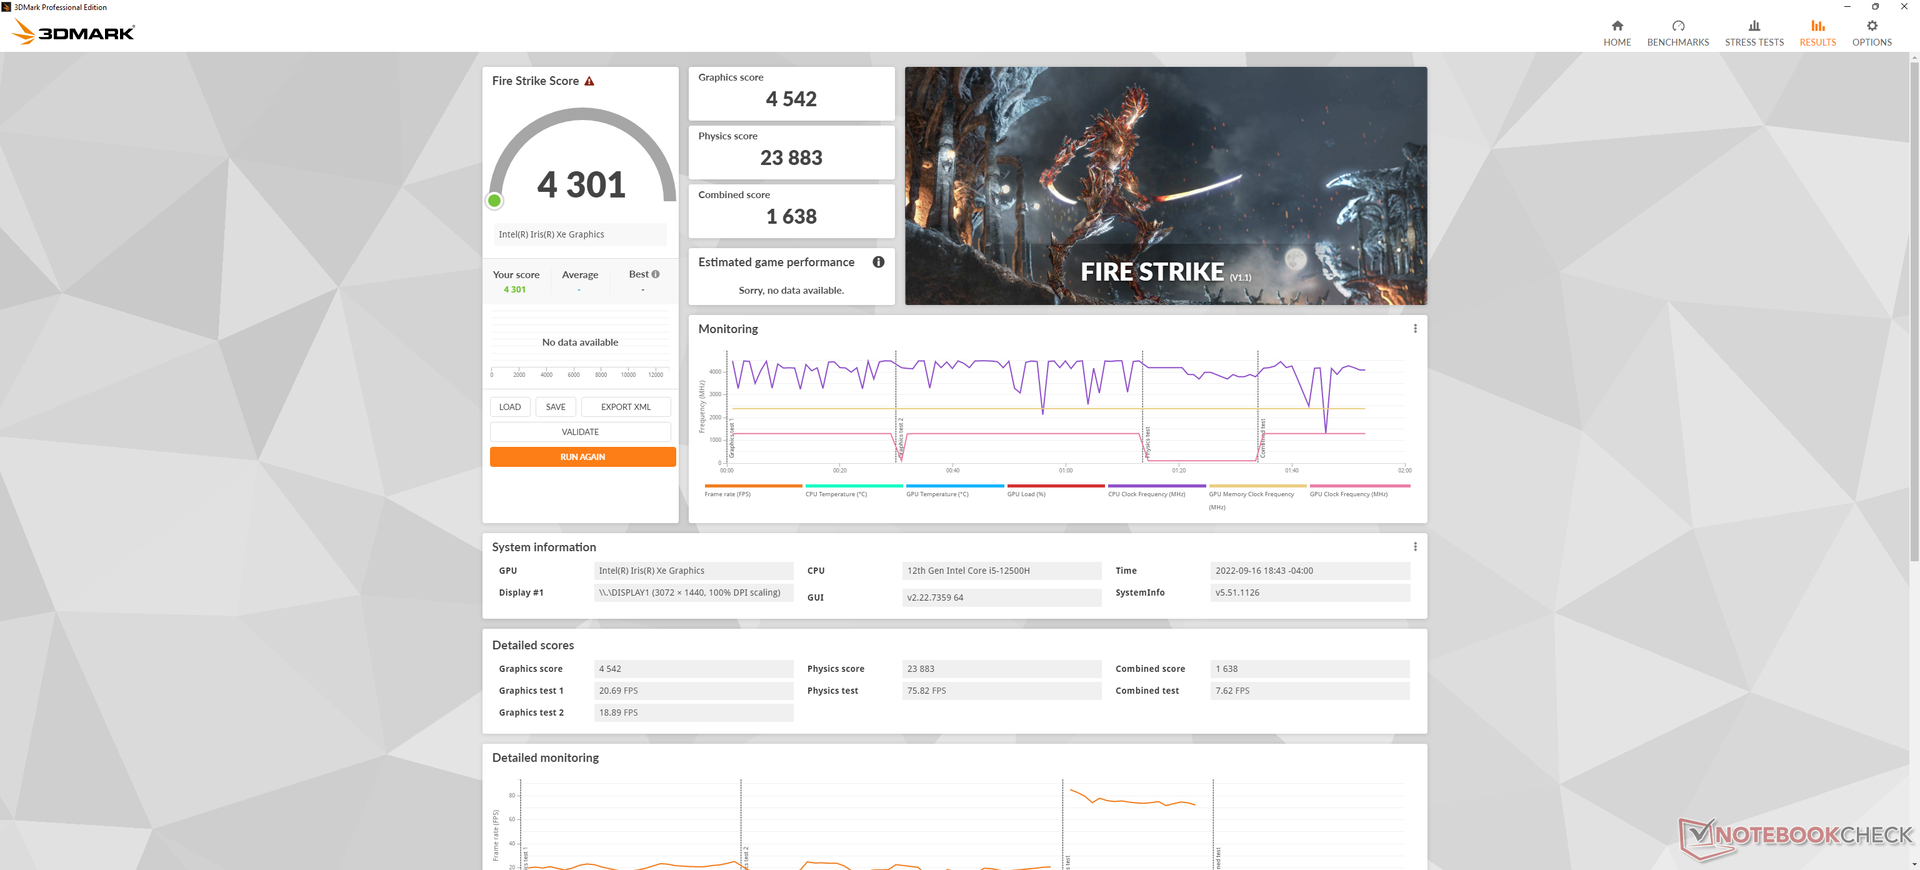
| 3DMark Fire Strike Score | 4301 points | |
| 3DMark Time Spy Score | 1545 points | |
Help | ||
Witcher 3 FPS Chart
| low | med. | high | ultra | |
|---|---|---|---|---|
| GTA V (2015) | 100.1 | 60.9 | 20 | 8.96 |
| The Witcher 3 (2015) | 87.1 | 51.2 | 30.4 | 13.4 |
| Dota 2 Reborn (2015) | 126 | 94.1 | 48.6 | 44.9 |
| Final Fantasy XV Benchmark (2018) | 39 | 21.3 | 16.8 | |
| X-Plane 11.11 (2018) | 43.5 | 34 | 30.4 | |
| Strange Brigade (2018) | 74.6 | 32 | 25.5 | 20.2 |
| Cyberpunk 2077 1.6 (2022) | 16 | 13.4 | 10.6 | 8.6 |
排放
系统噪音 - 负载下声音大
在桌面上空转时的风扇噪音在26至28 dB(A)之间,取决于电源配置文件,而静音背景为22.7 dB(A)。因此,在大多数情况下,内部风扇从来没有真正安静过,这也许是使用酷睿H系列CPU而不是较慢但更高效的酷睿U选项的后果。如果在极限性能模式下进行网页浏览或文字处理,风扇的脉动会达到35 dB(A),因此我们建议在运行要求不高的应用程序时采用平衡或 "智能冷却 "模式。
运行游戏等高负载时,风扇噪音在39-43 dB(A)之间,比小型ThinkBook Plus Gen 2的噪音大得多。
Noise level
| Idle |
| 26.3 / 26.3 / 27.9 dB(A) |
| Load |
| 42.2 / 46.5 dB(A) |
 | ||
30 dB silent 40 dB(A) audible 50 dB(A) loud |
||
min: | ||
| Lenovo ThinkBook Plus Gen3 Iris Xe G7 96EUs, i7-12700H, Micron 3400 MTFDKBA512TFH 512GB | Lenovo ThinkBook Plus Gen2 Core i5 Iris Xe G7 80EUs, i5-1130G7, Samsung PM9A1 MZVL2512HCJQ | Asus ProArt StudioBook Pro 17 W700G3T Quadro RTX 3000 Max-Q, i7-9750H, Samsung SSD PM981 MZVLB1T0HALR | LG Gram 17 (2022) Iris Xe G7 80EUs, i5-1240P, Samsung PM9A1 MZVL2512HCJQ | Dell XPS 17 9720 GeForce RTX 3050 4GB Laptop GPU, i7-12700H, Micron 3400 MTFDKBA512TFH 512GB | Gigabyte Aero 17 HDR YD GeForce RTX 3080 Laptop GPU, i9-11980HK, Samsung PM9A1 MZVL2512HCJQ | |
|---|---|---|---|---|---|---|
| Noise | 6% | 2% | 6% | -1% | -21% | |
| off / environment * (dB) | 22.7 | 25.4 -12% | 29.4 -30% | 25.1 -11% | 24 -6% | 25 -10% |
| Idle Minimum * (dB) | 26.3 | 25.4 3% | 29.4 -12% | 25.12 4% | 24 9% | 30 -14% |
| Idle Average * (dB) | 26.3 | 27.4 -4% | 29.9 -14% | 25.15 4% | 24 9% | 32 -22% |
| Idle Maximum * (dB) | 27.9 | 32.2 -15% | 29.9 -7% | 26 7% | 24 14% | 41 -47% |
| Load Average * (dB) | 42.2 | 32.2 24% | 31.6 25% | 36.9 13% | 43.9 -4% | 43 -2% |
| Witcher 3 ultra * (dB) | 39.8 | 32.2 19% | 31.6 21% | 48.4 -22% | 51 -28% | |
| Load Maximum * (dB) | 46.5 | 34.5 26% | 31.6 32% | 37.2 20% | 48.4 -4% | 59 -27% |
* ... smaller is better
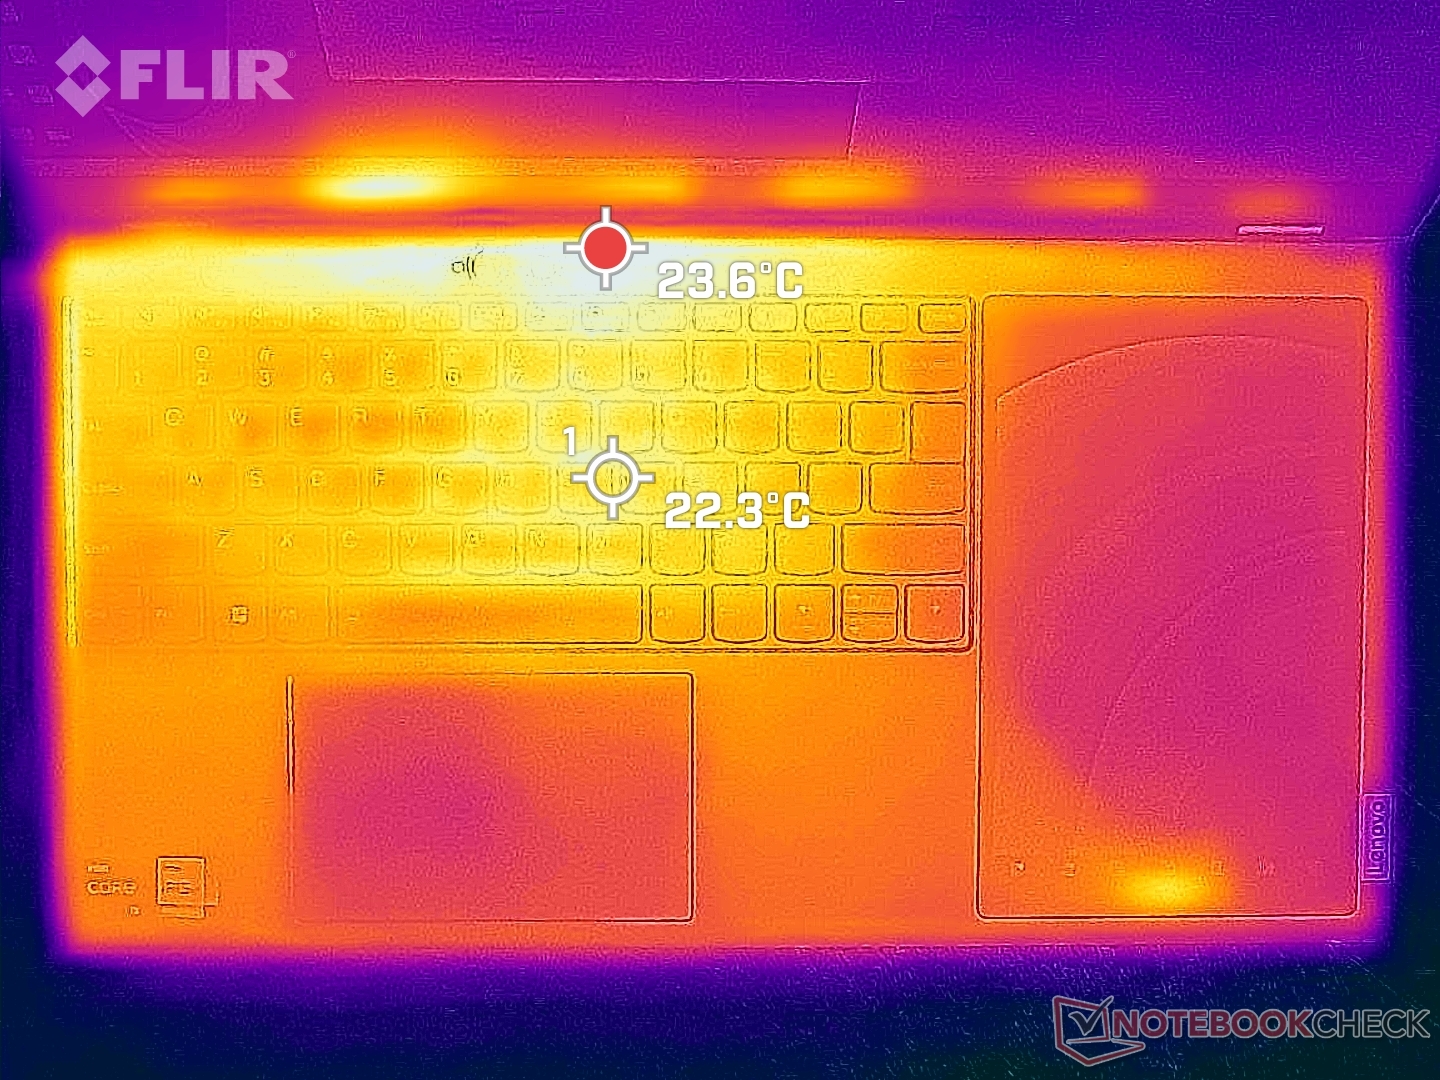
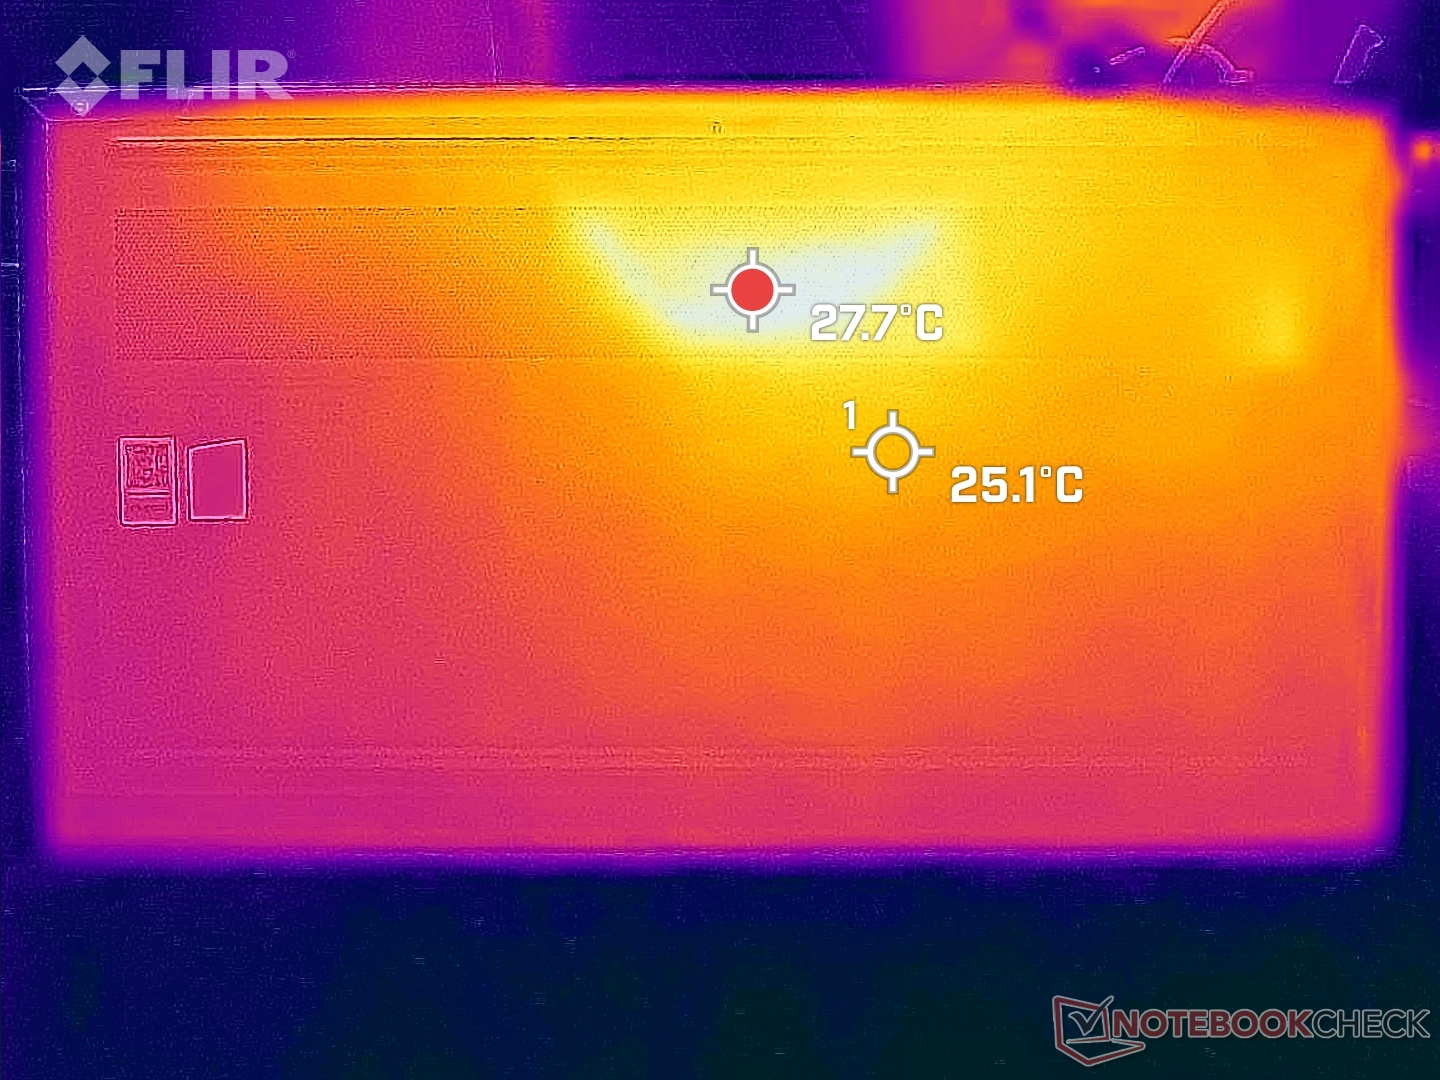
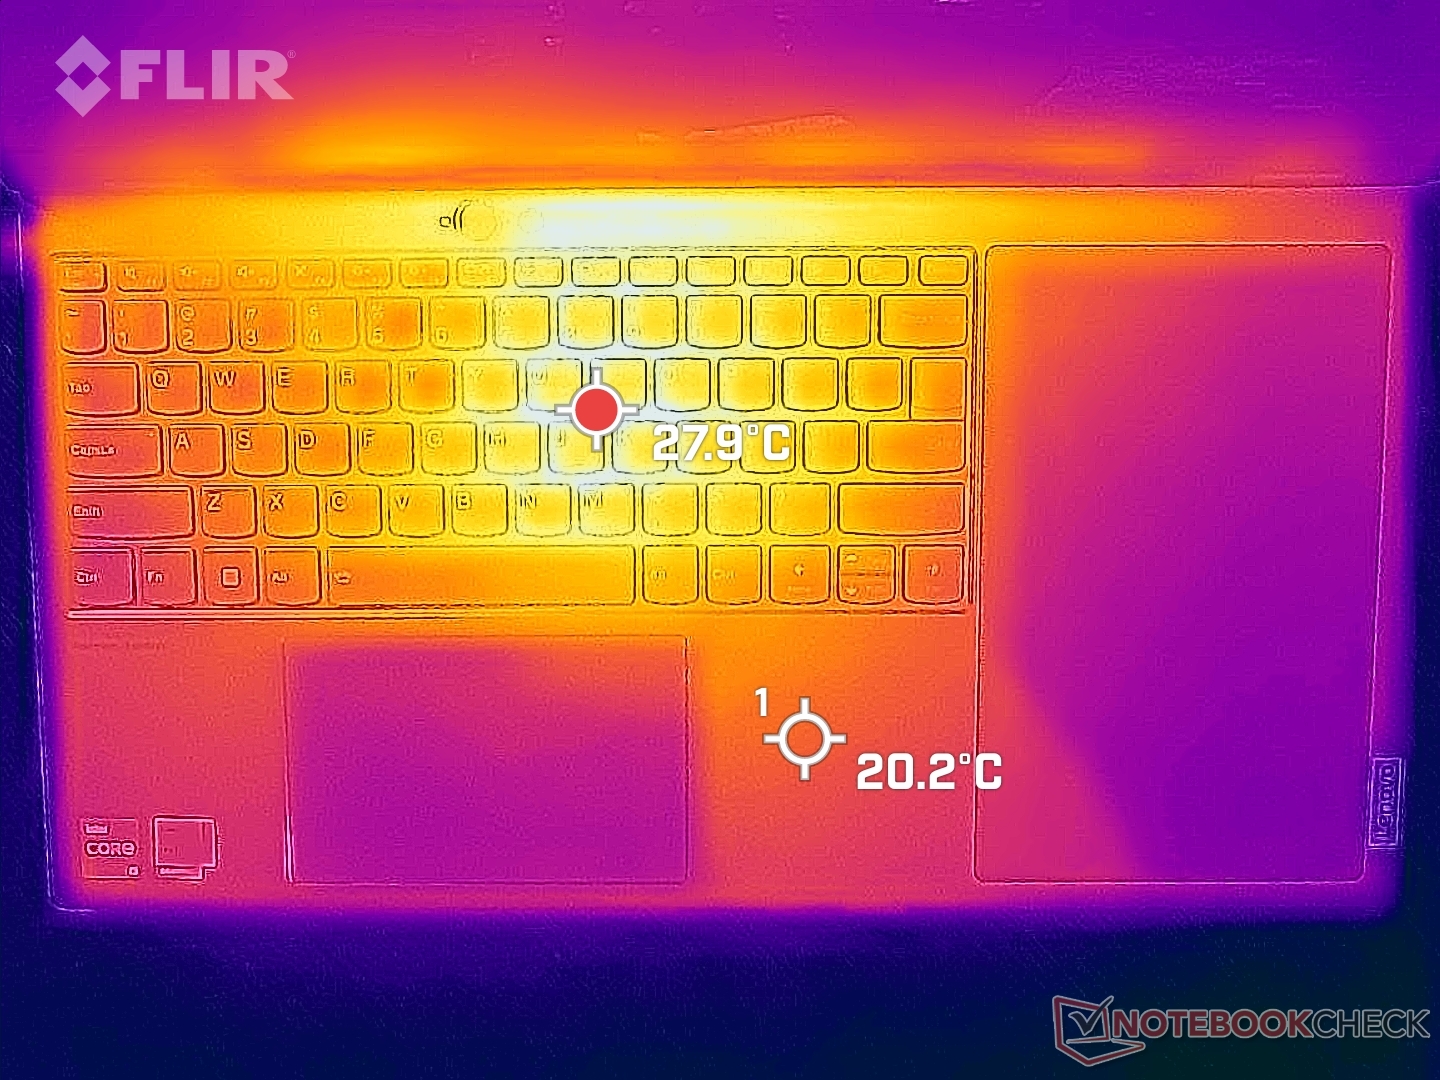
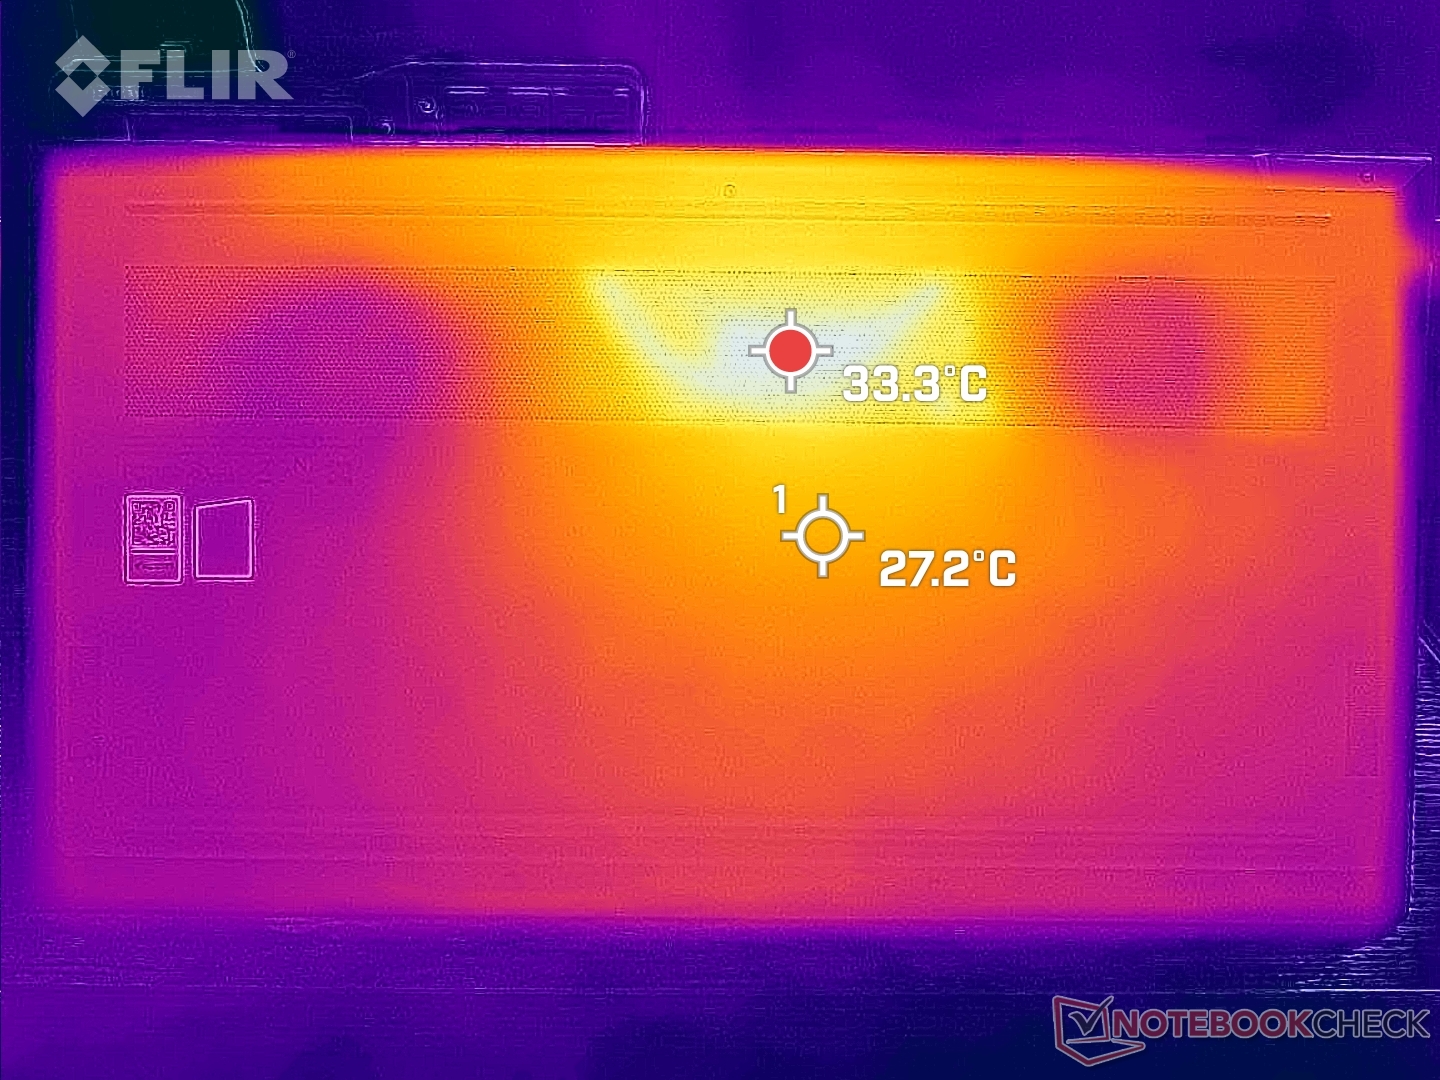
温度 - 非常酷
即使在运行苛刻的负载时,表面温度也比预期的低。热点在顶部和底部分别只有约33摄氏度,而50摄氏度或更高的温度在 LG Gram 17在类似条件下的温度为50℃或更高。宽21:10长宽比的较大表面积对整体温度发展有积极影响。
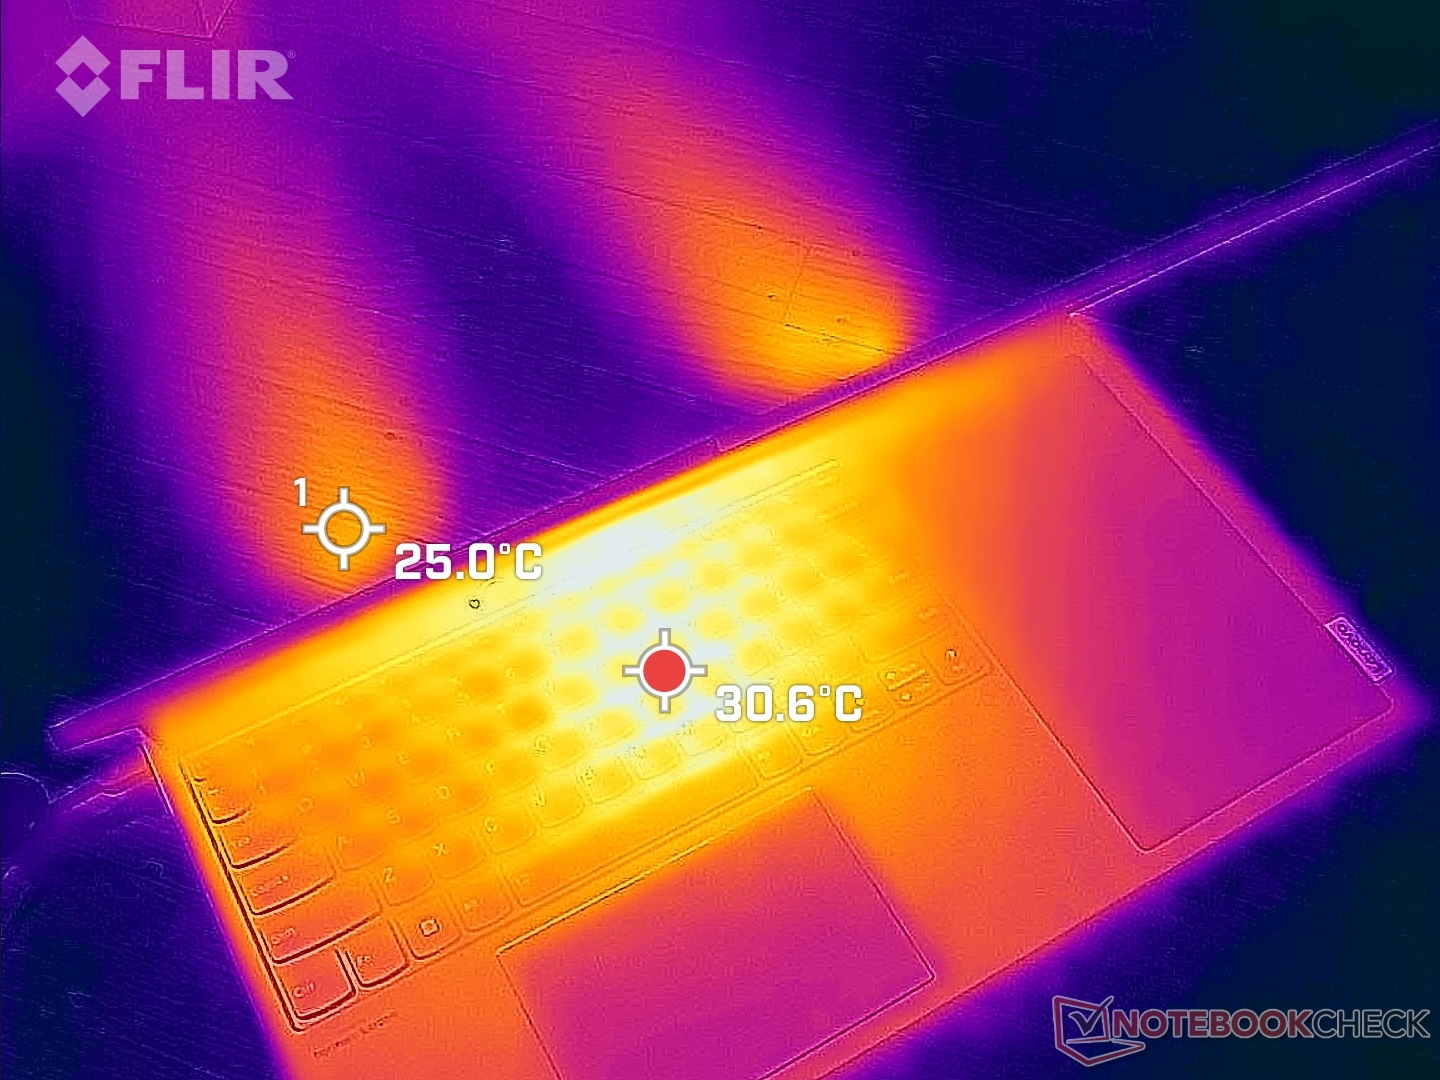
(+) The maximum temperature on the upper side is 33.2 °C / 92 F, compared to the average of 34.3 °C / 94 F, ranging from 21.2 to 62.5 °C for the class Office.
(+) The bottom heats up to a maximum of 32.8 °C / 91 F, compared to the average of 36.8 °C / 98 F
(+) In idle usage, the average temperature for the upper side is 27.2 °C / 81 F, compared to the device average of 29.5 °C / 85 F.
(+) The palmrests and touchpad are cooler than skin temperature with a maximum of 26.4 °C / 79.5 F and are therefore cool to the touch.
(±) The average temperature of the palmrest area of similar devices was 27.6 °C / 81.7 F (+1.2 °C / 2.2 F).
| Lenovo ThinkBook Plus Gen3 Intel Core i7-12700H, Intel Iris Xe Graphics G7 96EUs | Lenovo ThinkBook Plus Gen2 Core i5 Intel Core i5-1130G7, Intel Iris Xe Graphics G7 80EUs | Asus ProArt StudioBook Pro 17 W700G3T Intel Core i7-9750H, NVIDIA Quadro RTX 3000 Max-Q | LG Gram 17 (2022) Intel Core i5-1240P, Intel Iris Xe Graphics G7 80EUs | Dell XPS 17 9720 Intel Core i7-12700H, NVIDIA GeForce RTX 3050 4GB Laptop GPU | Gigabyte Aero 17 HDR YD Intel Core i9-11980HK, NVIDIA GeForce RTX 3080 Laptop GPU | |
|---|---|---|---|---|---|---|
| Heat | -17% | -12% | -30% | -13% | -32% | |
| Maximum Upper Side * (°C) | 33.2 | 42 -27% | 45.4 -37% | 50 -51% | 49.5 -49% | 44 -33% |
| Maximum Bottom * (°C) | 32.8 | 44.5 -36% | 53.7 -64% | 50 -52% | 38.4 -17% | 56 -71% |
| Idle Upper Side * (°C) | 29.8 | 29.8 -0% | 22.2 26% | 31.5 -6% | 28 6% | 32 -7% |
| Idle Bottom * (°C) | 30.4 | 31.9 -5% | 21.8 28% | 33.5 -10% | 27.8 9% | 35 -15% |
* ... smaller is better
压力测试
当运行Prime95对CPU施加压力时,时钟频率和电路板功耗将分别飙升至3.6 GHz和80 W,仅持续几秒钟,核心温度达到98 C。时钟频率和电路板功耗将迅速下降到3 GHz和60 W,最终分别稳定在2.8 GHz和52 W,以保持核心温度略低于90 C。
运行时的GPU时钟速率和温度 Witcher 3将分别稳定在1297兆赫和85摄氏度,这是由Core H驱动的薄型多媒体笔记本电脑的一个常见范围,如 戴尔 Inspiron 16 Plus 7620.
用电池供电运行会影响性能。在电池上运行3DMark 11,物理和图形分数分别为16704和5421分,而在主电源上运行时,物理和图形分数分别为18948和6524分。
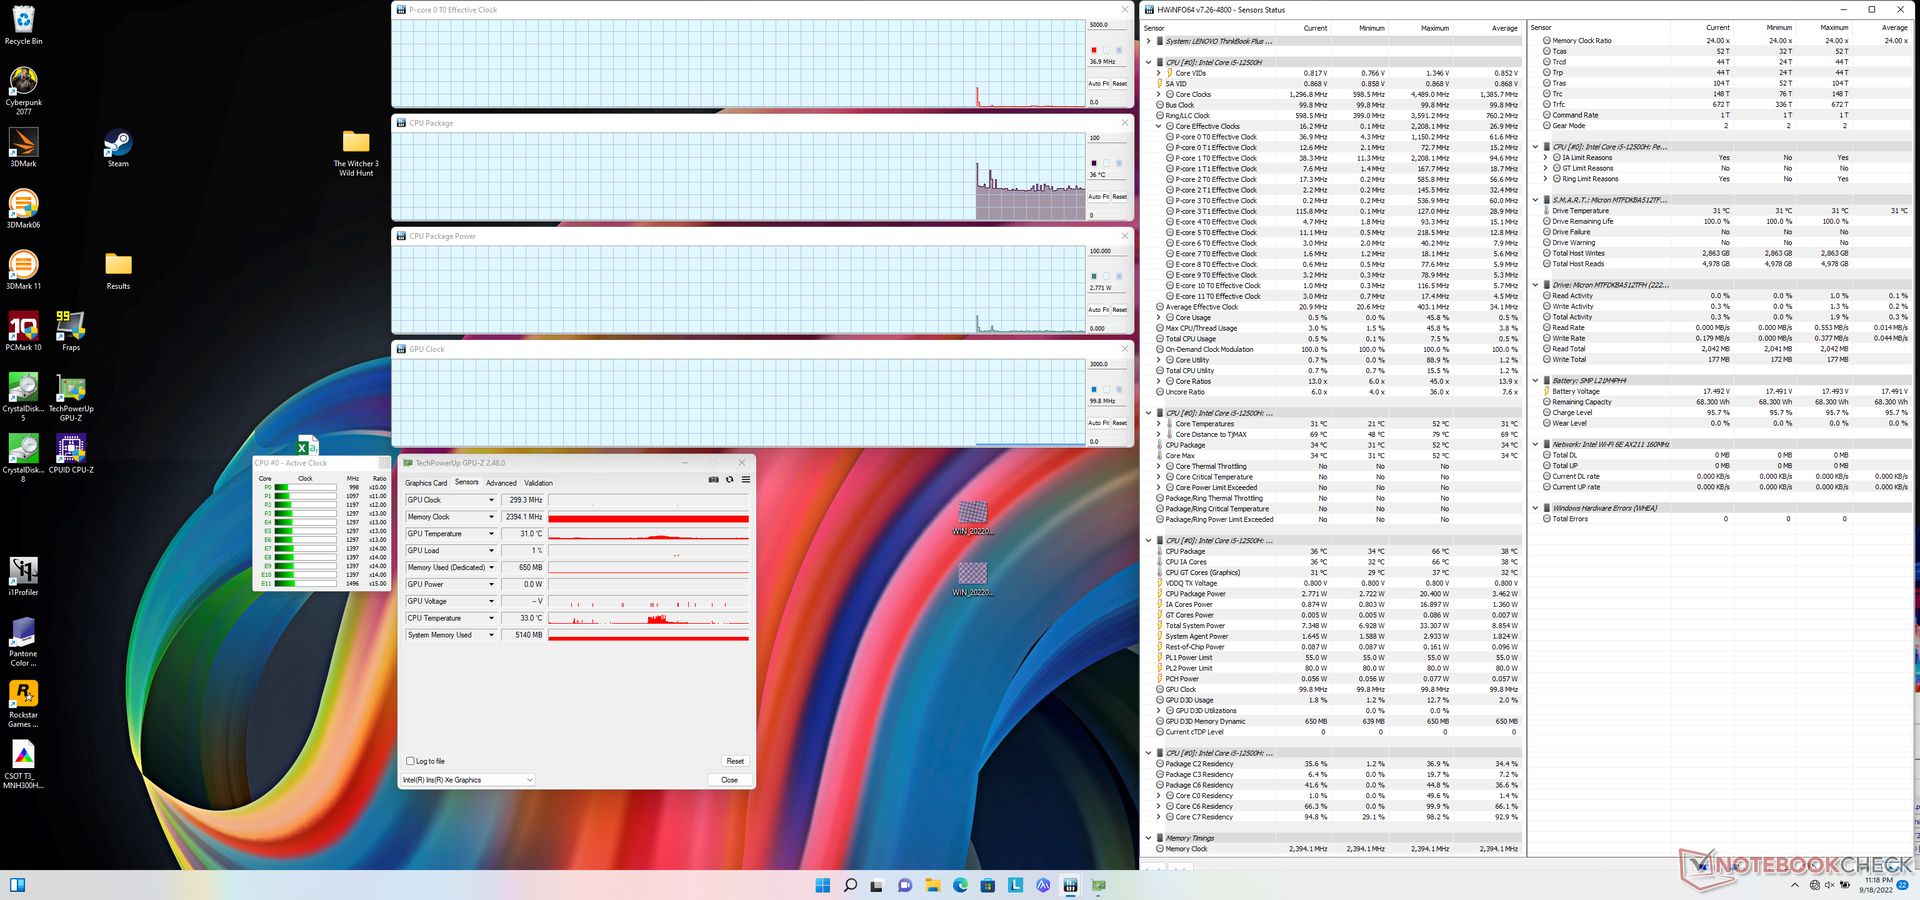
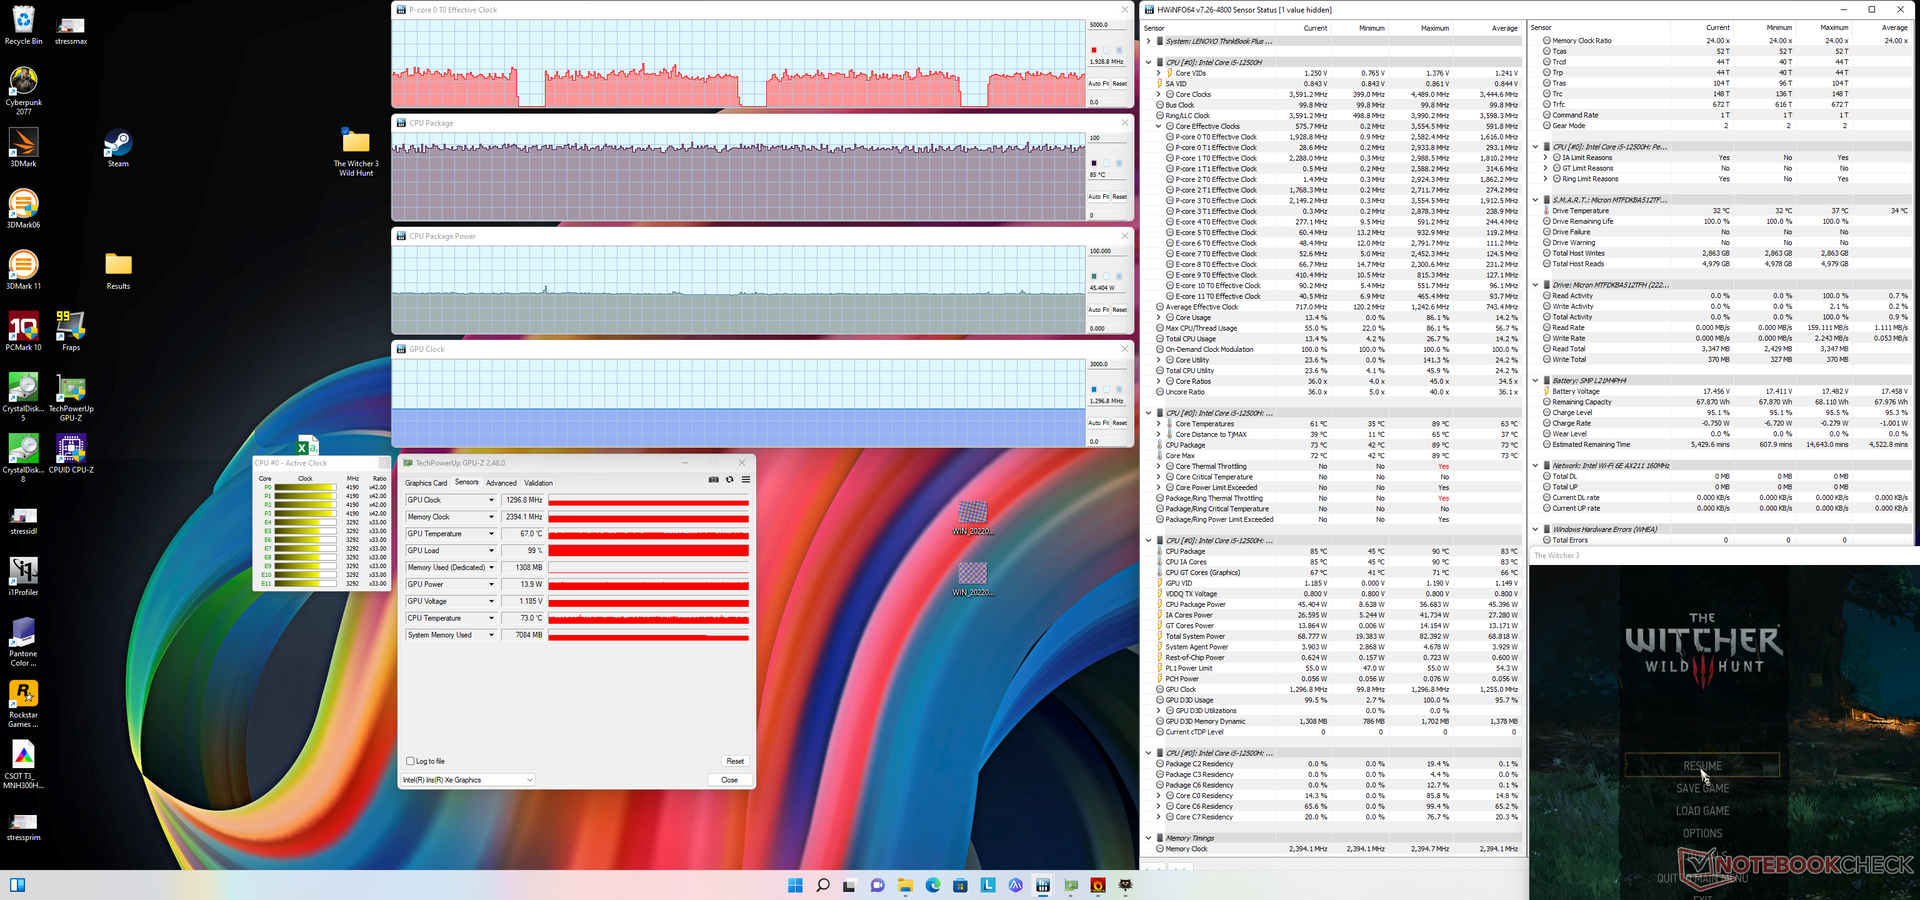
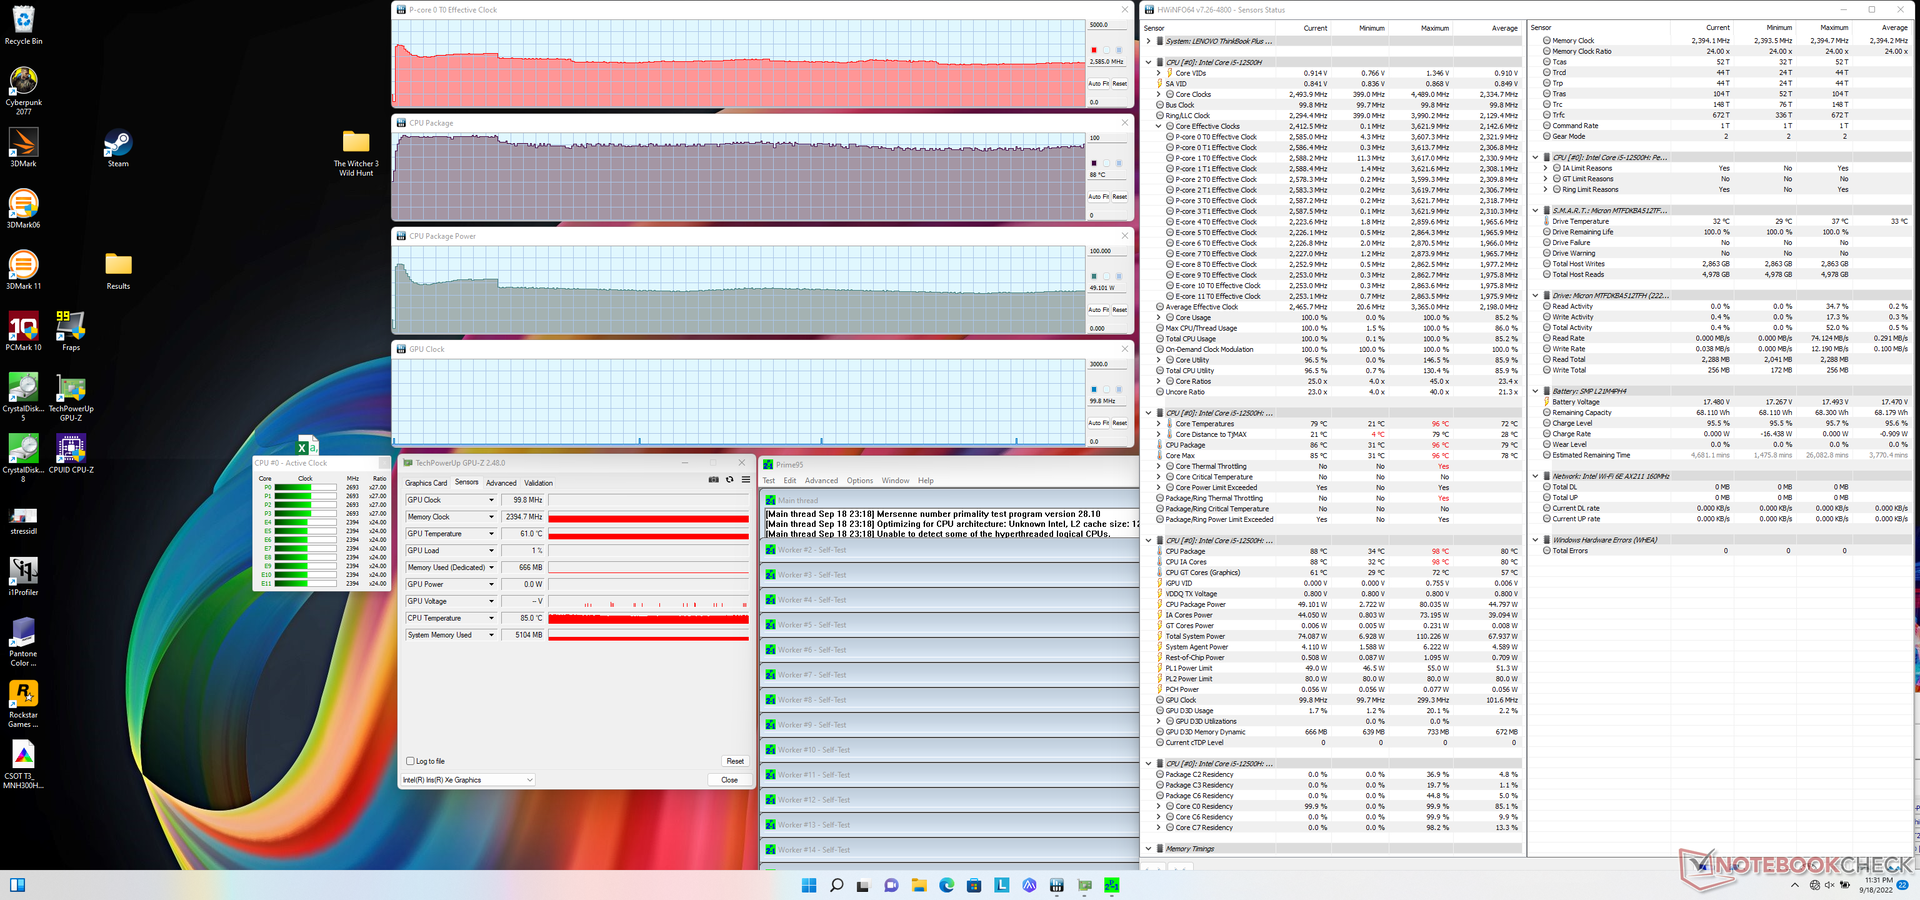
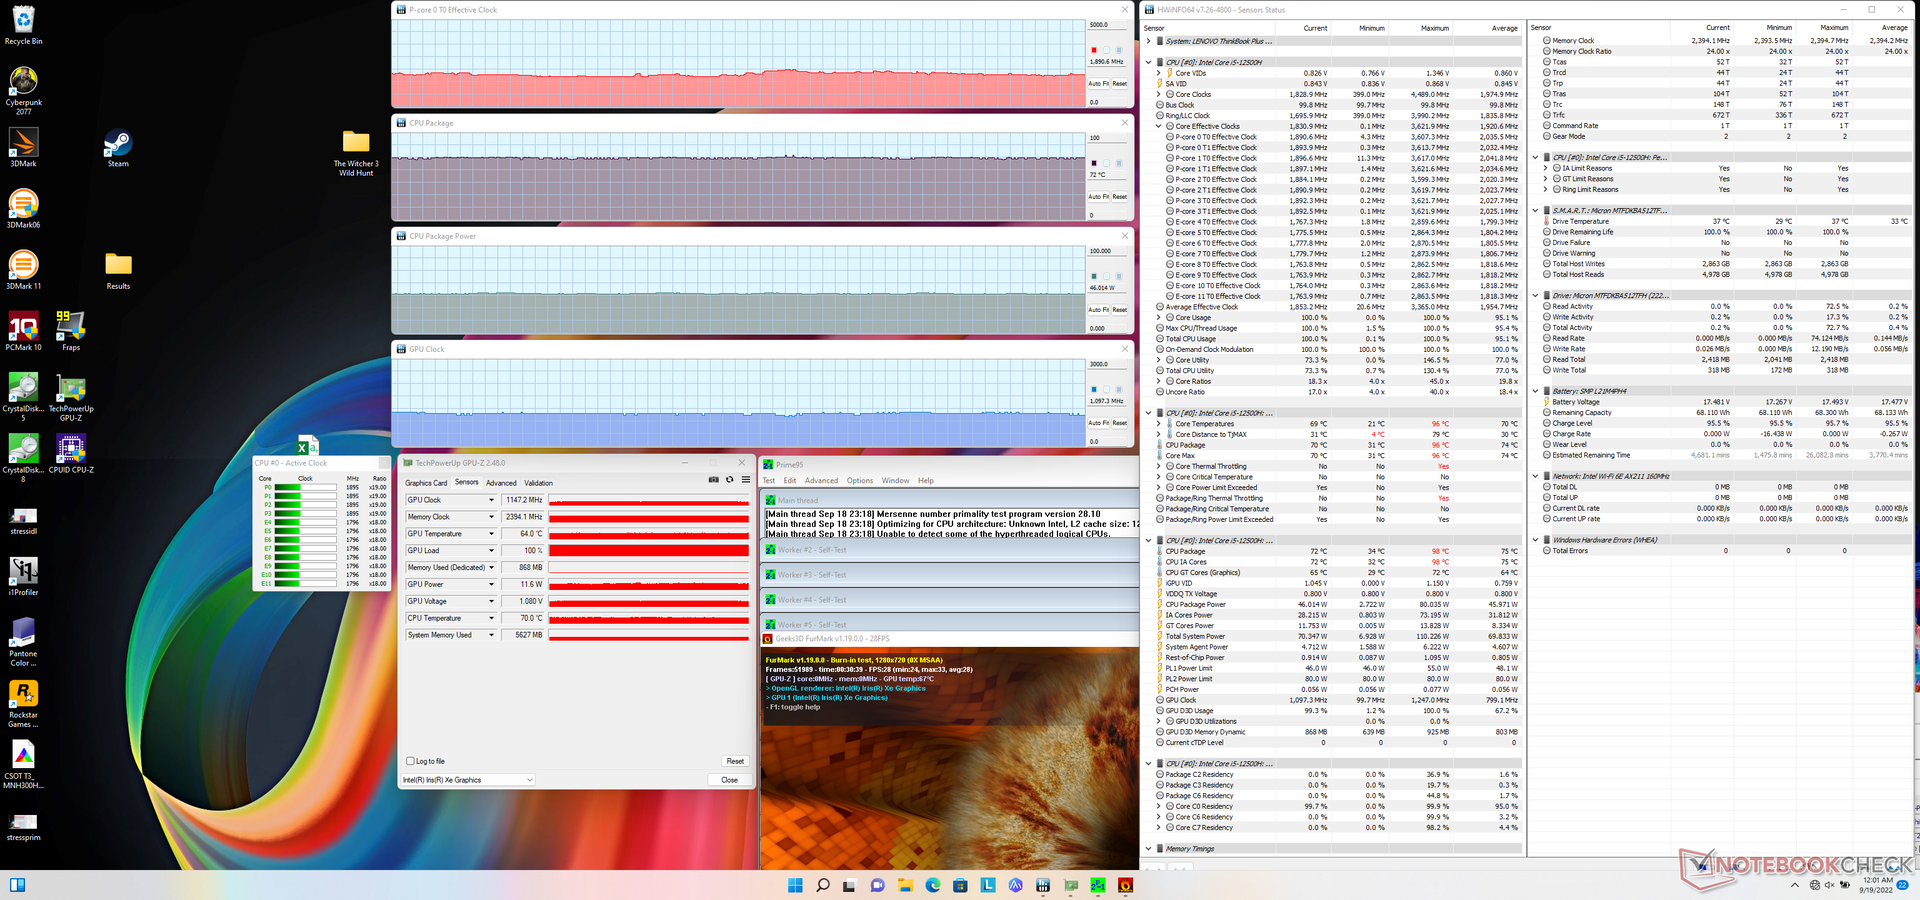
| CPU时钟(GHz) | GPU时钟(MHz) | CPU平均温度(°C) | |
| 系统空闲 | -- | -- | 36 |
| Prime95压力 | 2.6 | -- | 88 |
| Prime95 + FurMark 压力 | 1.9 | 1147 | 72 |
| Witcher 3 应力 | ~1.9 | 1297 | 85 |
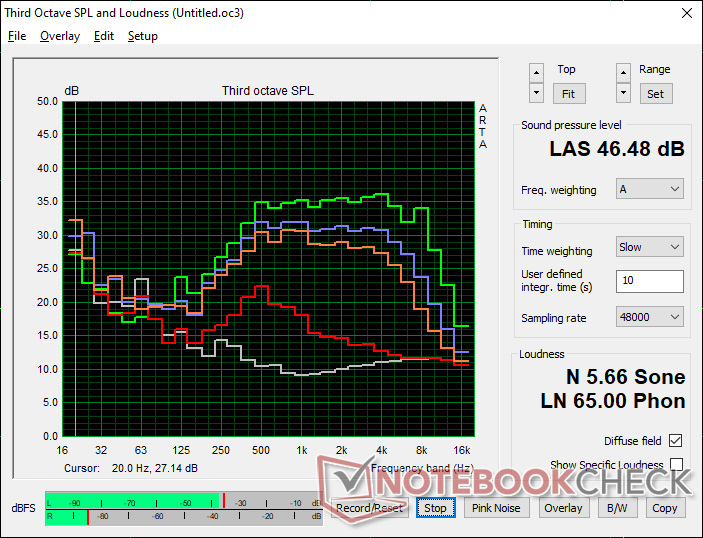
发言人
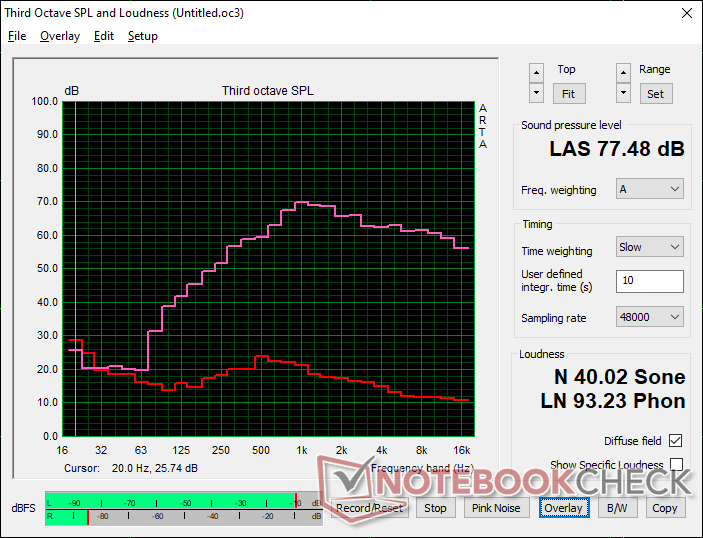
Lenovo ThinkBook Plus Gen3 audio analysis
(±) | speaker loudness is average but good (77.5 dB)
Bass 100 - 315 Hz
(±) | reduced bass - on average 14% lower than median
(±) | linearity of bass is average (9.4% delta to prev. frequency)
Mids 400 - 2000 Hz
(±) | higher mids - on average 5% higher than median
(+) | mids are linear (5% delta to prev. frequency)
Highs 2 - 16 kHz
(+) | balanced highs - only 1.4% away from median
(+) | highs are linear (2.5% delta to prev. frequency)
Overall 100 - 16.000 Hz
(±) | linearity of overall sound is average (16% difference to median)
Compared to same class
» 19% of all tested devices in this class were better, 6% similar, 76% worse
» The best had a delta of 7%, average was 21%, worst was 53%
Compared to all devices tested
» 25% of all tested devices were better, 5% similar, 69% worse
» The best had a delta of 4%, average was 23%, worst was 134%
Apple MacBook Pro 16 2021 M1 Pro audio analysis
(+) | speakers can play relatively loud (84.7 dB)
Bass 100 - 315 Hz
(+) | good bass - only 3.8% away from median
(+) | bass is linear (5.2% delta to prev. frequency)
Mids 400 - 2000 Hz
(+) | balanced mids - only 1.3% away from median
(+) | mids are linear (2.1% delta to prev. frequency)
Highs 2 - 16 kHz
(+) | balanced highs - only 1.9% away from median
(+) | highs are linear (2.7% delta to prev. frequency)
Overall 100 - 16.000 Hz
(+) | overall sound is linear (4.6% difference to median)
Compared to same class
» 0% of all tested devices in this class were better, 0% similar, 100% worse
» The best had a delta of 5%, average was 17%, worst was 45%
Compared to all devices tested
» 0% of all tested devices were better, 0% similar, 100% worse
» The best had a delta of 4%, average was 23%, worst was 134%
能源管理
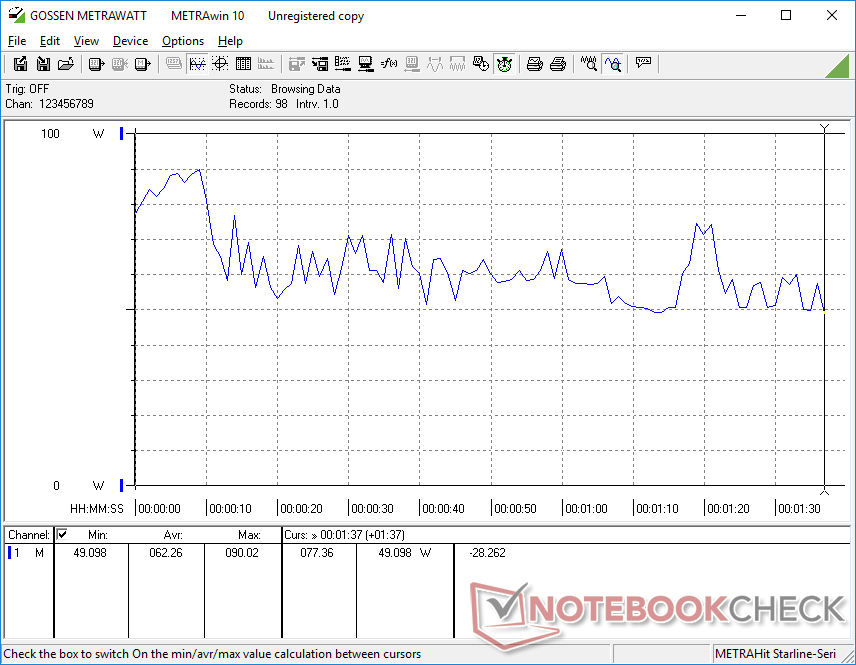
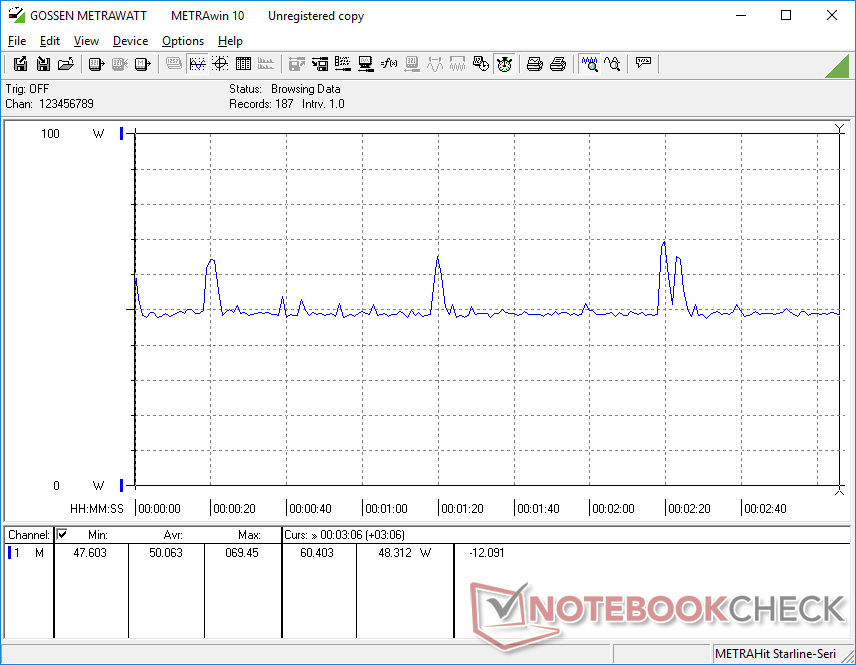
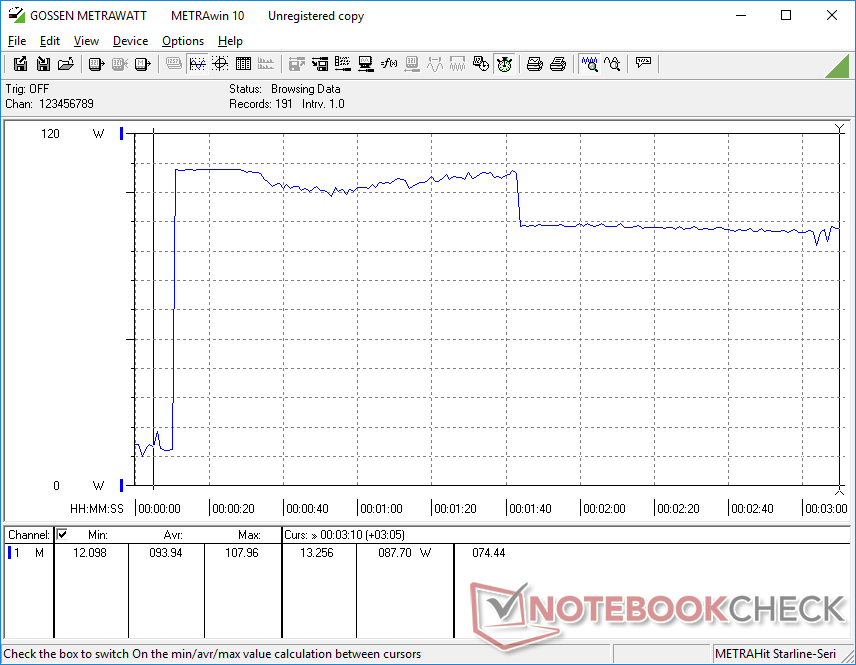
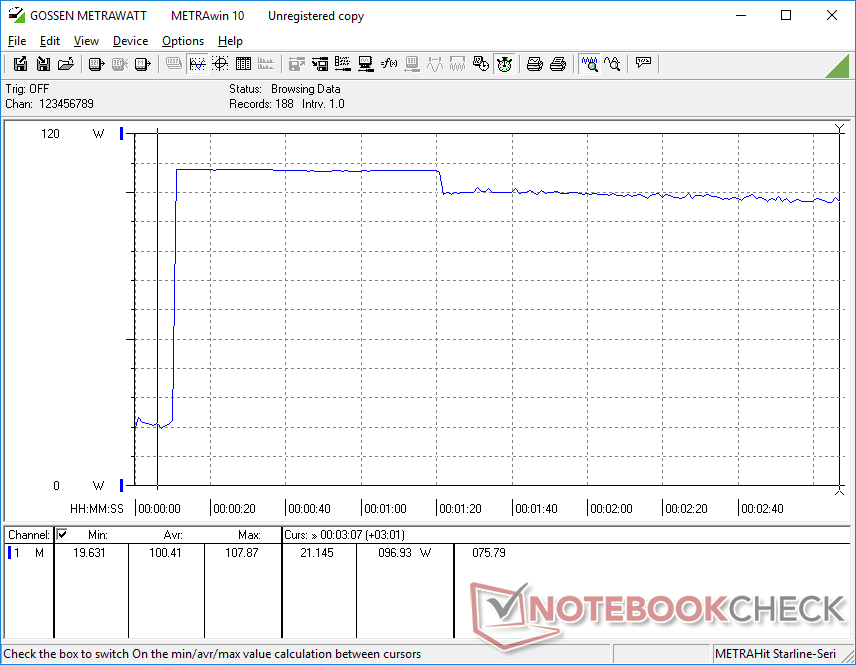
消耗功率
在最低亮度水平和副屏幕关闭的情况下,在节能模式下的桌面上空转,耗电量低至7瓦。如果启用副屏并将其设置为最大亮度水平,消耗量将高出约2.8瓦。在桌面上空转,两个屏幕都设置为最大亮度,并在极限性能模式下,需要略低于17瓦的功率,与配备独立GPU的更快的17英寸笔记本电脑一样多。
运行更高的负载(如游戏)需要50至65瓦的功率,而大多数配备相同集成Iris Xe 96 EUs GPU的Core U系列或P系列笔记本的功率只有约40瓦,如 LG Gram 17.
在大多数情况下,由于尺寸和性能的增加以及副显示屏带来的额外效用,总体功耗比上一代ThinkBook Plus Gen 2高约2倍。
| Off / Standby | |
| Idle | |
| Load |
|
Key:
min: | |
| Lenovo ThinkBook Plus Gen3 i7-12700H, Iris Xe G7 96EUs, Micron 3400 MTFDKBA512TFH 512GB, IPS, 3072x1440, 17.3" | Lenovo ThinkBook Plus Gen2 Core i5 i5-1130G7, Iris Xe G7 80EUs, Samsung PM9A1 MZVL2512HCJQ, IPS, E-Ink, 2560x1600, 13.3" | Asus ProArt StudioBook Pro 17 W700G3T i7-9750H, Quadro RTX 3000 Max-Q, Samsung SSD PM981 MZVLB1T0HALR, IPS, 1920x1200, 17" | LG Gram 17 (2022) i5-1240P, Iris Xe G7 80EUs, Samsung PM9A1 MZVL2512HCJQ, IPS, 2560x1600, 17" | Dell XPS 17 9720 i7-12700H, GeForce RTX 3050 4GB Laptop GPU, Micron 3400 MTFDKBA512TFH 512GB, IPS, 3840x2400, 17" | Gigabyte Aero 17 HDR YD i9-11980HK, GeForce RTX 3080 Laptop GPU, Samsung PM9A1 MZVL2512HCJQ, IPS, 3840x2160, 17.3" | |
|---|---|---|---|---|---|---|
| Power Consumption | 46% | -48% | 33% | -40% | -150% | |
| Idle Minimum * (Watt) | 7.4 | 5 32% | 11.3 -53% | 4 46% | 7.8 -5% | 25 -238% |
| Idle Average * (Watt) | 16.4 | 7.9 52% | 16 2% | 12.2 26% | 15.1 8% | 28 -71% |
| Idle Maximum * (Watt) | 16.8 | 8.3 51% | 16.8 -0% | 13.2 21% | 17 -1% | 40 -138% |
| Load Average * (Watt) | 62.3 | 30.9 50% | 93.6 -50% | 34 45% | 114 -83% | 114 -83% |
| Witcher 3 ultra * (Watt) | 50 | 25.2 50% | 106 -112% | 39.4 21% | 115.2 -130% | 176 -252% |
| Load Maximum * (Watt) | 107.9 | 66.8 38% | 186.6 -73% | 65.9 39% | 135.6 -26% | 236 -119% |
* ... smaller is better
Power Consumption Witcher 3 / Stresstest
Power Consumption external Monitor
电池寿命 - 没有那么长
对于一个17英寸的笔记本电脑来说,运行时间最好是平均水平。电池容量比LG Gram 17或Dell XPS 17的小,WLAN运行时间短了几个小时。在副显示屏激活的情况下,我们能够在现实世界的WLAN使用中打卡不到5.5小时,而前述的华硕和戴尔则各为9个多小时。
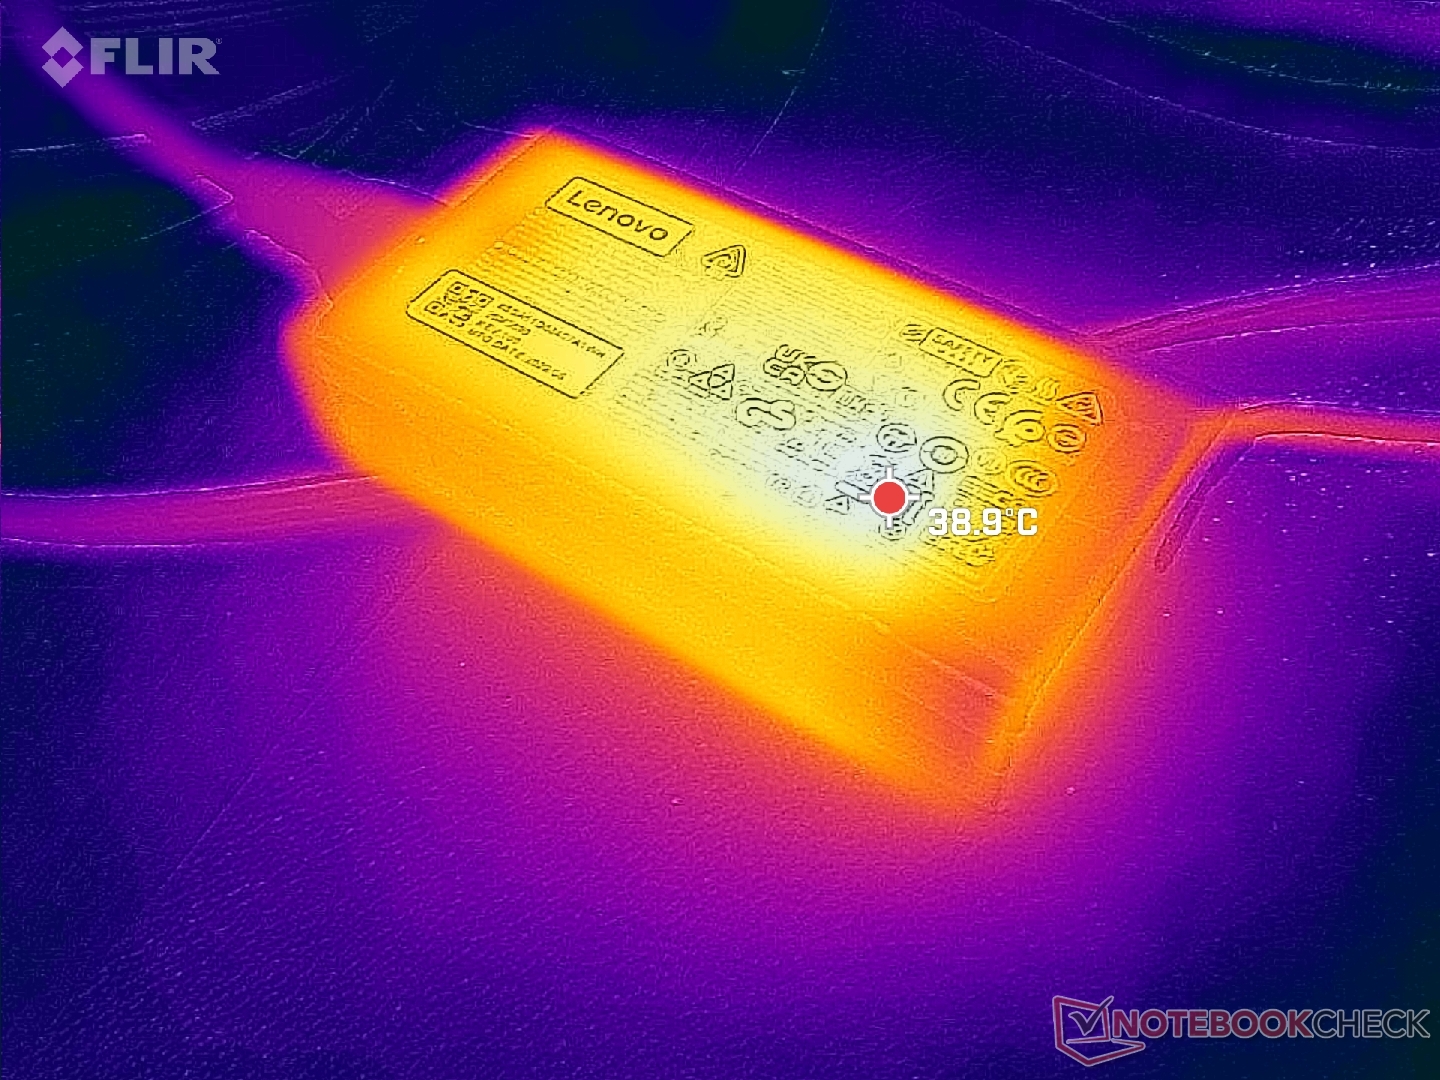
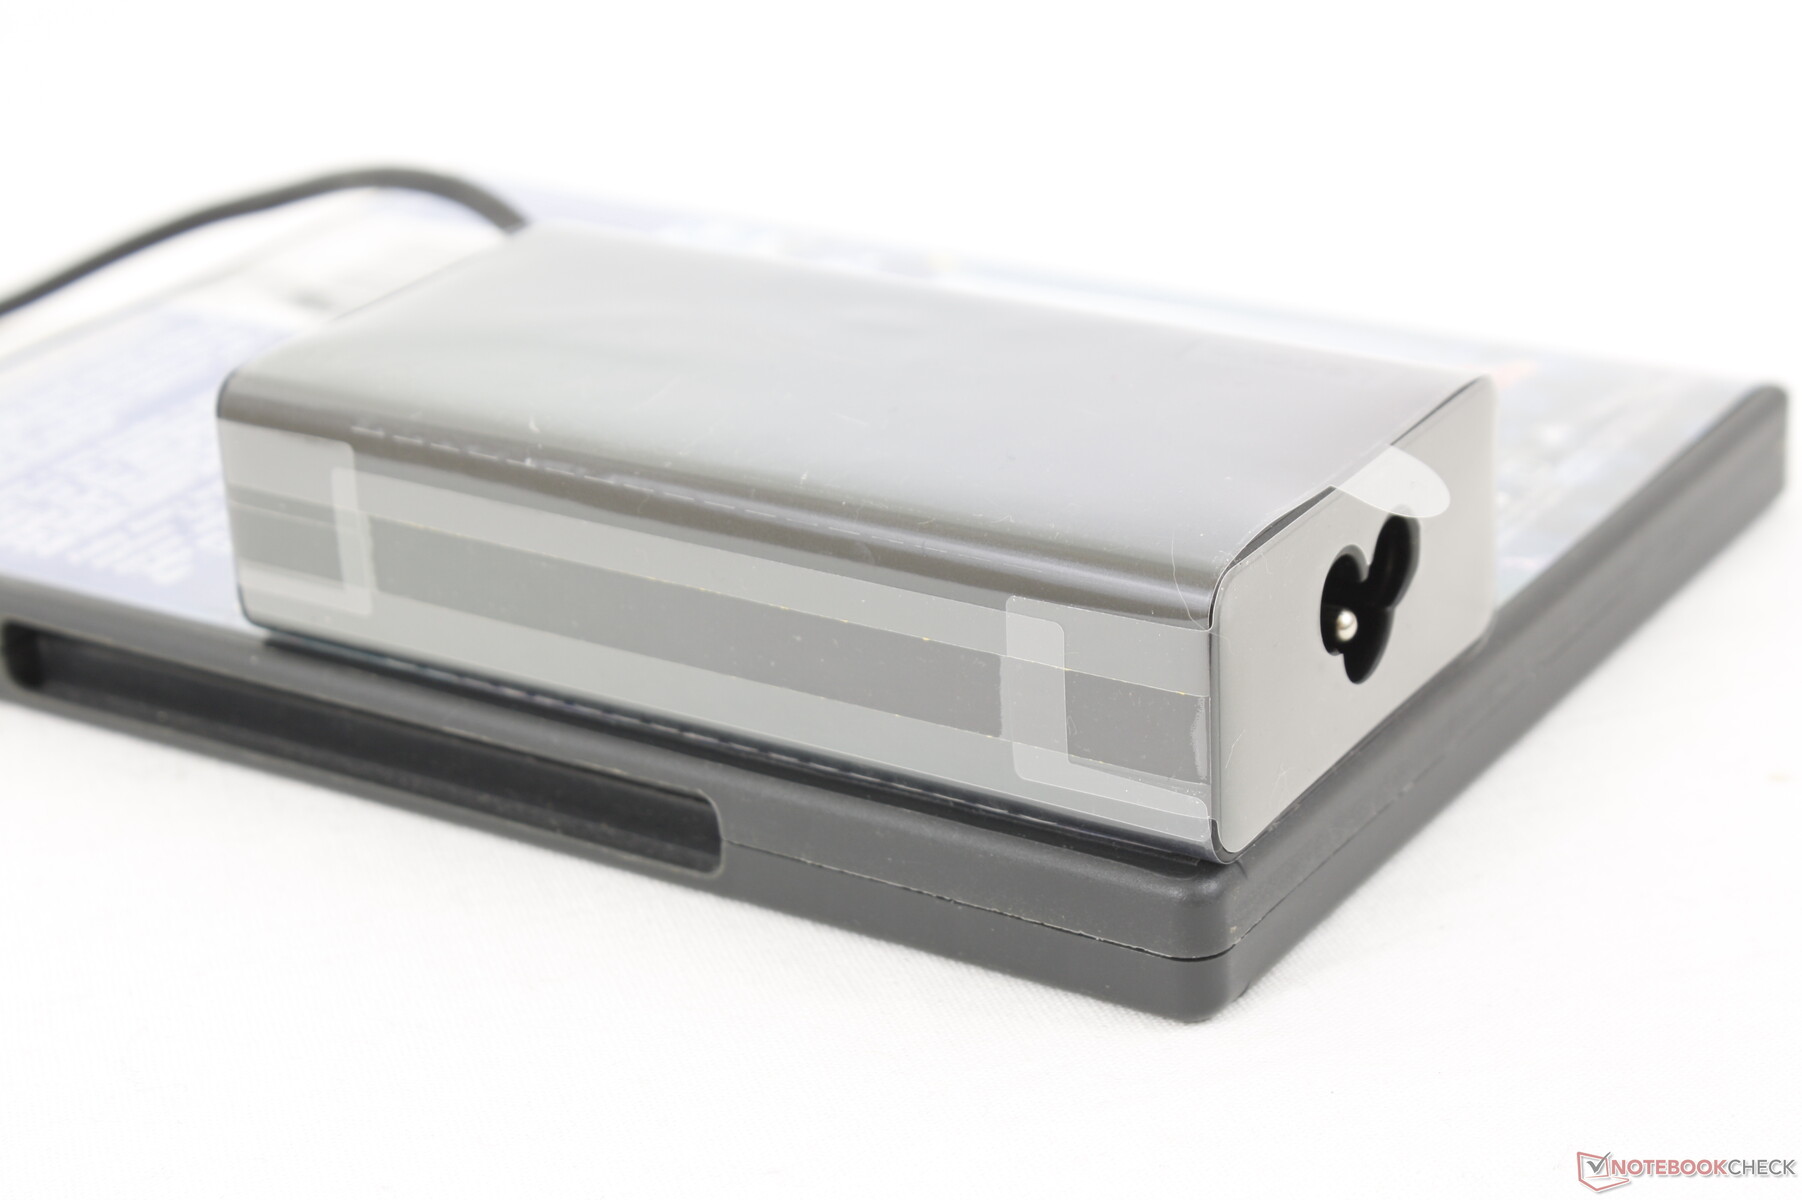
启用快速充电时,从空电到满电需要1到1.5小时。
| Lenovo ThinkBook Plus Gen3 i7-12700H, Iris Xe G7 96EUs, 70 Wh | Lenovo ThinkBook Plus Gen2 Core i5 i5-1130G7, Iris Xe G7 80EUs, 53 Wh | Asus ProArt StudioBook Pro 17 W700G3T i7-9750H, Quadro RTX 3000 Max-Q, 57 Wh | LG Gram 17 (2022) i5-1240P, Iris Xe G7 80EUs, 80 Wh | Dell XPS 17 9720 i7-12700H, GeForce RTX 3050 4GB Laptop GPU, 97 Wh | Gigabyte Aero 17 HDR YD i9-11980HK, GeForce RTX 3080 Laptop GPU, 99 Wh | |
|---|---|---|---|---|---|---|
| Battery runtime | 43% | 41% | 186% | 47% | 13% | |
| Reader / Idle (h) | 8.1 | 28.2 248% | ||||
| WiFi v1.3 (h) | 5.3 | 7.6 43% | 5.9 11% | 11.2 111% | 9.2 74% | 5.6 6% |
| Load (h) | 1 | 1.7 70% | 3 200% | 1.2 20% | 1.2 20% | |
| H.264 (h) | 6.9 | 14.1 | 11.2 | |||
| Witcher 3 ultra (h) | 1.7 |
Pros
Cons
结论 - 对狭小的工作空间非常有利
ThinkBook Plus第三代在其尺寸类别中是独一无二的,不仅仅是因为其8英寸副显示屏或21:10的外形尺寸。更具体地说,它是为数不多的配备英特尔第12代酷睿H处理器的17英寸笔记本电脑之一,完全没有独立显卡选项。尽管有第二块显示屏和较长的机箱尺寸,但这种方法使得机箱设计相对纤细和轻便。
该机型的一个关键缺点是,对于一些用户来说,它可能动力不足。CPU性能比许多 其他17英寸笔记本电脑同样的酷睿i7-12700H处理器,CPU性能比许多其他17英寸笔记本电脑要慢,而且缺少一个DGPU,可能会把大多数电力用户拒之门外。后者是一种耻辱,因为主显示屏具有图形编辑的色彩和功能,而副显示屏对繁重的多任务处理有内在的作用。只要你的工作负荷不是特别重的GPU,那么这个缺点就不应该是太大的问题。
ThinkBook Plus第三代通过为用户提供比市场上大多数其他笔记本电脑更多的屏幕空间,优化了生产力。不过,你不得不放弃一点图形性能。
至于集成的副显示屏,该功能对于文件资源管理器窗口、文本、命令行和其他颜色准确性不是很重要的应用来说最有用。然而,它的触摸屏功能并不像智能手机或平板电脑那样可靠,所以我们发现用鼠标来代替显示屏是最容易的。
如果你有足够的桌面空间放置一个外部辅助显示器,如 Lepow C2那么ThinkBook Plus第三代的吸引力就会大打折扣。与其他17英寸机型相比,那些经常移动或没有空间安装外部显示器的用户会发现这款联想的空间出奇的大。
价格和可用性
ThinkBook Plus第三代还没有在亚马逊、百思买或新蛋等主要经销商处出售。用户可以,直接从联想购买起价为1500美元的酷睿i5选项或1600美元的酷睿i7配置。
Lenovo ThinkBook Plus Gen3
- 09/21/2022 v7 (old)
Allen Ngo
Price comparison

