Notebookcheck Logo

AMD Radeon RX Vega M GL / 870

AMD Vega M GL / 870

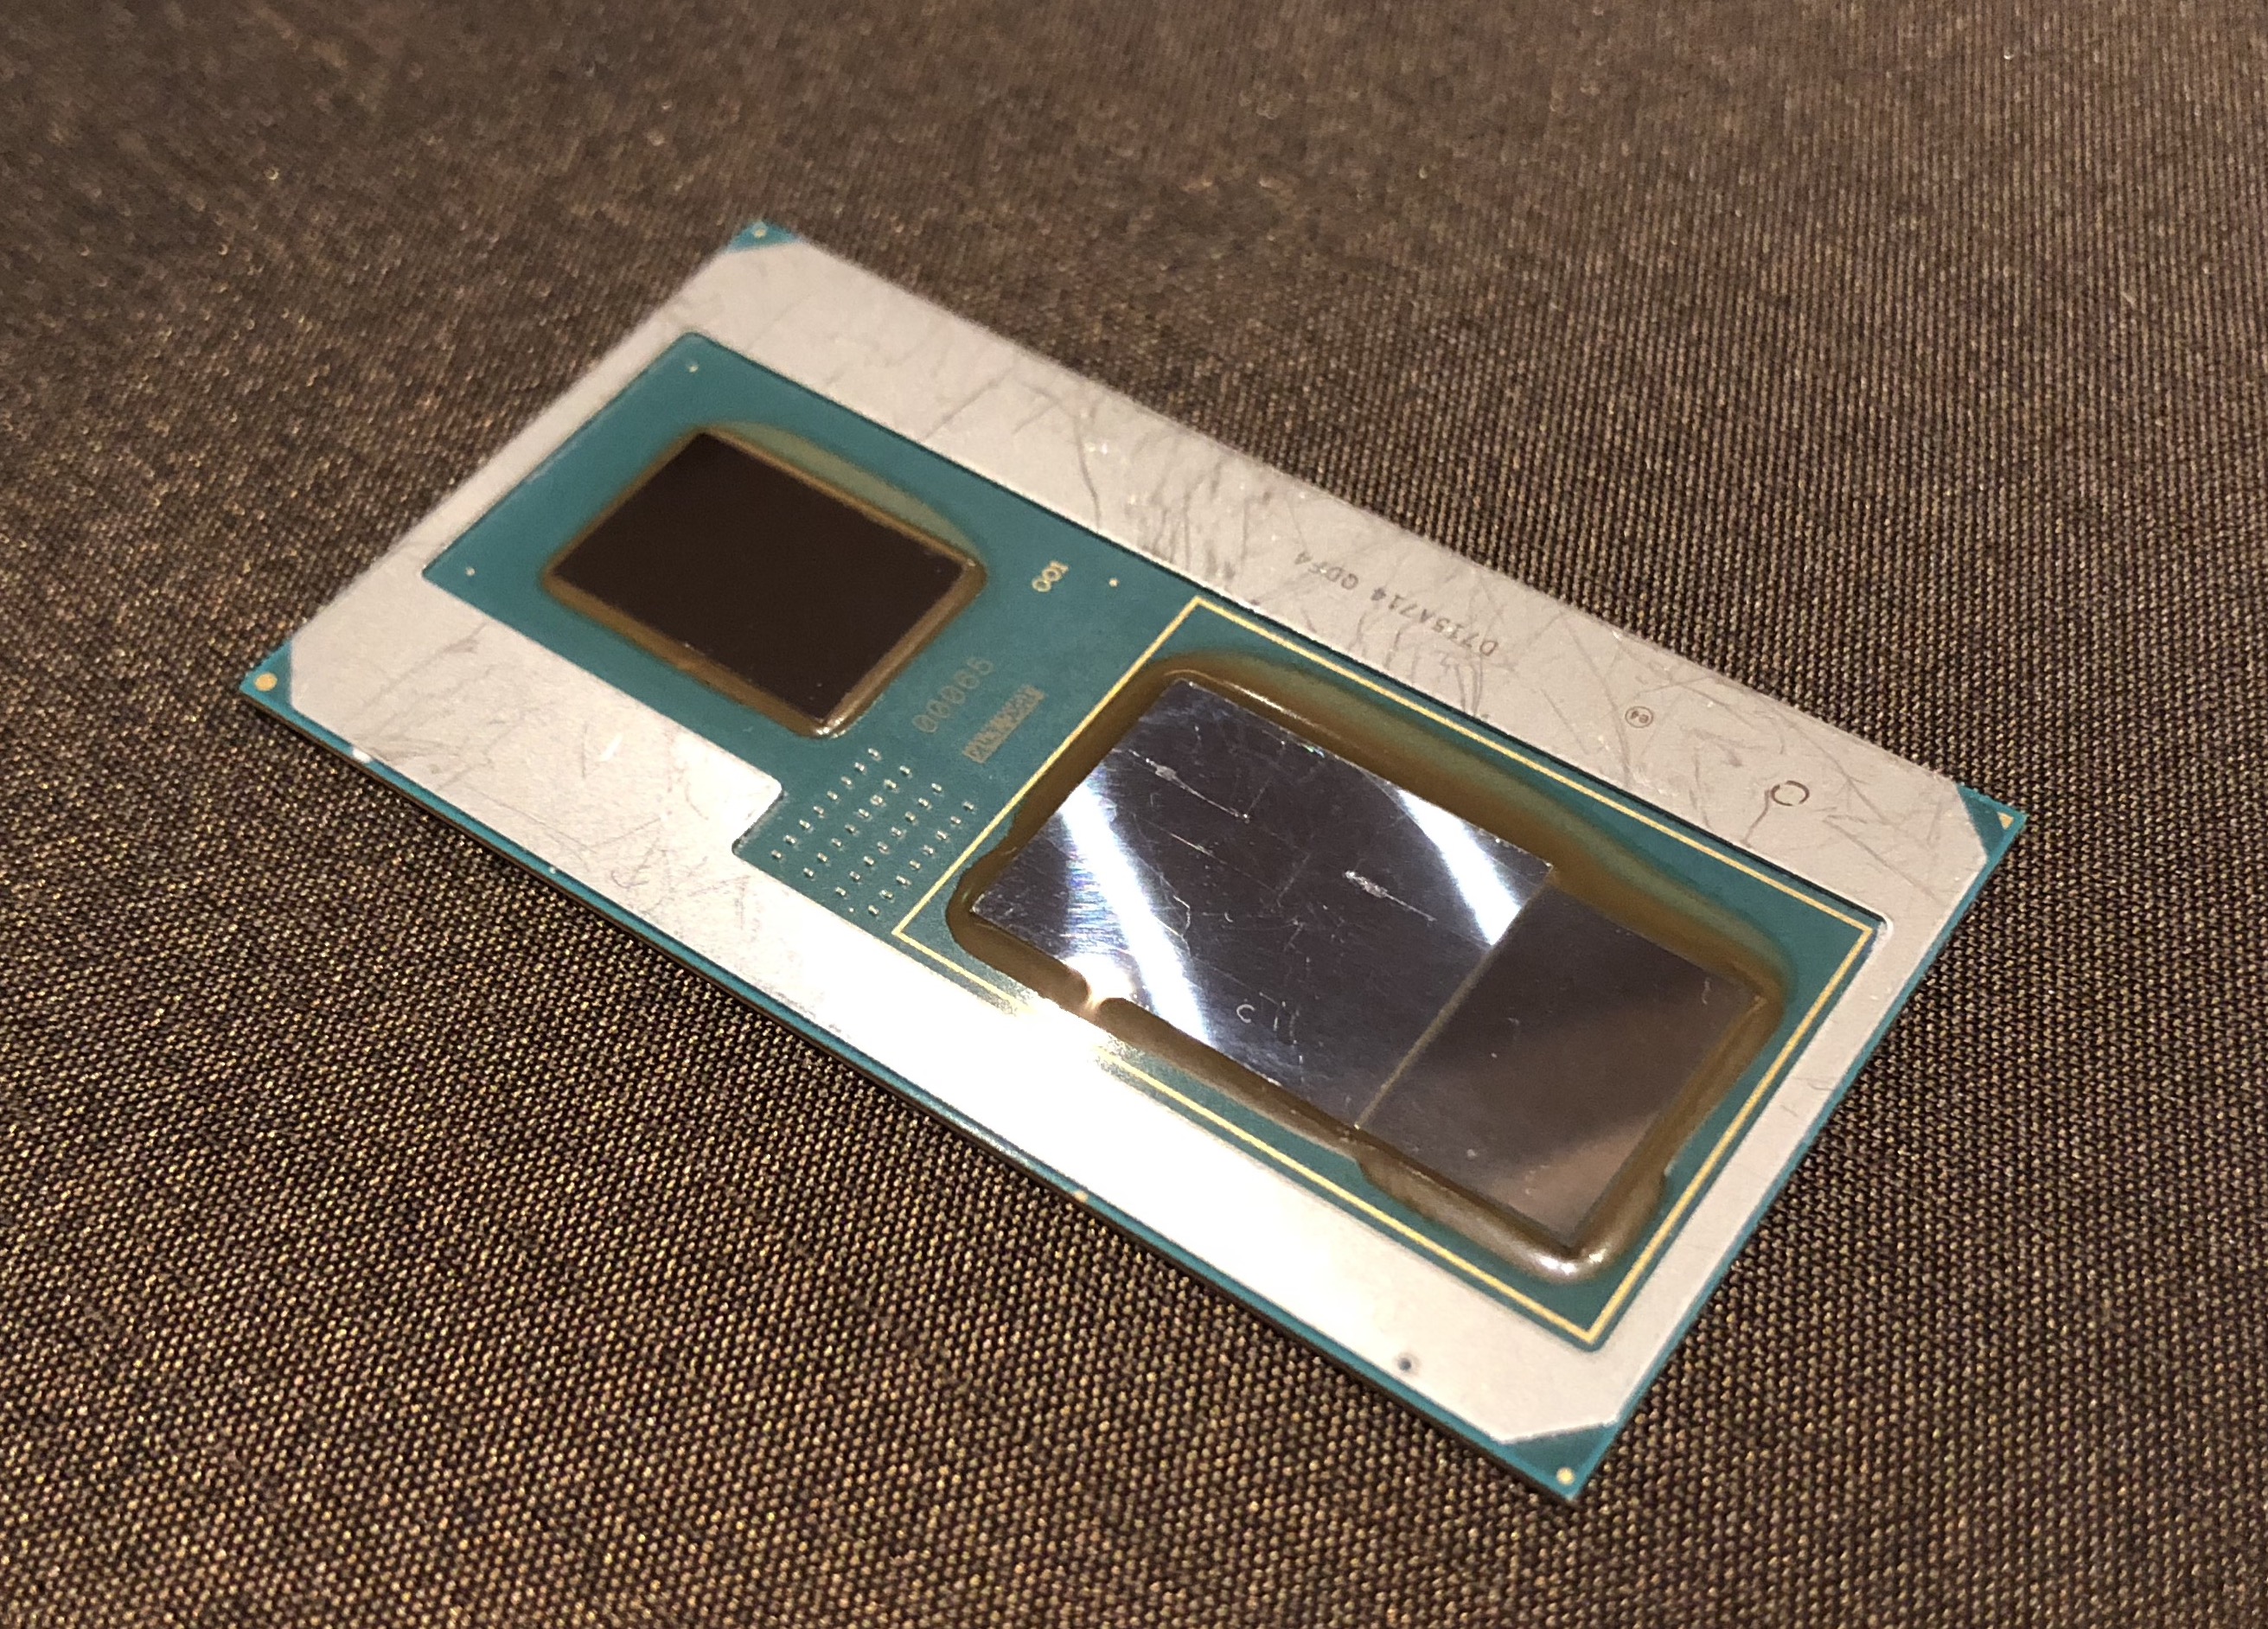
AMD Radeon RX Vega M GL或Radeon RX Vega 870(戴尔)是速度较慢的Intel Kaby-Lake-G SoC中的集成GPU。它在单个封装中集成了Kaby-Lake处理器,Vega图形卡和4 GB HBM2显存。该显卡提供20个CU(1280个着色器),时钟频率为931-1011 MHz。

目前看起来GPU是Polaris和Vega(HBM内存控制器)的混合体。因为显卡在内部称为Polaris 22。有关Vega架构的详细信息可以在我们关于Raven Ridge架构的专门文章中找到。

根据英特尔的基准测试,Vega M GL的性能应介于Nvidia GeForce GTX 1050和1050 Ti之间。因此,它非常适合1080p的高分辨率游戏。

功耗与Vega Mobile GPU非常相似,但由于外形小巧,可以使用Kaby-Lake-G SoC构建更小的笔记本电脑。整个封装的TDP指定为65瓦,包括GPU,CPU和HBM2存储器。

AMD Radeon RX Vega Series

RX Vega 64 4096 @ 1.63 GHz2048 Bit @ 945 MHz
RX Vega 56 3584 @ 1.14 - 1.47 GHz409.6 Bit @ 800 MHz
Vega Mobile 1792 2048 Bit
Vega M GH 1536 @ 1.06 - 1.19 GHz
Vega M GL / 870 1280 @ 0.93 - 1.01 GHz
WX Vega M GL 1280 @ 0.93 - 1.01 GHz
Vega 11 704 @ 1.24 GHz
CodenameVega Kaby Lake-G
ArchitectureVega
Pipelines1280 - unified
Core Speed931 - 1011 (Boost) MHz
Memory TypeHBM2
Max. Amount of Memory4 GB
Shared Memoryno
APIDirectX 12_1
Power Consumption65 Watt
technology14 nm
FeaturesTiled Rasterization, Shared Memory (up to Dual-Channel DDR4-2400)
Notebook Sizemedium sized
Date of Announcement07.01.2018
CPU in Vega M GL / 870GPU Base SpeedGPU Boost / Turbo
Intel Core i7-8706G4 x 3100 MHz, 65 W931 MHz1011 MHz
Intel Core i7-8705G4 x 3100 MHz, 65 W931 MHz1011 MHz
Intel Core i5-8305G4 x 2800 MHz, 65 W931 MHz1011 MHz
min. - max.931 MHz1011 MHz

Benchmarks

Performance Rating - 3DMark 11 + Fire Strike + Time Spy
3.3 pt (10%)
AMD Radeon HD 8180
0.06605 -98%
...
NVIDIA Quadro M3000M
2.98 -11%
AMD Radeon R9 M295X
3 -10%
NVIDIA Quadro P2000 Max-Q
3.07 -8%
AMD Radeon R9 M395
3.11 -7%
NVIDIA Quadro P2000
3.12 -7%
AMD Radeon 680M
3.13 -6%
AMD FirePro W7170M
3.16 -5%
NVIDIA GeForce GTX 1050 Ti Max-Q
3.34 0%
AMD Radeon Pro WX Vega M GL
3.34 0%
AMD Radeon RX Vega M GL / 870
3.34
3.4 2%
NVIDIA Quadro M4000M
3.52 5%
NVIDIA GeForce GTX 1050 Ti Mobile
3.53 6%
3.54 6%
3.59 7%
3.61 8%
3.85 15%
3.86 16%
3.9 17%
...
21.1 532%
max:
33.3 897%
0%
100%
3DMark - 3DMark Time Spy Score
min: 2121     avg: 2199     median: 2225 (6%)     max: 2252 Points
3DMark - 3DMark Time Spy Graphics
min: 2031     avg: 2070     median: 2072 (5%)     max: 2108 Points
Intel UHD Graphics 605
113 -95%
...
AMD Radeon RX 560X (Laptop)
1788 -14%
1796 -13%
1810 -13%
NVIDIA T500 Laptop GPU
1814 -12%
1890 -9%
2021 -2%
NVIDIA Quadro P2000
2046 -1%
NVIDIA Quadro P2000 Max-Q
2049 -1%
AMD Radeon Pro WX Vega M GL
2062 0%
AMD Radeon RX Vega M GL / 870
2070
2116 2%
AMD Radeon Pro Vega 16
2198 6%
AMD Radeon 680M
2221 7%
NVIDIA GeForce GTX 1050 Ti Max-Q
2245 8%
NVIDIA GeForce GTX 1050 Ti Mobile
2309 12%
2472 19%
2601 26%
2667 29%
2766 34%
...
19434 839%
max:
36485 1663%
0%
100%
3DMark - 3DMark Ice Storm Unlimited Graphics
min: 261434     avg: 290539     median: 299071 (34%)     max: 311111 Points
3DMark - 3DMark Ice Storm Extreme Graphics
min: 46963     avg: 106261     median: 106261 (14%)     max: 165559 Points
3DMark - 3DMark Cloud Gate Score
min: 15911     avg: 19226     median: 19473 (21%)     max: 21322 Points
3DMark - 3DMark Cloud Gate Graphics
min: 37915     avg: 40459     median: 38812 (10%)     max: 44796 Points
3DMark - 3DMark Fire Strike Standard Score
min: 5879     avg: 6114     median: 6225 (11%)     max: 6280 Points
3DMark - 3DMark Fire Strike Standard Graphics
min: 7059     avg: 7254     median: 7329 (8%)     max: 7355 Points
3DMark - 3DMark Ice Storm Graphics
min: 74196     avg: 127123     median: 127123 (15%)     max: 180050 Points
3DMark 11 - 3DM11 Performance Score
min: 9104     avg: 9465     median: 9380 (13%)     max: 9890 Points
3DMark 11 - 3DM11 Performance GPU
min: 9632     avg: 9910     median: 9862 (8%)     max: 10118 Points
171.8 -98%
...
AMD Radeon R9 M395
8656 -13%
NVIDIA GeForce GTX 1050 Ti Max-Q
8781 -11%
AMD Radeon R9 M295X
8851 -11%
9448 -5%
NVIDIA GeForce GTX 770M SLI
9569 -3%
NVIDIA GeForce GTX 1050 Ti Mobile
9591 -3%
9603 -3%
AMD FirePro W7170M
9708 -2%
9840 -1%
AMD Radeon RX Vega M GL / 870
9910
9950 0%
AMD Radeon 680M
9979 1%
10005 1%
AMD Radeon Pro WX Vega M GL
10020 1%
NVIDIA Quadro M4000M
10259 4%
10498 6%
AMD Radeon Pro Vega 16
10569 7%
10730 8%
10748 8%
...
59943 505%
max:
106023 970%
0%
100%
3DMark 06 3DMark 06 - Standard 1280x1024 +
3DMark 06
16707 Points (22%)
SPECviewperf 12
specvp12 sw-03 +
SPECviewperf 12 - specvp12 sw-03
53 fps (13%)
specvp12 snx-02 +
SPECviewperf 12 - specvp12 snx-02
16.5 fps (2%)
specvp12 showcase-01 +
SPECviewperf 12 - specvp12 showcase-01
30.6 fps (7%)
specvp12 mediacal-01 +
SPECviewperf 12 - specvp12 mediacal-01
15.6 fps (4%)
specvp12 maya-04 +
SPECviewperf 12 - specvp12 maya-04
39.9 fps (11%)
specvp12 energy-01 +
SPECviewperf 12 - specvp12 energy-01
2.7 fps (2%)
specvp12 creo-01 +
SPECviewperf 12 - specvp12 creo-01
37 fps (15%)
specvp12 catia-04 +
SPECviewperf 12 - specvp12 catia-04
55.5 fps (9%)
Cinebench R10 Cinebench R10 Shading (32bit) +
Cinebench R10 - Cinebench R10 Shading (32bit)
min: 9486     avg: 9791     median: 9791 (7%)     max: 10096 points
Cinebench R11.5 Cinebench R11.5 OpenGL 64 Bit +
Cinebench R11.5 - Cinebench R11.5 OpenGL 64 Bit
min: 96.2     avg: 102.6     median: 104.3 (36%)     max: 107.4 fps
Cinebench R15
Cinebench R15 OpenGL 64 Bit +
Cinebench R15 - Cinebench R15 OpenGL 64 Bit
min: 98.6     avg: 116.4     median: 120.7 (7%)     max: 125.5 fps
Cinebench R15 OpenGL Ref. Match 64 Bit +
Cinebench R15 - Cinebench R15 OpenGL Ref. Match 64 Bit
98 % (98%)
GFXBench - GFXBench 5.0 Aztec Ruins High Tier Offscreen
63.8 fps (12%)
3.3 -95%
...
48.6 -24%
AMD Radeon 680M
49.2 -23%
NVIDIA GeForce GTX 1050 Ti Max-Q
49.5 -22%
AMD Radeon RX 560X (Laptop)
52.4 -18%
58.3 -9%
61.4 -4%
62.7 -2%
62.7 -2%
62.8 -2%
AMD Radeon RX Vega M GL / 870
63.8
NVIDIA Quadro T2000 Max-Q
64.8 2%
65.5 3%
Apple M1 7-Core GPU
72.4 13%
Apple M1 8-Core GPU
74.3 16%
78.8 24%
80.5 26%
83.4 31%
87.1 37%
89.3 40%
...
536 740%
0%
100%
GFXBench - GFXBench 5.0 Aztec Ruins Normal Tier Offscreen
158.2 fps (12%)
GFXBench - GFXBench Car Chase Offscreen
110 fps (12%)
GFXBench 3.1 - GFXBench Manhattan ES 3.1 Offscreen
132.5 fps (3%)
GFXBench 3.0 - GFXBench 3.0 Manhattan Offscreen
182.5 fps (11%)
GFXBench (DX / GLBenchmark) 2.7
GFXBench T-Rex HD Offscreen C24Z16 +
GFXBench (DX / GLBenchmark) 2.7 - GFXBench T-Rex HD Offscreen C24Z16
502 fps (4%)
LuxMark v2.0 64Bit - LuxMark v2.0 Room GPU
min: 1096     avg: 1131     median: 1130.5 (5%)     max: 1165 Samples/s
LuxMark v2.0 64Bit - LuxMark v2.0 Sala GPU
min: 2205     avg: 2253     median: 2253 (4%)     max: 2301 Samples/s
ComputeMark v2.1 - ComputeMark v2.1 Result
min: 862     avg: 2179     median: 956 (1%)     max: 4719 points
Power Consumption - Witcher 3 Power Consumption *
min: 84.3     avg: 85.8     median: 85.8 (19%)     max: 87.2 Watt
Power Consumption - Witcher 3 ultra Power Efficiency
0.2 fps per Watt (24%)
Emissions Witcher 3 Fan Noise +
Emissions - Witcher 3 Fan Noise
min: 44.2     avg: 45.7     median: 44.7 (72%)     max: 48.1 dB(A)
Clock Speed - GPU Clock Witcher 3 ultra
1011 MHz (40%)
Clock Speed - GPU Clock Speed Furmark
838 MHz (33%)
- Range of benchmark values for this graphics card
- Average benchmark values for this graphics card
* Smaller numbers mean a higher performance

Game Benchmarks

The following benchmarks stem from our benchmarks of review laptops. The performance depends on the used graphics memory, clock rate, processor, system settings, drivers, and operating systems. So the results don't have to be representative for all laptops with this GPU. For detailed information on the benchmark results, click on the fps number.

low 1280x720
172.7  fps    + Compare
med. 1920x1080
57.7  fps    + Compare
high 1920x1080
39.4  fps    + Compare
ultra 1920x1080
27.4  fps    + Compare
QHD 2560x1440
18.4  fps    + Compare
4K 3840x2160
8.8  fps    + Compare
» With all tested laptops playable in detail settings high.
low 1280x720
83.4  fps    + Compare
med. 1920x1080
46.7  fps    + Compare
high 1920x1080
27  fps    + Compare
» With all tested laptops playable in detail settings med..
low 1280x720
90.6  fps    + Compare
med. 1920x1080
35.3  fps    + Compare
high 1920x1080
29.5  fps    + Compare
QHD 2560x1440
18.9  fps    + Compare
» With all tested laptops playable in detail settings med..
low 1280x720
97.9  fps    + Compare
med. 1920x1080
45.2  fps    + Compare
high 1920x1080
34.3  fps    + Compare
ultra 1920x1080
29.8  fps    + Compare
QHD 2560x1440
20.8  fps    + Compare
4K 3840x2160
9.5  fps    + Compare
» With all tested laptops playable in detail settings med..
low 1280x720
69.1  fps    + Compare
med. 1920x1080
34.9  fps    + Compare
high 1920x1080
20.6  fps    + Compare
ultra 1920x1080
12.1  fps    + Compare
» With all tested laptops playable in detail settings low.
med. 1920x1080
47.7  fps    + Compare
high 1920x1080
39.3  fps    + Compare
ultra 1920x1080
32  fps    + Compare
QHD 2560x1440
20.8  fps    + Compare
4K 3840x2160
9.9  fps    + Compare
» With all tested laptops playable in detail settings high.
low 1280x720
64.9  fps    + Compare
med. 1920x1080
43.7  fps    + Compare
high 1920x1080
36.7  fps    + Compare
ultra 1920x1080
30.5  fps    + Compare
QHD 2560x1440
22.1  fps    + Compare
4K 3840x2160
11.5  fps    + Compare
» With all tested laptops playable in detail settings high.
low 1280x720
72.1  fps    + Compare
med. 1920x1080
44.4  fps    + Compare
high 1920x1080
37.8  fps    + Compare
ultra 1920x1080
33.5  fps    + Compare
QHD 2560x1440
21.1  fps    + Compare
4K 3840x2160
11.8  fps    + Compare
» With all tested laptops playable in detail settings high.
GRID 2019

GRID 2019

2019
low 1280x720
120.5  fps    + Compare
med. 1920x1080
50.5  fps    + Compare
high 1920x1080
42  fps    + Compare
ultra 1920x1080
26.8  fps    + Compare
QHD 2560x1440
14.7  fps    + Compare
4K 3840x2160
9.2  fps    + Compare
» With all tested laptops playable in detail settings high.
low 1280x720
55  fps    + Compare
med. 1920x1080
33  fps    + Compare
high 1920x1080
30  fps    + Compare
ultra 1920x1080
20  fps    + Compare
QHD 2560x1440
12  fps    + Compare
4K 3840x2160
4  fps    + Compare
» With all tested laptops playable in detail settings low.
FIFA 20

FIFA 20

2019
ultra 1920x1080
98.9  fps    + Compare
QHD 2560x1440
76.9  fps    + Compare
4K 3840x2160
49.7  fps    + Compare
» With all tested laptops playable in detail settings ultra.
low 1280x720
87.5  fps    + Compare
med. 1920x1080
39.3  fps    + Compare
high 1920x1080
24.2  fps    + Compare
ultra 1920x1080
18.5  fps    + Compare
QHD 2560x1440
12.6  fps    + Compare
4K 3840x2160
5.4  fps    + Compare
» With all tested laptops playable in detail settings med..
Additional Benchmarks
Very Low Overall Quality (DX11) 1920x1080
58.2
Control

Control

2019
low 1280x720
87.6  fps    + Compare
med. 1920x1080
27.5  fps    + Compare
high 1920x1080
19.8  fps    + Compare
QHD 2560x1440
12.6  fps    + Compare
4K 3840x2160
5.9  fps    + Compare
» With all tested laptops playable in detail settings low.
F1 2019

F1 2019

2019
low 1280x720
105  fps    + Compare
med. 1920x1080
65  fps    + Compare
high 1920x1080
56  fps    + Compare
ultra 1920x1080
38  fps    + Compare
4K 3840x2160
16  fps    + Compare
» With all tested laptops playable in detail settings ultra.
low 1280x720
122.5  fps    + Compare
med. 1920x1080
37.8  fps    + Compare
high 1920x1080
23.7  fps    + Compare
ultra 1920x1080
16.7  fps    + Compare
QHD 2560x1440
9.5  fps    + Compare
4K 3840x2160
3.6  fps    + Compare
» With all tested laptops playable in detail settings med..
Rage 2

Rage 2

2019
low 1280x720
52.8  fps    + Compare
med. 1920x1080
27.7  fps    + Compare
high 1920x1080
4.4  fps    + Compare
» With all tested laptops playable in detail settings low.
Anno 1800

Anno 1800

2019
low 1280x720
84  fps    + Compare
med. 1920x1080
41.3  fps    + Compare
high 1920x1080
23.7  fps    + Compare
ultra 1920x1080
12.1  fps    + Compare
QHD 2560x1440
8  fps    + Compare
4K 3840x2160
4.2  fps    + Compare
» With all tested laptops playable in detail settings med..
low 1280x720
88  fps    + Compare
med. 1920x1080
46  fps    + Compare
high 1920x1080
34  fps    + Compare
ultra 1920x1080
24  fps    + Compare
QHD 2560x1440
15  fps    + Compare
4K 3840x2160
7  fps    + Compare
» With all tested laptops playable in detail settings med..
low 1280x720
179.6  fps    + Compare
med. 1920x1080
70.7  fps    + Compare
high 1920x1080
54.4  fps    + Compare
ultra 1920x1080
30.1  fps    + Compare
QHD 2560x1440
21.2  fps    + Compare
4K 3840x2160
11.3  fps    + Compare
» With all tested laptops playable in detail settings high.
Anthem

Anthem

2019
low 1280x720
55.6  fps    + Compare
med. 1920x1080
40.6  fps    + Compare
high 1920x1080
37.4  fps    + Compare
ultra 1920x1080
26.4  fps    + Compare
QHD 2560x1440
19.8  fps    + Compare
4K 3840x2160
9.9  fps    + Compare
» With all tested laptops playable in detail settings high.
low 1280x720
74  fps    + Compare
med. 1920x1080
44  fps    + Compare
high 1920x1080
41  fps    + Compare
ultra 1920x1080
38  fps    + Compare
QHD 2560x1440
27  fps    + Compare
4K 3840x2160
13  fps    + Compare
» With all tested laptops playable in detail settings ultra.
low 1280x720
72.7  fps    + Compare
med. 1920x1080
32.8  fps    + Compare
high 1920x1080
21.6  fps    + Compare
ultra 1920x1080
18  fps    + Compare
QHD 2560x1440
13.9  fps    + Compare
» With all tested laptops playable in detail settings low.
low 1280x720
124.2  fps    + Compare
med. 1920x1080
53  fps    + Compare
high 1920x1080
41.4  fps    + Compare
ultra 1920x1080
39.7  fps    + Compare
QHD 2560x1440
26.8  fps    + Compare
4K 3840x2160
14.8  fps    + Compare
» With all tested laptops playable in detail settings ultra.
low 1280x720
118.2  fps    + Compare
med. 1920x1080
61.6  fps    + Compare
high 1920x1080
51.6  fps    + Compare
ultra 1920x1080
47.7  fps    + Compare
QHD 2560x1440
34.2  fps    + Compare
4K 3840x2160
16.4  fps    + Compare
» With all tested laptops playable in detail settings ultra.
low 1280x720
160.3  fps    + Compare
med. 1920x1080
115.9  fps    + Compare
high 1920x1080
68.4  fps    + Compare
ultra 1920x1080
37.1  fps    + Compare
QHD 2560x1440
25.5  fps    + Compare
4K 3840x2160
12.2  fps    + Compare
» With all tested laptops playable in detail settings ultra.
low 1280x720
60  fps    + Compare
med. 1920x1080
47  fps    + Compare
high 1920x1080
39  fps    + Compare
ultra 1920x1080
23  fps    + Compare
QHD 2560x1440
17  fps    + Compare
4K 3840x2160
11  fps    + Compare
» With all tested laptops playable in detail settings high.
low 1280x720
72  fps    + Compare
med. 1920x1080
41  fps    + Compare
high 1920x1080
36  fps    + Compare
ultra 1920x1080
30  fps    + Compare
QHD 2560x1440
19  fps    + Compare
4K 3840x2160
9  fps    + Compare
» With all tested laptops playable in detail settings high.
Additional Benchmarks
Lowest Preset 1920x1080
65
Far Cry 5

Far Cry 5

2018
low 1280x720
78  fps    + Compare
med. 1920x1080
42  fps    + Compare
high 1920x1080
39  fps    + Compare
ultra 1920x1080
36  fps    + Compare
QHD 2560x1440
24  fps    + Compare
4K 3840x2160
12  fps    + Compare
» With all tested laptops playable in detail settings ultra.
Additional Benchmarks
Low Preset TAA 1920x1080
48
World of Tanks enCore

World of Tanks enCore

2018
low 1366x768
318.5  fps    + Compare
med. 1920x1080
130.6  fps    + Compare
ultra 1920x1080
50.8  fps    + Compare
QHD 2560x1440
32.2  fps    + Compare
4K 3840x2160
15.4  fps    + Compare
» With all tested laptops playable in detail settings ultra.
low 1280x720
50.4  fps    + Compare
med. 1920x1080
42.2  fps    + Compare
high 1920x1080
36.9  fps    + Compare
4K 3840x2160
23.6  fps    + Compare
» With all tested laptops playable in detail settings high.
low 1280x720
9 57.3 ~ 33 fps    + Compare
med. 1920x1080
31.3  fps    + Compare
high 1920x1080
20.7  fps    + Compare
4K 3840x2160
8.2  fps    + Compare
» The benchmarks indicate that the game is not playable in the tested settings.
Fortnite

Fortnite

2018
low 1280x720
126.9  fps    + Compare
med. 1920x1080
86.2  fps    + Compare
high 1920x1080
55.7  fps    + Compare
ultra 1920x1080
37.9  fps    + Compare
QHD 2560x1440
24.2  fps    + Compare
4K 3840x2160
8.8  fps    + Compare
» With all tested laptops playable in detail settings ultra.
F1 2017

F1 2017

2017
med. 1920x1080
80  fps    + Compare
high 1920x1080
65  fps    + Compare
ultra 1920x1080
39  fps    + Compare
» With all tested laptops playable in detail settings ultra.
Additional Benchmarks
Medium Preset 4xAF 1366x768
105
Dirt 4

Dirt 4

2017
low 1280x720
40.9  fps    + Compare
med. 1920x1080
16.3  fps    + Compare
high 1920x1080
9.7  fps    + Compare
» With all tested laptops playable in detail settings low.
Additional Benchmarks
Medium Preset 4xAF 1366x768
26.4
low 1280x720
248.2  fps    + Compare
med. 1920x1080
159.8  fps    + Compare
high 1920x1080
99.1  fps    + Compare
QHD 2560x1440
61.6  fps    + Compare
4K 3840x2160
29.6  fps    + Compare
» With all tested laptops playable in detail settings high.
Additional Benchmarks
Performance 1920x1080
127.6
Prey

Prey

2017
low 1280x720
135  fps    + Compare
med. 1920x1080
86.6  fps    + Compare
high 1920x1080
69.1  fps    + Compare
ultra 1920x1080
61  fps    + Compare
» With all tested laptops playable in detail settings ultra.
Additional Benchmarks
Medium Preset 4xAF FXAA 1366x768
133
Mafia 3

Mafia 3

2016
low 1280x720
45  fps    + Compare
med. 1366x768
34  fps    + Compare
high 1920x1080
24  fps    + Compare
» With all tested laptops playable in detail settings low.
Additional Benchmarks
Medium Preset 1920x1080
25.1
Overwatch

Overwatch

2016
med. 1366x768
184.3  fps    + Compare
high 1920x1080
108.2  fps    + Compare
ultra 1920x1080
50  fps    + Compare
» With all tested laptops playable in detail settings ultra.
Additional Benchmarks
Medium (Render Scale 100 %) 2xAF FXAA 1920x1080
117
low 1280x768
54.1 54.9 58.7 ~ 56 fps    + Compare
med. 1920x1080
36.4 37 38.4 ~ 37 fps    + Compare
high 1920x1080
32.3 32.5 32.7 ~ 33 fps    + Compare
» With all tested laptops playable in detail settings med..
Additional Benchmarks
extreme 3840x2160
18
low 1024x768
131.1 133.1 ~ 132 fps    + Compare
med. 1366x768
79.7 80.2 81.2 ~ 80 fps    + Compare
high 1920x1080
35 40.6 42.4 ~ 39 fps    + Compare
ultra 1920x1080
26.9 31.7 32.8 ~ 30 fps    + Compare
4K 3840x2160
12 14.3 ~ 13 fps    + Compare
» With most tested laptops playable in detail settings high.
low 1024x768
180.9  fps    + Compare
med. 1366x768
149.4  fps    + Compare
high 1920x1080
97  fps    + Compare
ultra 1920x1080
80.5  fps    + Compare
4K 3840x2160
30.8  fps    + Compare
» With all tested laptops playable in detail settings ultra.
Additional Benchmarks
Ultra Preset 16xAF TAA 3840x2160
24.7
Fallout 4

Fallout 4

2015
med. 1366x768
86.1  fps    + Compare
high 1920x1080
45.2  fps    + Compare
ultra 1920x1080
36  fps    + Compare
» With all tested laptops playable in detail settings ultra.
low 1024x768
60  fps    + Compare
med. 1366x768
60  fps    + Compare
high 1920x1080
60  fps    + Compare
ultra 1920x1080
54  fps    + Compare
» With all tested laptops playable in detail settings ultra.
low 1280x720
108 111 118 ~ 112 fps    + Compare
med. 1366x768
95 97 107 ~ 100 fps    + Compare
high 1920x1080
53 54 55 ~ 54 fps    + Compare
4K 3840x2160
16 16 ~ 16 fps    + Compare
» With all tested laptops playable in detail settings high.
low 1024x768
116.6  fps    + Compare
med. 1366x768
75.9 77.8 79 ~ 78 fps    + Compare
high 1920x1080
40.8 41.3 43.8 ~ 42 fps    + Compare + 📈 Graph
ultra 1920x1080
21.5 23.7 24.3 ~ 23 fps    + Compare
4K 3840x2160
13 14.4 ~ 14 fps    + Compare
» With all tested laptops playable in detail settings high.
GTA V

GTA V

2015
low 1024x768
138.7  fps    + Compare
med. 1366x768
130.8  fps    + Compare
high 1920x1080
58.1  fps    + Compare
ultra 1920x1080
24  fps    + Compare
4K 3840x2160
28.8  fps    + Compare
» With all tested laptops playable in detail settings high.
Additional Benchmarks
Normal/Off 4xAF 1920x1080
118.9
Lowest Settings possible 1920x1080
126.1
Thief

Thief

2014
med. 1366x768
78.8  fps    + Compare
high 1366x768
72.6  fps    + Compare
ultra 1920x1080
41.1  fps    + Compare
» With all tested laptops playable in detail settings ultra.
med. 1366x768
105.8  fps    + Compare
high 1366x768
80.9  fps    + Compare
ultra 1920x1080
40.8  fps    + Compare
» With all tested laptops playable in detail settings ultra.
low 1280x720
202.7 208 216.3 223.6 224.5 ~ 215 fps    + Compare
med. 1366x768
165.3 172 177.3 181.4 187.3 ~ 177 fps    + Compare
high 1366x768
148 152 157 161 166.7 ~ 157 fps    + Compare
ultra 1920x1080
51.7 51.7 52.5 59.8 60.2 ~ 55 fps    + Compare
» With all tested laptops playable in detail settings ultra.
lowmed.highultraQHD4K
Gears Tactics172.757.739.427.418.48.8
Doom Eternal83.446.727
Hunt Showdown90.635.329.518.9
Escape from Tarkov97.945.234.329.820.89.5
Red Dead Redemption 269.134.920.612.1
Star Wars Jedi Fallen Order47.739.33220.89.9
Need for Speed Heat64.943.736.730.522.111.5
Call of Duty Modern Warfare 201972.144.437.833.521.111.8
GRID 2019120.550.54226.814.79.2
Ghost Recon Breakpoint55333020124
FIFA 2098.976.949.7
Borderlands 387.539.324.218.512.65.4
Control87.627.519.812.65.9
F1 201910565563816
Total War: Three Kingdoms122.537.823.716.79.53.6
Rage 252.827.74.4
Anno 18008441.323.712.184.2
The Division 288463424157
Dirt Rally 2.0179.670.754.430.121.211.3
Anthem55.640.637.426.419.89.9
Far Cry New Dawn744441382713
Metro Exodus72.732.821.61813.9
Apex Legends124.25341.439.726.814.8
Battlefield V118.261.651.647.734.216.4
Farming Simulator 19160.3115.968.437.125.512.2
Assassin´s Creed Odyssey604739231711
Shadow of the Tomb Raider72413630199
Far Cry 5784239362412
World of Tanks enCore318.5130.650.832.215.4
X-Plane 11.1150.442.236.923.6
Final Fantasy XV Benchmark3331.320.78.2
Fortnite126.986.255.737.924.28.8
F1 2017806539
Dirt 440.916.39.7
Rocket League248.2159.899.161.629.6
Prey13586.669.161
Mafia 3453424
Overwatch184.3108.250
Ashes of the Singularity563733
Rise of the Tomb Raider13280393013
Rainbow Six Siege180.9149.49780.530.8
Fallout 486.145.236
Metal Gear Solid V60606054
Batman: Arkham Knight1121005416
The Witcher 3116.678422314
GTA V138.7130.858.12428.8
Thief78.872.641.1
Metro: Last Light105.880.940.8
BioShock Infinite21517715755
< 30 fps
< 60 fps
< 120 fps
≥ 120 fps

8
20
14
3
25
14
6
12
25
9
1
14
21
3
23
2
2
31
2

For more games that might be playable and a list of all games and graphics cards visit our Gaming List

v1.26
log 23. 01:01:46

#0 no ids found in url (should be separated by "_") +0s ... 0s

#1 not redirecting to Ajax server +0s ... 0s

#2 did not recreate cache, as it is less than 5 days old! Created at Mon, 22 Apr 2024 05:40:21 +0200 +0.001s ... 0.001s

#3 no comparison url found in template nbc.compare_page_1 needed +0.037s ... 0.038s

#4 no comparison url found in template nbc.compare_page_1 needed +0s ... 0.038s

#5 no comparison url found in template nbc.compare_page_1 needed +0s ... 0.038s

#6 no comparison url found in template nbc.compare_page_1 needed +0s ... 0.038s

#7 no comparison url found in template nbc.compare_page_1 needed +0s ... 0.038s

#8 no comparison url found in template nbc.compare_page_1 needed +0s ... 0.038s

#9 composed specs +0s ... 0.038s

#10 did output specs +0s ... 0.038s

#11 start showIntegratedCPUs +0s ... 0.038s

#12 getting avg benchmarks for device 8472 +0.025s ... 0.063s

#13 got single benchmarks 8472 +0.019s ... 0.083s

#14 got avg benchmarks for devices +0s ... 0.083s

#15 min, max, avg, median took s +0.709s ... 0.791s

#16 before gaming benchmark output +0s ... 0.791s

#17 Got 280 rows for game benchmarks. +0.026s ... 0.817s

#18 composed SQL query for gamebenchmarks +0s ... 0.817s

#19 got data and put it in $dataArray +0.035s ... 0.852s

#20 benchmarks composed for output. +2.009s ... 2.862s

#21 no comparison url found in template nbc.compare_page_1 needed +0.005s ... 2.867s

#22 return log +0s ... 2.867s

Notebook reviews with AMD Radeon RX Vega M GL / 870 graphics card

Acer ConceptD 5 CN515-51-73Z7: Intel Core i7-8705G, 15.60", 1.5 kg
  External Review » Acer ConceptD 5 CN515-51-73Z7

Acer Aspire 7 A715-73G-779W: Intel Core i7-8705G, 15.60", 1.5 kg
  External Review » Acer Aspire 7 A715-73G-779W

Acer Aspire 7 A715-73G-56YJ: Intel Core i5-8305G, 15.60", 1.5 kg
  External Review » Acer Aspire 7 A715-73G-56YJ

Acer ConceptD 5: Intel Core i7-8705G, 15.60", 1.5 kg
  External Review » Acer ConceptD 5

HP Spectre x360 15-ch006nf : Intel Core i7-8705G, 15.60", 2.1 kg
  External Review » HP Spectre x360 15-ch006nf

HP Spectre x360 15-CH004no: Intel Core i7-8705G, 15.60", 2.2 kg
  External Review » HP Spectre x360 15-CH004no

Dell XPS 15 9575 i7-8705G: Intel Core i7-8705G, 15.60", 2 kg
  External Review » Dell XPS 15 9575 i7-8705G

HP Spectre x360 15-ch025nd: Intel Core i7-8705G, 15.60", 2.1 kg
  External Review » HP Spectre x360 15-ch025nd

Dell XPS 15 9575 i5-8305G: Intel Core i5-8305G, 15.60", 2 kg
  External Review » Dell XPS 15 9575 i5-8305G

Dell XPS 15 9575, i7-8705G: Intel Core i7-8705G, 15.60", 2 kg
  External Review » Dell XPS 15 9575, i7-8705G

HP Spectre x360 15-ch004ng: Intel Core i7-8705G, 15.60", 2.1 kg
  External Review » HP Spectre x360 15-ch004ng

Dell XPS 15-9575: Intel Core i5-8305G, 15.60", 2 kg
  External Review » Dell XPS 15-9575

Please share our article, every link counts!

» Comparison of GPUs
Detailed list of all laptop GPUs sorted by class and performance.

» Benchmark List
Sort and restrict laptop GPUs based on performance in synthetic benchmarks.

» Notebook Gaming List
Playable games for each graphics card and their average FPS results.

Class 1

GeForce RTX 2080 Super Mobile

Class 2

M1 Max 32-Core GPU *
GeForce RTX 2070 Super Mobile
M1 Max 24-Core GPU *
Quadro RTX 5000 Max-Q
Radeon RX 5700M *
GeForce GTX 1080 Mobile
Quadro RTX 4000 (Laptop)
M1 Pro 16-Core GPU *
Radeon PRO W6600M *
GeForce RTX 2070 Super Max-Q
Quadro RTX 4000 Max-Q *
M1 Pro 14-Core GPU *
Quadro P5200
Quadro RTX 3000 Max-Q *
Quadro P4200
Quadro P5000 Max-Q *
GeForce GTX 980 (Laptop)
Quadro P4000
Quadro P4000 Max-Q
Quadro P3200
Radeon RX 580X (Laptop) *
Radeon RX 580 (Laptop)
Radeon Pro 5300M
Radeon RX 5300M
Quadro P3000 Max-Q *
Quadro T2000 Max-Q *
Radeon Pro WX 7100 *
Radeon RX 570X (Laptop) *
Radeon RX 570 (Laptop) *
Radeon RX 470 (Laptop) *
Quadro T1000 Max-Q *

Class 3

Vega M GH
Quadro M5000M
GeForce GTX 1050 Ti Mobile
Radeon 680M
Quadro P2000
Quadro P2000 Max-Q
Quadro M4000M
T500 Laptop GPU *
Radeon R9 M395X
GeForce GTX 1050 Ti Max-Q *
Radeon Pro Vega 16
WX Vega M GL
Radeon R9 M485X
Quadro M3000M
FirePro W7170M
Radeon R9 M395
GeForce GTX 1050 Max-Q *
Radeon 660M
Radeon Pro WX 4150 *
Radeon RX 560X (Laptop)
Radeon RX 560 (Laptop)
Radeon RX 460 (Laptop)
Quadro P1000
Radeon R9 M390
Xe MAX
Radeon Pro 560X
Radeon Pro 560
Radeon Pro 460
Radeon Pro WX 4130 *
GeForce GTX 960M
Quadro P620 *
Radeon RX 550X (Laptop)
Radeon Pro WX 3200 *
Radeon Pro 555X
Radeon Pro 555
Radeon Pro 455
Quadro P600
Quadro M2000M
Radeon RX 540X *
Radeon Pro WX 2100 *
Radeon Pro WX 3100 *
GeForce GTX 950M
Radeon Pro 450
Radeon 630
Radeon 540X *
Radeon R9 M385X
Quadro P520
Quadro M1000M
GeForce 945M
Quadro P500 *
Iris Plus Graphics G7 (Ice Lake 64 EU) *
Vega 10 *
Iris Pro Graphics 580
FirePro W5170M *
Radeon R9 M370X
Vega 9
FirePro W5130M
UHD Graphics Xe G4 48EUs *
UHD Graphics 32EUs
UHD Graphics Xe 32EUs (Tiger Lake-H) *
UHD Graphics 750
Vega 7
Radeon R7 M465
Iris Pro Graphics 6200
Vega 8
GeForce 940M
Iris Plus Graphics G4 (Ice Lake 48 EU)
Quadro M600M
FirePro W4190M
Radeon R9 M375
Radeon R7 M445
Iris Plus Graphics 650
Iris Graphics 550
Radeon 625
Vega 6 *
Iris Plus Graphics 640
Iris Graphics 540
UHD Graphics 24EUs (Alder Lake-N) *
Radeon R7 M360
GeForce 920M
Radeon 620
Radeon R7 M340
Radeon 610
Radeon 610M *
Vega 6 *
UHD Graphics G1 (Ice Lake 32 EU)
UHD Graphics Xe 16EUs (Tiger Lake-H) *
HD Graphics 530
Radeon R5 (Bristol Ridge)
Adreno 690 *
Adreno 685 *
Adreno 680 *
Radeon R5 M330
GeForce 910M
HD Graphics 520

Class 4

UHD Graphics 730
Radeon R5 M320 *
Radeon R5 M315 *
Radeon R5 M420 *
Vega 2 *
UHD Graphics 617
UHD Graphics 615
HD Graphics 515
UHD Graphics 610
HD Graphics 510
UHD Graphics 605
Radeon R4 (Stoney Ridge)
Radeon R2 (Stoney Ridge)
HD Graphics (Broadwell)
UHD Graphics 600
HD Graphics (Braswell)

Class 5

* Approximate position of the graphics adapter