Trigkey Speed S评论。廉价的即用型酷睿i5-11320H迷你电脑
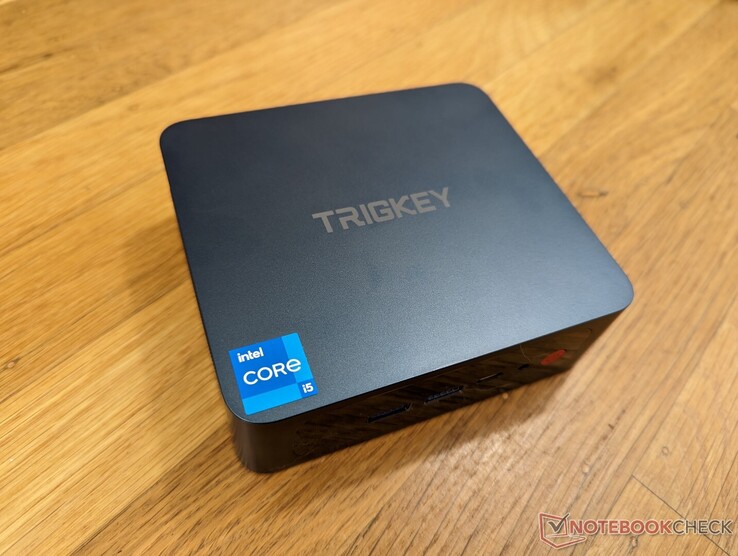
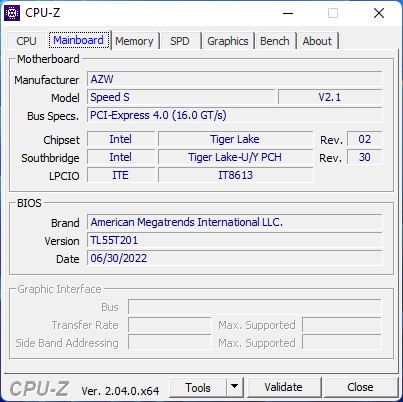
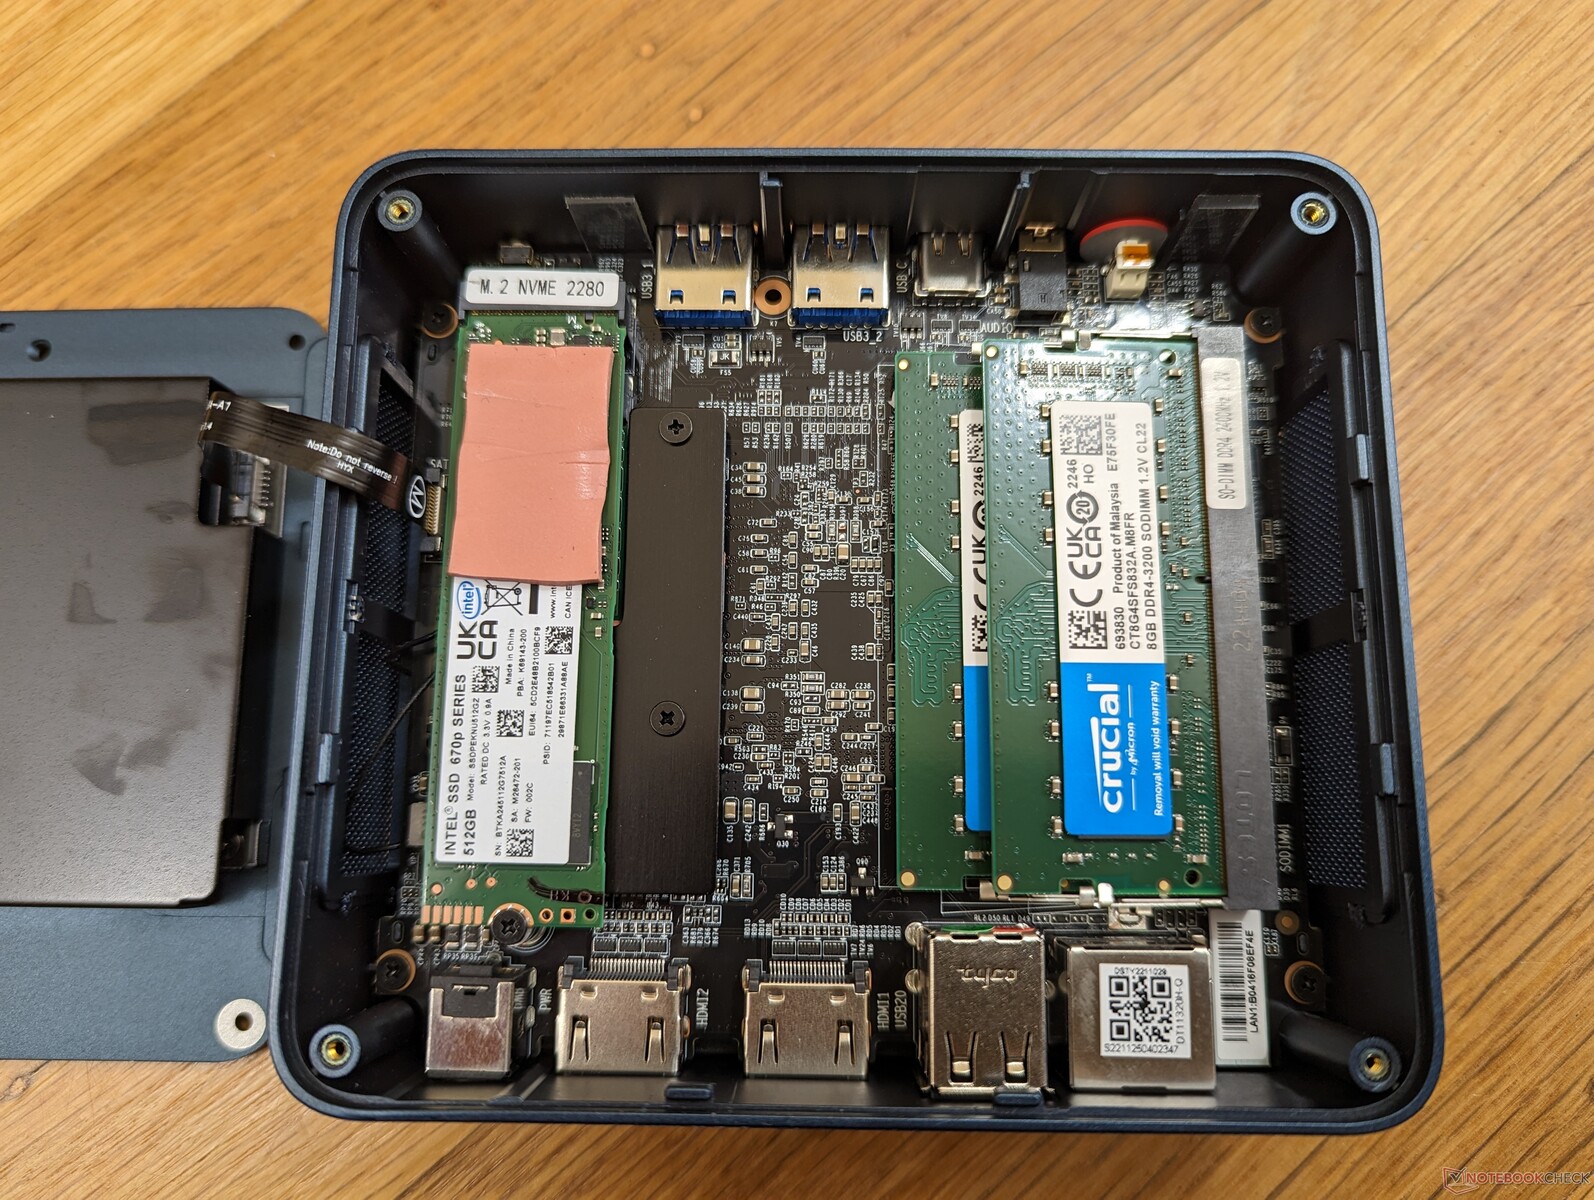
Trigkey Speed S是Trigkey S3的快速版本。取而代之的是老化的 Ryzen 5 3550H而不是老化的Ryzen 5 3550H,Speed S采用了第11代 酷睿i5-11320H同时将价格保持在非常实惠的400美元以下的范围。我们的具体审查配置配有16GB DDR4-3200内存和512GB M.2 PCIe3 x4固态硬盘。
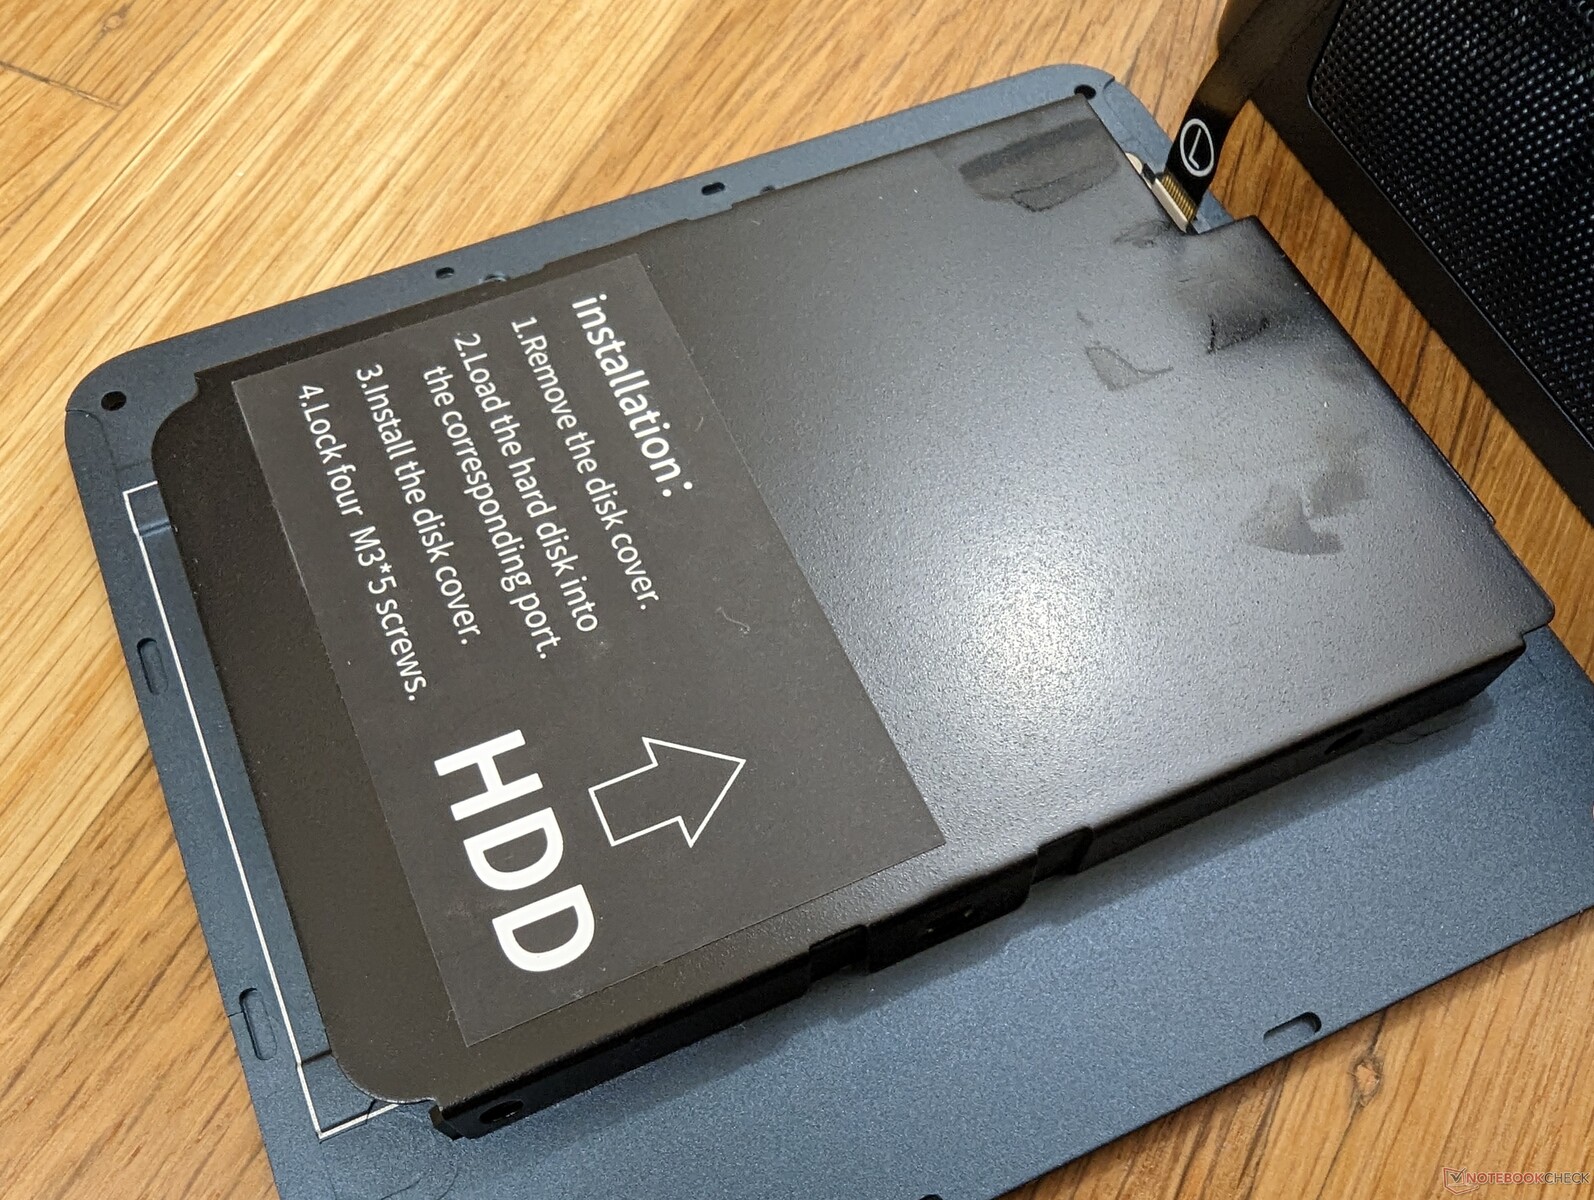
除了上述差异外,Speed S与S3共享相同的机箱设计和功能,因此我们建议查看我们的 关于S3的现有评论来了解更多关于该系列的物理特征。这篇评论将显示用户在这两个型号之间可以期待哪些性能优势。
Speed S的替代品包括其他面向预算的迷你电脑,如 BMax B5 Pro和 Beelink SEi或 SER系列.
更多Trigkey评论。
潜在的竞争对手比较
Rating | Date | Model | Weight | Height | Size | Resolution | Price |
|---|---|---|---|---|---|---|---|
v (old) | 03 / 2023 | Trigkey Speed S i5-11320H, Iris Xe G7 96EUs | 415 g | 40.7 mm | x | ||
v (old) | 01 / 2023 | Trigkey S3 R5 3550H, Vega 8 | 419 g | 40.7 mm | x | ||
v (old) | 12 / 2022 | Beelink SEi12 Core i5-1235U i5-1235U, Iris Xe G7 80EUs | 465 g | 42 mm | x | ||
v (old) | 10 / 2022 | Beelink SER Pro Ryzen 5 5600H R5 5600H, Vega 7 | 498 g | 42 mm | x | ||
| 78.9 % v7 (old) | 11 / 2022 | Intel NUC 12 Pro Kit NUC12WSKi7 i7-1260P, Iris Xe G7 96EUs | 511 g | 37 mm | x | ||
v (old) | 11 / 2022 | BMAX B5 Pro G7H8 i5-8260U, UHD Graphics 620 | 369 g | 43.2 mm | x |
案例
沟通
如下图所示,即使经过多次重试,无线性能的波动也超过了预期。然而,它的速度足以满足4K视频流的需求。
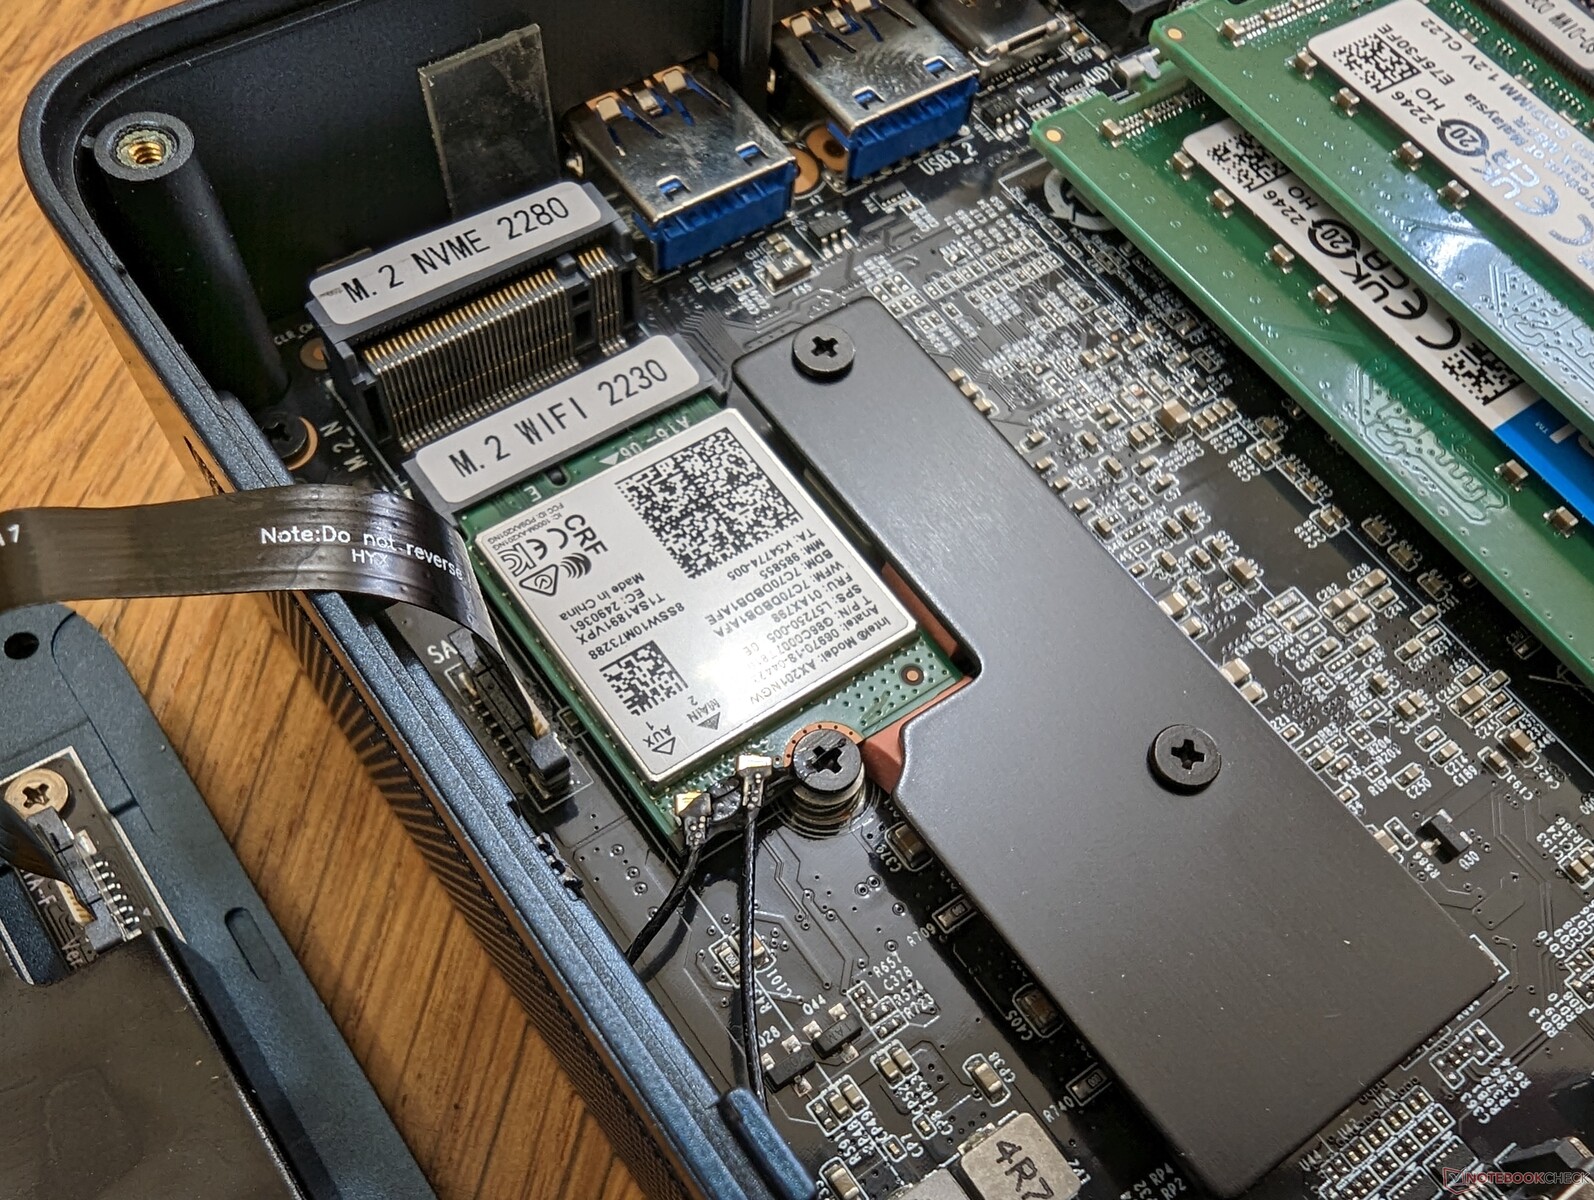
英特尔AX201不支持Wi-Fi 6E。
| Networking | |
| iperf3 transmit AXE11000 | |
| Beelink SEi12 Core i5-1235U | |
| Trigkey Speed S | |
| BMAX B5 Pro G7H8 | |
| Trigkey S3 | |
| iperf3 receive AXE11000 | |
| Beelink SEi12 Core i5-1235U | |
| Trigkey Speed S | |
| BMAX B5 Pro G7H8 | |
| Trigkey S3 | |
| iperf3 transmit AXE11000 6GHz | |
| Intel NUC 12 Pro Kit NUC12WSKi7 | |
| Beelink SER Pro Ryzen 5 5600H | |
| iperf3 receive AXE11000 6GHz | |
| Intel NUC 12 Pro Kit NUC12WSKi7 | |
| Beelink SER Pro Ryzen 5 5600H | |
业绩
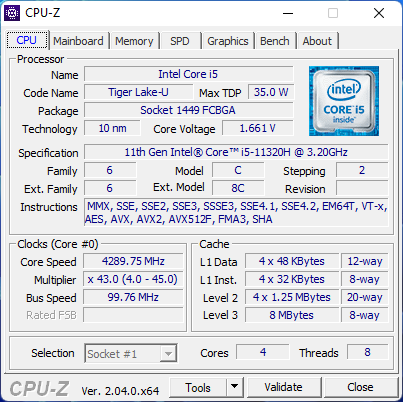
处理器 - Core i5-11320H
Cinebench R15 Multi Loop
Cinebench R23: Multi Core | Single Core
Cinebench R20: CPU (Multi Core) | CPU (Single Core)
Cinebench R15: CPU Multi 64Bit | CPU Single 64Bit
Blender: v2.79 BMW27 CPU
7-Zip 18.03: 7z b 4 | 7z b 4 -mmt1
Geekbench 5.5: Multi-Core | Single-Core
HWBOT x265 Benchmark v2.2: 4k Preset
LibreOffice : 20 Documents To PDF
R Benchmark 2.5: Overall mean
| CPU Performance rating | |
| Intel NUC 12 Pro Kit NUC12WSKi7 | |
| Beelink SEi12 Core i5-1235U | |
| Beelink SER Pro Ryzen 5 5600H | |
| Average Intel Core i5-11320H | |
| Trigkey Speed S | |
| Trigkey S3 | |
| BMAX B5 Pro G7H8 | |
| Cinebench R23 / Multi Core | |
| Intel NUC 12 Pro Kit NUC12WSKi7 | |
| Beelink SEi12 Core i5-1235U | |
| Beelink SER Pro Ryzen 5 5600H | |
| Average Intel Core i5-11320H (5720 - 6051, n=4) | |
| Trigkey Speed S | |
| Trigkey S3 | |
| BMAX B5 Pro G7H8 | |
| Cinebench R23 / Single Core | |
| Intel NUC 12 Pro Kit NUC12WSKi7 | |
| Beelink SEi12 Core i5-1235U | |
| Trigkey Speed S | |
| Average Intel Core i5-11320H (1341 - 1467, n=4) | |
| Beelink SER Pro Ryzen 5 5600H | |
| Trigkey S3 | |
| BMAX B5 Pro G7H8 | |
| Cinebench R20 / CPU (Multi Core) | |
| Intel NUC 12 Pro Kit NUC12WSKi7 | |
| Beelink SEi12 Core i5-1235U | |
| Beelink SER Pro Ryzen 5 5600H | |
| Average Intel Core i5-11320H (2208 - 2349, n=4) | |
| Trigkey Speed S | |
| BMAX B5 Pro G7H8 | |
| Trigkey S3 | |
| Cinebench R20 / CPU (Single Core) | |
| Intel NUC 12 Pro Kit NUC12WSKi7 | |
| Beelink SEi12 Core i5-1235U | |
| Trigkey Speed S | |
| Average Intel Core i5-11320H (557 - 567, n=4) | |
| Beelink SER Pro Ryzen 5 5600H | |
| BMAX B5 Pro G7H8 | |
| Trigkey S3 | |
| Cinebench R15 / CPU Multi 64Bit | |
| Intel NUC 12 Pro Kit NUC12WSKi7 | |
| Beelink SEi12 Core i5-1235U | |
| Beelink SER Pro Ryzen 5 5600H | |
| Average Intel Core i5-11320H (857 - 1019, n=4) | |
| Trigkey Speed S | |
| Trigkey S3 | |
| BMAX B5 Pro G7H8 | |
| Cinebench R15 / CPU Single 64Bit | |
| Intel NUC 12 Pro Kit NUC12WSKi7 | |
| Beelink SEi12 Core i5-1235U | |
| Beelink SER Pro Ryzen 5 5600H | |
| Trigkey Speed S | |
| Average Intel Core i5-11320H (212 - 215, n=4) | |
| BMAX B5 Pro G7H8 | |
| Trigkey S3 | |
| Blender / v2.79 BMW27 CPU | |
| BMAX B5 Pro G7H8 | |
| Trigkey S3 | |
| Trigkey Speed S | |
| Average Intel Core i5-11320H (507 - 543, n=4) | |
| Beelink SEi12 Core i5-1235U | |
| Beelink SER Pro Ryzen 5 5600H | |
| Intel NUC 12 Pro Kit NUC12WSKi7 | |
| 7-Zip 18.03 / 7z b 4 | |
| Intel NUC 12 Pro Kit NUC12WSKi7 | |
| Beelink SER Pro Ryzen 5 5600H | |
| Beelink SEi12 Core i5-1235U | |
| Average Intel Core i5-11320H (24718 - 26858, n=4) | |
| Trigkey Speed S | |
| BMAX B5 Pro G7H8 | |
| Trigkey S3 | |
| 7-Zip 18.03 / 7z b 4 -mmt1 | |
| Intel NUC 12 Pro Kit NUC12WSKi7 | |
| Beelink SER Pro Ryzen 5 5600H | |
| Beelink SEi12 Core i5-1235U | |
| Trigkey Speed S | |
| Average Intel Core i5-11320H (4813 - 5119, n=4) | |
| BMAX B5 Pro G7H8 | |
| Trigkey S3 | |
| Geekbench 5.5 / Multi-Core | |
| Intel NUC 12 Pro Kit NUC12WSKi7 | |
| Beelink SEi12 Core i5-1235U | |
| Beelink SER Pro Ryzen 5 5600H | |
| Average Intel Core i5-11320H (4927 - 5955, n=4) | |
| Trigkey Speed S | |
| Trigkey S3 | |
| BMAX B5 Pro G7H8 | |
| Geekbench 5.5 / Single-Core | |
| Intel NUC 12 Pro Kit NUC12WSKi7 | |
| Beelink SEi12 Core i5-1235U | |
| Trigkey Speed S | |
| Average Intel Core i5-11320H (1453 - 1523, n=4) | |
| Beelink SER Pro Ryzen 5 5600H | |
| Trigkey S3 | |
| BMAX B5 Pro G7H8 | |
| HWBOT x265 Benchmark v2.2 / 4k Preset | |
| Intel NUC 12 Pro Kit NUC12WSKi7 | |
| Beelink SER Pro Ryzen 5 5600H | |
| Beelink SEi12 Core i5-1235U | |
| Average Intel Core i5-11320H (7.25 - 7.91, n=4) | |
| Trigkey Speed S | |
| Trigkey S3 | |
| BMAX B5 Pro G7H8 | |
| LibreOffice / 20 Documents To PDF | |
| BMAX B5 Pro G7H8 | |
| Trigkey S3 | |
| Beelink SER Pro Ryzen 5 5600H | |
| Beelink SEi12 Core i5-1235U | |
| Average Intel Core i5-11320H (44 - 50, n=4) | |
| Intel NUC 12 Pro Kit NUC12WSKi7 | |
| Trigkey Speed S | |
| R Benchmark 2.5 / Overall mean | |
| BMAX B5 Pro G7H8 | |
| Trigkey S3 | |
| Average Intel Core i5-11320H (0.581 - 0.622, n=4) | |
| Trigkey Speed S | |
| Beelink SER Pro Ryzen 5 5600H | |
| Beelink SEi12 Core i5-1235U | |
| Intel NUC 12 Pro Kit NUC12WSKi7 | |
* ... smaller is better
| Blender | |
| v3.3 Classroom HIP/AMD | |
| Trigkey S3 | |
| v3.3 Classroom CPU | |
| BMAX B5 Pro G7H8 | |
| Trigkey S3 | |
| Trigkey Speed S | |
| Beelink SEi12 Core i5-1235U | |
| Average Intel Iris Xe Graphics G7 96EUs (336 - 1259, n=109) | |
| Beelink SER Pro Ryzen 5 5600H | |
| Intel NUC 12 Pro Kit NUC12WSKi7 | |
* ... smaller is better
AIDA64: FP32 Ray-Trace | FPU Julia | CPU SHA3 | CPU Queen | FPU SinJulia | FPU Mandel | CPU AES | CPU ZLib | FP64 Ray-Trace | CPU PhotoWorxx
| Performance rating | |
| Intel NUC 12 Pro Kit NUC12WSKi7 | |
| Beelink SER Pro Ryzen 5 5600H | |
| Beelink SEi12 Core i5-1235U | |
| Average Intel Core i5-11320H | |
| Trigkey Speed S | |
| BMAX B5 Pro G7H8 | |
| Trigkey S3 | |
| AIDA64 / FP32 Ray-Trace | |
| Intel NUC 12 Pro Kit NUC12WSKi7 | |
| Beelink SER Pro Ryzen 5 5600H | |
| Trigkey Speed S | |
| Average Intel Core i5-11320H (6369 - 7489, n=4) | |
| Beelink SEi12 Core i5-1235U | |
| BMAX B5 Pro G7H8 | |
| Trigkey S3 | |
| AIDA64 / FPU Julia | |
| Beelink SER Pro Ryzen 5 5600H | |
| Intel NUC 12 Pro Kit NUC12WSKi7 | |
| Beelink SEi12 Core i5-1235U | |
| Trigkey Speed S | |
| Average Intel Core i5-11320H (27391 - 31637, n=4) | |
| BMAX B5 Pro G7H8 | |
| Trigkey S3 | |
| AIDA64 / CPU SHA3 | |
| Intel NUC 12 Pro Kit NUC12WSKi7 | |
| Beelink SER Pro Ryzen 5 5600H | |
| Trigkey Speed S | |
| Average Intel Core i5-11320H (1847 - 2099, n=4) | |
| Beelink SEi12 Core i5-1235U | |
| BMAX B5 Pro G7H8 | |
| Trigkey S3 | |
| AIDA64 / CPU Queen | |
| Intel NUC 12 Pro Kit NUC12WSKi7 | |
| Beelink SER Pro Ryzen 5 5600H | |
| Beelink SEi12 Core i5-1235U | |
| Trigkey Speed S | |
| Average Intel Core i5-11320H (43565 - 52477, n=4) | |
| BMAX B5 Pro G7H8 | |
| Trigkey S3 | |
| AIDA64 / FPU SinJulia | |
| Beelink SER Pro Ryzen 5 5600H | |
| Intel NUC 12 Pro Kit NUC12WSKi7 | |
| Trigkey S3 | |
| Trigkey Speed S | |
| Average Intel Core i5-11320H (4381 - 5011, n=4) | |
| Beelink SEi12 Core i5-1235U | |
| BMAX B5 Pro G7H8 | |
| AIDA64 / FPU Mandel | |
| Beelink SER Pro Ryzen 5 5600H | |
| Intel NUC 12 Pro Kit NUC12WSKi7 | |
| Trigkey Speed S | |
| Average Intel Core i5-11320H (16659 - 18770, n=4) | |
| Beelink SEi12 Core i5-1235U | |
| BMAX B5 Pro G7H8 | |
| Trigkey S3 | |
| AIDA64 / CPU AES | |
| Intel NUC 12 Pro Kit NUC12WSKi7 | |
| Beelink SER Pro Ryzen 5 5600H | |
| Trigkey Speed S | |
| Average Intel Core i5-11320H (59851 - 76500, n=4) | |
| Beelink SEi12 Core i5-1235U | |
| Trigkey S3 | |
| BMAX B5 Pro G7H8 | |
| AIDA64 / CPU ZLib | |
| Intel NUC 12 Pro Kit NUC12WSKi7 | |
| Beelink SEi12 Core i5-1235U | |
| Beelink SER Pro Ryzen 5 5600H | |
| Average Intel Core i5-11320H (330 - 410, n=4) | |
| Trigkey Speed S | |
| Trigkey S3 | |
| BMAX B5 Pro G7H8 | |
| AIDA64 / FP64 Ray-Trace | |
| Intel NUC 12 Pro Kit NUC12WSKi7 | |
| Beelink SER Pro Ryzen 5 5600H | |
| Average Intel Core i5-11320H (3536 - 4021, n=4) | |
| Trigkey Speed S | |
| Beelink SEi12 Core i5-1235U | |
| BMAX B5 Pro G7H8 | |
| Trigkey S3 | |
| AIDA64 / CPU PhotoWorxx | |
| Average Intel Core i5-11320H (25964 - 36644, n=4) | |
| Beelink SEi12 Core i5-1235U | |
| Intel NUC 12 Pro Kit NUC12WSKi7 | |
| Trigkey Speed S | |
| Beelink SER Pro Ryzen 5 5600H | |
| BMAX B5 Pro G7H8 | |
| Trigkey S3 | |
系统性能
CrossMark: Overall | Productivity | Creativity | Responsiveness
| PCMark 10 / Score | |
| Intel NUC 12 Pro Kit NUC12WSKi7 | |
| Beelink SER Pro Ryzen 5 5600H | |
| Beelink SEi12 Core i5-1235U | |
| Trigkey Speed S | |
| Average Intel Core i5-11320H, Intel Iris Xe Graphics G7 96EUs (5095 - 5302, n=3) | |
| Trigkey S3 | |
| BMAX B5 Pro G7H8 | |
| PCMark 10 / Essentials | |
| Beelink SEi12 Core i5-1235U | |
| Intel NUC 12 Pro Kit NUC12WSKi7 | |
| Trigkey Speed S | |
| Beelink SER Pro Ryzen 5 5600H | |
| Average Intel Core i5-11320H, Intel Iris Xe Graphics G7 96EUs (9556 - 10558, n=3) | |
| BMAX B5 Pro G7H8 | |
| Trigkey S3 | |
| PCMark 10 / Productivity | |
| Beelink SER Pro Ryzen 5 5600H | |
| Intel NUC 12 Pro Kit NUC12WSKi7 | |
| Beelink SEi12 Core i5-1235U | |
| Trigkey Speed S | |
| Average Intel Core i5-11320H, Intel Iris Xe Graphics G7 96EUs (6832 - 6963, n=3) | |
| Trigkey S3 | |
| BMAX B5 Pro G7H8 | |
| PCMark 10 / Digital Content Creation | |
| Intel NUC 12 Pro Kit NUC12WSKi7 | |
| Beelink SER Pro Ryzen 5 5600H | |
| Beelink SEi12 Core i5-1235U | |
| Trigkey Speed S | |
| Average Intel Core i5-11320H, Intel Iris Xe Graphics G7 96EUs (5048 - 5615, n=3) | |
| Trigkey S3 | |
| BMAX B5 Pro G7H8 | |
| CrossMark / Overall | |
| Intel NUC 12 Pro Kit NUC12WSKi7 | |
| Beelink SEi12 Core i5-1235U | |
| Trigkey Speed S | |
| Average Intel Core i5-11320H, Intel Iris Xe Graphics G7 96EUs (1300 - 1371, n=3) | |
| Beelink SER Pro Ryzen 5 5600H | |
| Trigkey S3 | |
| BMAX B5 Pro G7H8 | |
| CrossMark / Productivity | |
| Beelink SEi12 Core i5-1235U | |
| Intel NUC 12 Pro Kit NUC12WSKi7 | |
| Trigkey Speed S | |
| Average Intel Core i5-11320H, Intel Iris Xe Graphics G7 96EUs (1376 - 1456, n=3) | |
| Beelink SER Pro Ryzen 5 5600H | |
| Trigkey S3 | |
| BMAX B5 Pro G7H8 | |
| CrossMark / Creativity | |
| Intel NUC 12 Pro Kit NUC12WSKi7 | |
| Beelink SEi12 Core i5-1235U | |
| Beelink SER Pro Ryzen 5 5600H | |
| Trigkey Speed S | |
| Average Intel Core i5-11320H, Intel Iris Xe Graphics G7 96EUs (1241 - 1256, n=3) | |
| Trigkey S3 | |
| BMAX B5 Pro G7H8 | |
| CrossMark / Responsiveness | |
| Beelink SEi12 Core i5-1235U | |
| Trigkey Speed S | |
| Intel NUC 12 Pro Kit NUC12WSKi7 | |
| Average Intel Core i5-11320H, Intel Iris Xe Graphics G7 96EUs (1260 - 1494, n=3) | |
| Beelink SER Pro Ryzen 5 5600H | |
| BMAX B5 Pro G7H8 | |
| Trigkey S3 | |
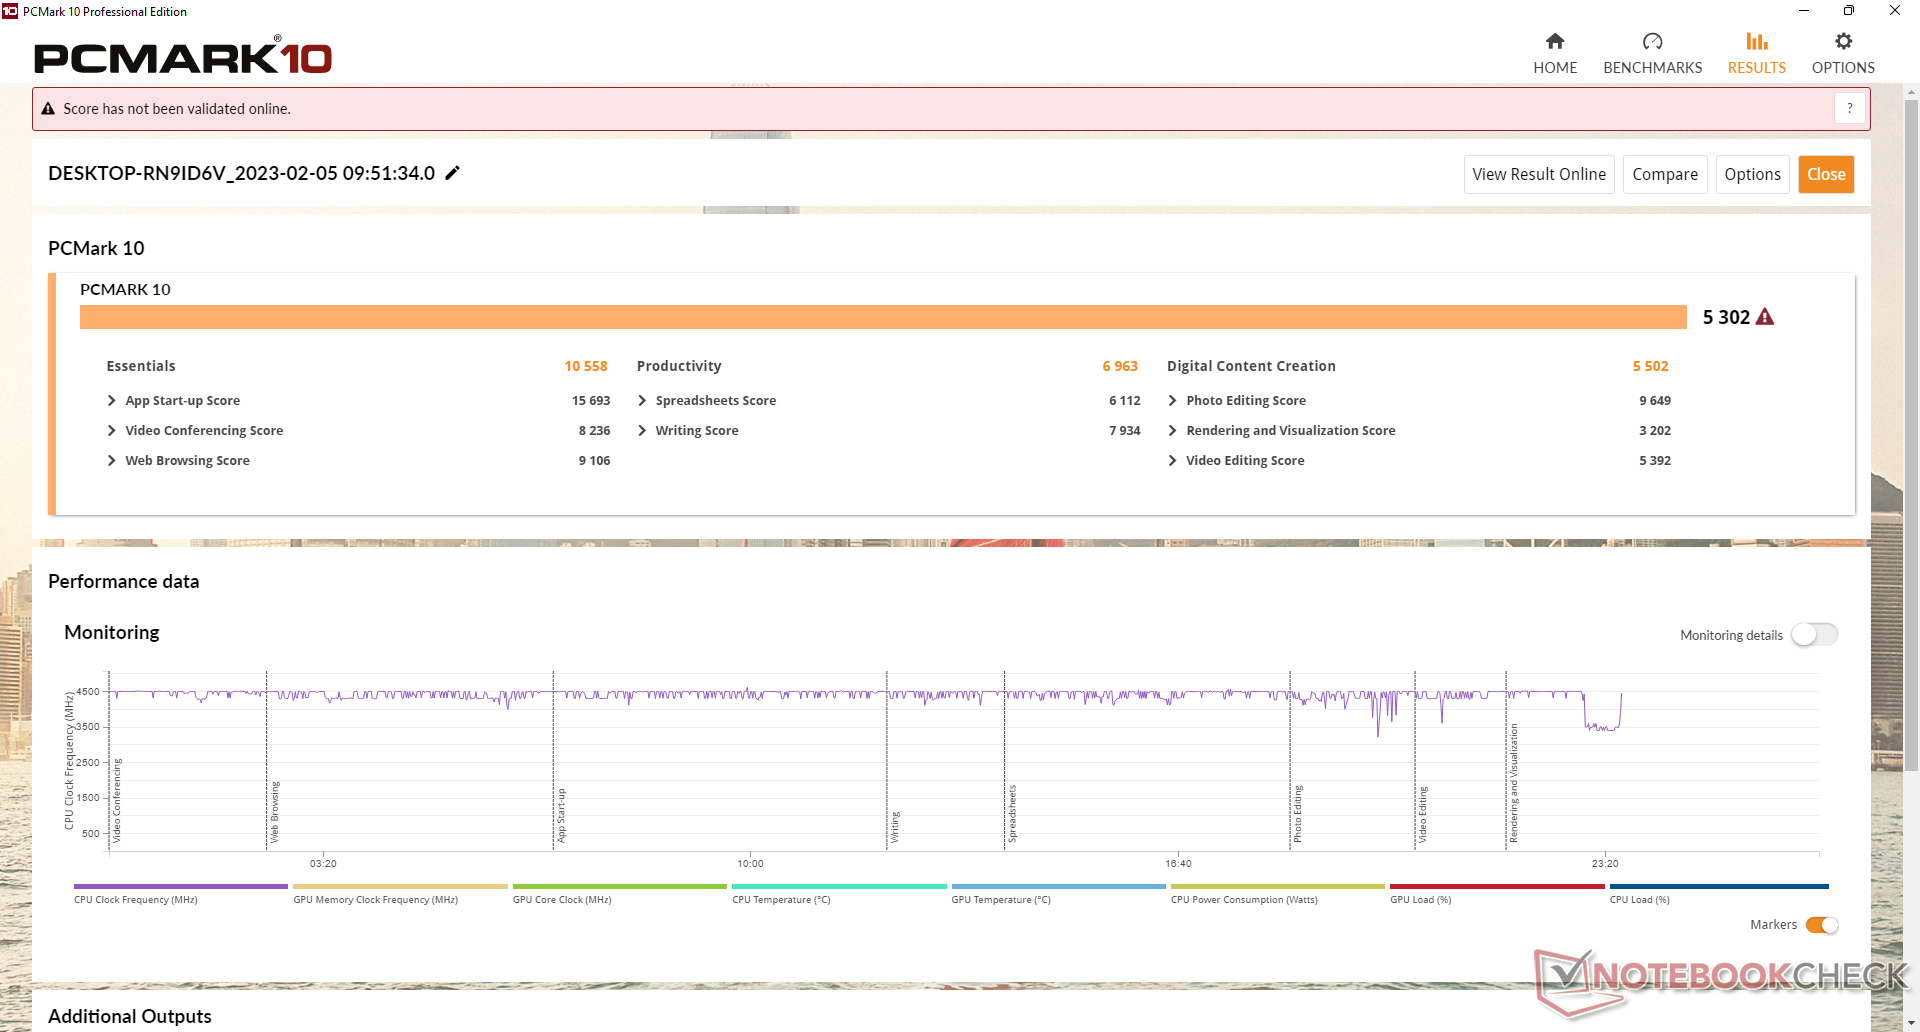
| PCMark 10 Score | 5302 points | |
Help | ||
| AIDA64 / Memory Copy | |
| Average Intel Core i5-11320H (41106 - 55961, n=4) | |
| Intel NUC 12 Pro Kit NUC12WSKi7 | |
| Beelink SEi12 Core i5-1235U | |
| Beelink SER Pro Ryzen 5 5600H | |
| Trigkey Speed S | |
| Trigkey S3 | |
| BMAX B5 Pro G7H8 | |
| AIDA64 / Memory Read | |
| Average Intel Core i5-11320H (46516 - 52799, n=4) | |
| Beelink SER Pro Ryzen 5 5600H | |
| Trigkey Speed S | |
| Intel NUC 12 Pro Kit NUC12WSKi7 | |
| Beelink SEi12 Core i5-1235U | |
| Trigkey S3 | |
| BMAX B5 Pro G7H8 | |
| AIDA64 / Memory Write | |
| Average Intel Core i5-11320H (46760 - 63323, n=4) | |
| Trigkey Speed S | |
| Beelink SEi12 Core i5-1235U | |
| Intel NUC 12 Pro Kit NUC12WSKi7 | |
| Beelink SER Pro Ryzen 5 5600H | |
| Trigkey S3 | |
| BMAX B5 Pro G7H8 | |
| AIDA64 / Memory Latency | |
| Trigkey S3 | |
| BMAX B5 Pro G7H8 | |
| Intel NUC 12 Pro Kit NUC12WSKi7 | |
| Average Intel Core i5-11320H (77.6 - 114.1, n=4) | |
| Beelink SEi12 Core i5-1235U | |
| Beelink SER Pro Ryzen 5 5600H | |
| Trigkey Speed S | |
* ... smaller is better
DPC延时
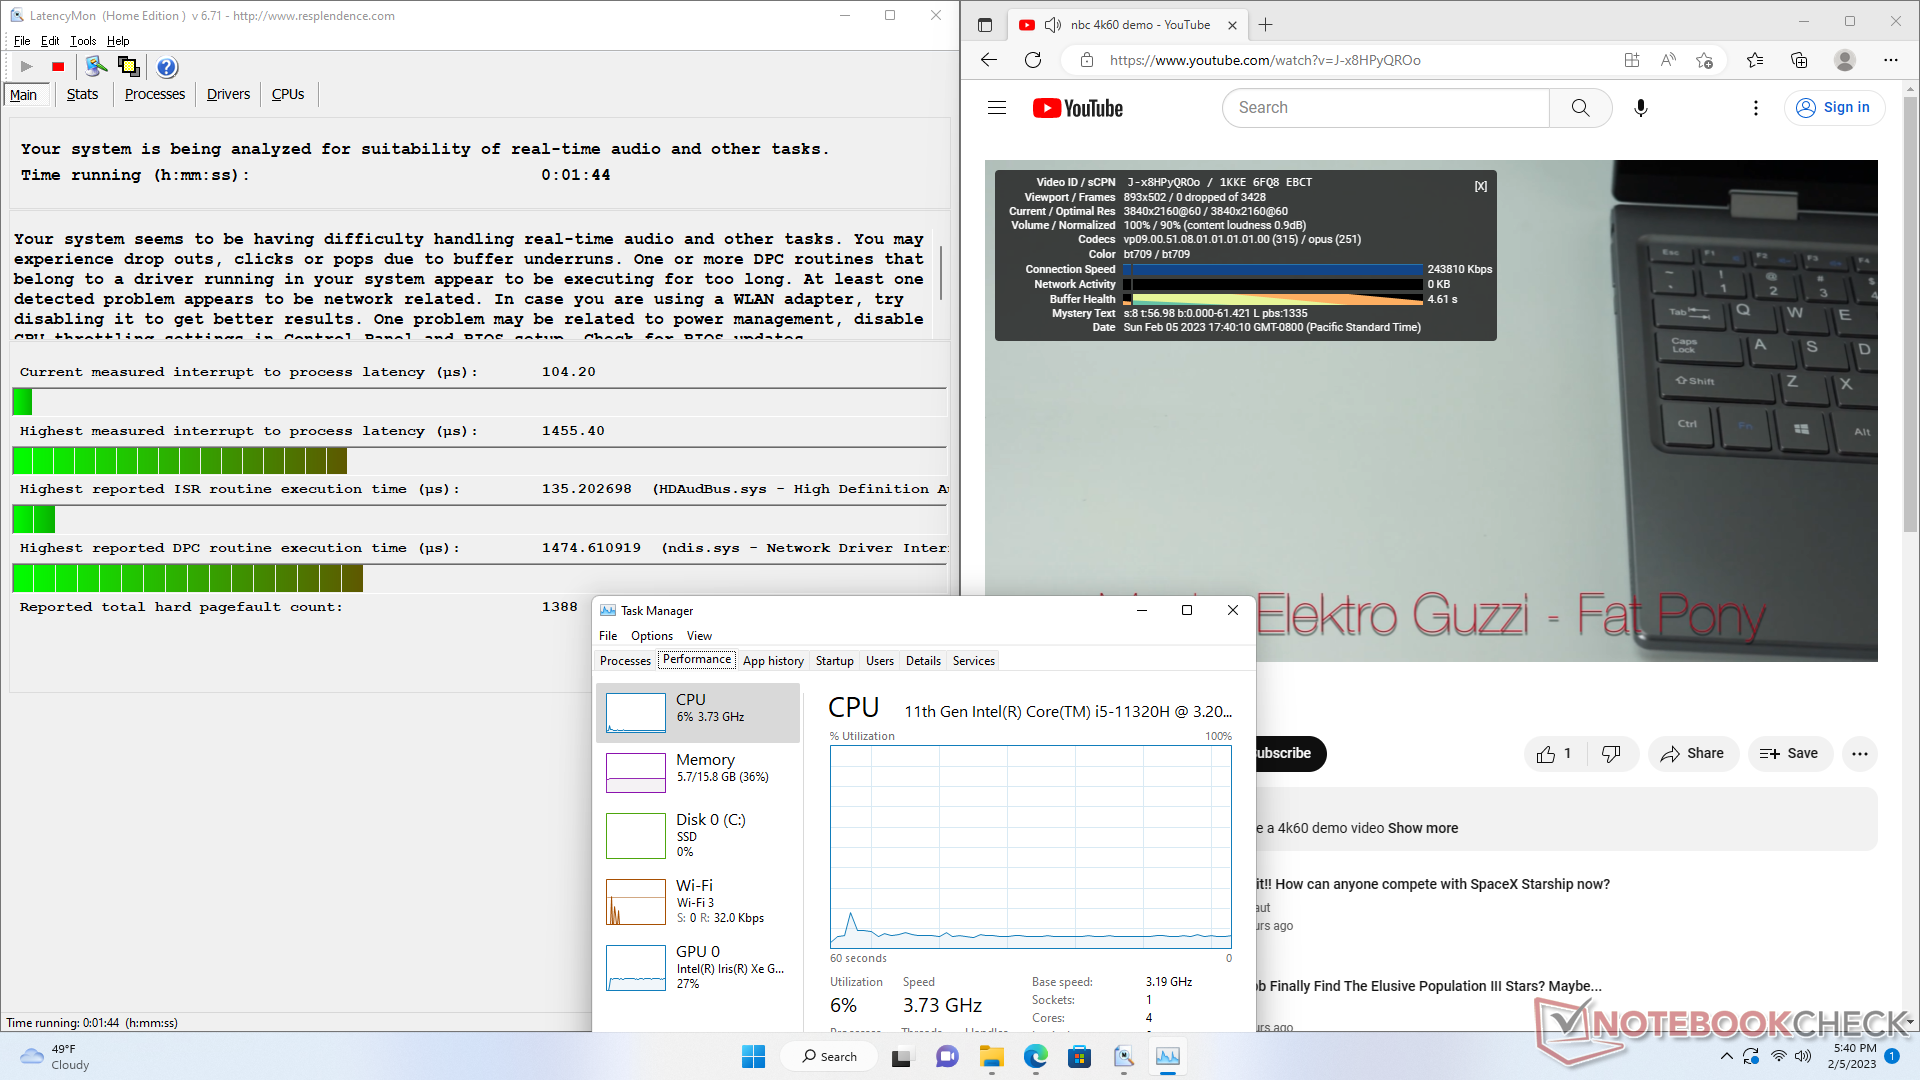
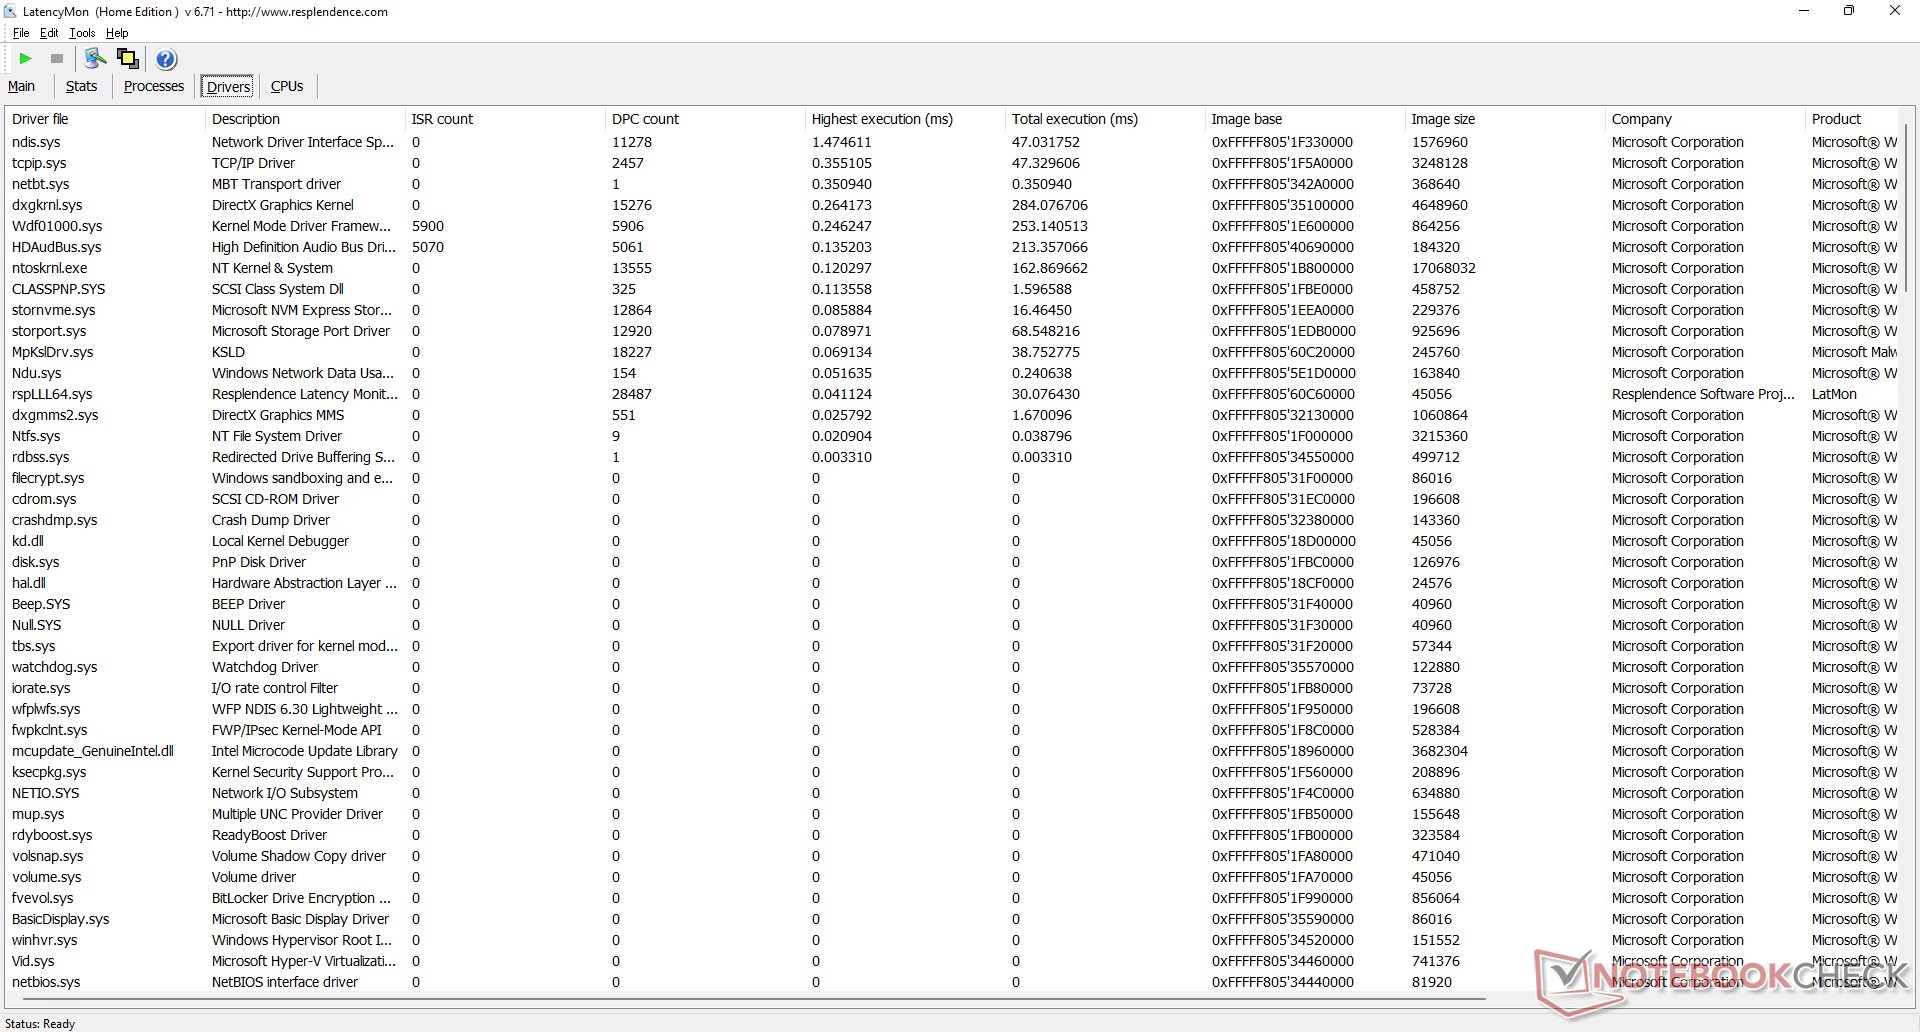
| DPC Latencies / LatencyMon - interrupt to process latency (max), Web, Youtube, Prime95 | |
| Trigkey S3 | |
| Trigkey Speed S | |
| Beelink SEi12 Core i5-1235U | |
| Intel NUC 12 Pro Kit NUC12WSKi7 | |
| Beelink SER Pro Ryzen 5 5600H | |
| BMAX B5 Pro G7H8 | |
* ... smaller is better
存储设备
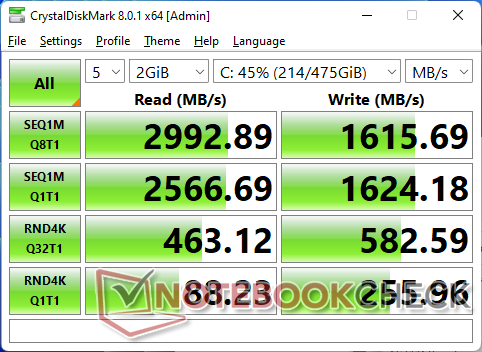
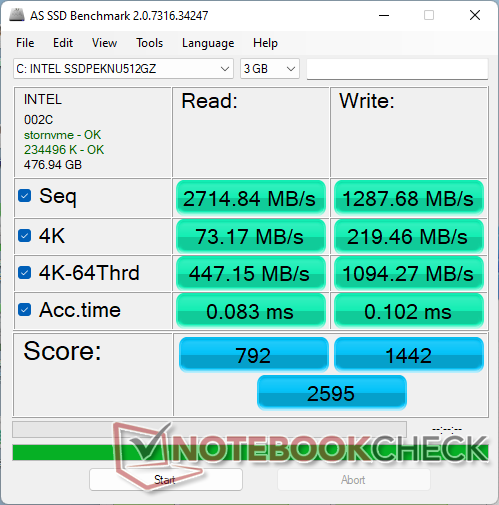

| Drive Performance rating - Percent | |
| Beelink SEi12 Core i5-1235U | |
| Trigkey Speed S | |
| BMAX B5 Pro G7H8 | |
| Average Intel SSD 670p SSDPEKNU512GZ | |
| Beelink SER Pro Ryzen 5 5600H -11! | |
| Trigkey S3 | |
| Intel NUC 12 Pro Kit NUC12WSKi7 | |
* ... smaller is better
Disk Throttling: DiskSpd Read Loop, Queue Depth 8
GPU性能
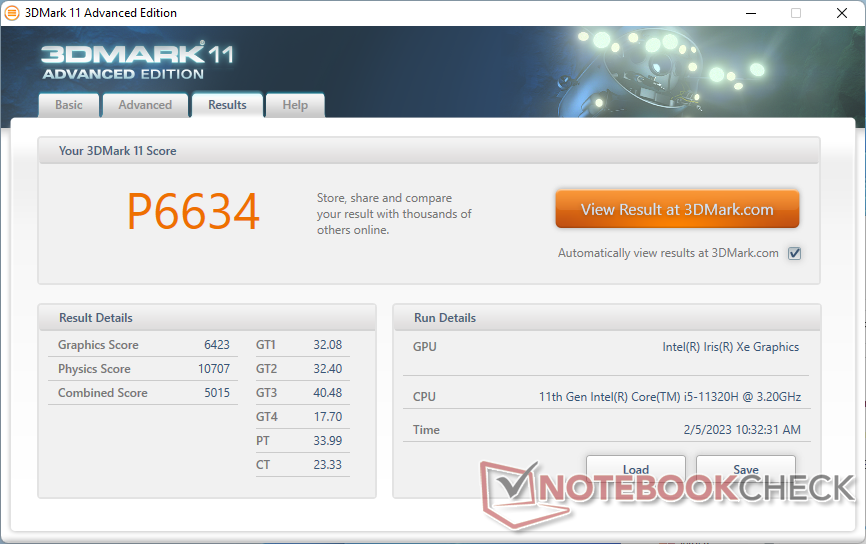
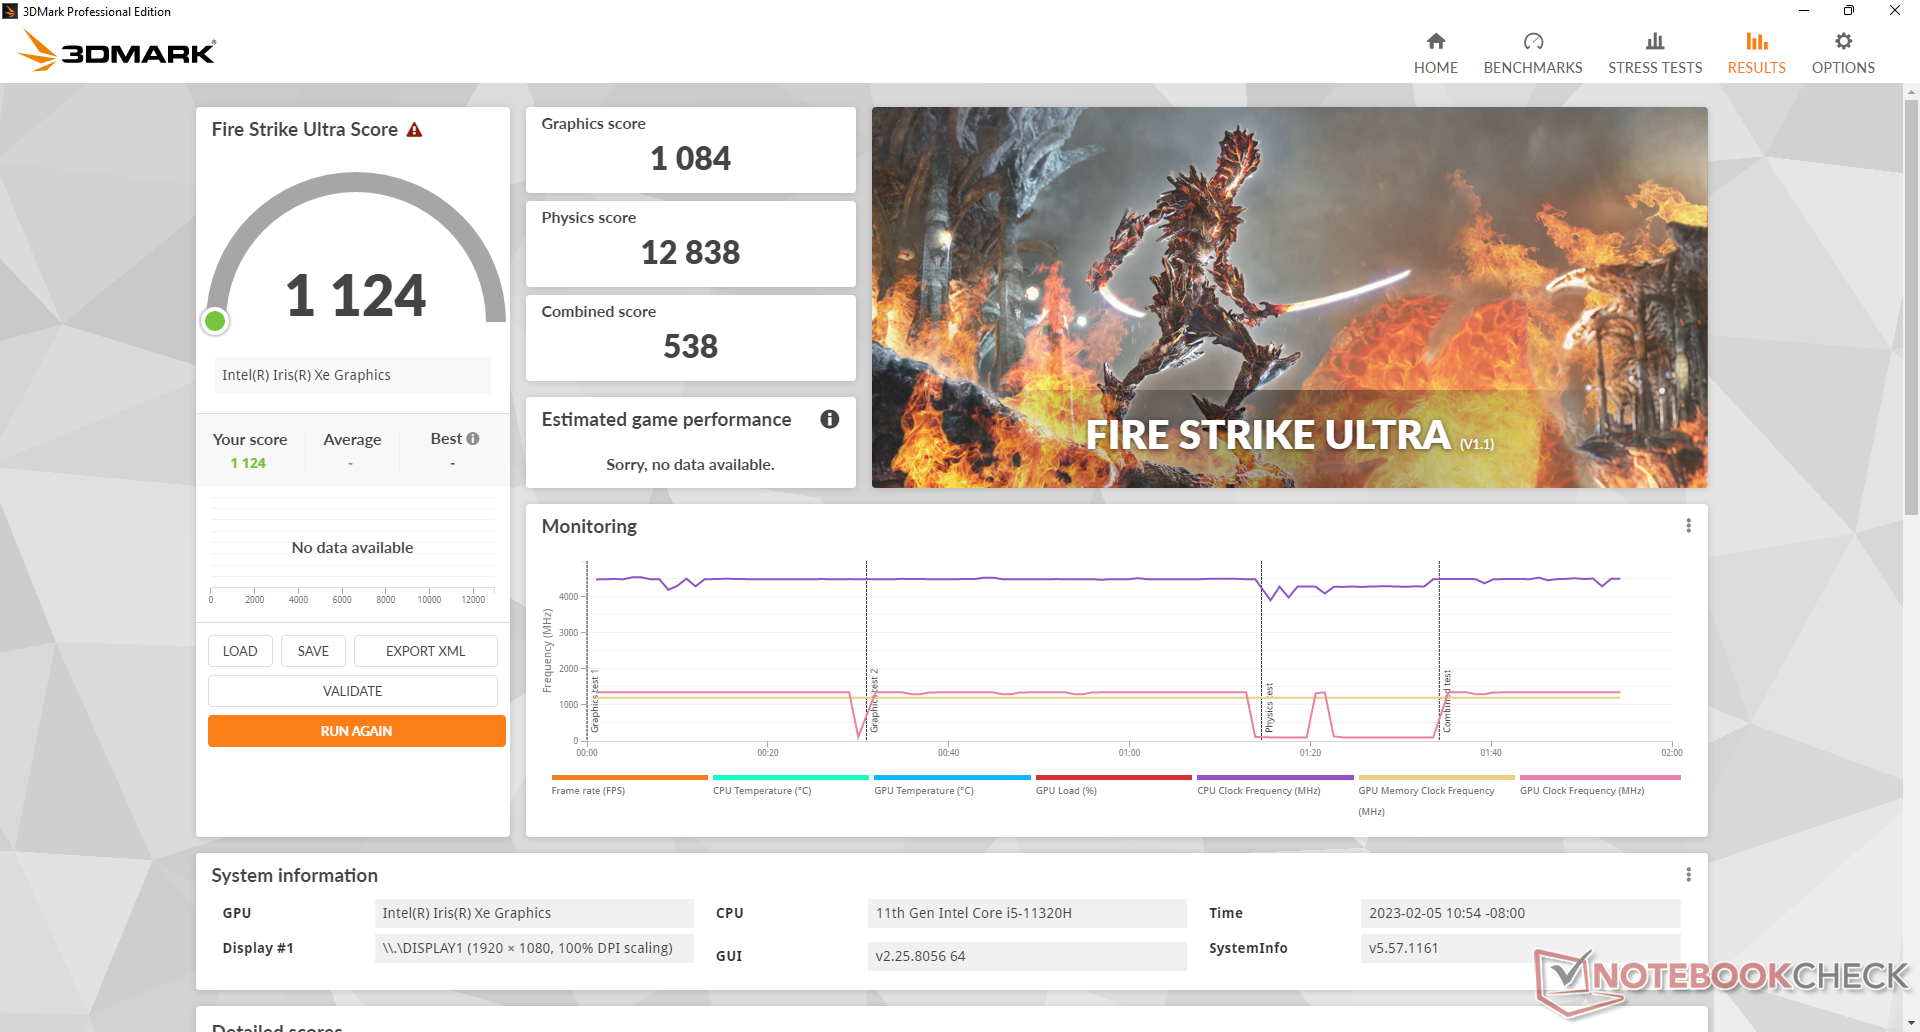
| 3DMark 11 Performance | 6634 points | |
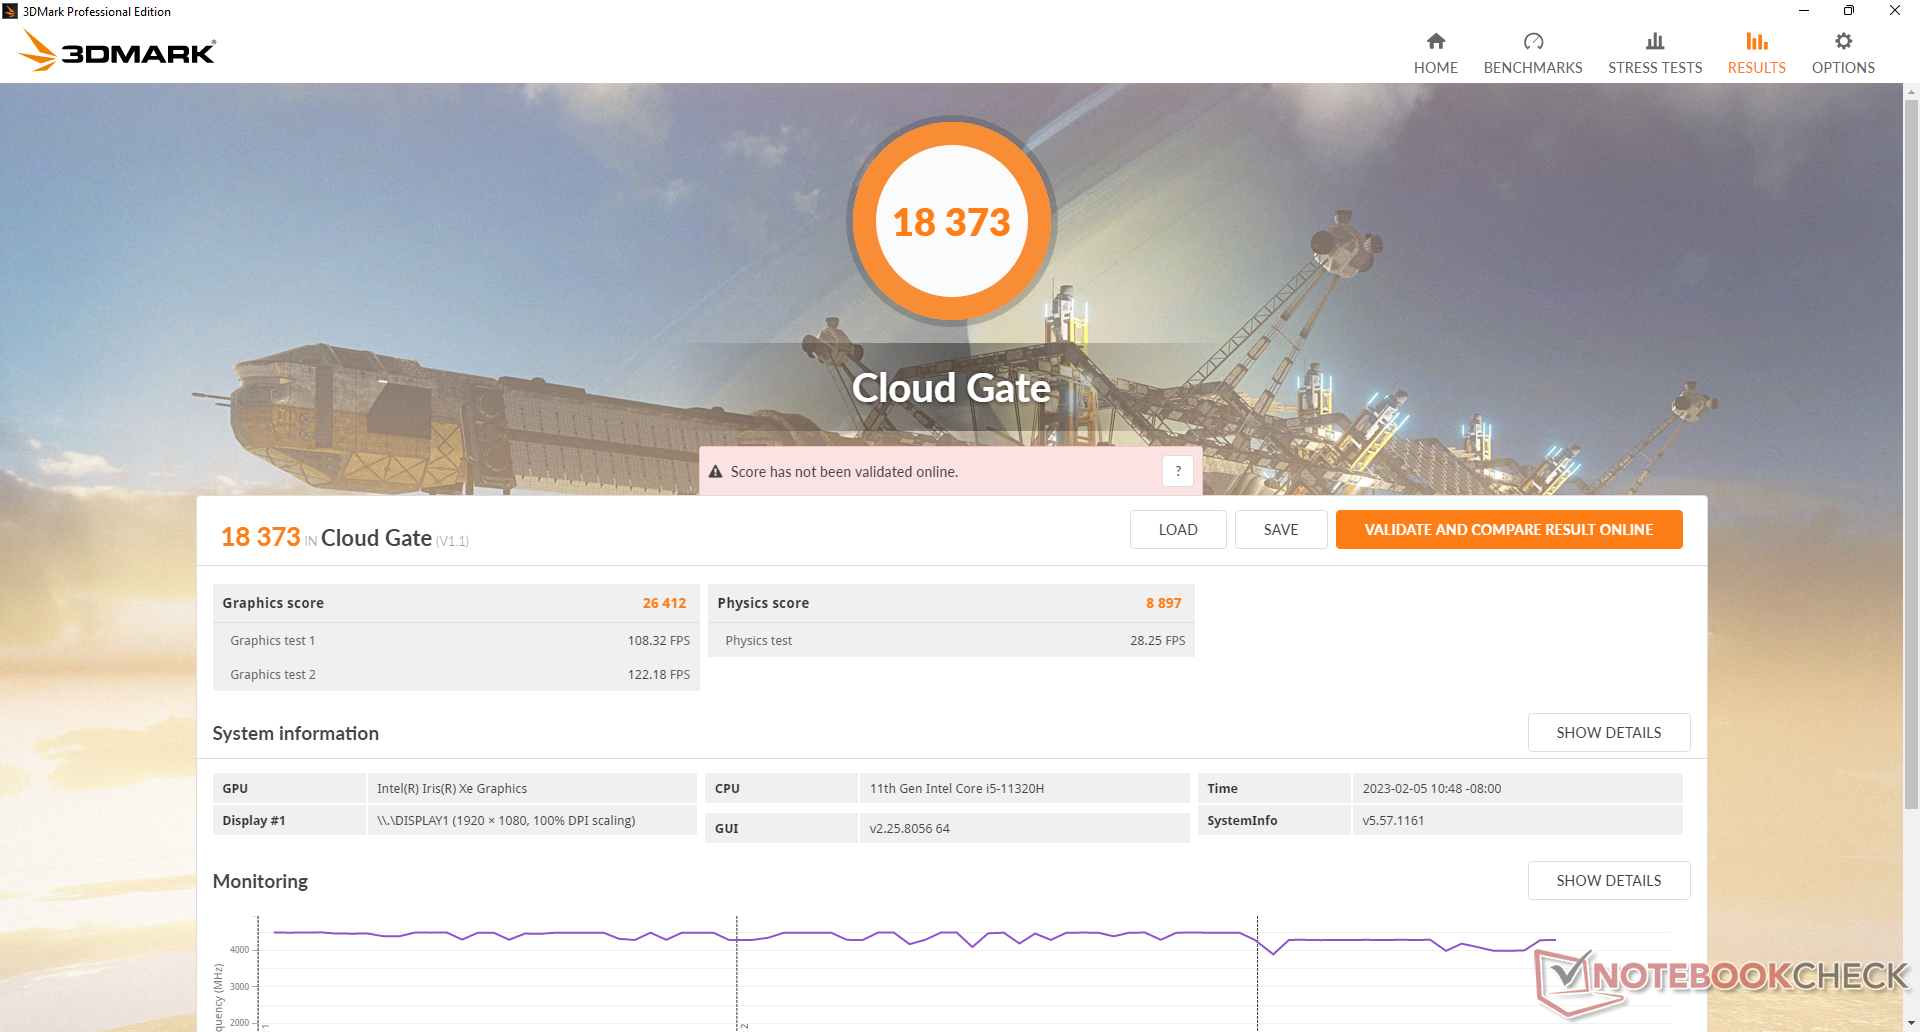
| 3DMark Cloud Gate Standard Score | 18373 points | |
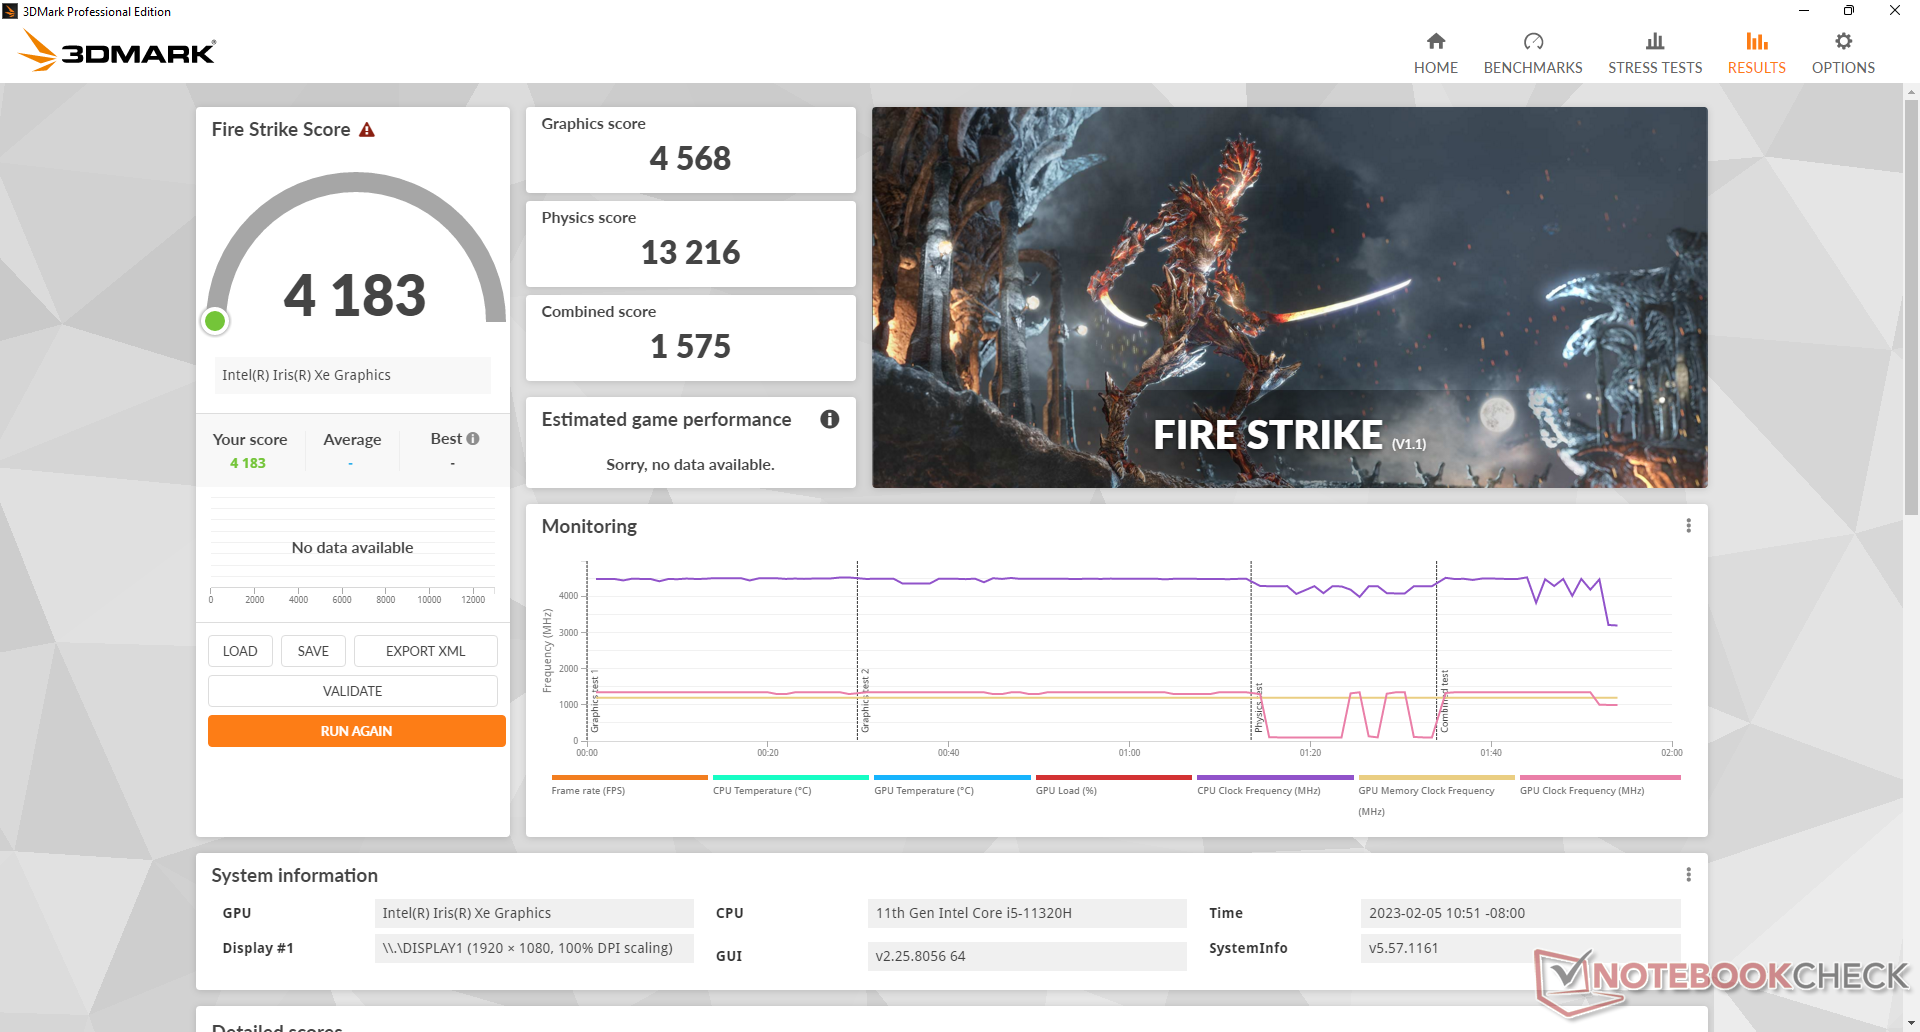
| 3DMark Fire Strike Score | 4183 points | |
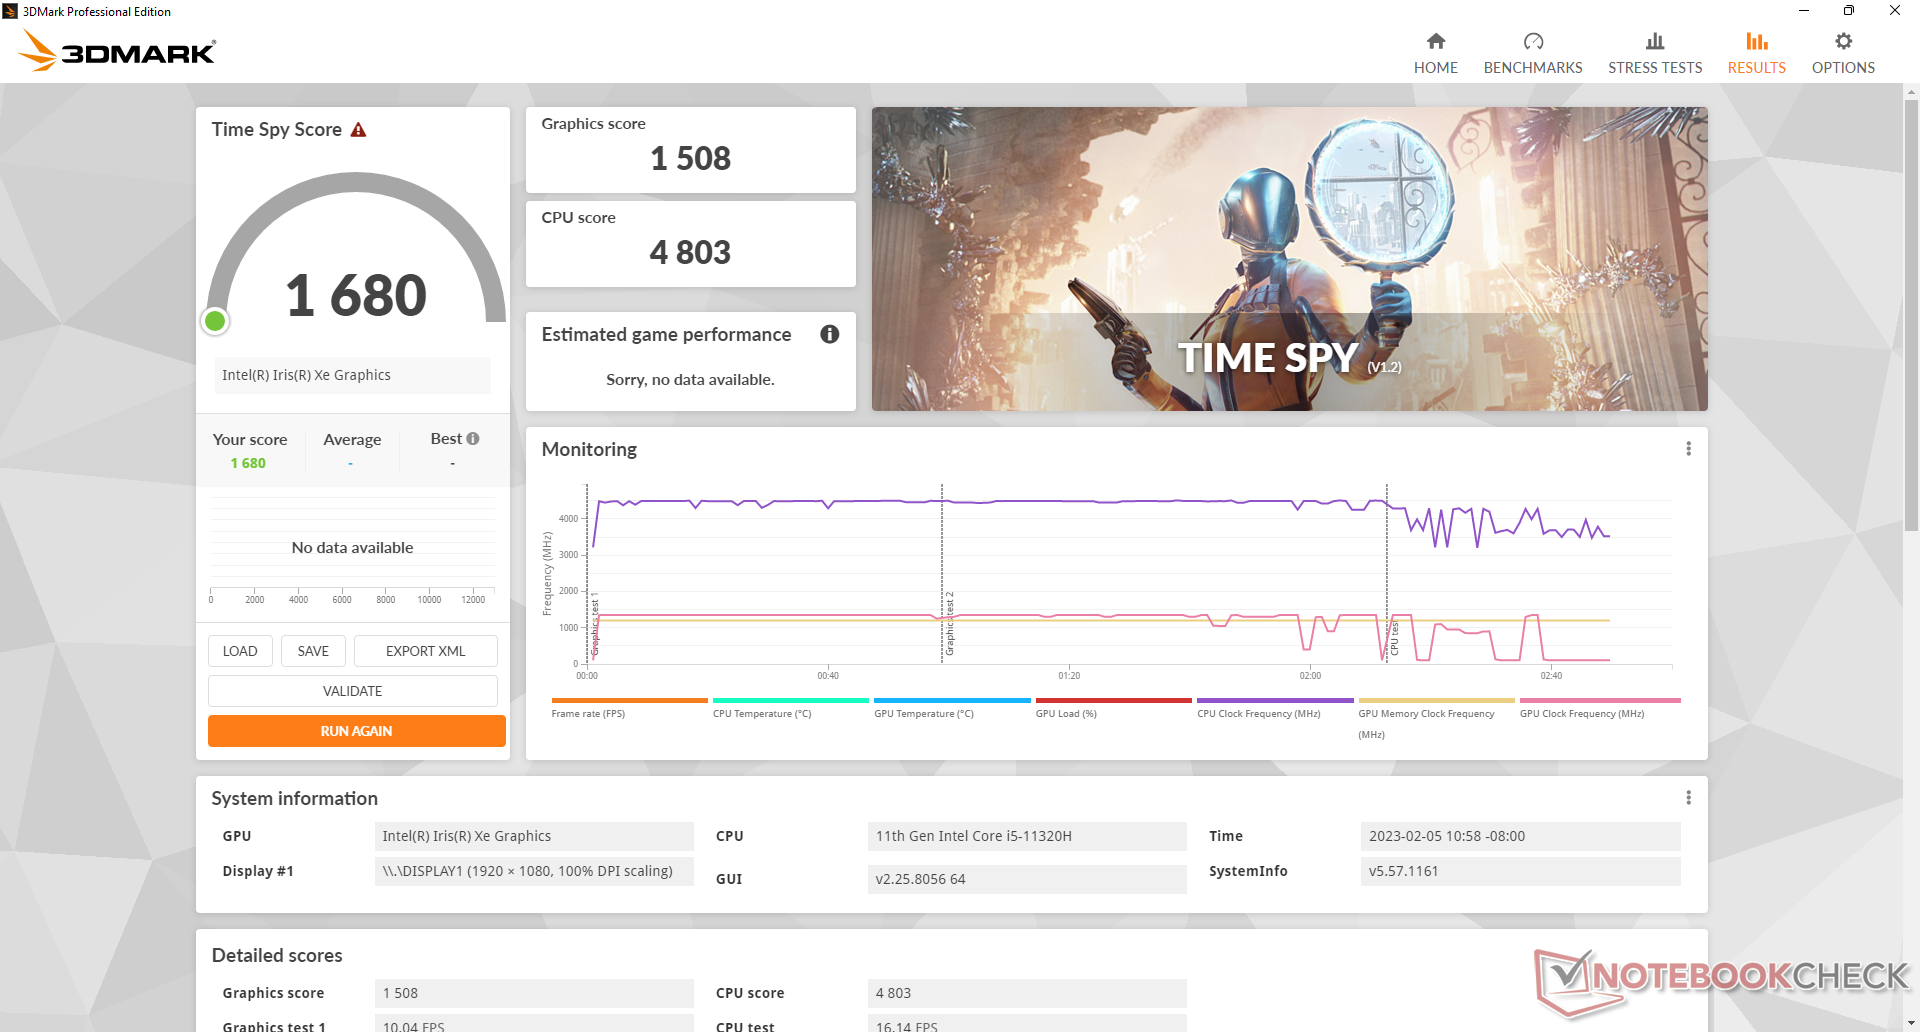
| 3DMark Time Spy Score | 1680 points | |
Help | ||
| The Witcher 3 | |
| 1024x768 Low Graphics & Postprocessing | |
| Intel NUC 12 Pro Kit NUC12WSKi7 | |
| Trigkey Speed S | |
| Average Intel Iris Xe Graphics G7 96EUs (28.9 - 117.2, n=188) | |
| Beelink SER Pro Ryzen 5 5600H | |
| Beelink SEi12 Core i5-1235U | |
| Trigkey S3 | |
| BMAX B5 Pro G7H8 | |
| 1366x768 Medium Graphics & Postprocessing | |
| Average Intel Iris Xe Graphics G7 96EUs (21.4 - 77.8, n=185) | |
| Trigkey Speed S | |
| Beelink SER Pro Ryzen 5 5600H | |
| Beelink SEi12 Core i5-1235U | |
| Trigkey S3 | |
| BMAX B5 Pro G7H8 | |
| 1920x1080 High Graphics & Postprocessing (Nvidia HairWorks Off) | |
| Average Intel Iris Xe Graphics G7 96EUs (10.6 - 45.9, n=191) | |
| Beelink SEi12 Core i5-1235U | |
| Beelink SER Pro Ryzen 5 5600H | |
| Trigkey Speed S | |
| Trigkey S3 | |
| Intel NUC 12 Pro Kit NUC12WSKi7 | |
| BMAX B5 Pro G7H8 | |
| 1920x1080 Ultra Graphics & Postprocessing (HBAO+) | |
| Beelink SER Pro Ryzen 5 5600H | |
| Average Intel Iris Xe Graphics G7 96EUs (8.79 - 20.1, n=181) | |
| Trigkey Speed S | |
| Beelink SEi12 Core i5-1235U | |
| Trigkey S3 | |
| Cyberpunk 2077 1.6 - 1920x1080 Low Preset | |
| Beelink SER Pro Ryzen 5 5600H | |
| Average Intel Iris Xe Graphics G7 96EUs (13 - 25.9, n=42) | |
| Beelink SEi12 Core i5-1235U | |
| Trigkey S3 | |
Witcher 3 FPS Chart
| low | med. | high | ultra | |
|---|---|---|---|---|
| GTA V (2015) | 92.2 | 80.3 | 23.4 | 9.04 |
| The Witcher 3 (2015) | 87.8 | 53.5 | 23.5 | 13.1 |
| Dota 2 Reborn (2015) | 121 | 79.4 | 50.6 | 52.3 |
| Final Fantasy XV Benchmark (2018) | 39.8 | 21.3 | 15.4 | |
| X-Plane 11.11 (2018) | 51.1 | 43.7 | 38.7 | |
| Strange Brigade (2018) | 80.1 | 34.5 | 28.5 | 22.9 |
排放
系统噪音
虽然内部风扇本身在流媒体内容时大多听不到,但我们的具体设备有时会表现出明显的电子噪音或线圈啸叫,频率约为10 kHz,如下图所示。当CPU受到严重压力时,例如在游戏过程中,这种啸叫最经常发生。不幸的是,即使经过几个小时的游戏,该啸声也不会消失。这种行为表明,组装该模型时使用了廉价零件。
希望这个问题只针对我们的评测单元,而不是任何零售单元的指示。
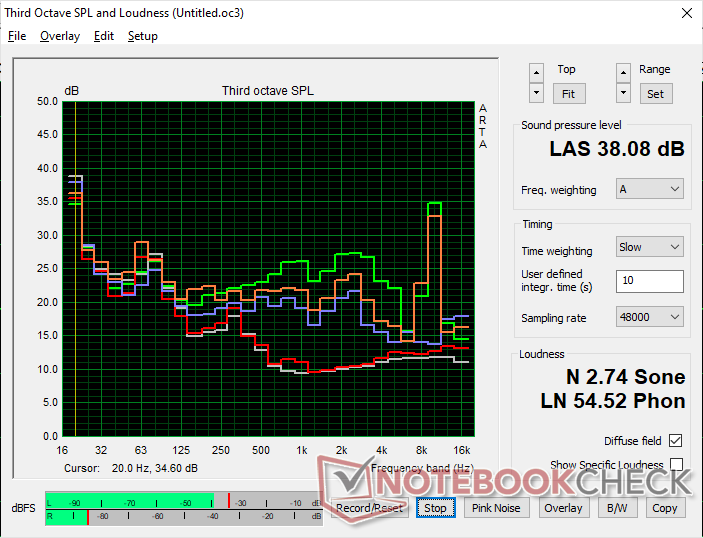
Noise level
| Idle |
| 24.1 / 24.1 / 26.6 dB(A) |
| Load |
| 30.4 / 38.1 dB(A) |
 | ||
30 dB silent 40 dB(A) audible 50 dB(A) loud |
||
min: | ||
| Trigkey Speed S Iris Xe G7 96EUs, i5-11320H, Intel SSD 670p SSDPEKNU512GZ | Trigkey S3 Vega 8, R5 3550H, Kingston NV1 SNVS/500GCN | Beelink SEi12 Core i5-1235U Iris Xe G7 80EUs, i5-1235U, Kingston NV1 SNVS/500GCN | Beelink SER Pro Ryzen 5 5600H Vega 7, R5 5600H, Kingston NV1 SNVS/500GCN | Intel NUC 12 Pro Kit NUC12WSKi7 Iris Xe G7 96EUs, i7-1260P, Transcend M.2 SSD 2200S TS512GMTE220S | BMAX B5 Pro G7H8 UHD Graphics 620, i5-8260U | |
|---|---|---|---|---|---|---|
| Noise | 5% | -8% | -4% | -28% | 3% | |
| off / environment * (dB) | 23.5 | 23.2 1% | 23.3 1% | 22.8 3% | 30.4 -29% | 23 2% |
| Idle Minimum * (dB) | 24.1 | 24.5 -2% | 27.8 -15% | 26.1 -8% | 33.1 -37% | 25.1 -4% |
| Idle Average * (dB) | 24.1 | 24.5 -2% | 27.8 -15% | 26.1 -8% | 33.1 -37% | 25.1 -4% |
| Idle Maximum * (dB) | 26.6 | 24.5 8% | 27.8 -5% | 28.7 -8% | 33.1 -24% | 25.1 6% |
| Load Average * (dB) | 30.4 | 27.1 11% | 32 -5% | 32.3 -6% | 38.1 -25% | 28.6 6% |
| Witcher 3 ultra * (dB) | 30.4 | 30.6 -1% | 34.1 -12% | 32.8 -8% | 30.1 1% | |
| Load Maximum * (dB) | 38.1 | 31.3 18% | 39.2 -3% | 36.4 4% | 43.6 -14% | 34 11% |
* ... smaller is better
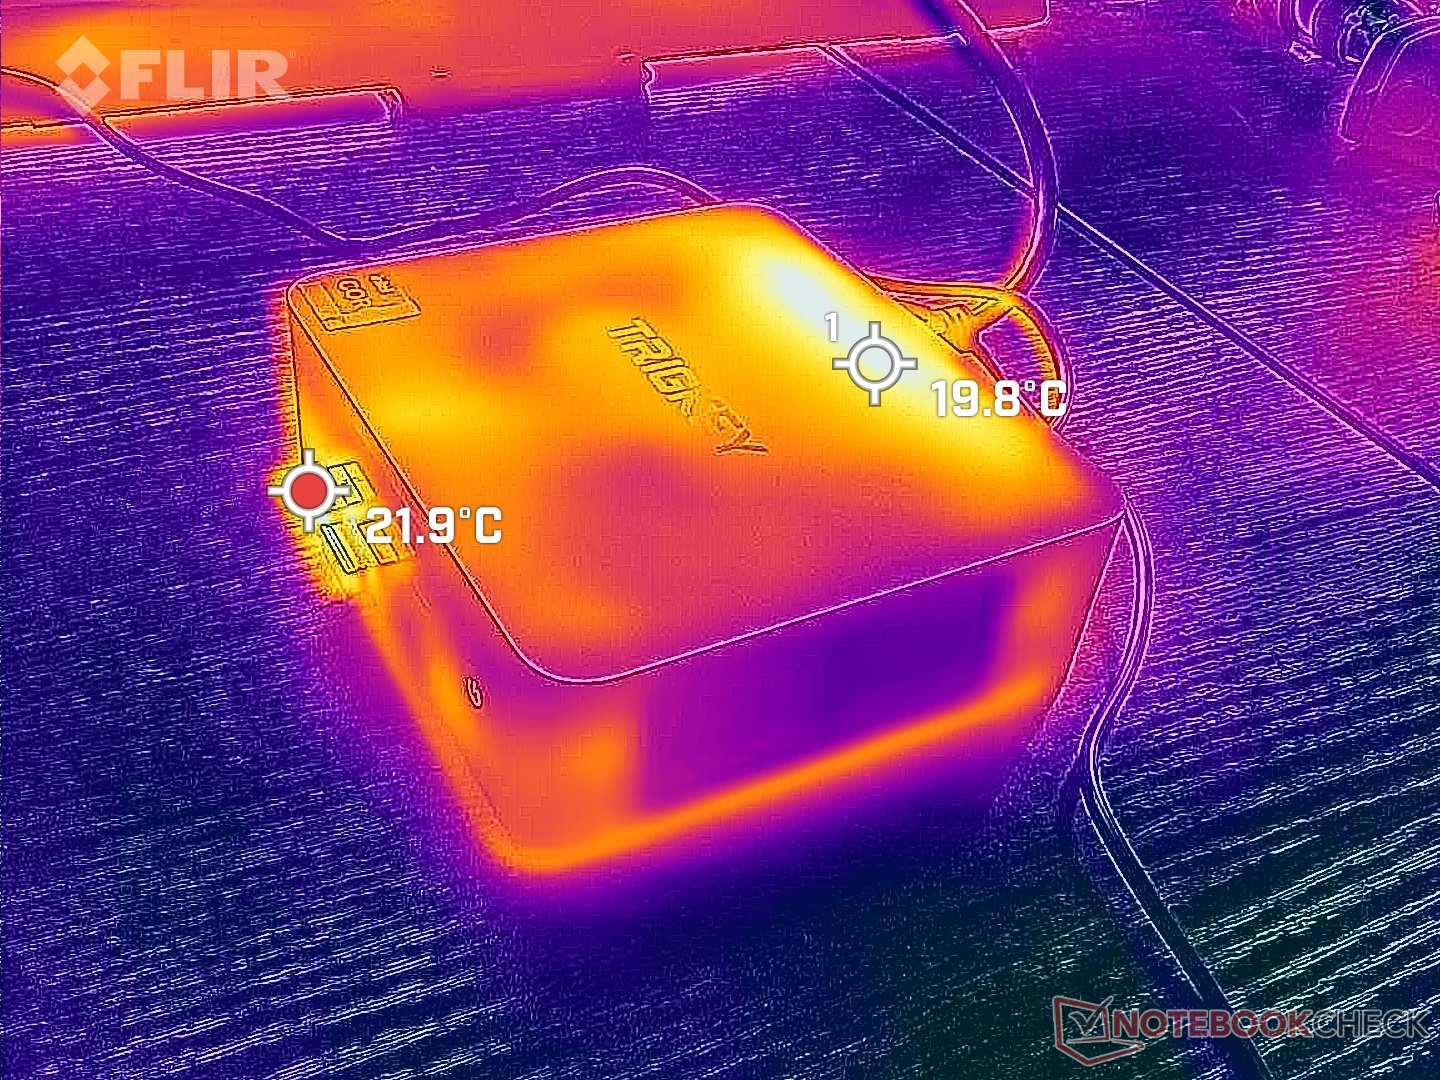
温度
沿着热空气流出的后部,表面温度最热。冷空气从底盘的两侧进入。
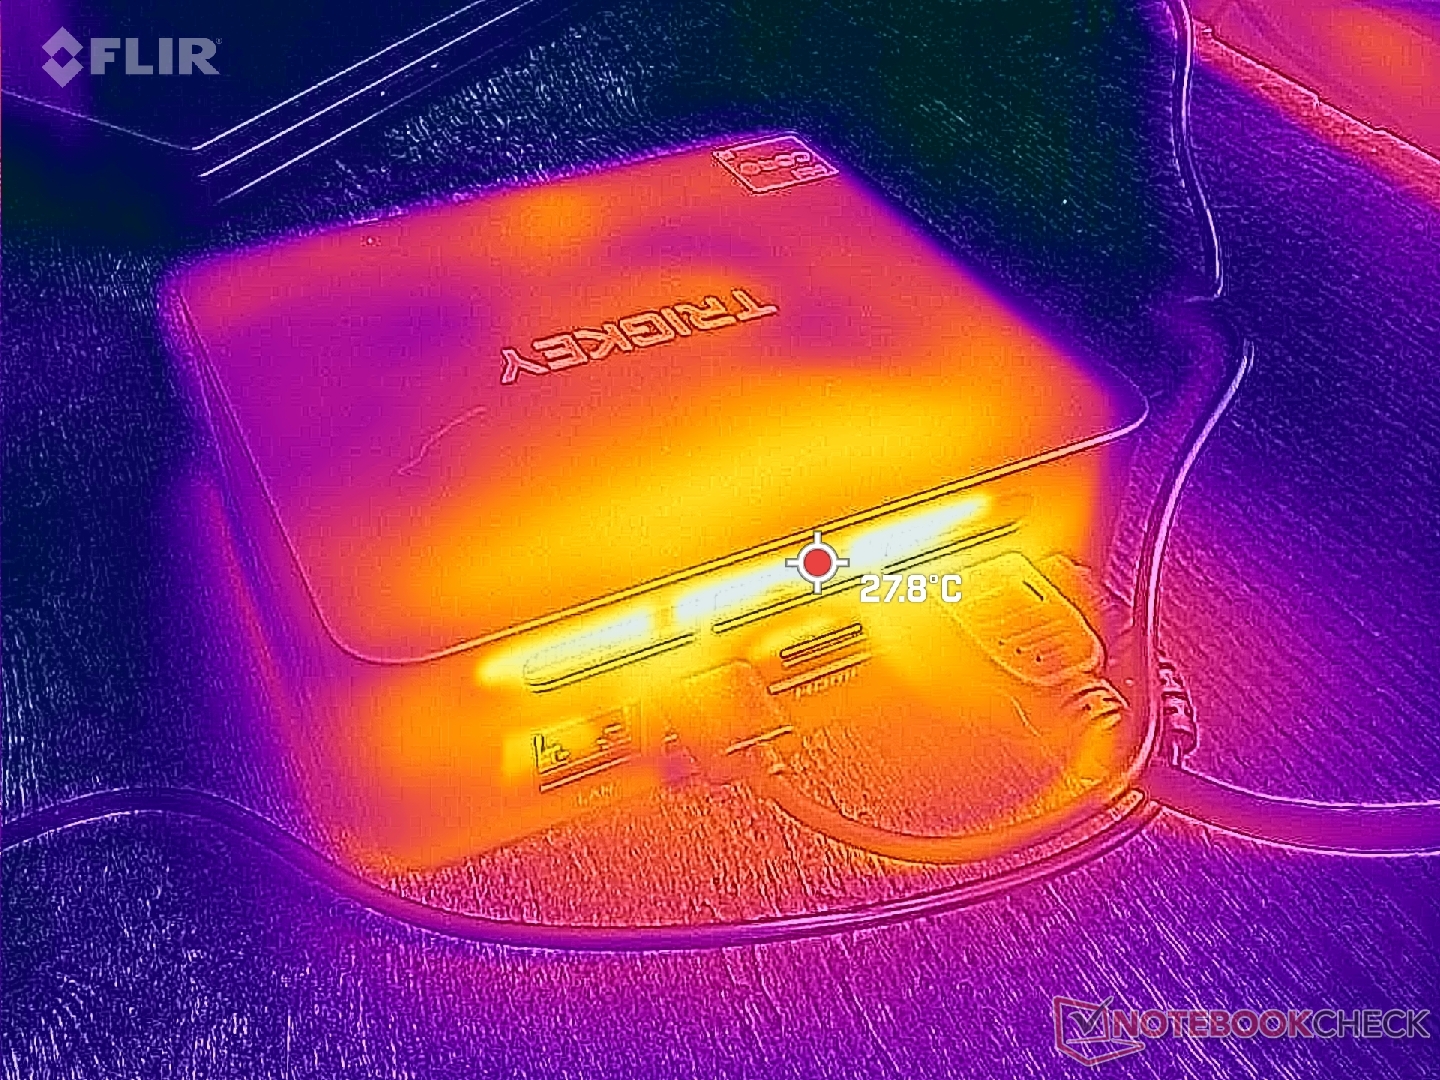
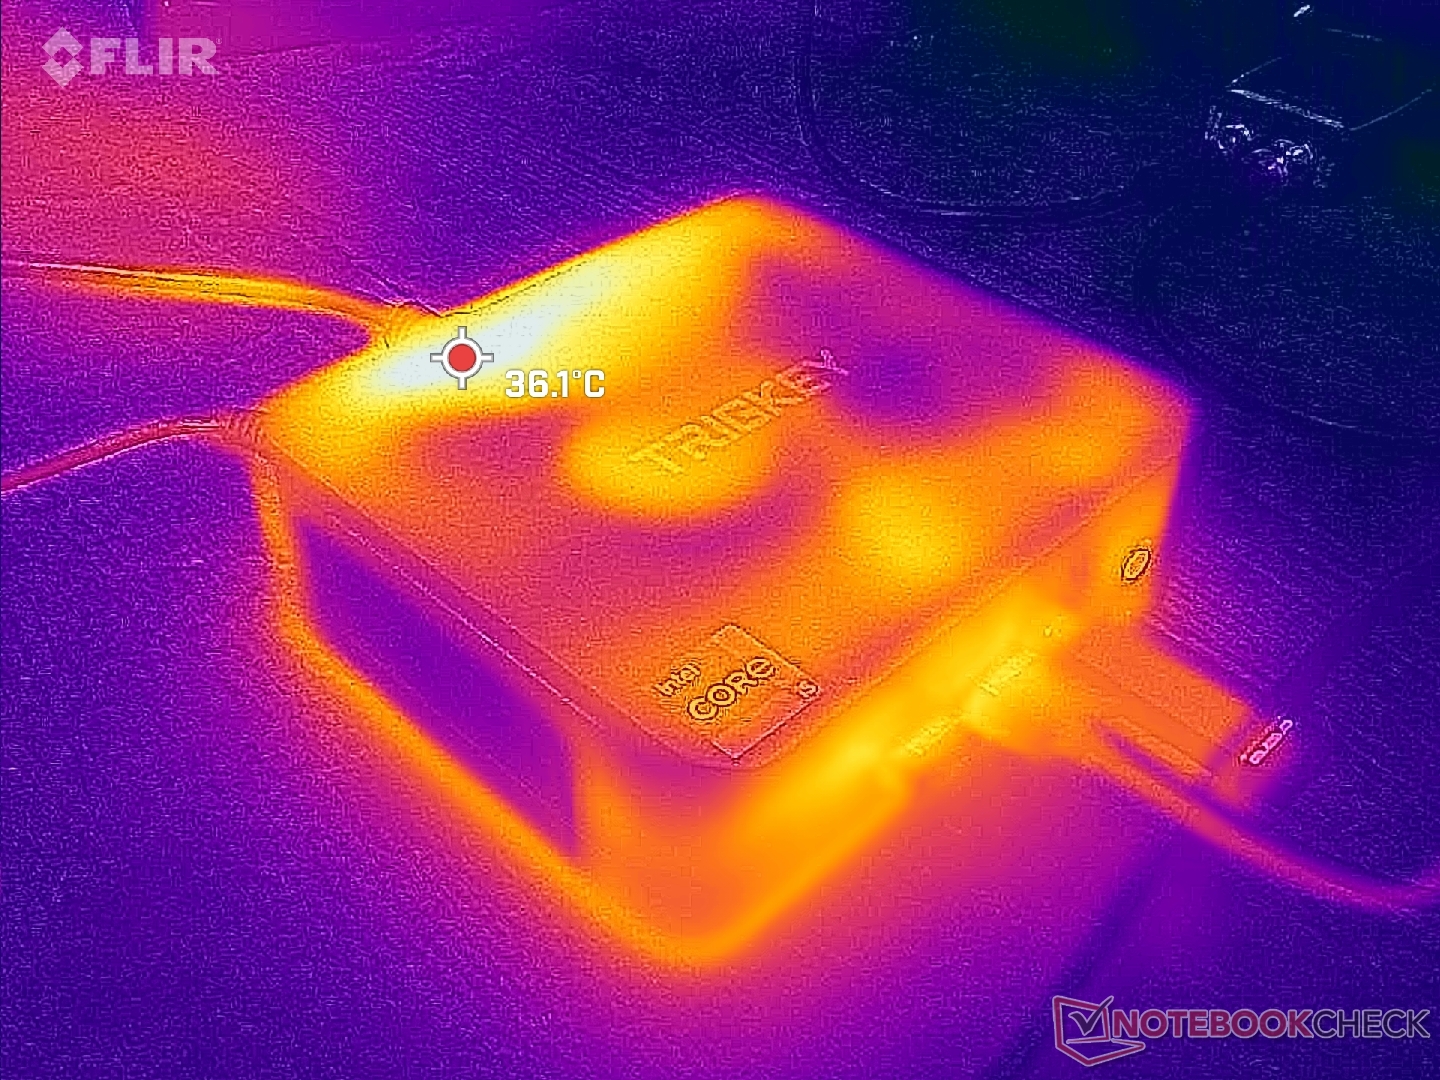
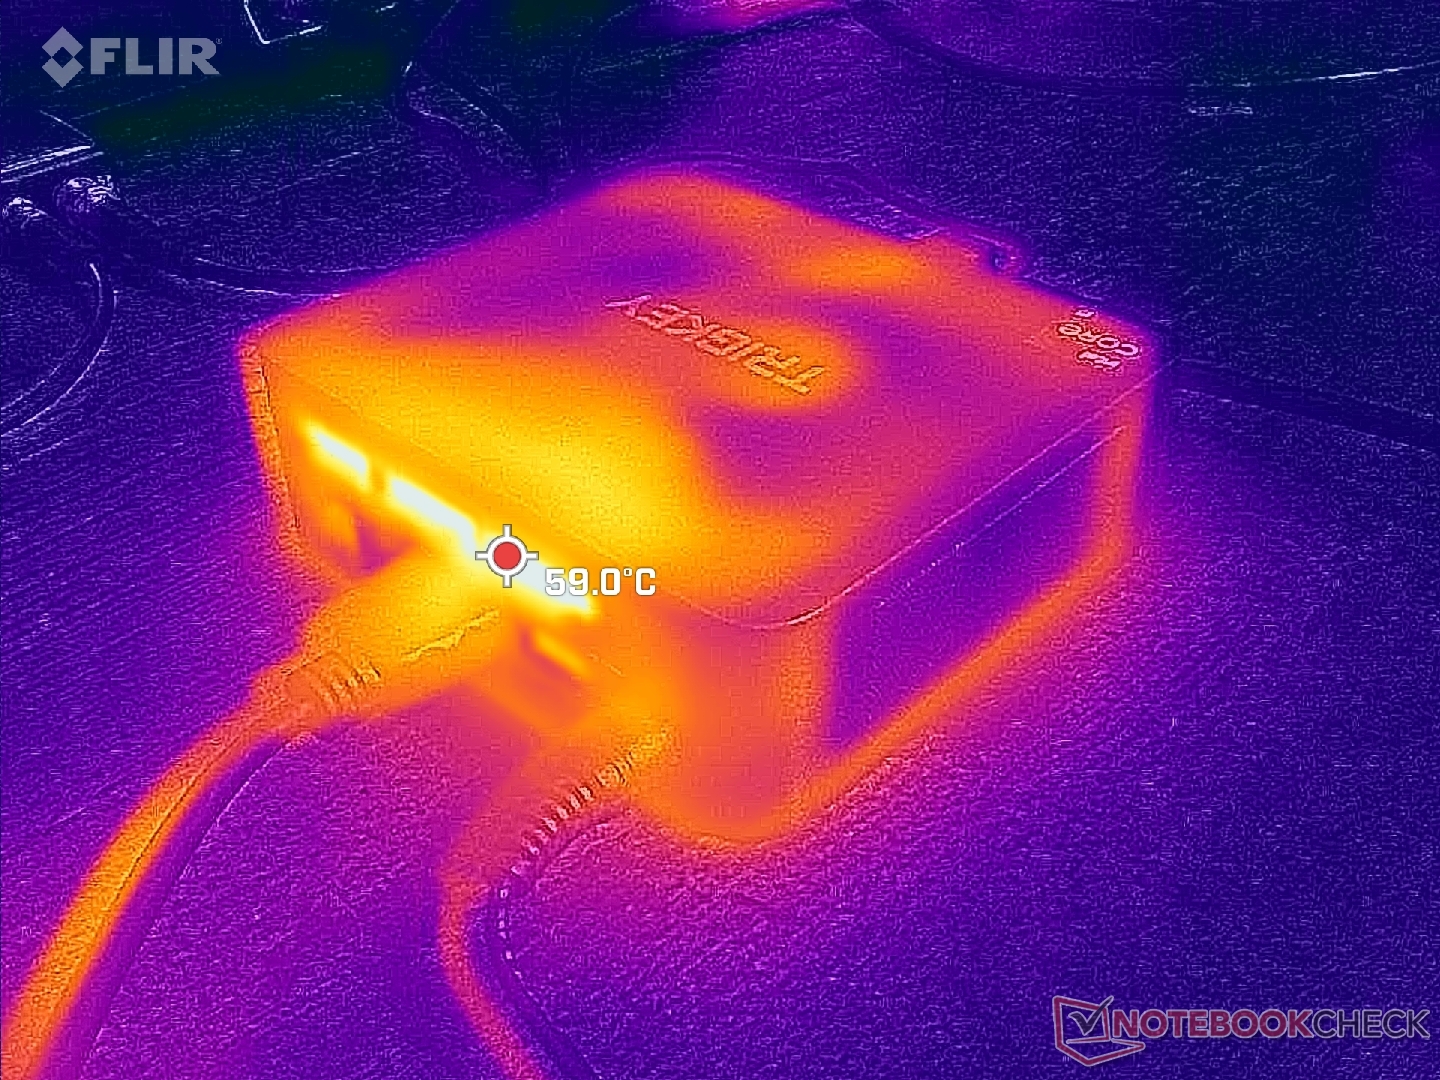
压力测试
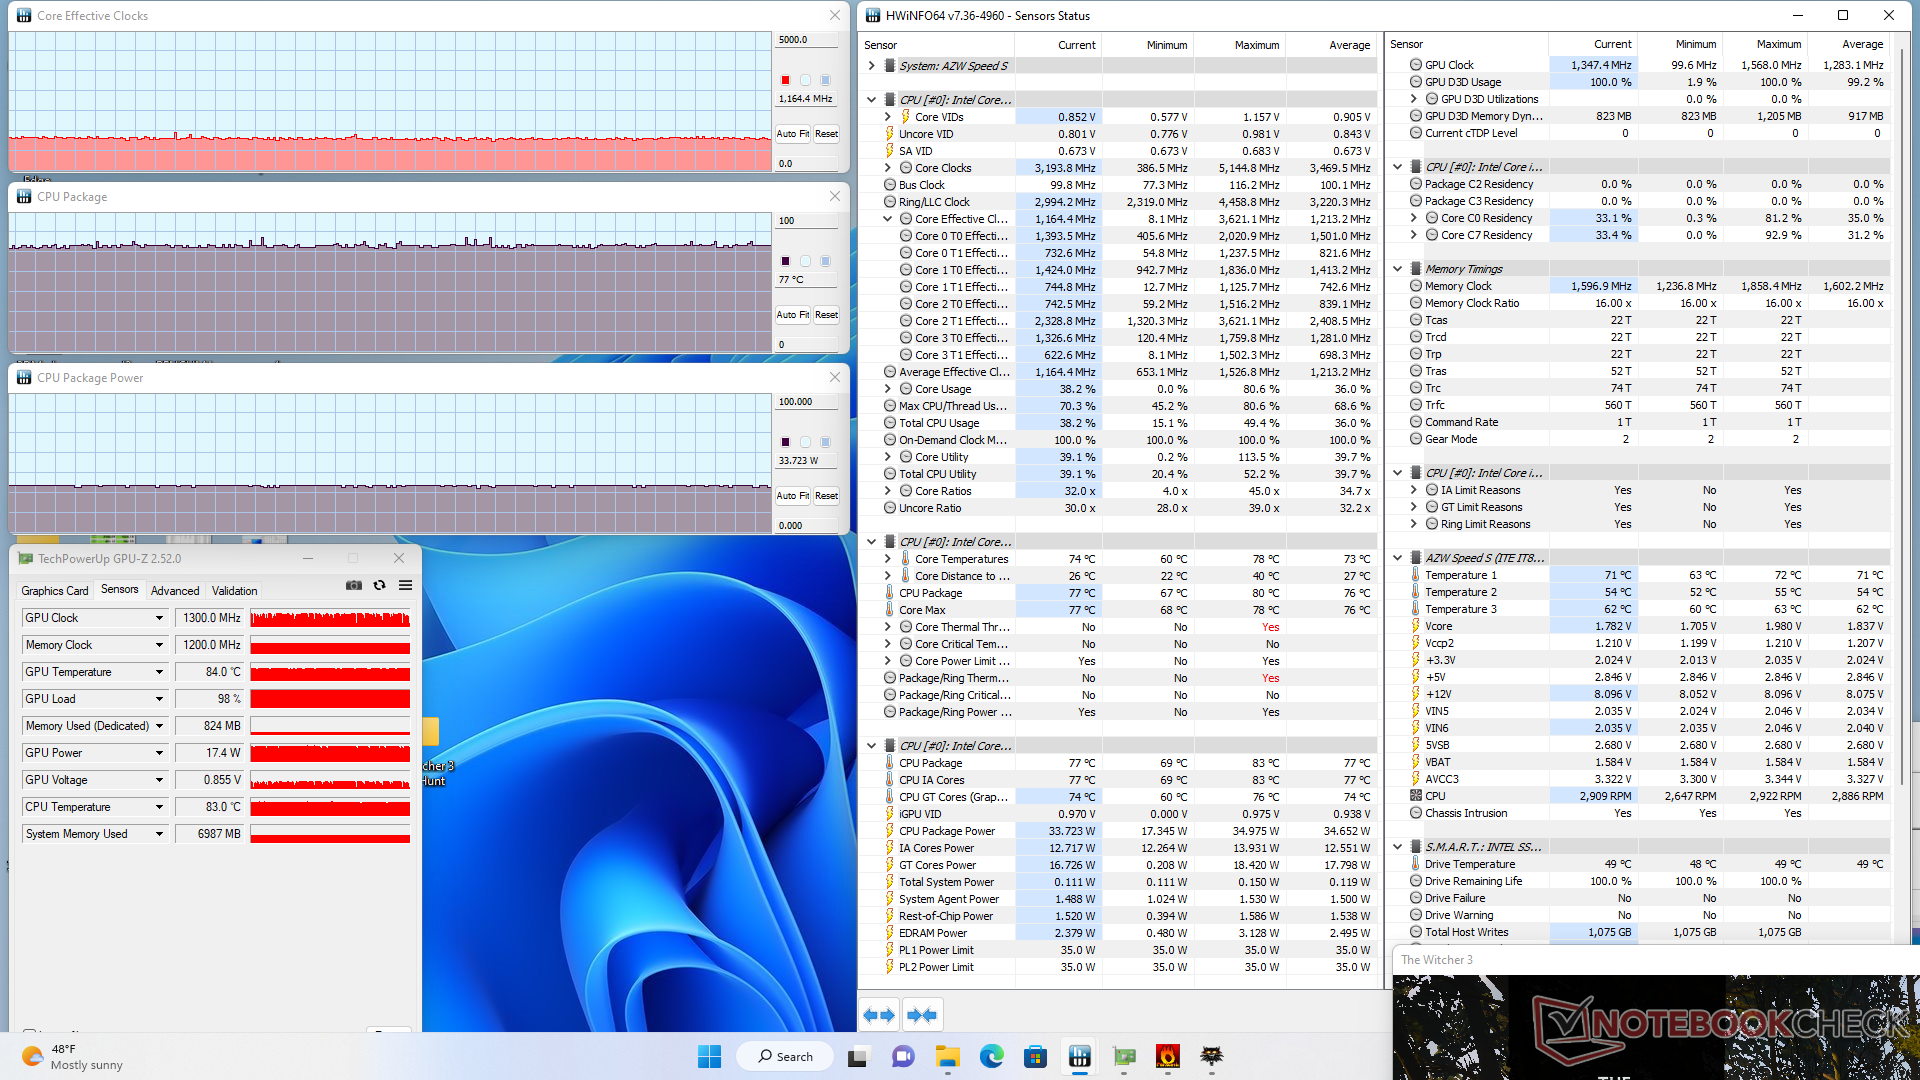
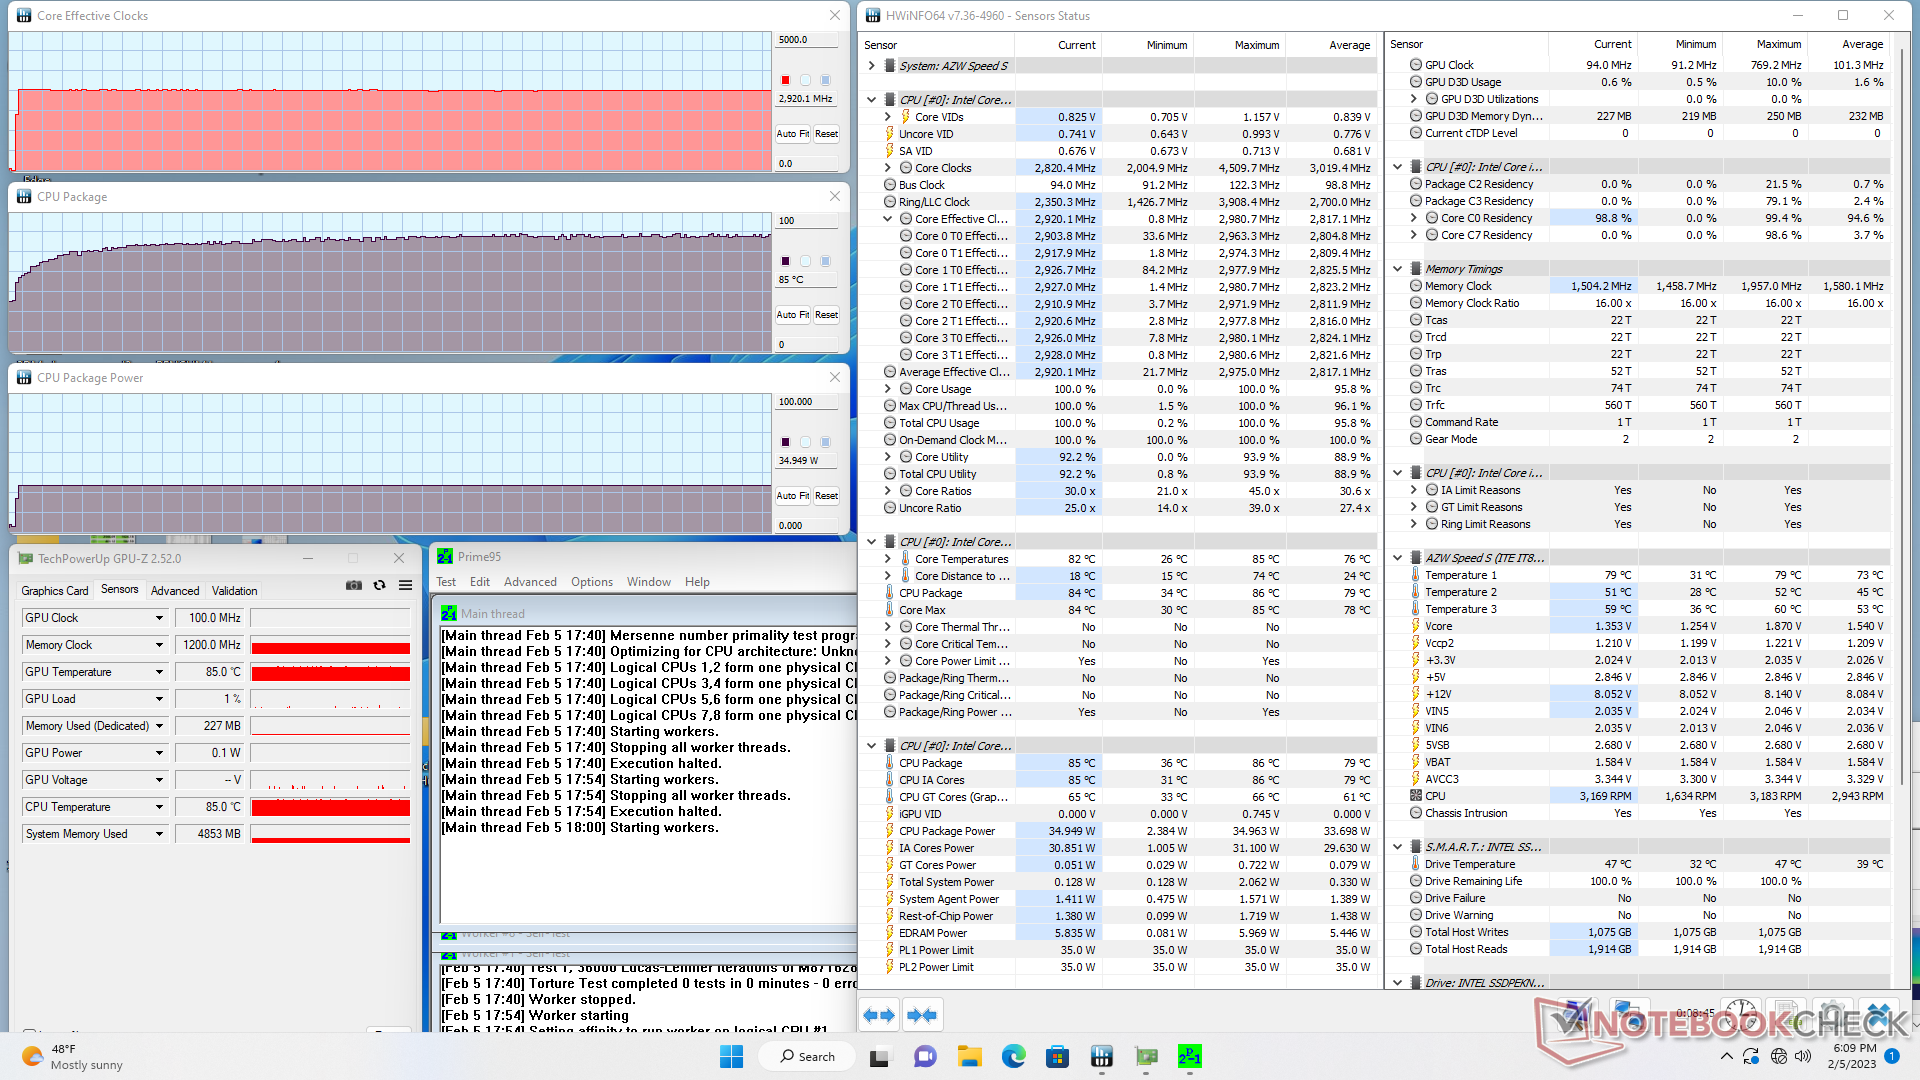
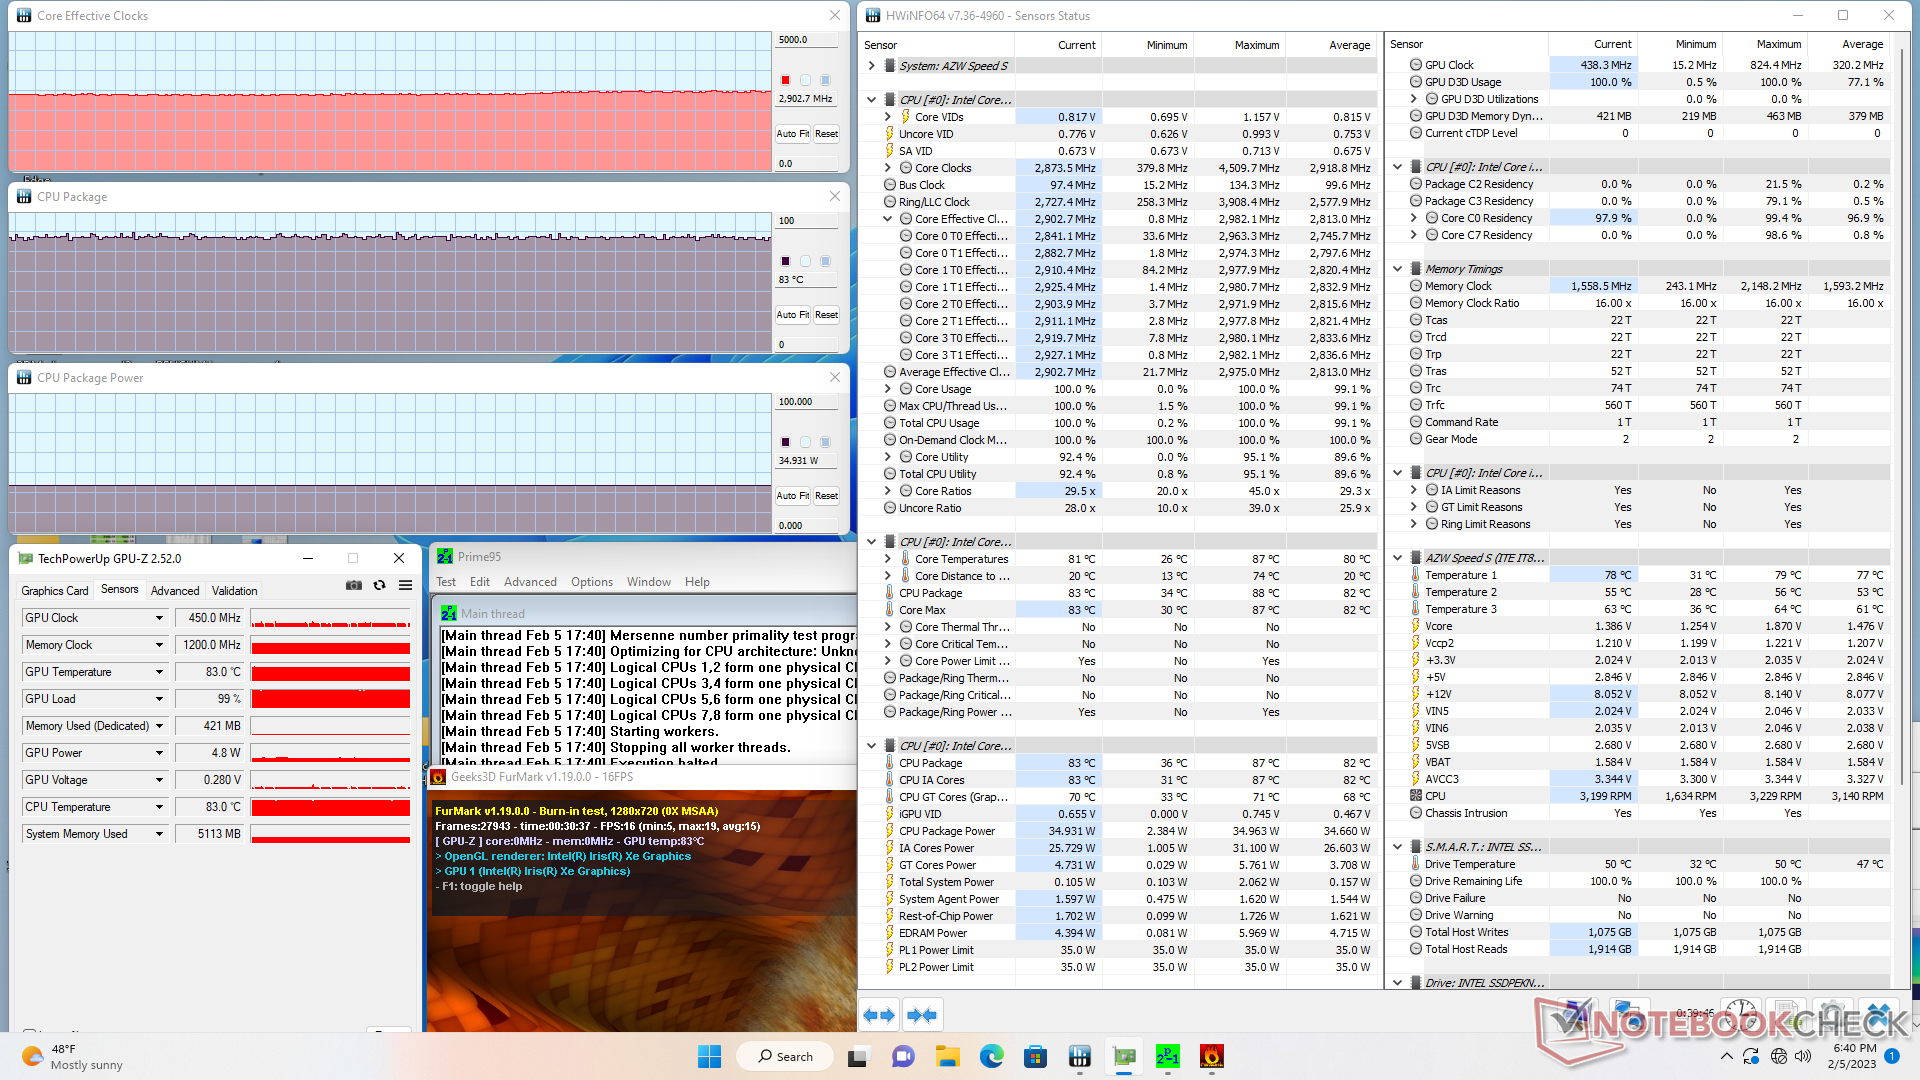
| CPU时钟(GHz) | GPU时钟(MHz) | CPU平均温度(°C) | |
| 系统空闲 | -- | -- | 39 |
| Prime95压力 | 2.9 | -- | 86 |
| Prime95+FurMark的压力 | 2.9 | 438 | 83 |
| Witcher 3 应力 | 1.2 | 1347 | 77 |
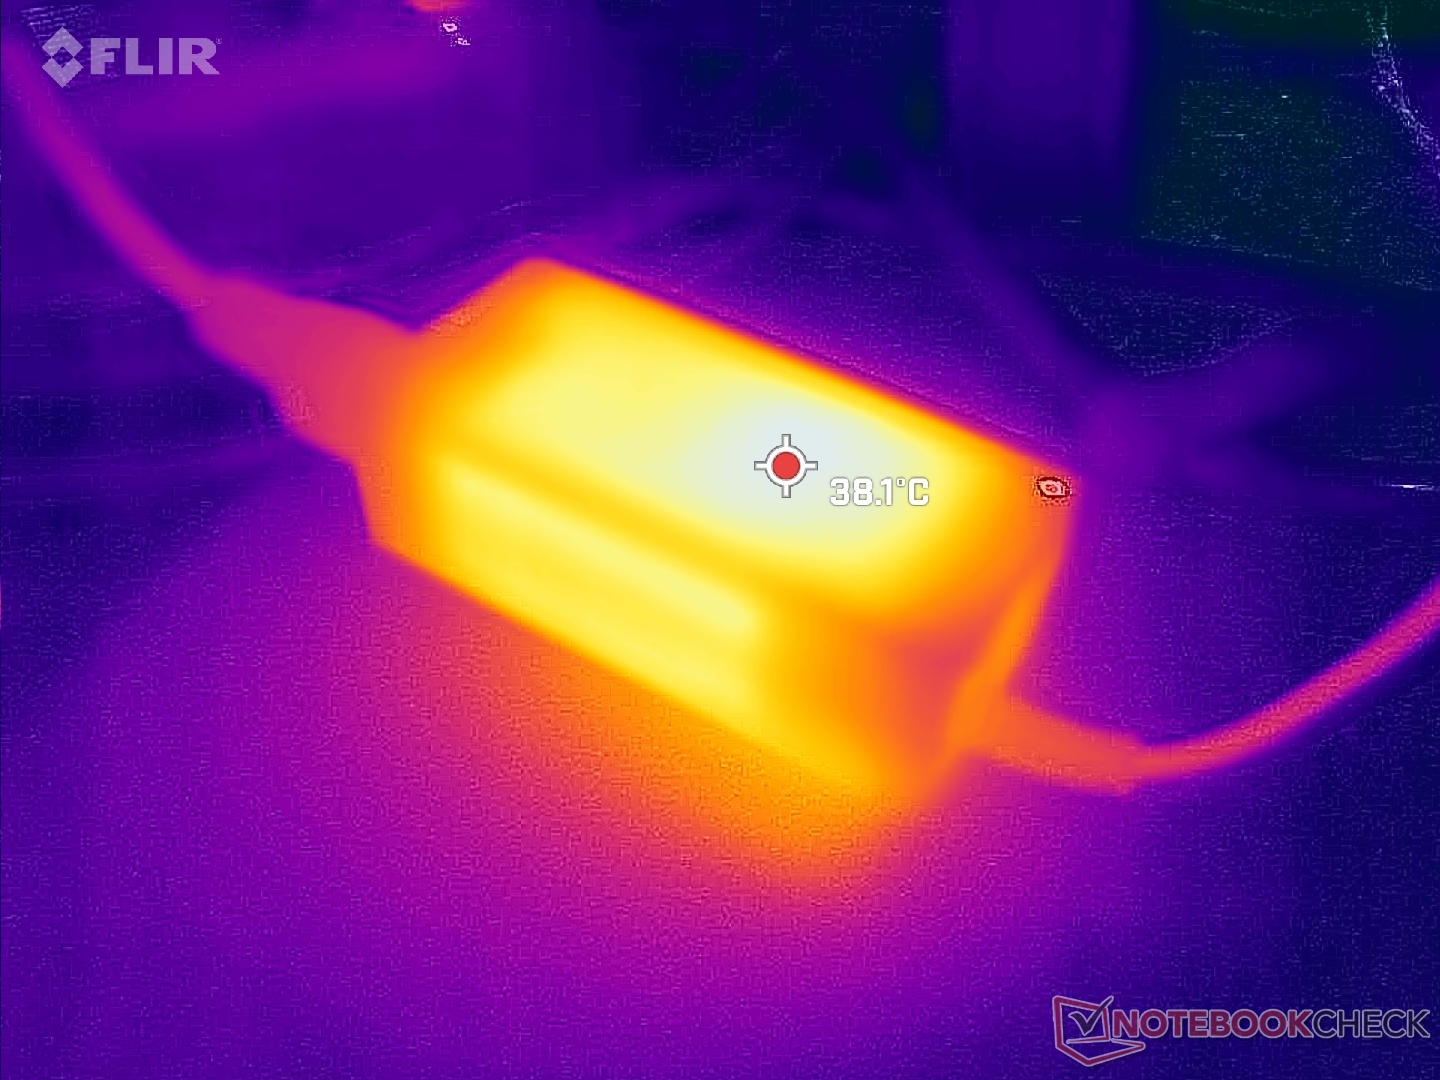
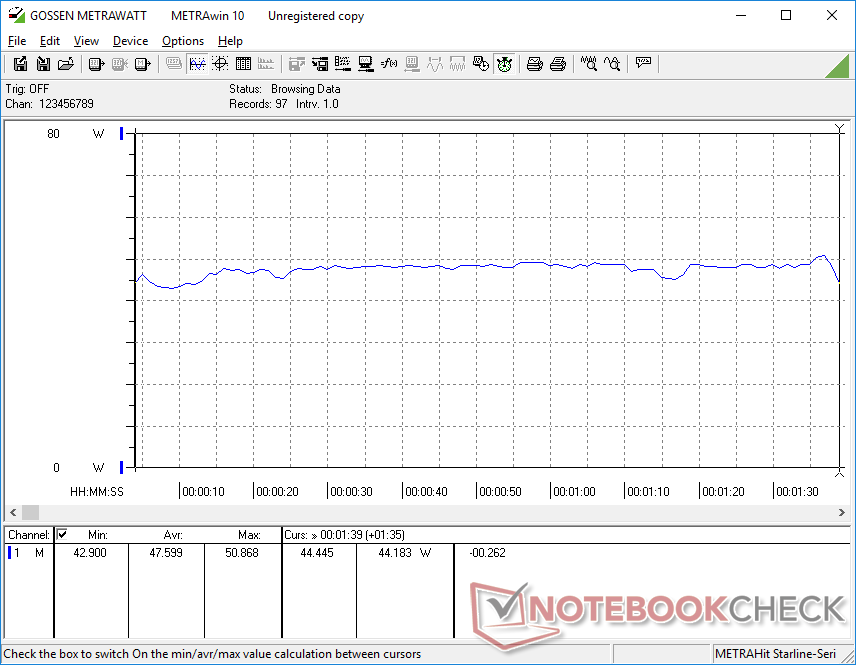
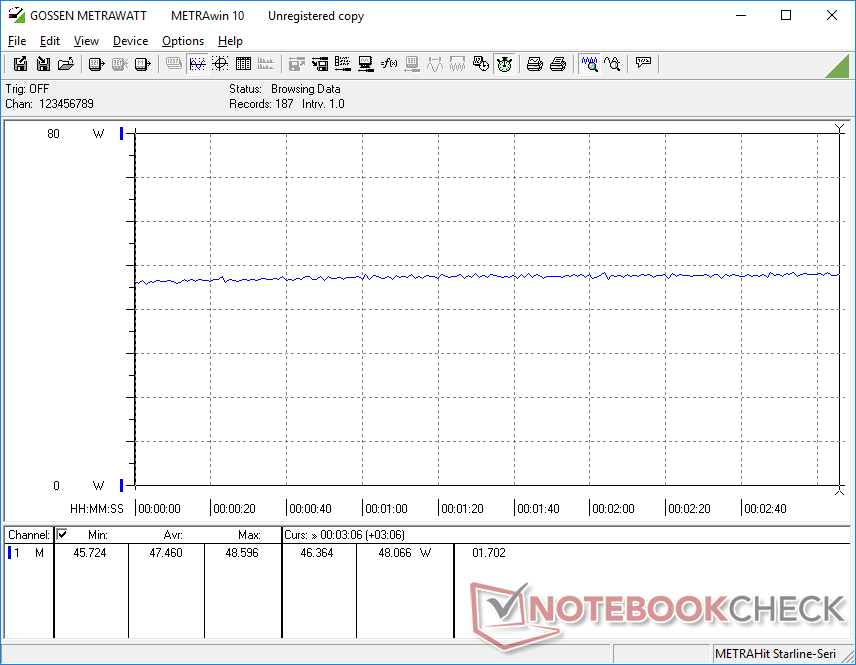
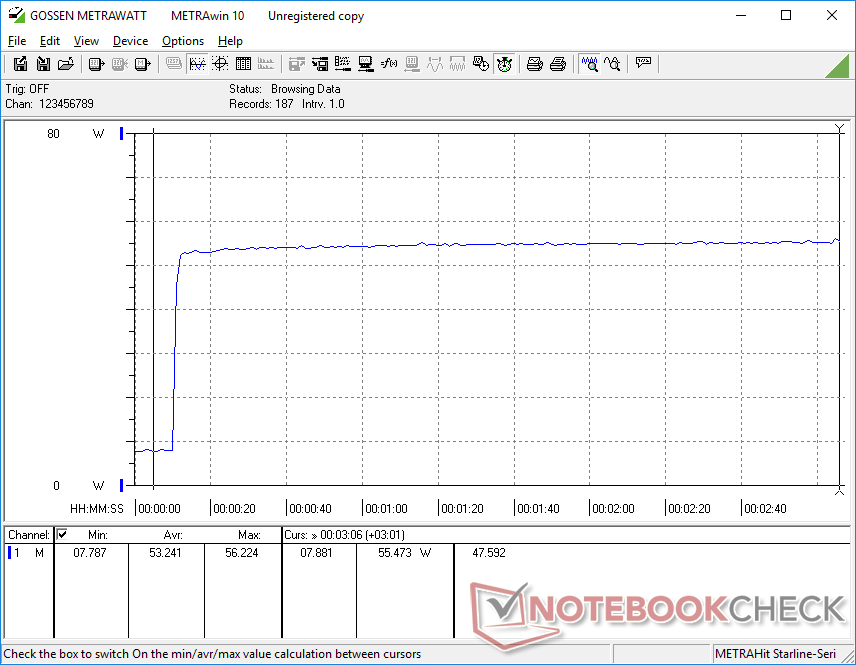
能源管理
消耗功率

| Off / Standby | |
| Idle | |
| Load |
|
Key:
min: | |
| Trigkey Speed S i5-11320H, Iris Xe G7 96EUs, Intel SSD 670p SSDPEKNU512GZ, , x, | Trigkey S3 R5 3550H, Vega 8, Kingston NV1 SNVS/500GCN, , x, | Beelink SEi12 Core i5-1235U i5-1235U, Iris Xe G7 80EUs, Kingston NV1 SNVS/500GCN, , x, | Beelink SER Pro Ryzen 5 5600H R5 5600H, Vega 7, Kingston NV1 SNVS/500GCN, , x, | Intel NUC 12 Pro Kit NUC12WSKi7 i7-1260P, Iris Xe G7 96EUs, Transcend M.2 SSD 2200S TS512GMTE220S, , x, | BMAX B5 Pro G7H8 i5-8260U, UHD Graphics 620, , , x, | |
|---|---|---|---|---|---|---|
| Power Consumption | -61% | -82% | 4% | -59% | 15% | |
| Idle Minimum * (Watt) | 6.7 | 11.3 -69% | 15.8 -136% | 5.4 19% | 12.1 -81% | 6 10% |
| Idle Average * (Watt) | 8 | 21.8 -173% | 16.8 -110% | 8.2 -2% | 12.2 -53% | 6.2 22% |
| Idle Maximum * (Watt) | 8.1 | 22.2 -174% | 17 -110% | 8.3 -2% | 12.3 -52% | 6.3 22% |
| Load Average * (Watt) | 47.6 | 39.7 17% | 54.4 -14% | 49.3 -4% | 64 -34% | 42.8 10% |
| Witcher 3 ultra * (Watt) | 47.5 | 37.5 21% | 50.7 -7% | 46.1 3% | 35 26% | |
| Load Maximum * (Watt) | 56.3 | 48.9 13% | 119.1 -112% | 50.2 11% | 98.8 -75% | 55.8 1% |
* ... smaller is better
Power Consumption Witcher 3 / Stresstest
Power Consumption external Monitor
Pros
Cons
判决书
NUC替代品通过使用H系列CPU发货,在不牺牲性能的情况下,价格一直在稳步下降。现在的价格如此之低,以至于它们开始挤掉较慢的Atom或Celeron迷你电脑。Trigkey Speed S的价格为400美元,已经准备好了,而且是许多配备类似内存和存储配置的英特尔NUC的一半。它没有提供一些先进的功能,如Thunderbolt、Wi-Fi 6E或2.5Gbit以太网,但许多HTPC用户在涉及1080p或4K视频流时不太可能介意。
与同价位的其他迷你PC相比,特瑞凯Speed S在每个方面都很有说服力。
与Trigkey S3相比,Speed S的图形性能提高了70%到120%,多线程CPU性能提高了50%到60%。在这个过程中,当处于负载状态时,它消耗的功率更大一些,但每瓦性能和每美元性能都保持很高。我们建议在收到时检查是否有任何电子噪音或线圈啸叫,以防万一。
Transparency
The selection of devices to be reviewed is made by our editorial team. The test sample was provided to the author as a loan by the manufacturer or retailer for the purpose of this review. The lender had no influence on this review, nor did the manufacturer receive a copy of this review before publication. There was no obligation to publish this review. As an independent media company, Notebookcheck is not subjected to the authority of manufacturers, retailers or publishers.
This is how Notebookcheck is testing
Every year, Notebookcheck independently reviews hundreds of laptops and smartphones using standardized procedures to ensure that all results are comparable. We have continuously developed our test methods for around 20 years and set industry standards in the process. In our test labs, high-quality measuring equipment is utilized by experienced technicians and editors. These tests involve a multi-stage validation process. Our complex rating system is based on hundreds of well-founded measurements and benchmarks, which maintains objectivity. Further information on our test methods can be found here.
Price comparison

