三星Galaxy Book3 Ultra 16 with RTX 4070 in review:商务型笔记本中的高图形性能
通过Galaxy Book3 Ultra,三星正在涉足高性能多媒体笔记本领域。可选择配备NvidiaGeForce RTX 4050或RTX 4070,重点是高级视频和图像处理。同时,这款笔记本很薄,不显眼,比类似配置的游戏笔记本轻了近1公斤。
由于大力降低了功耗,一个小型冷却系统就足够了,这也占用了更少的空间。在下面的评论中,我们看看当系统不得不使用低于100瓦的功率而不是250或300瓦的功率时,图形性能受到多大影响。此外,三星在小空间内限制热量排放和风扇噪音的能力如何,还有待观察。
我们最近审查了较小的 三星Galaxy Book3 Ultra配备RTX 4050。对于类似的任务和类似的硬件,一个竞争对手是,例如, Gigabyte AERO 16 OLED.但看看装备更好、更昂贵的 MSI Stealth 17 Studio当然也无妨。而配备M2芯片的MacBook Pro在价格和性能方面应该大致相当,尽管Windows和Mac之间的比较就像比较苹果和橘子。
潜在的竞争对手比较
Rating | Date | Model | Weight | Height | Size | Resolution | Price |
|---|---|---|---|---|---|---|---|
| 88.8 % v7 (old) | 05 / 2023 | Samsung Galaxy Book3 Ultra 16, i9-13900H RTX 4070 i9-13900H, GeForce RTX 4070 Laptop GPU | 1.8 kg | 16.8 mm | 16.00" | 2880x1800 | |
| 90.3 % v7 (old) | 04 / 2023 | Dell XPS 15 9530 RTX 4070 i7-13700H, GeForce RTX 4070 Laptop GPU | 1.9 kg | 18 mm | 15.60" | 3456x2160 | |
| 89.2 % v7 (old) | 04 / 2023 | MSI Stealth 17 Studio A13VH-014 i9-13900H, GeForce RTX 4080 Laptop GPU | 3 kg | 21.3 mm | 17.30" | 3840x2160 | |
| 89 % v7 (old) | 02 / 2023 | Asus ProArt StudioBook 16 H7600ZW i9-12900H, GeForce RTX 3070 Ti Laptop GPU | 2.4 kg | 19.9 mm | 16.00" | 3840x2400 | |
| 86.2 % v7 (old) | 03 / 2023 | Gigabyte AERO 16 OLED BSF i9-13900H, GeForce RTX 4070 Laptop GPU | 2.1 kg | 18 mm | 16.00" | 3840x2400 | |
| 89.4 % v7 (old) | 04 / 2023 | Samsung Galaxy Book3 Ultra 16 i7-13700H, GeForce RTX 4050 Laptop GPU | 1.8 kg | 16.5 mm | 16.00" | 2880x1800 |
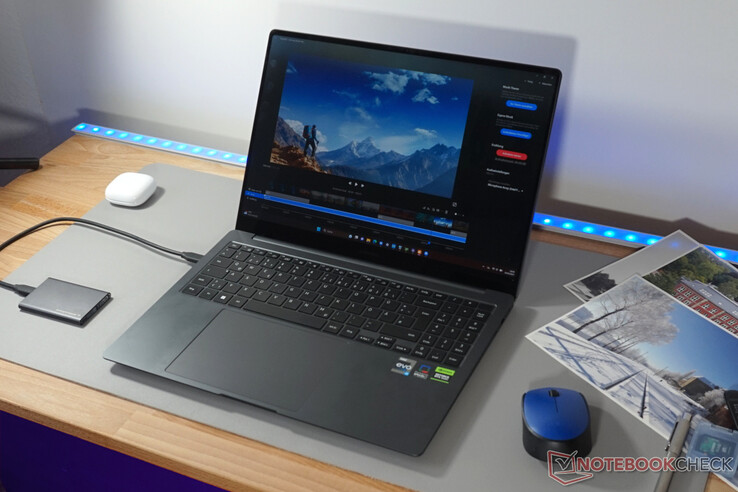
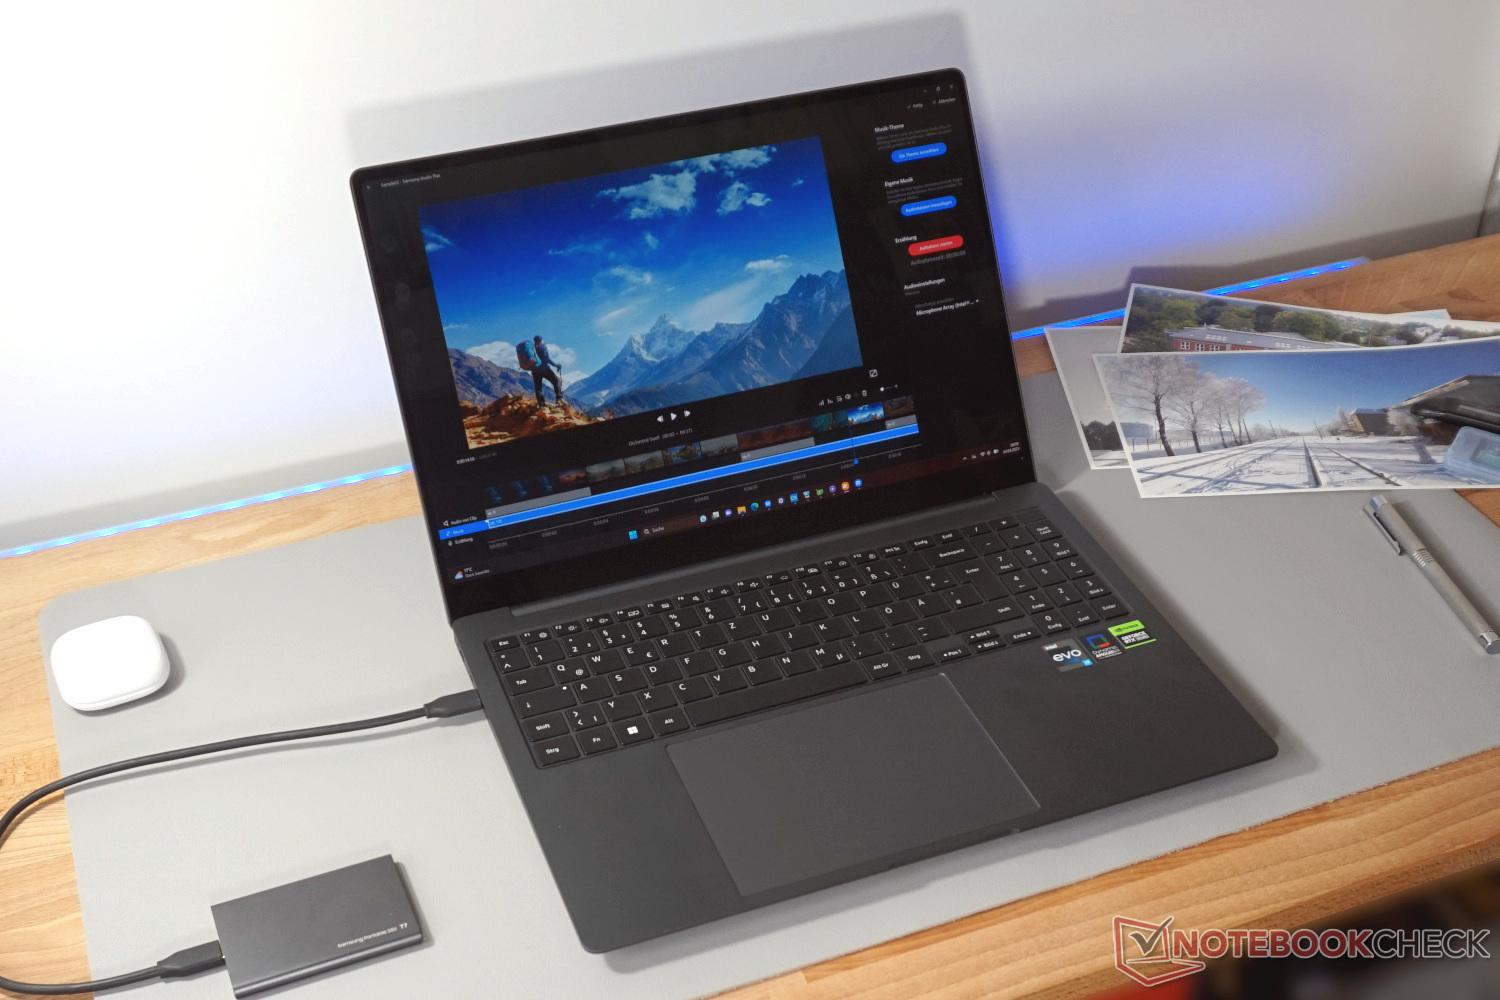
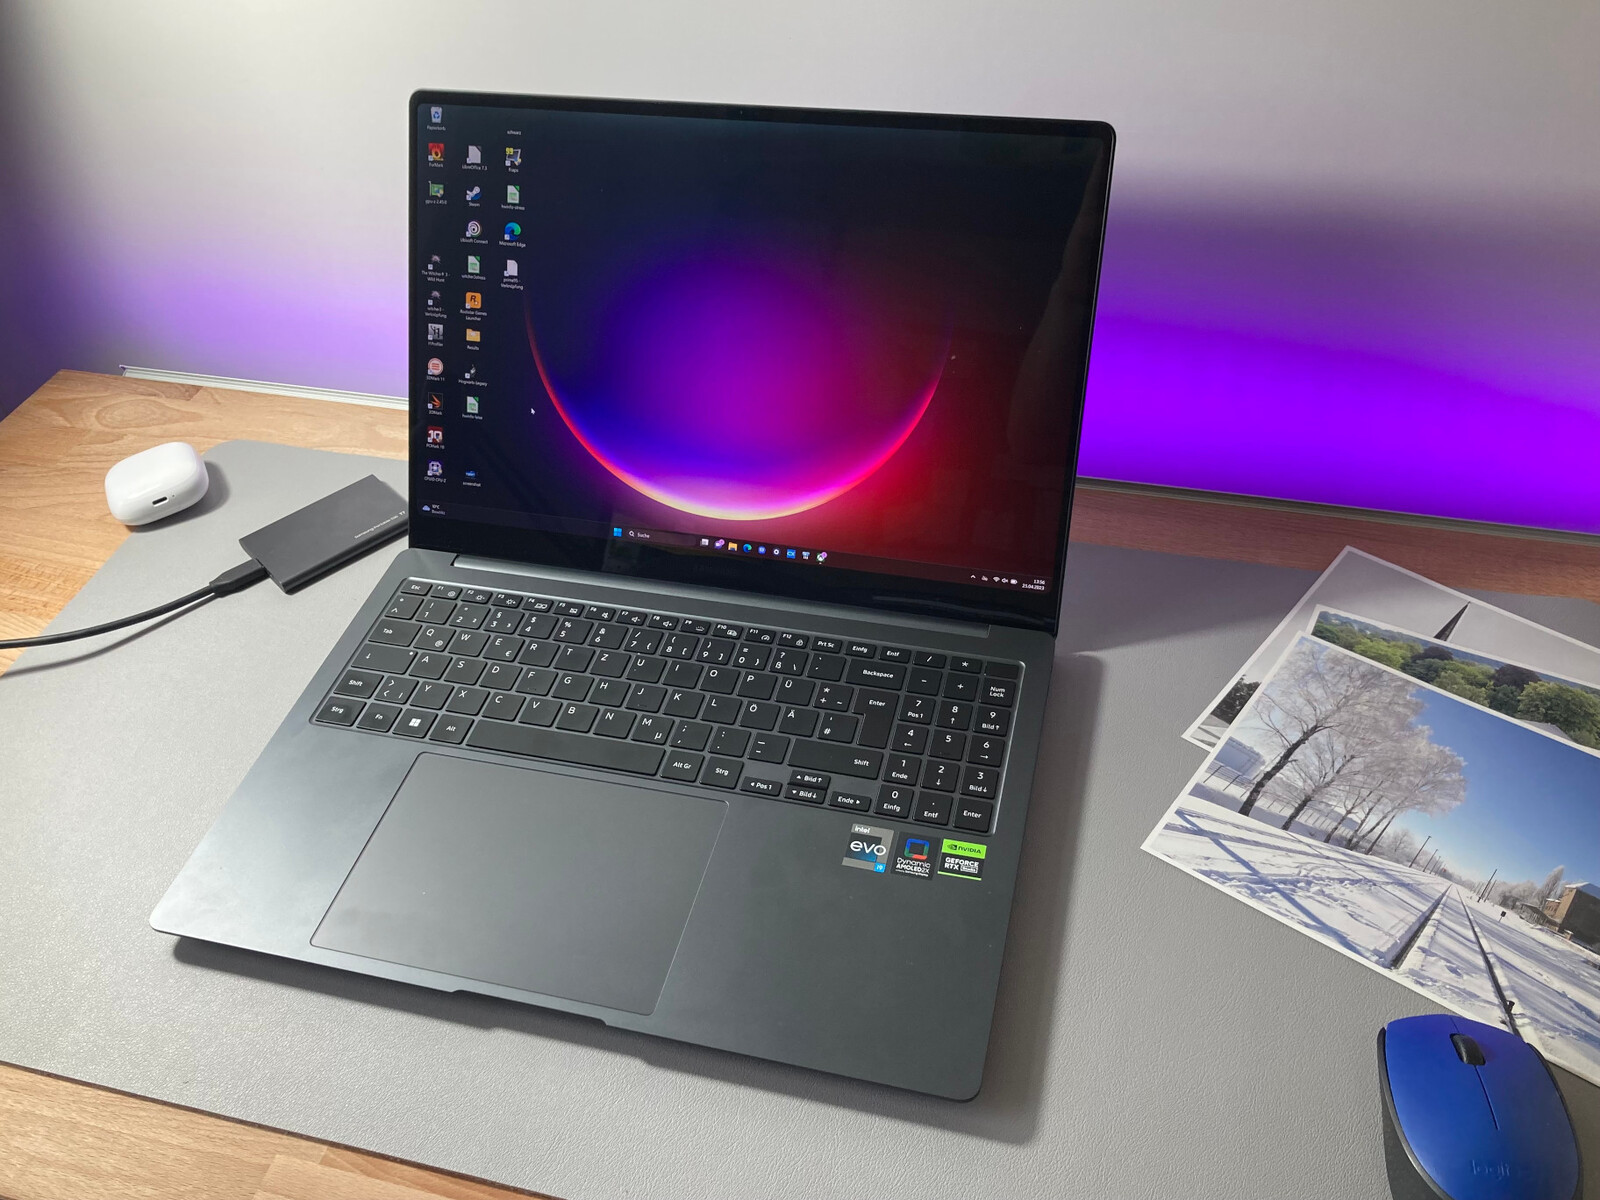
案例 - 极薄的Galaxy 书
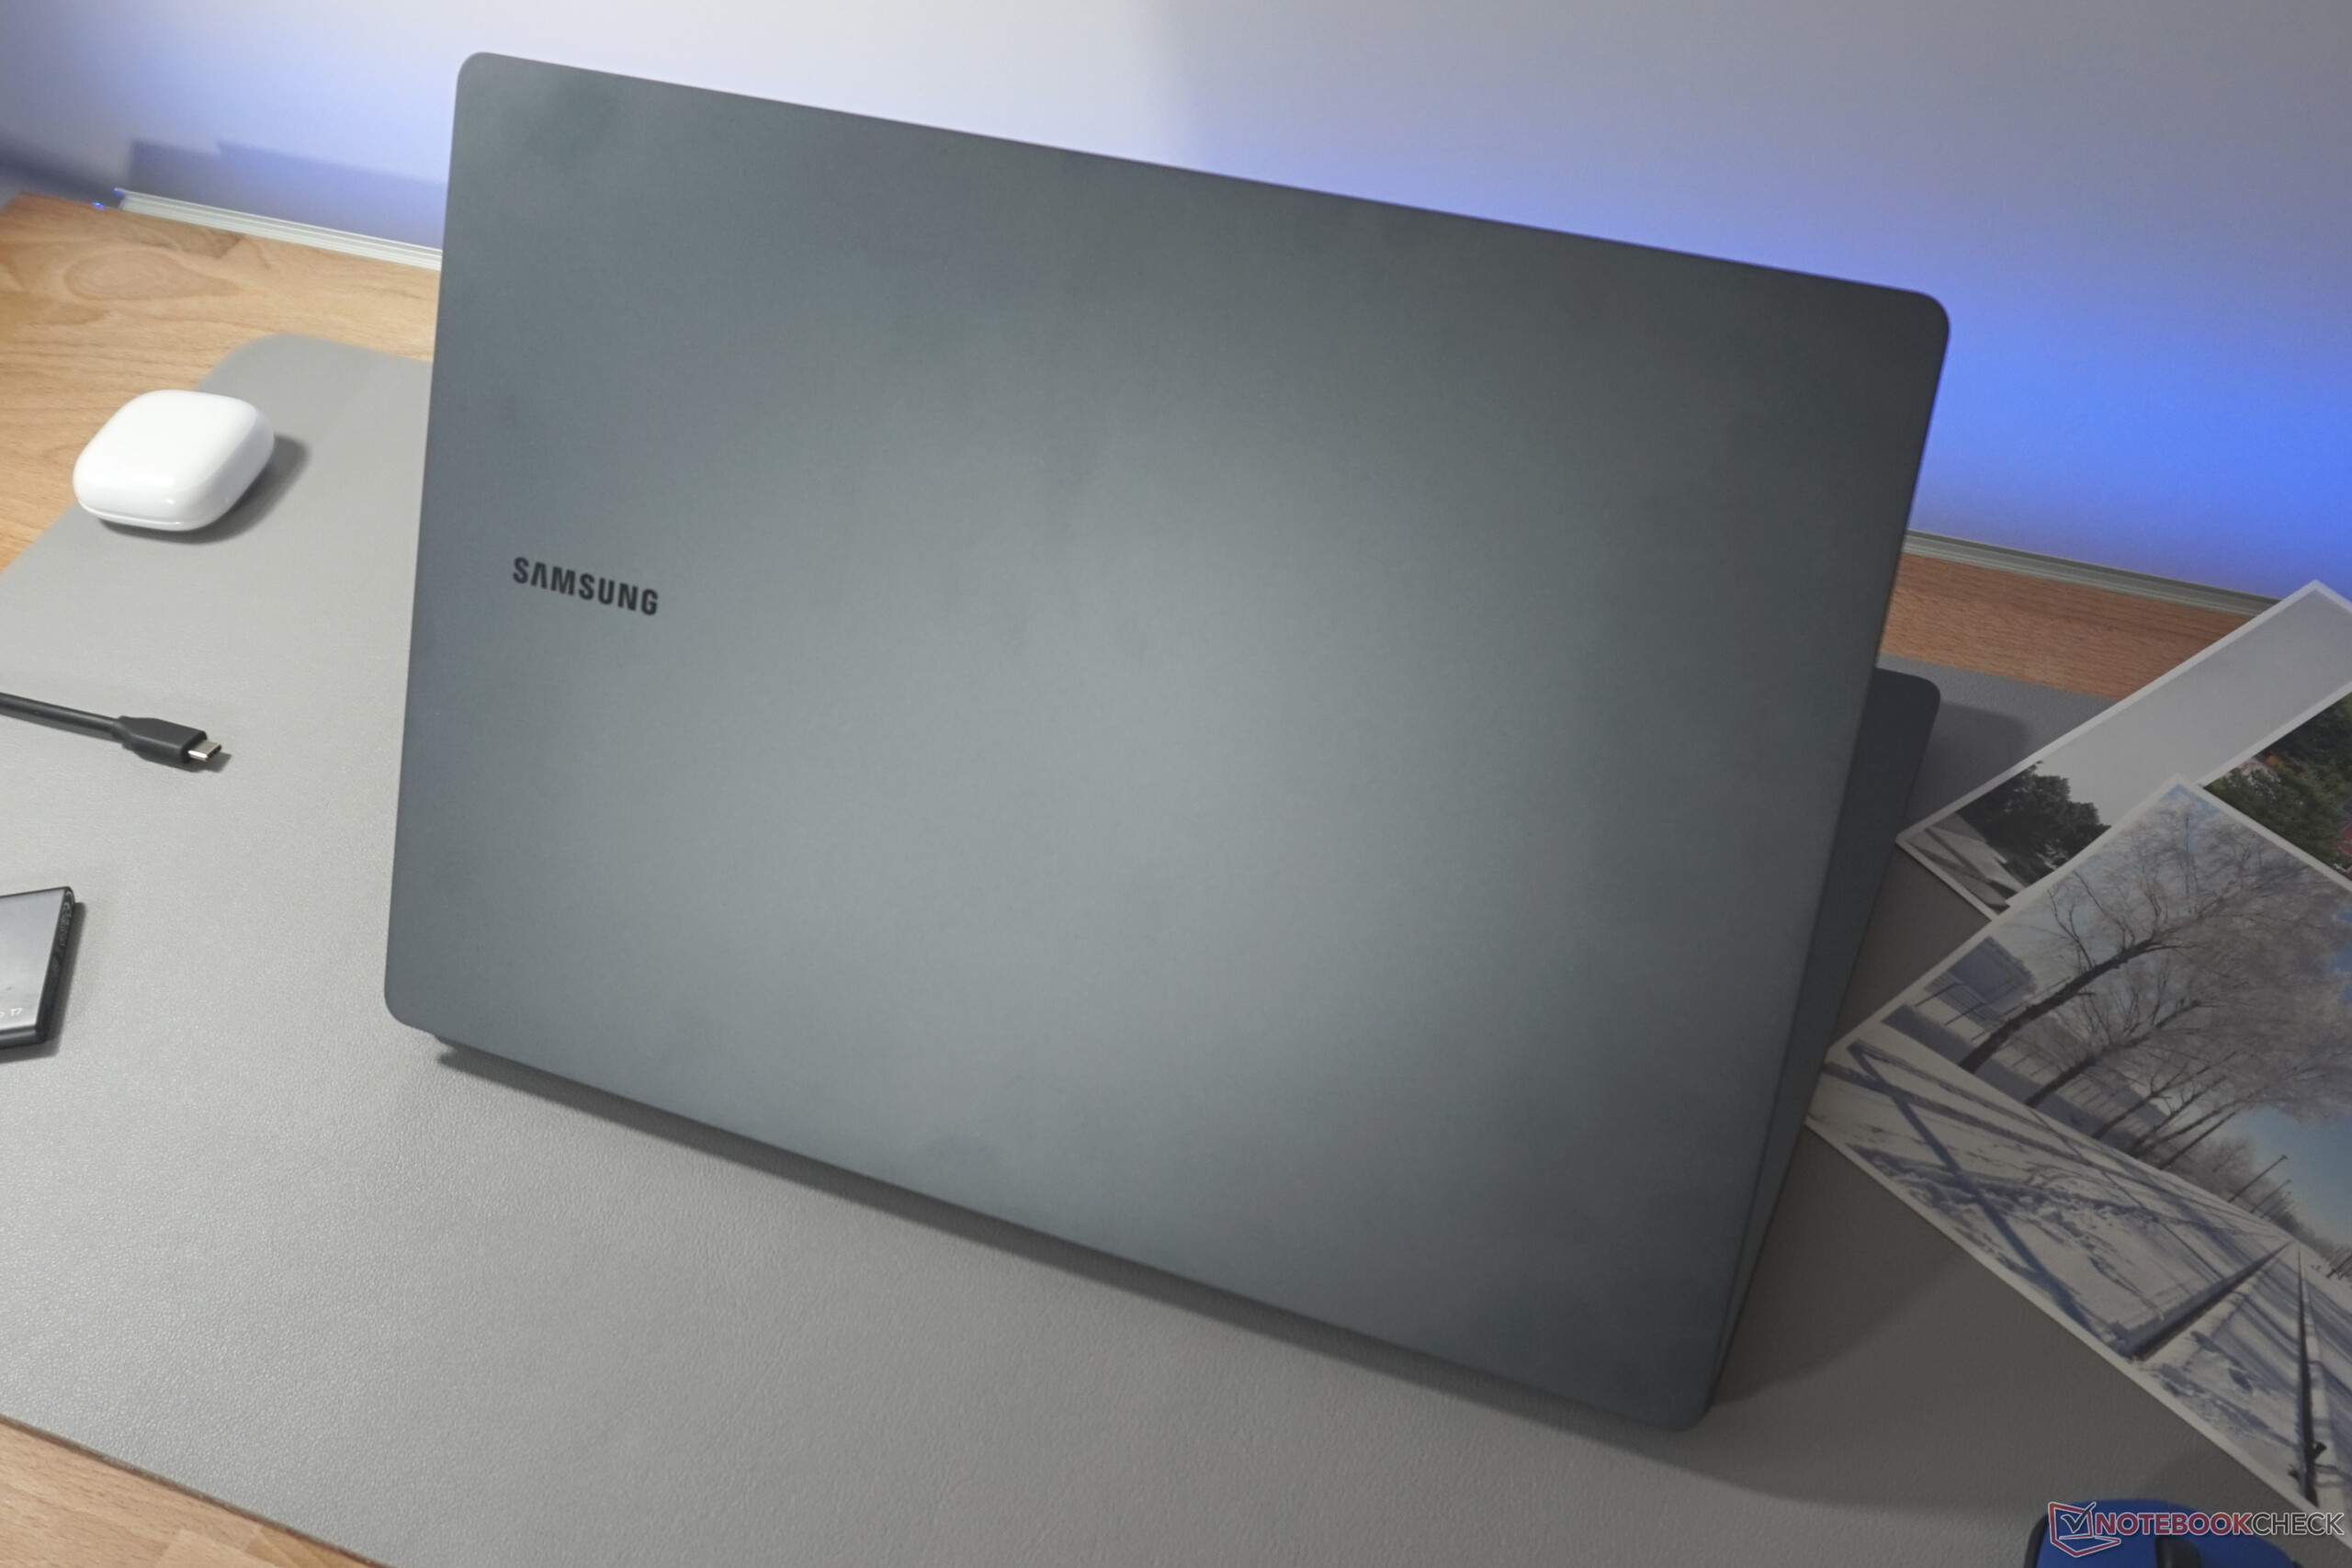
Galaxy Book Ultra的深灰色看起来很清醒,不显眼。底部和键盘框架都由塑料制成,与金属显示屏盖子几乎没有区别,至少在视觉上是这样。所有的东西看起来都是无缝连接的,找不到任何缝隙。
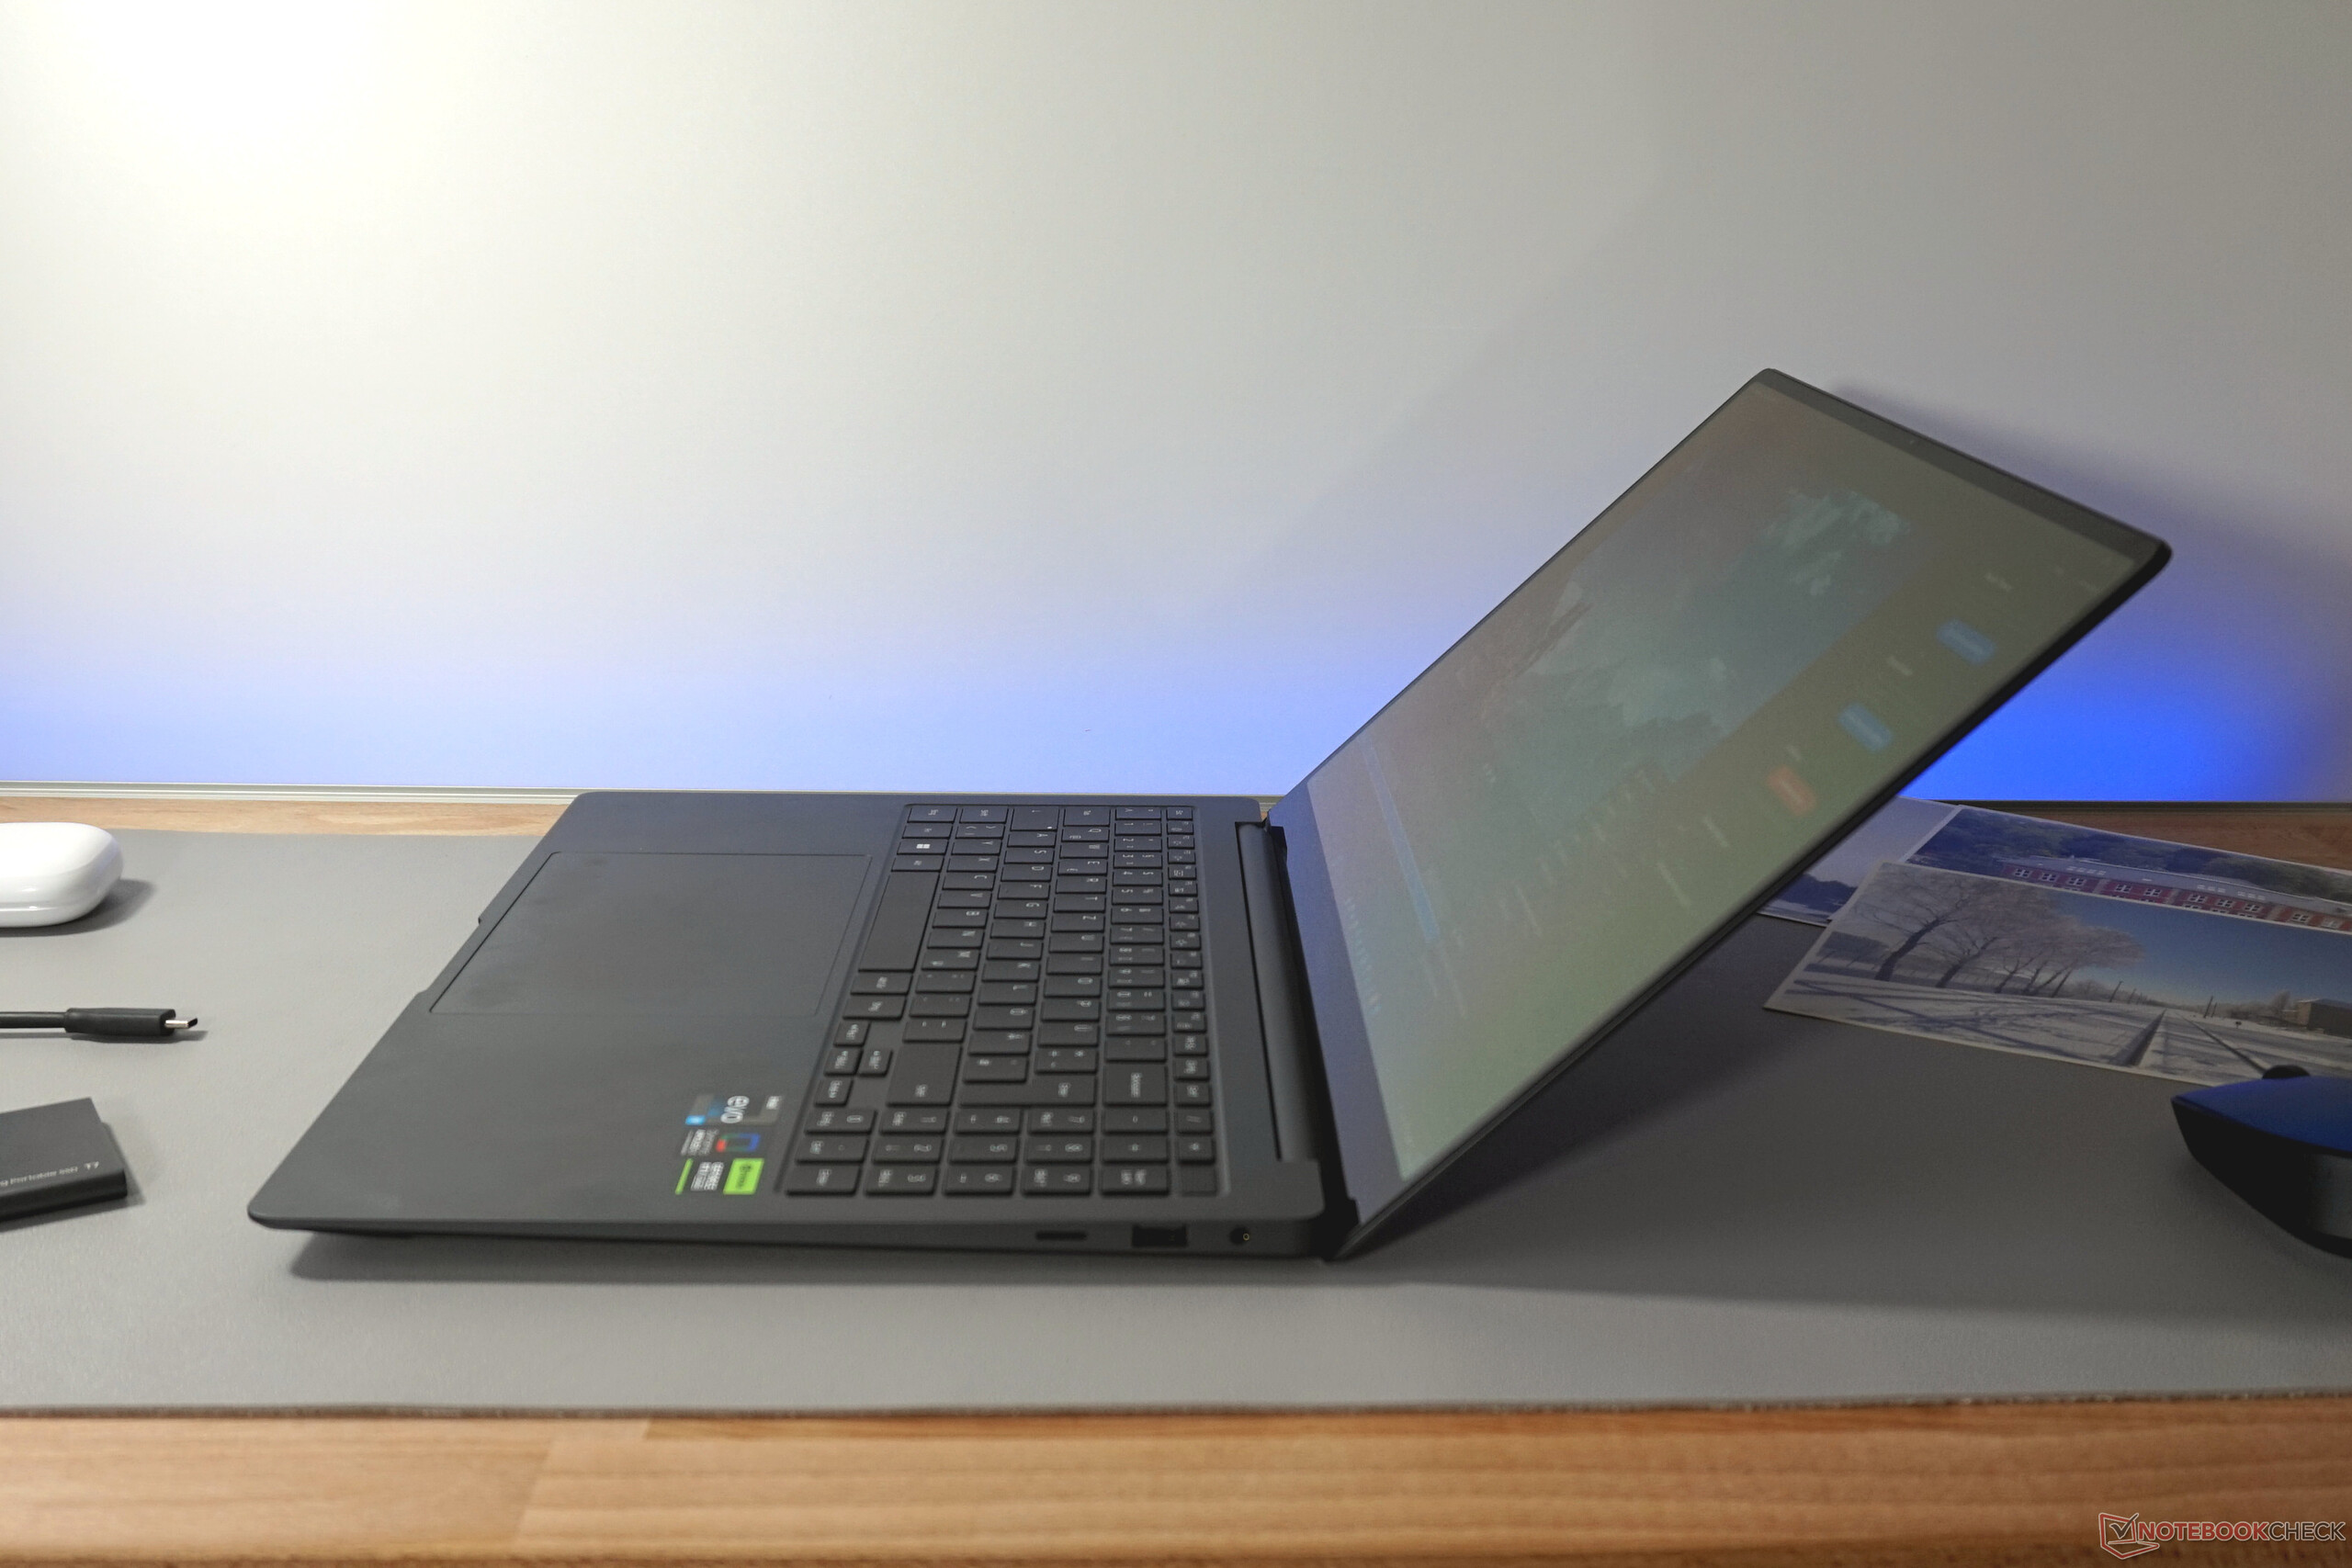
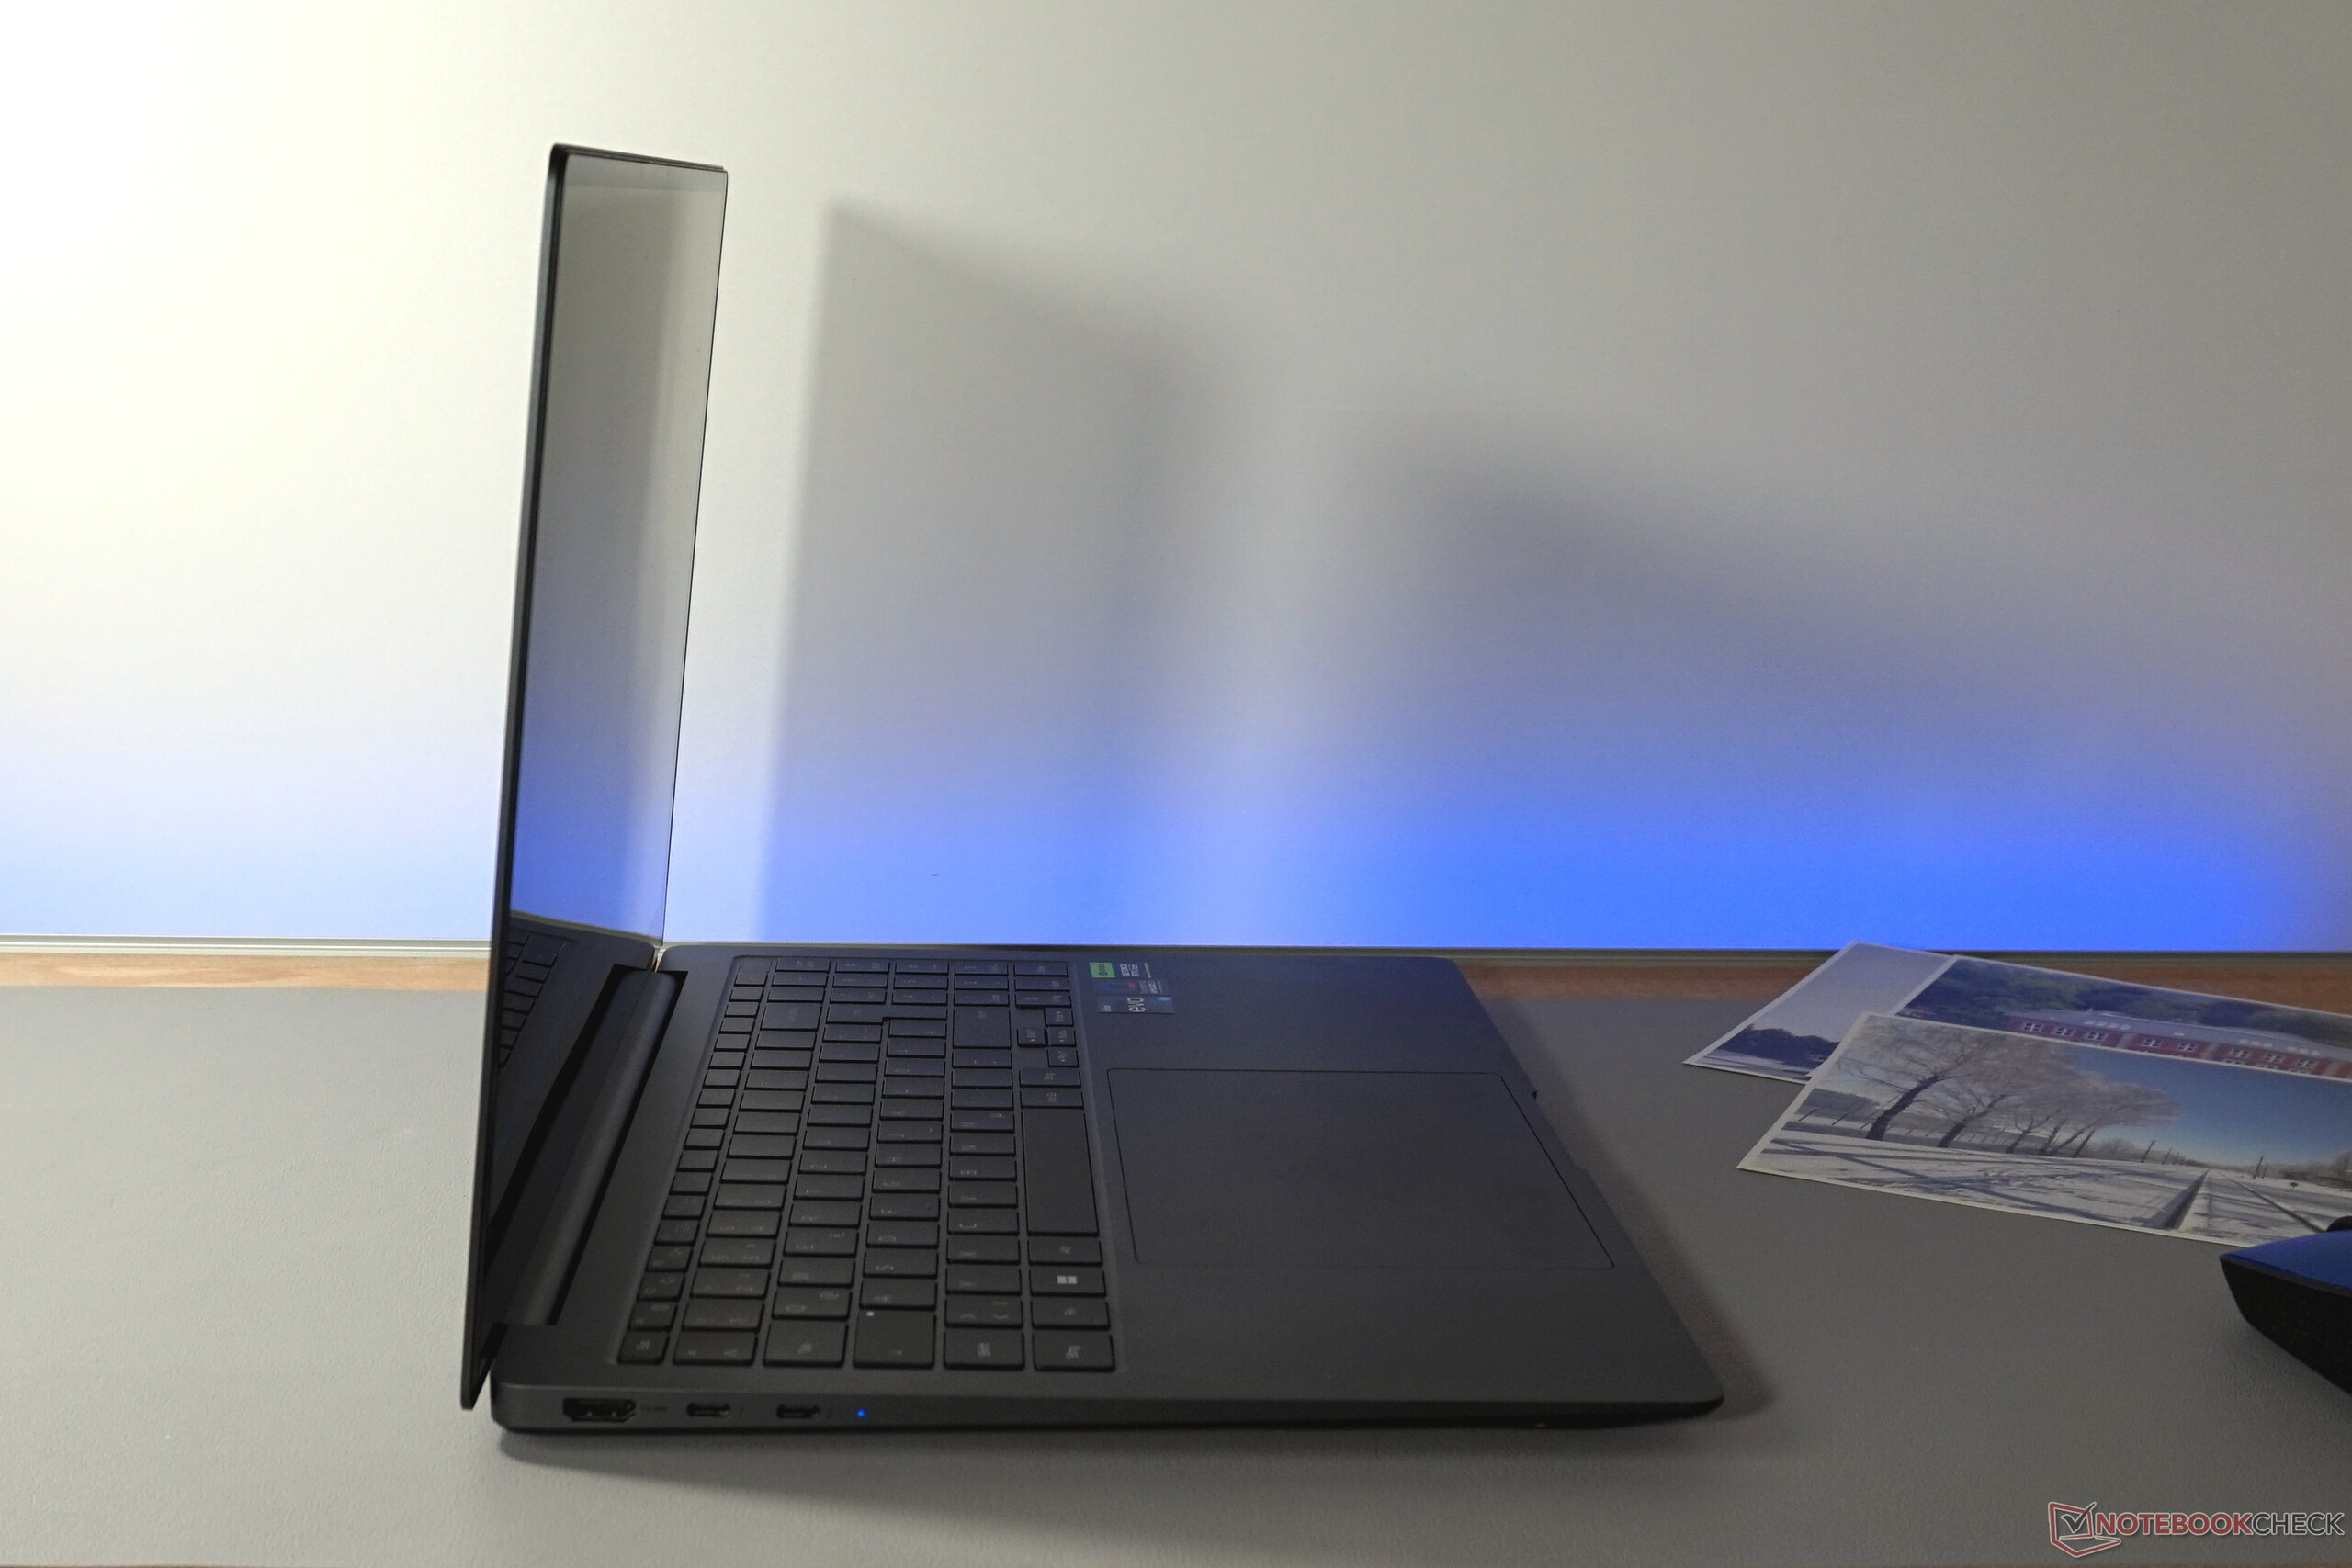
扭转刚度很高。非常平坦的外壳只能产生最小的弯曲。由于其重量,显示屏可以很容易地用一只手打开,可以达到135°,也显得非常坚固。只有铰链的晃动有点大。
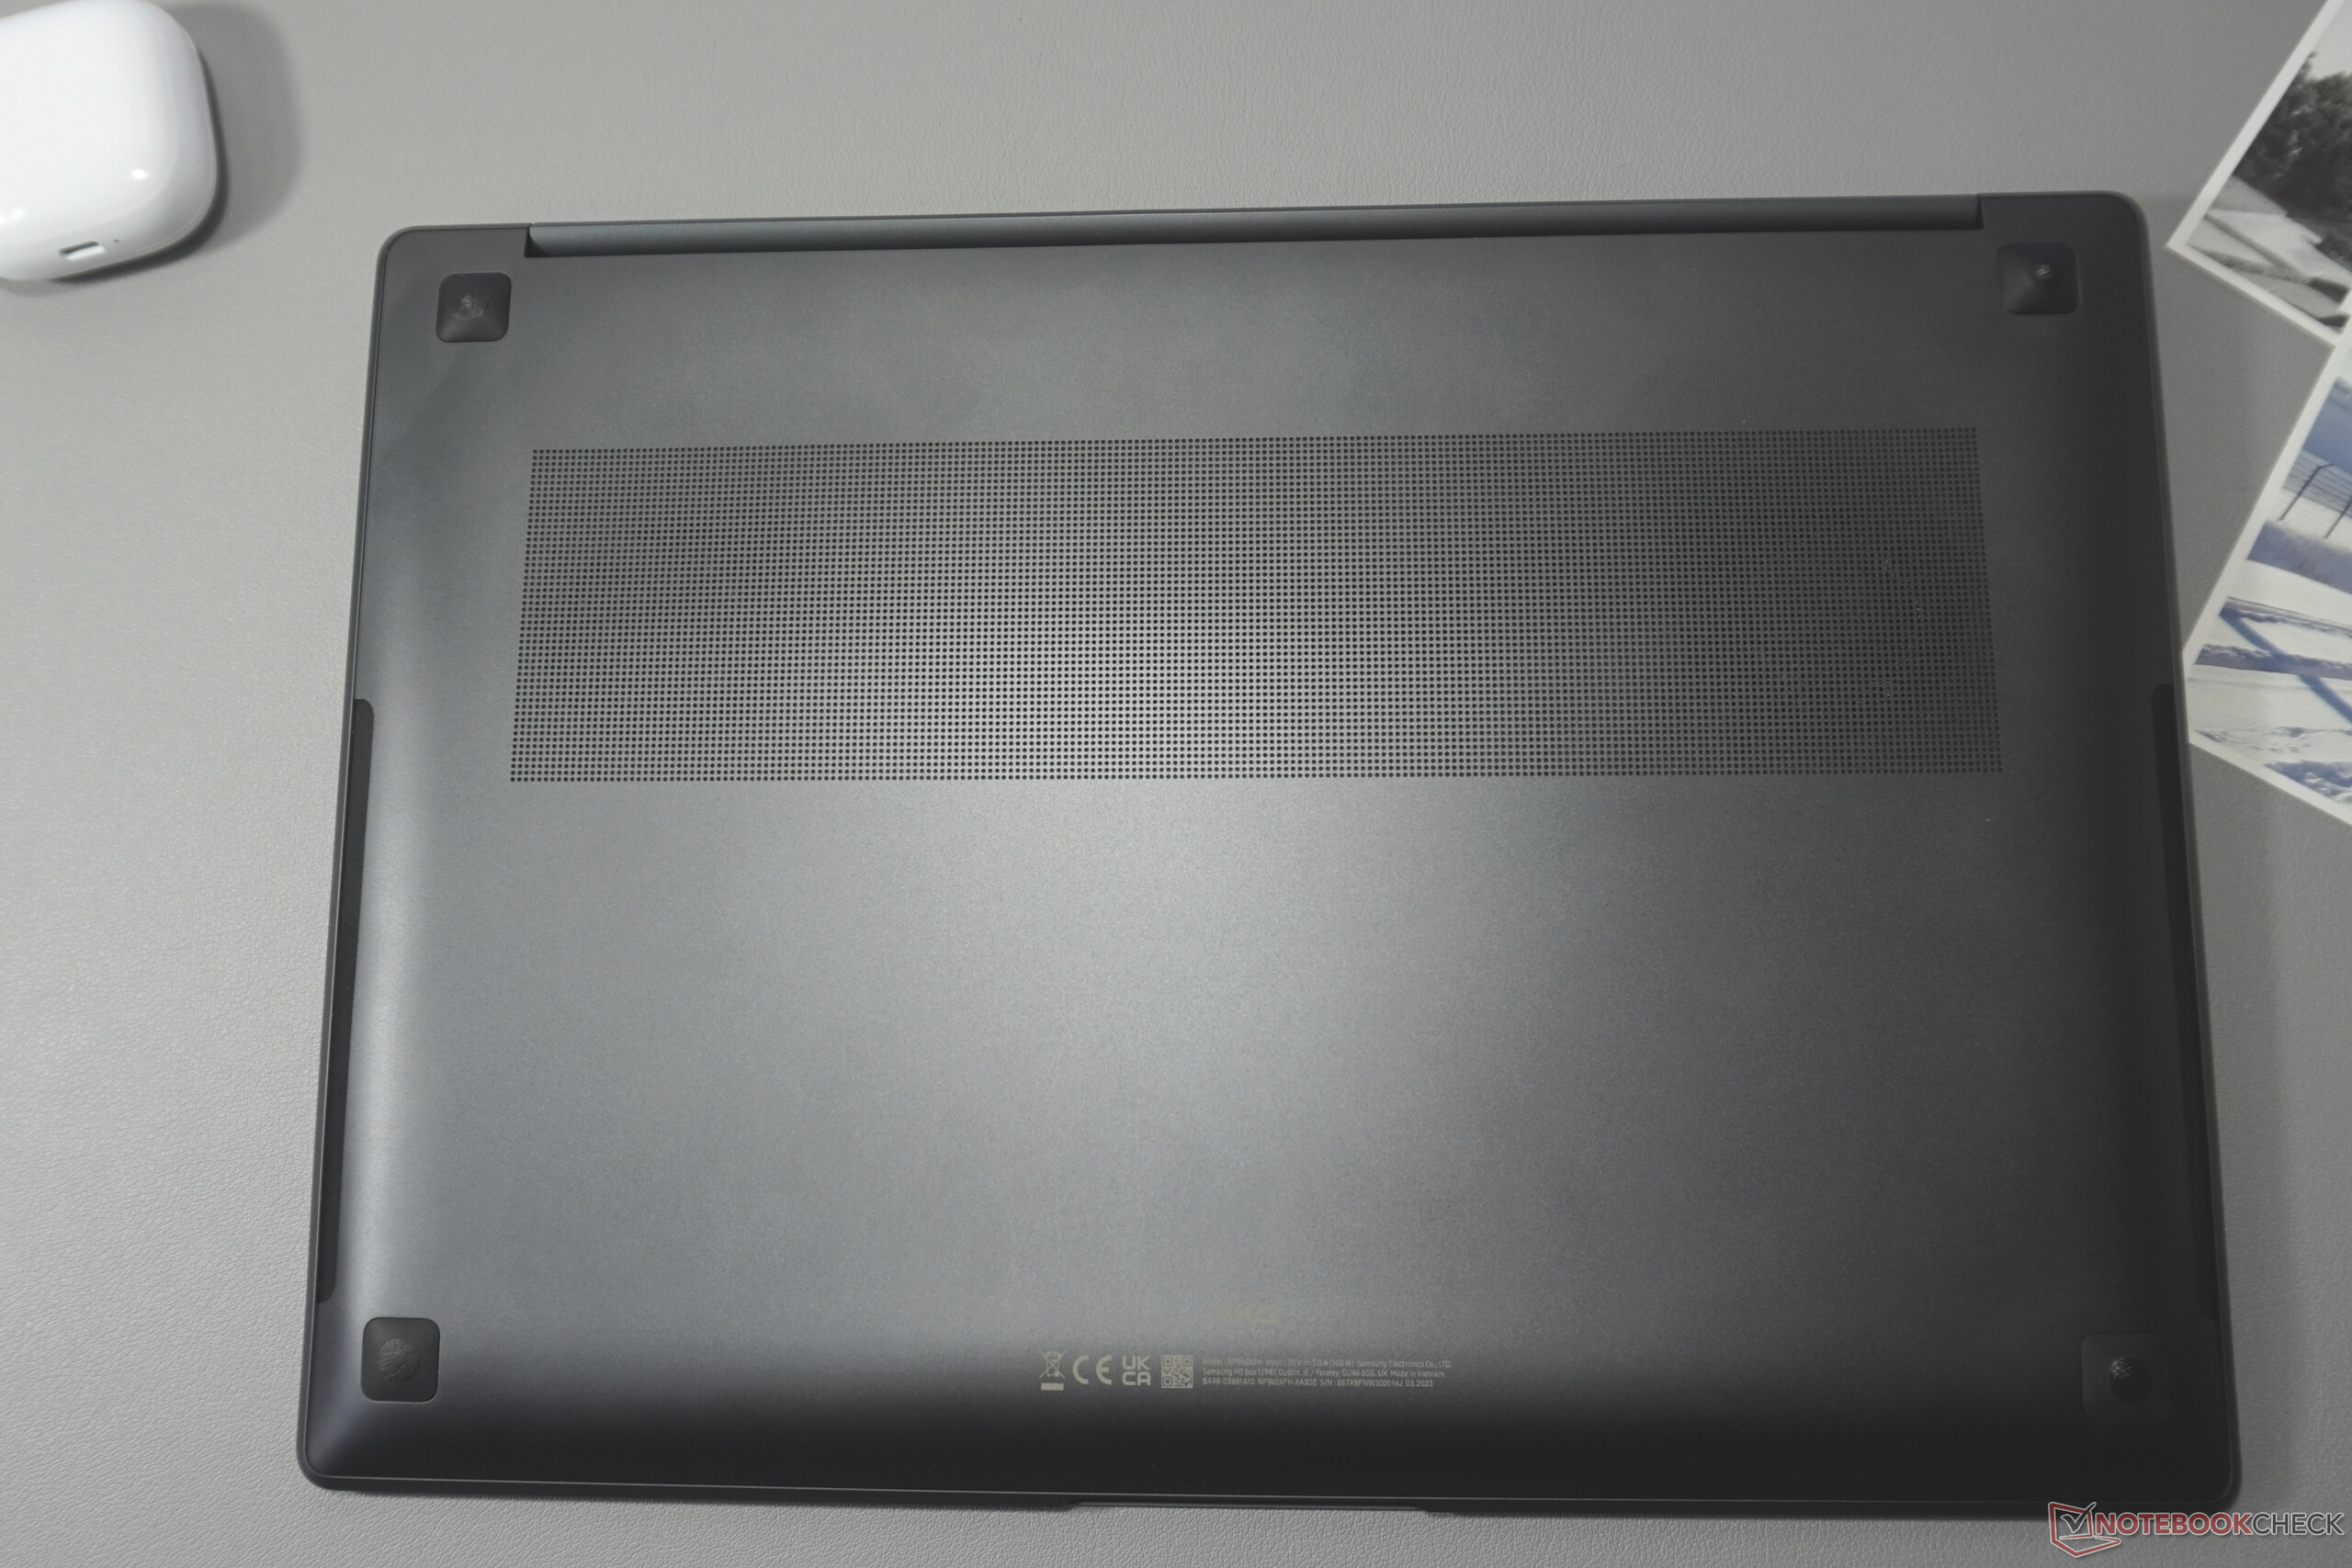
真正引人注目的是缺乏更大的通风槽。空气交换只能通过底板和两侧非常微妙的栅栏来实现。
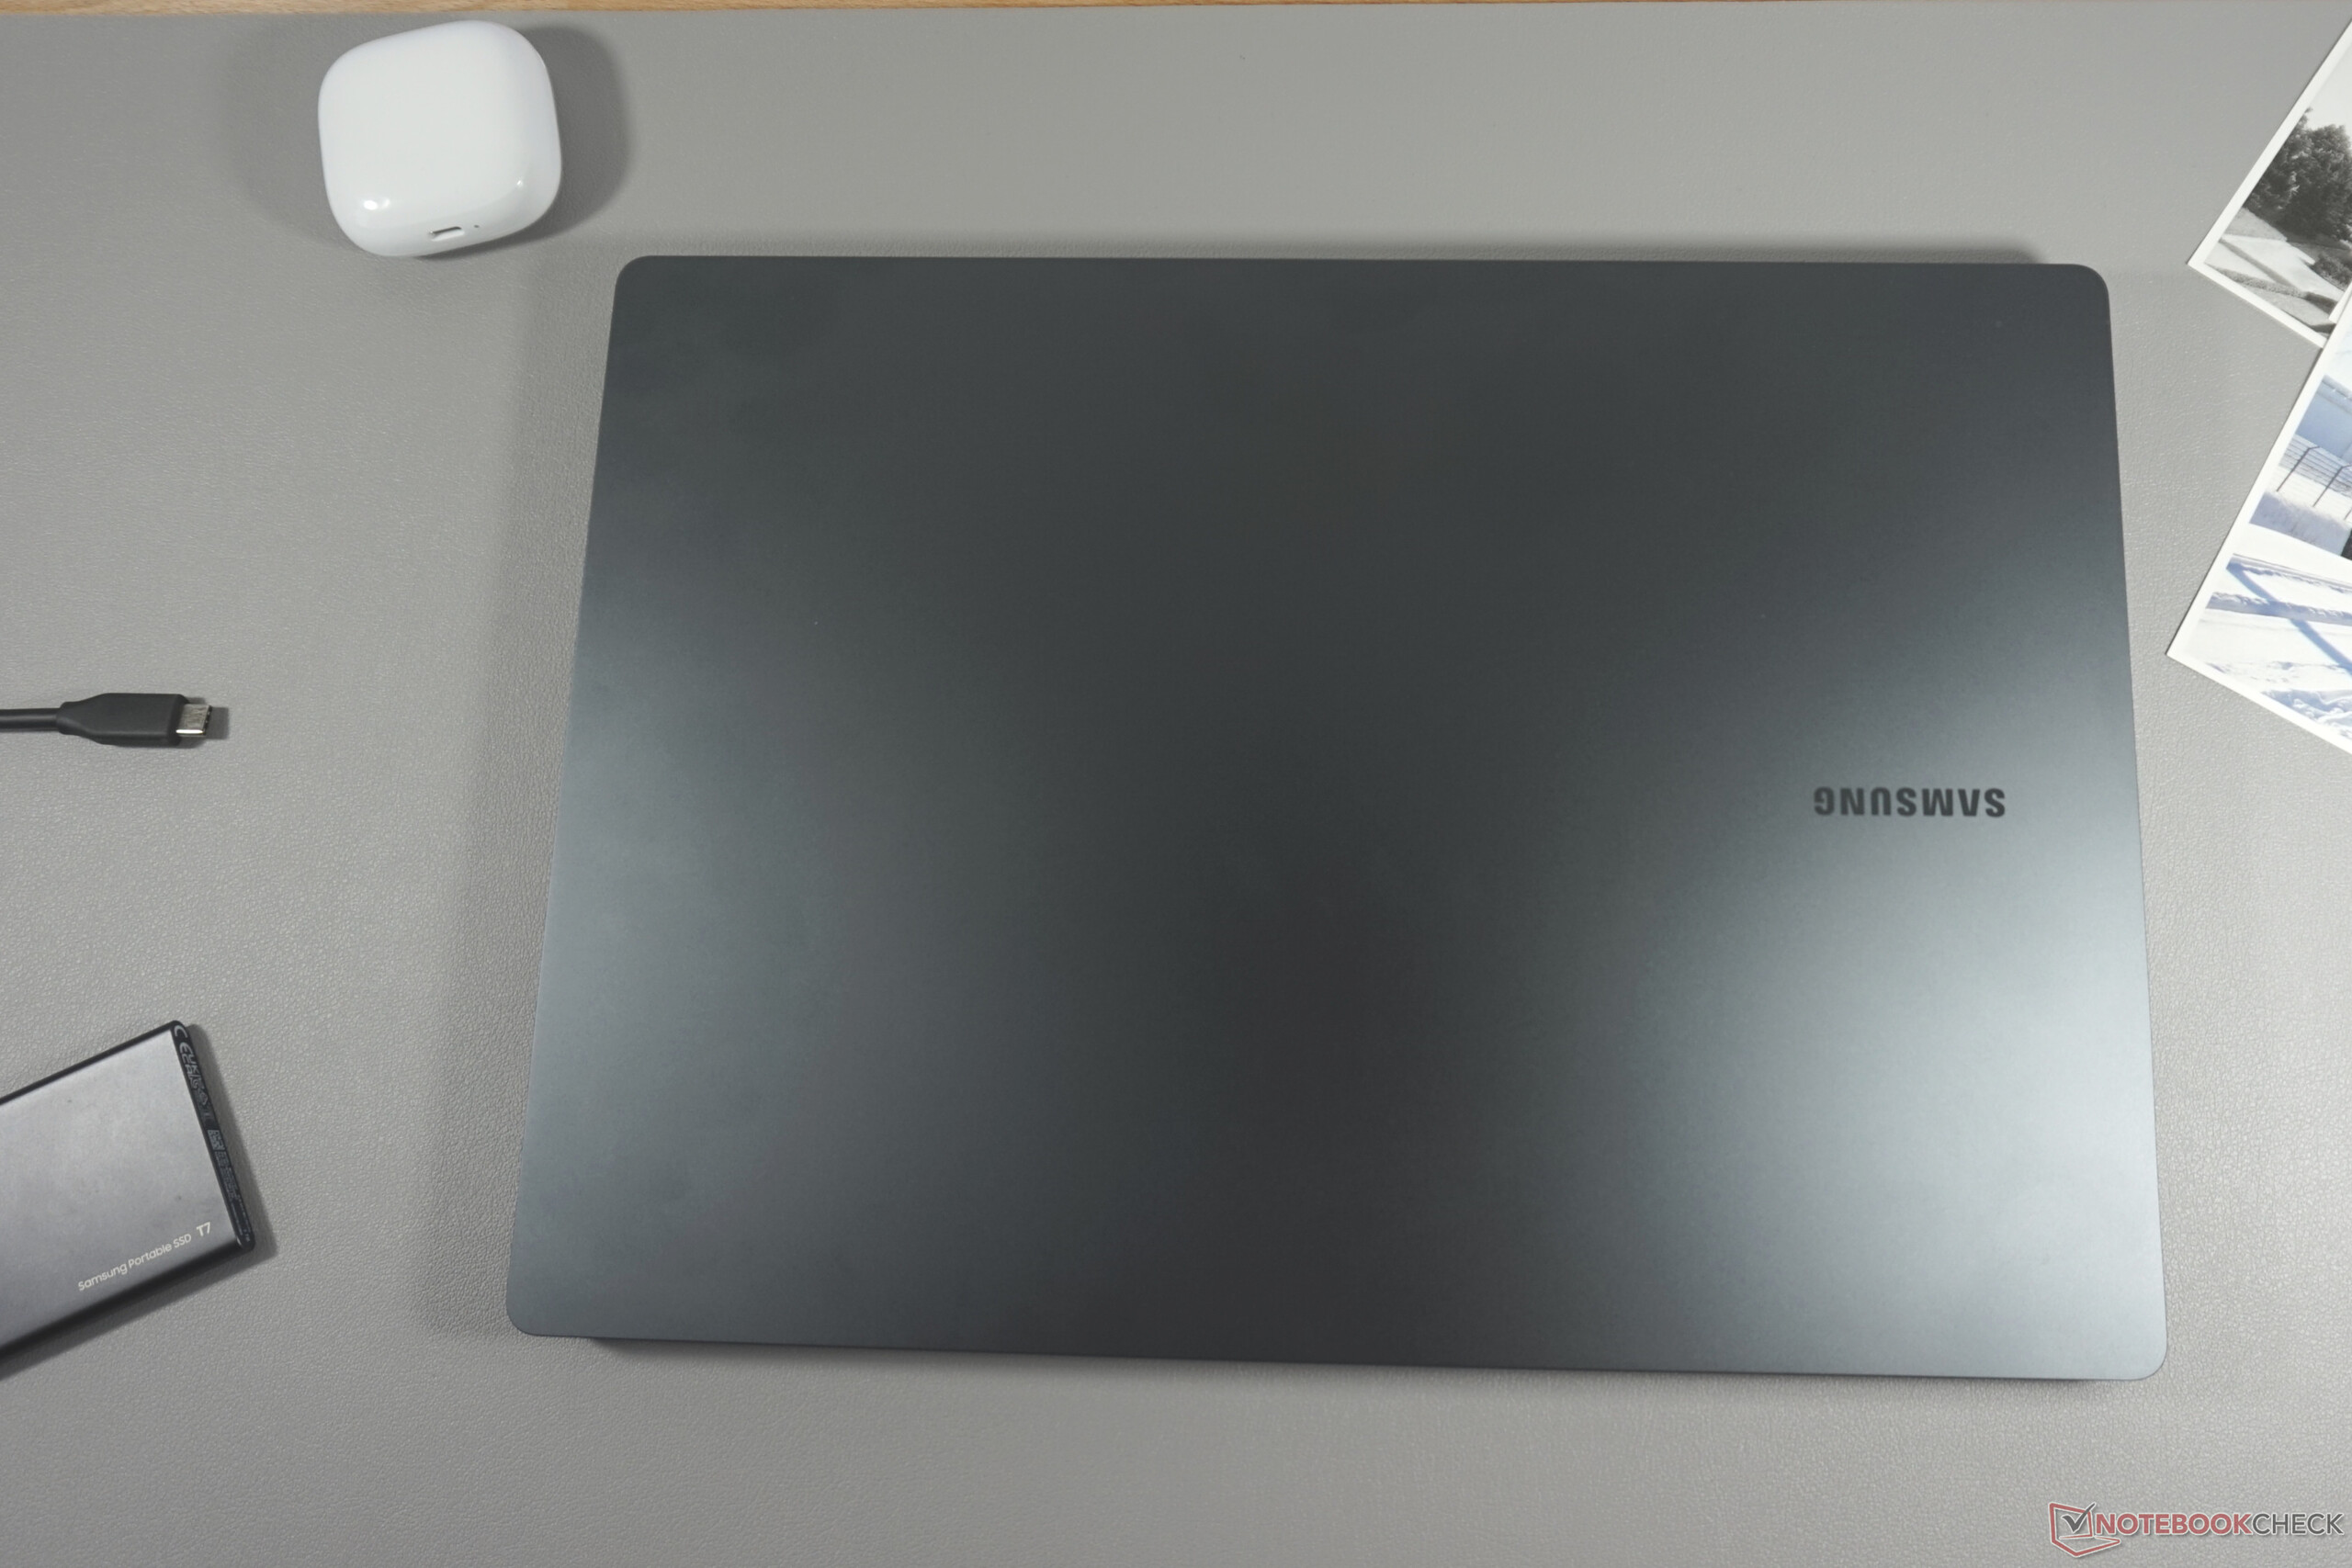
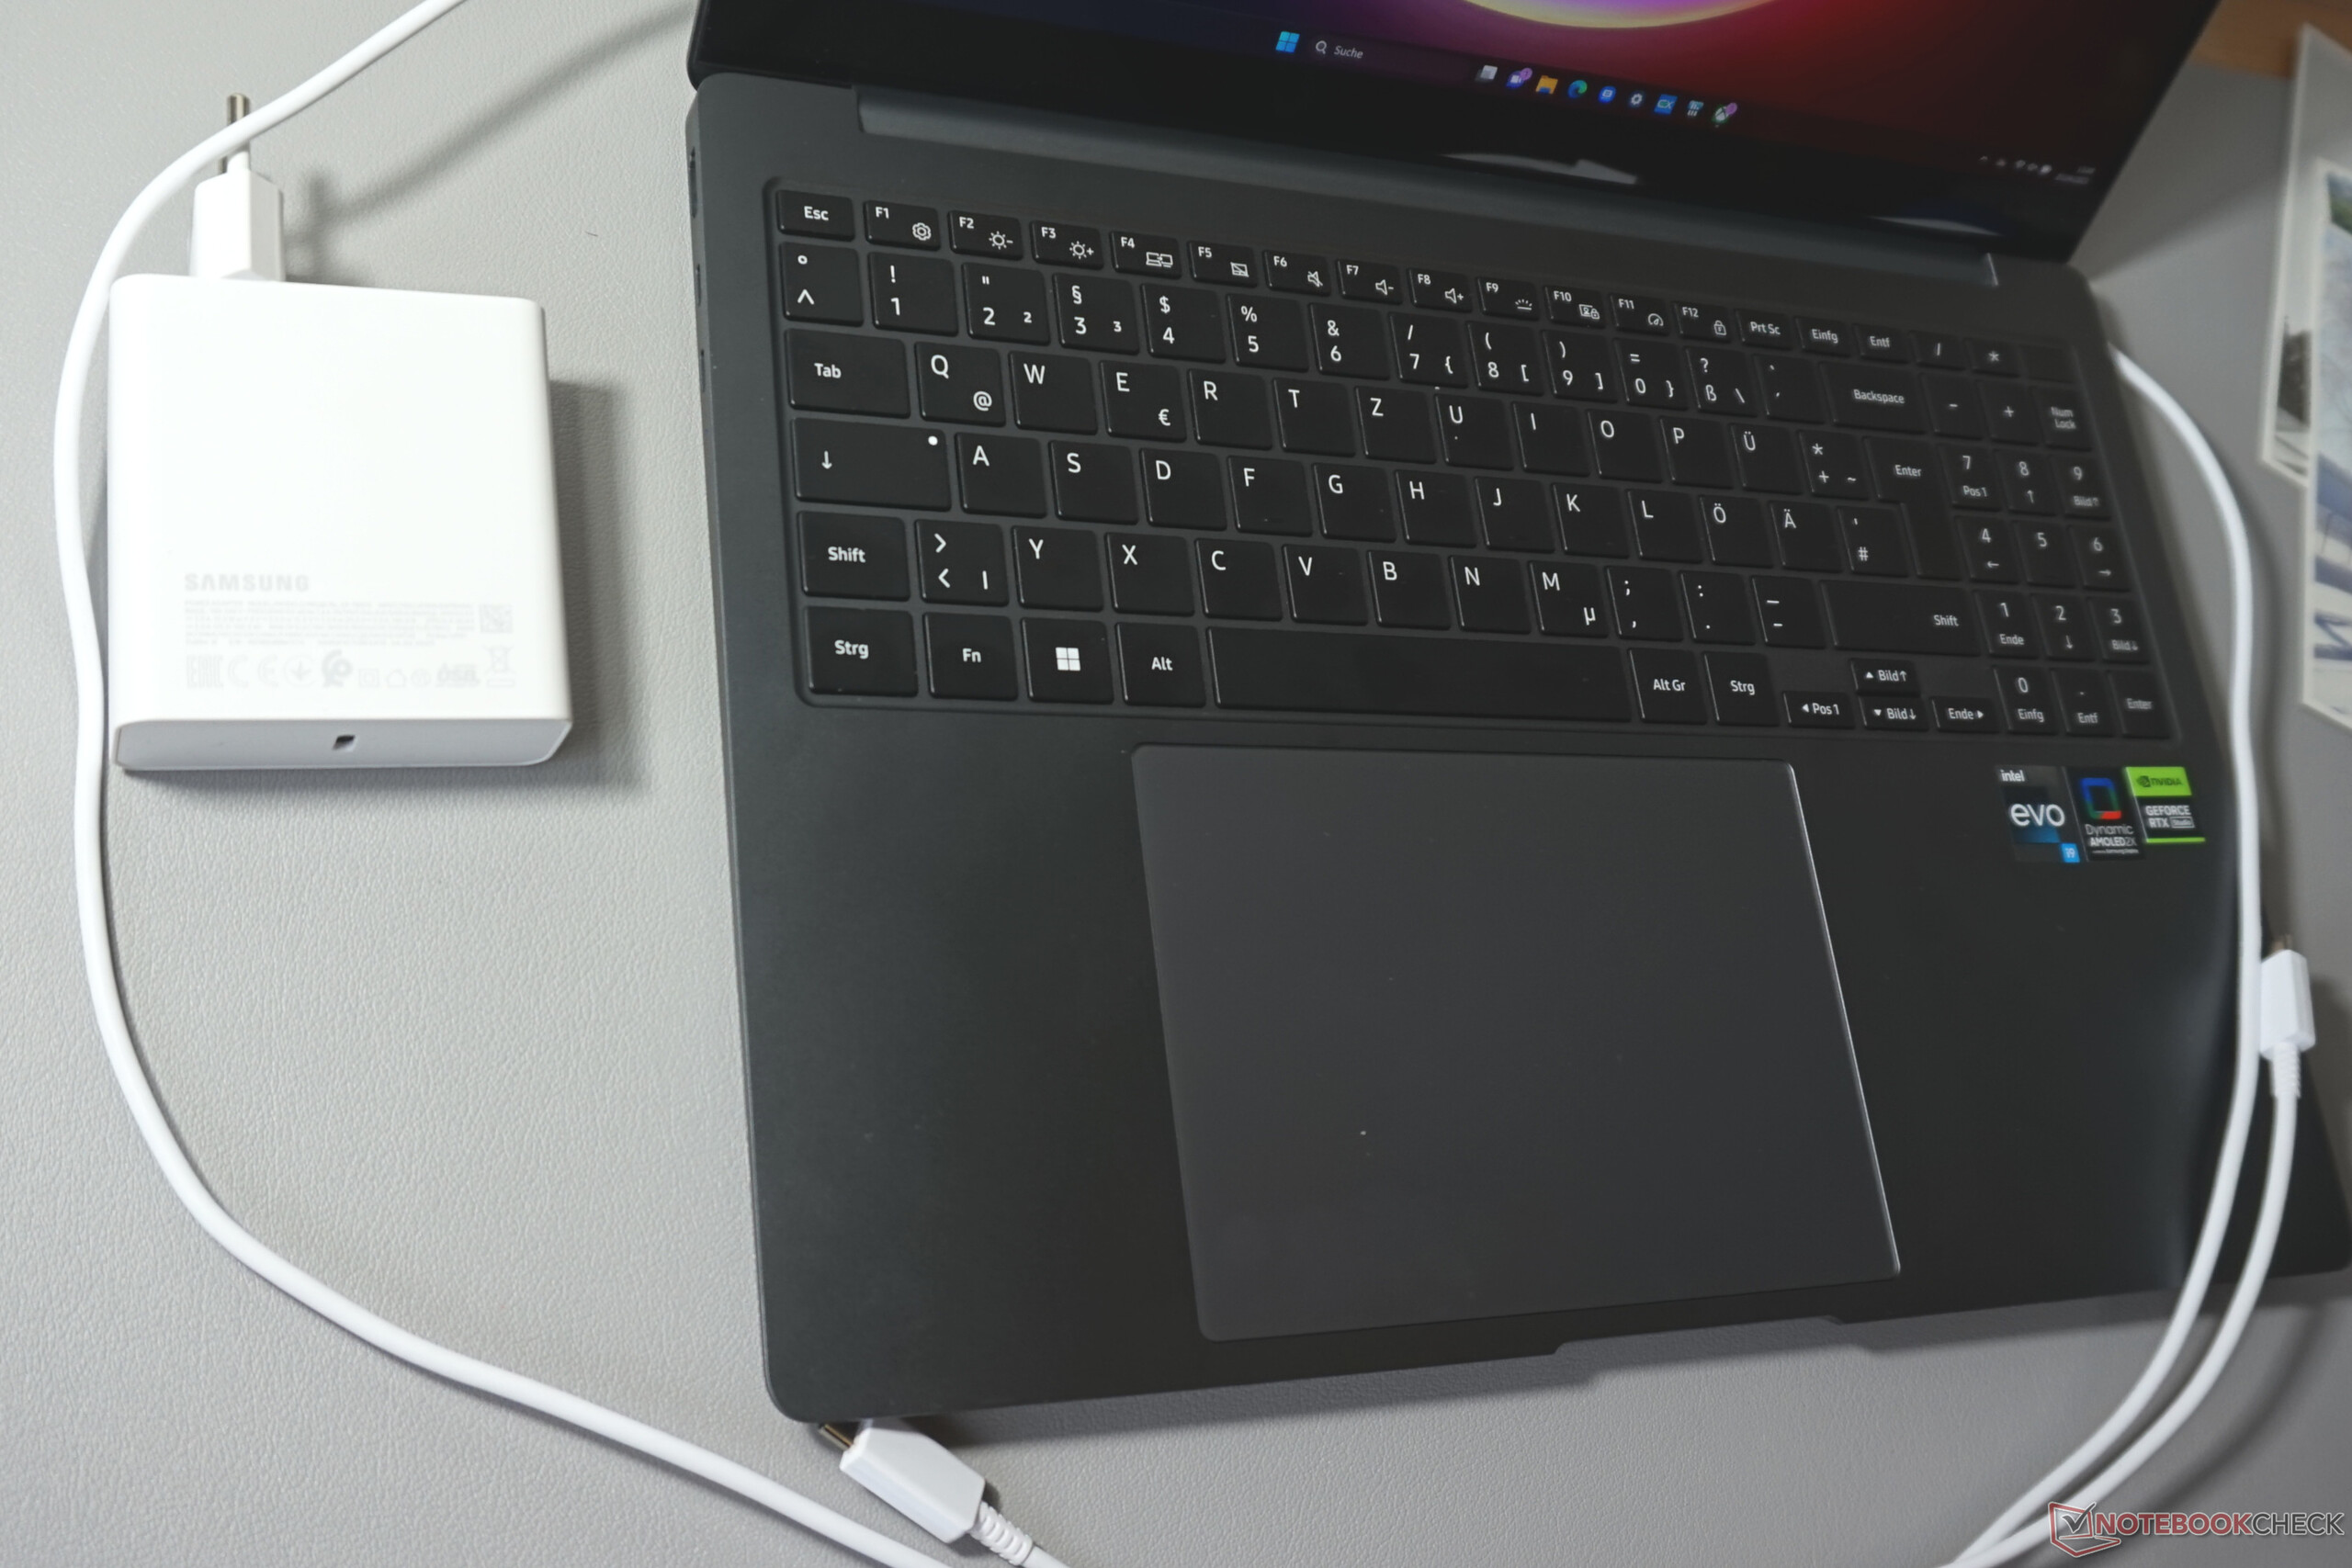
16.8毫米的厚度(我们的测量值)是难以超越的。考虑到强大的硬件,这个测量值就更加引人注目了。在这一点上,Galaxy Book3 Ultra在重量上也相当克制。
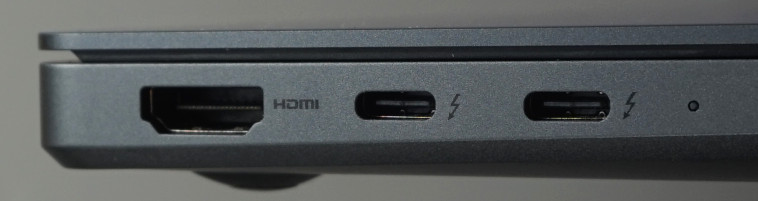
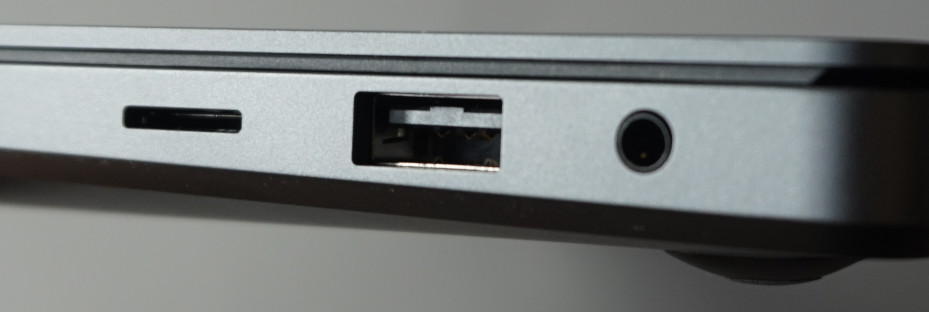
设备--两个TB4,其他不多
端口的范围和数量似乎是最低限度的,但它们与同样最低限度的案例相匹配。至少最重要的都在船上。有一个HDMI端口,旁边有两个Thunderbolt 4端口,所以所有的视频输出都是紧挨着的。还有一个卡槽,一个用于鼠标或打印机的USB-A和一个音频插孔。
端口的范围和数量似乎很简约,但它们与同样简约的外壳相匹配。至少最重要的都在机身上。有一个HDMI端口,旁边有两个Thunderbolt 4端口,所以所有的视频输出都是紧挨着的。还有一个卡槽,一个用于鼠标或打印机的USB-A和音频插孔。
SD卡阅读器
通过我们的AV PRO microSD 128 GB V60参考卡的传输速度并不令人惊讶。大多数竞争对手也达到了80MB/s左右。这款 Gigabyte AERO 16和戴尔的XPS 15 9530显示,在这里可以做得更好。这在复制一张充满的卡时可以节省几分钟,但不会更多。
| SD Card Reader | |
| average JPG Copy Test (av. of 3 runs) | |
| Gigabyte AERO 16 OLED BSF | |
| Dell XPS 15 9530 RTX 4070 (Toshiba Exceria Pro SDXC 64 GB UHS-II) | |
| Average of class Multimedia (23 - 531, n=37, last 2 years) | |
| Samsung Galaxy Book3 Ultra 16, i9-13900H RTX 4070 (AV Pro SD microSD 128 GB V60) | |
| Samsung Galaxy Book3 Ultra 16 (AV PRO microSD 128 GB V60) | |
| Asus ProArt StudioBook 16 H7600ZW (AV PRO microSD 128 GB V60) | |
| MSI Stealth 17 Studio A13VH-014 | |
| maximum AS SSD Seq Read Test (1GB) | |
| Average of class Multimedia (37.3 - 1455, n=36, last 2 years) | |
| Gigabyte AERO 16 OLED BSF | |
| Dell XPS 15 9530 RTX 4070 (Toshiba Exceria Pro SDXC 64 GB UHS-II) | |
| Samsung Galaxy Book3 Ultra 16, i9-13900H RTX 4070 (AV Pro SD microSD 128 GB V60) | |
| Samsung Galaxy Book3 Ultra 16 (AV PRO microSD 128 GB V60) | |
| Asus ProArt StudioBook 16 H7600ZW (AV PRO microSD 128 GB V60) | |
| MSI Stealth 17 Studio A13VH-014 | |
沟通
缺少一个LAN端口也不一定会被错过。至少在路由器附近,三星Galaxy Book3在没有电缆的情况下传输速度超过1Gbit/s。我们的测量值属于多媒体笔记本和使用的英特尔AX211 WLAN模块的平均范围。
只有当通过Wi-Fi 6E在6GHz上传输时,尽管反复测试,该模块仍未达到预期速率。然而,在接收时并没有出现这种情况,所以我们可以排除硬件错误。
网络摄像头
对于这样一台紧凑的笔记本电脑,全高清网络摄像头提供了相当不错的效果。在光线充足的情况下,图像看起来很优质。没有观察到颜色偏差或图像噪音。只有在光线较弱的房间或黄昏时才会出现图像噪音,帧率似乎也会下降。
当涉及到视频电话的适用性时,双阵列麦克风的表现足够好。它能从不同的方向和不同的距离上捕捉到声音,而音量没有变化。虽然声音在大多数情况下听起来很干净,但有时也会听起来有点失真。然而,这只有在你密切注意的情况下才会明显。


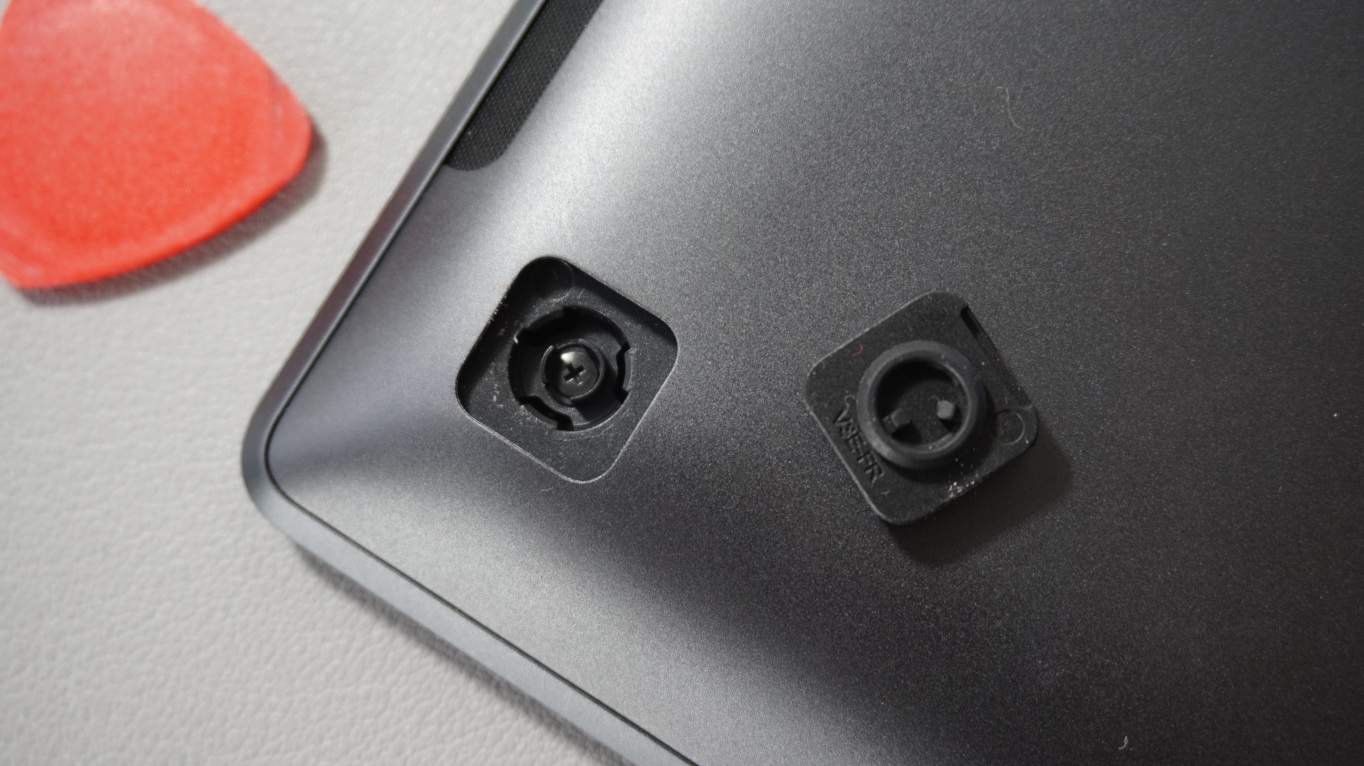
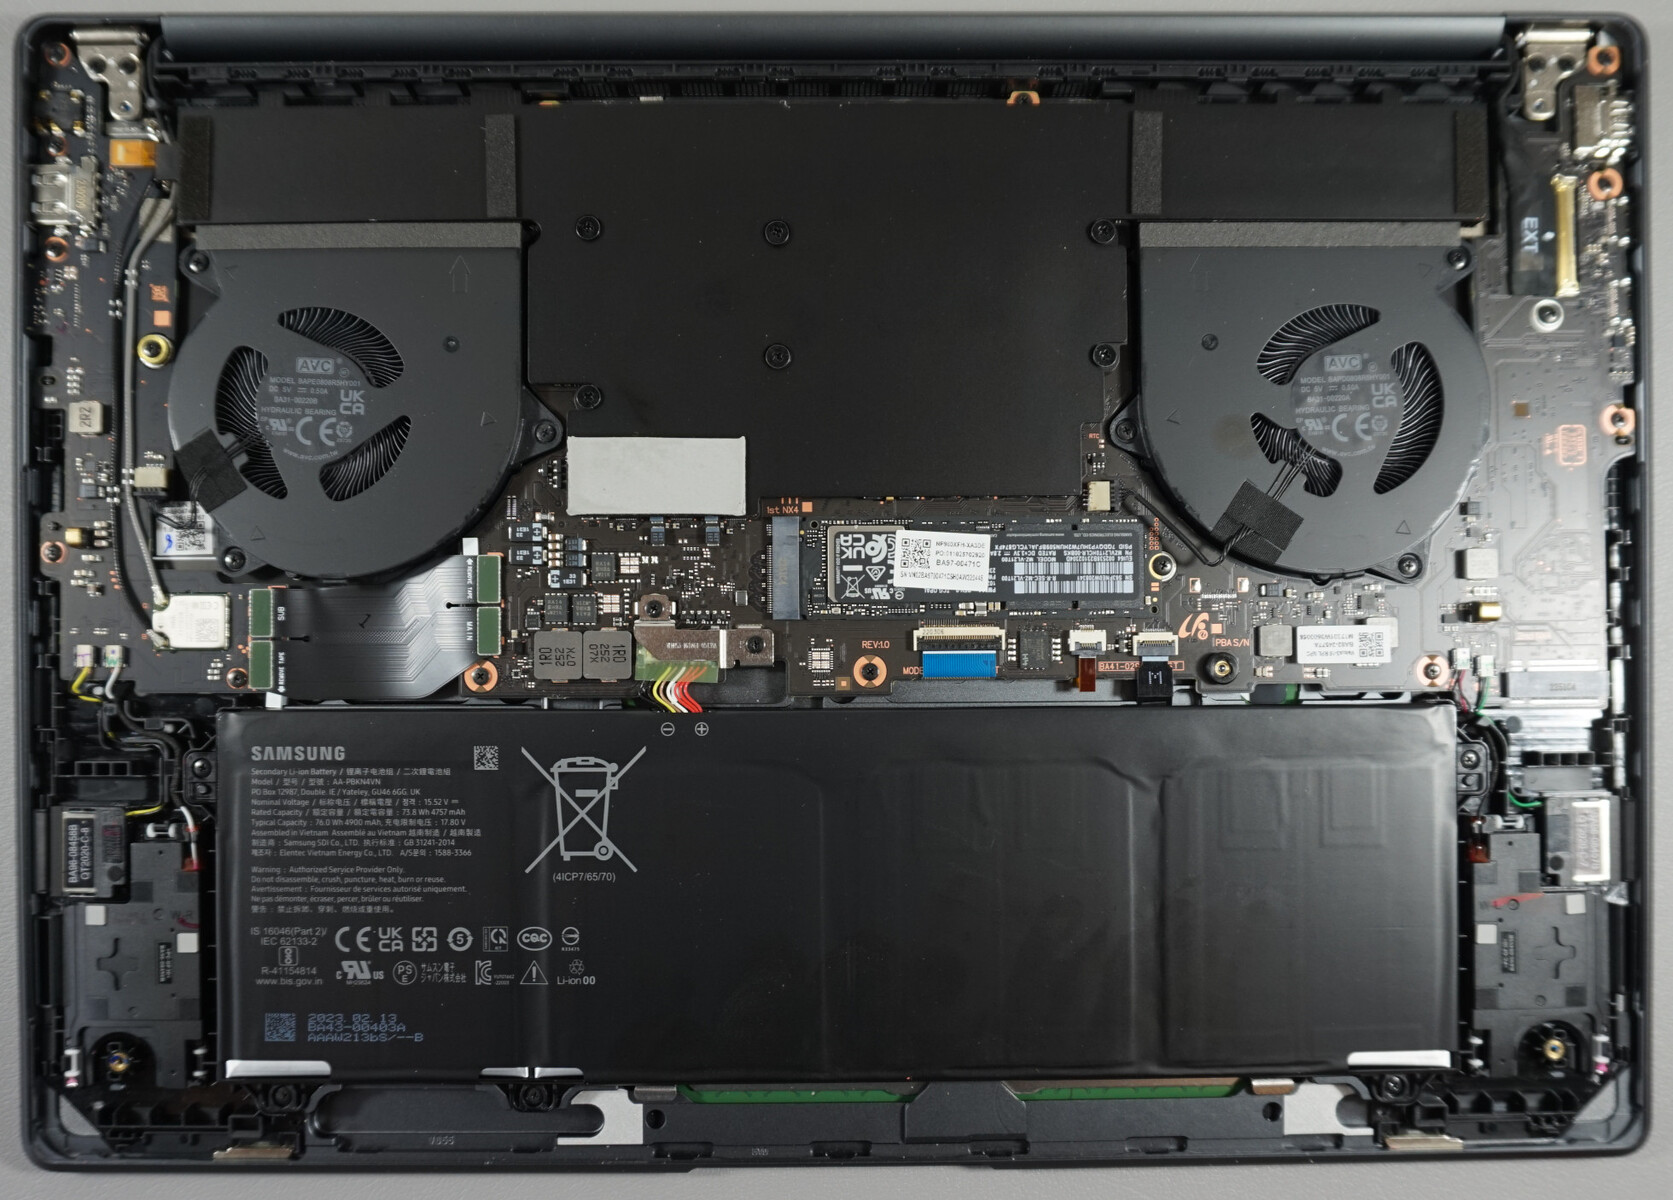
维护
只需拧下四颗十字螺丝就可以拆下底板。这些螺丝位于卡住的橡胶脚下,只要有点技巧,就可以在不损坏的情况下取下。
这使它听起来像一个容易打开的笔记本,但它根本不是。无数的塑料夹子将底板紧紧地固定在那里。在底板的中央还有一个机构,它也通过散热垫与冷却系统相连。该机构只有在完全松开并弯曲底板后才能打开,事实证明,在将笔记本装回原处时也同样复杂。
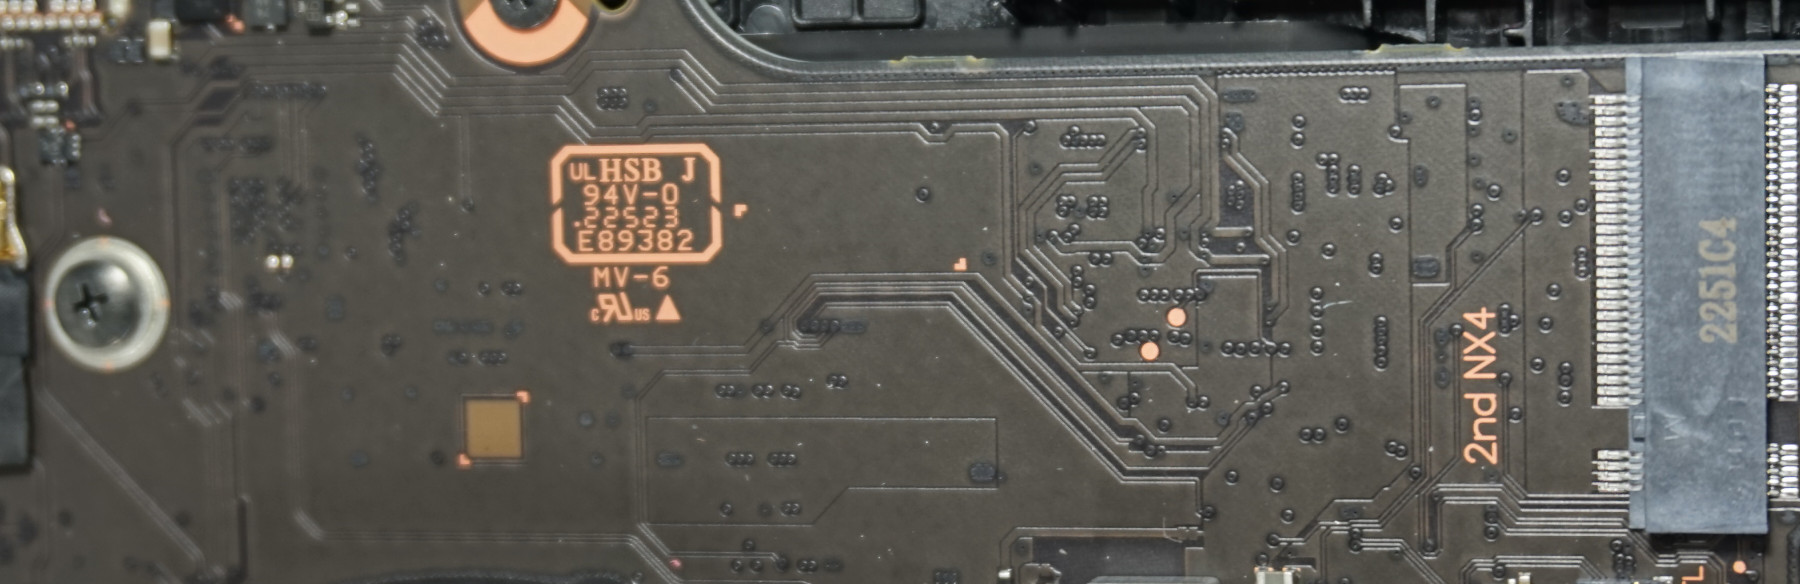
那些有毅力和足够小心不弯曲或打破任何东西的人,会发现一个免费的M.2插槽与PCIe 4用于存储扩展。主要的固态硬盘和电池也可以被换掉。风扇可以很容易地被清洁。
另一方面,内存和WLAN模块是焊接的。总而言之,这几乎不重要,因为三星已经使打开变得非常麻烦了。
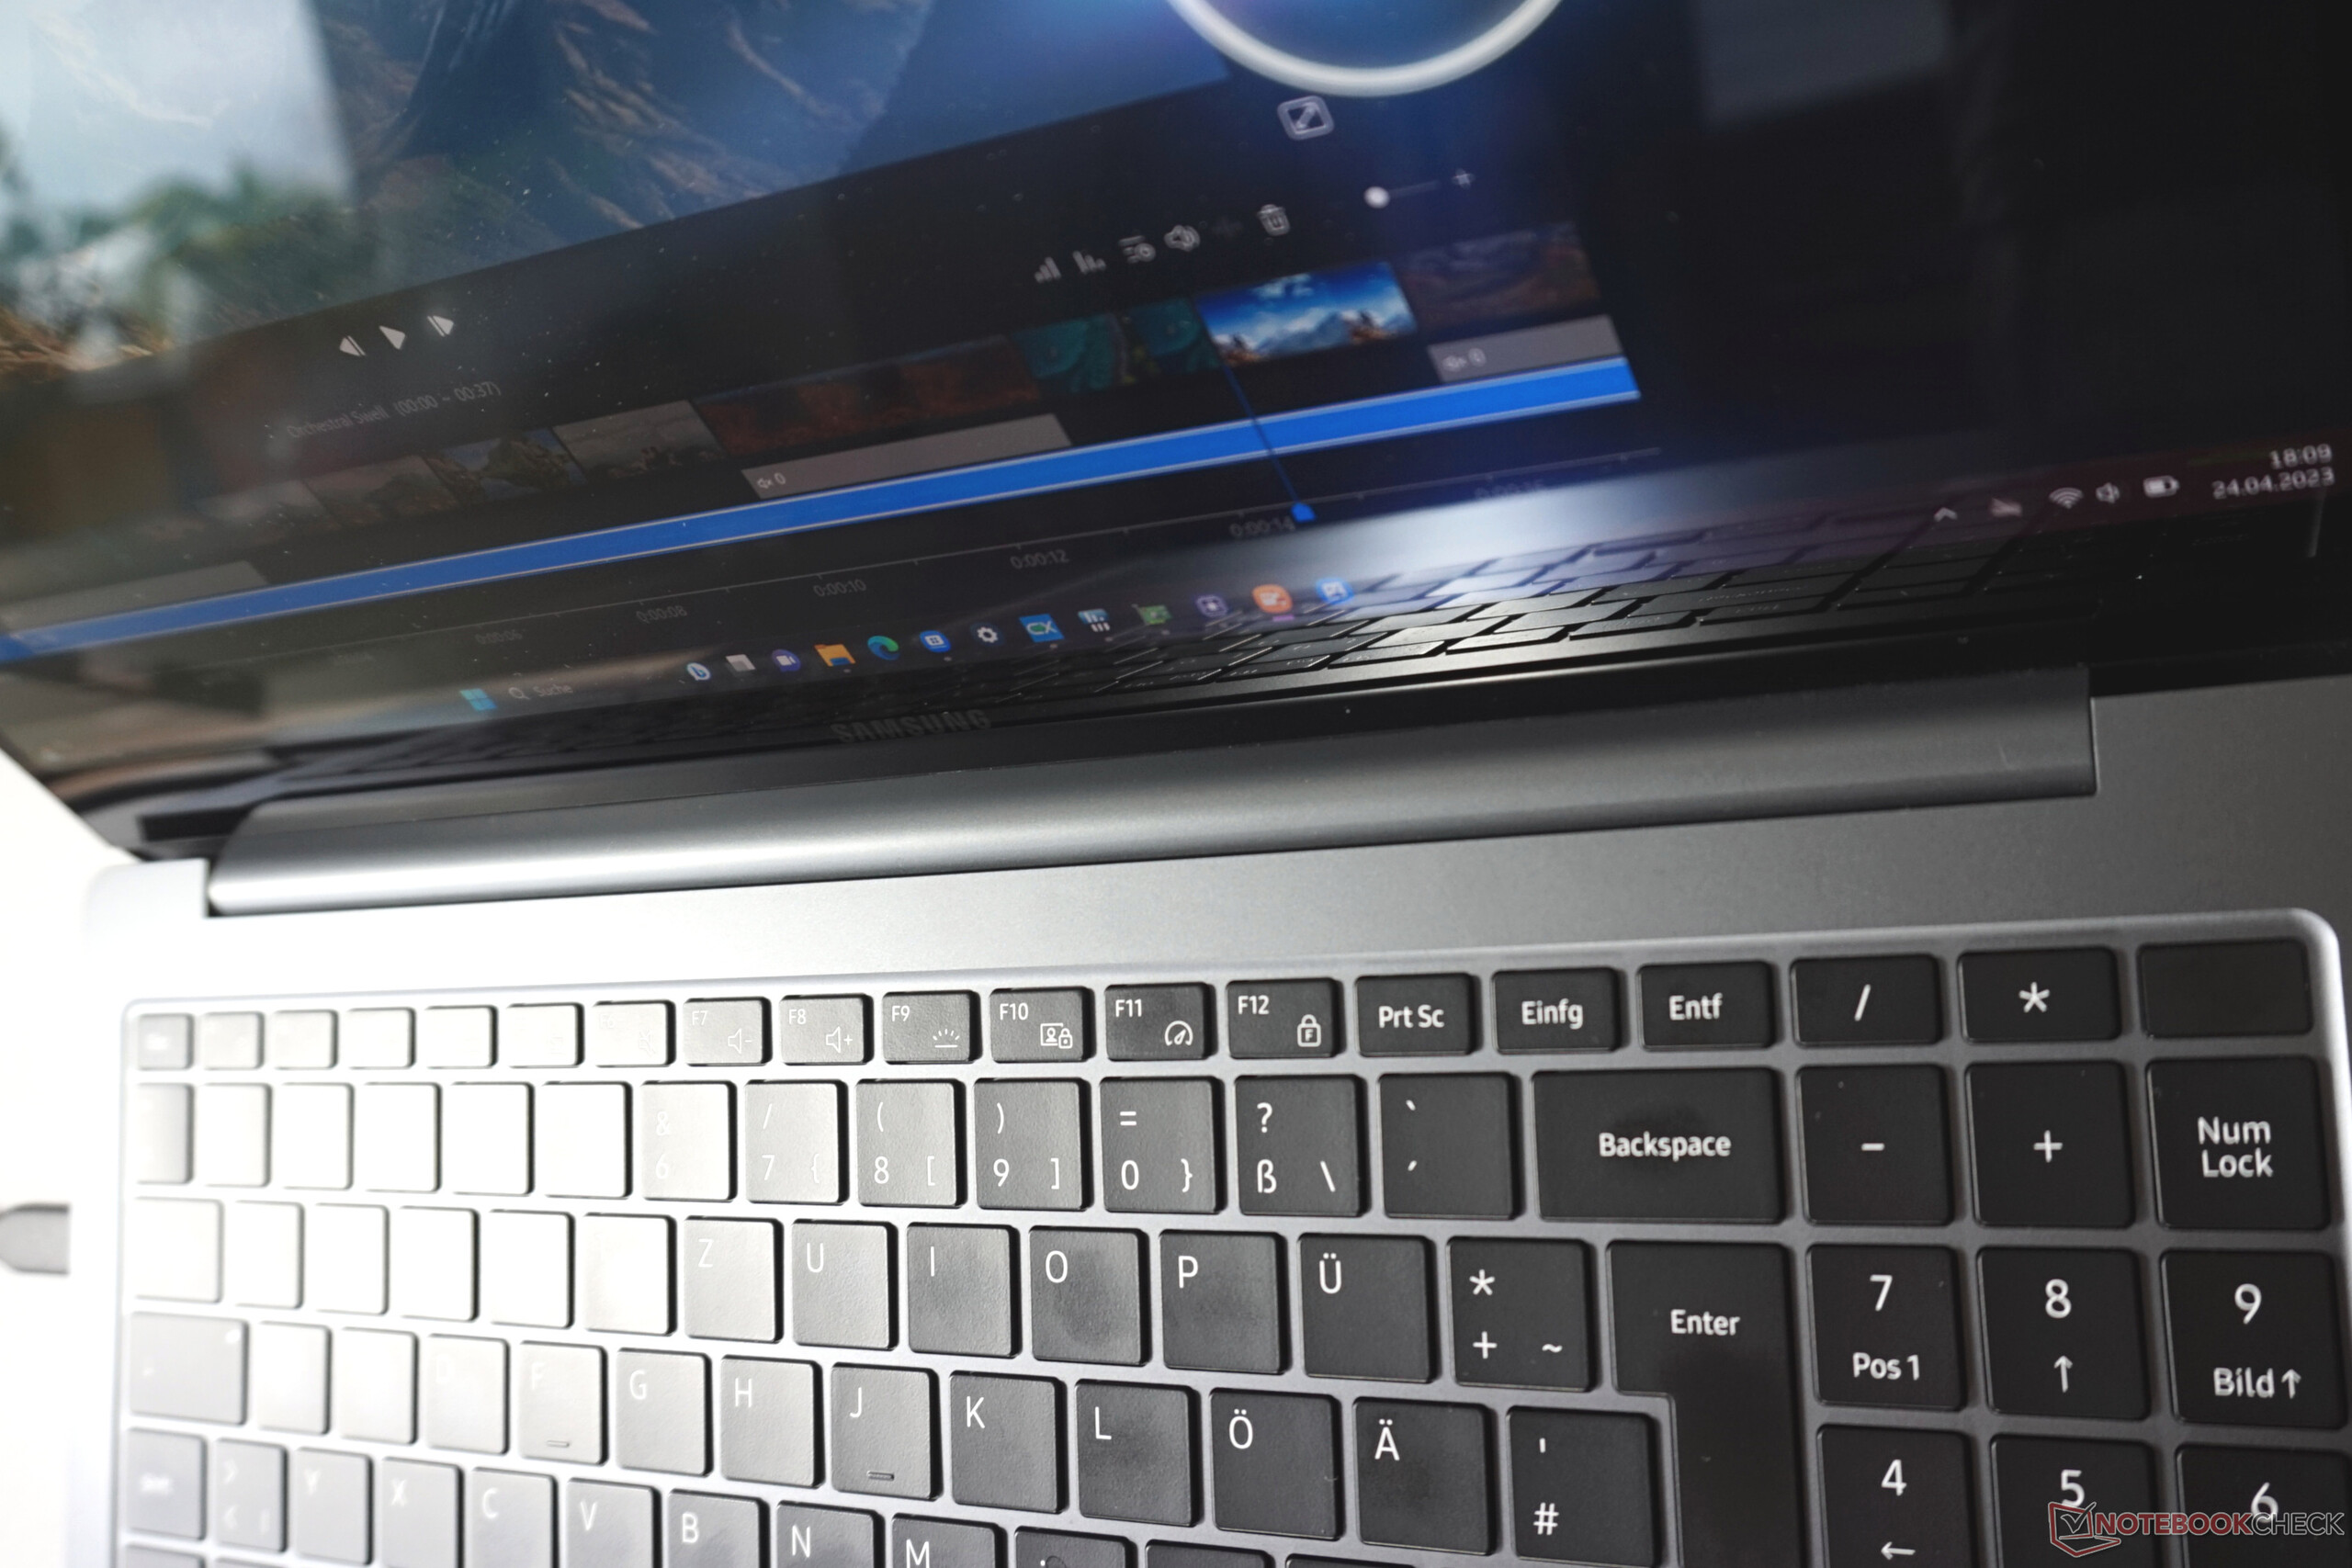
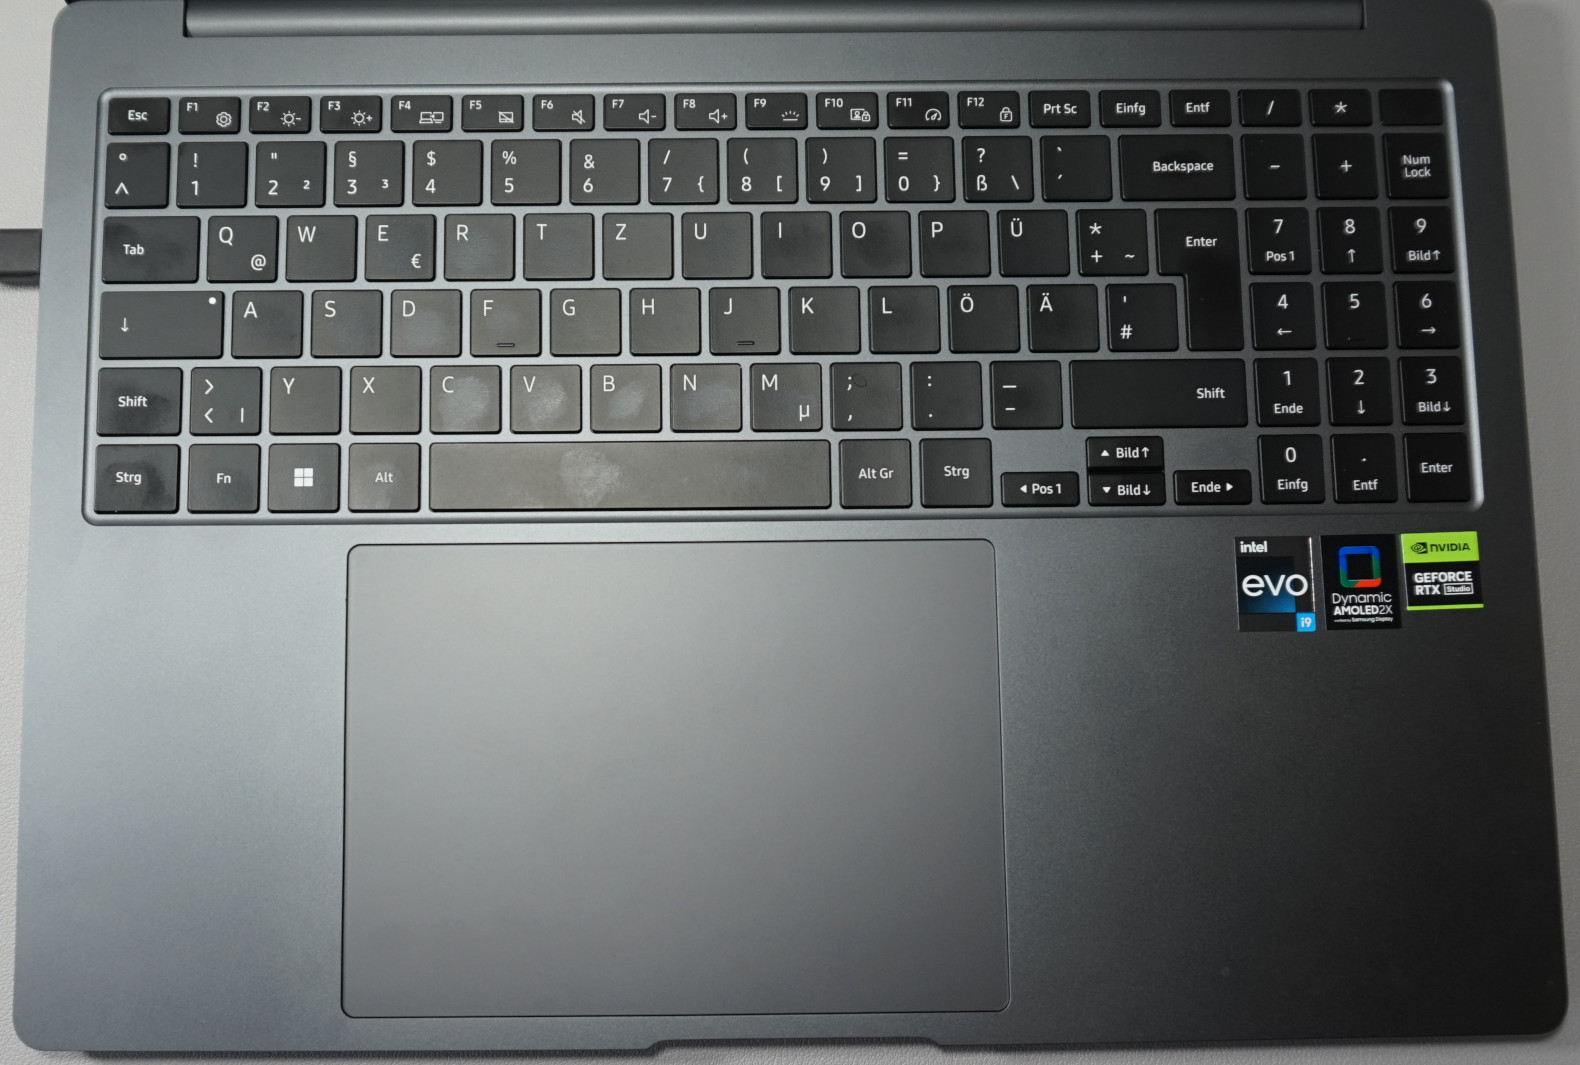
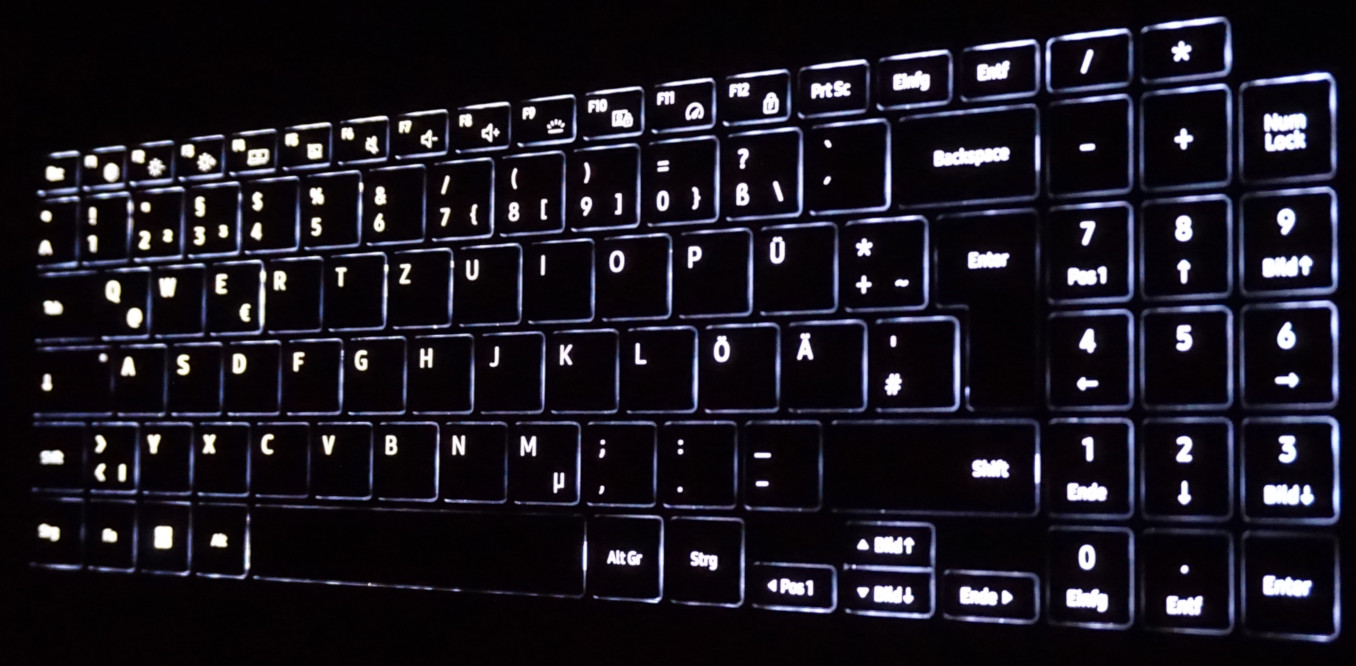
输入设备 - 造物主的笔记本有一个大的额外
笔记本狭小的尺寸没有留下什么发挥的空间,所以键程只有1毫米,但这几乎没有破坏我们对键盘的总体积极印象。防滑的表面结构和令人愉快的坚定的反压力确保了良好的打字动态。三星还很好地利用了16英寸键盘的可用空间。数字块有一个正常的尺寸,由于方向键的空间很小,不用眼睛就能感觉到这些。这当然会使表格工作变得更容易,以及其他一些事情。
然而,最大的亮点是超大的触摸板。它的尺寸为15×10厘米,比一般的商务笔记本大得多。控制很精确,键位分布合理,用几个手指操作也没有问题。然而,这确实需要一定的适应性,因为我们在打字时反复用手拂过触摸板。在大多数情况下,输入是成功的,但有时用两个手指会不精确或无意地输入。
尽管如此,触摸板看起来不错,如果有必要,应该会使额外的鼠标变得过时。
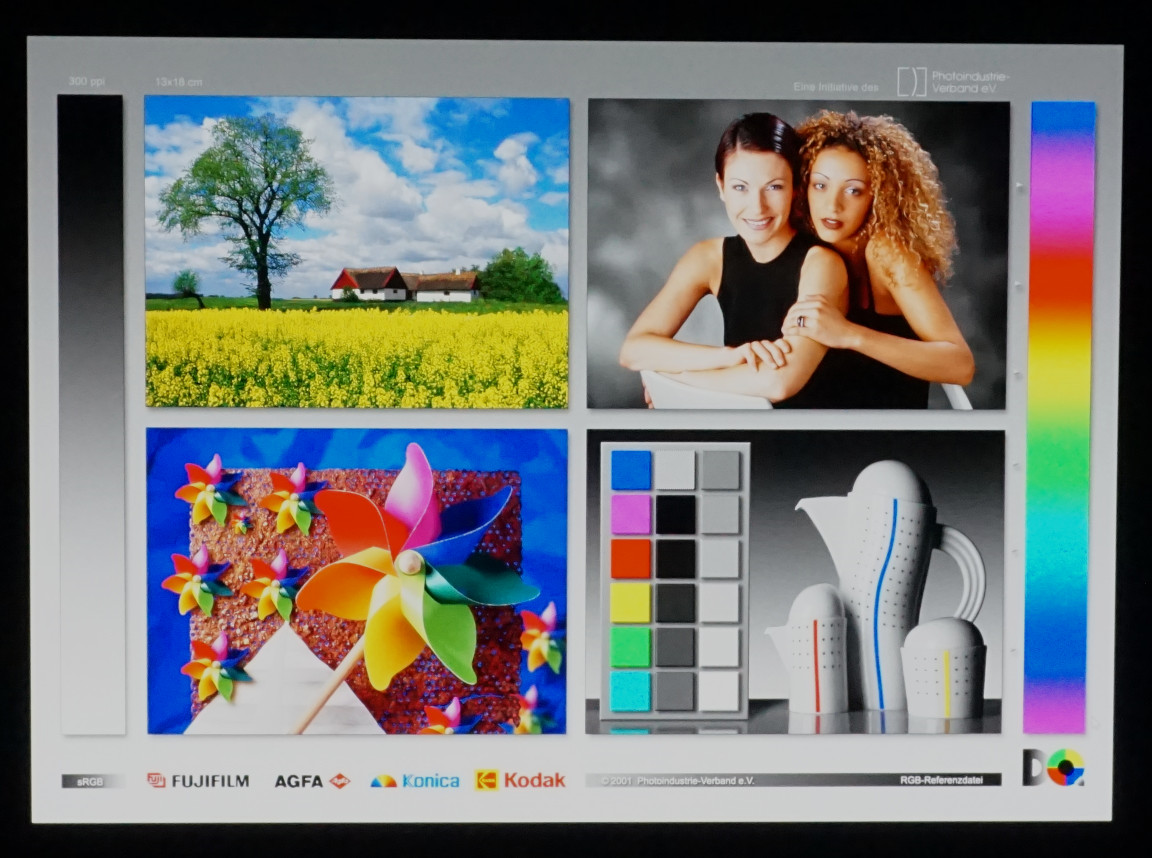
显示屏 -Galaxy Book3 Ultra的OLED和3K显示屏
3K分辨率,在这种情况下意味着2880 x 1,800像素,OLED显示屏,120赫兹和HDR认证很适合笔记本的预期目的。由于有500万像素,高分辨率的数码照片显示得非常好。增加的帧率也符合最佳视频播放和编辑的要求。
除此之外,OLED显示屏也为强大的图像价值做出了自己的贡献。深黑色确保了非常好的对比度,并使色彩显得更加生动。此外,Vesa Display HDR 500认证宣传了HDR内容的最佳再现。光滑的屏幕也有助于实现显示内容的良好表现。在没有表面颗粒感的情况下,图像和视频看起来始终很明亮。然而,你必须接受背景中明亮表面的强烈反射。
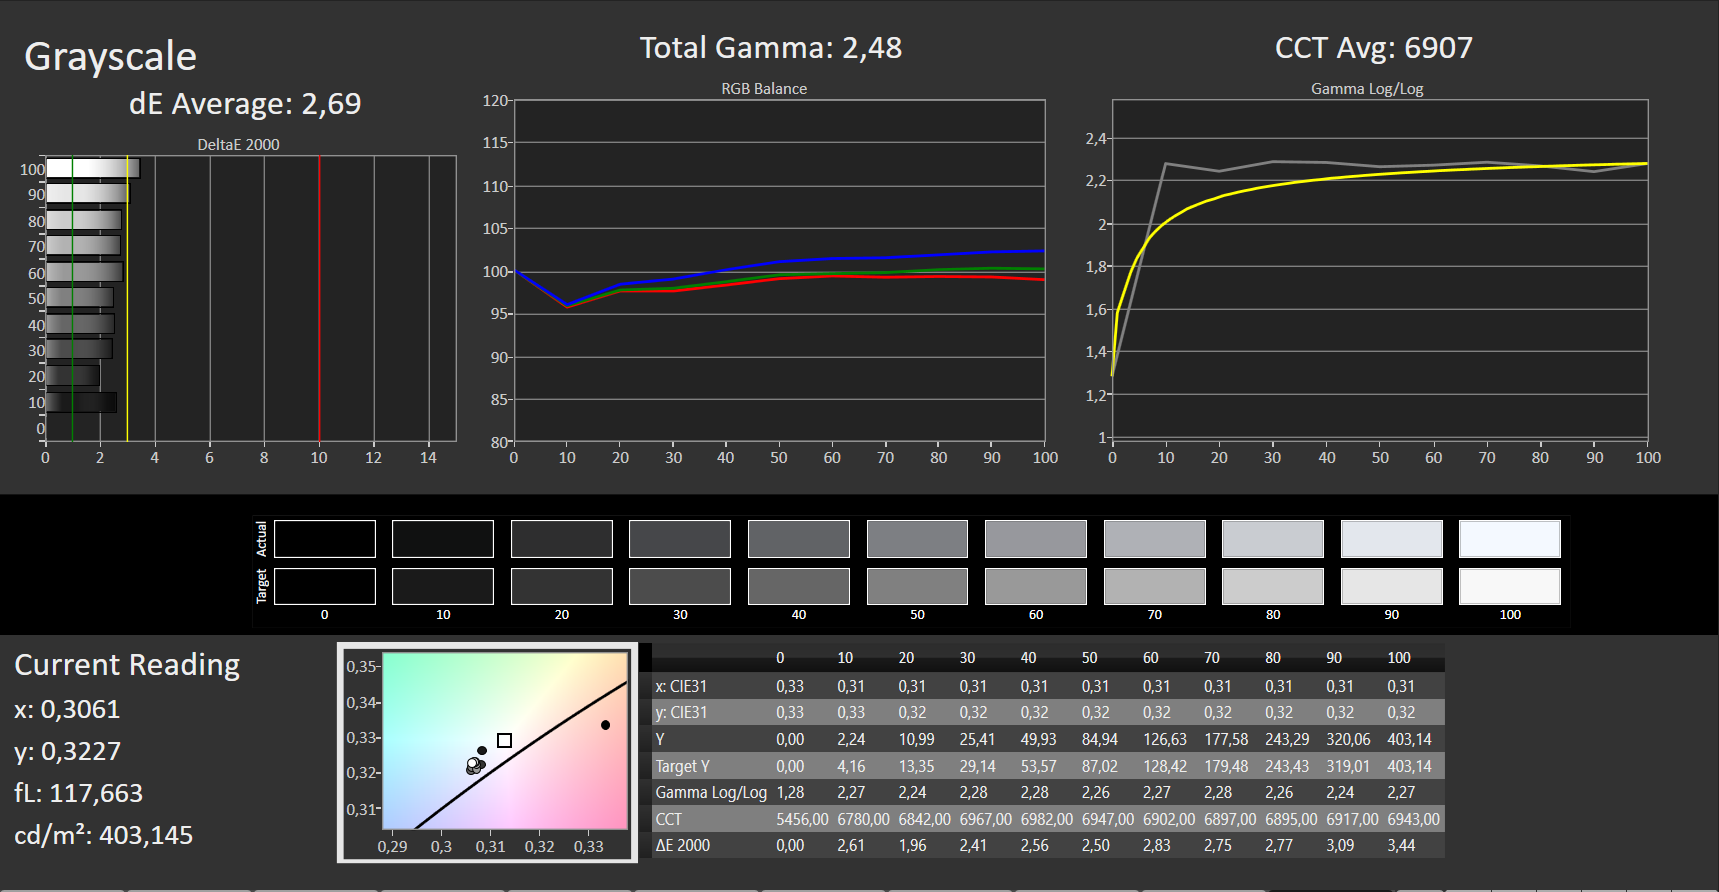
我们测量了408cd/m²的良好平均亮度。采用OLED显示屏的对手设备并没有完全达到这个亮度水平。拔掉电源适配器时,可以观察到轻微的暗淡,但340cd/m²的亮度仍然是可以接受的。
不需要担心屏幕出血的问题。在显示黑色时,自发光的像素会关闭,这导致了面板的完美黑色值。
| |||||||||||||||||||||||||
Brightness Distribution: 98 %
Center on Battery: 343 cd/m²
Contrast: ∞:1 (Black: 0 cd/m²)
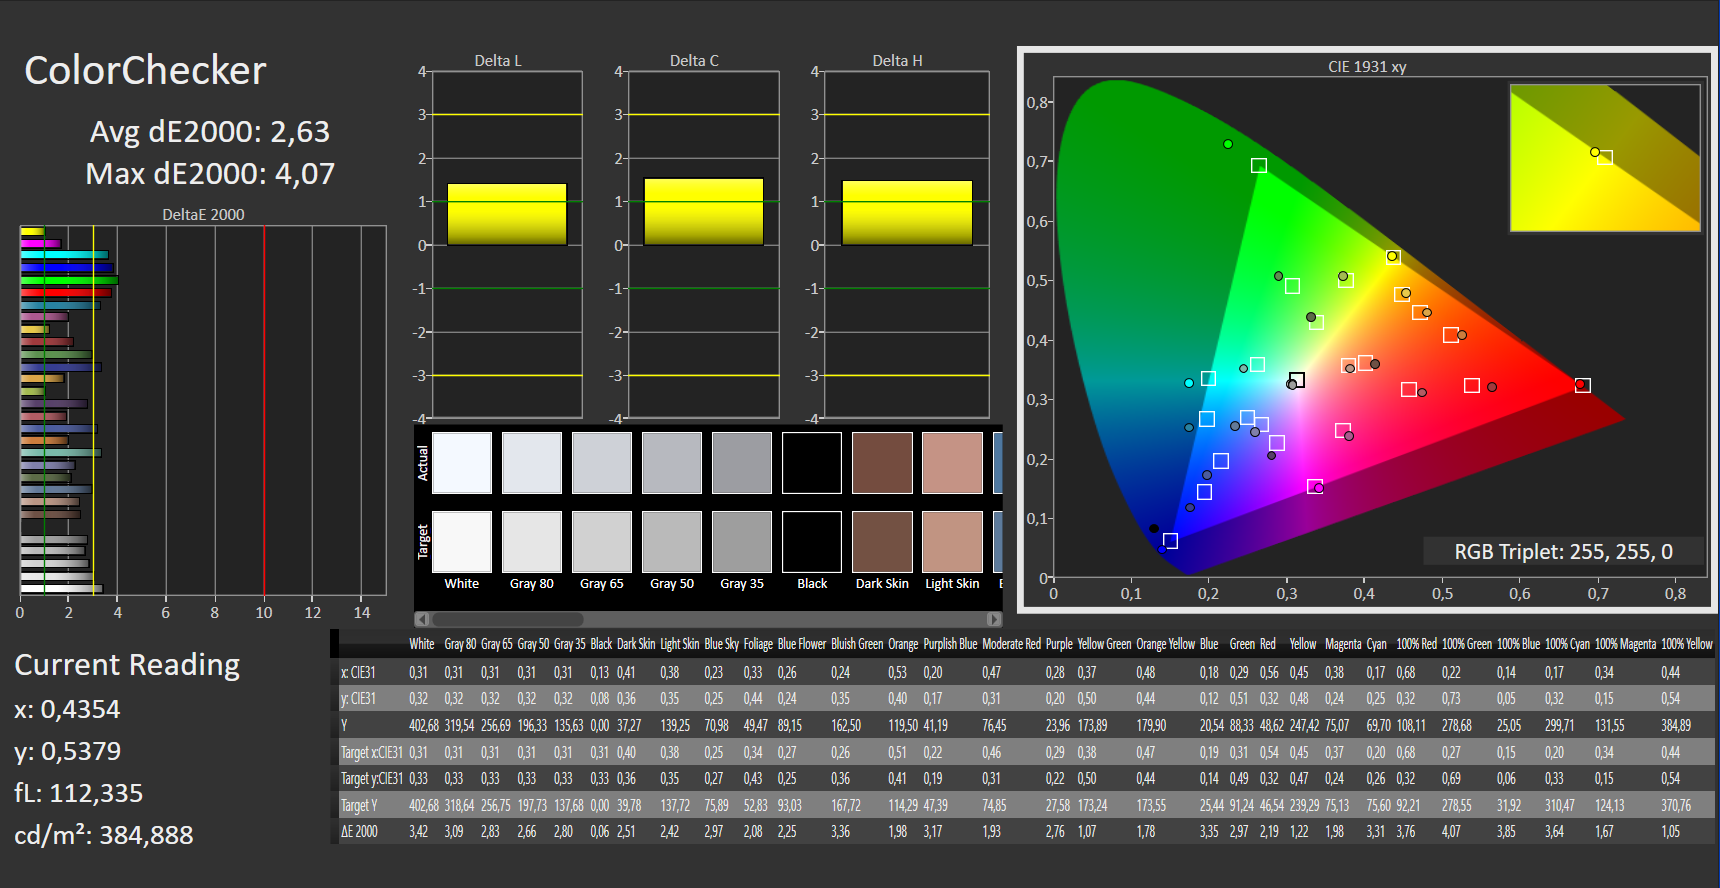
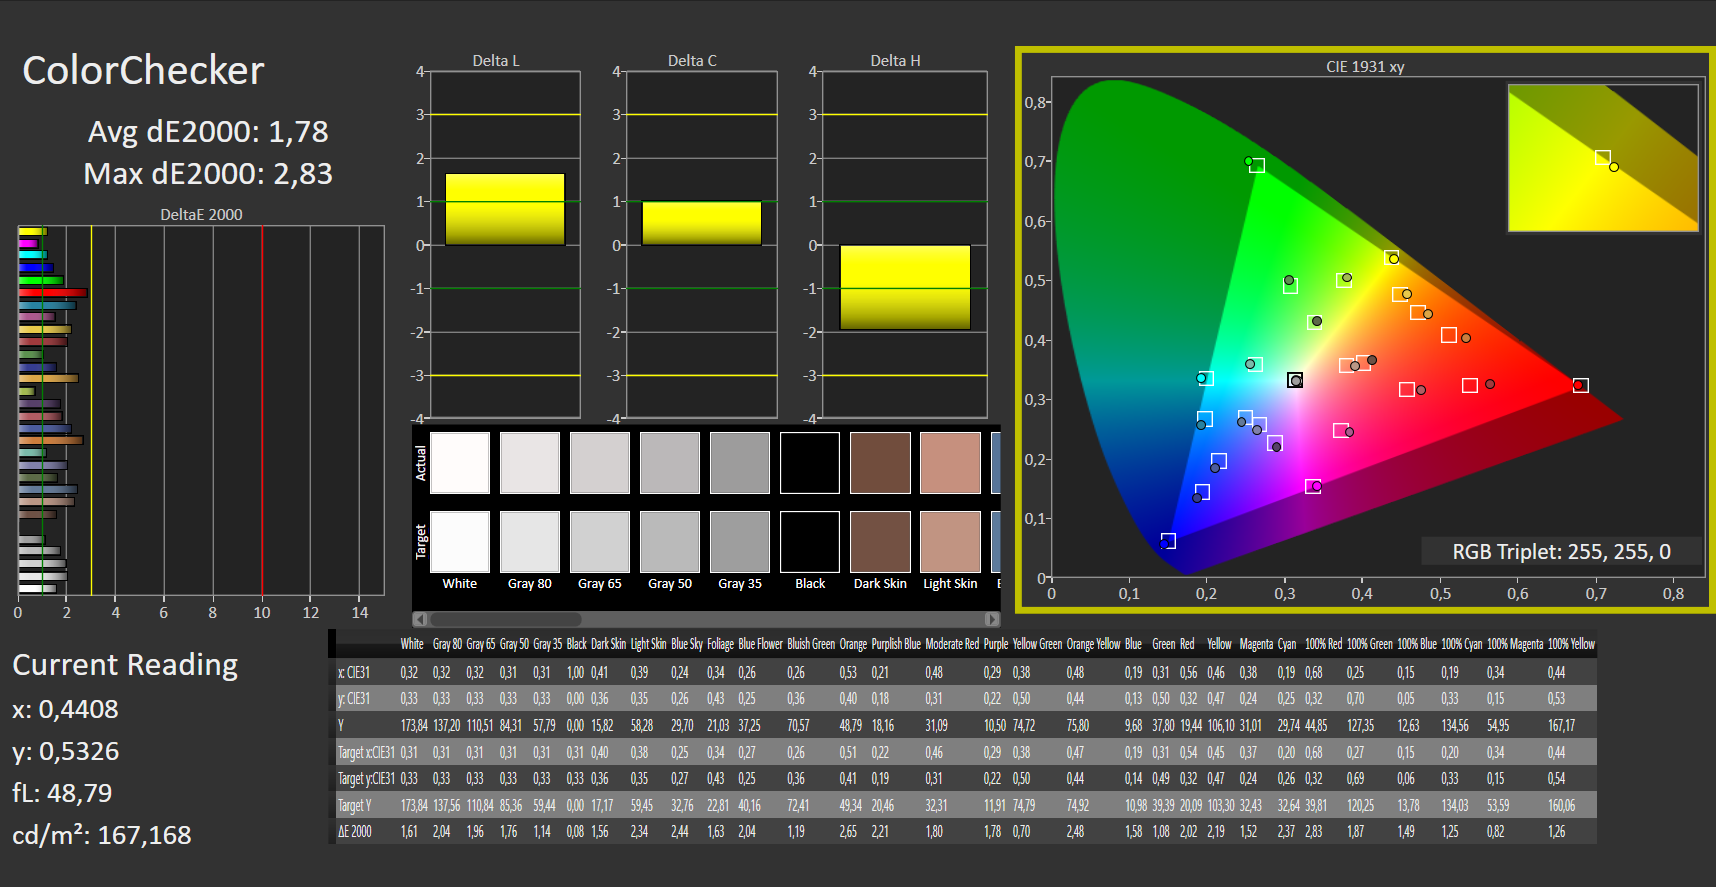
ΔE ColorChecker Calman: 2.63 | ∀{0.5-29.43 Ø4.71}
ΔE Greyscale Calman: 2.69 | ∀{0.09-98 Ø4.96}
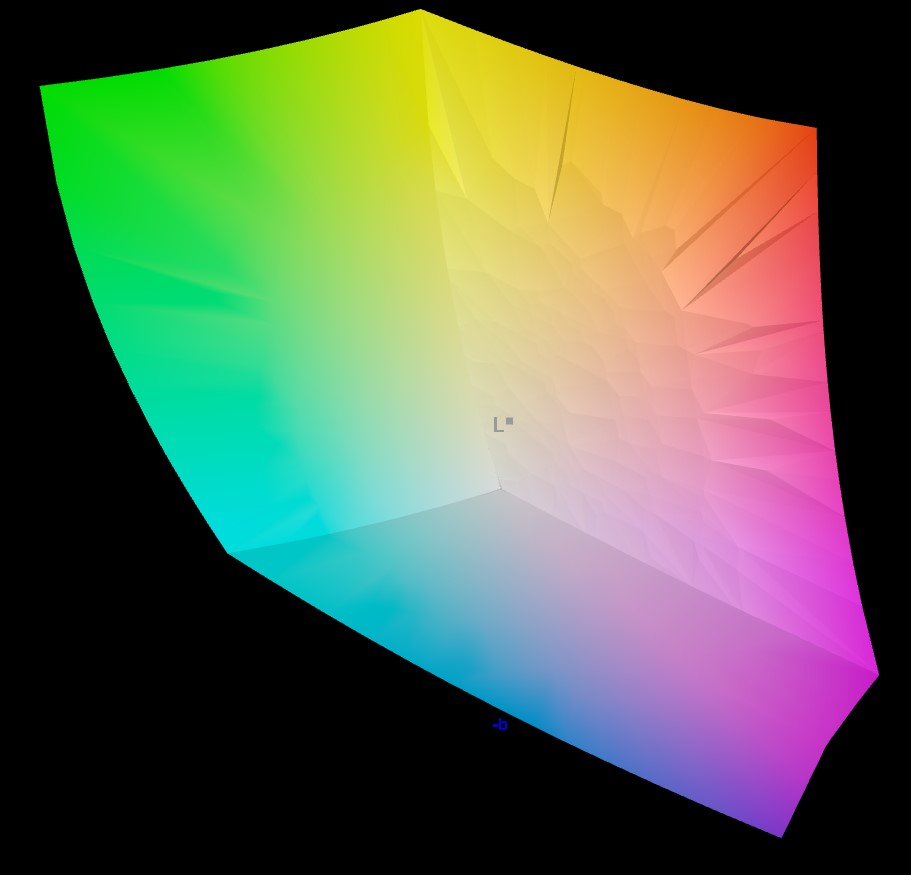
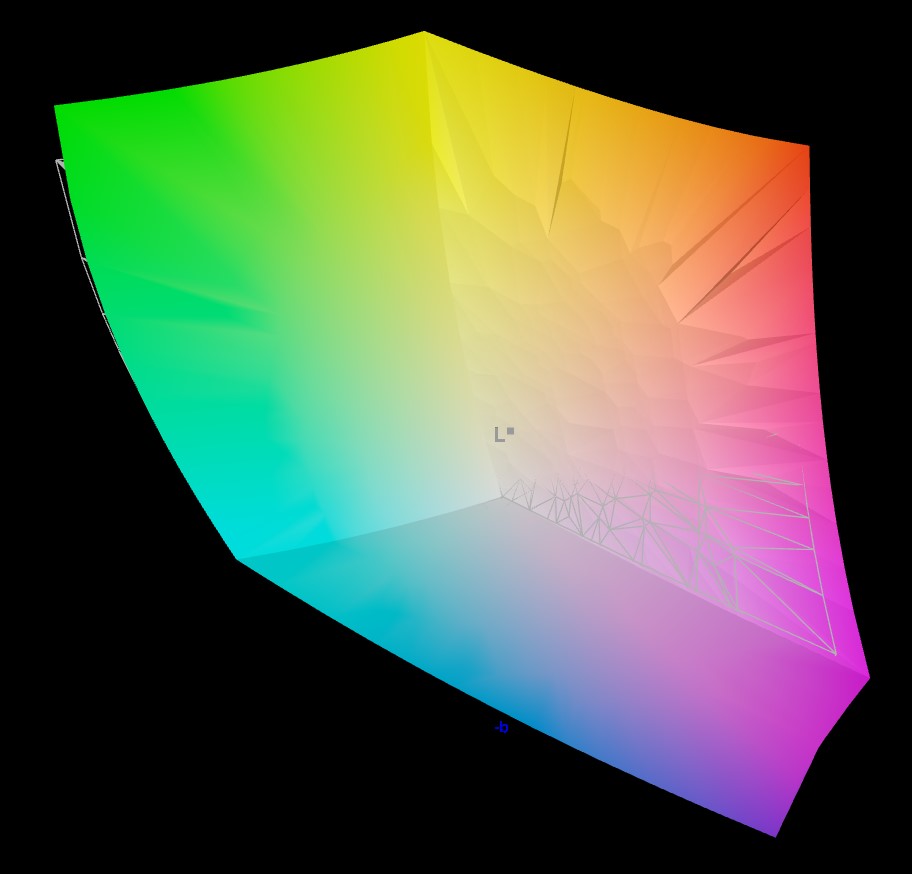
97.4% AdobeRGB 1998 (Argyll 3D)
99.1% sRGB (Argyll 3D)
95.3% Display P3 (Argyll 3D)
Gamma: 2.48
CCT: 6907 K
| Samsung Galaxy Book3 Ultra 16, i9-13900H RTX 4070 Samsung SDC4185 ATNA60CL03-0, OLED / AMOLED, 2880x1800, 16" | Dell XPS 15 9530 RTX 4070 Samsung 156XG01, OLED, 3456x2160, 15.6" | MSI Stealth 17 Studio A13VH-014 AUO41A2 B173ZAN06.C, Mini LED, 3840x2160, 17.3" | Asus ProArt StudioBook 16 H7600ZW Samsung ATNA60YV02, OLED, 3840x2400, 16" | Gigabyte AERO 16 OLED BSF Samsung SDC4191 (ATNA60YV09-0, OLED, 3840x2400, 16" | Samsung Galaxy Book3 Ultra 16 Samsung ATNA60CL03-0, AMOLED, 2880x1800, 16" | |
|---|---|---|---|---|---|---|
| Display | 2% | -2% | 2% | 2% | 2% | |
| Display P3 Coverage (%) | 95.3 | 99.8 5% | 92 -3% | 99.6 5% | 99.9 5% | 99.9 5% |
| sRGB Coverage (%) | 99.1 | 100 1% | 99.1 0% | 100 1% | 100 1% | 100 1% |
| AdobeRGB 1998 Coverage (%) | 97.4 | 98.4 1% | 94.07 -3% | 96.5 -1% | 96.4 -1% | 96.3 -1% |
| Response Times | 10% | -1076% | -398% | 1% | 71% | |
| Response Time Grey 50% / Grey 80% * (ms) | 2 ? | 1.68 ? 16% | 46.4 ? -2220% | 1.6 ? 20% | 2 ? -0% | 0.49 ? 75% |
| Response Time Black / White * (ms) | 2 ? | 1.94 ? 3% | 0.62 ? 69% | 18.32 ? -816% | 1.98 ? 1% | 0.65 ? 67% |
| PWM Frequency (Hz) | 250 ? | 239 | 2400 | 60 ? | 60 | 240 ? |
| Screen | -30% | -1% | -8% | 6% | 1% | |
| Brightness middle (cd/m²) | 403 | 389.5 -3% | 397.29 -1% | 370 -8% | 389.97 -3% | 400 -1% |
| Brightness (cd/m²) | 408 | 392 -4% | 392 -4% | 374 -8% | 395 -3% | 399 -2% |
| Brightness Distribution (%) | 98 | 98 0% | 93 -5% | 98 0% | 97 -1% | 93 -5% |
| Black Level * (cd/m²) | 0.02 | 0.03 | 0.03 | |||
| Colorchecker dE 2000 * | 2.63 | 4.95 -88% | 2.52 4% | 2.97 -13% | 2 24% | 2.3 13% |
| Colorchecker dE 2000 max. * | 4.07 | 8.65 -113% | 3.91 4% | 4.38 -8% | 4.1 -1% | 4.15 -2% |
| Greyscale dE 2000 * | 2.69 | 2 26% | 2.78 -3% | 2.9 -8% | 2.23 17% | 2.7 -0% |
| Gamma | 2.48 89% | 2.27 97% | 2.63 84% | 2.13 103% | 2.41 91% | 2.266 97% |
| CCT | 6907 94% | 6265 104% | 6412 101% | 6636 98% | 6323 103% | 7047 92% |
| Colorchecker dE 2000 calibrated * | 1.53 | 2.52 | 2.15 | 1.68 | 1.66 | |
| Contrast (:1) | 19865 | 12999 | 13333 | |||
| Total Average (Program / Settings) | -6% /
-14% | -360% /
-197% | -135% /
-76% | 3% /
4% | 25% /
14% |
* ... smaller is better
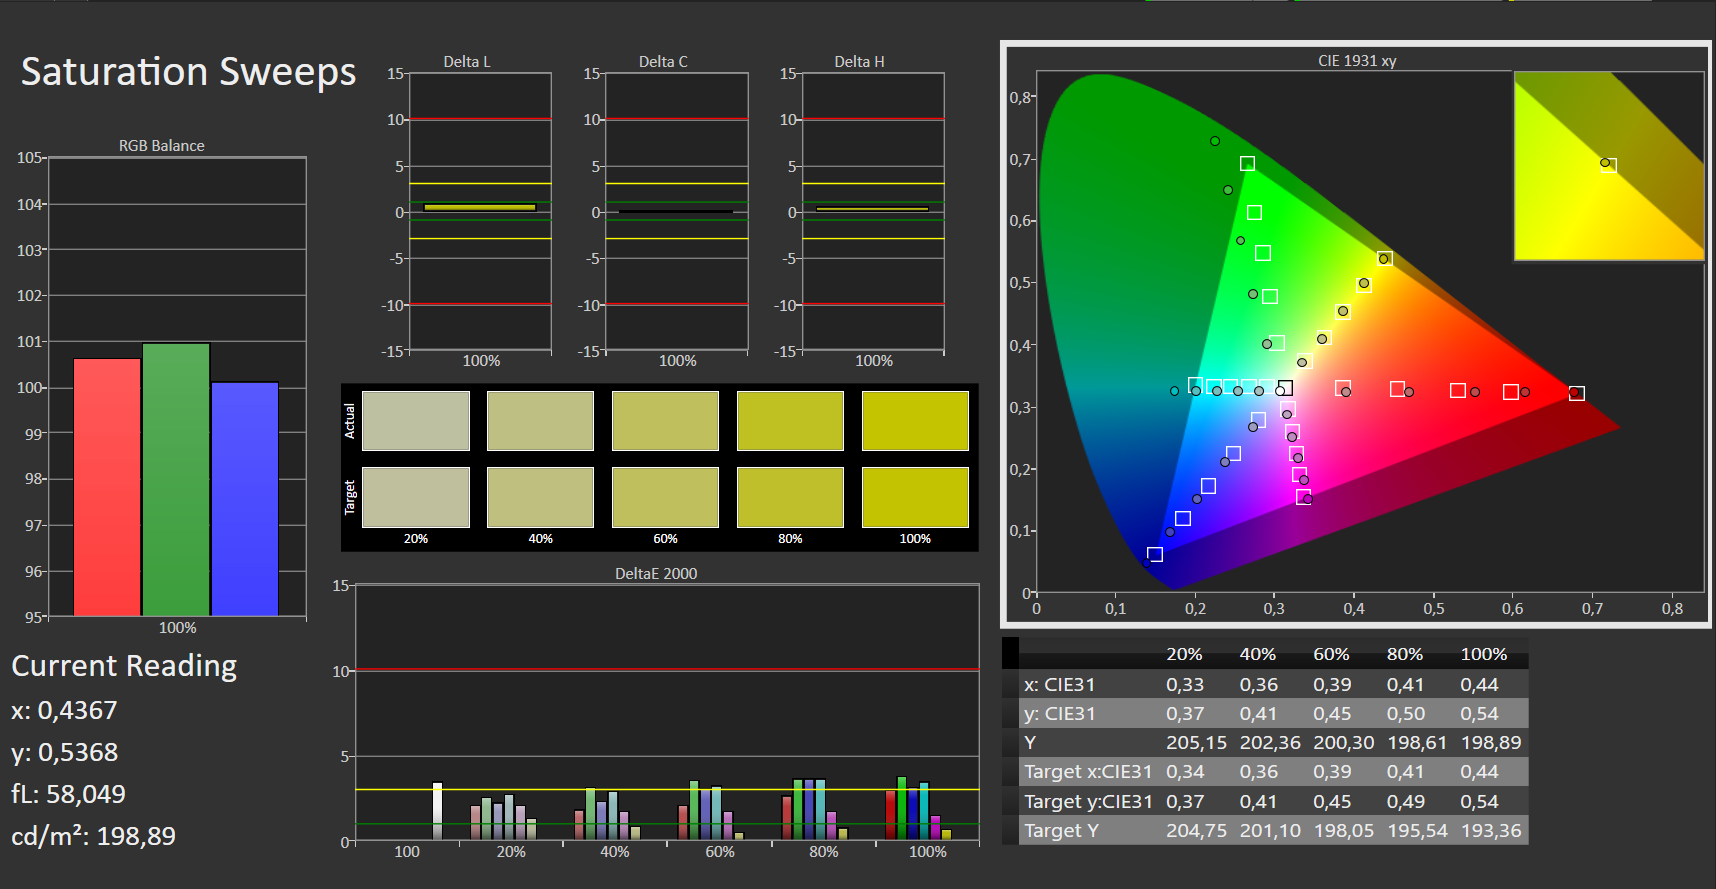
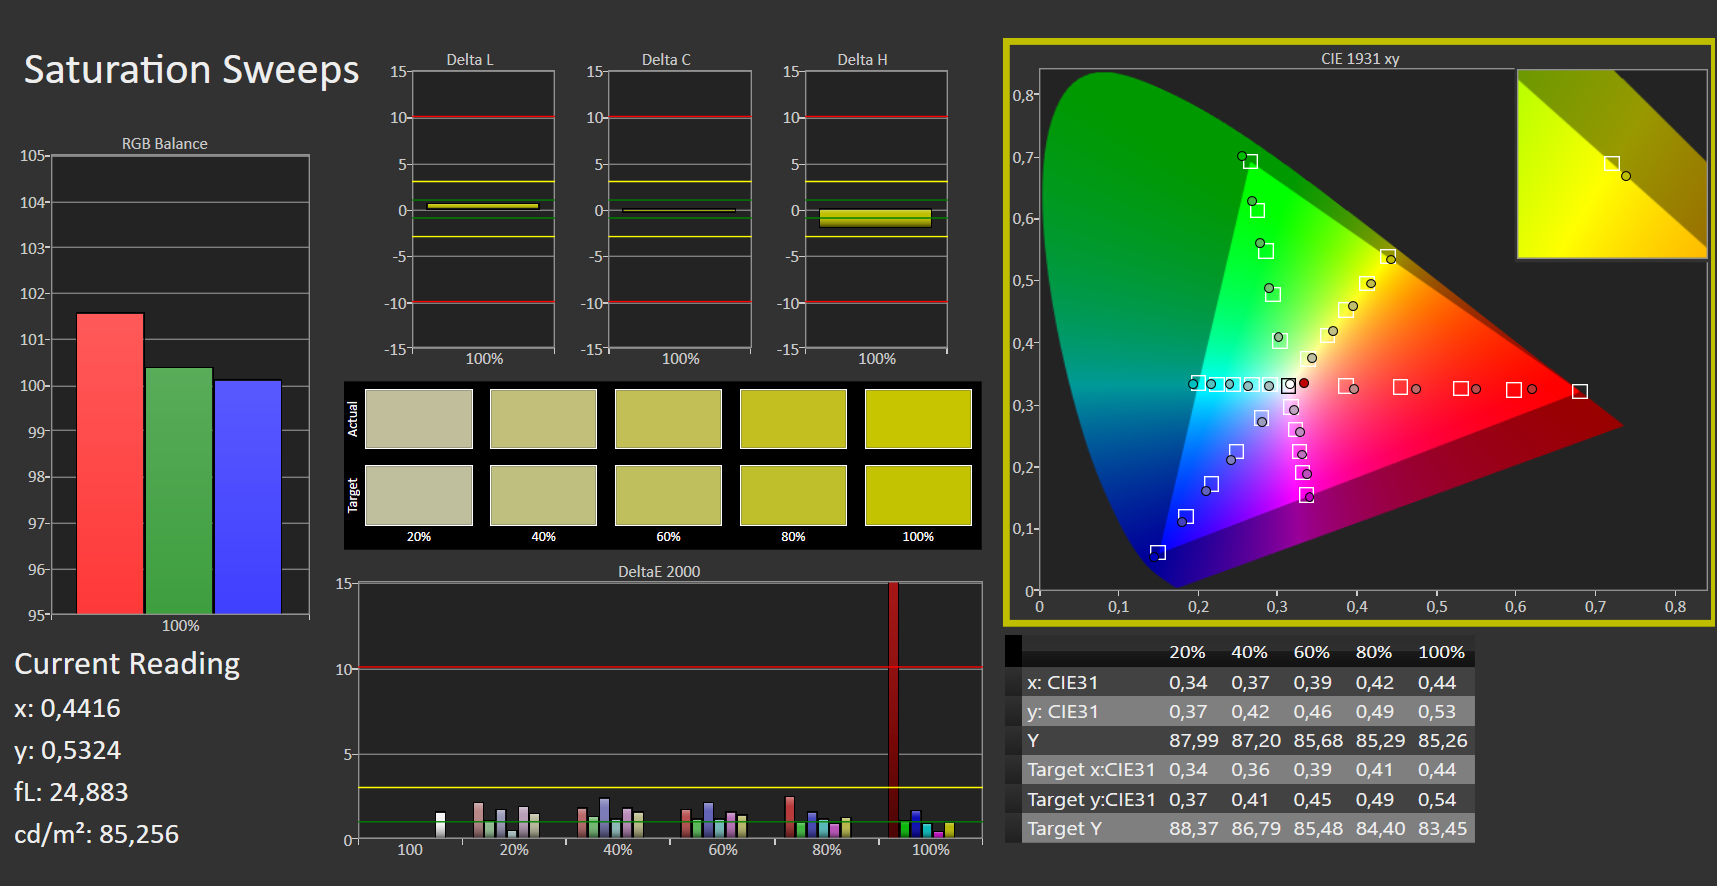
显示器的P3色彩空间,通常用于专业的视频编辑,不能相当完美地再现。OLED显示屏不能完全显示所需的黄色和橙色色调。事实上,三星指定120%的覆盖率是因为它根本包括了在色彩空间中根本不存在的颜色。
另一方面,在所列竞争者中,我们测得的AdobeRGB覆盖率是最好的之一,而AdobeRGB主要用于专业图像编辑。只有同样配备了三星OLED显示屏的戴尔XPS 9530表现得更好一些。
然而,由于我们几乎总是在sRGB色彩空间中工作,该显示器完全适用于媒体创作和编辑,无需进一步校准。

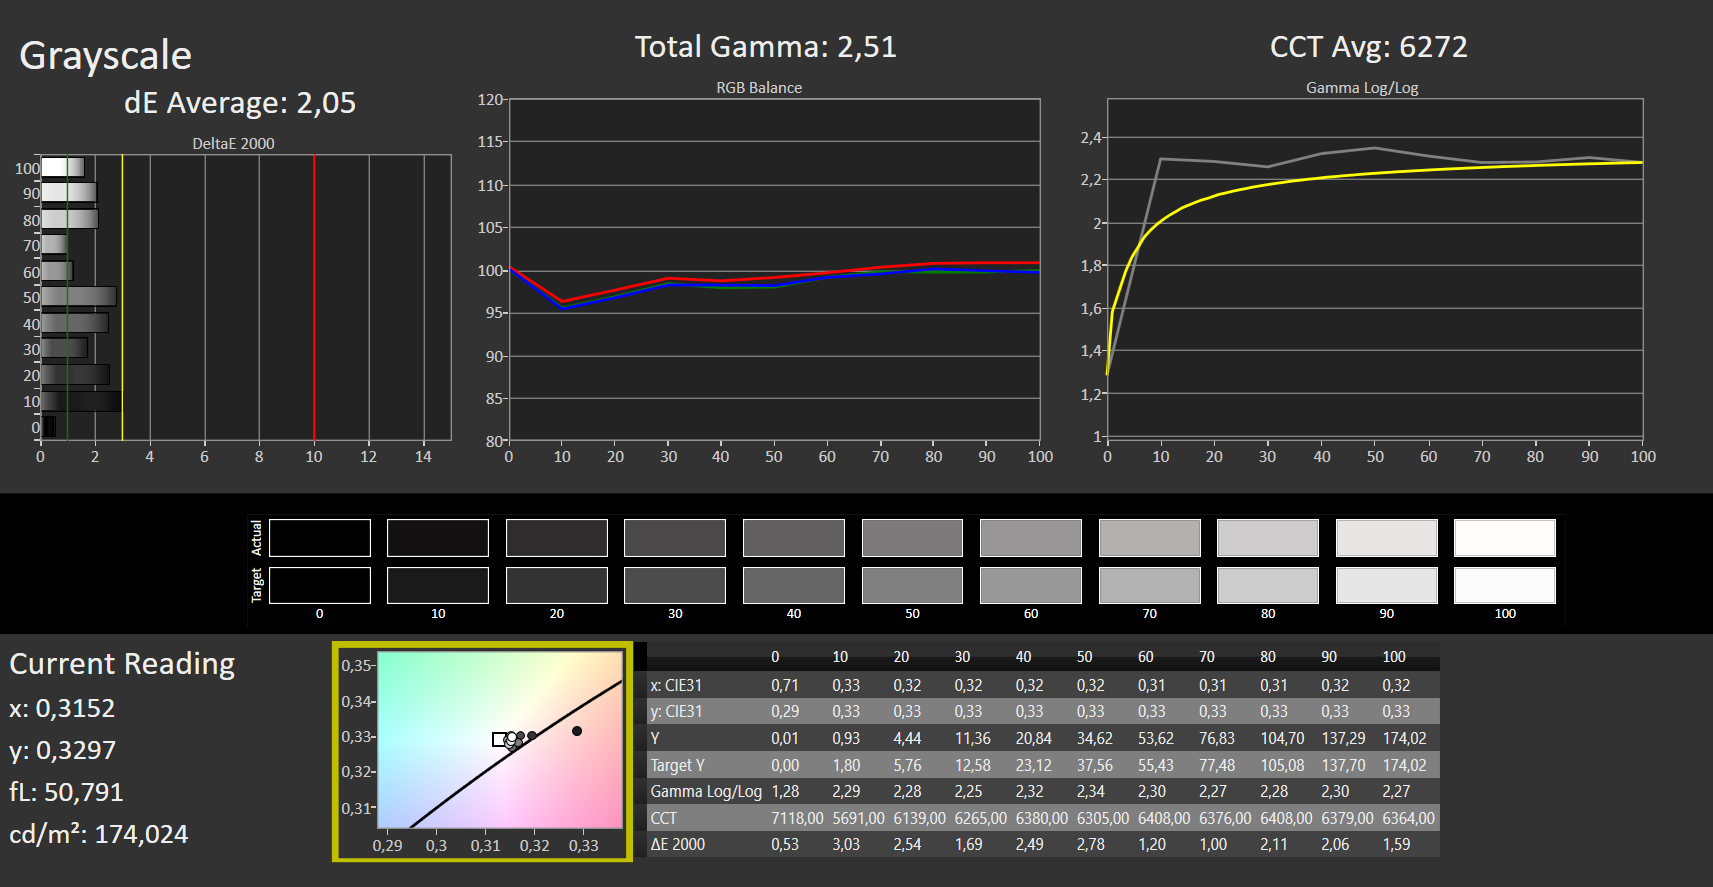
三星附带的软件允许直接选择不同的颜色配置文件。即使在OLED显示器的原生模式下,我们确定的平均色彩偏差实际上是难以察觉的。然而,训练有素的眼睛仍然可能注意到某些色调的差异。
另一方面,如果选择Display-P3配置文件,这将明显改变显示效果,所有的偏差都在一个非常低的水平上,应该不再是可感知的。因此,在没有校准的情况下,色彩表现接近完美。
Display Response Times
| ↔ Response Time Black to White | ||
|---|---|---|
| 2 ms ... rise ↗ and fall ↘ combined | ↗ 1 ms rise |  |
| ↘ 1 ms fall | ||
| The screen shows very fast response rates in our tests and should be very well suited for fast-paced gaming. In comparison, all tested devices range from 0.1 (minimum) to 240 (maximum) ms. » 11 % of all devices are better. This means that the measured response time is better than the average of all tested devices (19.8 ms). | ||
| ↔ Response Time 50% Grey to 80% Grey | ||
| 2 ms ... rise ↗ and fall ↘ combined | ↗ 1 ms rise |  |
| ↘ 1 ms fall | ||
| The screen shows very fast response rates in our tests and should be very well suited for fast-paced gaming. In comparison, all tested devices range from 0.165 (minimum) to 636 (maximum) ms. » 10 % of all devices are better. This means that the measured response time is better than the average of all tested devices (31 ms). | ||
Screen Flickering / PWM (Pulse-Width Modulation)
| Screen flickering / PWM detected | 250 Hz | ≤ 70 % brightness setting |    |
The display backlight flickers at 250 Hz (worst case, e.g., utilizing PWM) Flickering detected at a brightness setting of 70 % and below. There should be no flickering or PWM above this brightness setting. The frequency of 250 Hz is relatively low, so sensitive users will likely notice flickering and experience eyestrain at the stated brightness setting and below. In comparison: 52 % of all tested devices do not use PWM to dim the display. If PWM was detected, an average of 7754 (minimum: 5 - maximum: 343500) Hz was measured. | |||
与通常的OLED面板一样,我们检测到PWM引起的图像闪烁。240赫兹的频率在一个范围内,敏感的人可能会注意到。相机传感器也没有问题表现出这种效果。
然而,这种效果比带有LED背光的经典显示器要小得多。在这样的面板上,较大的区域被停用了。另一方面,在OLED显示器上,总是只有非常小的像素区域在短时间内变黑。这有助于提高显示器的寿命,以及其他方面。
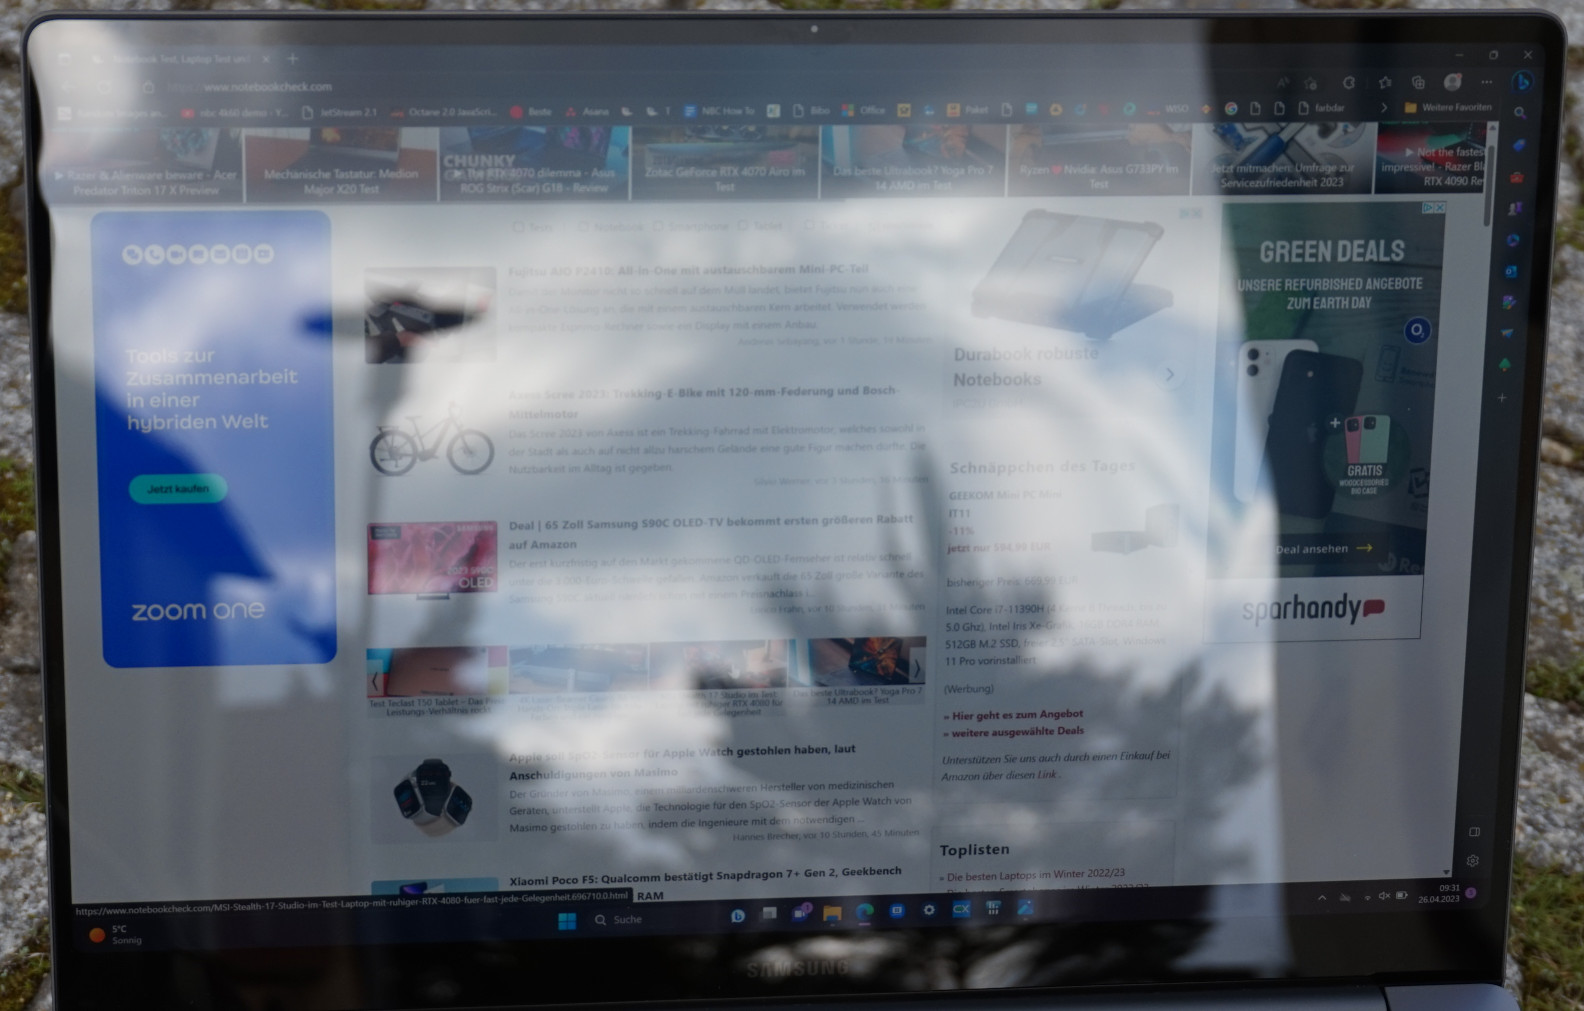
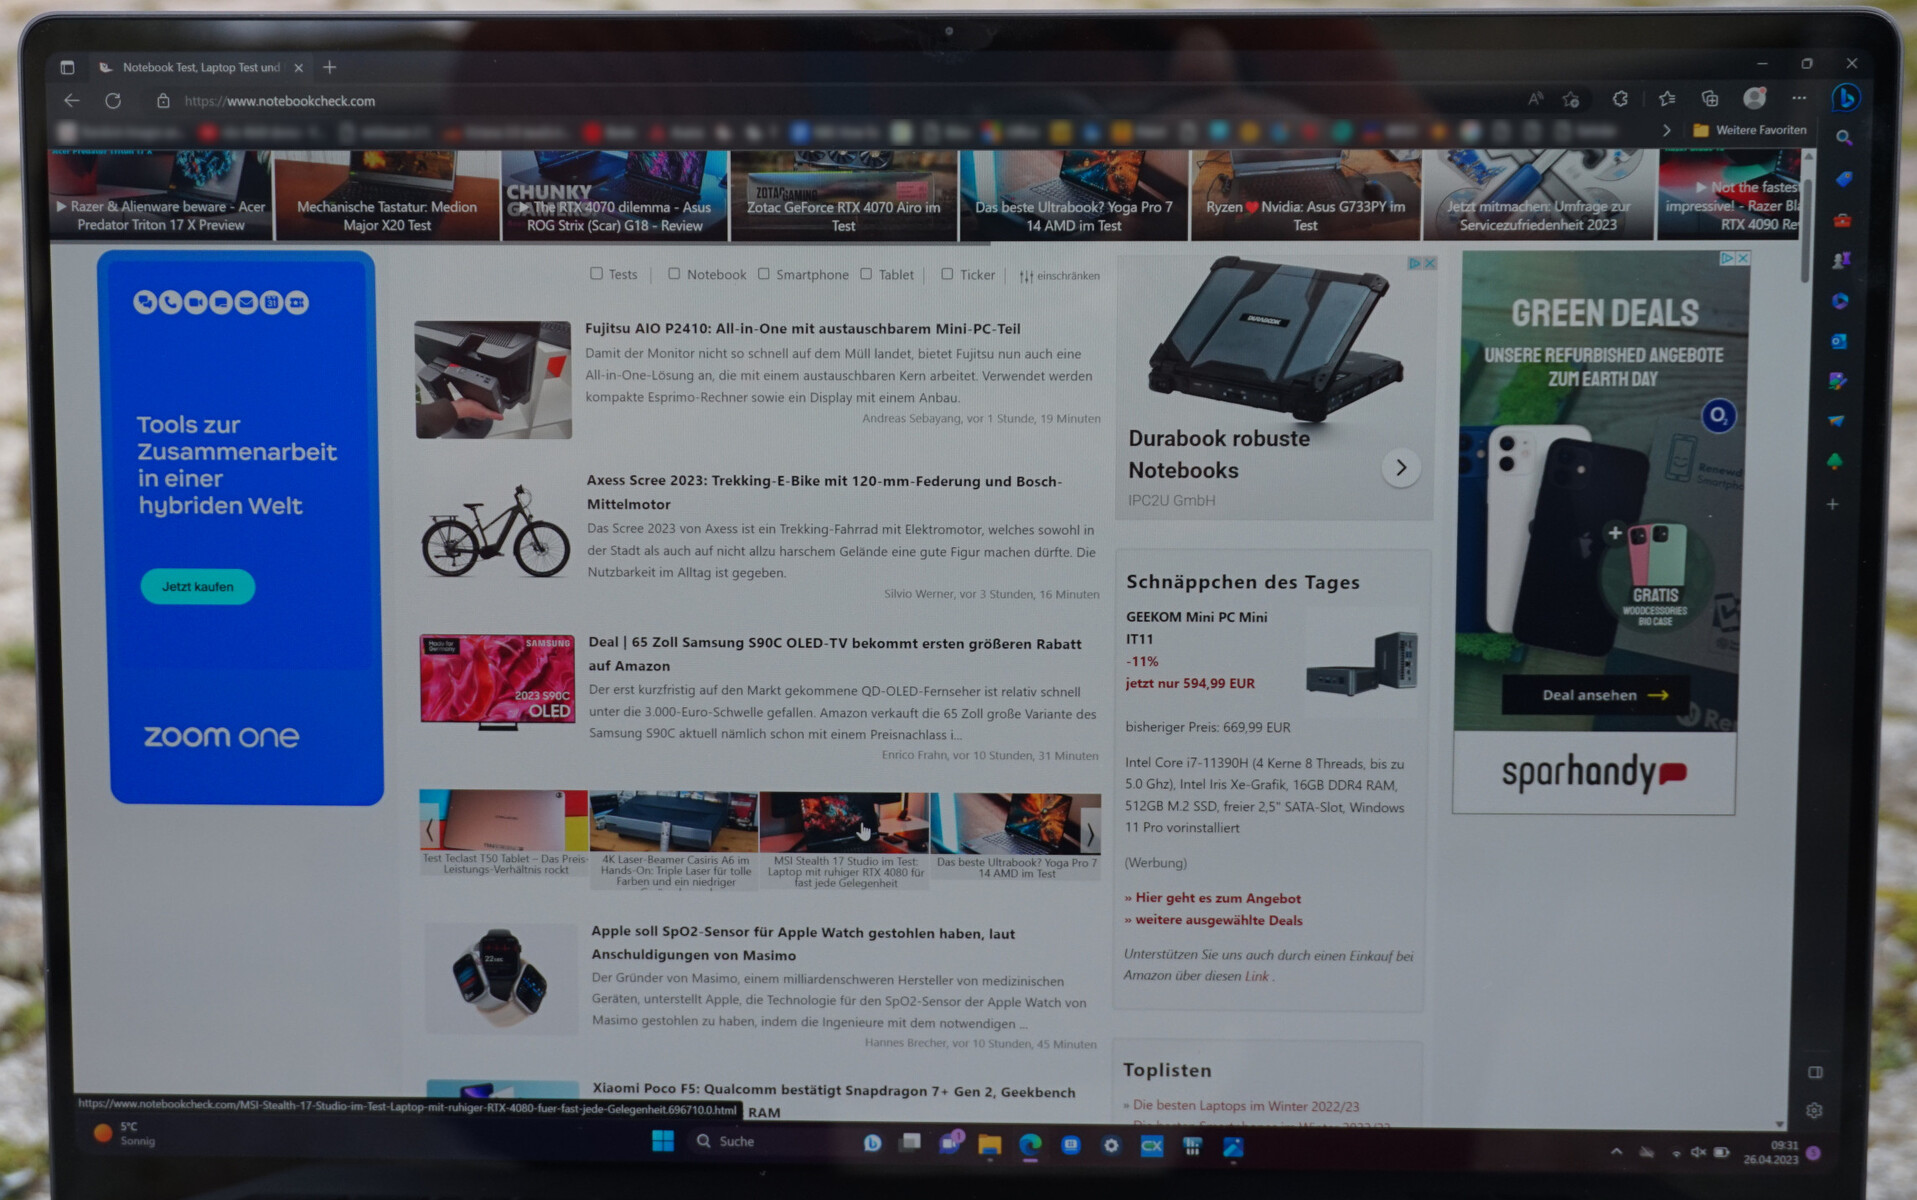
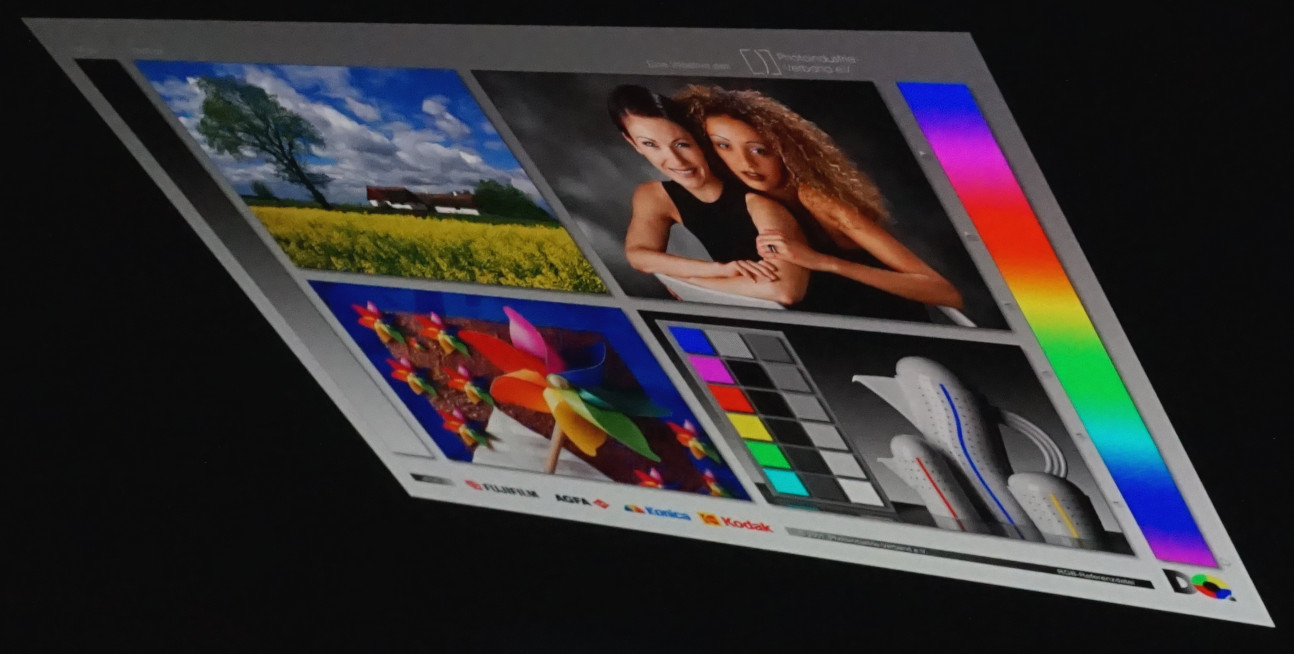
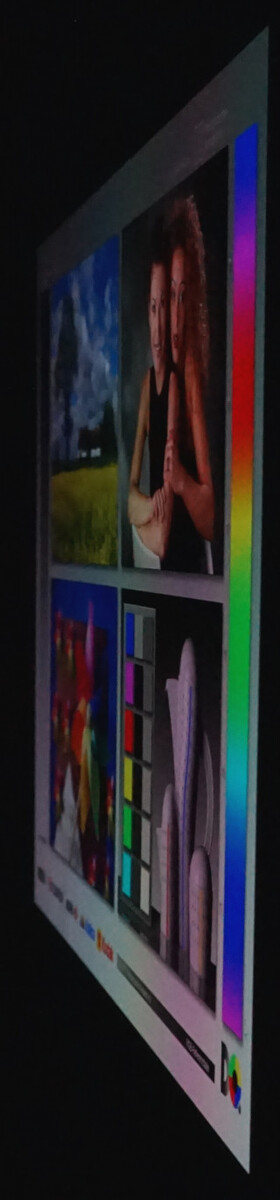
尽管有足够的亮度,但光泽的显示屏妨碍了户外使用。即使在阴天,也会有强烈的反光,使屏幕观看更加困难。
只有在阴凉处和逆光下,文字和图片才能被很好地识别。
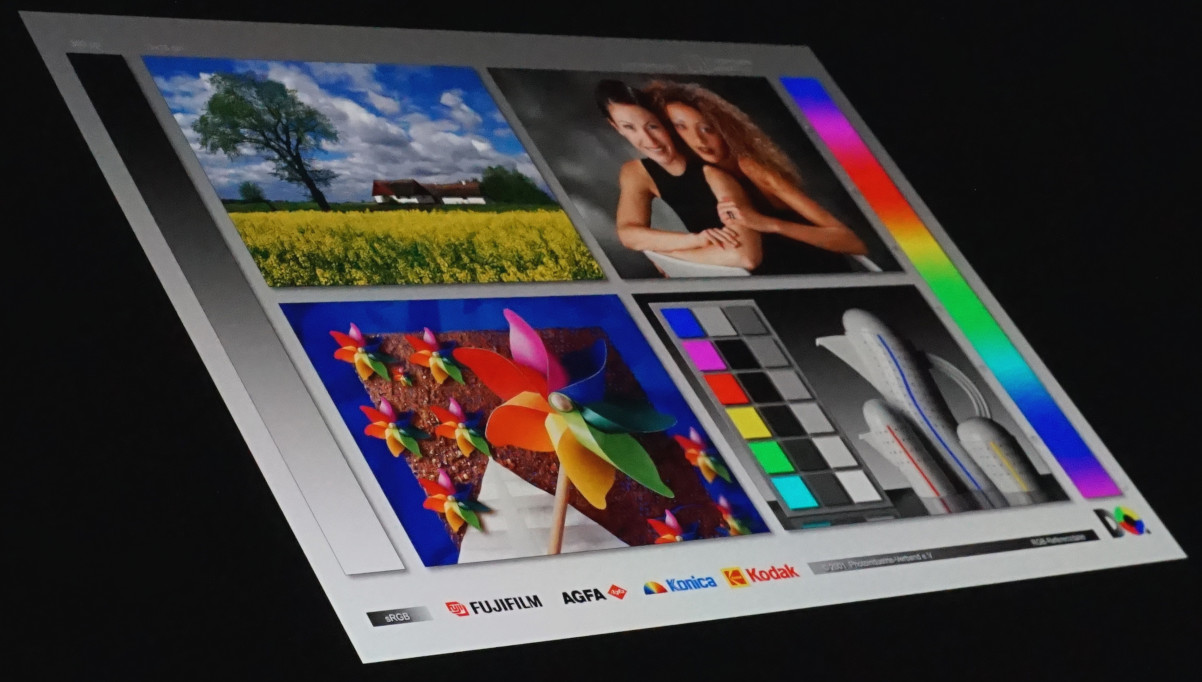
只有在极其陡峭的视角下才能观察到色彩再现的偏差。在通常的视野范围内和45°以外,亮度和色彩再现仍然无可挑剔。
性能 - 效率是Galaxy Book3 Ultra的重点。
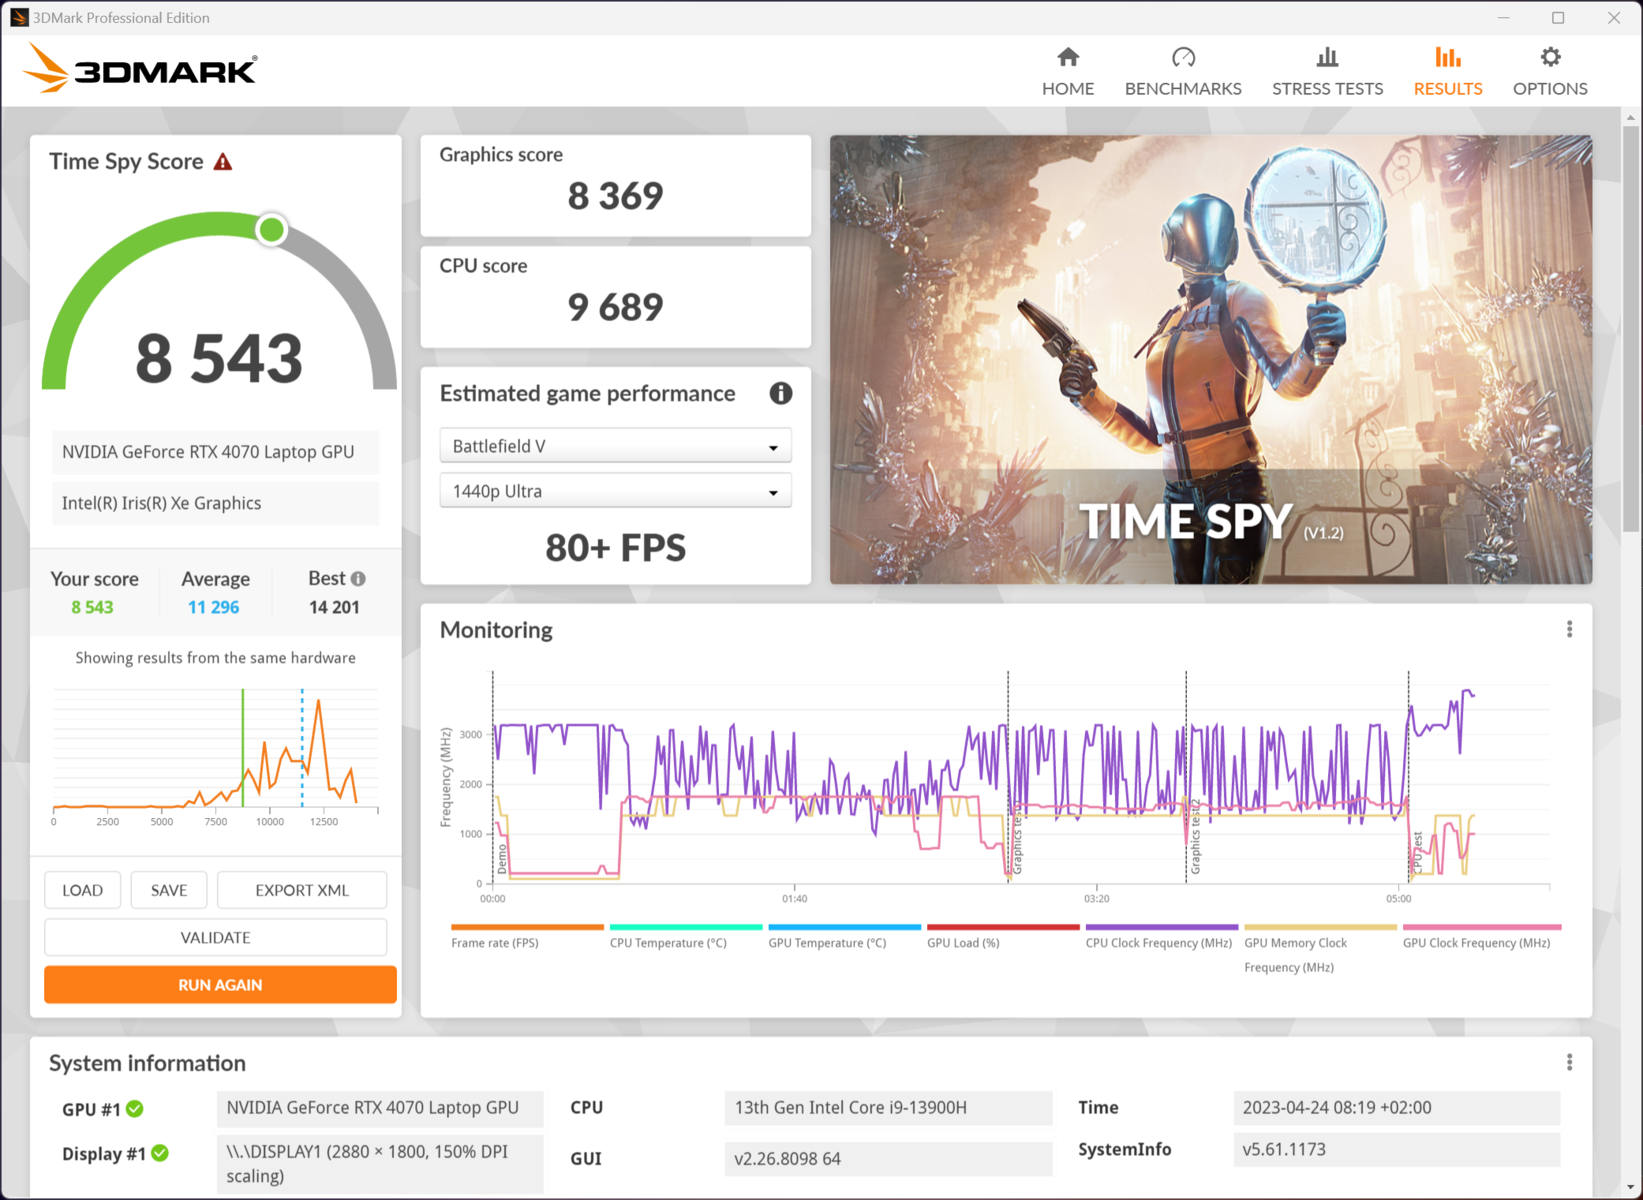
强大的硬件使你能够快速工作,即使是复杂的应用程序和密集的多任务处理。英特尔酷睿 英特尔酷睿i9-13900H在简单的任务中很少受到全面挑战,正如 RTX 4070。特别是显卡,由于功耗非常有限,只有在当前的游戏标题中才能达到其极限。尽管如此,我们观察到在最高级别的细节中几乎始终如一的可玩帧率。
然而,该系统注定要用于图像和视频编辑。3D渲染也没有什么大问题。Galaxy Book3 Ultra可以非常安静地运行,但会失去一些性能。在电池模式下的表现也很出色,因为3D性能仍然很高。因此,旅途中的视频编辑似乎是可行的。
较小的配置有英特尔酷睿i7-13700H和 NvidiaGeForce RTX 4050需要作出更多的妥协。在特别复杂的任务中,速度上的明显差异可能会被注意到。如果你确实想偶尔玩玩游戏,更强的变体自然会更有优势。
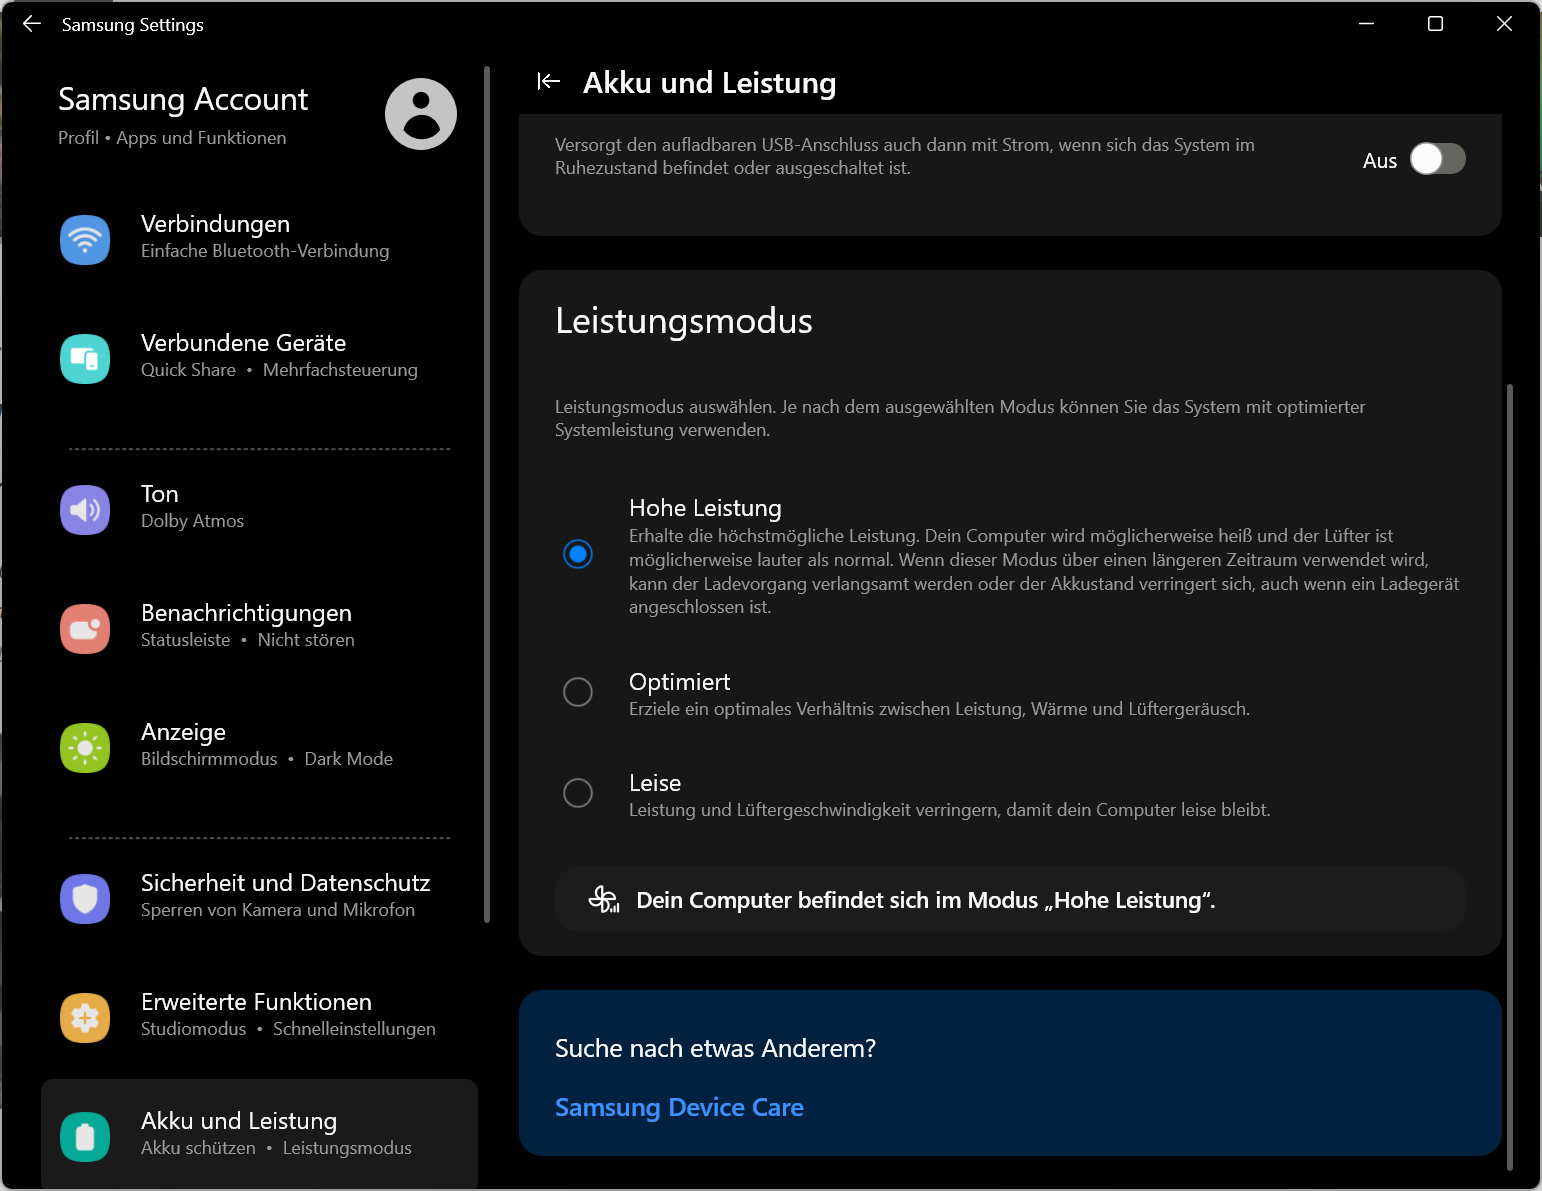
测试条件
三星Galaxy Book3使用附带的 "三星设置 "软件来配置笔记本电脑的一些基本设置和行为。有三个性能配置文件可供选择,也可以通过 "Fn "+"F11 "进行设置。
我们为基准测试选择了高性能模式。对热量和噪音的发展考虑得很少。在任何情况下,后者都远远低于游戏笔记本经常表现出的水平。
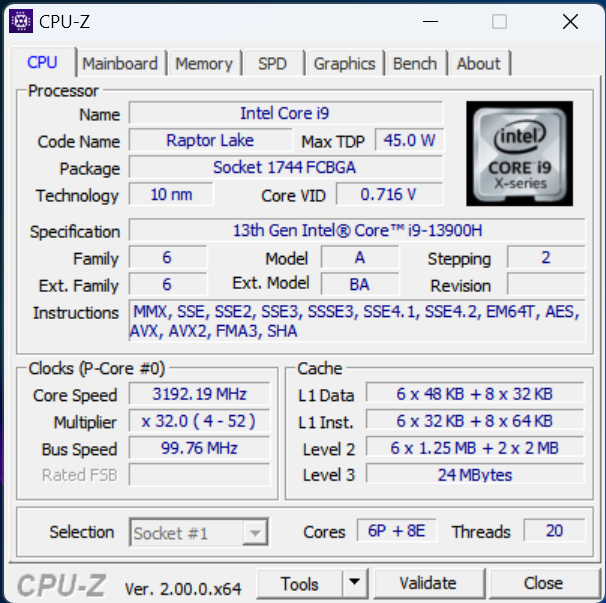
处理器
的 英特尔酷睿i9-13900HCPU属于高端领域,很少有移动处理器能比它更出色。它拥有14个内核、20个线程、24MB L3缓存和较高的峰值时钟,当然有能力处理复杂任务。然而,在纤薄的Galaxy Book中,该CPU不得不在最大75W的功耗下进行处理。因此,它远远落后于 英特尔酷睿i9-12900H例如,它远远落后于上一代的英特尔酷睿i9-12900H,但却要经济得多。
笔记本电脑 Apple M2 Pro 10 Core显示,事情可以做得更有效。它只需要27瓦,在Cinebench R15耐力测试中的得分略差。尽管如此,当你考虑到有限的空间和冷却选项时,三星造物主笔记本中的i9处于一个良好的水平。
与Galaxy 书3 Ultra与 英特尔酷睿i7-13700H显示,CPU在短期负载下更强大。在我们的CPU评估中,这两款 "较小 "的笔记本在各种测量中的表现明显更好。似乎i7比i9能更好地应对较低的功耗。大致相同的CPU主要在可实现的最大时钟速率方面存在差异,这在较低的功耗下无法利用。例如,我们在Cinebench R23中测得的最大时钟速率为3.7 GHz。理论上,最高5.4GHz是可能的。
另一方面,当需要较长时间的计算能力时,更快的i9处理器可以在Cinebench R15耐力测试中再次证明自己。更强大但也更响亮的冷却(与i7变体相比)的优势随之变得明显。
使用优化 模式会导致一些不寻常的动态变化。在几分之一秒的时间里,允许有75瓦的功率,就像在静音 模式下,甚至在电池操作下。相比之下,长时间的功耗被限制在45瓦。在静音 模式下,这个值下降到30瓦。
性能模式在电池操作中也是可用的。PL1,设置了长达32秒的功耗,然后减少了10W。另一方面,在静音模式下,它保持在30W,这实际上是足够的,这将在下面显示。
更多的基准测试和比较值可以在我们的 CPU基准测试列表.
Cinebench R15 Multi Sustained Load
Cinebench R23: Multi Core | Single Core
Cinebench R20: CPU (Multi Core) | CPU (Single Core)
Cinebench R15: CPU Multi 64Bit | CPU Single 64Bit
Blender: v2.79 BMW27 CPU
7-Zip 18.03: 7z b 4 | 7z b 4 -mmt1
Geekbench 5.5: Multi-Core | Single-Core
HWBOT x265 Benchmark v2.2: 4k Preset
LibreOffice : 20 Documents To PDF
R Benchmark 2.5: Overall mean
| CPU Performance rating | |
| Asus ProArt StudioBook 16 H7600ZW | |
| MSI Stealth 17 Studio A13VH-014 | |
| Gigabyte AERO 16 OLED BSF | |
| Average Intel Core i9-13900H | |
| Average of class Multimedia | |
| Dell XPS 15 9530 RTX 4070 | |
| Samsung Galaxy Book3 Ultra 16 | |
| Apple MacBook Pro 14 2023 M2 Pro Entry -5! | |
| Lenovo ThinkPad T14 G3-21AJS00400 | |
| Samsung Galaxy Book3 Ultra 16, i9-13900H RTX 4070 | |
| Samsung Galaxy Book Pro 15 NP950XDB-KC5US | |
| Cinebench R23 / Single Core | |
| Average of class Multimedia (1128 - 2459, n=66, last 2 years) | |
| Average Intel Core i9-13900H (1297 - 2054, n=26) | |
| Asus ProArt StudioBook 16 H7600ZW | |
| Dell XPS 15 9530 RTX 4070 | |
| Lenovo ThinkPad T14 G3-21AJS00400 | |
| Gigabyte AERO 16 OLED BSF | |
| MSI Stealth 17 Studio A13VH-014 | |
| Samsung Galaxy Book3 Ultra 16 | |
| Apple MacBook Pro 14 2023 M2 Pro Entry | |
| Samsung Galaxy Book Pro 15 NP950XDB-KC5US | |
| Samsung Galaxy Book3 Ultra 16, i9-13900H RTX 4070 | |
| Cinebench R20 / CPU (Multi Core) | |
| MSI Stealth 17 Studio A13VH-014 | |
| Asus ProArt StudioBook 16 H7600ZW | |
| Gigabyte AERO 16 OLED BSF | |
| Average Intel Core i9-13900H (4935 - 7716, n=25) | |
| Average of class Multimedia (1887 - 12912, n=57, last 2 years) | |
| Dell XPS 15 9530 RTX 4070 | |
| Samsung Galaxy Book3 Ultra 16 | |
| Samsung Galaxy Book3 Ultra 16, i9-13900H RTX 4070 | |
| Lenovo ThinkPad T14 G3-21AJS00400 | |
| Apple MacBook Pro 14 2023 M2 Pro Entry | |
| Samsung Galaxy Book Pro 15 NP950XDB-KC5US | |
| Cinebench R20 / CPU (Single Core) | |
| Asus ProArt StudioBook 16 H7600ZW | |
| Average of class Multimedia (425 - 853, n=57, last 2 years) | |
| Average Intel Core i9-13900H (428 - 792, n=25) | |
| Dell XPS 15 9530 RTX 4070 | |
| Lenovo ThinkPad T14 G3-21AJS00400 | |
| MSI Stealth 17 Studio A13VH-014 | |
| Samsung Galaxy Book3 Ultra 16 | |
| Gigabyte AERO 16 OLED BSF | |
| Samsung Galaxy Book Pro 15 NP950XDB-KC5US | |
| Apple MacBook Pro 14 2023 M2 Pro Entry | |
| Samsung Galaxy Book3 Ultra 16, i9-13900H RTX 4070 | |
| Cinebench R15 / CPU Multi 64Bit | |
| MSI Stealth 17 Studio A13VH-014 | |
| Gigabyte AERO 16 OLED BSF | |
| Asus ProArt StudioBook 16 H7600ZW | |
| Average Intel Core i9-13900H (2061 - 3100, n=26) | |
| Dell XPS 15 9530 RTX 4070 | |
| Average of class Multimedia (856 - 5224, n=61, last 2 years) | |
| Samsung Galaxy Book3 Ultra 16 | |
| Samsung Galaxy Book3 Ultra 16, i9-13900H RTX 4070 | |
| Lenovo ThinkPad T14 G3-21AJS00400 | |
| Apple MacBook Pro 14 2023 M2 Pro Entry | |
| Samsung Galaxy Book Pro 15 NP950XDB-KC5US | |
| Cinebench R15 / CPU Single 64Bit | |
| MSI Stealth 17 Studio A13VH-014 | |
| Average of class Multimedia (184.8 - 326, n=59, last 2 years) | |
| Asus ProArt StudioBook 16 H7600ZW | |
| Dell XPS 15 9530 RTX 4070 | |
| Average Intel Core i9-13900H (211 - 297, n=26) | |
| Samsung Galaxy Book3 Ultra 16 | |
| Lenovo ThinkPad T14 G3-21AJS00400 | |
| Gigabyte AERO 16 OLED BSF | |
| Apple MacBook Pro 14 2023 M2 Pro Entry | |
| Samsung Galaxy Book3 Ultra 16, i9-13900H RTX 4070 | |
| Samsung Galaxy Book Pro 15 NP950XDB-KC5US | |
| Blender / v2.79 BMW27 CPU | |
| Samsung Galaxy Book Pro 15 NP950XDB-KC5US | |
| Apple MacBook Pro 14 2023 M2 Pro Entry | |
| Lenovo ThinkPad T14 G3-21AJS00400 | |
| Average of class Multimedia (100 - 557, n=58, last 2 years) | |
| Samsung Galaxy Book3 Ultra 16, i9-13900H RTX 4070 | |
| Samsung Galaxy Book3 Ultra 16 | |
| Dell XPS 15 9530 RTX 4070 | |
| Average Intel Core i9-13900H (166 - 268, n=24) | |
| Gigabyte AERO 16 OLED BSF | |
| Asus ProArt StudioBook 16 H7600ZW | |
| MSI Stealth 17 Studio A13VH-014 | |
| 7-Zip 18.03 / 7z b 4 | |
| Asus ProArt StudioBook 16 H7600ZW | |
| MSI Stealth 17 Studio A13VH-014 | |
| Gigabyte AERO 16 OLED BSF | |
| Average Intel Core i9-13900H (45045 - 79032, n=25) | |
| Samsung Galaxy Book3 Ultra 16 | |
| Dell XPS 15 9530 RTX 4070 | |
| Average of class Multimedia (26062 - 130368, n=55, last 2 years) | |
| Samsung Galaxy Book3 Ultra 16, i9-13900H RTX 4070 | |
| Lenovo ThinkPad T14 G3-21AJS00400 | |
| Samsung Galaxy Book Pro 15 NP950XDB-KC5US | |
| 7-Zip 18.03 / 7z b 4 -mmt1 | |
| Asus ProArt StudioBook 16 H7600ZW | |
| MSI Stealth 17 Studio A13VH-014 | |
| Dell XPS 15 9530 RTX 4070 | |
| Average Intel Core i9-13900H (3665 - 6600, n=25) | |
| Average of class Multimedia (3666 - 7545, n=56, last 2 years) | |
| Lenovo ThinkPad T14 G3-21AJS00400 | |
| Gigabyte AERO 16 OLED BSF | |
| Samsung Galaxy Book3 Ultra 16 | |
| Samsung Galaxy Book Pro 15 NP950XDB-KC5US | |
| Samsung Galaxy Book3 Ultra 16, i9-13900H RTX 4070 | |
| Geekbench 5.5 / Single-Core | |
| MSI Stealth 17 Studio A13VH-014 | |
| Average of class Multimedia (805 - 2974, n=56, last 2 years) | |
| Apple MacBook Pro 14 2023 M2 Pro Entry | |
| Dell XPS 15 9530 RTX 4070 | |
| Average Intel Core i9-13900H (1140 - 2043, n=26) | |
| Asus ProArt StudioBook 16 H7600ZW | |
| Gigabyte AERO 16 OLED BSF | |
| Samsung Galaxy Book3 Ultra 16 | |
| Lenovo ThinkPad T14 G3-21AJS00400 | |
| Samsung Galaxy Book Pro 15 NP950XDB-KC5US | |
| Samsung Galaxy Book3 Ultra 16, i9-13900H RTX 4070 | |
| HWBOT x265 Benchmark v2.2 / 4k Preset | |
| Asus ProArt StudioBook 16 H7600ZW | |
| MSI Stealth 17 Studio A13VH-014 | |
| Gigabyte AERO 16 OLED BSF | |
| Average of class Multimedia (5.26 - 36.1, n=56, last 2 years) | |
| Average Intel Core i9-13900H (14.1 - 22.3, n=25) | |
| Dell XPS 15 9530 RTX 4070 | |
| Samsung Galaxy Book3 Ultra 16 | |
| Samsung Galaxy Book3 Ultra 16, i9-13900H RTX 4070 | |
| Lenovo ThinkPad T14 G3-21AJS00400 | |
| Samsung Galaxy Book Pro 15 NP950XDB-KC5US | |
| LibreOffice / 20 Documents To PDF | |
| Samsung Galaxy Book3 Ultra 16, i9-13900H RTX 4070 | |
| Gigabyte AERO 16 OLED BSF | |
| Samsung Galaxy Book Pro 15 NP950XDB-KC5US | |
| MSI Stealth 17 Studio A13VH-014 | |
| Average of class Multimedia (23.9 - 146.7, n=57, last 2 years) | |
| Samsung Galaxy Book3 Ultra 16 | |
| Average Intel Core i9-13900H (34.4 - 82.8, n=25) | |
| Asus ProArt StudioBook 16 H7600ZW | |
| Dell XPS 15 9530 RTX 4070 | |
| Lenovo ThinkPad T14 G3-21AJS00400 | |
| R Benchmark 2.5 / Overall mean | |
| Samsung Galaxy Book3 Ultra 16, i9-13900H RTX 4070 | |
| Samsung Galaxy Book Pro 15 NP950XDB-KC5US | |
| Gigabyte AERO 16 OLED BSF | |
| Samsung Galaxy Book3 Ultra 16 | |
| Lenovo ThinkPad T14 G3-21AJS00400 | |
| Average of class Multimedia (0.3604 - 0.947, n=56, last 2 years) | |
| Average Intel Core i9-13900H (0.4052 - 0.723, n=25) | |
| Dell XPS 15 9530 RTX 4070 | |
| Asus ProArt StudioBook 16 H7600ZW | |
| MSI Stealth 17 Studio A13VH-014 | |
* ... smaller is better
AIDA64: FP32 Ray-Trace | FPU Julia | CPU SHA3 | CPU Queen | FPU SinJulia | FPU Mandel | CPU AES | CPU ZLib | FP64 Ray-Trace | CPU PhotoWorxx
| Performance rating | |
| Asus ProArt StudioBook 16 H7600ZW | |
| Gigabyte AERO 16 OLED BSF | |
| MSI Stealth 17 Studio A13VH-014 | |
| Average of class Multimedia | |
| Average Intel Core i9-13900H | |
| Samsung Galaxy Book3 Ultra 16 | |
| Dell XPS 15 9530 RTX 4070 | |
| Samsung Galaxy Book3 Ultra 16, i9-13900H RTX 4070 | |
| AIDA64 / FP32 Ray-Trace | |
| MSI Stealth 17 Studio A13VH-014 | |
| Gigabyte AERO 16 OLED BSF | |
| Asus ProArt StudioBook 16 H7600ZW | |
| Average of class Multimedia (2214 - 50388, n=53, last 2 years) | |
| Average Intel Core i9-13900H (6788 - 19557, n=25) | |
| Samsung Galaxy Book3 Ultra 16, i9-13900H RTX 4070 | |
| Samsung Galaxy Book3 Ultra 16 | |
| Dell XPS 15 9530 RTX 4070 | |
| AIDA64 / FPU Julia | |
| MSI Stealth 17 Studio A13VH-014 | |
| Asus ProArt StudioBook 16 H7600ZW | |
| Gigabyte AERO 16 OLED BSF | |
| Average of class Multimedia (12867 - 201874, n=54, last 2 years) | |
| Average Intel Core i9-13900H (22551 - 95579, n=25) | |
| Samsung Galaxy Book3 Ultra 16 | |
| Dell XPS 15 9530 RTX 4070 | |
| Samsung Galaxy Book3 Ultra 16, i9-13900H RTX 4070 | |
| AIDA64 / CPU SHA3 | |
| MSI Stealth 17 Studio A13VH-014 | |
| Asus ProArt StudioBook 16 H7600ZW | |
| Gigabyte AERO 16 OLED BSF | |
| Average of class Multimedia (626 - 8623, n=54, last 2 years) | |
| Average Intel Core i9-13900H (2491 - 4270, n=25) | |
| Samsung Galaxy Book3 Ultra 16, i9-13900H RTX 4070 | |
| Samsung Galaxy Book3 Ultra 16 | |
| Dell XPS 15 9530 RTX 4070 | |
| AIDA64 / CPU Queen | |
| Asus ProArt StudioBook 16 H7600ZW | |
| Average Intel Core i9-13900H (65121 - 120936, n=25) | |
| Dell XPS 15 9530 RTX 4070 | |
| Samsung Galaxy Book3 Ultra 16 | |
| MSI Stealth 17 Studio A13VH-014 | |
| Gigabyte AERO 16 OLED BSF | |
| Samsung Galaxy Book3 Ultra 16, i9-13900H RTX 4070 | |
| Average of class Multimedia (13483 - 181505, n=41, last 2 years) | |
| AIDA64 / FPU SinJulia | |
| MSI Stealth 17 Studio A13VH-014 | |
| Gigabyte AERO 16 OLED BSF | |
| Asus ProArt StudioBook 16 H7600ZW | |
| Average Intel Core i9-13900H (6108 - 11631, n=25) | |
| Samsung Galaxy Book3 Ultra 16 | |
| Average of class Multimedia (886 - 28794, n=54, last 2 years) | |
| Dell XPS 15 9530 RTX 4070 | |
| Samsung Galaxy Book3 Ultra 16, i9-13900H RTX 4070 | |
| AIDA64 / FPU Mandel | |
| MSI Stealth 17 Studio A13VH-014 | |
| Asus ProArt StudioBook 16 H7600ZW | |
| Gigabyte AERO 16 OLED BSF | |
| Average of class Multimedia (6395 - 105740, n=53, last 2 years) | |
| Average Intel Core i9-13900H (11283 - 48474, n=25) | |
| Samsung Galaxy Book3 Ultra 16, i9-13900H RTX 4070 | |
| Samsung Galaxy Book3 Ultra 16 | |
| Dell XPS 15 9530 RTX 4070 | |
| AIDA64 / CPU AES | |
| Asus ProArt StudioBook 16 H7600ZW | |
| Gigabyte AERO 16 OLED BSF | |
| Average Intel Core i9-13900H (3691 - 149377, n=25) | |
| MSI Stealth 17 Studio A13VH-014 | |
| Samsung Galaxy Book3 Ultra 16 | |
| Average of class Multimedia (8171 - 126790, n=54, last 2 years) | |
| Dell XPS 15 9530 RTX 4070 | |
| Samsung Galaxy Book3 Ultra 16, i9-13900H RTX 4070 | |
| AIDA64 / CPU ZLib | |
| MSI Stealth 17 Studio A13VH-014 | |
| Gigabyte AERO 16 OLED BSF | |
| Asus ProArt StudioBook 16 H7600ZW | |
| Average Intel Core i9-13900H (789 - 1254, n=25) | |
| Samsung Galaxy Book3 Ultra 16 | |
| Samsung Galaxy Book3 Ultra 16, i9-13900H RTX 4070 | |
| Average of class Multimedia (143.8 - 2022, n=54, last 2 years) | |
| Dell XPS 15 9530 RTX 4070 | |
| AIDA64 / FP64 Ray-Trace | |
| MSI Stealth 17 Studio A13VH-014 | |
| Asus ProArt StudioBook 16 H7600ZW | |
| Gigabyte AERO 16 OLED BSF | |
| Average of class Multimedia (1014 - 26875, n=54, last 2 years) | |
| Average Intel Core i9-13900H (3655 - 10716, n=25) | |
| Samsung Galaxy Book3 Ultra 16 | |
| Dell XPS 15 9530 RTX 4070 | |
| Samsung Galaxy Book3 Ultra 16, i9-13900H RTX 4070 | |
| AIDA64 / CPU PhotoWorxx | |
| MSI Stealth 17 Studio A13VH-014 | |
| Average of class Multimedia (8187 - 88154, n=54, last 2 years) | |
| Samsung Galaxy Book3 Ultra 16, i9-13900H RTX 4070 | |
| Samsung Galaxy Book3 Ultra 16 | |
| Gigabyte AERO 16 OLED BSF | |
| Dell XPS 15 9530 RTX 4070 | |
| Asus ProArt StudioBook 16 H7600ZW | |
| Average Intel Core i9-13900H (10871 - 50488, n=25) | |
系统性能
在正常使用过程中,几乎看不出有限的电力消耗。与更强大的机型相比,程序启动稍有延迟。另一方面,与快速商务笔记本相比,三星Galaxy Book3 Ultra有优势。CPU的许多内核和专用图形芯片提供的支持在这里可以得到充分的利用。
快速工作和多任务处理不会给系统带来任何问题。此外,效率因素也不应该被忽视。非常相似的装备 Gigabyte AERO 16 OLED在大多数基准测试中领先40-50%。然而,它需要消耗两倍的电力才能保持领先。
笔记本电脑的CPU性能与系统性能相呼应:较小的三星Galaxy Book3 Ultra在这里也显示出更好的速率。然而,i7-13700H i7-13700H继续证明它能比i7-13700H更好地处理75W的限制。 i9-13900H.
CrossMark: Overall | Productivity | Creativity | Responsiveness
| PCMark 10 / Score | |
| Asus ProArt StudioBook 16 H7600ZW | |
| Gigabyte AERO 16 OLED BSF | |
| Average of class Multimedia (4325 - 10386, n=52, last 2 years) | |
| Average Intel Core i9-13900H, NVIDIA GeForce RTX 4070 Laptop GPU (5855 - 8538, n=8) | |
| MSI Stealth 17 Studio A13VH-014 | |
| Dell XPS 15 9530 RTX 4070 | |
| Samsung Galaxy Book3 Ultra 16 | |
| Lenovo ThinkPad T14 G3-21AJS00400 | |
| Samsung Galaxy Book3 Ultra 16, i9-13900H RTX 4070 | |
| Samsung Galaxy Book Pro 15 NP950XDB-KC5US | |
| PCMark 10 / Essentials | |
| Asus ProArt StudioBook 16 H7600ZW | |
| Dell XPS 15 9530 RTX 4070 | |
| Gigabyte AERO 16 OLED BSF | |
| Average Intel Core i9-13900H, NVIDIA GeForce RTX 4070 Laptop GPU (8835 - 11940, n=8) | |
| Samsung Galaxy Book3 Ultra 16 | |
| Average of class Multimedia (8025 - 11664, n=51, last 2 years) | |
| MSI Stealth 17 Studio A13VH-014 | |
| Samsung Galaxy Book Pro 15 NP950XDB-KC5US | |
| Lenovo ThinkPad T14 G3-21AJS00400 | |
| Samsung Galaxy Book3 Ultra 16, i9-13900H RTX 4070 | |
| PCMark 10 / Productivity | |
| Average of class Multimedia (7323 - 18233, n=51, last 2 years) | |
| Asus ProArt StudioBook 16 H7600ZW | |
| MSI Stealth 17 Studio A13VH-014 | |
| Average Intel Core i9-13900H, NVIDIA GeForce RTX 4070 Laptop GPU (7967 - 10991, n=8) | |
| Gigabyte AERO 16 OLED BSF | |
| Samsung Galaxy Book3 Ultra 16 | |
| Dell XPS 15 9530 RTX 4070 | |
| Lenovo ThinkPad T14 G3-21AJS00400 | |
| Samsung Galaxy Book3 Ultra 16, i9-13900H RTX 4070 | |
| Samsung Galaxy Book Pro 15 NP950XDB-KC5US | |
| PCMark 10 / Digital Content Creation | |
| Gigabyte AERO 16 OLED BSF | |
| Average Intel Core i9-13900H, NVIDIA GeForce RTX 4070 Laptop GPU (7738 - 13575, n=8) | |
| Asus ProArt StudioBook 16 H7600ZW | |
| MSI Stealth 17 Studio A13VH-014 | |
| Dell XPS 15 9530 RTX 4070 | |
| Average of class Multimedia (3651 - 16240, n=51, last 2 years) | |
| Samsung Galaxy Book3 Ultra 16 | |
| Samsung Galaxy Book3 Ultra 16, i9-13900H RTX 4070 | |
| Lenovo ThinkPad T14 G3-21AJS00400 | |
| Samsung Galaxy Book Pro 15 NP950XDB-KC5US | |
| CrossMark / Overall | |
| Asus ProArt StudioBook 16 H7600ZW | |
| Dell XPS 15 9530 RTX 4070 | |
| Gigabyte AERO 16 OLED BSF | |
| Average of class Multimedia (866 - 2728, n=60, last 2 years) | |
| Average Intel Core i9-13900H, NVIDIA GeForce RTX 4070 Laptop GPU (1104 - 1974, n=7) | |
| Apple MacBook Pro 14 2023 M2 Pro Entry | |
| MSI Stealth 17 Studio A13VH-014 | |
| Samsung Galaxy Book3 Ultra 16 | |
| Lenovo ThinkPad T14 G3-21AJS00400 | |
| Samsung Galaxy Book3 Ultra 16, i9-13900H RTX 4070 | |
| CrossMark / Productivity | |
| Asus ProArt StudioBook 16 H7600ZW | |
| Gigabyte AERO 16 OLED BSF | |
| Average of class Multimedia (931 - 2489, n=60, last 2 years) | |
| Dell XPS 15 9530 RTX 4070 | |
| Average Intel Core i9-13900H, NVIDIA GeForce RTX 4070 Laptop GPU (1058 - 1914, n=7) | |
| MSI Stealth 17 Studio A13VH-014 | |
| Apple MacBook Pro 14 2023 M2 Pro Entry | |
| Lenovo ThinkPad T14 G3-21AJS00400 | |
| Samsung Galaxy Book3 Ultra 16 | |
| Samsung Galaxy Book3 Ultra 16, i9-13900H RTX 4070 | |
| CrossMark / Creativity | |
| Apple MacBook Pro 14 2023 M2 Pro Entry | |
| Average of class Multimedia (907 - 3465, n=60, last 2 years) | |
| Dell XPS 15 9530 RTX 4070 | |
| Asus ProArt StudioBook 16 H7600ZW | |
| Average Intel Core i9-13900H, NVIDIA GeForce RTX 4070 Laptop GPU (1178 - 2254, n=7) | |
| Gigabyte AERO 16 OLED BSF | |
| MSI Stealth 17 Studio A13VH-014 | |
| Samsung Galaxy Book3 Ultra 16 | |
| Lenovo ThinkPad T14 G3-21AJS00400 | |
| Samsung Galaxy Book3 Ultra 16, i9-13900H RTX 4070 | |
| CrossMark / Responsiveness | |
| Gigabyte AERO 16 OLED BSF | |
| Asus ProArt StudioBook 16 H7600ZW | |
| Average Intel Core i9-13900H, NVIDIA GeForce RTX 4070 Laptop GPU (1037 - 1952, n=7) | |
| Dell XPS 15 9530 RTX 4070 | |
| MSI Stealth 17 Studio A13VH-014 | |
| Average of class Multimedia (605 - 2024, n=60, last 2 years) | |
| Samsung Galaxy Book3 Ultra 16 | |
| Apple MacBook Pro 14 2023 M2 Pro Entry | |
| Lenovo ThinkPad T14 G3-21AJS00400 | |
| Samsung Galaxy Book3 Ultra 16, i9-13900H RTX 4070 | |
| PCMark 10 Score | 5855 points | |
Help | ||
| AIDA64 / Memory Copy | |
| Average of class Multimedia (11299 - 132135, n=54, last 2 years) | |
| MSI Stealth 17 Studio A13VH-014 | |
| Samsung Galaxy Book3 Ultra 16 | |
| Samsung Galaxy Book3 Ultra 16, i9-13900H RTX 4070 | |
| Gigabyte AERO 16 OLED BSF | |
| Dell XPS 15 9530 RTX 4070 | |
| Asus ProArt StudioBook 16 H7600ZW | |
| Average Intel Core i9-13900H (37448 - 74486, n=25) | |
| AIDA64 / Memory Read | |
| Average of class Multimedia (11624 - 174586, n=54, last 2 years) | |
| MSI Stealth 17 Studio A13VH-014 | |
| Samsung Galaxy Book3 Ultra 16, i9-13900H RTX 4070 | |
| Dell XPS 15 9530 RTX 4070 | |
| Samsung Galaxy Book3 Ultra 16 | |
| Gigabyte AERO 16 OLED BSF | |
| Asus ProArt StudioBook 16 H7600ZW | |
| Average Intel Core i9-13900H (41599 - 75433, n=25) | |
| AIDA64 / Memory Write | |
| Samsung Galaxy Book3 Ultra 16 | |
| Samsung Galaxy Book3 Ultra 16, i9-13900H RTX 4070 | |
| Average of class Multimedia (11755 - 134998, n=54, last 2 years) | |
| MSI Stealth 17 Studio A13VH-014 | |
| Gigabyte AERO 16 OLED BSF | |
| Dell XPS 15 9530 RTX 4070 | |
| Average Intel Core i9-13900H (36152 - 88505, n=25) | |
| Asus ProArt StudioBook 16 H7600ZW | |
| AIDA64 / Memory Latency | |
| Average of class Multimedia (7 - 535, n=53, last 2 years) | |
| Samsung Galaxy Book3 Ultra 16, i9-13900H RTX 4070 | |
| Samsung Galaxy Book3 Ultra 16 | |
| Gigabyte AERO 16 OLED BSF | |
| MSI Stealth 17 Studio A13VH-014 | |
| Asus ProArt StudioBook 16 H7600ZW | |
| Average Intel Core i9-13900H (75.8 - 102.3, n=25) | |
| Dell XPS 15 9530 RTX 4070 | |
* ... smaller is better
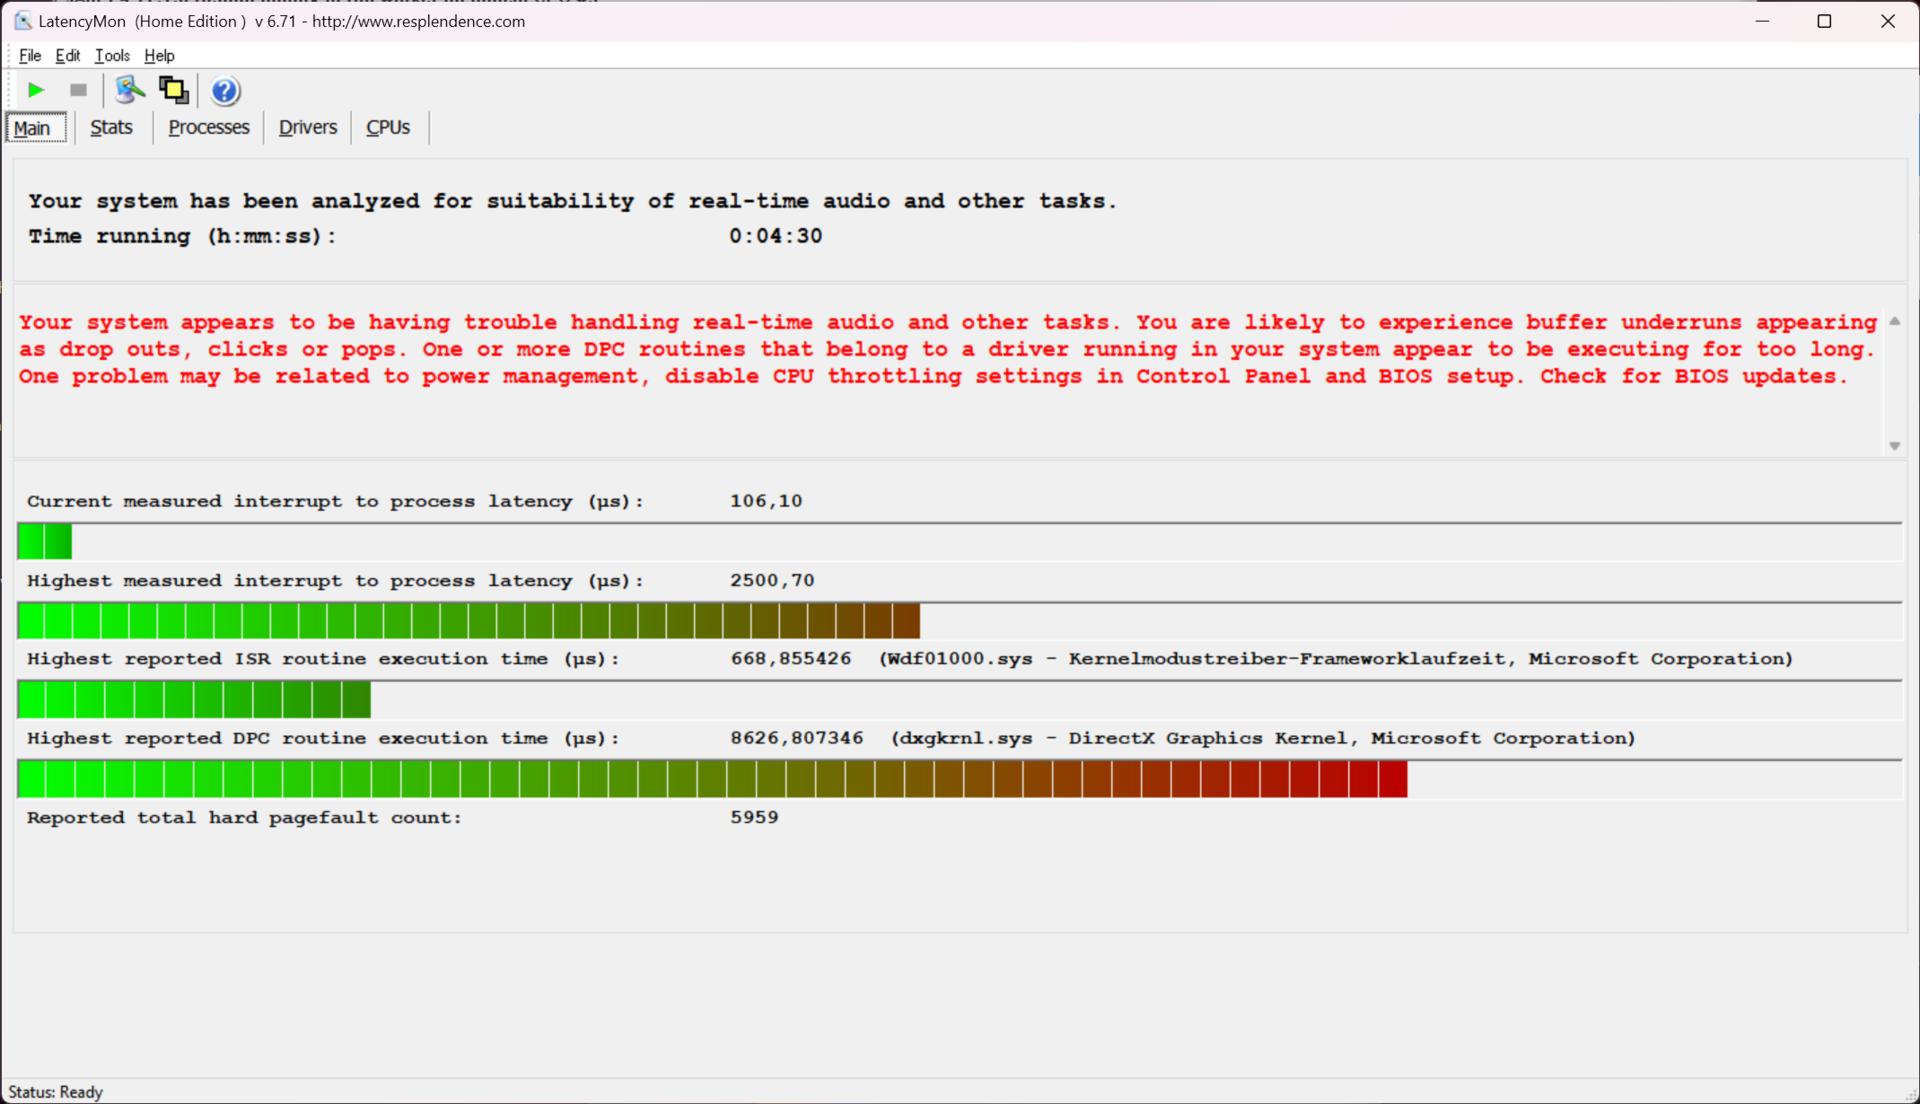
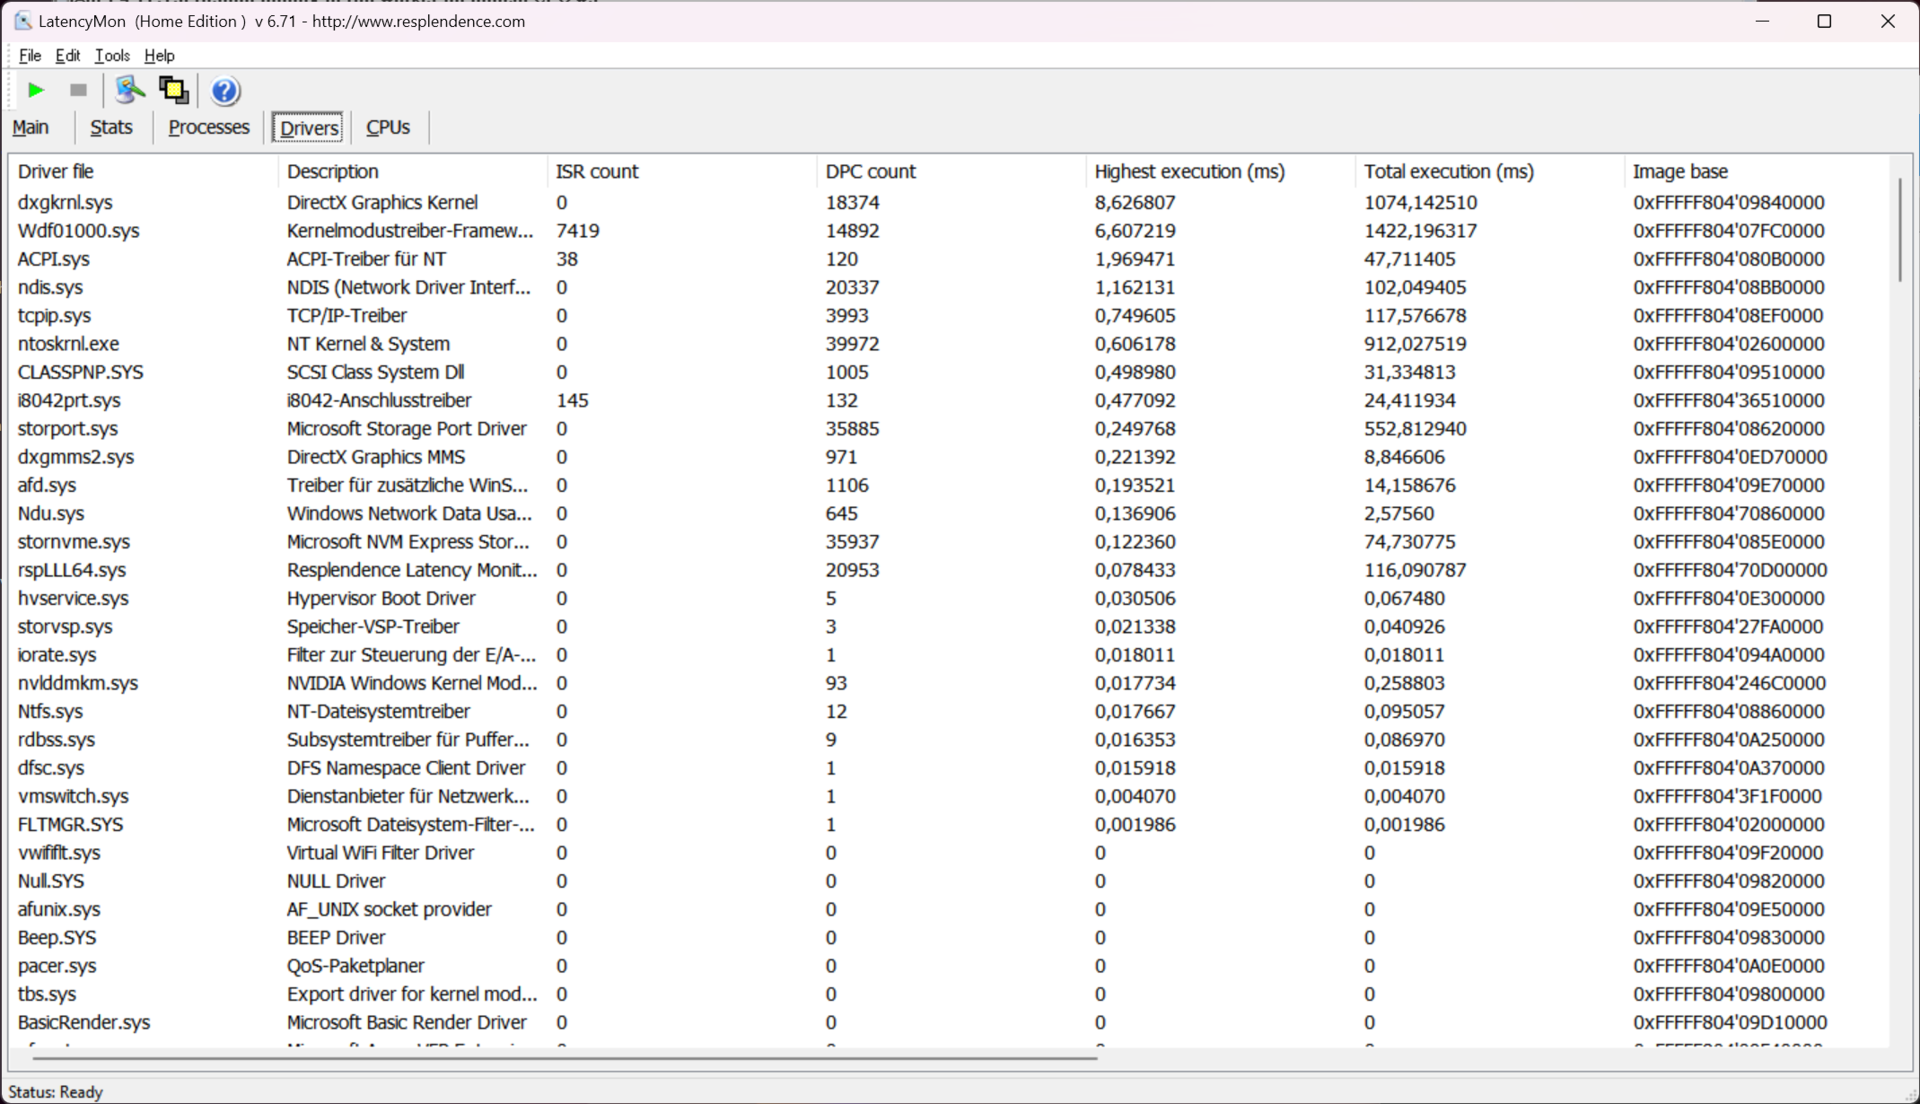
DPC延时
我们用LatencyMon测量的延迟表明Nvidia Studio图形驱动的驱动问题。然而,内核模式的驱动框架也显示出可测量的延迟。因此,该系统不适合用于实时音频处理。调整软件以及未来的更新可能会带来相当大的改善。
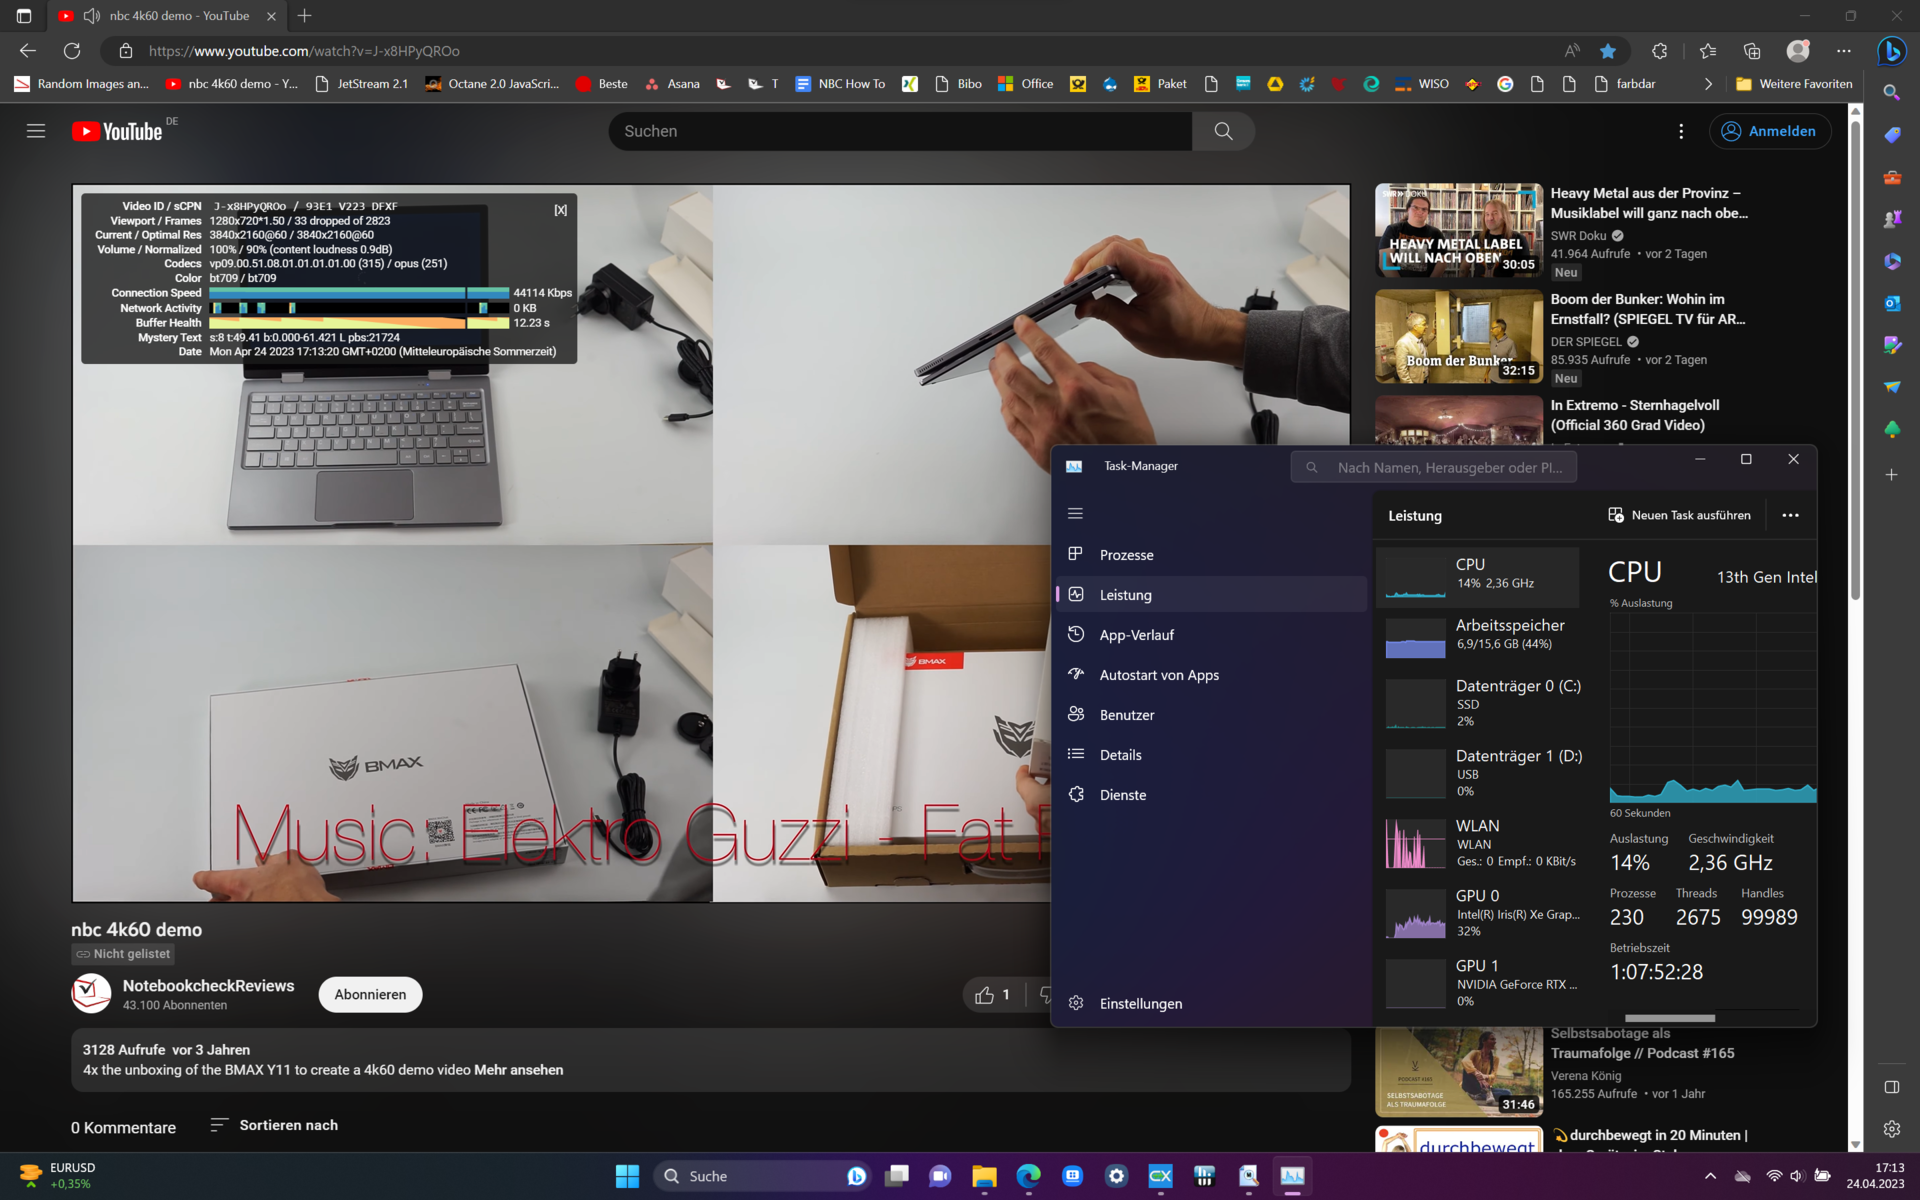
对于YouTube上的4K视频播放来说,56个丢帧也是一个低于平均水平的数值,特别是对于这种配置的多媒体笔记本。未来的驱动程序更新应该会修正这一点。在审查时,Nvidia Studio 531.61是最新安装的显卡驱动程序。
| DPC Latencies / LatencyMon - interrupt to process latency (max), Web, Youtube, Prime95 | |
| Samsung Galaxy Book3 Ultra 16 | |
| MSI Stealth 17 Studio A13VH-014 | |
| Samsung Galaxy Book3 Ultra 16, i9-13900H RTX 4070 | |
| Asus ProArt StudioBook 16 H7600ZW | |
| Dell XPS 15 9530 RTX 4070 | |
| Gigabyte AERO 16 OLED BSF | |
* ... smaller is better
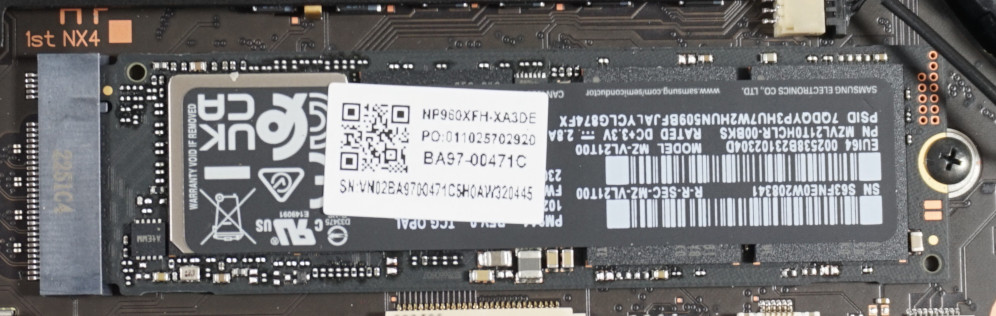
存储设备
这款M.2固态硬盘并没有任何惊喜。不出所料,这是一个三星的模型,经常在我们的测量中达到这里的数值。最大速度高于PCIe 3的能力,但不能与最好的PCIe 4固态硬盘竞争。
对于Galaxy Book3 Ultra必须处理的任务,固态硬盘在任何时候都不应该被证明是一个瓶颈。此外,在持续的负载下,访问速度保持在一个较高的水平--与华硕ProArt StudioBook 16中的相同存储设备完全相反,它被迫严重限制数据速率以防止过热。
最多,在编辑大量原始材料时,硬盘空间可能很快变得稀缺。如果底板不是那么难拆,升级会很容易。幸运的是,两个Thunderbolt 4端口可用于外部SSD。

* ... smaller is better
Sustained Read Performance: DiskSpd Read Loop, Queue Depth 8
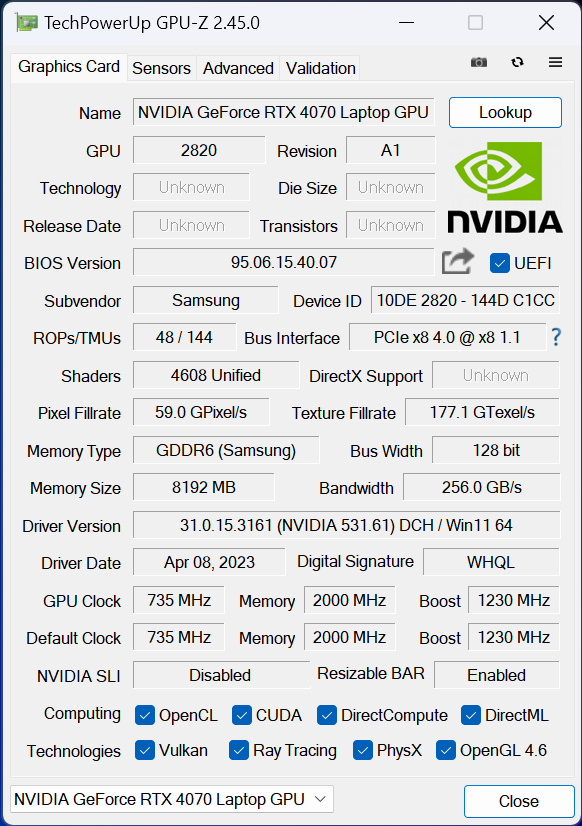
图形卡
的 NvidiaGeForce RTX 4070通常是无可指责的。它能以最高水平的细节处理当前的游戏,并超越全高清。它经常保持在接近100帧的水平。在一个 Medion Erazer Major X20、为例,它的这些性能值可以消耗115W,甚至在启动Boost时可以消耗140W。
另一方面,在三星Creator笔记本电脑中,耗电量被限制在35W,在启动Boost时则为60W。正如来自Witcher 3 的指标所显示的那样,在高负载下,60瓦被完全利用,而CPU几乎看起来没有被充分利用,其消耗率不到15瓦。显卡没有被调整到最高水平的永久负载。
另一方面,Galaxy Book Ultra在Blender中的结果与RTX 4070的平均值相差无几。主要任务,创建和编辑图形内容,被笔记本处理得非常好。
更多测量值、帧数和数据可以在我们的 GPU基准测试列表.
| 3DMark 11 Performance | 25500 points | |
| 3DMark Cloud Gate Standard Score | 34191 points | |
| 3DMark Fire Strike Score | 18076 points | |
| 3DMark Time Spy Score | 8692 points | |
Help | ||
* ... smaller is better
游戏性能

游戏决不是Galaxy Book的核心能力。这款RTX 4070在这里经常达到它的极限,因为它无法在薄薄的笔记本中驱散很多热量,而且还被限制在60W的功耗。因此,与类似配置的笔记本电脑进行比较将是不公平的。另一方面,即使在负载下,功耗也经常低于100W。在一个游戏笔记本中,如 Medion Erazer Major X20中,这个功率大约在200到300瓦之间。
一个 惠普Victus 16与一个 NvidiaGeForce RTX 3060在性能发挥到极致时也有类似的消耗率,因此三星为创意者设计的笔记本电脑在游戏方面大致上是一致的。然而,后者在一个更薄的机箱中以一半的能量实现了这些价值。有一些注意事项,可以玩最新的游戏,但由于缺乏冷却和有限的功耗,这款笔记本电脑根本不是为此设计的。
Witcher 3 中的fps时钟始终保持稳定。平均77帧是一个可敬的数值。这一点保持不变,说明了组件的充分冷却。因此,三星的笔记本应该能够以稳定的水平处理更广泛的计算任务。
Witcher 3 FPS chart
| low | med. | high | ultra | QHD | |
|---|---|---|---|---|---|
| GTA V (2015) | 150.1 | 74.7 | 64.5 | ||
| The Witcher 3 (2015) | 161 | 71 | |||
| Dota 2 Reborn (2015) | 99.7 | 97.4 | |||
| Final Fantasy XV Benchmark (2018) | 82 | 60.2 | |||
| X-Plane 11.11 (2018) | 72.2 | ||||
| Far Cry 5 (2018) | 98 | 92 | 79 | ||
| Strange Brigade (2018) | 173.9 | 148.7 | 106.2 | ||
| Cyberpunk 2077 1.6 (2022) | 71 | 65 | 42 | ||
| F1 22 (2022) | 109 | 54 | 36 | ||
| Hogwarts Legacy (2023) | 57 | 41 | 35 |
排放--安静的、热的创作者笔记本
噪声
只要硬件不过分紧张,Galaxy Book3 Ultra就能完全保持安静。在较高的热量发展过程中,适度的风扇噪音会出现,这仍然是一个非常可容忍的范围,低于40dB。
只有在最大负荷下,风扇才会真正地响起来。超过50分贝不是一个你可以期望完全集中工作的数值。这可以通过静音模式来改变。虽然系统性能也明显下降,但我们测得平均减少8分贝,这几乎是一半的音量。
更大的风扇和一个体积稍大的冷却系统可以显著改善结果,但会使笔记本整体更大。例如,微星Stealth 17 Studio的性能率明显更高,令人印象深刻地证明了这一点。然而,它更重,而且厚得多。
Noise level
| Idle |
| 25.2 / 25.2 / 31.3 dB(A) |
| Load |
| 38.8 / 51.2 dB(A) |
 | ||
30 dB silent 40 dB(A) audible 50 dB(A) loud |
||
min: | ||
| Samsung Galaxy Book3 Ultra 16, i9-13900H RTX 4070 GeForce RTX 4070 Laptop GPU, i9-13900H, Samsung PM9A1 MZVL21T0HCLR | Dell XPS 15 9530 RTX 4070 GeForce RTX 4070 Laptop GPU, i7-13700H, SK hynix PC801 HFS001TEJ9X101N | MSI Stealth 17 Studio A13VH-014 GeForce RTX 4080 Laptop GPU, i9-13900H, Samsung PM9A1 MZVL22T0HBLB | Asus ProArt StudioBook 16 H7600ZW GeForce RTX 3070 Ti Laptop GPU, i9-12900H, Samsung PM9A1 MZVL21T0HCLR | Gigabyte AERO 16 OLED BSF GeForce RTX 4070 Laptop GPU, i9-13900H, Gigabyte AG470S1TB-SI B10 | Samsung Galaxy Book3 Ultra 16 GeForce RTX 4050 Laptop GPU, i7-13700H, Samsung PM9A1 MZVL2512HCJQ | |
|---|---|---|---|---|---|---|
| Noise | 15% | 9% | 19% | -4% | 3% | |
| off / environment * (dB) | 25.2 | 23.1 8% | 24 5% | 19.55 22% | 23 9% | 25 1% |
| Idle Minimum * (dB) | 25.2 | 23.1 8% | 24 5% | 20.07 20% | 23 9% | 26 -3% |
| Idle Average * (dB) | 25.2 | 23.1 8% | 24 5% | 20.07 20% | 23 9% | 27 -7% |
| Idle Maximum * (dB) | 31.3 | 24.2 23% | 24 23% | 20.07 36% | 33.64 -7% | 28 11% |
| Load Average * (dB) | 38.8 | 27.1 30% | 34.49 11% | 34.53 11% | 51.49 -33% | 40 -3% |
| Load Maximum * (dB) | 51.2 | 44.6 13% | 49.66 3% | 49.21 4% | 55.24 -8% | 41 20% |
| Witcher 3 ultra * (dB) | 40.1 | 48.29 | 49.1 | 55.27 | 39 |
* ... smaller is better
温度
Galaxy Book3几乎在任何场合都会变热。即使是一点点的冲浪,也足以使底部发热,以至于把笔记本放在腿上变得不舒服。
如果需要最大的性能,键盘会变得非常热。我们在底部登记了更高的温度,因此,在渲染较大的视频文件时,建议使用笔记本支架,例如。
(-) The maximum temperature on the upper side is 45.9 °C / 115 F, compared to the average of 36.8 °C / 98 F, ranging from 21 to 71 °C for the class Multimedia.
(-) The bottom heats up to a maximum of 50.9 °C / 124 F, compared to the average of 39.1 °C / 102 F
(+) In idle usage, the average temperature for the upper side is 29.7 °C / 85 F, compared to the device average of 31.3 °C / 88 F.
(-) Playing The Witcher 3, the average temperature for the upper side is 39.2 °C / 103 F, compared to the device average of 31.3 °C / 88 F.
(±) The palmrests and touchpad can get very hot to the touch with a maximum of 37.2 °C / 99 F.
(-) The average temperature of the palmrest area of similar devices was 28.7 °C / 83.7 F (-8.5 °C / -15.3 F).
| Samsung Galaxy Book3 Ultra 16, i9-13900H RTX 4070 Intel Core i9-13900H, NVIDIA GeForce RTX 4070 Laptop GPU | Dell XPS 15 9530 RTX 4070 Intel Core i7-13700H, NVIDIA GeForce RTX 4070 Laptop GPU | Gigabyte AERO 16 OLED BSF Intel Core i9-13900H, NVIDIA GeForce RTX 4070 Laptop GPU | MSI Stealth 17 Studio A13VH-014 Intel Core i9-13900H, NVIDIA GeForce RTX 4080 Laptop GPU | Samsung Galaxy Book3 Ultra 16 Intel Core i7-13700H, NVIDIA GeForce RTX 4050 Laptop GPU | Asus ProArt StudioBook 16 H7600ZW Intel Core i9-12900H, NVIDIA GeForce RTX 3070 Ti Laptop GPU | |
|---|---|---|---|---|---|---|
| Heat | 3% | 20% | 1% | 19% | 11% | |
| Maximum Upper Side * (°C) | 45.9 | 45.6 1% | 41 11% | 47 -2% | 41 11% | 41.6 9% |
| Maximum Bottom * (°C) | 50.9 | 42 17% | 47 8% | 54 -6% | 44 14% | 41.4 19% |
| Idle Upper Side * (°C) | 31.6 | 34.4 -9% | 23 27% | 30 5% | 23 27% | 31.8 -1% |
| Idle Bottom * (°C) | 34.2 | 33.2 3% | 23 33% | 32 6% | 26 24% | 29.2 15% |
* ... smaller is better
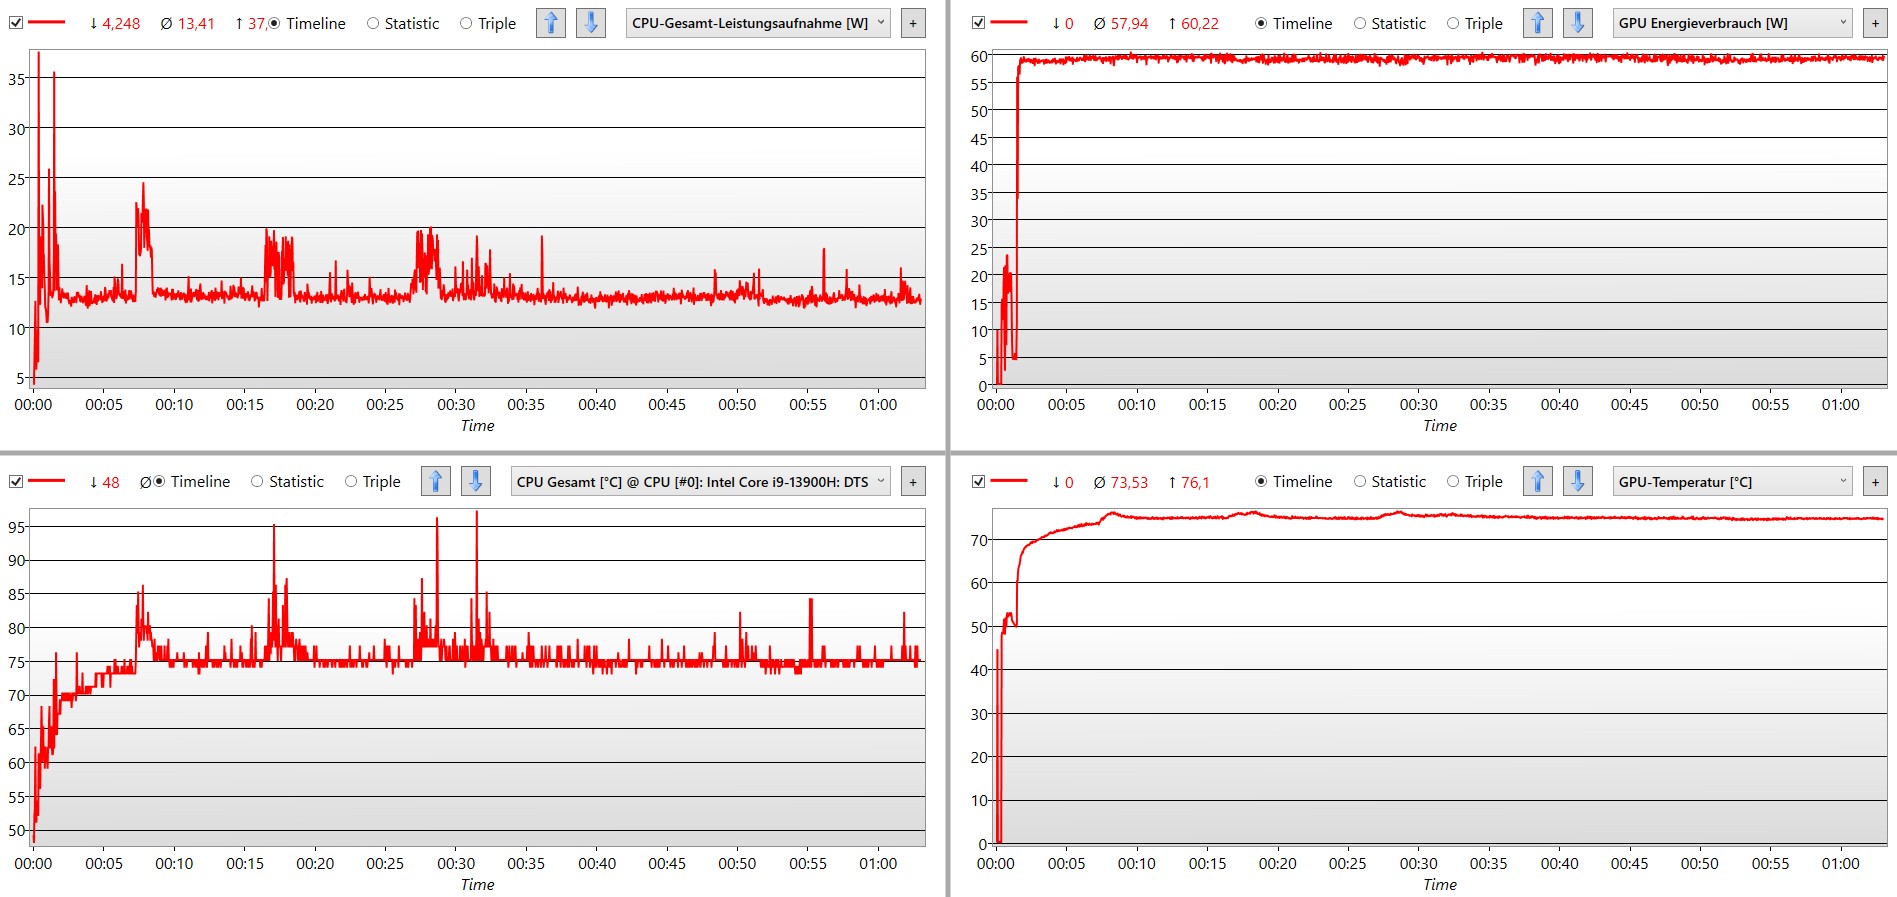
压力测试
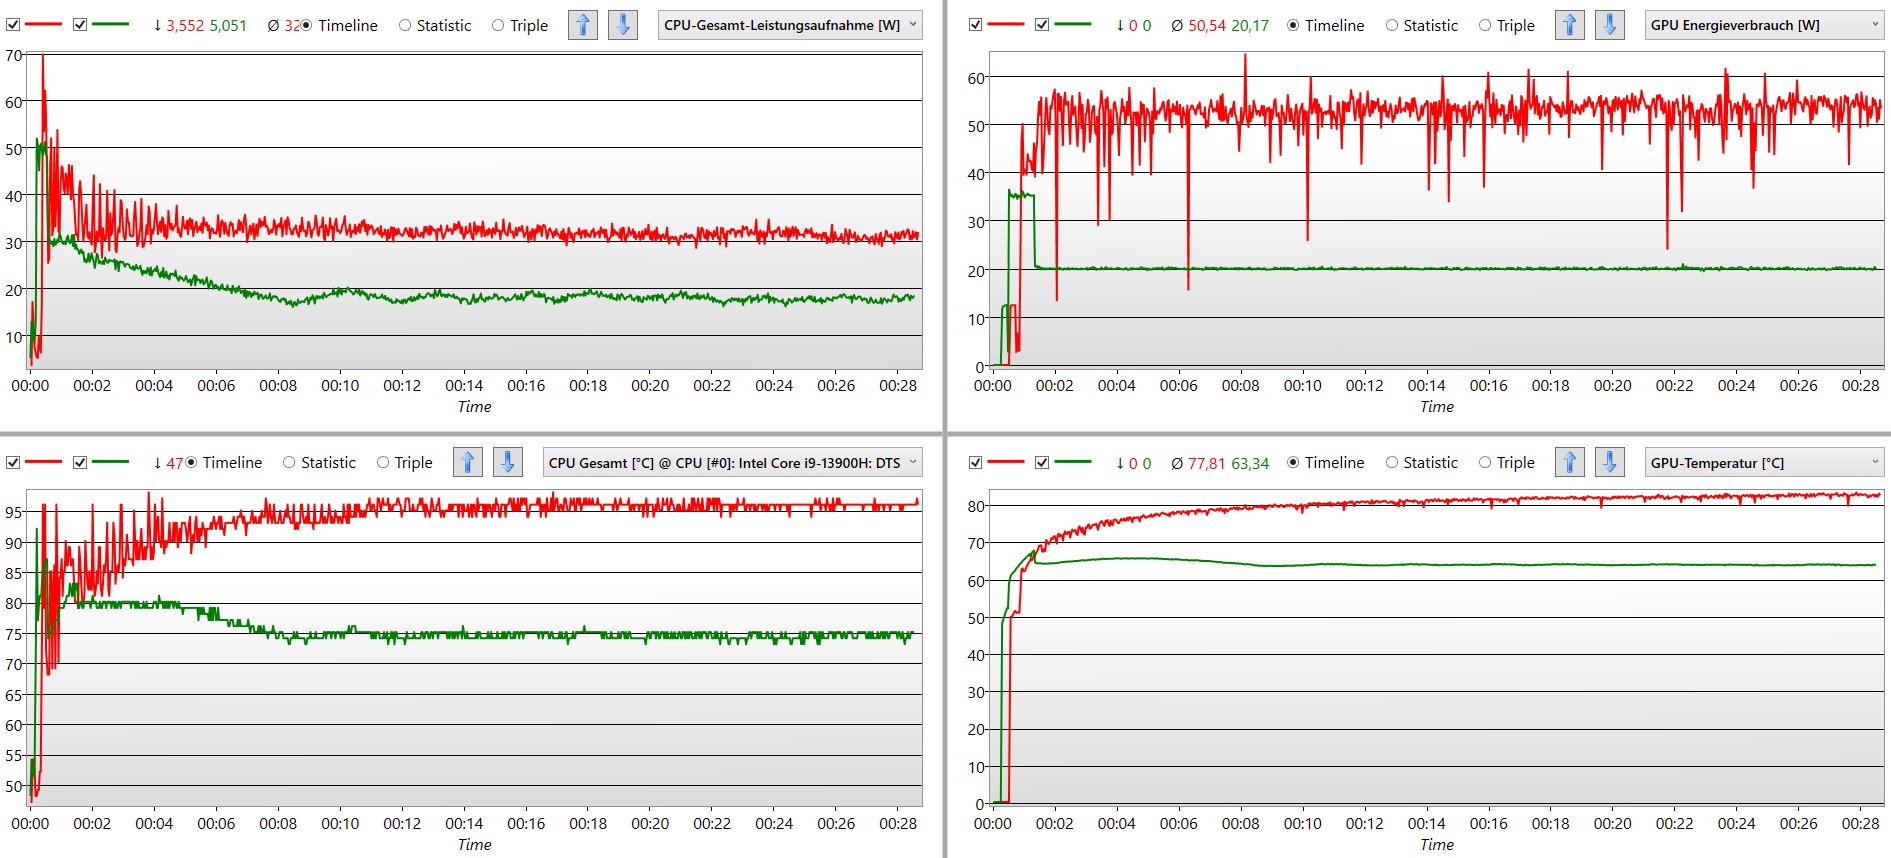
在最大负荷下,处理器在长期运行中允许的功率仅低于30W。另一方面,显卡则相对稳定地保持在略低于50W的高水平。Galaxy Book3 Ultra变得如此之热的事实,从CPU和GPU的温度曲线可以看出。尽管它们在大约10分钟后几乎保持水平,但它们分别达到了惊人的95和80℃。再加上小的冷却系统,这导致了一个非常温暖的箱子。尽管如此,这台笔记本电脑还是能够在长时间内利用电源允许的100瓦的功率。
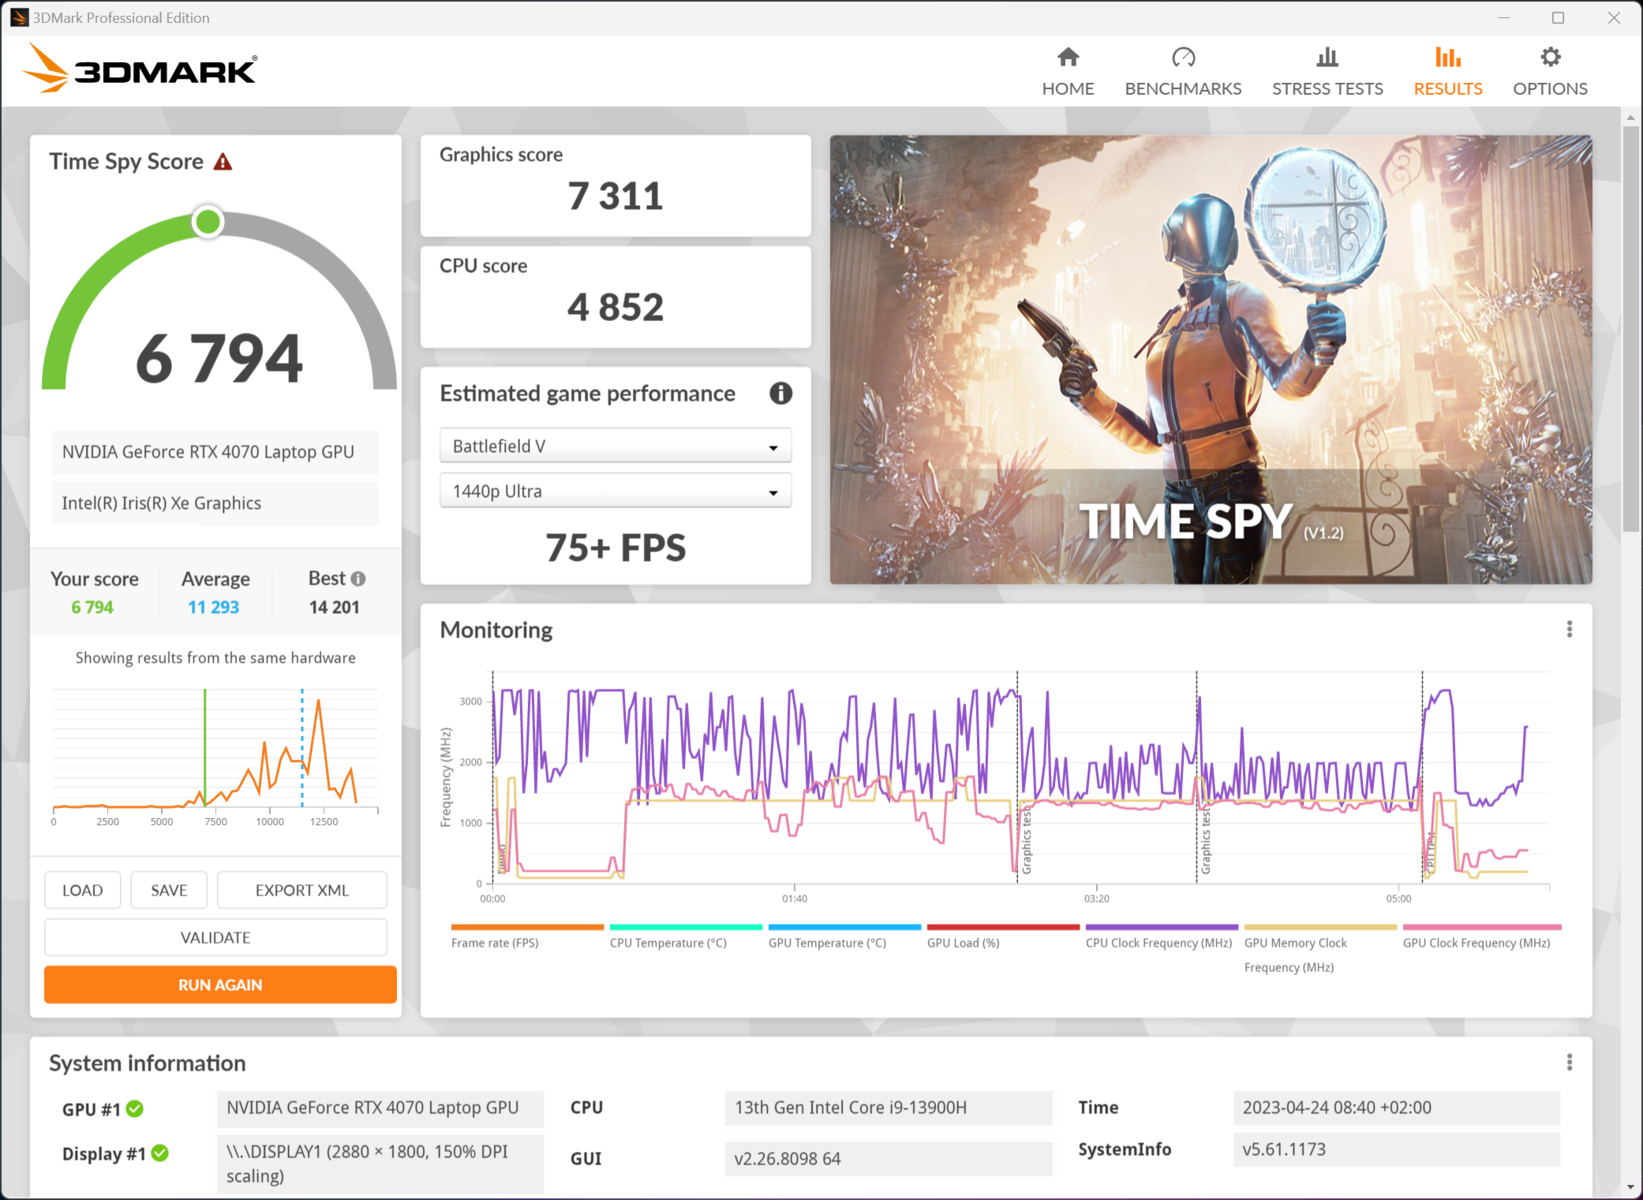
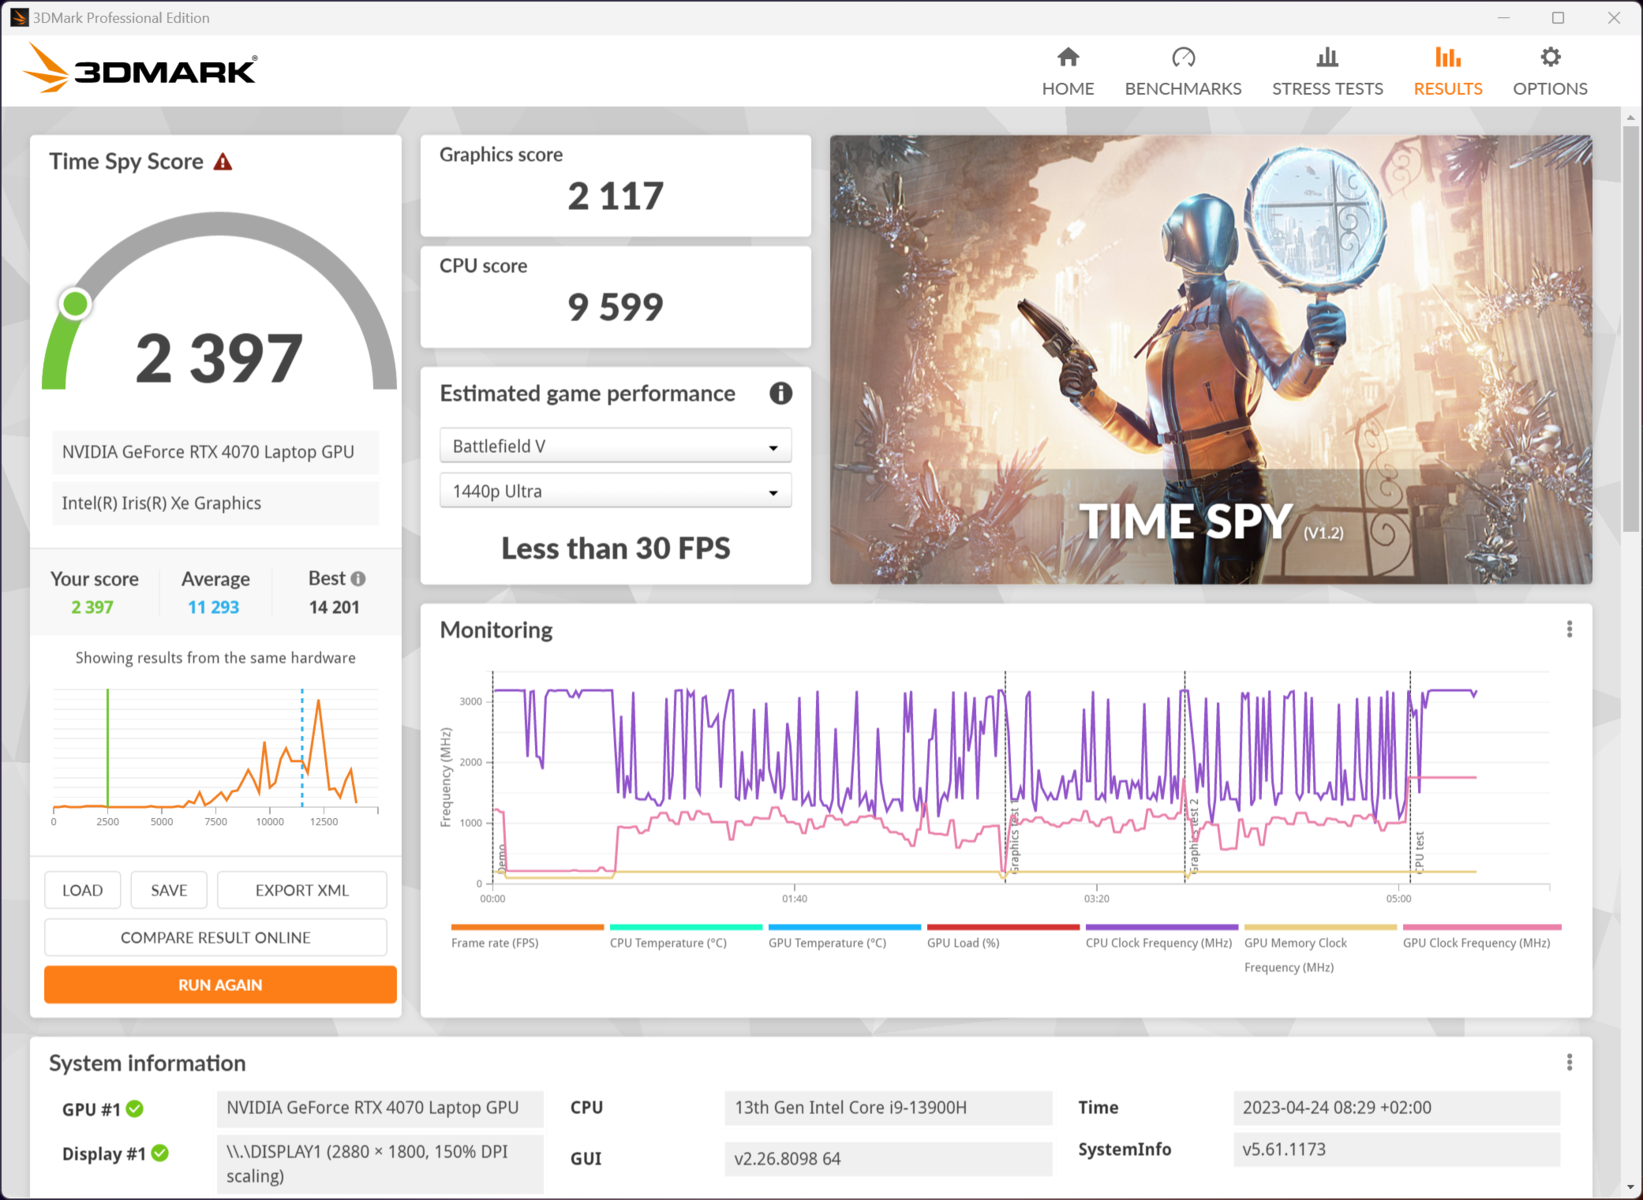
在静音 模式下可以观察到明显的变化。不仅噪音排放急剧下降,CPU和GPU的功耗也从90瓦下降到40瓦左右。虽然有明显的性能损失,特别是在图形性能方面,但该模式似乎适合于长期安静工作,尽管计算需求增加。
发言人
AKG的立体声扬声器只能部分地满足人们对该品牌的期望。强大的低音和细致的中音,加上高超的音质,使从摇滚到电子的音乐听起来都很好。然而,与许多型号一样,低中音可以做得更有力一些。总的来说,混合绝对是好的,特别是对于视频流。
遗憾的是,我们观察到高音部分有强烈的过载现象,这在频率图中也可以清楚地看到。
Samsung Galaxy Book3 Ultra 16, i9-13900H RTX 4070 audio analysis
(+) | speakers can play relatively loud (85.7 dB)
Bass 100 - 315 Hz
(-) | nearly no bass - on average 15.8% lower than median
(-) | bass is not linear (16.6% delta to prev. frequency)
Mids 400 - 2000 Hz
(+) | balanced mids - only 2.9% away from median
(+) | mids are linear (3.8% delta to prev. frequency)
Highs 2 - 16 kHz
(+) | balanced highs - only 4.7% away from median
(±) | linearity of highs is average (9.5% delta to prev. frequency)
Overall 100 - 16.000 Hz
(+) | overall sound is linear (13.8% difference to median)
Compared to same class
» 30% of all tested devices in this class were better, 4% similar, 65% worse
» The best had a delta of 5%, average was 17%, worst was 45%
Compared to all devices tested
» 15% of all tested devices were better, 4% similar, 81% worse
» The best had a delta of 4%, average was 23%, worst was 134%
Apple MacBook Pro 16 2021 M1 Pro audio analysis
(+) | speakers can play relatively loud (84.7 dB)
Bass 100 - 315 Hz
(+) | good bass - only 3.8% away from median
(+) | bass is linear (5.2% delta to prev. frequency)
Mids 400 - 2000 Hz
(+) | balanced mids - only 1.3% away from median
(+) | mids are linear (2.1% delta to prev. frequency)
Highs 2 - 16 kHz
(+) | balanced highs - only 1.9% away from median
(+) | highs are linear (2.7% delta to prev. frequency)
Overall 100 - 16.000 Hz
(+) | overall sound is linear (4.6% difference to median)
Compared to same class
» 0% of all tested devices in this class were better, 0% similar, 100% worse
» The best had a delta of 5%, average was 17%, worst was 45%
Compared to all devices tested
» 0% of all tested devices were better, 0% similar, 100% worse
» The best had a delta of 4%, average was 23%, worst was 134%
电源管理--造物主笔记本具有强大的耐力
消耗功率
Galaxy Book在低负荷时是非常经济的。尽管有大而相对明亮的显示屏,但对于大多数简单的任务来说,耗电量仍然低于10W。许多拥有如此强大硬件的对手的耗电量是其两倍。
在负载情况下,通过USB-C提供100瓦的电源适配器的最大可能供应量被完全利用。正如我们在压力测试中的测量结果显示,笔记本电脑可以长时间吸收和使用这个功率。然而,在这种负载下,给电池充电是不可能的。至少我们在压力测试中没有观察到电池耗尽的情况。
| Off / Standby | |
| Idle | |
| Load |
|
Key:
min: | |
| Samsung Galaxy Book3 Ultra 16, i9-13900H RTX 4070 i9-13900H, GeForce RTX 4070 Laptop GPU, Samsung PM9A1 MZVL21T0HCLR, OLED / AMOLED, 2880x1800, 16" | Dell XPS 15 9530 RTX 4070 i7-13700H, GeForce RTX 4070 Laptop GPU, SK hynix PC801 HFS001TEJ9X101N, OLED, 3456x2160, 15.6" | MSI Stealth 17 Studio A13VH-014 i9-13900H, GeForce RTX 4080 Laptop GPU, Samsung PM9A1 MZVL22T0HBLB, Mini LED, 3840x2160, 17.3" | Asus ProArt StudioBook 16 H7600ZW i9-12900H, GeForce RTX 3070 Ti Laptop GPU, Samsung PM9A1 MZVL21T0HCLR, OLED, 3840x2400, 16" | Gigabyte AERO 16 OLED BSF i9-13900H, GeForce RTX 4070 Laptop GPU, Gigabyte AG470S1TB-SI B10, OLED, 3840x2400, 16" | Samsung Galaxy Book3 Ultra 16 i7-13700H, GeForce RTX 4050 Laptop GPU, Samsung PM9A1 MZVL2512HCJQ, AMOLED, 2880x1800, 16" | Average NVIDIA GeForce RTX 4070 Laptop GPU | Average of class Multimedia | |
|---|---|---|---|---|---|---|---|---|
| Power Consumption | -135% | -130% | -132% | -102% | 14% | -145% | -27% | |
| Idle Minimum * (Watt) | 4.3 | 20 -365% | 13.9 -223% | 12.6 -193% | 11.8 -174% | 3 30% | 13.2 ? -207% | 5.66 ? -32% |
| Idle Average * (Watt) | 4.6 | 20.7 -350% | 20 -335% | 17.41 -278% | 16.1 -250% | 5 -9% | 18.2 ? -296% | 10.2 ? -122% |
| Idle Maximum * (Watt) | 11.4 | 22.4 -96% | 20.6 -81% | 23.12 -103% | 17 -49% | 11 4% | 24.6 ? -116% | 12.5 ? -10% |
| Load Average * (Watt) | 97 | 77.1 21% | 77 21% | 117.5 -21% | 100.6 -4% | 72 26% | 97 ? -0% | 65.2 ? 33% |
| Witcher 3 ultra * (Watt) | 100.9 | 95.4 5% | 162 -61% | 172.6 -71% | 158 -57% | 69.7 31% | ||
| Load Maximum * (Watt) | 107 | 133.4 -25% | 216 -102% | 241.36 -126% | 192 -79% | 108 -1% | 221 ? -107% | 113.5 ? -6% |
* ... smaller is better
Power consumption Witcher 3 / Stress test
Power consumption with an external monitor
电池寿命
正如低负载下的低耗电率所表明的那样,这款笔记本的运行时间非常可观。尽管76Wh的电池与竞争对手相比相当小,但在播放全高清视频和激烈的冲浪时,它被证明是非常耐用的。Galaxy Book3 Ultra 16的较弱变体甚至能多提供几个小时。
视频测试中的9小时和网络冲浪中的8小时令人印象深刻。OLED显示屏自然对运行时间有非常大的影响。我们在最大亮度下实现了不到6小时的运行时间。另一方面,如果在网络浏览器中激活黑暗模式或强制所有网站使用黑暗模式,笔记本可以挤出额外的两个小时的冲浪时间,也就是刚刚超过10小时。
| Samsung Galaxy Book3 Ultra 16, i9-13900H RTX 4070 i9-13900H, GeForce RTX 4070 Laptop GPU, 76 Wh | Dell XPS 15 9530 RTX 4070 i7-13700H, GeForce RTX 4070 Laptop GPU, 86 Wh | MSI Stealth 17 Studio A13VH-014 i9-13900H, GeForce RTX 4080 Laptop GPU, 99 Wh | Asus ProArt StudioBook 16 H7600ZW i9-12900H, GeForce RTX 3070 Ti Laptop GPU, 90 Wh | Gigabyte AERO 16 OLED BSF i9-13900H, GeForce RTX 4070 Laptop GPU, 88 Wh | Samsung Galaxy Book3 Ultra 16 i7-13700H, GeForce RTX 4050 Laptop GPU, 76 Wh | Average of class Multimedia | |
|---|---|---|---|---|---|---|---|
| Battery runtime | 34% | 3% | 1% | 36% | 56% | 76% | |
| H.264 (h) | 9 | 5.6 -38% | 9.7 8% | 7.4 -18% | 13.4 49% | 17.1 ? 90% | |
| WiFi v1.3 (h) | 8 | 8 0% | 5.6 -30% | 7.5 -6% | 7.5 -6% | 9.6 20% | 12.2 ? 53% |
| Load (h) | 0.9 | 1.5 67% | 1.6 78% | 0.9 0% | 2.1 133% | 1.8 100% | 1.664 ? 85% |
| Witcher 3 ultra (h) | 2.6 | 1.3 |
Pros
Cons
结论 -Galaxy Book Ultra为内容创作而设计
三星通过Galaxy Book3 Ultra 16击中了靶心:该笔记本提供了大量的性能和创造性工作的完美显示。纤细而谨慎的外壳使笔记本看起来像一个专业的工作工具,而这种印象只是在我们的测量和基准测试中得到了进一步加强。三个视频输出、成功的触摸板和负载下的安静运行完全符合整体情况。
Galaxy Book3 Ultra为创意任务提供了一切。屏幕、系统性能和制造质量都非常协调。然而,为了一个超薄的外壳,必须牺牲顶级性能。
同时,对CPU和GPU电源的大力削减确保了对视频和图像处理及渲染的纯粹关注。Galaxy Book3在游戏方面表现不佳,尽管我们能够在最高设置下玩最新的游戏。然而,在 RTX 4070在这里的作用更像是 RTX 3060的水平,尽管它更经济、更安静。
也有一些缺点。创造者的笔记本电脑在长时间推动下会发热。在要求不高的任务中,底面和键盘也会明显发热,有点太热。微型SD插槽本可以是一个完整的读卡器。此外,扬声器的声音很好。然而,它们在高频下过载的事实不应该发生在这个级别。
就其对媒体处理的关注而言,三星笔记本是最接近于 MacBook Pro,即使Mac和Windows只能在有限的范围内进行比较。另一方面,如果需要更多的图形性能,这可能意味着更大的外壳和更高的功耗,同样安静的 MSI Stealth 17 Studio或 Gigabyte AERO 16 OLED都是不错的选择。
价格和可用性
在美国,我们审查的三星Galaxy Book3 Ultra 16的配置是i9-13900H和RTX 4070,通过三星的产品页面,售价为2999.99美元。.
其他国家的感兴趣的买家可以在这里选择他们的位置https://www.samsung.com/us/common/visitlocationsite/(如适用),并在搜索栏中输入Book3 Ultra 16 来检查是否有货。
价格截至2023年5月9日,可能会有变化。
Samsung Galaxy Book3 Ultra 16, i9-13900H RTX 4070
- 04/27/2023 v7 (old)
Mario Petzold
Transparency
The selection of devices to be reviewed is made by our editorial team. The test sample was provided to the author as a loan by the manufacturer or retailer for the purpose of this review. The lender had no influence on this review, nor did the manufacturer receive a copy of this review before publication. There was no obligation to publish this review. As an independent media company, Notebookcheck is not subjected to the authority of manufacturers, retailers or publishers.
This is how Notebookcheck is testing
Every year, Notebookcheck independently reviews hundreds of laptops and smartphones using standardized procedures to ensure that all results are comparable. We have continuously developed our test methods for around 20 years and set industry standards in the process. In our test labs, high-quality measuring equipment is utilized by experienced technicians and editors. These tests involve a multi-stage validation process. Our complex rating system is based on hundreds of well-founded measurements and benchmarks, which maintains objectivity. Further information on our test methods can be found here.
Price comparison

