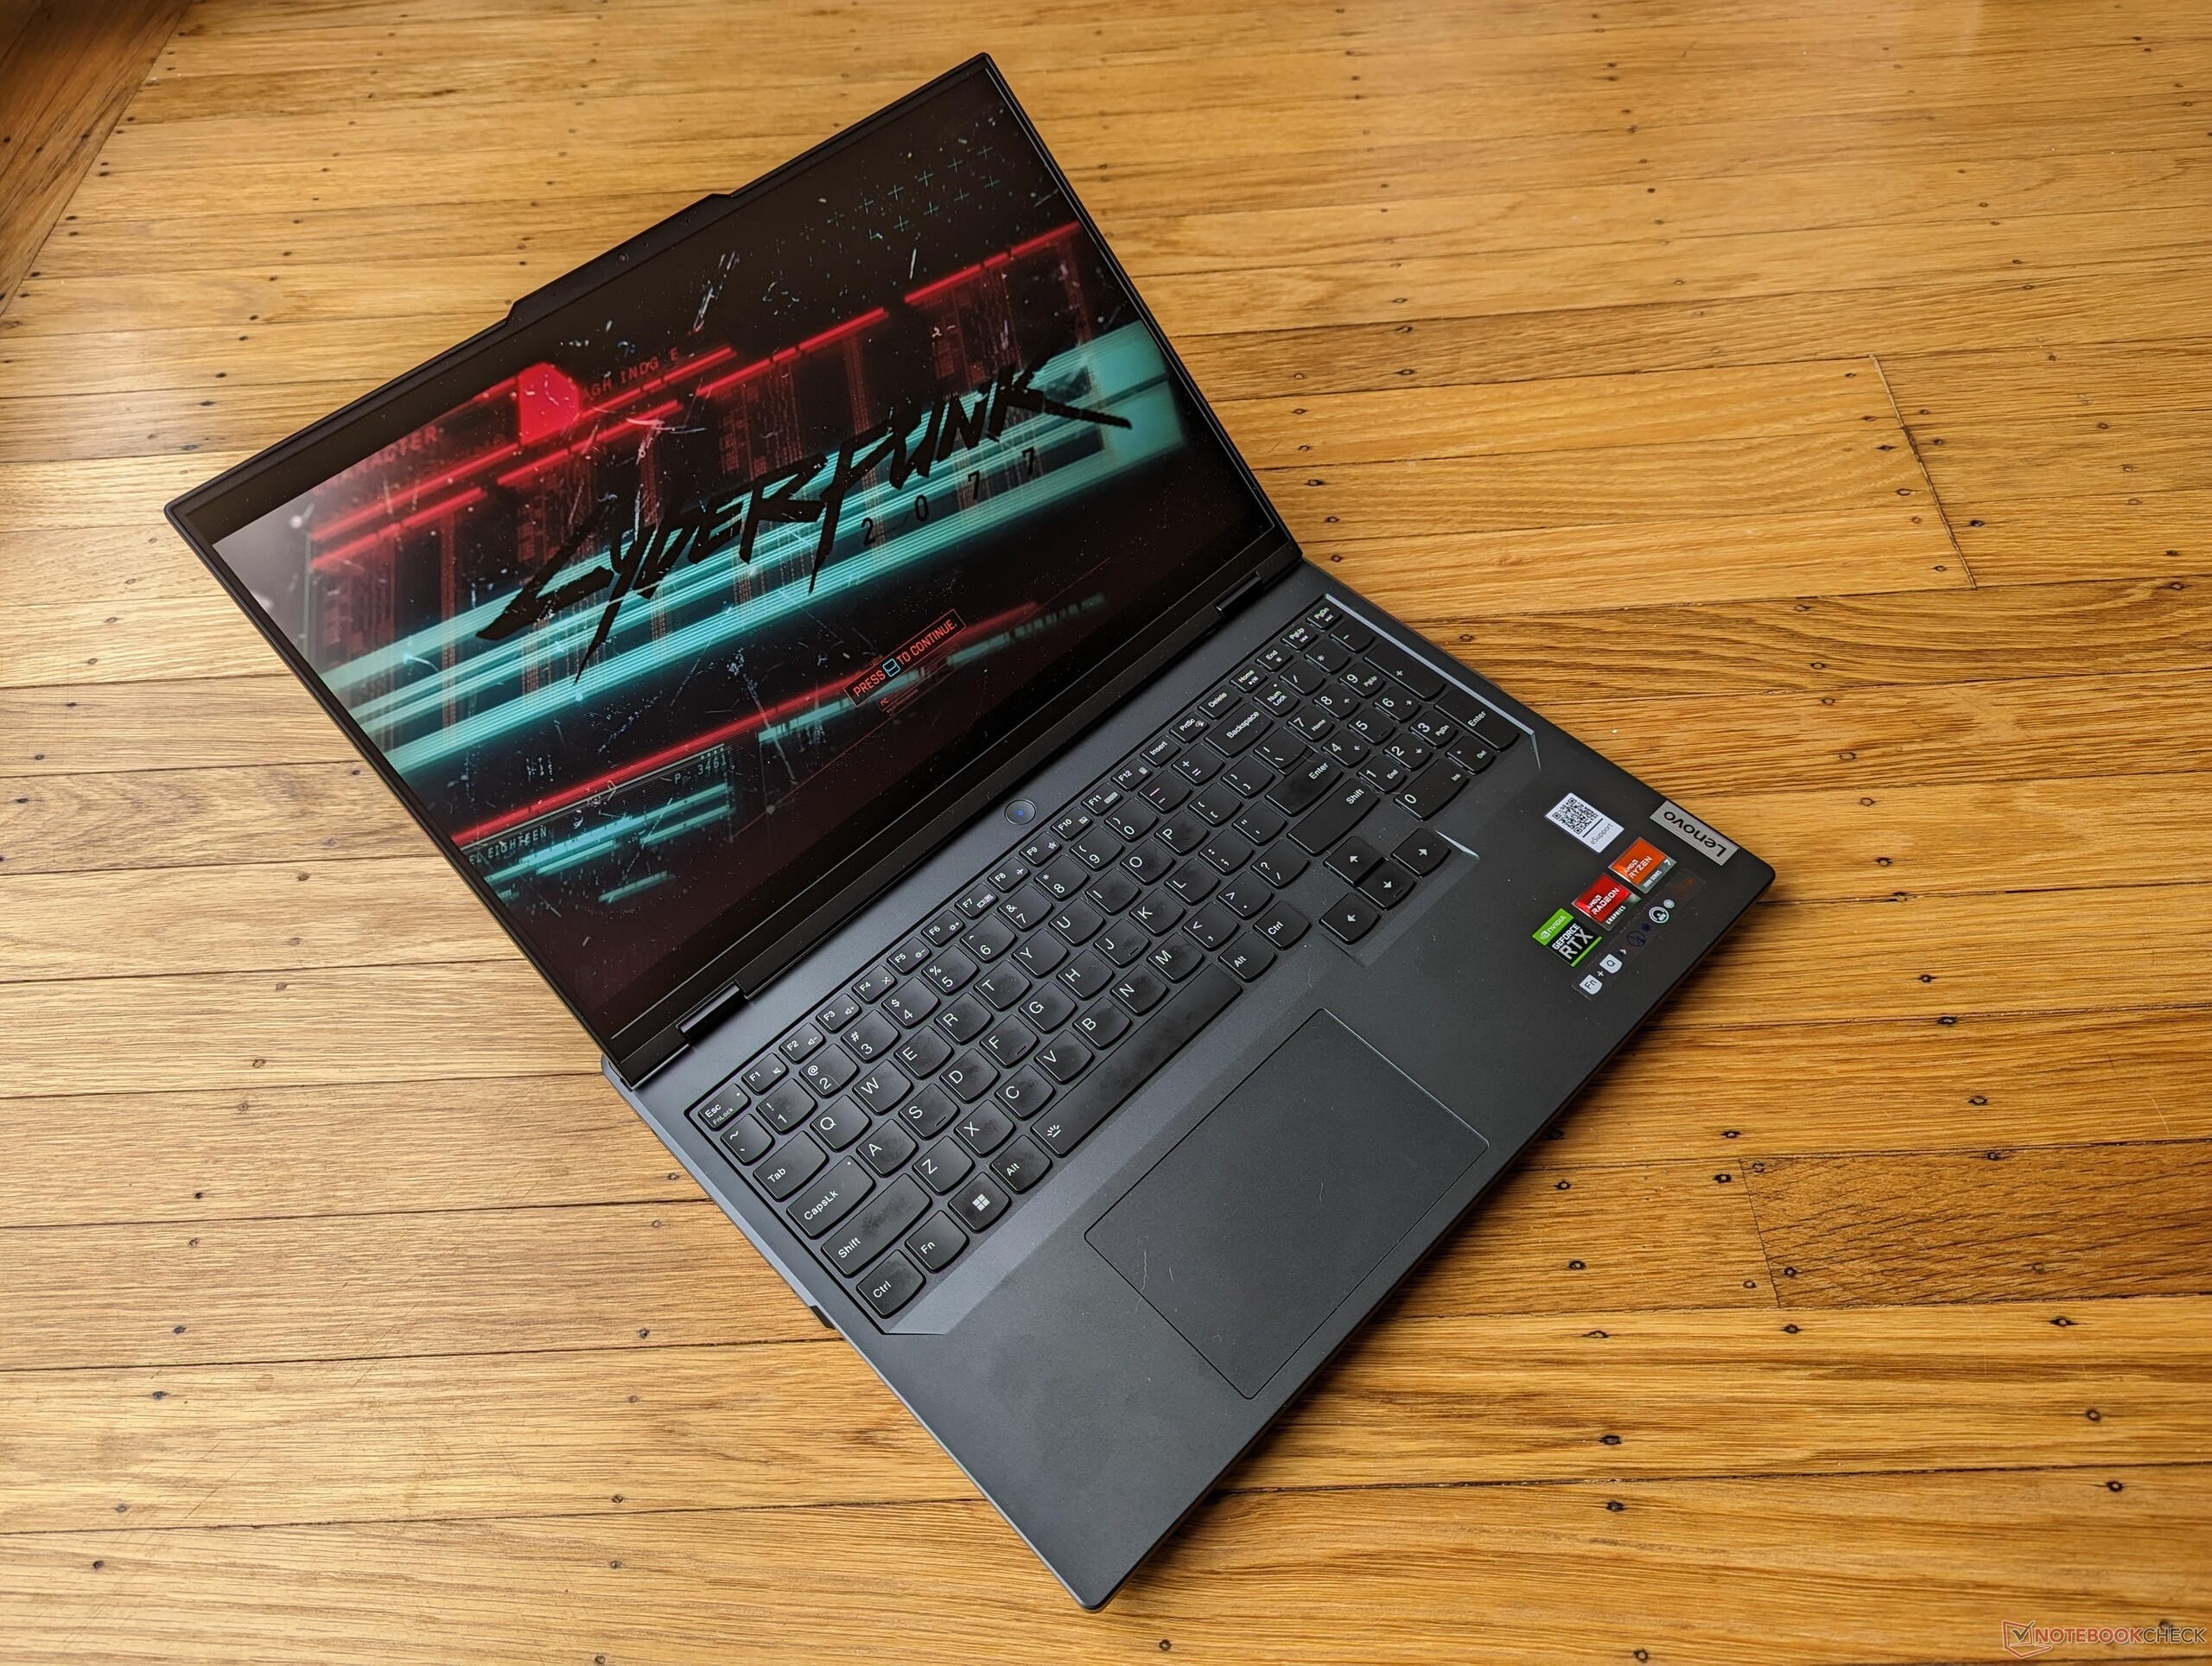
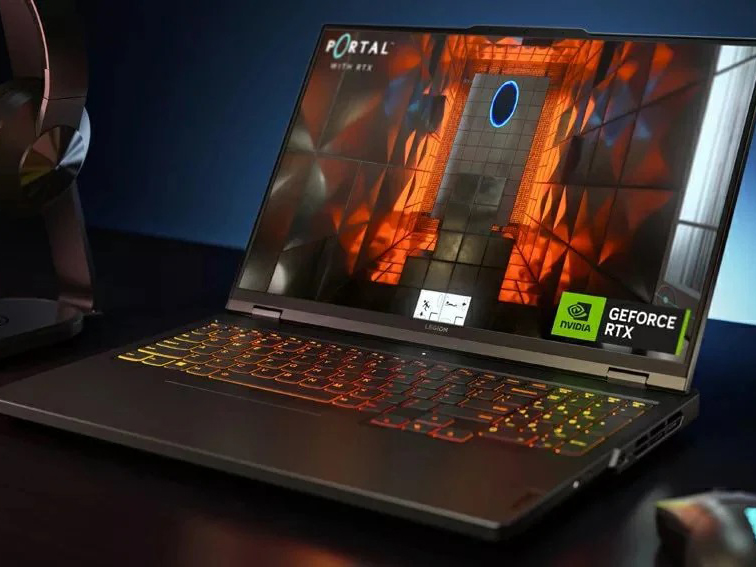
Ryzen 7 7745HX性能首次亮相:联想Legion Pro 5 16代8笔记本评测

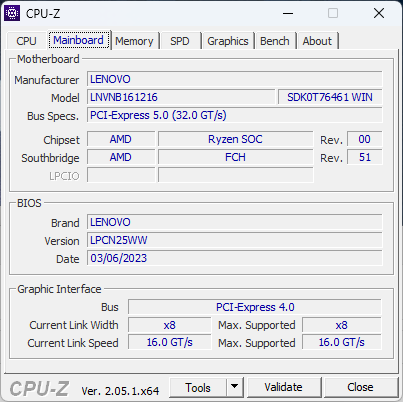
联想Legion Pro 5 16ARX8是英特尔Legion Pro 5 16IRX8的AMD版本。两种型号都采用相同的Legion Pro 5 16 Gen 8机箱,其他方面在视觉上是相同的。我们建议查看我们的 关于Legion Pro 5 16IRX8的现有评论以了解更多关于该型号的物理特性,因为我们的许多评论仍然适用于Legion Pro 5 16ARX8。
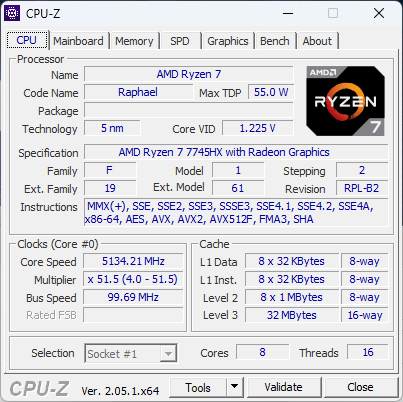
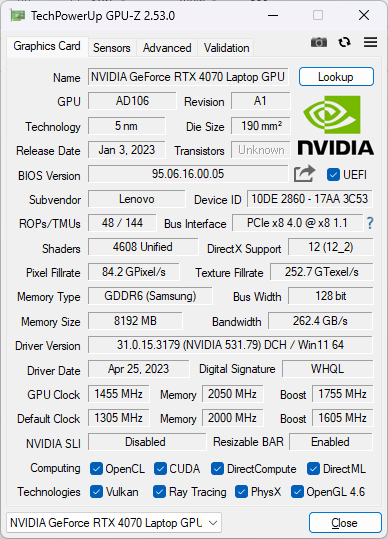
我们的测试装置是一个更高端的配置,配备Zen 4 Ryzen 7 7745HX CPU,140 WGeForce RTX 4070 GPU,以及165 Hz 1600p IPS显示屏,零售价约为1600美元。其他SKU可能包括Ryzen 5 7645HX,GeForce RTX 4050,或240 Hz IPS显示屏。这款特殊的机型是首批配备中端Ryzen 7 7745HX的机型之一,而早期的Zen 4笔记本电脑只配备价格较高的Ryzen 9 7945HX。
这一领域的竞争者包括其他中端到高端游戏笔记本电脑,如 华硕ROG Strix G16, Razer Blade 16, 联合利华GM6PX7X, 或 MSI Pulse GL76.Legion 7系列比我们的Legion Pro 5高一个档次,有更快的CPU和GPU选项可供挑选。
更多联想的评论:
潜在的竞争对手比较
Rating | Date | Model | Weight | Height | Size | Resolution | Price |
|---|---|---|---|---|---|---|---|
| 88.4 % v7 (old) | 05 / 2023 | Lenovo Legion Pro 5 16ARX8 R7 7745HX, GeForce RTX 4070 Laptop GPU | 2.5 kg | 26.8 mm | 16.00" | 2560x1600 | |
| 87.9 % v7 (old) | 05 / 2023 | Lenovo Legion Pro 5 16IRX8 i7-13700HX, GeForce RTX 4060 Laptop GPU | 2.5 kg | 26.8 mm | 16.00" | 2560x1600 | |
| 88.2 % v7 (old) | 03 / 2023 | Uniwill GM6PX7X RTX 4070 i7-13700HX, GeForce RTX 4070 Laptop GPU | 2.2 kg | 22 mm | 16.00" | 2560x1600 | |
| 87.7 % v7 (old) | 04 / 2023 | Schenker XMG Neo 16 E23 i9-13900HX, GeForce RTX 4090 Laptop GPU | 2.5 kg | 29.9 mm | 16.00" | 2560x1600 | |
| 88.4 % v7 (old) | 03 / 2023 | Asus ROG Strix G16 G614JZ i9-13980HX, GeForce RTX 4080 Laptop GPU | 2.4 kg | 30.4 mm | 16.00" | 2560x1600 | |
| 88 % v7 (old) | 04 / 2023 | Asus Zephyrus Duo 16 GX650PY-NM006W R9 7945HX, GeForce RTX 4090 Laptop GPU | 2.7 kg | 29.7 mm | 16.00" | 2560x1600 |
案例 - 相同的外观和相同的端口
AMDLegion Pro 5 16ARX8与英特尔Legion Pro 5 16IRX8共享同一机箱。虽然大多数AMD和英特尔变体之间通常有一些端口差异,但这两个型号之间实际上没有差异,因为联想已经选择在所有Legion 5 Pro SKU上排除USB 4和Thunderbolt支持,无论CPU选项如何。这可以看作是一种迫使用户考虑更昂贵的Legion 7系列的方式,因为该系列默认包括Thunderbolt支持。
沟通
AMD型号将常见的英特尔AX211换成了不太常见的联发科MT7922。在与我们的6GHz网络配对时,性能是稳定和可靠的。
| Networking | |
| iperf3 transmit AXE11000 | |
| Schenker XMG Neo 16 E23 | |
| Asus ROG Strix G16 G614JZ | |
| Lenovo Legion Pro 5 16ARX8 | |
| Uniwill GM6PX7X RTX 4070 | |
| Lenovo Legion Pro 5 16IRX8 | |
| iperf3 receive AXE11000 | |
| Schenker XMG Neo 16 E23 | |
| Asus ROG Strix G16 G614JZ | |
| Lenovo Legion Pro 5 16ARX8 | |
| Uniwill GM6PX7X RTX 4070 | |
| Lenovo Legion Pro 5 16IRX8 | |
| iperf3 transmit AXE11000 6GHz | |
| Asus Zephyrus Duo 16 GX650PY-NM006W | |
| Lenovo Legion Pro 5 16ARX8 | |
| Lenovo Legion Pro 5 16IRX8 | |
| iperf3 receive AXE11000 6GHz | |
| Asus Zephyrus Duo 16 GX650PY-NM006W | |
| Lenovo Legion Pro 5 16ARX8 | |
| Lenovo Legion Pro 5 16IRX8 | |
网络摄像头


维护
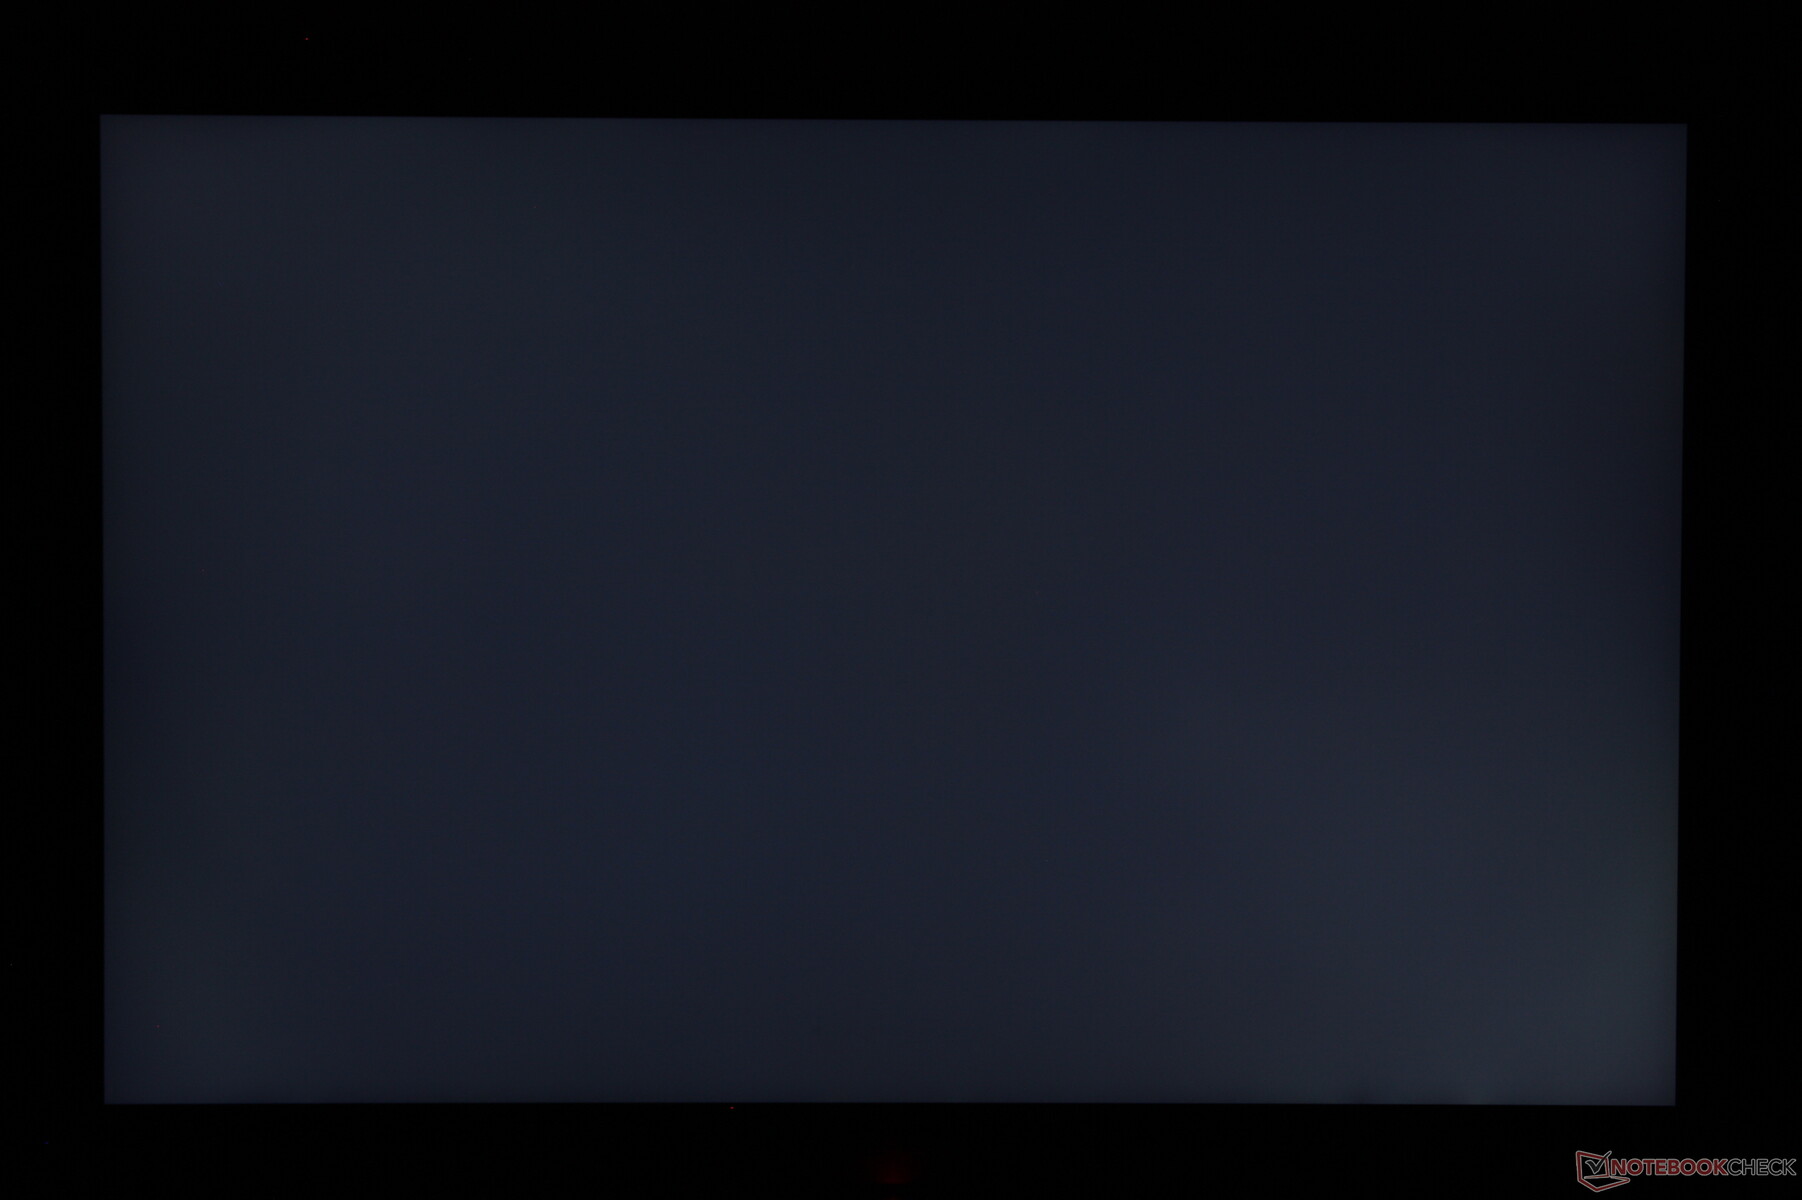
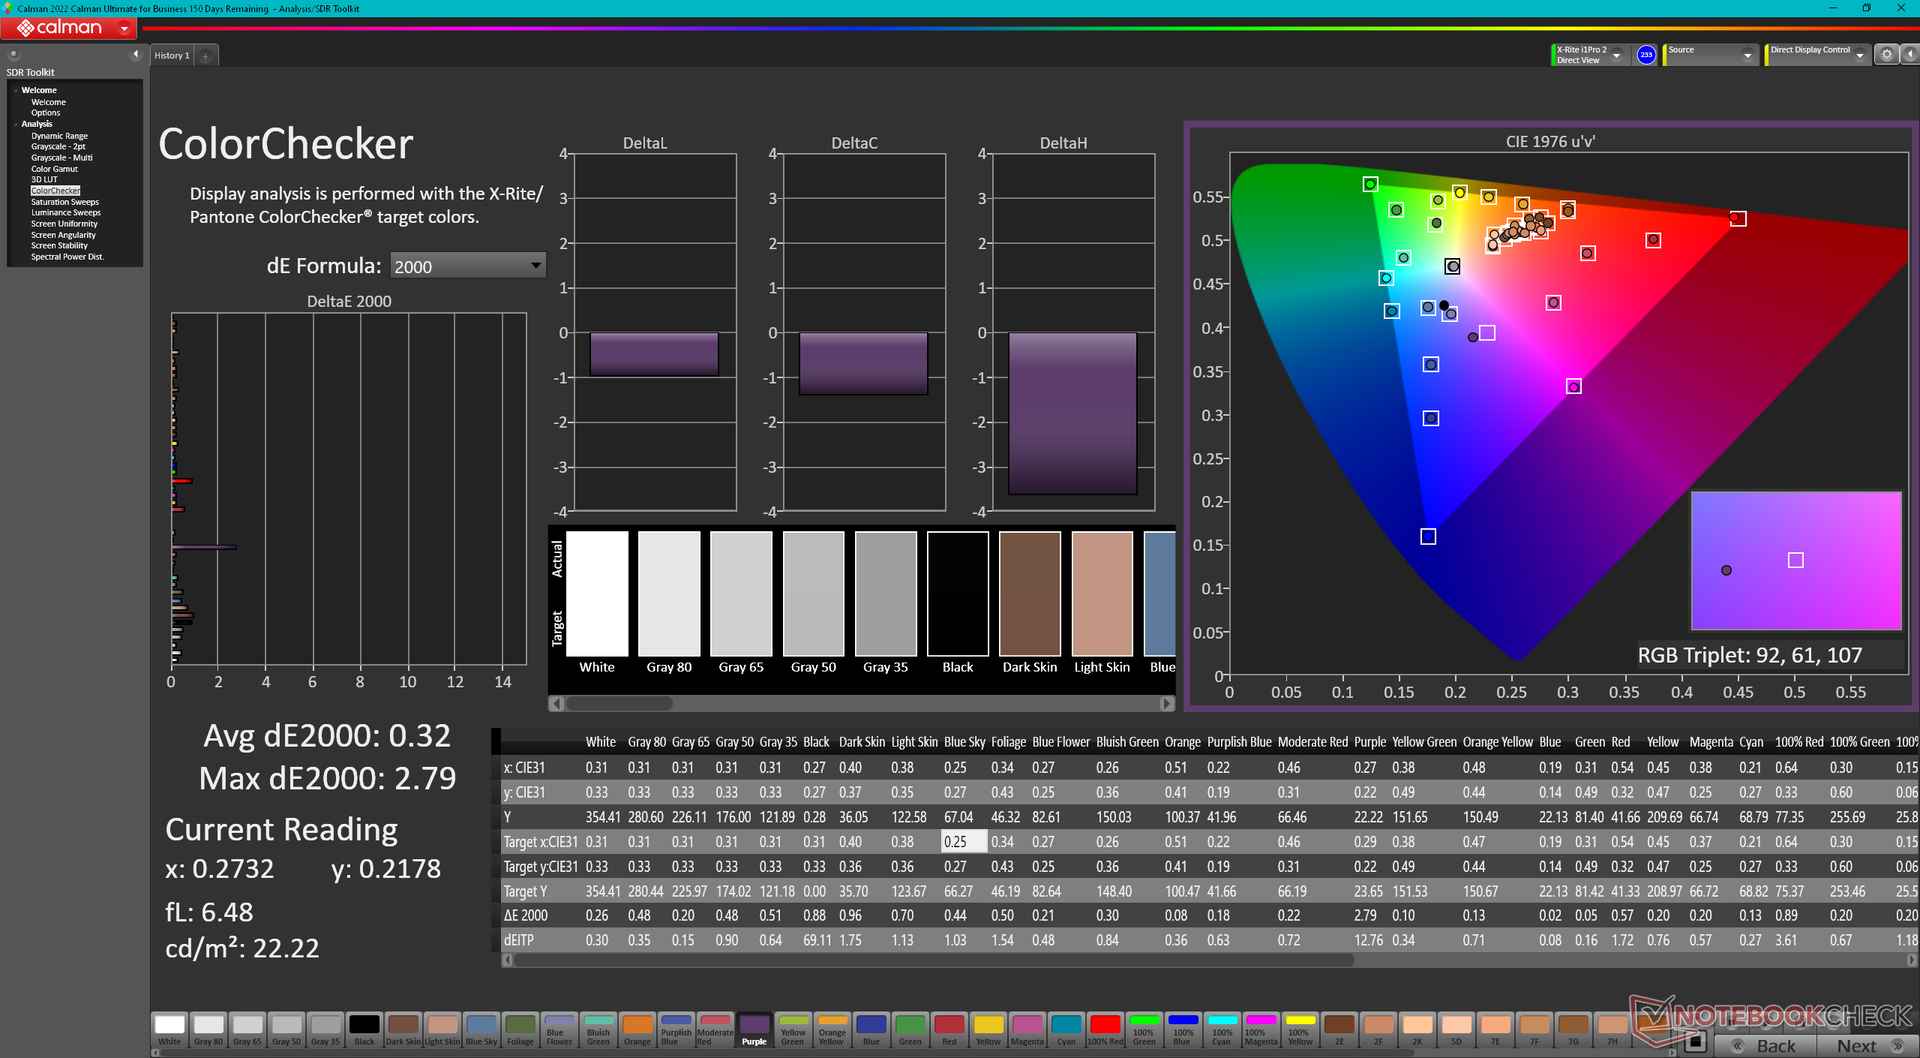
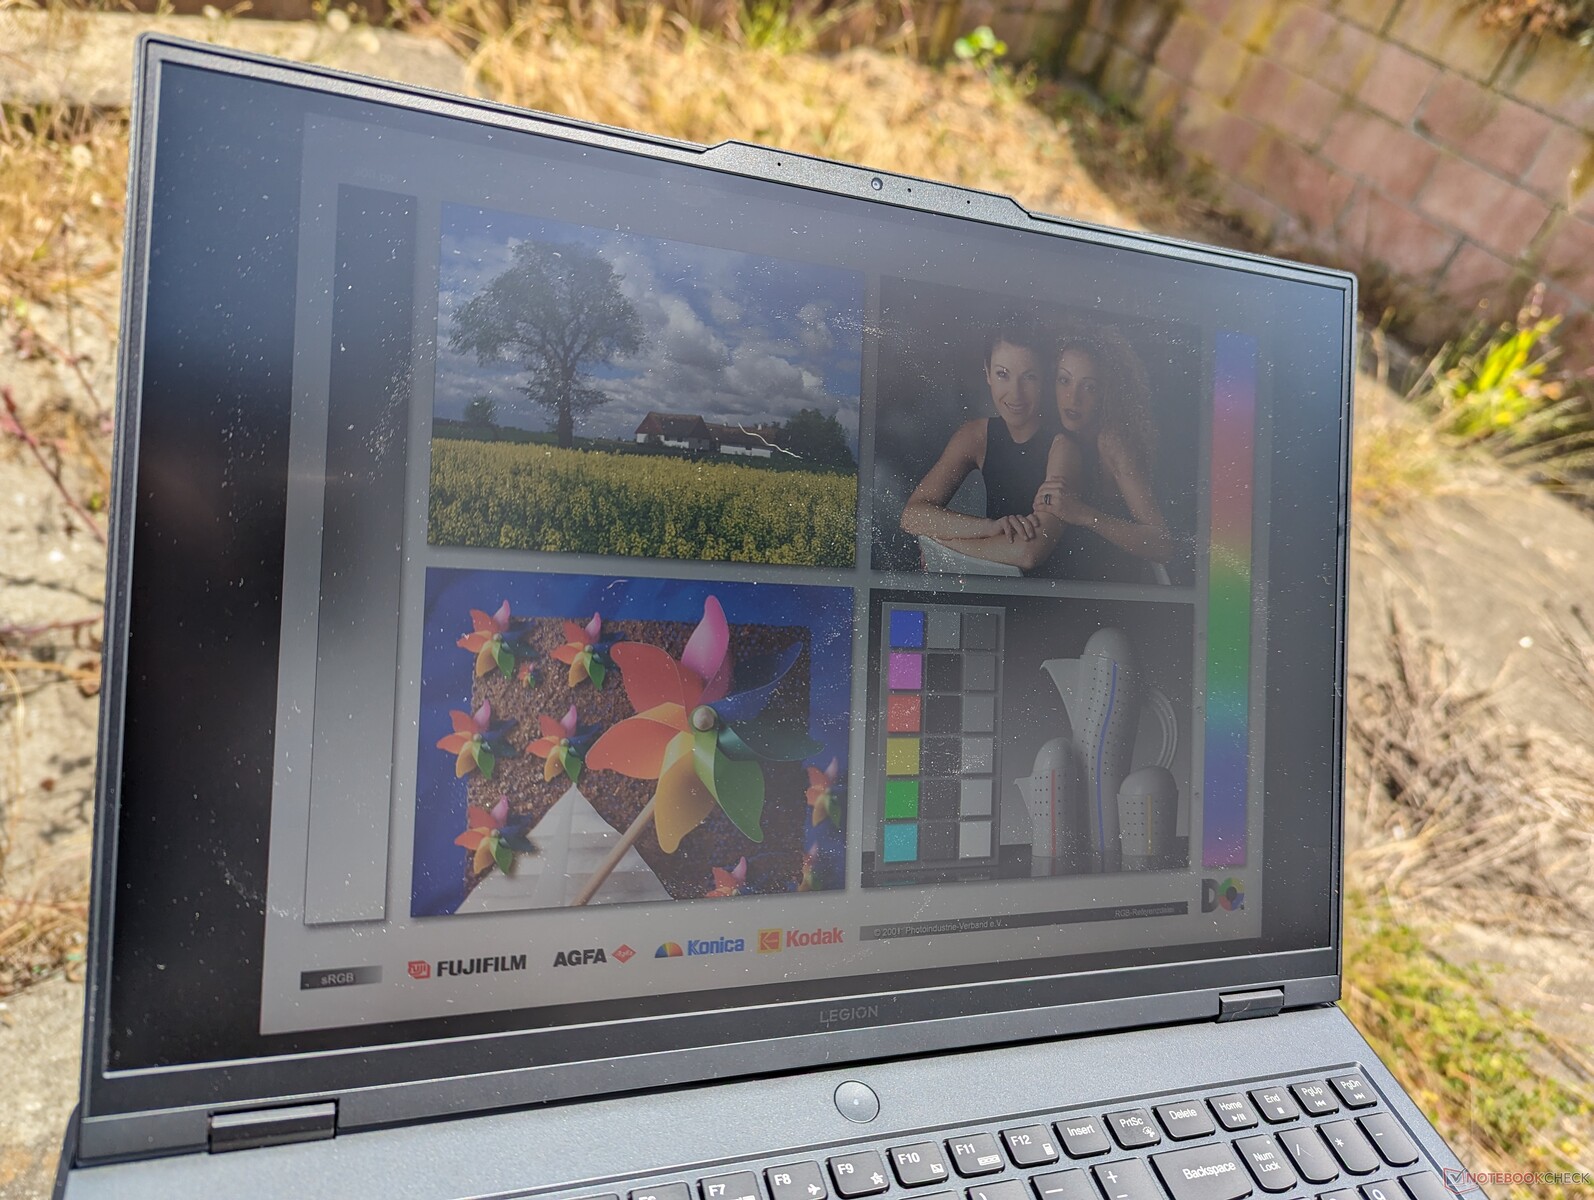
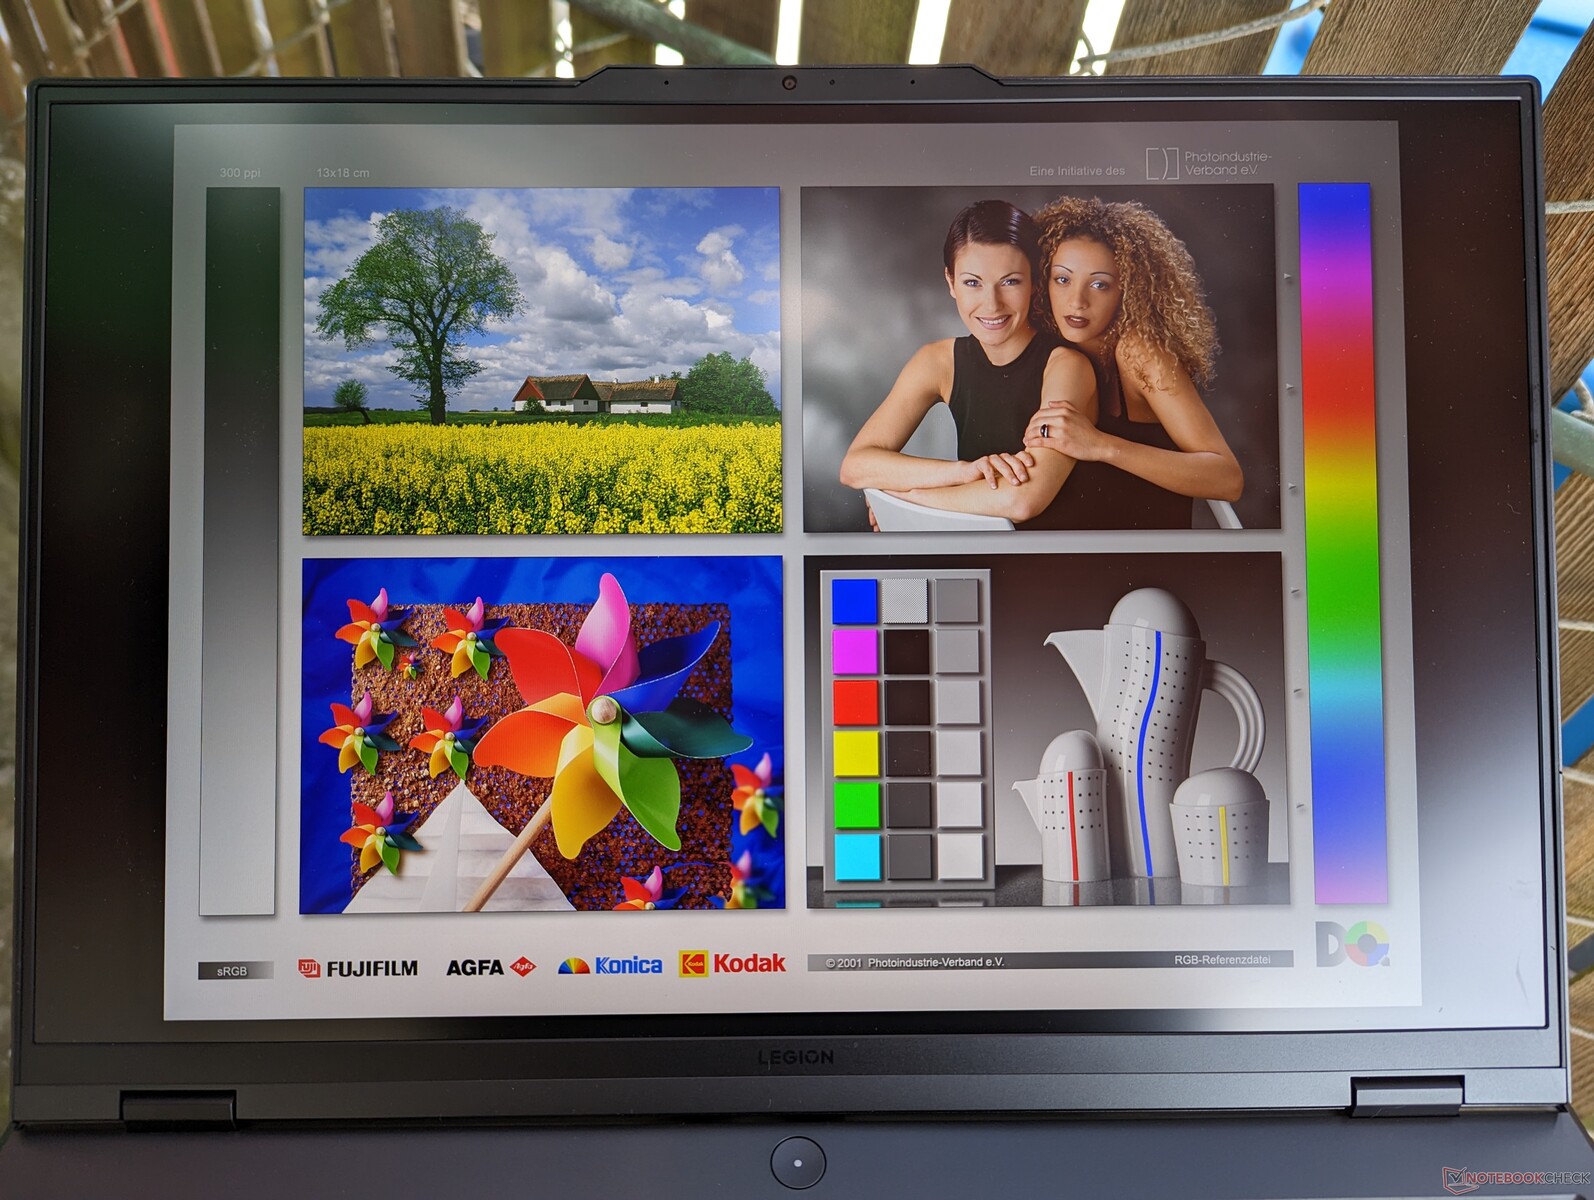
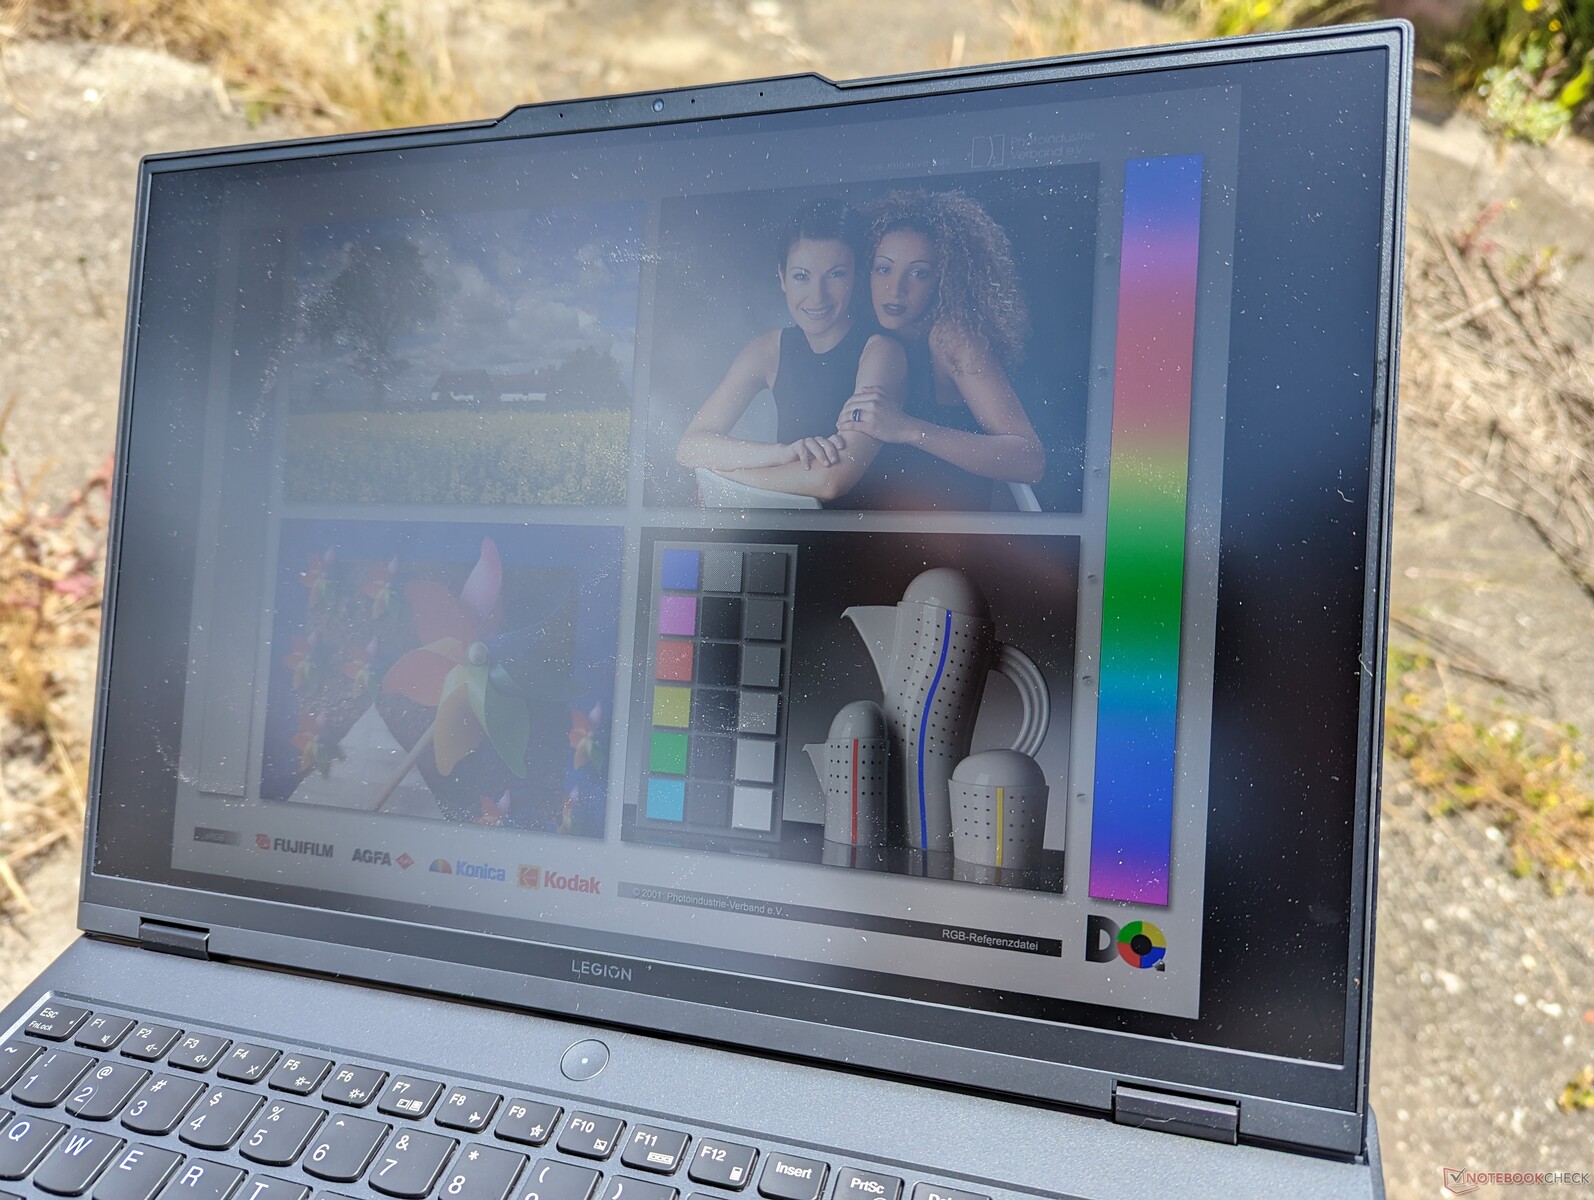
显示器 - 165赫兹,1600p,全sRGB
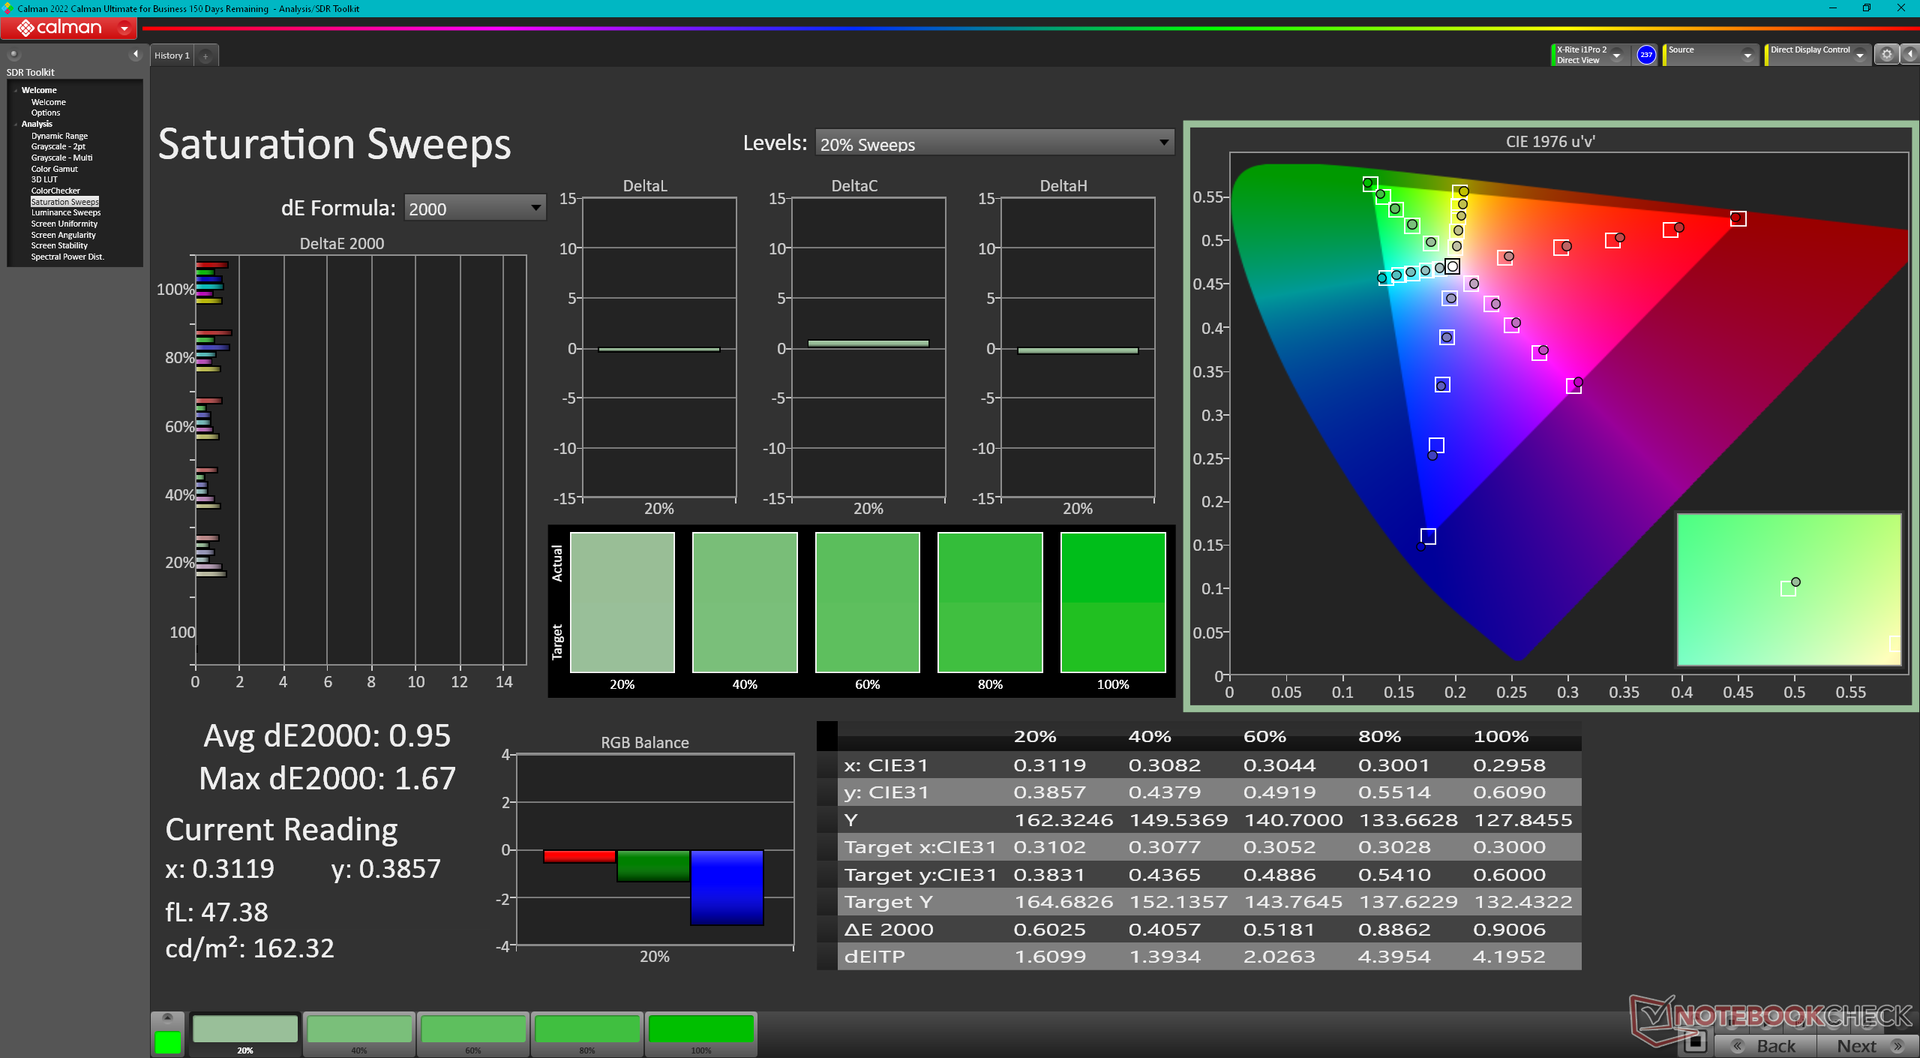
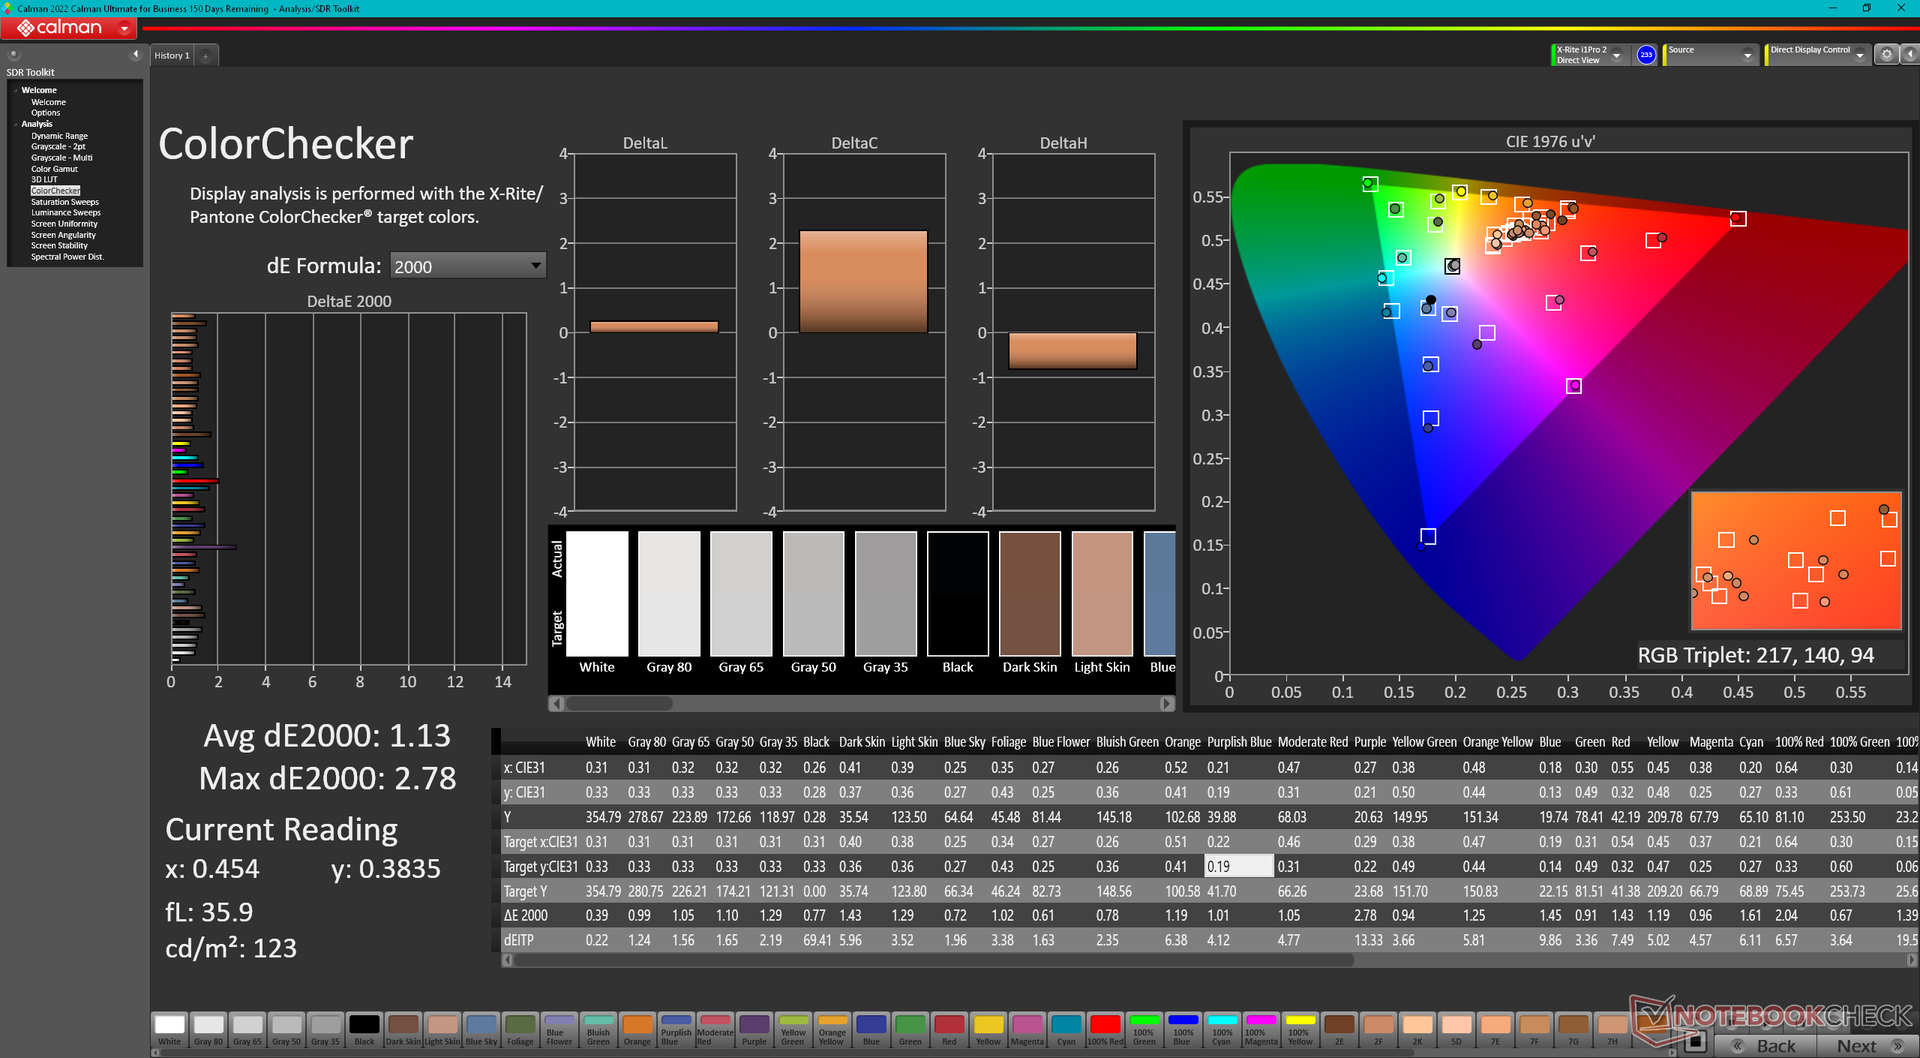
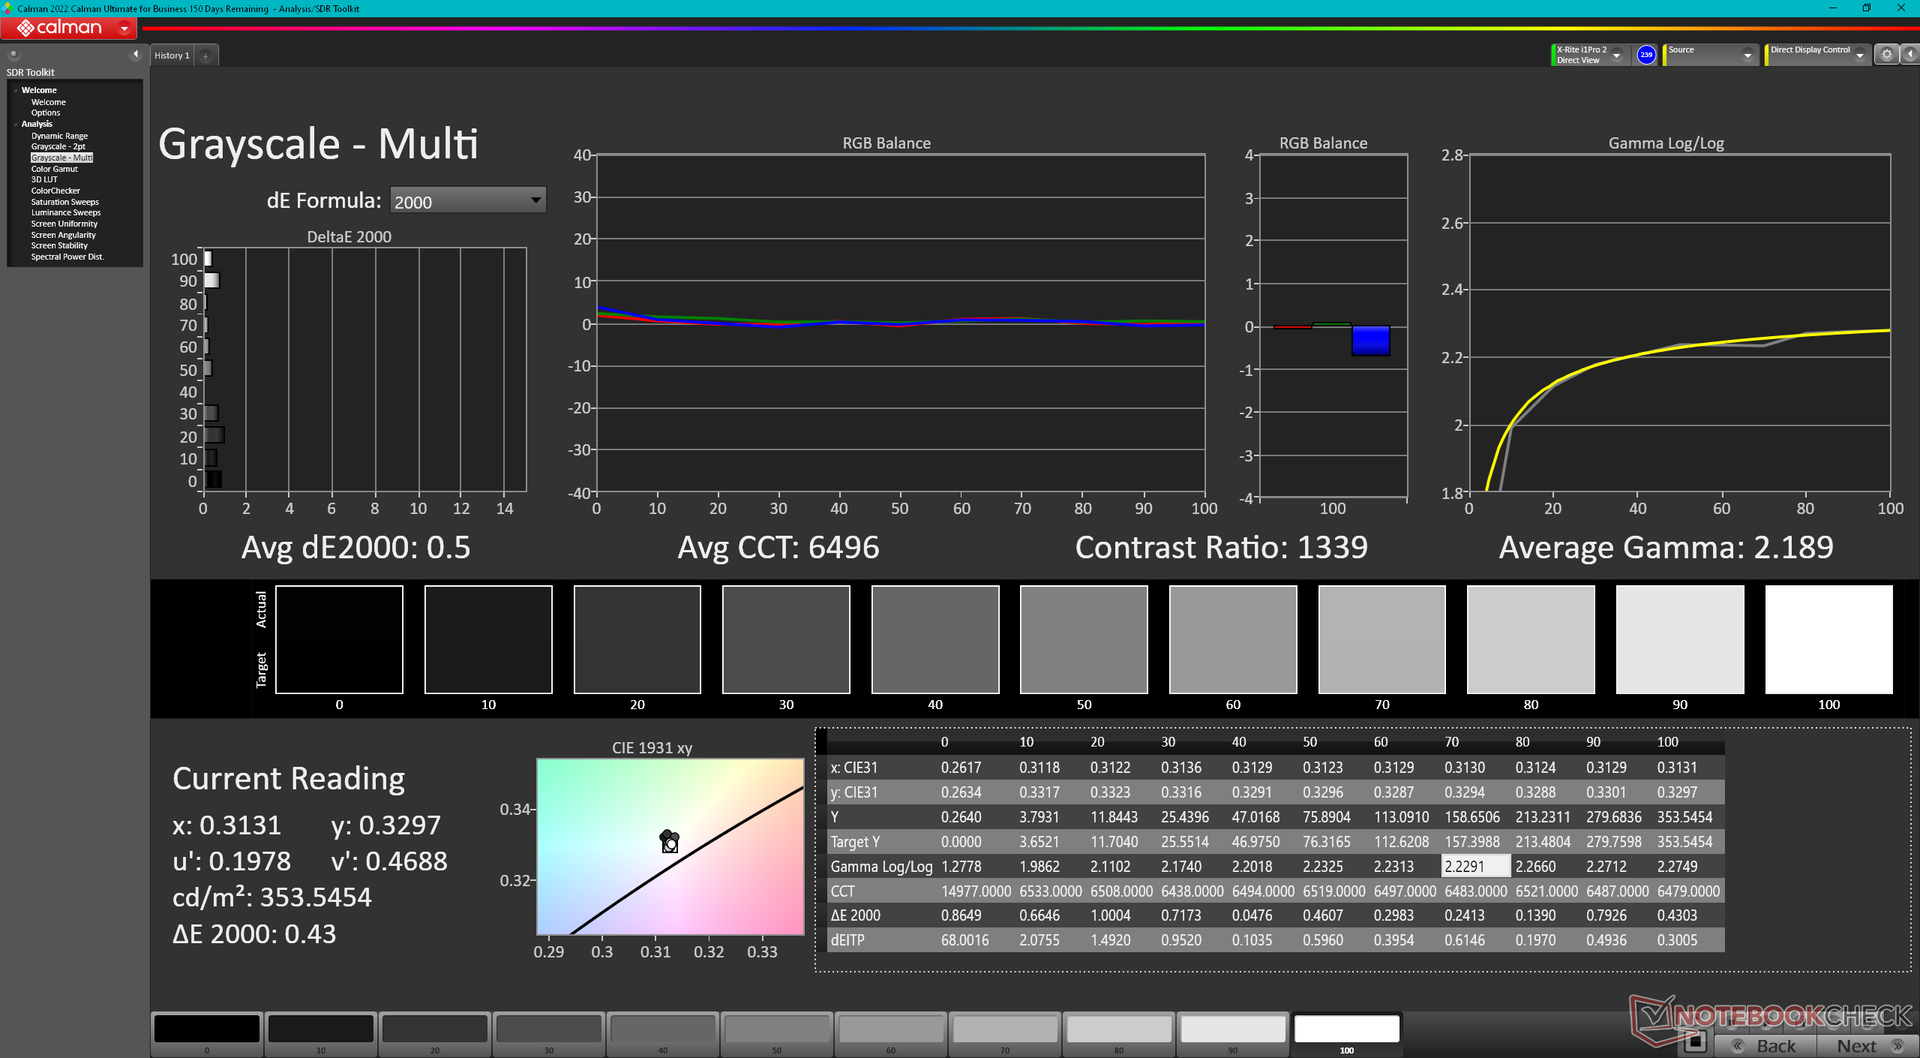
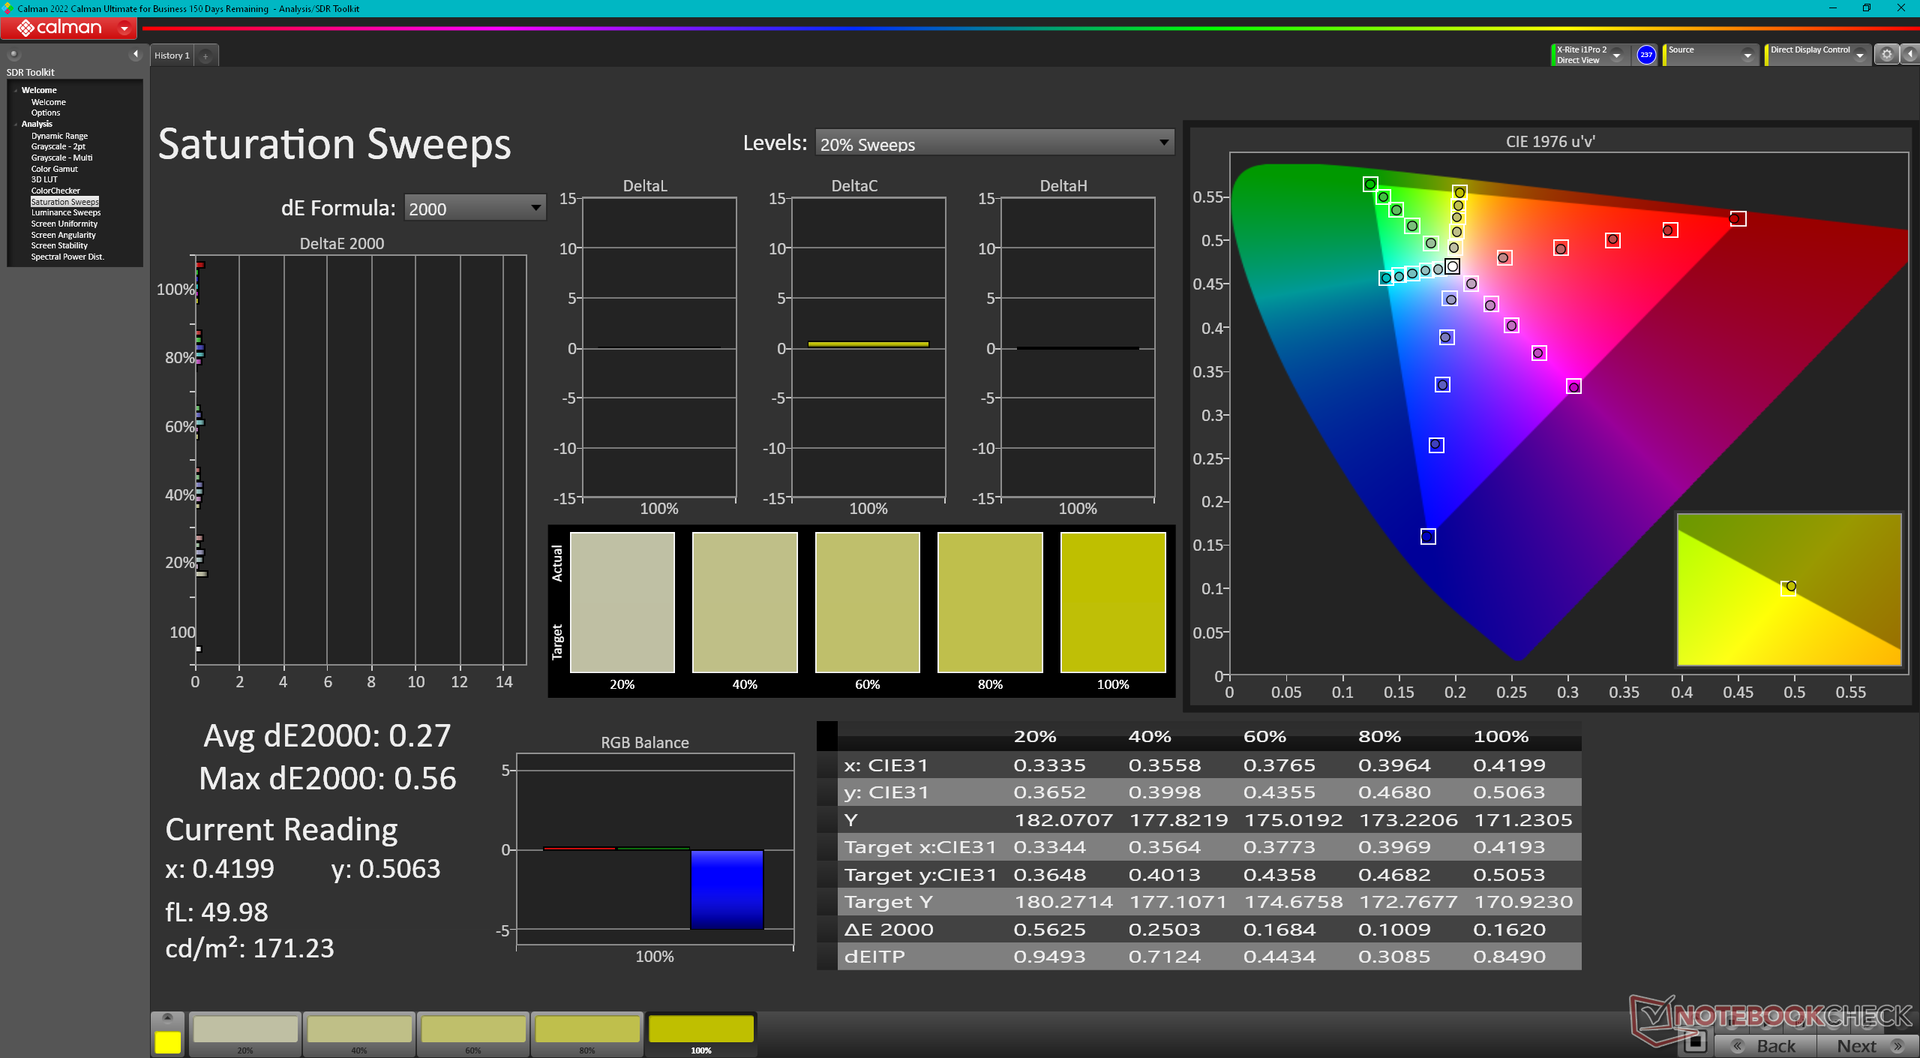
有趣的是,我们的AMD供电的Legion Pro 5 16ARX8采用了与英特尔供电的Legion Pro 5 16IRX8不同的IPS面板(CSOT MNG007DA1-Q vs. AU Optronics B160QAN03.1),尽管这两块面板具有相似的165 Hz原生刷新率、1600p原生分辨率、约1000:1的对比度和100%的sRGB覆盖。CSOT面板的黑白和灰度响应时间稍快,但对于基本相同的观看体验来说,其差异充其量是微不足道的。
第二块面板是可用的,它承诺有更亮的500尼特背光和更快的240赫兹刷新率。我们下面的测量结果只反映了基本的165赫兹面板。

| |||||||||||||||||||||||||
Brightness Distribution: 91 %
Center on Battery: 355.3 cd/m²
Contrast: 1110:1 (Black: 0.32 cd/m²)
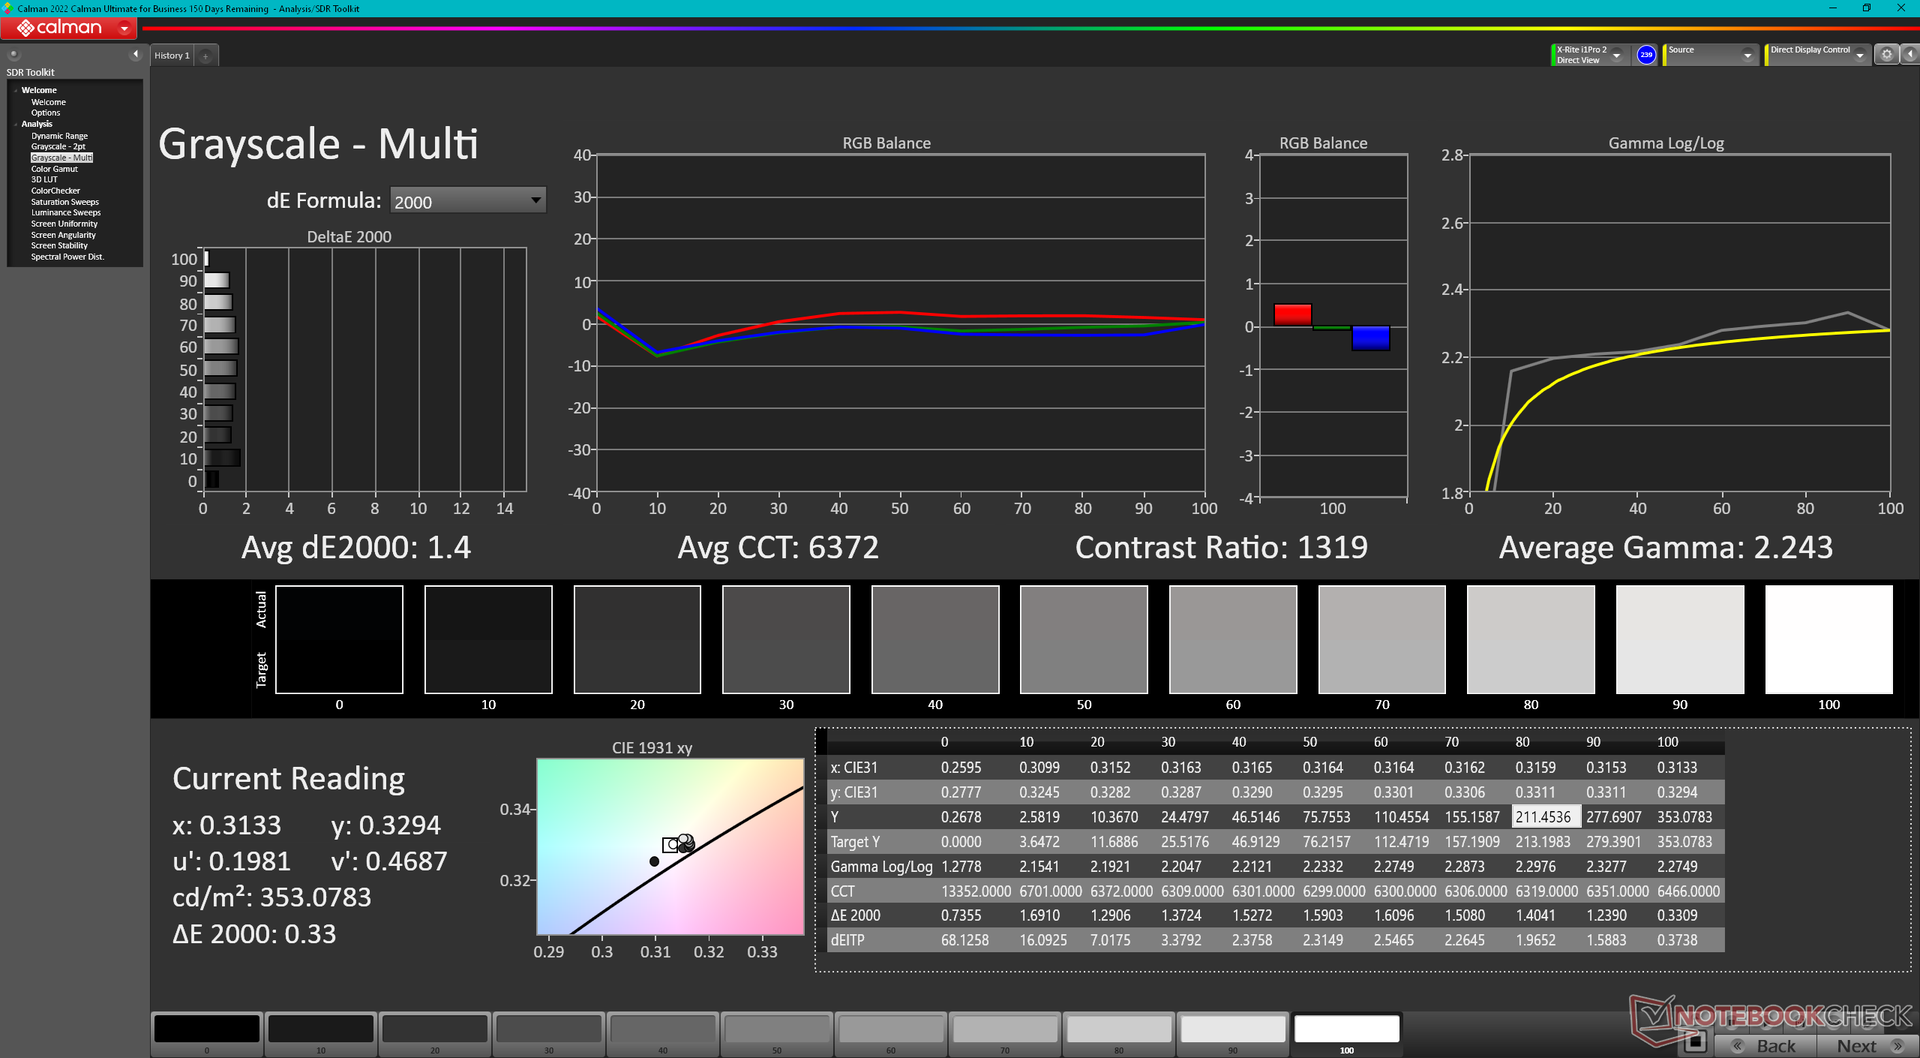
ΔE ColorChecker Calman: 1.13 | ∀{0.5-29.43 Ø4.72}
calibrated: 0.32
ΔE Greyscale Calman: 1.4 | ∀{0.09-98 Ø4.97}
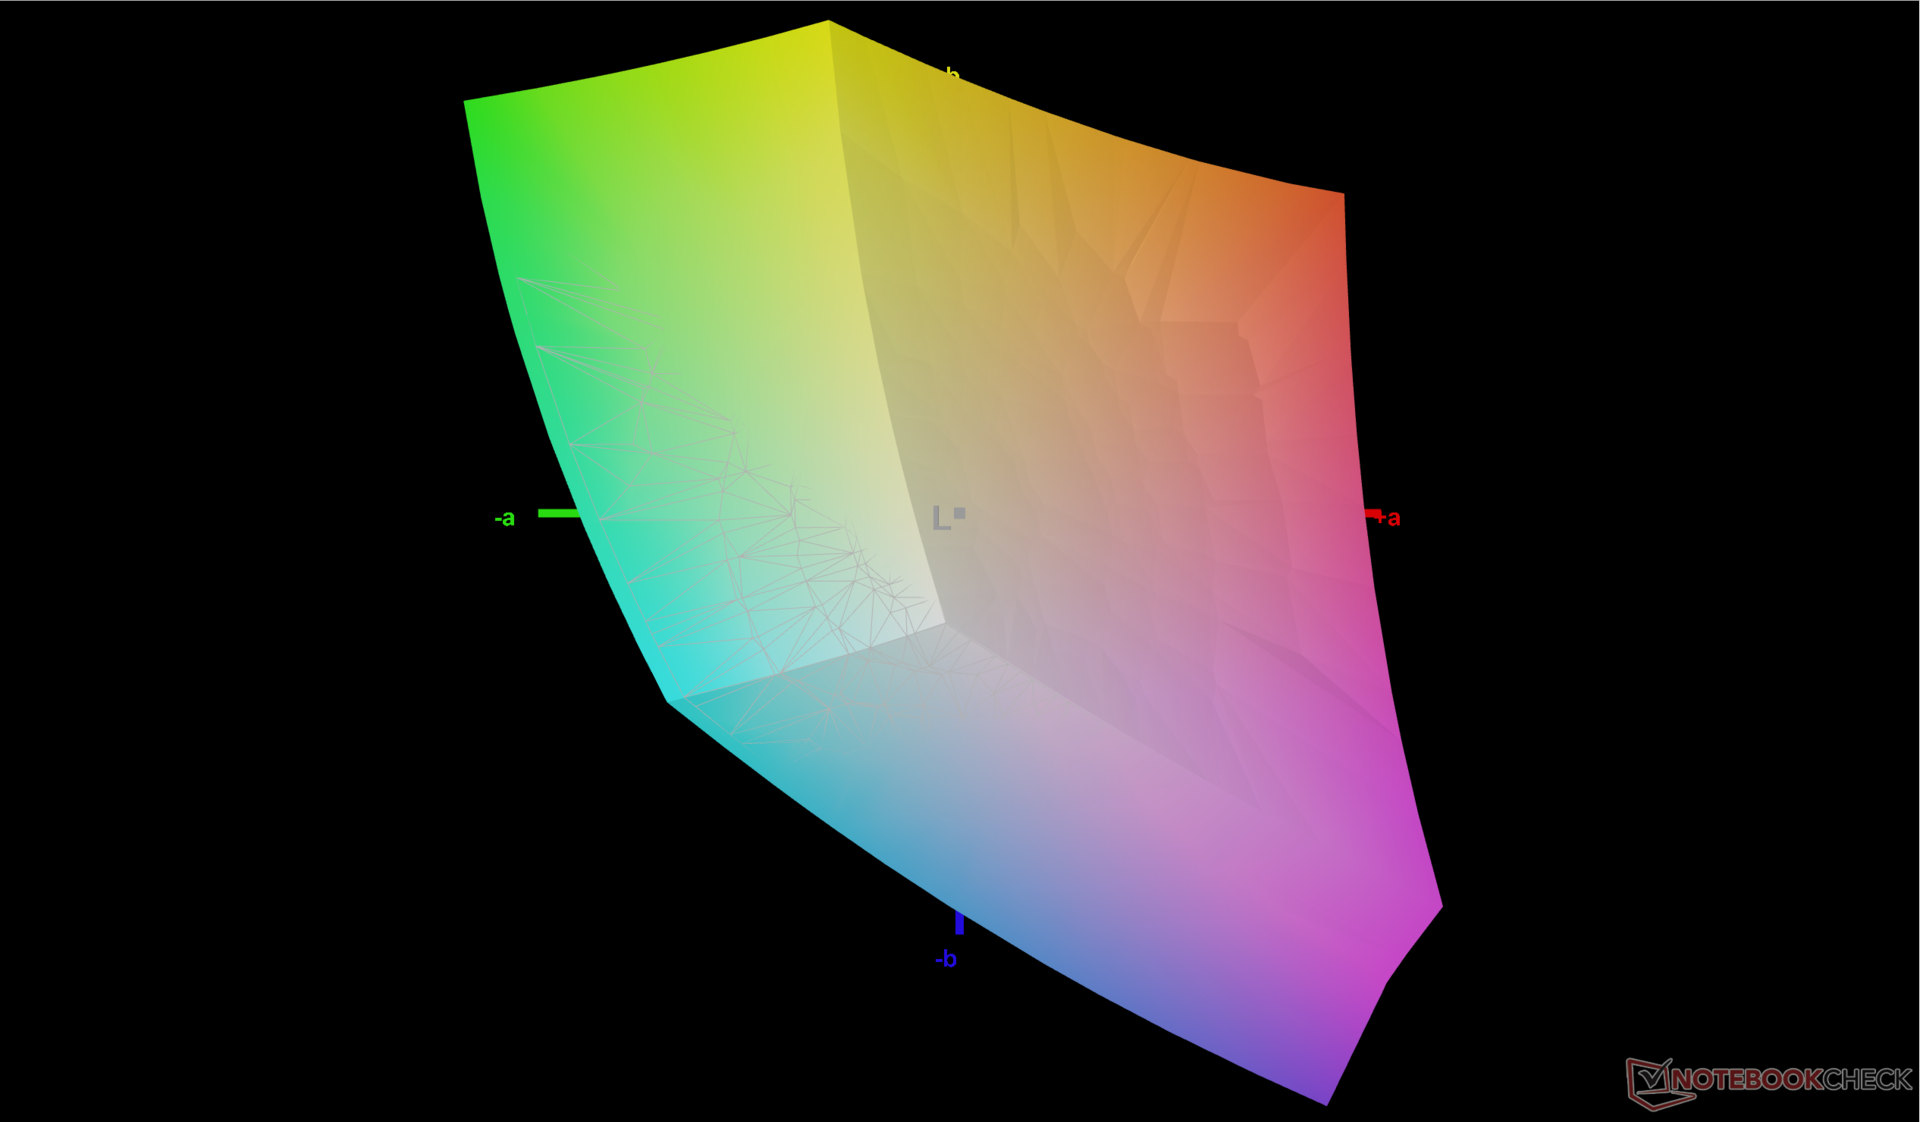
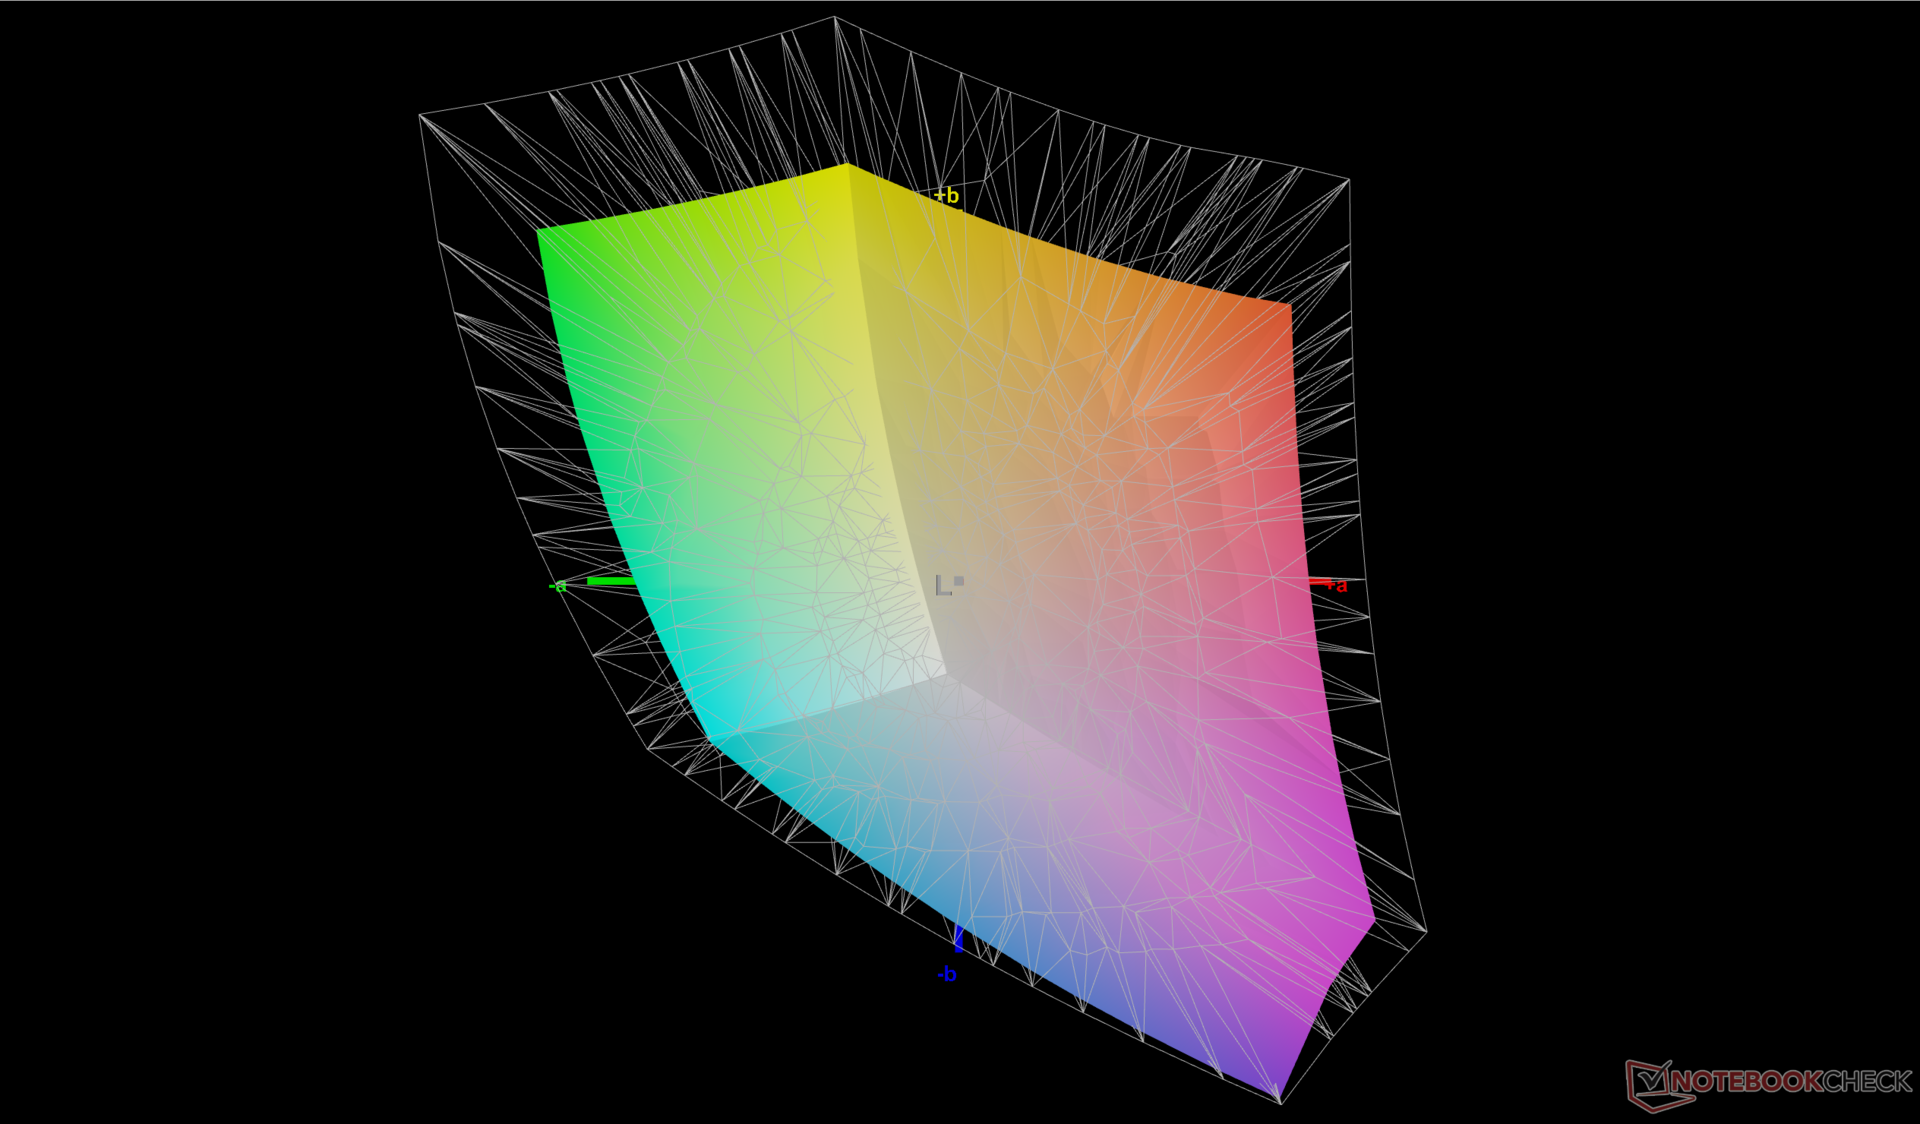
72.6% AdobeRGB 1998 (Argyll 3D)
99.6% sRGB (Argyll 3D)
70.4% Display P3 (Argyll 3D)
Gamma: 2.24
CCT: 6372 K
| Lenovo Legion Pro 5 16ARX8 CSOT T3 MNG007DA1-Q, IPS, 2560x1600, 16" | Lenovo Legion Pro 5 16IRX8 AU Optronics B160QAN03.1, IPS, 2560x1600, 16" | Uniwill GM6PX7X RTX 4070 BOE CQ NE160QDM-NZ1, IPS, 2560x1600, 16" | Schenker XMG Neo 16 E23 BOE0AF0 NE160QDM-NZ1, IPS, 2560x1600, 16" | Asus ROG Strix G16 G614JZ TL160ADMP03-0, IPS, 2560x1600, 16" | Asus Zephyrus Duo 16 GX650PY-NM006W NE160QDM-NM4, MiniLED, 2560x1600, 16" | |
|---|---|---|---|---|---|---|
| Display | 0% | -4% | -4% | 18% | 22% | |
| Display P3 Coverage (%) | 70.4 | 71.2 1% | 67.5 -4% | 67.3 -4% | 97 38% | 99.4 41% |
| sRGB Coverage (%) | 99.6 | 98.8 -1% | 96.4 -3% | 96.7 -3% | 99.9 0% | 100 0% |
| AdobeRGB 1998 Coverage (%) | 72.6 | 73.3 1% | 68.6 -6% | 68.9 -5% | 84.9 17% | 90.8 25% |
| Response Times | -61% | -44% | -51% | 27% | -113% | |
| Response Time Grey 50% / Grey 80% * (ms) | 7 ? | 14.5 ? -107% | 12.6 ? -80% | 14.5 ? -107% | 5.1 ? 27% | 15.2 ? -117% |
| Response Time Black / White * (ms) | 9.1 ? | 10.4 ? -14% | 9.8 ? -8% | 8.6 ? 5% | 6.6 ? 27% | 19 ? -109% |
| PWM Frequency (Hz) | 12000 ? | |||||
| Screen | -17% | -69% | -54% | -39% | 71% | |
| Brightness middle (cd/m²) | 355.3 | 405.7 14% | 338.6 -5% | 372 5% | 470 32% | 712 100% |
| Brightness (cd/m²) | 340 | 368 8% | 328 -4% | 349 3% | 459 35% | 703 107% |
| Brightness Distribution (%) | 91 | 87 -4% | 89 -2% | 88 -3% | 93 2% | 95 4% |
| Black Level * (cd/m²) | 0.32 | 0.38 -19% | 0.32 -0% | 0.32 -0% | 0.42 -31% | 0.07 78% |
| Contrast (:1) | 1110 | 1068 -4% | 1058 -5% | 1163 5% | 1119 1% | 10171 816% |
| Colorchecker dE 2000 * | 1.13 | 1.65 -46% | 2.18 -93% | 2.06 -82% | 1.86 -65% | 1.7 -50% |
| Colorchecker dE 2000 max. * | 2.78 | 4.2 -51% | 7.14 -157% | 3 -8% | 3.87 -39% | 4 -44% |
| Colorchecker dE 2000 calibrated * | 0.32 | 0.53 -66% | 0.93 -191% | 1.5 -369% | 0.93 -191% | 1.2 -275% |
| Greyscale dE 2000 * | 1.4 | 1.2 14% | 3.7 -164% | 1.9 -36% | 2.7 -93% | 2.8 -100% |
| Gamma | 2.24 98% | 2.3 96% | 2.18 101% | 2.312 95% | 2.246 98% | 2.21 100% |
| CCT | 6372 102% | 6453 101% | 7245 90% | 6747 96% | 6711 97% | 6978 93% |
| Total Average (Program / Settings) | -26% /
-20% | -39% /
-52% | -36% /
-43% | 2% /
-17% | -7% /
34% |
* ... smaller is better
这款显示器开箱后就进行了预校准,平均灰度和色彩DeltaE值分别为1.4和1.13,非常出色。试图用我们的X-Rite色度计进一步校准显示器,实际上会将灰度和色彩DeltaE值分别提高到<0.5。即便如此,如果deltaE值已经<2,通常不需要进行终端用户校准。
Display Response Times
| ↔ Response Time Black to White | ||
|---|---|---|
| 9.1 ms ... rise ↗ and fall ↘ combined | ↗ 4.9 ms rise | 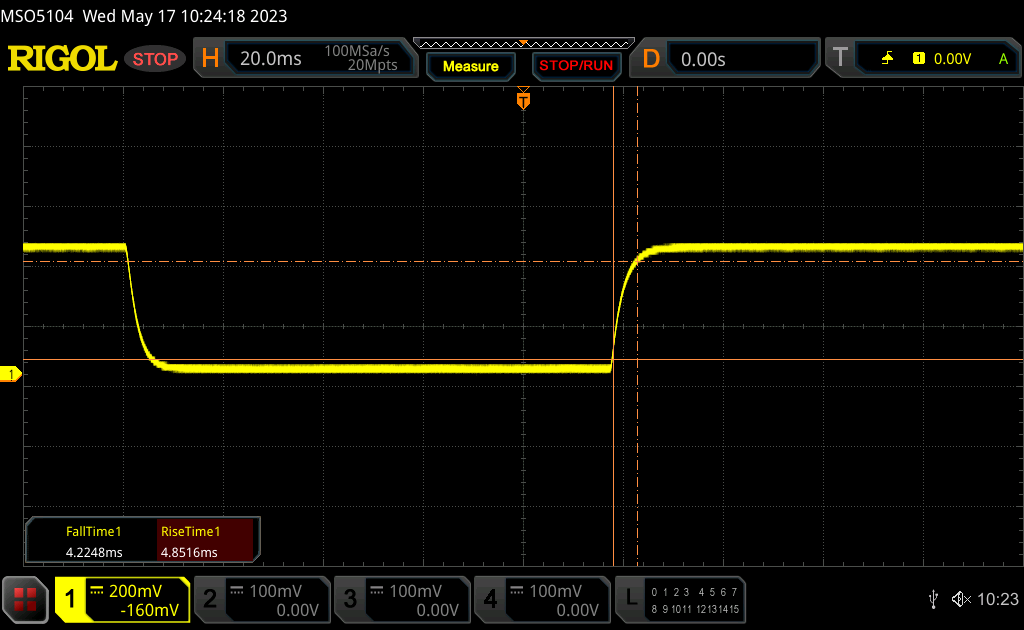 |
| ↘ 4.2 ms fall | ||
| The screen shows fast response rates in our tests and should be suited for gaming. In comparison, all tested devices range from 0.1 (minimum) to 240 (maximum) ms. » 25 % of all devices are better. This means that the measured response time is better than the average of all tested devices (19.8 ms). | ||
| ↔ Response Time 50% Grey to 80% Grey | ||
| 7 ms ... rise ↗ and fall ↘ combined | ↗ 3.2 ms rise | 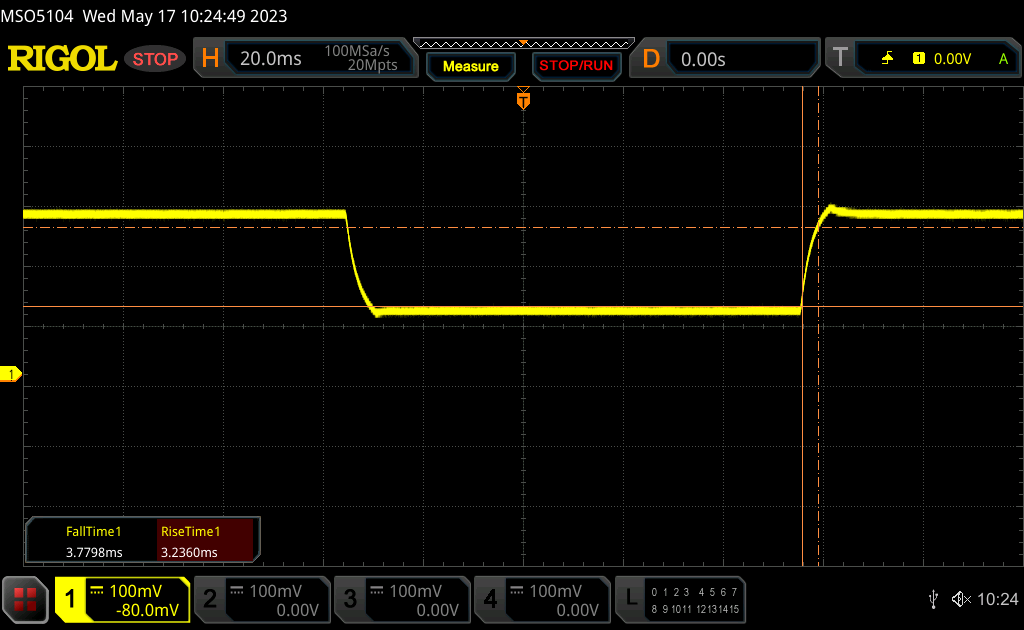 |
| ↘ 3.8 ms fall | ||
| The screen shows very fast response rates in our tests and should be very well suited for fast-paced gaming. In comparison, all tested devices range from 0.165 (minimum) to 636 (maximum) ms. » 20 % of all devices are better. This means that the measured response time is better than the average of all tested devices (31 ms). | ||
Screen Flickering / PWM (Pulse-Width Modulation)
| Screen flickering / PWM not detected | 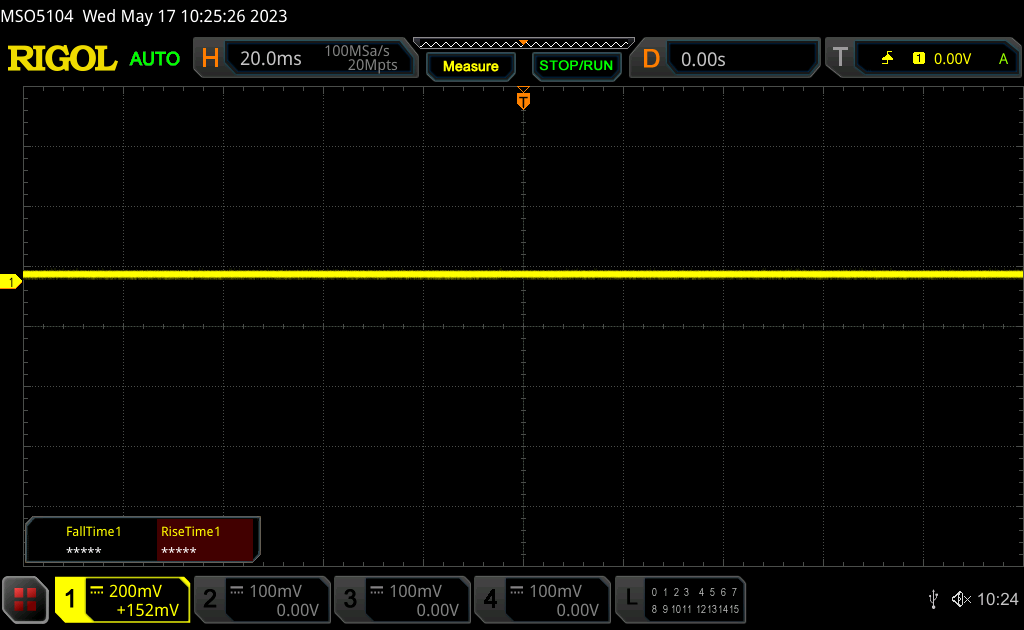 | ||
In comparison: 52 % of all tested devices do not use PWM to dim the display. If PWM was detected, an average of 7781 (minimum: 5 - maximum: 343500) Hz was measured. | |||
户外能见度在该类别中属于平均水平,因为大多数游戏笔记本电脑的显示屏通常在300至400尼特之间。240赫兹面板选项承诺为500尼特,或比我们的165赫兹面板明亮约200尼特,这应该会改善户外能见度,如果这是一个问题。无论如何,你会希望尽可能地在阴凉处工作,以减少眩光并保持颜色。

性能 - 中端Zen 4 Ryzen 7
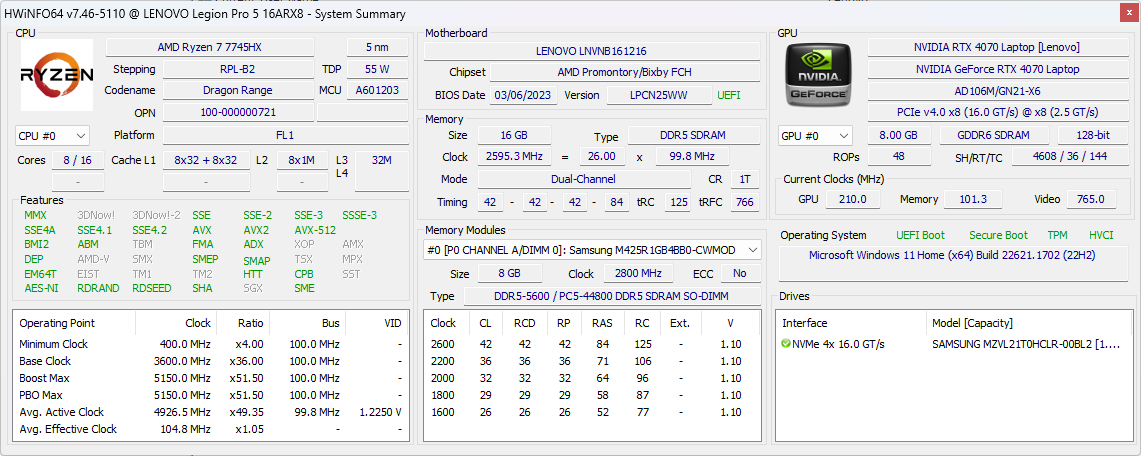
测试条件
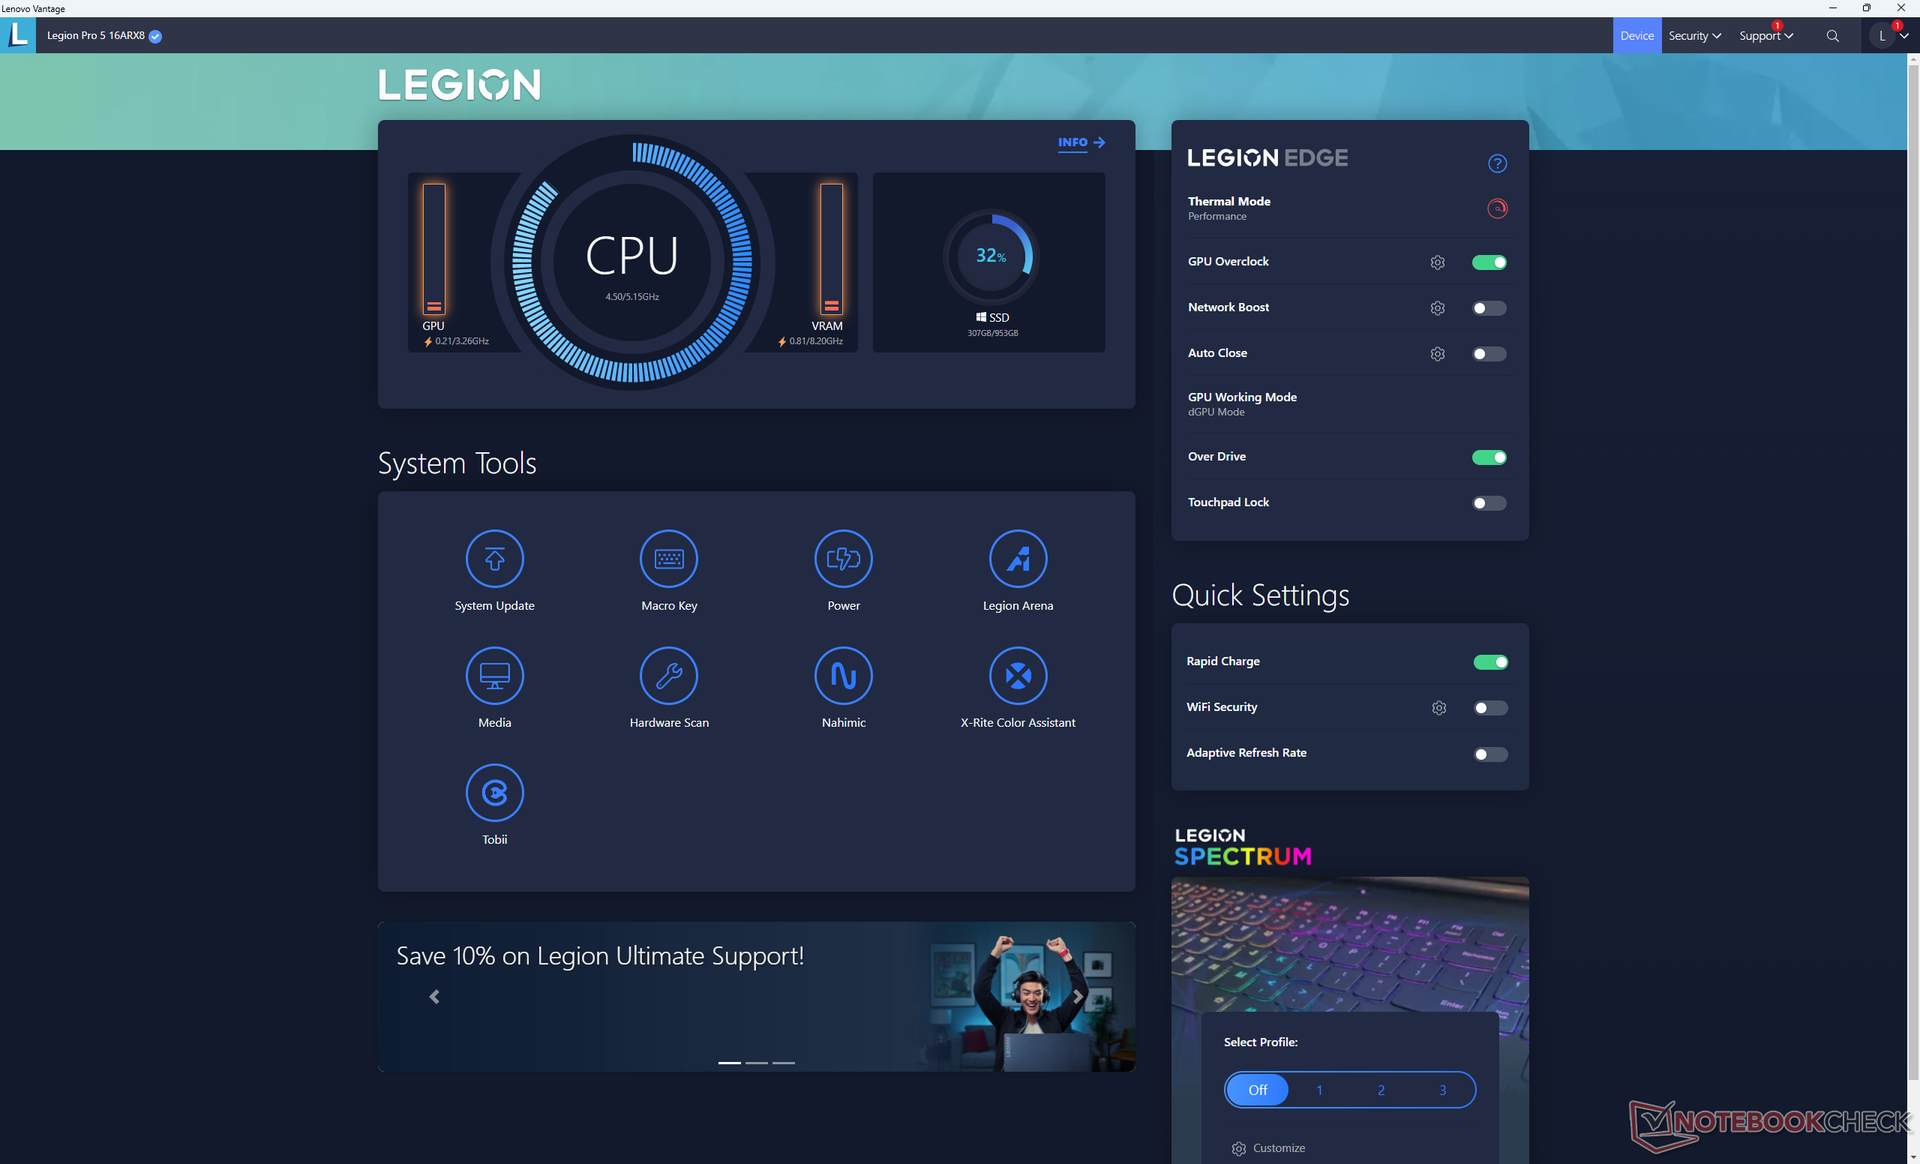
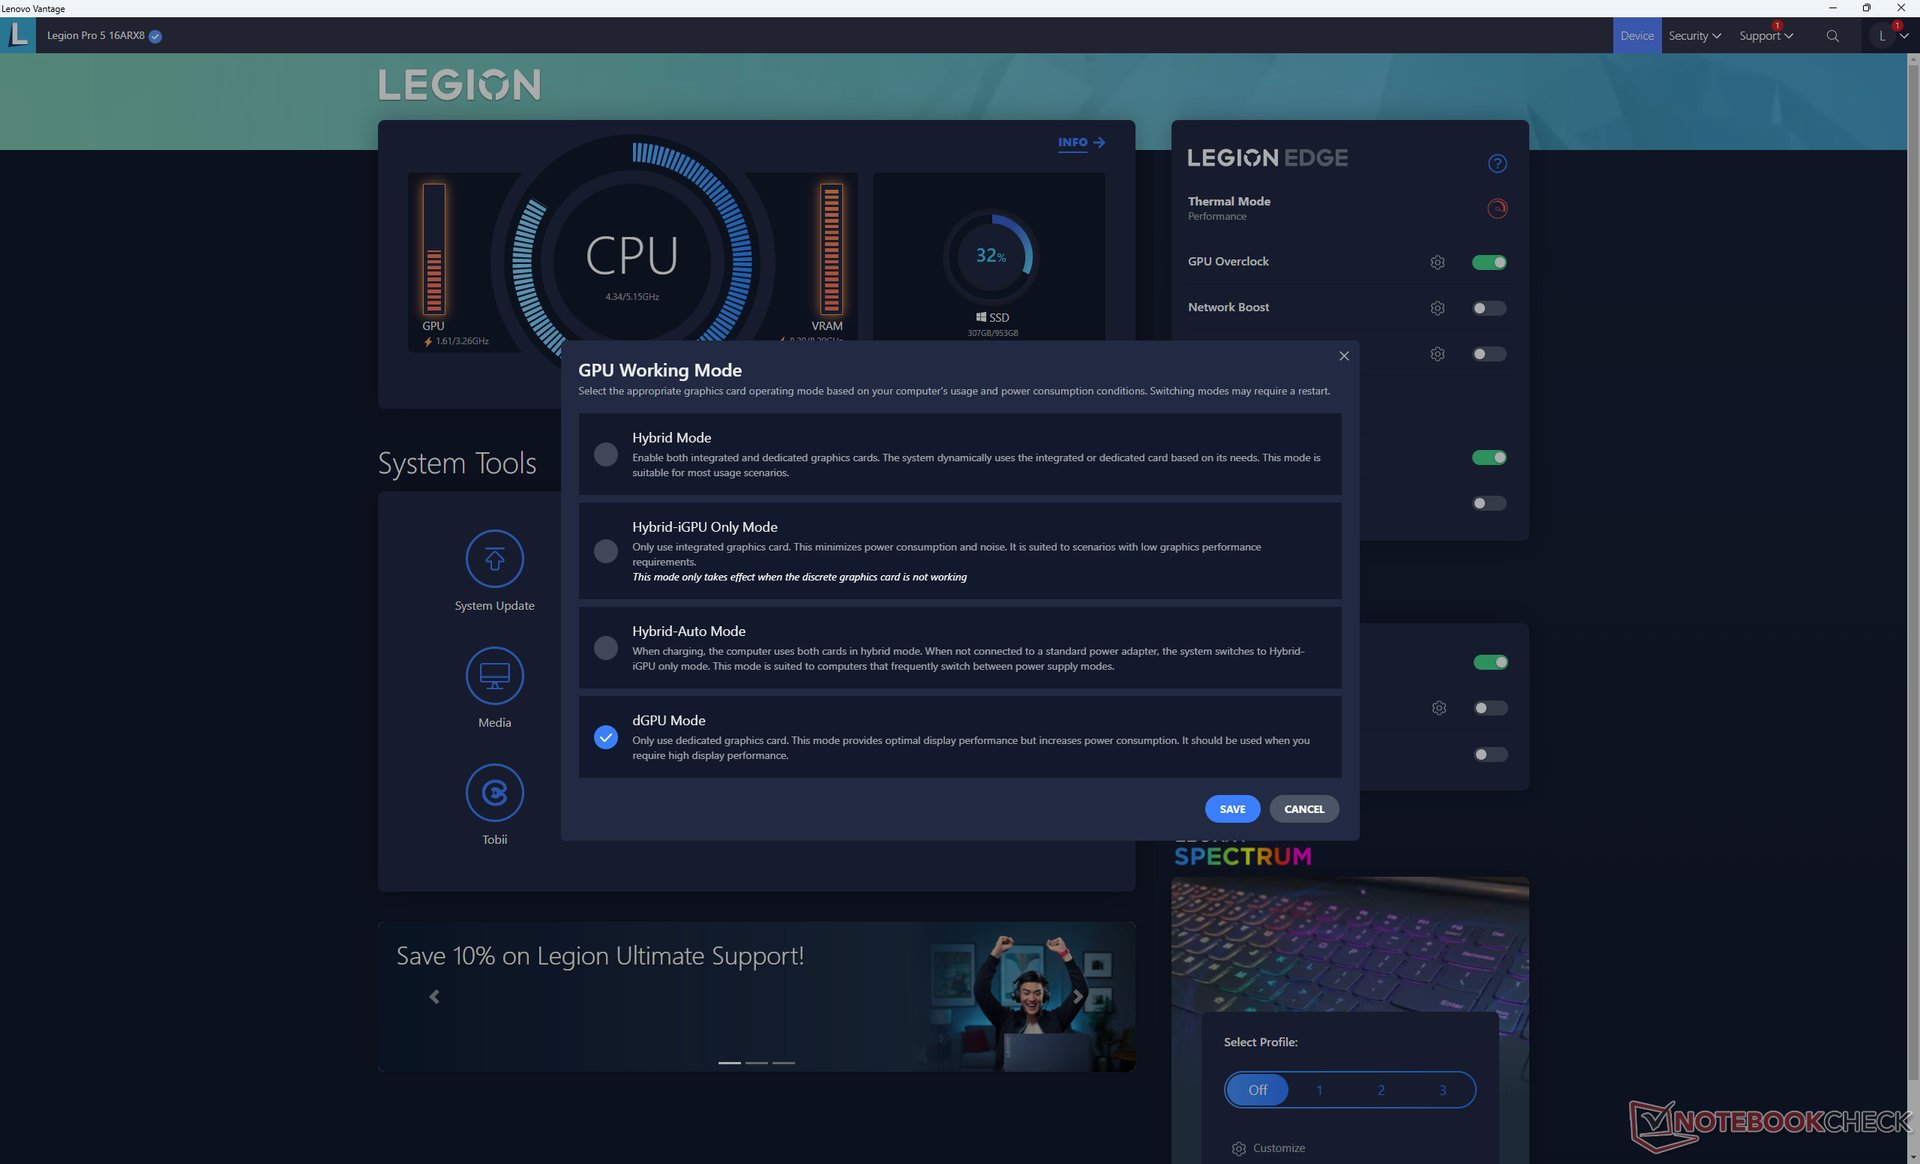
在运行以下任何基准测试之前,我们通过Windows和联想Vantage软件将我们的设备设置为性能模式。我们还确保将图形设置为dGPU模式,并激活预设的GPU超频功能。建议熟悉Vantage,因为它是控制键盘照明功能、联想特定更新、GPU行为等的主要界面。
支持MUX,以便在Optimus(iGPU + dGPU)或仅dGPU之间切换。只有在dGPU模式下,内部显示器才支持G-Sync。在Optimus和dGPU模式之间切换时,需要重启,因为不支持高级Optimus。令人讨厌的是,在图形模式之间切换时,重启过程会比普通重启的时间长很多。
处理器
在经历了令人难以置信的Zen 4Ryzen 9 7945HX后,又被不尽如人意的Zen 3所击倒。Ryzen 7 7735HS我们不确定对Zen 4的期望是什么Ryzen 7 7745HX.值得庆幸的是,作为一款中端CPU,其结果非常好,单线程和多线程性能得分分别比Ryzen 7 7735HS高出15%和30%。因此,Ryzen 7 7745HX在竞争者的范围内。 酷睿i7-13700HX在大多数基准测试中,包括LibreOffice和HWBOT x265 4K,仅有5%至15%。这绝对是一个合理的升级,从去年的Ryzen 7 6800H或 Ryzen 9 6900HX当与Ryzen 7 7735HX相比。
联想提供了一个较慢的Ryzen 5 7645HX选项,核心数量比Ryzen 7 7745HX少(6个对8个)。然而,截至目前,我们还没有亲自测试Ryzen 5 7645HX,因此这两个选项之间的性能差异目前还不清楚。
Cinebench R15 Multi Loop
Cinebench R23: Multi Core | Single Core
Cinebench R20: CPU (Multi Core) | CPU (Single Core)
Cinebench R15: CPU Multi 64Bit | CPU Single 64Bit
Blender: v2.79 BMW27 CPU
7-Zip 18.03: 7z b 4 | 7z b 4 -mmt1
Geekbench 5.5: Multi-Core | Single-Core
HWBOT x265 Benchmark v2.2: 4k Preset
LibreOffice : 20 Documents To PDF
R Benchmark 2.5: Overall mean
| CPU Performance rating | |
| Schenker XMG SECTOR, i9 13900K, RTX 4090 | |
| Alienware m18 R1 | |
| Schenker XMG Neo 16 E23 | |
| Average AMD Ryzen 7 7745HX | |
| Lenovo Legion Pro 5 16ARX8 | |
| MSI GE67 HX 12UGS | |
| Lenovo Legion Pro 5 16IRX8 | |
| MSI Pulse GL76 12UGK | |
| Asus TUF Gaming A16 FA617 | |
| Schenker XMG Core 15 (M22) | |
| Asus ROG Strix G15 G513RW | |
| MSI Alpha 15 B5EEK-008 | |
| Cinebench R23 / Multi Core | |
| Schenker XMG SECTOR, i9 13900K, RTX 4090 | |
| Alienware m18 R1 | |
| Schenker XMG Neo 16 E23 | |
| MSI GE67 HX 12UGS | |
| Lenovo Legion Pro 5 16IRX8 | |
| Average AMD Ryzen 7 7745HX (18060 - 18845, n=2) | |
| Lenovo Legion Pro 5 16ARX8 | |
| MSI Pulse GL76 12UGK | |
| Schenker XMG Core 15 (M22) | |
| Asus TUF Gaming A16 FA617 | |
| Asus ROG Strix G15 G513RW | |
| MSI Alpha 15 B5EEK-008 | |
| Cinebench R23 / Single Core | |
| Schenker XMG SECTOR, i9 13900K, RTX 4090 | |
| Alienware m18 R1 | |
| Schenker XMG Neo 16 E23 | |
| Average AMD Ryzen 7 7745HX (1846 - 1854, n=2) | |
| Lenovo Legion Pro 5 16ARX8 | |
| MSI GE67 HX 12UGS | |
| MSI Pulse GL76 12UGK | |
| Lenovo Legion Pro 5 16IRX8 | |
| Asus TUF Gaming A16 FA617 | |
| Schenker XMG Core 15 (M22) | |
| Asus ROG Strix G15 G513RW | |
| MSI Alpha 15 B5EEK-008 | |
| Cinebench R20 / CPU (Multi Core) | |
| Schenker XMG SECTOR, i9 13900K, RTX 4090 | |
| Alienware m18 R1 | |
| Schenker XMG Neo 16 E23 | |
| MSI GE67 HX 12UGS | |
| Average AMD Ryzen 7 7745HX (7072 - 7399, n=2) | |
| Lenovo Legion Pro 5 16ARX8 | |
| Lenovo Legion Pro 5 16IRX8 | |
| MSI Pulse GL76 12UGK | |
| Schenker XMG Core 15 (M22) | |
| Asus TUF Gaming A16 FA617 | |
| Asus ROG Strix G15 G513RW | |
| MSI Alpha 15 B5EEK-008 | |
| Cinebench R20 / CPU (Single Core) | |
| Schenker XMG SECTOR, i9 13900K, RTX 4090 | |
| Alienware m18 R1 | |
| Schenker XMG Neo 16 E23 | |
| Average AMD Ryzen 7 7745HX (717 - 719, n=2) | |
| Lenovo Legion Pro 5 16ARX8 | |
| MSI GE67 HX 12UGS | |
| MSI Pulse GL76 12UGK | |
| Lenovo Legion Pro 5 16IRX8 | |
| Asus TUF Gaming A16 FA617 | |
| Schenker XMG Core 15 (M22) | |
| Asus ROG Strix G15 G513RW | |
| MSI Alpha 15 B5EEK-008 | |
| Cinebench R15 / CPU Multi 64Bit | |
| Schenker XMG SECTOR, i9 13900K, RTX 4090 | |
| Alienware m18 R1 | |
| Schenker XMG Neo 16 E23 | |
| MSI GE67 HX 12UGS | |
| Lenovo Legion Pro 5 16IRX8 | |
| Average AMD Ryzen 7 7745HX (2978 - 2994, n=2) | |
| Lenovo Legion Pro 5 16ARX8 | |
| MSI Pulse GL76 12UGK | |
| Schenker XMG Core 15 (M22) | |
| Asus TUF Gaming A16 FA617 | |
| Asus ROG Strix G15 G513RW | |
| MSI Alpha 15 B5EEK-008 | |
| Cinebench R15 / CPU Single 64Bit | |
| Schenker XMG SECTOR, i9 13900K, RTX 4090 | |
| Alienware m18 R1 | |
| Schenker XMG Neo 16 E23 | |
| Average AMD Ryzen 7 7745HX (294 - 295, n=2) | |
| Lenovo Legion Pro 5 16ARX8 | |
| Lenovo Legion Pro 5 16IRX8 | |
| MSI GE67 HX 12UGS | |
| MSI Pulse GL76 12UGK | |
| Schenker XMG Core 15 (M22) | |
| Asus TUF Gaming A16 FA617 | |
| Asus ROG Strix G15 G513RW | |
| MSI Alpha 15 B5EEK-008 | |
| Blender / v2.79 BMW27 CPU | |
| MSI Alpha 15 B5EEK-008 | |
| Asus ROG Strix G15 G513RW | |
| Asus TUF Gaming A16 FA617 | |
| Schenker XMG Core 15 (M22) | |
| MSI Pulse GL76 12UGK | |
| Lenovo Legion Pro 5 16ARX8 | |
| Average AMD Ryzen 7 7745HX (169 - 174, n=2) | |
| MSI GE67 HX 12UGS | |
| Lenovo Legion Pro 5 16IRX8 | |
| Schenker XMG Neo 16 E23 | |
| Alienware m18 R1 | |
| Schenker XMG SECTOR, i9 13900K, RTX 4090 | |
| 7-Zip 18.03 / 7z b 4 | |
| Schenker XMG SECTOR, i9 13900K, RTX 4090 | |
| Alienware m18 R1 | |
| Schenker XMG Neo 16 E23 | |
| Average AMD Ryzen 7 7745HX (75557 - 83268, n=2) | |
| Lenovo Legion Pro 5 16IRX8 | |
| MSI GE67 HX 12UGS | |
| Lenovo Legion Pro 5 16ARX8 | |
| MSI Pulse GL76 12UGK | |
| Schenker XMG Core 15 (M22) | |
| Asus TUF Gaming A16 FA617 | |
| Asus ROG Strix G15 G513RW | |
| MSI Alpha 15 B5EEK-008 | |
| 7-Zip 18.03 / 7z b 4 -mmt1 | |
| Average AMD Ryzen 7 7745HX (7244 - 7275, n=2) | |
| Lenovo Legion Pro 5 16ARX8 | |
| Schenker XMG SECTOR, i9 13900K, RTX 4090 | |
| Schenker XMG Neo 16 E23 | |
| Alienware m18 R1 | |
| Asus ROG Strix G15 G513RW | |
| Schenker XMG Core 15 (M22) | |
| Asus TUF Gaming A16 FA617 | |
| Lenovo Legion Pro 5 16IRX8 | |
| MSI Pulse GL76 12UGK | |
| MSI GE67 HX 12UGS | |
| MSI Alpha 15 B5EEK-008 | |
| Geekbench 5.5 / Multi-Core | |
| Schenker XMG SECTOR, i9 13900K, RTX 4090 | |
| Alienware m18 R1 | |
| Schenker XMG Neo 16 E23 | |
| MSI GE67 HX 12UGS | |
| Lenovo Legion Pro 5 16IRX8 | |
| Average AMD Ryzen 7 7745HX (12378 - 13462, n=2) | |
| Lenovo Legion Pro 5 16ARX8 | |
| MSI Pulse GL76 12UGK | |
| Schenker XMG Core 15 (M22) | |
| Asus TUF Gaming A16 FA617 | |
| Asus ROG Strix G15 G513RW | |
| MSI Alpha 15 B5EEK-008 | |
| Geekbench 5.5 / Single-Core | |
| Schenker XMG SECTOR, i9 13900K, RTX 4090 | |
| Alienware m18 R1 | |
| Average AMD Ryzen 7 7745HX (2040 - 2067, n=2) | |
| Schenker XMG Neo 16 E23 | |
| Lenovo Legion Pro 5 16ARX8 | |
| Lenovo Legion Pro 5 16IRX8 | |
| MSI GE67 HX 12UGS | |
| MSI Pulse GL76 12UGK | |
| Asus ROG Strix G15 G513RW | |
| Asus TUF Gaming A16 FA617 | |
| Schenker XMG Core 15 (M22) | |
| MSI Alpha 15 B5EEK-008 | |
| HWBOT x265 Benchmark v2.2 / 4k Preset | |
| Schenker XMG SECTOR, i9 13900K, RTX 4090 | |
| Alienware m18 R1 | |
| Schenker XMG Neo 16 E23 | |
| MSI GE67 HX 12UGS | |
| Lenovo Legion Pro 5 16IRX8 | |
| Average AMD Ryzen 7 7745HX (23.2 - 24.1, n=2) | |
| Lenovo Legion Pro 5 16ARX8 | |
| MSI Pulse GL76 12UGK | |
| Schenker XMG Core 15 (M22) | |
| Asus TUF Gaming A16 FA617 | |
| Asus ROG Strix G15 G513RW | |
| MSI Alpha 15 B5EEK-008 | |
| LibreOffice / 20 Documents To PDF | |
| Schenker XMG Core 15 (M22) | |
| Asus ROG Strix G15 G513RW | |
| Asus TUF Gaming A16 FA617 | |
| MSI Alpha 15 B5EEK-008 | |
| Alienware m18 R1 | |
| MSI Pulse GL76 12UGK | |
| MSI GE67 HX 12UGS | |
| Average AMD Ryzen 7 7745HX (37.9 - 41.4, n=2) | |
| Lenovo Legion Pro 5 16ARX8 | |
| Schenker XMG Neo 16 E23 | |
| Schenker XMG SECTOR, i9 13900K, RTX 4090 | |
| Lenovo Legion Pro 5 16IRX8 | |
| R Benchmark 2.5 / Overall mean | |
| MSI Alpha 15 B5EEK-008 | |
| Asus TUF Gaming A16 FA617 | |
| Asus ROG Strix G15 G513RW | |
| Schenker XMG Core 15 (M22) | |
| Lenovo Legion Pro 5 16IRX8 | |
| MSI Pulse GL76 12UGK | |
| MSI GE67 HX 12UGS | |
| Lenovo Legion Pro 5 16ARX8 | |
| Average AMD Ryzen 7 7745HX (0.4141 - 0.421, n=2) | |
| Alienware m18 R1 | |
| Schenker XMG Neo 16 E23 | |
| Schenker XMG SECTOR, i9 13900K, RTX 4090 | |
* ... smaller is better
AIDA64: FP32 Ray-Trace | FPU Julia | CPU SHA3 | CPU Queen | FPU SinJulia | FPU Mandel | CPU AES | CPU ZLib | FP64 Ray-Trace | CPU PhotoWorxx
| Performance rating | |
| Asus ROG Strix G16 G614JZ | |
| Schenker XMG Neo 16 E23 | |
| Average AMD Ryzen 7 7745HX | |
| Lenovo Legion Pro 5 16ARX8 | |
| Uniwill GM6PX7X RTX 4070 | |
| Lenovo Legion Pro 5 16IRX8 | |
| AIDA64 / FP32 Ray-Trace | |
| Lenovo Legion Pro 5 16ARX8 | |
| Average AMD Ryzen 7 7745HX (29066 - 29656, n=2) | |
| Asus ROG Strix G16 G614JZ | |
| Schenker XMG Neo 16 E23 | |
| Uniwill GM6PX7X RTX 4070 | |
| Lenovo Legion Pro 5 16IRX8 | |
| AIDA64 / FPU Julia | |
| Asus ROG Strix G16 G614JZ | |
| Average AMD Ryzen 7 7745HX (120974 - 123689, n=2) | |
| Lenovo Legion Pro 5 16ARX8 | |
| Schenker XMG Neo 16 E23 | |
| Uniwill GM6PX7X RTX 4070 | |
| Lenovo Legion Pro 5 16IRX8 | |
| AIDA64 / CPU SHA3 | |
| Asus ROG Strix G16 G614JZ | |
| Schenker XMG Neo 16 E23 | |
| Average AMD Ryzen 7 7745HX (4974 - 5204, n=2) | |
| Lenovo Legion Pro 5 16ARX8 | |
| Uniwill GM6PX7X RTX 4070 | |
| Lenovo Legion Pro 5 16IRX8 | |
| AIDA64 / CPU Queen | |
| Asus ROG Strix G16 G614JZ | |
| Schenker XMG Neo 16 E23 | |
| Average AMD Ryzen 7 7745HX (126954 - 128143, n=2) | |
| Lenovo Legion Pro 5 16ARX8 | |
| Lenovo Legion Pro 5 16IRX8 | |
| Uniwill GM6PX7X RTX 4070 | |
| AIDA64 / FPU SinJulia | |
| Asus ROG Strix G16 G614JZ | |
| Average AMD Ryzen 7 7745HX (15887 - 16221, n=2) | |
| Lenovo Legion Pro 5 16ARX8 | |
| Schenker XMG Neo 16 E23 | |
| Lenovo Legion Pro 5 16IRX8 | |
| Uniwill GM6PX7X RTX 4070 | |
| AIDA64 / FPU Mandel | |
| Asus ROG Strix G16 G614JZ | |
| Average AMD Ryzen 7 7745HX (64255 - 64969, n=2) | |
| Lenovo Legion Pro 5 16ARX8 | |
| Schenker XMG Neo 16 E23 | |
| Uniwill GM6PX7X RTX 4070 | |
| Lenovo Legion Pro 5 16IRX8 | |
| AIDA64 / CPU AES | |
| Schenker XMG Neo 16 E23 | |
| Uniwill GM6PX7X RTX 4070 | |
| Asus ROG Strix G16 G614JZ | |
| Lenovo Legion Pro 5 16IRX8 | |
| Average AMD Ryzen 7 7745HX (71191 - 95481, n=2) | |
| Lenovo Legion Pro 5 16ARX8 | |
| AIDA64 / CPU ZLib | |
| Asus ROG Strix G16 G614JZ | |
| Schenker XMG Neo 16 E23 | |
| Uniwill GM6PX7X RTX 4070 | |
| Lenovo Legion Pro 5 16IRX8 | |
| Average AMD Ryzen 7 7745HX (1147 - 1176, n=2) | |
| Lenovo Legion Pro 5 16ARX8 | |
| AIDA64 / FP64 Ray-Trace | |
| Average AMD Ryzen 7 7745HX (15975 - 16358, n=2) | |
| Lenovo Legion Pro 5 16ARX8 | |
| Asus ROG Strix G16 G614JZ | |
| Schenker XMG Neo 16 E23 | |
| Lenovo Legion Pro 5 16IRX8 | |
| Uniwill GM6PX7X RTX 4070 | |
| AIDA64 / CPU PhotoWorxx | |
| Schenker XMG Neo 16 E23 | |
| Uniwill GM6PX7X RTX 4070 | |
| Asus ROG Strix G16 G614JZ | |
| Lenovo Legion Pro 5 16IRX8 | |
| Average AMD Ryzen 7 7745HX (28499 - 33304, n=2) | |
| Lenovo Legion Pro 5 16ARX8 | |
系统性能
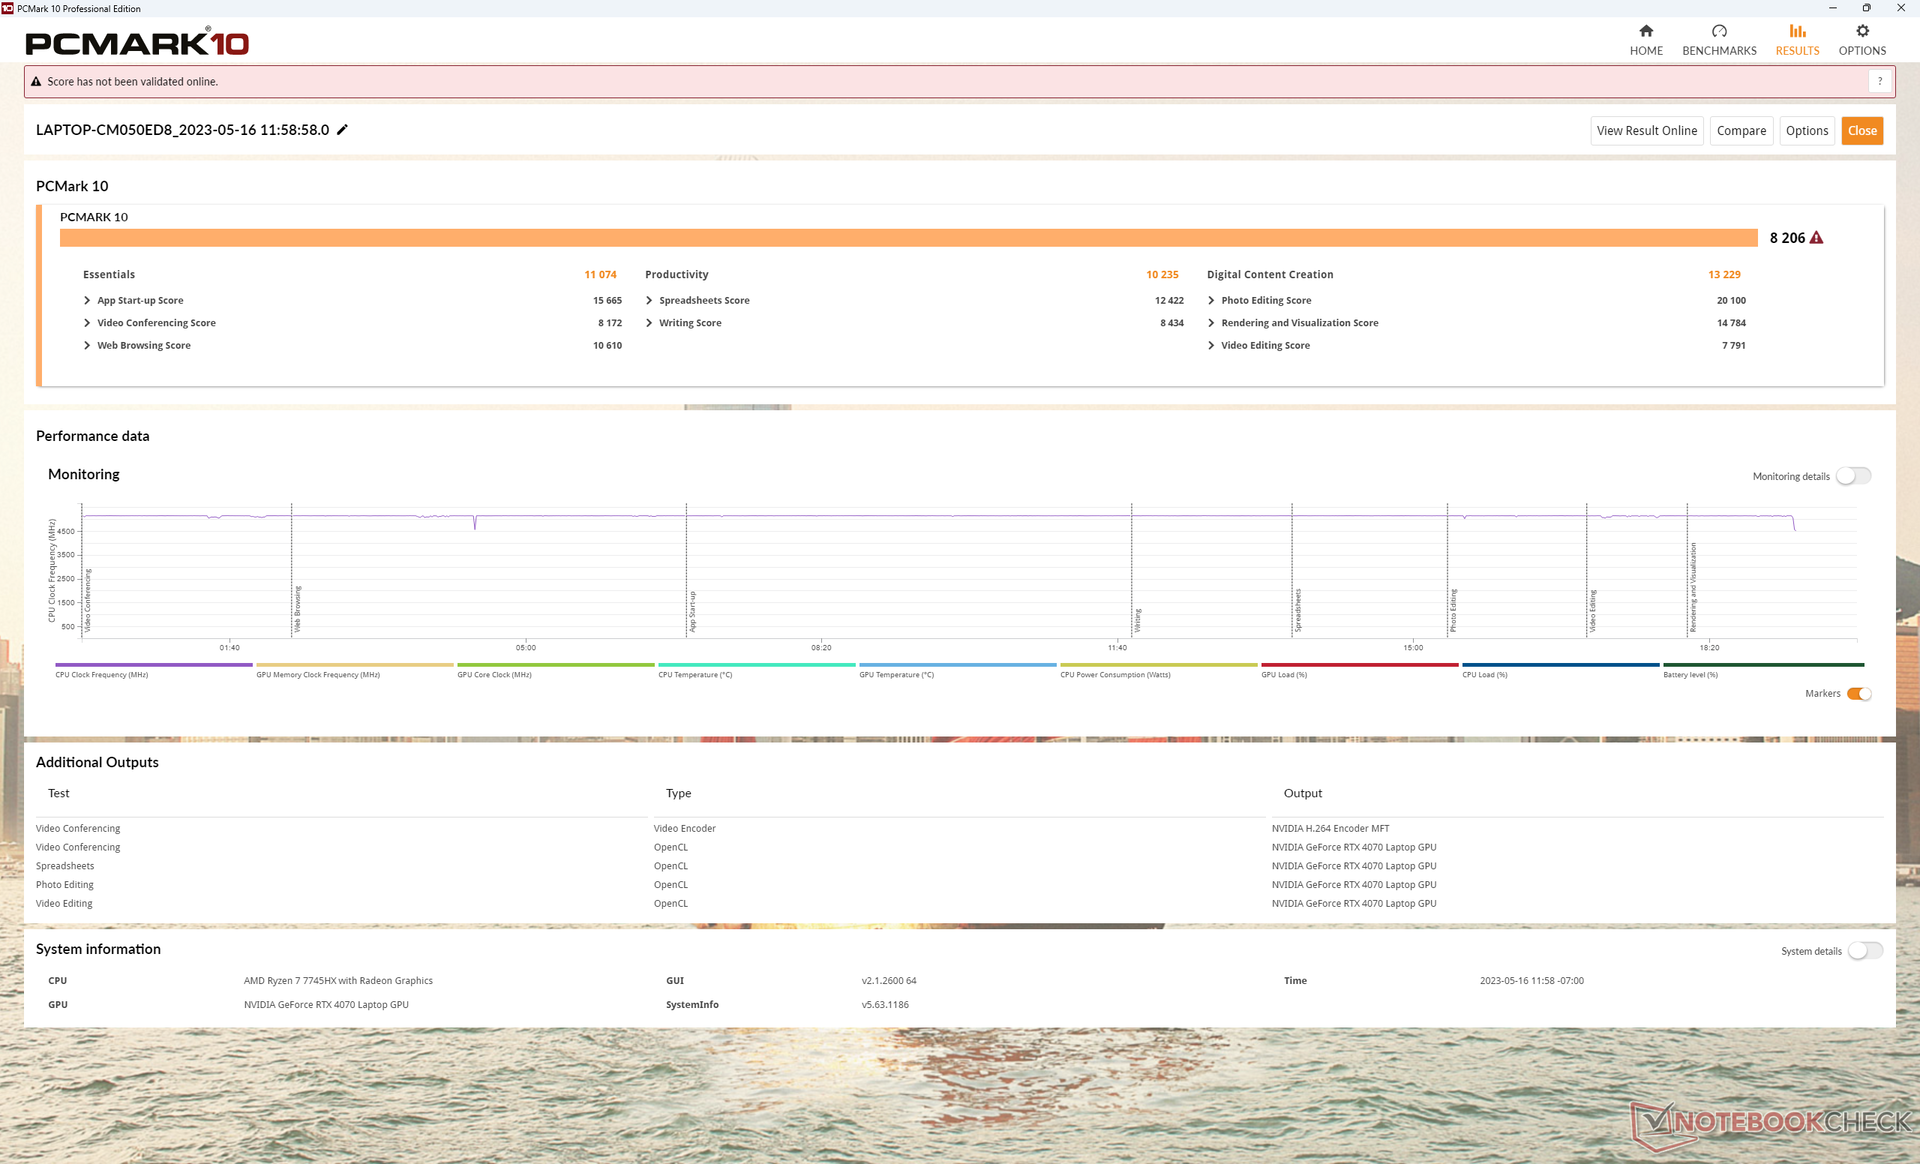
CrossMark: Overall | Productivity | Creativity | Responsiveness
| PCMark 10 / Score | |
| Asus Zephyrus Duo 16 GX650PY-NM006W | |
| Uniwill GM6PX7X RTX 4070 | |
| Schenker XMG Neo 16 E23 | |
| Lenovo Legion Pro 5 16ARX8 | |
| Lenovo Legion Pro 5 16IRX8 | |
| Asus ROG Strix G16 G614JZ | |
| PCMark 10 / Essentials | |
| Asus Zephyrus Duo 16 GX650PY-NM006W | |
| Asus ROG Strix G16 G614JZ | |
| Uniwill GM6PX7X RTX 4070 | |
| Lenovo Legion Pro 5 16ARX8 | |
| Schenker XMG Neo 16 E23 | |
| Lenovo Legion Pro 5 16IRX8 | |
| PCMark 10 / Productivity | |
| Asus Zephyrus Duo 16 GX650PY-NM006W | |
| Uniwill GM6PX7X RTX 4070 | |
| Lenovo Legion Pro 5 16ARX8 | |
| Schenker XMG Neo 16 E23 | |
| Lenovo Legion Pro 5 16IRX8 | |
| Asus ROG Strix G16 G614JZ | |
| PCMark 10 / Digital Content Creation | |
| Schenker XMG Neo 16 E23 | |
| Asus Zephyrus Duo 16 GX650PY-NM006W | |
| Uniwill GM6PX7X RTX 4070 | |
| Lenovo Legion Pro 5 16ARX8 | |
| Lenovo Legion Pro 5 16IRX8 | |
| Asus ROG Strix G16 G614JZ | |
| CrossMark / Overall | |
| Asus ROG Strix G16 G614JZ | |
| Schenker XMG Neo 16 E23 | |
| Asus Zephyrus Duo 16 GX650PY-NM006W | |
| Lenovo Legion Pro 5 16ARX8 | |
| Uniwill GM6PX7X RTX 4070 | |
| Lenovo Legion Pro 5 16IRX8 | |
| CrossMark / Productivity | |
| Asus ROG Strix G16 G614JZ | |
| Schenker XMG Neo 16 E23 | |
| Asus Zephyrus Duo 16 GX650PY-NM006W | |
| Lenovo Legion Pro 5 16ARX8 | |
| Uniwill GM6PX7X RTX 4070 | |
| Lenovo Legion Pro 5 16IRX8 | |
| CrossMark / Creativity | |
| Schenker XMG Neo 16 E23 | |
| Asus ROG Strix G16 G614JZ | |
| Asus Zephyrus Duo 16 GX650PY-NM006W | |
| Lenovo Legion Pro 5 16ARX8 | |
| Uniwill GM6PX7X RTX 4070 | |
| Lenovo Legion Pro 5 16IRX8 | |
| CrossMark / Responsiveness | |
| Asus ROG Strix G16 G614JZ | |
| Lenovo Legion Pro 5 16ARX8 | |
| Uniwill GM6PX7X RTX 4070 | |
| Schenker XMG Neo 16 E23 | |
| Asus Zephyrus Duo 16 GX650PY-NM006W | |
| Lenovo Legion Pro 5 16IRX8 | |
| PCMark 10 Score | 8206 points | |
Help | ||
| AIDA64 / Memory Copy | |
| Schenker XMG Neo 16 E23 | |
| Uniwill GM6PX7X RTX 4070 | |
| Asus ROG Strix G16 G614JZ | |
| Lenovo Legion Pro 5 16IRX8 | |
| Average AMD Ryzen 7 7745HX (50007 - 53867, n=2) | |
| Lenovo Legion Pro 5 16ARX8 | |
| AIDA64 / Memory Read | |
| Schenker XMG Neo 16 E23 | |
| Asus ROG Strix G16 G614JZ | |
| Uniwill GM6PX7X RTX 4070 | |
| Lenovo Legion Pro 5 16IRX8 | |
| Average AMD Ryzen 7 7745HX (50703 - 54278, n=2) | |
| Lenovo Legion Pro 5 16ARX8 | |
| AIDA64 / Memory Write | |
| Schenker XMG Neo 16 E23 | |
| Lenovo Legion Pro 5 16IRX8 | |
| Uniwill GM6PX7X RTX 4070 | |
| Average AMD Ryzen 7 7745HX (54587 - 70803, n=2) | |
| Asus ROG Strix G16 G614JZ | |
| Lenovo Legion Pro 5 16ARX8 | |
| AIDA64 / Memory Latency | |
| Asus ROG Strix G16 G614JZ | |
| Uniwill GM6PX7X RTX 4070 | |
| Lenovo Legion Pro 5 16ARX8 | |
| Schenker XMG Neo 16 E23 | |
| Average AMD Ryzen 7 7745HX (80.7 - 86.5, n=2) | |
| Lenovo Legion Pro 5 16IRX8 | |
* ... smaller is better
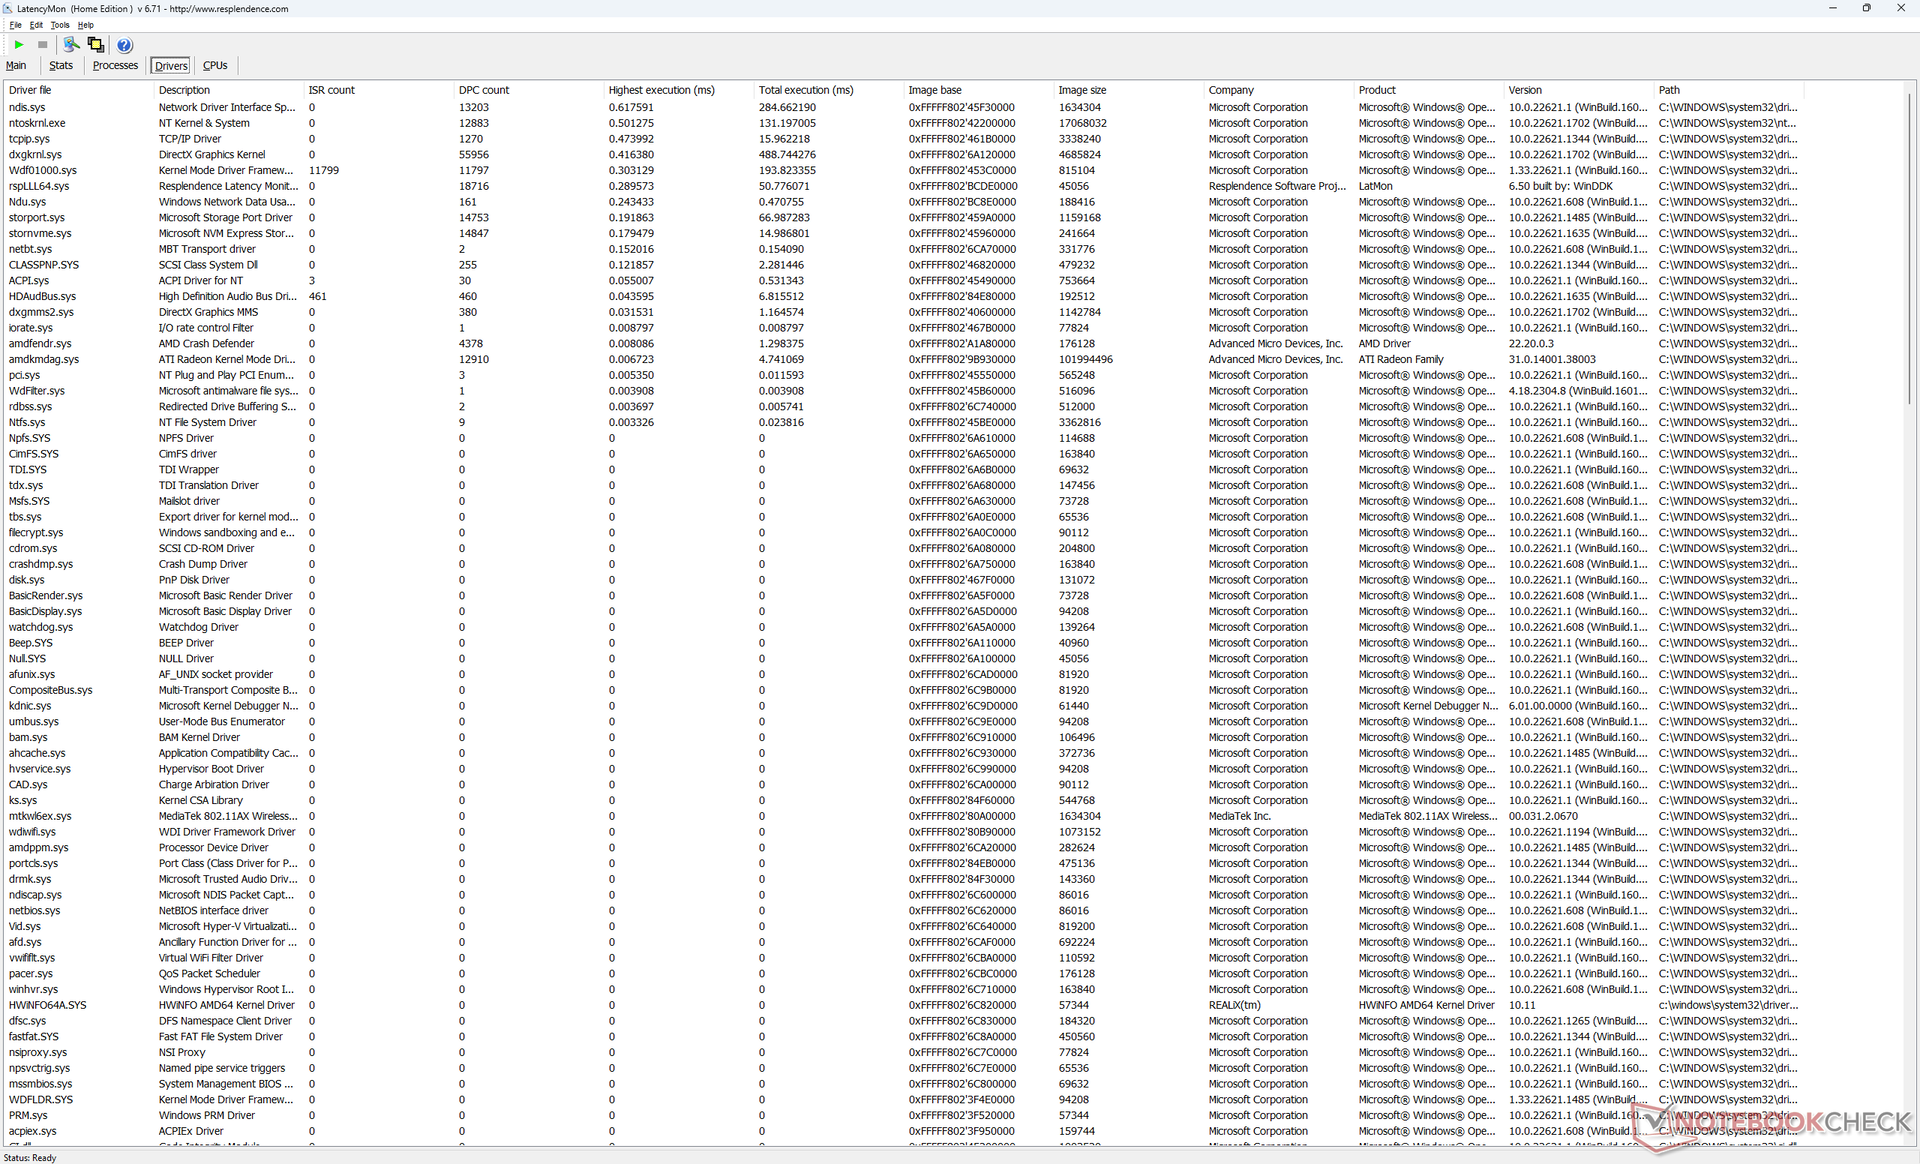
DPC延时
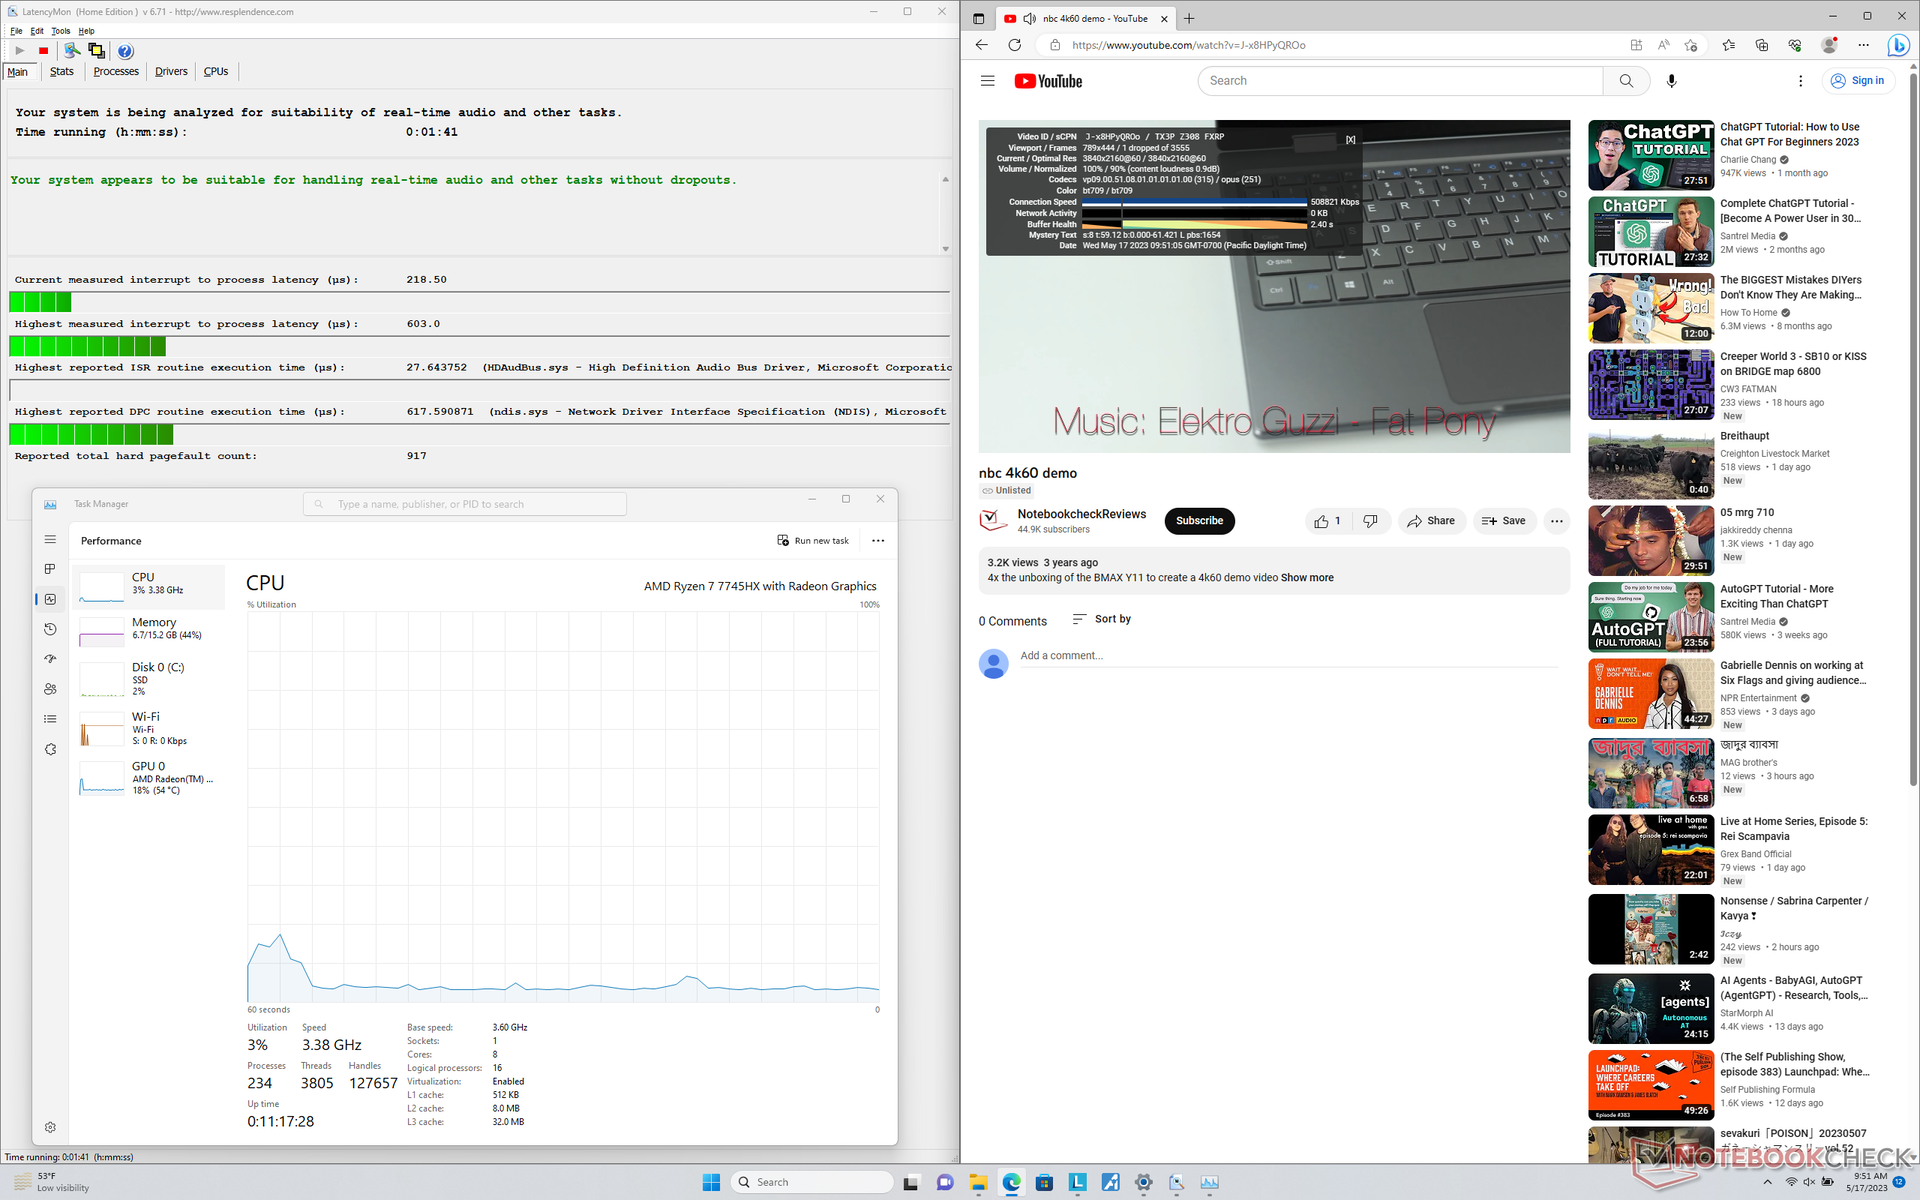
LatencyMon显示,在打开我们主页的多个浏览器标签或运行Prime95压力时,没有重大的DPC问题。在60 FPS下的4K视频播放是非常好的,在我们的测试视频中只有一个丢帧。
| DPC Latencies / LatencyMon - interrupt to process latency (max), Web, Youtube, Prime95 | |
| Asus Zephyrus Duo 16 GX650PY-NM006W | |
| Schenker XMG Neo 16 E23 | |
| Asus ROG Strix G16 G614JZ | |
| Uniwill GM6PX7X RTX 4070 | |
| Lenovo Legion Pro 5 16IRX8 | |
| Lenovo Legion Pro 5 16ARX8 | |
* ... smaller is better
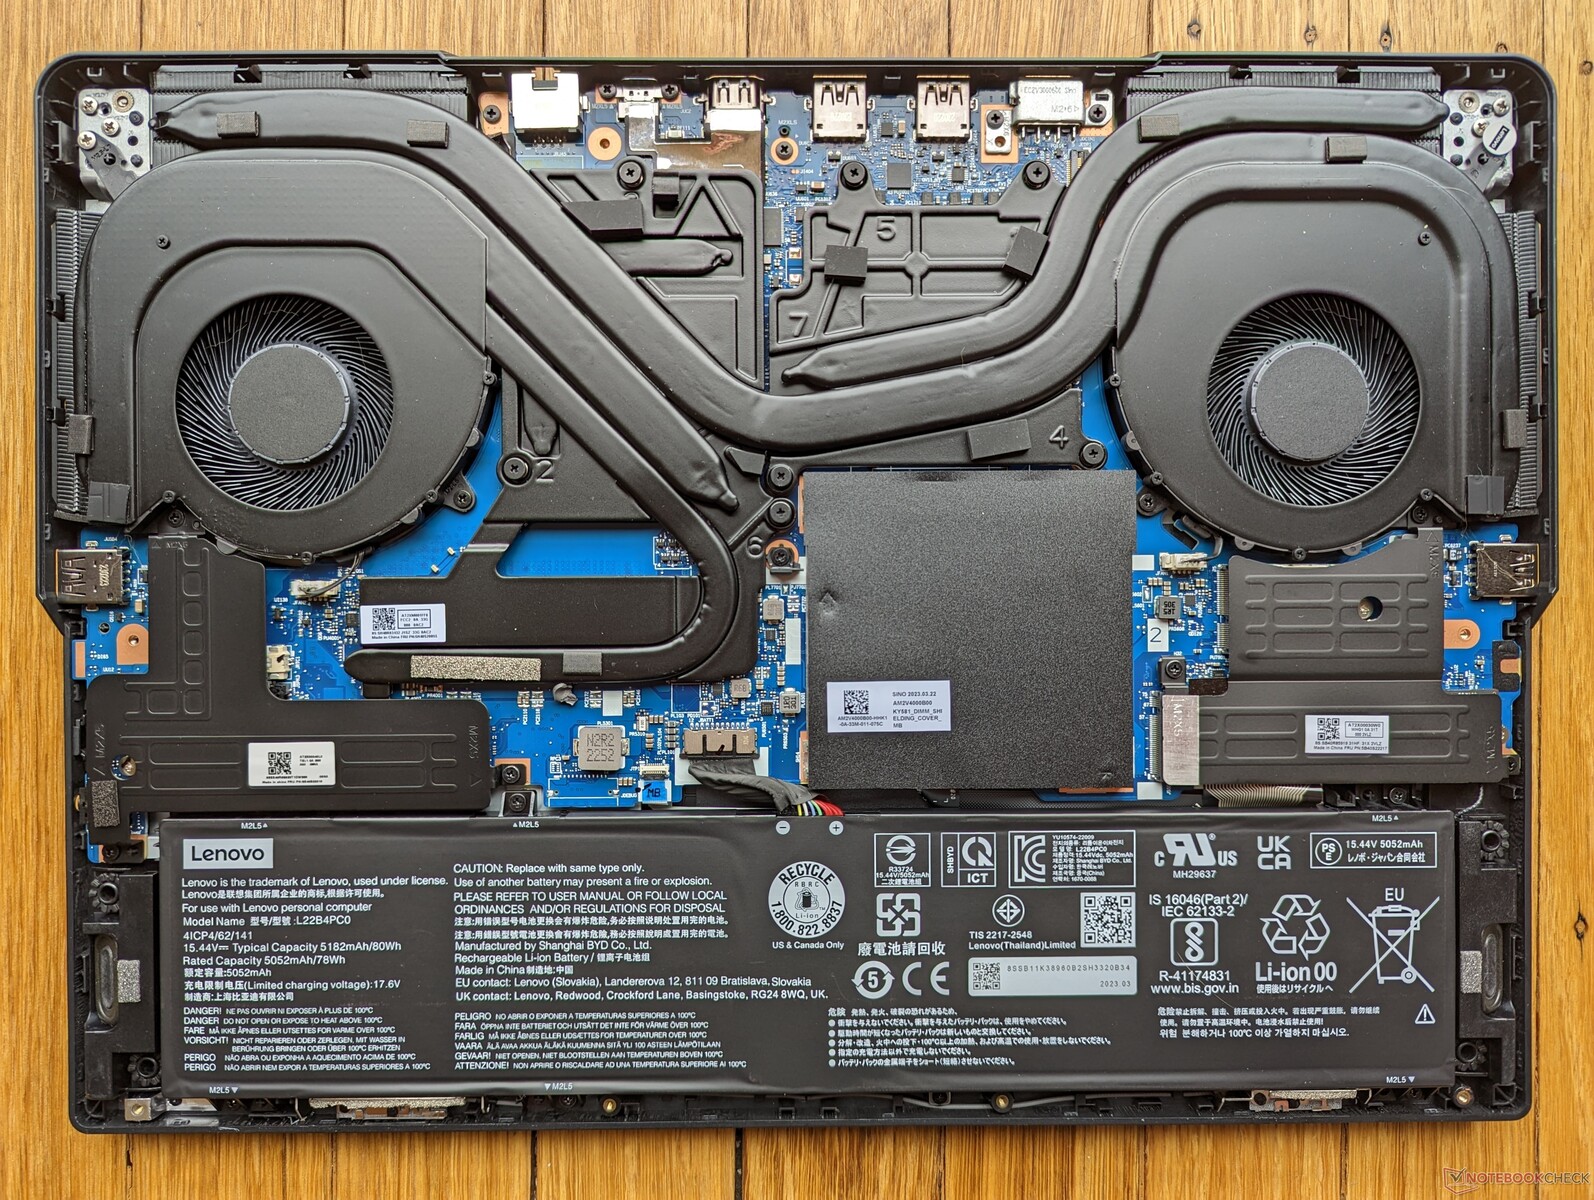
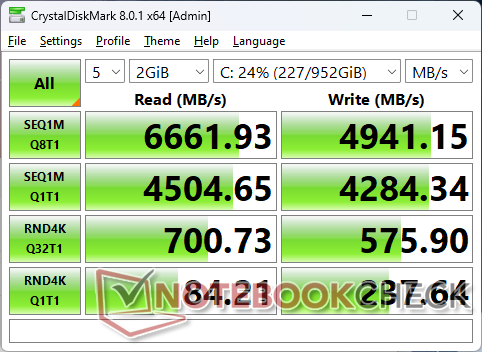
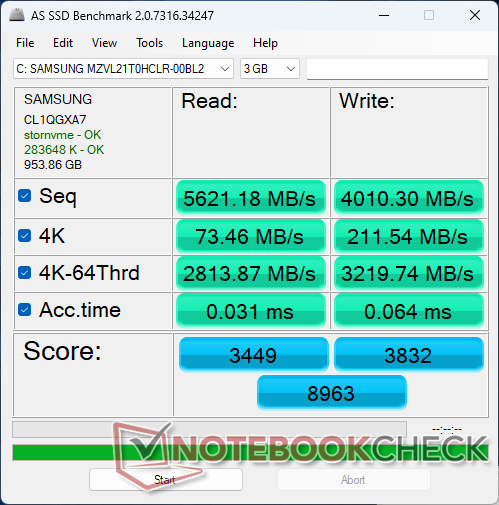
存储设备 - 多达两个PCIe4 x4驱动器
我们的设备配备了一个1TB 三星PM9A1NVMe SSD,这是目前最快的消费级PCIe4 x4 SSD之一。传输速率最高约为6600MB/s,但如下图所示,在我们的压力测试中,仅仅几分钟后,性能就降到了3300MB/s。结果表明,联想的固态硬盘没有得到适当的冷却,就像其他笔记本电脑中的相同固态硬盘一样,例如 联合利华GM6PX7X可以在更长的时间内维持更高的传输率。

| Drive Performance rating - Percent | |
| Lenovo Legion Pro 5 16ARX8 | |
| Lenovo Legion Pro 5 16IRX8 | |
| Uniwill GM6PX7X RTX 4070 | |
| Asus Zephyrus Duo 16 GX650PY-NM006W | |
| Asus ROG Strix G16 G614JZ | |
| Schenker XMG Neo 16 E23 | |
* ... smaller is better
Disk Throttling: DiskSpd Read Loop, Queue Depth 8
GPU性能--中高端图形卡
原始图形性能可与去年的 移动版eForce RTX 3070 Ti.140W的TGP目标允许联想的移动RTX 4070在性能上略微超过其他大多数具有相同GPU的笔记本电脑。
降级到 移动RTX 4060或 移动RTX 4050SKU,预计性能会分别下降15%和20%。不幸的是,目前没有 移动RTX 4080选项,这将使性能比我们的移动RTX 4070大幅提高40%至50%。相反,这样的高端GPU选项是为联想的顶级Legion 7系列保留的。
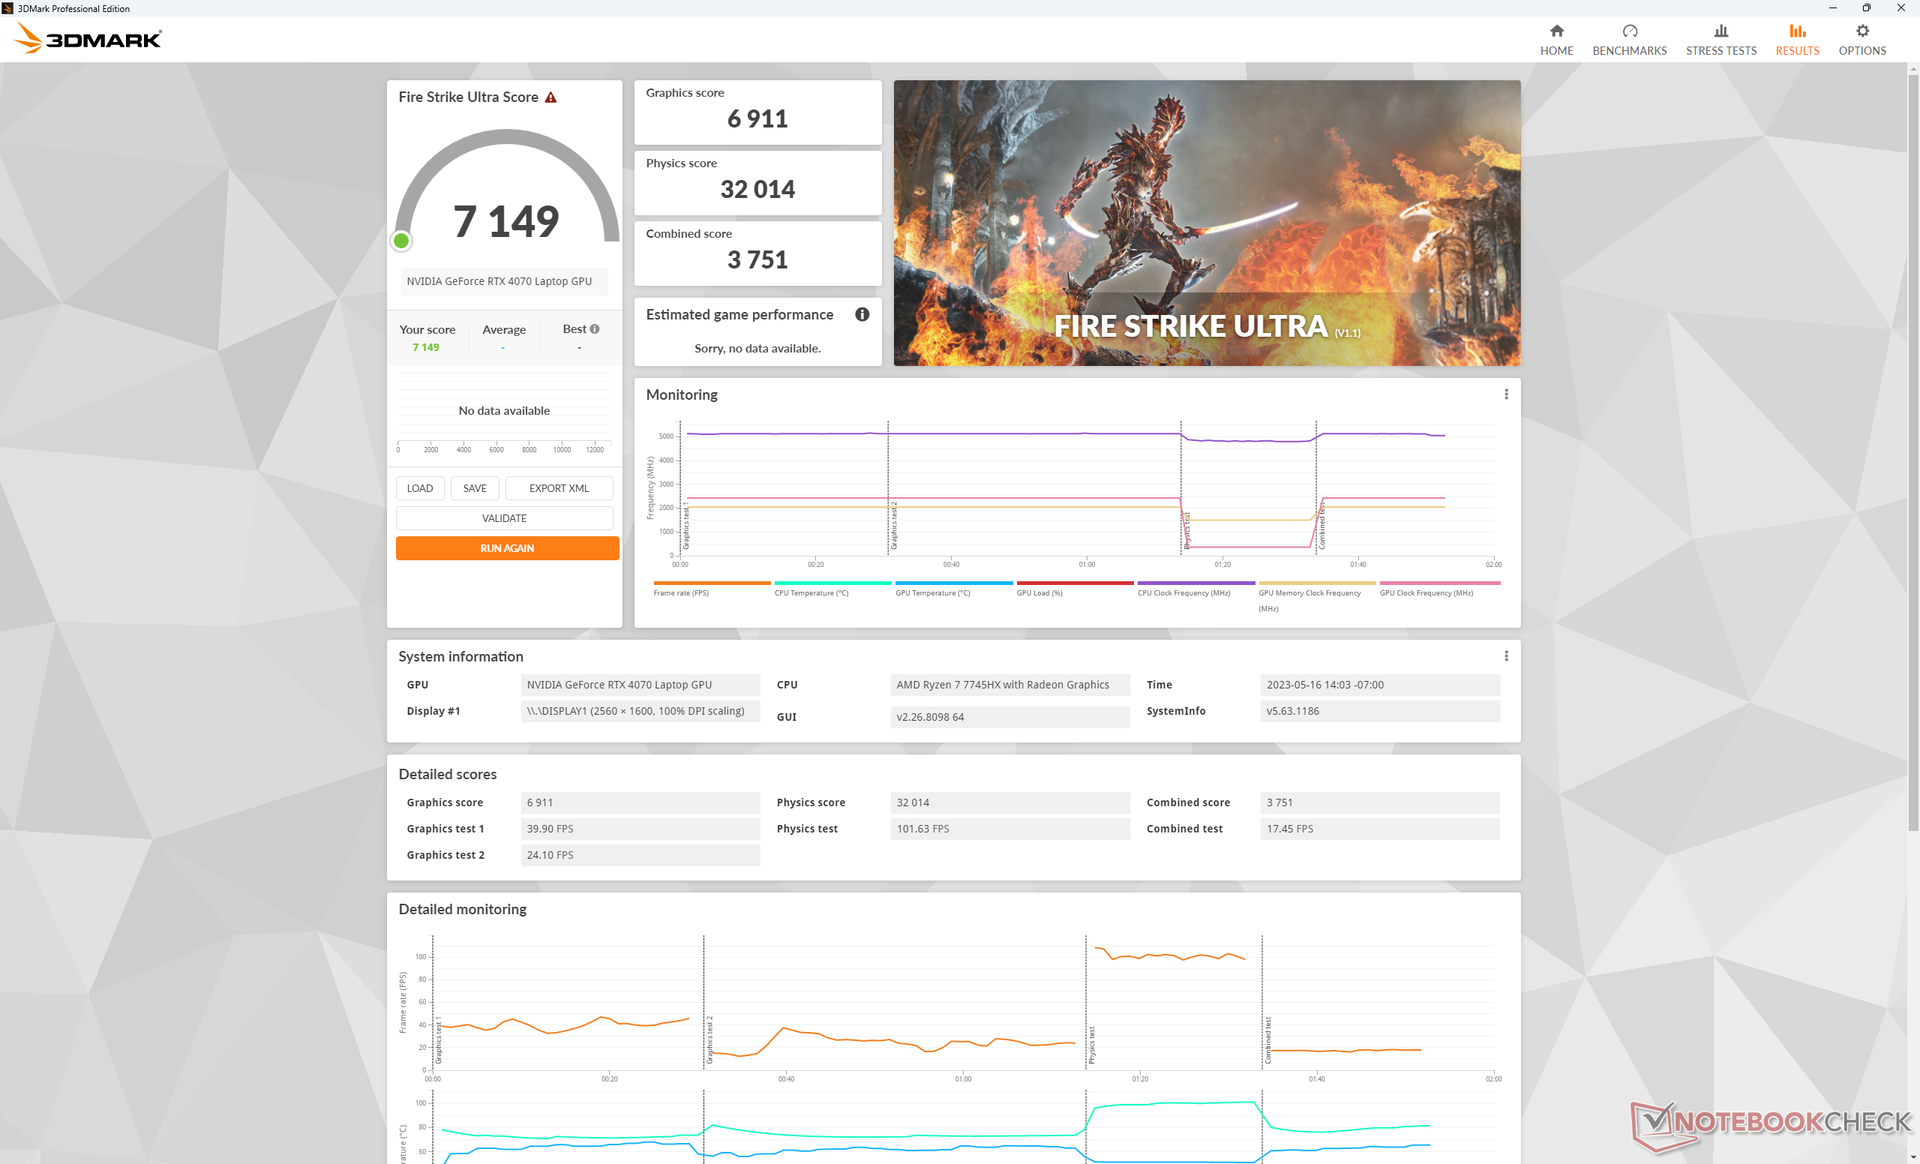
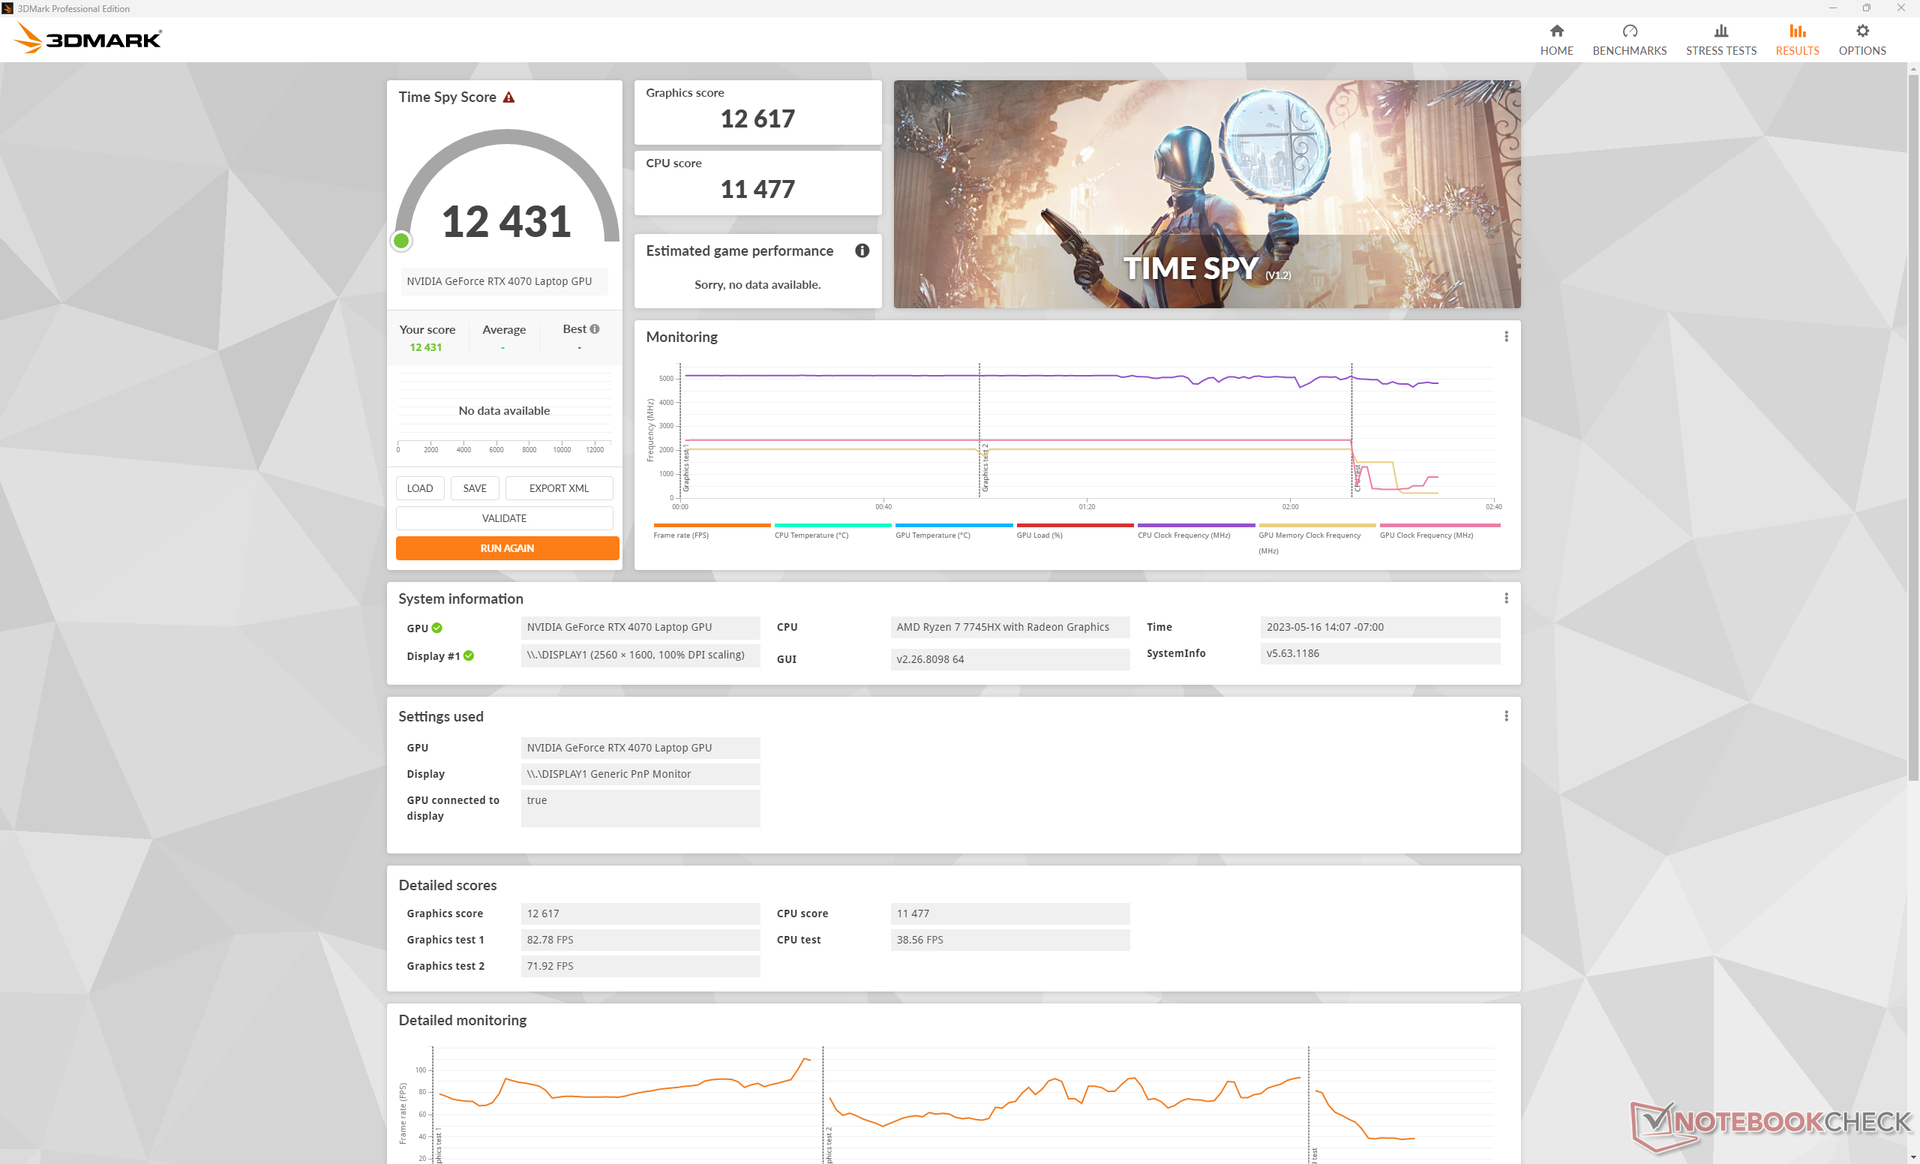
根据3DMarkTime Spy ,在没有超频的情况下,在平衡电源配置文件上运行dGPU将使图形性能下降约13%。
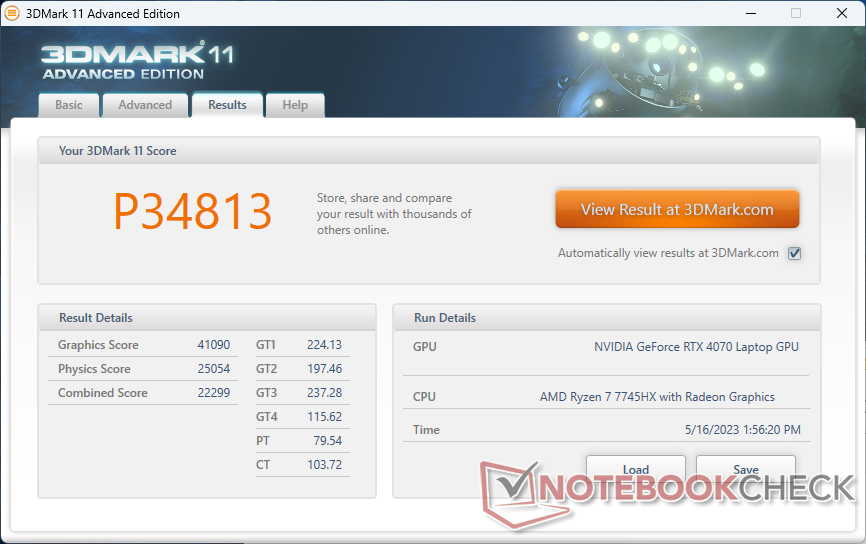
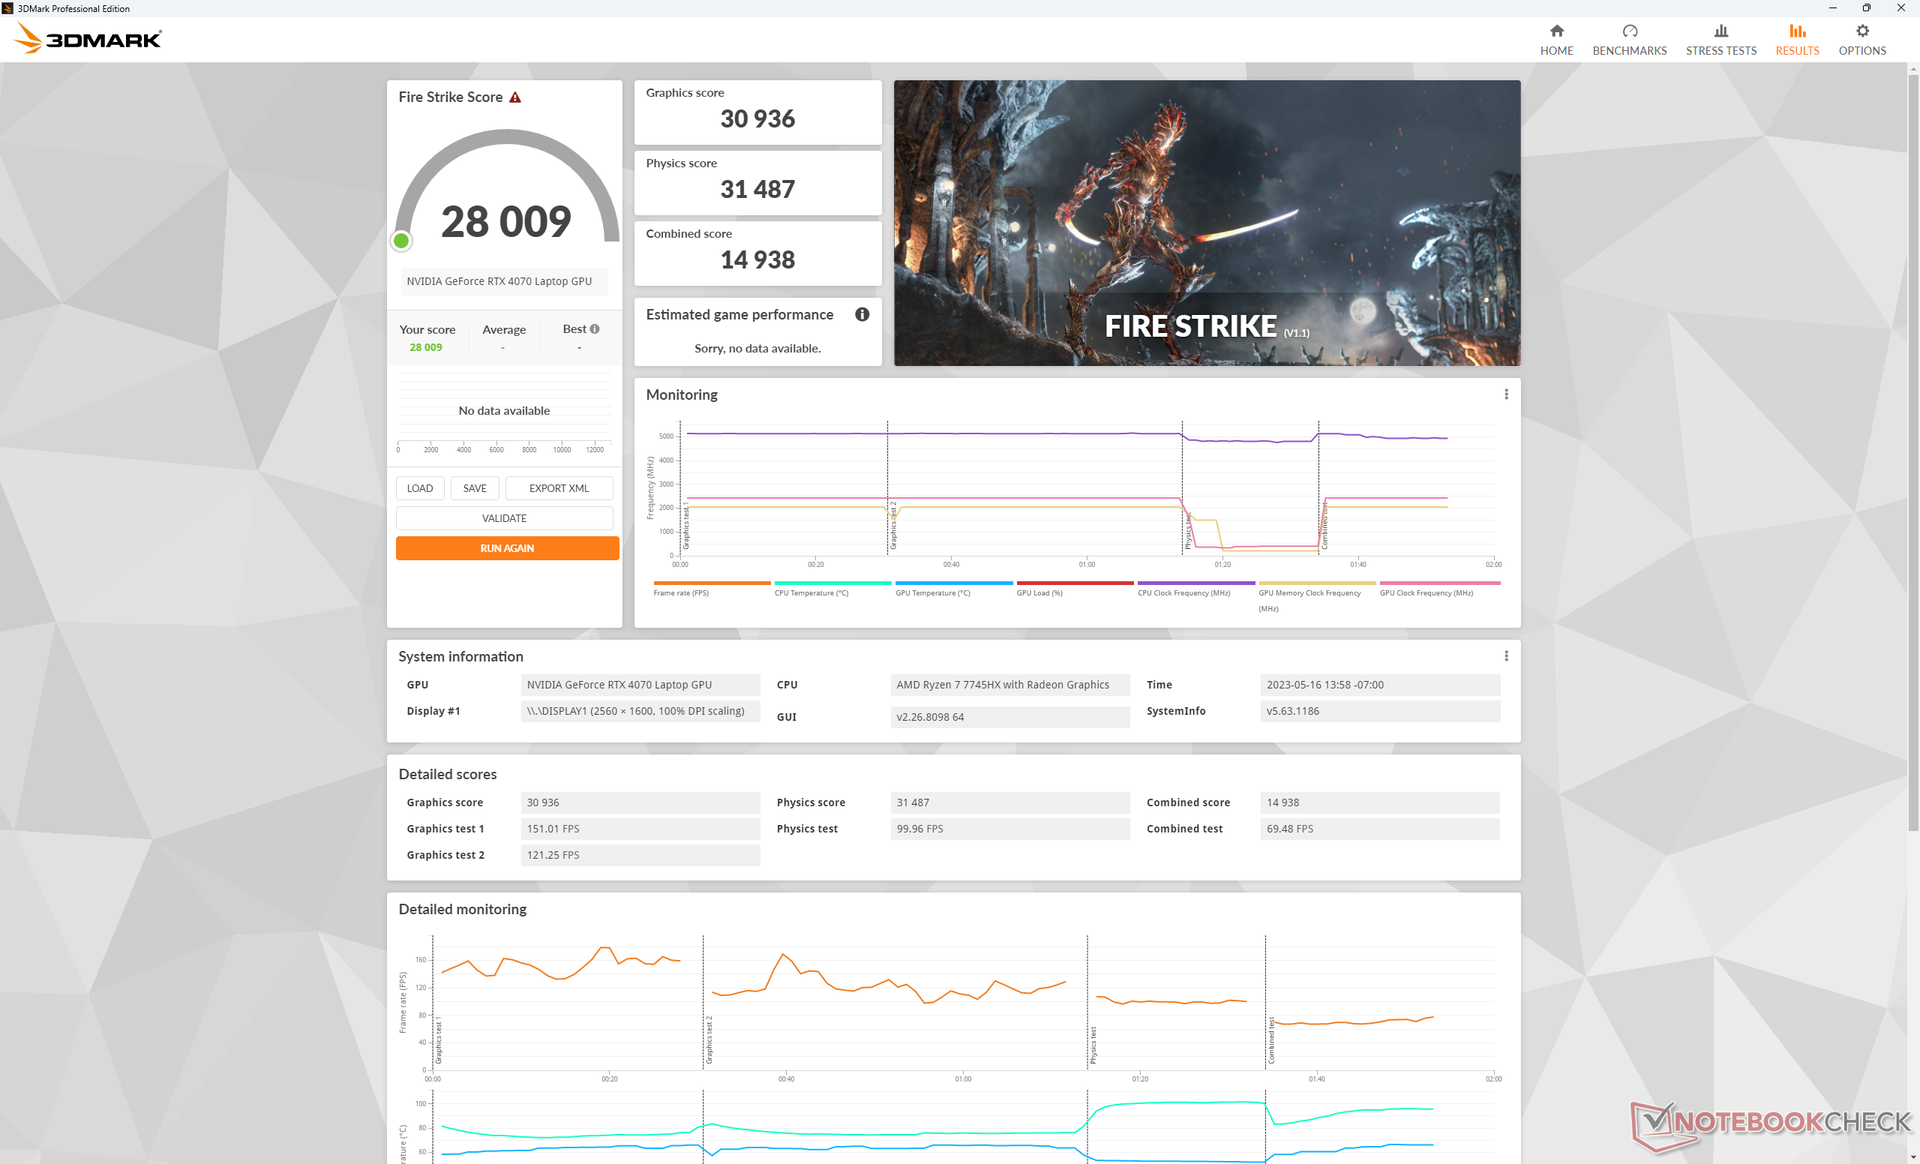
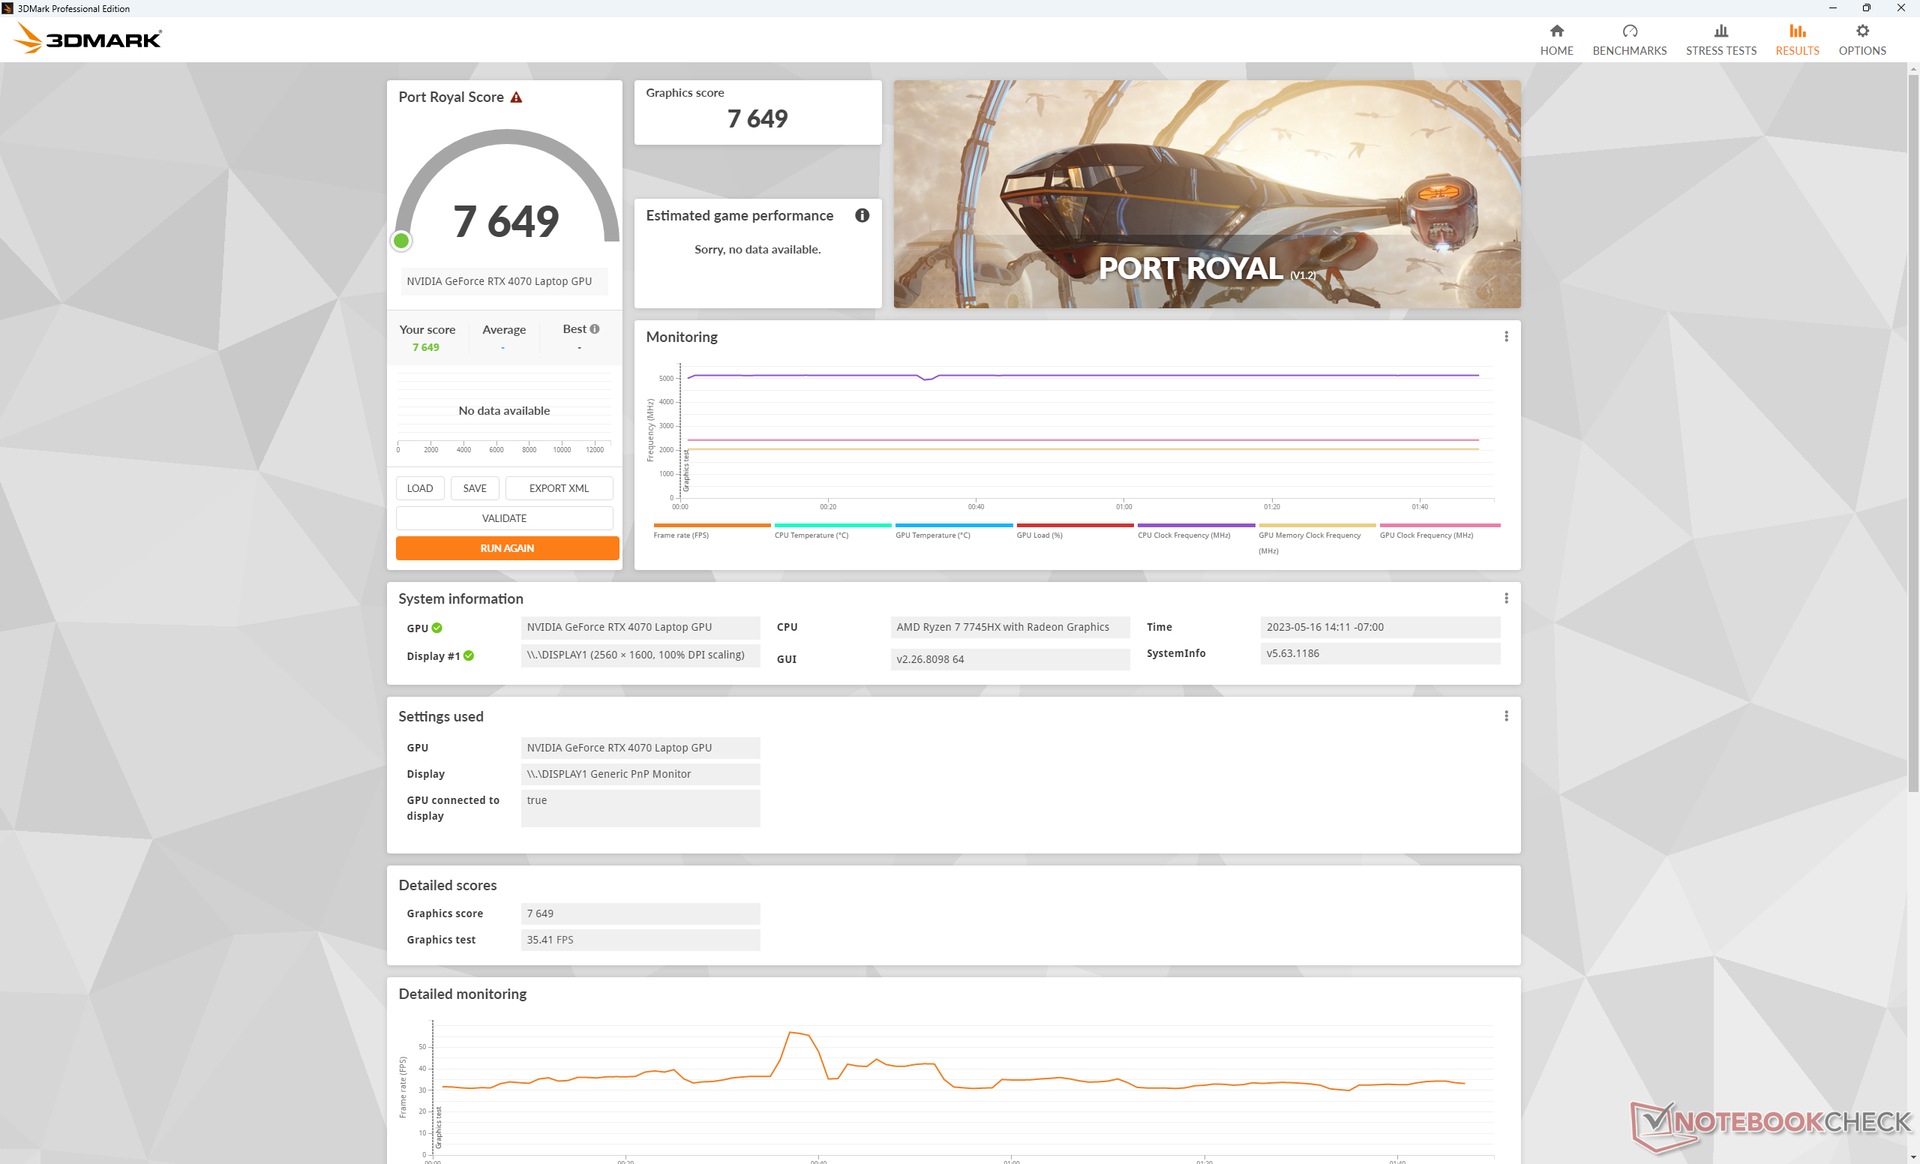
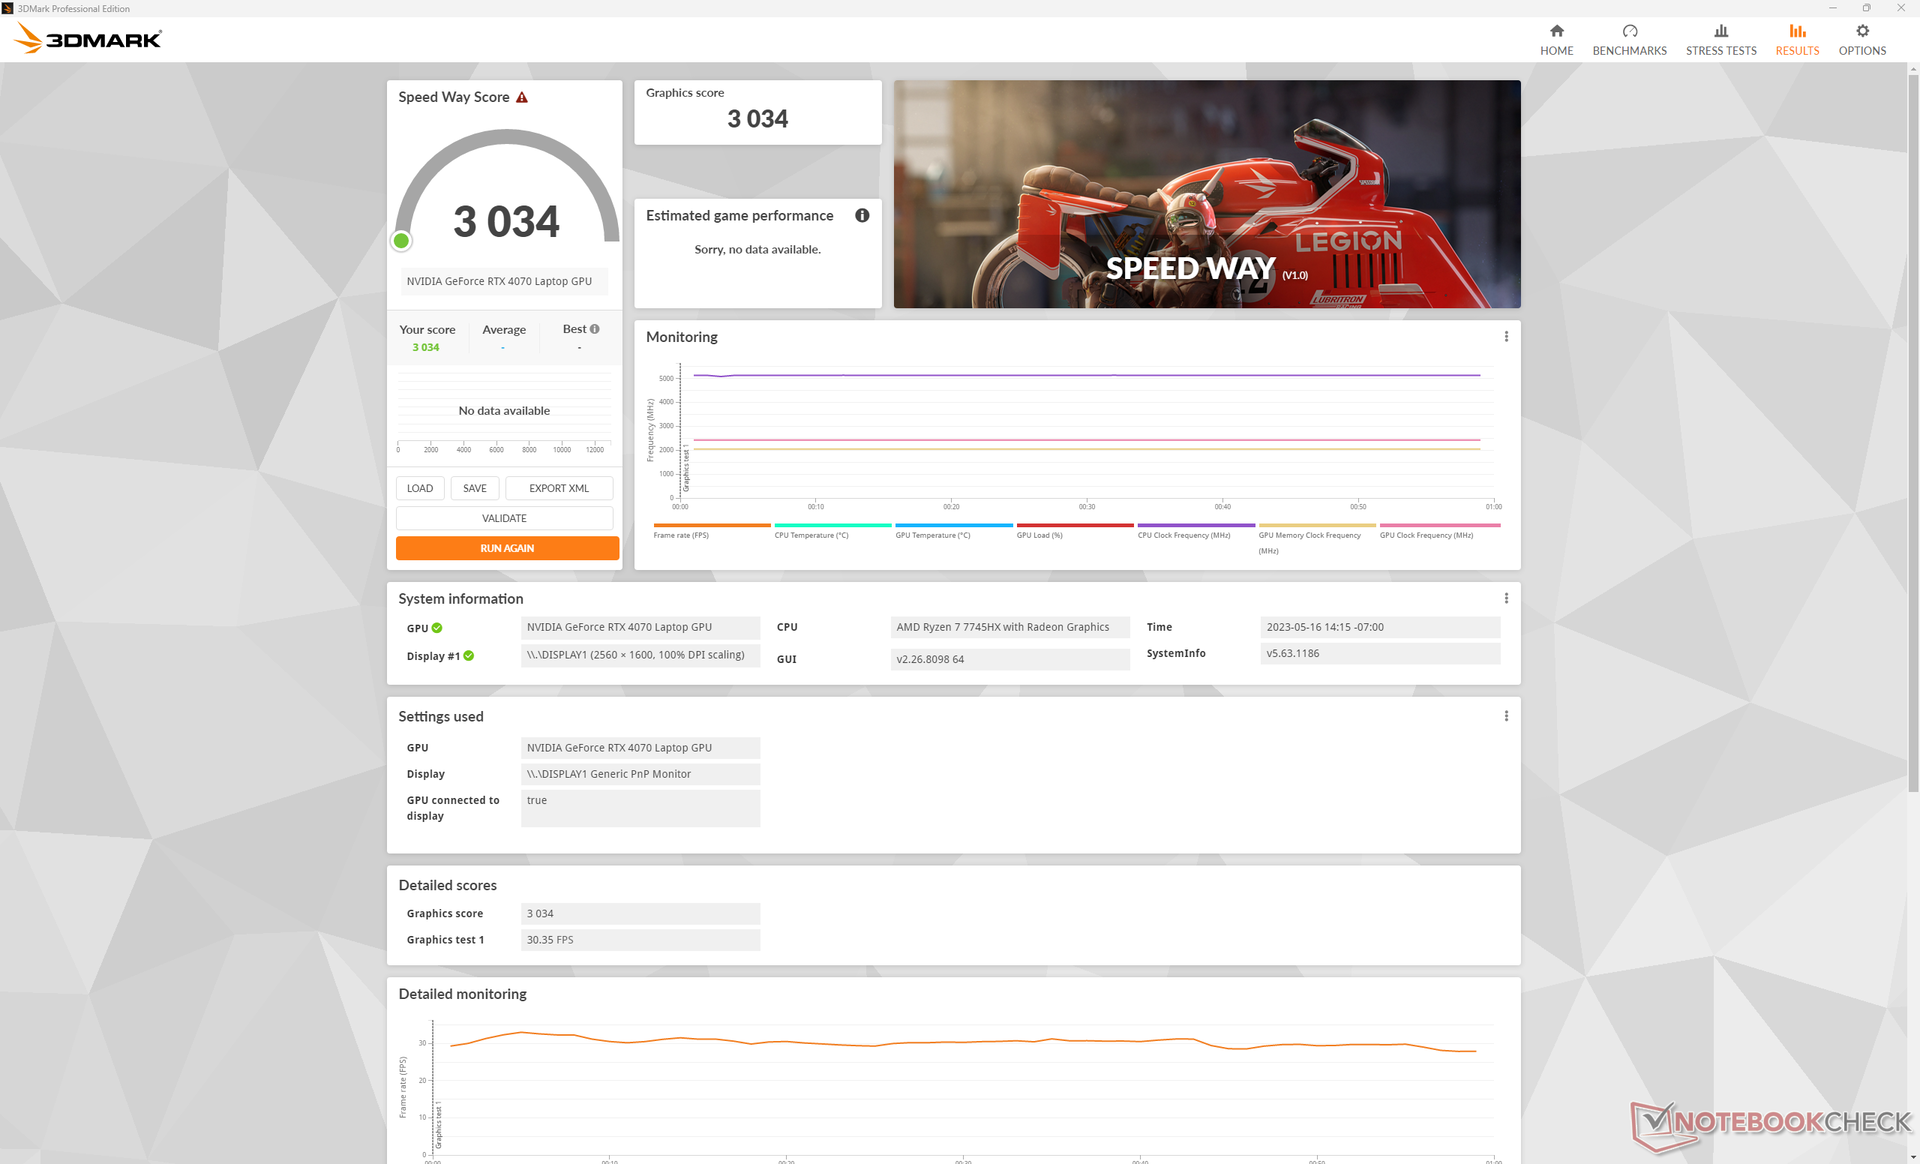
| 3DMark 11 Performance | 34813 points | |
| 3DMark Fire Strike Score | 28009 points | |
| 3DMark Time Spy Score | 12431 points | |
Help | ||
* ... smaller is better
游戏性能
我们的AMD驱动的RTX 4070模型在最坏的情况下会与英特尔驱动的RTX 4060模型表现差不多,最好的情况下会快20%。正如预期的那样,在以更高的分辨率和设置玩更高要求的游戏时,这两款GPU之间的性能差距往往会扩大。例如,《F1 22》和《Returnal》 在我们的AMDLegion 模型上运行时快了15%至20%,而像《GTA V》 这样的老游戏会显示较小的帧率优势,只有5%至10%。因此,你会想玩更多较新的游戏,以更好地利用移动RTX 4070的优势。
一般来说,移动RTX 4070与原生2560 x 1600分辨率的显示器搭配得很好,尤其是支持G-Sync。虽然移动版比桌面版要弱得多 桌面版本约30%,但它仍然足够强大,可以在1600p和60+FPS的高设置下运行最新的游戏。不为帧生成的缺点所困扰的玩家可以在支持的游戏中启用DLSS3,以获得更高的帧率。
Witcher 3 FPS Chart
| low | med. | high | ultra | QHD | 4K | |
|---|---|---|---|---|---|---|
| GTA V (2015) | 185.8 | 185.1 | 178.6 | 119.9 | 93.2 | 93.7 |
| The Witcher 3 (2015) | 597 | 415.1 | 257.3 | 119.8 | 76.2 | |
| Dota 2 Reborn (2015) | 238 | 203 | 191.8 | 182 | 151.5 | |
| Final Fantasy XV Benchmark (2018) | 229 | 172.5 | 119.9 | 119.9 | 49.2 | |
| X-Plane 11.11 (2018) | 186.3 | 155.2 | 117.8 | 99.5 | ||
| Strange Brigade (2018) | 636 | 334 | 260 | 223 | 146.4 | 76.8 |
| Shadow of the Tomb Raider (2018) | 168 | 110 | 53 | |||
| Far Cry 6 (2021) | 110 | 88 | 43 | |||
| Cyberpunk 2077 1.6 (2022) | 185.8 | 157.6 | 121.3 | 98.9 | 58.1 | 24.7 |
| Tiny Tina's Wonderlands (2022) | 263.6 | 217.3 | 144.5 | 112.1 | 76.9 | 39.7 |
| F1 22 (2022) | 311 | 300 | 235 | 84.1 | 54.8 | 26.4 |
| Call of Duty Modern Warfare 2 2022 (2022) | 108 | 77 | 44 | |||
| Returnal (2023) | 93 | 90 | 85 | 77 | 55 | 29 |
| Star Wars Jedi Survivor (2023) | 77.9 | 50.4 | 24.2 |
排放
系统噪音 - 游戏时约为50 dB(A)
在游戏时,AMD和英特尔型号的风扇噪音大致相同,约为48 dB(A)。然而,如果CPU的压力大得多,风扇噪音最高可达54 dB(A)。50分贝(A)的低范围是大多数游戏笔记本电脑的典型特征,包括华硕ROG Strix G16或Razer Blade 16.
有趣的是,在运行办公室工作或视频播放等要求不高的负载时,风扇的噪音要小一些,而且脉动也不频繁。在升压时,AMD的CPU比英特尔的CPU消耗更少的功率,这可能有助于稳定的风扇噪音。
Noise level
| Idle |
| 23.2 / 23.2 / 26.2 dB(A) |
| Load |
| 31.4 / 53.8 dB(A) |
 | ||
30 dB silent 40 dB(A) audible 50 dB(A) loud |
||
min: | ||
| Lenovo Legion Pro 5 16ARX8 GeForce RTX 4070 Laptop GPU, R7 7745HX, Samsung PM9A1 MZVL21T0HCLR | Lenovo Legion Pro 5 16IRX8 GeForce RTX 4060 Laptop GPU, i7-13700HX, SK hynix PC801 HFS512GEJ9X115N | Uniwill GM6PX7X RTX 4070 GeForce RTX 4070 Laptop GPU, i7-13700HX, Samsung PM9A1 MZVL2512HCJQ | Schenker XMG Neo 16 E23 GeForce RTX 4090 Laptop GPU, i9-13900HX, Crucial P5 Plus 1TB CT1000P5PSSD8 | Asus ROG Strix G16 G614JZ GeForce RTX 4080 Laptop GPU, i9-13980HX, WD PC SN560 SDDPNQE-1T00 | Asus Zephyrus Duo 16 GX650PY-NM006W GeForce RTX 4090 Laptop GPU, R9 7945HX, SK hynix PC801 HFS002TEJ9X101N | |
|---|---|---|---|---|---|---|
| Noise | -2% | -9% | -37% | -15% | -19% | |
| off / environment * (dB) | 23.2 | 23 1% | 22.4 3% | 25 -8% | 25 -8% | 23.9 -3% |
| Idle Minimum * (dB) | 23.2 | 23.1 -0% | 22.9 1% | 31 -34% | 26 -12% | 23.9 -3% |
| Idle Average * (dB) | 23.2 | 23.1 -0% | 29 -25% | 33 -42% | 28 -21% | 32.9 -42% |
| Idle Maximum * (dB) | 26.2 | 26.6 -2% | 29 -11% | 42 -60% | 30 -15% | 36.5 -39% |
| Load Average * (dB) | 31.4 | 34.7 -11% | 40.2 -28% | 58 -85% | 48 -53% | 42.9 -37% |
| Witcher 3 ultra * (dB) | 48.4 | 47.6 2% | 48.7 -1% | 57 -18% | 49 -1% | 51.2 -6% |
| Load Maximum * (dB) | 53.8 | 54.8 -2% | 55 -2% | 59 -10% | 52 3% | 56 -4% |
* ... smaller is better
温度
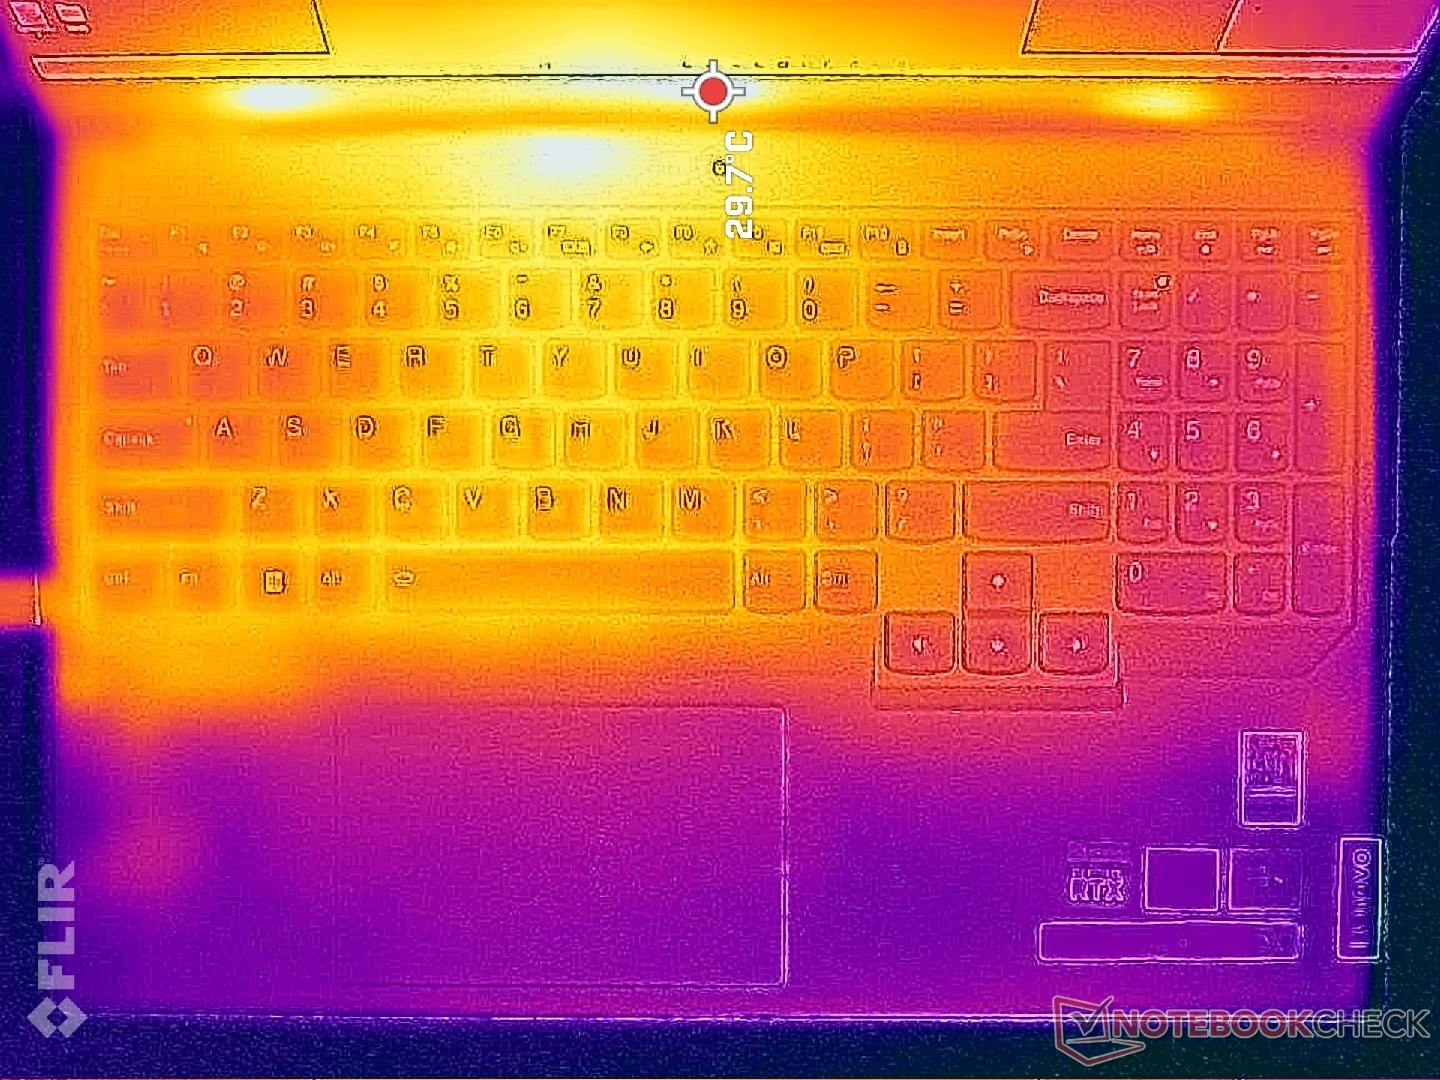
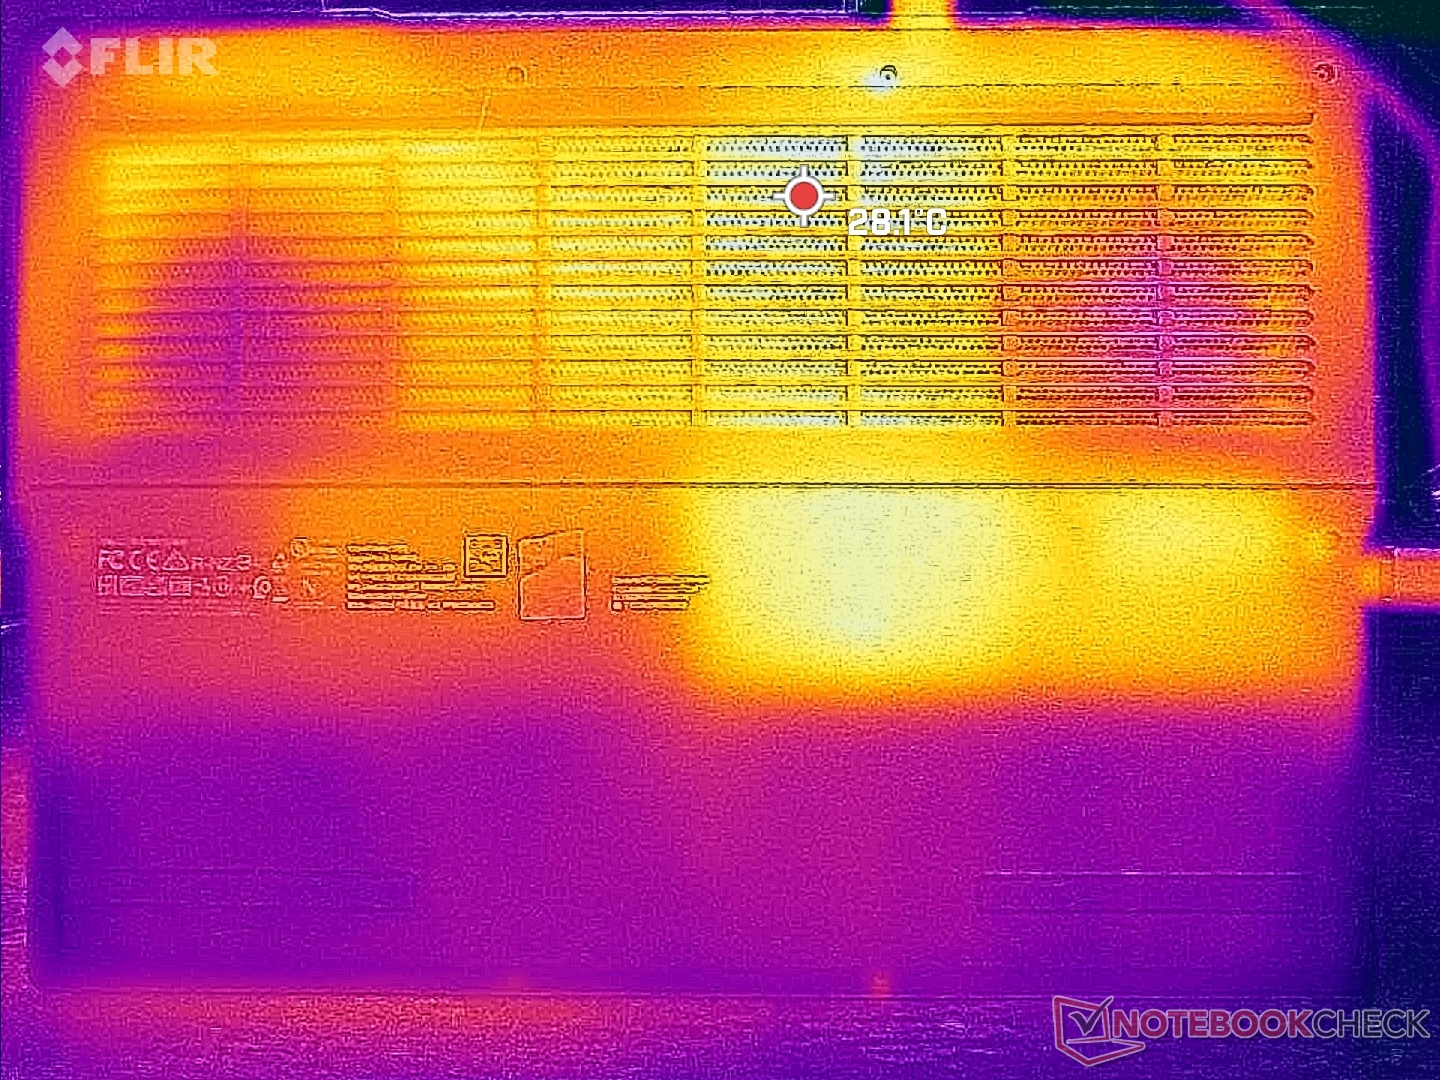
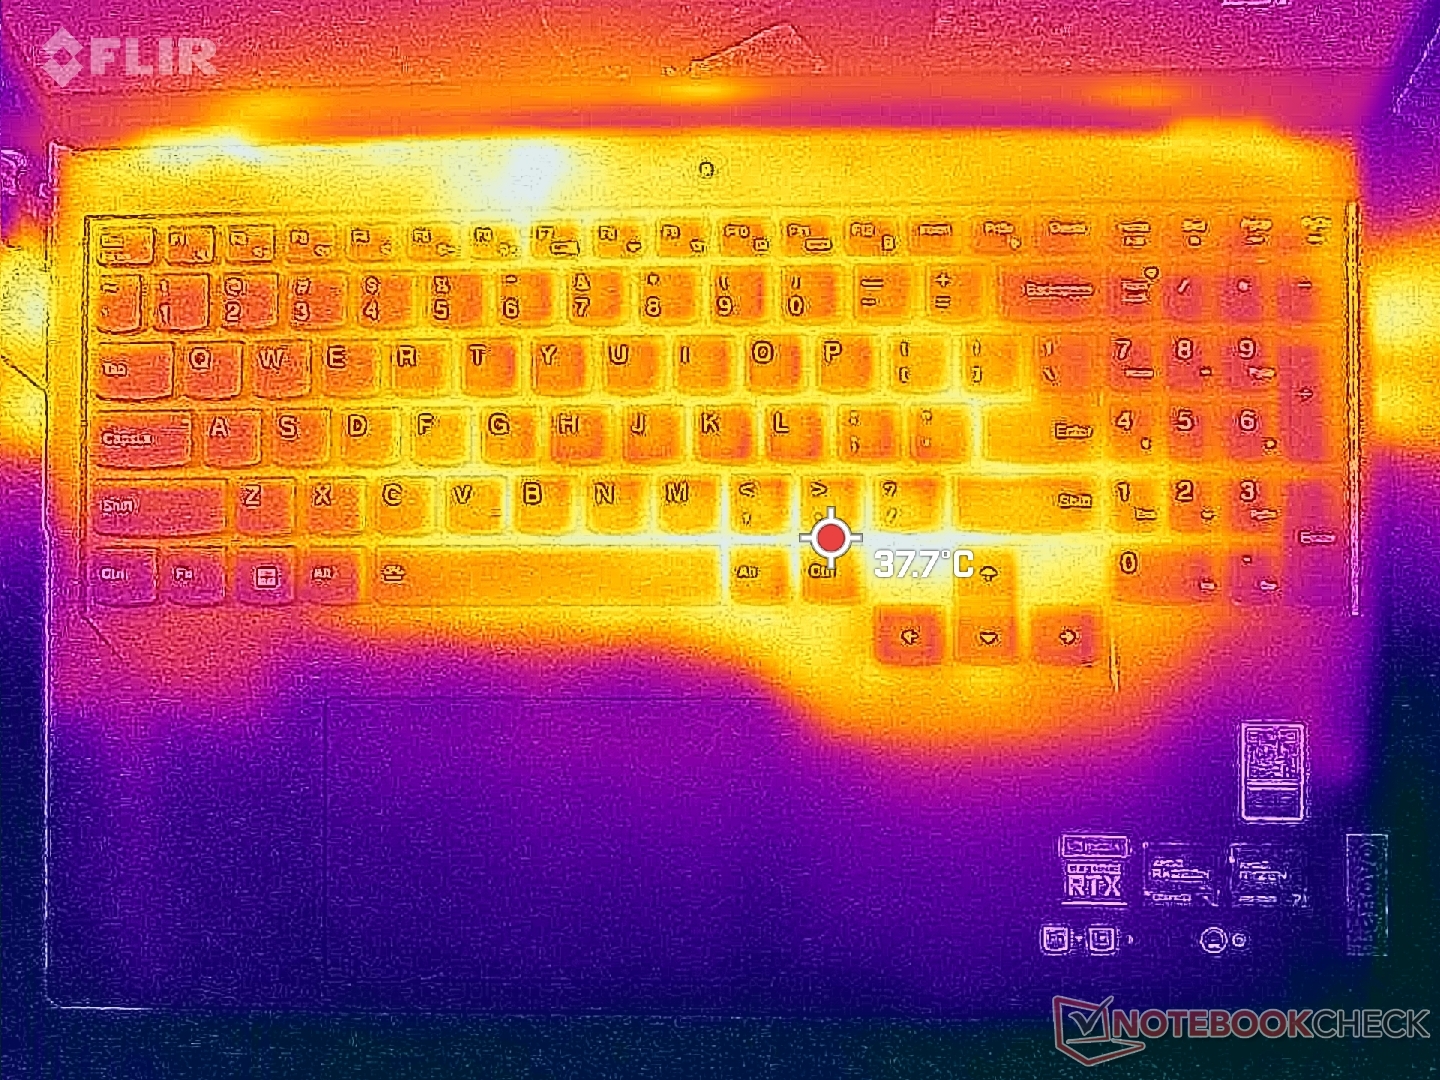
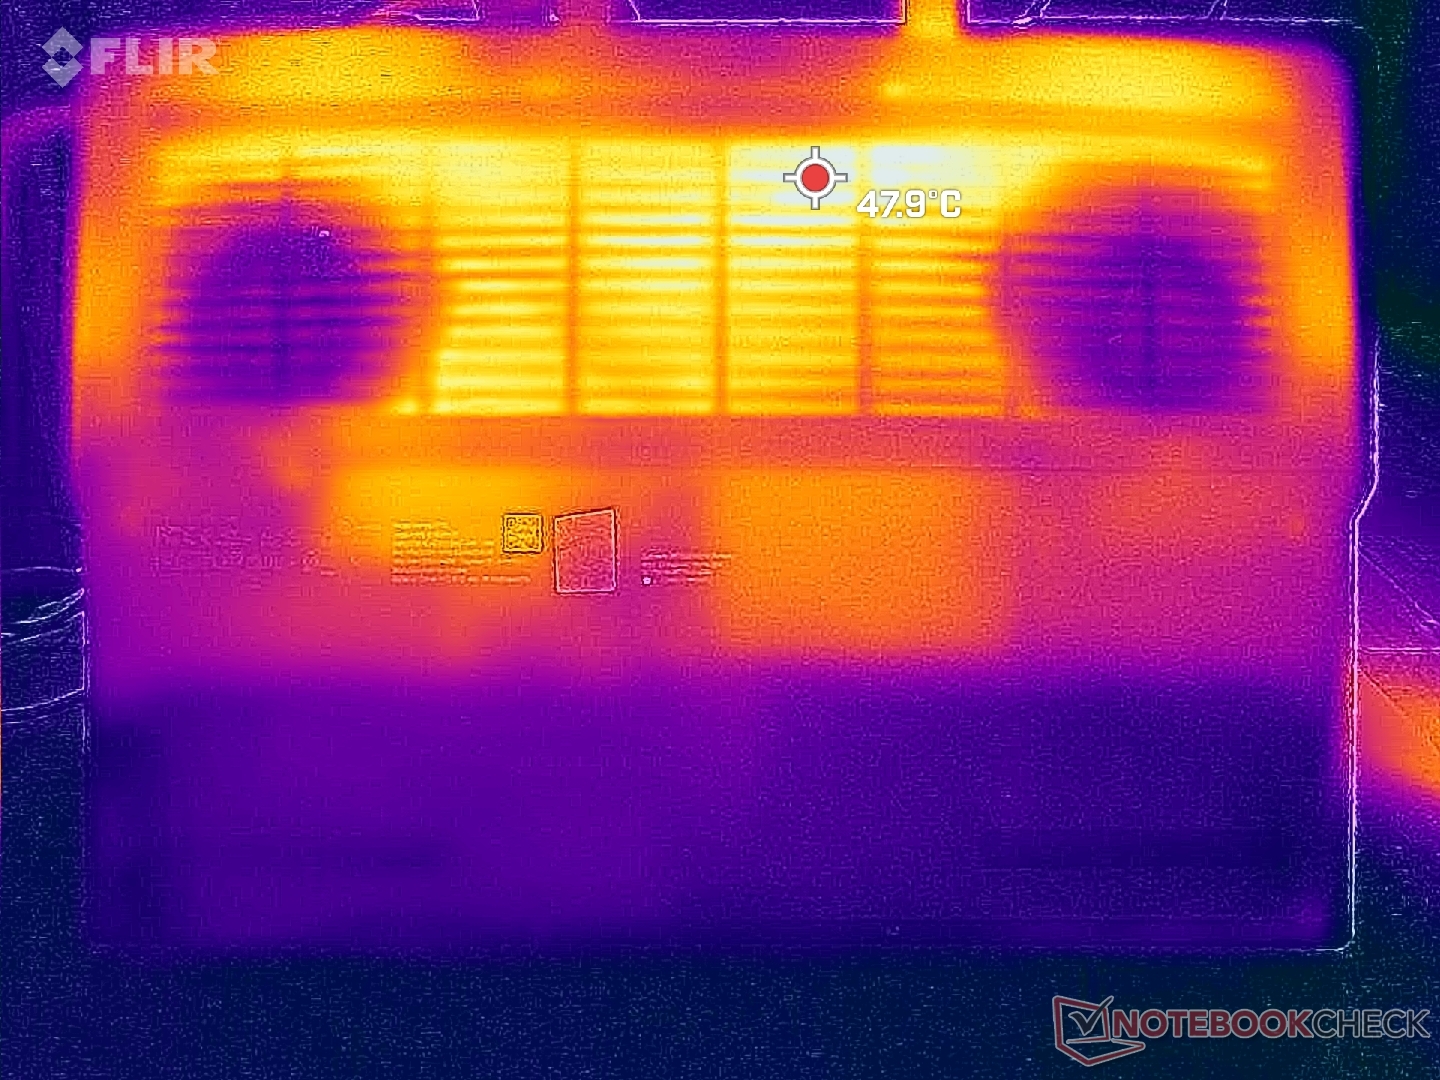
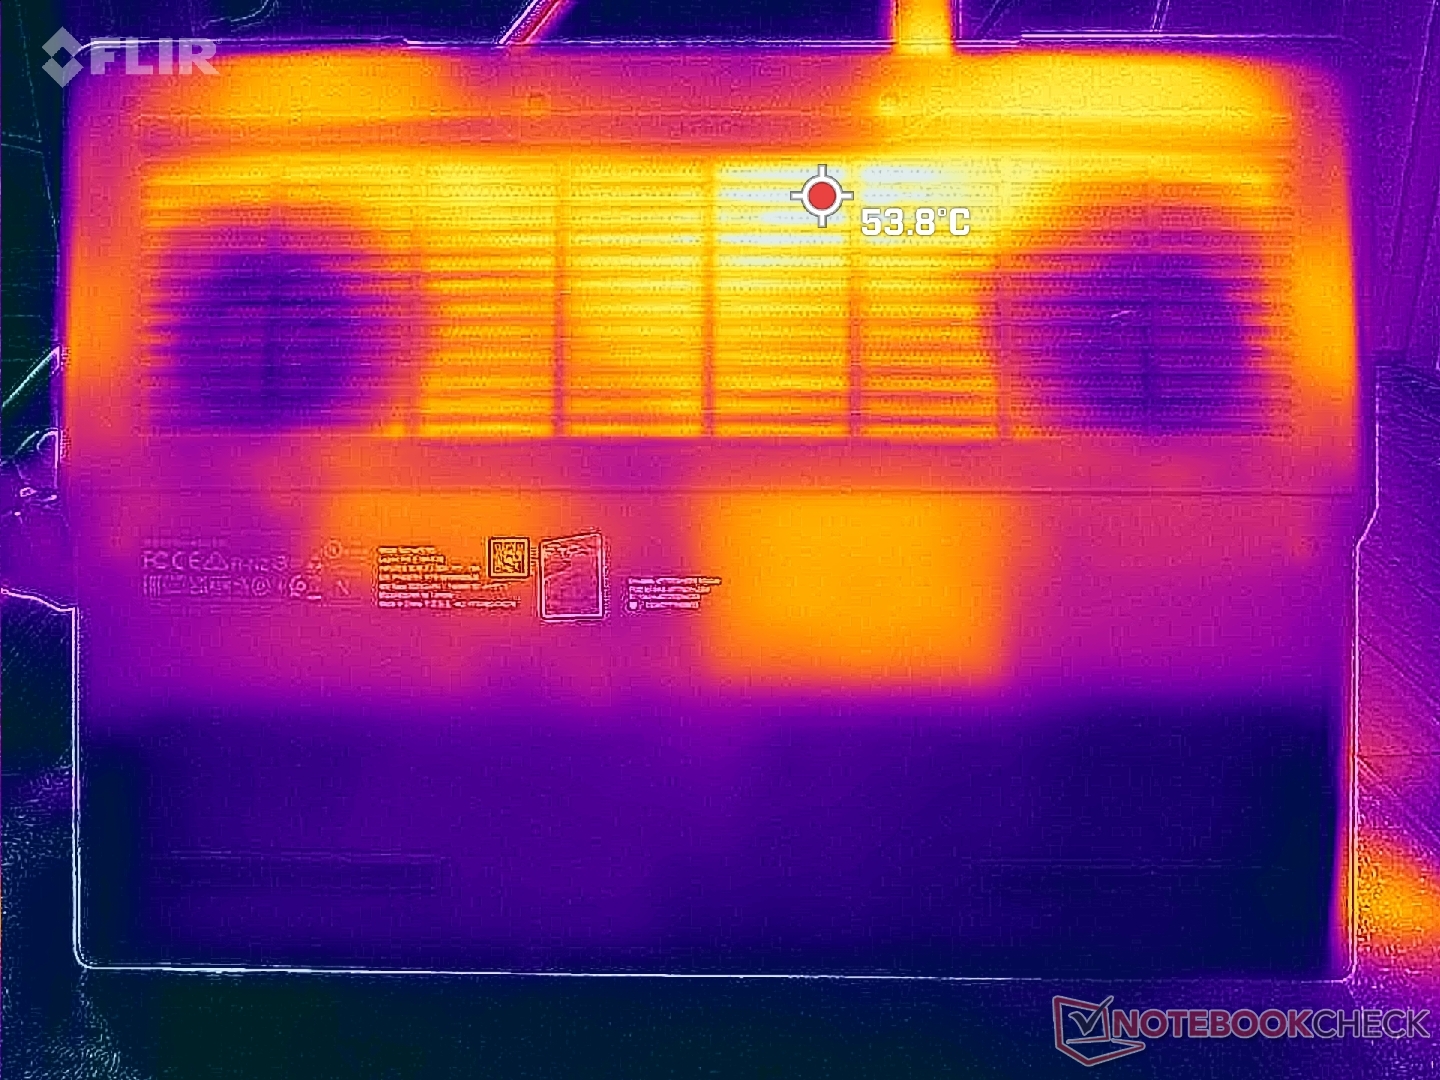
表面温度在靠近机箱中心和后部的地方最热,在游戏时,热点可以达到略高于40摄氏度。竞争机型如华硕ROG Zephyrus M16在类似的测试条件下,运行温度甚至超过50℃。毫无疑问,Legion 设计上相对较大的通风格栅是取得较好温度的部分原因。
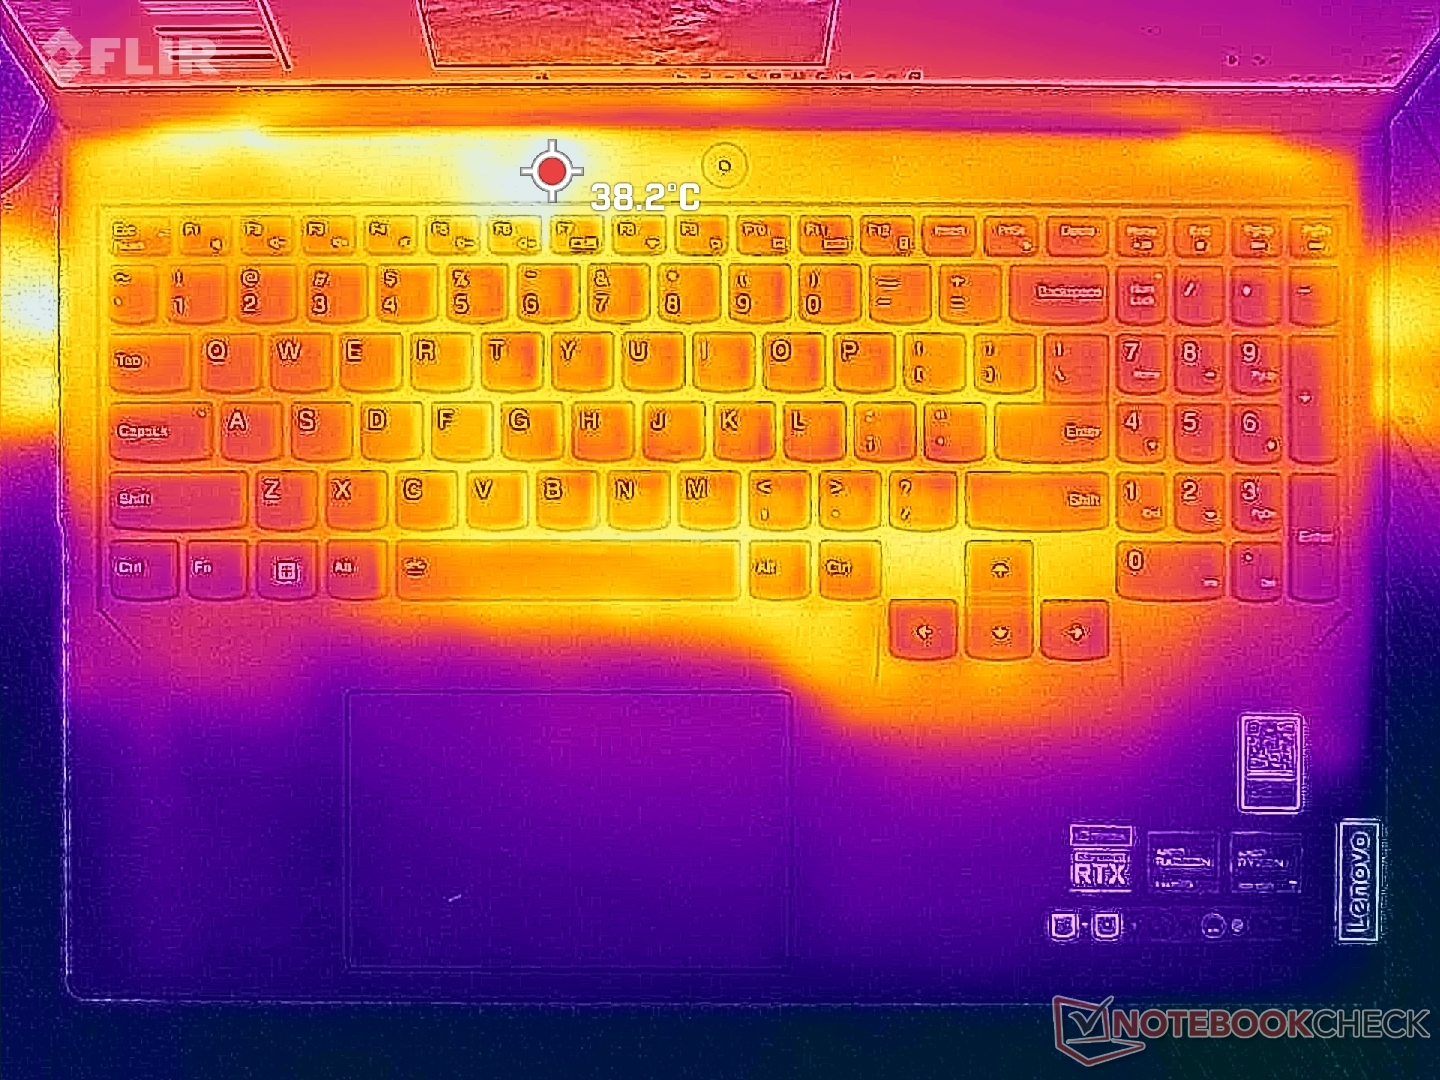
无论屏幕上的负载如何,掌托几乎不发热,以保持游戏时的双手舒适。
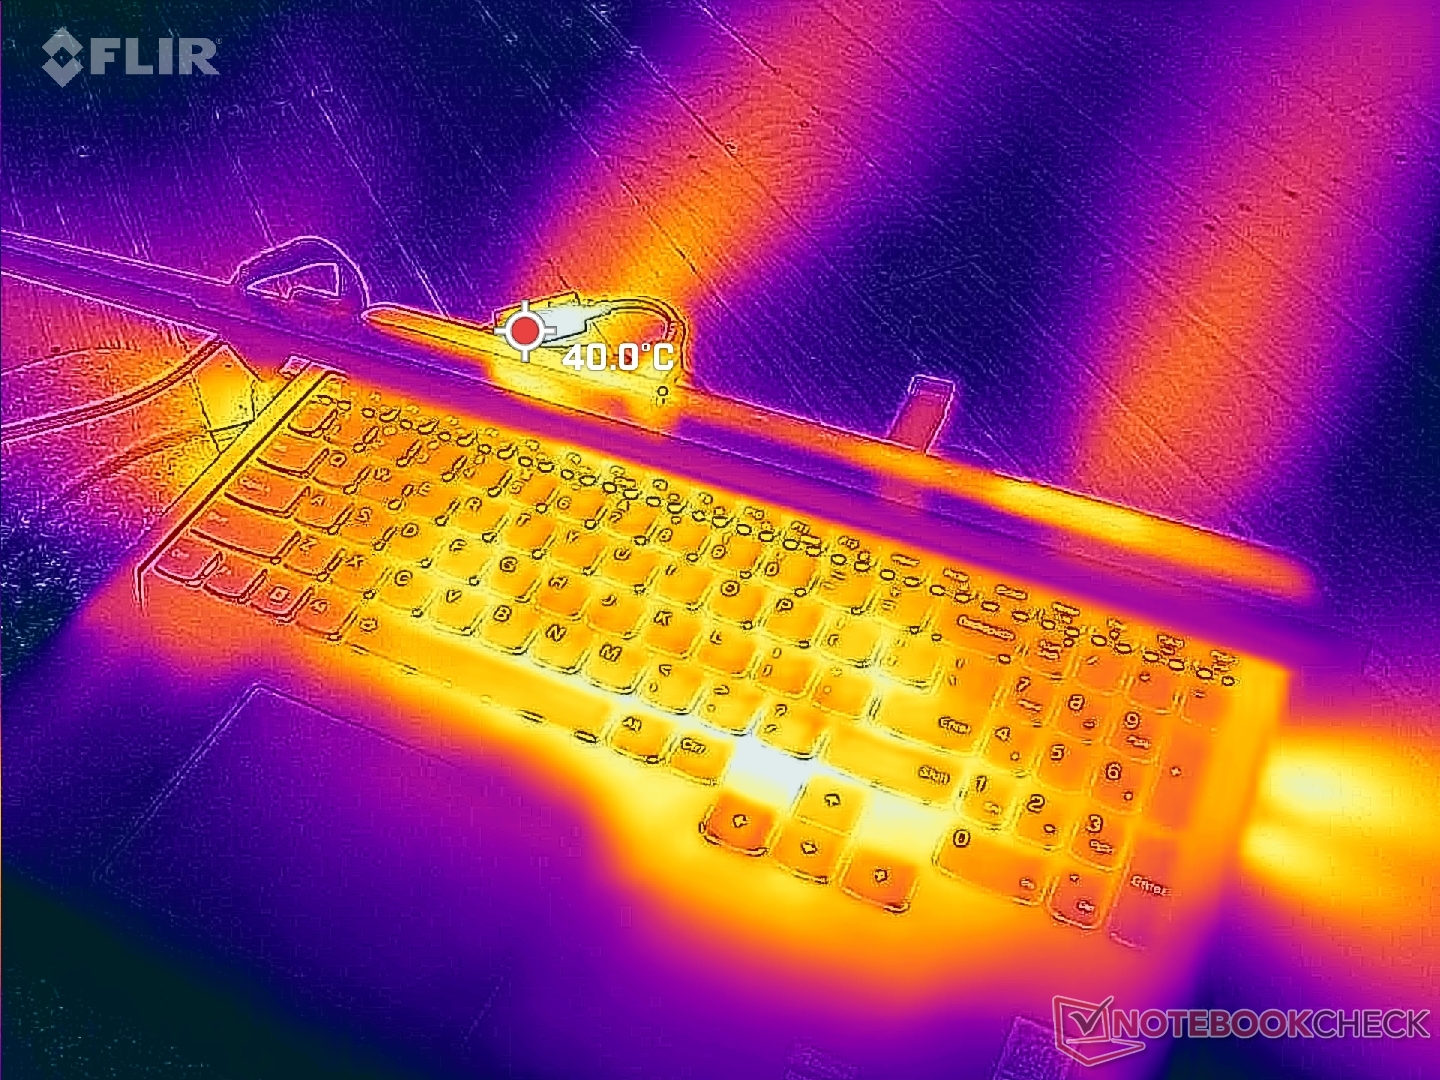
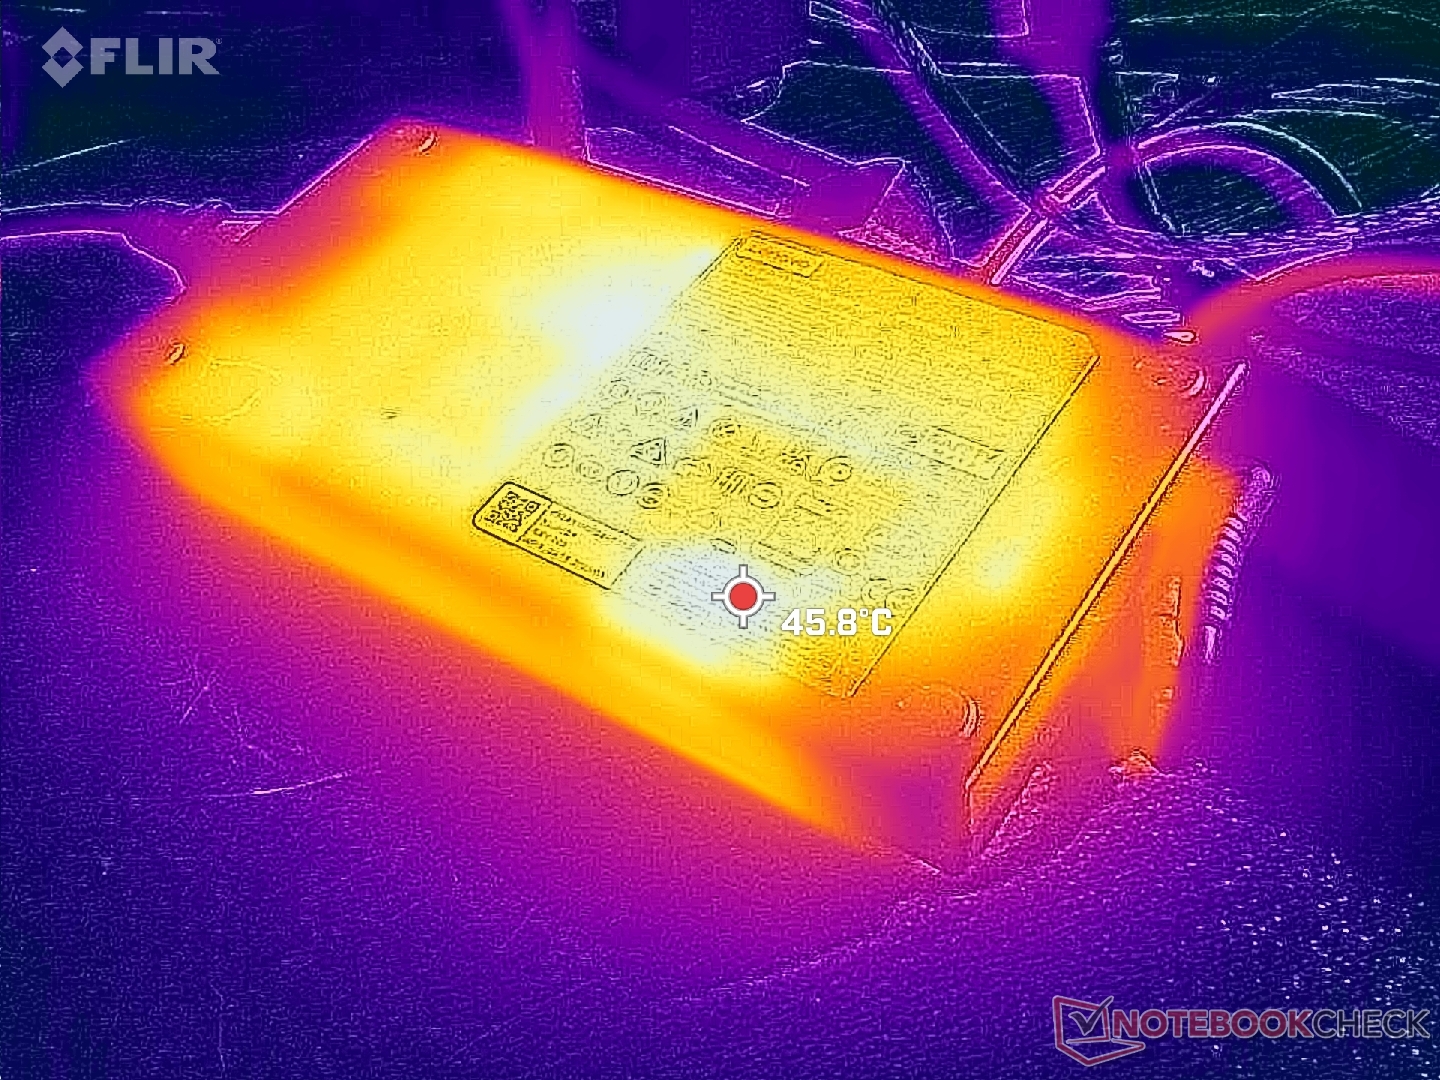
(±) The maximum temperature on the upper side is 41.8 °C / 107 F, compared to the average of 40.4 °C / 105 F, ranging from 21.2 to 68.8 °C for the class Gaming.
(±) The bottom heats up to a maximum of 41.4 °C / 107 F, compared to the average of 43.2 °C / 110 F
(+) In idle usage, the average temperature for the upper side is 26.2 °C / 79 F, compared to the device average of 33.9 °C / 93 F.
(±) Playing The Witcher 3, the average temperature for the upper side is 34.2 °C / 94 F, compared to the device average of 33.9 °C / 93 F.
(+) The palmrests and touchpad are cooler than skin temperature with a maximum of 30.4 °C / 86.7 F and are therefore cool to the touch.
(±) The average temperature of the palmrest area of similar devices was 28.8 °C / 83.8 F (-1.6 °C / -2.9 F).
| Lenovo Legion Pro 5 16ARX8 AMD Ryzen 7 7745HX, NVIDIA GeForce RTX 4070 Laptop GPU | Lenovo Legion Pro 5 16IRX8 Intel Core i7-13700HX, NVIDIA GeForce RTX 4060 Laptop GPU | Uniwill GM6PX7X RTX 4070 Intel Core i7-13700HX, NVIDIA GeForce RTX 4070 Laptop GPU | Schenker XMG Neo 16 E23 Intel Core i9-13900HX, NVIDIA GeForce RTX 4090 Laptop GPU | Asus ROG Strix G16 G614JZ Intel Core i9-13980HX, NVIDIA GeForce RTX 4080 Laptop GPU | Asus Zephyrus Duo 16 GX650PY-NM006W AMD Ryzen 9 7945HX, NVIDIA GeForce RTX 4090 Laptop GPU | |
|---|---|---|---|---|---|---|
| Heat | -9% | -12% | -7% | -18% | -5% | |
| Maximum Upper Side * (°C) | 41.8 | 42.8 -2% | 38.2 9% | 50 -20% | 54 -29% | 44.2 -6% |
| Maximum Bottom * (°C) | 41.4 | 50 -21% | 45 -9% | 51 -23% | 55 -33% | 46.8 -13% |
| Idle Upper Side * (°C) | 29 | 29.6 -2% | 33.6 -16% | 28 3% | 29 -0% | 29.2 -1% |
| Idle Bottom * (°C) | 30.4 | 34 -12% | 39.6 -30% | 26 14% | 33 -9% | 30.2 1% |
* ... smaller is better
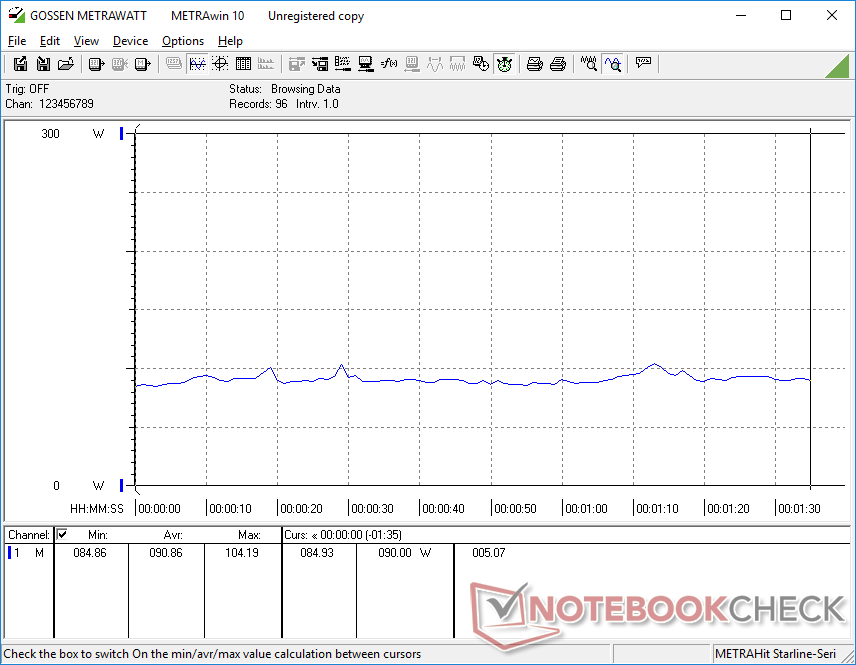
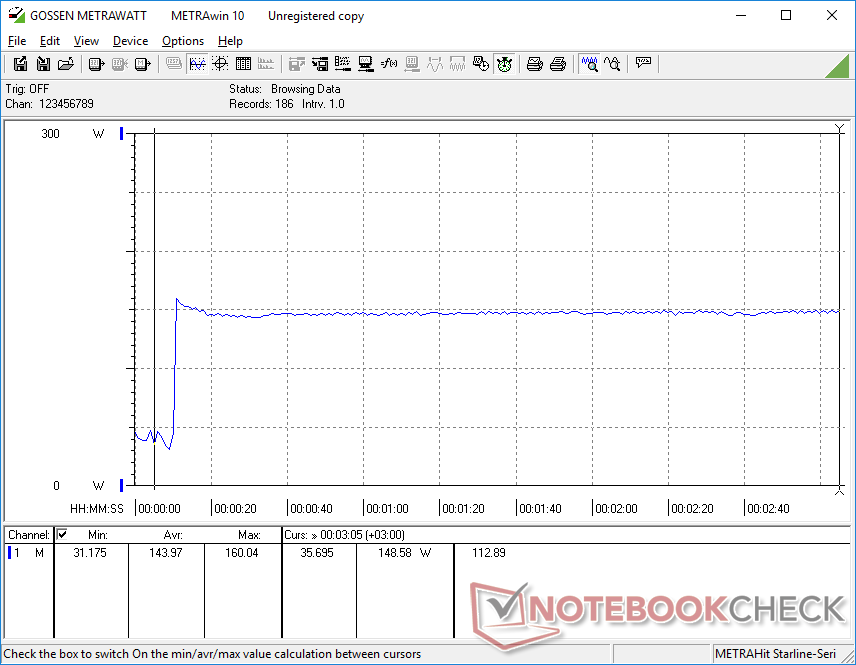
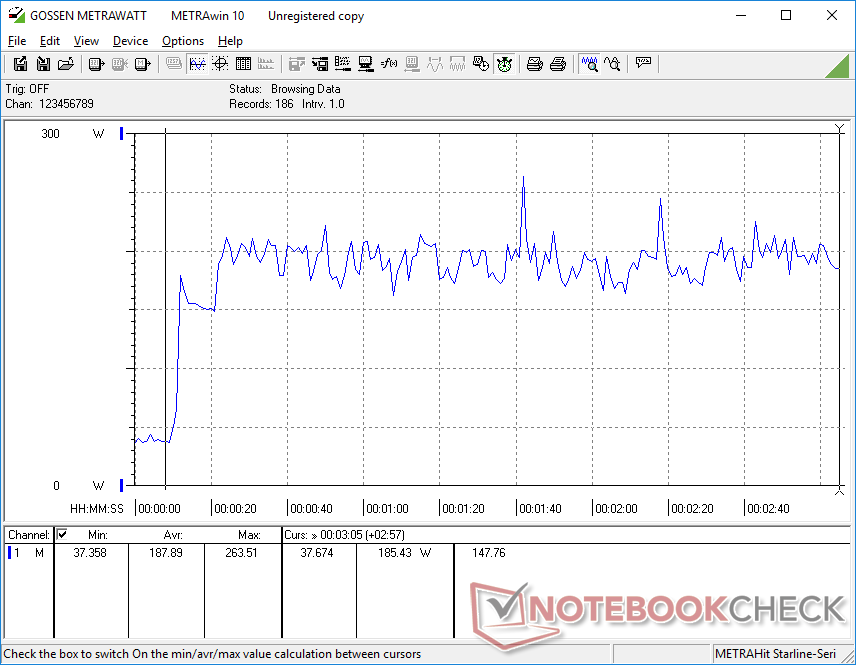
压力测试--一个温暖的CPU
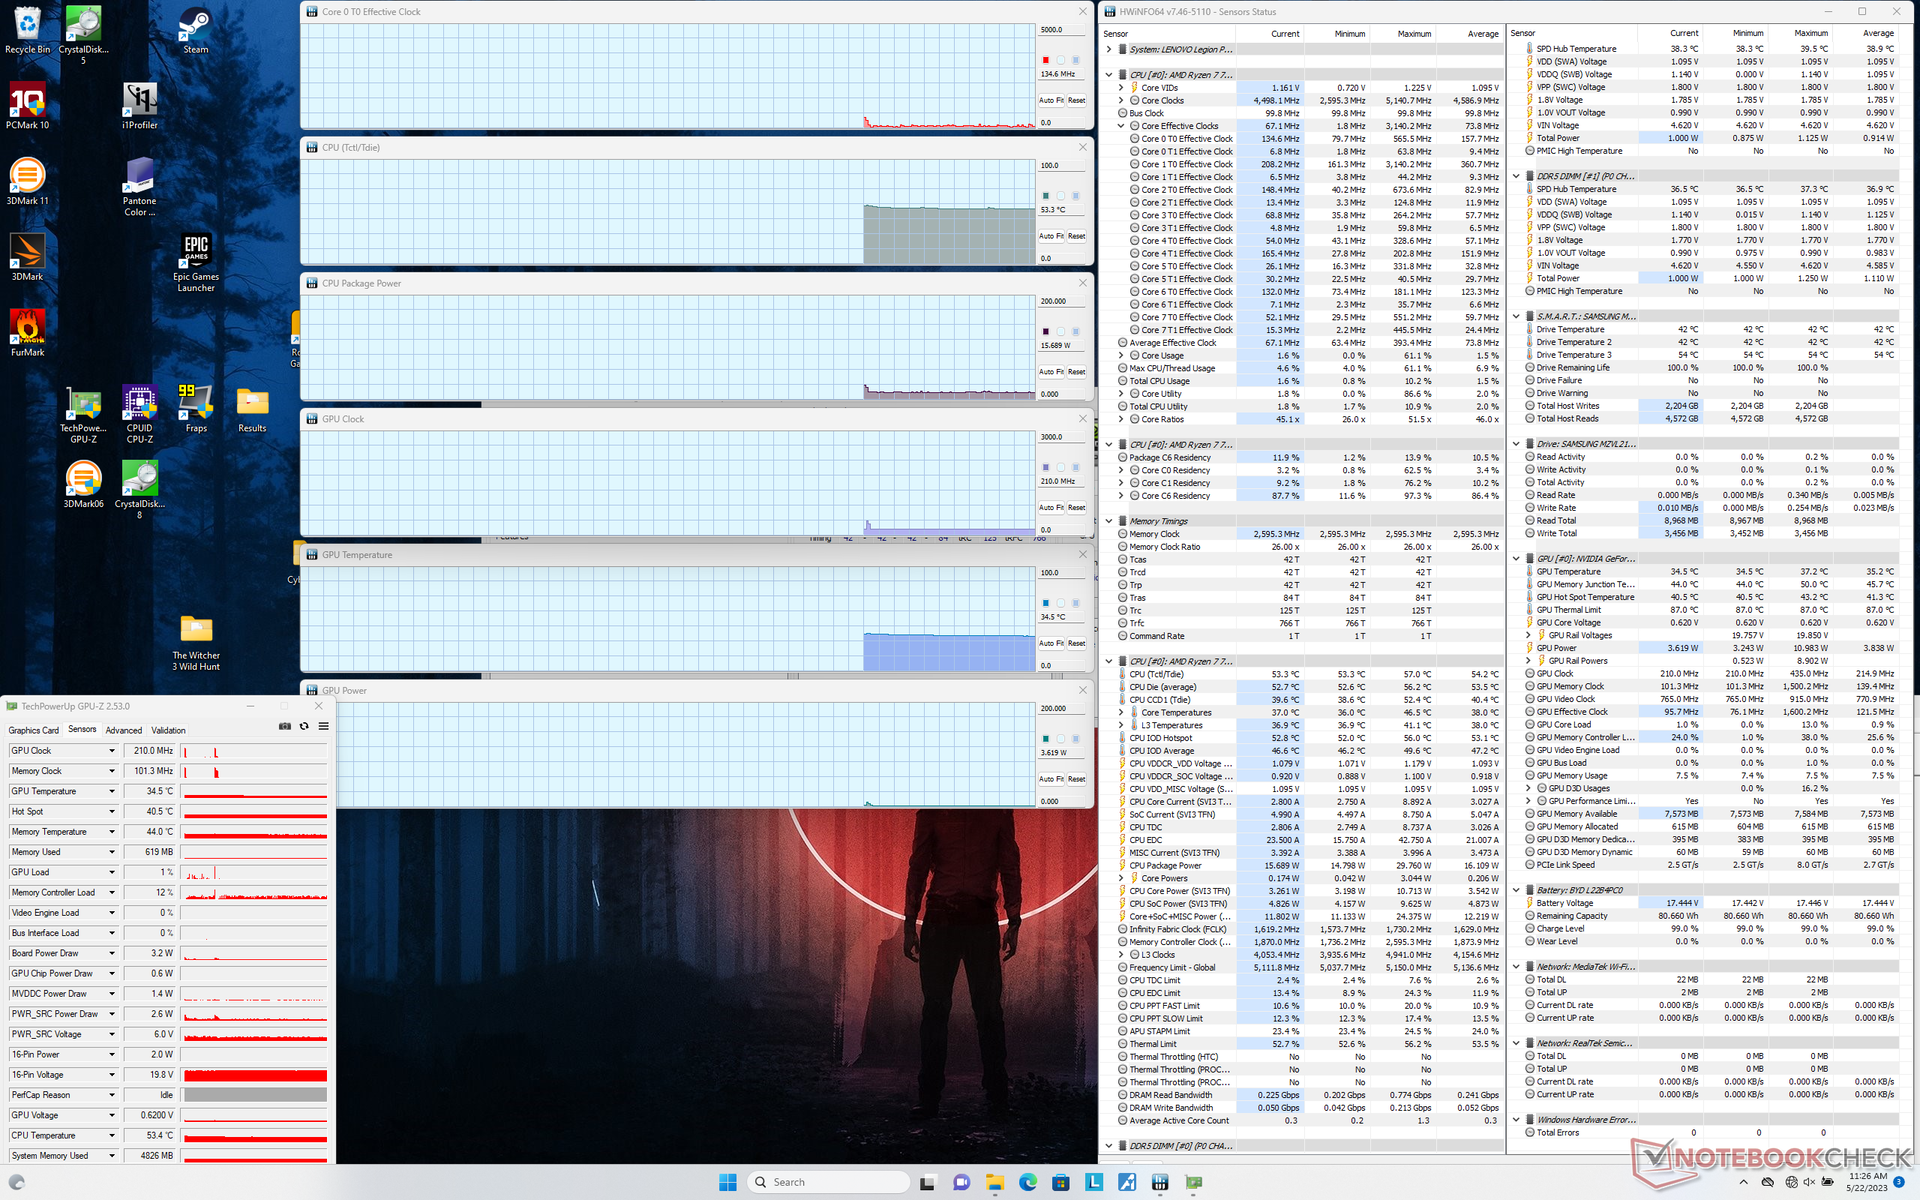
当运行Prime95对CPU施加压力时,时钟频率和主板功耗将分别飙升至4.9 GHz和110 W,然后在几秒钟后迅速降至4.6 GHz和90 W范围。核心温度将稳定在非常高的90摄氏度至100摄氏度的范围内,这甚至比已经很热的Core i7-13700HX的温度还要高几度。 另一个英特尔Legion 型号.很明显,Ryzen 7 CPU正在挑战机箱冷却解决方案的极限,如果采用更快的Ryzen 9解决方案,就必须做出妥协。
在性能模式下,dGPU将稳定在2430 MHz核心、2050 MHz内存、67 C和105 W,而目标TGP为140 W。 Witcher 3在性能模式下。英特尔Legion 模式中的RTX 4060也将稳定在105 W和110 W之间,因为尽管这两个GPU的性能不同,但都处于类似的功率包络之下。在禁用GPU超频功能的平衡模式下进行游戏,将导致GPU时钟降低到1965 MHz,并且主板功耗大大降低,只有80 W。如上所述,平衡模式和性能模式之间的性能差距约为10%至15%。
用电池供电运行会降低性能。在电池上进行的Fire Strike 测试,物理和图形分数分别为10865和9334分,而在主电源上则为11477和12617分。
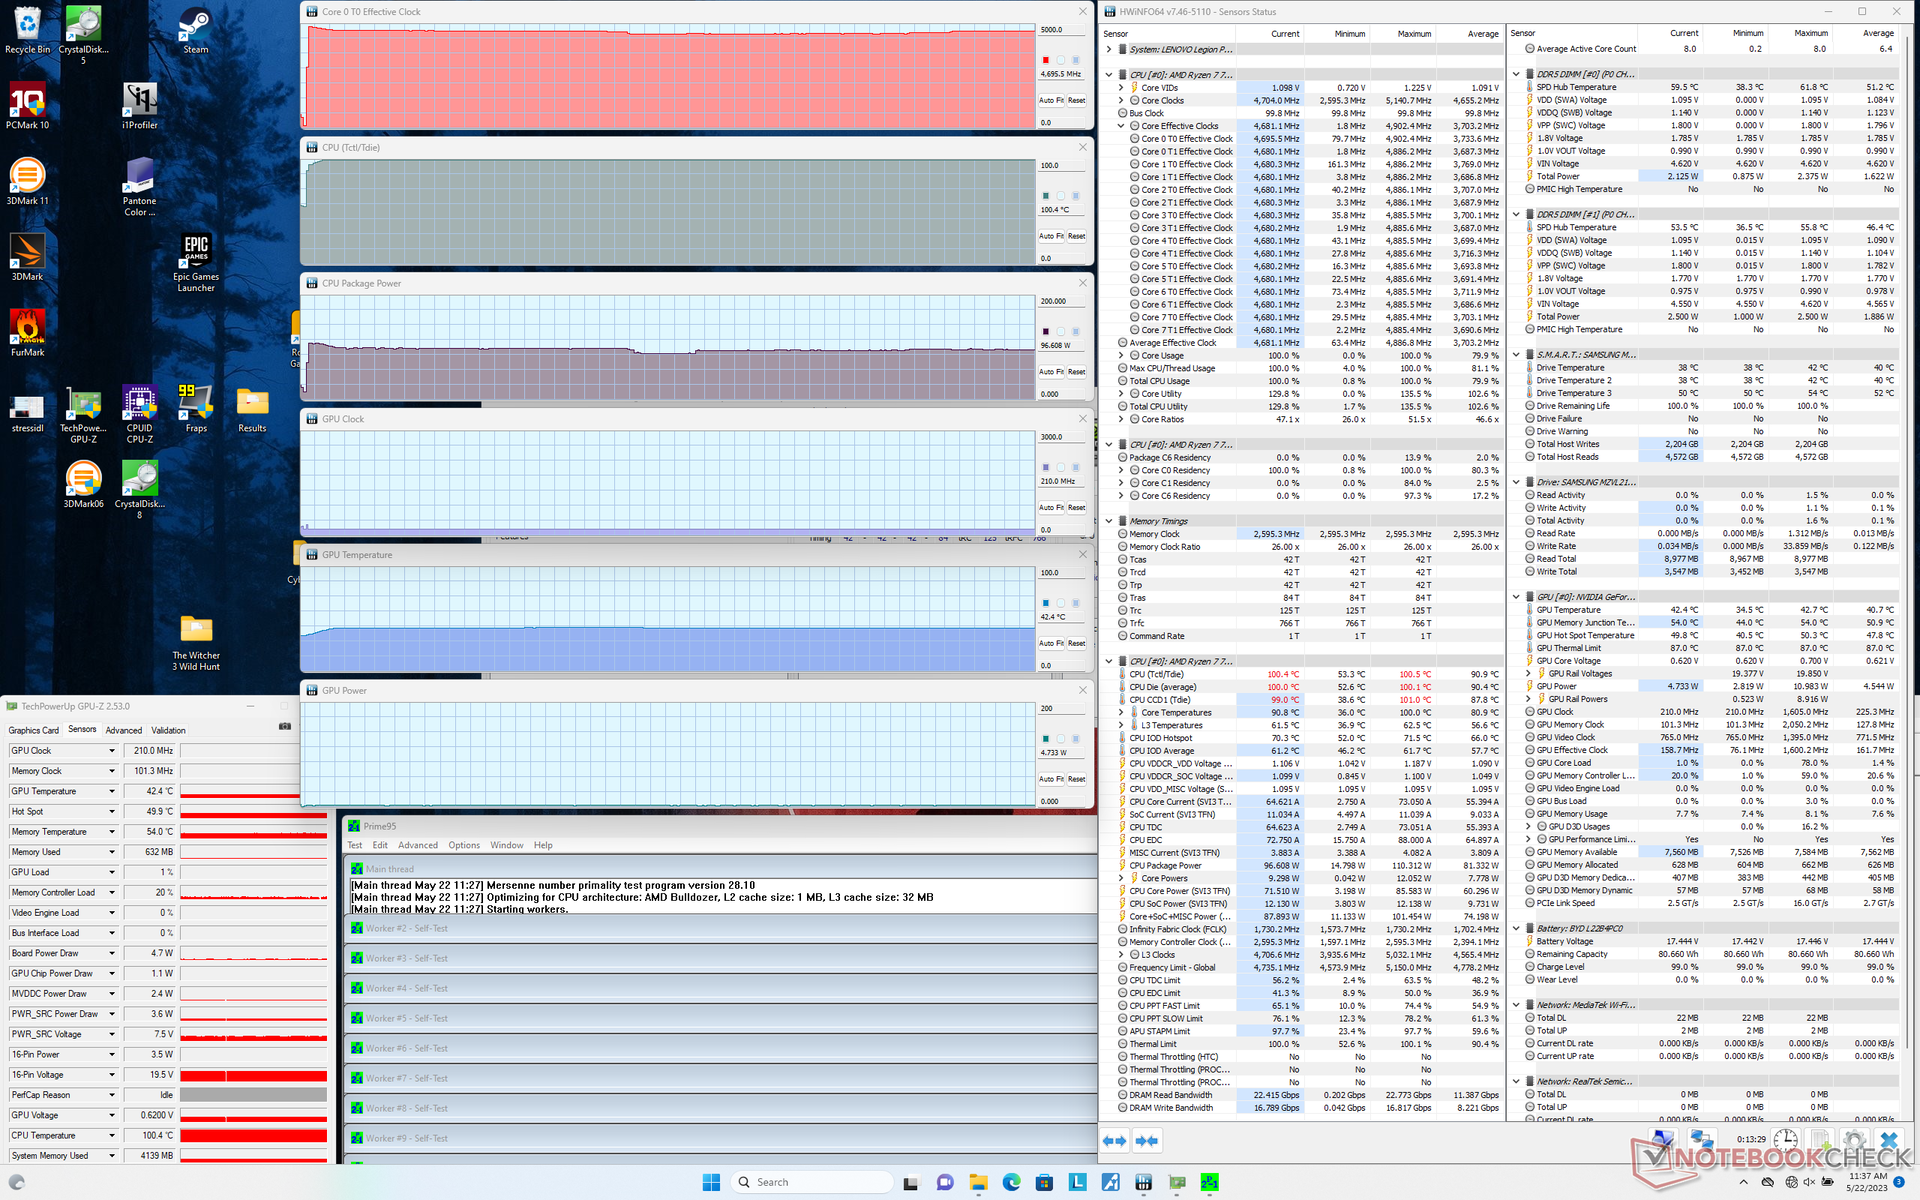
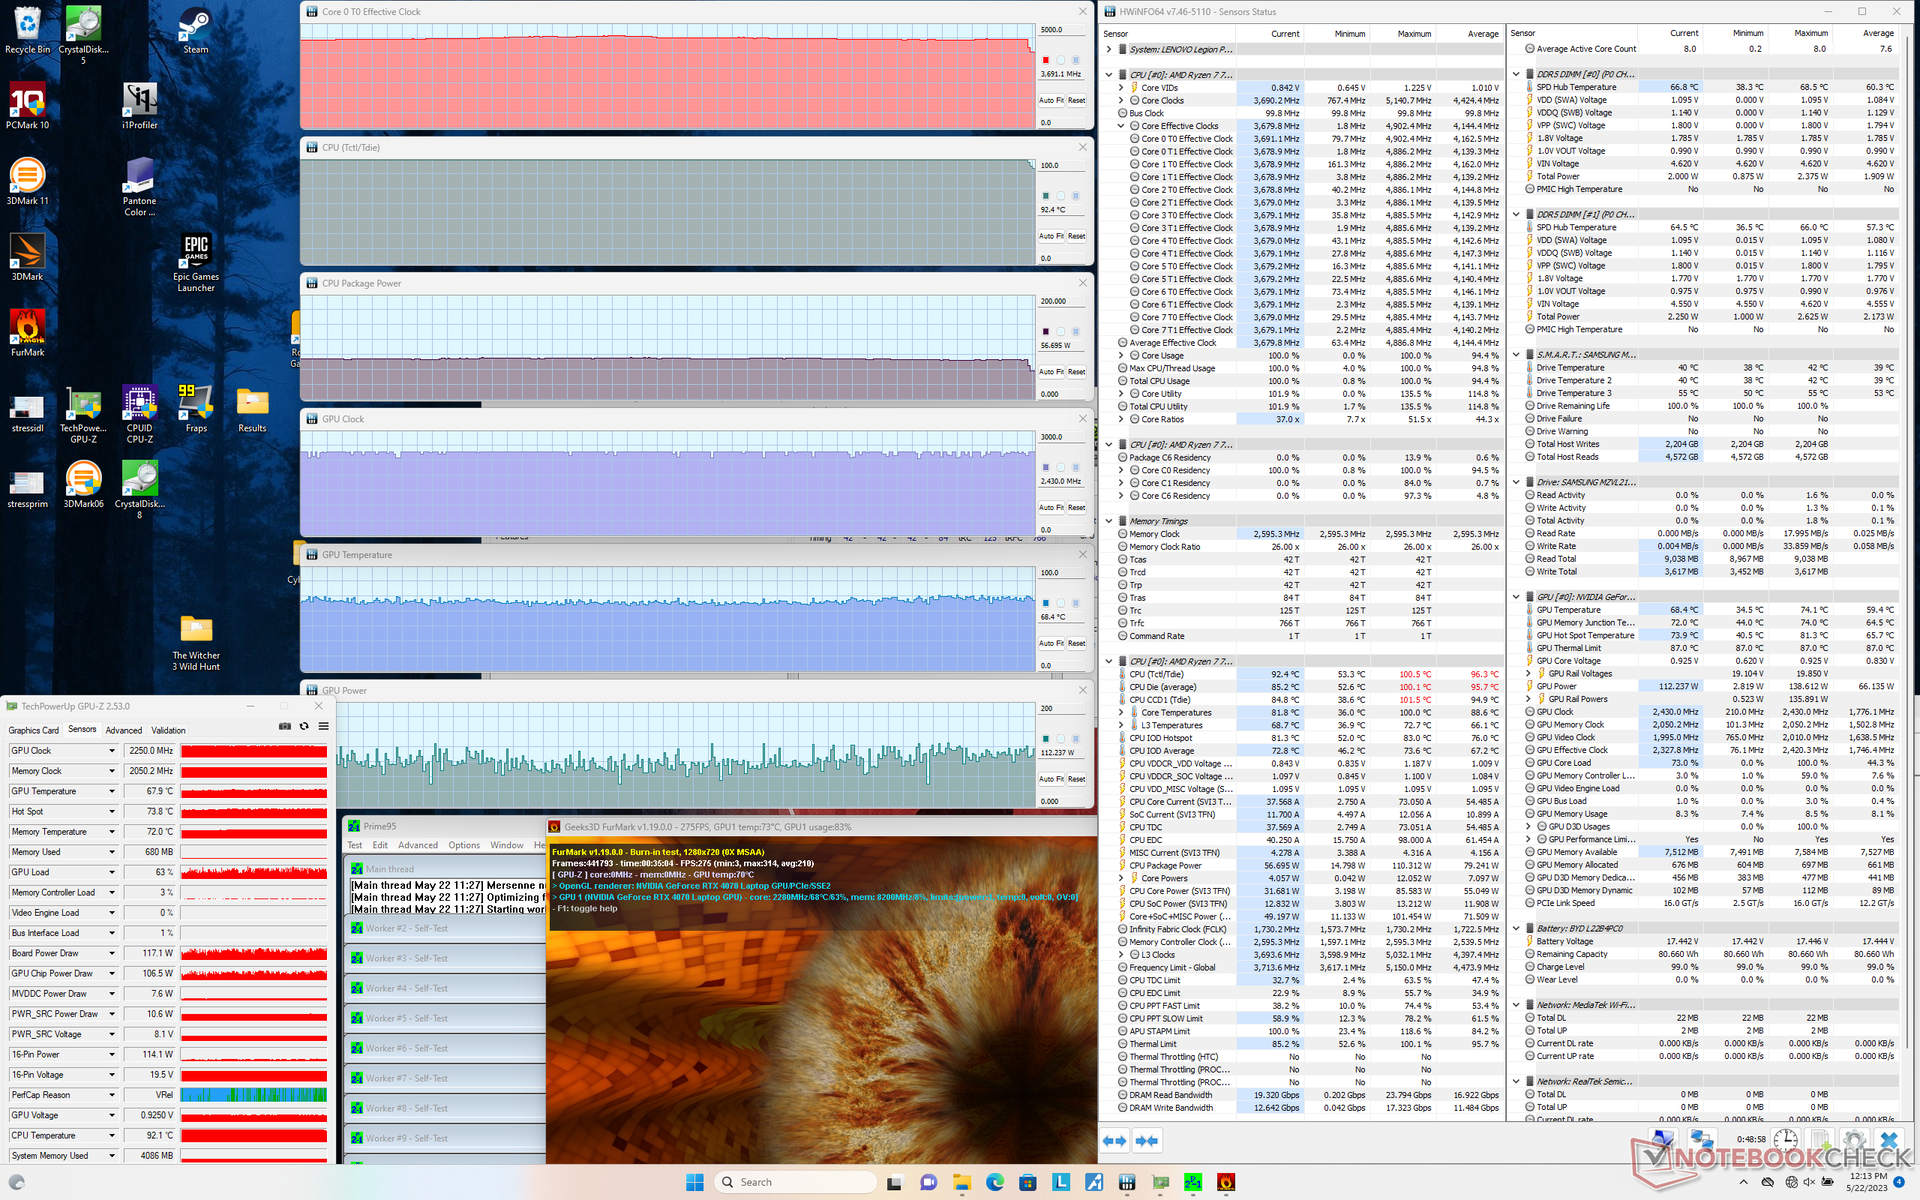
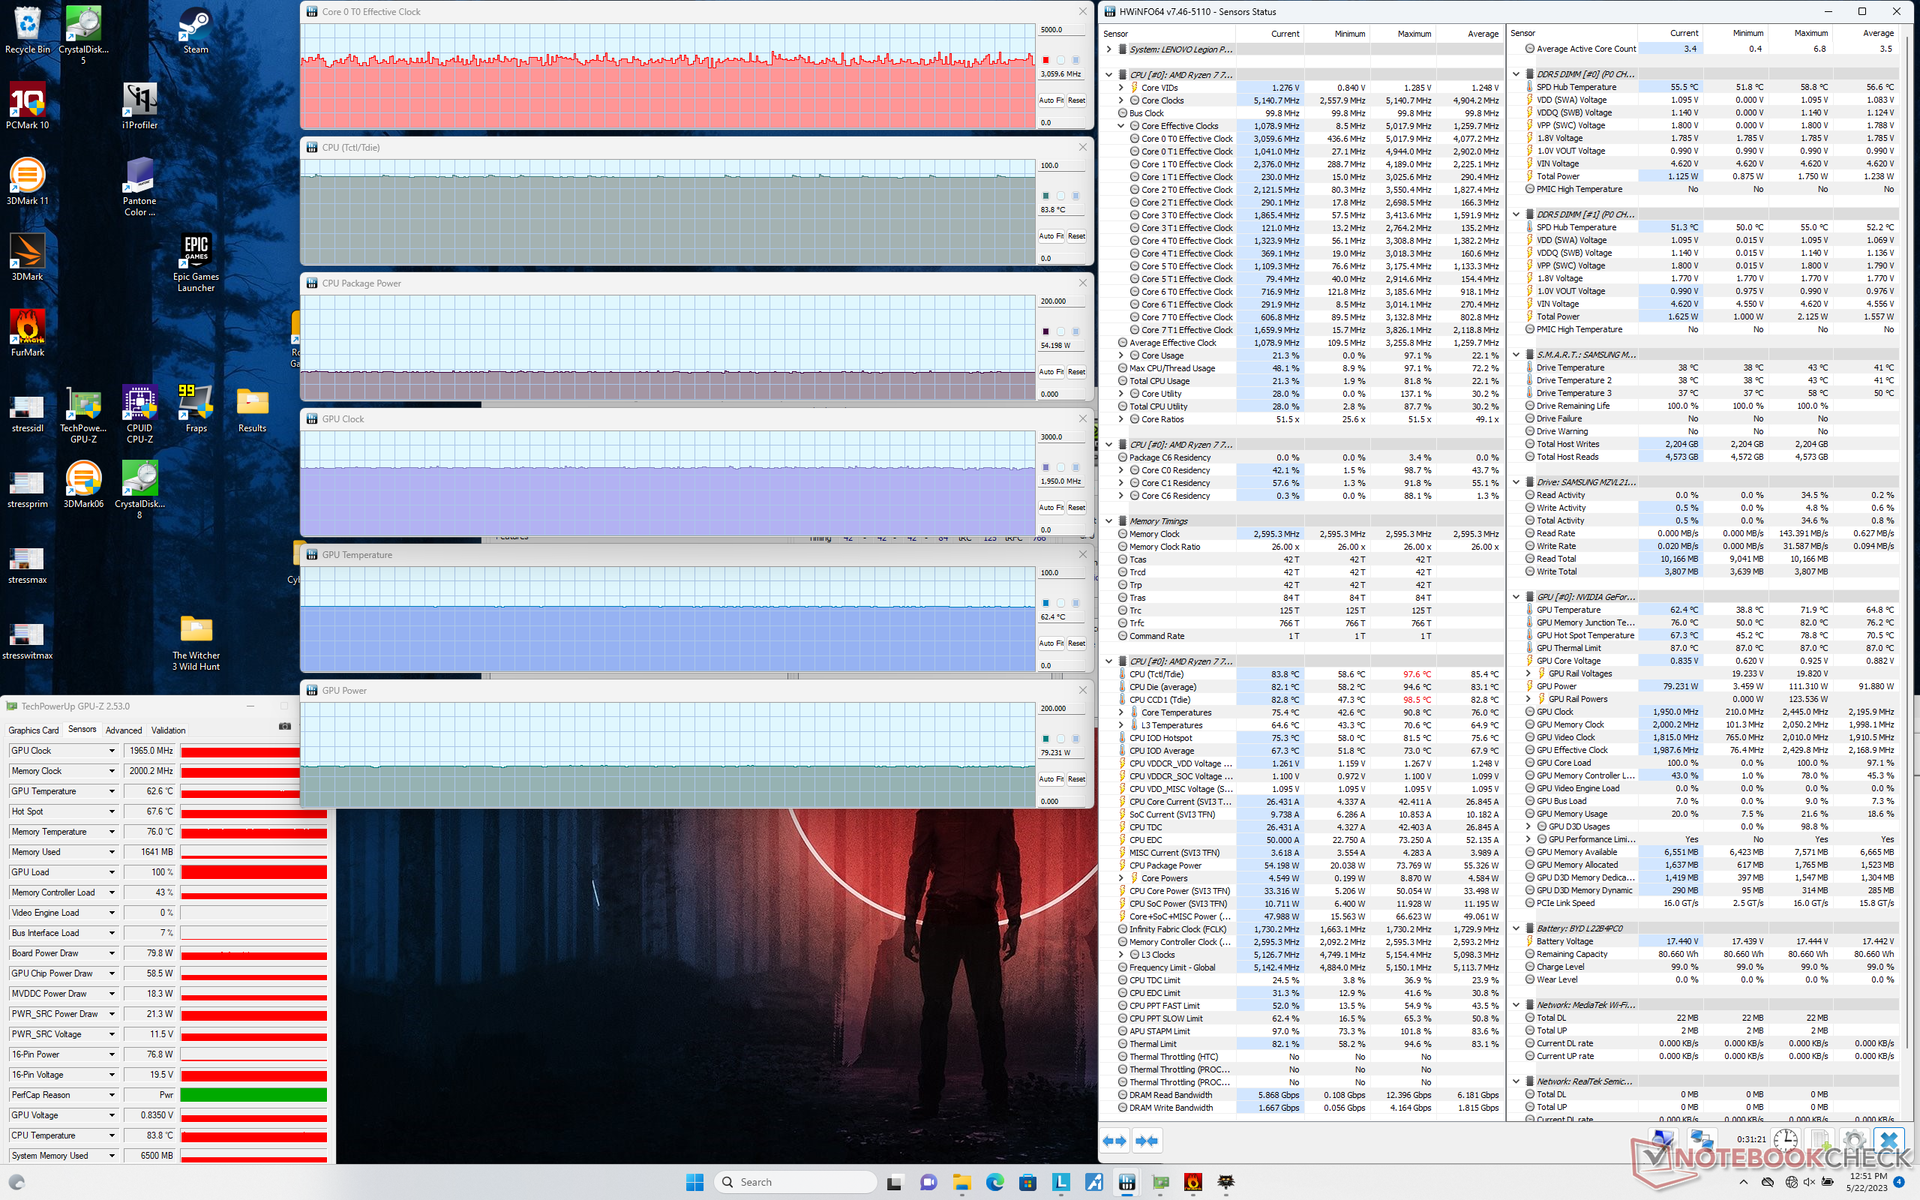
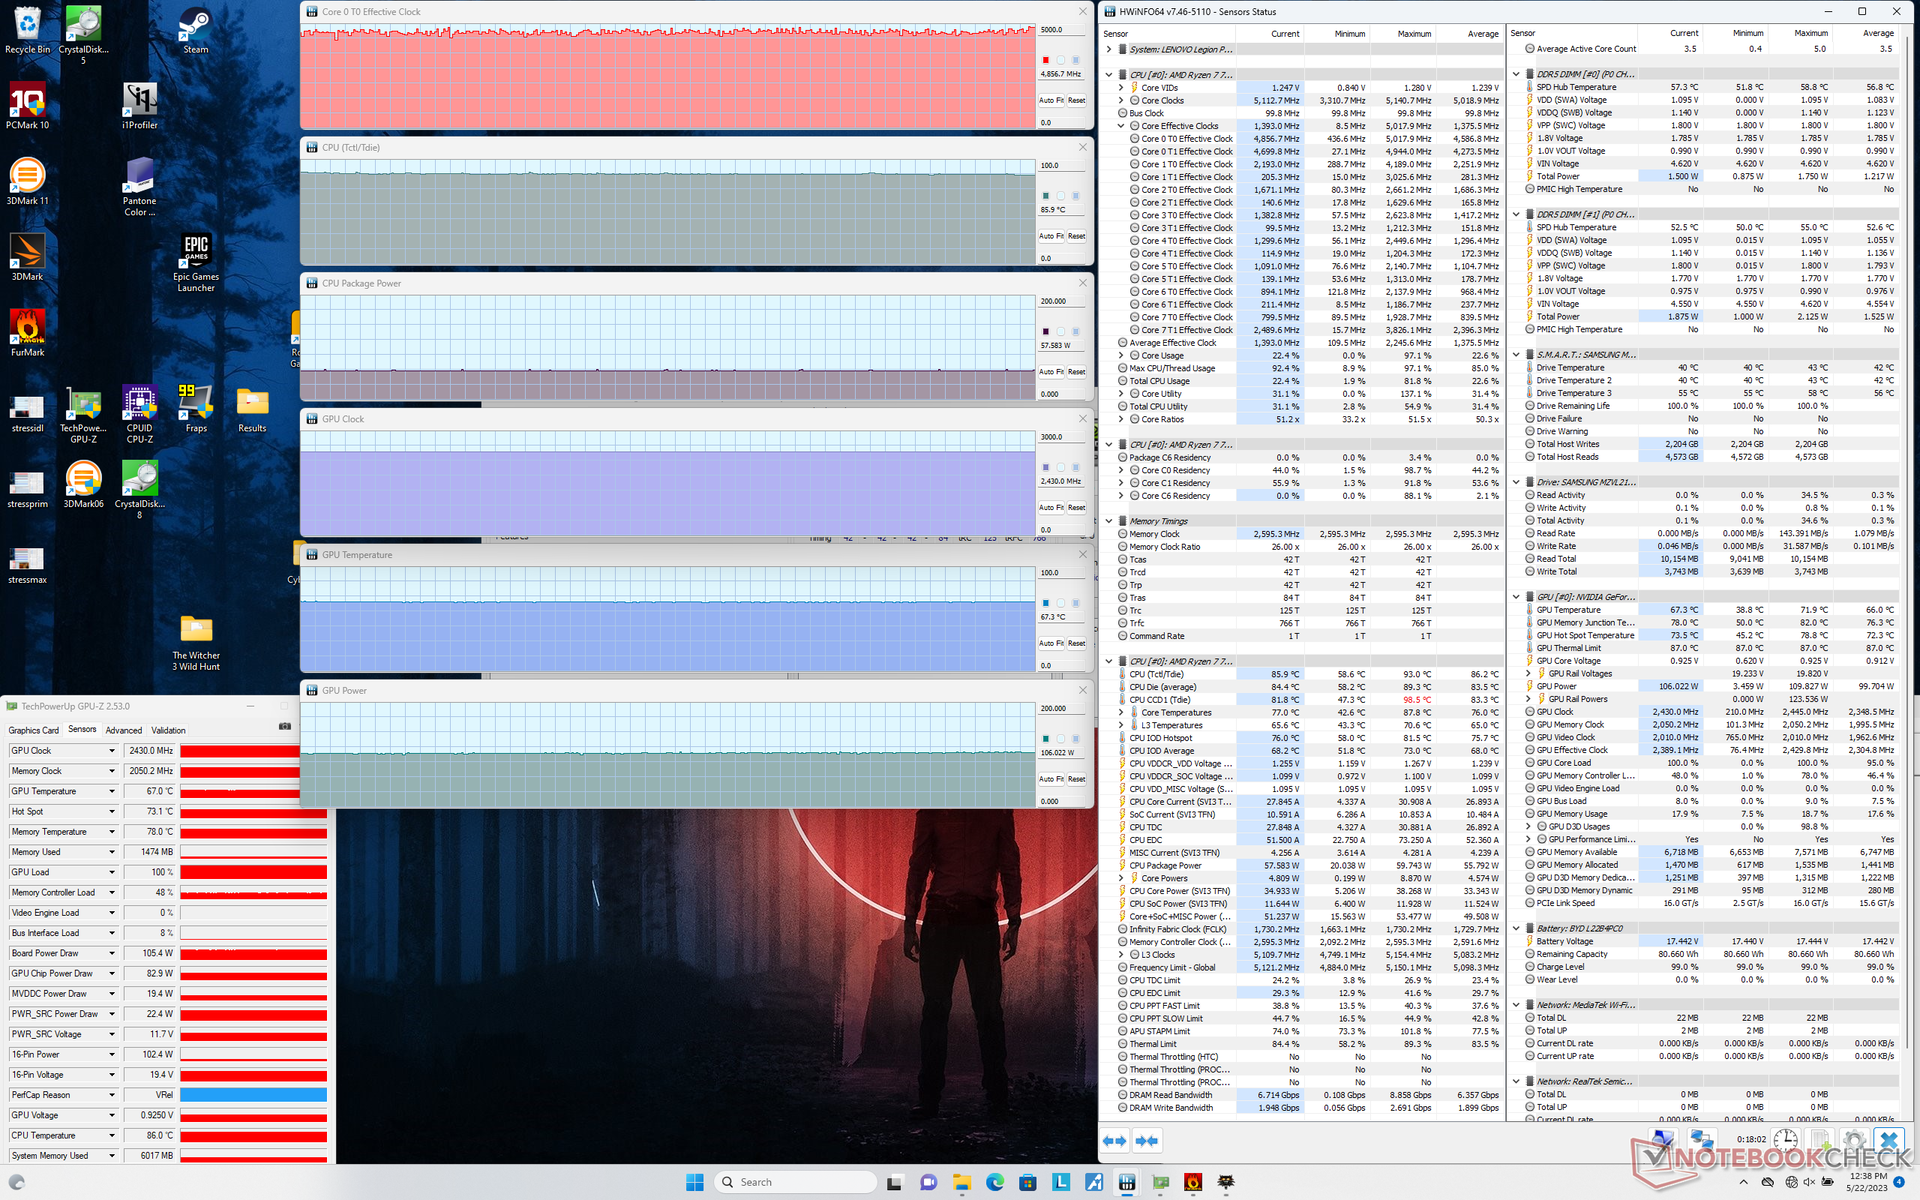
| CPU时钟(GHz) | GPU时钟(MHz) | CPU平均温度(°C) | GPU平均温度(°C) | |
| 系统空闲 | -- | -- | 53 | 35 |
| Prime95压力 | 4.6 - 4.7 | -- | 100 | 42 |
| Prime95 + FurMark压力 | 3.7 - 4.3 | 2250 | 92 - 100 | 69 |
| Witcher 3 压力(性能模式) | 4.9 | 2430 | 86 | 67 |
| Witcher 3 压力(平衡模式) | 3.1 | 1965 | 84 | 62 |
发言人
Lenovo Legion Pro 5 16ARX8 audio analysis
(±) | speaker loudness is average but good (80.9 dB)
Bass 100 - 315 Hz
(-) | nearly no bass - on average 24% lower than median
(±) | linearity of bass is average (13.4% delta to prev. frequency)
Mids 400 - 2000 Hz
(+) | balanced mids - only 4.7% away from median
(+) | mids are linear (6.2% delta to prev. frequency)
Highs 2 - 16 kHz
(+) | balanced highs - only 2.5% away from median
(+) | highs are linear (6.2% delta to prev. frequency)
Overall 100 - 16.000 Hz
(±) | linearity of overall sound is average (21.9% difference to median)
Compared to same class
» 79% of all tested devices in this class were better, 6% similar, 16% worse
» The best had a delta of 6%, average was 18%, worst was 132%
Compared to all devices tested
» 63% of all tested devices were better, 7% similar, 31% worse
» The best had a delta of 4%, average was 24%, worst was 134%
Apple MacBook Pro 16 2021 M1 Pro audio analysis
(+) | speakers can play relatively loud (84.7 dB)
Bass 100 - 315 Hz
(+) | good bass - only 3.8% away from median
(+) | bass is linear (5.2% delta to prev. frequency)
Mids 400 - 2000 Hz
(+) | balanced mids - only 1.3% away from median
(+) | mids are linear (2.1% delta to prev. frequency)
Highs 2 - 16 kHz
(+) | balanced highs - only 1.9% away from median
(+) | highs are linear (2.7% delta to prev. frequency)
Overall 100 - 16.000 Hz
(+) | overall sound is linear (4.6% difference to median)
Compared to same class
» 0% of all tested devices in this class were better, 0% similar, 100% worse
» The best had a delta of 5%, average was 17%, worst was 45%
Compared to all devices tested
» 0% of all tested devices were better, 0% similar, 100% worse
» The best had a delta of 4%, average was 24%, worst was 134%
能源管理
功耗 - 比酷睿i7-13700HX的CPU提升更低
在桌面上闲置时,AMD机型比Intel机型更省电。否则,在运行更高的负载(如游戏)时,两款机型需要的功率差不多。两种型号还配备了相同的300W交流适配器,为140W的GPU和100W的CPU提供了足够的空间。
值得注意的是,英特尔模型中的酷睿i7-13700HX可以提升到159W的主板功耗,而我们的Ryzen 7 7745HX只有110W,这将部分解释它比AMD CPU的性能优势。然而,当Turbo Boost时钟速率在几分钟的压力后稳定下来时,两种型号的功耗将变得更加接近,正如下面的对比图所示。例如,英特尔和AMD型号在运行Prime95几分钟后将分别稳定在158瓦和149瓦,尽管英特尔型号在测试开始时可以提升到220瓦。
| Off / Standby | |
| Idle | |
| Load |
|
Key:
min: | |
| Lenovo Legion Pro 5 16ARX8 R7 7745HX, GeForce RTX 4070 Laptop GPU, Samsung PM9A1 MZVL21T0HCLR, IPS, 2560x1600, 16" | Lenovo Legion Pro 5 16IRX8 i7-13700HX, GeForce RTX 4060 Laptop GPU, SK hynix PC801 HFS512GEJ9X115N, IPS, 2560x1600, 16" | Uniwill GM6PX7X RTX 4070 i7-13700HX, GeForce RTX 4070 Laptop GPU, Samsung PM9A1 MZVL2512HCJQ, IPS, 2560x1600, 16" | Schenker XMG Neo 16 E23 i9-13900HX, GeForce RTX 4090 Laptop GPU, Crucial P5 Plus 1TB CT1000P5PSSD8, IPS, 2560x1600, 16" | Asus ROG Strix G16 G614JZ i9-13980HX, GeForce RTX 4080 Laptop GPU, WD PC SN560 SDDPNQE-1T00, IPS, 2560x1600, 16" | Asus Zephyrus Duo 16 GX650PY-NM006W R9 7945HX, GeForce RTX 4090 Laptop GPU, SK hynix PC801 HFS002TEJ9X101N, MiniLED, 2560x1600, 16" | |
|---|---|---|---|---|---|---|
| Power Consumption | -46% | -13% | -23% | -17% | -51% | |
| Idle Minimum * (Watt) | 8.1 | 24.5 -202% | 12.6 -56% | 8 1% | 10 -23% | 19.2 -137% |
| Idle Average * (Watt) | 15.9 | 29.2 -84% | 17.7 -11% | 18 -13% | 16 -1% | 29.7 -87% |
| Idle Maximum * (Watt) | 37.2 | 34.3 8% | 31.8 15% | 28 25% | 27 27% | 30.8 17% |
| Load Average * (Watt) | 90.9 | 98.7 -9% | 101.4 -12% | 133 -46% | 129 -42% | 126 -39% |
| Witcher 3 ultra * (Watt) | 189.6 | 178.6 6% | 185.3 2% | 294 -55% | 247 -30% | 258 -36% |
| Load Maximum * (Watt) | 263.5 | 249.6 5% | 298 -13% | 399 -51% | 342 -30% | 330 -25% |
* ... smaller is better
Power Consumption Witcher 3 / Stresstest
Power Consumption external Monitor
电池寿命
当设置为iGPU激活的平衡电源配置文件时,WLAN运行时间只是比英特尔版本略长约30分钟。虽然对于游戏笔记本电脑来说还不错,但像Schenker XMG Neo 16或华硕ROG Strix G16有更大的电池容量和更长的运行时间,分别超过两个小时。
用附带的交流适配器从空电到满电的充电速度很快,大约1到1.5小时。快速充电在默认情况下是启用的,而不像旧的Legion 或Yoga型号,它可能被禁用。使用第三方USB-C适配器充电,只支持沿后方的USB-C端口。
| Lenovo Legion Pro 5 16ARX8 R7 7745HX, GeForce RTX 4070 Laptop GPU, 80 Wh | Lenovo Legion Pro 5 16IRX8 i7-13700HX, GeForce RTX 4060 Laptop GPU, 80 Wh | Uniwill GM6PX7X RTX 4070 i7-13700HX, GeForce RTX 4070 Laptop GPU, 62 Wh | Schenker XMG Neo 16 E23 i9-13900HX, GeForce RTX 4090 Laptop GPU, 99 Wh | Asus ROG Strix G16 G614JZ i9-13980HX, GeForce RTX 4080 Laptop GPU, 90 Wh | Asus Zephyrus Duo 16 GX650PY-NM006W R9 7945HX, GeForce RTX 4090 Laptop GPU, 90 Wh | |
|---|---|---|---|---|---|---|
| Battery runtime | -14% | 0% | 68% | 76% | 0% | |
| Reader / Idle (h) | 6.5 | 6.7 3% | ||||
| WiFi v1.3 (h) | 4 | 3.4 -15% | 4 0% | 6.7 68% | 9.7 142% | 4 0% |
| Load (h) | 1 | 0.7 -30% | 1.1 10% | 1 0% | ||
| H.264 (h) | 5.8 | 3.8 | ||||
| Witcher 3 ultra (h) | 1.4 |
Pros
Cons
结论--AMD是游戏玩家的更好选择
联想在这里有两个非常有趣的选择:英特尔酷睿i7-13700HXLegion Pro 5 16,配备RTX 4060显卡,售价1600美元;或AMD Ryzen 7 7745HXLegion Pro 5 16,配备RTX 4070显卡--也是1600美元。前者提供约10%的CPU性能,代价是15%的GPU性能减慢,而后者则相反。关于这两个选项的其他内容几乎都是相同的,因为它们都有相同的机箱设计。因此,重视CPU性能而非GPU的用户可能想要英特尔的方案,而更重视GPU的用户可能想要AMD的方案。
由于Legion Pro 5 16首先是一台游戏笔记本电脑,大多数用户将希望选择AMD选项,以获得更快的RTX 4070图形。几乎所有的最新游戏都是GPU绑定的,因此任何高于Ryzen 7 7745HX的额外CPU性能优势对游戏体验的影响都是最小的。在这种情况下,相对较高的1600美元要价是比较合理的,因为用户得到的是RTX 4070而不是较慢的RTX 4060。
价格和可用性
联想目前正在运送其Legion Pro 5 16代8,基本的Ryzen 5/RTX 4050配置起价为1280美元,而我们的Ryzen 7/RTX 4070配置则为1600美元。截至目前,该机型还没有通过百思买或亚马逊等主要经销商广泛销售。
Lenovo Legion Pro 5 16ARX8
- 05/24/2023 v7 (old)
Allen Ngo
Transparency
The selection of devices to be reviewed is made by our editorial team. The test sample was provided to the author as a loan by the manufacturer or retailer for the purpose of this review. The lender had no influence on this review, nor did the manufacturer receive a copy of this review before publication. There was no obligation to publish this review. As an independent media company, Notebookcheck is not subjected to the authority of manufacturers, retailers or publishers.
This is how Notebookcheck is testing
Every year, Notebookcheck independently reviews hundreds of laptops and smartphones using standardized procedures to ensure that all results are comparable. We have continuously developed our test methods for around 20 years and set industry standards in the process. In our test labs, high-quality measuring equipment is utilized by experienced technicians and editors. These tests involve a multi-stage validation process. Our complex rating system is based on hundreds of well-founded measurements and benchmarks, which maintains objectivity. Further information on our test methods can be found here.
Price comparison

