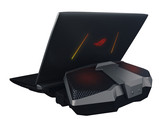
Notebookcheck Logo

NVIDIA GeForce GTX 980 SLI (Laptop)

NVIDIA GeForce GTX 980 SLI (Laptop)

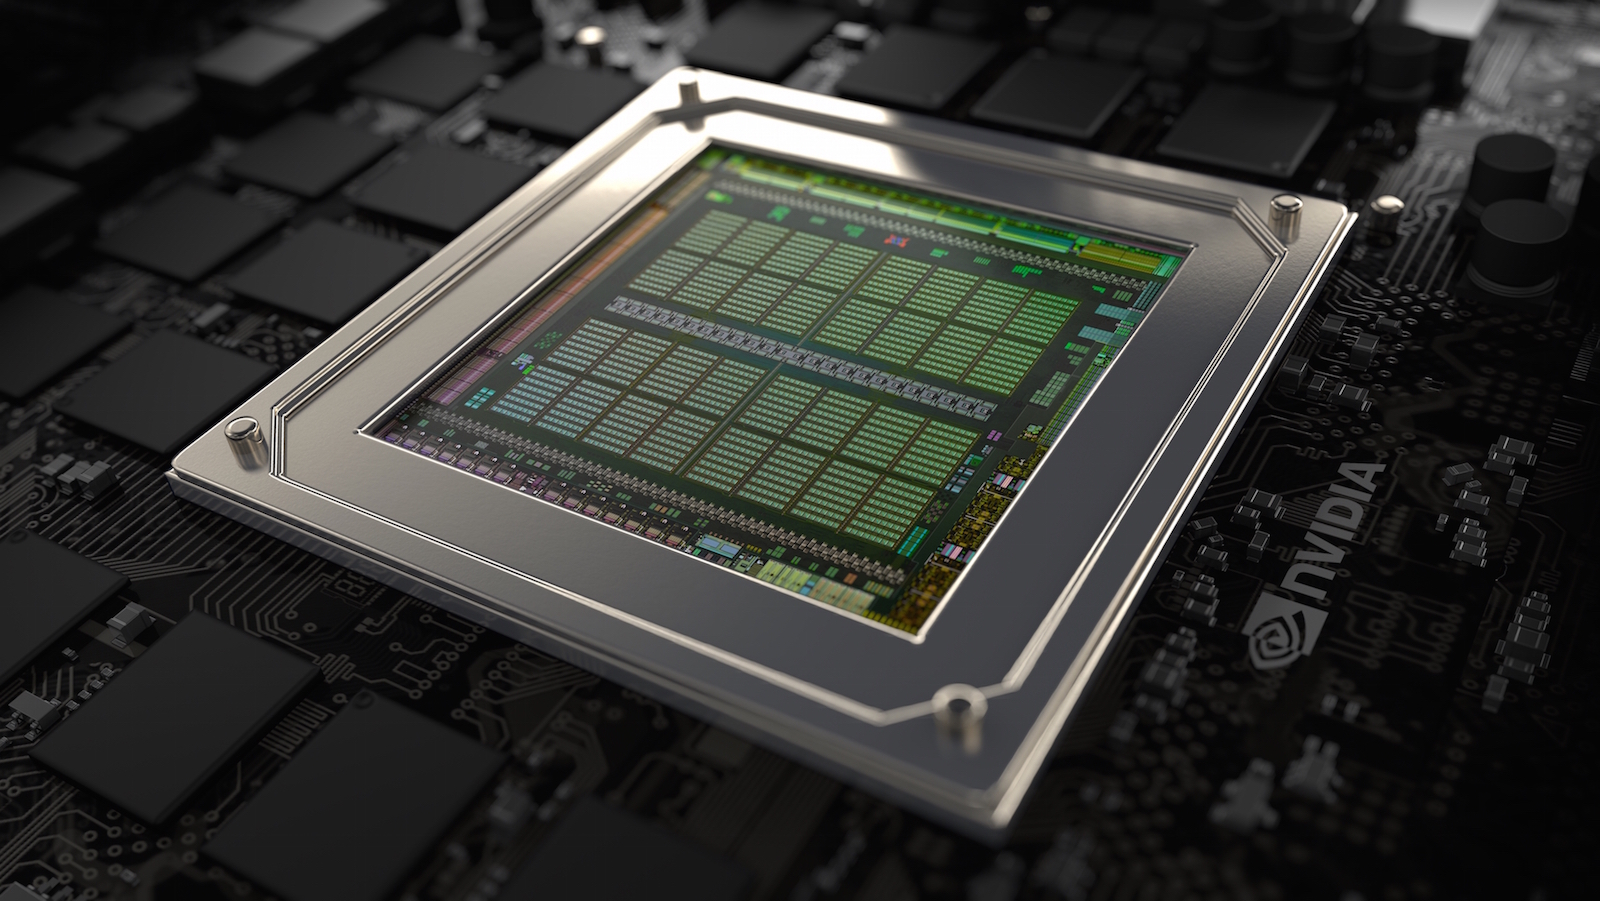
Nvidia GeForce GTX 980 SLI是一款支持DirectX 12的高端笔记本显卡,由两块GeForce GTX 980组成。每块显卡有一颗基于Maxwell架构的28纳米GM204核心,与桌面版GeForce GTX 980显卡的芯片特性相似。它在SLI模式下的时钟频率与GTX 980单显卡模式下相同。

在SLI设置下,每块显卡交替负责渲染一个单独的帧(AFR模式)。因此,它可能在较低帧数下(30fps)有“微卡帧”的情况。这个现象源自两个相邻帧间的时间间隔出现误差(例如在帧序列间出现的不规则延迟)。

它的性能与两块桌面版GTX 980的SLI模式相近。由于不同的散热设计,它在长时间使用时的性能可能会低于散热更好的台式芯片,不过Nvidia保证它的性能降低会很小。与所有的SLI模式显卡相同,它的性能取决于驱动对于测试软件和游戏的支持度。在我们的测试机微星GT80S中,980 SLI是笔记本电脑显卡中速度最快的。980M SLI性能低约17%,而单显卡980则慢了26%。因此,980 SLI的笔记本版本为2015年的大型游戏在高细节和4K分辨率运行提供了足够的性能。

它的核心特性与桌面式980相同,应该可以支持DirectX 12(FL 12_1)。因此它将会与桌面版GTX 950相似,支持最新的H.265视频引擎。

它的每颗核心功耗明显高于其它移动显卡如GeFroce 980M(100瓦热设计功率)。根据Nvidia的信息,它的设计与桌面版相同约为165瓦,因此SLI版本的总功耗将高达330瓦。因此,只有搭配高效散热系统的大尺寸笔记本电脑可以容纳笔记本版本的GeForce GTX 980。

GeForce GTX 900 Series

GeForce GTX 980 SLI (Laptop) 4096 @ 1.13 - 1.23 GHz256 Bit @ 3500 MHz
GeForce GTX 980 Ti 2816 @ 1 - 1.2 GHz256 Bit @ 7000 MHz
GeForce GTX 980 2048 @ 1.13 - 1.22 GHz256 Bit @ 3500 MHz
GeForce GTX 980 (Laptop) 2048 @ 1.13 - 1.23 GHz256 Bit @ 3500 MHz
GeForce GTX 970 1664 @ 1.05 - 1.18 GHz224 + 32 Bit @ 3500 MHz
GeForce GTX 960 1024 @ 1.13 - 1.18 GHz128 Bit @ 3500 MHz
GeForce GTX 950 768 @ 1.02 - 1.19 GHz128 Bit @ 3300 MHz
CodenameN16E-GXX SLI
ArchitectureMaxwell
Pipelines4096 - unified
Core Speed1126 - 1228 (Boost) MHz
Memory Speed3500 MHz
Memory Bus Width256 Bit
Memory TypeGDDR5
Max. Amount of Memory2x 8192 MB
Shared Memoryno
APIDirectX 12_1, OpenGL 4.5
Power Consumption330 Watt
Transistor Count10.4 Billion
technology28 nm
FeaturesCUDA, 3D Vision, PhysX, GeForce Experience, Surround, GameStream, GPU Boost 2.0, Adaptive Vertical Sync, G-SYNC, SLI
Notebook Sizelarge
Date of Announcement22.09.2015

Benchmarks

Performance Rating - 3DMark 11 + Fire Strike + Time Spy
11.6 pt (35%)
3DMark - 3DMark Cloud Gate Score
min: 32522     avg: 33811     median: 33811 (36%)     max: 35100 Points
3DMark - 3DMark Cloud Gate Graphics
min: 147015     avg: 155239     median: 155238 (41%)     max: 163462 Points
3DMark - 3DMark Fire Strike Standard Score
min: 17165     avg: 18339     median: 18339 (32%)     max: 19513 Points
3DMark - 3DMark Fire Strike Standard Graphics
min: 23351     avg: 25453     median: 25453 (29%)     max: 27555 Points
3DMark - 3DMark Ice Storm Graphics
min: 422037     avg: 440931     median: 440930 (53%)     max: 459824 Points
3DMark 11 - 3DM11 Performance Score
min: 20055     avg: 21341     median: 21341 (30%)     max: 22627 Points
3DMark 11 - 3DM11 Performance GPU
min: 30045     avg: 33169     median: 33169 (29%)     max: 36293 Points
3DMark Vantage
3DM Vant. Perf. total +
3DMark Vantage - 3DM Vant. Perf. total
47704 Points (14%)
3DM Vant. Perf. GPU no PhysX +
3DMark Vantage - 3DM Vant. Perf. GPU no PhysX
60089 Points (34%)
ATI Radeon HD 3200
62 -100%
...
49207 -18%
51344 -15%
51396 -14%
52230 -13%
52733 -12%
52917 -12%
53510 -11%
54830 -9%
58792 -2%
NVIDIA GeForce GTX 980 SLI (Laptop)
60089
60439 1%
NVIDIA Quadro RTX 4000 (Laptop)
62557 4%
NVIDIA Quadro RTX 5000 Max-Q
62862 5%
NVIDIA GeForce GTX 1080 Mobile
63088 5%
63137 5%
66003 10%
66376 10%
66735 11%
68082 13%
...
132443 120%
max:
170928 184%
0%
100%
3DMark 06 3DMark 06 - Standard 1280x1024 +
3DMark 06
35639 Points (47%)
SPECviewperf 12
specvp12 sw-03 +
SPECviewperf 12 - specvp12 sw-03
50.8 fps (13%)
specvp12 snx-02 +
SPECviewperf 12 - specvp12 snx-02
6.1 fps (1%)
specvp12 showcase-01 +
SPECviewperf 12 - specvp12 showcase-01
61.2 fps (13%)
specvp12 mediacal-01 +
SPECviewperf 12 - specvp12 mediacal-01
30.2 fps (8%)
specvp12 maya-04 +
SPECviewperf 12 - specvp12 maya-04
88.9 fps (24%)
specvp12 energy-01 +
SPECviewperf 12 - specvp12 energy-01
6.8 fps (6%)
specvp12 creo-01 +
SPECviewperf 12 - specvp12 creo-01
35.4 fps (14%)
specvp12 catia-04 +
SPECviewperf 12 - specvp12 catia-04
52.2 fps (9%)
Cinebench R11.5 Cinebench R11.5 OpenGL 64 Bit +
Cinebench R11.5 - Cinebench R11.5 OpenGL 64 Bit
min: 79.2     avg: 82.6     median: 82.6 (29%)     max: 85.9 fps
Cinebench R15
Cinebench R15 OpenGL 64 Bit +
Cinebench R15 - Cinebench R15 OpenGL 64 Bit
min: 117.9     avg: 125.9     median: 125.9 (7%)     max: 133.8 fps
GFXBench 3.0 - GFXBench 3.0 Manhattan Offscreen
381.7 fps (22%)
LuxMark v2.0 64Bit - LuxMark v2.0 Sala GPU
5814 Samples/s (10%)
ComputeMark v2.1 - ComputeMark v2.1 Result
8892 points (10%)
- Range of benchmark values for this graphics card
- Average benchmark values for this graphics card
* Smaller numbers mean a higher performance

Game Benchmarks

The following benchmarks stem from our benchmarks of review laptops. The performance depends on the used graphics memory, clock rate, processor, system settings, drivers, and operating systems. So the results don't have to be representative for all laptops with this GPU. For detailed information on the benchmark results, click on the fps number.

low 1280x720
197.4  fps    + Compare
med. 1366x768
145.4  fps    + Compare
high 1920x1080
124.4  fps    + Compare
ultra 1920x1080
119.3  fps    + Compare
4K 3840x2160
48.3  fps    + Compare
» With all tested laptops playable in detail settings ultra.
Overwatch

Overwatch

2016
low 1280x720
299.9  fps    + Compare
med. 1366x768
299.8  fps    + Compare
high 1920x1080
299.8  fps    + Compare
ultra 1920x1080
297.4  fps    + Compare
4K 3840x2160
143  fps    + Compare
» With all tested laptops playable in detail settings ultra.
Doom

Doom

2016
low 1280x720
192.7  fps    + Compare
med. 1366x768
189.8  fps    + Compare
high 1920x1080
168.7  fps    + Compare
ultra 1920x1080
160.3  fps    + Compare
4K 3840x2160
70.3  fps    + Compare
» With all tested laptops playable in detail settings ultra.
low 1280x720
133.4  fps    + Compare
med. 1366x768
122.4  fps    + Compare
high 1920x1080
121.4  fps    + Compare
ultra 1920x1080
93.1  fps    + Compare
4K 3840x2160
75.1  fps    + Compare
» With all tested laptops playable in detail settings ultra.
low 1280x720
84.8  fps    + Compare
med. 1366x768
79.7  fps    + Compare
high 1920x1080
72  fps    + Compare
ultra 1920x1080
70.6  fps    + Compare
4K 3840x2160
54.6  fps    + Compare
» With all tested laptops playable in detail settings ultra.
low 1280x720
226  fps    + Compare
med. 1366x768
189.9  fps    + Compare
high 1920x1080
126.5  fps    + Compare
ultra 1920x1080
100.6  fps    + Compare
4K 3840x2160
55.1  fps    + Compare
» With all tested laptops playable in detail settings ultra.
low 1280x720
98  fps    + Compare
med. 1920x1080
97  fps    + Compare
high 1920x1080
86  fps    + Compare
ultra 1920x1080
85  fps    + Compare
4K 3840x2160
56  fps    + Compare
» With all tested laptops playable in detail settings ultra.
XCOM 2

XCOM 2

2016
low 1280x720
129.6  fps    + Compare
med. 1920x1080
109.5  fps    + Compare
high 1920x1080
108  fps    + Compare
ultra 1920x1080
59.9  fps    + Compare
4K 3840x2160
39  fps    + Compare
» With all tested laptops playable in detail settings ultra.
low 1024x768
107.3  fps    + Compare
med. 1366x768
95  fps    + Compare
high 1920x1080
94.7  fps    + Compare
ultra 1920x1080
94.4  fps    + Compare
4K 3840x2160
60.9  fps    + Compare
» With all tested laptops playable in detail settings ultra.
low 1024x768
279.8  fps    + Compare
med. 1366x768
232.2  fps    + Compare
high 1920x1080
150.9  fps    + Compare
ultra 1920x1080
136.4  fps    + Compare
4K 3840x2160
50.2  fps    + Compare
» With all tested laptops playable in detail settings ultra.
low 1024x768
158  fps    + Compare
med. 1366x768
147.7  fps    + Compare
high 1920x1080
92.7  fps    + Compare
ultra 1920x1080
79.3  fps    + Compare
» With all tested laptops playable in detail settings ultra.
low 1024x768
161.7  fps    + Compare
med. 1366x768
150.6  fps    + Compare
high 1920x1080
114.4  fps    + Compare
ultra 1920x1080
110.4  fps    + Compare
4K 3840x2160
62.6  fps    + Compare
» With all tested laptops playable in detail settings ultra.
low 1024x768
94.9  fps    + Compare
med. 1366x768
93.4  fps    + Compare
high 1920x1080
85.3  fps    + Compare
ultra 1920x1080
34.8  fps    + Compare
4K 3840x2160
37.7  fps    + Compare
» With all tested laptops playable in detail settings high.
Fallout 4

Fallout 4

2015
low 1280x720
189.2  fps    + Compare
med. 1366x768
183.8  fps    + Compare
high 1920x1080
149.4  fps    + Compare
ultra 1920x1080
129.9  fps    + Compare
4K 3840x2160
55.6  fps    + Compare
» With all tested laptops playable in detail settings ultra.
low 1024x768
175.3  fps    + Compare
med. 1366x768
169.2  fps    + Compare
high 1920x1080
152.8  fps    + Compare
ultra 1920x1080
152.7  fps    + Compare
4K 3840x2160
60.8  fps    + Compare
» With all tested laptops playable in detail settings ultra.
Anno 2205

Anno 2205

2015
low 1024x768
170.1  fps    + Compare
med. 1366x768
157.1  fps    + Compare
high 1920x1080
88  fps    + Compare
ultra 1920x1080
31.5  fps    + Compare
4K 3840x2160
35.4  fps    + Compare
» With all tested laptops playable in detail settings high.
FIFA 16

FIFA 16

2015
low 1280x720
357.3  fps    + Compare
high 1366x768
319.8  fps    + Compare
ultra 1920x1080
266.4  fps    + Compare
4K 3840x2160
118.6  fps    + Compare
» With all tested laptops playable in detail settings ultra.
Mad Max

Mad Max

2015
med. 1366x768
277  fps    + Compare
high 1920x1080
244.9  fps    + Compare
ultra 1920x1080
230.8  fps    + Compare
» With all tested laptops playable in detail settings ultra.
low 1280x720
160  fps    + Compare
med. 1366x768
148  fps    + Compare
high 1920x1080
96  fps    + Compare
ultra 1920x1080
64  fps    + Compare
4K 3840x2160
32  fps    + Compare
» With all tested laptops playable in detail settings ultra.
low 1024x768
270.3  fps    + Compare
med. 1366x768
203.4  fps    + Compare
high 1920x1080
131.9  fps    + Compare
ultra 1920x1080
74  fps    + Compare
4K 3840x2160
51.2  fps    + Compare
» With all tested laptops playable in detail settings ultra.
low 1024x768
394  fps    + Compare
med. 1366x768
178.9  fps    + Compare
high 1920x1080
137.3  fps    + Compare
ultra 1920x1080
124.4  fps    + Compare
4K 3840x2160
85.6  fps    + Compare
» With all tested laptops playable in detail settings ultra.
low 1024x768
198.4  fps    + Compare
med. 1366x768
197.9  fps    + Compare
high 1920x1080
195.4  fps    + Compare
ultra 1920x1080
176.1  fps    + Compare
» With all tested laptops playable in detail settings ultra.
Evolve

Evolve

2015
low 1024x768
274.8  fps    + Compare
med. 1366x768
225.7  fps    + Compare
high 1920x1080
199  fps    + Compare
ultra 1920x1080
177.8  fps    + Compare
» With all tested laptops playable in detail settings ultra.
low 1024x768
197.8  fps    + Compare
med. 1366x768
187.7  fps    + Compare
high 1920x1080
159.2  fps    + Compare
ultra 1920x1080
123.5  fps    + Compare
» With all tested laptops playable in detail settings ultra.
Far Cry 4

Far Cry 4

2014
low 1024x768
137.9  fps    + Compare
med. 1366x768
136.9  fps    + Compare
high 1920x1080
120.4  fps    + Compare
ultra 1920x1080
113.6  fps    + Compare
» With all tested laptops playable in detail settings ultra.
low 1024x768
284.6  fps    + Compare
med. 1366x768
269.1  fps    + Compare
high 1920x1080
238.7  fps    + Compare
ultra 1920x1080
185.4  fps    + Compare
» With all tested laptops playable in detail settings ultra.
low 1280x720
227.8  fps    + Compare
med. 1344x756
203  fps    + Compare
high 1920x1080
186.1  fps    + Compare
ultra 1920x1080
160.9  fps    + Compare
» With all tested laptops playable in detail settings ultra.
Sims 4

Sims 4

2014
low 1024x768
191.7  fps    + Compare
med. 1366x768
172.7  fps    + Compare
high 1920x1080
144.3  fps    + Compare
ultra 1920x1080
138.4  fps    + Compare
» With all tested laptops playable in detail settings ultra.
low 1024x768
342  fps    + Compare
med. 1366x768
191.3  fps    + Compare
high 1920x1080
155.2  fps    + Compare
ultra 1920x1080
142.9  fps    + Compare
» With all tested laptops playable in detail settings ultra.
low 1024x768
106  fps    + Compare
med. 1366x768
94.3  fps    + Compare
high 1920x1080
78.5  fps    + Compare
ultra 1920x1080
69.3  fps    + Compare
» With all tested laptops playable in detail settings ultra.
Thief

Thief

2014
low 1024x768
131.9  fps    + Compare
med. 1366x768
130.8  fps    + Compare
high 1366x768
130.3  fps    + Compare
ultra 1920x1080
113.8  fps    + Compare
» With all tested laptops playable in detail settings ultra.
low 1024x768
199.6  fps    + Compare
med. 1366x768
199.5  fps    + Compare
high 1366x768
198.9  fps    + Compare
ultra 1920x1080
176.8  fps    + Compare
4K 3840x2160
91.6  fps    + Compare
» With all tested laptops playable in detail settings ultra.
low 1024x768
155.9  fps    + Compare
med. 1366x768
151.2  fps    + Compare
high 1366x768
143.8  fps    + Compare
ultra 1920x1080
111.9  fps    + Compare
» With all tested laptops playable in detail settings ultra.
low 1280x720
293.3  fps    + Compare
med. 1366x768
259.7  fps    + Compare
high 1366x768
241.6  fps    + Compare
ultra 1920x1080
178.1  fps    + Compare
» With all tested laptops playable in detail settings ultra.
low 1024x768
548  fps    + Compare
med. 1366x768
521  fps    + Compare
high 1366x768
507  fps    + Compare
ultra 1920x1080
276.9  fps    + Compare
» With all tested laptops playable in detail settings ultra.
Crysis 3

Crysis 3

2013
low 1024x768
163.7  fps    + Compare
med. 1366x768
147.9  fps    + Compare
high 1366x768
128  fps    + Compare
ultra 1920x1080
91.7  fps    + Compare
» With all tested laptops playable in detail settings ultra.
lowmed.highultraQHD4K
Mirror's Edge Catalyst197.4145.4124.4119.348.3
Overwatch299.9299.8299.8297.4143
Doom192.7189.8168.7160.370.3
Need for Speed 2016133.4122.4121.493.175.1
Hitman 201684.879.77270.654.6
The Division226189.9126.5100.655.1
Far Cry Primal9897868556
XCOM 2129.6109.510859.939
Rise of the Tomb Raider107.39594.794.460.9
Rainbow Six Siege279.8232.2150.9136.450.2
Just Cause 3158147.792.779.3
Star Wars Battlefront161.7150.6114.4110.462.6
Assassin's Creed Syndicate94.993.485.334.837.7
Fallout 4189.2183.8149.4129.955.6
Call of Duty: Black Ops 3175.3169.2152.8152.760.8
Anno 2205170.1157.18831.535.4
FIFA 16357.3319.8266.4118.6
Mad Max277244.9230.8
Batman: Arkham Knight160148966432
The Witcher 3270.3203.4131.97451.2
Dirt Rally394178.9137.3124.485.6
Battlefield Hardline198.4197.9195.4176.1
Evolve274.8225.7199177.8
Dragon Age: Inquisition197.8187.7159.2123.5
Far Cry 4137.9136.9120.4113.6
Alien: Isolation284.6269.1238.7185.4
Middle-earth: Shadow of Mordor227.8203186.1160.9
Sims 4191.7172.7144.3138.4
GRID: Autosport342191.3155.2142.9
Watch Dogs10694.378.569.3
Thief131.9130.8130.3113.8
Battlefield 4199.6199.5198.9176.891.6
Metro: Last Light155.9151.2143.8111.9
BioShock Infinite293.3259.7241.6178.1
Tomb Raider548521507276.9
Crysis 3163.7147.912891.7
< 30 fps
< 60 fps
< 120 fps
≥ 120 fps


5
30


6
29


10
26

3
15
18


11
8
1

For more games that might be playable and a list of all games and graphics cards visit our Gaming List

v1.26
log 03. 05:06:37

#0 no ids found in url (should be separated by "_") +0s ... 0s

#1 not redirecting to Ajax server +0s ... 0s

#2 did not recreate cache, as it is less than 5 days old! Created at Wed, 01 May 2024 05:36:19 +0200 +0.001s ... 0.001s

#3 no comparison url found in template nbc.compare_page_1 needed +0.035s ... 0.036s

#4 no comparison url found in template nbc.compare_page_1 needed +0s ... 0.036s

#5 no comparison url found in template nbc.compare_page_1 needed +0s ... 0.036s

#6 no comparison url found in template nbc.compare_page_1 needed +0s ... 0.036s

#7 no comparison url found in template nbc.compare_page_1 needed +0s ... 0.036s

#8 no comparison url found in template nbc.compare_page_1 needed +0s ... 0.036s

#9 composed specs +0s ... 0.036s

#10 did output specs +0s ... 0.036s

#11 start showIntegratedCPUs +0s ... 0.036s

#12 getting avg benchmarks for device 7167 +0.029s ... 0.065s

#13 got single benchmarks 7167 +0.01s ... 0.075s

#14 got avg benchmarks for devices +0s ... 0.075s

#15 min, max, avg, median took s +0.475s ... 0.551s

#16 before gaming benchmark output +0s ... 0.551s

#17 Got 162 rows for game benchmarks. +0.014s ... 0.565s

#18 composed SQL query for gamebenchmarks +0s ... 0.565s

#19 got data and put it in $dataArray +0.031s ... 0.596s

#20 benchmarks composed for output. +1.299s ... 1.895s

#21 no comparison url found in template nbc.compare_page_1 needed +0.003s ... 1.898s

#22 return log +0s ... 1.898s

Please share our article, every link counts!

» Comparison of GPUs
Detailed list of all laptop GPUs sorted by class and performance.

» Benchmark List
Sort and restrict laptop GPUs based on performance in synthetic benchmarks.

» Notebook Gaming List
Playable games for each graphics card and their average FPS results.

Class 1

GeForce RTX 2080 Super Mobile

Class 2

M1 Max 32-Core GPU *
GeForce RTX 2070 Super Mobile
M1 Max 24-Core GPU *
Quadro RTX 5000 Max-Q
Radeon RX 5700M *
GeForce GTX 1080 Mobile
Quadro RTX 4000 (Laptop)
M1 Pro 16-Core GPU *
Radeon PRO W6600M *
GeForce RTX 2070 Super Max-Q
Quadro RTX 4000 Max-Q *
M1 Pro 14-Core GPU *
Quadro P5200
Quadro RTX 3000 Max-Q *
Quadro P4200
Quadro P5000 Max-Q *
GeForce GTX 980 (Laptop)
Quadro P4000
Quadro P4000 Max-Q
Quadro P3200
Radeon RX 580X (Laptop) *
Radeon RX 580 (Laptop)
Radeon Pro 5300M
Radeon RX 5300M
Quadro P3000 Max-Q *
Quadro T2000 Max-Q *
Radeon Pro WX 7100 *
Radeon RX 570X (Laptop) *
Radeon RX 570 (Laptop) *
Radeon RX 470 (Laptop) *
Quadro T1000 Max-Q *

Class 3

Vega M GH
Quadro M5000M
GeForce GTX 1050 Ti Mobile
Radeon 680M
Quadro P2000
Quadro P2000 Max-Q
Quadro M4000M
T500 Laptop GPU *
Radeon R9 M395X
GeForce GTX 1050 Ti Max-Q *
Radeon Pro Vega 16
WX Vega M GL
Radeon R9 M485X
Quadro M3000M
FirePro W7170M
Radeon R9 M395
GeForce GTX 1050 Max-Q *
Radeon 660M
Radeon Pro WX 4150 *
Radeon RX 560X (Laptop)
Radeon RX 560 (Laptop)
Radeon RX 460 (Laptop)
Quadro P1000
Radeon R9 M390
Xe MAX
Radeon Pro 560X
Radeon Pro 560
Radeon Pro 460
Radeon Pro WX 4130 *
GeForce GTX 960M
Quadro P620 *
Radeon RX 550X (Laptop)
Radeon Pro WX 3200 *
Radeon Pro 555X
Radeon Pro 555
Radeon Pro 455
Quadro P600
Quadro M2000M
Radeon RX 540X *
Radeon Pro WX 2100 *
Radeon Pro WX 3100 *
GeForce GTX 950M
Radeon Pro 450
Radeon 630
Radeon 540X *
Radeon R9 M385X
Quadro P520
Quadro M1000M
GeForce 945M
Quadro P500 *
Iris Plus Graphics G7 (Ice Lake 64 EU) *
Vega 10 *
Iris Pro Graphics 580
FirePro W5170M *
Radeon R9 M370X
Vega 9
FirePro W5130M
UHD Graphics Xe G4 48EUs *
UHD Graphics 32EUs
UHD Graphics Xe 32EUs (Tiger Lake-H) *
UHD Graphics 750
Vega 7
Radeon R7 M465
Iris Pro Graphics 6200
Vega 8
GeForce 940M
Iris Plus Graphics G4 (Ice Lake 48 EU)
Quadro M600M
FirePro W4190M
Radeon R9 M375
Radeon R7 M445
Iris Plus Graphics 650
Iris Graphics 550
Radeon 625
Vega 6 *
Iris Plus Graphics 640
Iris Graphics 540
UHD Graphics 24EUs (Alder Lake-N) *
Radeon R7 M360
GeForce 920M
Radeon 620
Radeon R7 M340
Radeon 610
Radeon 610M *
Vega 6 *
UHD Graphics G1 (Ice Lake 32 EU)
UHD Graphics Xe 16EUs (Tiger Lake-H) *
HD Graphics 530
Radeon R5 (Bristol Ridge)
Adreno 690 *
Adreno 685 *
Adreno 680 *
Radeon R5 M330
GeForce 910M
HD Graphics 520

Class 4

UHD Graphics 730
Radeon R5 M320 *
Radeon R5 M315 *
Radeon R5 M420 *
Vega 2 *
UHD Graphics 617
UHD Graphics 615
HD Graphics 515
UHD Graphics 610
HD Graphics 510
UHD Graphics 605
Radeon R4 (Stoney Ridge)
Radeon R2 (Stoney Ridge)
HD Graphics (Broadwell)
UHD Graphics 600
HD Graphics (Braswell)

Class 5

* Approximate position of the graphics adapter

> Notebookcheck中文版(NBC中国) > FAQ / 小提示/ 技术参数 > 移动显示芯片——基准测试成绩列表 > NVIDIA GeForce GTX 980 SLI (Notebook)
Klaus Hinum (Update: 2016-04- 3)