Notebookcheck Logo

Intel Core i9-13900HX

Intel i9-13900HX

英特尔酷睿 i9-13900HX是猛禽湖系列的一款快速高端移动处理器。它于 2023 年初发布,看起来是基于台式机的 酷睿 i9-13000K结合的 24 个内核和 32 个线程。其中,8 个快速 Raptor Cove 性能内核(P-cores)带有超线程技术,主频介于 2.2 GHz(基本)和 5.4 GHz(单核提升,所有内核均为 4.9 GHz)之间,16 个 Gracemont 效率内核不带超线程技术(1.6 - 3.9 GHz)。

与 Alder Lake 相比,Raptor Lake 改进了 P 核心(Raptor Cove 微架构),增加了缓存,并增加了 E 核心(与 Gracemont 微架构相同)。此外,该芯片还支持更快的 DDR5 内存(13900HX 最高可达 5600 MHz)。

性能

我们数据库中 13900HX 的平均性能与 酷睿 i9-13950HXRyzen 9 7845HX的多线程基准测试成绩。可以说,这确实令人印象深刻。

得益于体面的冷却解决方案和 99 W 的 CPU 长期功率限制,Eluktronics Mech-17 GP2 Eluktronics Mech-17 GP2是我们所知的最快的 13900HX 笔记本电脑之一。截至 2023 年 8 月,它在 CPU 负载工作负载中的速度比我们数据库中采用相同芯片的最慢系统快约 50%。

CPU 仍采用进一步改进的 10nm FinFET 工艺(英特尔 7)生产,从而实现了更高的时钟速度。基本功耗为 55 瓦,最大功耗为 157 瓦。涡轮功率

SeriesIntel Raptor Lake-HX
CodenameRaptor Lake-HX

Series: Raptor Lake-HX Raptor Lake-HX

Intel Core i9-13980HX1.6 - 5.6 GHz24 / 32 cores36 MB L3
Intel Core i9-13950HX1.6 - 5.5 GHz24 / 32 cores36 MB L3
Intel Core i9-13900HX « 1.6 - 5.4 GHz24 / 32 cores36 MB L3
Intel Core i7-13850HX1.5 - 5.3 GHz20 / 28 cores30 MB L3
Intel Core i7-13700HX1.5 - 5 GHz16 / 24 cores30 MB L3
Intel Core i7-13650HX1.9 - 4.9 GHz14 / 20 cores24 MB L3
Intel Core i5-13600HX1.9 - 4.8 GHz14 / 20 cores24 MB L3
Intel Core i5-13500HX1.8 - 4.7 GHz14 / 20 cores24 MB L3
Intel Core i5-13450HX1.8 - 4.6 GHz10 / 16 cores20 MB L3
Clock Rate1600 - 5400 MHz
Level 2 Cache32 MB
Level 3 Cache36 MB
Number of Cores / Threads24 / 32
8 x 5.4 GHz Intel Raptor Cove P-Core
16 x 3.9 GHz Intel Gracemont E-Core
Power Consumption (TDP = Thermal Design Power)55 Watt
Manufacturing Technology10 nm
Die Size257 mm2
Max. Temperature100 °C
SocketBGA1964
FeaturesDDR4-3200/DDR5-5600 RAM, PCIe 5, Thr. Dir., DL B., GNA, MMX, SSE, SSE2, SSE3, SSSE3, SSE4.1, SSE4.2, AVX, AVX2, BMI2, ABM, FMA, ADX, VMX, SMEP, SMAP, EIST, TM1, TM2, HT, Turbo, SST, AES-NI, RDRAND, RDSEED, SHA
GPUIntel UHD Graphics Xe 32EUs (Tiger Lake-H) ( - 1650 MHz)
64 Bit64 Bit support
Architecturex86
Announcement Date01/04/2023
Product Link (external)ark.intel.com

Benchmarks

Performance Rating - CB R15 + R20 + 7-Zip + X265 + Blender + 3DM11 CPU
53.1 pt (74%)
Cinebench R23 - Cinebench R23 Multi Core
min: 24270     avg: 28225     median: 27844 (26%)     max: 32623 Points
Cinebench R23 - Cinebench R23 Single Core
min: 1867     avg: 2044     median: 2055 (87%)     max: 2105 Points
Cinebench R20 - Cinebench R20 CPU (Single Core)
min: 722     avg: 784     median: 785.5 (87%)     max: 810 Points
Cinebench R20 - Cinebench R20 CPU (Multi Core)
min: 9152     avg: 10766     median: 10548 (26%)     max: 12541 Points
Cinebench R15 - Cinebench R15 CPU Multi 64 Bit
min: 3913     avg: 4522     median: 4487 (28%)     max: 4970 Points
02505007501000125015001750200022502500275030003250350037504000425045004750Tooltip
Cinebench R15 - Cinebench R15 CPU Single 64 Bit
min: 247     avg: 291.7     median: 295 (89%)     max: 304 Points
Cinebench R11.5 - Cinebench R11.5 CPU Multi 64 Bit
min: 49.5     avg: 52.3     median: 52.3 (68%)     max: 55.14 Points
Cinebench R11.5 - Cinebench R11.5 CPU Single 64 Bit
min: 3.64     avg: 3.7     median: 3.7 (91%)     max: 3.67 Points
Cinebench R10 - Cinebench R10 Rend. Single (32bit)
min: 11618     avg: 11700     median: 11699.5 (71%)     max: 11781 points
Cinebench R10 - Cinebench R10 Rend. Multi (32bit)
min: 76718     avg: 79300     median: 79299.5 (57%)     max: 81881 points
Cinebench R10 - Cinebench R10 Rend. Multi (64bit)
111582 Points (77%)
Cinebench R10 - Cinebench R10 Rend. Single (64bit)
17169 Points (21%)
wPrime 2.10 - wPrime 2.0 1024m *
215.7 s (3%)
wPrime 2.10 - wPrime 2.0 32m *
2.6 s (1%)
WinRAR - WinRAR 4.0
min: 12876     avg: 12916     median: 12916 (20%)     max: 12956 points
7-Zip 18.03 - 7-Zip 18.03 Multli Thread 4 runs
min: 90675     avg: 111796     median: 114430 (66%)     max: 127283 MIPS
7-Zip 18.03 - 7-Zip 18.03 Single Thread 4 runs
min: 6340     avg: 6848     median: 6892.5 (82%)     max: 7177 MIPS
X264 HD Benchmark 4.0 - x264 Pass 2
217.7 fps (76%)
X264 HD Benchmark 4.0 - x264 Pass 1
387.7 fps (89%)
HWBOT x265 Benchmark v2.2 - HWBOT x265 4k Preset
min: 23.5     avg: 29.1     median: 29.4 (52%)     max: 34.4 fps
051015202530354045Tooltip
TrueCrypt - TrueCrypt Serpent
min: 2.1     avg: 2.3     median: 2.3 (0%)     max: 2.4 GB/s
TrueCrypt - TrueCrypt Twofish
min: 4.1     avg: 4.3     median: 4.3 (73%)     max: 4.4 GB/s
TrueCrypt - TrueCrypt AES
min: 15.2     avg: 17     median: 17 (44%)     max: 18.8 GB/s
Blender - Blender 3.3 Classroom CPU *
min: 175     avg: 210.7     median: 202 (3%)     max: 275 Seconds
Blender - Blender 2.79 BMW27 CPU *
min: 101     avg: 117.9     median: 114 (1%)     max: 153 Seconds
R Benchmark 2.5 - R Benchmark 2.5 *
min: 0.375     avg: 0.4     median: 0.4 (9%)     max: 0.4564 sec
3DMark 06 - CPU - 3DMark 06 - CPU
min: 16591     avg: 17802     median: 18036.5 (38%)     max: 18235 Points
Super Pi mod 1.5 XS 1M - Super Pi mod 1.5 XS 1M *
min: 6.2     avg: 6.2     median: 6.2 (1%)     max: 6.215 s
Super Pi mod 1.5 XS 2M - Super Pi mod 1.5 XS 2M *
13.4 s (1%)
Super Pi Mod 1.5 XS 32M - Super Pi mod 1.5 XS 32M *
min: 315     avg: 315.1     median: 315.1 (1%)     max: 315.265 s
3DMark Vantage - 3DM Vant. Perf. CPU no Physx
min: 74788     avg: 76276     median: 76275.5 (67%)     max: 77763 Points
3DMark 11 - 3DM11 Performance Physics
min: 19090     avg: 23161     median: 23767 (64%)     max: 25681 Points
3DMark - 3DMark Ice Storm Physics
min: 77043     avg: 86045     median: 83045 (67%)     max: 101046 Points
3DMark - 3DMark Ice Storm Extreme Physics
82808 Points (67%)
3DMark - 3DMark Ice Storm Unlimited Physics
85007 Points (72%)
3DMark - 3DMark Cloud Gate Physics
min: 16532     avg: 21282     median: 21573 (55%)     max: 23984 Points
3DMark - 3DMark Fire Strike Standard Physics
min: 28693     avg: 37016     median: 37598.5 (67%)     max: 43004 Points
3DMark - 3DMark Time Spy CPU
min: 13288     avg: 15195     median: 14988 (63%)     max: 18304 Points
Geekbench 6.2 - Geekbench 6.2 Single-Core
min: 2548     avg: 2720     median: 2720 (83%)     max: 2892 points
Geekbench 6.2 - Geekbench 6.2 Multi-Core
min: 15031     avg: 16523     median: 16522.5 (65%)     max: 18014 points
Geekbench 5.5 - Geekbench 5.1 - 5.4 64 Bit Single-Core
min: 1345     avg: 1988     median: 2036 (86%)     max: 2093 points
Geekbench 5.5 - Geekbench 5.1 - 5.4 64 Bit Multi-Core
min: 17614     avg: 19809     median: 19982 (36%)     max: 21075 points
Geekbench 5.0 - Geekbench 5.0 64 Bit Single-Core
min: 1804     avg: 1964     median: 1982 (9%)     max: 2064 points
Geekbench 5.0 - Geekbench 5.0 64 Bit Multi-Core
min: 18612     avg: 19451     median: 19027 (60%)     max: 20594 points
Geekbench 4.4 - Geekbench 4.1 - 4.4 64 Bit Single-Core
min: 8706     avg: 8840     median: 8843 (88%)     max: 8936 points
Geekbench 4.4 - Geekbench 4.1 - 4.4 64 Bit Multi-Core
min: 66537     avg: 70316     median: 71143 (79%)     max: 71700 points
Mozilla Kraken 1.1 - Kraken 1.1 Total Score *
min: 453     avg: 471.3     median: 463.5 (1%)     max: 520 ms
Octane V2 - Octane V2 Total Score
min: 95898     avg: 101964     median: 104390 (94%)     max: 105526 Points
WebXPRT 4 - WebXPRT 4 Score
min: 243     avg: 288.7     median: 291 (84%)     max: 304 Points
WebXPRT 3 - WebXPRT 3 Score
min: 266     avg: 322.6     median: 322 (67%)     max: 358 Points
CrossMark - CrossMark Overall
min: 1825     avg: 2064     median: 2113 (81%)     max: 2295 Points
Power Consumption - Prime95 Power Consumption - external Monitor *
min: 106.1     avg: 171.8     median: 175.4 (30%)     max: 231 Watt
0153045607590105120135150165180195210225240255270Tooltip
Power Consumption - Cinebench R15 Multi Power Consumption - external Monitor *
min: 176     avg: 217.8     median: 223 (41%)     max: 266 Watt
0153045607590105120135150165180195210225240255270Tooltip
Power Consumption - Idle Power Consumption - external Monitor *
min: 13.9     avg: 23.8     median: 25 (17%)     max: 31.5 Watt
0510152025303540455055606570Tooltip
Power Consumption - Idle Power Consumption 150cd 1min *
min: 15     avg: 19.9     median: 19 (21%)     max: 29 Watt
05101520253035404550556065707580859095Tooltip
Power Consumption - Cinebench R15 Multi Power Efficiency - external Monitor
min: 19.5     avg: 20.7     median: 20.8 (15%)     max: 21.8 Points per Watt
- Range of benchmark values for this graphics card
- Average benchmark values for this graphics card
* Smaller numbers mean a higher performance

v1.26
log 24. 14:19:25

#0 no ids found in url (should be separated by "_") +0s ... 0s

#1 not redirecting to Ajax server +0s ... 0s

#2 did not recreate cache, as it is less than 5 days old! Created at Tue, 23 Apr 2024 05:40:15 +0200 +0.001s ... 0.001s

#3 no comparison url found in template nbc.compare_page_2 needed +0.015s ... 0.016s

#4 no comparison url found in template nbc.compare_page_2 needed +0s ... 0.016s

#5 no comparison url found in template nbc.compare_page_2 needed +0s ... 0.016s

#6 no comparison url found in template nbc.compare_page_2 needed +0s ... 0.016s

#7 no comparison url found in template nbc.compare_page_2 needed +0s ... 0.017s

#8 no comparison url found in template nbc.compare_page_2 needed +0s ... 0.017s

#9 no comparison url found in template nbc.compare_page_2 needed +0s ... 0.017s

#10 no comparison url found in template nbc.compare_page_2 needed +0s ... 0.017s

#11 composed specs +0.001s ... 0.018s

#12 did output specs +0s ... 0.018s

#13 getting avg benchmarks for device 14659 +0.015s ... 0.033s

#14 got single benchmarks 14659 +0.072s ... 0.105s

#15 got avg benchmarks for devices +0s ... 0.105s

#16 min, max, avg, median took s +1.008s ... 1.113s

#17 no comparison url found in template nbc.compare_page_2 needed +0s ... 1.114s

#18 return log +0s ... 1.114s

Reviews for the Intel Core i9-13900HX processor
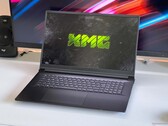
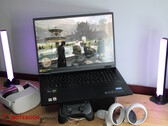
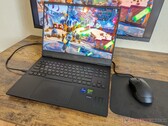
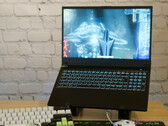
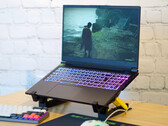
宏碁掠夺者 Helios 18 笔记本电脑评测:配备 MiniLED 显示屏的 RTX 4080 玩家,亮度超过 1,000 尼特

宏碁掠夺者 Helios 18 笔记本电脑评测:配备 MiniLED 显示屏的 RTX 4080 玩家,亮度超过 1,000 尼特

18 英寸的 Predator Helios 18 是一款真正的台式机替代产品,尤其适合游戏玩家和创意人士。除了 RTX 4080 和强劲的 i9-13900HX 之外,非常明亮的 MiniLED 显示屏也确保了这一点。请继续阅读,了解这款笔记本电脑在其他功能方面是否也适合游戏玩家和创意人士。...
Intel Core i9-13900HX | NVIDIA GeForce RTX 4080 Laptop GPU | 18.00" | 3.2 kg
惠普 Omen Transcend 16 笔记本电脑评测:不仅仅是名称上的细微差别

惠普 Omen Transcend 16 笔记本电脑评测:不仅仅是名称上的细微差别

不要把它与普通的 Omen 16 混为一谈,Omen Transcend 16 是该系列的升级版,具有更新的功能和选项,未来的 Omen 型号可能会借鉴这些功能和选项。在扣动扳机之前,请了解所有的区别和变化。...
Intel Core i9-13900HX | NVIDIA GeForce RTX 4070 Laptop GPU | 16.00" | 2.3 kg
XMG Focus 15回顾

申克 XMG Focus 15 (E23) 经济型游戏笔记本电脑评测:比Pro 15性能更强,价格更低

如果您可以不使用金属外壳和全RGB键盘,您不一定非要选择昂贵的XMG Pro 15。在我们的测试中,XMG Focus 15的性能与Pro 15相当,只是在某些方面稍逊一筹。作为回报,Focus 15的基本价格比Pro 15低约400欧元,而性能却几乎相似。...
Intel Core i9-13900HX | NVIDIA GeForce RTX 4050 Laptop GPU | 15.60" | 2.4 kg
申科XMG Pro 15 E23 (PD50SND-G)游戏笔记本电脑评测:为工作和游戏的平衡干杯!

申科XMG Pro 15 E23 (PD50SND-G)游戏笔记本电脑评测:为工作和游戏的平衡干杯!

坚实和低调的设计与计算能力相搭配。这就是XMG Pro 15 E23在我们的评测中的形象。无论是作为内容创作者还是游戏玩家的笔记本电脑,XMG Pro 15都以强大的Nvidia显卡和涵盖P3色彩空间的精彩QHD显示屏给人留下深刻印象。 ...
Intel Core i9-13900HX | NVIDIA GeForce RTX 4060 Laptop GPU | 15.60" | 2.4 kg
联想Legion Pro 7 16笔记本电脑回顾:得益于RTX 4090的全面游戏能力

联想Legion Pro 7 16笔记本电脑回顾:得益于RTX 4090的全面游戏能力

Legion Pro 7的顶级型号是为最大性能而设计的。酷睿i9-13900HX和GeForce RTX 4090承诺在内部WQXGA显示器上的流畅帧率,即使在要求很高的游戏中。我们把16英寸的设备通过我们的测试课程。...
Intel Core i9-13900HX | NVIDIA GeForce RTX 4090 Laptop GPU | 16.00" | 2.7 kg

SCHENKER XMG Focus 17 (E23): NVIDIA GeForce RTX 4070 Laptop GPU, 17.30", 2.9 kg
  Review » Schenker XMG Focus 17 (E23) in review:配备RTX 4070的游戏笔记本在性能上毫不逊色

SCHENKER Key 17 Pro (Early 23): NVIDIA GeForce RTX 4090 Laptop GPU, 17.30", 3.4 kg
  Review » 斯堪的纳维亚钥匙17 Pro(早期23)回顾:配备Core i9和RTX 4090的4k游戏笔记本

Eurocom Raptor X17: NVIDIA GeForce RTX 4090 Laptop GPU, 17.30", 3.5 kg
  Review » Eurocom Raptor X17笔记本电脑评测:微星和华硕ROG的替代品

Medion Erazer Major X20: NVIDIA GeForce RTX 4070 Laptop GPU, 16.00", 2.4 kg
  Review » Medion Erazer Major X20回顾:配备RTX 4070和坚实硬件的游戏笔记本

Aorus 17X AZF: NVIDIA GeForce RTX 4090 Laptop GPU, 17.30", 2.9 kg
  Review » Aorus 17X AZF回顾:带有i9-13900HX和RTX 4090的高端游戏笔记本电脑在一个薄薄的盒子里

Eluktronics Mech-17 GP2 Liquid Propulsion Package G2: NVIDIA GeForce RTX 4090 Laptop GPU
  Review » 水冷一个GeForce RTX 4090笔记本电脑:Eluktronics液体推进包G2回顾

HP Omen 17-ck2097ng: NVIDIA GeForce RTX 4080 Laptop GPU, 17.30", 2.8 kg
  Review » HP Omen 17 (2023)回顾:游戏笔记本使用RTX 4080

Medion Erazer Beast X40: NVIDIA GeForce RTX 4090 Laptop GPU, 17.00", 2.9 kg
  Review » Medion Erazer Beast X40回顾:配备RTX 4090的游戏笔记本

Eluktronics Mech-17 GP2: NVIDIA GeForce RTX 4090 Laptop GPU, 17.00", 2.9 kg
  Review » Eluktronics Mech-17 GP2笔记本电脑评测。微星GT77泰坦的性能,没有大小之分

Lenovo Legion Pro 7 16IRX8H: NVIDIA GeForce RTX 4080 Laptop GPU, 16.00", 2.7 kg
  Review » 联想Legion Pro 7 16IRX8H评论。高端的RTX4080性能强者

SCHENKER XMG Neo 17 2023 Engineering Sample: NVIDIA GeForce RTX 4070 Laptop GPU
  Review » GeForce RTX 4070、4060、4050笔记本电脑分析--Nvidia新的主流笔记本电脑GPU回顾

SCHENKER XMG Neo 16 Raptor Lake: NVIDIA GeForce RTX 4090 Laptop GPU, 16.00"
  Review » Nvidia Ada RTX 40笔记本GPU分析:175W RTX 4090笔记本GPU在性能和功率效率方面超过了350W RTX 3090

Dell G16 7630, i9-13900HX RTX 4070: NVIDIA GeForce RTX 4070 Laptop GPU, 16.00", 2.9 kg
  External Review » Dell G16 7630, i9-13900HX RTX 4070

Acer Predator Helios 3D 15 SpatialLabs Edition: NVIDIA GeForce RTX 4080 Laptop GPU, 15.60", 3 kg
  External Review » Acer Predator Helios 3D 15 SpatialLabs Edition

Alienware m18 R1, RTX 4090: NVIDIA GeForce RTX 4090 Laptop GPU, 18.00", 4.2 kg
  External Review » Alienware m18 R1, RTX 4090

Acer Predator Helios 16 PH16-71-97H2: NVIDIA GeForce RTX 4070 Laptop GPU, 16.00", 2.7 kg
  External Review » Acer Predator Helios 16 PH16-71-97H2

SCHENKER XMG Neo 17 E23: NVIDIA GeForce RTX 4090 Laptop GPU, 17.30", 2.8 kg
  External Review » SCHENKER XMG Neo 17 E23

HP Omen Transcend 16-u0000: NVIDIA GeForce RTX 4070 Laptop GPU, 16.00", 2.2 kg
  External Review » HP Omen Transcend 16-u0000

Origin PC EON17-X 2023: NVIDIA GeForce RTX 4090 Laptop GPU, 17.30", 3.3 kg
  External Review » Origin PC EON17-X 2023

HP Omen Transcend 16: NVIDIA GeForce RTX 4070 Laptop GPU, 16.00", 2.3 kg
  External Review » HP Omen Transcend 16

HP Omen Transcend 16-u0095ng: NVIDIA GeForce RTX 4070 Laptop GPU, 16.00", 2.2 kg
  External Review » HP Omen Transcend 16-u0095ng

HP Omen 17-ck2940nz: NVIDIA GeForce RTX 4080 Laptop GPU, 17.30", 2.8 kg
  External Review » HP Omen 17-ck2940nz

Lenovo Legion Pro 7 16IRX8H, i9-13900HX RTX 4090: NVIDIA GeForce RTX 4090 Laptop GPU, 16.00", 2.8 kg
  External Review » Lenovo Legion Pro 7 16IRX8H, i9-13900HX RTX 4090

HP Omen 17-ck2004TX: NVIDIA GeForce RTX 4080 Laptop GPU, 17.30", 2.8 kg
  External Review » HP Omen 17-ck2004TX

Lenovo Legion Pro 5 16IRX8, i9-13900HX RTX 4070: NVIDIA GeForce RTX 4070 Laptop GPU, 16.00", 2.6 kg
  External Review » Lenovo Legion Pro 5 16IRX8, i9-13900HX RTX 4070

Acer Predator Triton 17X PTX17-71-99W5: NVIDIA GeForce RTX 4090 Laptop GPU, 17.00", 3 kg
  External Review » Acer Predator Triton 17X PTX17-71-99W5

Lenovo Legion Pro 7 16IRX8H, i9-13900HX RTX 4070: NVIDIA GeForce RTX 4070 Laptop GPU, 16.00", 2.5 kg
  External Review » Lenovo Legion Pro 7 16IRX8H, i9-13900HX RTX 4070

Acer Predator Helios 16 PH16-71: NVIDIA GeForce RTX 4070 Laptop GPU, 16.00", 2.7 kg
  External Review » Acer Predator Helios 16 PH16-71

SCHENKER XMG Focus 15 (E23): NVIDIA GeForce RTX 4050 Laptop GPU, 15.60", 2.4 kg
  External Review » Schenker XMG Focus 15 (E23)

HP Omen 17-ck2097ng: NVIDIA GeForce RTX 4080 Laptop GPU, 17.30", 2.8 kg
  External Review » HP Omen 17-ck2097ng

Medion Erazer Major X20: NVIDIA GeForce RTX 4070 Laptop GPU, 16.00", 2.4 kg
  External Review » Medion Erazer Major X20

Alienware m16 R1: NVIDIA GeForce RTX 4080 Laptop GPU, 16.00", 3.3 kg
  External Review » Alienware m16 R1

Aorus 17X AZF: NVIDIA GeForce RTX 4090 Laptop GPU, 17.30", 2.9 kg
  External Review » Aorus 17X AZF

Lenovo Legion Pro 7 16IRX8H: NVIDIA GeForce RTX 4080 Laptop GPU, 16.00", 2.7 kg
  External Review » Lenovo Legion Pro 7 16IRX8H

Acer Predator Helios 16 2023 PH16-71-9705: NVIDIA GeForce RTX 4080 Laptop GPU, 16.00", 2.7 kg
  External Review » Acer Predator Helios 16 2023 PH16-71-9705

Acer Predator Helios 18 2023 PH18-71-91U5: NVIDIA GeForce RTX 4080 Laptop GPU, 18.00", 3.3 kg
  External Review » Acer Predator Helios 18 2023 PH18-71-91U5

SCHENKER XMG Neo 16 E23: NVIDIA GeForce RTX 4090 Laptop GPU, 16.00", 2.5 kg
  External Review » Schenker XMG Neo 16 E23

Medion Erazer Beast X40: NVIDIA GeForce RTX 4090 Laptop GPU, 17.00", 2.9 kg
  External Review » Medion Erazer Beast X40

HP Omen Transcend 16: NVIDIA GeForce RTX 4070 Laptop GPU, 16.00", 2.3 kg
   » 惠普 "奥门 "创见 16 是该系列的三进一退之作

Please share our article, every link counts!

»移动处理器 对比
所有移动处理器的对比


»移动处理器 基准测试
所有已有笔记本电脑中使用的处理器的基准测试成绩 (桌面处理器或移动处理器)

Other CPUs of the series Raptor Lake-HX

» Intel Core i9-14900HX
   24x 1.6 GHz - 5.8 GHz
» Intel Core i9-13980HX
   24x 1.6 GHz - 5.6 GHz
» Intel Core i9-13950HX
   24x 1.6 GHz - 5.5 GHz
» Intel Core i9-13900HX
   24x 1.6 GHz - 5.4 GHz
» Intel Core i7-14700HX
   20x 3.9 GHz - 5.5 GHz
» Intel Core i7-13850HX
   20x 1.5 GHz - 5.3 GHz
» Intel Core i7-14650HX
   16x 1.6 GHz - 5.2 GHz
» Intel Core i7-13700HX
   16x 1.5 GHz - 5 GHz
» Intel Core i5-14500HX
   14x 1.8 GHz - 5 GHz
» Intel Core i7-13650HX
   14x 1.9 GHz - 4.9 GHz
» Intel Core i5-13600HX
   14x 1.9 GHz - 4.8 GHz
» Intel Core i5-13500HX
   14x 1.8 GHz - 4.7 GHz
» Intel Core i5-14450HX
   10x 1.8 GHz - 4.8 GHz
» Intel Core i5-13450HX
   10x 1.8 GHz - 4.6 GHz

Surrounding CPUs

+ AMD Ryzen 9 7945HX3D
   16x 2.3 GHz - 5.4 GHz
+ AMD Ryzen 9 7945HX
   16x 2.5 GHz - 5.4 GHz
+ Intel Core i9-14900HX
   24x 1.6 GHz - 5.8 GHz
+ Intel Core i9-13980HX
   24x 1.6 GHz - 5.6 GHz
+ Intel Core i9-13950HX
   24x 1.6 GHz - 5.5 GHz
» Intel Core i9-13900HX
   24x 1.6 GHz - 5.4 GHz
- AMD Ryzen 9 7940HX
   16x 2.4 GHz - 5.2 GHz
- AMD Ryzen 9 7845HX
   12x 3 GHz - 5.2 GHz
- Intel Core i7-14700HX
   20x 3.9 GHz - 5.5 GHz
- AMD Ryzen 9 7840HX
   12x 2.9 GHz - 5.1 GHz
- Intel Core i7-13850HX
   20x 1.5 GHz - 5.3 GHz
> Notebookcheck中文版(NBC中国) > FAQ / 小提示/ 技术参数 > 移动处理器 —— 基准测试成绩列表 > Intel Raptor Lake-HX i9-13900HX 笔记本处理器
Klaus Hinum (Update: 2023-11-26)