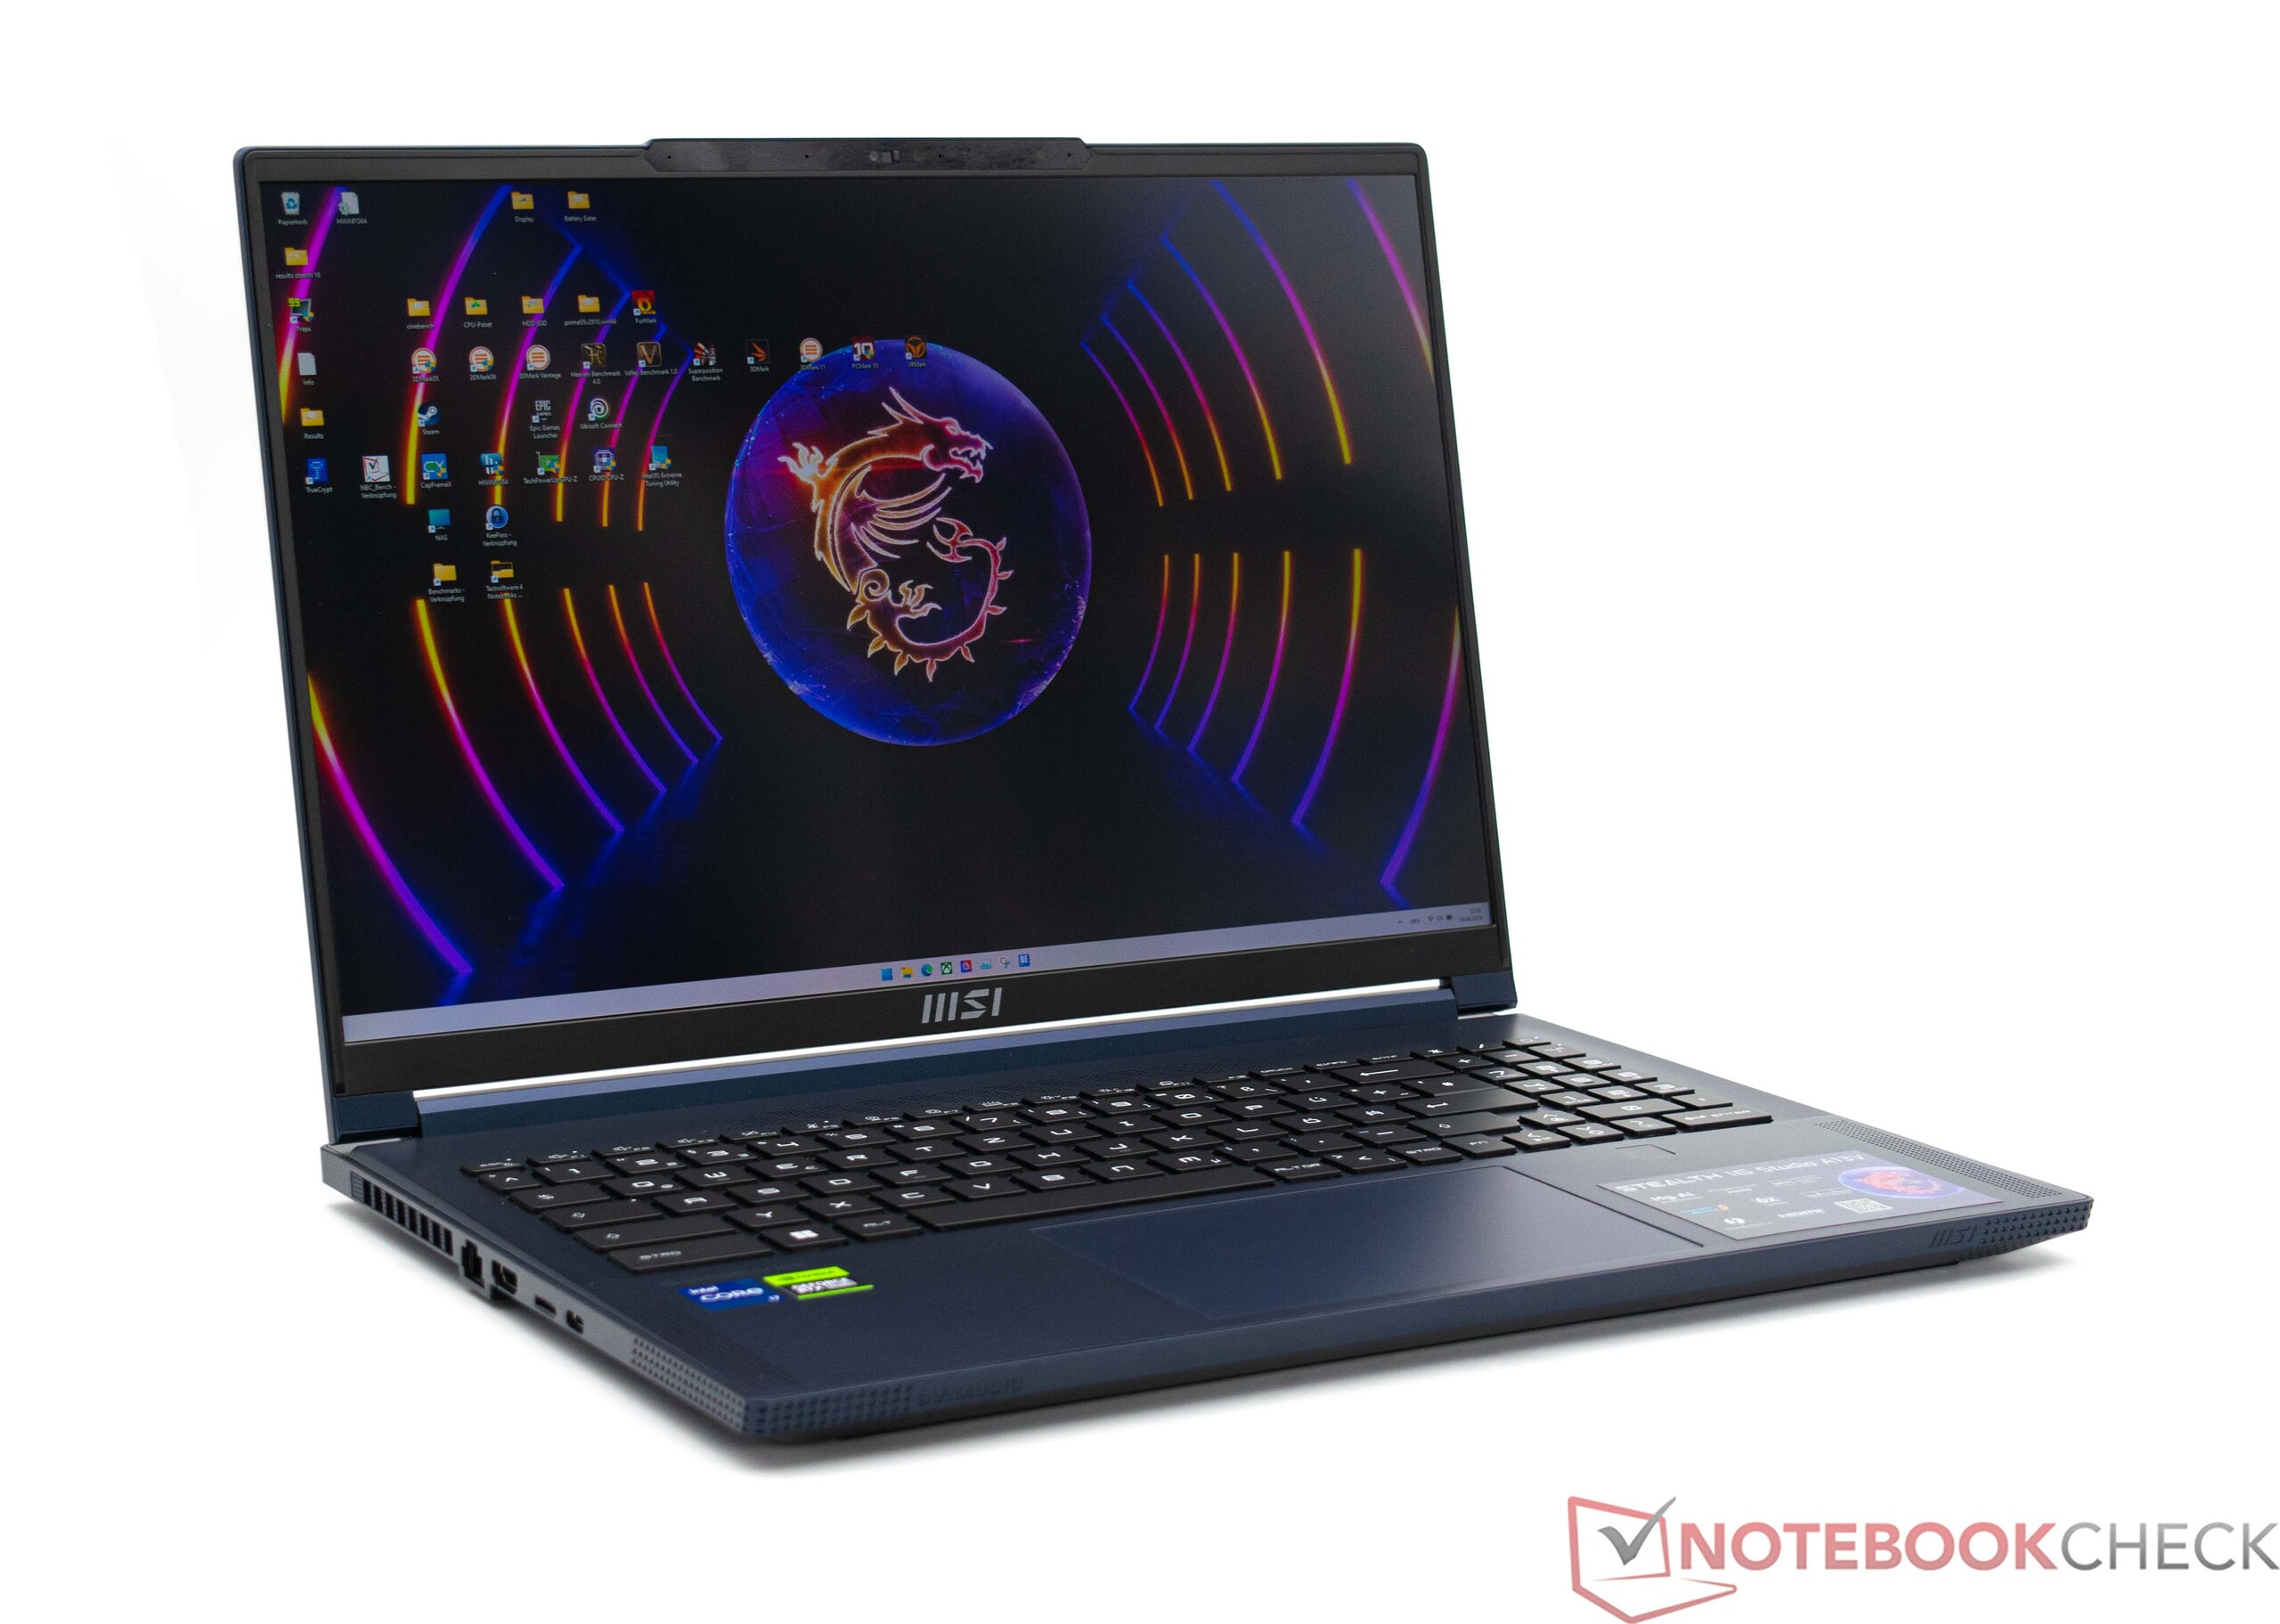
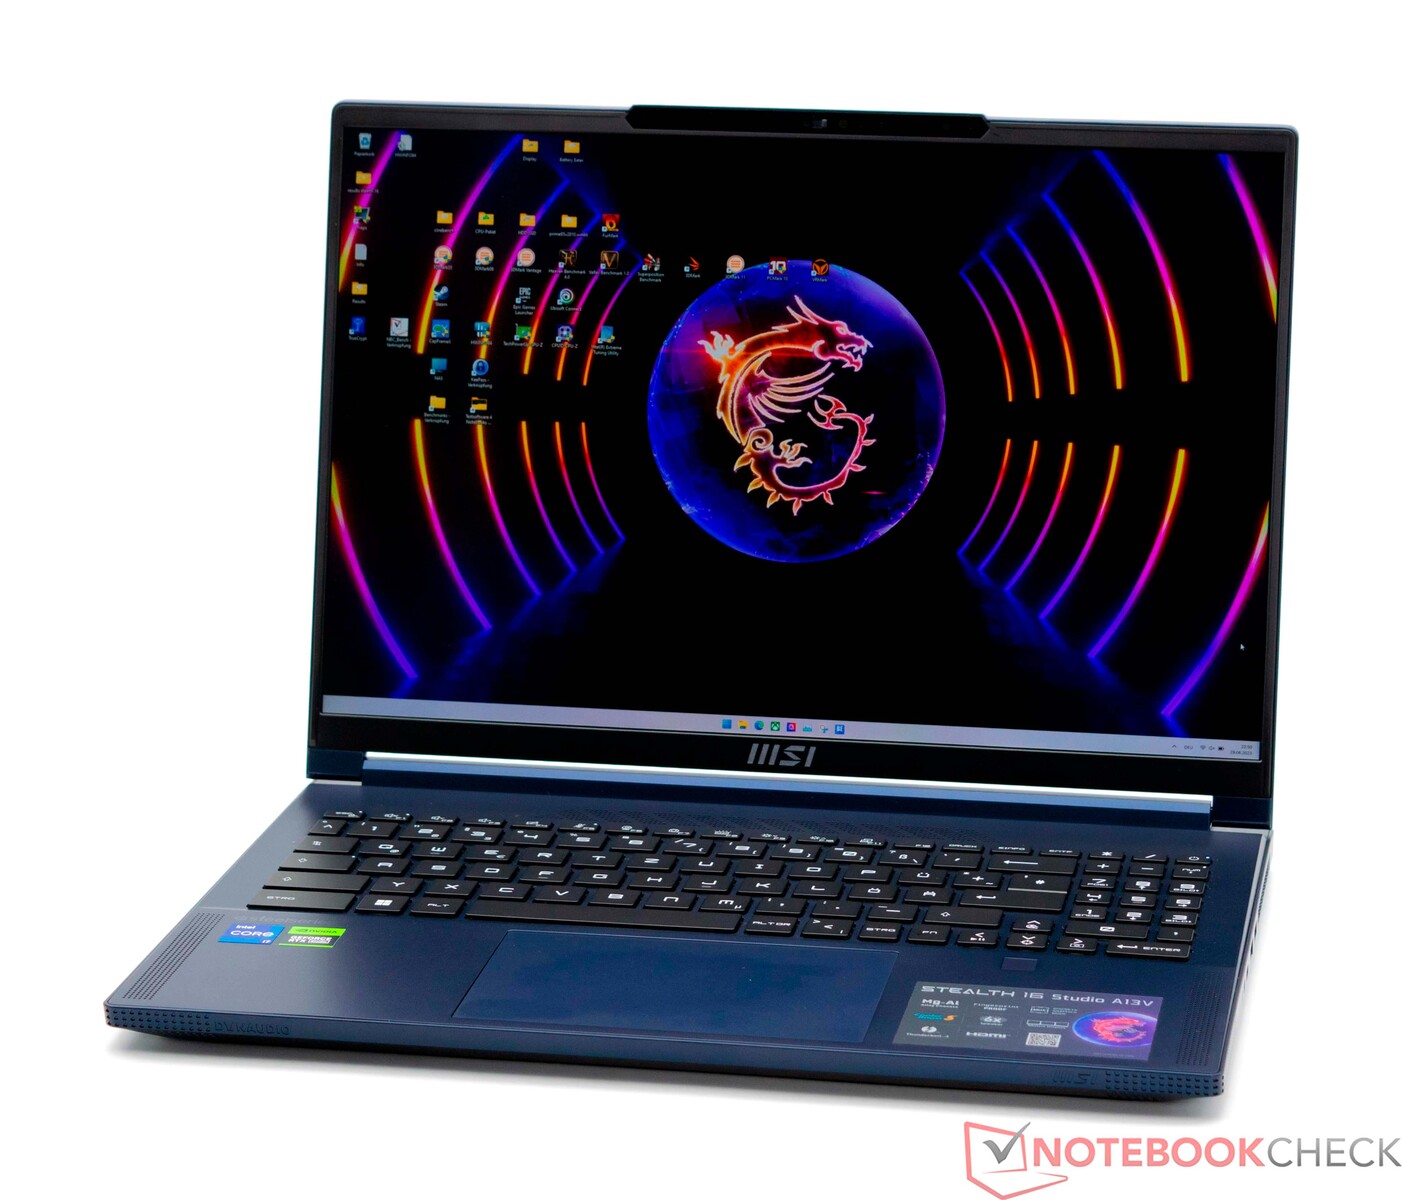
微星Stealth 16 Studio笔记本电脑回顾:为游戏玩家和创作者提供的极轻、16英寸、Core i7、RTX 4070设备
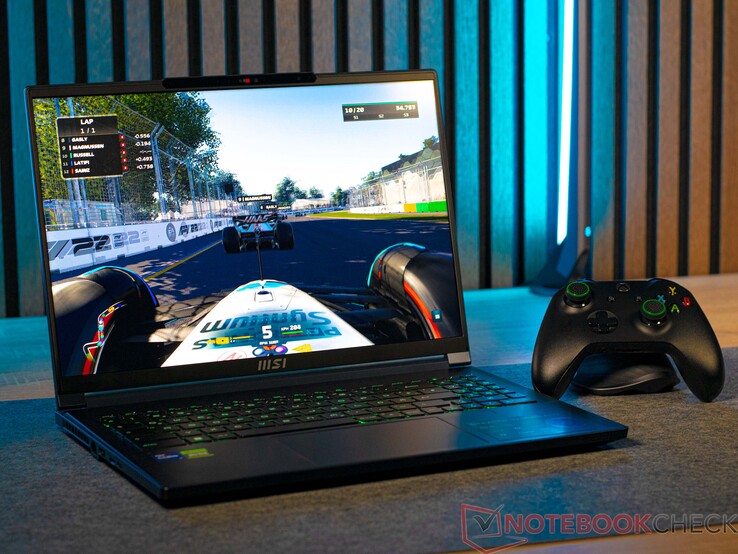
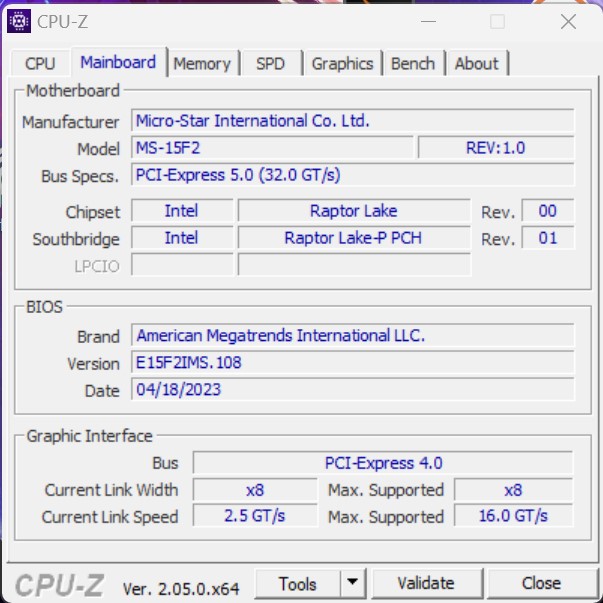
新的微星Stealth 16 Studio A13VG是基于一个 英特尔猛禽湖H处理器和一个当前的Nvidia移动GPU。在细节方面,我们的审查设备有一个英特尔酷睿i7-13700H与一个NvidiaGeForce RTX 4070笔记本GPU.然而,从视觉上看,微星Stealth 16 Studio A13VG非常低调,并设法在强大的商务笔记本电脑和游戏笔记本电脑之间踩出一条线。基本上,我们也认为这个设备为创作者形成了一个很好的基础,他们可以看到自己利用微星Stealth 16 Studio A13VG的优势,因为其强大的组件和良好的便携性。
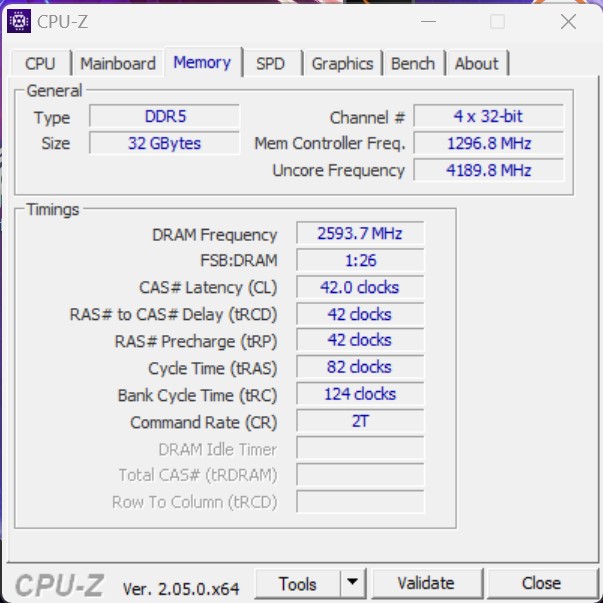
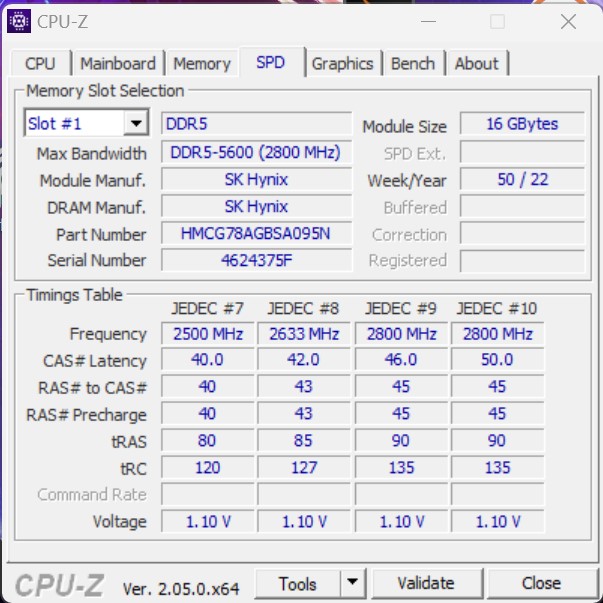
然而,从价格上看,微星Stealth 16 Studio A13VG发现自己处于高端领域。但是,除了已经提到的组件外,还有32GB的DDR5内存和2TB的SSD存储。同样,我们也不应该忘记16英寸的QHD+显示屏。凭借其240赫兹的刷新率,它的目标直指游戏界。
在这次审查中,微星Stealth 16 Studio A13VG将不得不证明自己与当前16英寸笔记本电脑相比。更多细节见下表。
潜在的竞争对手比较
Rating | Date | Model | Weight | Height | Size | Resolution | Price |
|---|---|---|---|---|---|---|---|
| 88.8 % v7 (old) | 07 / 2023 | MSI Stealth 16 Studio A13VG i7-13700H, GeForce RTX 4070 Laptop GPU | 2 kg | 19.95 mm | 16.00" | 2560x1600 | |
| 89.7 % v7 (old) | 06 / 2023 | Asus ROG Flow X16 GV601V i9-13900H, GeForce RTX 4060 Laptop GPU | 2.1 kg | 19.4 mm | 16.00" | 2560x1600 | |
| 89 % v7 (old) | 04 / 2023 | Medion Erazer Major X20 i9-13900HX, GeForce RTX 4070 Laptop GPU | 2.4 kg | 29 mm | 16.00" | 2560x1600 | |
| 88.1 % v7 (old) | 06 / 2023 | Acer Nitro 16 AN16-41 R7 7735HS, GeForce RTX 4070 Laptop GPU | 2.7 kg | 27.9 mm | 16.00" | 2560x1600 | |
| 86.6 % v7 (old) | 12 / 2022 | Corsair Voyager a1600 R9 6900HS, Radeon RX 6800M | 2.4 kg | 19.9 mm | 16.00" | 2560x1600 | |
| 86.2 % v7 (old) | 03 / 2023 | Gigabyte AERO 16 OLED BSF i9-13900H, GeForce RTX 4070 Laptop GPU | 2.1 kg | 18 mm | 16.00" | 3840x2400 |
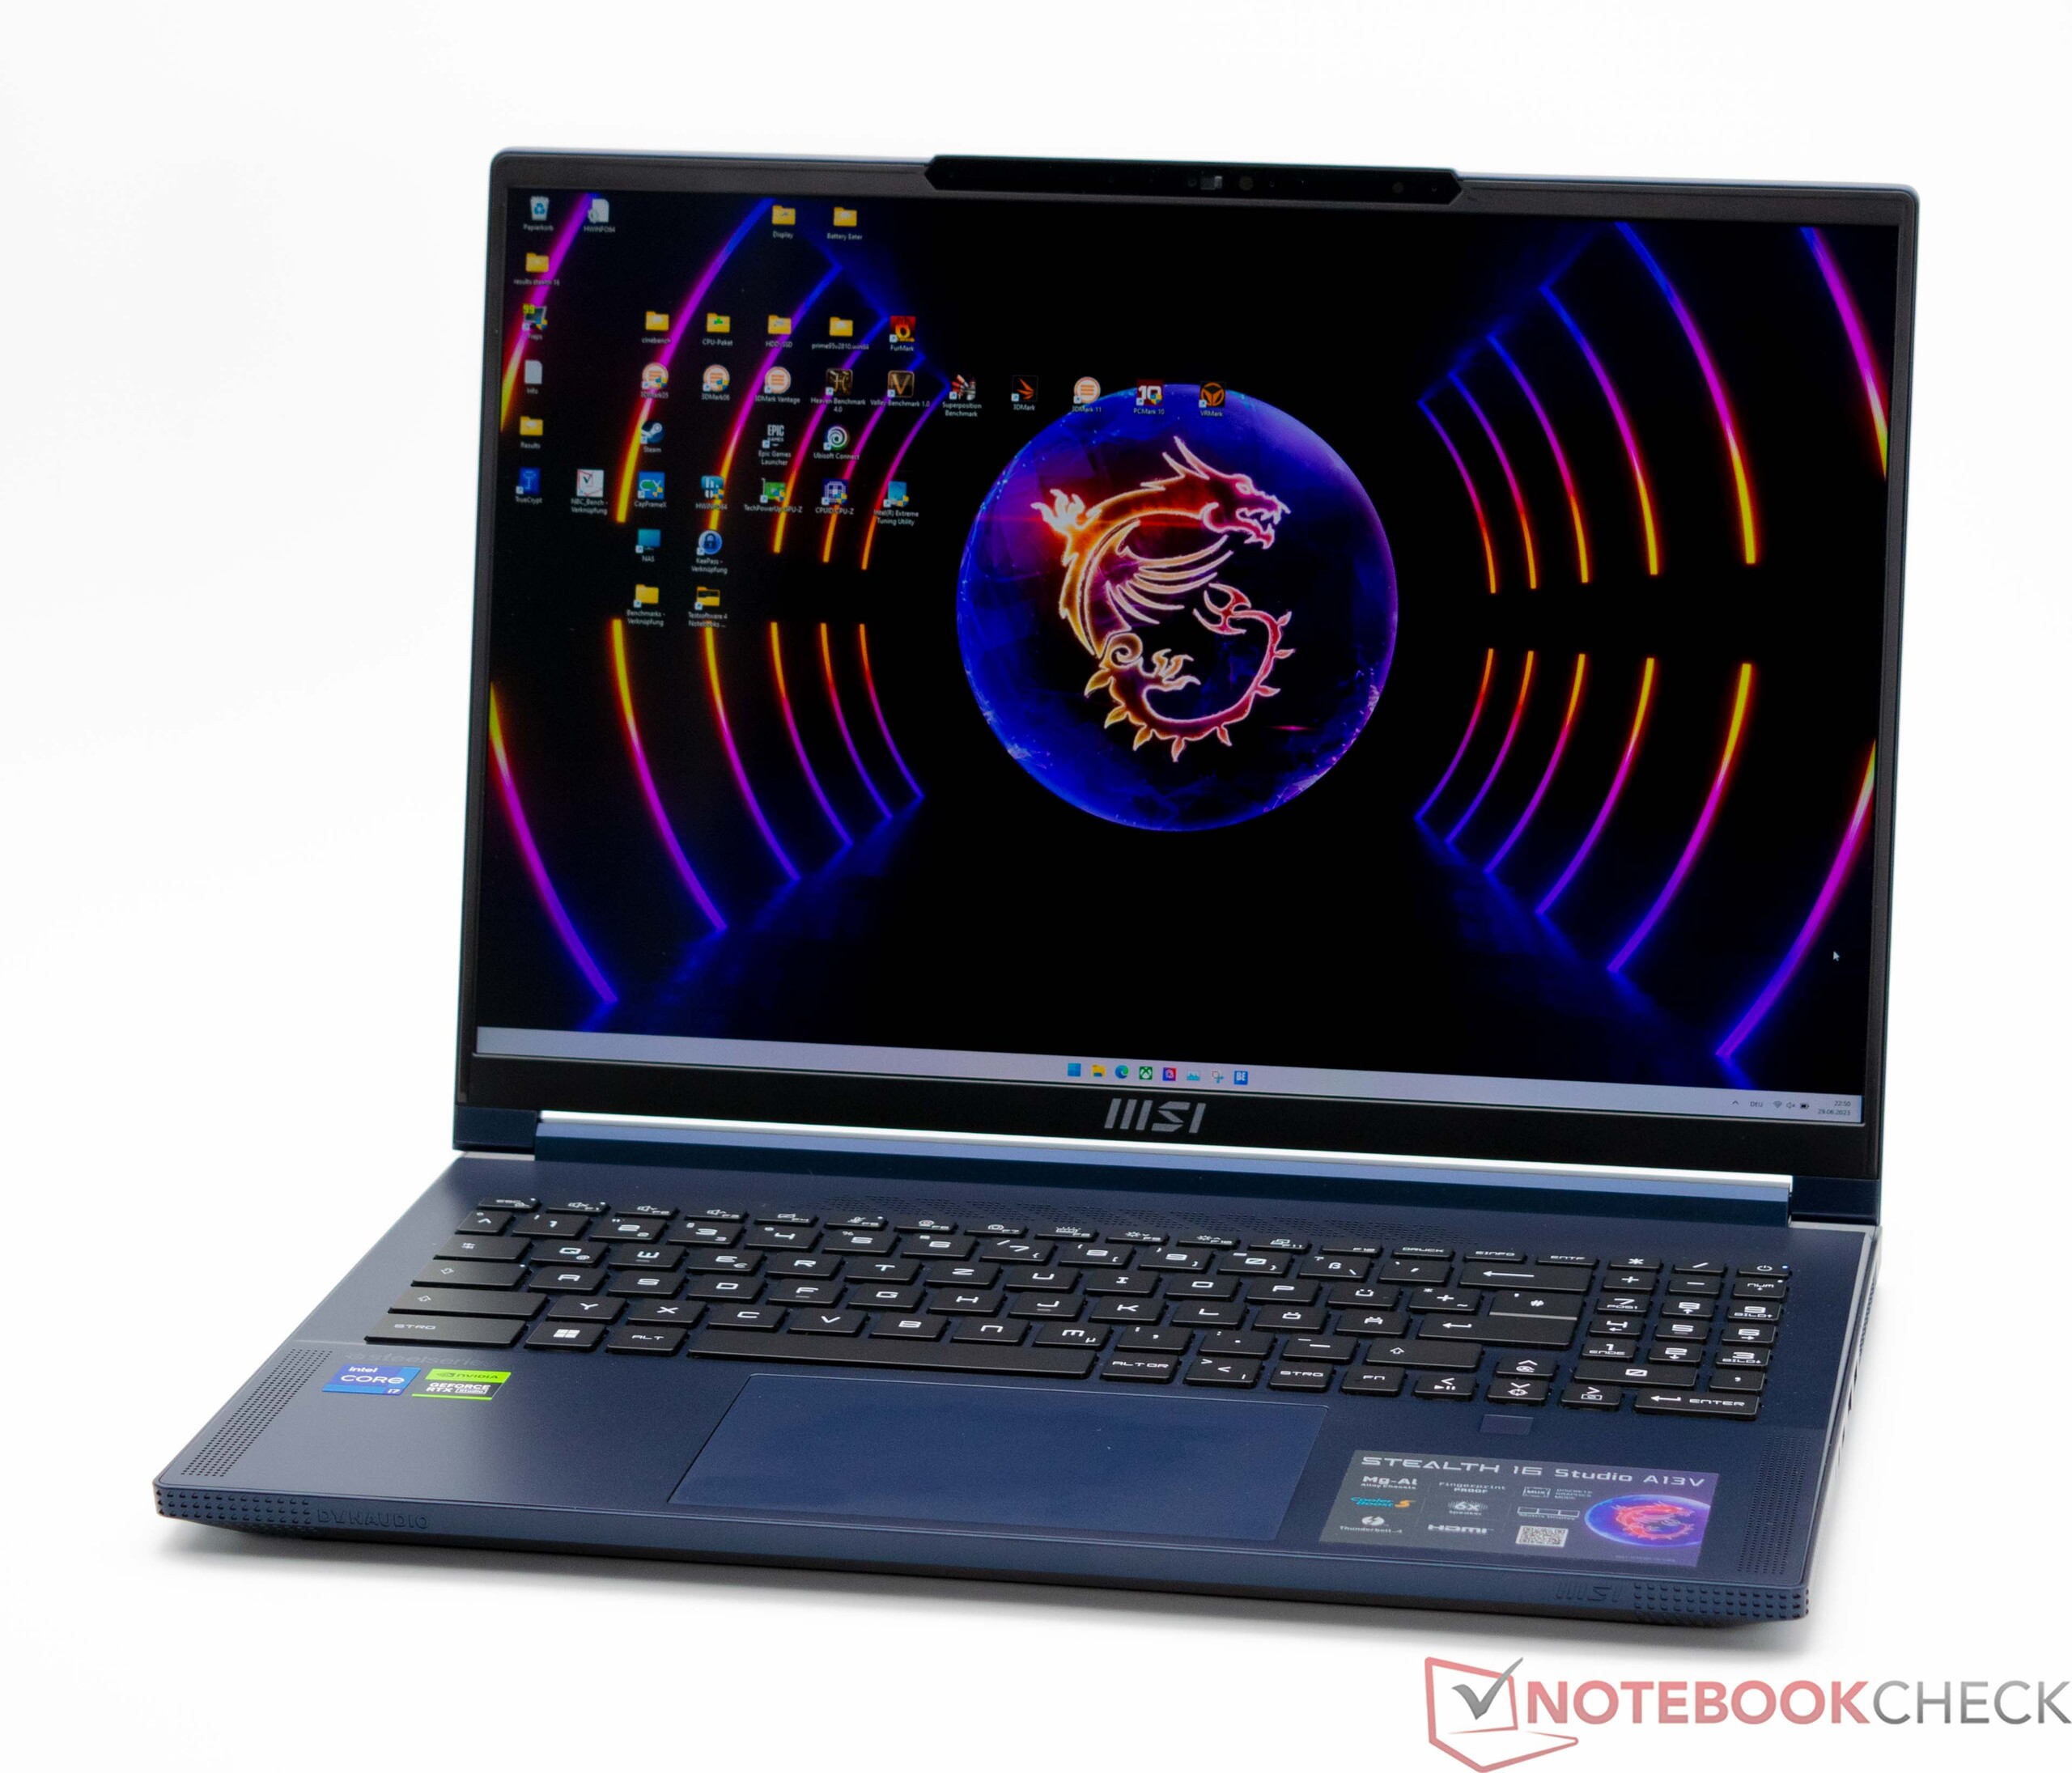
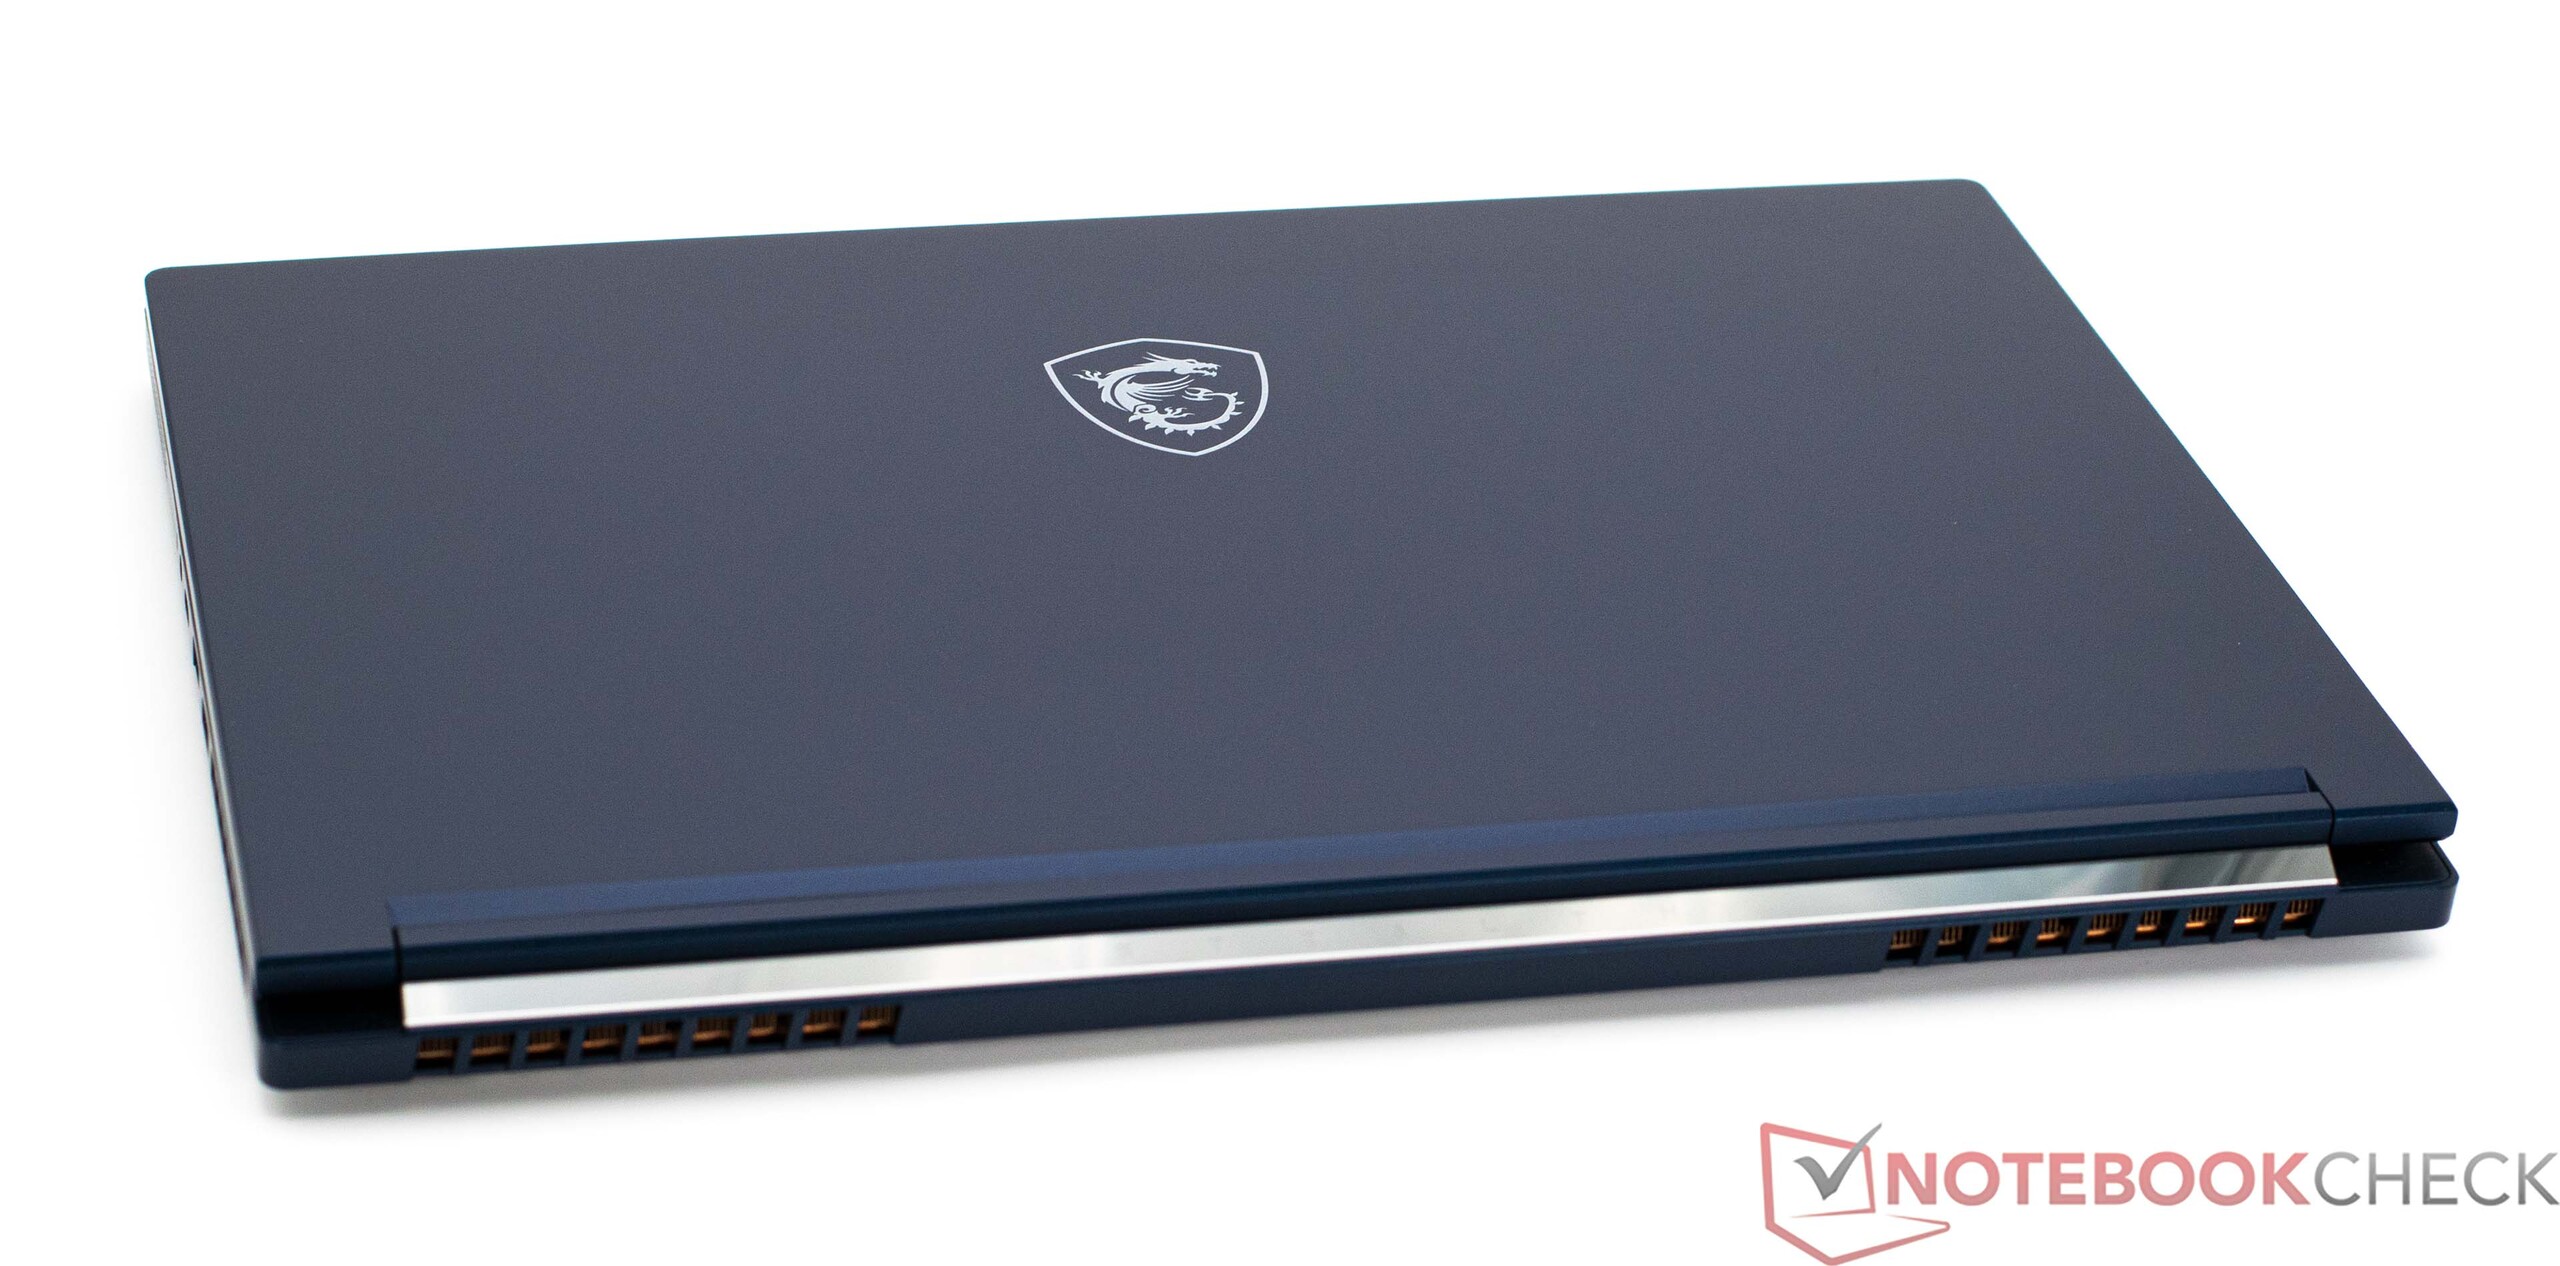
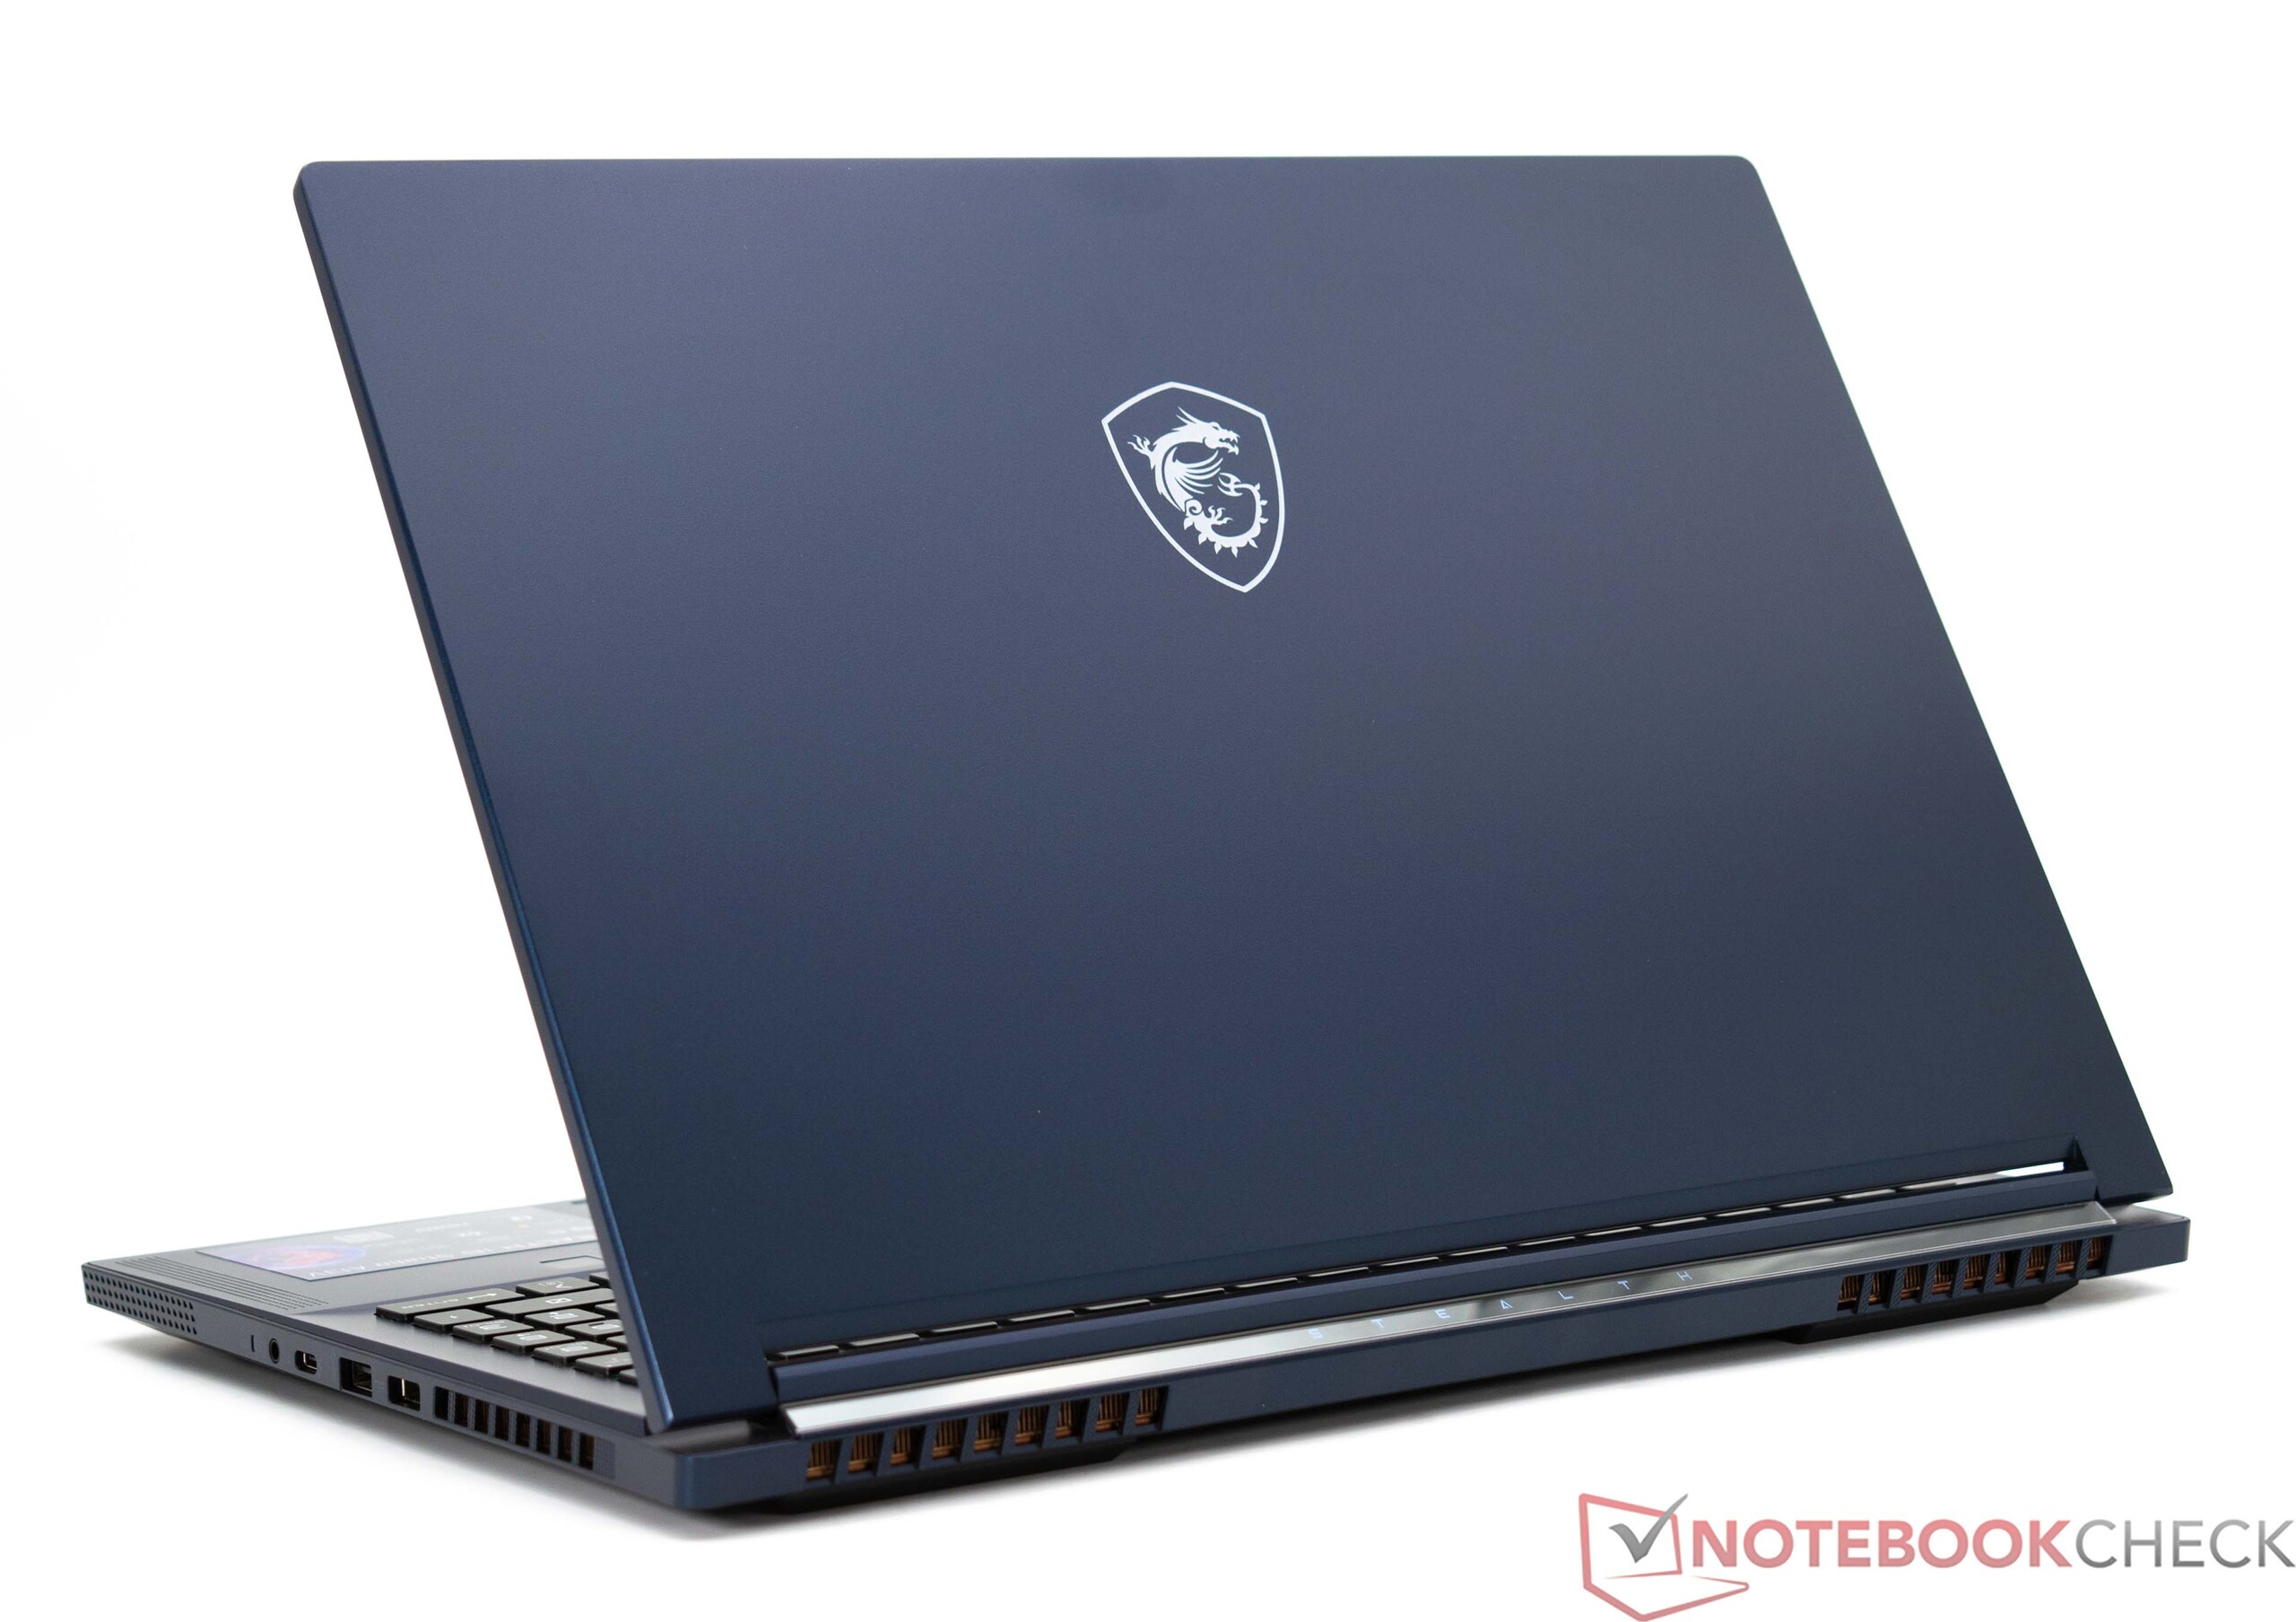
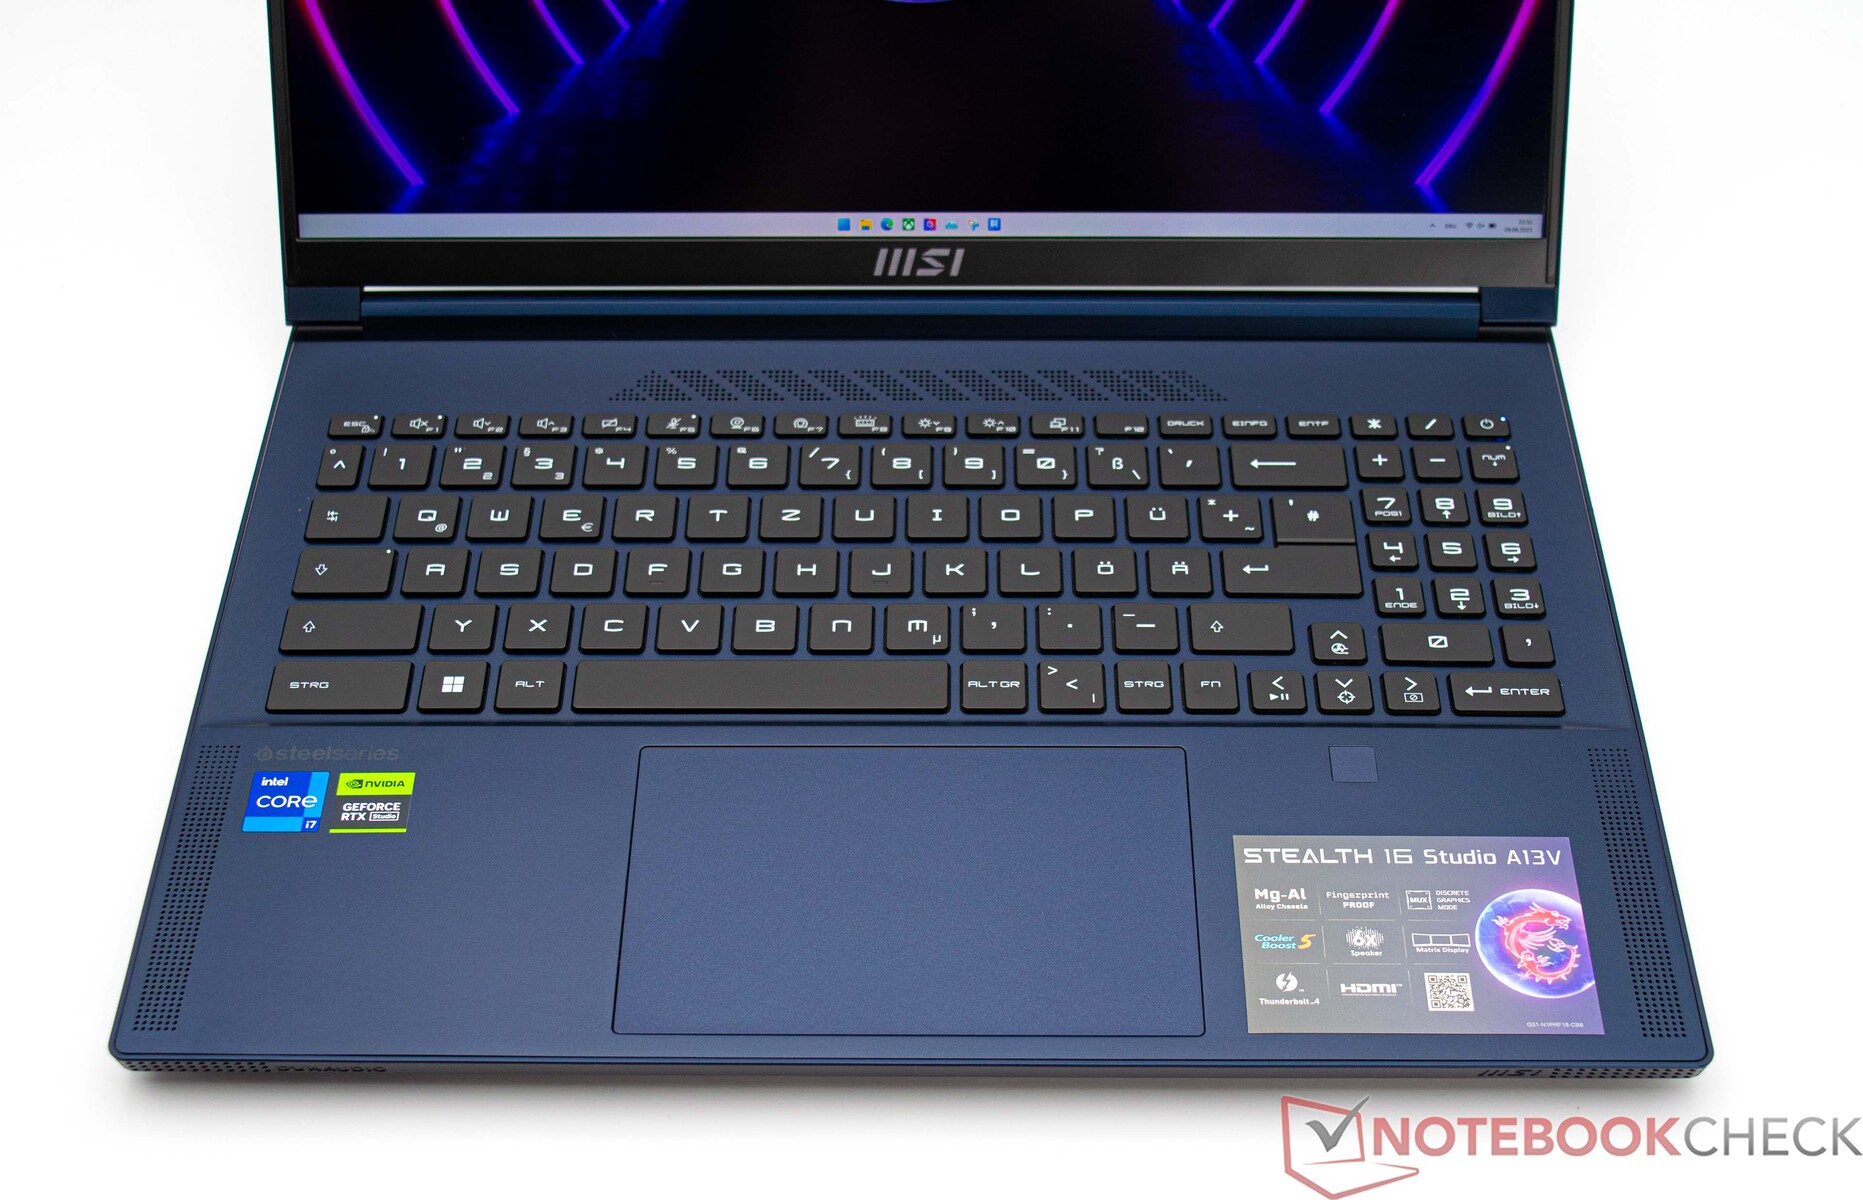
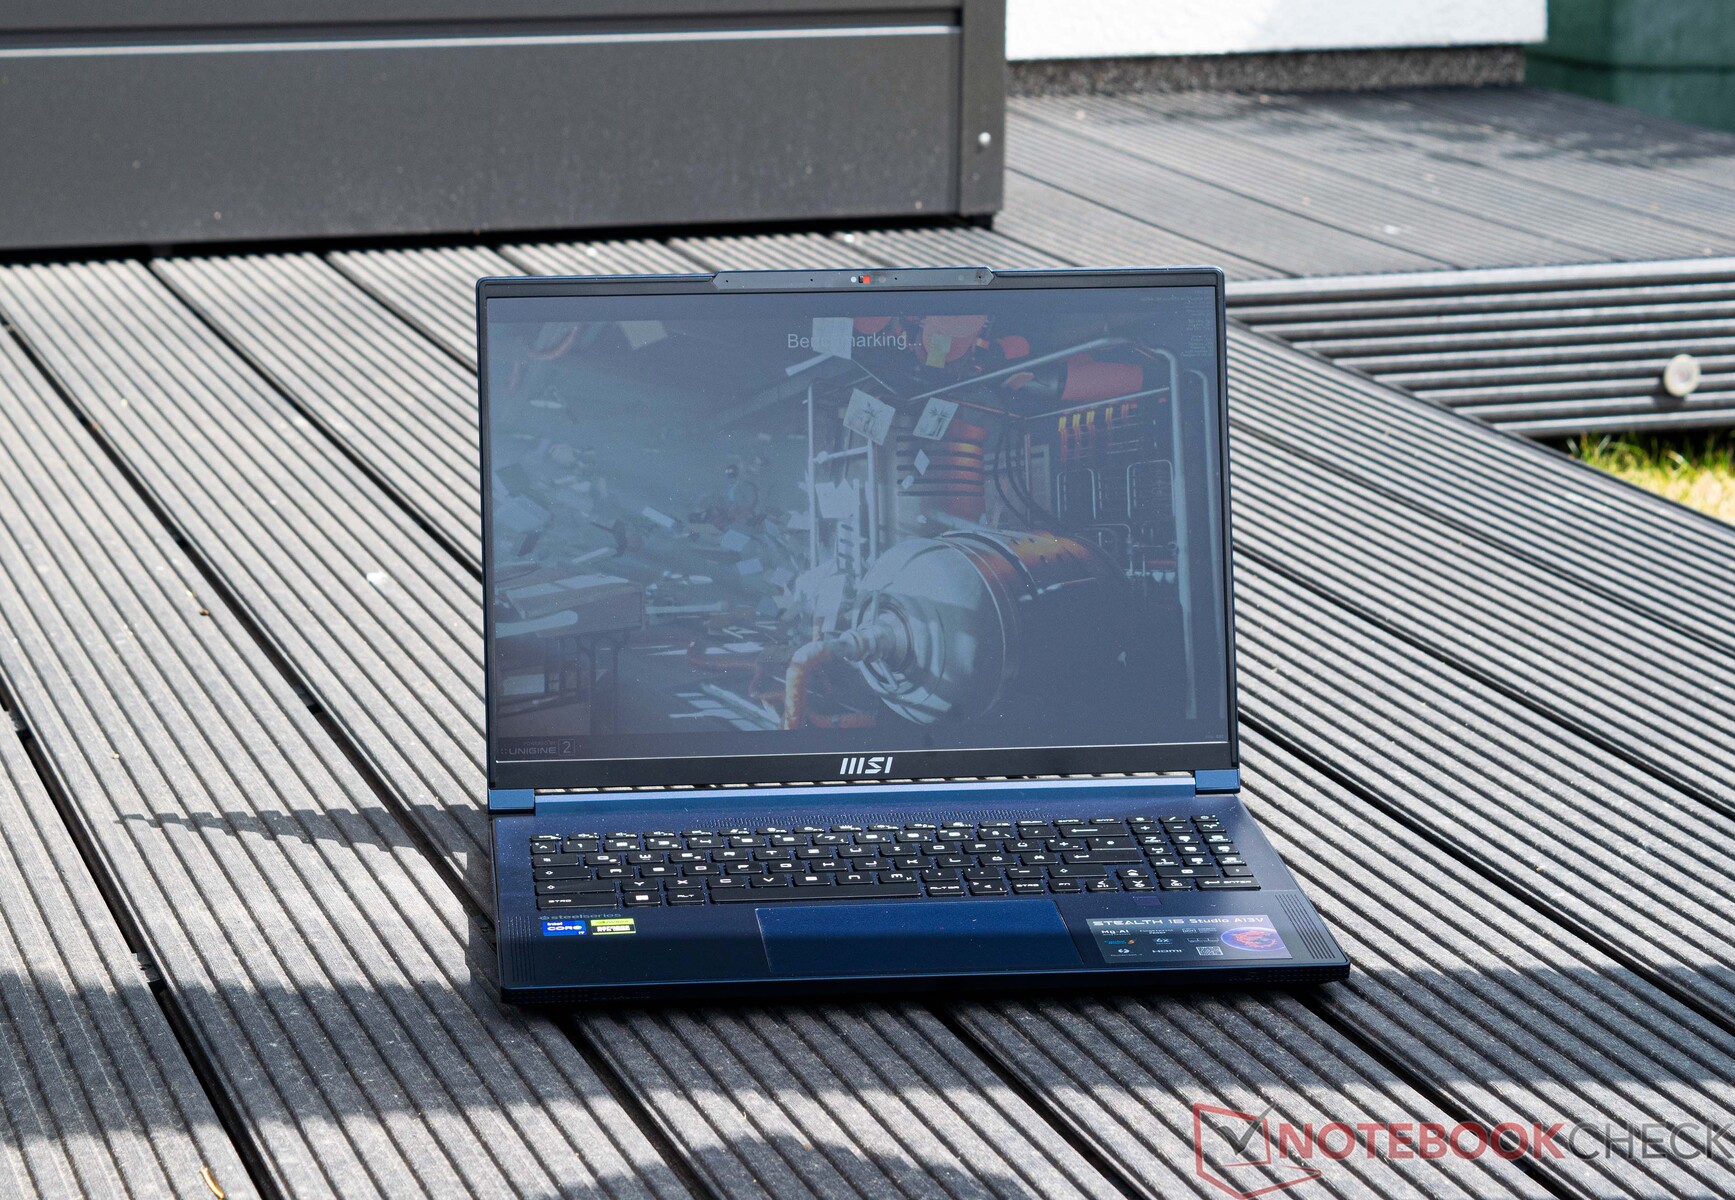
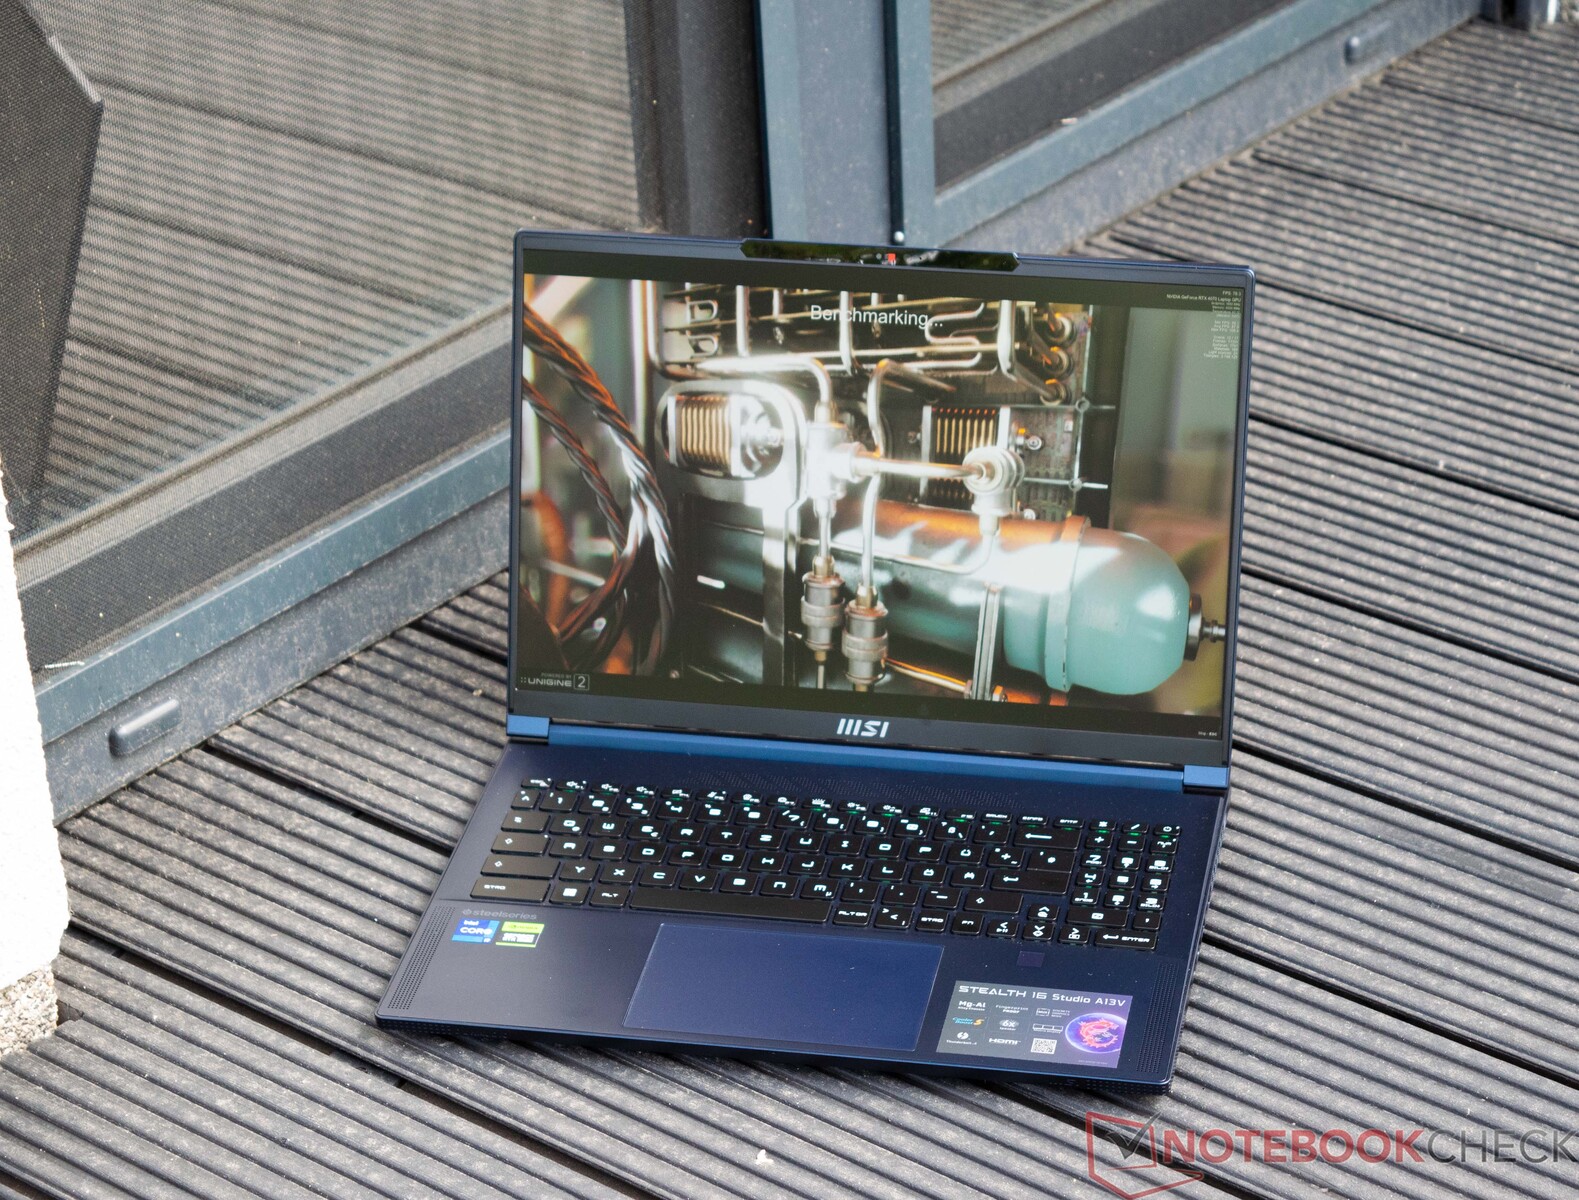
外壳 - 铝和镁提供坚固性
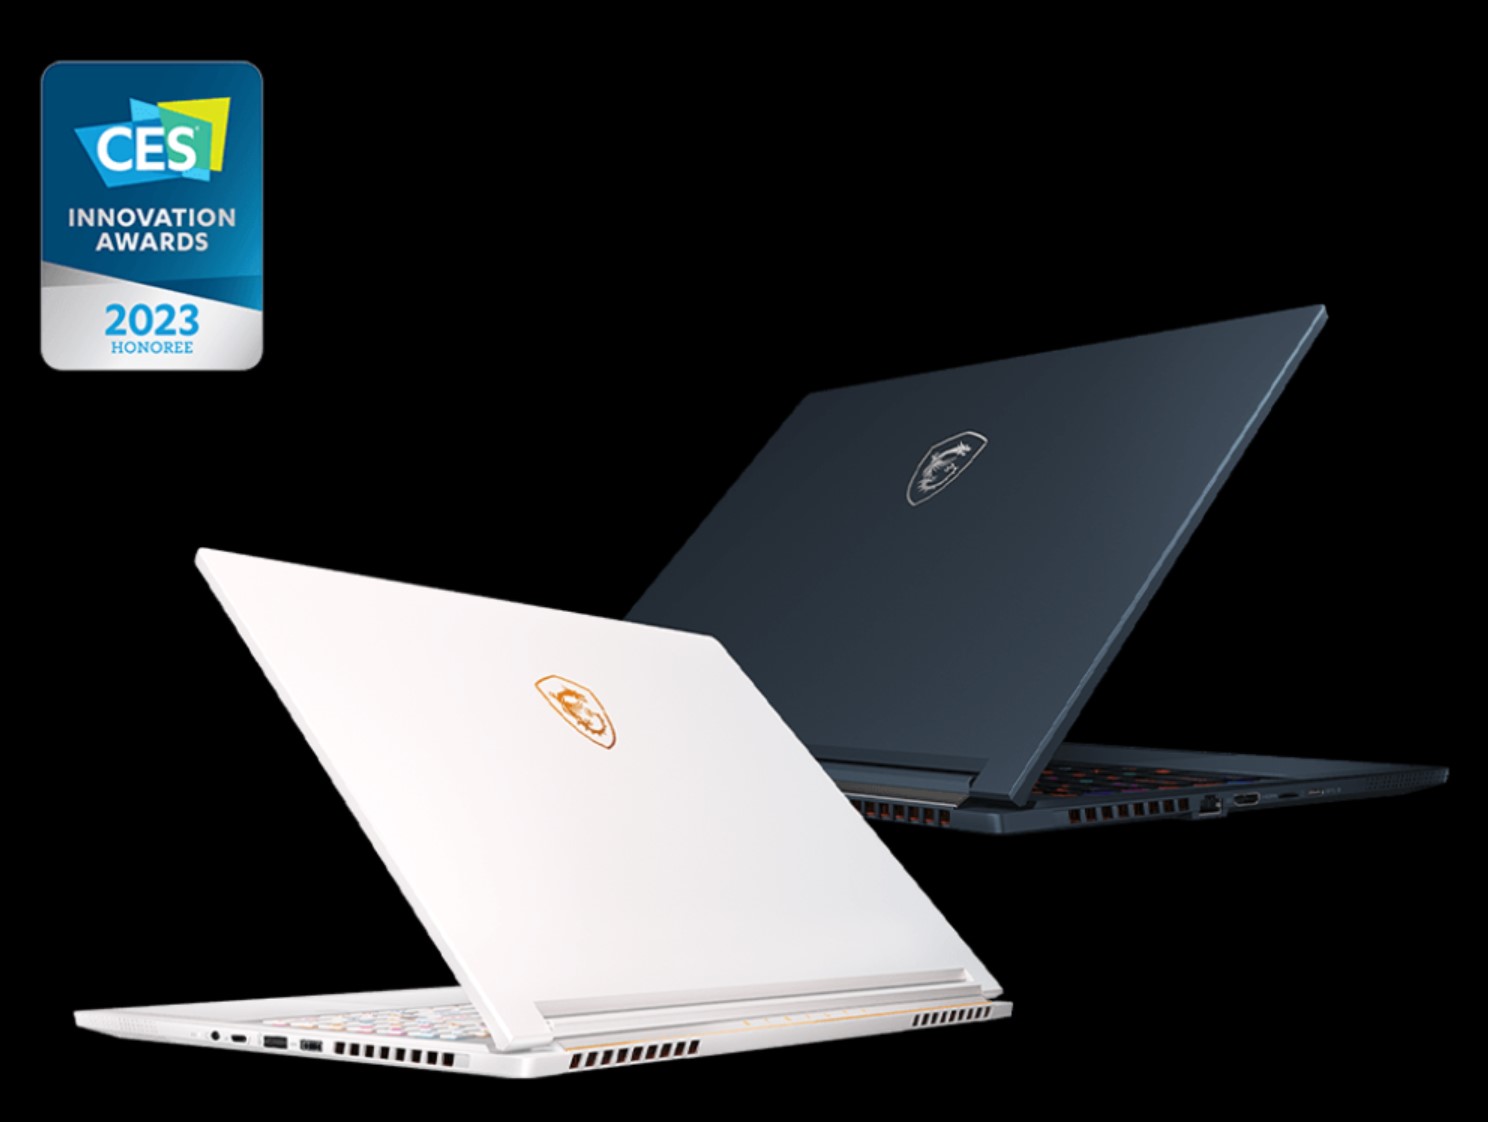
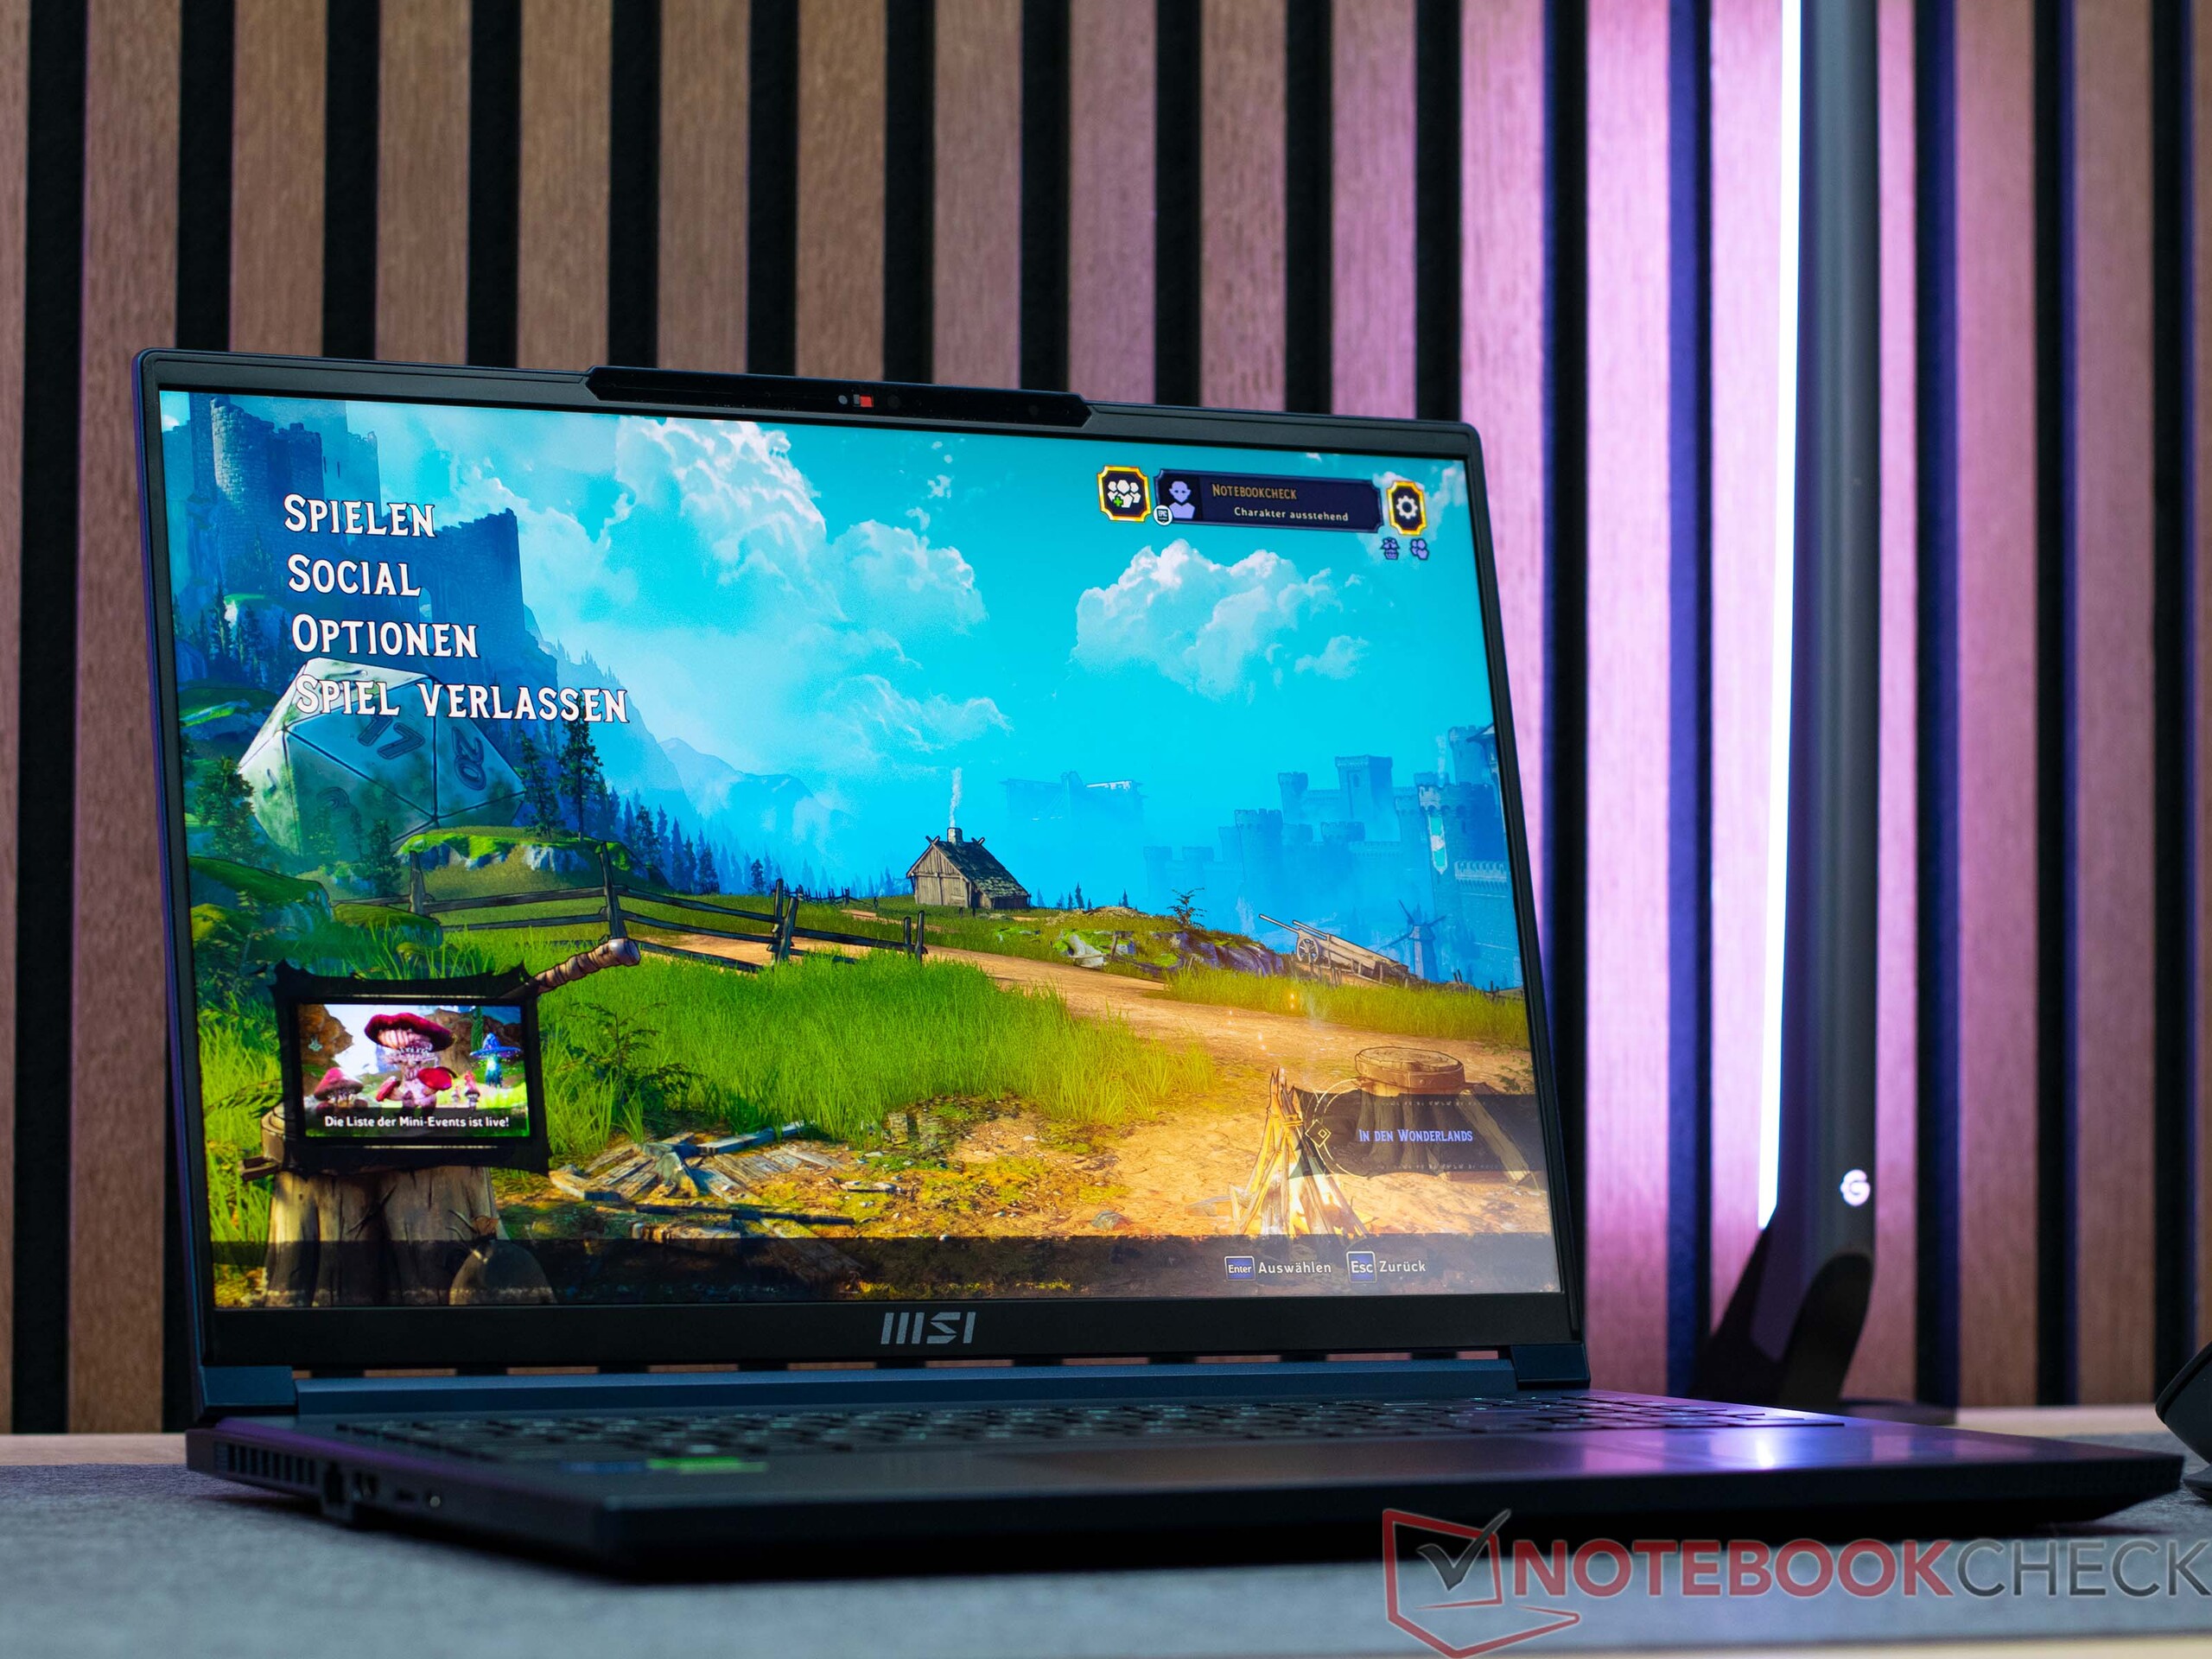
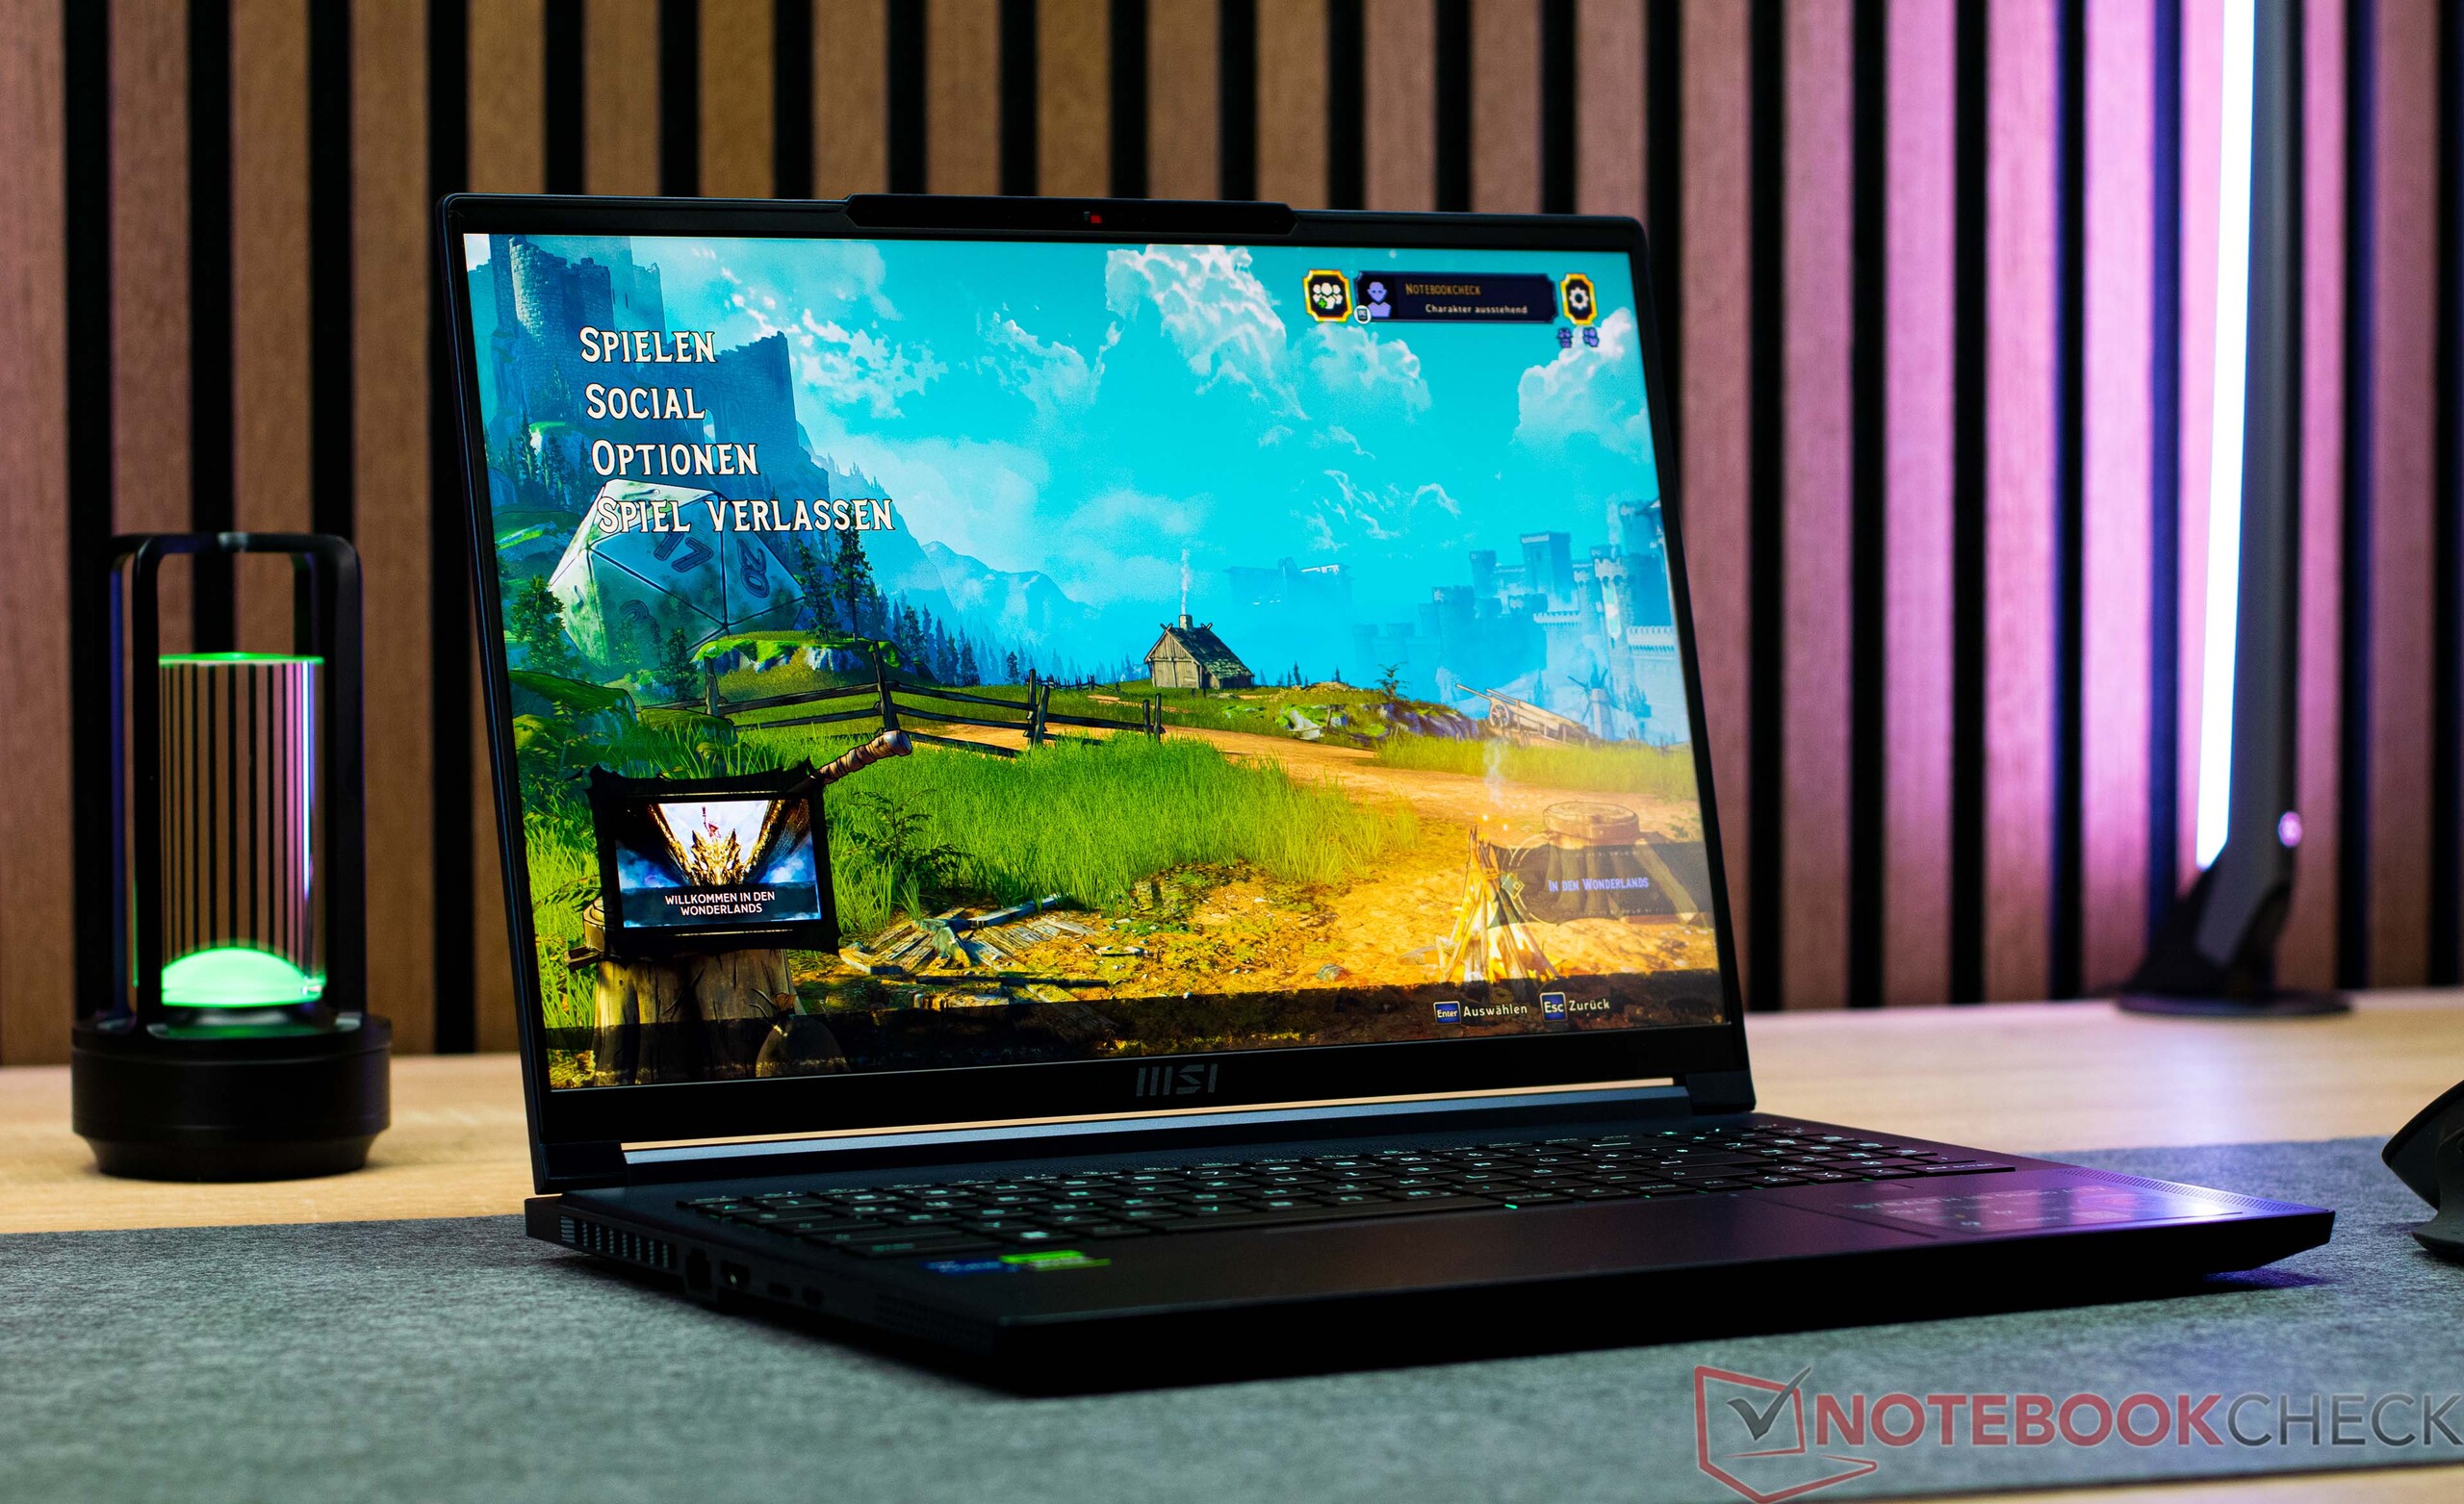
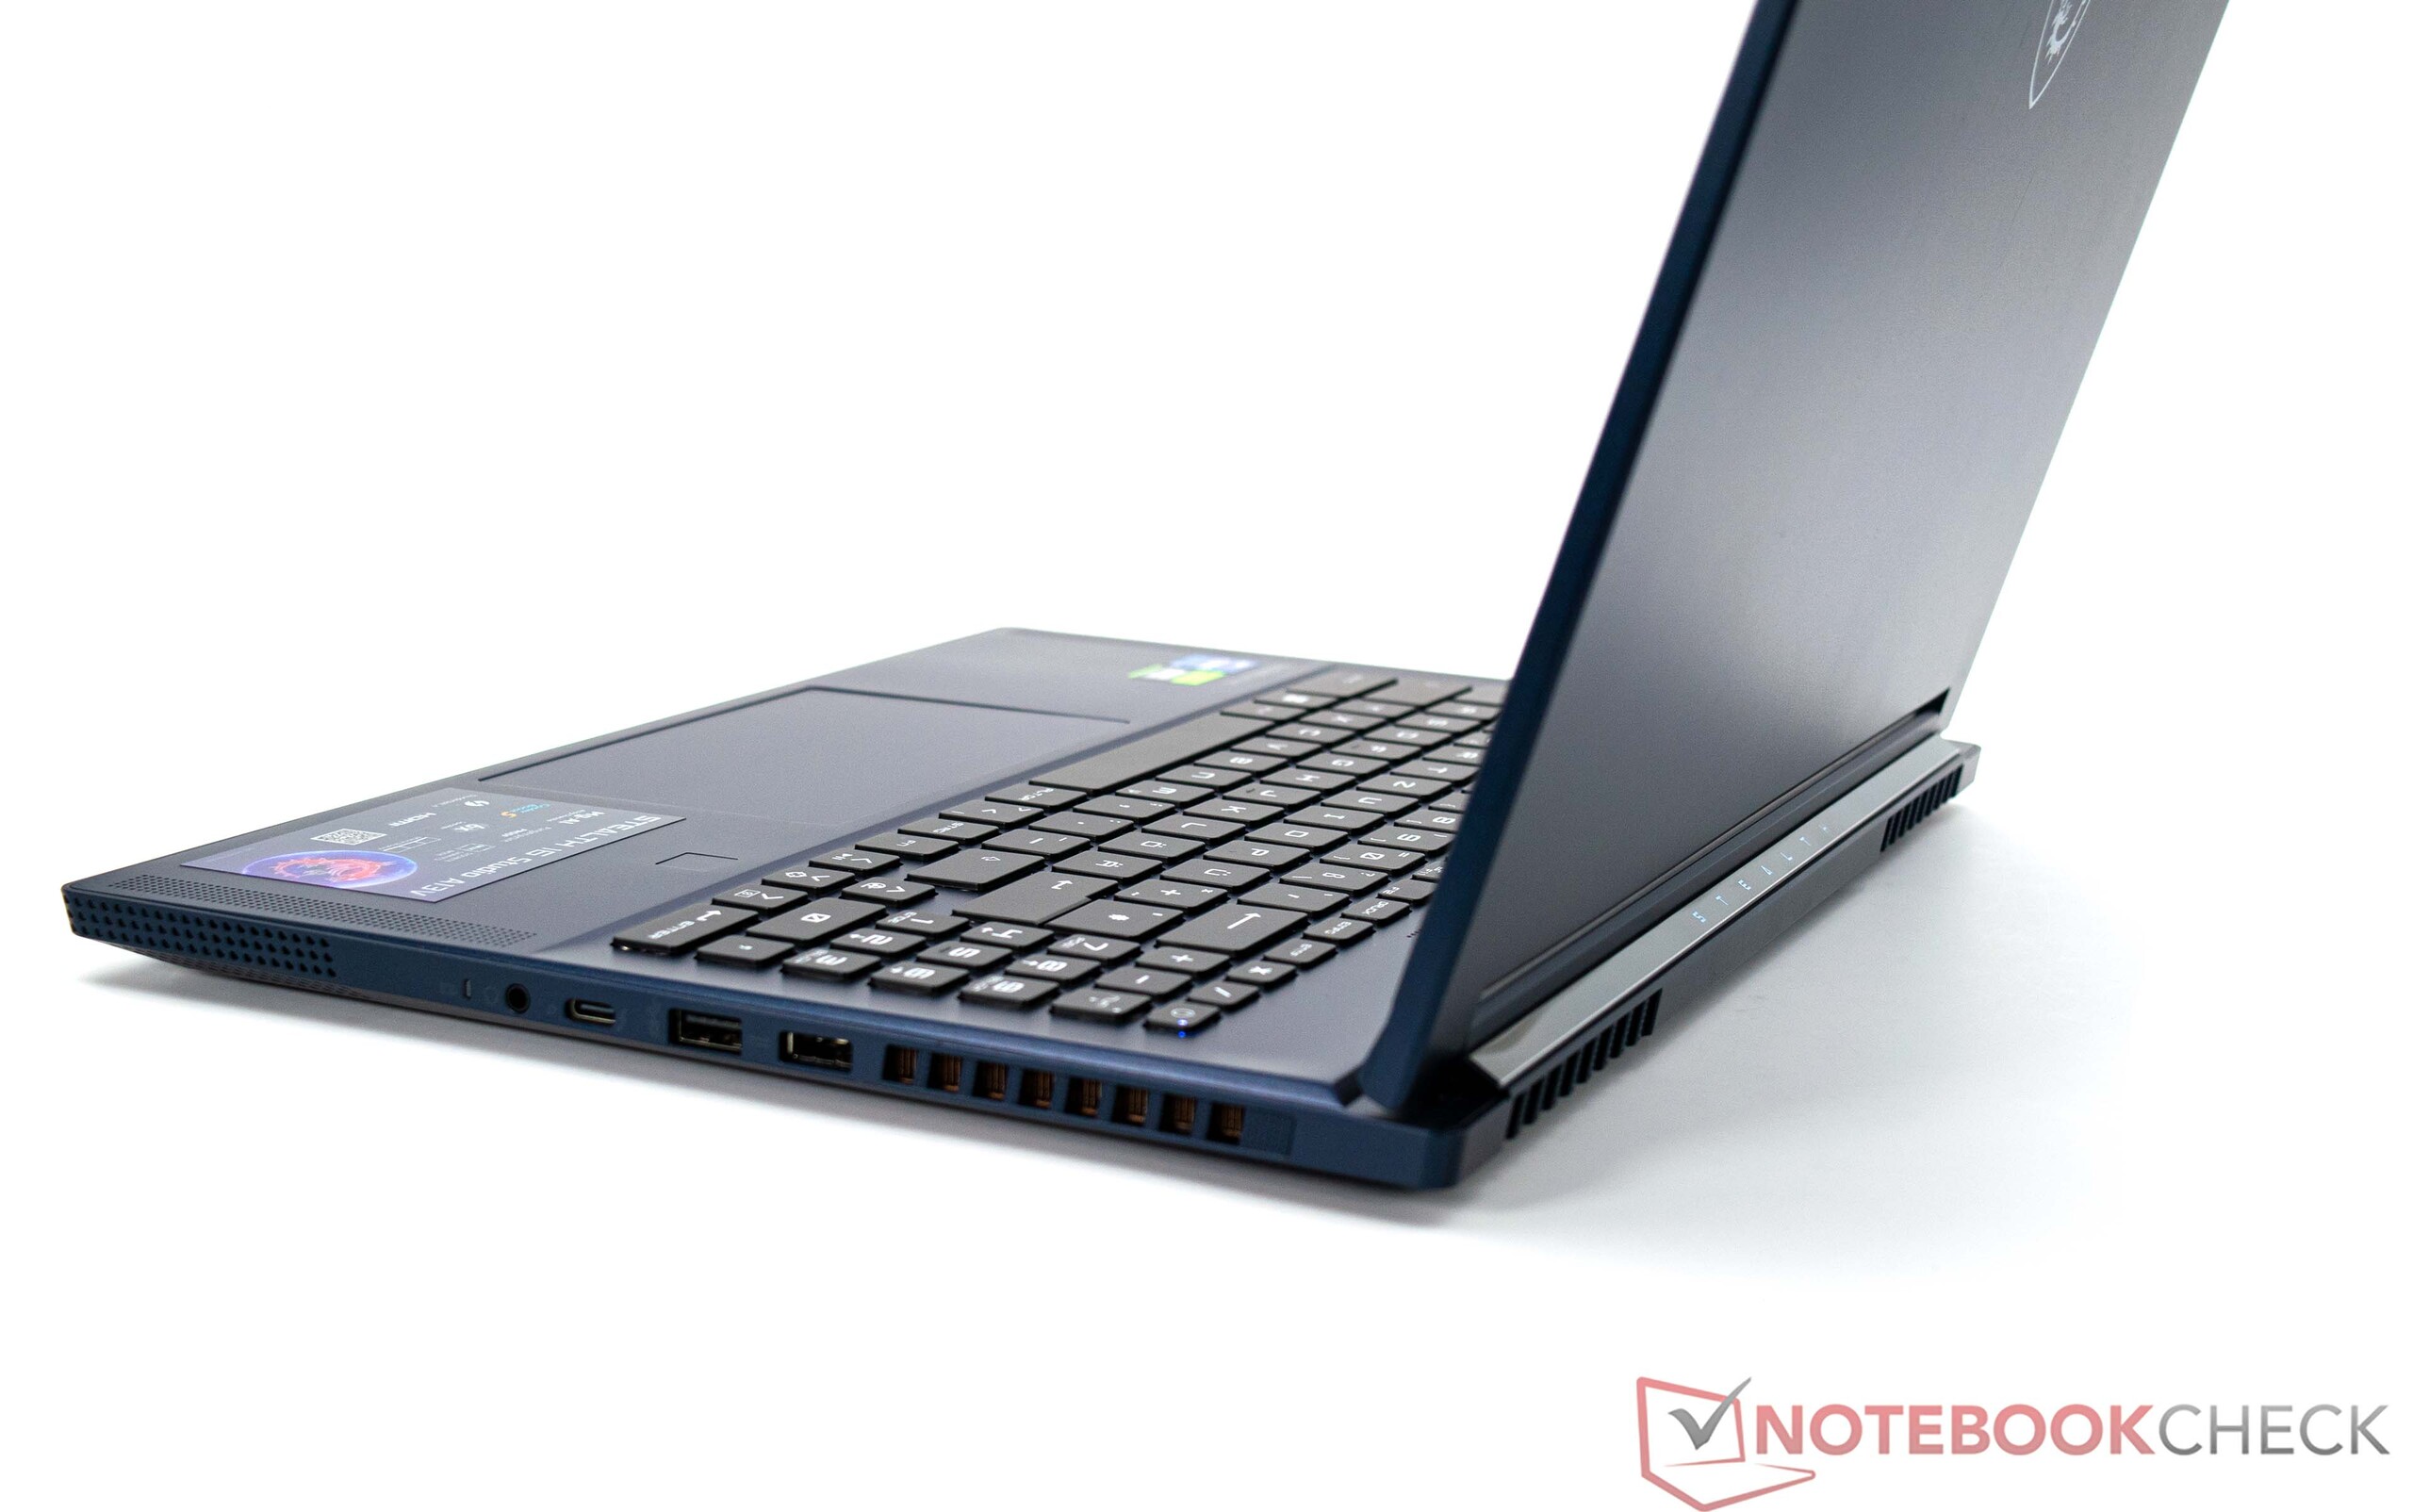
微星Stealth 16 Studio A13VG主要使用高品质材料。铝和镁的混合不仅给设备带来了细腻和良好的稳定性,同时也减轻了其重量。选择性压力的应用只导致底座的最小弯曲,但只有在适度的压力下才会出现。另一方面,机箱盖可以轻微扭曲,尽管这在微星Stealth 16 Studio A13VG中似乎不是一个极其消极的方面。铰链做得很好,有助于防止箱盖来回晃动。尽管如此,该设备可以用一只手打开。从设计的角度来看,这台笔记本电脑很低调,没有大量的RGB照明。在后侧,只有 "Stealth "字样被巧妙地照亮。我们的评测设备是蓝色的,但是,另外,微星Stealth 16 Studio也完全是白色的。
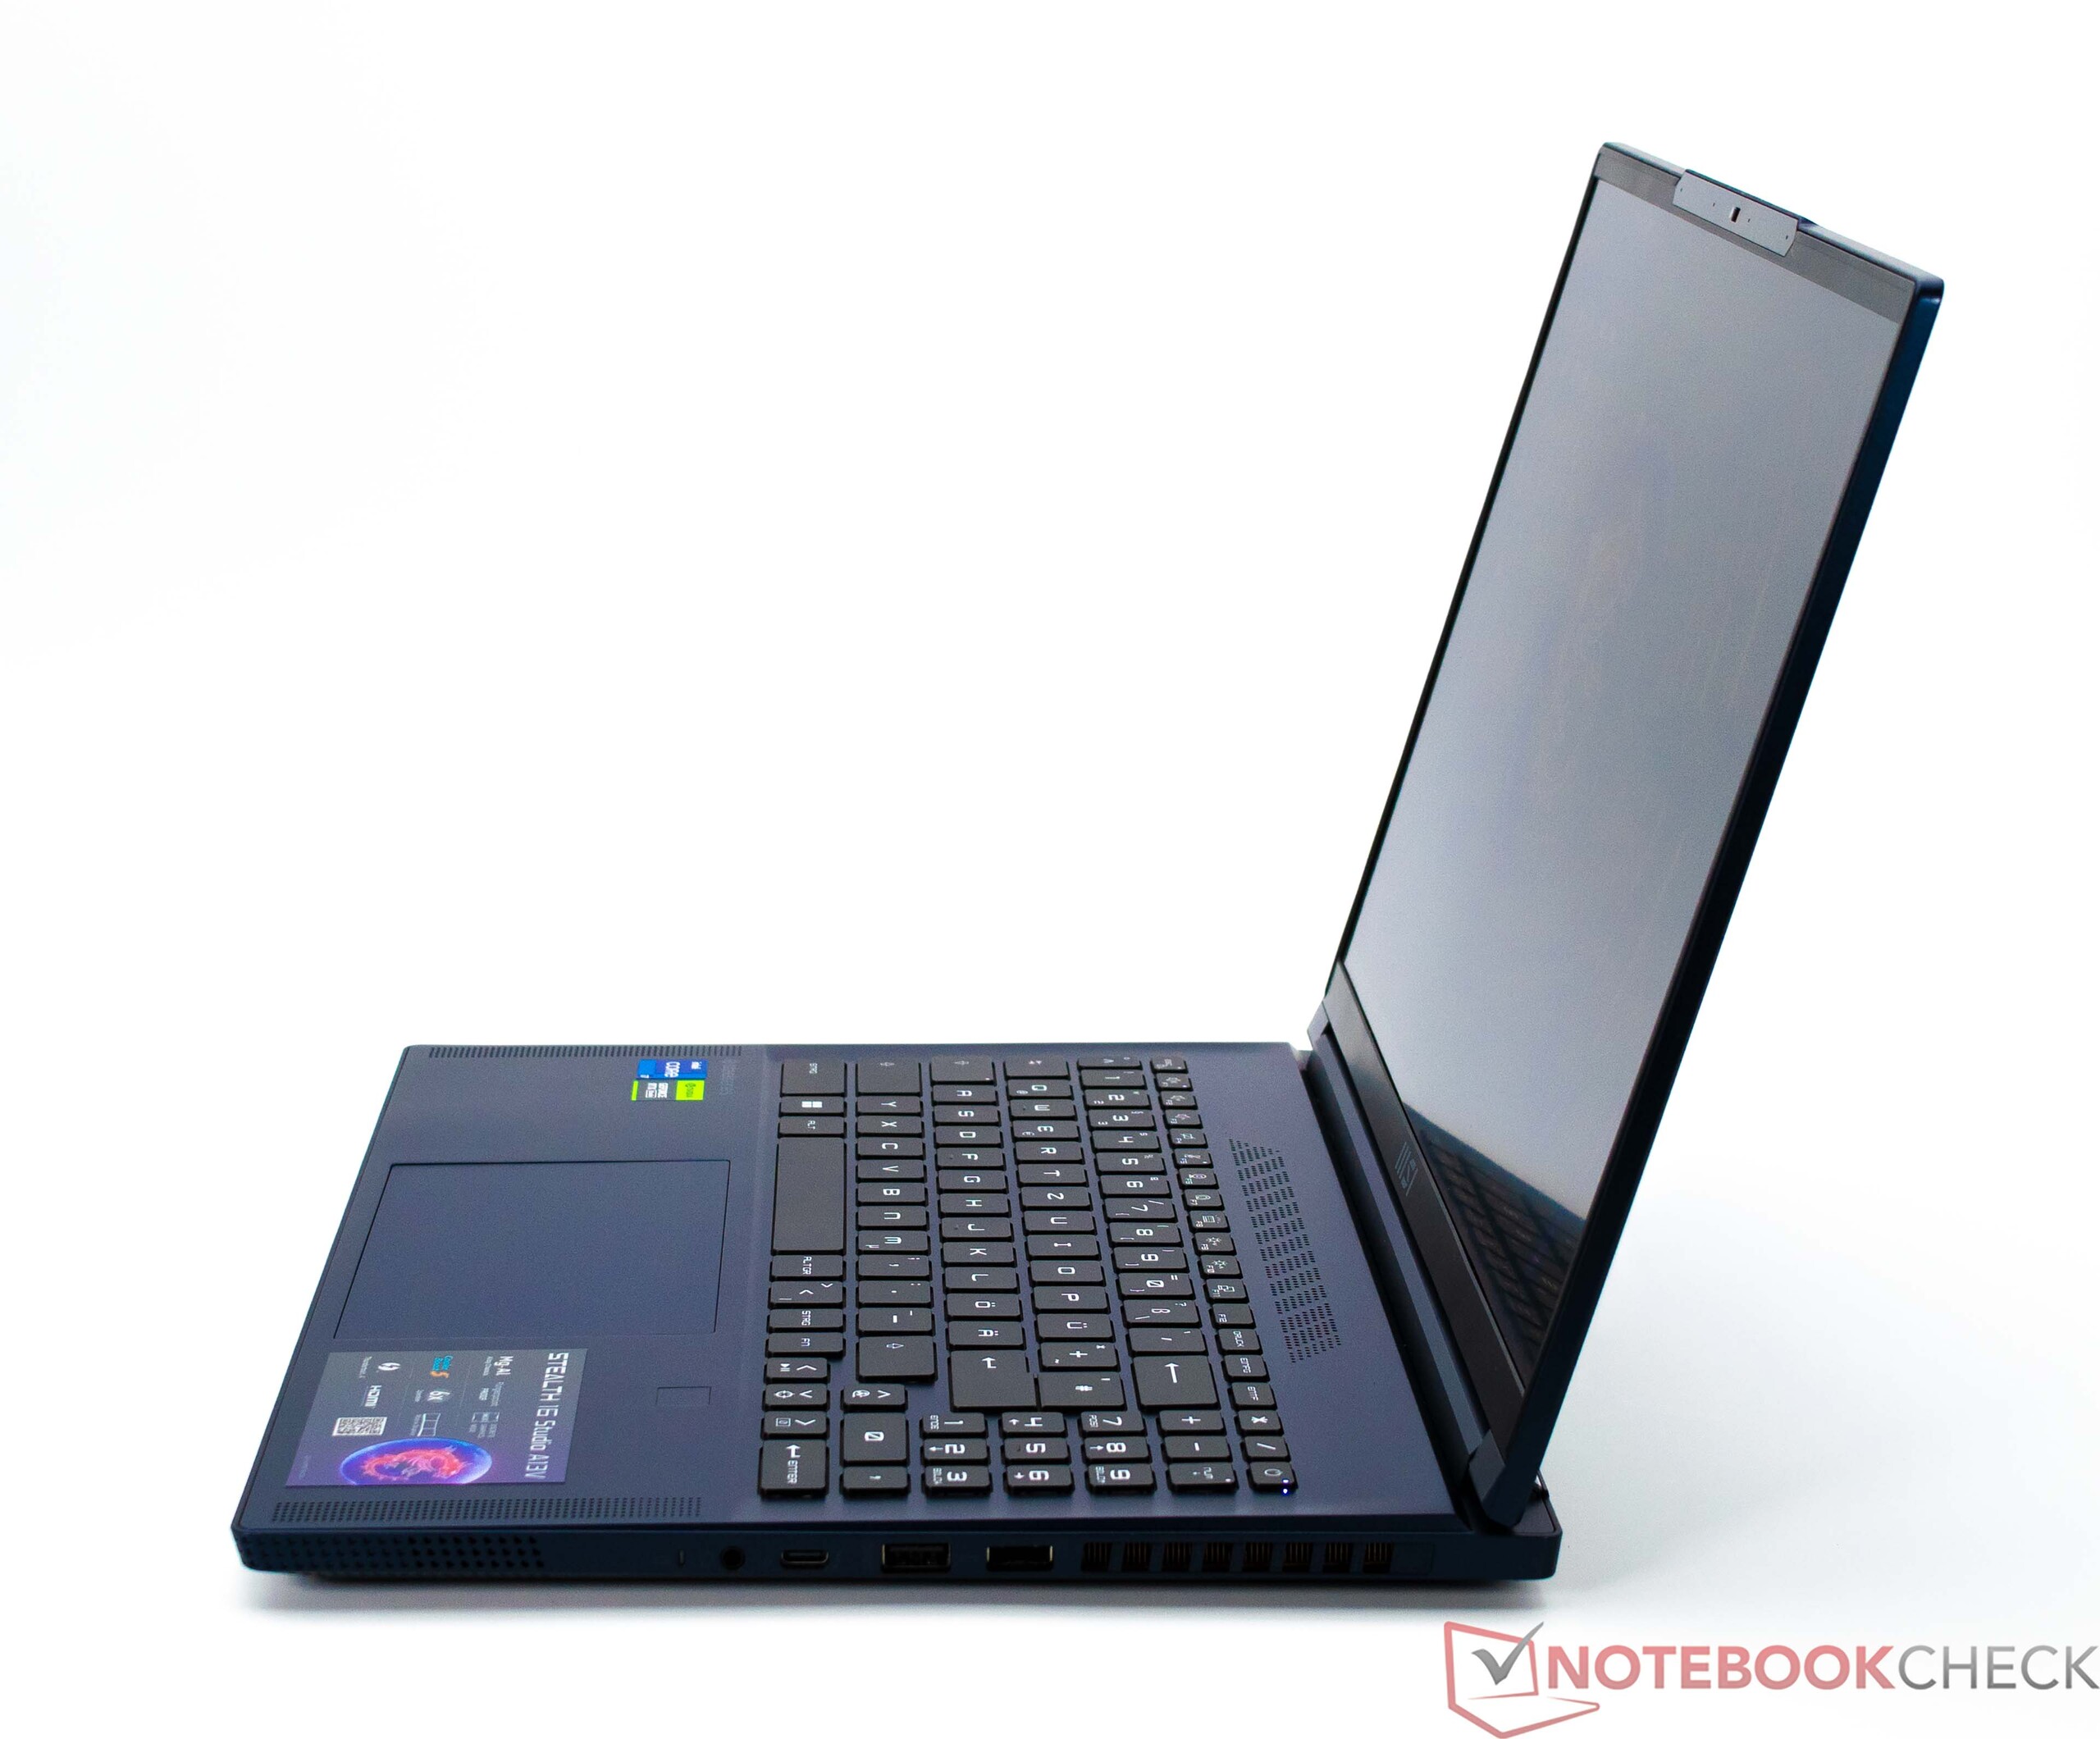
当涉及到笔记本电脑的桌面足迹时,这里所有的设备或多或少地占用了相同的空间。相比之下,在重量方面,微星Stealth 16 Studio A13VG属于我们比较中最轻的候选者,该设备的重量刚刚超过2公斤。PSU的重量为576克。
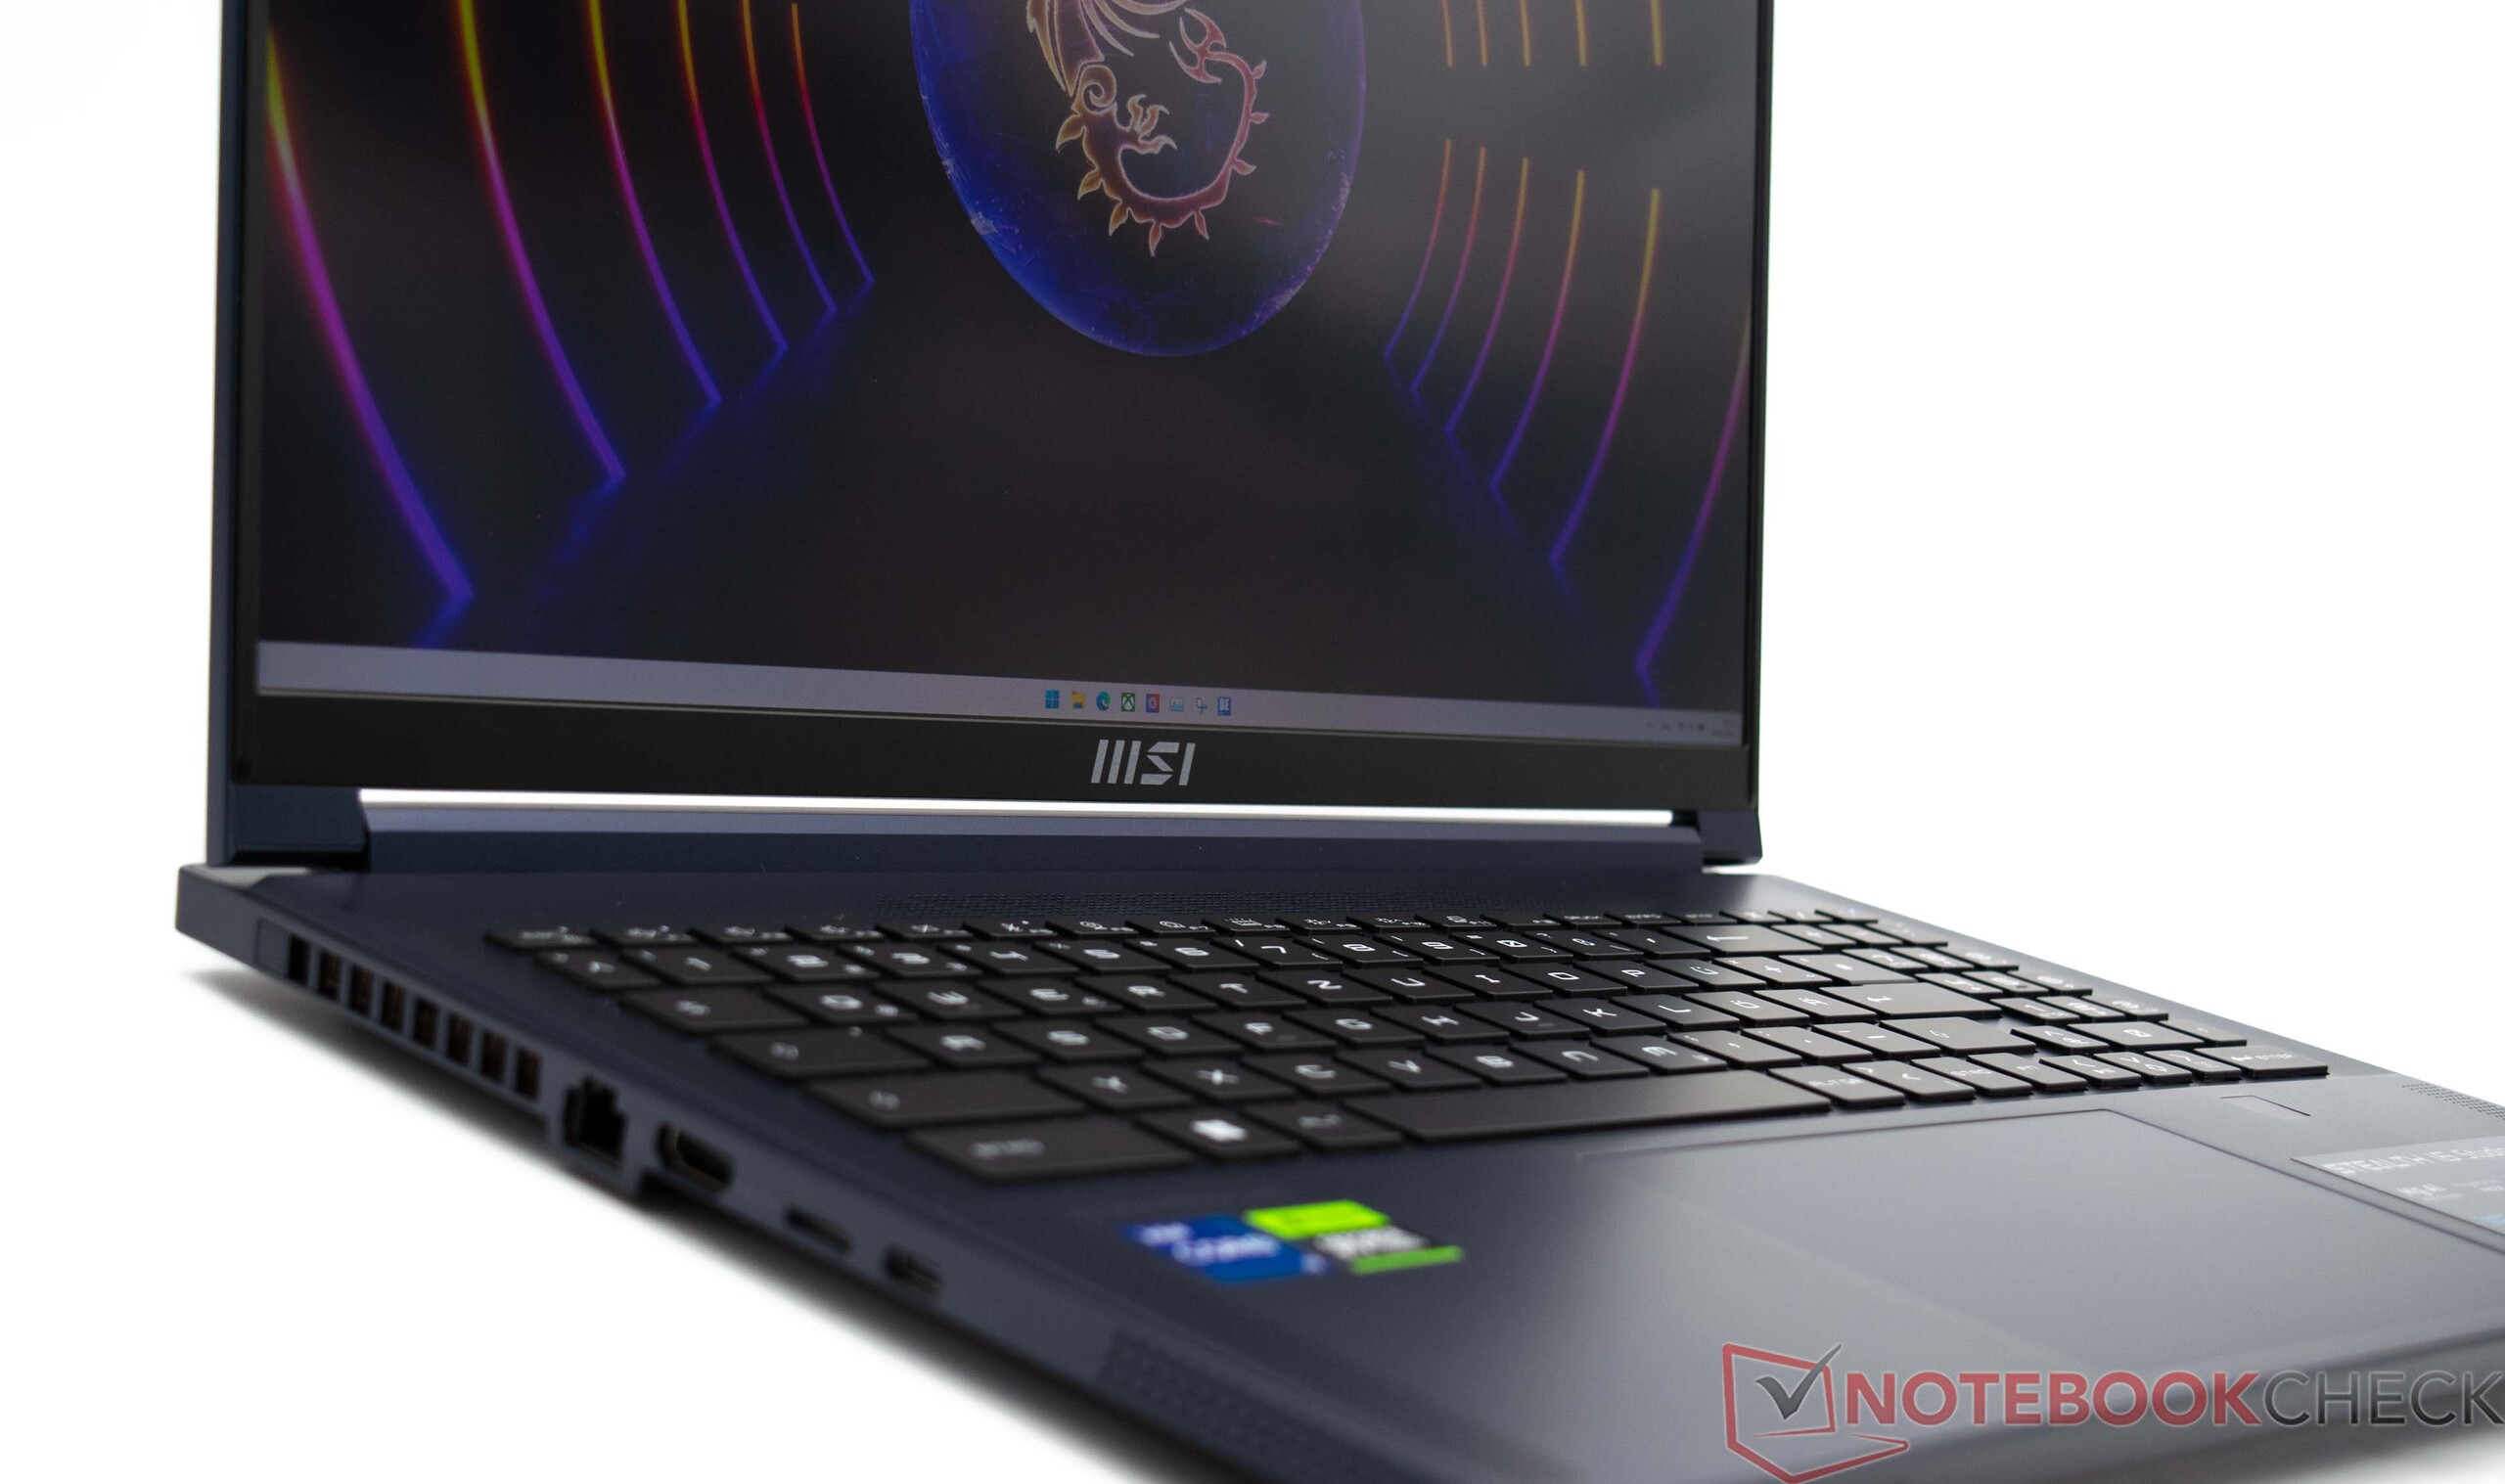
特点--不乱,并带有Thunderbolt 4功能
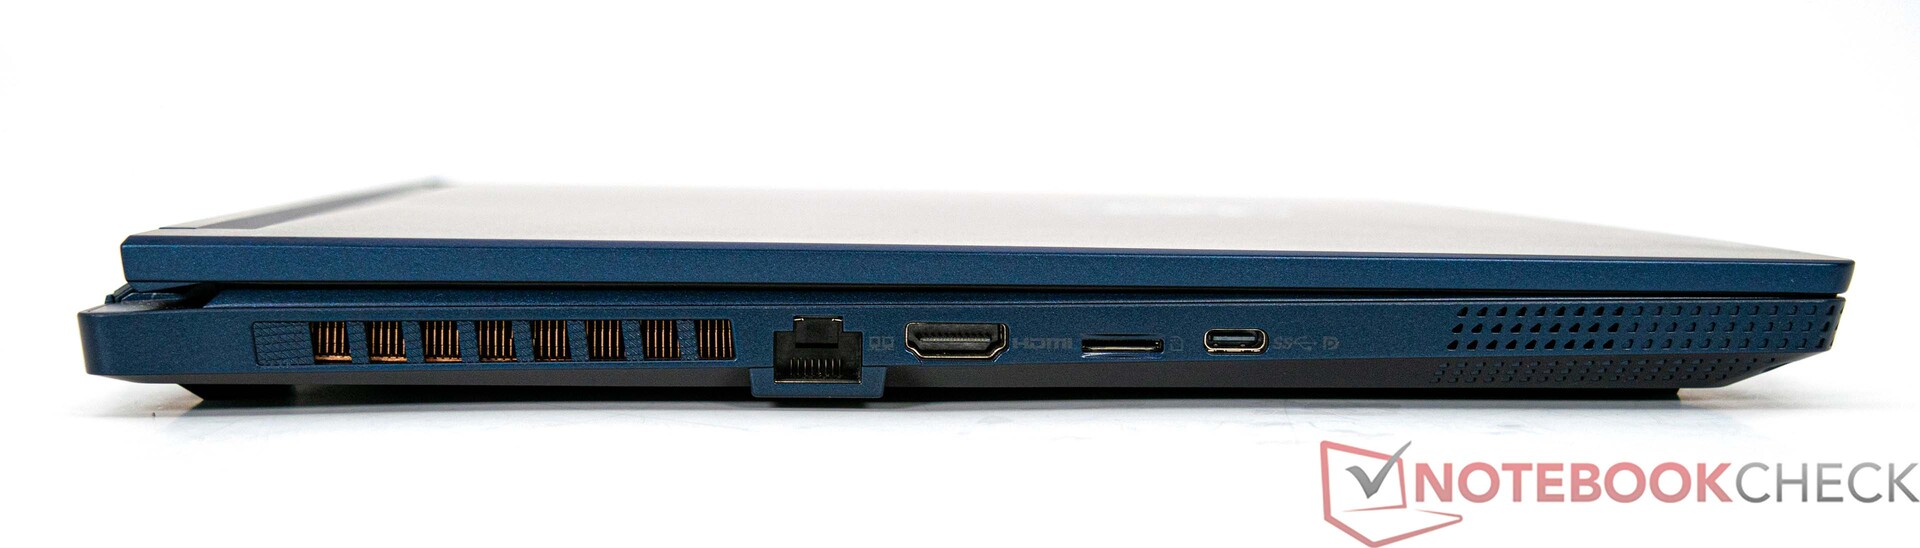
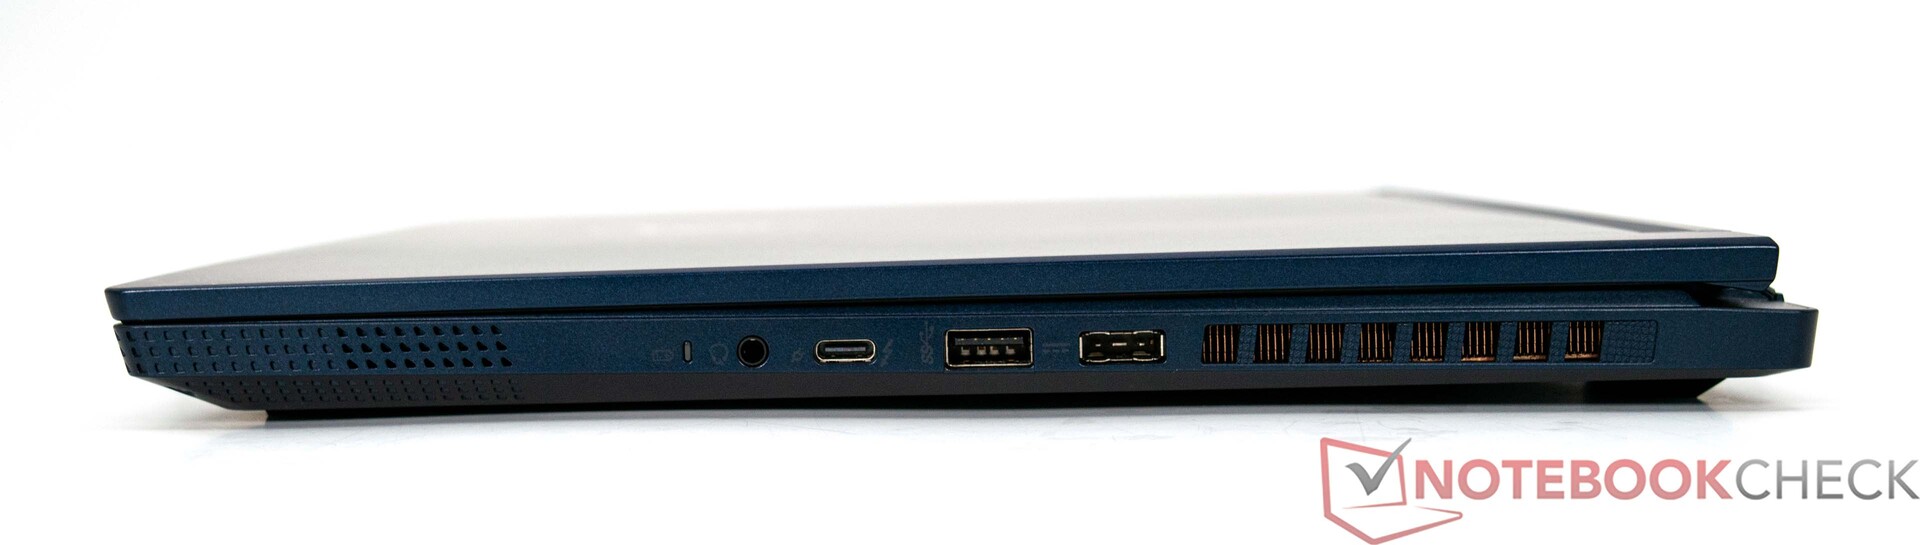
不幸的是,微星Stealth 16 Studio A13VG并没有配备特别多的端口。然而,所提供的接口应该足够大多数用户在日常情况下使用。至少包括一个带有Power Delivery(PD)的现代Thunderbolt 4端口。但是,用户被限制在只有一个USB-A端口。外部显示器可以通过HDMI或USB-C连接到笔记本电脑,这意味着总共可以同时使用三个显示器。
SD卡阅读器
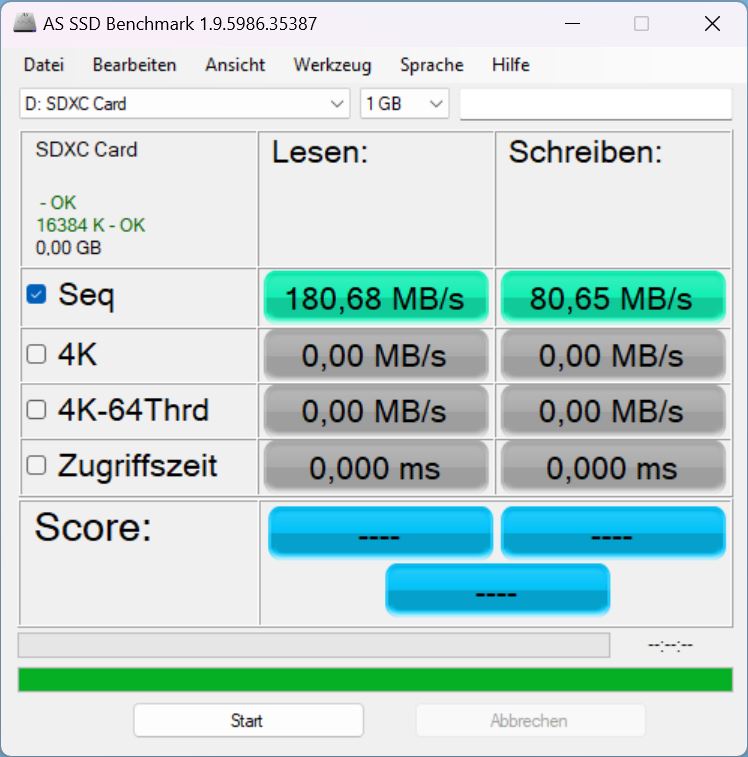
微星Stealth 16 Studio A13VG配备了一个读卡器,可以接受microSD存储卡。该读卡器支持快速的UHS-II标准。在我们的测试中,我们使用我们的参考卡,AV PRO microSD 128 GB V60,记录了出色的结果。然而,华硕和技嘉的竞争对手也令人印象深刻,在连续数据方面的得分甚至更好。
| SD Card Reader | |
| average JPG Copy Test (av. of 3 runs) | |
| Gigabyte AERO 16 OLED BSF | |
| MSI Stealth 16 Studio A13VG | |
| Average of class Gaming (20.9 - 210, n=54, last 2 years) | |
| Asus ROG Flow X16 GV601V | |
| Corsair Voyager a1600 (AV Pro SD microSD 128 GB V60) | |
| Acer Nitro 16 AN16-41 (AV Pro SD microSD 128 GB V60) | |
| Medion Erazer Major X20 (AV PRO microSD 128 GB V60) | |
| maximum AS SSD Seq Read Test (1GB) | |
| Asus ROG Flow X16 GV601V | |
| Gigabyte AERO 16 OLED BSF | |
| MSI Stealth 16 Studio A13VG | |
| Average of class Gaming (25.5 - 261, n=51, last 2 years) | |
| Corsair Voyager a1600 (AV Pro SD microSD 128 GB V60) | |
| Medion Erazer Major X20 (AV PRO microSD 128 GB V60) | |
| Acer Nitro 16 AN16-41 (AV Pro SD microSD 128 GB V60) | |
沟通
基本上,安装的Wi-Fi模块表现得很好。与其竞争对手相比,微星Stealth 16 Studio A13VG不能很好地证明自己,尽管我们的评测设备在这里展示的性能方面没有什么可隐藏。为此,我们使用了我们的华硕ROG Rapture GT-AXE11000测试路由器。另外,微星Stealth 16 Studio A13VG也提供一个以太网端口。传输速度可以达到2.5GBit/s。
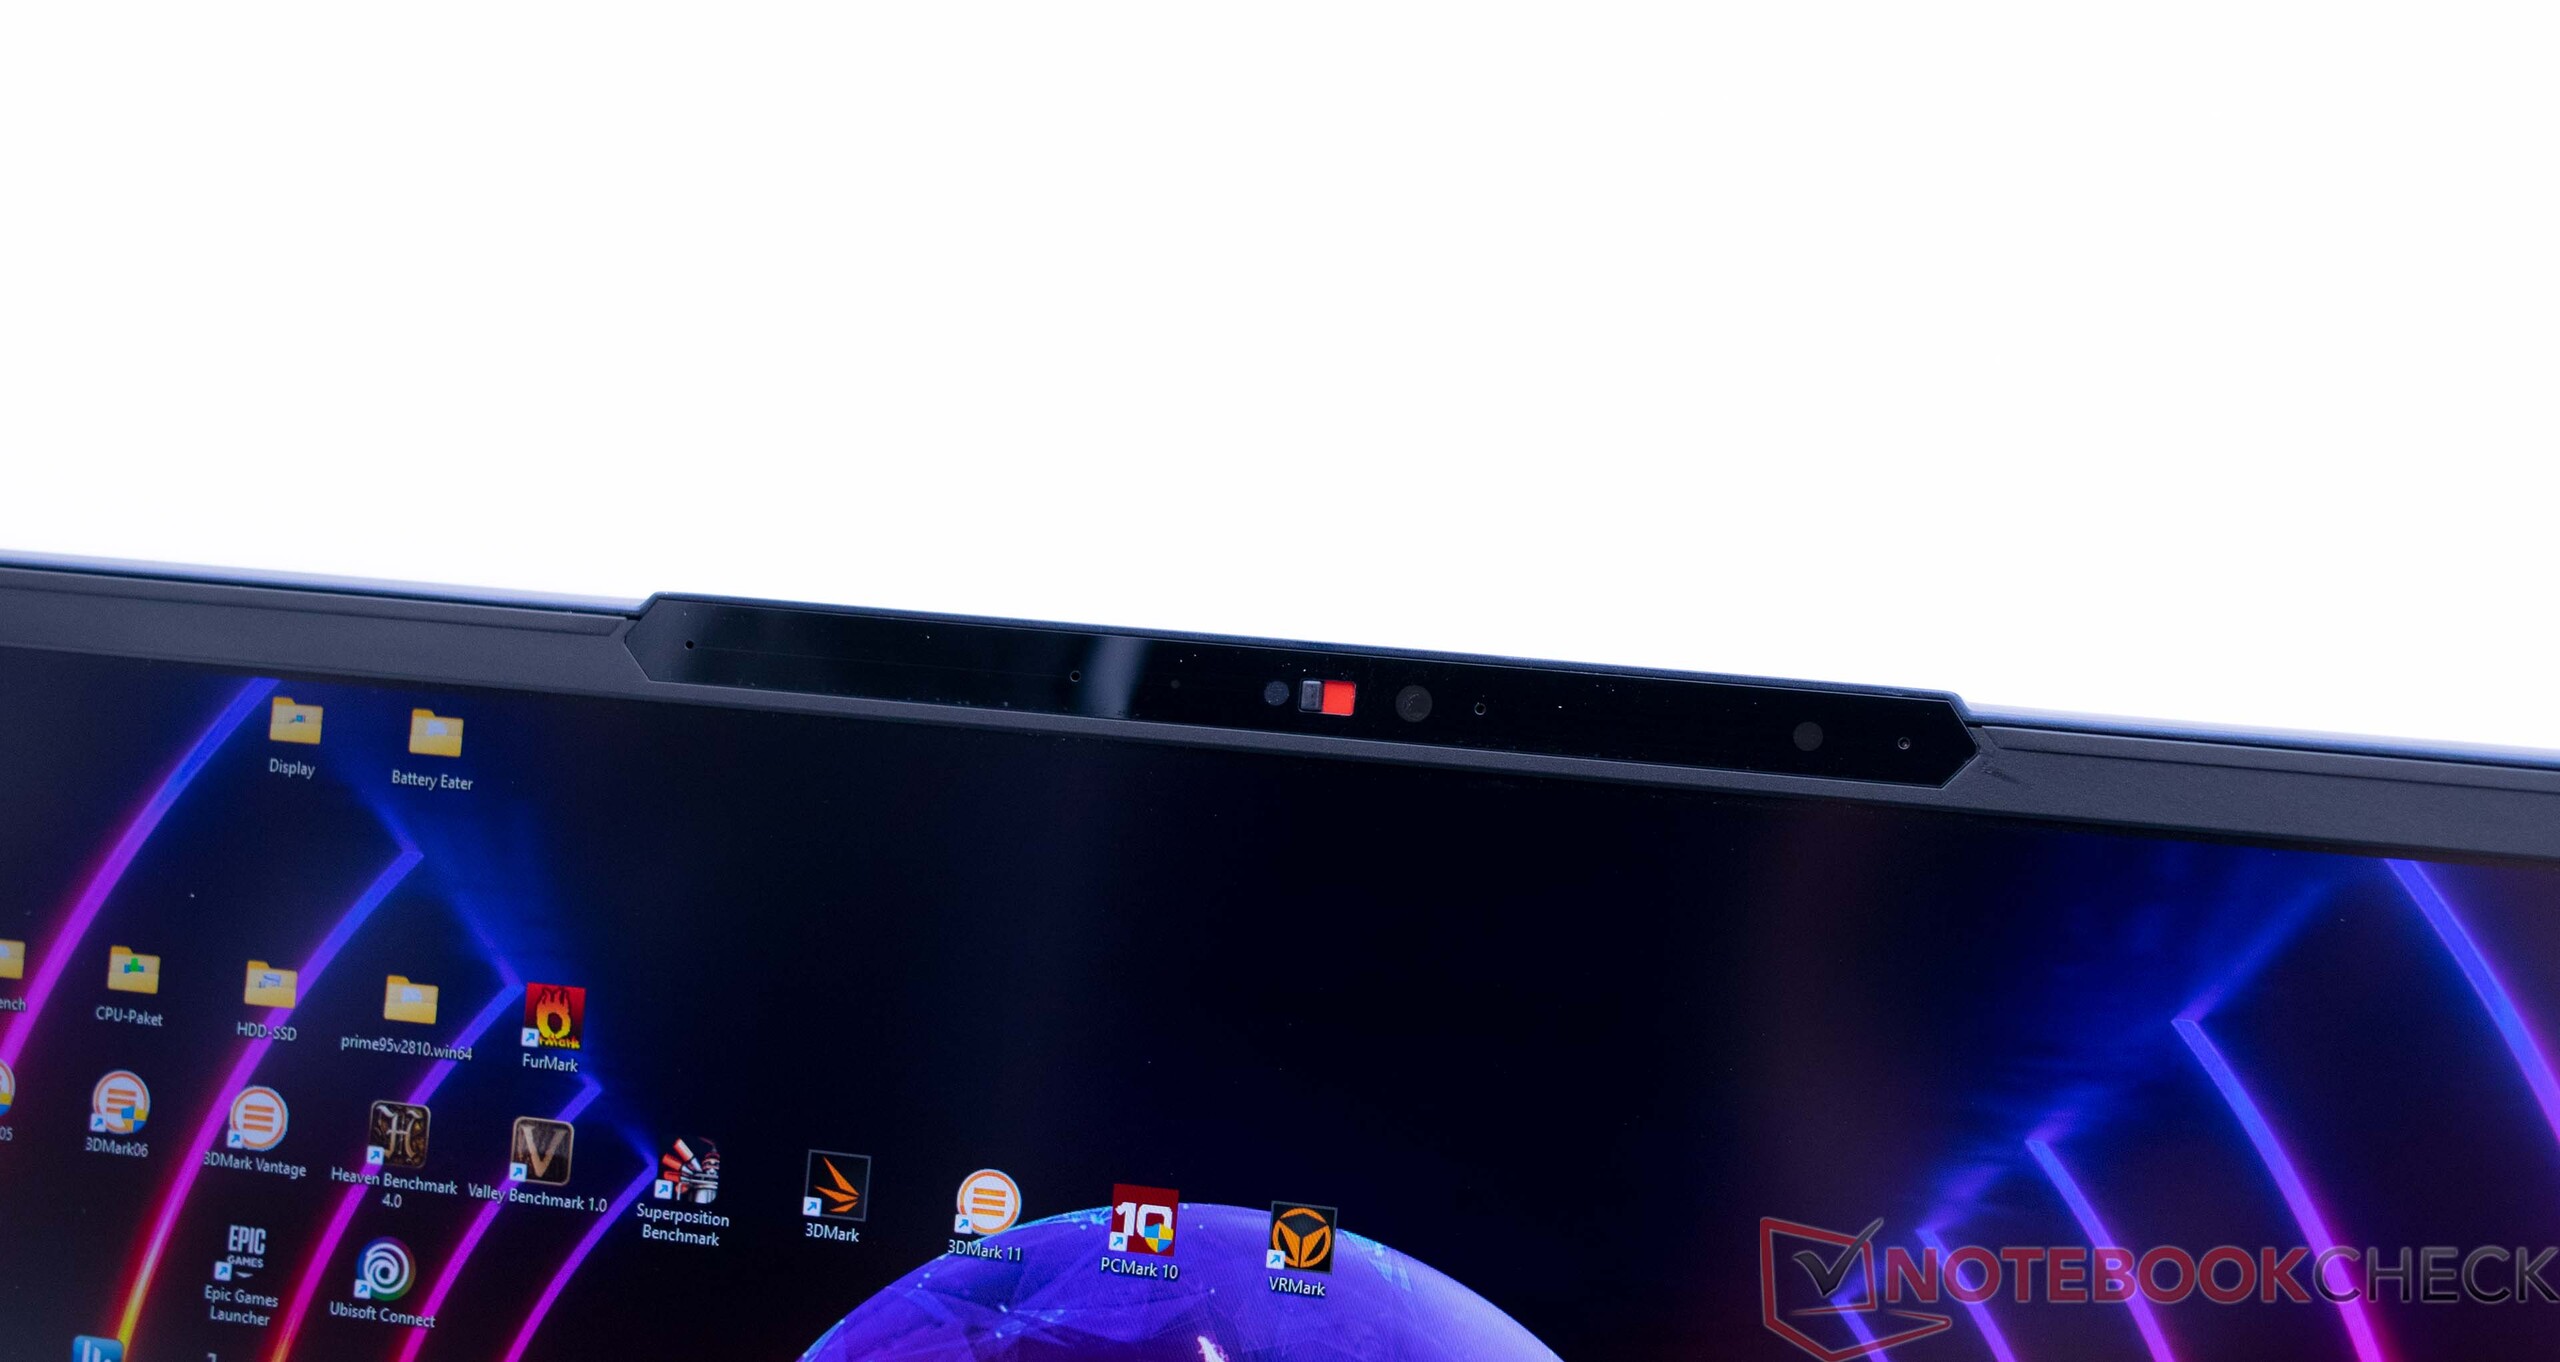
网络摄像头
微星Stealth 16 Studio A13VG配备了一个FHD网络摄像头,适用于直接的视频通话。由于色彩准确度低,所以扣了几分。


安全问题
微星Stealth 16 Studio A13VG的集成指纹传感器做得很好,确保系统认证不复杂。
辅料
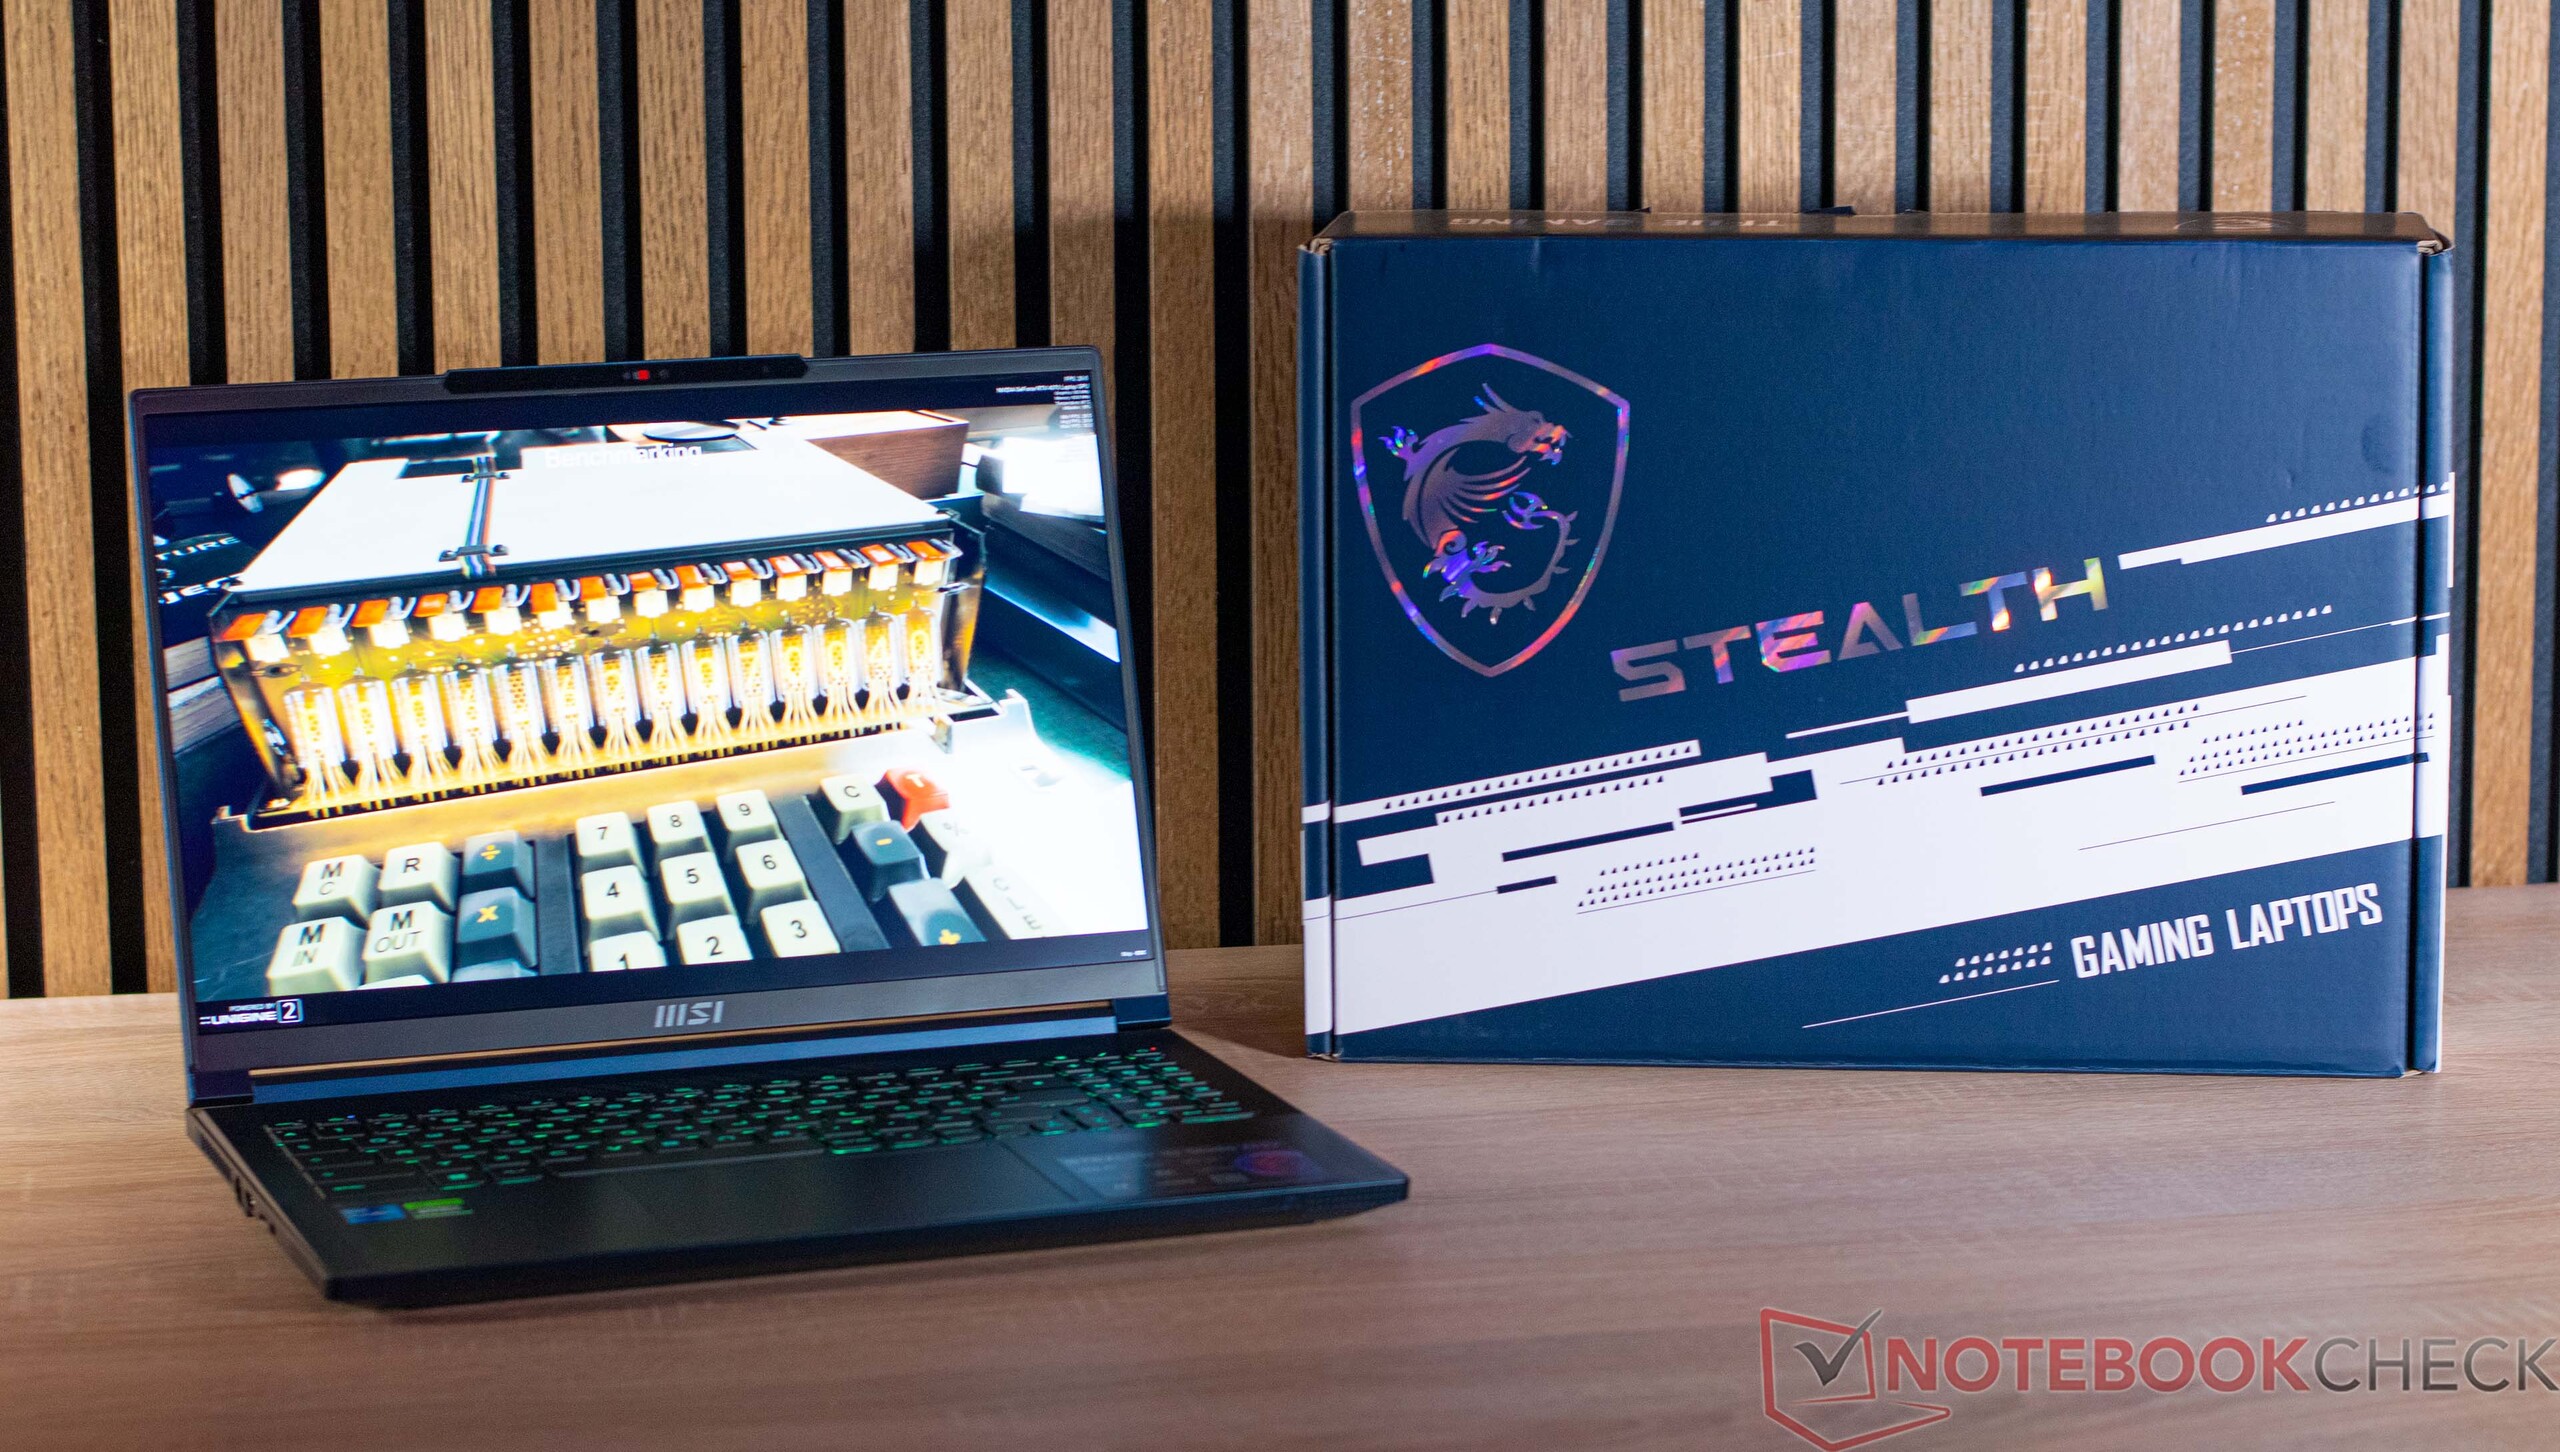
盒子里除了设备本身外,还有一个240瓦的PSU以及必要的文件资料。
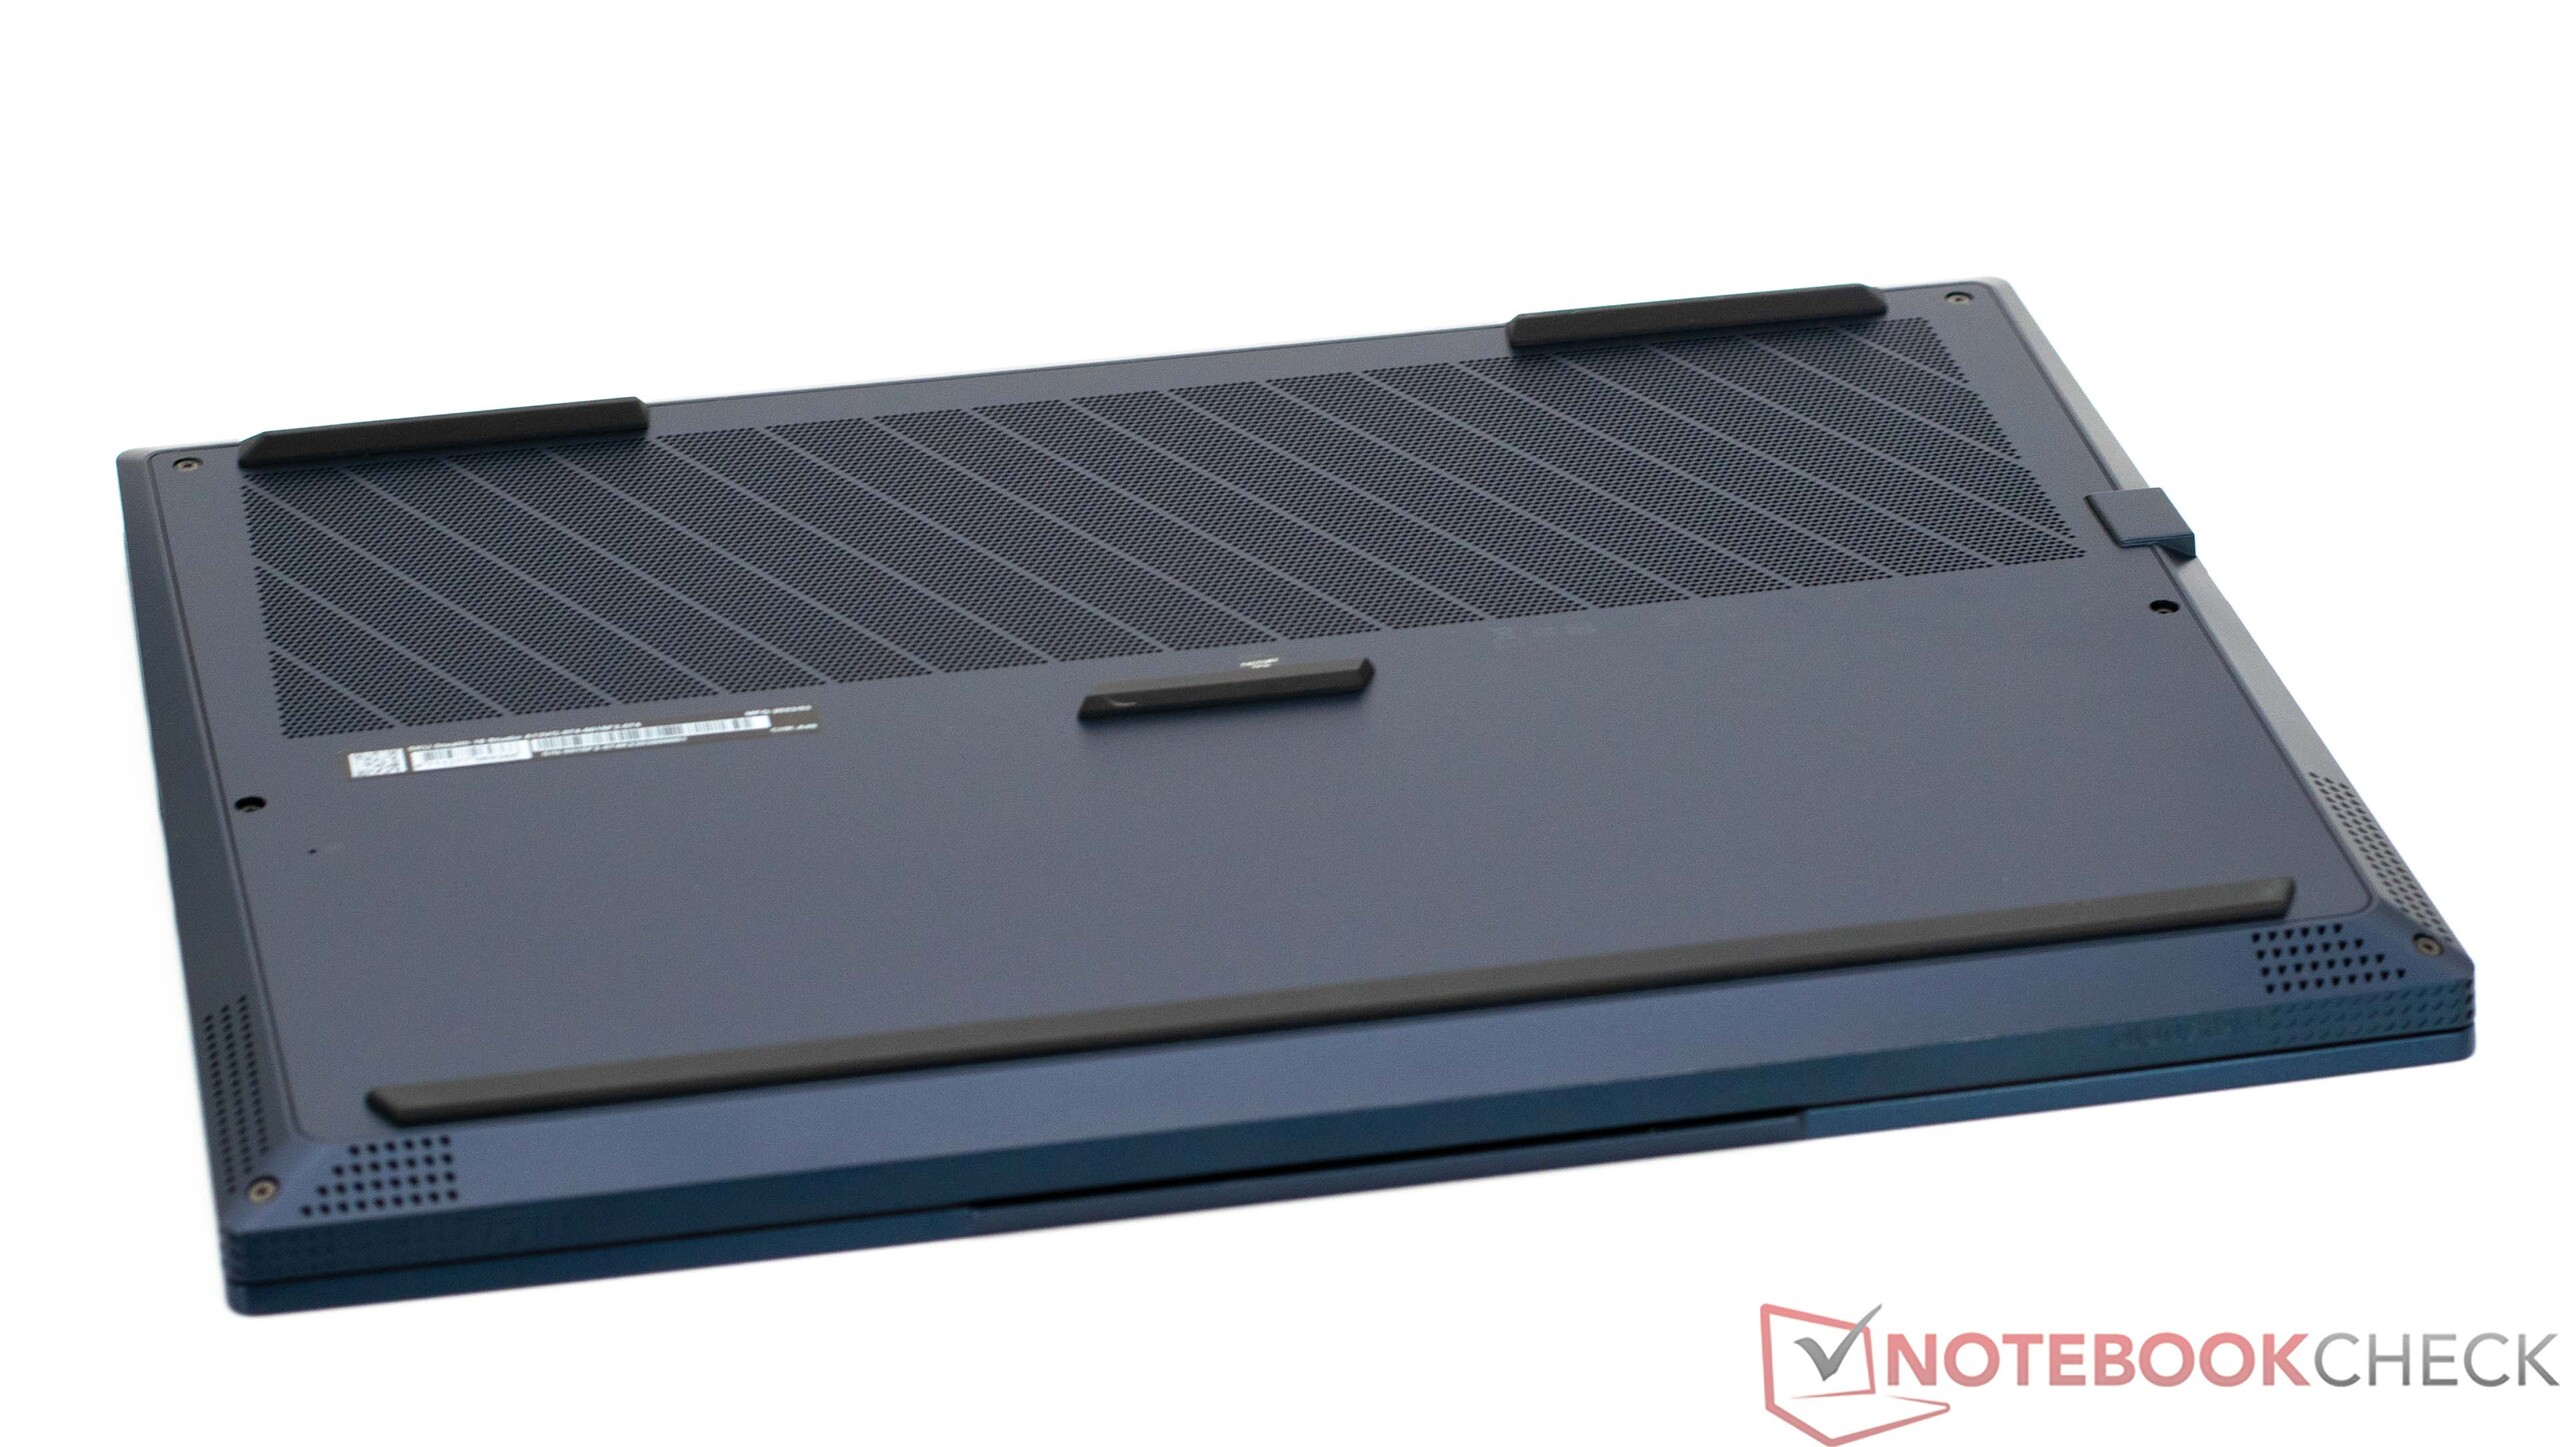
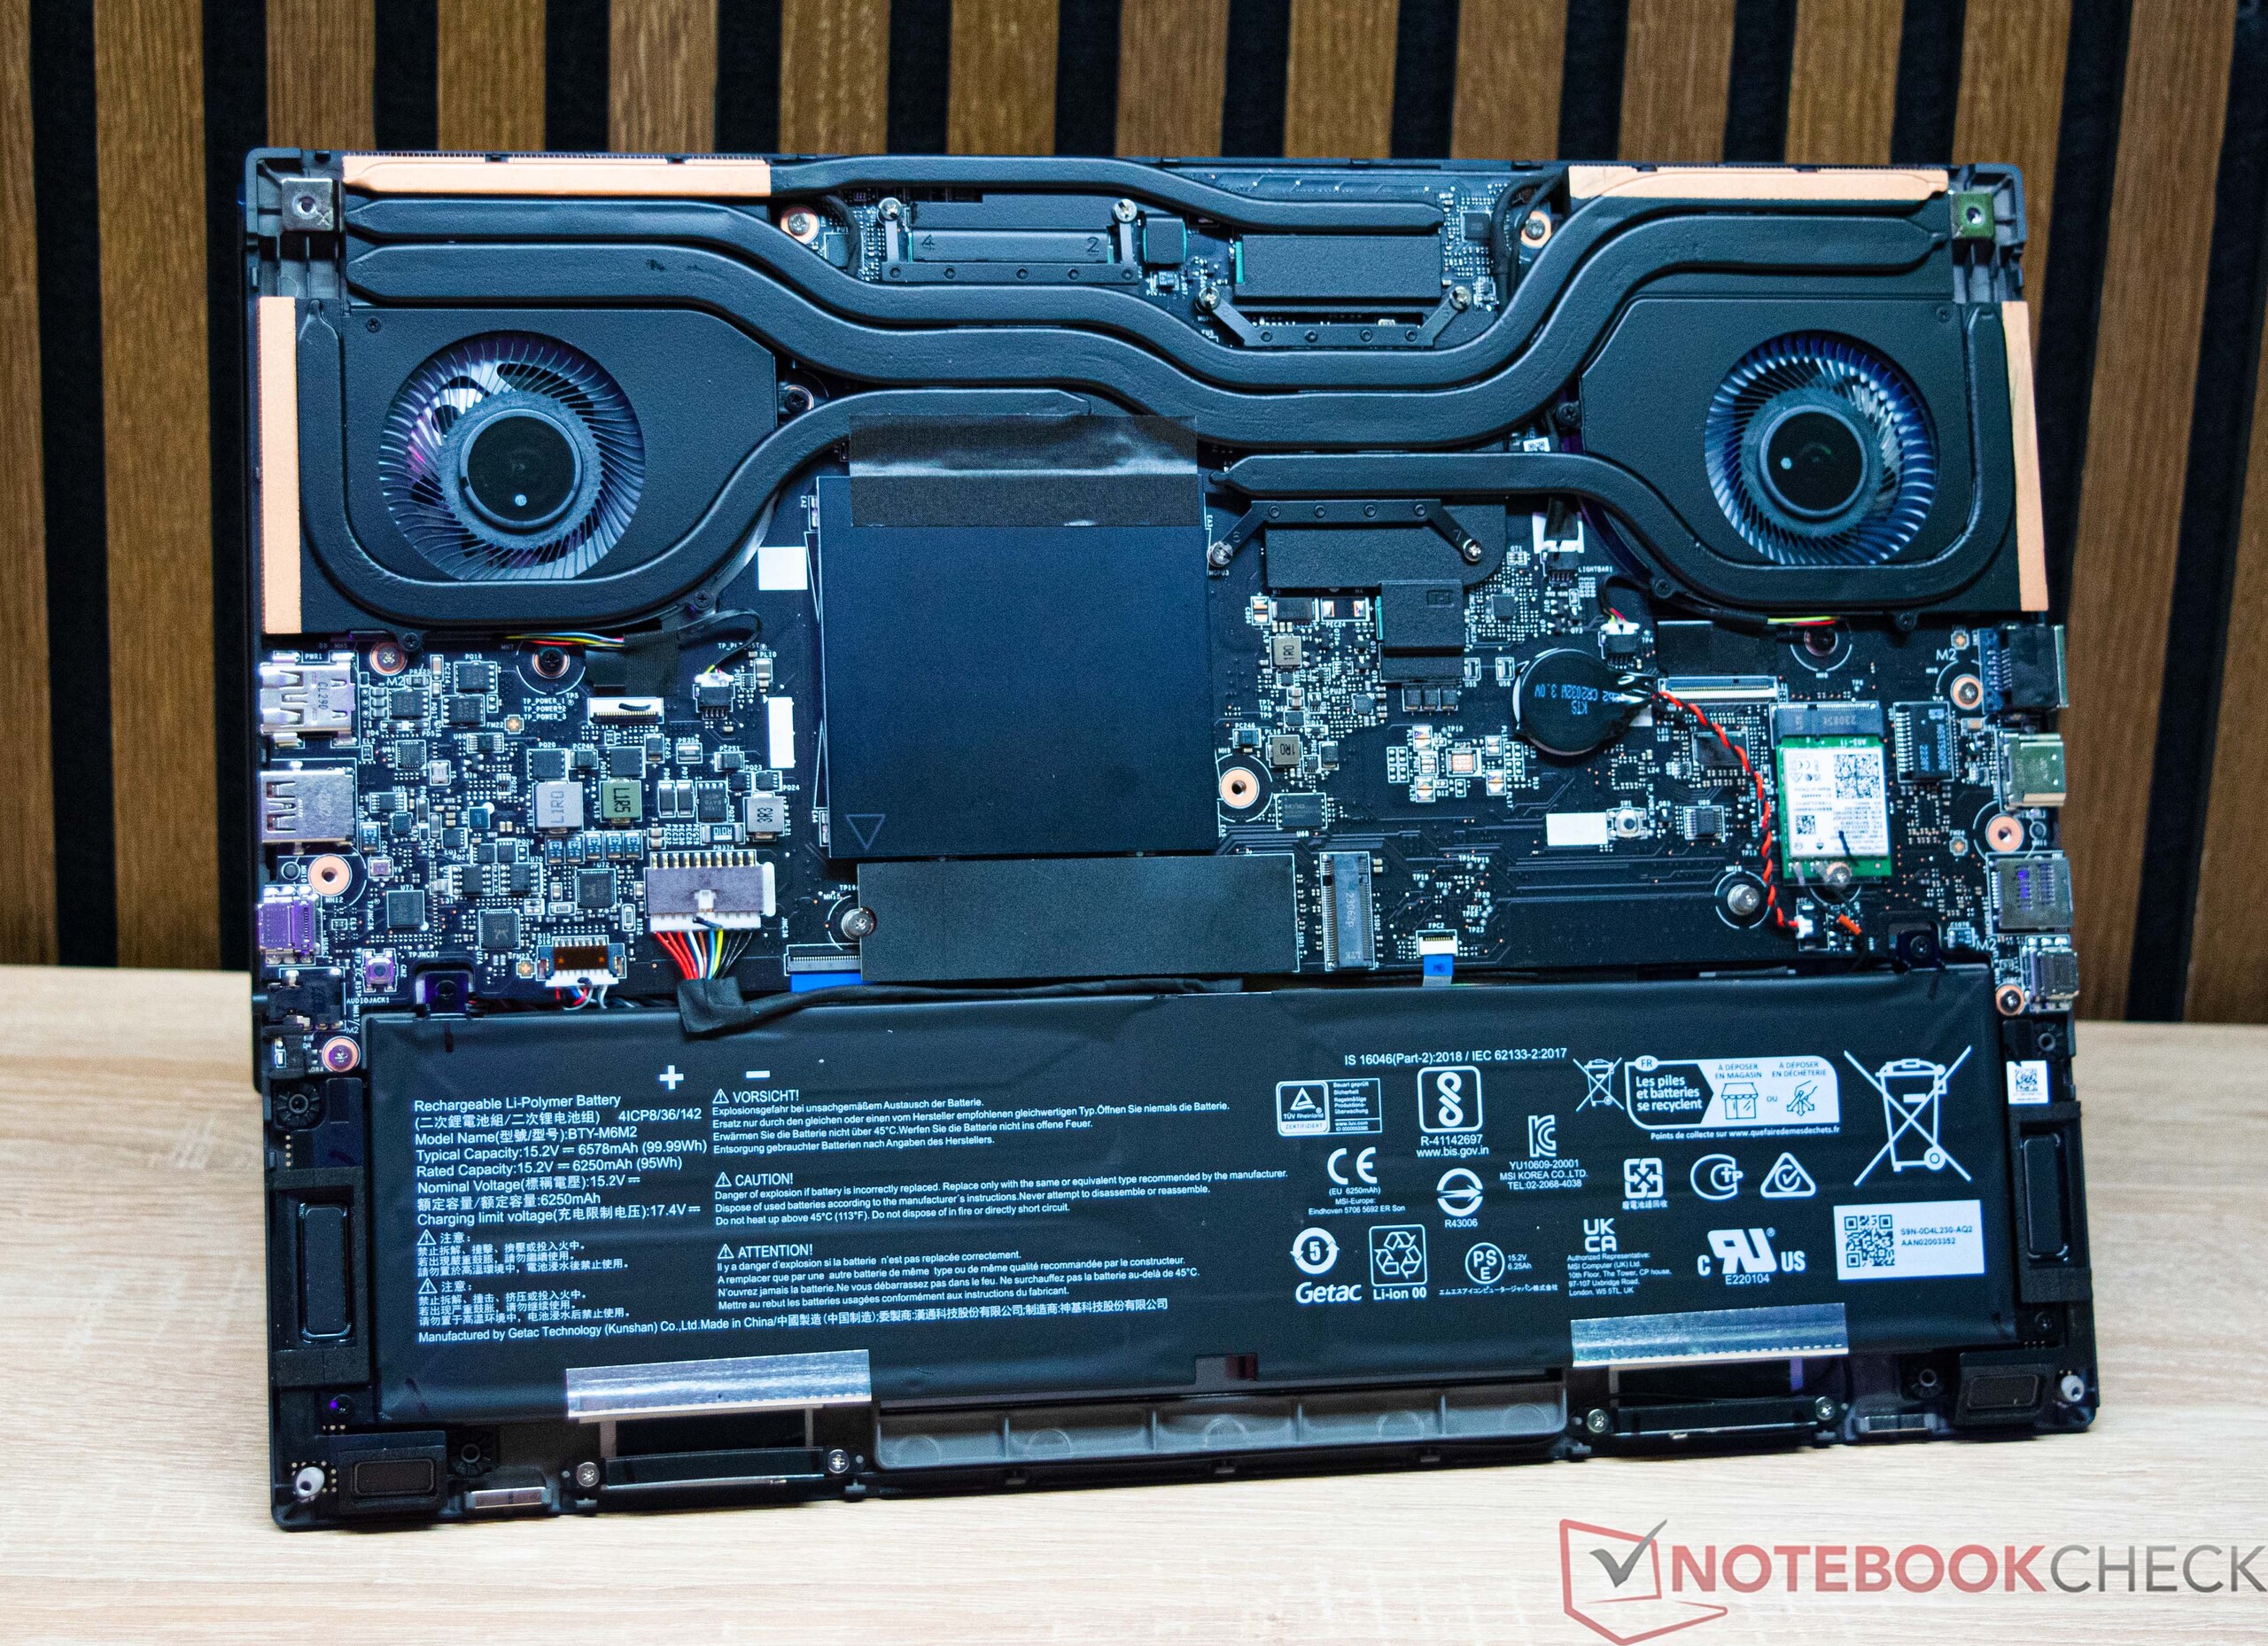
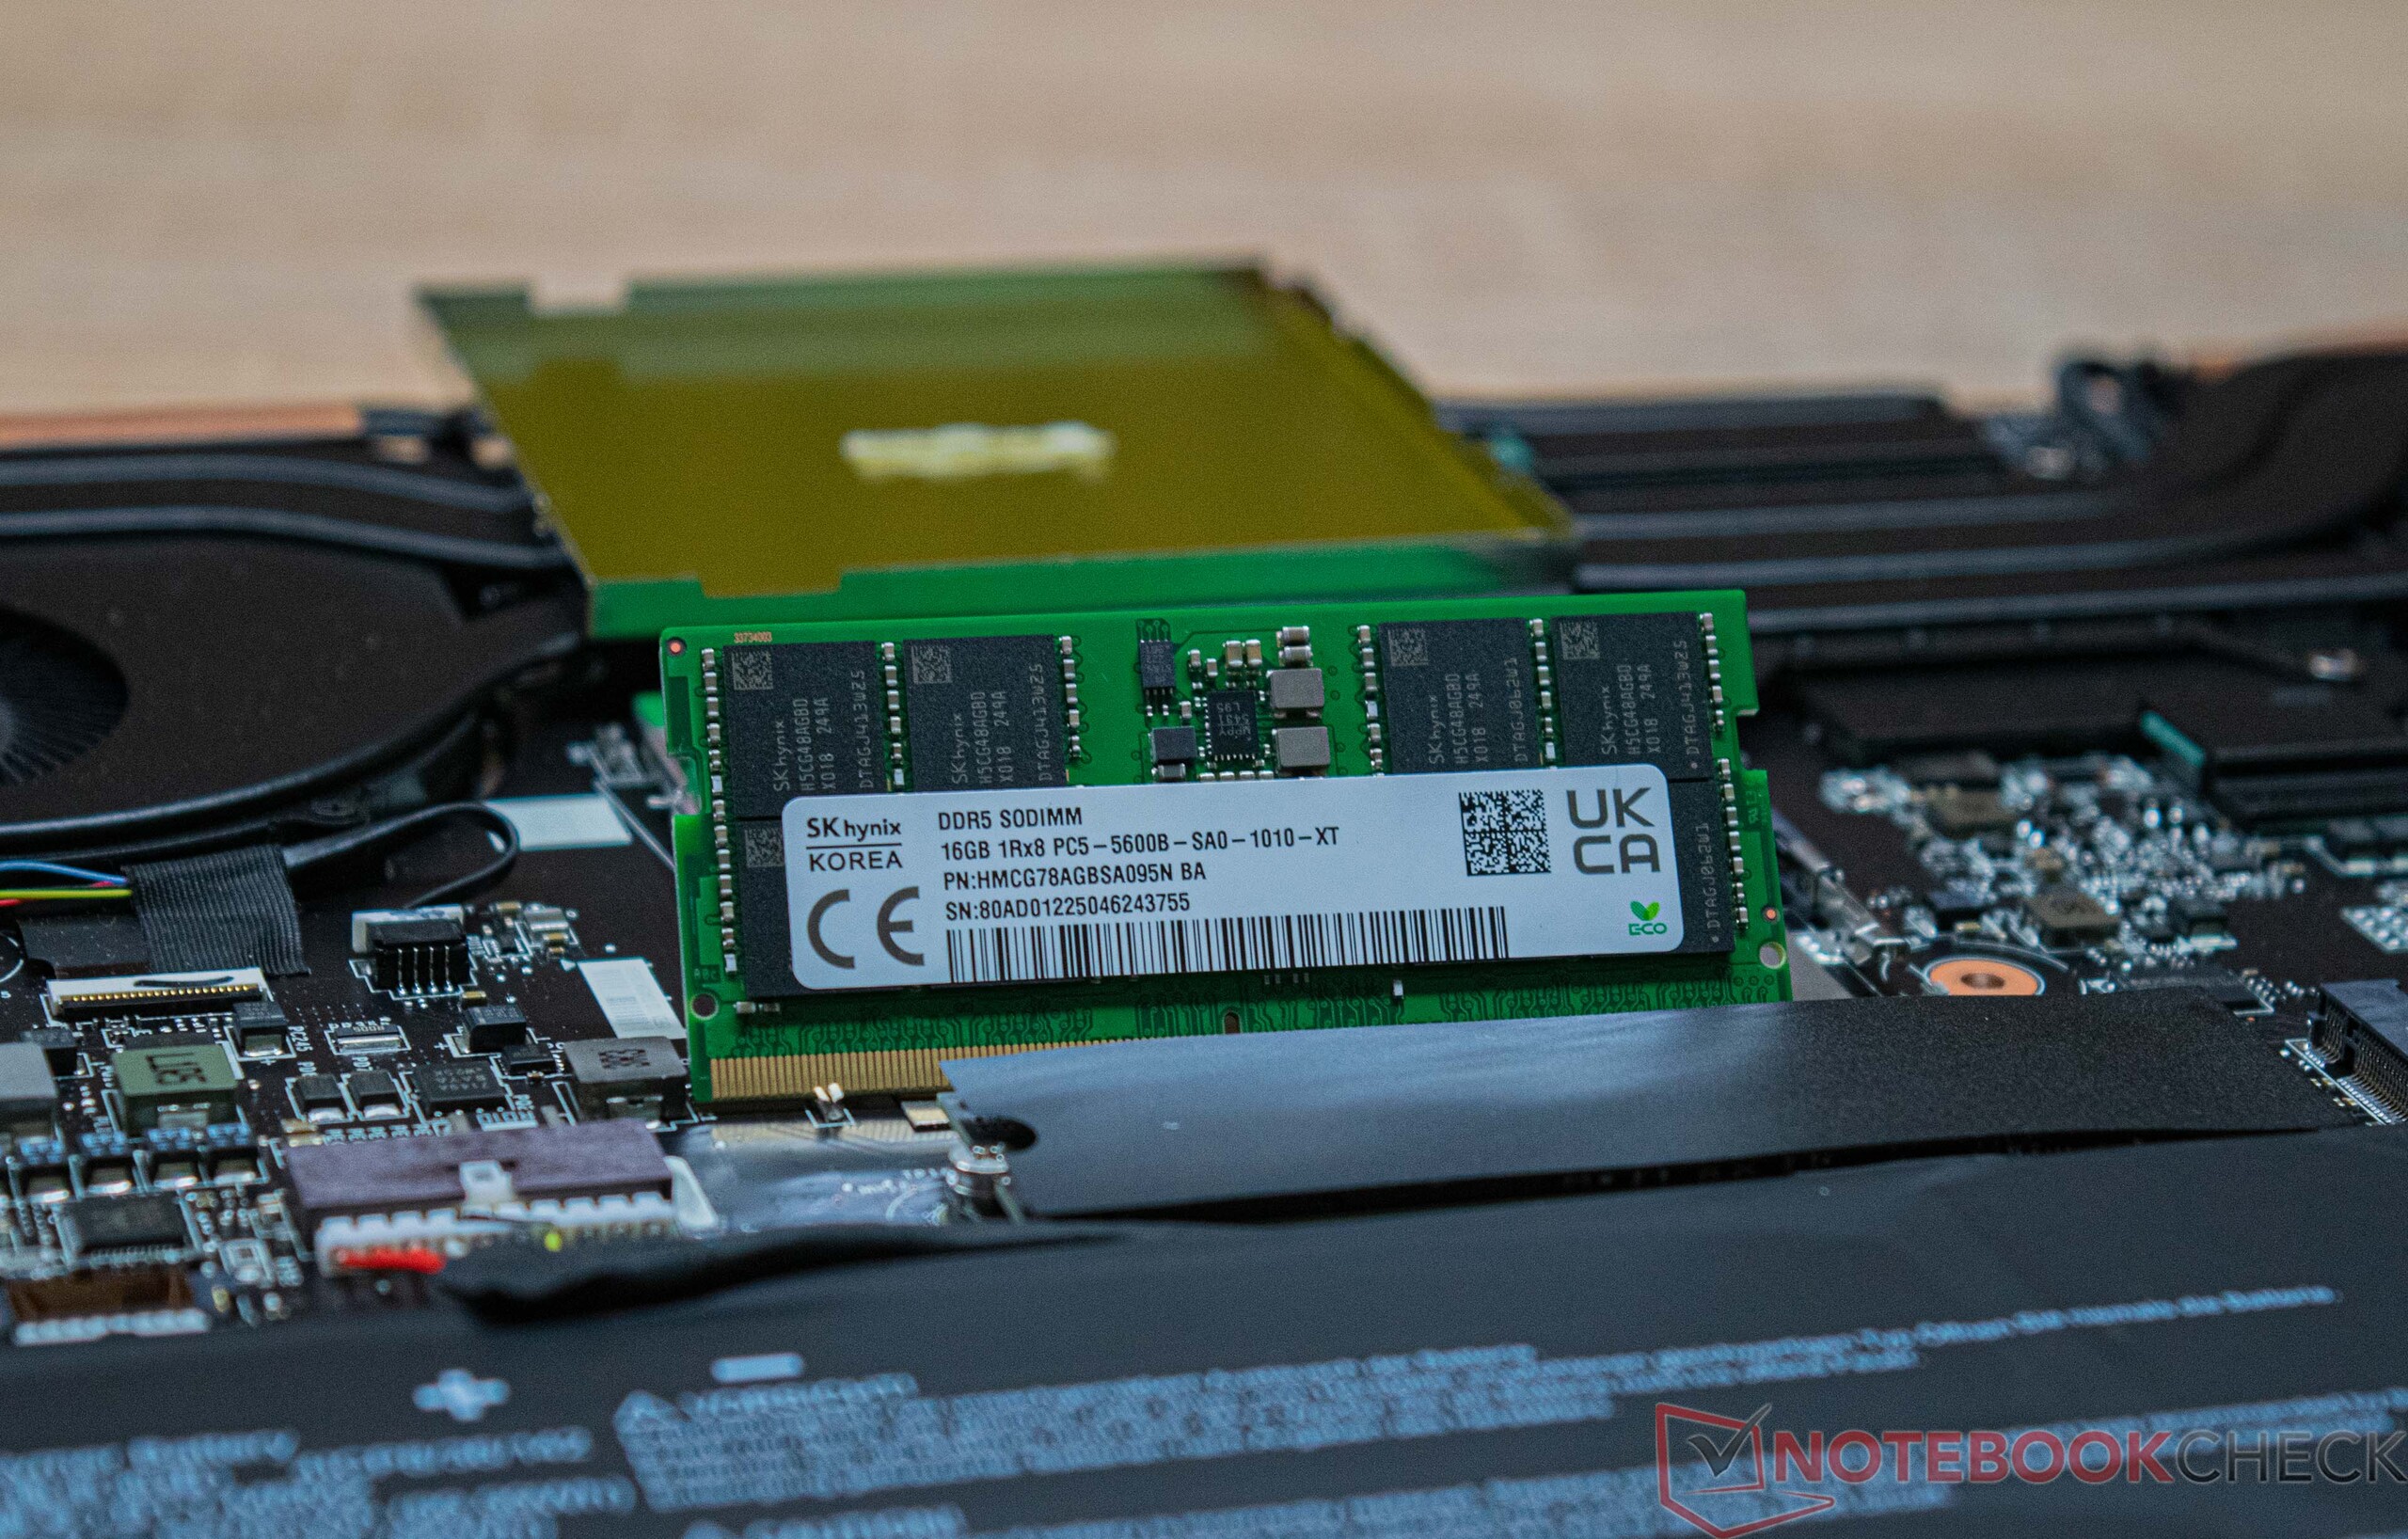
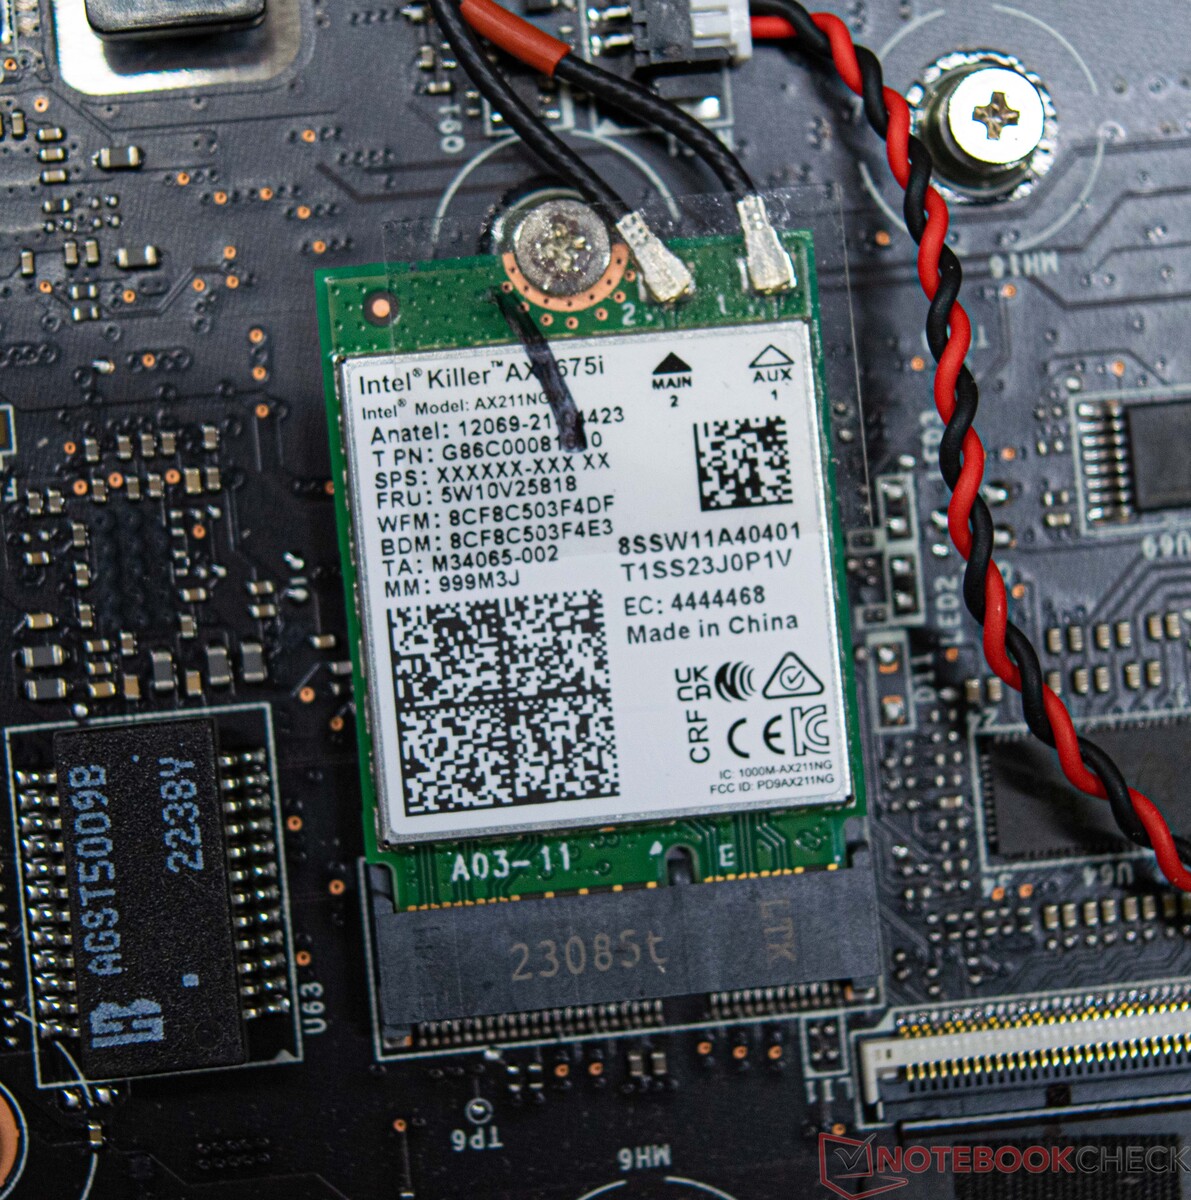
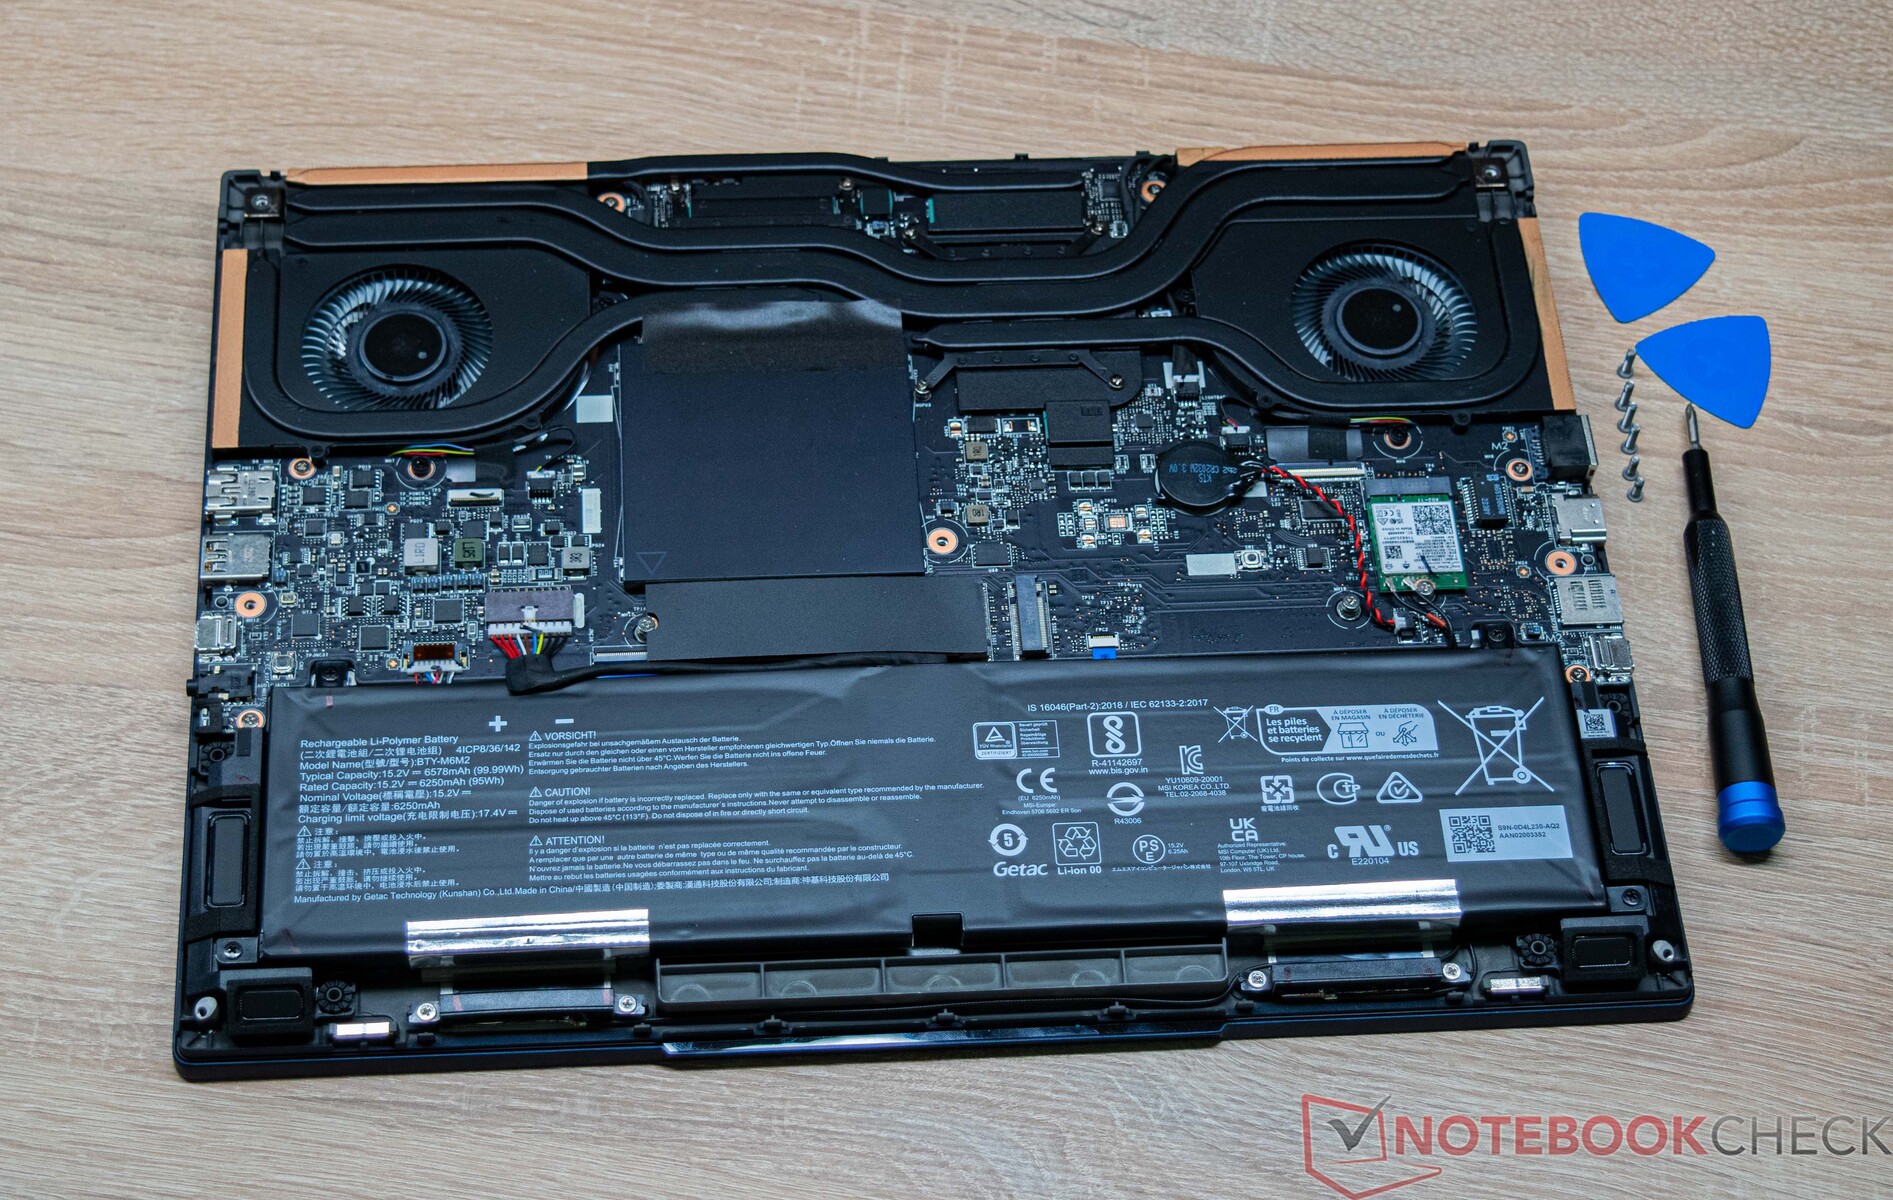
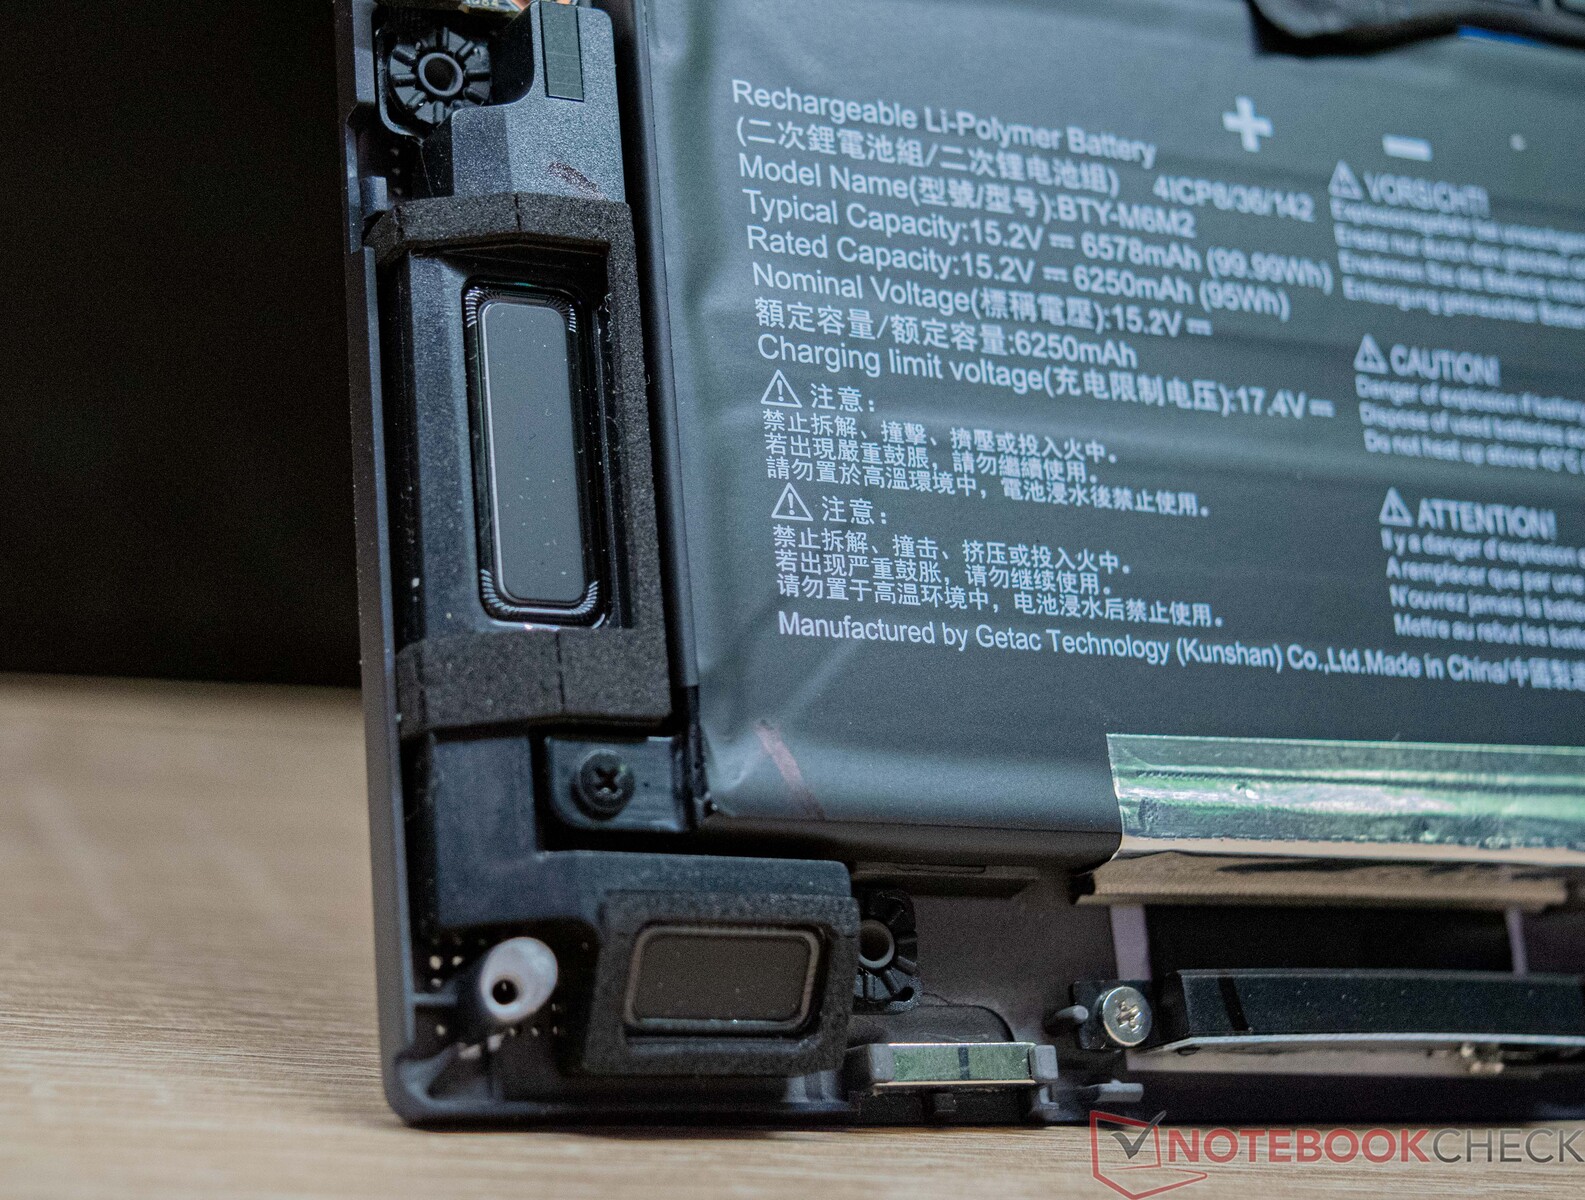
维护
可以对微星Stealth 16 Studio A13VG进行维护工作。然而,为了做到这一点,必须拆开由一些螺丝固定的底板。卸下螺丝后,底板仍然牢牢地固定在底座上。然而,利用适当的工具,我们能够拆除底板。尽管如此,建议谨慎行事,以避免损坏。原则上,由于有一个额外的M.2 2280插槽,诸如内存或大容量存储设备等组件可以被替换或扩展。同样,Wi-Fi也不是固定的,也可以被替换或更换。
担保
微星Stealth 16 Studio A13VG有24个月的保修期,包括提货和退货服务。
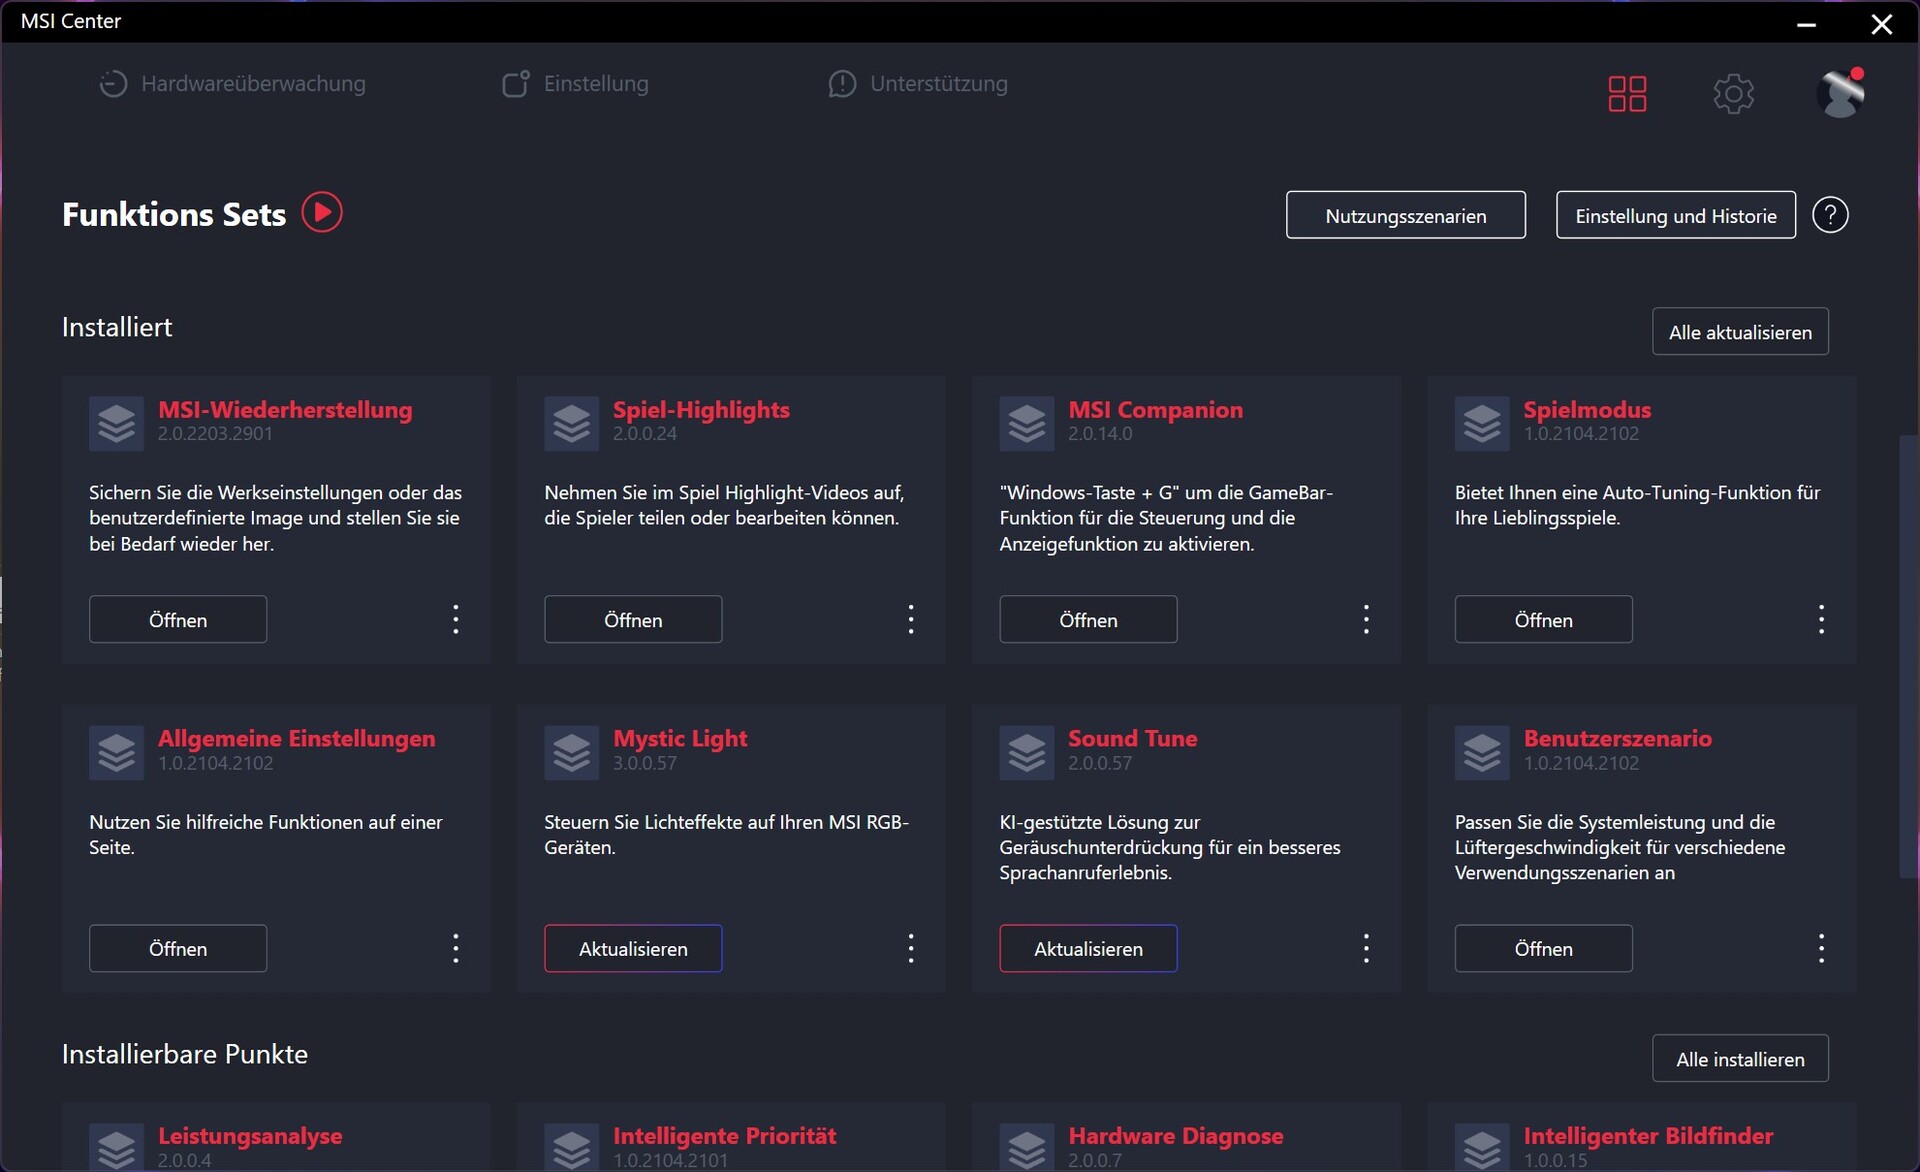
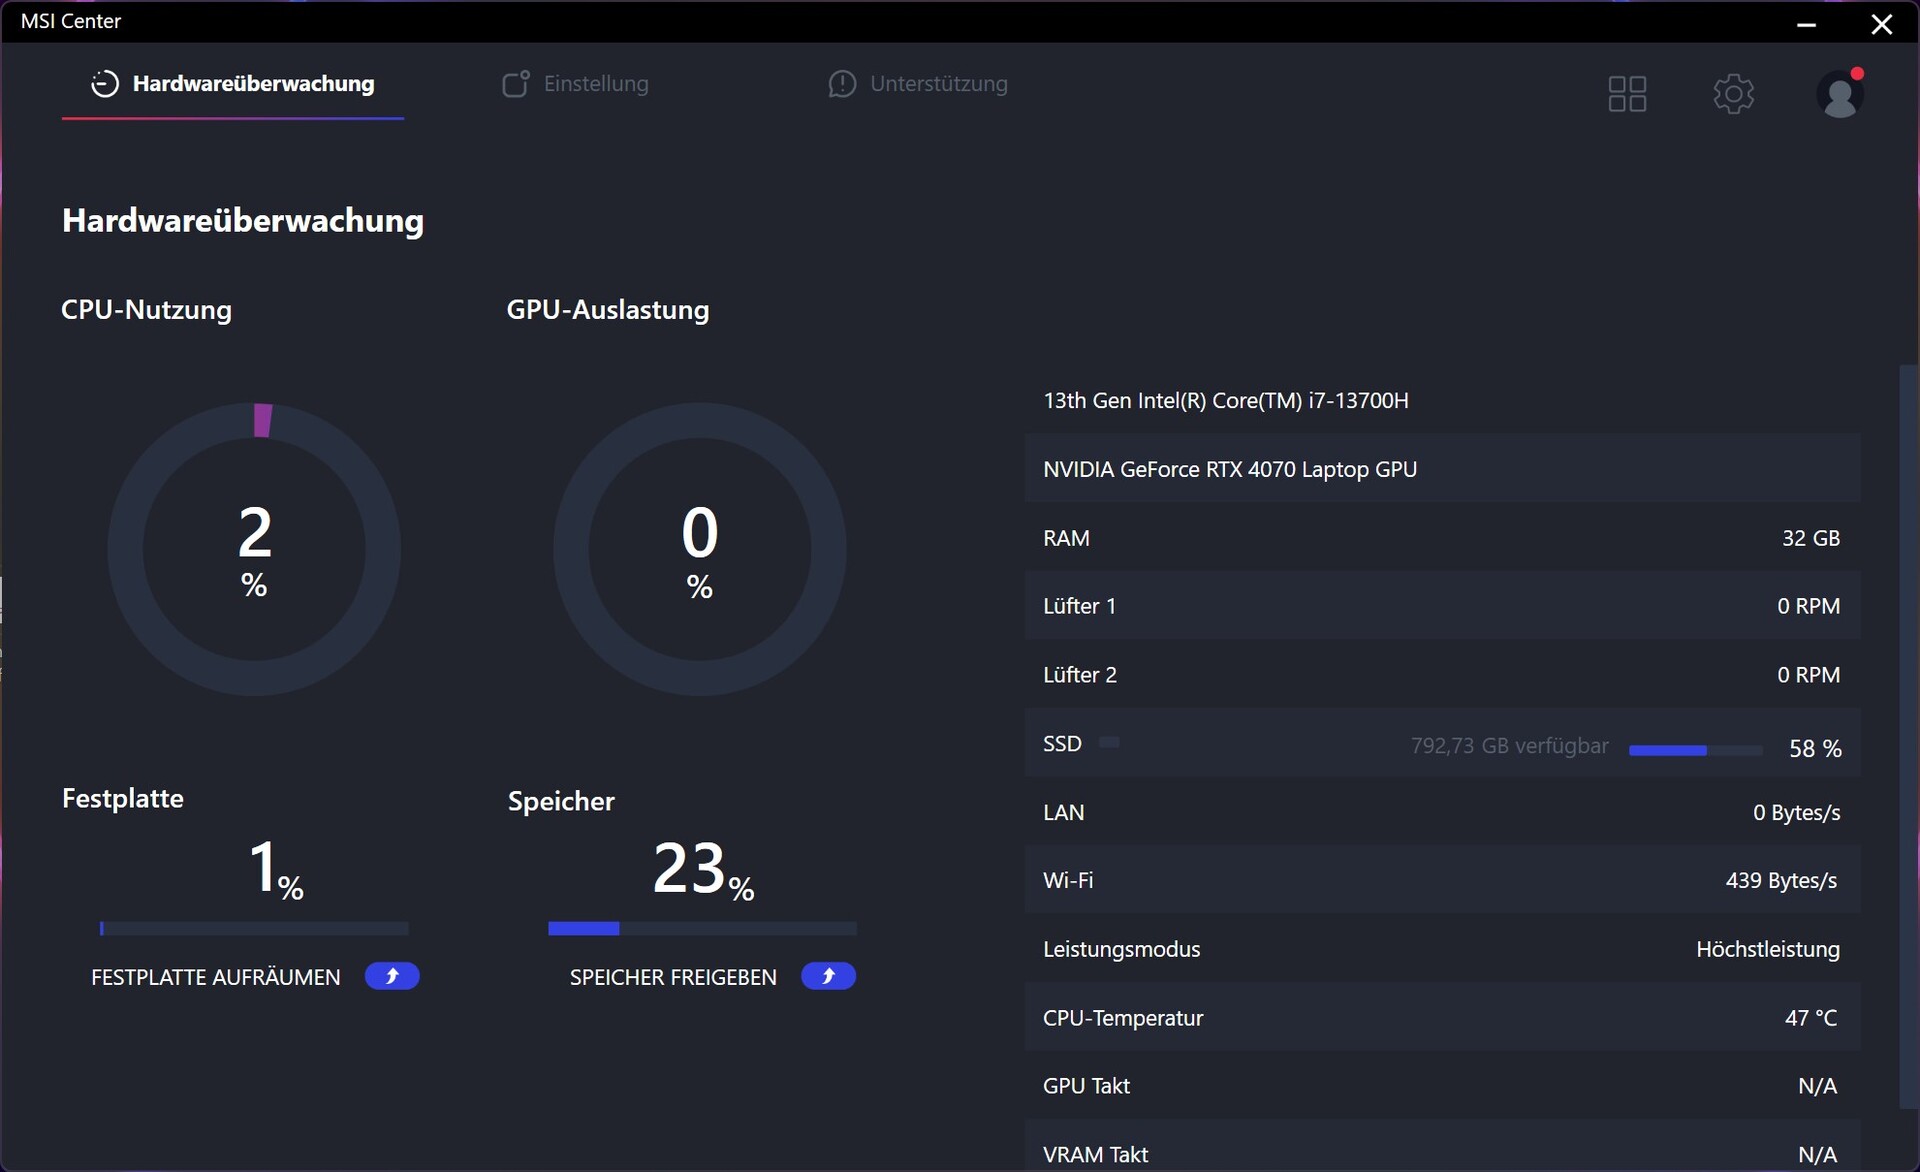
软件 - MSI中心是您的主要办公室
通过微星中心,制造商有一个合适的工具来控制和监测微星Stealth 16 Studio A13VG。 在测试中,我们使用微星中心没有遇到问题。使用这个工具,用户可以调节笔记本电脑的性能,除其他外,极大地影响了背景噪音的数量。从性能的角度来看,也有明显的差异,由于各种模式下的功率限制不同。
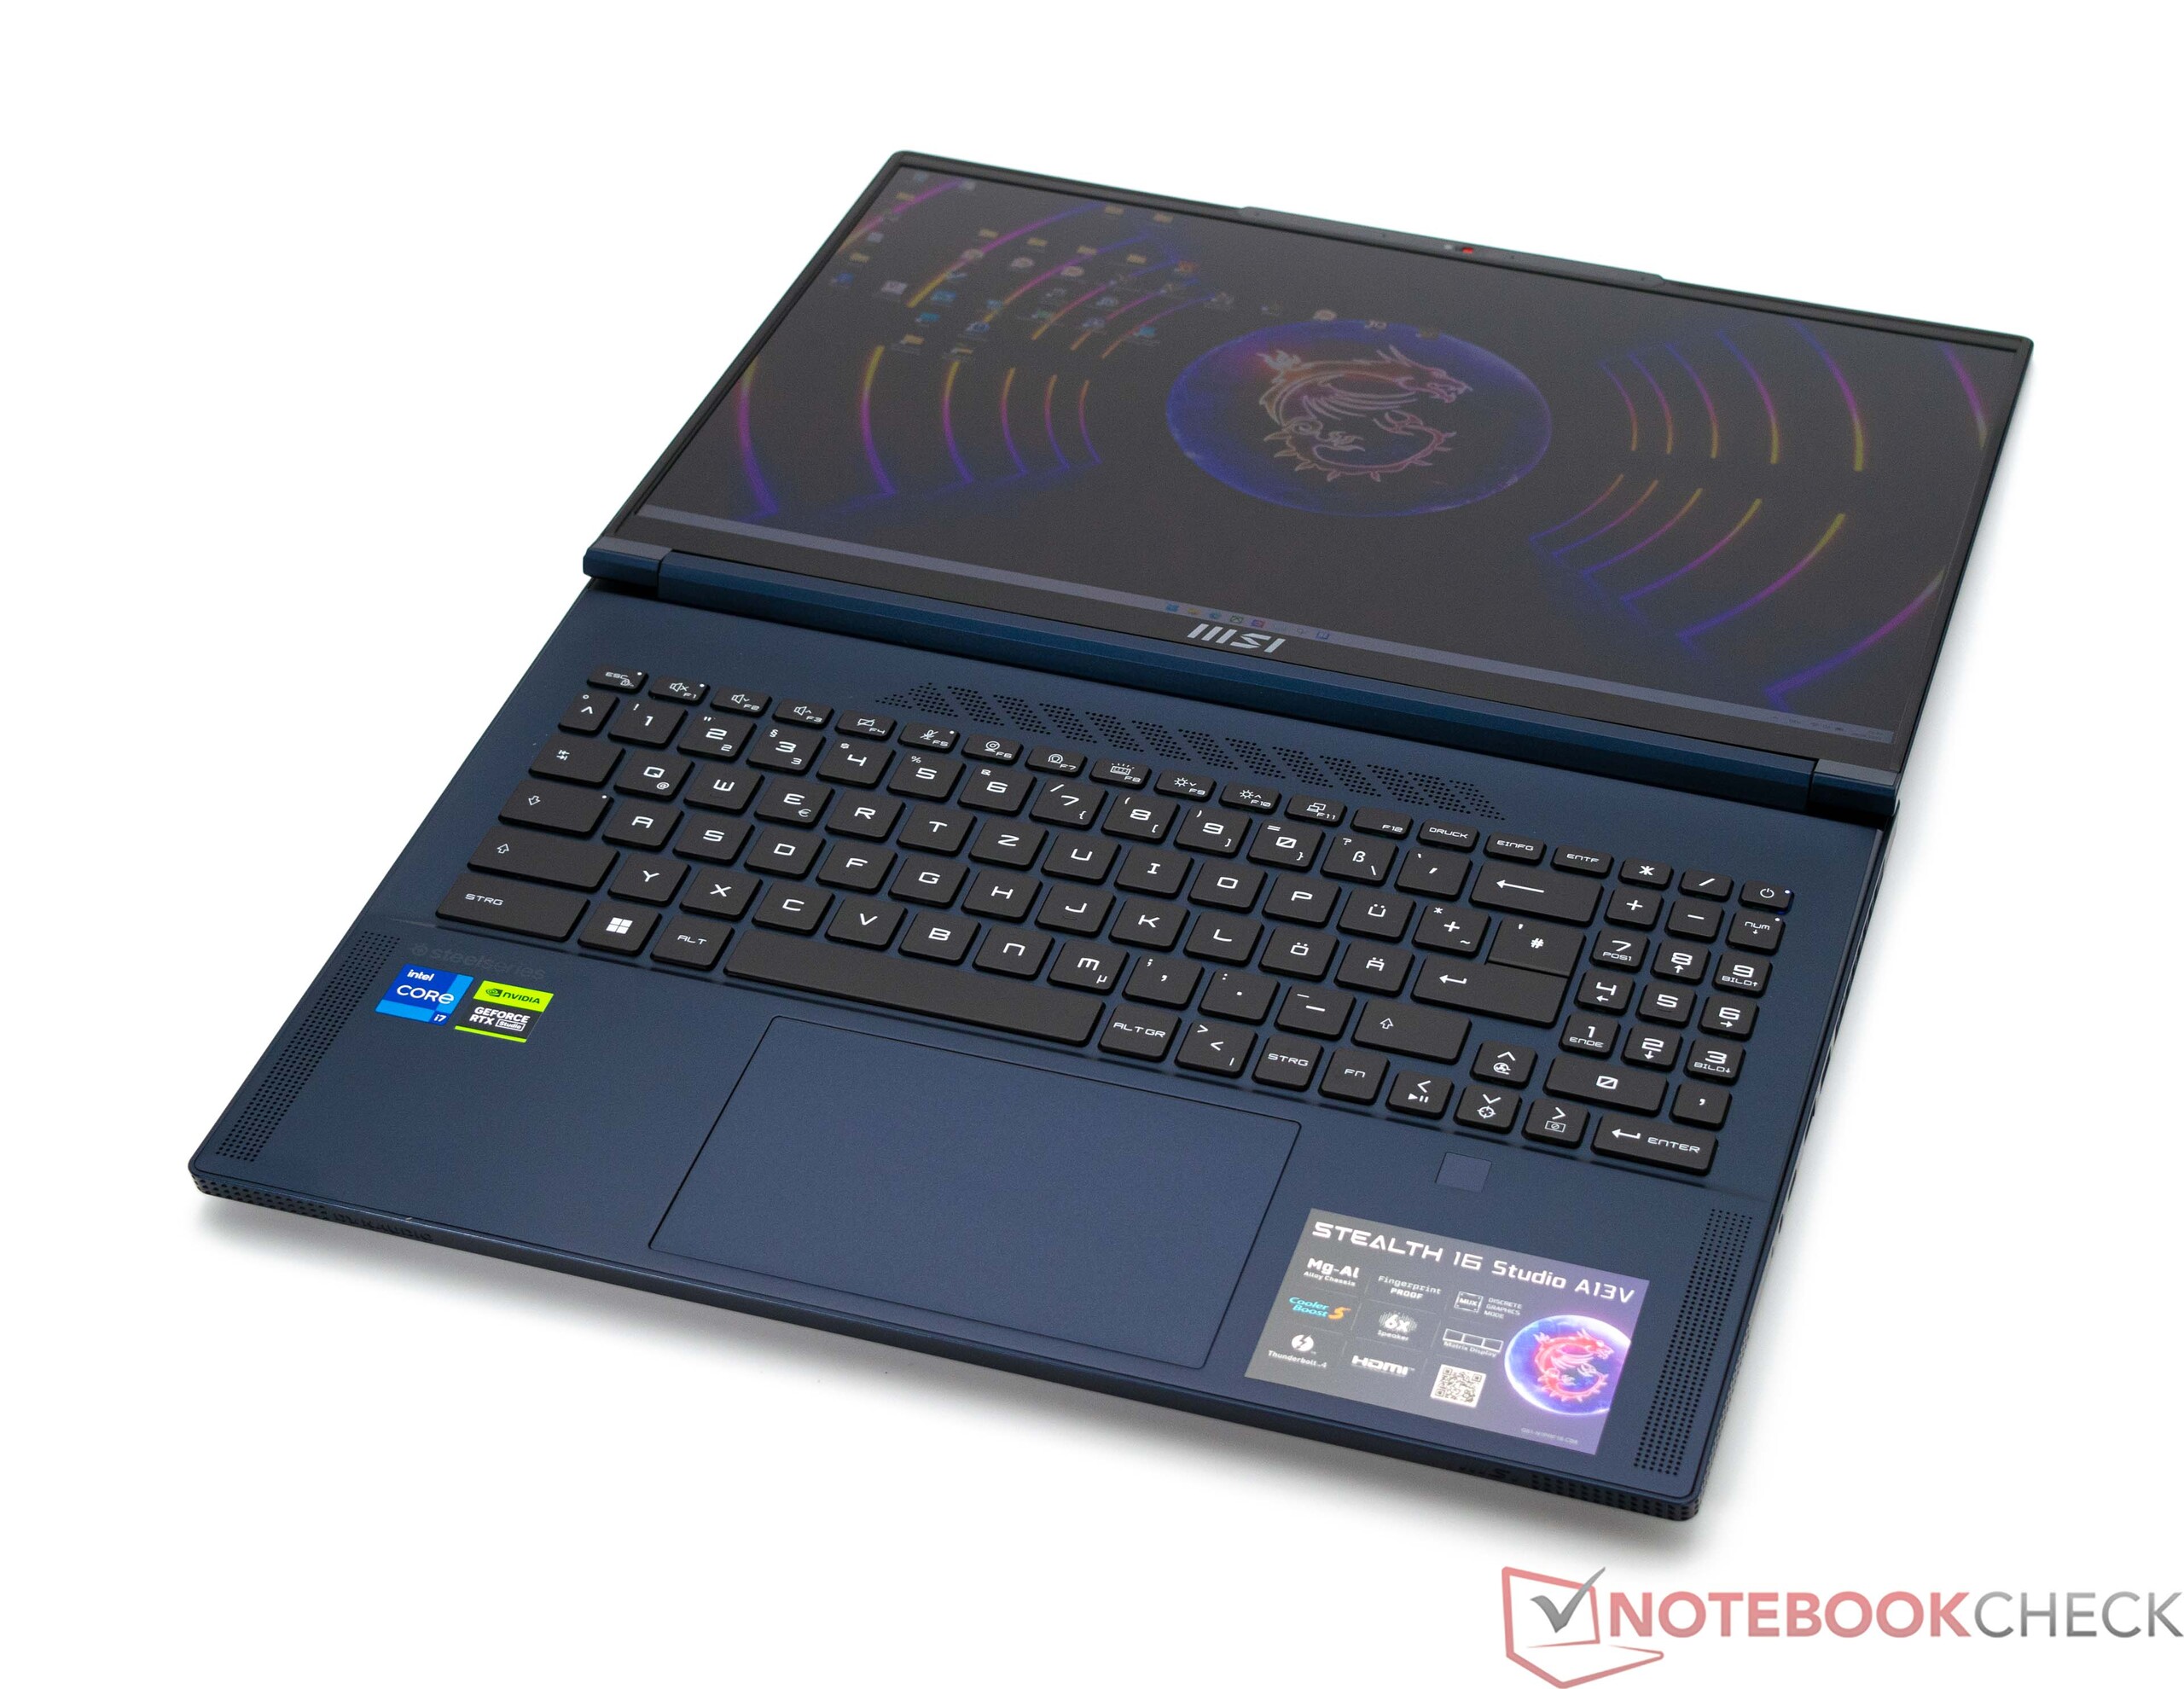
输入设备--熟悉的设计,在日常使用中令人愉快
键盘
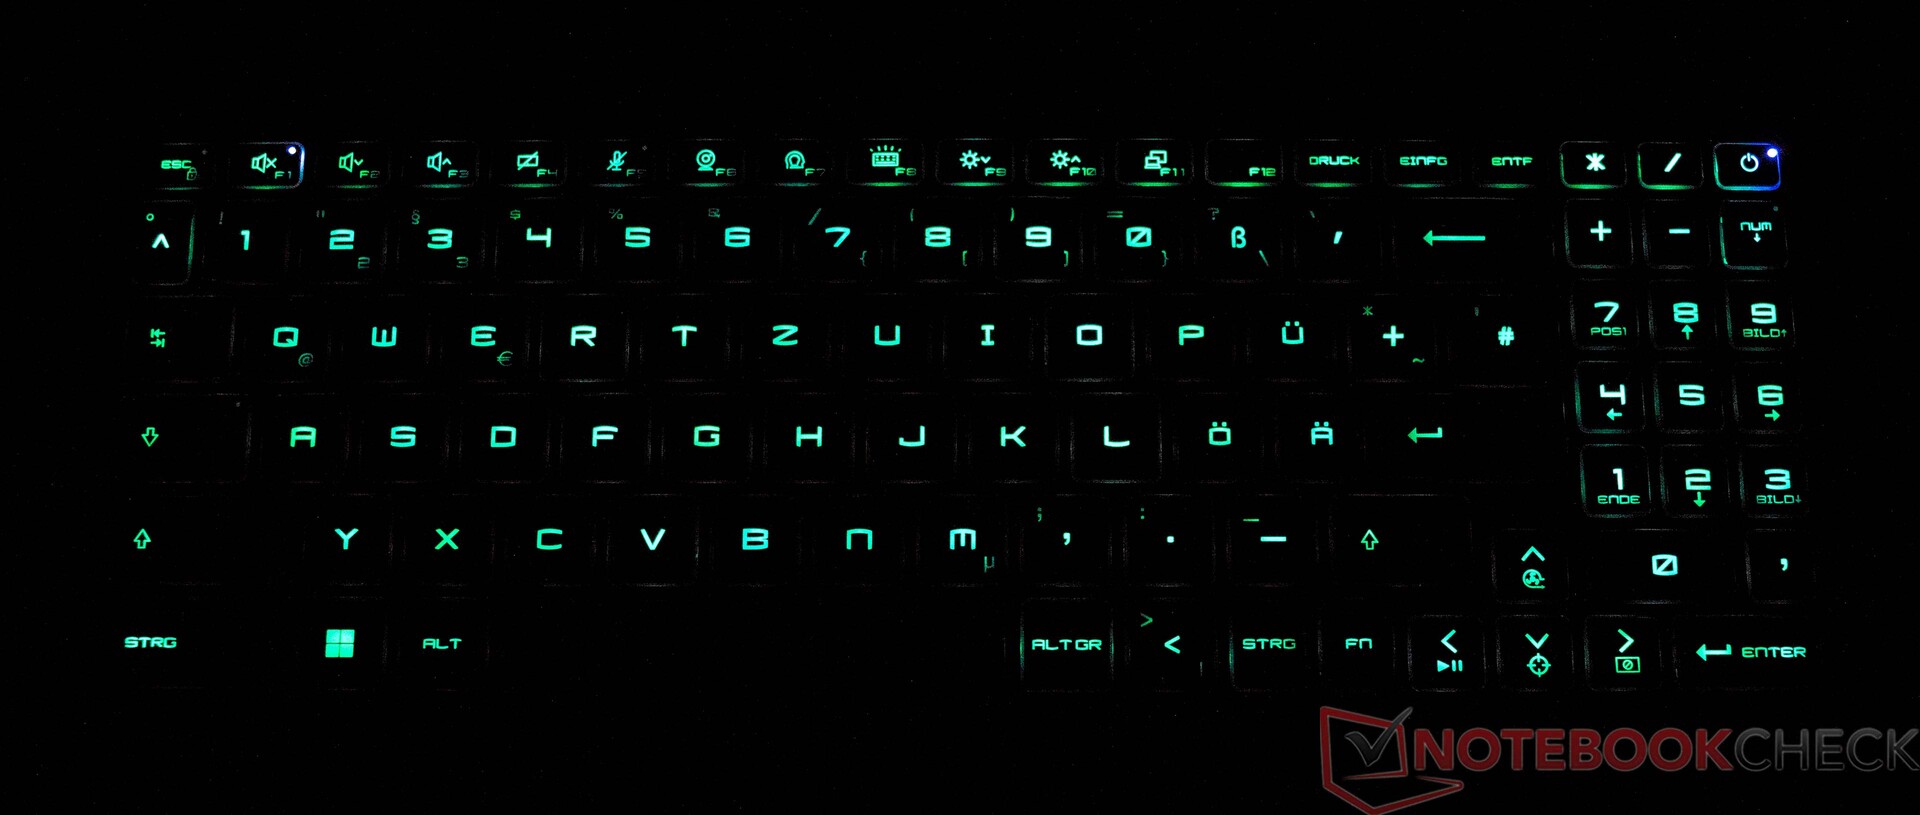
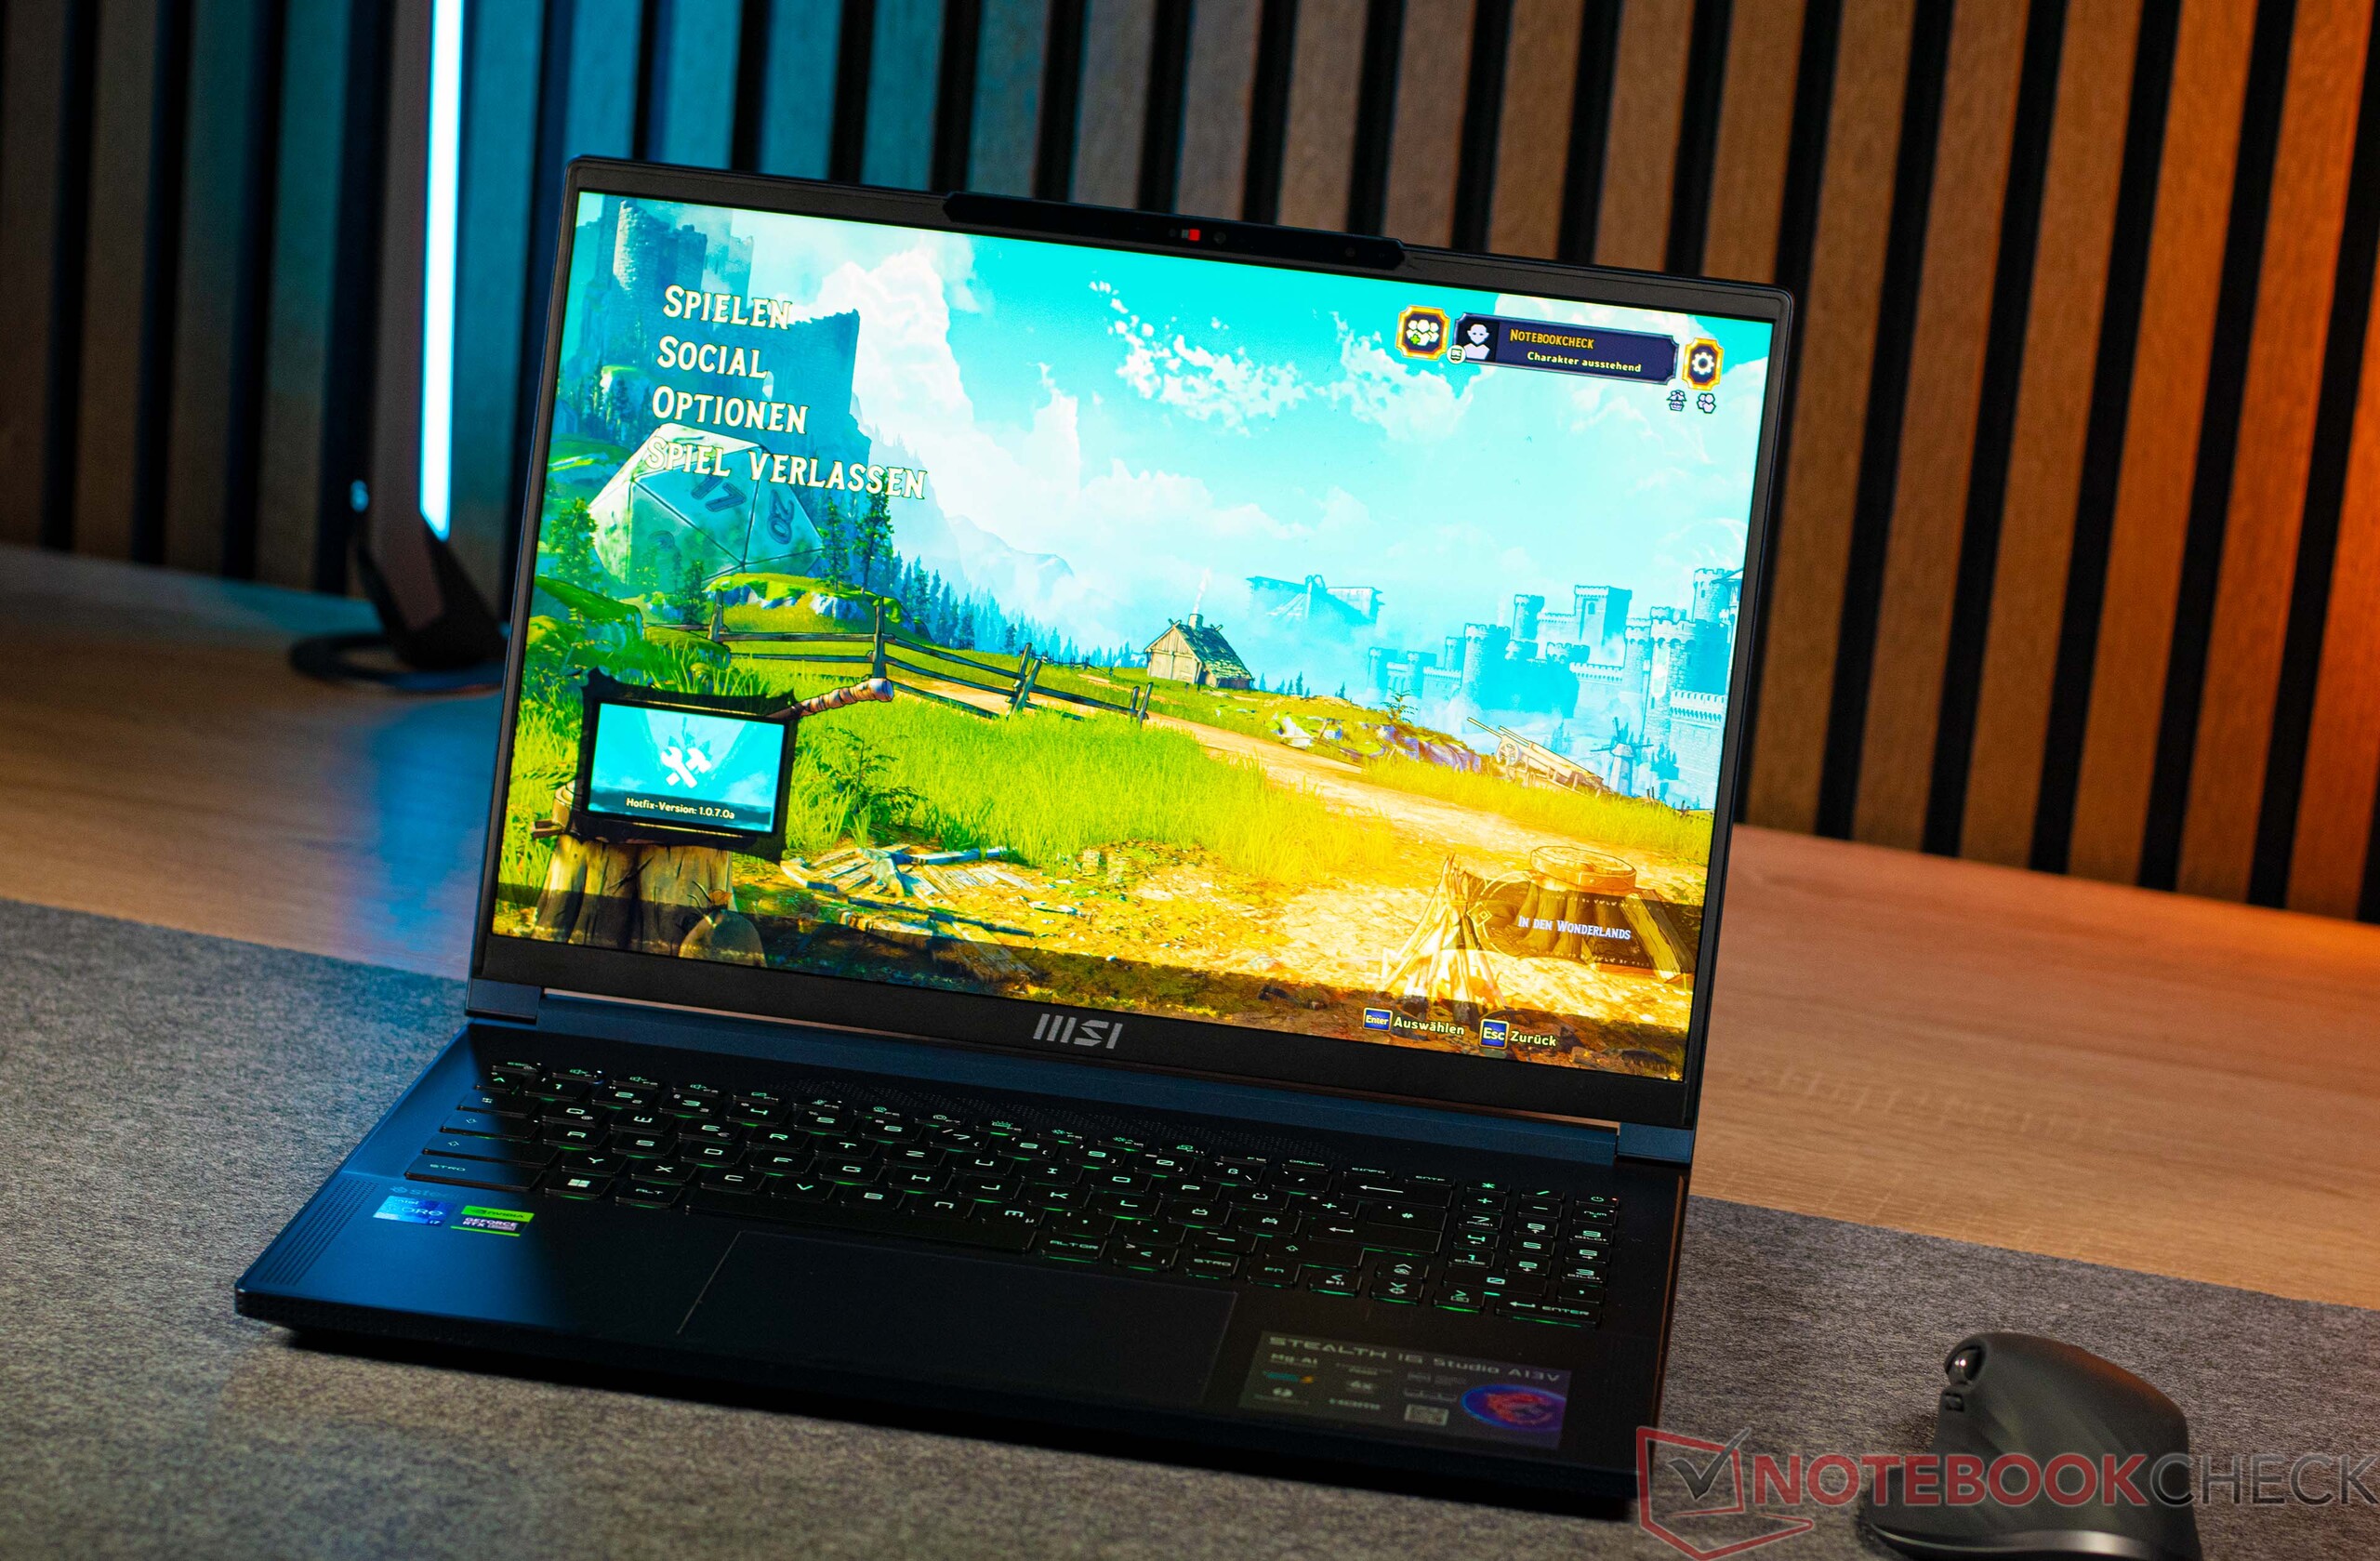
在与SteelSeries的合作中,微星Stealth 16 Studio A13VG被安装了一个包括数字键盘的6行Chiclet键盘。虽然光滑的按键提供了明显的静音效果,但字体是微星的典型特征。键程非常短,压力点明确。因此,你不应该期望在办公室快速打字时收到愤怒的目光,因为背景噪音非常低。背光可以通过使用组合键改变为三个不同的亮度水平之一。值得注意的是,微星决定不把Fn键放在左手边。然而,使用微星中心,可以通过将Windows键和Fn键的分配调换到右侧来解决这个问题。这样做允许用户选择自己的最佳设置。
触摸板
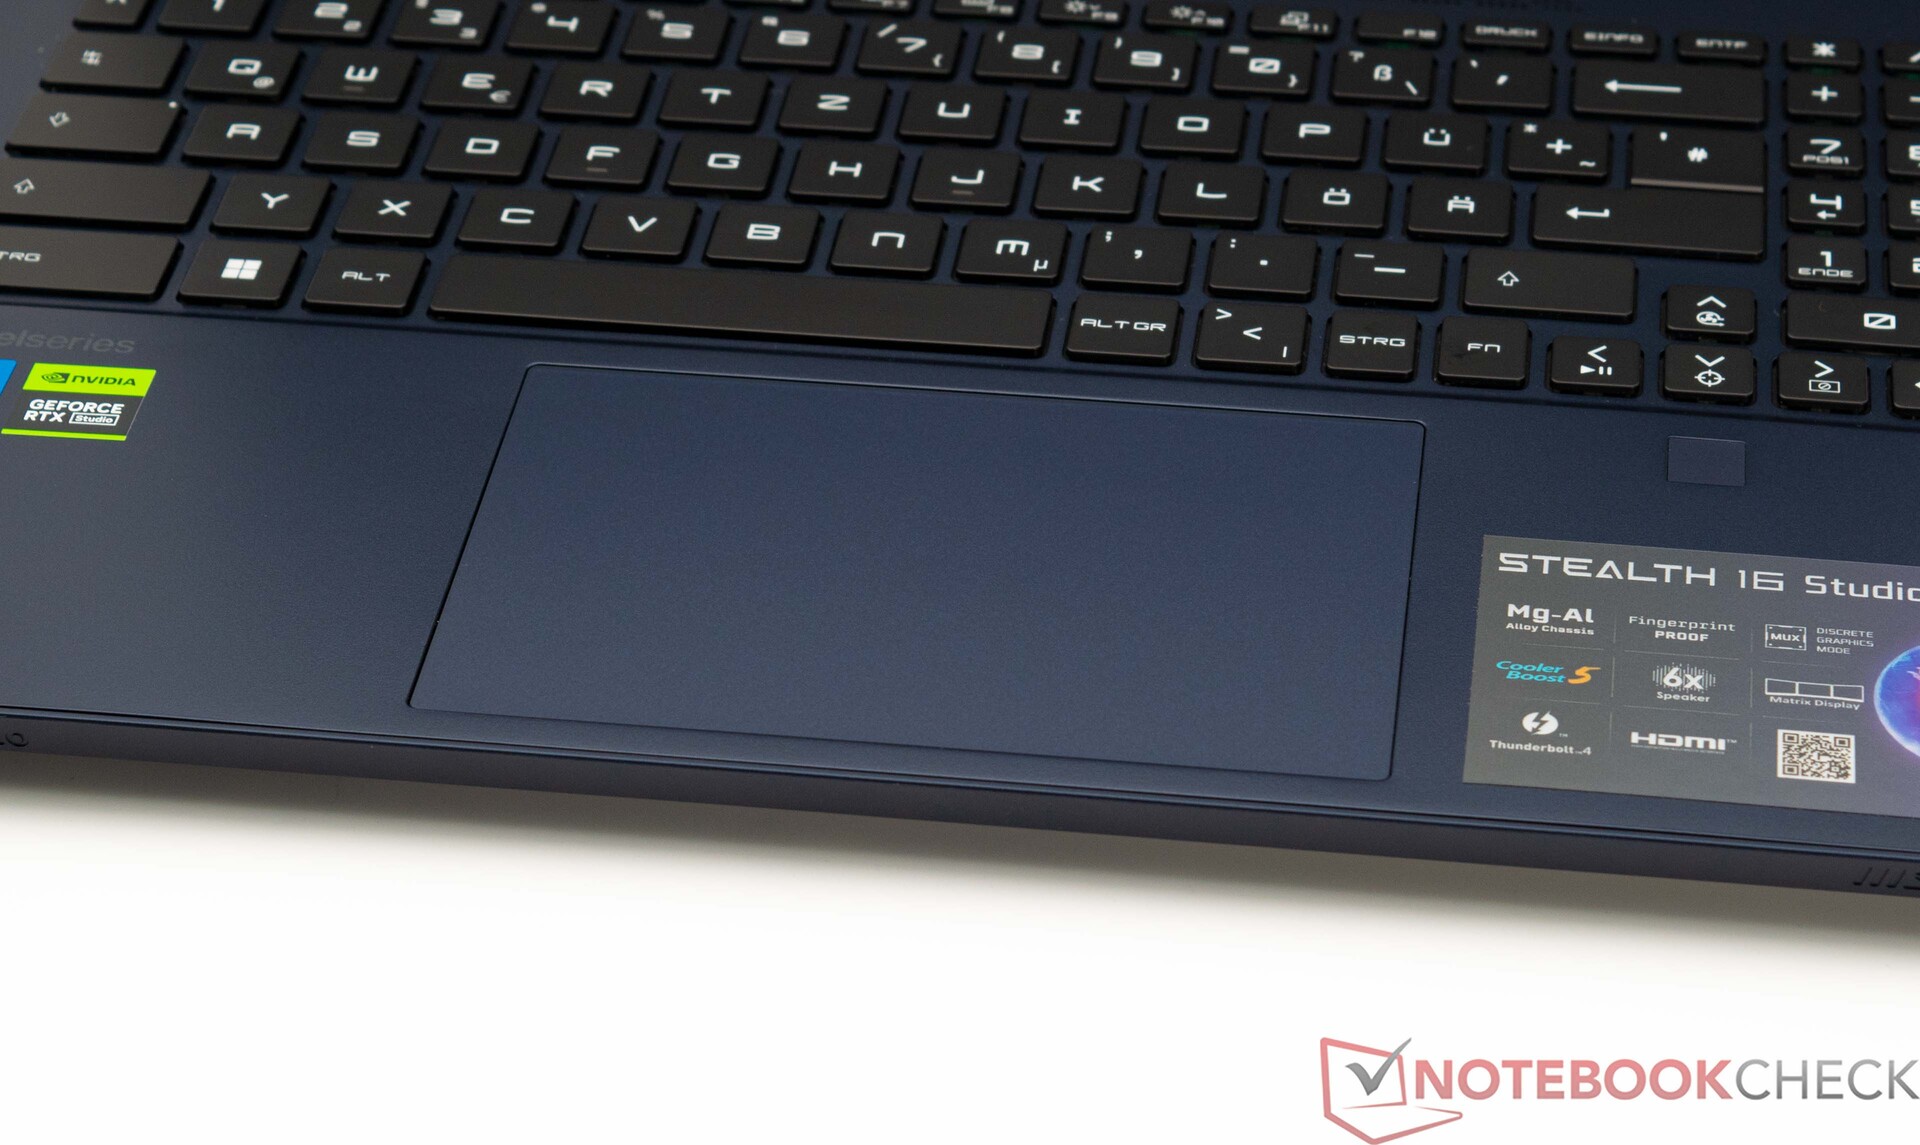
鼠标的替代品可以在一个具有多点触摸功能的触摸板上找到。它的尺寸为13.1 x 8.2厘米,是一个很好的尺寸。从设计上讲,触摸板与底座的顶部表面完美匹配。这个表面明显比掌托有更光滑的感觉。这导致了最佳的滑行性能。触摸板反应灵敏,非常精确,甚至在边缘处也是如此。触摸板为输入提供了较短的行程,有助于为用户提供一个清晰的压力点和清晰的反馈。
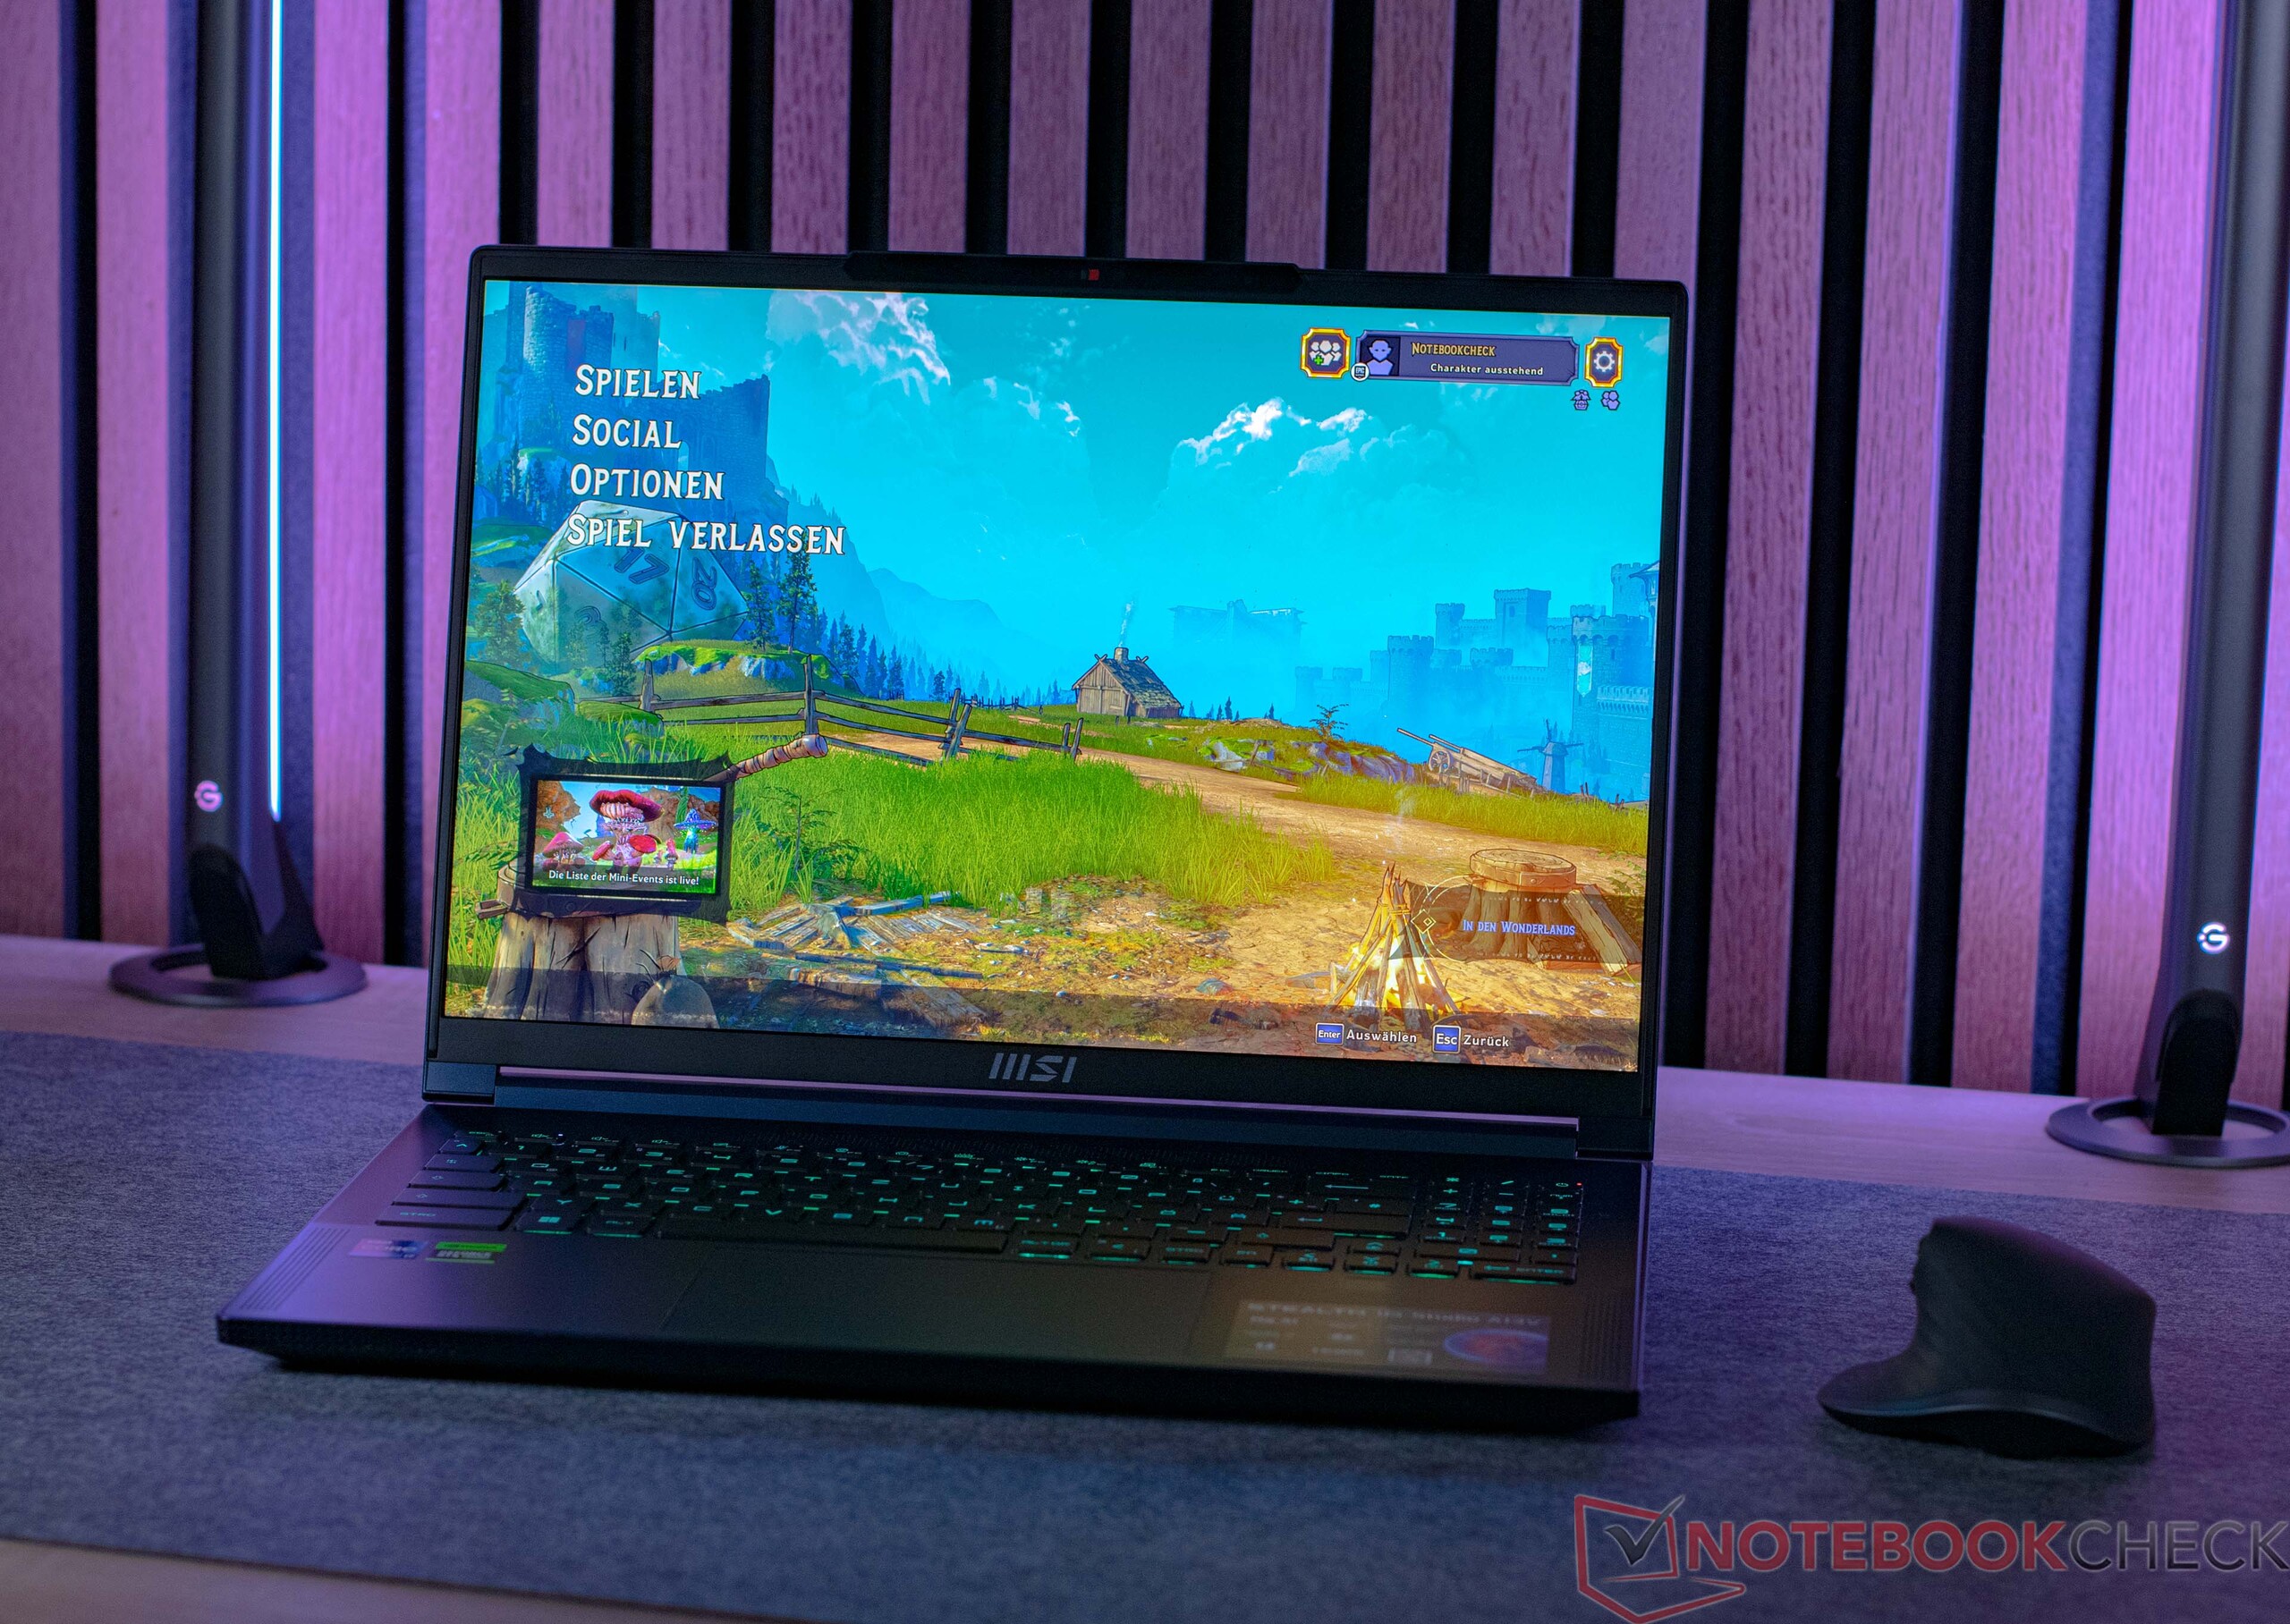
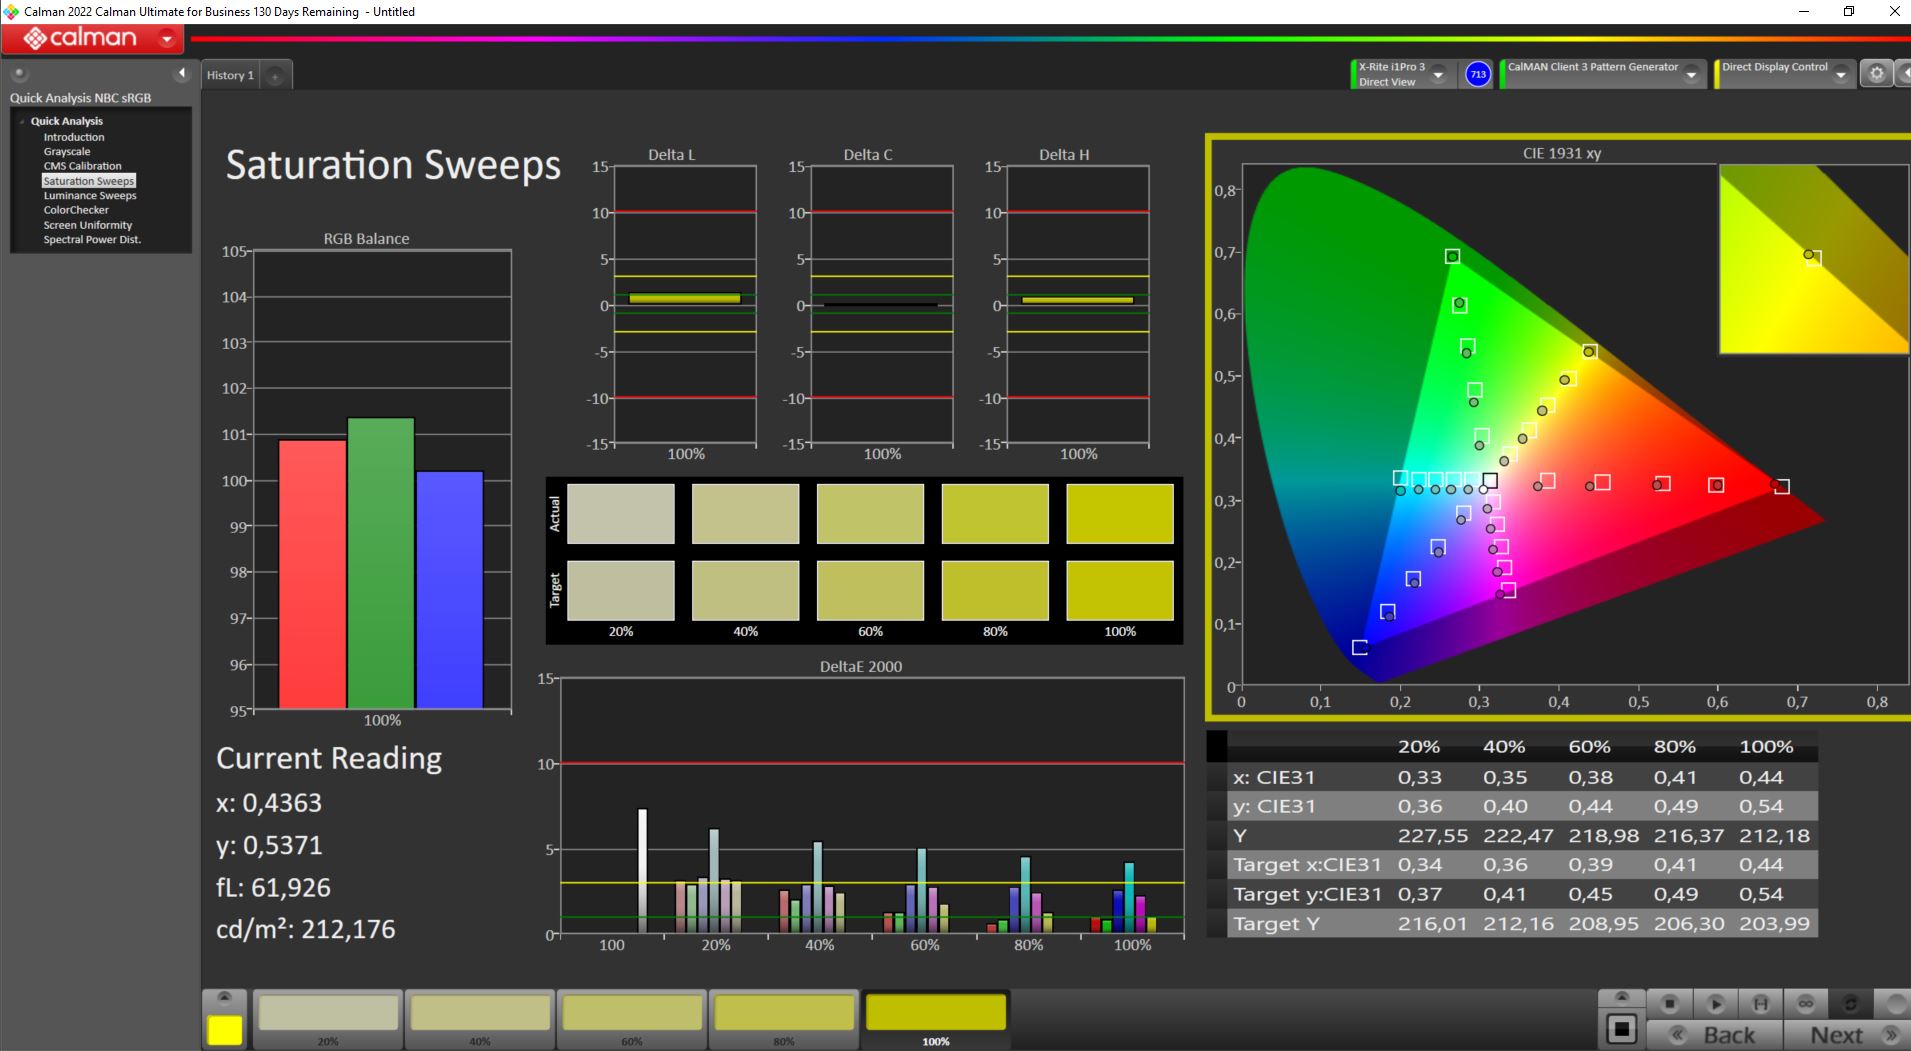
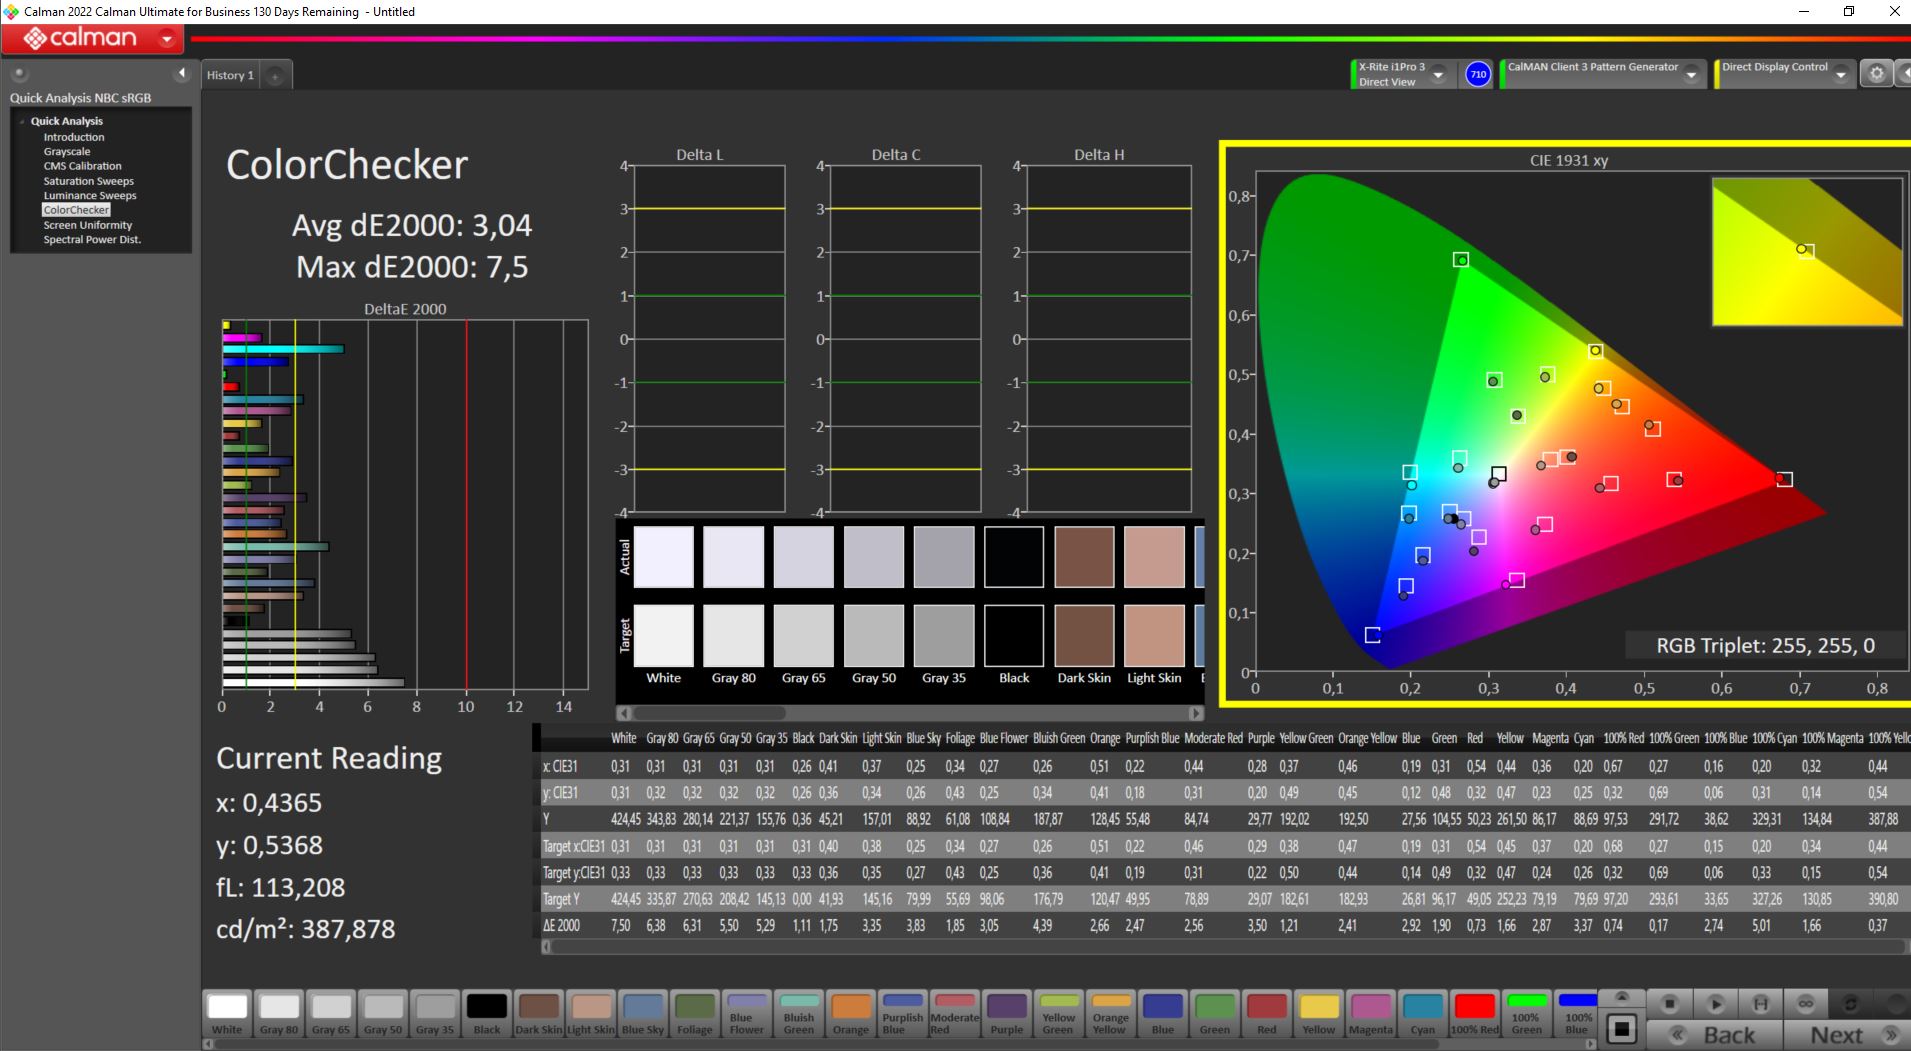
显示 - 240赫兹,用户友好的16:10长宽比

微星Stealth 16 Studio A13VG配备了良好的16英寸QHD+面板,其240赫兹的刷新率应该可以满足大多数游戏玩家的愿望。我们测量的平均显示亮度为424cd/m²。这意味着该显示器相对较亮,它甚至能够比许多竞争对手更好。只有Acer Nitro 16 和Asus ROG Flow X16 提供更明亮的显示屏。我们的评测设备不得不与轻微的屏幕出血作斗争,这也是我们在授予显示分数时不得不考虑的问题。相比之下,没有检测到PWM,这可以防止在长时间使用时出现疲劳的迹象。
微星Stealth 16 Studio A13VG没有指定其他显示选项,如4K面板。
| |||||||||||||||||||||||||
Brightness Distribution: 88 %
Center on Battery: 428 cd/m²
Contrast: 1146:1 (Black: 0.37 cd/m²)
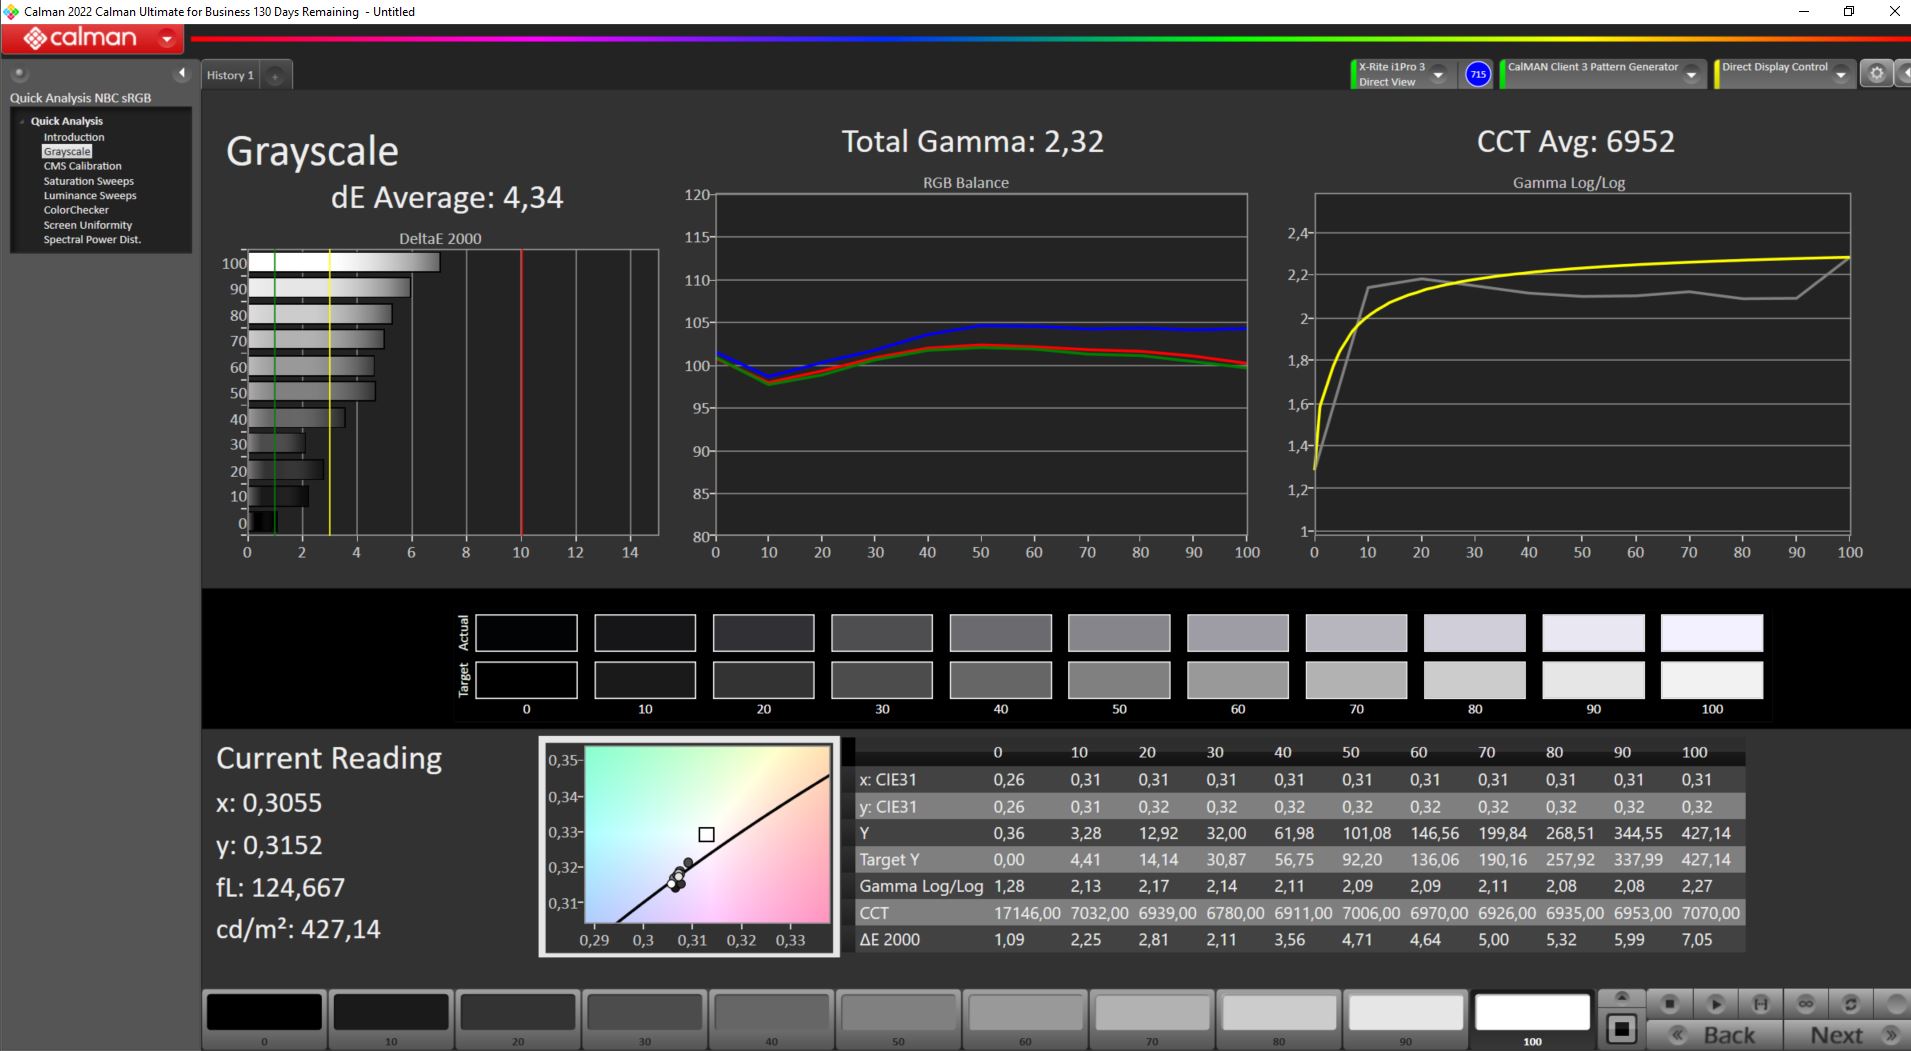
ΔE ColorChecker Calman: 3.04 | ∀{0.5-29.43 Ø4.71}
calibrated: 3.04
ΔE Greyscale Calman: 4.34 | ∀{0.09-98 Ø4.96}
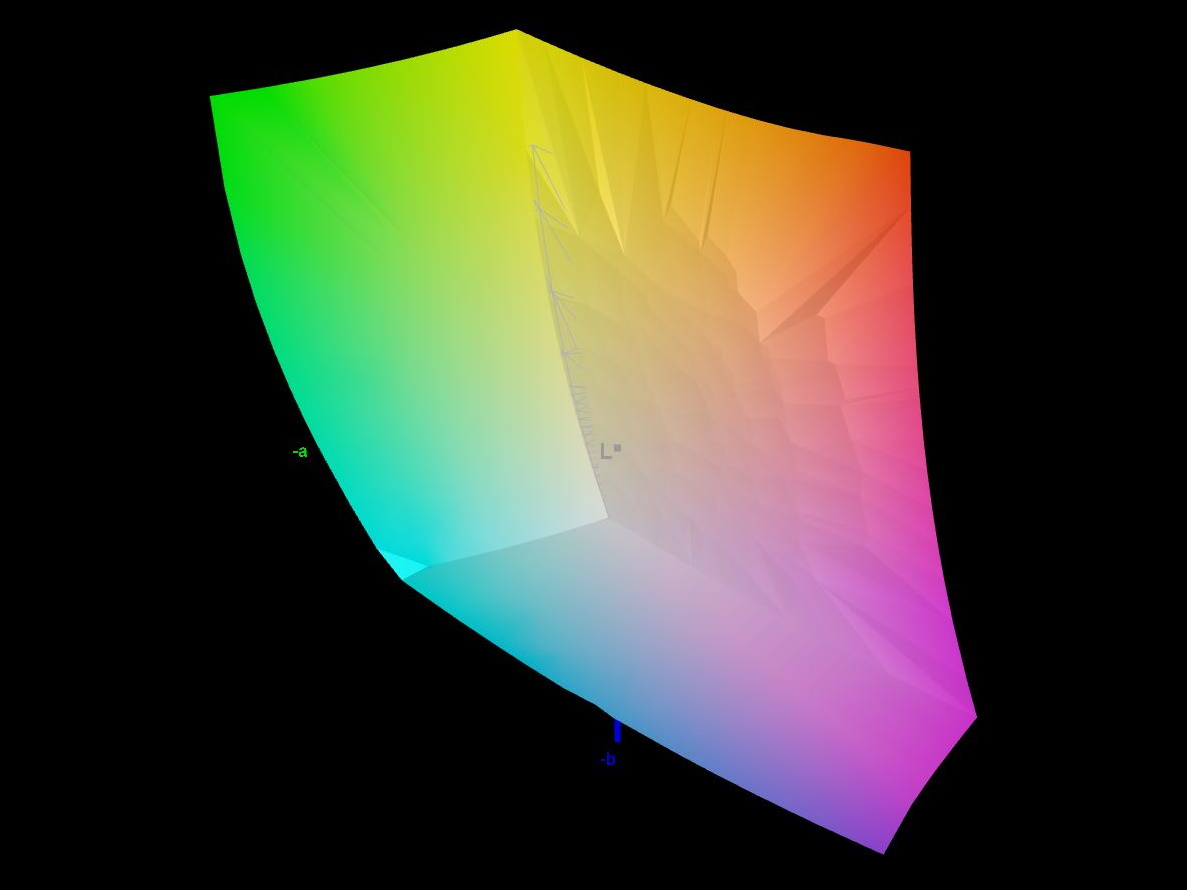
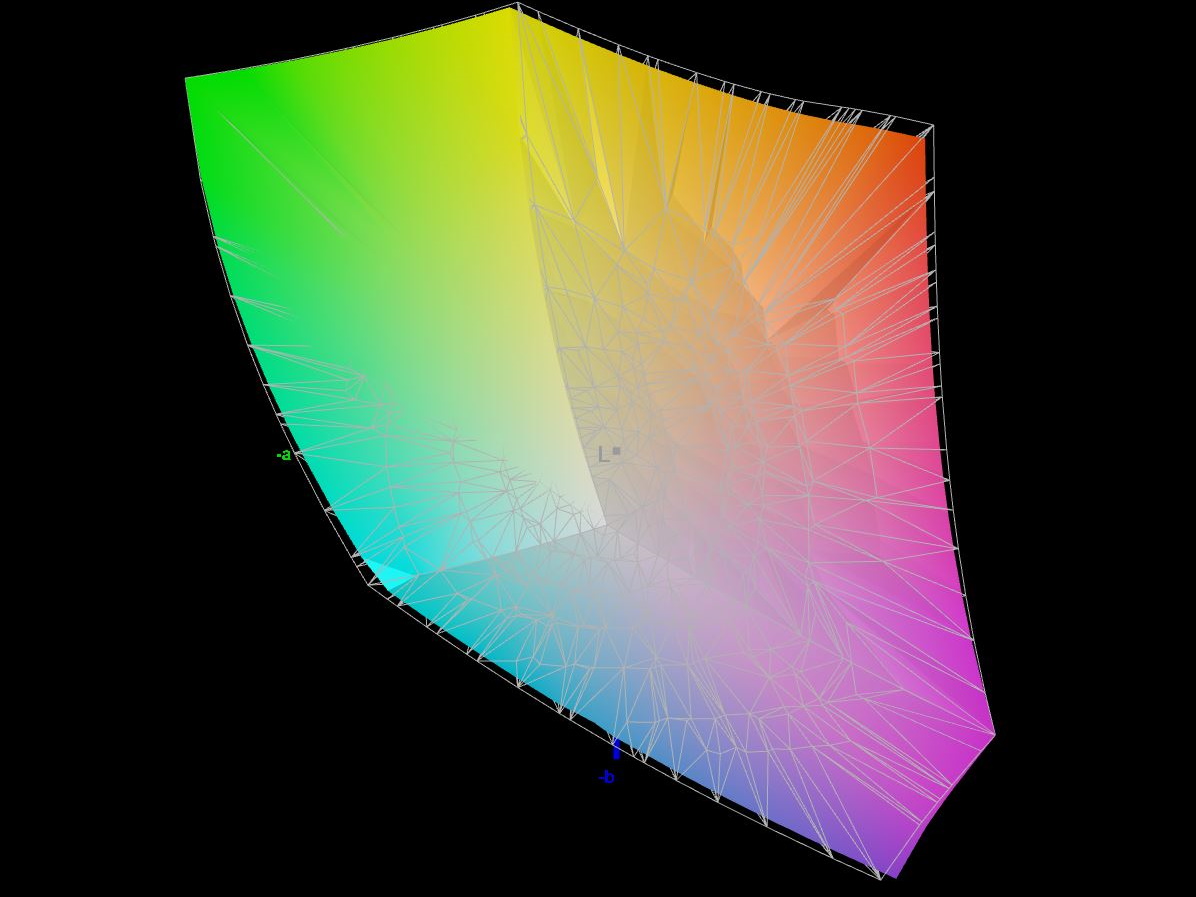
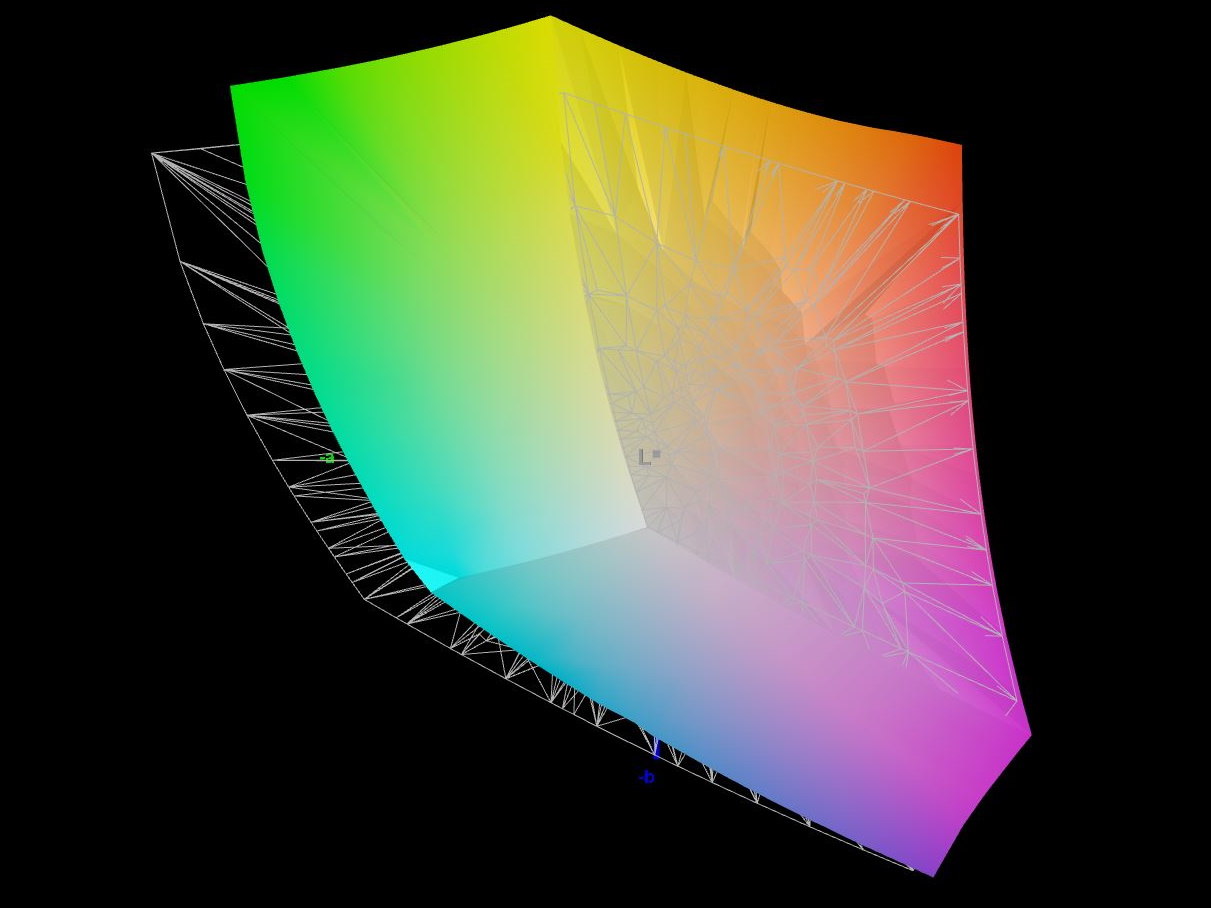
84.8% AdobeRGB 1998 (Argyll 3D)
99.7% sRGB (Argyll 3D)
96.4% Display P3 (Argyll 3D)
Gamma: 2.32
CCT: 6952 K
| MSI Stealth 16 Studio A13VG AUO26A9, IPS, 2560x1600, 16" | Asus ROG Flow X16 GV601V TMX1603 (TL160ADMP03-0), IPS, 2560x1600, 16" | Medion Erazer Major X20 BOE CQ NE160QDM-NZ1, IPS, 2560x1600, 16" | Acer Nitro 16 AN16-41 BOE CQ NE16QDM-NY1, IPS, 2560x1600, 16" | Corsair Voyager a1600 BOE0A3B, IPS, 2560x1600, 16" | Gigabyte AERO 16 OLED BSF Samsung SDC4191 (ATNA60YV09-0, OLED, 3840x2400, 16" | |
|---|---|---|---|---|---|---|
| Display | 0% | -15% | -16% | -16% | 6% | |
| Display P3 Coverage (%) | 96.4 | 96.61 0% | 69.4 -28% | 67.9 -30% | 68.7 -29% | 99.9 4% |
| sRGB Coverage (%) | 99.7 | 99.92 0% | 98 -2% | 99.1 -1% | 98.2 -2% | 100 0% |
| AdobeRGB 1998 Coverage (%) | 84.8 | 84.63 0% | 70.9 -16% | 69.9 -18% | 70.1 -17% | 96.4 14% |
| Response Times | -11% | -114% | -70% | -137% | 60% | |
| Response Time Grey 50% / Grey 80% * (ms) | 4.4 ? | 3.8 ? 14% | 13.1 ? -198% | 11 ? -150% | 13 ? -195% | 2 ? 55% |
| Response Time Black / White * (ms) | 5.6 ? | 7.6 ? -36% | 7.3 ? -30% | 5 ? 11% | 10 ? -79% | 1.98 ? 65% |
| PWM Frequency (Hz) | 60 | |||||
| Screen | 21% | 16% | 25% | 6% | 144% | |
| Brightness middle (cd/m²) | 424 | 486 15% | 374 -12% | 520 23% | 355 -16% | 389.97 -8% |
| Brightness (cd/m²) | 411 | 469 14% | 357 -13% | 494 20% | 340 -17% | 395 -4% |
| Brightness Distribution (%) | 88 | 91 3% | 92 5% | 91 3% | 91 3% | 97 10% |
| Black Level * (cd/m²) | 0.37 | 0.39 -5% | 0.33 11% | 0.39 -5% | 0.53 -43% | 0.03 92% |
| Contrast (:1) | 1146 | 1246 9% | 1133 -1% | 1333 16% | 670 -42% | 12999 1034% |
| Colorchecker dE 2000 * | 3.04 | 2.27 25% | 2.43 20% | 1.94 36% | 2.43 20% | 2 34% |
| Colorchecker dE 2000 max. * | 7.5 | 5.73 24% | 3.97 47% | 5.62 25% | 4.31 43% | 4.1 45% |
| Colorchecker dE 2000 calibrated * | 3.04 | 0.6 80% | 1.4 54% | 0.74 76% | 1.14 63% | 1.68 45% |
| Greyscale dE 2000 * | 4.34 | 3.36 23% | 3.1 29% | 2.94 32% | 2.62 40% | 2.23 49% |
| Gamma | 2.32 95% | 2.46 89% | 2.191 100% | 2.37 93% | 2.28 96% | 2.41 91% |
| CCT | 6952 93% | 6625 98% | 6194 105% | 6443 101% | 6909 94% | 6323 103% |
| Total Average (Program / Settings) | 3% /
12% | -38% /
-10% | -20% /
3% | -49% /
-19% | 70% /
103% |
* ... smaller is better
我们的测量显示,sRGB色彩空间的覆盖率良好,几乎达到100%。此外,在P3色彩空间方面,我们看到了一个超过96%的精彩结果,尽管扩展的AdobeRGB色彩空间只能复制到84.8%。通过这些数据,IPS的成绩不错,只输给了Gigabyte AERO 16的OLED面板。尽管如此,这款笔记本电脑可以用于半专业的图像或视频编辑,这是肯定的。
主观上,内置显示屏的图像质量非常好。哑光的表面防止了反射,也没有明显的颗粒感。总之,开箱后,测量的DeltaE-2000色彩值相对接近目标值<3。然而,竞争证明更好是可能的。典型的IPS,我们观察到微星Stealth 16 Studio A13VG有轻微但不是很明显的蓝色色调。
我们的手动校准并没有带来任何改善。我们还打算提供该显示器的ICC配置文件。
Display Response Times
| ↔ Response Time Black to White | ||
|---|---|---|
| 5.6 ms ... rise ↗ and fall ↘ combined | ↗ 2.2 ms rise | 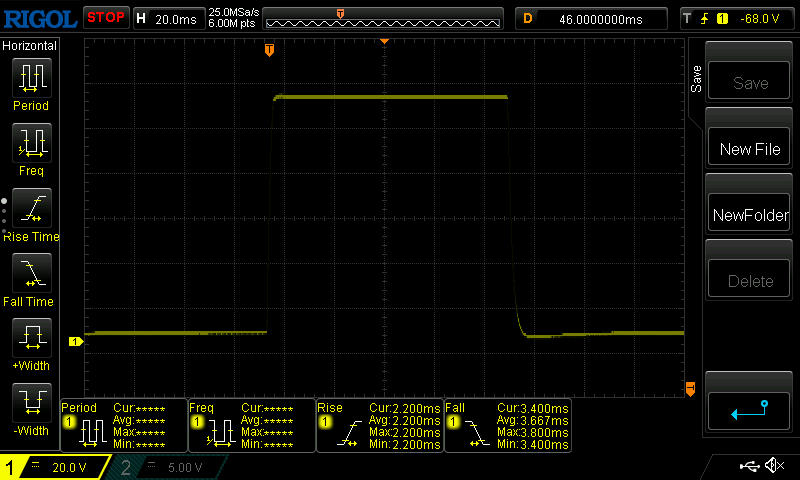 |
| ↘ 3.4 ms fall | ||
| The screen shows very fast response rates in our tests and should be very well suited for fast-paced gaming. In comparison, all tested devices range from 0.1 (minimum) to 240 (maximum) ms. » 18 % of all devices are better. This means that the measured response time is better than the average of all tested devices (19.8 ms). | ||
| ↔ Response Time 50% Grey to 80% Grey | ||
| 4.4 ms ... rise ↗ and fall ↘ combined | ↗ 2.2 ms rise | 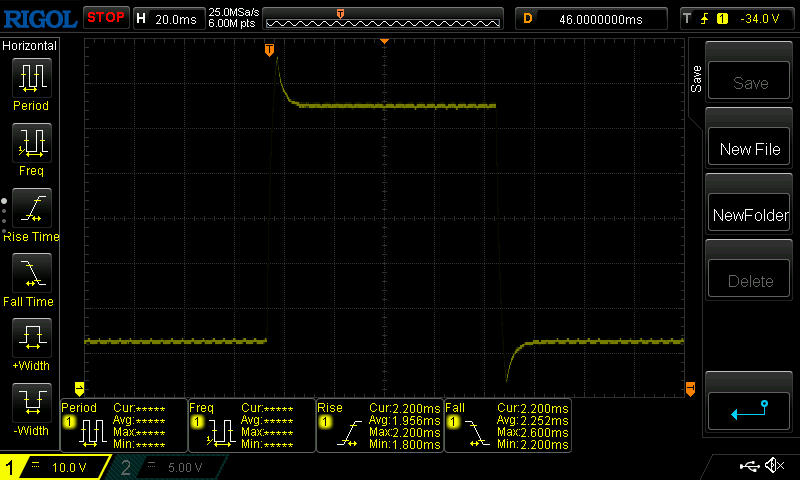 |
| ↘ 2.2 ms fall | ||
| The screen shows very fast response rates in our tests and should be very well suited for fast-paced gaming. In comparison, all tested devices range from 0.165 (minimum) to 636 (maximum) ms. » 16 % of all devices are better. This means that the measured response time is better than the average of all tested devices (31 ms). | ||
Screen Flickering / PWM (Pulse-Width Modulation)
| Screen flickering / PWM not detected |  | ||
In comparison: 52 % of all tested devices do not use PWM to dim the display. If PWM was detected, an average of 7757 (minimum: 5 - maximum: 343500) Hz was measured. | |||
相对较好的显示亮度足以满足户外使用。然而,用户应该优先选择在阴凉处使用。由于显示器的磨砂表面,没有恼人的反射。
在正常使用情况下,内置的IPS面板是一个美妙的显示屏。从四个角落的图像中可以看出,只有从广角和陡峭的角度观察时,才会看到颜色的变化。

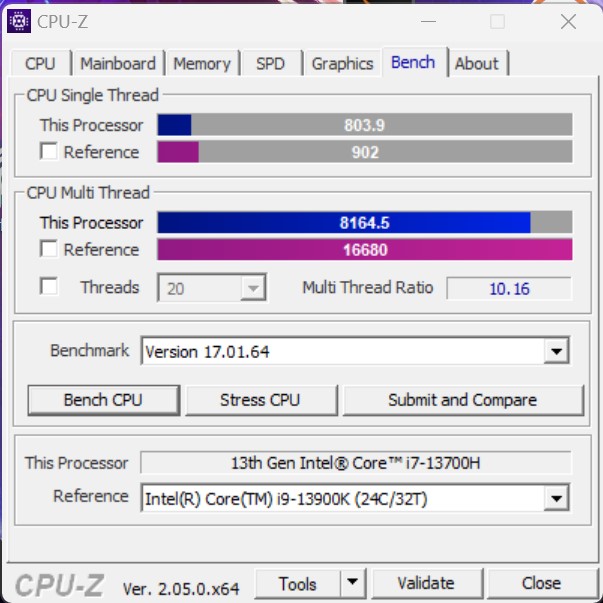
性能 - 14个核心的力量 - 英特尔酷睿i7-13700H
微星Stealth 16 Studio A13VG,它是基于英特尔酷睿i7-13700H和NvidiaGeForce RTX 4070笔记本GPU,提供了一个水平的力量,意味着它作为一个强大的游戏笔记本电脑得分很高。然而,游戏并不是该设备的唯一主要能力,因为精彩的显示屏和优雅的外观也使其成为创作者的诱人前景。我们的审查模型的替代品可以在微星隐形16工作室A13V的形式找到,它也配备了一个NvidiaGeForce RTX 4060笔记本GPU.
测试条件
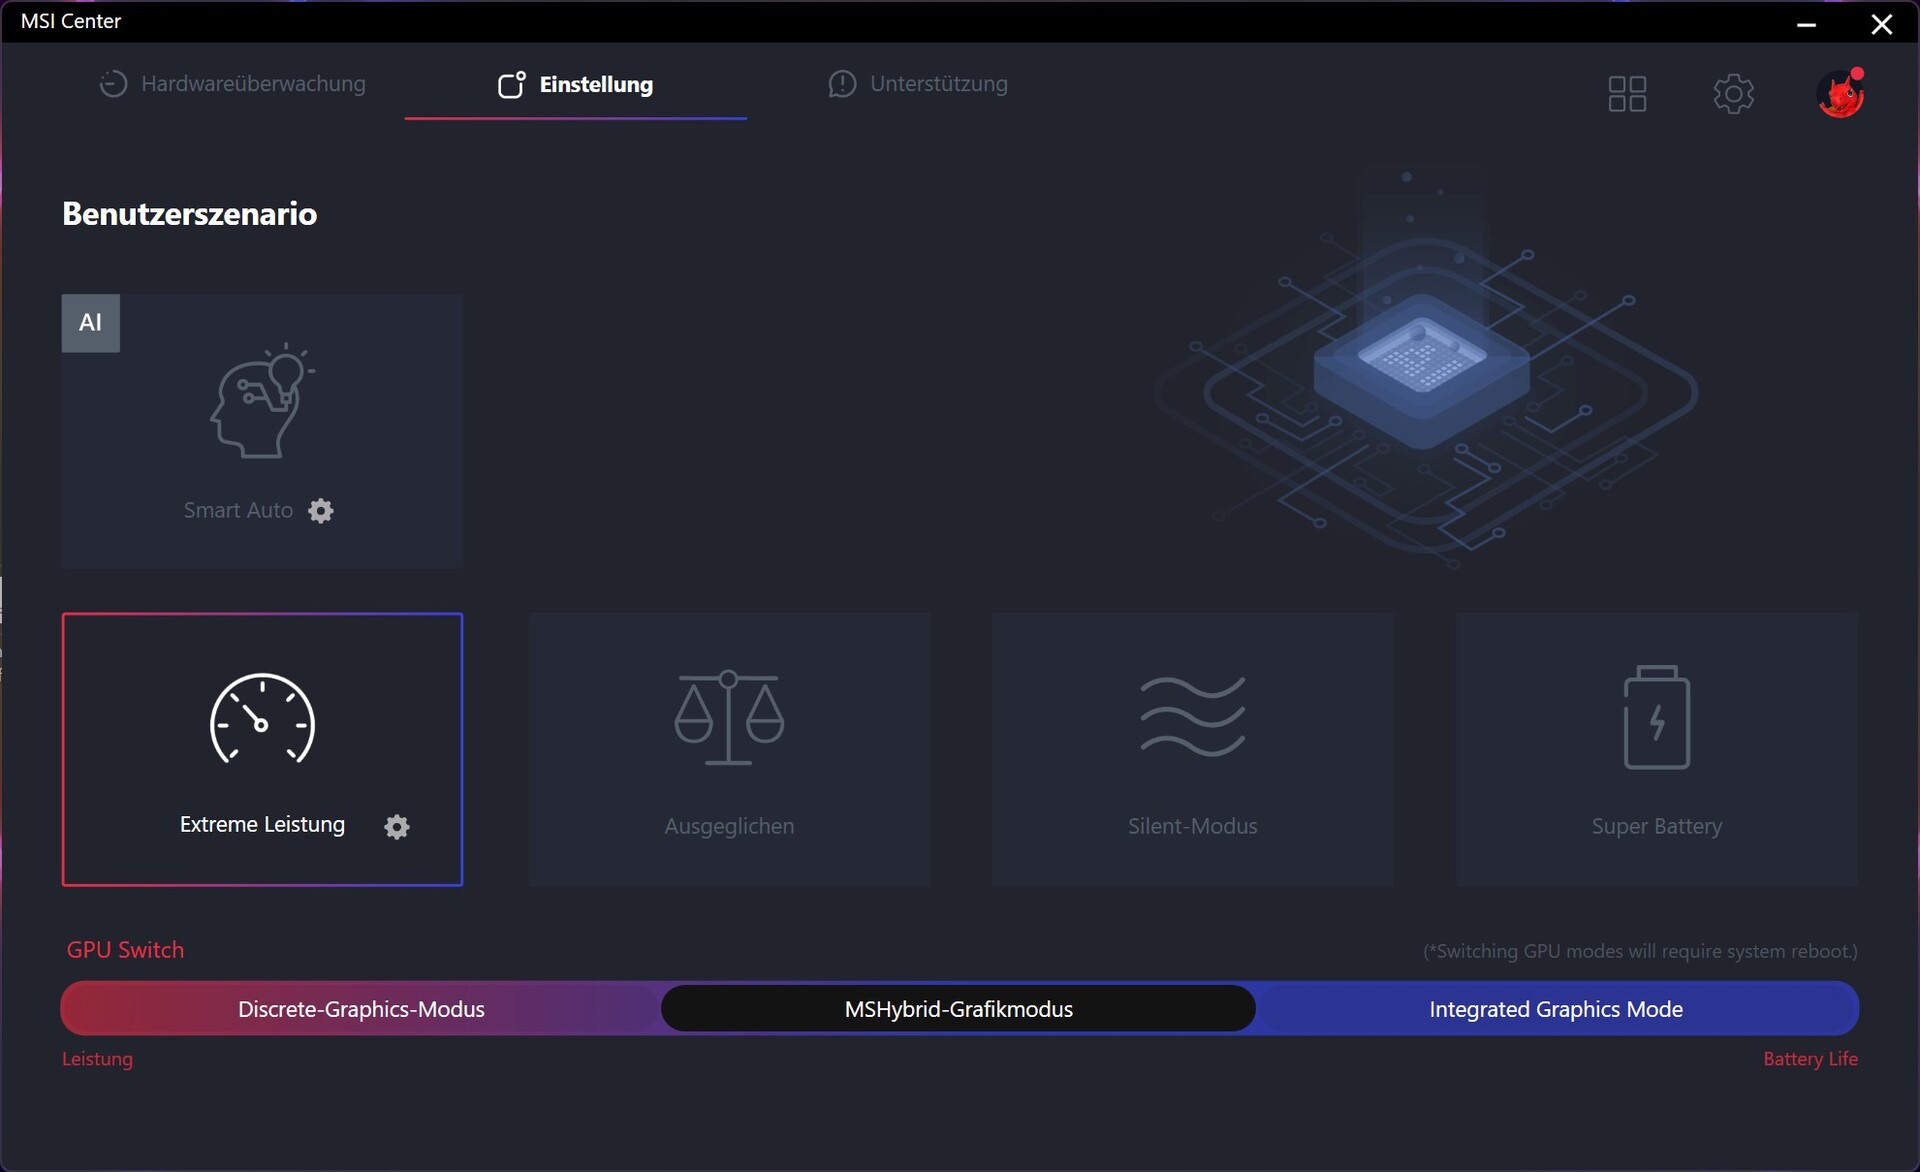
各种影响CPU和GPU的性能配置可以通过使用MSI中心来选择。除非另有说明,性能测试是使用极限性能
配置文件进行的。此外,我们根据我们的测试标准,进行了能量和体积测量的偏差。
| 模式 | CPU功率 PL1 | CPU功率 PL2 | GPU功率 |
|---|---|---|---|
| 超级电池 | 15 W | 15 W | 80 W |
| 静音模式 | 25 W | 45 W | 80 W |
| 平衡模式 | 45 W | 45 W | 80 W |
| 极限性能 | 115 W | 160 W | 105 W |
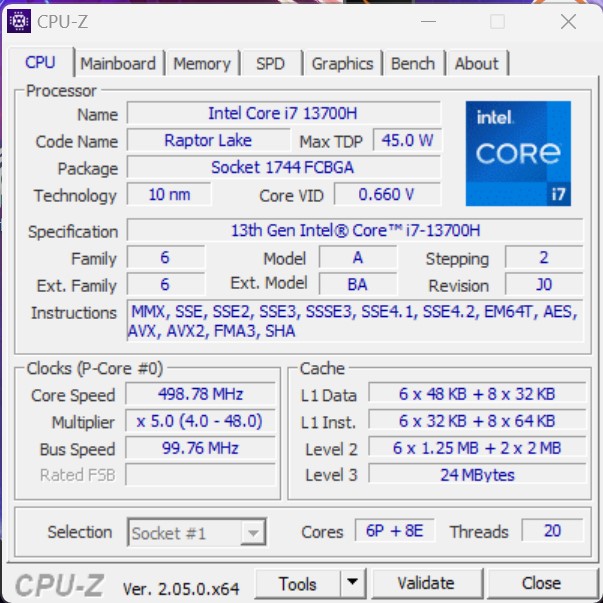
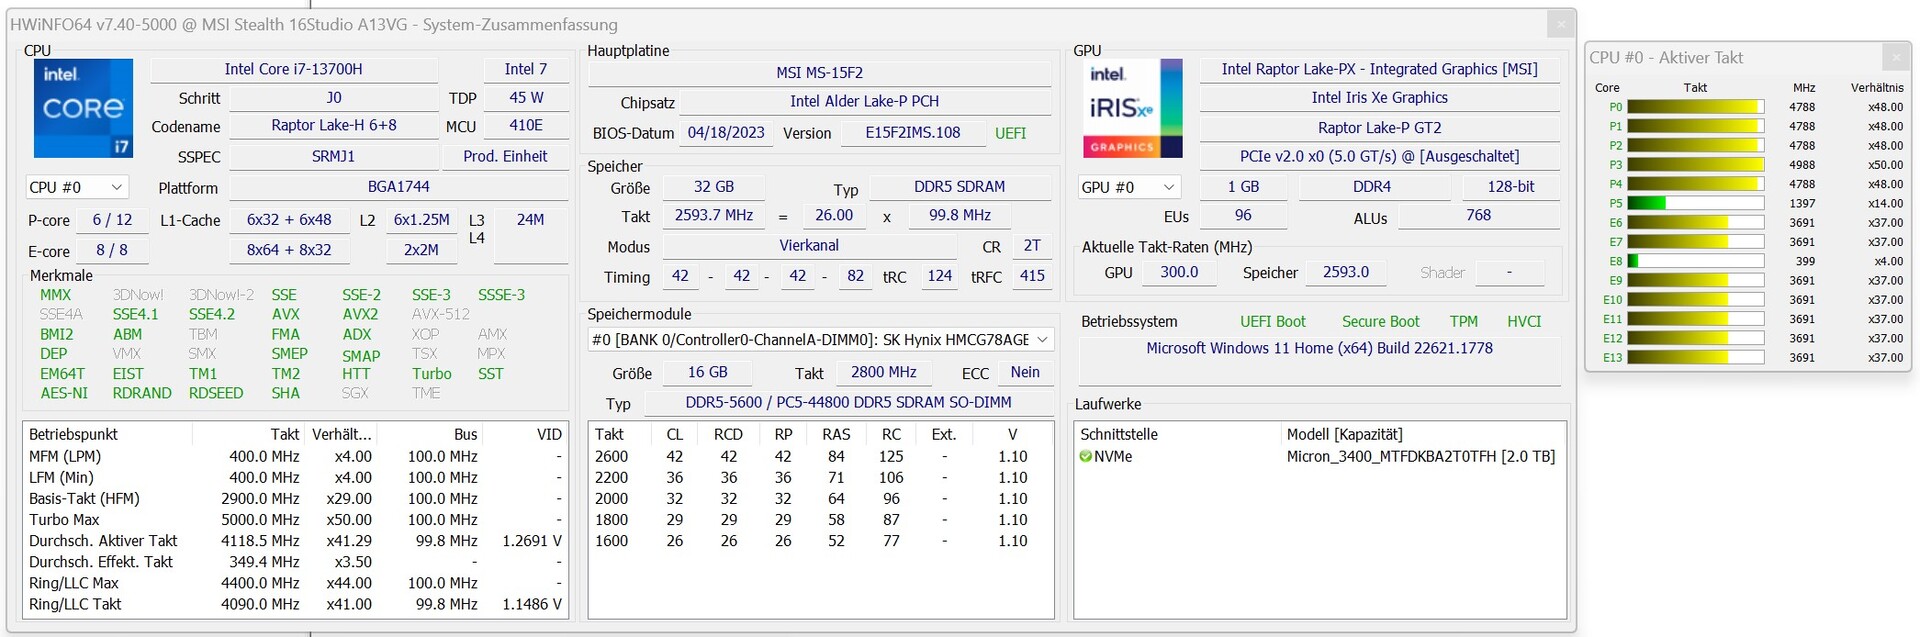
处理器
英特尔Core-i7-13700H处理器 (Raptor Lake)由八个效率核心(无超线程,1.8至3.7 GHz)和六个性能核心(超线程,2.4至5.0 GHz)组成。总的来说,这导致了20个逻辑上的CPU核心。基于酷睿i7-13700H,微星Stealth 16 Studio A13VG实现了良好的性能,领先于我们之前记录的英特尔酷睿i7-13700H的性能。即使是Gigabyte AERO 16 ,它配备的是Intel Core i9-13900H ,也要为我们的审查样本让路。Medion Erazer Major X20是无可争议的领导者。但是,与英特尔酷睿i9-13900HX相比,微星Stealth 16 Studio A13VG的性能要低30%左右。
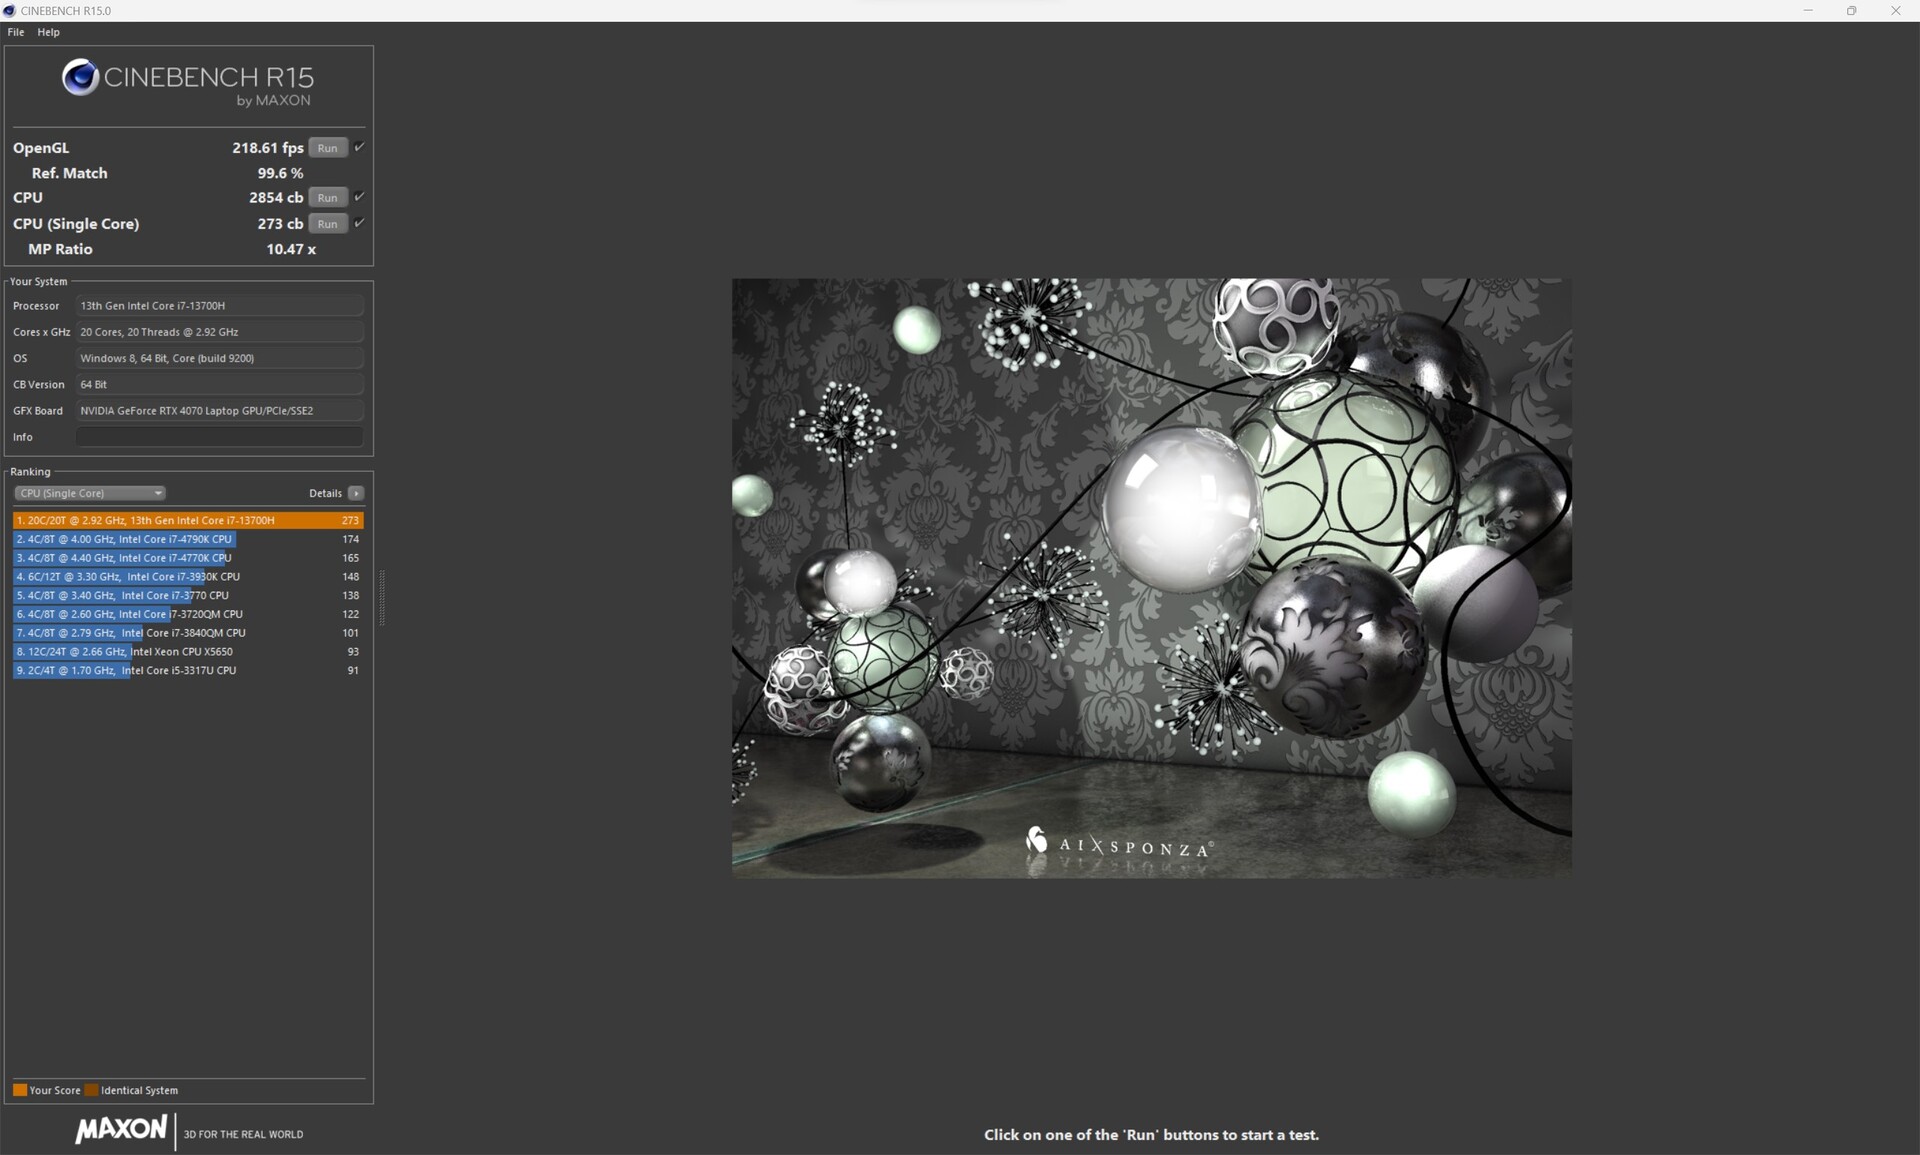
Cinebench R15循环测试显示,在开始时,CPU的提升保持得比较好,但是,在第11次运行后,SoC无法提供其全部动力。与第一次运行相比,我们记录了约15%的性能损失。
Cinebench R15 Multi Continuous Test
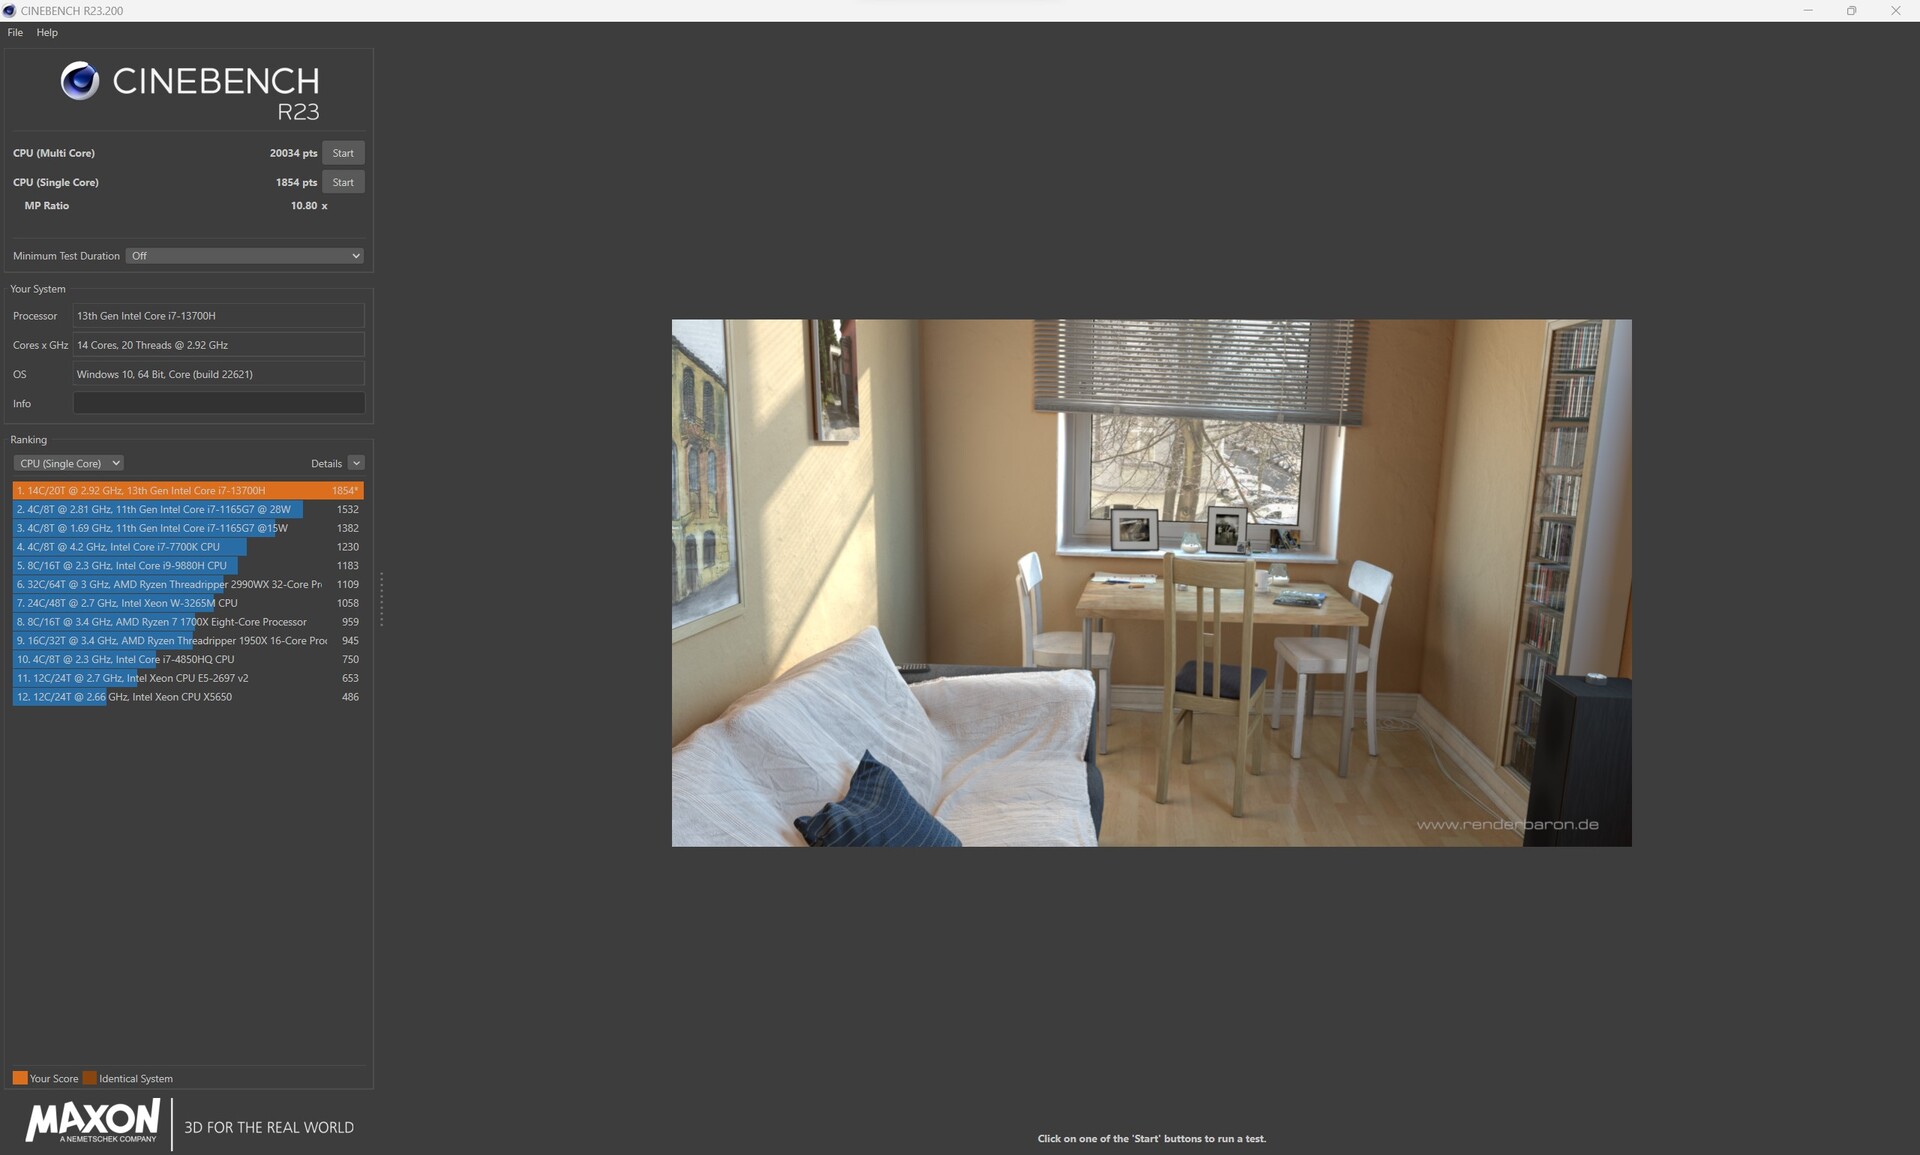
Cinebench R23: Multi Core | Single Core
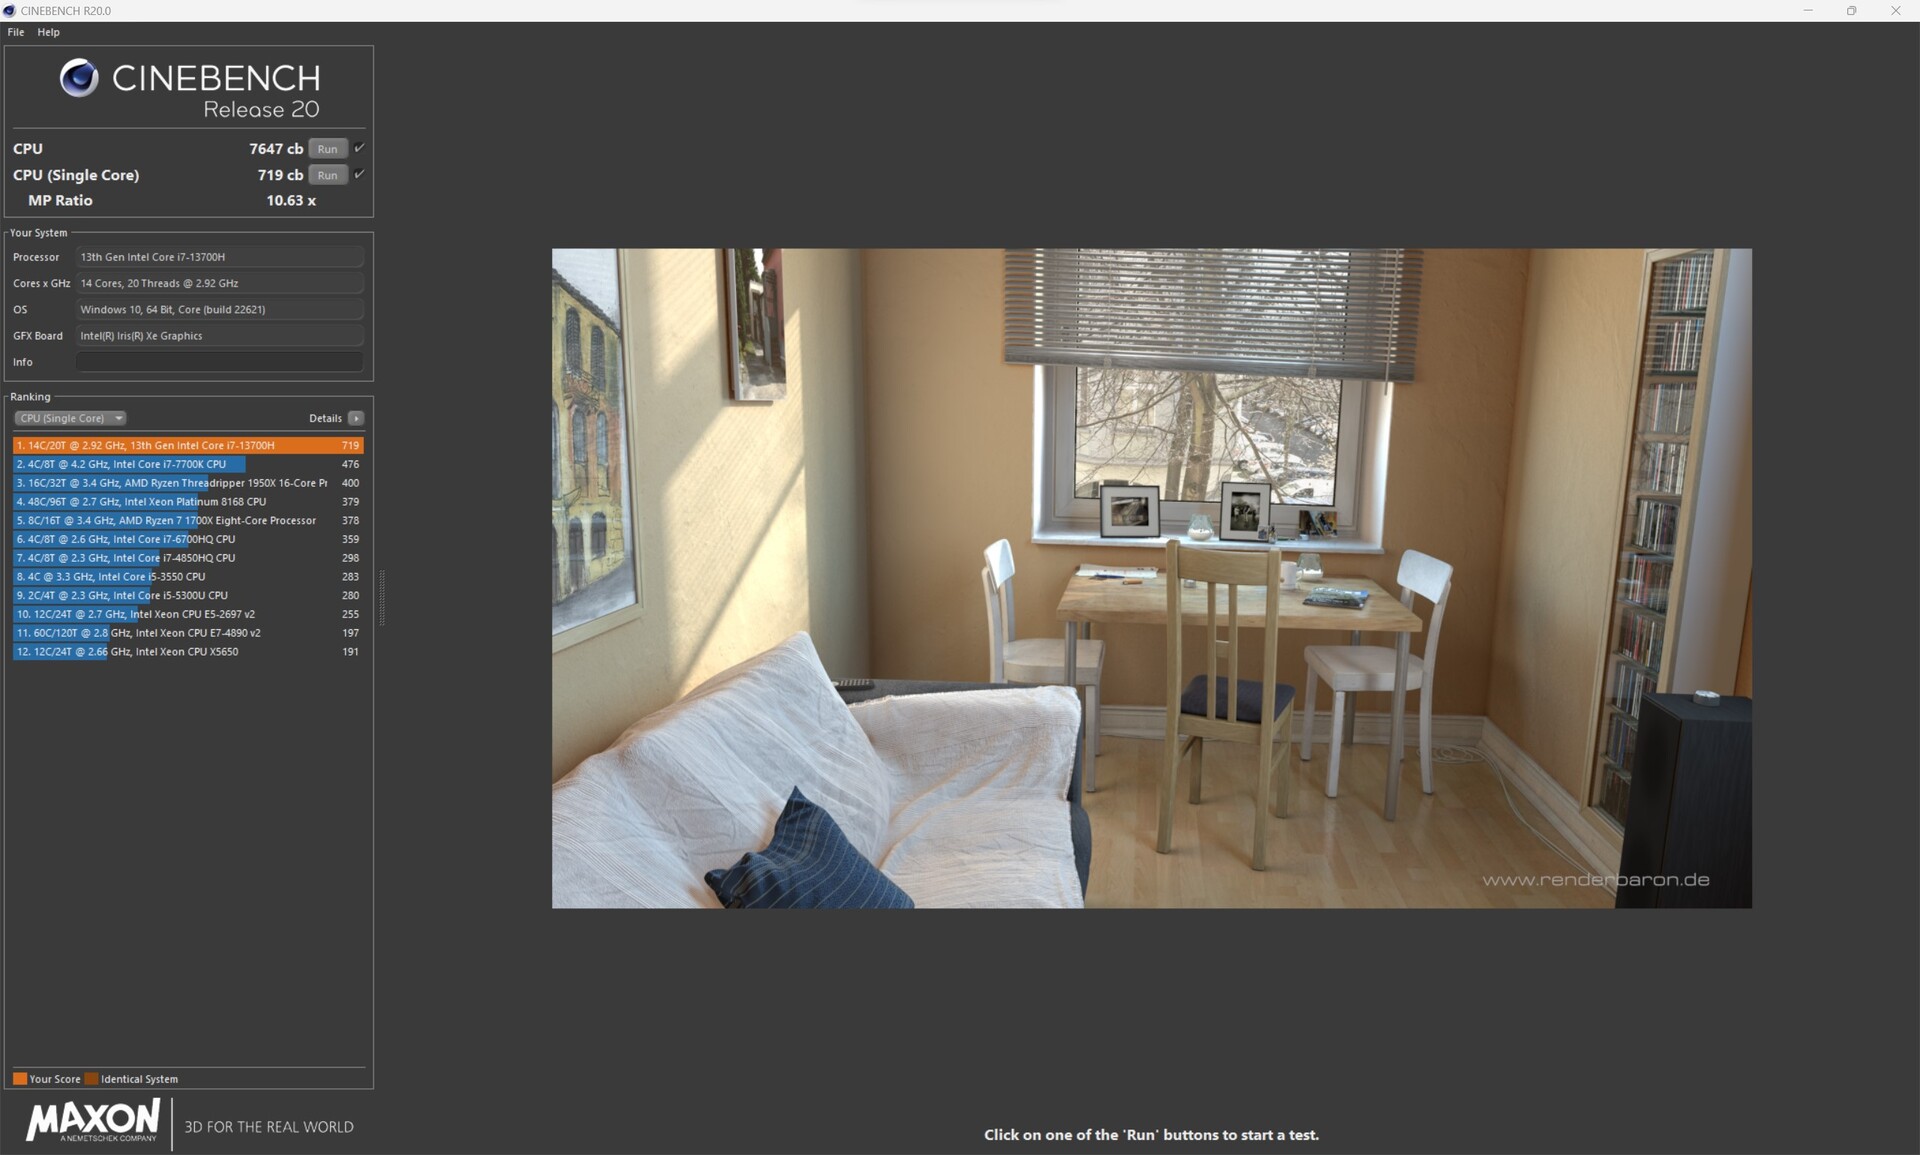
Cinebench R20: CPU (Multi Core) | CPU (Single Core)
Cinebench R15: CPU Multi 64Bit | CPU Single 64Bit
Blender: v2.79 BMW27 CPU
7-Zip 18.03: 7z b 4 | 7z b 4 -mmt1
Geekbench 5.5: Multi-Core | Single-Core
HWBOT x265 Benchmark v2.2: 4k Preset
LibreOffice : 20 Documents To PDF
R Benchmark 2.5: Overall mean
| CPU Performance rating | |
| Medion Erazer Major X20 | |
| Average of class Gaming | |
| Asus ROG Flow X16 GV601V | |
| MSI Stealth 16 Studio A13VG | |
| Gigabyte AERO 16 OLED BSF | |
| Average Intel Core i7-13700H | |
| Acer Nitro 16 AN16-41 | |
| Corsair Voyager a1600 | |
| Cinebench R23 / Multi Core | |
| Medion Erazer Major X20 | |
| Average of class Gaming (10488 - 42661, n=107, last 2 years) | |
| MSI Stealth 16 Studio A13VG | |
| Asus ROG Flow X16 GV601V | |
| Gigabyte AERO 16 OLED BSF | |
| Average Intel Core i7-13700H (5890 - 20034, n=29) | |
| Acer Nitro 16 AN16-41 | |
| Corsair Voyager a1600 | |
| Cinebench R23 / Single Core | |
| Medion Erazer Major X20 | |
| Asus ROG Flow X16 GV601V | |
| Average of class Gaming (1166 - 2415, n=107, last 2 years) | |
| MSI Stealth 16 Studio A13VG | |
| Average Intel Core i7-13700H (1323 - 1914, n=29) | |
| Gigabyte AERO 16 OLED BSF | |
| Corsair Voyager a1600 | |
| Acer Nitro 16 AN16-41 | |
| Cinebench R20 / CPU (Multi Core) | |
| Medion Erazer Major X20 | |
| Average of class Gaming (4029 - 16433, n=106, last 2 years) | |
| MSI Stealth 16 Studio A13VG | |
| Asus ROG Flow X16 GV601V | |
| Gigabyte AERO 16 OLED BSF | |
| Average Intel Core i7-13700H (2322 - 7674, n=29) | |
| Acer Nitro 16 AN16-41 | |
| Corsair Voyager a1600 | |
| Cinebench R20 / CPU (Single Core) | |
| Average of class Gaming (442 - 913, n=106, last 2 years) | |
| Medion Erazer Major X20 | |
| Asus ROG Flow X16 GV601V | |
| MSI Stealth 16 Studio A13VG | |
| Average Intel Core i7-13700H (508 - 741, n=29) | |
| Gigabyte AERO 16 OLED BSF | |
| Acer Nitro 16 AN16-41 | |
| Corsair Voyager a1600 | |
| Cinebench R15 / CPU Multi 64Bit | |
| Medion Erazer Major X20 | |
| Average of class Gaming (1578 - 6330, n=105, last 2 years) | |
| Asus ROG Flow X16 GV601V | |
| Gigabyte AERO 16 OLED BSF | |
| MSI Stealth 16 Studio A13VG | |
| Average Intel Core i7-13700H (905 - 2982, n=29) | |
| Acer Nitro 16 AN16-41 | |
| Corsair Voyager a1600 | |
| Cinebench R15 / CPU Single 64Bit | |
| Medion Erazer Major X20 | |
| Average of class Gaming (188.8 - 350, n=106, last 2 years) | |
| Asus ROG Flow X16 GV601V | |
| MSI Stealth 16 Studio A13VG | |
| Average Intel Core i7-13700H (213 - 278, n=29) | |
| Acer Nitro 16 AN16-41 | |
| Corsair Voyager a1600 | |
| Gigabyte AERO 16 OLED BSF | |
| Blender / v2.79 BMW27 CPU | |
| Average Intel Core i7-13700H (169 - 555, n=29) | |
| Corsair Voyager a1600 | |
| Acer Nitro 16 AN16-41 | |
| Asus ROG Flow X16 GV601V | |
| Gigabyte AERO 16 OLED BSF | |
| MSI Stealth 16 Studio A13VG | |
| Average of class Gaming (79 - 330, n=104, last 2 years) | |
| Medion Erazer Major X20 | |
| 7-Zip 18.03 / 7z b 4 | |
| Medion Erazer Major X20 | |
| Average of class Gaming (33491 - 148086, n=105, last 2 years) | |
| MSI Stealth 16 Studio A13VG | |
| Gigabyte AERO 16 OLED BSF | |
| Asus ROG Flow X16 GV601V | |
| Corsair Voyager a1600 | |
| Acer Nitro 16 AN16-41 | |
| Average Intel Core i7-13700H (27322 - 76344, n=29) | |
| 7-Zip 18.03 / 7z b 4 -mmt1 | |
| Medion Erazer Major X20 | |
| Average of class Gaming (4199 - 7436, n=105, last 2 years) | |
| Asus ROG Flow X16 GV601V | |
| MSI Stealth 16 Studio A13VG | |
| Average Intel Core i7-13700H (4825 - 6238, n=29) | |
| Corsair Voyager a1600 | |
| Acer Nitro 16 AN16-41 | |
| Gigabyte AERO 16 OLED BSF | |
| Geekbench 5.5 / Multi-Core | |
| Medion Erazer Major X20 | |
| Average of class Gaming (6460 - 28263, n=105, last 2 years) | |
| Asus ROG Flow X16 GV601V | |
| Gigabyte AERO 16 OLED BSF | |
| MSI Stealth 16 Studio A13VG | |
| Average Intel Core i7-13700H (6165 - 14215, n=29) | |
| Corsair Voyager a1600 | |
| Acer Nitro 16 AN16-41 | |
| Geekbench 5.5 / Single-Core | |
| Average of class Gaming (986 - 2474, n=105, last 2 years) | |
| Medion Erazer Major X20 | |
| Asus ROG Flow X16 GV601V | |
| MSI Stealth 16 Studio A13VG | |
| Average Intel Core i7-13700H (1362 - 1919, n=29) | |
| Gigabyte AERO 16 OLED BSF | |
| Acer Nitro 16 AN16-41 | |
| Corsair Voyager a1600 | |
| HWBOT x265 Benchmark v2.2 / 4k Preset | |
| Medion Erazer Major X20 | |
| Average of class Gaming (11.5 - 44.4, n=105, last 2 years) | |
| Asus ROG Flow X16 GV601V | |
| Gigabyte AERO 16 OLED BSF | |
| MSI Stealth 16 Studio A13VG | |
| Acer Nitro 16 AN16-41 | |
| Corsair Voyager a1600 | |
| Average Intel Core i7-13700H (6.72 - 21.2, n=29) | |
| LibreOffice / 20 Documents To PDF | |
| Gigabyte AERO 16 OLED BSF | |
| Corsair Voyager a1600 | |
| MSI Stealth 16 Studio A13VG | |
| Acer Nitro 16 AN16-41 | |
| Average of class Gaming (33.2 - 88.8, n=105, last 2 years) | |
| Average Intel Core i7-13700H (31.3 - 62.4, n=29) | |
| Medion Erazer Major X20 | |
| Asus ROG Flow X16 GV601V | |
| R Benchmark 2.5 / Overall mean | |
| Acer Nitro 16 AN16-41 | |
| Gigabyte AERO 16 OLED BSF | |
| Corsair Voyager a1600 | |
| Average Intel Core i7-13700H (0.4308 - 0.607, n=29) | |
| MSI Stealth 16 Studio A13VG | |
| Average of class Gaming (0.3439 - 0.759, n=106, last 2 years) | |
| Asus ROG Flow X16 GV601V | |
| Medion Erazer Major X20 | |
* ... smaller is better
AIDA64: FP32 Ray-Trace | FPU Julia | CPU SHA3 | CPU Queen | FPU SinJulia | FPU Mandel | CPU AES | CPU ZLib | FP64 Ray-Trace | CPU PhotoWorxx
| Performance rating | |
| Average of class Gaming | |
| Medion Erazer Major X20 | |
| Gigabyte AERO 16 OLED BSF | |
| Corsair Voyager a1600 | |
| MSI Stealth 16 Studio A13VG | |
| Asus ROG Flow X16 GV601V | |
| Acer Nitro 16 AN16-41 | |
| Average Intel Core i7-13700H | |
| AIDA64 / FP32 Ray-Trace | |
| Average of class Gaming (10227 - 85542, n=105, last 2 years) | |
| Medion Erazer Major X20 | |
| Gigabyte AERO 16 OLED BSF | |
| MSI Stealth 16 Studio A13VG | |
| Acer Nitro 16 AN16-41 | |
| Corsair Voyager a1600 | |
| Average Intel Core i7-13700H (4986 - 18908, n=29) | |
| Asus ROG Flow X16 GV601V | |
| AIDA64 / FPU Julia | |
| Average of class Gaming (51376 - 238426, n=105, last 2 years) | |
| Medion Erazer Major X20 | |
| Acer Nitro 16 AN16-41 | |
| Corsair Voyager a1600 | |
| Gigabyte AERO 16 OLED BSF | |
| Asus ROG Flow X16 GV601V | |
| MSI Stealth 16 Studio A13VG | |
| Average Intel Core i7-13700H (25360 - 92359, n=29) | |
| AIDA64 / CPU SHA3 | |
| Average of class Gaming (2180 - 10115, n=105, last 2 years) | |
| Medion Erazer Major X20 | |
| Asus ROG Flow X16 GV601V | |
| Gigabyte AERO 16 OLED BSF | |
| MSI Stealth 16 Studio A13VG | |
| Acer Nitro 16 AN16-41 | |
| Corsair Voyager a1600 | |
| Average Intel Core i7-13700H (1339 - 4224, n=29) | |
| AIDA64 / CPU Queen | |
| Medion Erazer Major X20 | |
| Average of class Gaming (49785 - 173351, n=90, last 2 years) | |
| Asus ROG Flow X16 GV601V | |
| Acer Nitro 16 AN16-41 | |
| MSI Stealth 16 Studio A13VG | |
| Corsair Voyager a1600 | |
| Average Intel Core i7-13700H (59324 - 107159, n=29) | |
| Gigabyte AERO 16 OLED BSF | |
| AIDA64 / FPU SinJulia | |
| Medion Erazer Major X20 | |
| Average of class Gaming (4424 - 33636, n=105, last 2 years) | |
| Acer Nitro 16 AN16-41 | |
| Corsair Voyager a1600 | |
| Asus ROG Flow X16 GV601V | |
| MSI Stealth 16 Studio A13VG | |
| Gigabyte AERO 16 OLED BSF | |
| Average Intel Core i7-13700H (4800 - 11050, n=29) | |
| AIDA64 / FPU Mandel | |
| Average of class Gaming (25115 - 128721, n=105, last 2 years) | |
| Medion Erazer Major X20 | |
| Acer Nitro 16 AN16-41 | |
| Corsair Voyager a1600 | |
| Gigabyte AERO 16 OLED BSF | |
| MSI Stealth 16 Studio A13VG | |
| Asus ROG Flow X16 GV601V | |
| Average Intel Core i7-13700H (12321 - 45118, n=29) | |
| AIDA64 / CPU AES | |
| Gigabyte AERO 16 OLED BSF | |
| Corsair Voyager a1600 | |
| Medion Erazer Major X20 | |
| Average of class Gaming (39258 - 247074, n=105, last 2 years) | |
| Asus ROG Flow X16 GV601V | |
| MSI Stealth 16 Studio A13VG | |
| Average Intel Core i7-13700H (28769 - 151254, n=29) | |
| Acer Nitro 16 AN16-41 | |
| AIDA64 / CPU ZLib | |
| Medion Erazer Major X20 | |
| Average of class Gaming (574 - 2531, n=105, last 2 years) | |
| Asus ROG Flow X16 GV601V | |
| Gigabyte AERO 16 OLED BSF | |
| MSI Stealth 16 Studio A13VG | |
| Average Intel Core i7-13700H (389 - 1215, n=29) | |
| Acer Nitro 16 AN16-41 | |
| Corsair Voyager a1600 | |
| AIDA64 / FP64 Ray-Trace | |
| Average of class Gaming (5509 - 45446, n=105, last 2 years) | |
| Medion Erazer Major X20 | |
| Gigabyte AERO 16 OLED BSF | |
| Asus ROG Flow X16 GV601V | |
| MSI Stealth 16 Studio A13VG | |
| Acer Nitro 16 AN16-41 | |
| Corsair Voyager a1600 | |
| Average Intel Core i7-13700H (2540 - 10135, n=29) | |
| AIDA64 / CPU PhotoWorxx | |
| MSI Stealth 16 Studio A13VG | |
| Average of class Gaming (12271 - 89891, n=105, last 2 years) | |
| Gigabyte AERO 16 OLED BSF | |
| Medion Erazer Major X20 | |
| Average Intel Core i7-13700H (12872 - 52727, n=29) | |
| Asus ROG Flow X16 GV601V | |
| Corsair Voyager a1600 | |
| Acer Nitro 16 AN16-41 | |
系统性能
在系统性能方面,微星Stealth 16 Studio A13VG在我们的基准测试中获得了中游的位置。分别为百分之六和百分之九,与第一名的差距相对较小。然而,系统性能很好,在过去两年发布的游戏笔记本中高于平均水平。当涉及到AIDA64基准测试时,微星Stealth 16 Studio A13VG由于其快速的DDR5内存,提供了持续无缺陷的结果,我们的评测设备甚至设法确保排名第一。
CrossMark: Overall | Productivity | Creativity | Responsiveness
| PCMark 10 / Score | |
| Average of class Gaming (5828 - 12414, n=93, last 2 years) | |
| Gigabyte AERO 16 OLED BSF | |
| Asus ROG Flow X16 GV601V | |
| Medion Erazer Major X20 | |
| Average Intel Core i7-13700H, NVIDIA GeForce RTX 4070 Laptop GPU (7158 - 7956, n=8) | |
| MSI Stealth 16 Studio A13VG | |
| Acer Nitro 16 AN16-41 | |
| Corsair Voyager a1600 | |
| PCMark 10 / Essentials | |
| Medion Erazer Major X20 | |
| Asus ROG Flow X16 GV601V | |
| Gigabyte AERO 16 OLED BSF | |
| Average Intel Core i7-13700H, NVIDIA GeForce RTX 4070 Laptop GPU (10252 - 11449, n=8) | |
| Average of class Gaming (8810 - 11935, n=97, last 2 years) | |
| Acer Nitro 16 AN16-41 | |
| MSI Stealth 16 Studio A13VG | |
| Corsair Voyager a1600 | |
| PCMark 10 / Productivity | |
| Average of class Gaming (6845 - 25323, n=95, last 2 years) | |
| Asus ROG Flow X16 GV601V | |
| Medion Erazer Major X20 | |
| Average Intel Core i7-13700H, NVIDIA GeForce RTX 4070 Laptop GPU (8501 - 10769, n=8) | |
| MSI Stealth 16 Studio A13VG | |
| Gigabyte AERO 16 OLED BSF | |
| Acer Nitro 16 AN16-41 | |
| Corsair Voyager a1600 | |
| PCMark 10 / Digital Content Creation | |
| Average of class Gaming (7602 - 19954, n=95, last 2 years) | |
| Gigabyte AERO 16 OLED BSF | |
| Corsair Voyager a1600 | |
| Asus ROG Flow X16 GV601V | |
| Average Intel Core i7-13700H, NVIDIA GeForce RTX 4070 Laptop GPU (10358 - 12908, n=8) | |
| MSI Stealth 16 Studio A13VG | |
| Acer Nitro 16 AN16-41 | |
| Medion Erazer Major X20 | |
| CrossMark / Overall | |
| Average of class Gaming (1366 - 2409, n=94, last 2 years) | |
| Asus ROG Flow X16 GV601V | |
| Average Intel Core i7-13700H, NVIDIA GeForce RTX 4070 Laptop GPU (1768 - 2073, n=6) | |
| Gigabyte AERO 16 OLED BSF | |
| Medion Erazer Major X20 | |
| MSI Stealth 16 Studio A13VG | |
| Acer Nitro 16 AN16-41 | |
| Corsair Voyager a1600 | |
| CrossMark / Productivity | |
| Asus ROG Flow X16 GV601V | |
| Average of class Gaming (1386 - 2254, n=94, last 2 years) | |
| Average Intel Core i7-13700H, NVIDIA GeForce RTX 4070 Laptop GPU (1645 - 2006, n=6) | |
| Gigabyte AERO 16 OLED BSF | |
| MSI Stealth 16 Studio A13VG | |
| Medion Erazer Major X20 | |
| Acer Nitro 16 AN16-41 | |
| Corsair Voyager a1600 | |
| CrossMark / Creativity | |
| Average of class Gaming (1343 - 2786, n=94, last 2 years) | |
| Asus ROG Flow X16 GV601V | |
| Medion Erazer Major X20 | |
| Average Intel Core i7-13700H, NVIDIA GeForce RTX 4070 Laptop GPU (1936 - 2137, n=6) | |
| Gigabyte AERO 16 OLED BSF | |
| MSI Stealth 16 Studio A13VG | |
| Acer Nitro 16 AN16-41 | |
| Corsair Voyager a1600 | |
| CrossMark / Responsiveness | |
| Gigabyte AERO 16 OLED BSF | |
| Average Intel Core i7-13700H, NVIDIA GeForce RTX 4070 Laptop GPU (1451 - 2202, n=6) | |
| Average of class Gaming (1226 - 2334, n=94, last 2 years) | |
| Asus ROG Flow X16 GV601V | |
| MSI Stealth 16 Studio A13VG | |
| Medion Erazer Major X20 | |
| Acer Nitro 16 AN16-41 | |
| Corsair Voyager a1600 | |
| PCMark 10 Score | 7329 points | |
Help | ||
| AIDA64 / Memory Copy | |
| Average of class Gaming (21750 - 129946, n=105, last 2 years) | |
| MSI Stealth 16 Studio A13VG | |
| Medion Erazer Major X20 | |
| Gigabyte AERO 16 OLED BSF | |
| Average Intel Core i7-13700H (24334 - 78081, n=29) | |
| Asus ROG Flow X16 GV601V | |
| Corsair Voyager a1600 | |
| Acer Nitro 16 AN16-41 | |
| AIDA64 / Memory Read | |
| Average of class Gaming (22956 - 118858, n=105, last 2 years) | |
| Medion Erazer Major X20 | |
| MSI Stealth 16 Studio A13VG | |
| Gigabyte AERO 16 OLED BSF | |
| Asus ROG Flow X16 GV601V | |
| Average Intel Core i7-13700H (23681 - 79656, n=29) | |
| Corsair Voyager a1600 | |
| Acer Nitro 16 AN16-41 | |
| AIDA64 / Memory Write | |
| Average of class Gaming (22297 - 135096, n=105, last 2 years) | |
| MSI Stealth 16 Studio A13VG | |
| Gigabyte AERO 16 OLED BSF | |
| Average Intel Core i7-13700H (22986 - 99898, n=29) | |
| Medion Erazer Major X20 | |
| Asus ROG Flow X16 GV601V | |
| Corsair Voyager a1600 | |
| Acer Nitro 16 AN16-41 | |
| AIDA64 / Memory Latency | |
| Average of class Gaming (75.3 - 259, n=105, last 2 years) | |
| Corsair Voyager a1600 | |
| Gigabyte AERO 16 OLED BSF | |
| Average Intel Core i7-13700H (82.4 - 136.8, n=29) | |
| Acer Nitro 16 AN16-41 | |
| Asus ROG Flow X16 GV601V | |
| Medion Erazer Major X20 | |
| MSI Stealth 16 Studio A13VG | |
* ... smaller is better
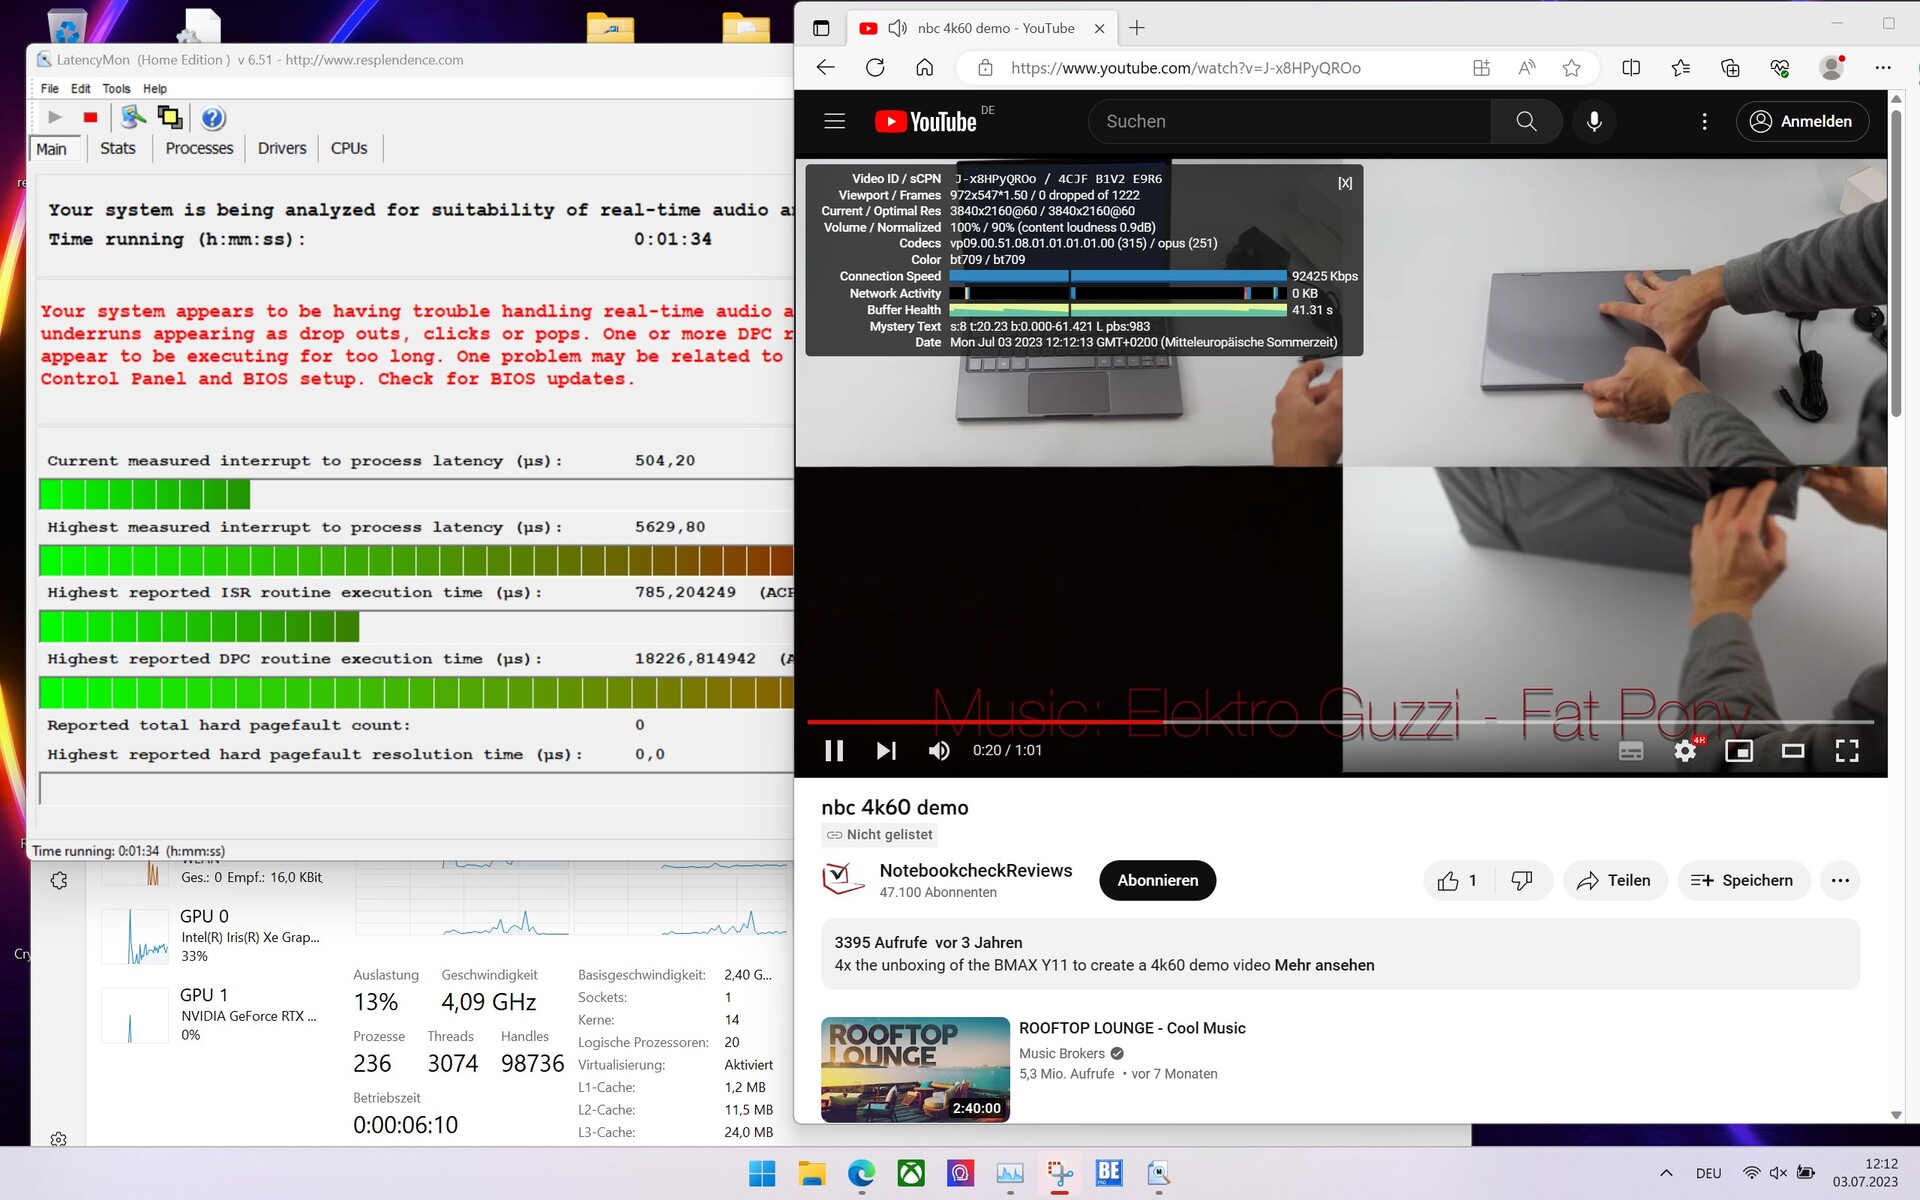
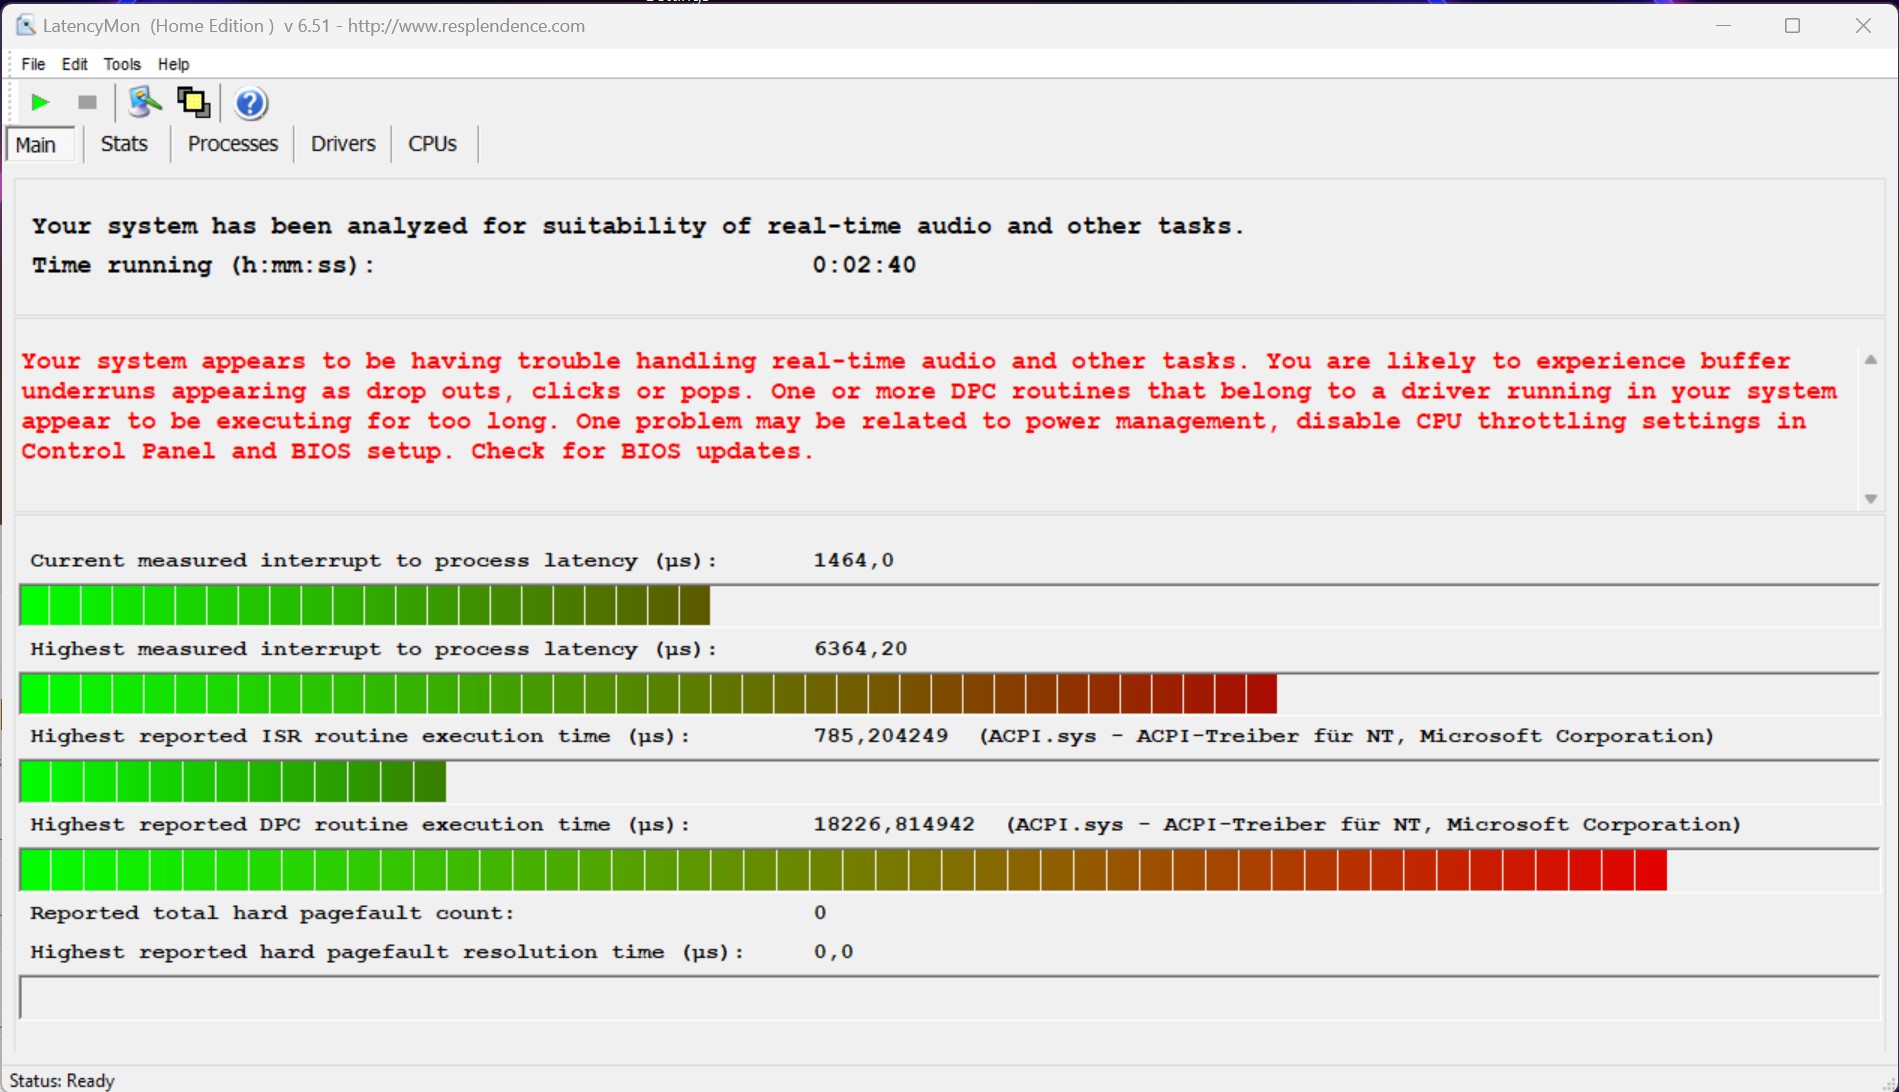
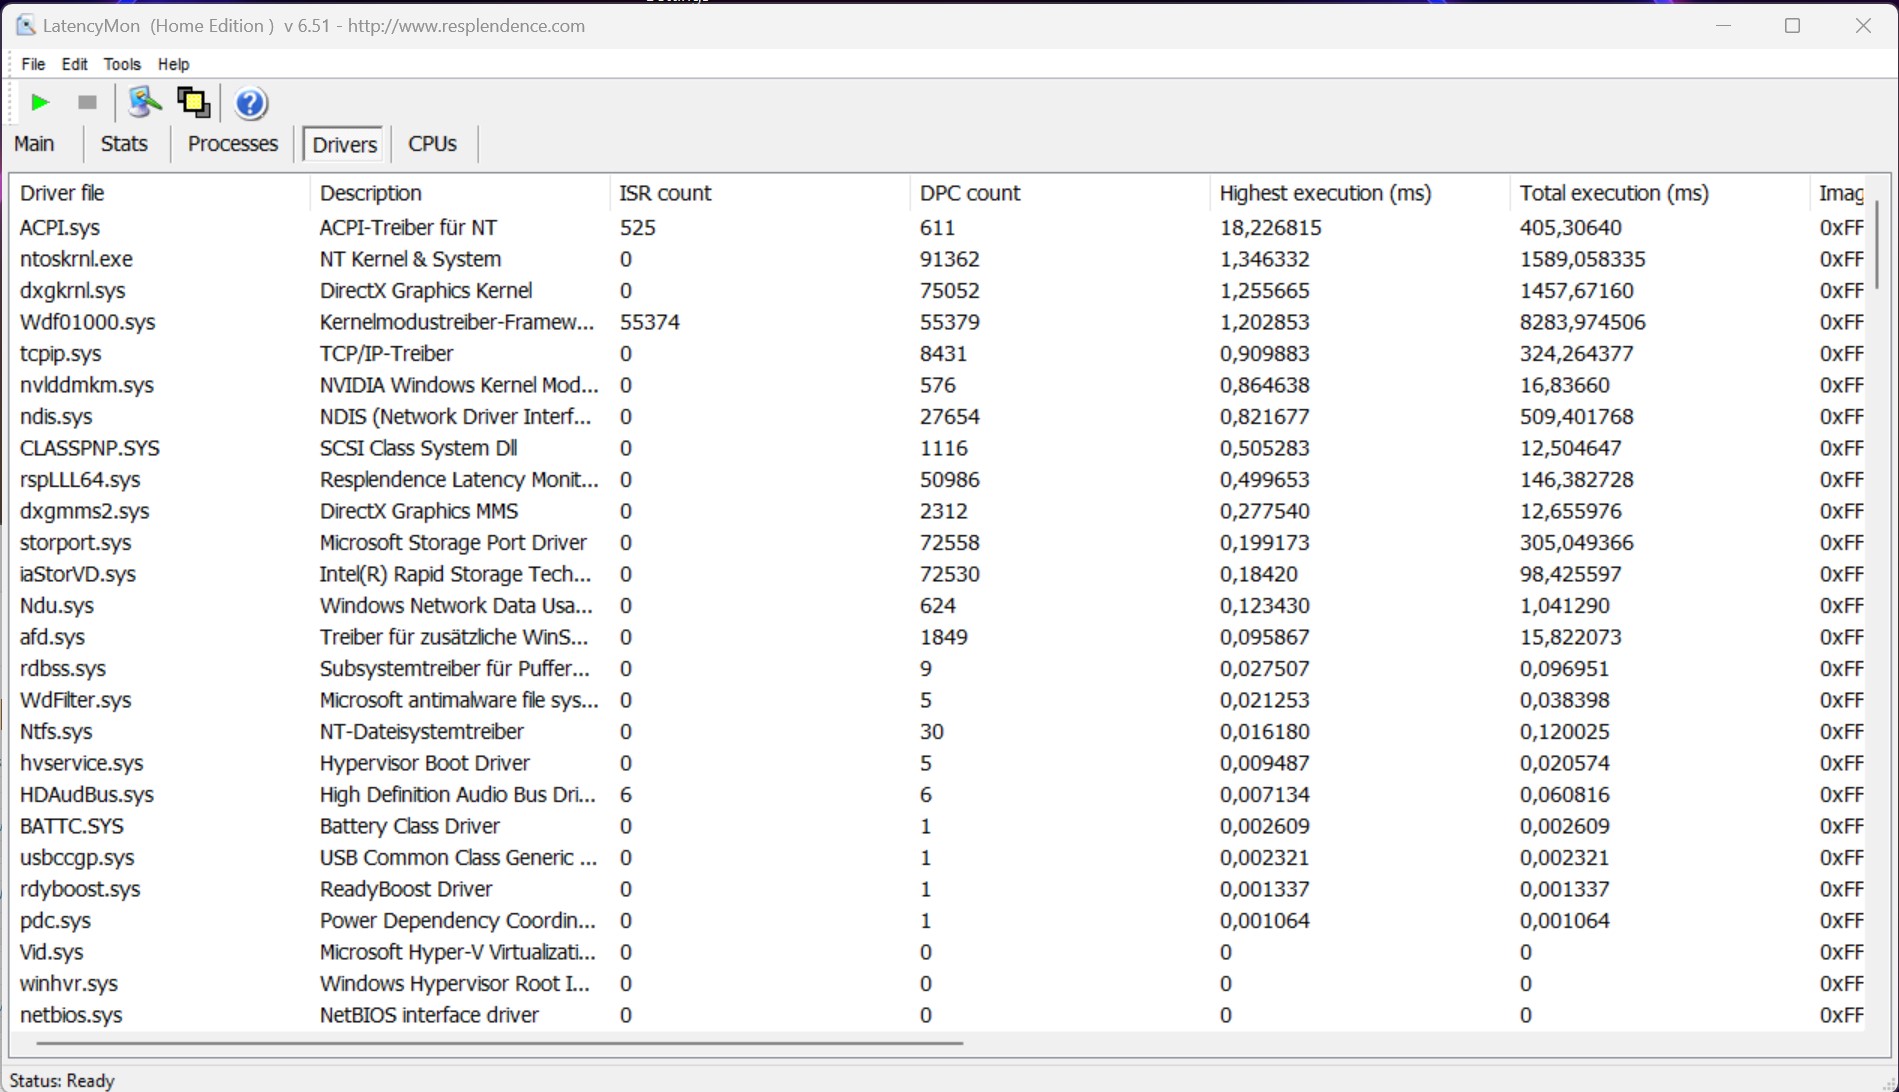
DPC延迟
微星Stealth 16 Studio A13VG的标准化延迟监测测试(上网,4K视频播放,Prime95高负载)返回了极端的数值。未来的软件更新应该有望确保改进,从而使该系统可以被认为完全适合实时视频和音频处理。然而,值得一提的是,在4K视频播放过程中没有发现跳帧。
| DPC Latencies / LatencyMon - interrupt to process latency (max), Web, Youtube, Prime95 | |
| MSI Stealth 16 Studio A13VG | |
| Medion Erazer Major X20 | |
| Acer Nitro 16 AN16-41 | |
| Asus ROG Flow X16 GV601V | |
| Gigabyte AERO 16 OLED BSF | |
| Corsair Voyager a1600 | |
* ... smaller is better
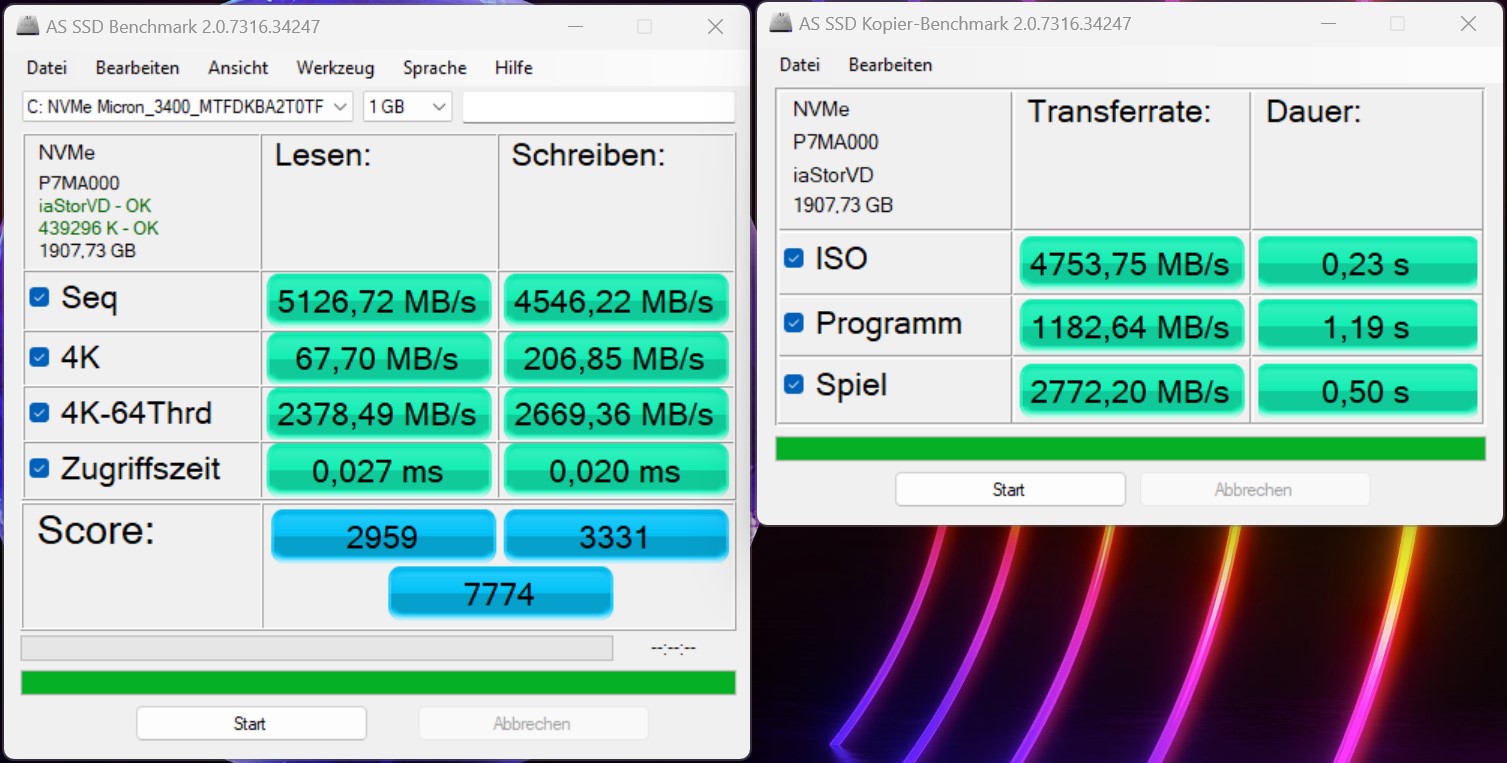
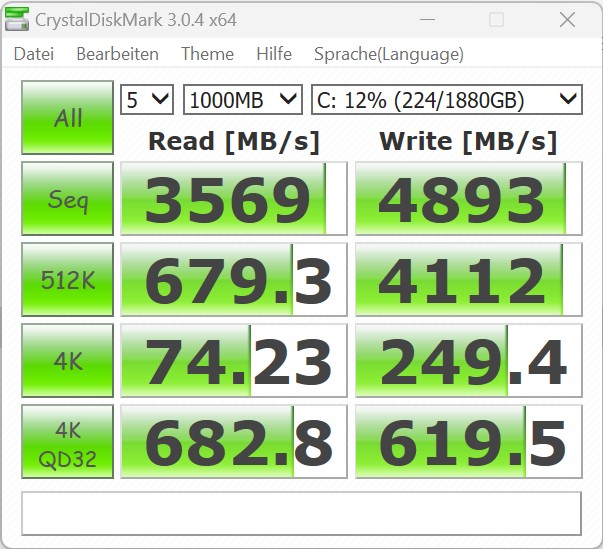
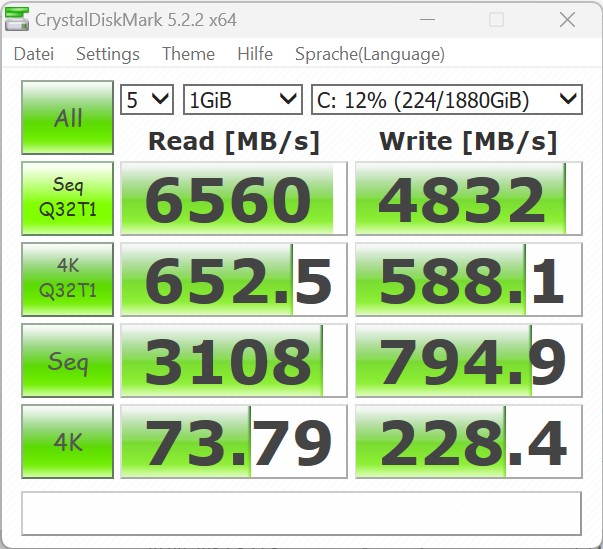
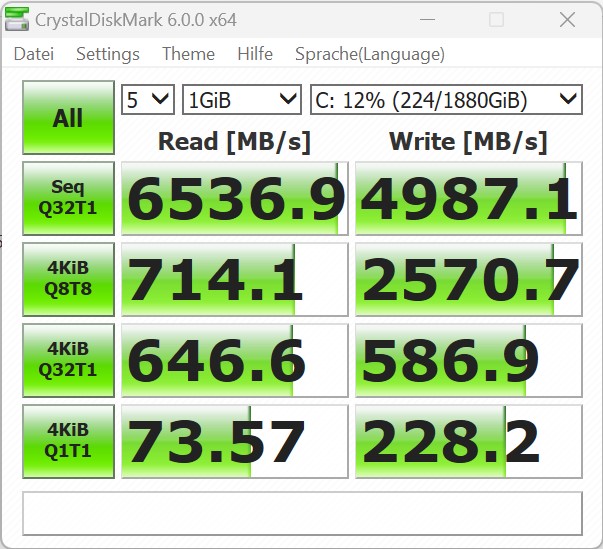
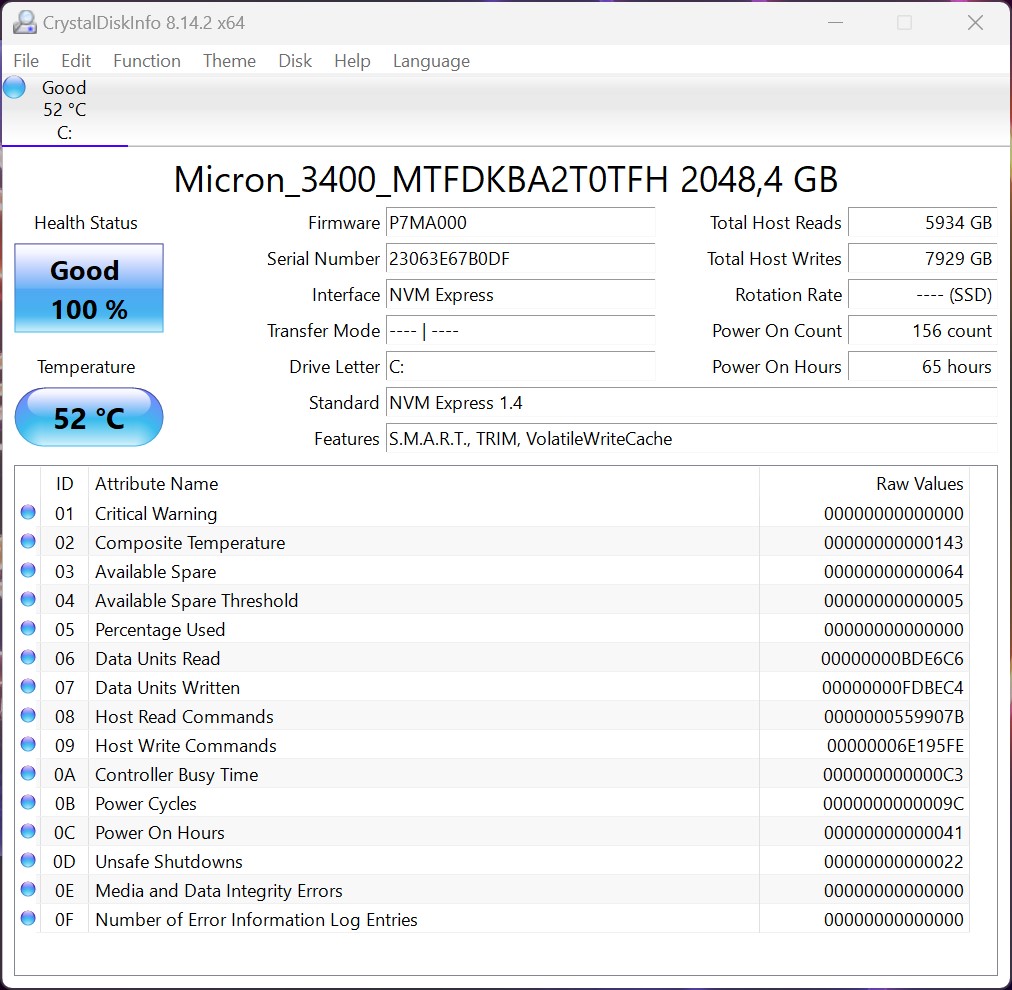
大容量存储
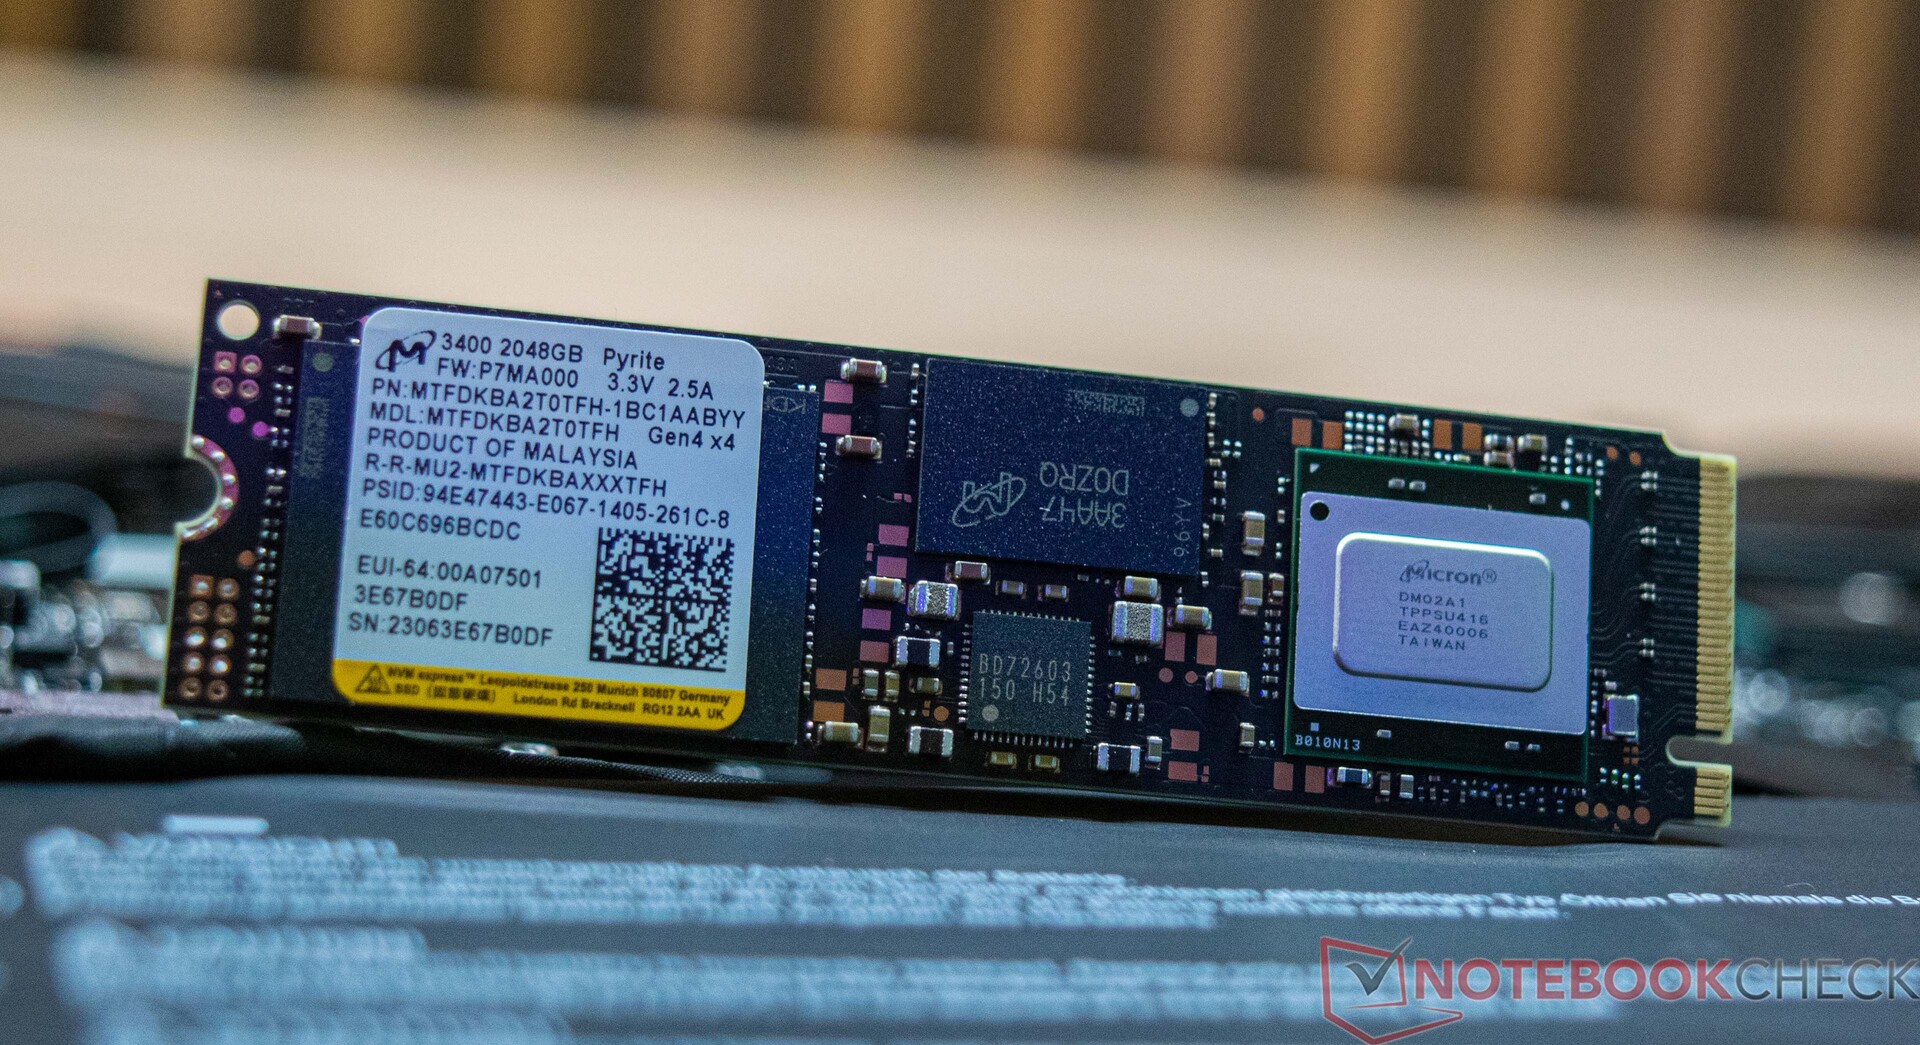
微星Stealth 16 Studio A13VG的大容量存储是以美光的SSD形式出现的。安装的模型为2TB,提供了大量的存储空间,从而支持了它的预期用途。在测试中,由于其PCIe连接,该固态硬盘提供了出色的价值。这再次帮助我们的审查设备获得了第一名。然而,微星Stealth 16 Studio A13VG在读取和写入固态硬盘时出现了永久性的问题,仅在短时间的连续负载后,读取性能就明显下降。微星Acer Nitro 16是唯一的其他设备,我们看到类似的性能大幅下降。微星Stealth 16 Studio A13VG总共可以容纳两块SSD。
关于更多的比较和基准,,看看我们的比较表。

* ... smaller is better
Continuous Performance Read: DiskSpd Read Loop, Queue Depth 8
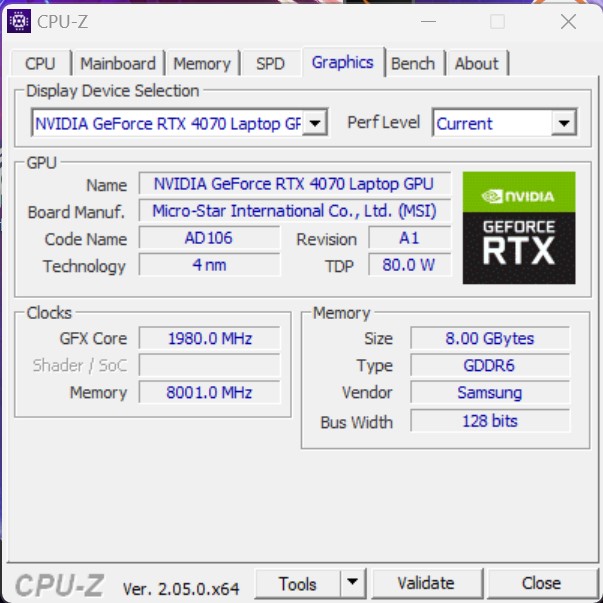
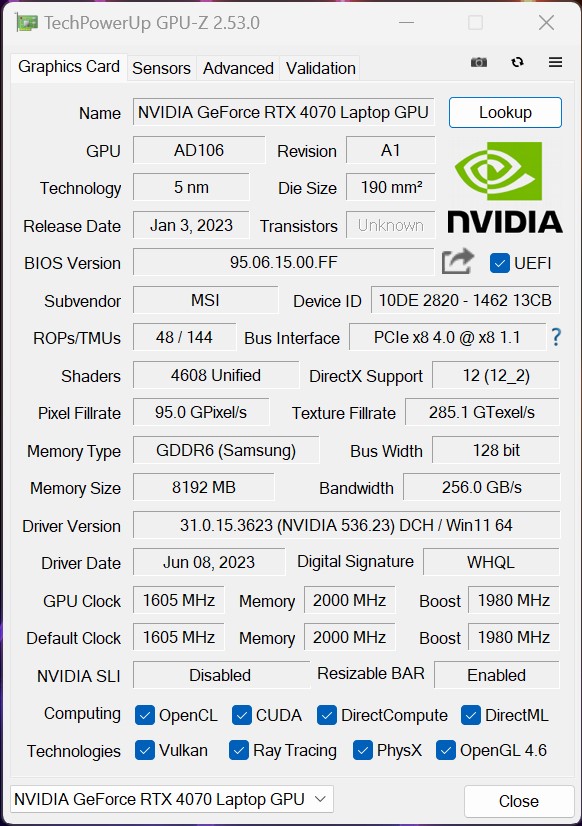
图形卡
Das MSI Stealth 16 Studio A13VG依靠的是一个NvidiaGeForce RTX 4070笔记本GPU它有一个可用的TGP高达105瓦。这意味着该显卡没有被授予最大可能的TGP,即高达115瓦。然而,在我们的比较中,我们看到我们的审查样本在合成测试中提供了良好的3D性能,其3DMark性能评级几乎足以确保第一名。
其他NvidiaGeForce RTX 4070笔记本GPU的基准测试可以发现 这里.
| 3DMark 05 Standard | 53254 points | |
| 3DMark 06 Standard Score | 63808 points | |
| 3DMark Vantage P Result | 94245 points | |
| 3DMark 11 Performance | 34960 points | |
| 3DMark Ice Storm Standard Score | 94921 points | |
| 3DMark Cloud Gate Standard Score | 63781 points | |
| 3DMark Fire Strike Score | 26244 points | |
| 3DMark Fire Strike Extreme Score | 13736 points | |
| 3DMark Time Spy Score | 11980 points | |
Help | ||
* ... smaller is better
游戏性能
的 NvidiaGeForce RTX 4070笔记本GPU这里采用的是足够快的速度,能够流畅地播放众多游戏,并以原生革命显示它们。我们的测试表明, 美迪恩Erazer Major X20以相同的图形适配器提供更好的图形性能。与技嘉AERO 16相比,微星Stealth 16 Studio A13VG显示了几乎相同的性能水平。除此之外,我们还注意到,宏碁的Nitro 16,它也配备了NvidiaGeForce RTX 4070笔记本GPU,显然要差一些。然而,我们不希望被剥夺Ada Lovelace架构的好处,该架构也在移动GPU中。这意味着你可以使用DLSS 3和帧生成等功能,只要游戏本身支持这项技术。这有时会导致帧率的显著增加。
| Performance rating - Percent | |
| Average of class Gaming | |
| Medion Erazer Major X20 | |
| Gigabyte AERO 16 OLED BSF | |
| MSI Stealth 16 Studio A13VG | |
| Asus ROG Flow X16 GV601V | |
| Acer Nitro 16 AN16-41 | |
| Corsair Voyager a1600 | |
| The Witcher 3 - 1920x1080 Ultra Graphics & Postprocessing (HBAO+) | |
| Average of class Gaming (104.7 - 240, n=7, last 2 years) | |
| Medion Erazer Major X20 | |
| MSI Stealth 16 Studio A13VG | |
| Gigabyte AERO 16 OLED BSF | |
| Acer Nitro 16 AN16-41 | |
| Corsair Voyager a1600 | |
| Asus ROG Flow X16 GV601V | |
| GTA V - 1920x1080 Highest AA:4xMSAA + FX AF:16x | |
| Average of class Gaming (48.3 - 186.9, n=94, last 2 years) | |
| Medion Erazer Major X20 | |
| Gigabyte AERO 16 OLED BSF | |
| MSI Stealth 16 Studio A13VG | |
| Asus ROG Flow X16 GV601V | |
| Acer Nitro 16 AN16-41 | |
| Corsair Voyager a1600 | |
| Final Fantasy XV Benchmark - 1920x1080 High Quality | |
| Average of class Gaming (41 - 215, n=95, last 2 years) | |
| Medion Erazer Major X20 | |
| Gigabyte AERO 16 OLED BSF | |
| MSI Stealth 16 Studio A13VG | |
| Acer Nitro 16 AN16-41 | |
| Asus ROG Flow X16 GV601V | |
| Corsair Voyager a1600 | |
| Strange Brigade - 1920x1080 ultra AA:ultra AF:16 | |
| Average of class Gaming (76.3 - 458, n=87, last 2 years) | |
| Medion Erazer Major X20 | |
| Corsair Voyager a1600 | |
| Gigabyte AERO 16 OLED BSF | |
| MSI Stealth 16 Studio A13VG | |
| Acer Nitro 16 AN16-41 | |
| Asus ROG Flow X16 GV601V | |
| Dota 2 Reborn - 1920x1080 ultra (3/3) best looking | |
| Medion Erazer Major X20 | |
| MSI Stealth 16 Studio A13VG | |
| Average of class Gaming (84.8 - 248, n=107, last 2 years) | |
| Asus ROG Flow X16 GV601V | |
| Gigabyte AERO 16 OLED BSF | |
| Corsair Voyager a1600 | |
| Acer Nitro 16 AN16-41 | |
为了检查帧率在较长时间内的稳定性,我们在全高清分辨率和最大预设下运行了游戏TheWitcher 3 约60分钟。在这个过程中,游戏角色没有被移动。图中显示了相对稳定的帧率性能。
Witcher 3 FPS diagram
| low | med. | high | ultra | QHD | |
|---|---|---|---|---|---|
| GTA V (2015) | 187 | 184.7 | 180.3 | 119.7 | 92.8 |
| The Witcher 3 (2015) | 452.3 | 390.5 | 226.7 | 119 | |
| Dota 2 Reborn (2015) | 189.6 | 169 | 160.5 | 154.7 | |
| Final Fantasy XV Benchmark (2018) | 202 | 154.2 | 115 | 83.8 | |
| X-Plane 11.11 (2018) | 158.5 | 142.4 | 110.2 | ||
| Far Cry 5 (2018) | 190 | 157 | 150 | 143 | 113 |
| Strange Brigade (2018) | 470 | 286 | 230 | 200 | 132 |
| Shadow of the Tomb Raider (2018) | 206 | 163.4 | 158.1 | 145.9 | 104 |
| Far Cry New Dawn (2019) | 165 | 140 | 135 | 120 | 105 |
| Metro Exodus (2019) | 221 | 141.3 | 109.8 | 87.2 | 69.1 |
| Borderlands 3 (2019) | 175.9 | 145.9 | 119.7 | 98.6 | 71.5 |
| F1 2020 (2020) | 331 | 276 | 235 | 183 | 142.6 |
| F1 2021 (2021) | 378 | 300 | 238 | 139.5 | 108.5 |
| Far Cry 6 (2021) | 168.8 | 143 | 126.5 | 114.5 | 86.7 |
| God of War (2022) | 143.1 | 119.5 | 95.6 | 68.8 | 58.5 |
| GRID Legends (2022) | 182.9 | 164.1 | 150.1 | 131.7 | 112.1 |
| Tiny Tina's Wonderlands (2022) | 230 | 190.1 | 130.3 | 101.7 | 70.5 |
| F1 22 (2022) | 256 | 246 | 183.4 | 76.7 | 49.7 |
| Uncharted Legacy of Thieves Collection (2022) | 94 | 92.4 | 86.2 | 82.7 | 61.2 |
| High On Life (2023) | 220 | 178.7 | 134.1 | 110.6 | 66.9 |
| Dead Space Remake (2023) | 102.8 | 98.2 | 86.7 | 86.5 | 56.5 |
| Returnal (2023) | 115 | 111 | 102 | 88 | 63 |
| Company of Heroes 3 (2023) | 211.8 | 191.4 | 156.5 | 153.9 | 114.8 |
| Resident Evil 4 Remake (2023) | 160.1 | 123.4 | 113.1 | 82.4 | 61.3 |
| The Last of Us (2023) | 114.4 | 96.5 | 85.5 | 75 | 43.9 |
| Star Wars Jedi Survivor (2023) | 92.1 | 80.6 | 75.6 | 71.1 | 47 |
| Diablo 4 (2023) | 255 | 233 | 208 | 177.8 | 105.4 |
| F1 23 (2023) | 230 | 232 | 189 | 71 | 45 |
排放 - 电池寿命好,但温度高
噪声排放
当空转和在日常办公中使用Office和执行基于互联网的任务时,微星Stealth 16 Studio A13VG是无声的。我们只测量了在平均负载下的35分贝(A),可以听到安静但可闻的呼呼声。在负载下,它可以变得非常嘈杂,压力测试的最大值为51.5分贝(A)。在62分贝(A),宏碁Nitro 16 AN16-41表明有可能得到明显的噪音。
基本上,微星Stealth 16 Studio A13VG也允许几乎无声运行。为了实现这一点,你必须选择 "静音 "或 "超级电池 "模式的能源配置文件,这两种模式可以在微星中心选择。
你也可以通过微星中心控制风扇。除了预定义的配置文件之外,您还可以创建自己的风扇曲线。
Noise level
| Idle |
| 24 / 24 / 24 dB(A) |
| Load |
| 34.81 / 51.57 dB(A) |
 | ||
30 dB silent 40 dB(A) audible 50 dB(A) loud |
||
min: | ||
| MSI Stealth 16 Studio A13VG GeForce RTX 4070 Laptop GPU, i7-13700H, Micron 3400 2TB MTFDKBA2T0TFH | Asus ROG Flow X16 GV601V GeForce RTX 4060 Laptop GPU, i9-13900H, WD PC SN560 SDDPNQE-1T00 | Medion Erazer Major X20 GeForce RTX 4070 Laptop GPU, i9-13900HX, Phison E18-1TB-PHISON-SSD-B47R | Acer Nitro 16 AN16-41 GeForce RTX 4070 Laptop GPU, R7 7735HS, Samsung PM9A1 MZVL21T0HCLR | Corsair Voyager a1600 Radeon RX 6800M, R9 6900HS, Samsung PM9A1 MZVL22T0HBLB | Gigabyte AERO 16 OLED BSF GeForce RTX 4070 Laptop GPU, i9-13900H, Gigabyte AG470S1TB-SI B10 | |
|---|---|---|---|---|---|---|
| Noise | -3% | -18% | -8% | -23% | -15% | |
| off / environment * (dB) | 24 | 24 -0% | 24 -0% | 25.7 -7% | 29.9 -25% | 23 4% |
| Idle Minimum * (dB) | 24 | 24 -0% | 25 -4% | 25.7 -7% | 30.5 -27% | 23 4% |
| Idle Average * (dB) | 24 | 24 -0% | 29 -21% | 25.7 -7% | 30.6 -28% | 23 4% |
| Idle Maximum * (dB) | 24 | 24 -0% | 31 -29% | 26.3 -10% | 30.7 -28% | 33.64 -40% |
| Load Average * (dB) | 34.81 | 36.71 -5% | 50 -44% | 33.9 3% | 44.5 -28% | 51.49 -48% |
| Witcher 3 ultra * (dB) | 44.05 | 50.92 -16% | 53 -20% | 55.27 -25% | ||
| Load Maximum * (dB) | 51.57 | 50.92 1% | 57 -11% | 62 -20% | 51.1 1% | 55.24 -7% |
* ... smaller is better
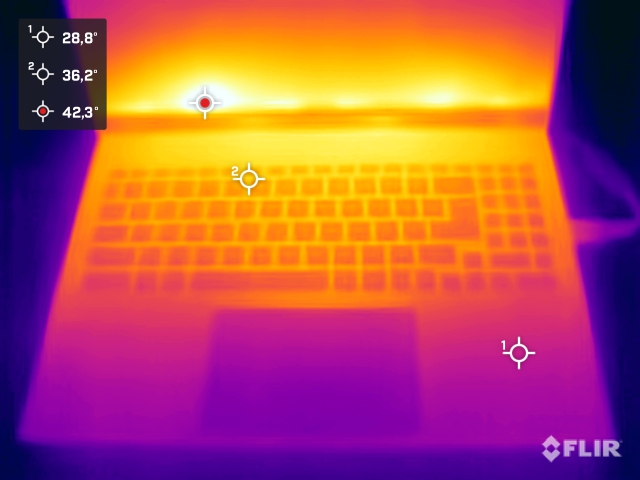
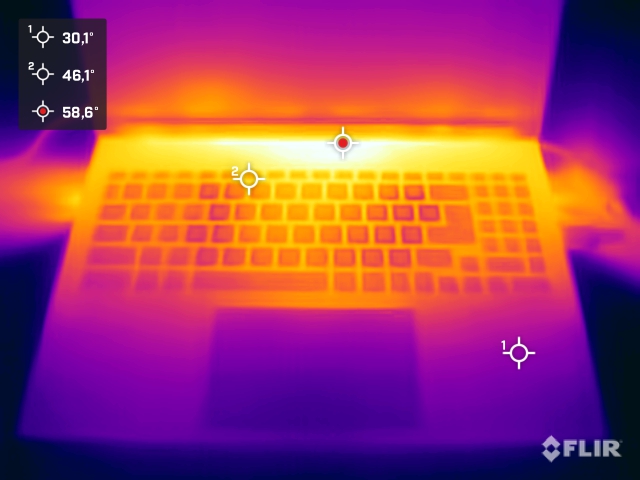
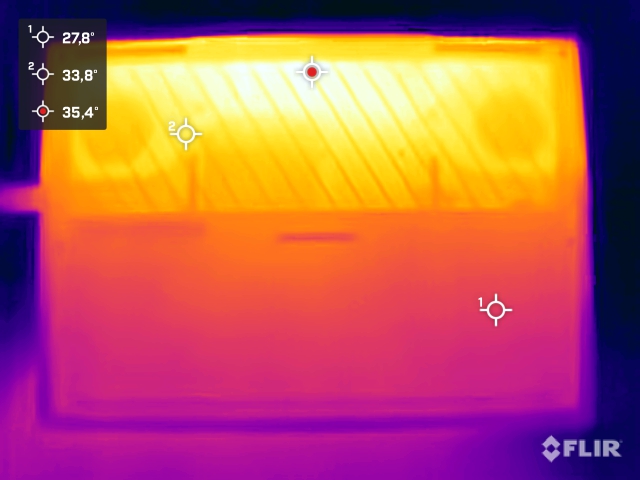
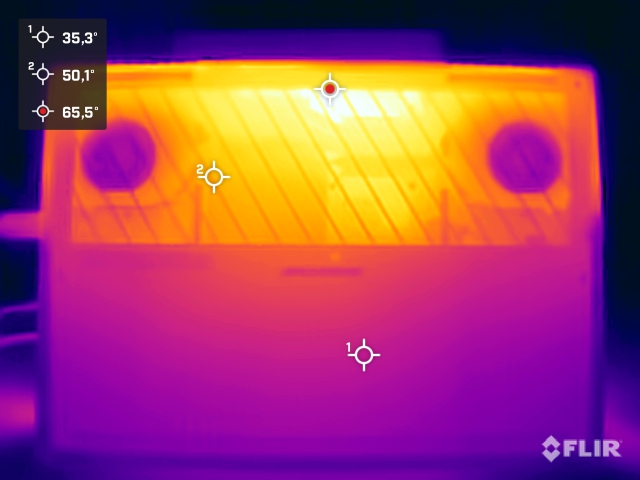
温度
在压力测试中,我们记录了负载下和游戏时的高机箱温度。在超过60℃的情况下,笔记本顶部和底部的温度都比同行要高。因此,在负载情况下将设备放在腿上使用时,会让人感到不舒服。
(-) The maximum temperature on the upper side is 60 °C / 140 F, compared to the average of 40.4 °C / 105 F, ranging from 21.2 to 68.8 °C for the class Gaming.
(-) The bottom heats up to a maximum of 61 °C / 142 F, compared to the average of 43.2 °C / 110 F
(±) In idle usage, the average temperature for the upper side is 33.2 °C / 92 F, compared to the device average of 33.9 °C / 93 F.
(-) Playing The Witcher 3, the average temperature for the upper side is 44.7 °C / 112 F, compared to the device average of 33.9 °C / 93 F.
(±) The palmrests and touchpad can get very hot to the touch with a maximum of 36 °C / 96.8 F.
(-) The average temperature of the palmrest area of similar devices was 28.8 °C / 83.8 F (-7.2 °C / -13 F).
| MSI Stealth 16 Studio A13VG Intel Core i7-13700H, NVIDIA GeForce RTX 4070 Laptop GPU | Asus ROG Flow X16 GV601V Intel Core i9-13900H, NVIDIA GeForce RTX 4060 Laptop GPU | Medion Erazer Major X20 Intel Core i9-13900HX, NVIDIA GeForce RTX 4070 Laptop GPU | Acer Nitro 16 AN16-41 AMD Ryzen 7 7735HS, NVIDIA GeForce RTX 4070 Laptop GPU | Corsair Voyager a1600 AMD Ryzen 9 6900HS, AMD Radeon RX 6800M | Gigabyte AERO 16 OLED BSF Intel Core i9-13900H, NVIDIA GeForce RTX 4070 Laptop GPU | |
|---|---|---|---|---|---|---|
| Heat | 19% | 11% | 18% | 11% | 34% | |
| Maximum Upper Side * (°C) | 60 | 46 23% | 46 23% | 41.5 31% | 50.7 15% | 41 32% |
| Maximum Bottom * (°C) | 61 | 41 33% | 49 20% | 51.8 15% | 54.2 11% | 47 23% |
| Idle Upper Side * (°C) | 38.2 | 36 6% | 37 3% | 31.6 17% | 35.8 6% | 23 40% |
| Idle Bottom * (°C) | 37.7 | 33 12% | 38 -1% | 34.5 8% | 33 12% | 23 39% |
* ... smaller is better
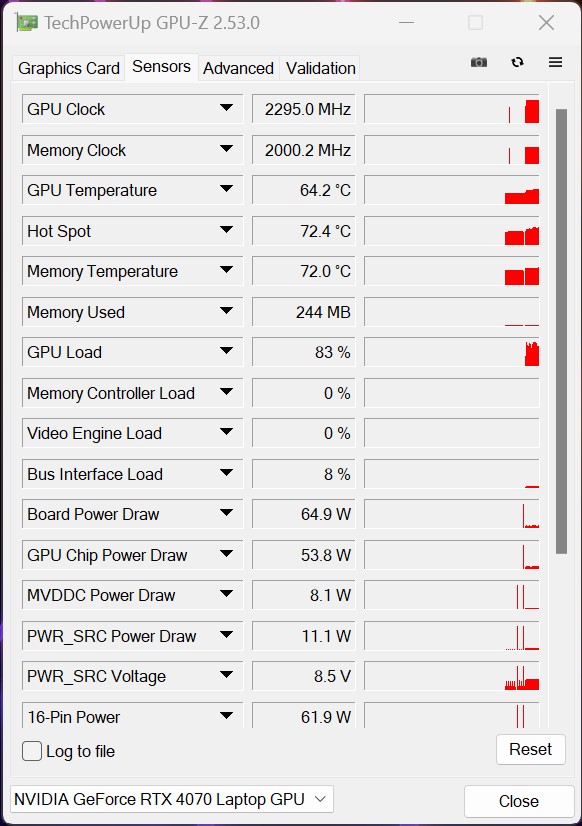
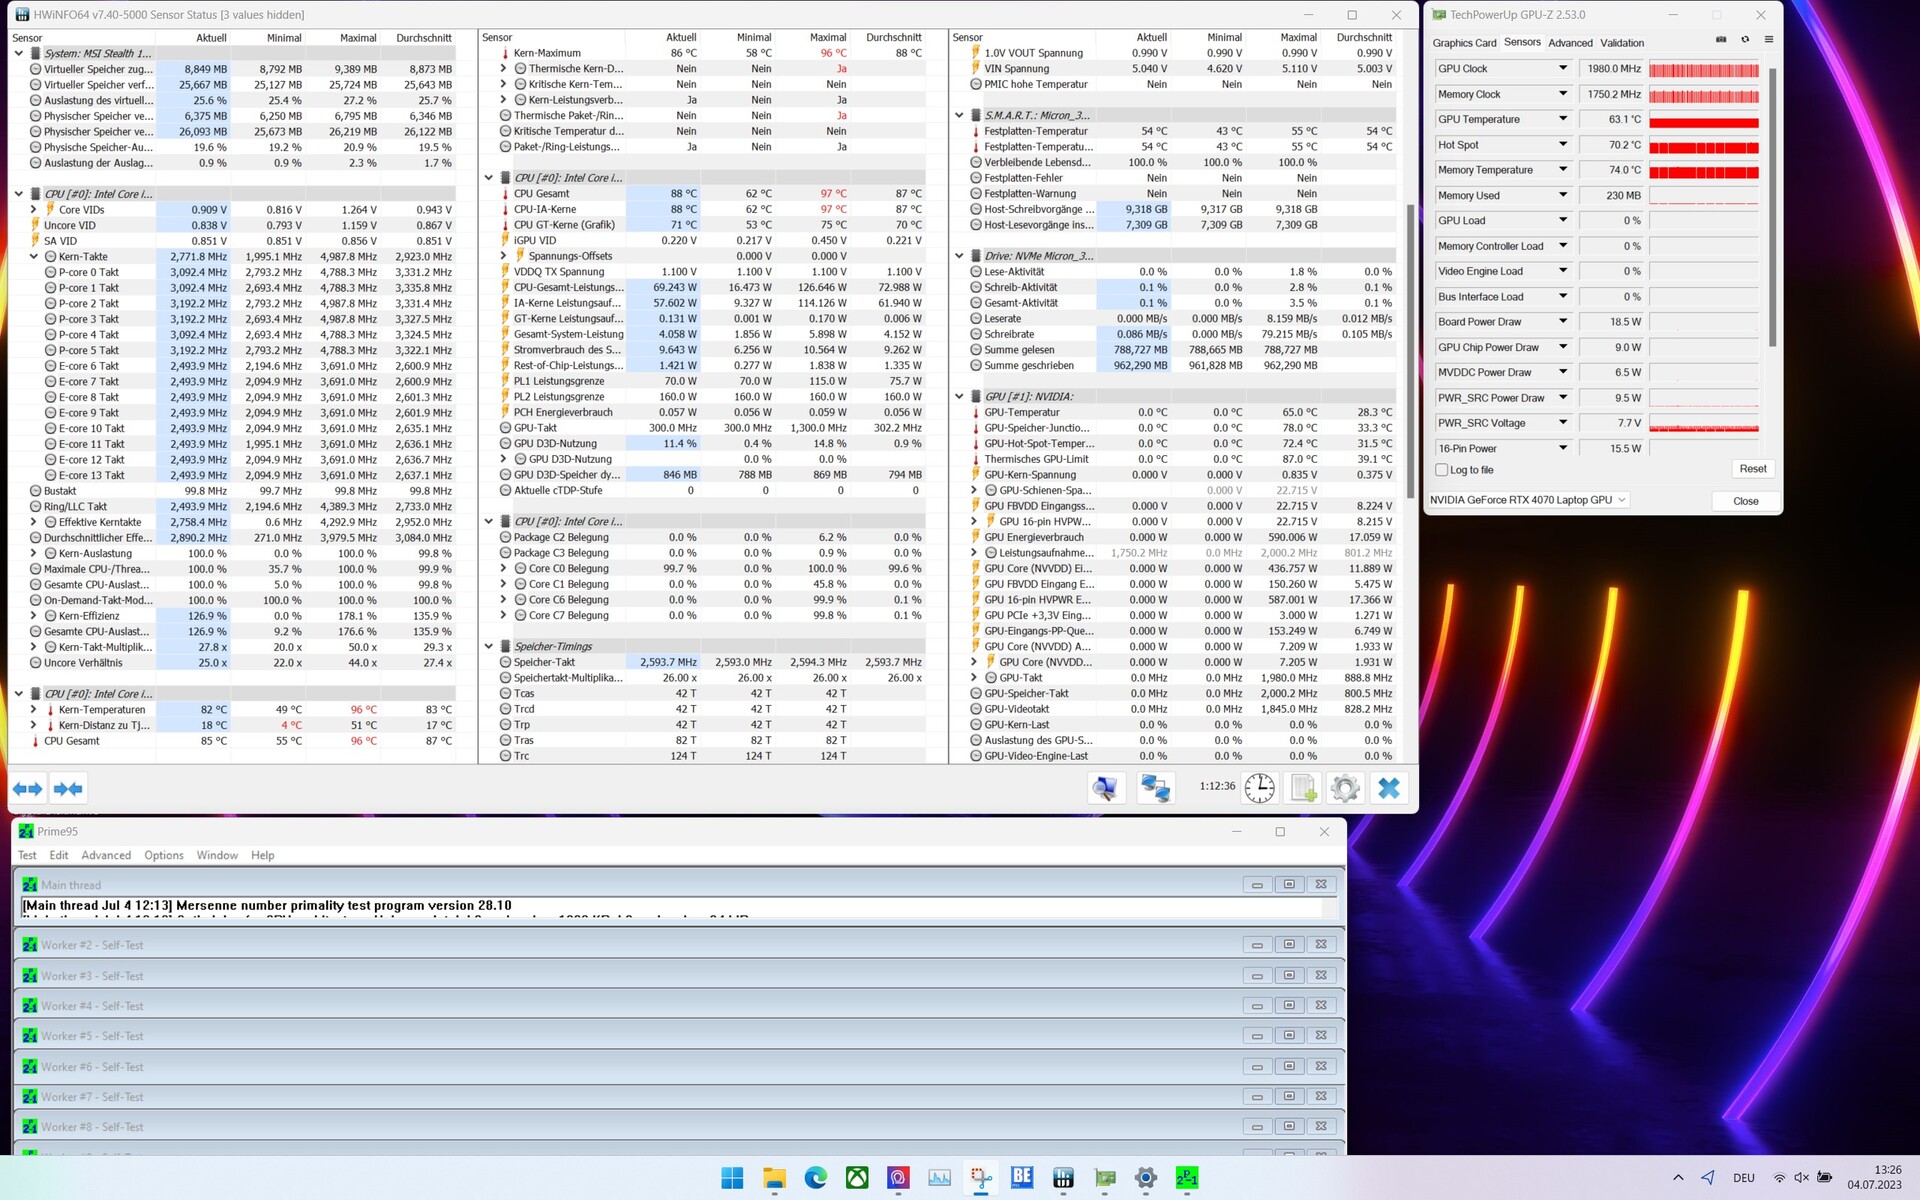
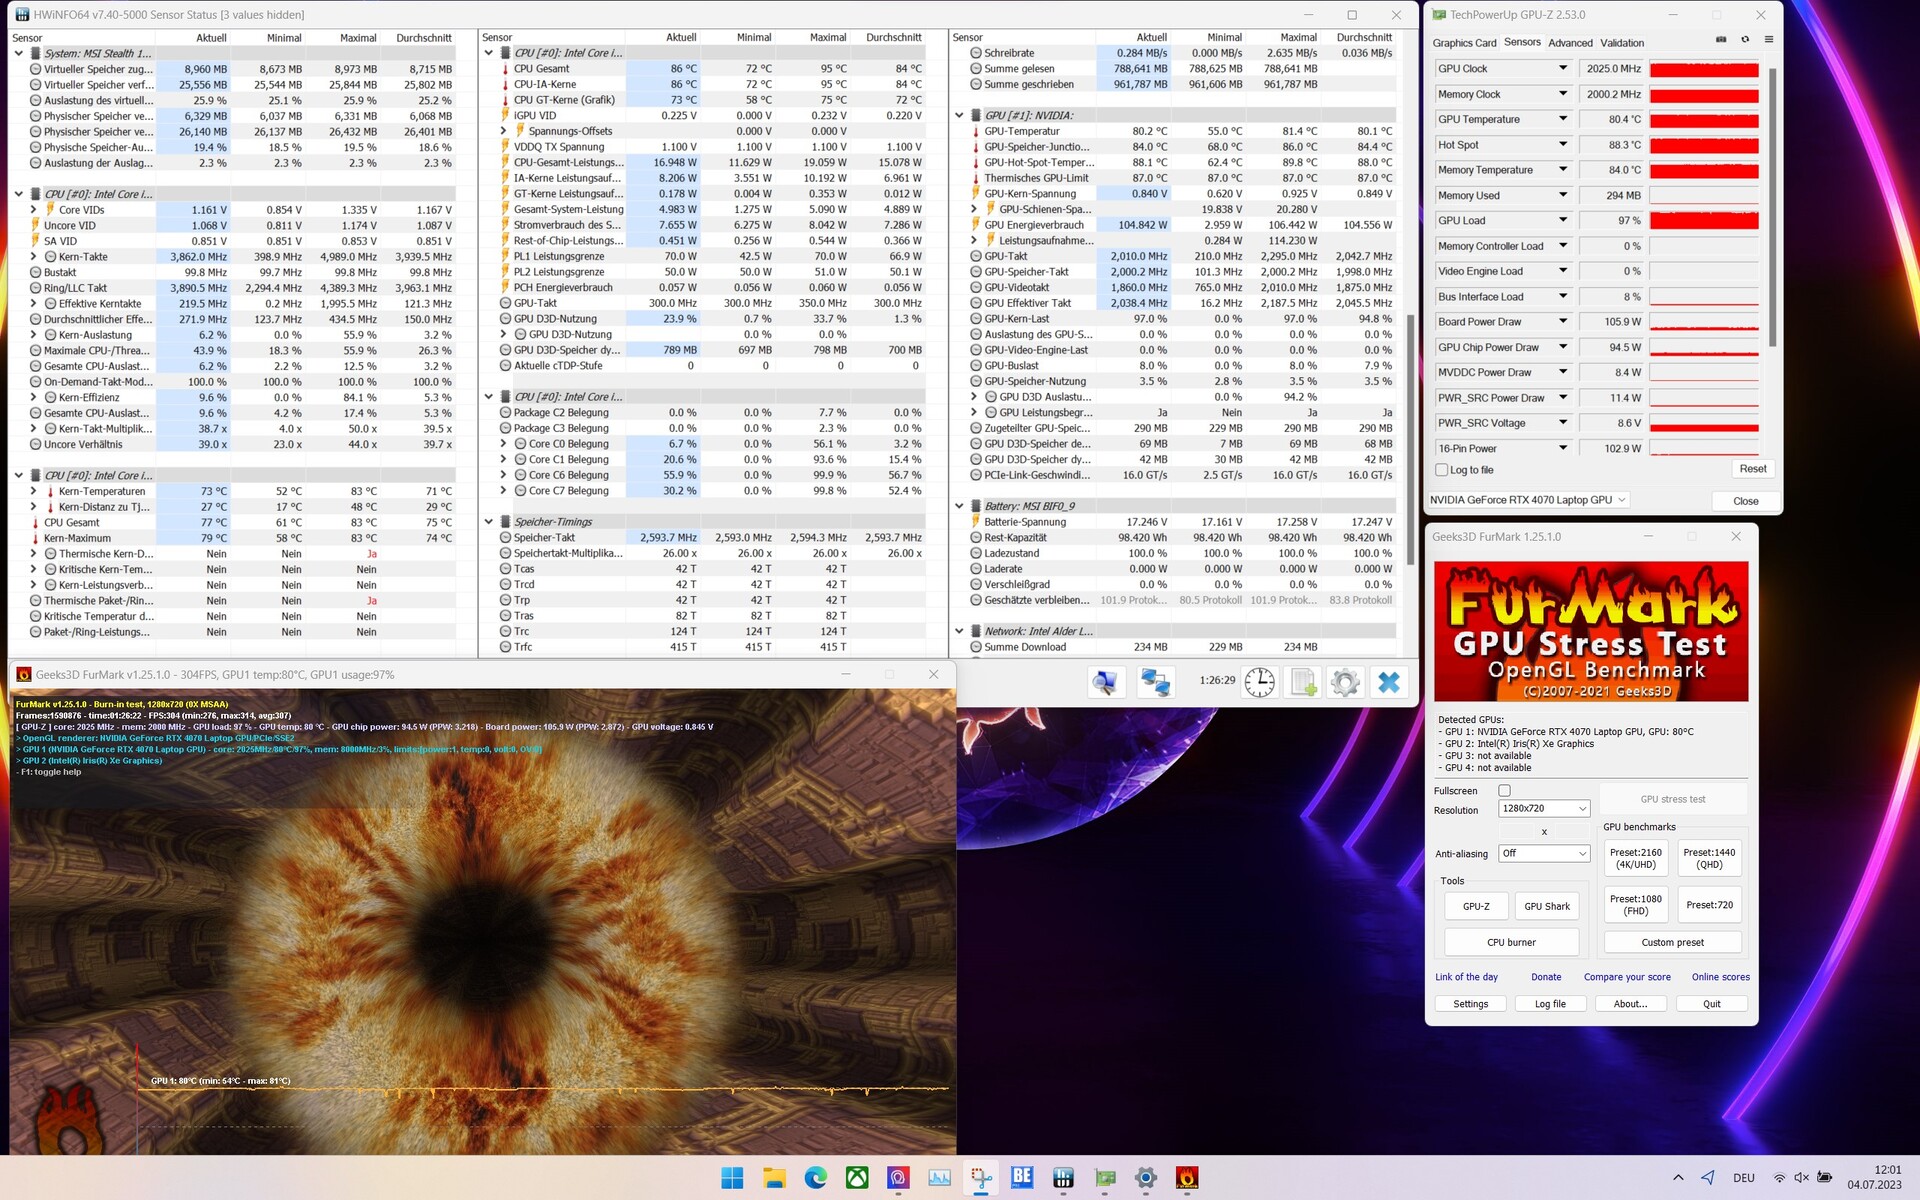
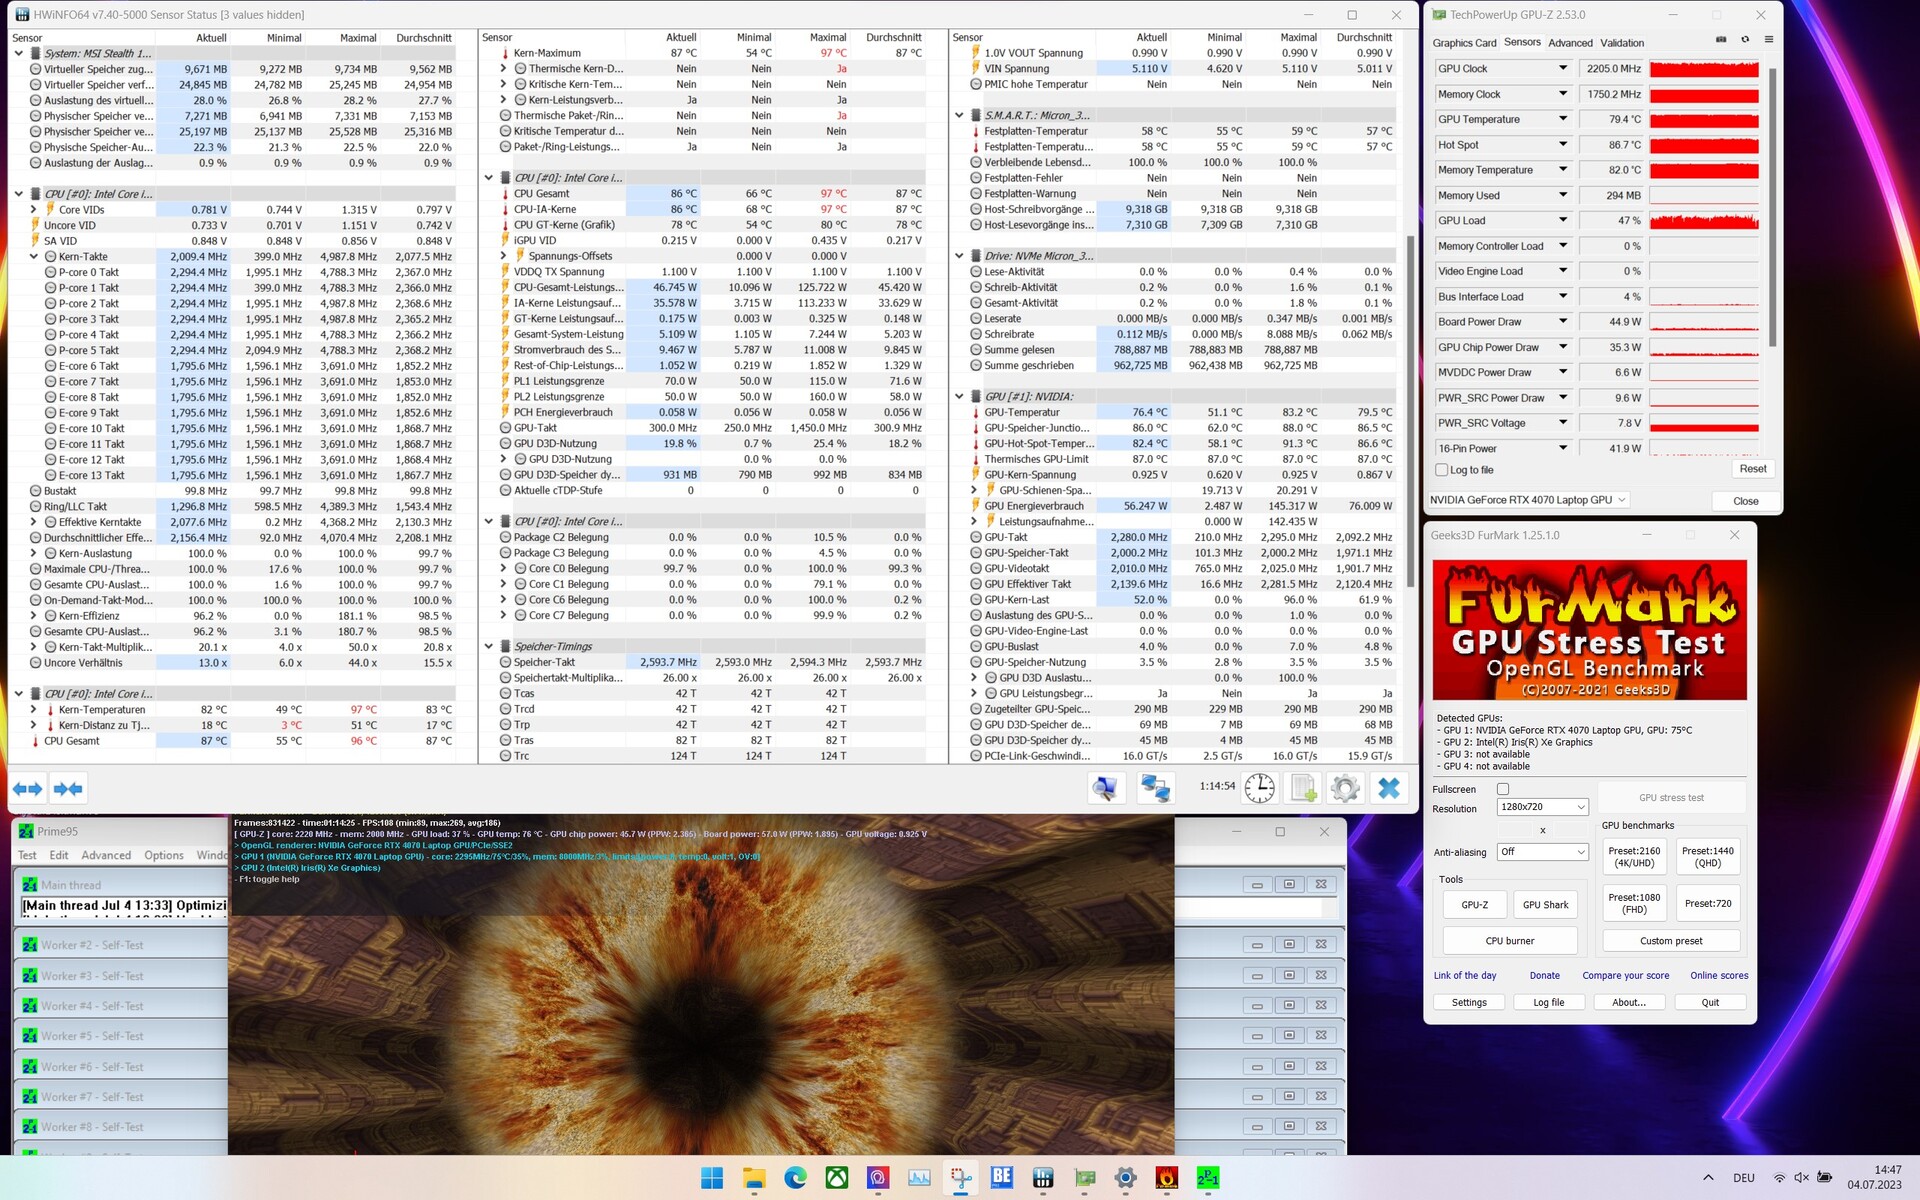
压力测试
我们使用Prime95和FurMark连续运行来模拟压力测试。它代表了一种极端情况,用于检查系统在全负荷下的稳定性。就处理器而言,我们观察到的最高值是97℃,是在一开始就达到的。随着时间的推移,CPU温度稳定在87℃左右。当涉及到图形适配器时,我们记录的最大热点值高达91℃。在平均80°C左右,我们看到负载下的温度大大降低。这意味着没有达到显卡的散热极限(87℃)。
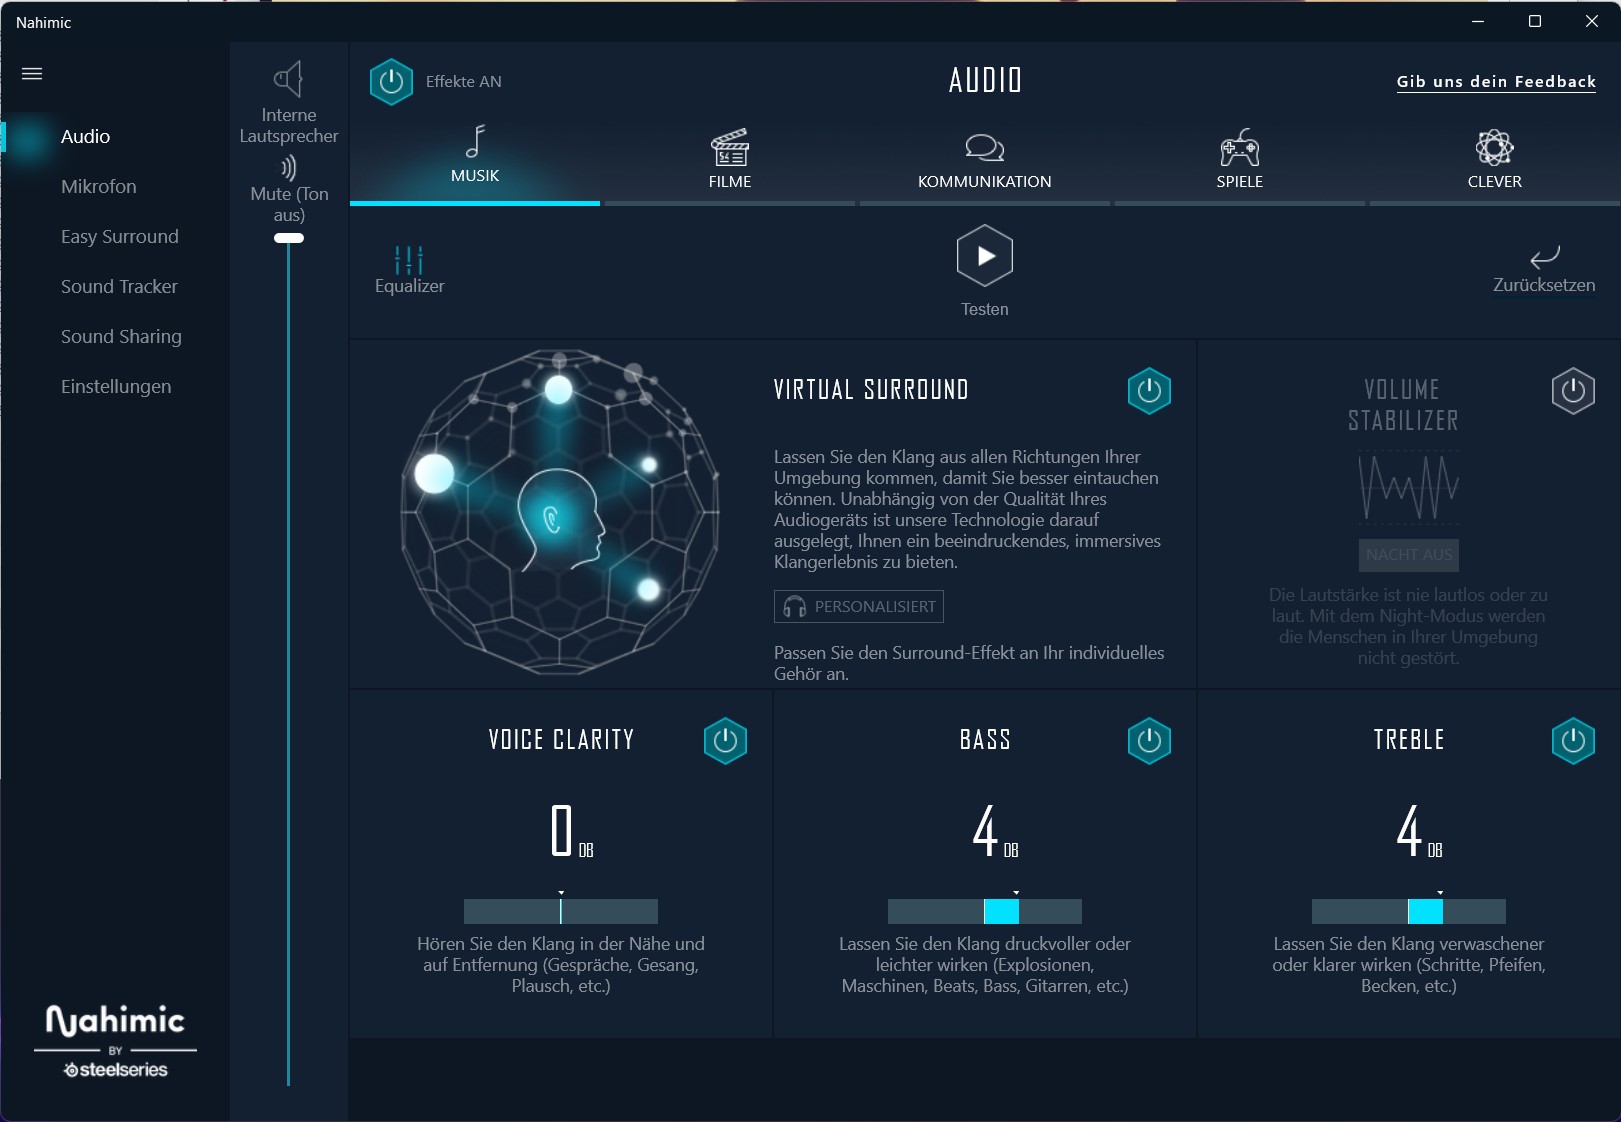
发言人
微星Stealth 16 Studio A13VG的声音系统基于六个扬声器,产生良好的音频体验。在最大音量下的播放是清晰和无干扰的,但不能取代外部系统。
MSI Stealth 16 Studio A13VG audio analysis
(+) | speakers can play relatively loud (85.48 dB)
Bass 100 - 315 Hz
(±) | reduced bass - on average 9% lower than median
(±) | linearity of bass is average (8.7% delta to prev. frequency)
Mids 400 - 2000 Hz
(+) | balanced mids - only 4.6% away from median
(+) | mids are linear (5.4% delta to prev. frequency)
Highs 2 - 16 kHz
(+) | balanced highs - only 2.7% away from median
(+) | highs are linear (5.1% delta to prev. frequency)
Overall 100 - 16.000 Hz
(+) | overall sound is linear (9.3% difference to median)
Compared to same class
» 3% of all tested devices in this class were better, 2% similar, 95% worse
» The best had a delta of 6%, average was 18%, worst was 132%
Compared to all devices tested
» 3% of all tested devices were better, 1% similar, 96% worse
» The best had a delta of 4%, average was 23%, worst was 134%
Asus ROG Flow X16 GV601V audio analysis
(±) | speaker loudness is average but good (77.38 dB)
Bass 100 - 315 Hz
(±) | reduced bass - on average 9.6% lower than median
(±) | linearity of bass is average (9.2% delta to prev. frequency)
Mids 400 - 2000 Hz
(+) | balanced mids - only 4.7% away from median
(±) | linearity of mids is average (7.5% delta to prev. frequency)
Highs 2 - 16 kHz
(+) | balanced highs - only 2.2% away from median
(+) | highs are linear (6.1% delta to prev. frequency)
Overall 100 - 16.000 Hz
(+) | overall sound is linear (12% difference to median)
Compared to same class
» 12% of all tested devices in this class were better, 4% similar, 84% worse
» The best had a delta of 6%, average was 18%, worst was 132%
Compared to all devices tested
» 9% of all tested devices were better, 2% similar, 88% worse
» The best had a delta of 4%, average was 23%, worst was 134%
能源管理--更大的电池和适度的能源需求
消耗功率
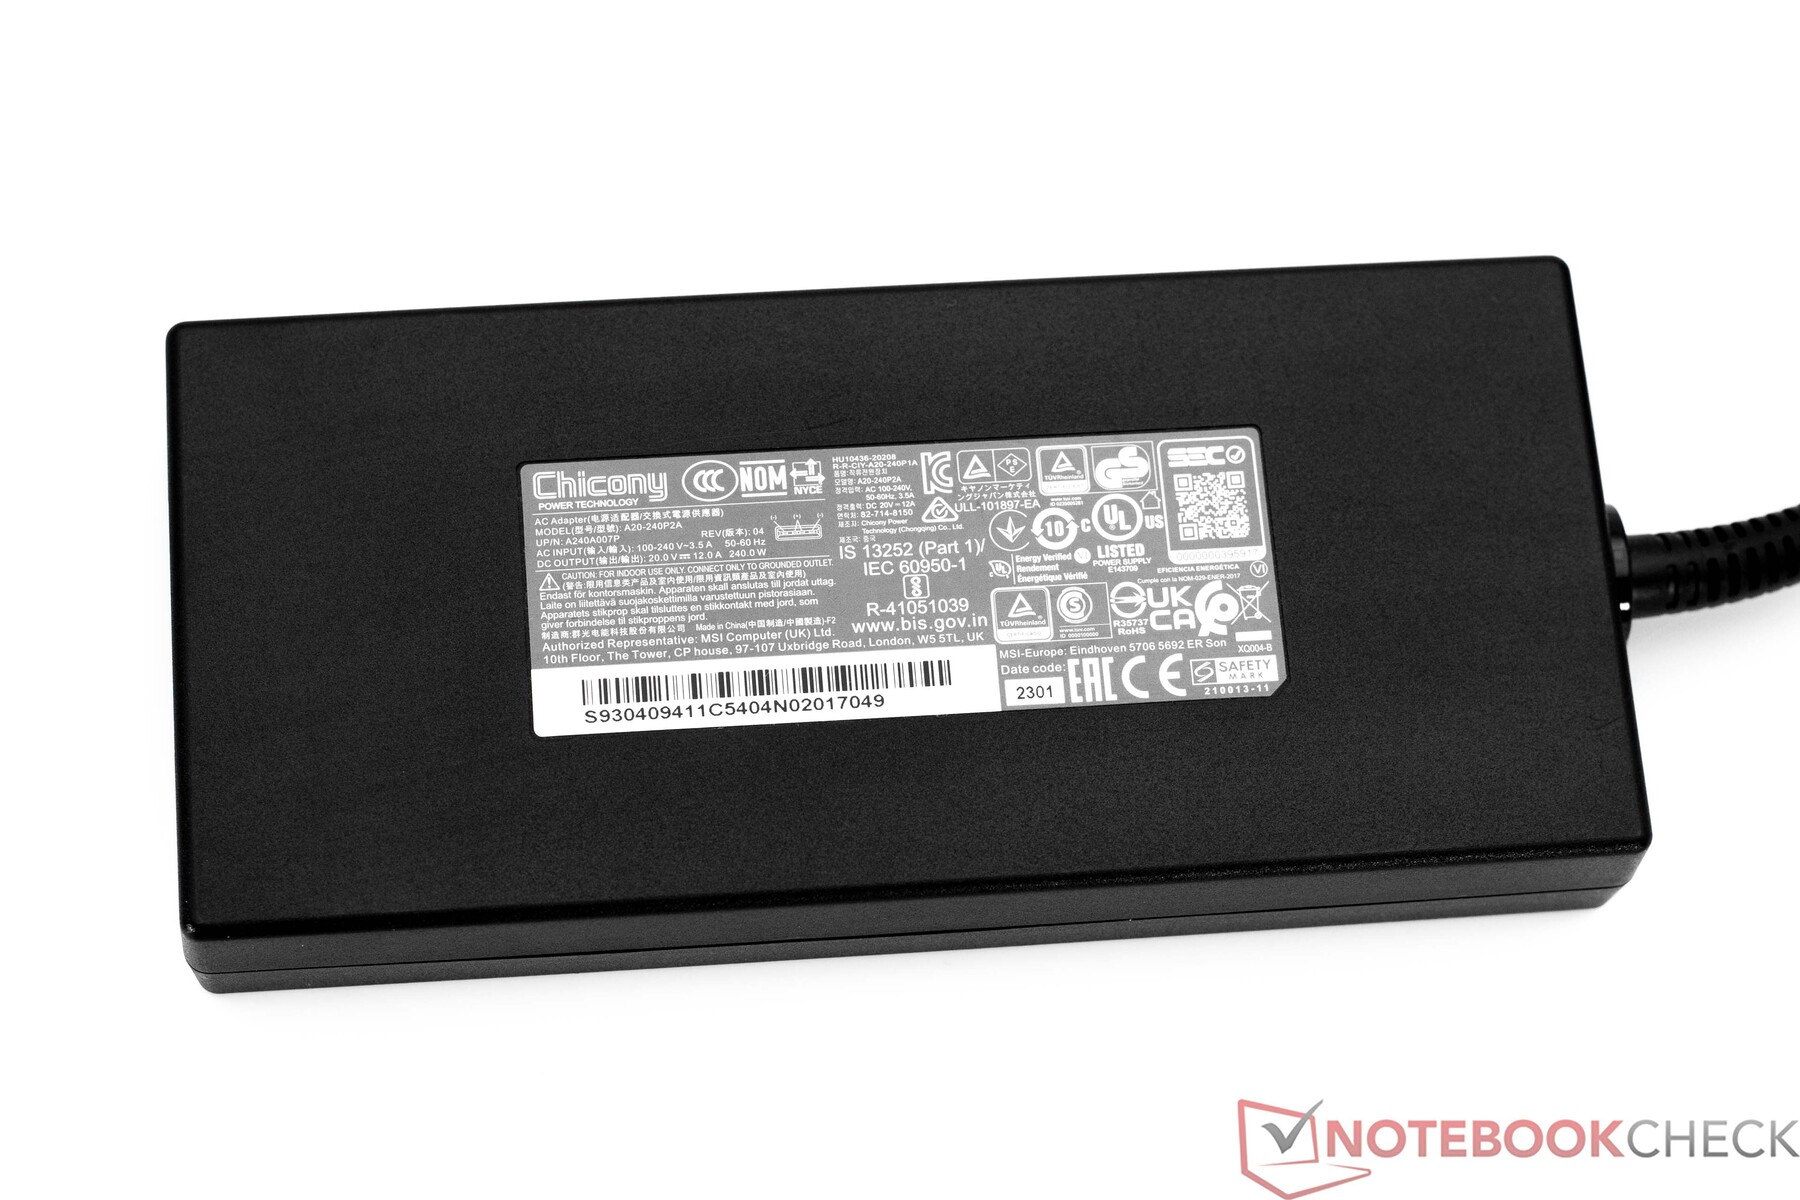
微星Stealth 16 Studio A13VG在功耗方面没有显示任何异常。在空闲状态下的记录值实际上是非常好的,尽管竞争者有时能够提供更好的结果。 然而,最低限度的高耗能是非常低的。在负载情况下,我们观察到与这种基本硬件有关的正常数值。在240瓦的情况下,PSU的尺寸很好,并没有被最大228瓦的功率所淹没。
| Off / Standby | |
| Idle | |
| Load |
|
Key:
min: | |
| MSI Stealth 16 Studio A13VG i7-13700H, GeForce RTX 4070 Laptop GPU, Micron 3400 2TB MTFDKBA2T0TFH, IPS, 2560x1600, 16" | Asus ROG Flow X16 GV601V i9-13900H, GeForce RTX 4060 Laptop GPU, WD PC SN560 SDDPNQE-1T00, IPS, 2560x1600, 16" | Medion Erazer Major X20 i9-13900HX, GeForce RTX 4070 Laptop GPU, Phison E18-1TB-PHISON-SSD-B47R, IPS, 2560x1600, 16" | Acer Nitro 16 AN16-41 R7 7735HS, GeForce RTX 4070 Laptop GPU, Samsung PM9A1 MZVL21T0HCLR, IPS, 2560x1600, 16" | Corsair Voyager a1600 R9 6900HS, Radeon RX 6800M, Samsung PM9A1 MZVL22T0HBLB, IPS, 2560x1600, 16" | Gigabyte AERO 16 OLED BSF i9-13900H, GeForce RTX 4070 Laptop GPU, Gigabyte AG470S1TB-SI B10, OLED, 3840x2400, 16" | Average NVIDIA GeForce RTX 4070 Laptop GPU | Average of class Gaming | |
|---|---|---|---|---|---|---|---|---|
| Power Consumption | 3% | -25% | -10% | -38% | -0% | -11% | -18% | |
| Idle Minimum * (Watt) | 11 | 9.6 13% | 12 -9% | 11.6 -5% | 16.9 -54% | 11.8 -7% | 13.2 ? -20% | 13 ? -18% |
| Idle Average * (Watt) | 18 | 16 11% | 16 11% | 15.6 13% | 20.3 -13% | 16.1 11% | 18.2 ? -1% | 19 ? -6% |
| Idle Maximum * (Watt) | 19 | 16.9 11% | 26 -37% | 16.5 13% | 22.2 -17% | 17 11% | 24.6 ? -29% | 24.6 ? -29% |
| Load Average * (Watt) | 91 | 104 -14% | 115 -26% | 155 -70% | 133.4 -47% | 100.6 -11% | 97 ? -7% | 110.7 ? -22% |
| Witcher 3 ultra * (Watt) | 130 | 142 -9% | 191.6 -47% | 154.8 -19% | 206 -58% | 158 -22% | ||
| Load Maximum * (Watt) | 228 | 214 6% | 319 -40% | 205 10% | 192 16% | 221 ? 3% | 259 ? -14% |
* ... smaller is better
Power consumption Witcher 3 / stress test
Power consumption with an external monitor
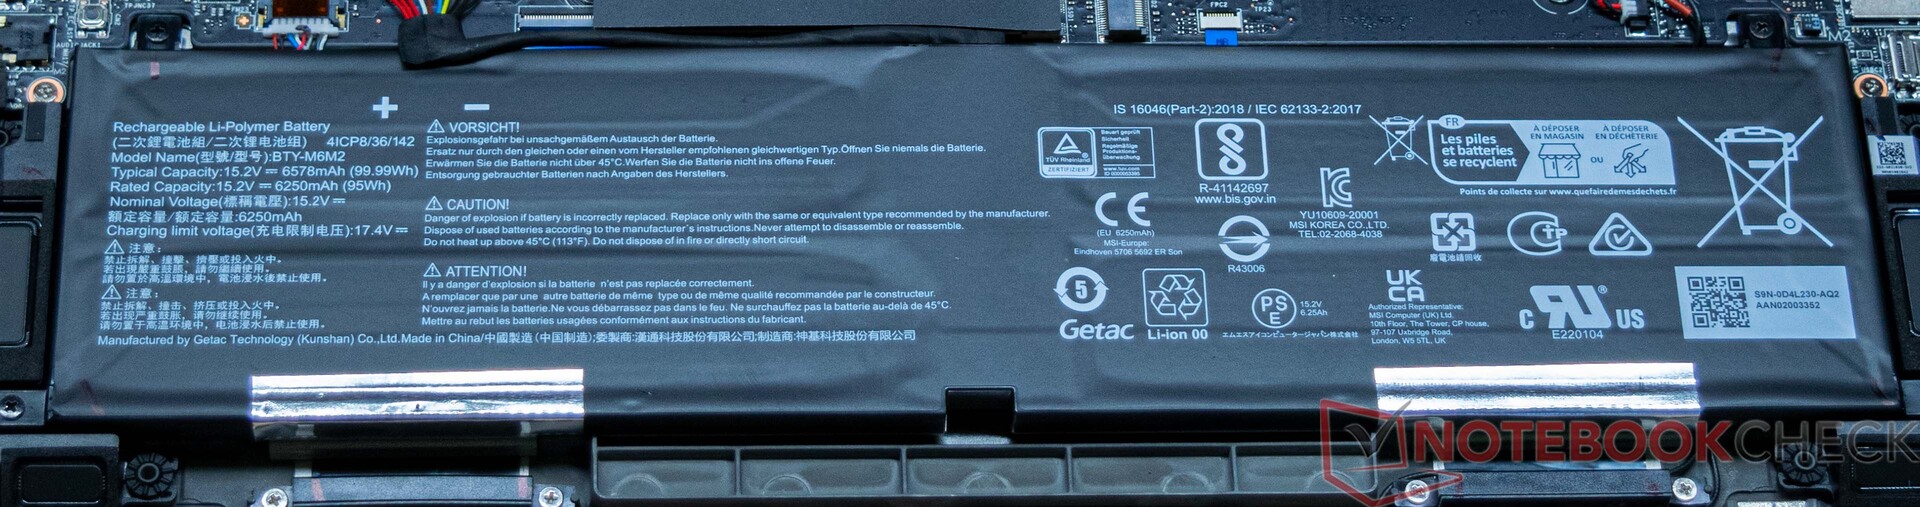
电池寿命
Das MSI Stealth 16 Studio A13VG有一个99Wh的电池,这是一个笔记本电脑可以采取的最大尺寸。由于它的容量,我们的审查样本管理7小时46分钟和7小时42分钟,分别在我们的Wi-Fi测试循环(使用脚本加载一个网站)和视频测试大巴克兔短片(H.264编码,FHD)。这意味着微星Stealth 16 Studio A13VG对于一台游戏笔记本来说管理着出色的电池寿命。在这两项测试中,显示亮度被设置为150cd/m²。在我们的案例中,这意味着将亮度降低到37%。
充满电几乎正好需要三个小时。然而,在大约一半的时间后,电池被充电到70%。

| MSI Stealth 16 Studio A13VG i7-13700H, GeForce RTX 4070 Laptop GPU, 99.9 Wh | Asus ROG Flow X16 GV601V i9-13900H, GeForce RTX 4060 Laptop GPU, 90 Wh | Medion Erazer Major X20 i9-13900HX, GeForce RTX 4070 Laptop GPU, 62.3 Wh | Acer Nitro 16 AN16-41 R7 7735HS, GeForce RTX 4070 Laptop GPU, 90 Wh | Corsair Voyager a1600 R9 6900HS, Radeon RX 6800M, 99 Wh | Gigabyte AERO 16 OLED BSF i9-13900H, GeForce RTX 4070 Laptop GPU, 88 Wh | Average of class Gaming | |
|---|---|---|---|---|---|---|---|
| Battery runtime | -7% | -44% | 8% | -24% | -7% | -16% | |
| Reader / Idle (h) | 11 | 5.8 -47% | 12.2 11% | 7 -36% | 8.27 ? -25% | ||
| H.264 (h) | 7.7 | 8.9 16% | 4.2 -45% | 10.2 32% | 6 -22% | 7.4 -4% | 8.32 ? 8% |
| WiFi v1.3 (h) | 7.8 | 7.9 1% | 3.9 -50% | 9 15% | 5.8 -26% | 7.5 -4% | 7.11 ? -9% |
| Load (h) | 2.4 | 1.5 -37% | 1.6 -33% | 1.8 -25% | 2.1 -12% | 2.1 -12% | 1.502 ? -37% |
Pros
Cons
结论 - 创作者的高级笔记本电脑
就其内置的CPU和GPU而言,微星Stealth 16 Studio A13VG是一款贯穿始终的游戏笔记本电脑。纯粹从视觉角度来看,微星Stealth 16 Studio A13VG是一款具有游戏野心的有品位的商务笔记本电脑。这样一来,该设备涵盖了广泛的需求,以吸引许多用户。这款笔记本电脑的目标是那些依赖高水平系统性能的创造者。英特尔酷睿i7-13700H与Nvidia-GeForce RTX 4070笔记本GPU相结合的性能一直很好。显示屏也要满足必要的要求,这一点它通过高色彩空间覆盖率来实现。
其余的规格也给我们留下了深刻的印象--32GB的DDR5内存和总共2TB的固态硬盘存储是一个很好的基础,这确保了笔记本电脑不会很快需要升级。16英寸显示屏提供QHD+分辨率,16:10的长宽比和240赫兹的刷新率证明了它的游戏资质。
微星Stealth 16 Studio A13VG同时是一个非常强大和非常轻的笔记本电脑,适合内容创作者和游戏者。
另一方面,声音的限制来自于音量的形式,然而,这对于游戏笔记本来说是典型的。我们对端口的选择也持批评态度,因为只有一个USB-A端口对于这类设备来说根本不够用。然而,有一个现代的Thunderbolt 4端口,使笔记本电脑可以有效地扩展。读卡器的实现很好,从性能上讲,它没有理由隐藏。
说到移动性,微星Stealth 16 Studio A13VG是一个很好的数字,因为它的低重量和良好的电池寿命都高于平均水平。许多设置可以通过微星中心进行,在正确的设置下,该设备甚至可以几乎无声地运行。
然而,在定价方面,微星Stealth 16 Studio A13VG目前的要价约为2549美元,让人很难接受。对于一个更便宜的替代品,值得一看的是 Medion Erazer Major X20,它配备了一个NvidiaGeForce RTX 4070笔记本GPU并提供出色的性能。
价格和可用性
配备1TB固态硬盘和64GB内存的微星Stealth 16 Studio A13VG目前在BestBuy售价为2549.99美元。
MSI Stealth 16 Studio A13VG
- 11/28/2023 v7 (old)
Sebastian Bade
Transparency
The selection of devices to be reviewed is made by our editorial team. The test sample was provided to the author as a loan by the manufacturer or retailer for the purpose of this review. The lender had no influence on this review, nor did the manufacturer receive a copy of this review before publication. There was no obligation to publish this review. As an independent media company, Notebookcheck is not subjected to the authority of manufacturers, retailers or publishers.
This is how Notebookcheck is testing
Every year, Notebookcheck independently reviews hundreds of laptops and smartphones using standardized procedures to ensure that all results are comparable. We have continuously developed our test methods for around 20 years and set industry standards in the process. In our test labs, high-quality measuring equipment is utilized by experienced technicians and editors. These tests involve a multi-stage validation process. Our complex rating system is based on hundreds of well-founded measurements and benchmarks, which maintains objectivity. Further information on our test methods can be found here.
Price comparison

