Razer Blade 18笔记本电脑回顾。比许多17英寸游戏笔记本更小
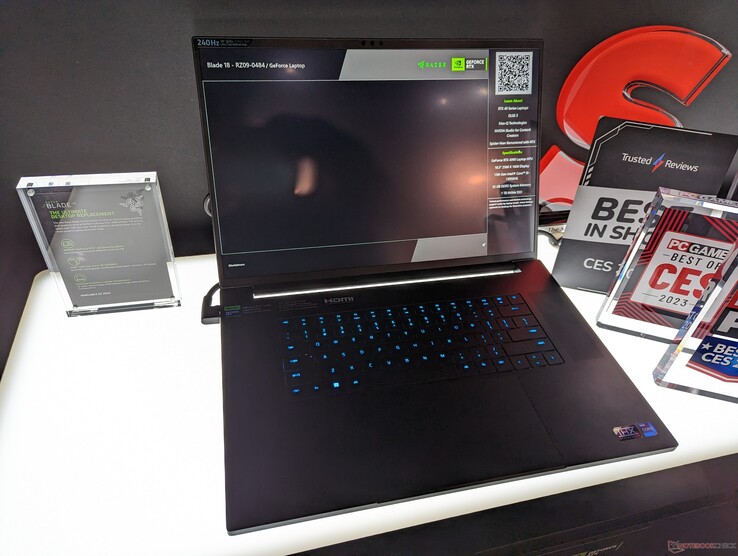
在2023年的CES上亮相的Blade 18提供了迄今为止最大的屏幕尺寸的Blade笔记本电脑,同时采用了熟悉的Razer机箱设计。该模型的推出与移动13代英特尔酷睿系列和移动NvidiaGeForce 40 Ada Lovelace系列的推出相吻合,这与最近的 刀锋16.
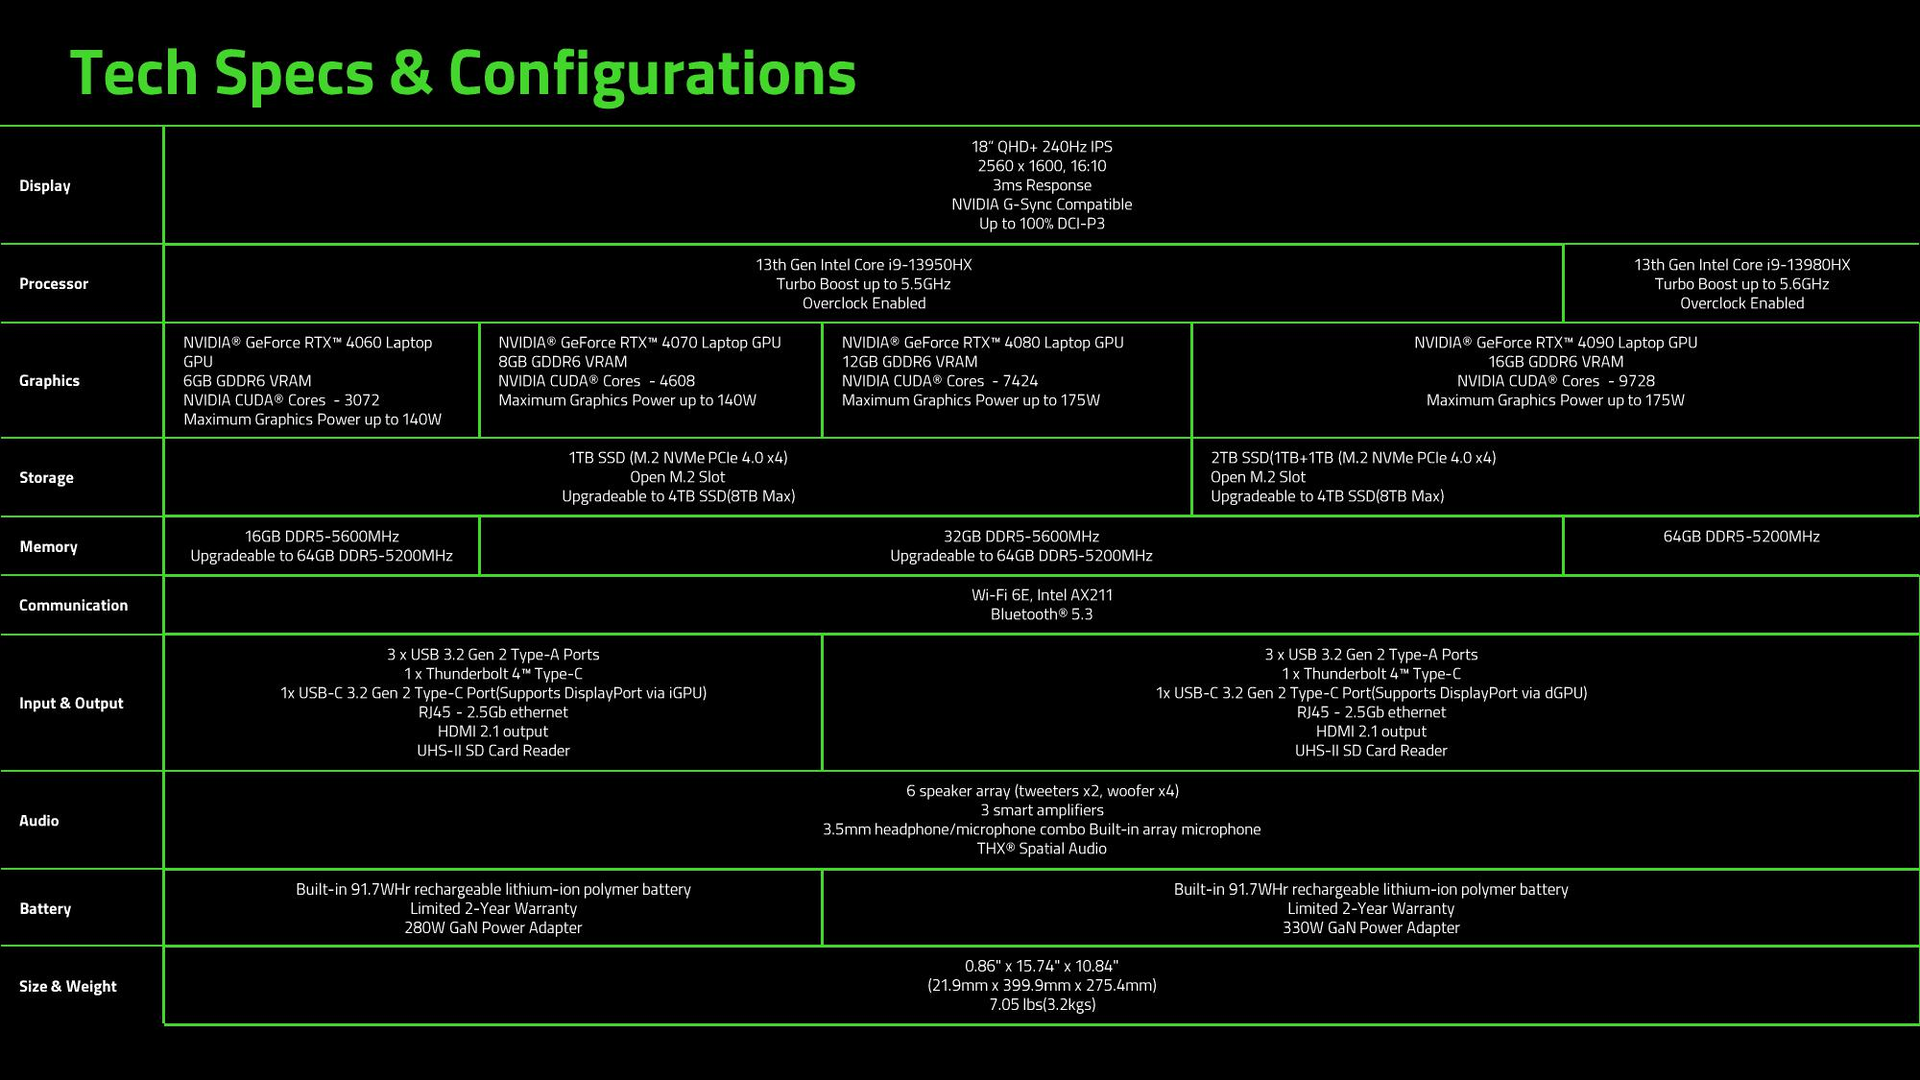
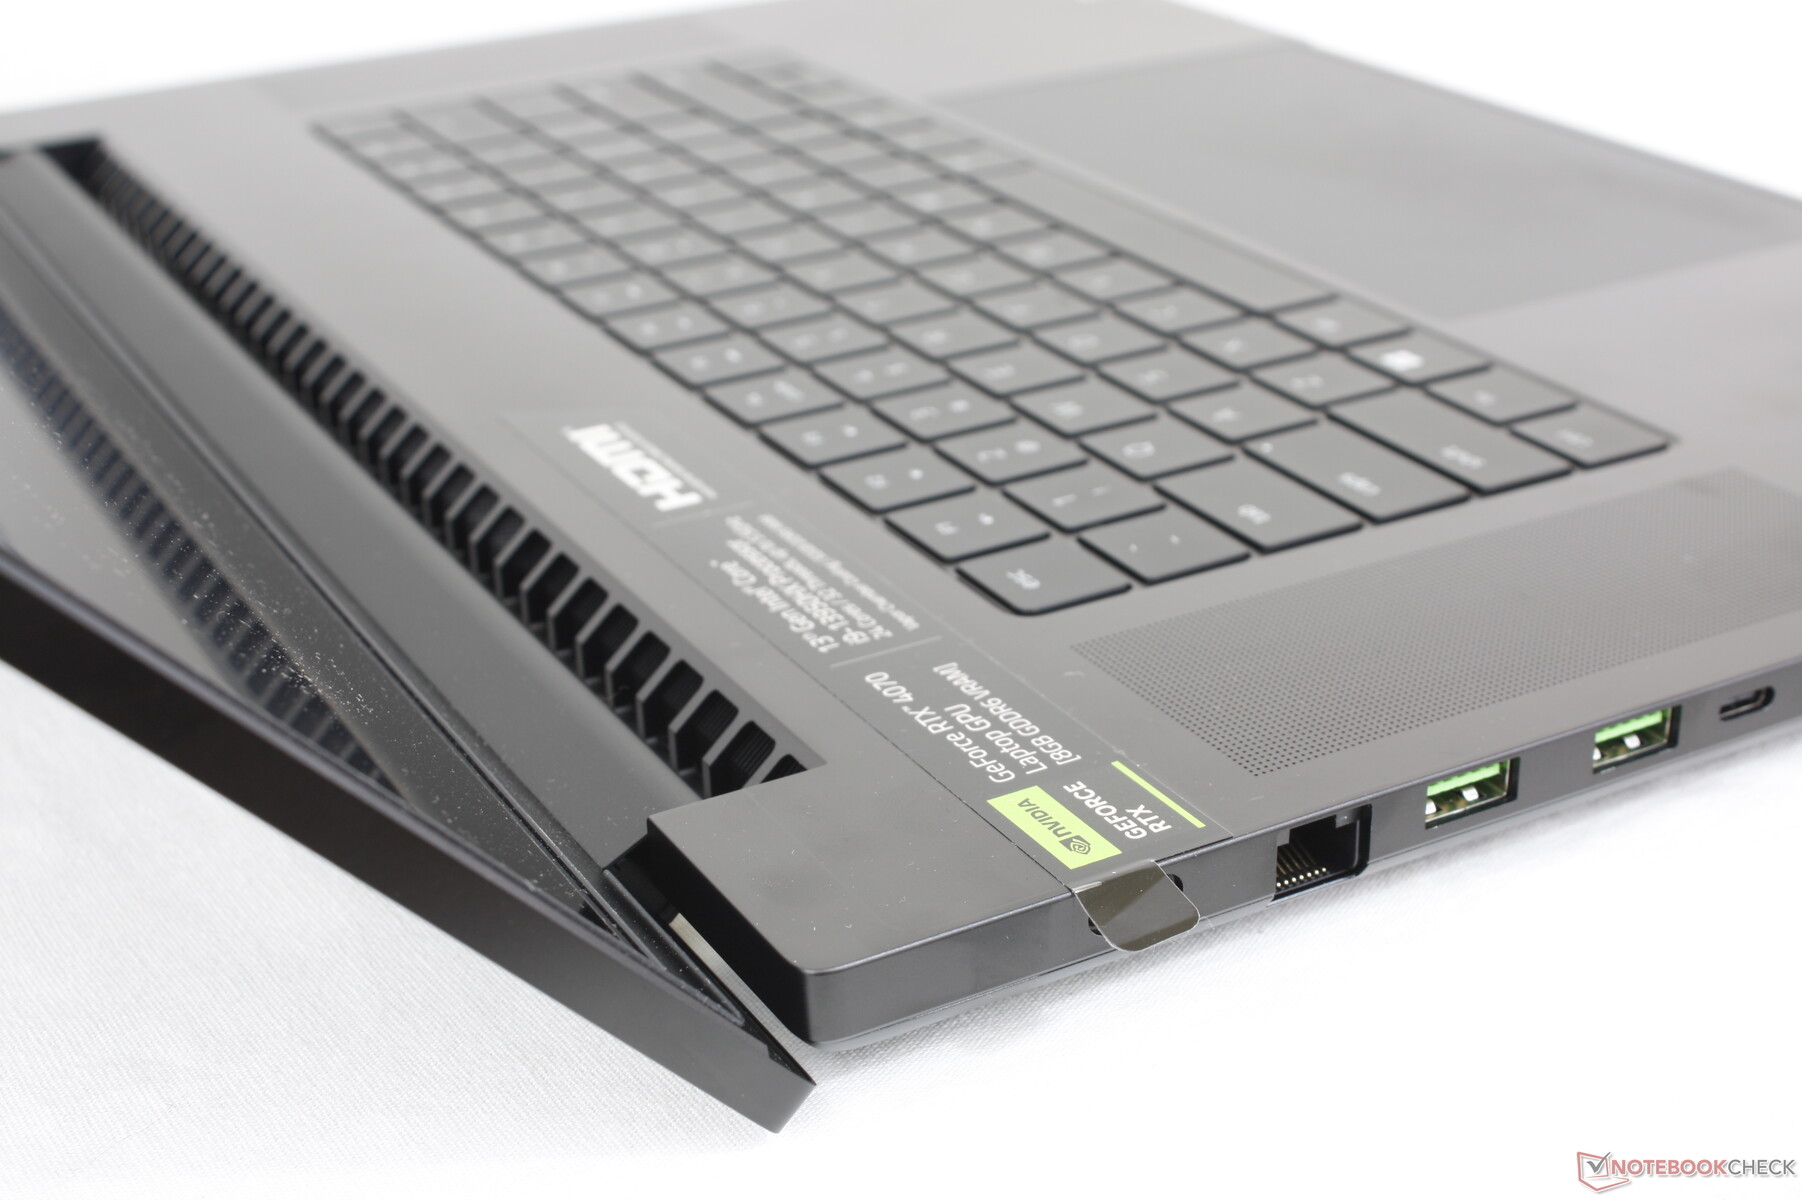
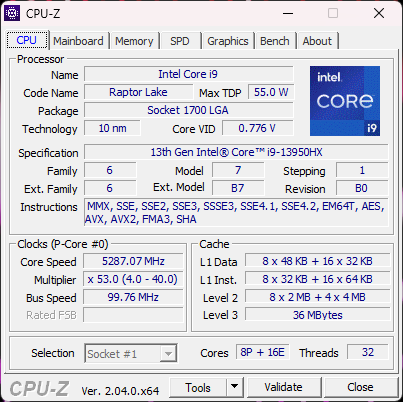
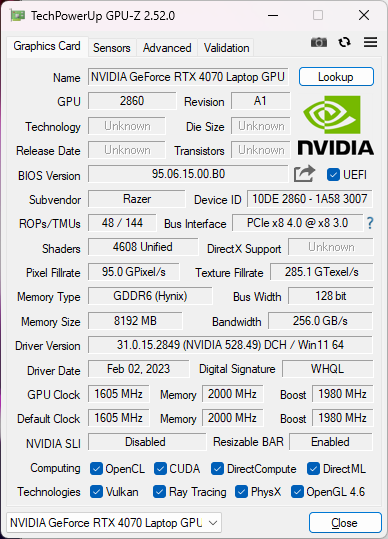
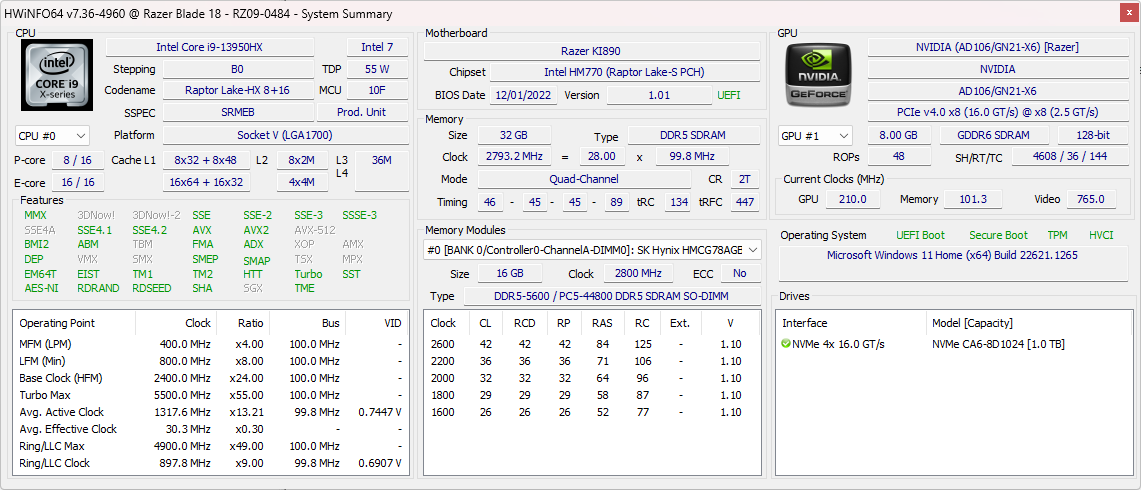
配置范围从Core i9-13950HX CPU和140 WGeForce RTX 4060 GPU到Core i9-13980HX和175 W RTX 4090。所有配置都配备了相同的16:10 QHD+ 240 Hz IPS面板。我们的具体审查单位是一个中间配置的运动,140 W RTX 4070的零售价约为3200美元。
18英寸笔记本电脑并不常见,6年前的微星GT83 Titan 是一个明显的例子。华硕和戴尔预计将分别推出ROG Strix Scar 18 和Alienware m18 ,直接与雷蛇Blade 18竞争。
更多Razer评论。
潜在的竞争对手比较
Rating | Date | Model | Weight | Height | Size | Resolution | Price |
|---|---|---|---|---|---|---|---|
| 91.4 % v7 (old) | 02 / 2023 | Razer Blade 18 RTX 4070 i9-13950HX, GeForce RTX 4070 Laptop GPU | 3 kg | 21.9 mm | 18.00" | 2560x1600 | |
| 89.9 % v7 (old) | 07 / 2022 | Razer Blade 17 Early 2022 i9-12900H, GeForce RTX 3080 Ti Laptop GPU | 2.8 kg | 19.9 mm | 17.30" | 3840x2160 | |
| 89 % v7 (old) | 02 / 2023 | MSI Titan GT77 HX 13VI i9-13950HX, GeForce RTX 4090 Laptop GPU | 3.5 kg | 23 mm | 17.30" | 3840x2160 | |
| 83.3 % v7 (old) | 01 / 2023 | Gigabyte G7 KE i5-12500H, GeForce RTX 3060 Laptop GPU | 2.6 kg | 25 mm | 17.30" | 1920x1080 | |
| 86.1 % v7 (old) | 01 / 2023 | Alienware m17 R5 (R9 6900HX, RX 6850M XT) R9 6900HX, Radeon RX 6850M XT | 3.4 kg | 26.7 mm | 17.00" | 3840x2160 | |
| 86.9 % v7 (old) | 11 / 2022 | Asus ROG Strix Scar 17 SE G733CX-LL014W i9-12950HX, GeForce RTX 3080 Ti Laptop GPU | 2.9 kg | 28.3 mm | 17.30" | 2560x1440 |
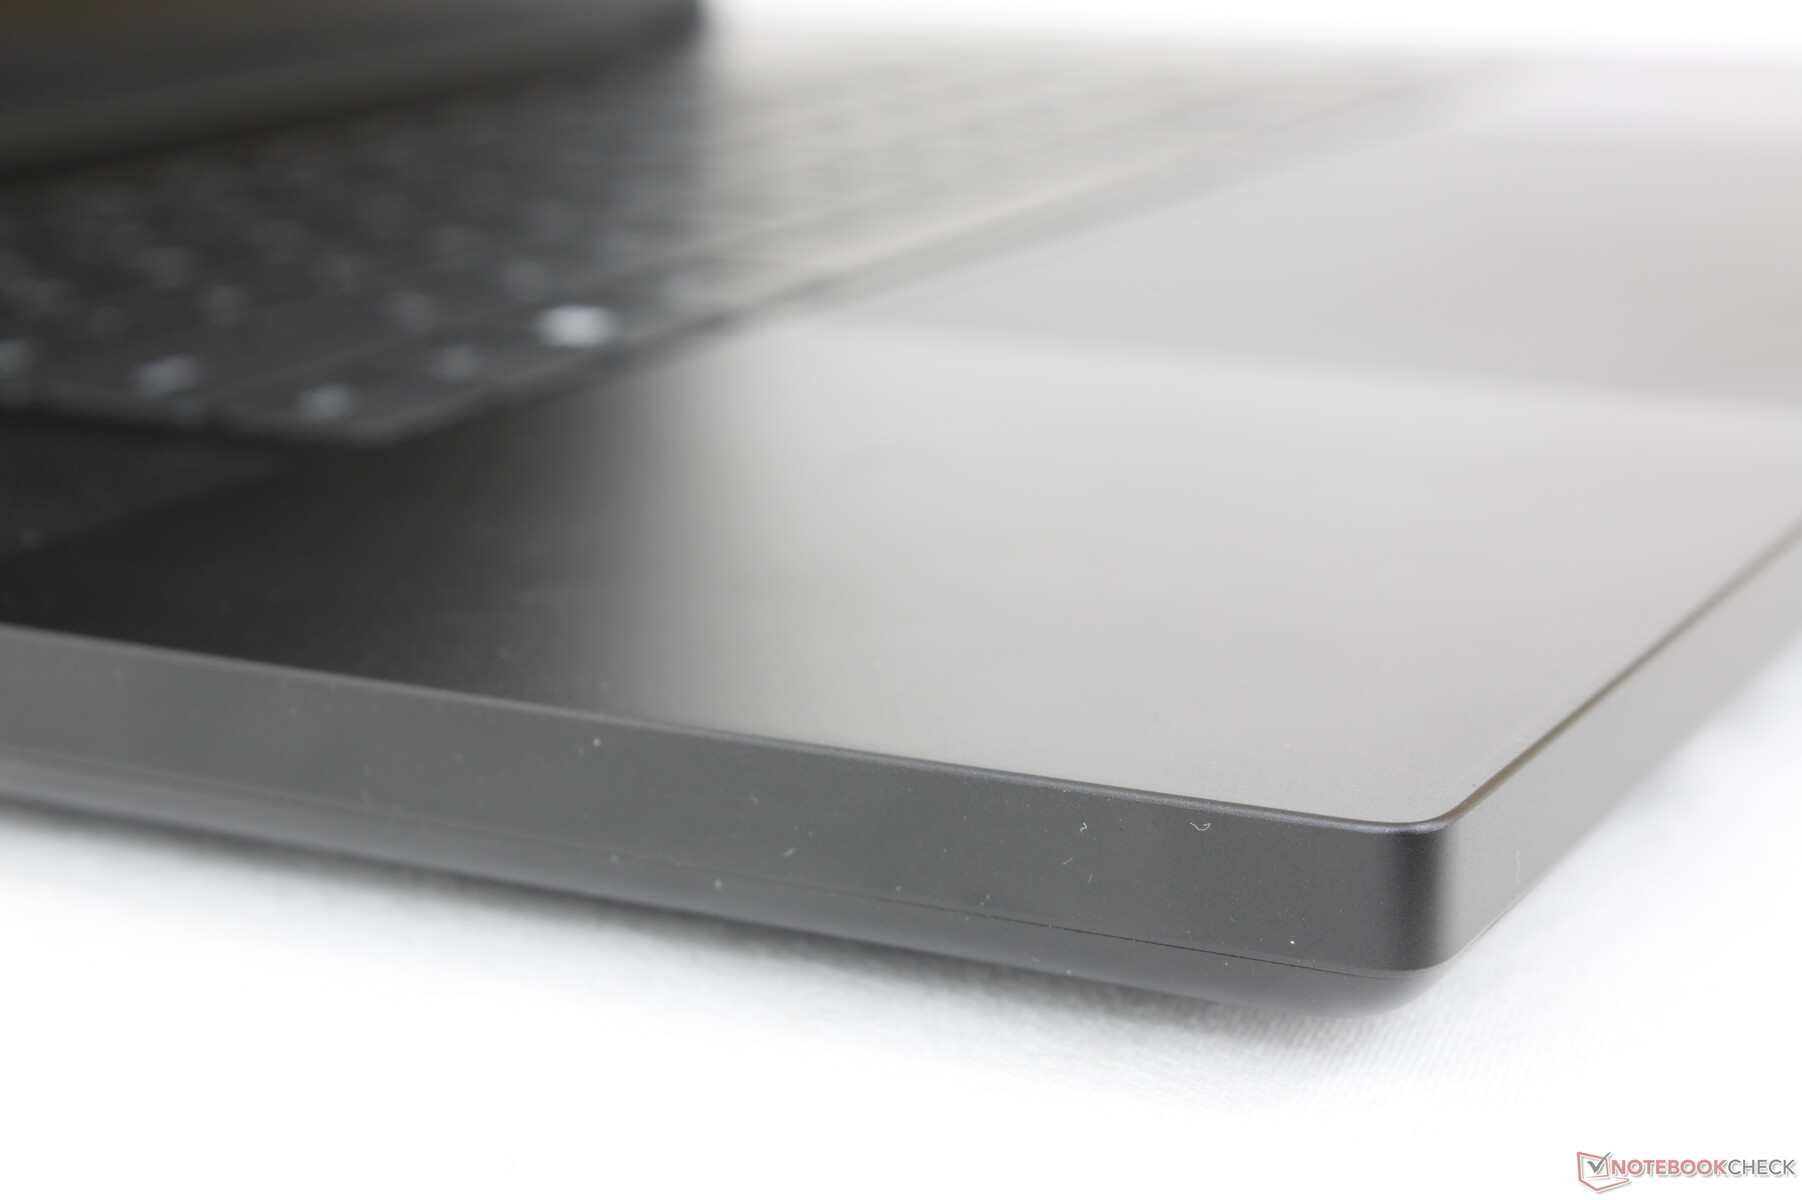
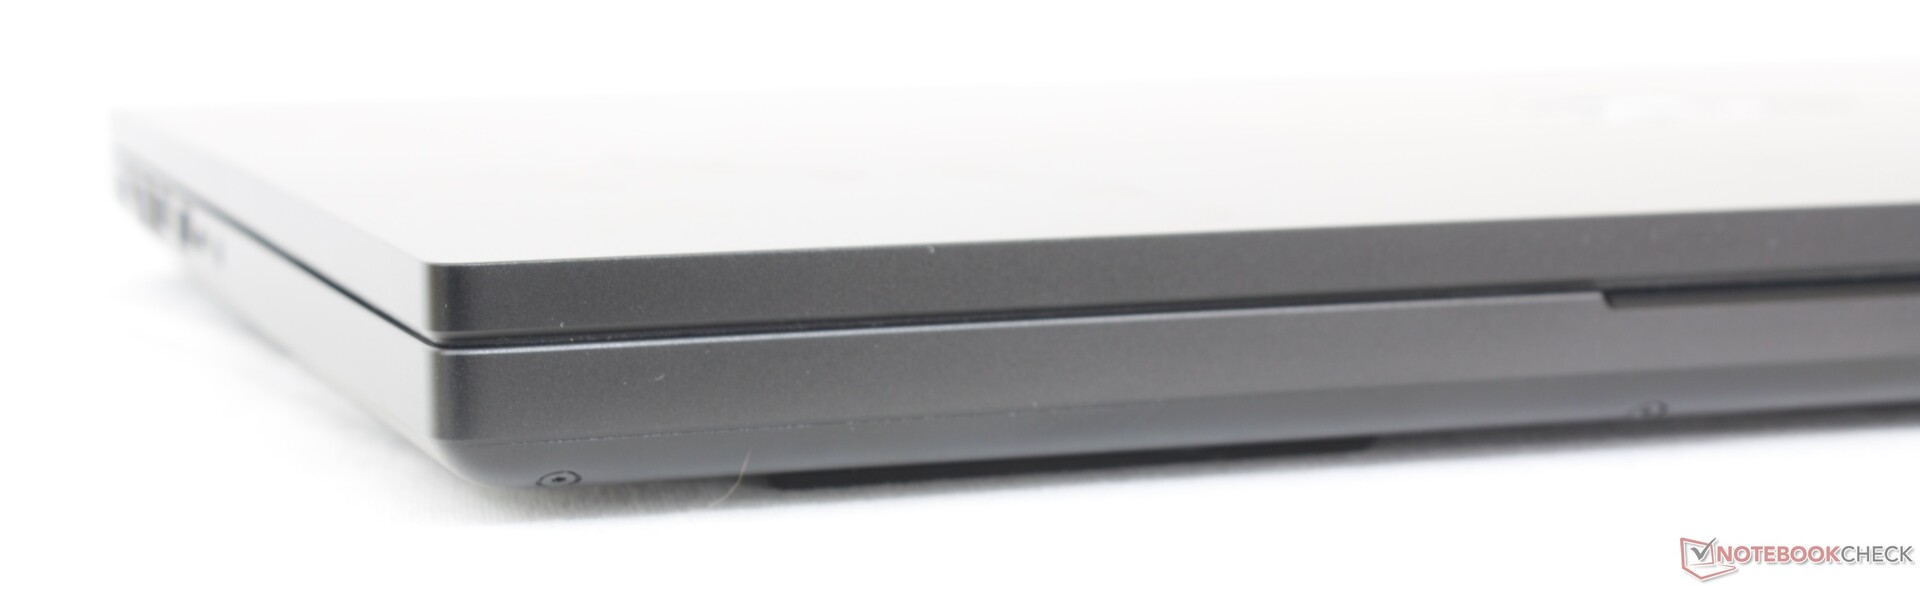
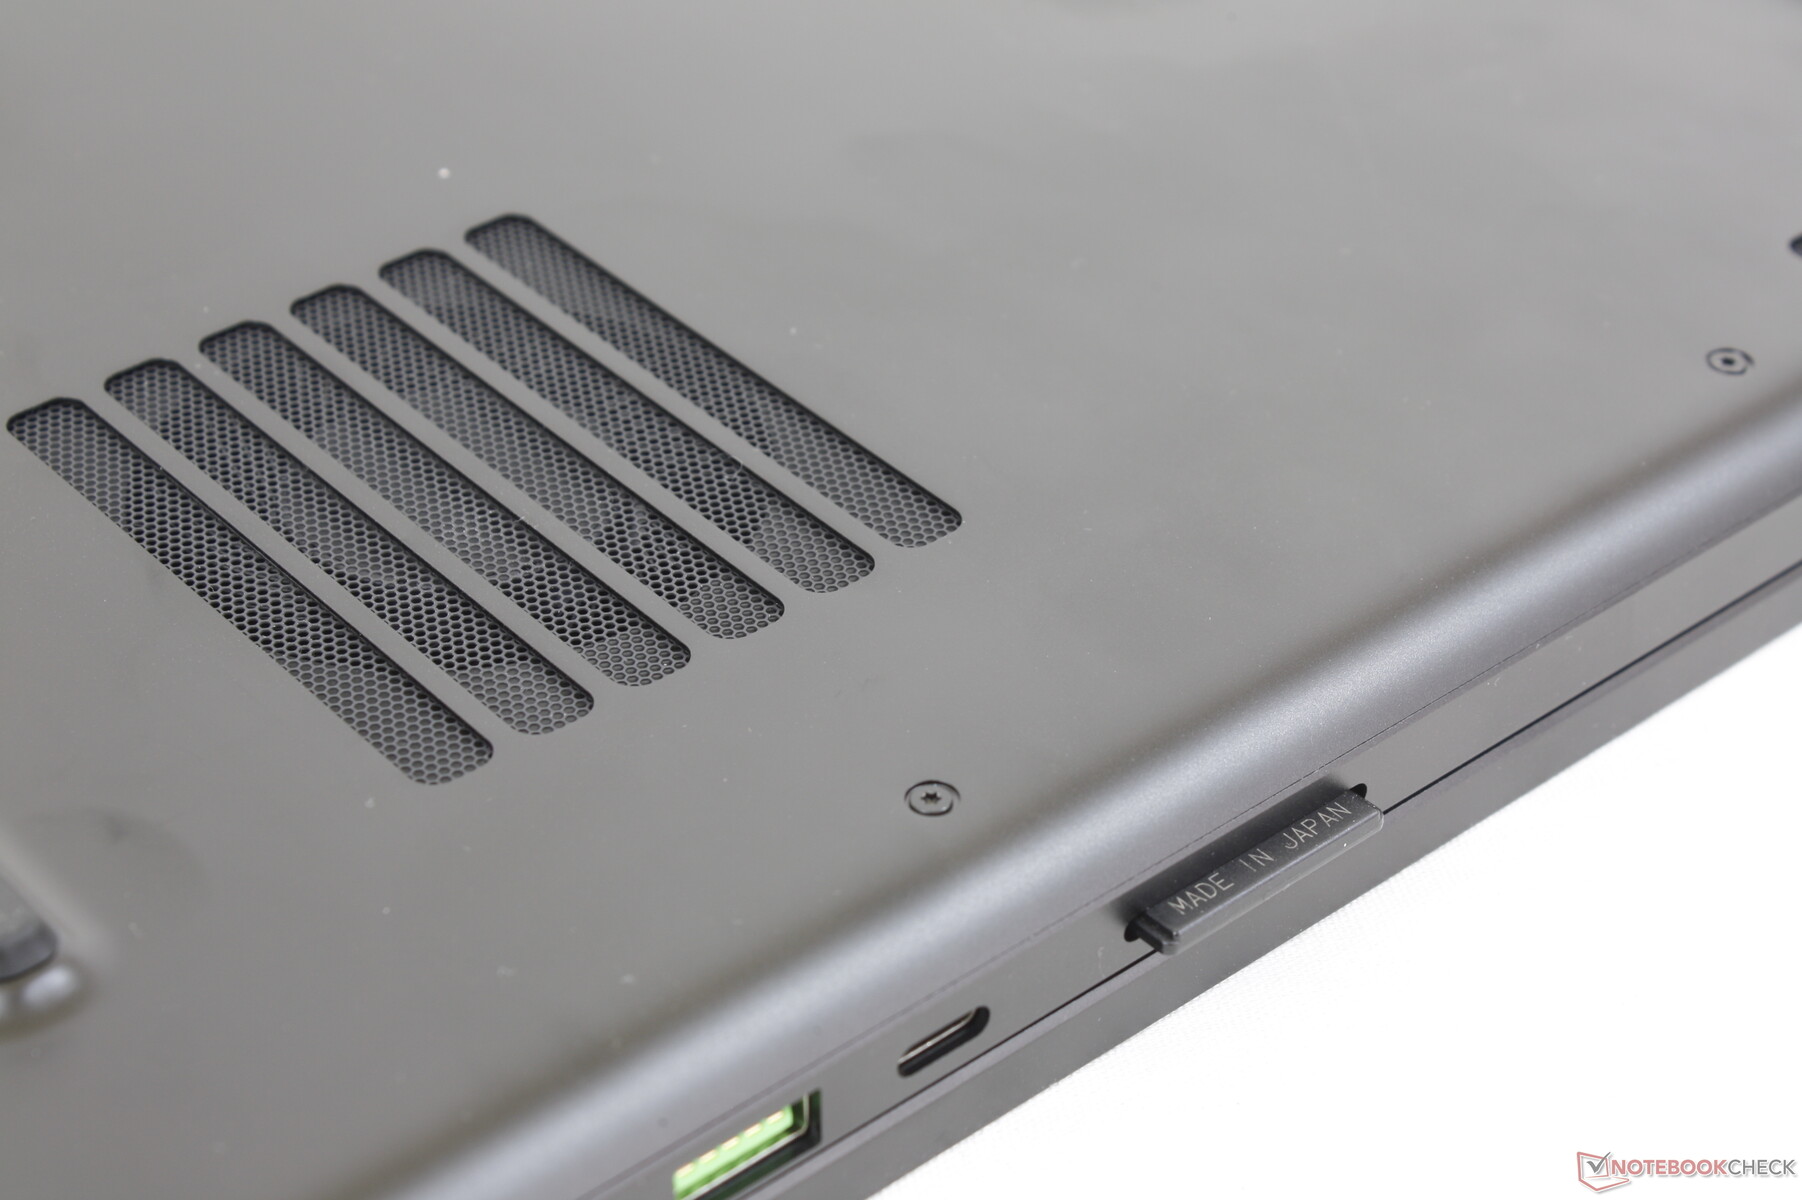
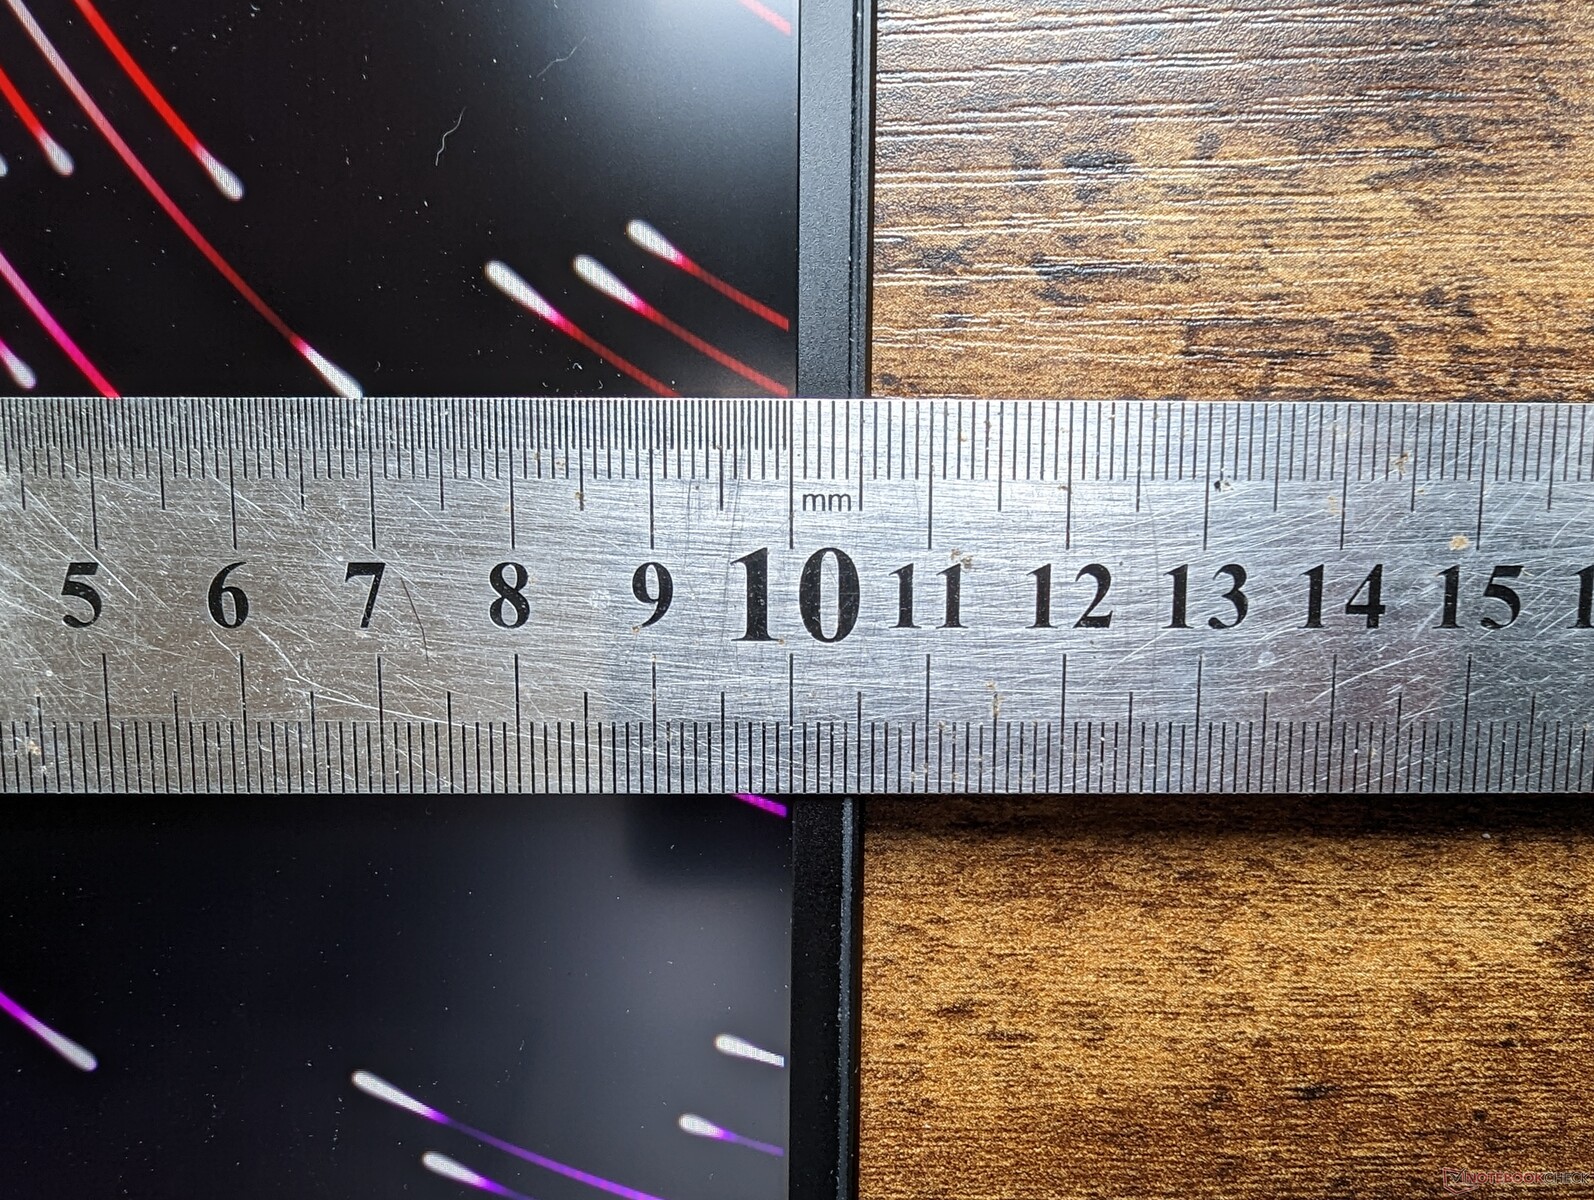
外壳 - 几乎不比刀锋17大
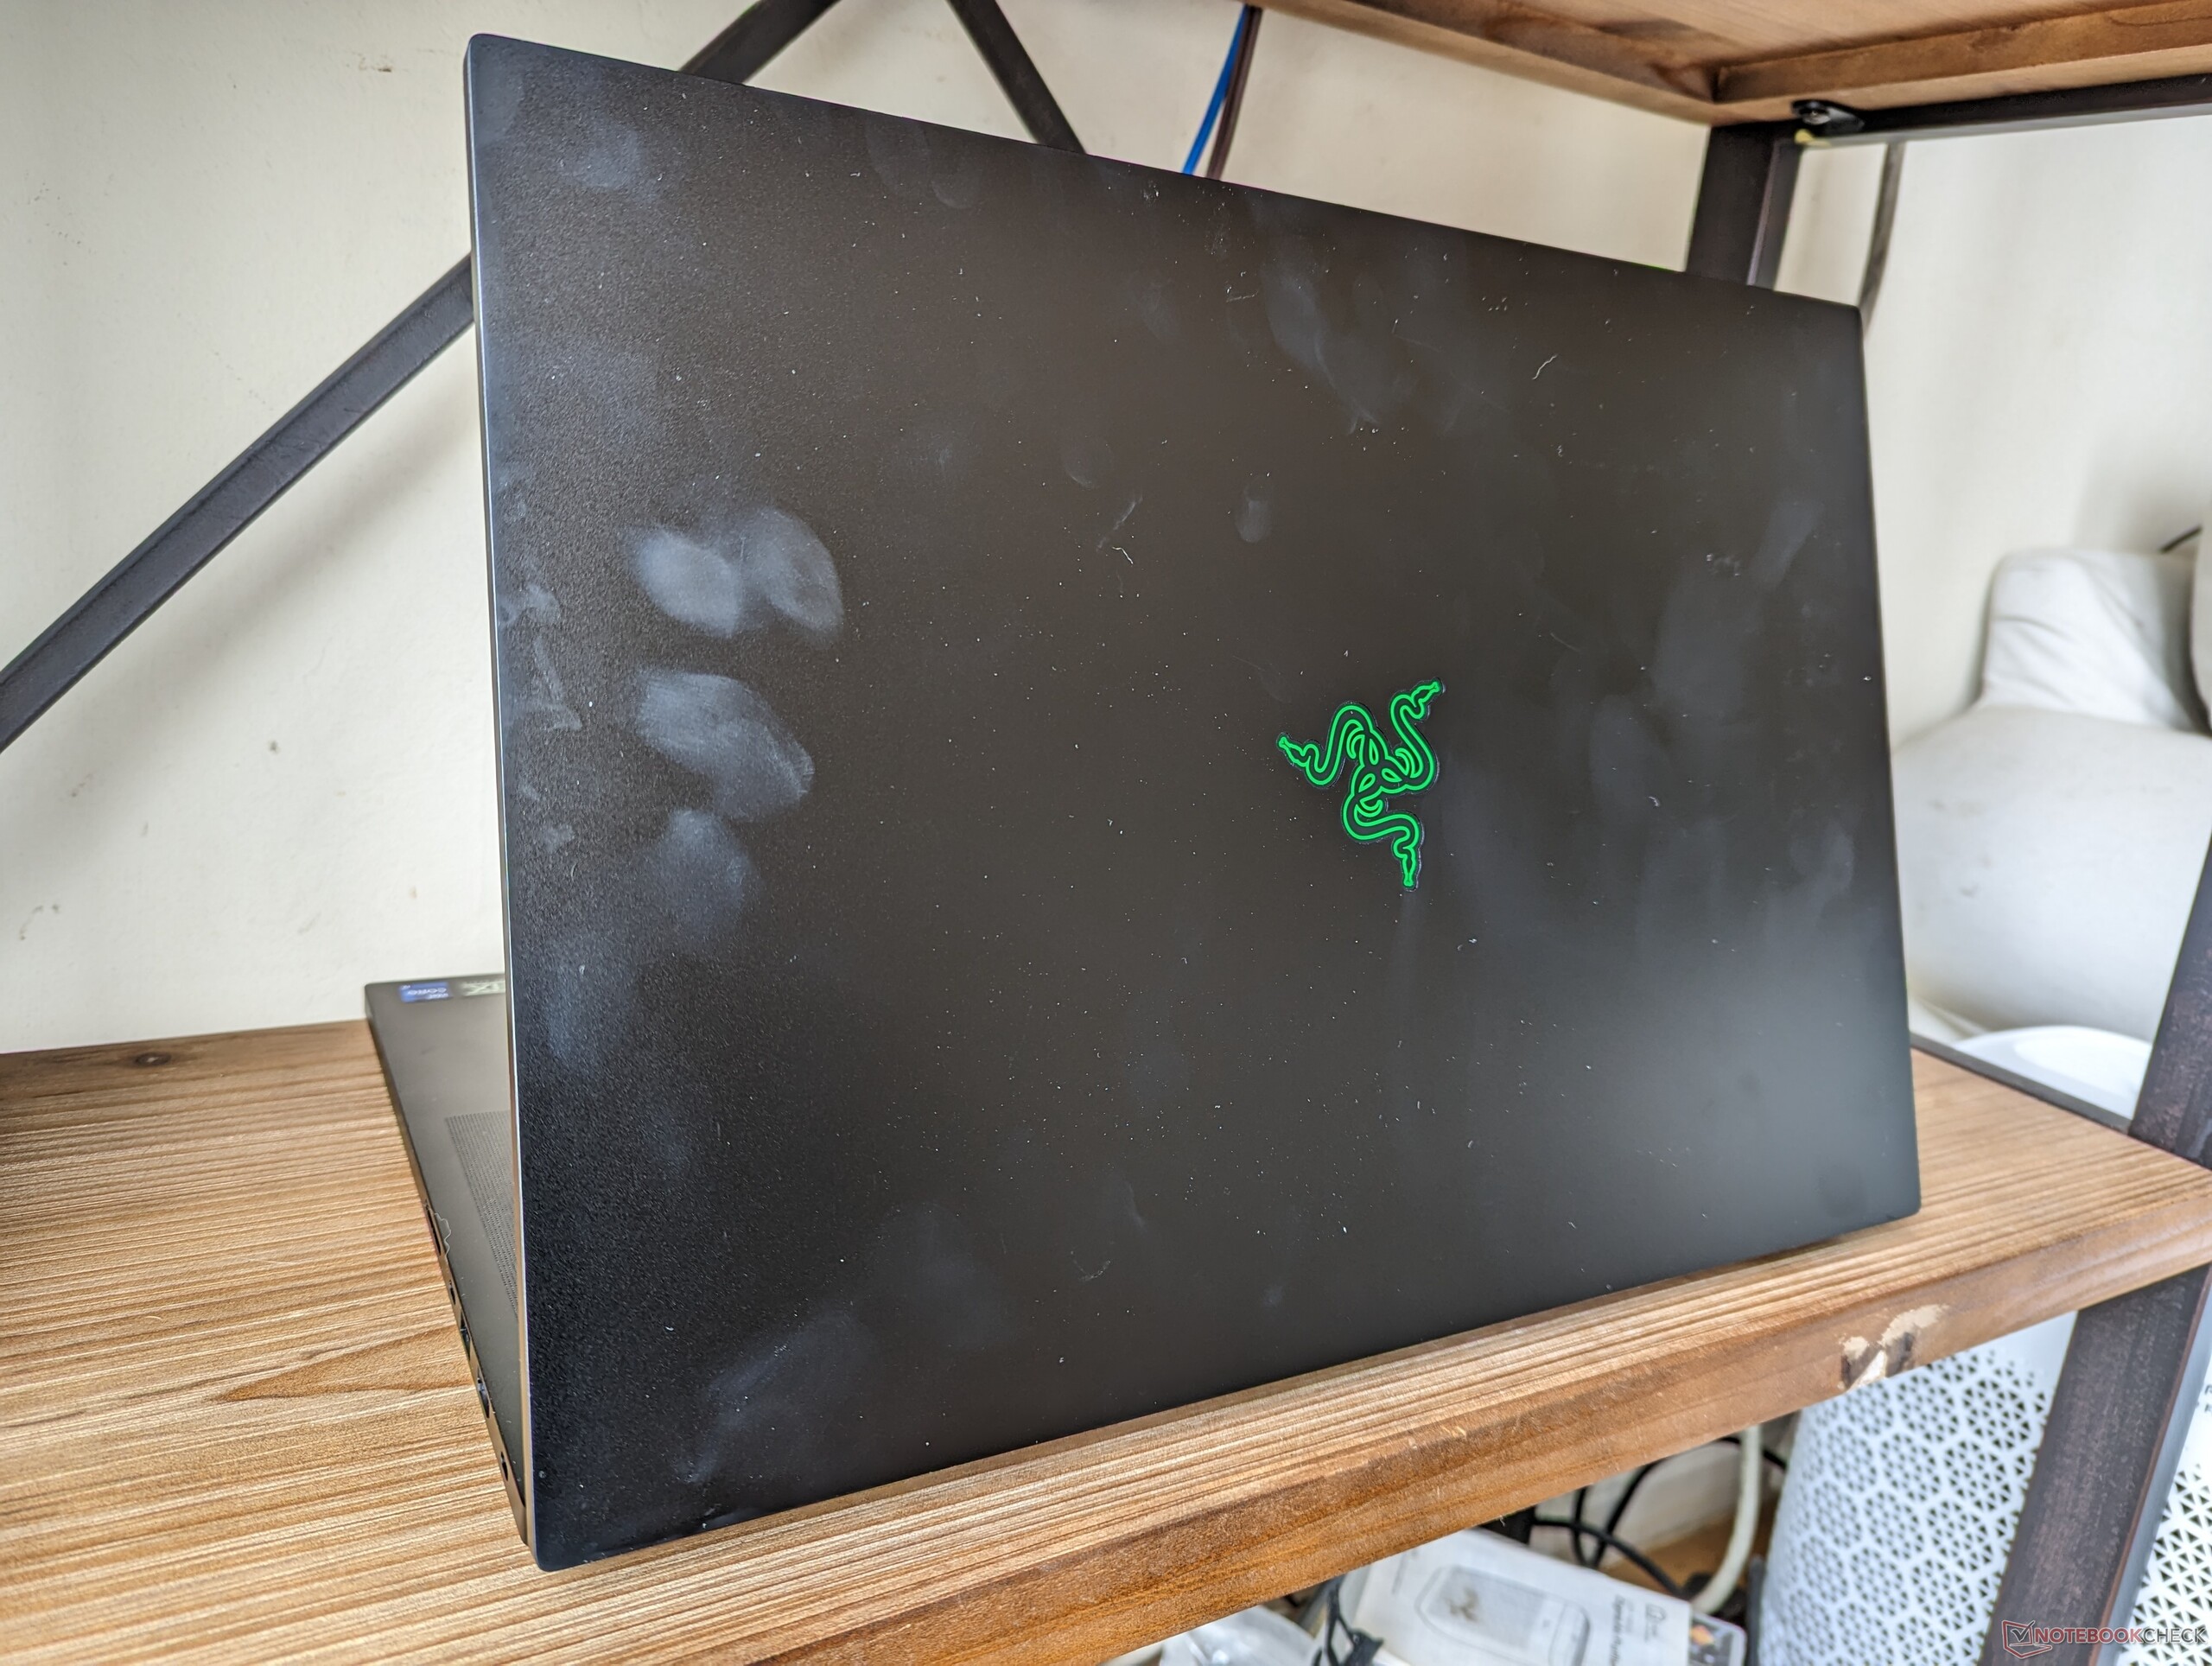
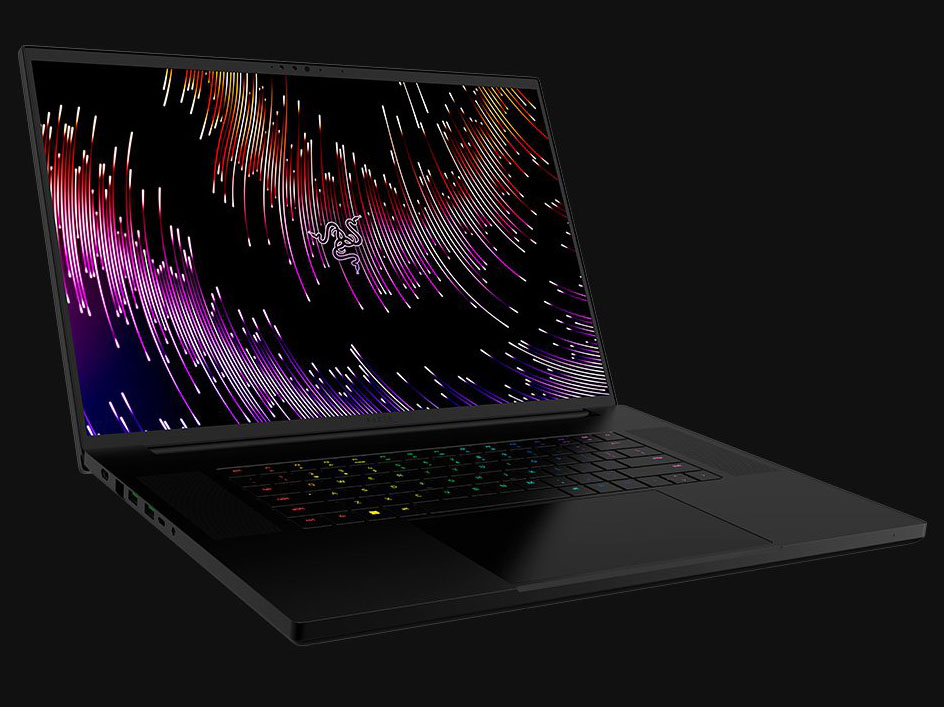
刀锋18可能是一个新的屏幕尺寸,但它在机身设计方面没有新的惊喜。该机型看起来和感觉就像 刀锋17从顶部到底部。最大的视觉差异是,与刀锋17相比,刀锋18的下巴边框小得多,屏幕与身体的比例更高。
值得庆幸的是,更大的18英寸外形尺寸并不影响机箱的刚性。底座和盖子都和Blade 17一样坚固,给人以类似MacBook Pro的强烈印象。特别是铰链,尽管有大屏幕,但其最大角度仍远低于180度。笔记本电脑上最薄弱的地方可能是外盖的最中央,那里的表面更容易因施加压力而变形。
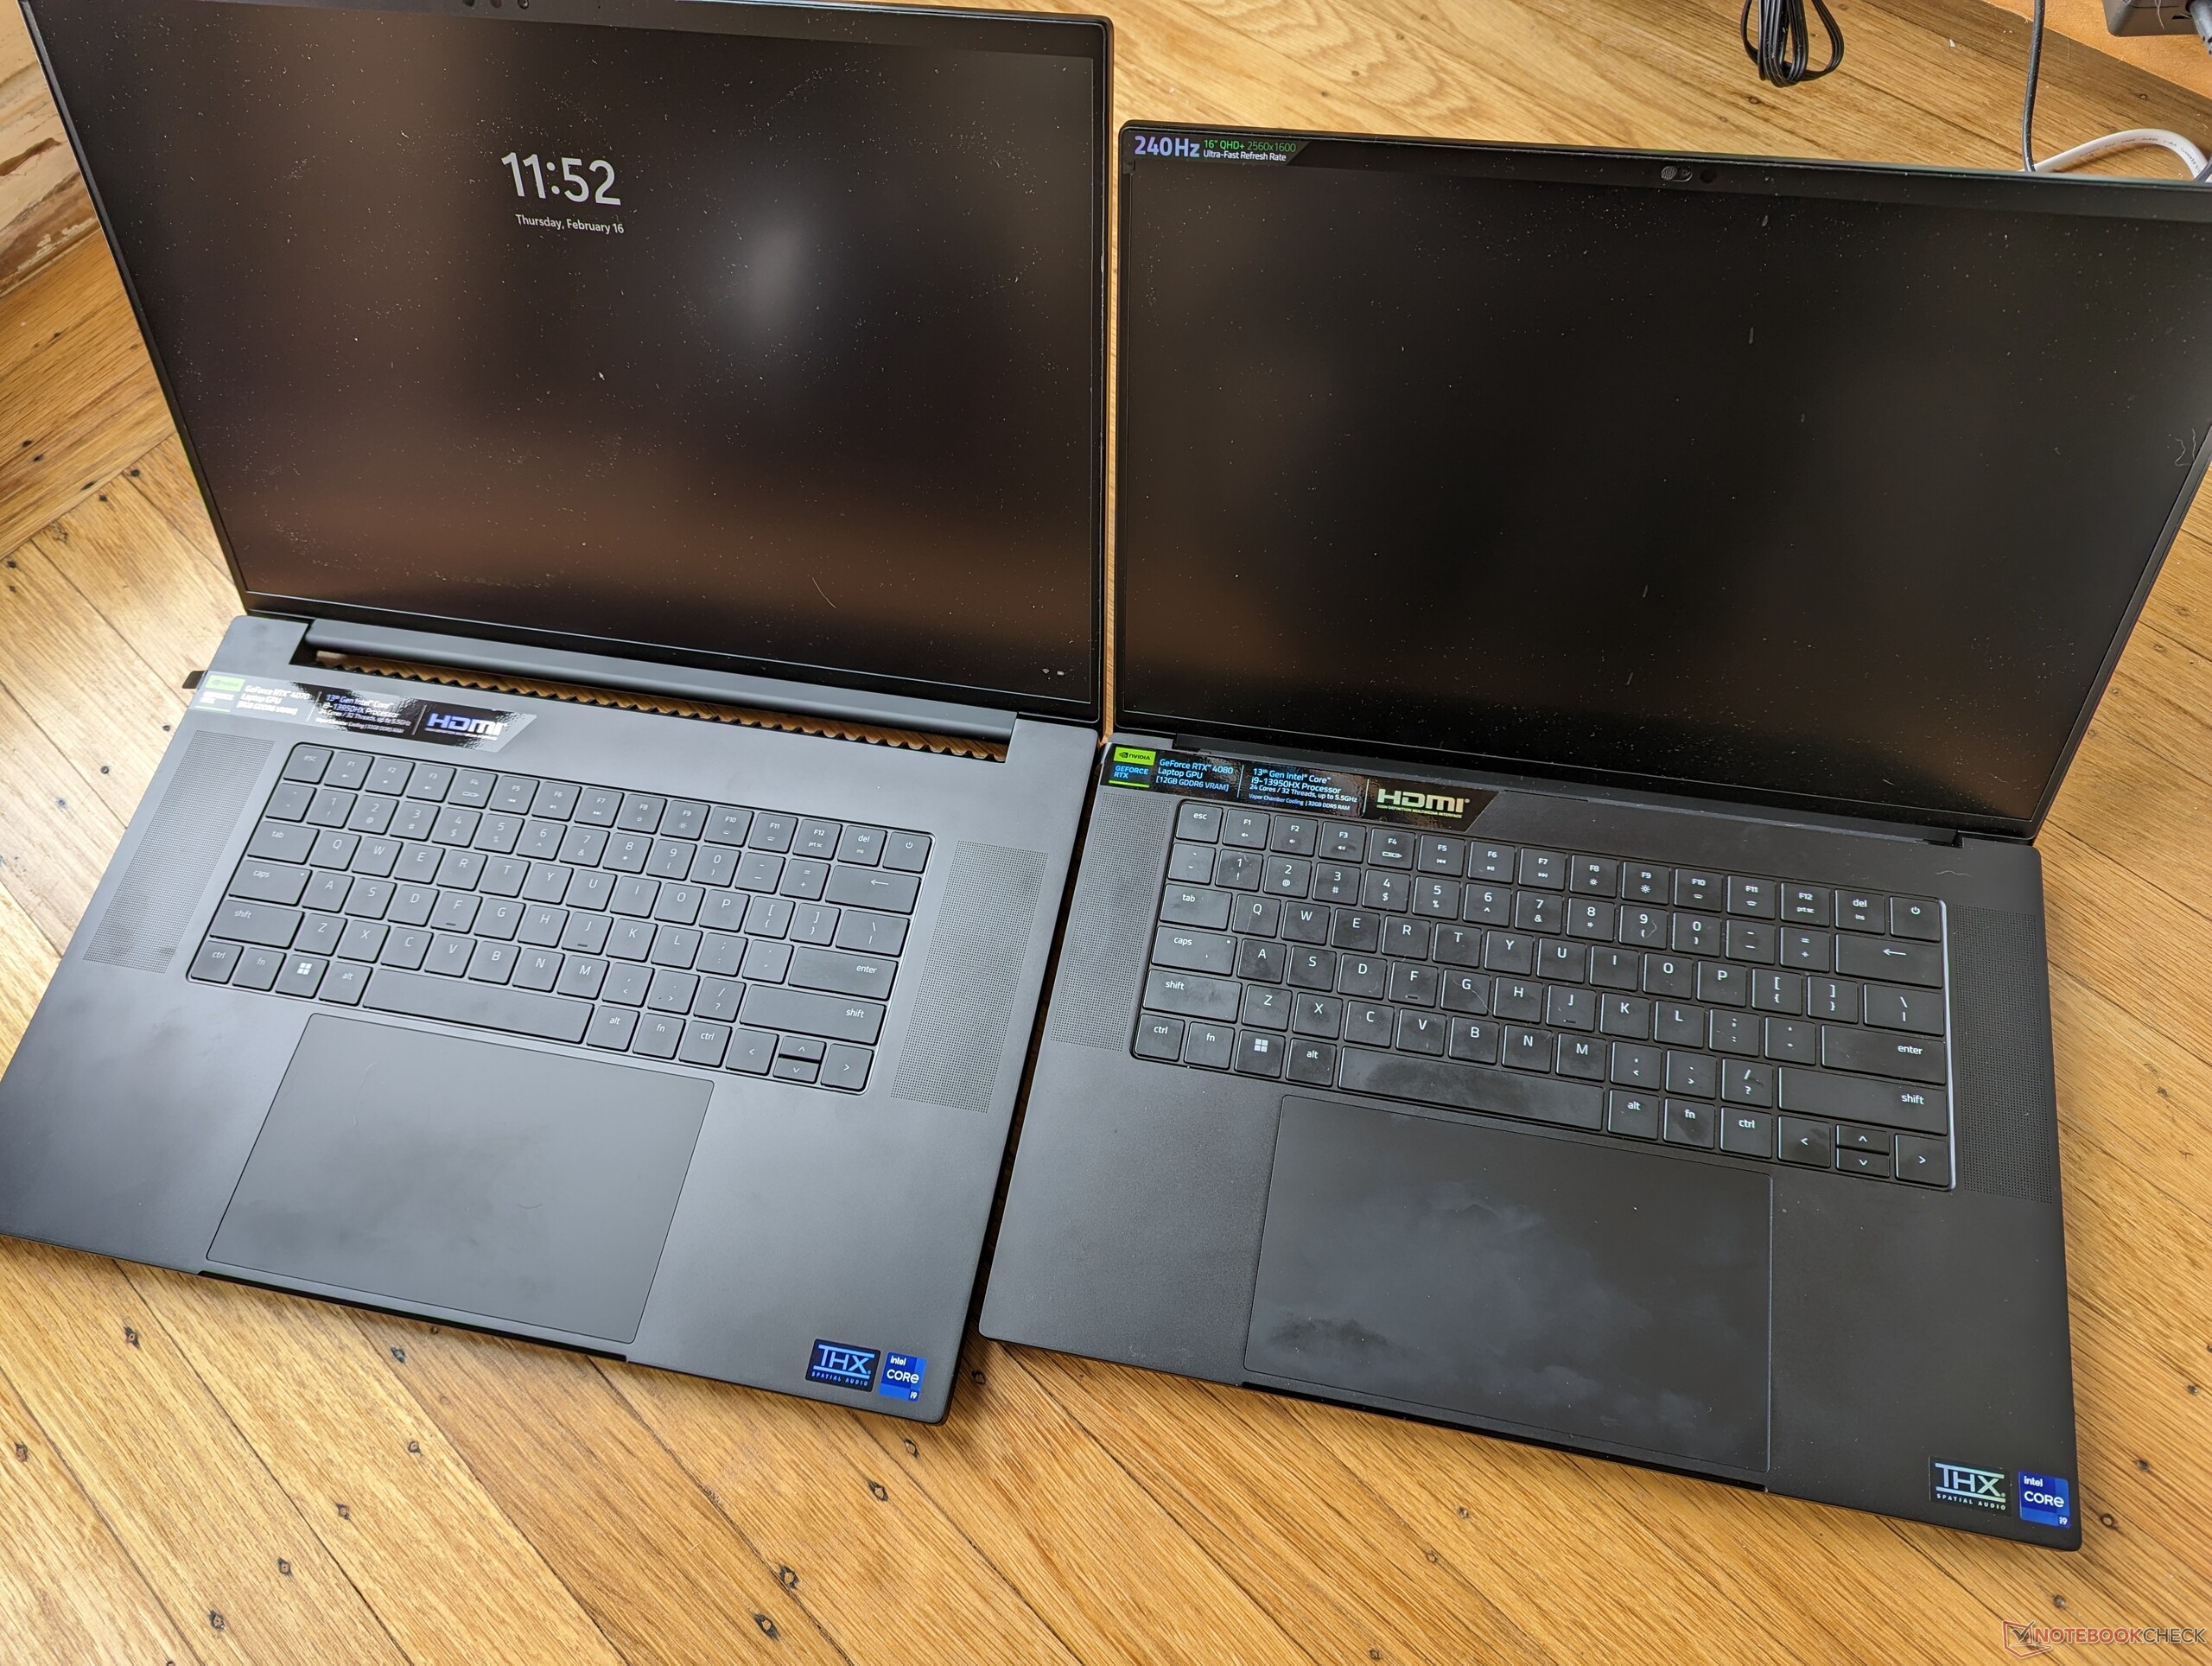
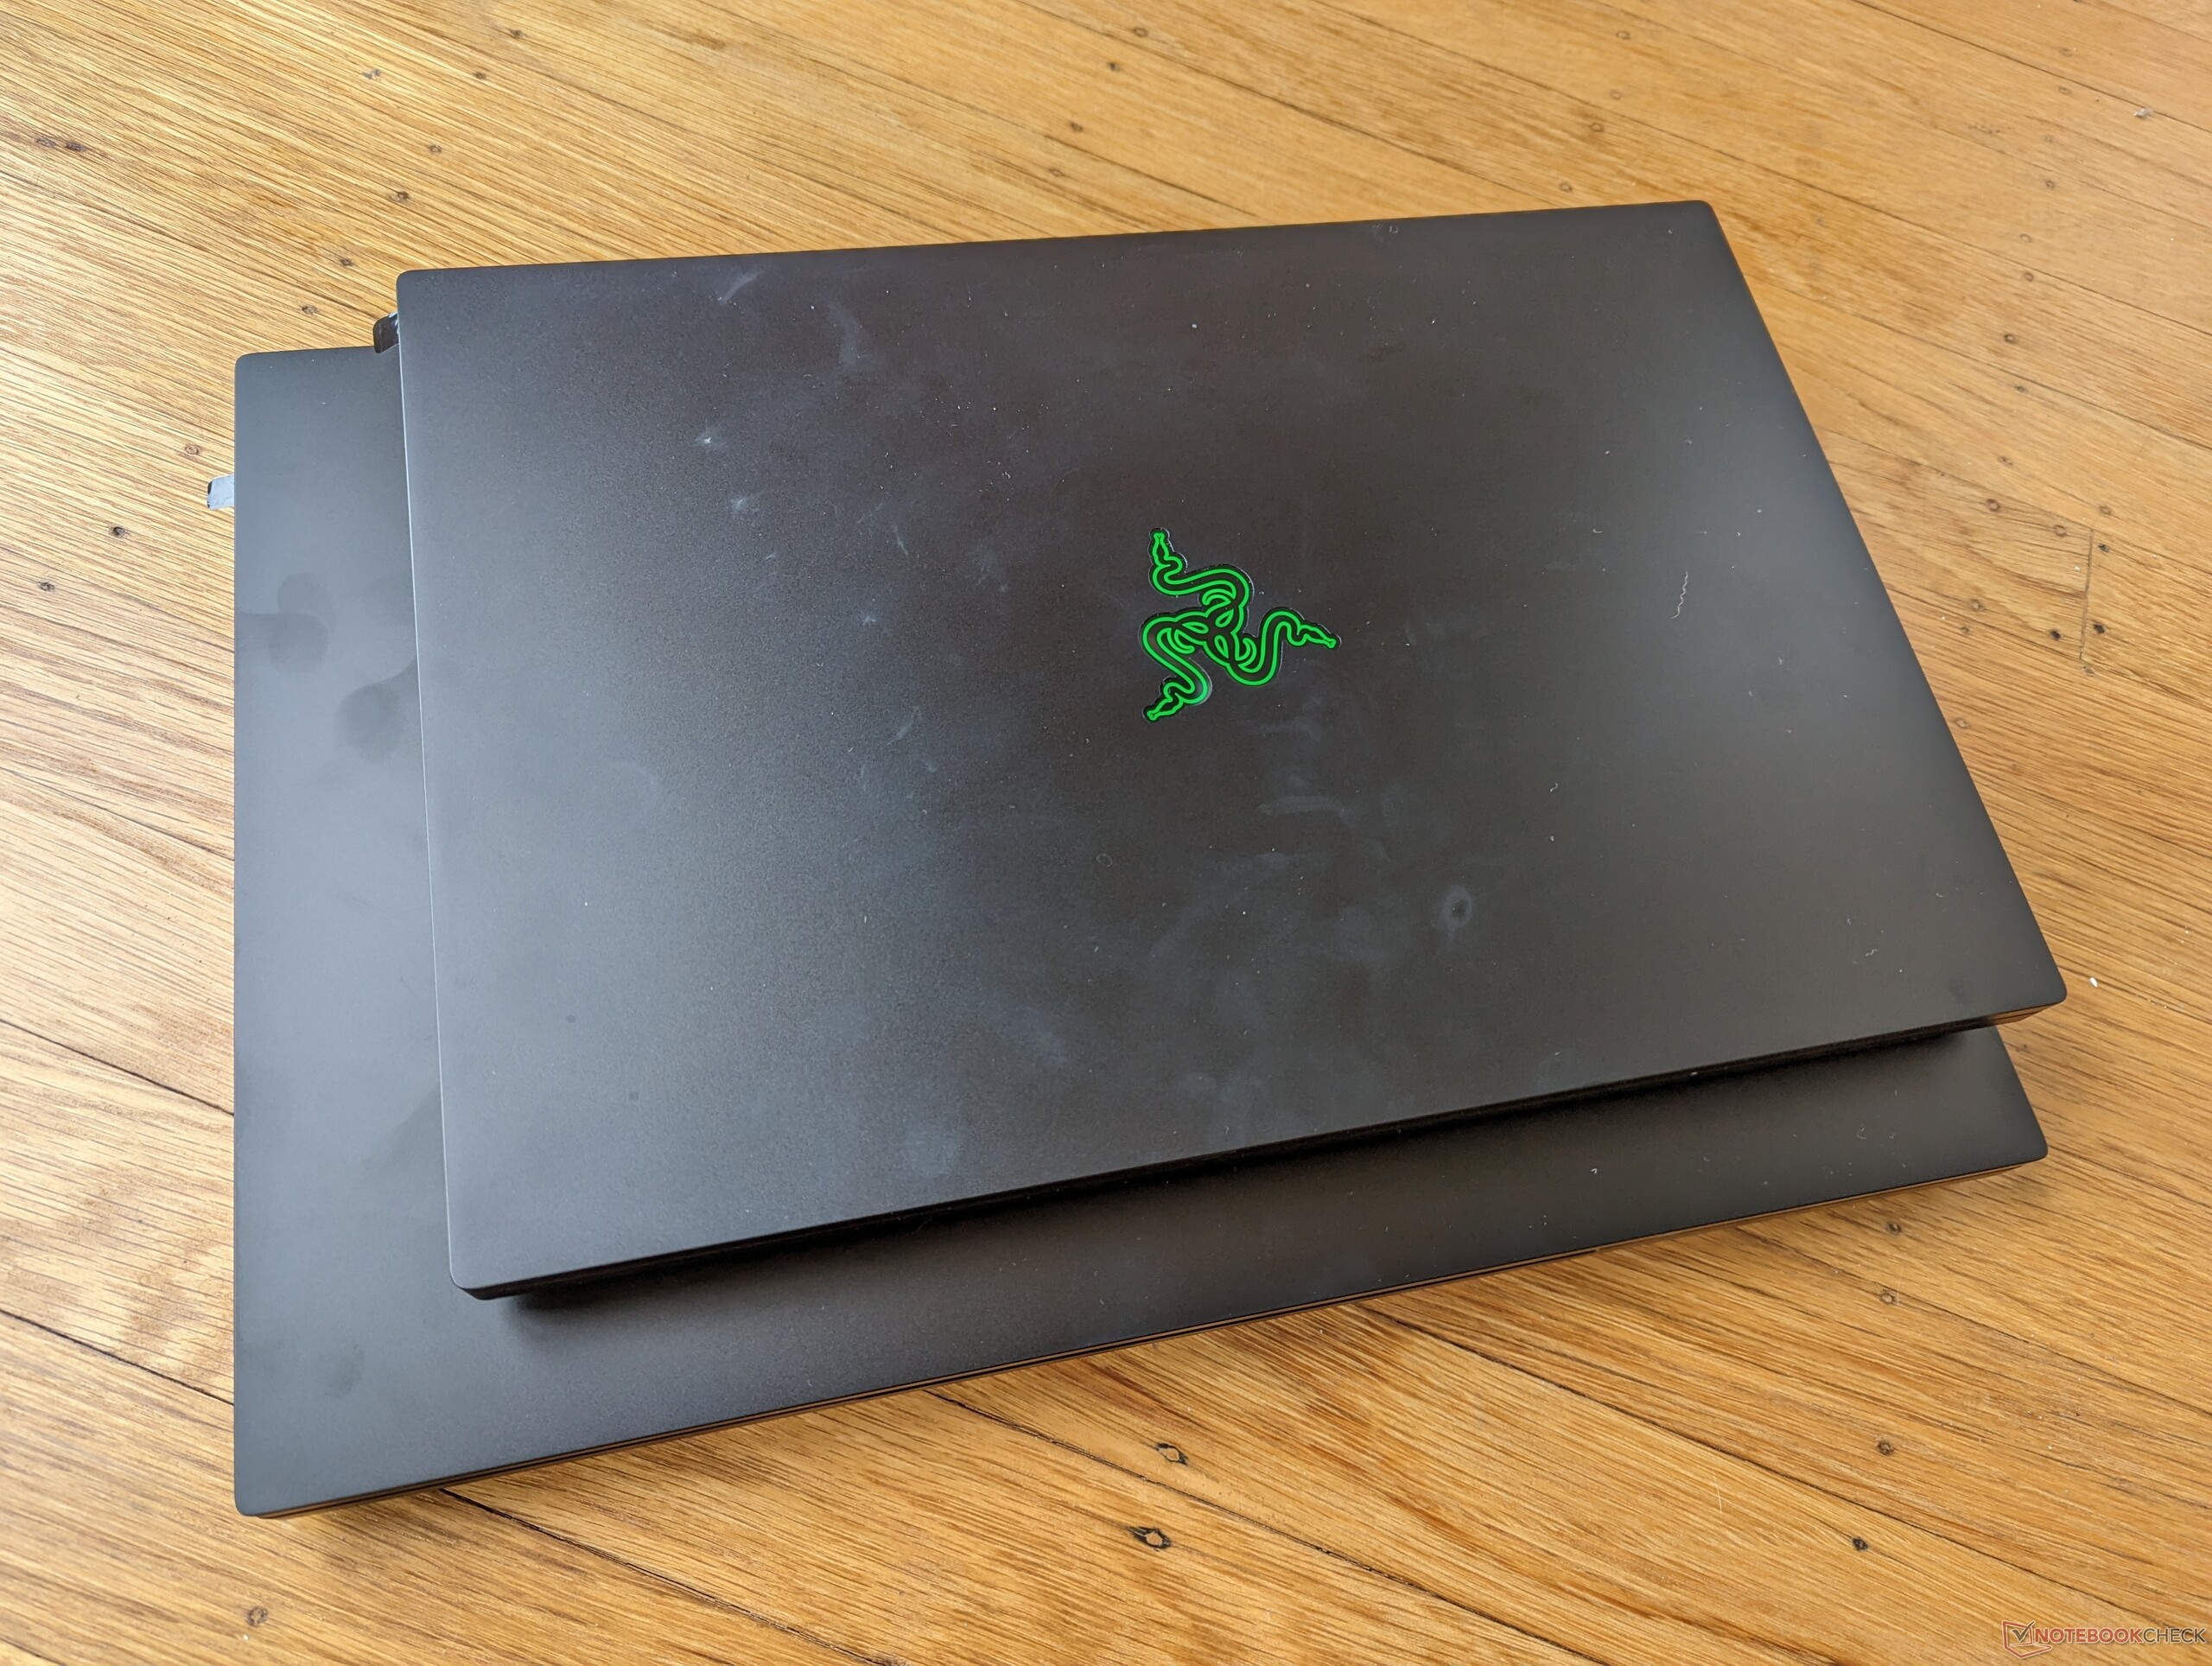
Razer自豪地指出,尽管它们的屏幕尺寸不同,但Blade 18的体积只比2022年的Blade 17大18%,重7%。因此,新的18英寸机型并不像人们最初预期的那样感觉笨重。事实上,一些17.3英寸游戏笔记本比Blade 18更大甚至更重,包括华硕ROG Strix Scar 17 SE或 Alienware m17 R5.
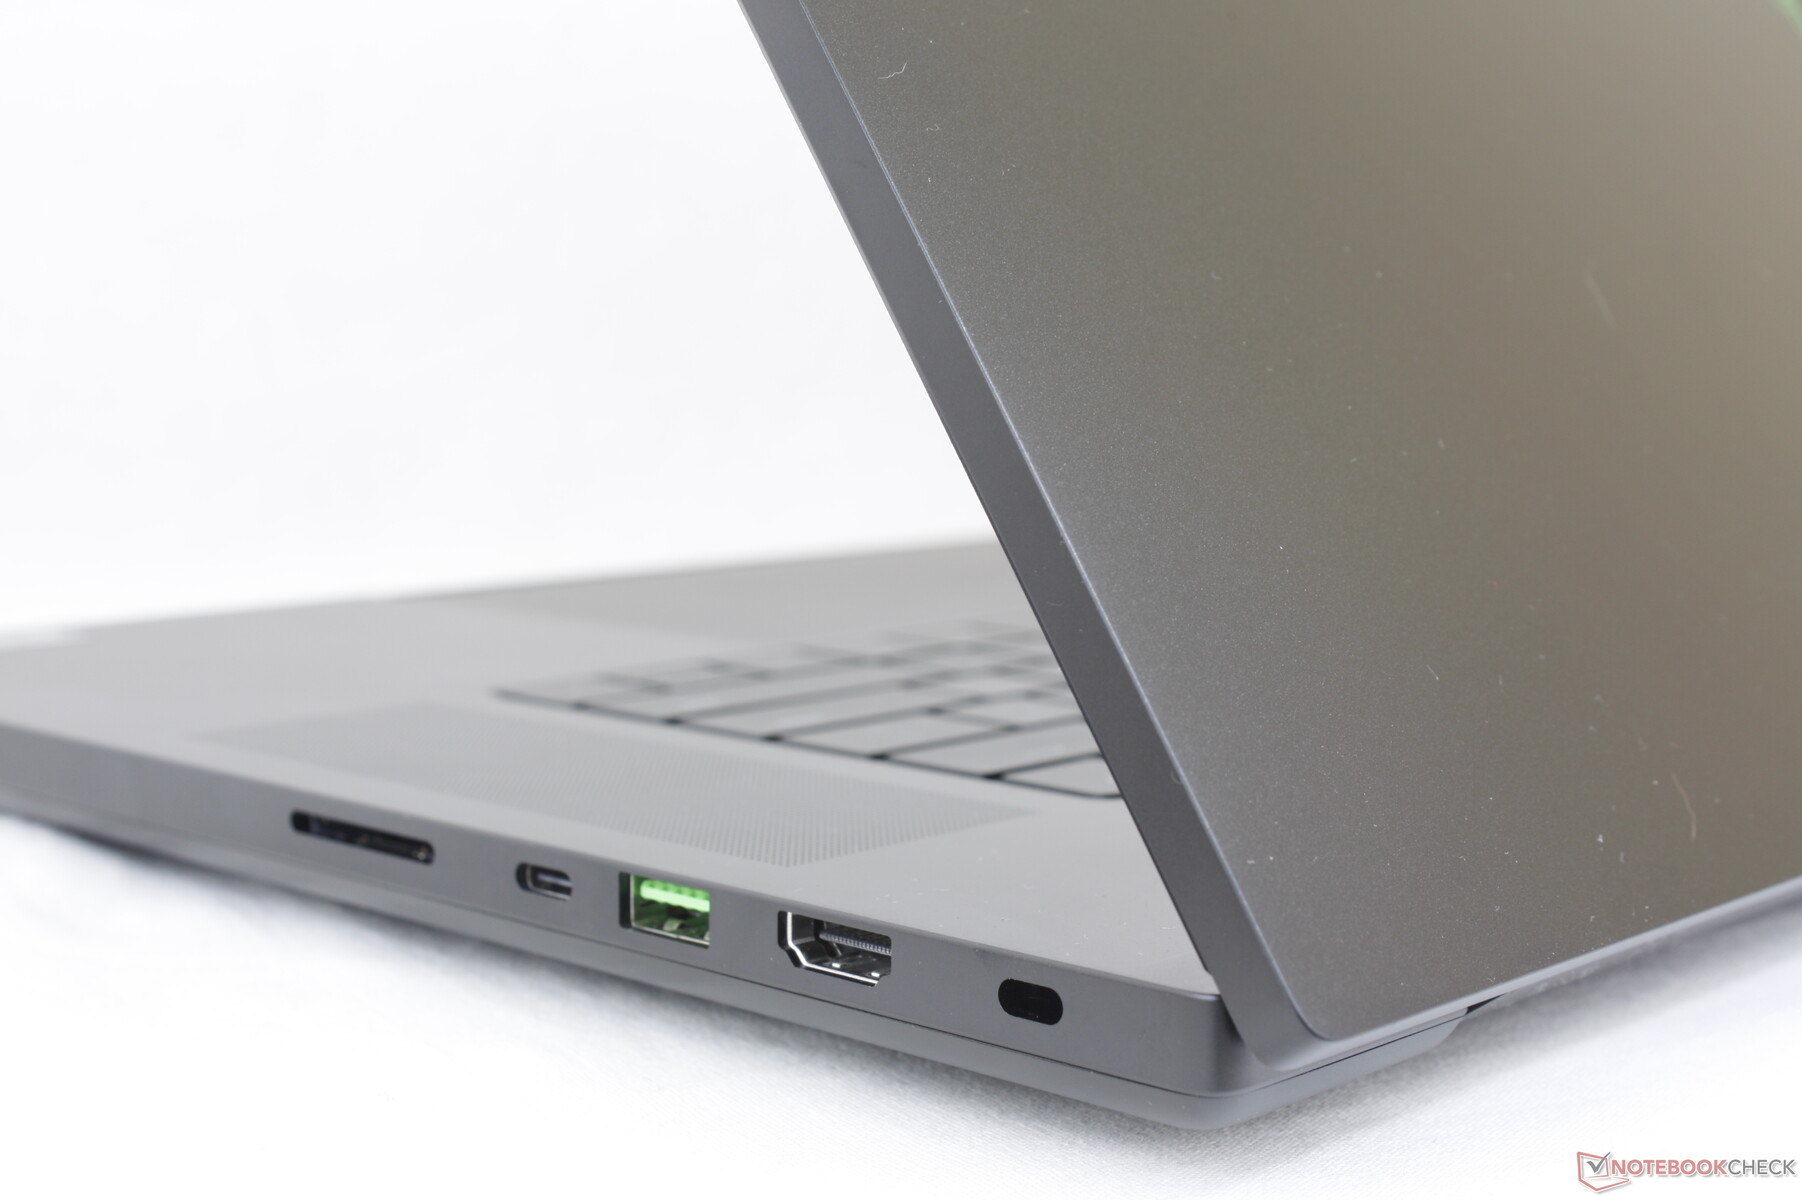
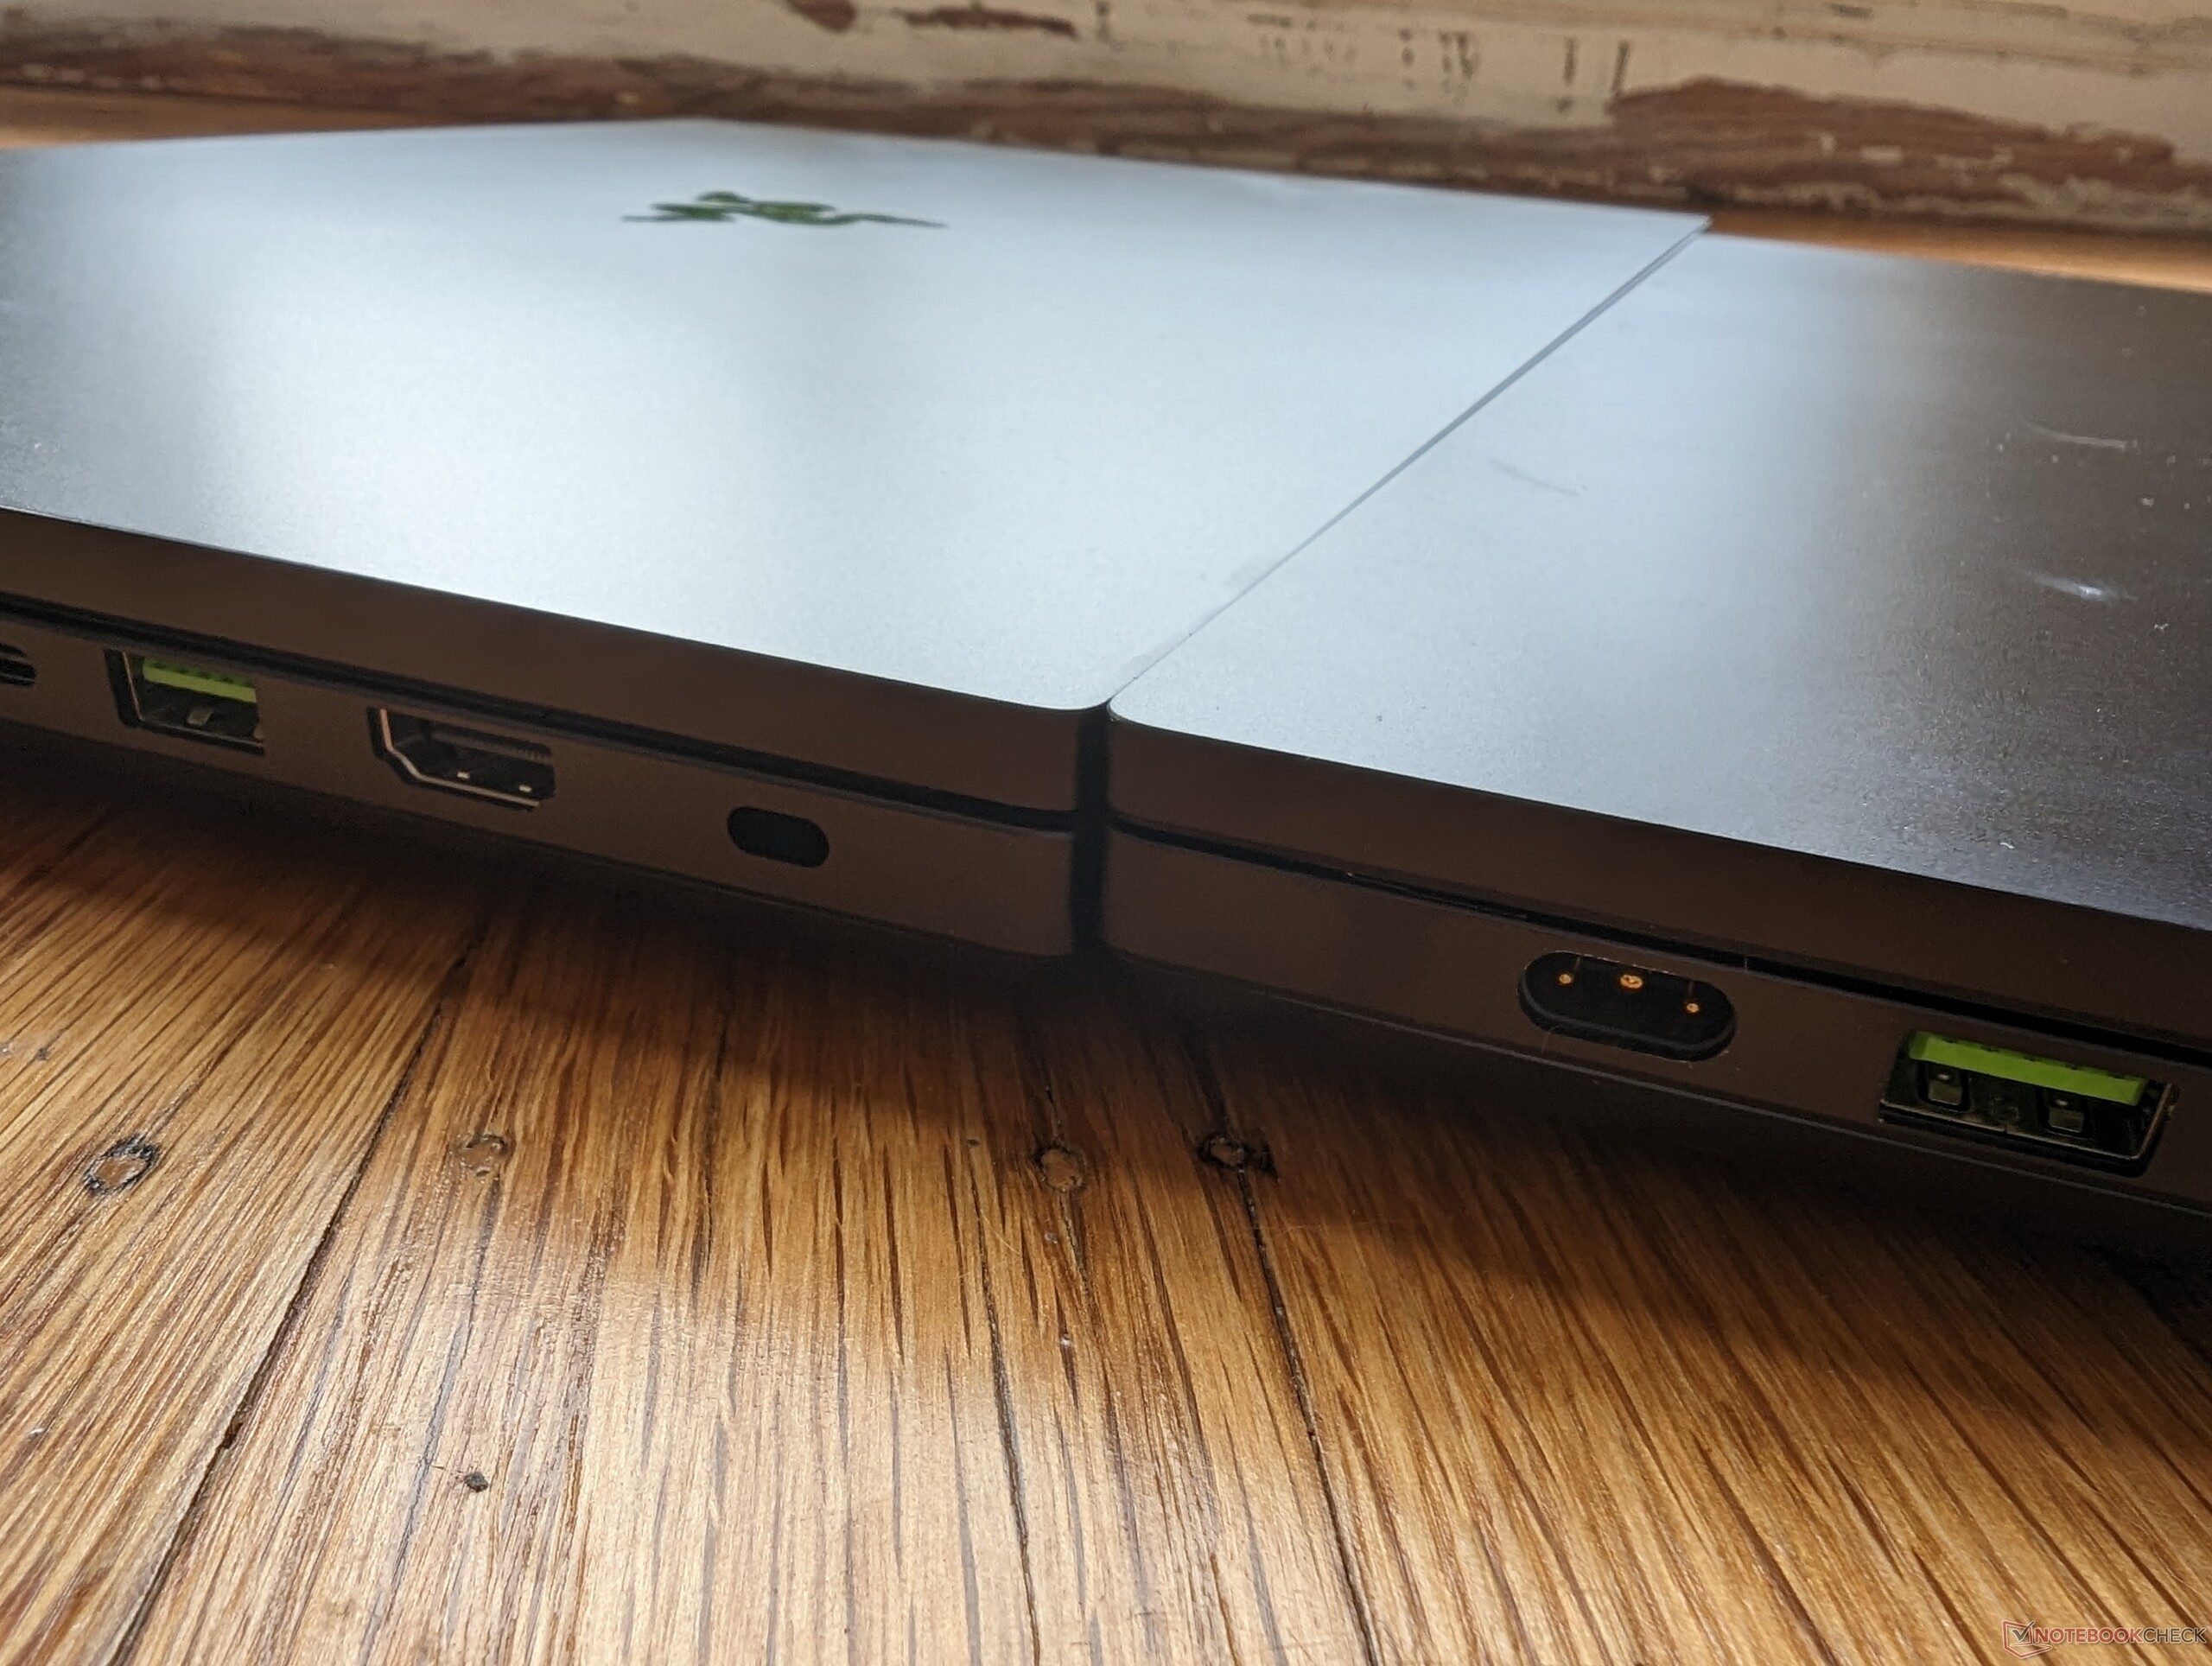
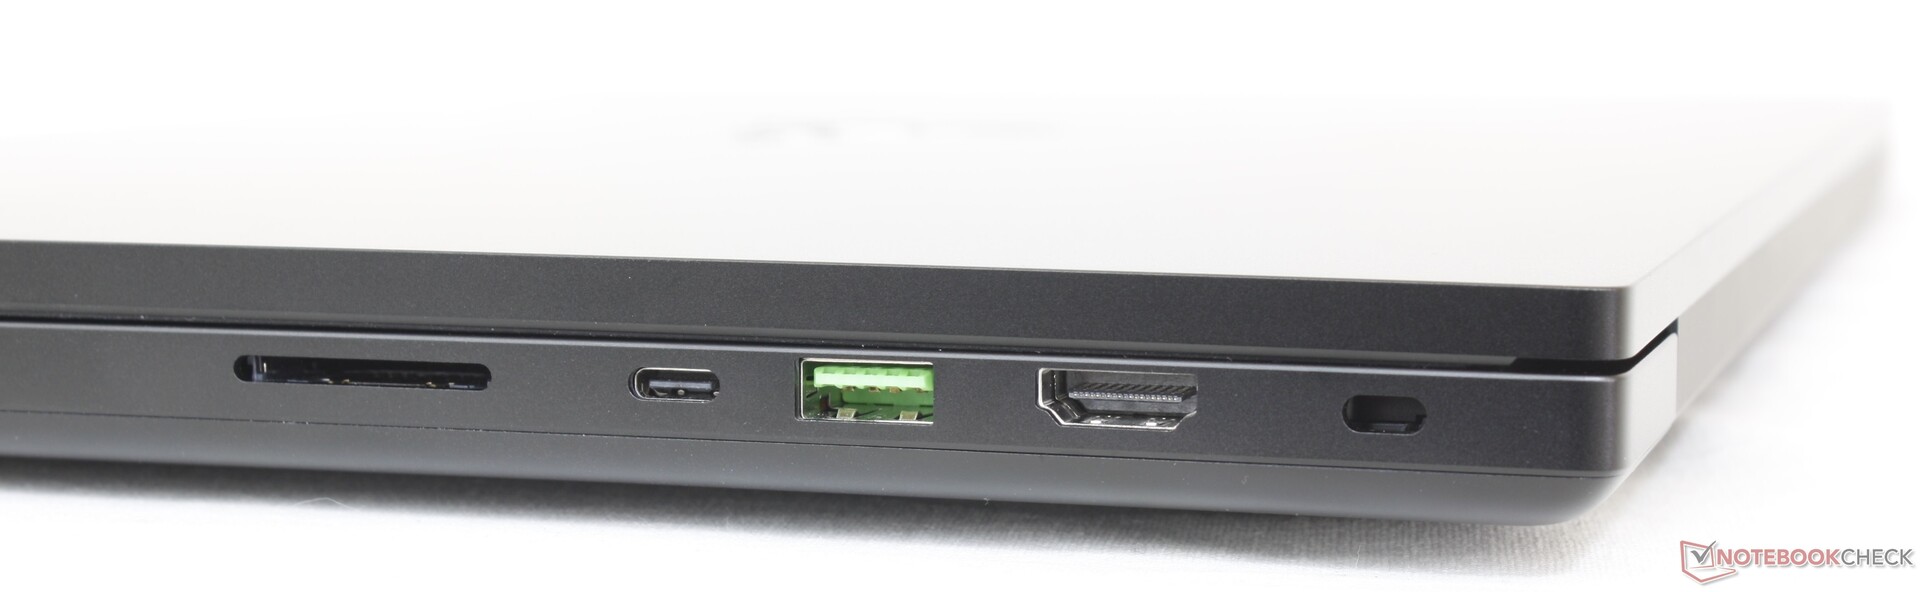
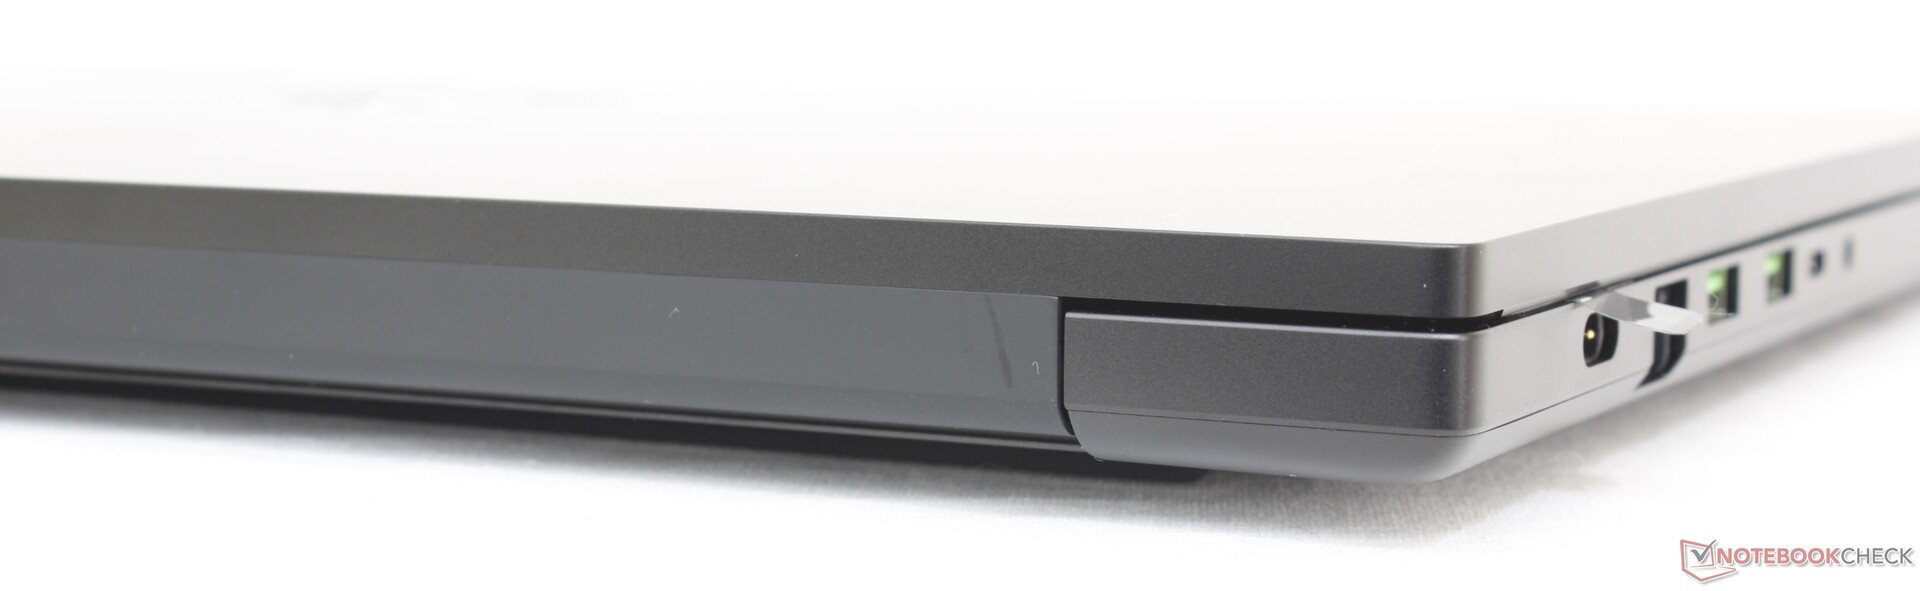
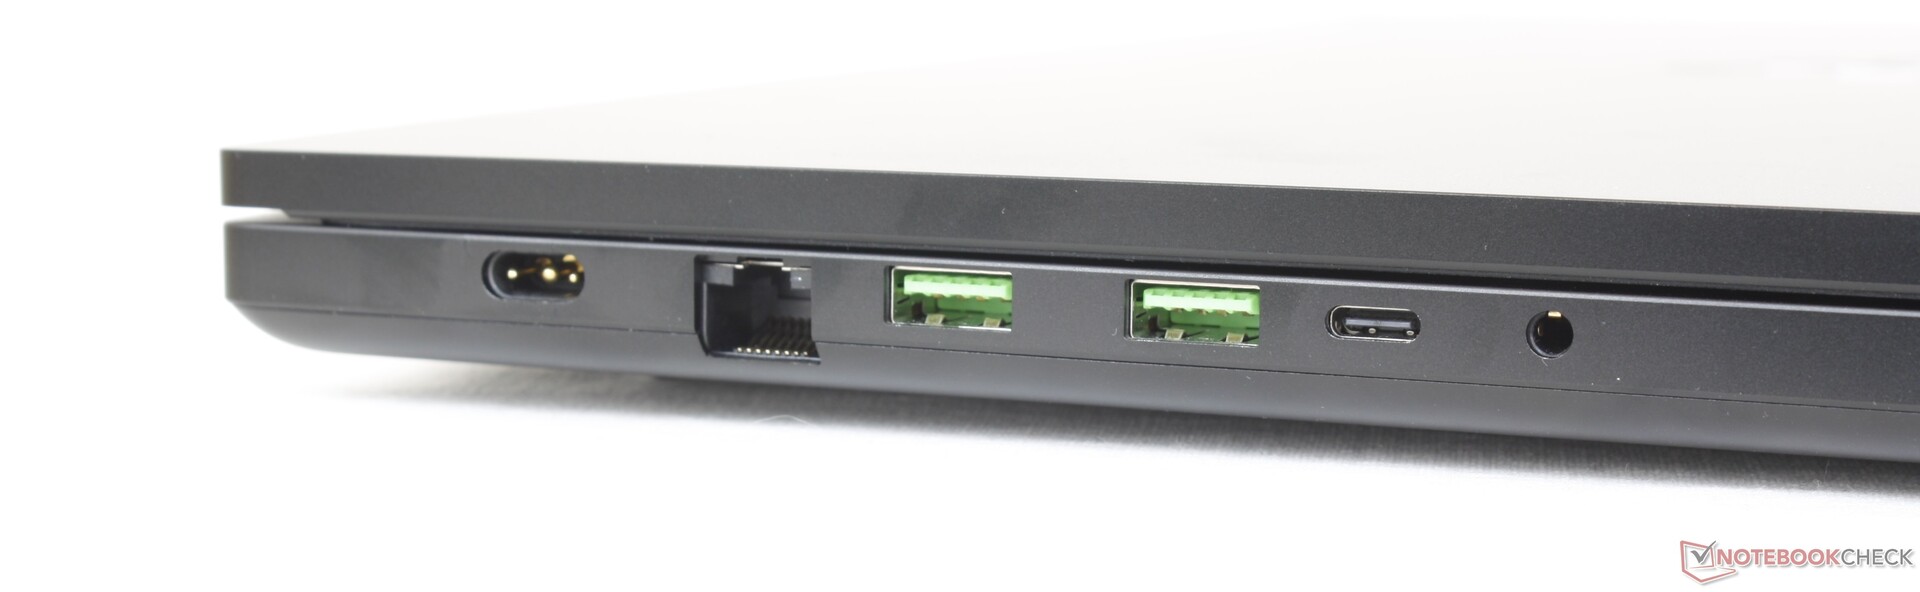
连接性--通常情况下
新机型继承了Blade 17的所有端口,提供了健康的连接选项。即便如此,我们还是希望看到更多的东西,以更好地将Blade 18与它的小兄弟姐妹区分开来。例如,一个HDMI输入端口将为宽敞的18英寸屏幕增加更多的功能。
请记住,两个USB-C端口中只有一个与Thunderbolt设备兼容。
SD卡阅读器
我们能够在短短5秒内将1GB的图片从我们的UHS-II测试卡转移到桌面上,而在微星Titan GT77上则需要13秒。微星泰坦GT77.
| SD Card Reader | |
| average JPG Copy Test (av. of 3 runs) | |
| Razer Blade 18 RTX 4070 (Angelibird AV Pro V60) | |
| Razer Blade 17 Early 2022 (AV PRO microSD 128 GB V60) | |
| Razer Blade 16 Early 2023 (AV PRO microSD 128 GB V60) | |
| MSI Titan GT77 HX 13VI (Angelibird AV Pro V60) | |
| maximum AS SSD Seq Read Test (1GB) | |
| Razer Blade 18 RTX 4070 (Angelibird AV Pro V60) | |
| Razer Blade 16 Early 2023 (AV PRO microSD 128 GB V60) | |
| Gigabyte G7 KE (AV PRO microSD 128 GB V60) | |
| MSI Titan GT77 HX 13VI (Angelibird AV Pro V60) | |
沟通
英特尔AX211是Wi-Fi 6E和蓝牙5.3连接的标准配置,而相比之下,Blade 17搭载的是Killer AX1690i。Killer AX1690i是英特尔AX211的游戏专用衍生产品,因此用户不应该看到两者之间有任何明显的性能差异。
| Networking | |
| iperf3 transmit AXE11000 6GHz | |
| Asus ROG Strix Scar 17 SE G733CX-LL014W | |
| Razer Blade 18 RTX 4070 | |
| iperf3 receive AXE11000 6GHz | |
| Asus ROG Strix Scar 17 SE G733CX-LL014W | |
| Razer Blade 18 RTX 4070 | |
| iperf3 receive AXE11000 | |
| Razer Blade 17 Early 2022 | |
| Gigabyte G7 KE | |
| MSI Titan GT77 HX 13VI | |
| Razer Blade 18 RTX 4070 | |
| Alienware m17 R5 (R9 6900HX, RX 6850M XT) | |
| iperf3 transmit AXE11000 | |
| Gigabyte G7 KE | |
| MSI Titan GT77 HX 13VI | |
| Razer Blade 18 RTX 4070 | |
| Alienware m17 R5 (R9 6900HX, RX 6850M XT) | |
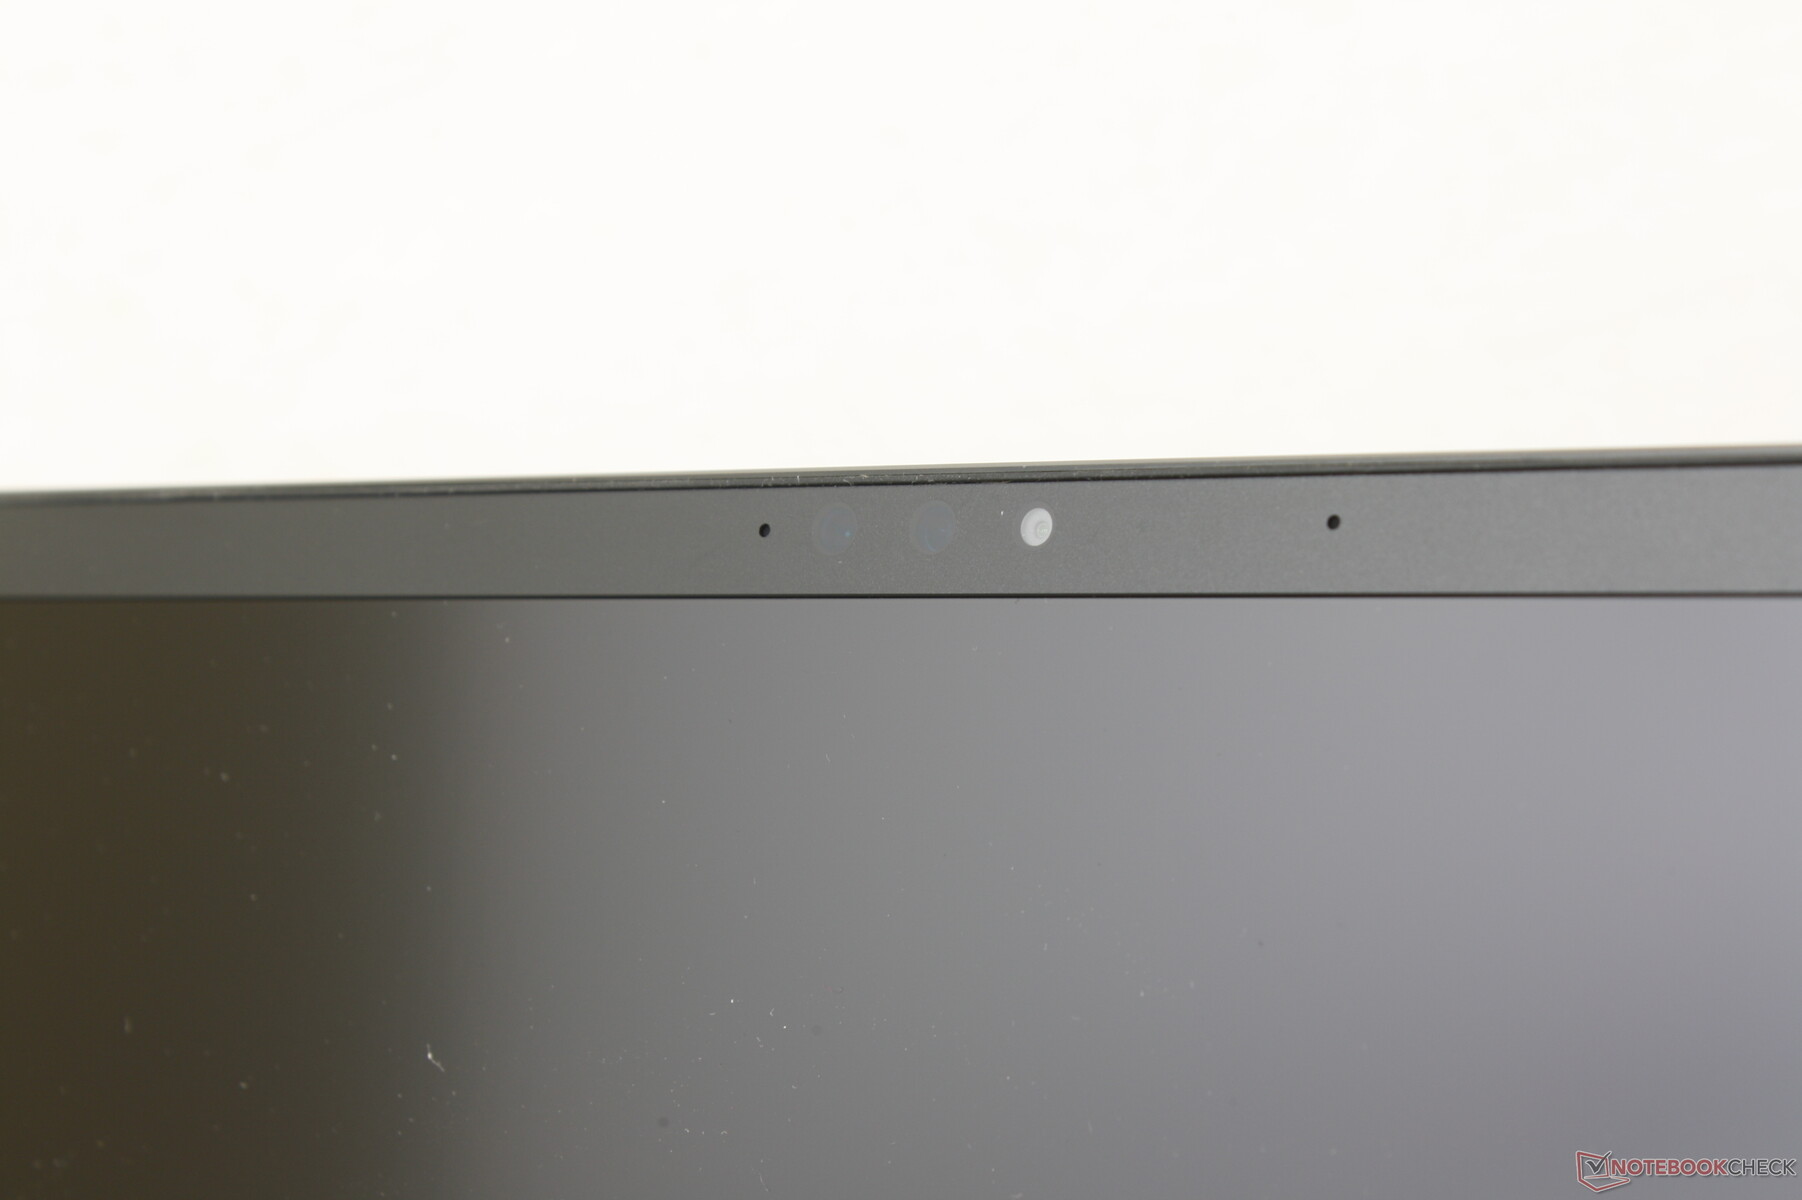
网络摄像头 - 现在有5MP
Razer已经将网络摄像头从Blade 17的200万像素升级到Blade 18的500万像素。我们完全期待制造商在不久的将来开始用同样的500万像素传感器更新其较小的刀片型号。使用500万像素传感器的图像更清晰,而颜色没有什么变化。红外线是支持Windows Hello的标准配置。
奇怪的是,没有物理网络摄像头隐私快门,尽管 刀片16纳入了一个。甚至没有一个数字杀毒开关或热键。


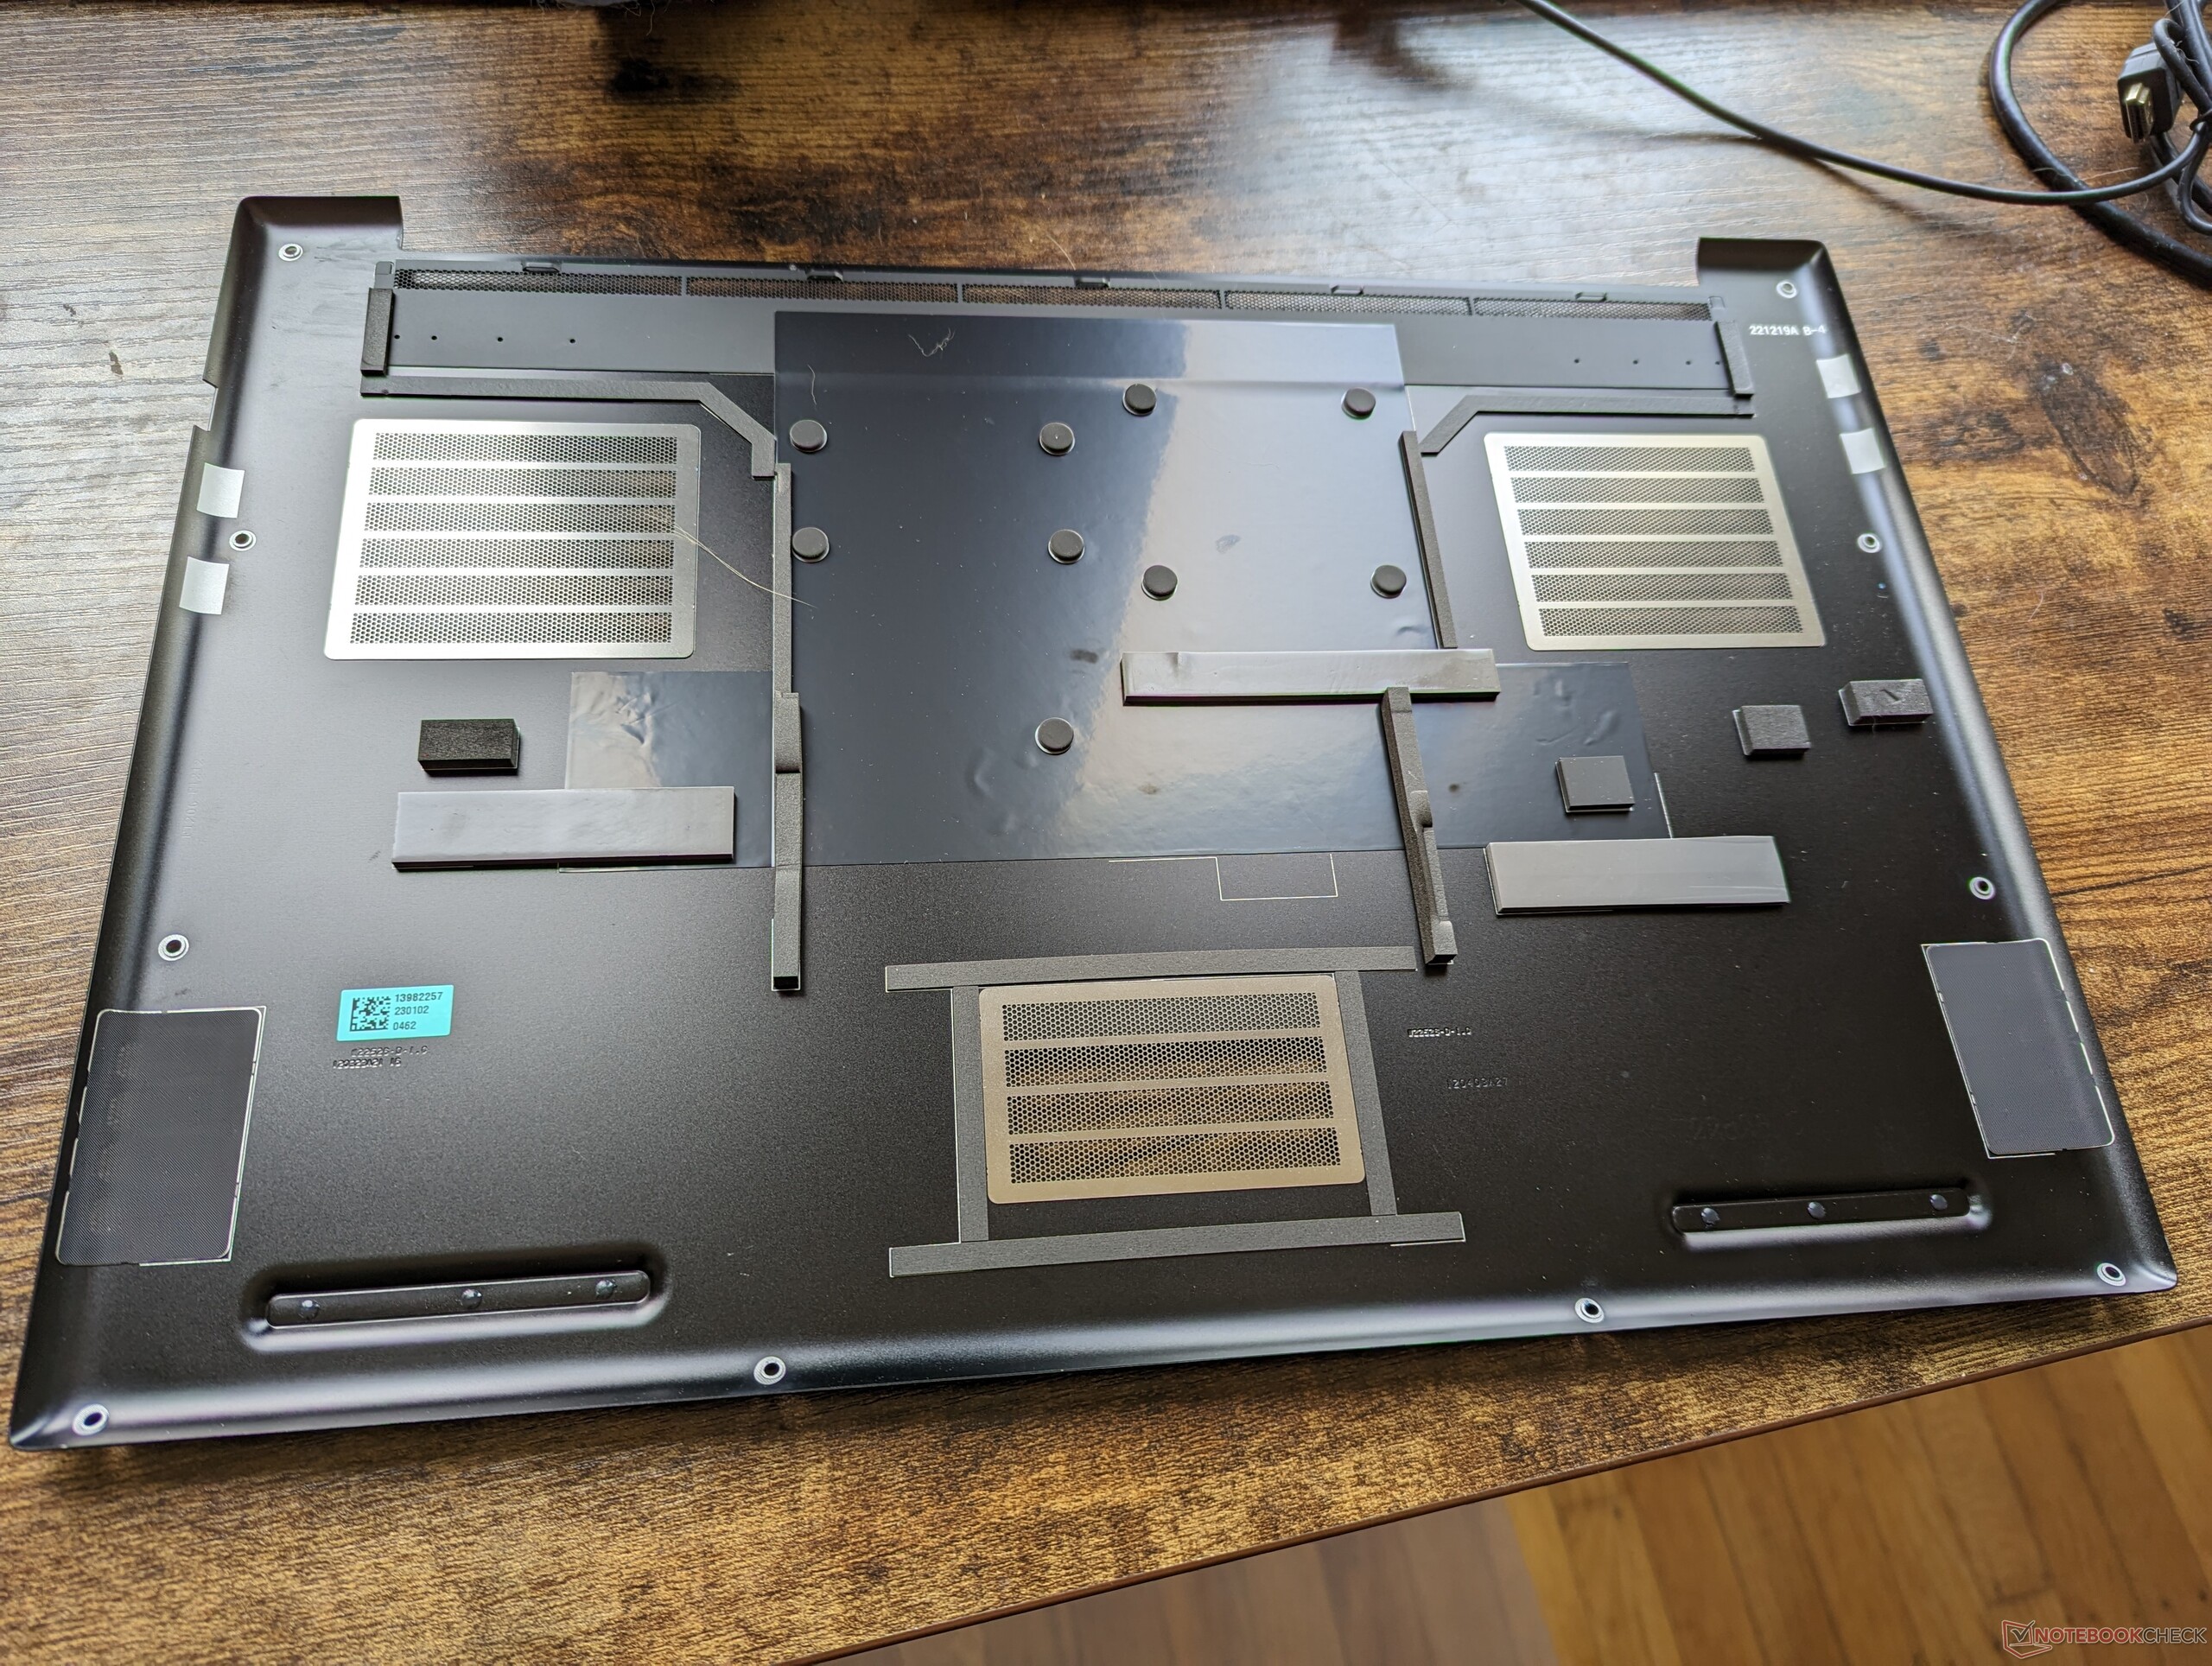
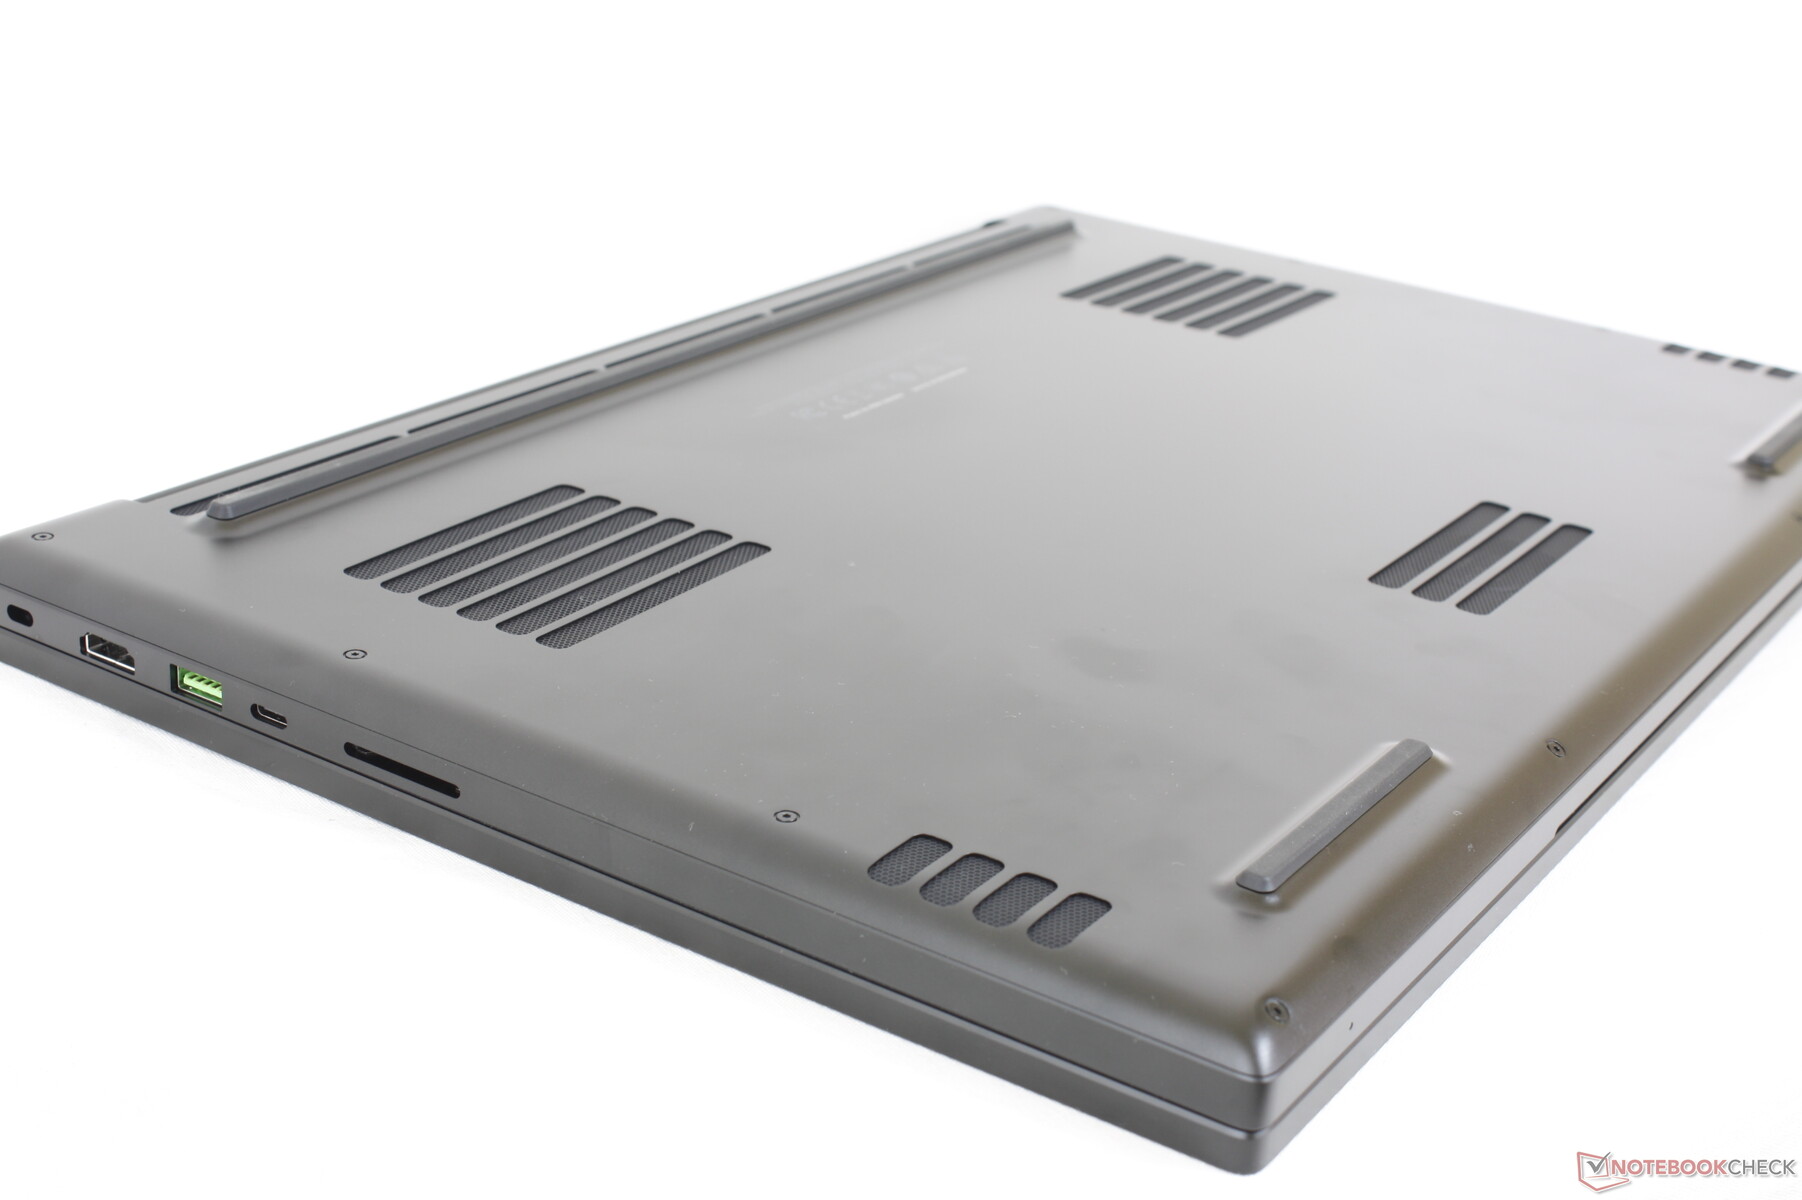
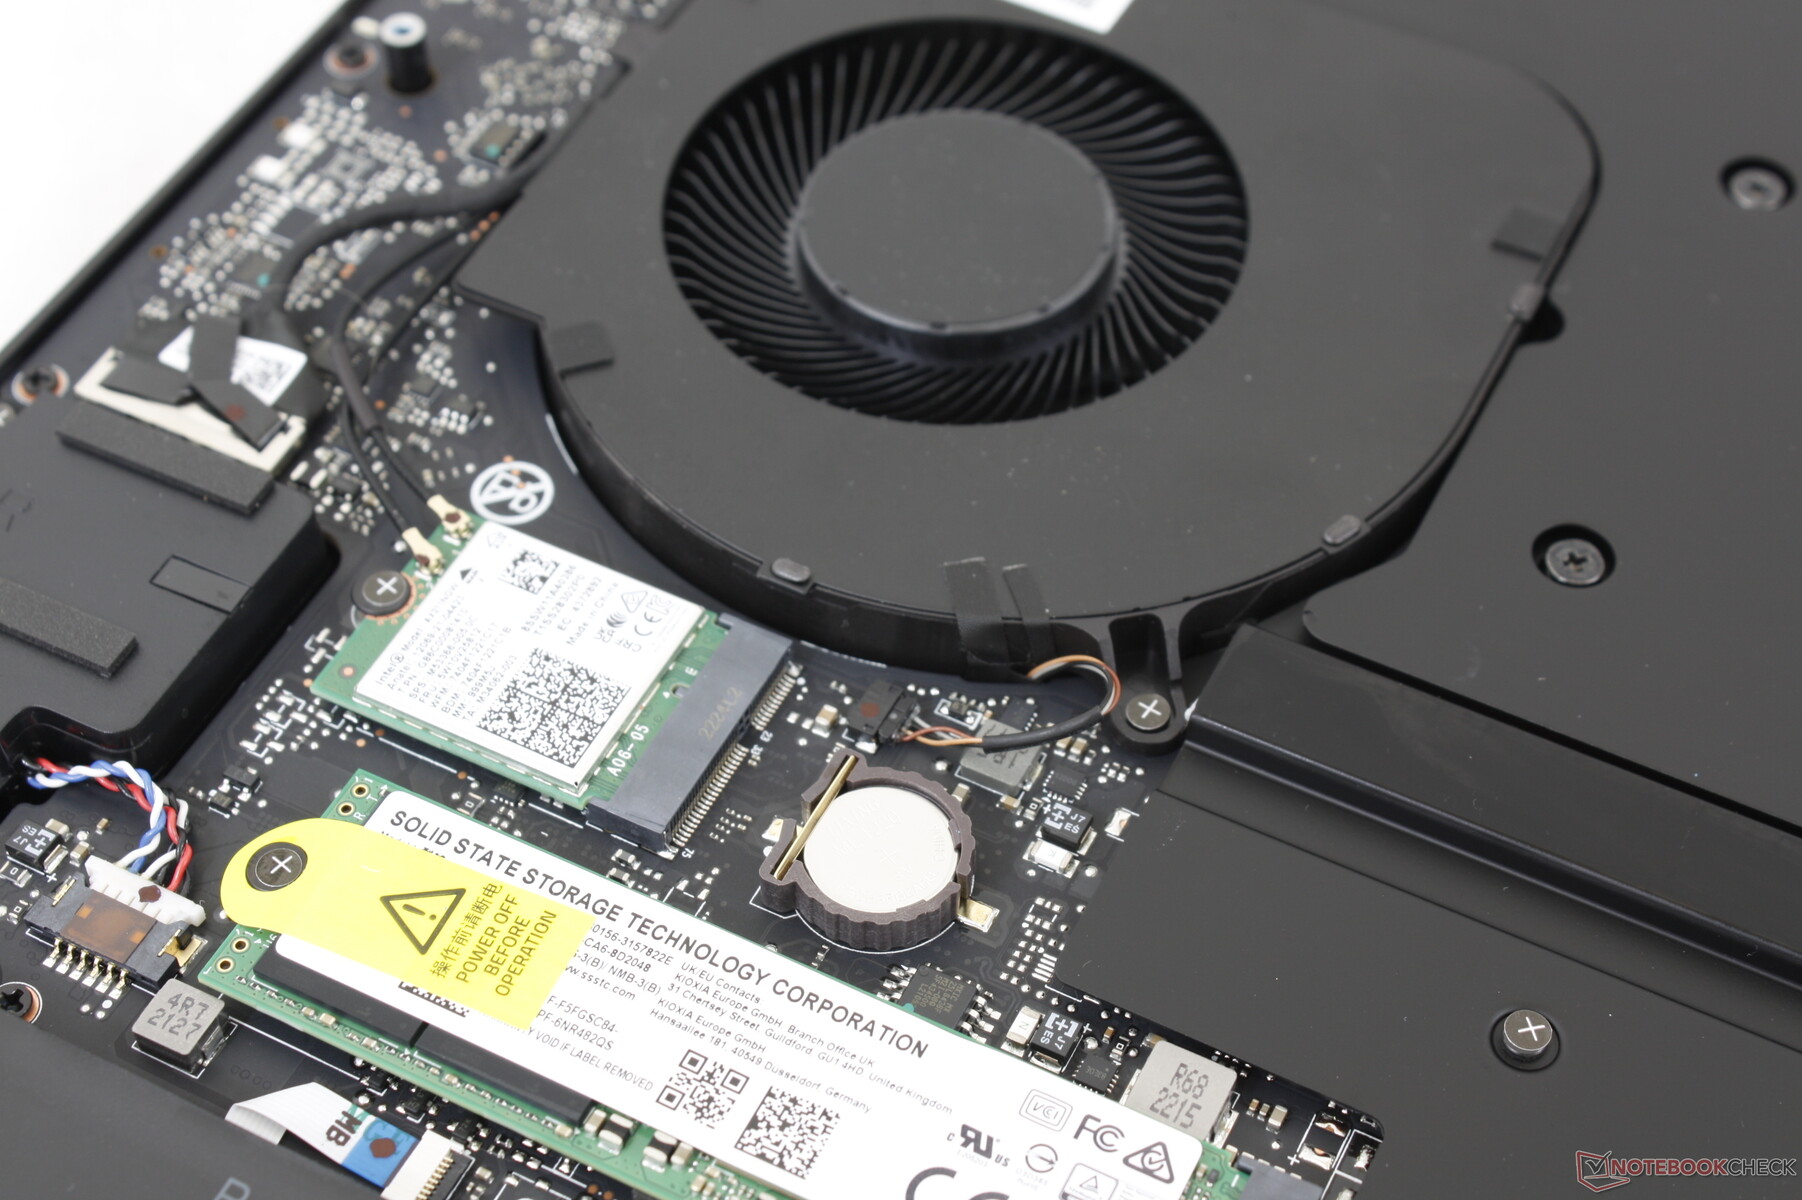
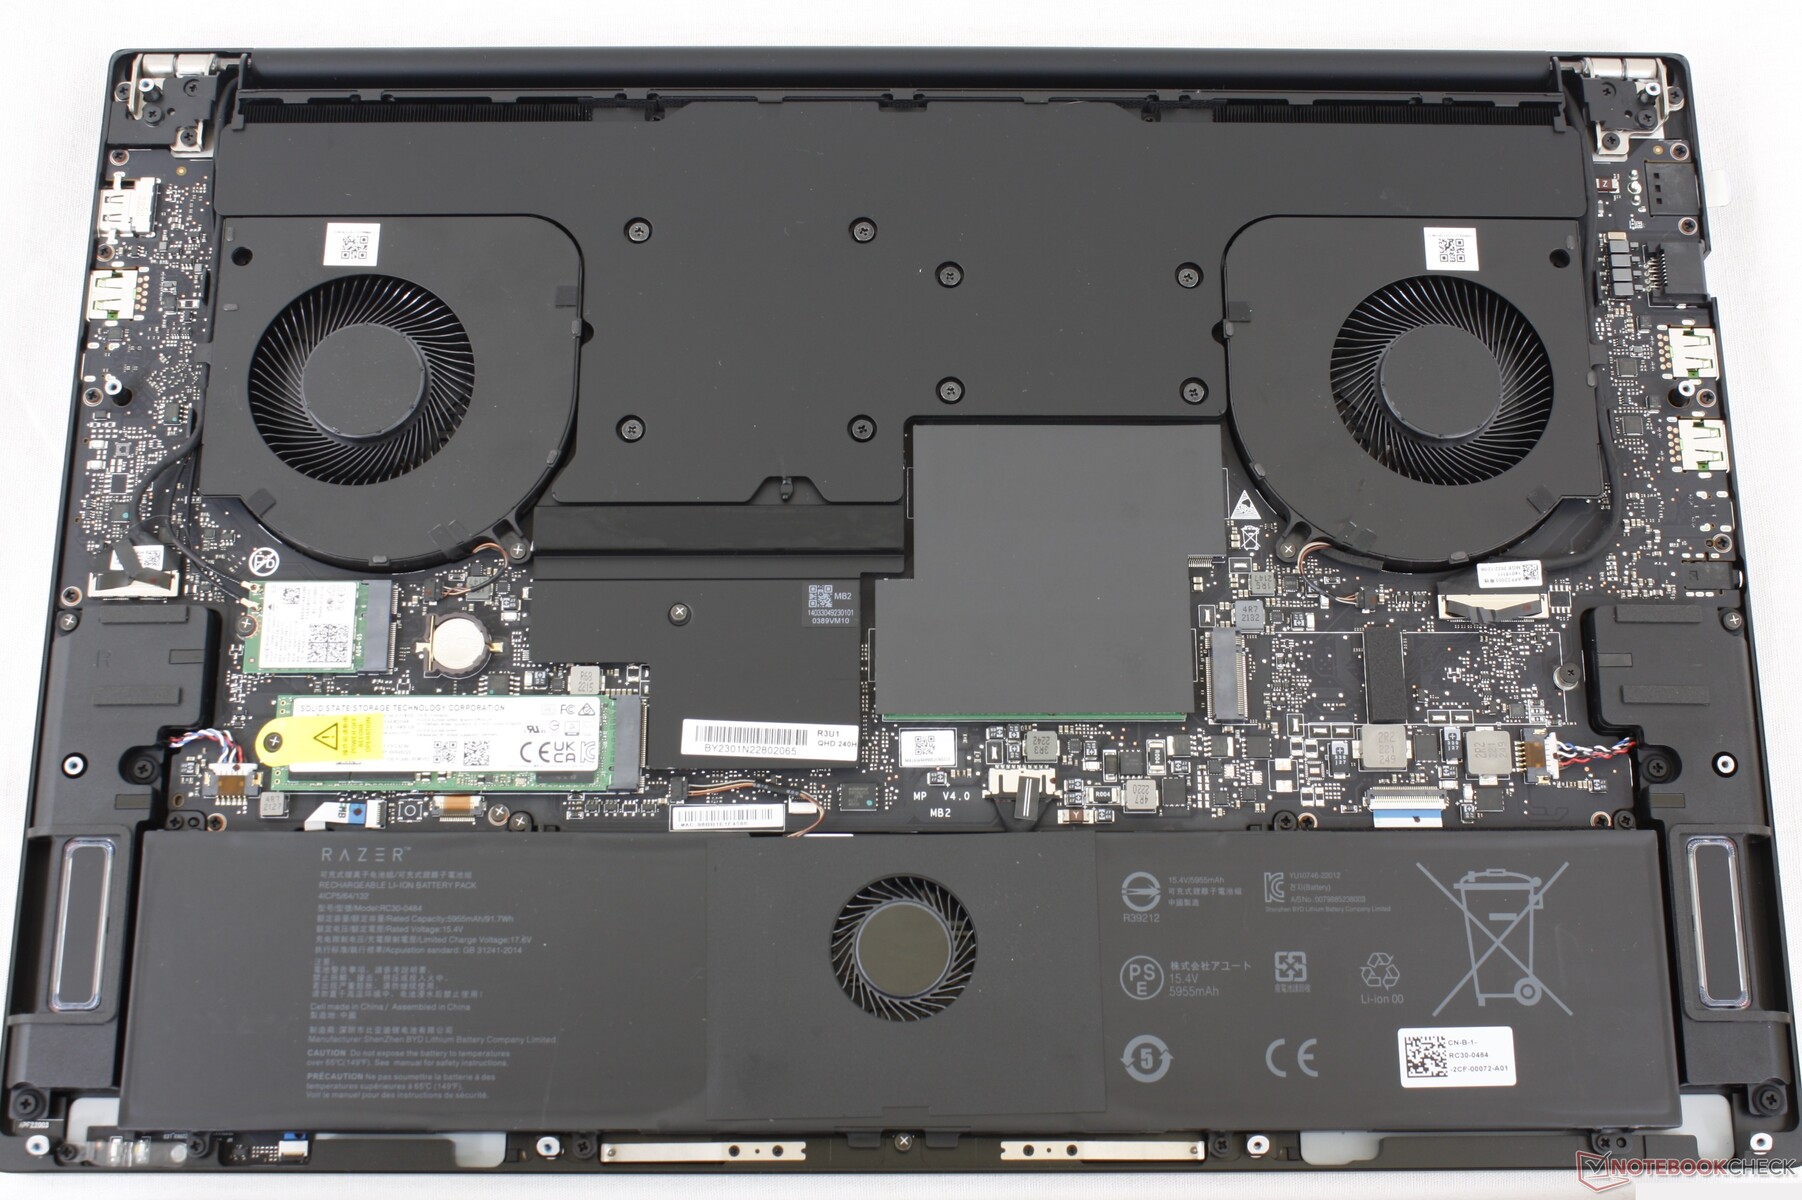
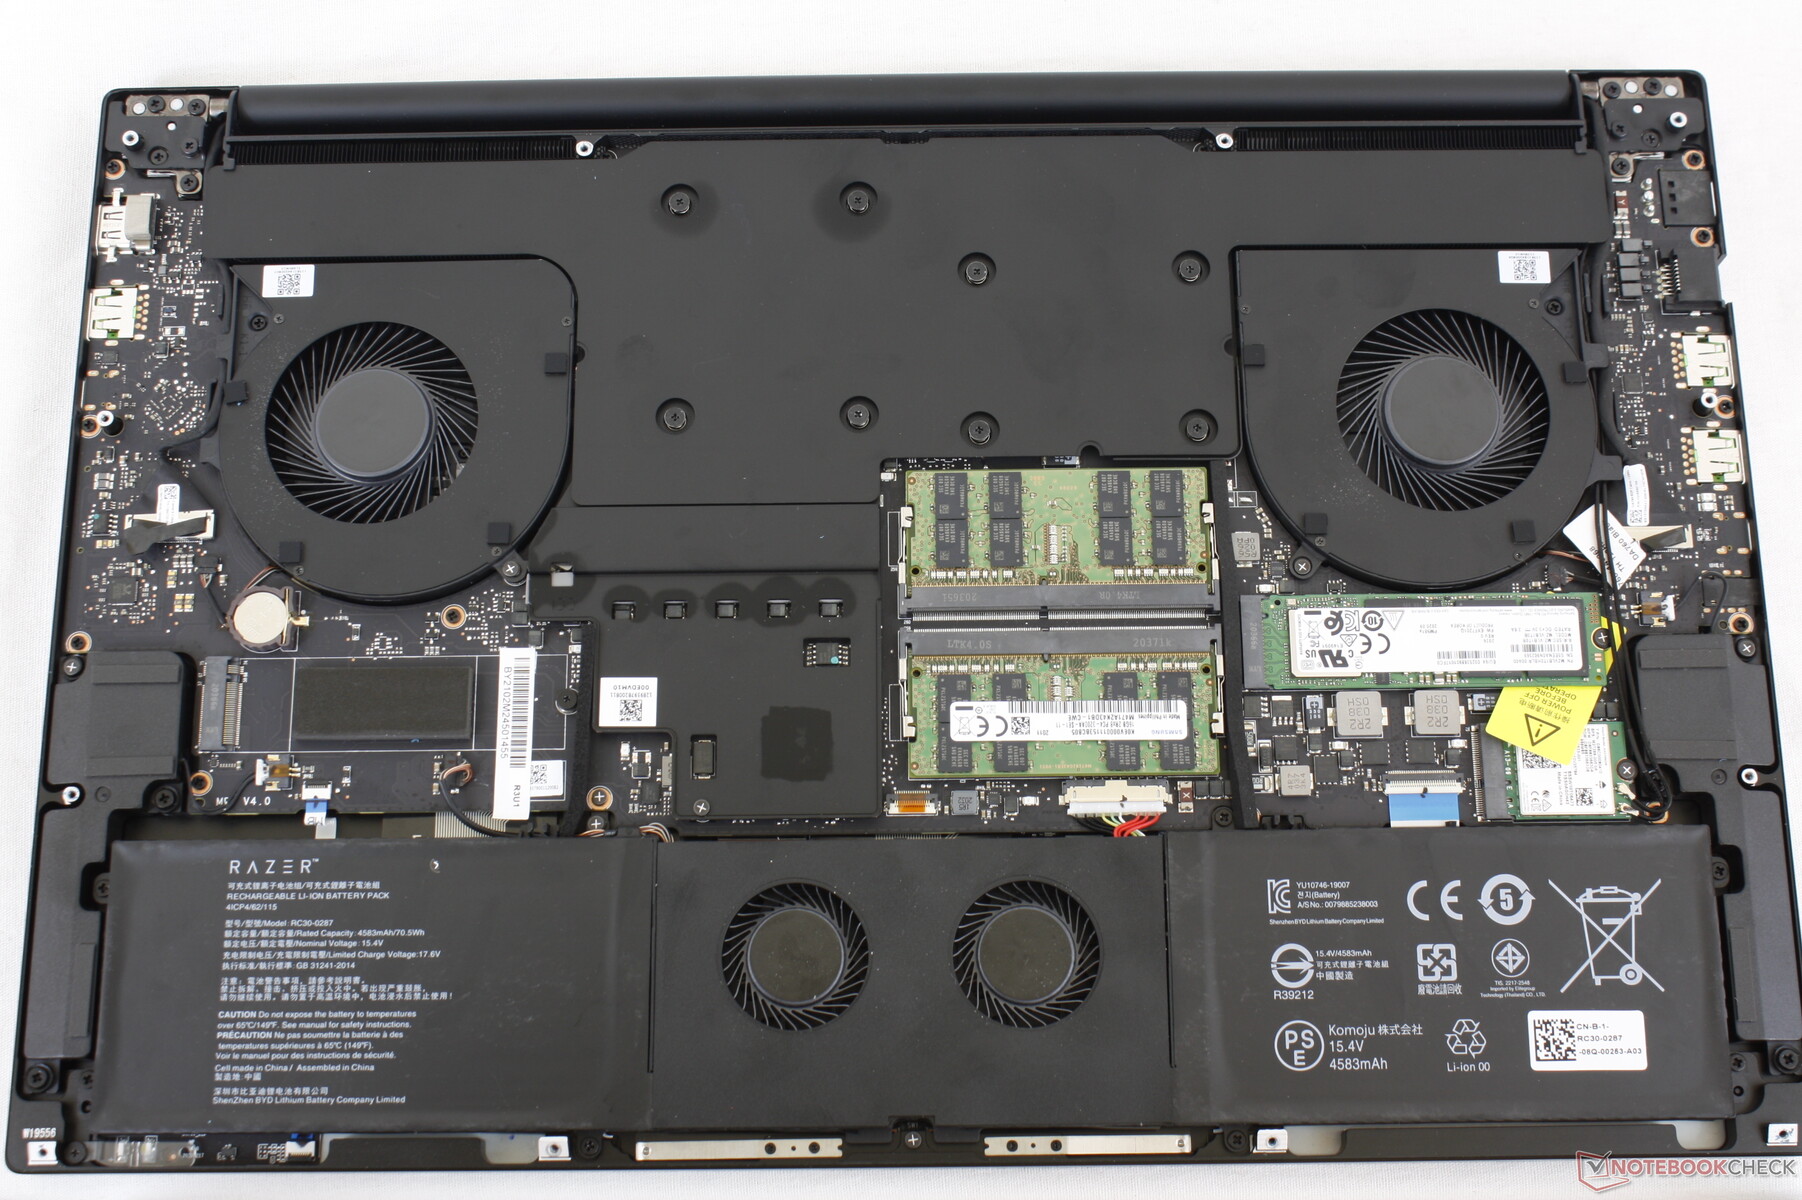
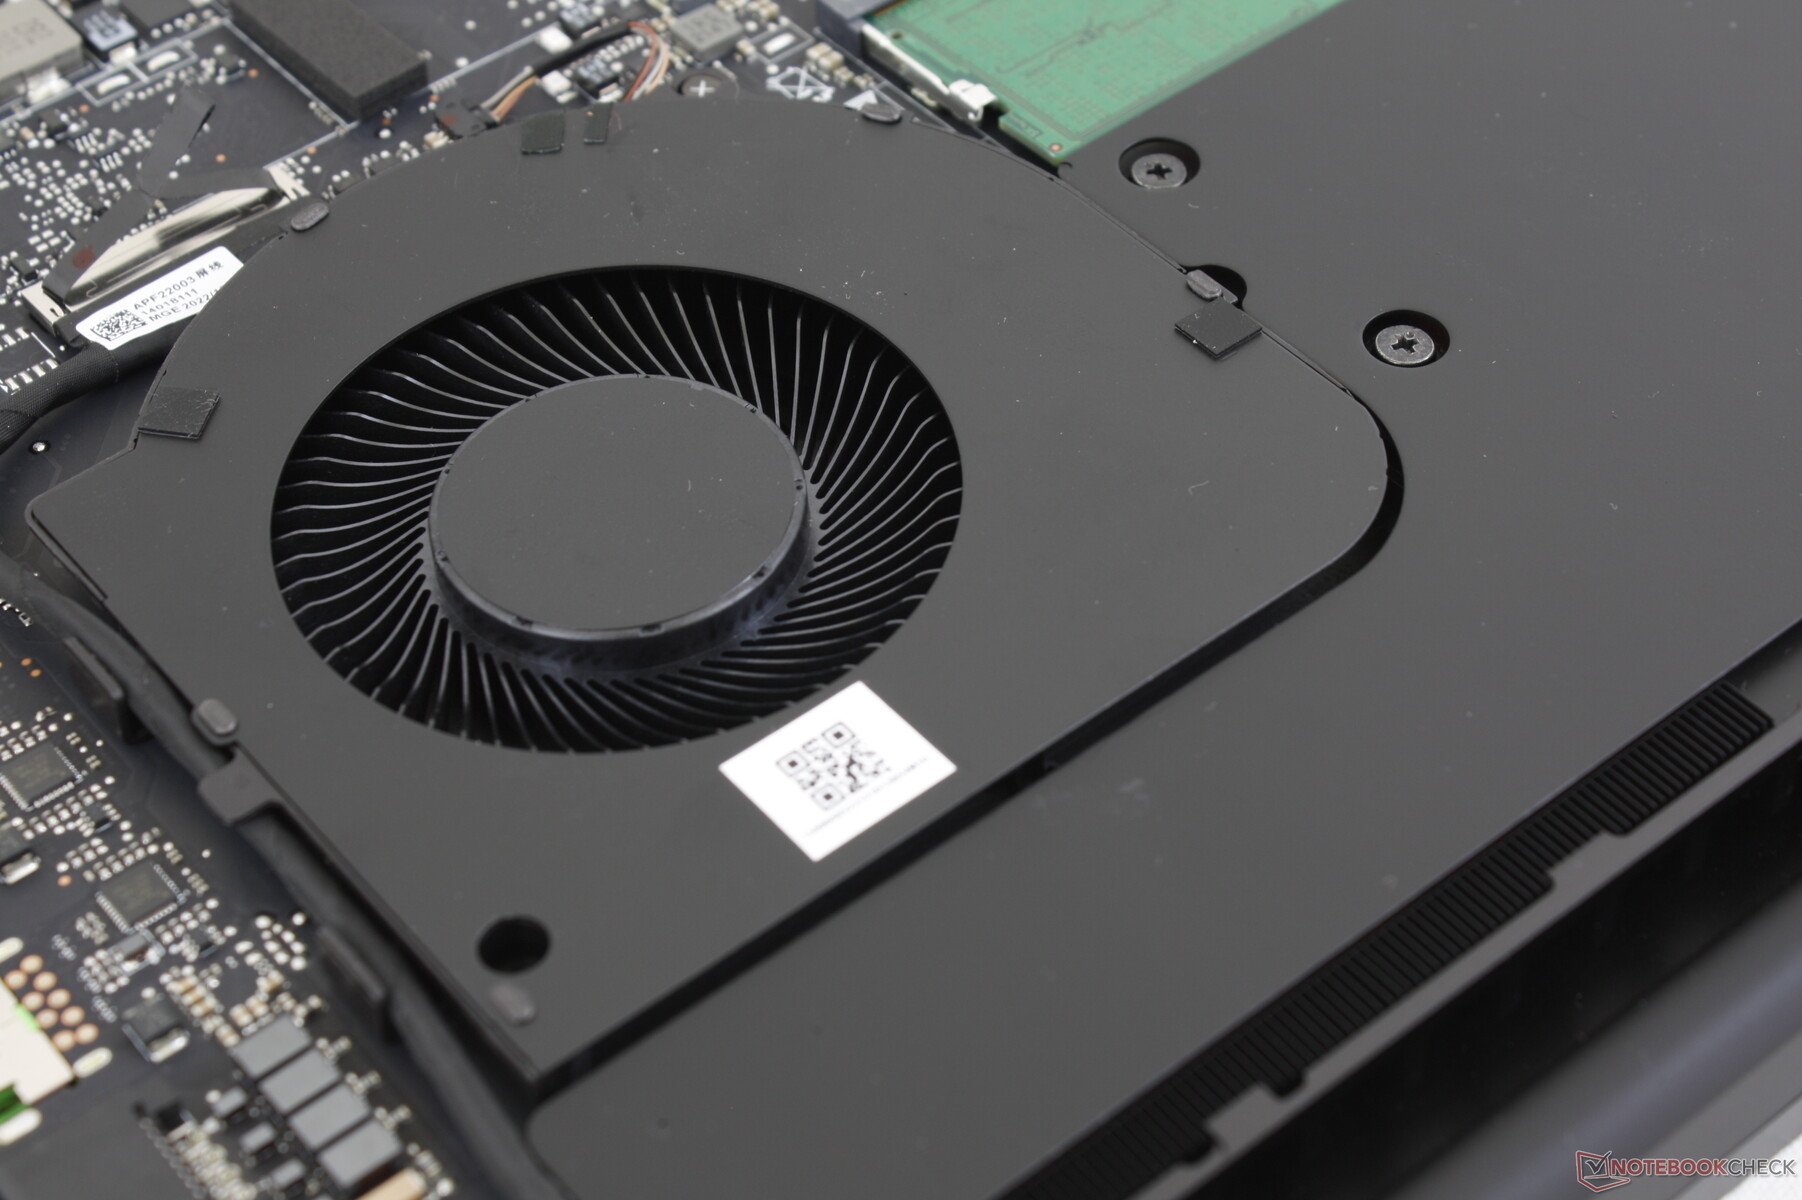
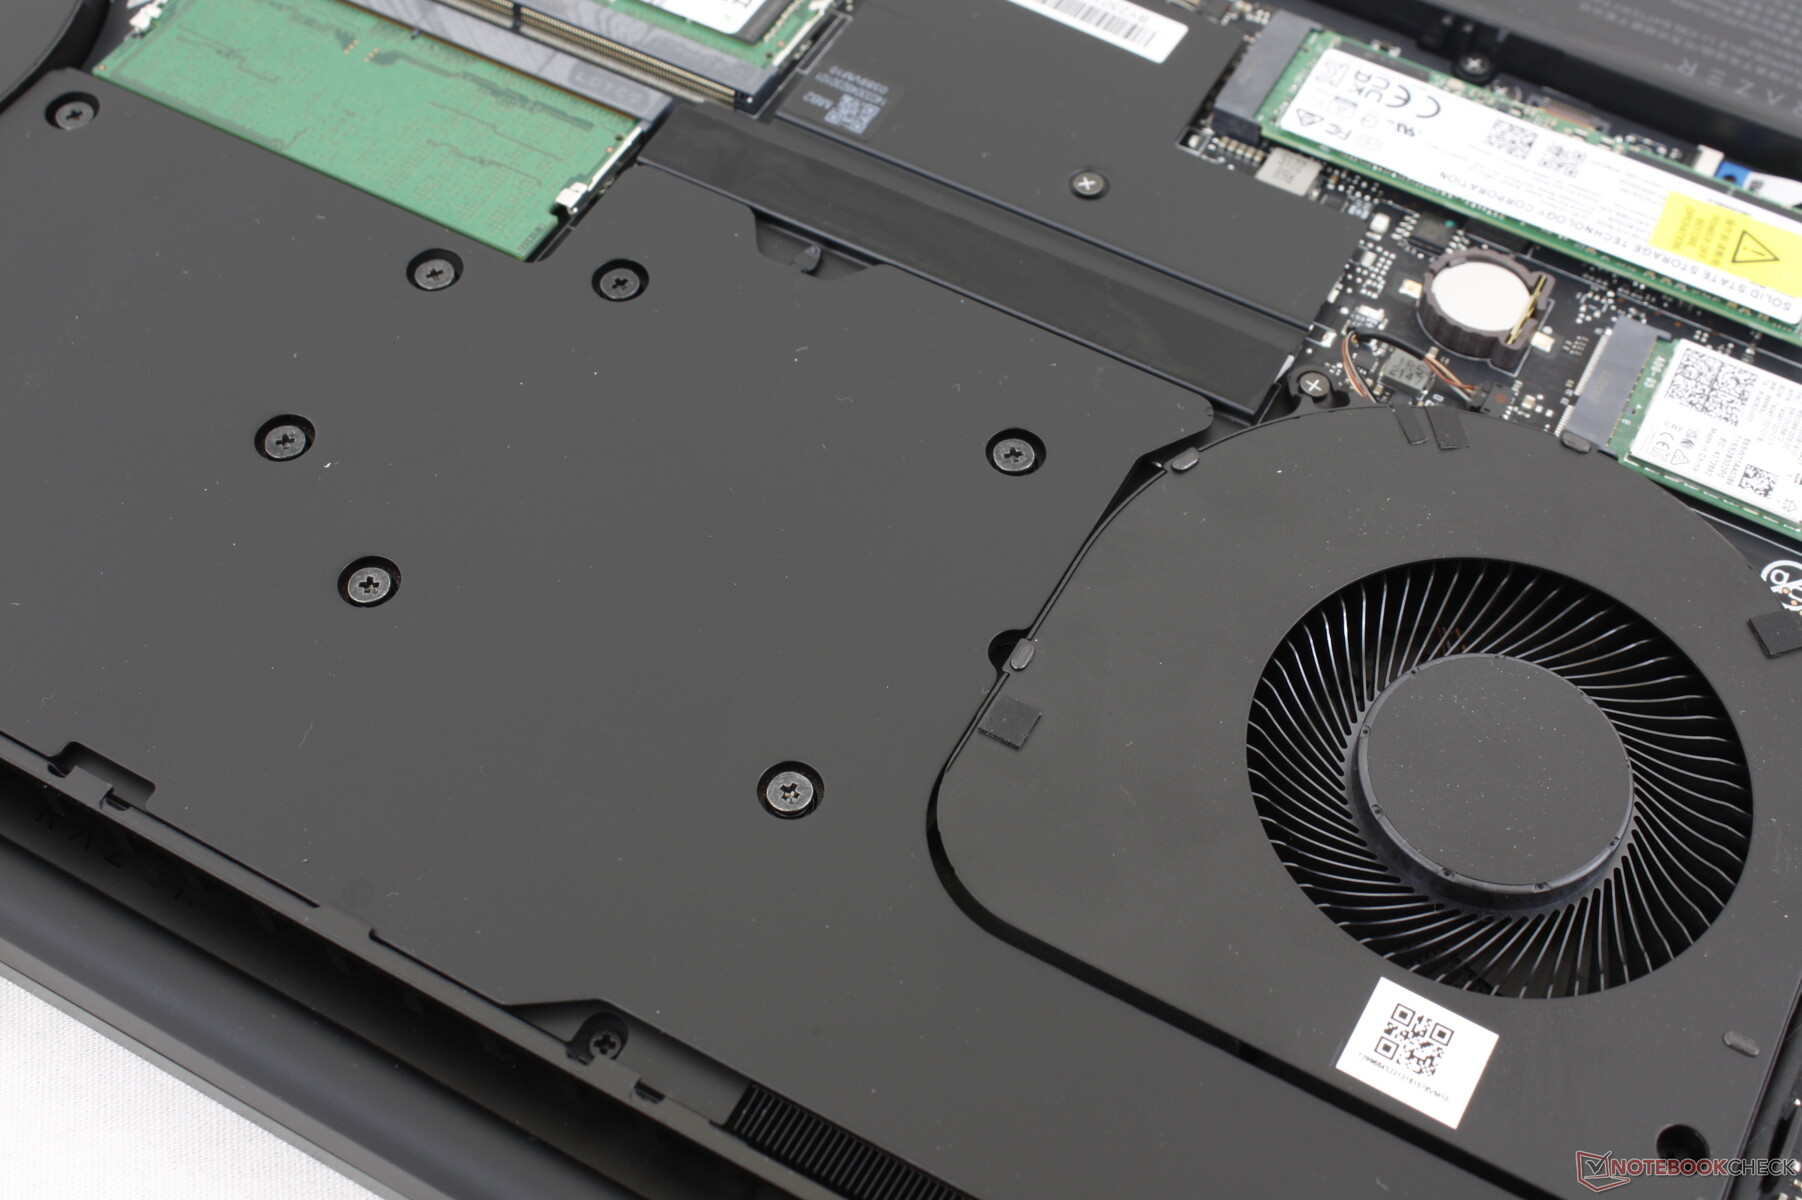
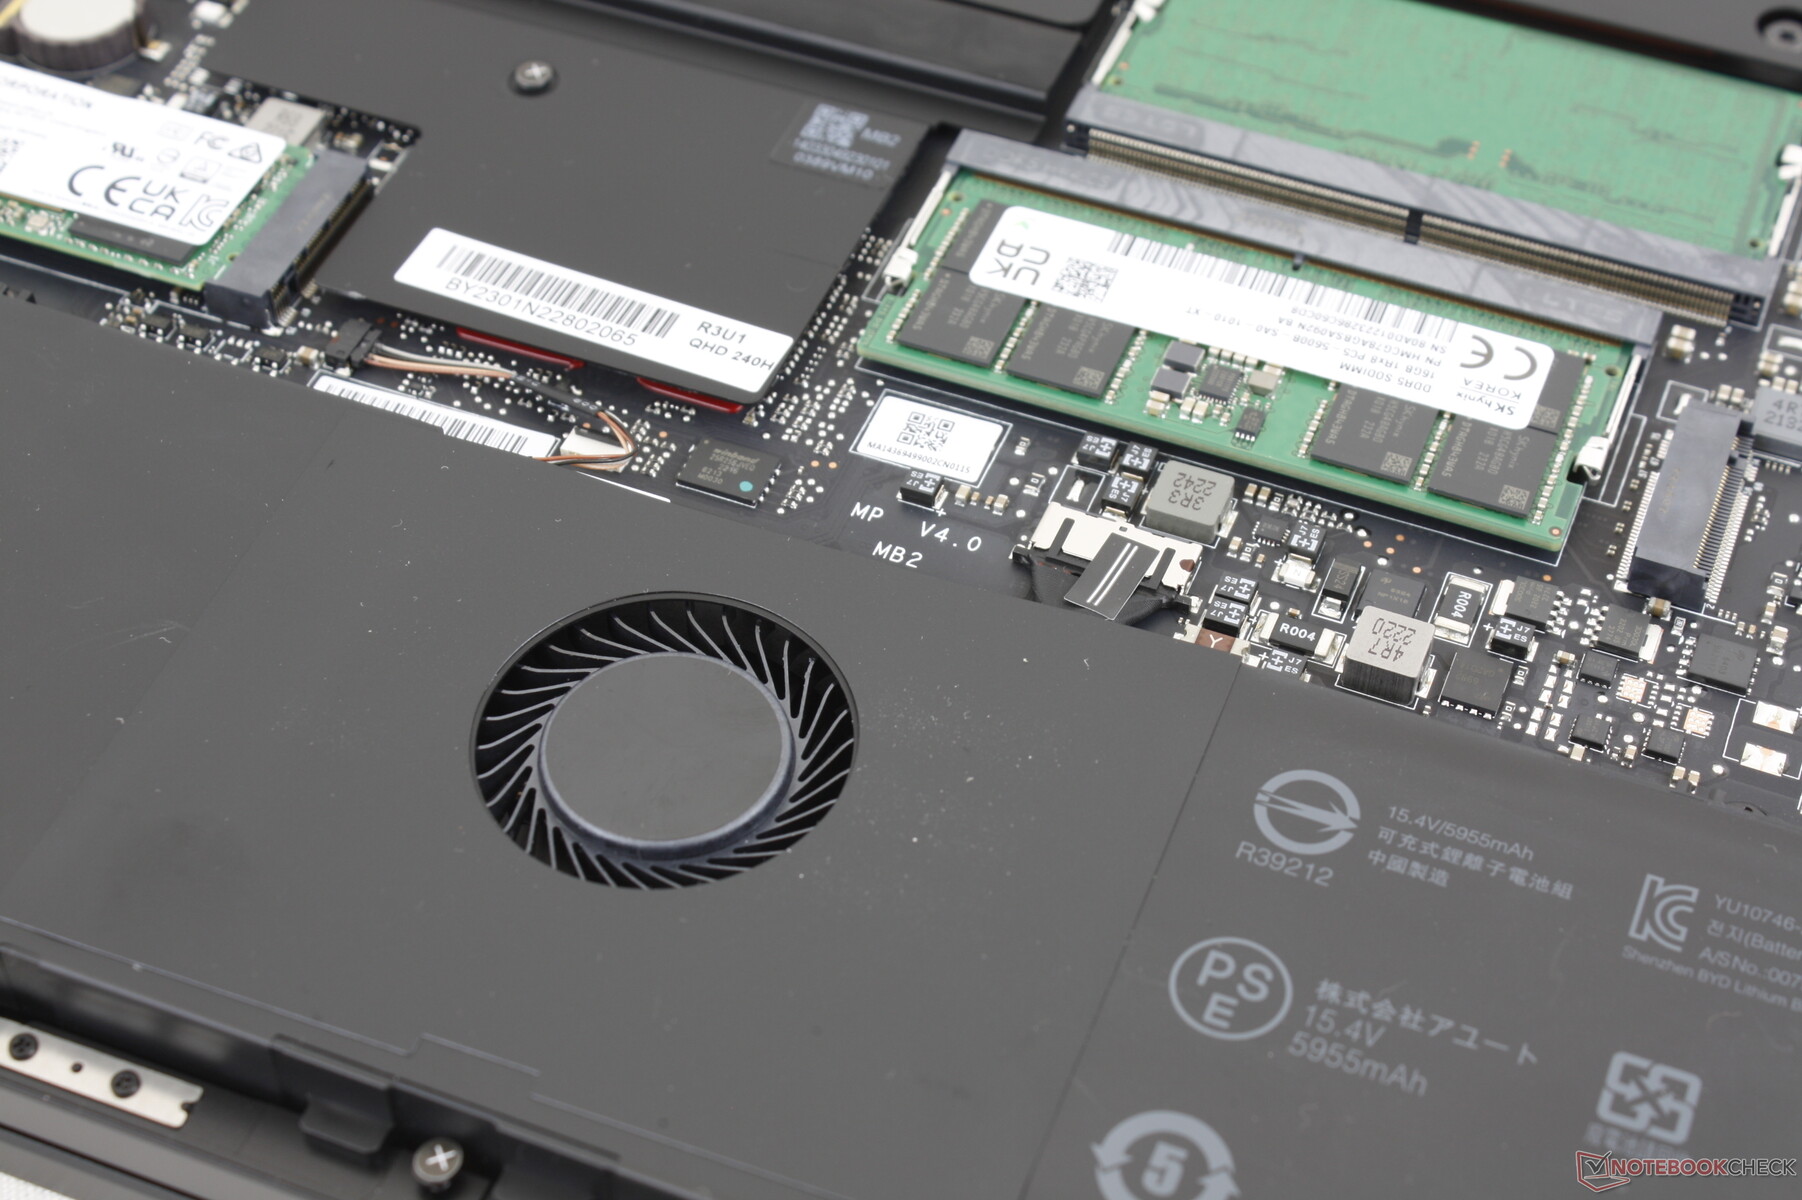
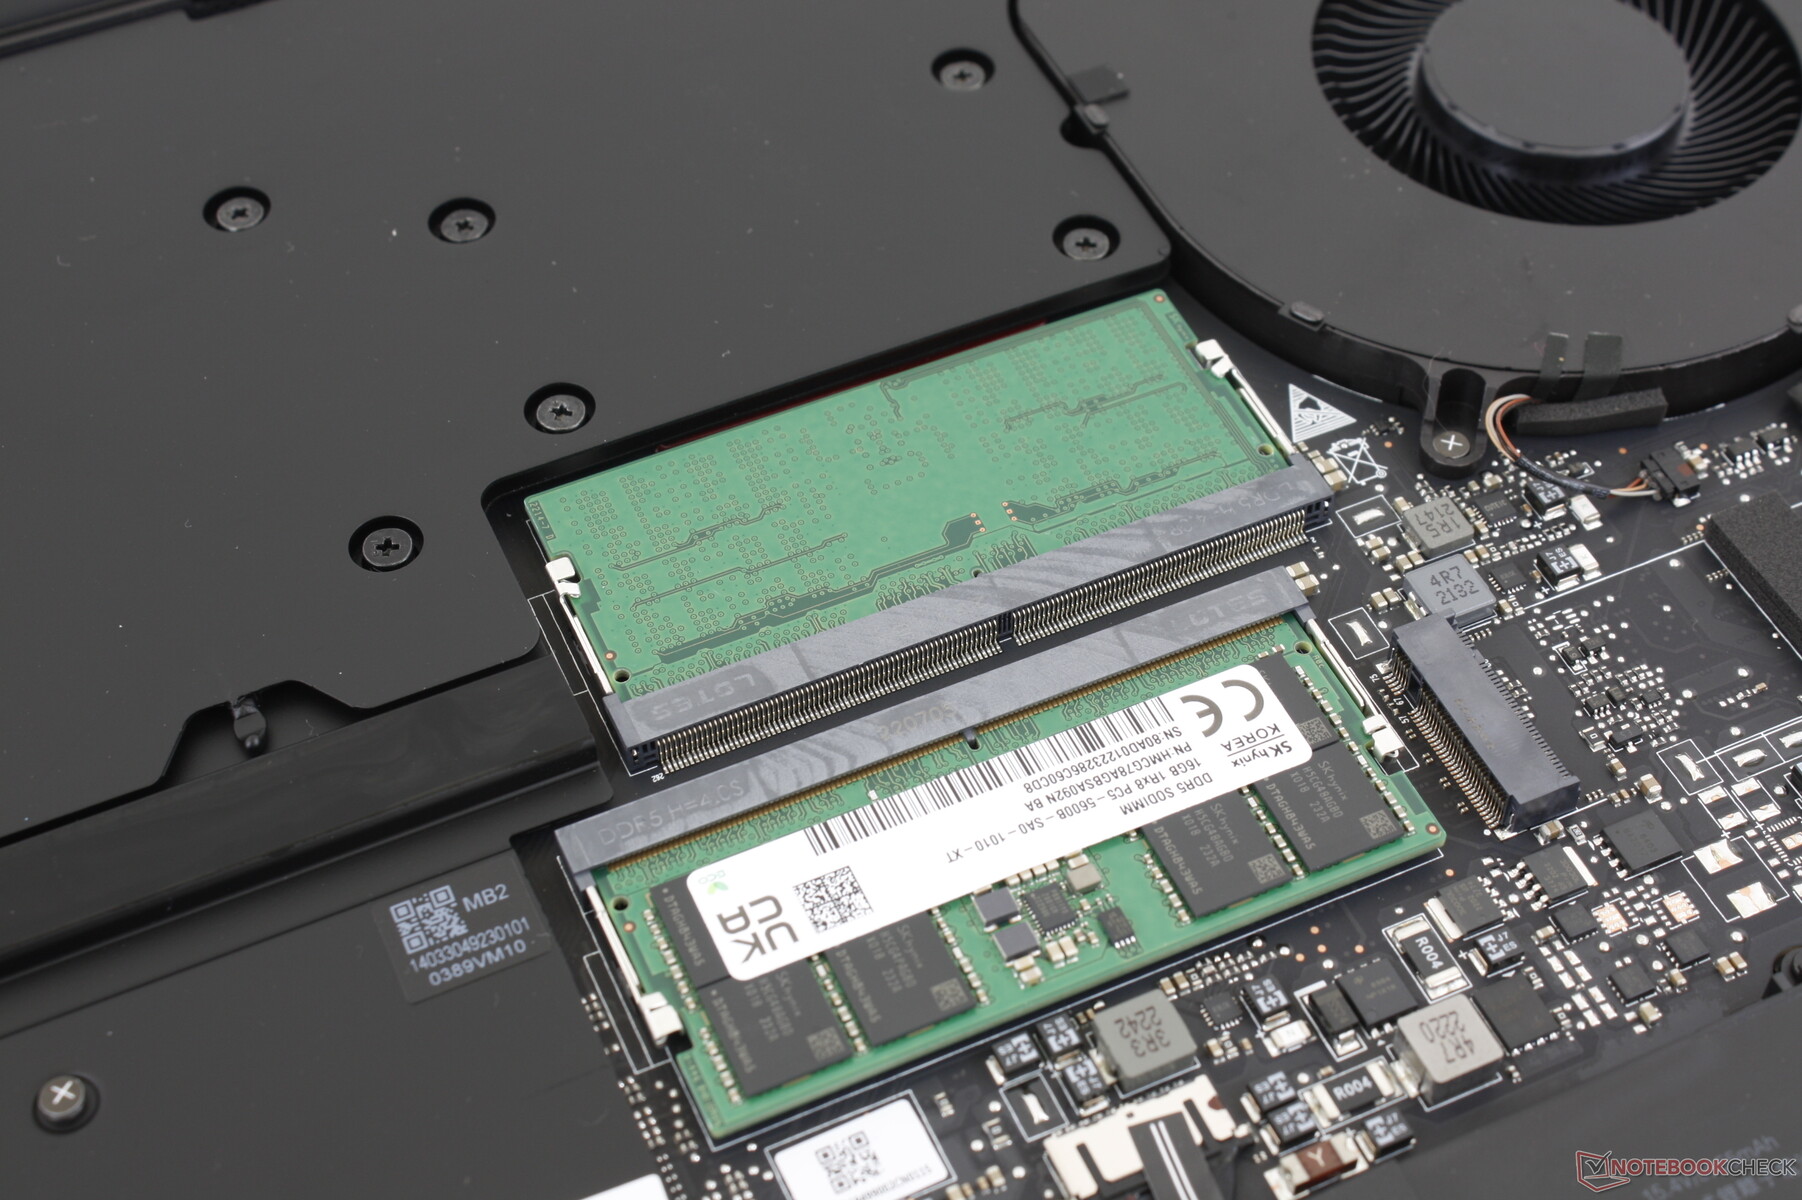
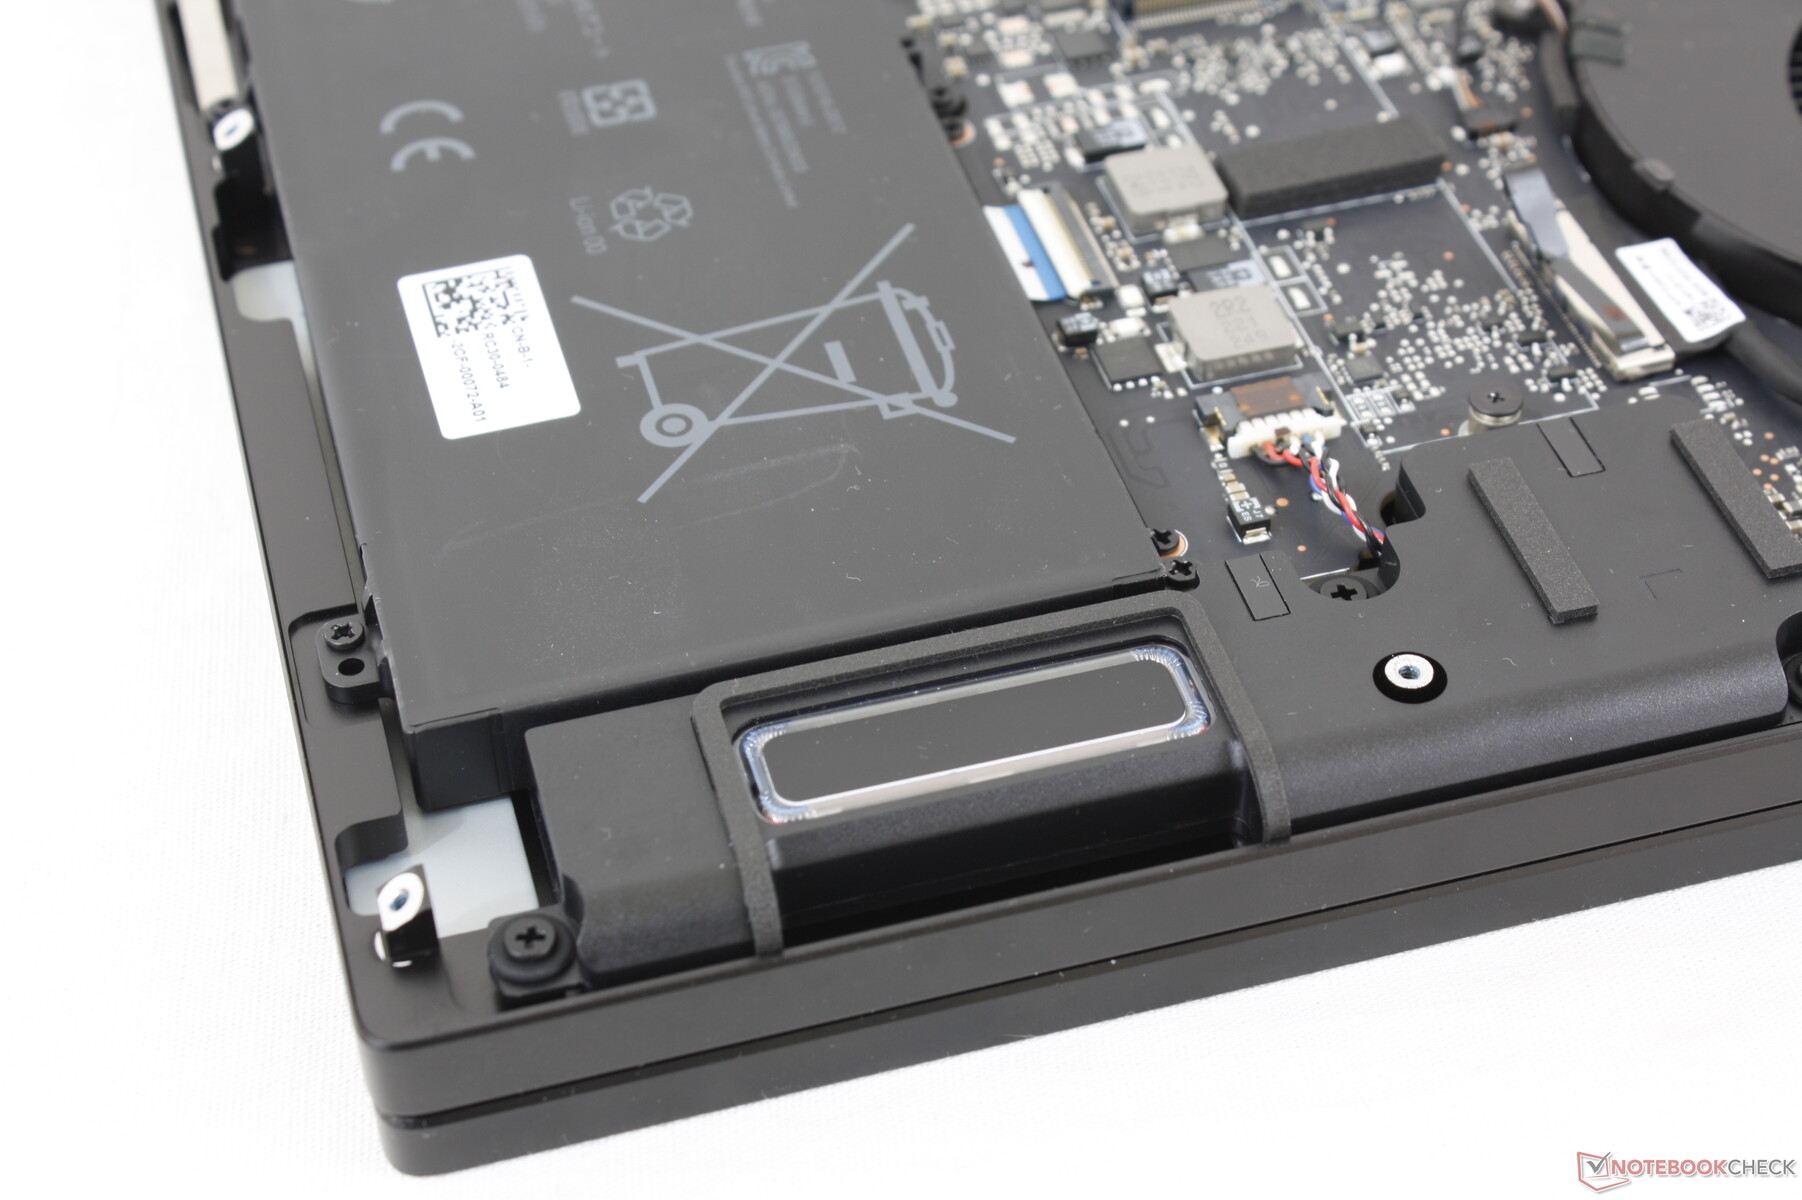
维护
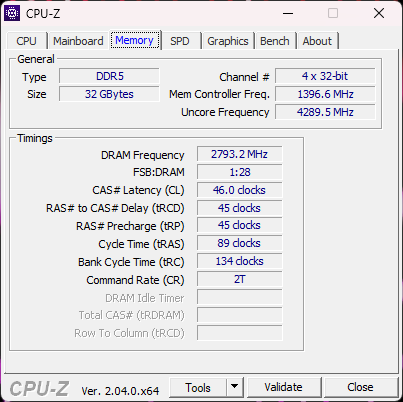
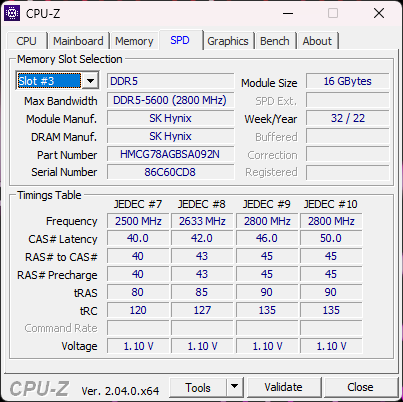
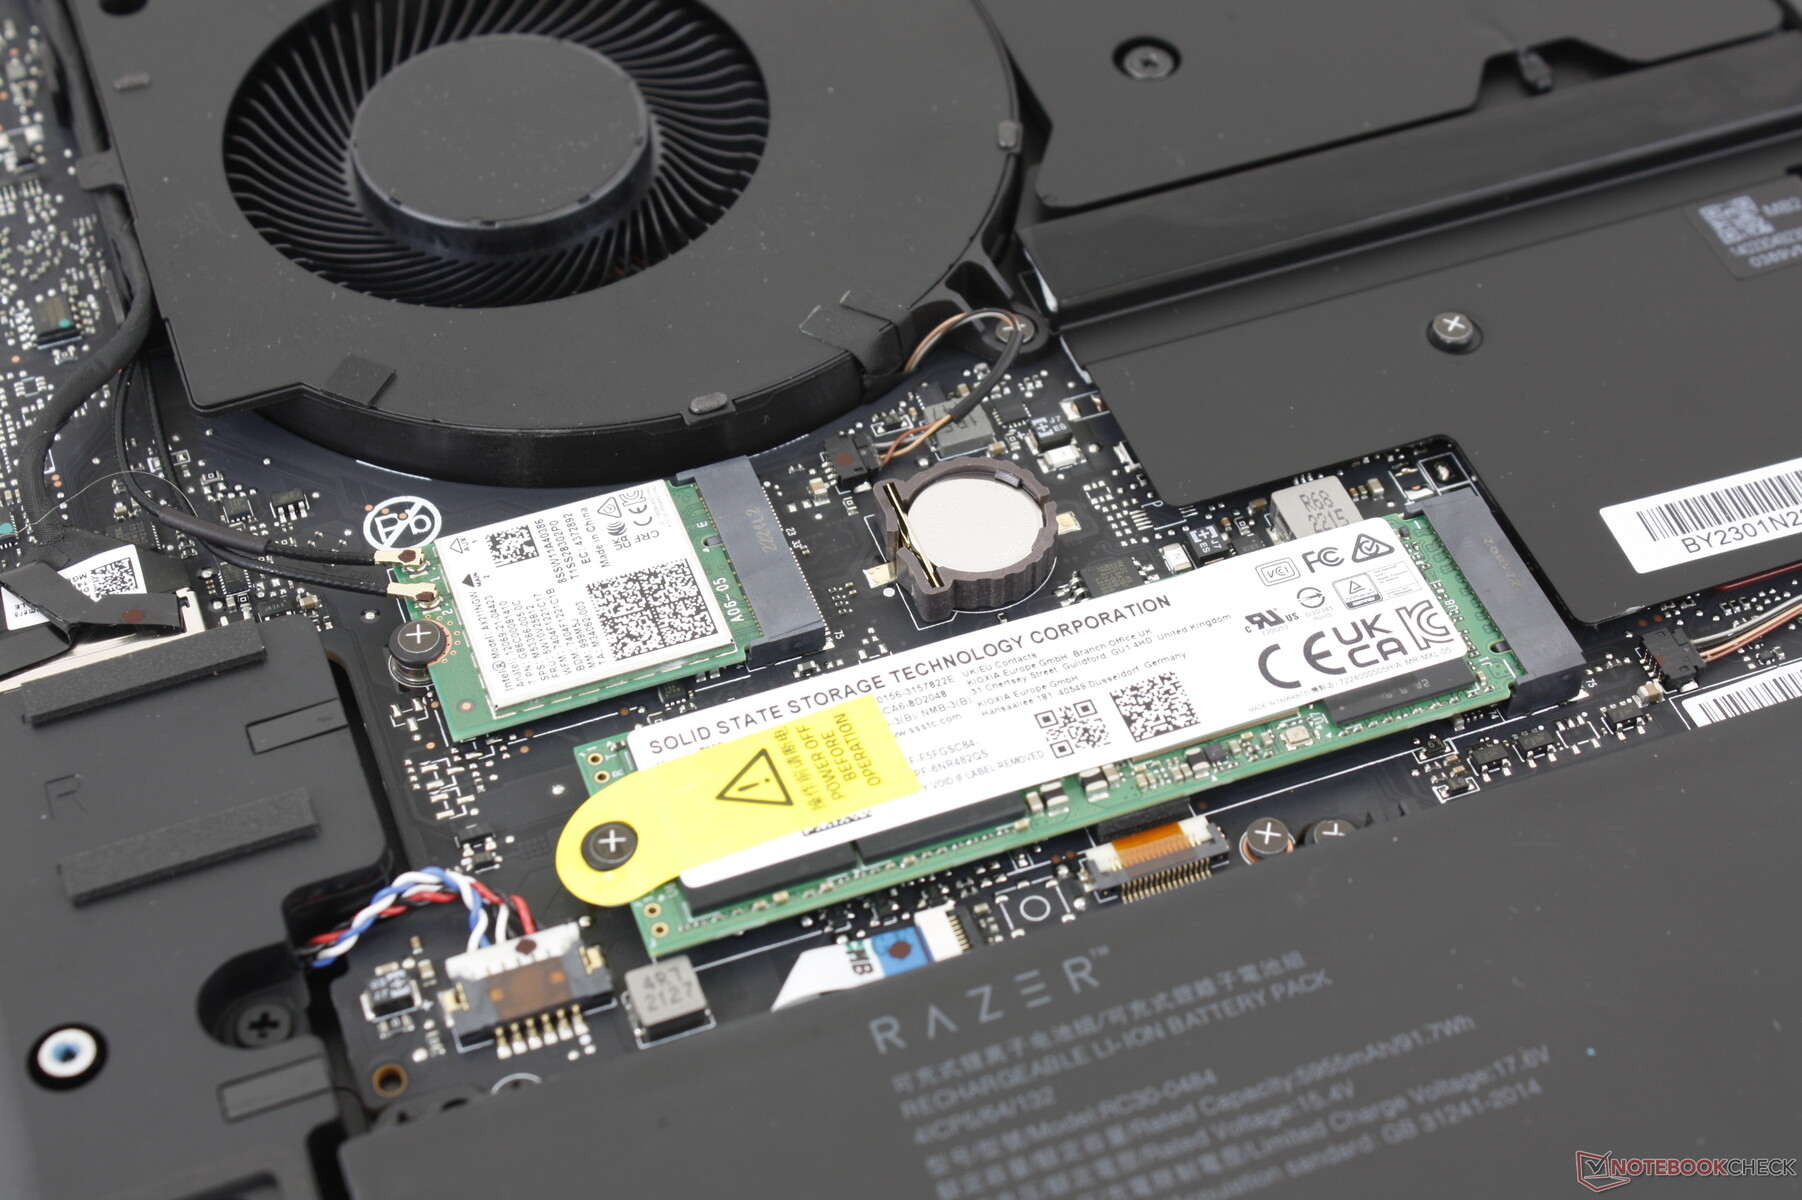
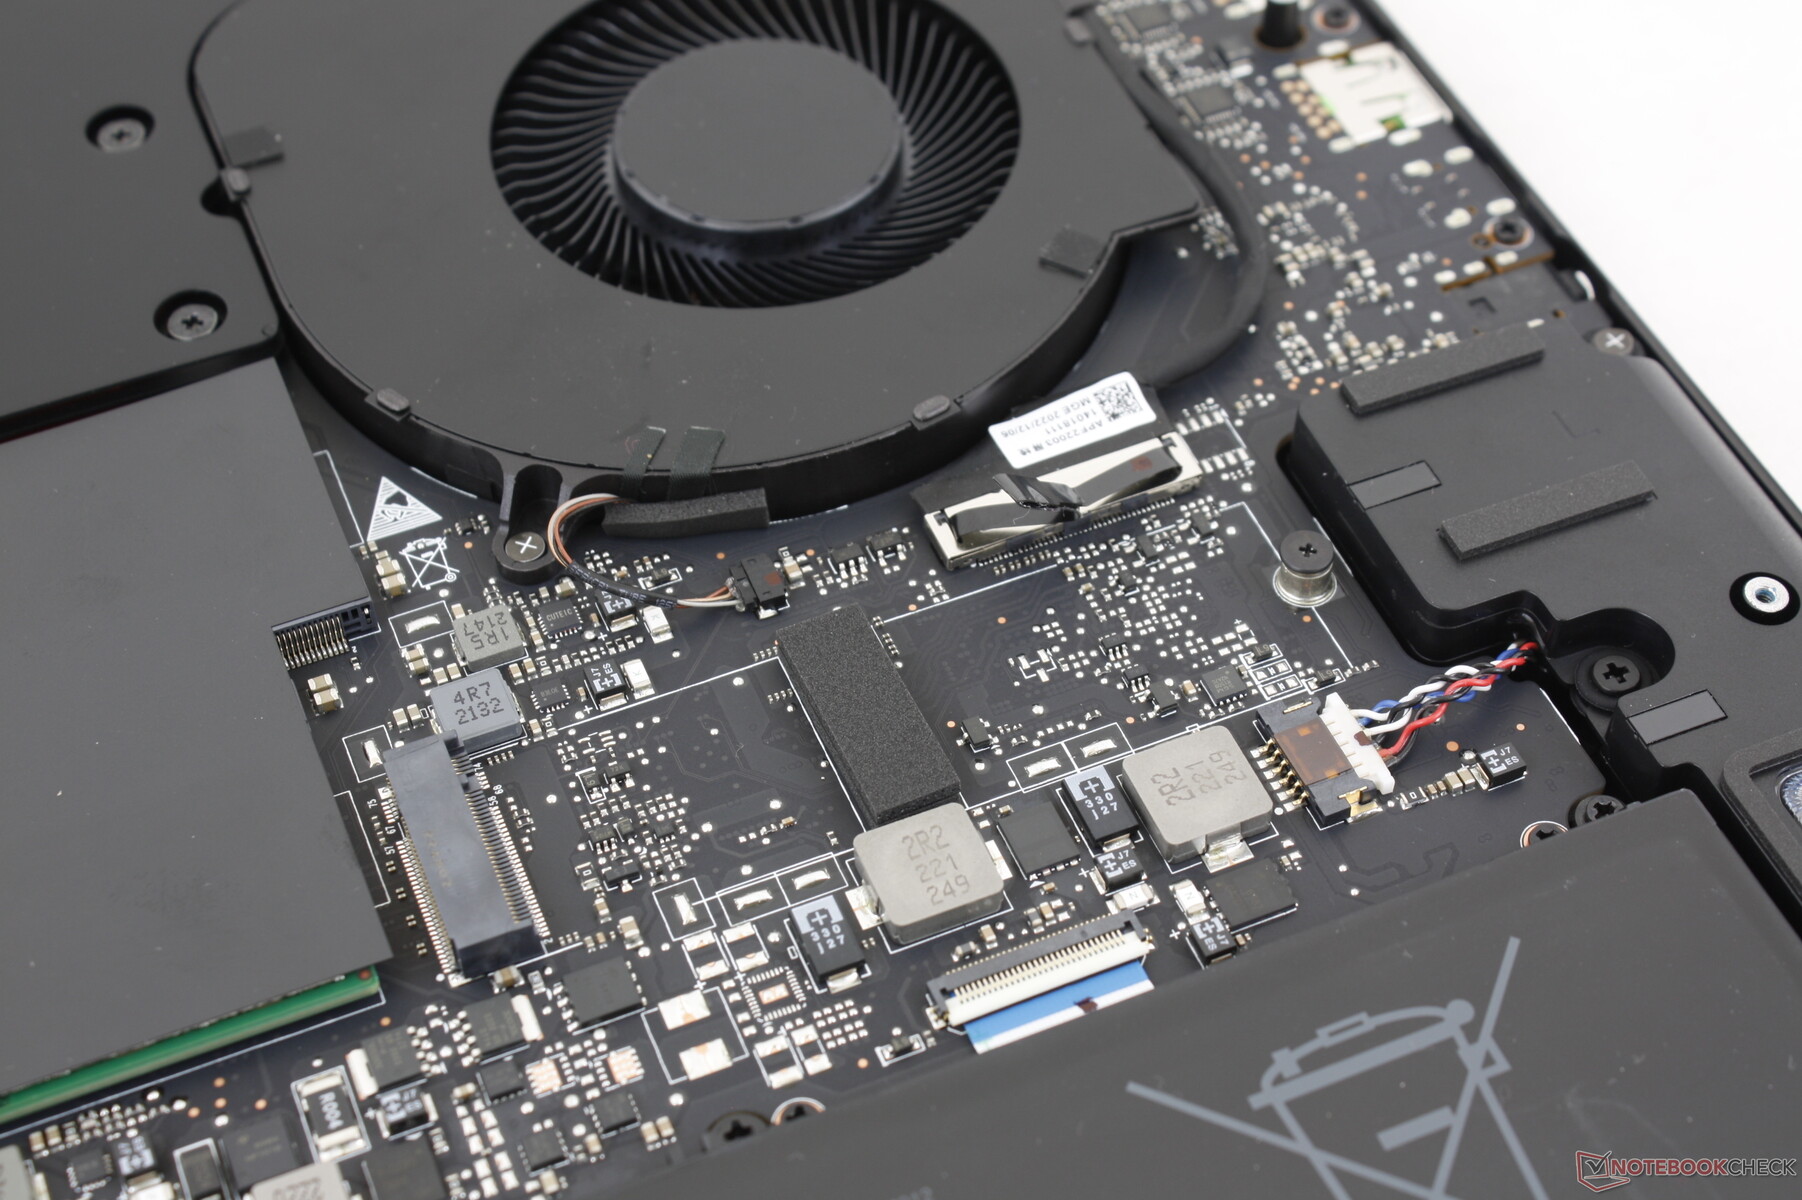
底部面板由十个T5 Torx螺钉固定,便于维修。用户可以直接访问两个M.2 2280固态硬盘插槽,两个SODIMM插槽,最多可容纳32GB DDR5-5600或64GB DDR5-5200,以及可拆卸的WLAN模块。最值得注意的是,目前的Blade 18设计在点击板的正下方加入了一个额外的风扇,与旧的Blade 17设计类似。
配件和保修
零售箱中没有任何额外的东西。制造商提供一年的有限保修,如果在美国购买,内部电池有单独的两年保修。
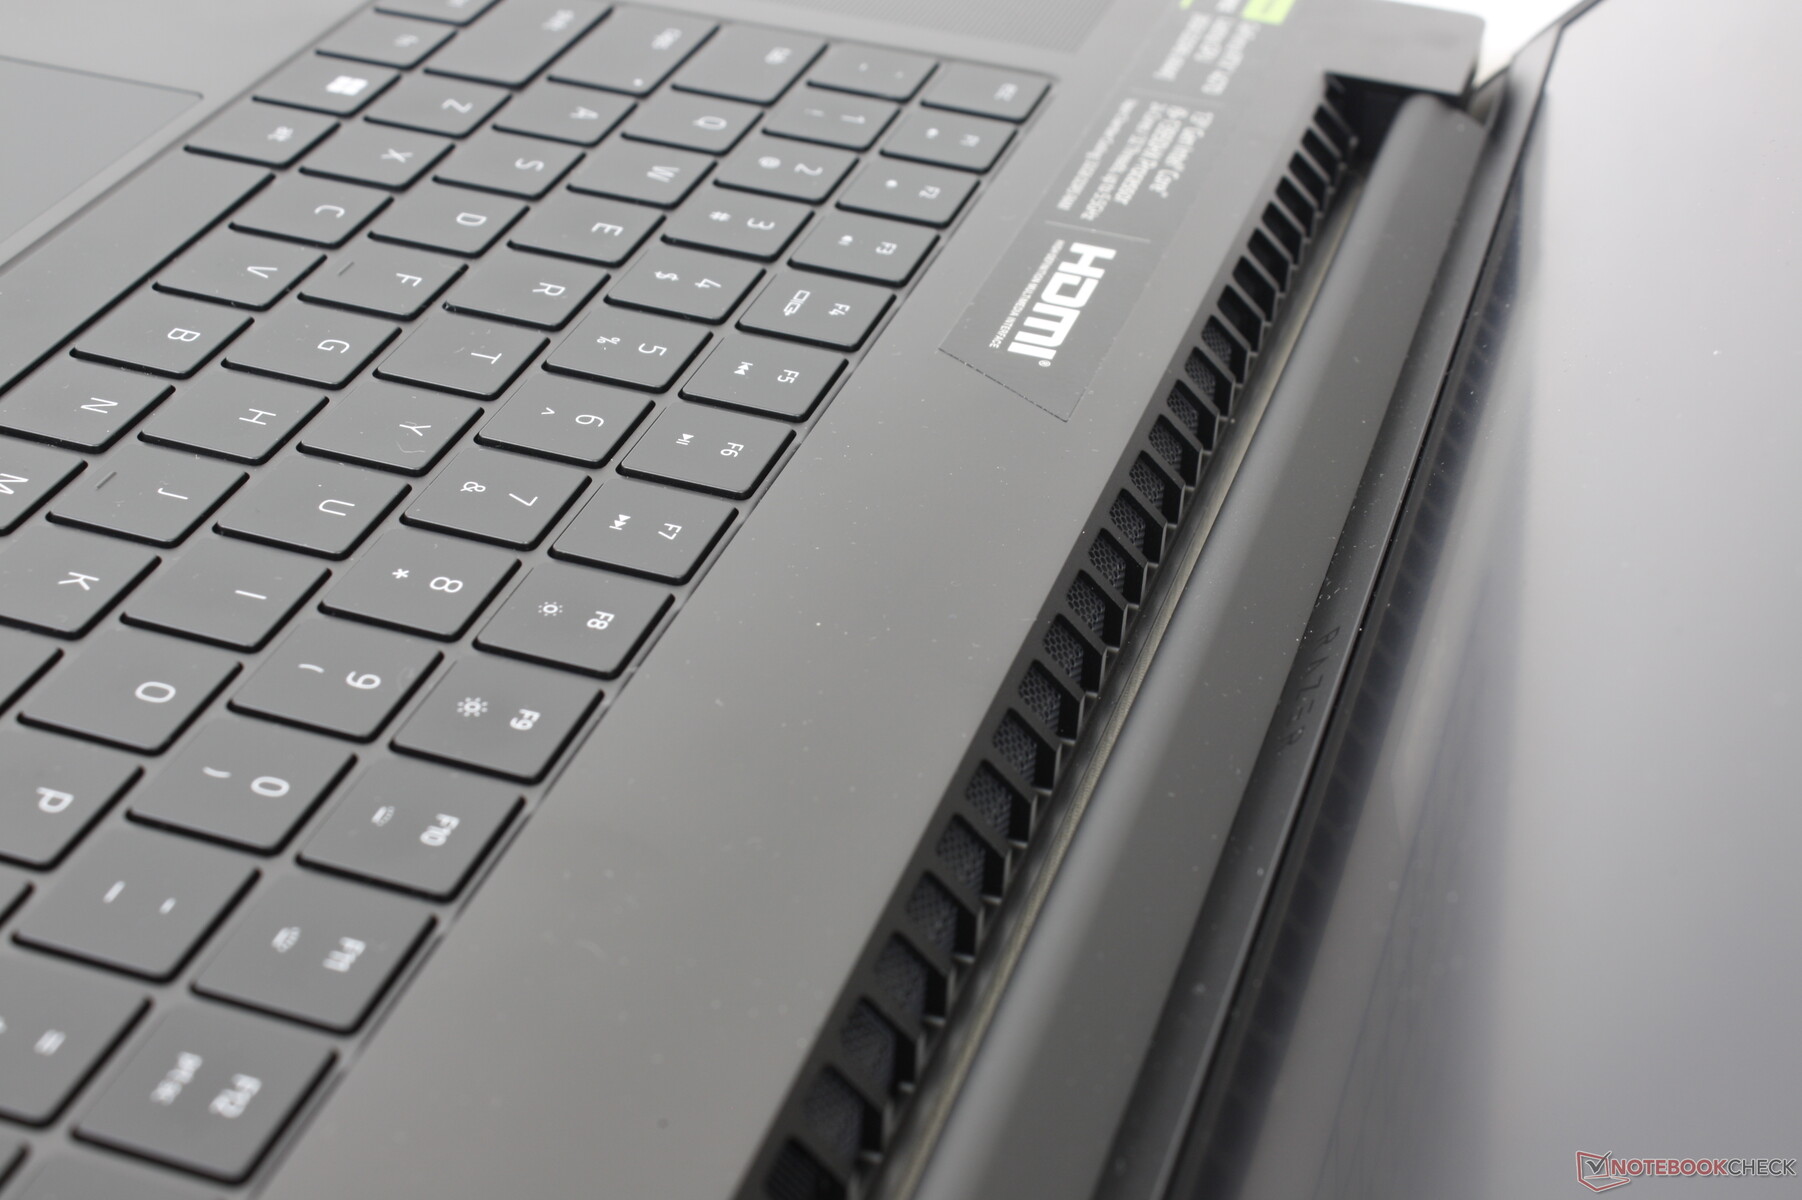
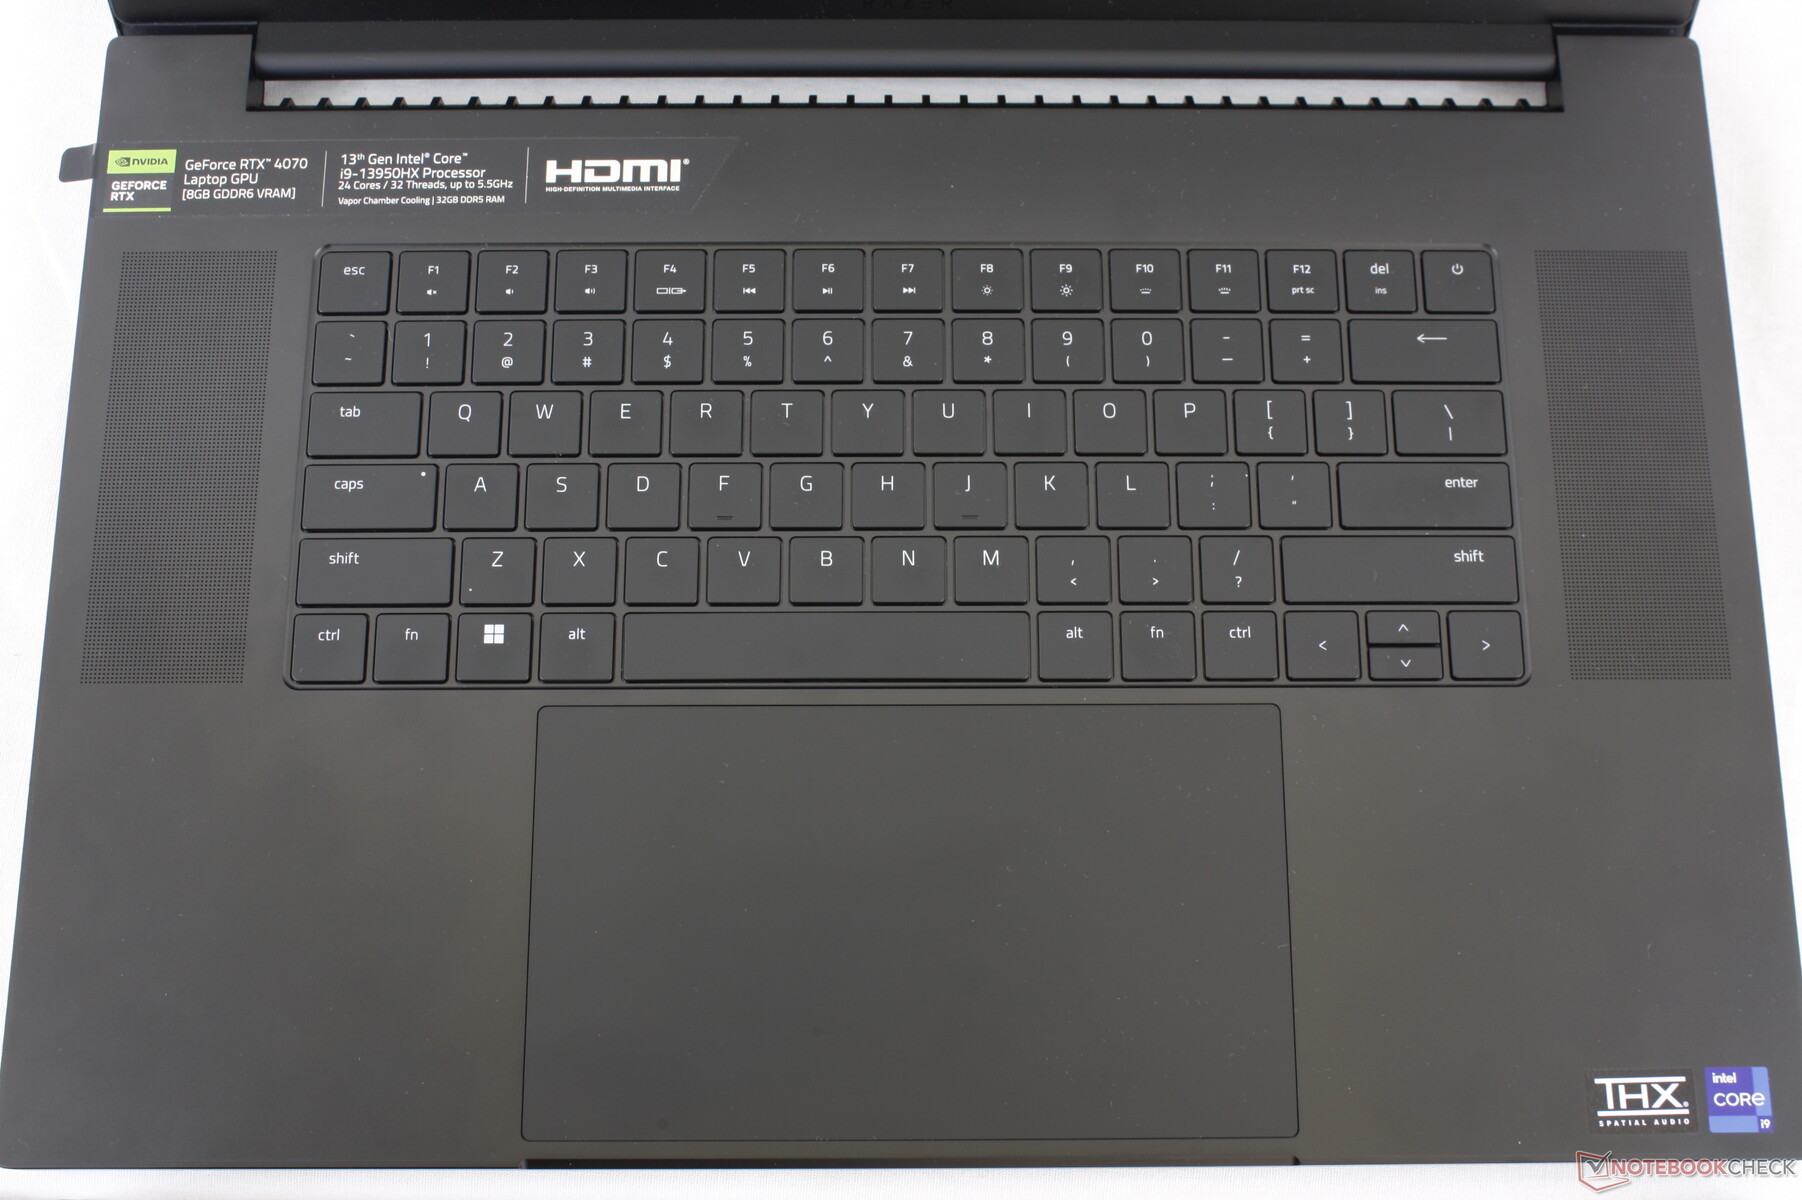
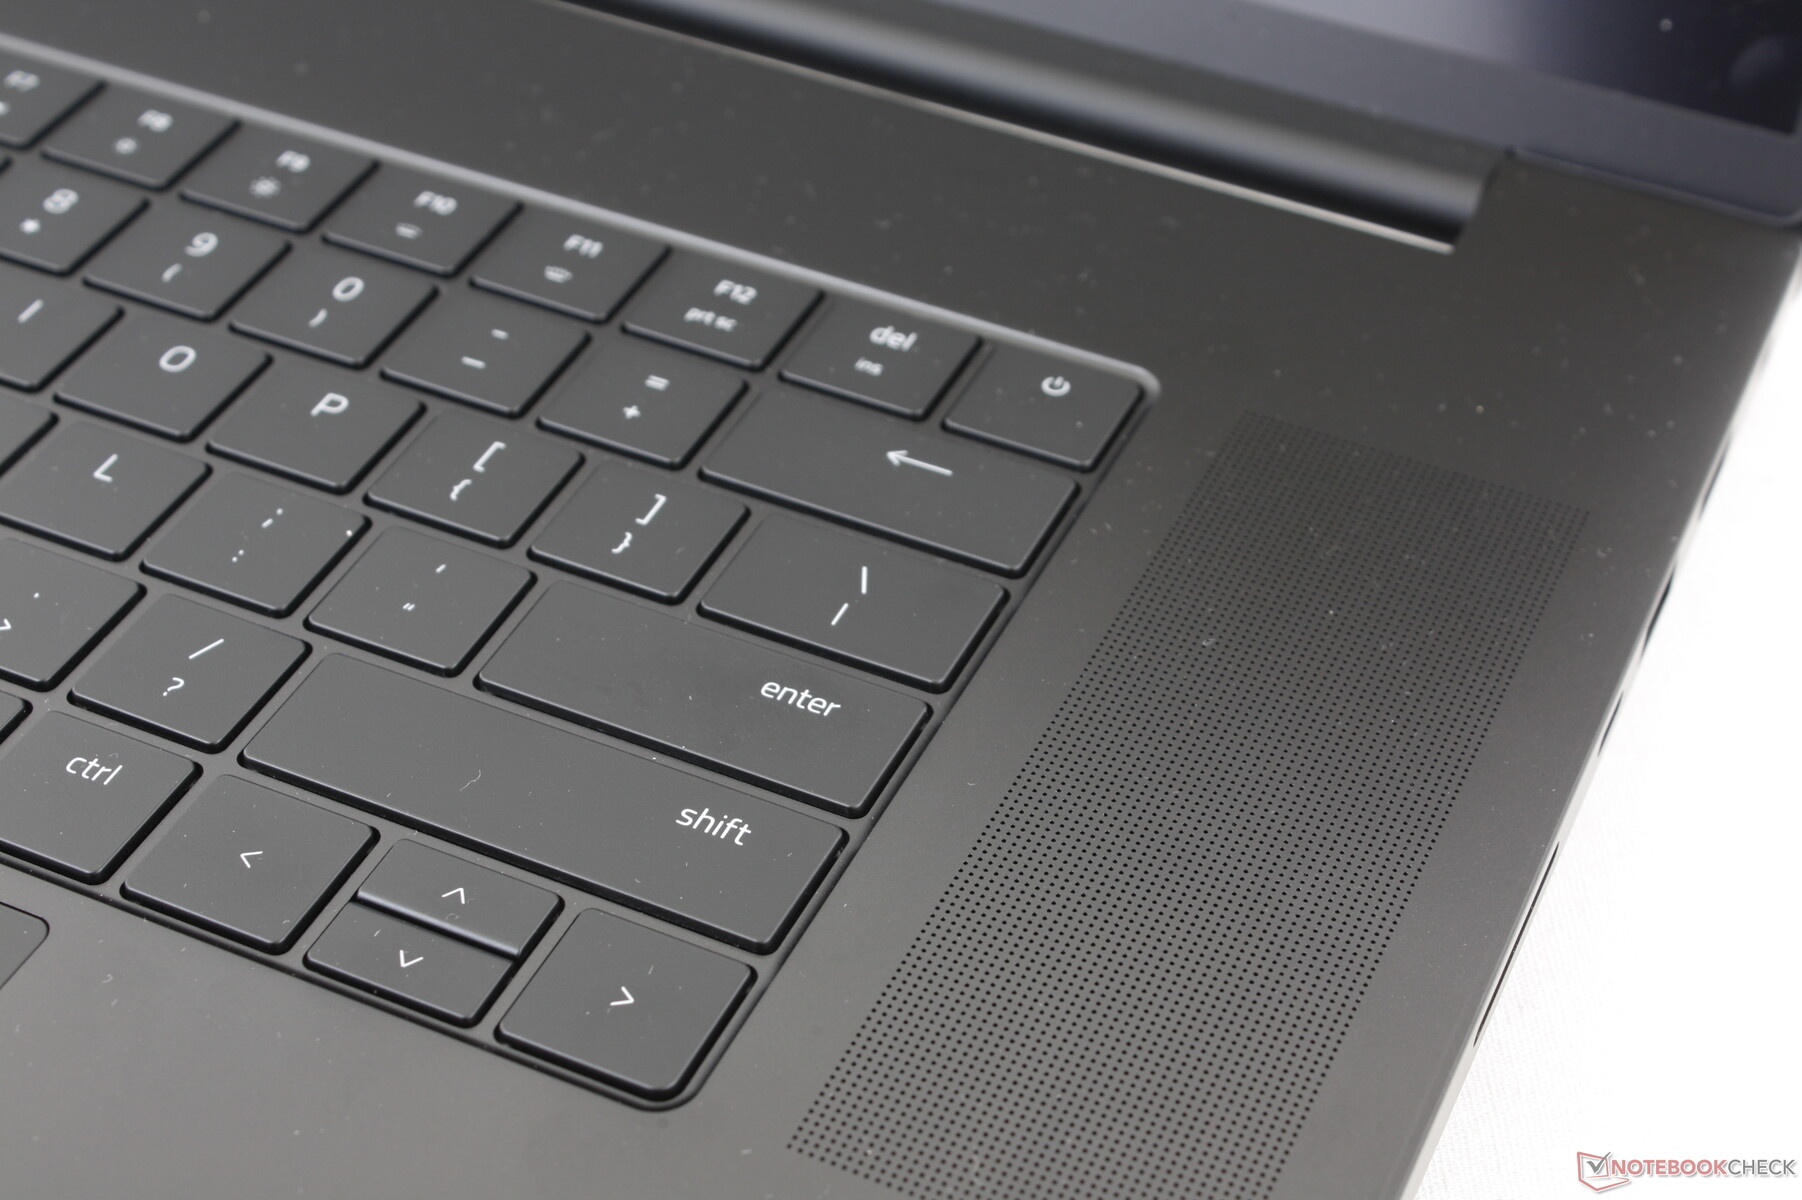
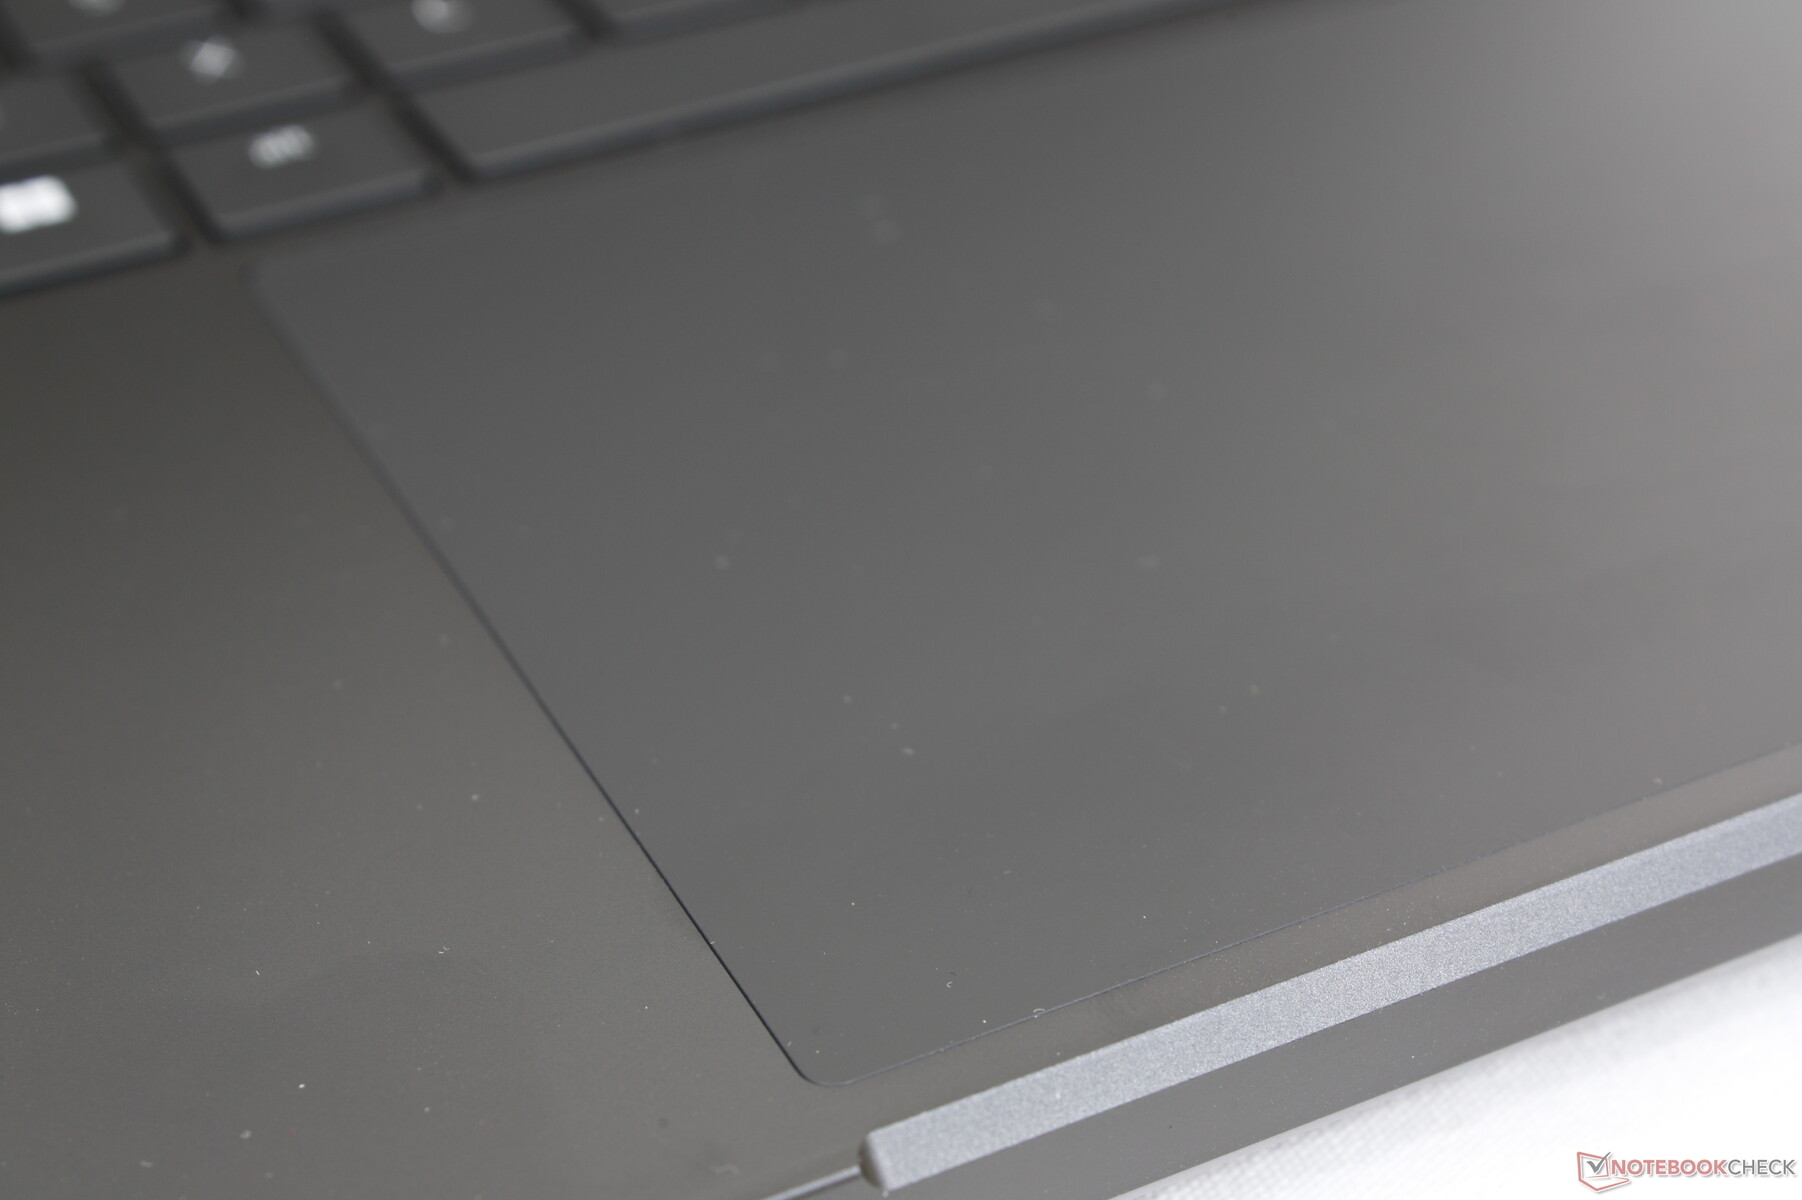
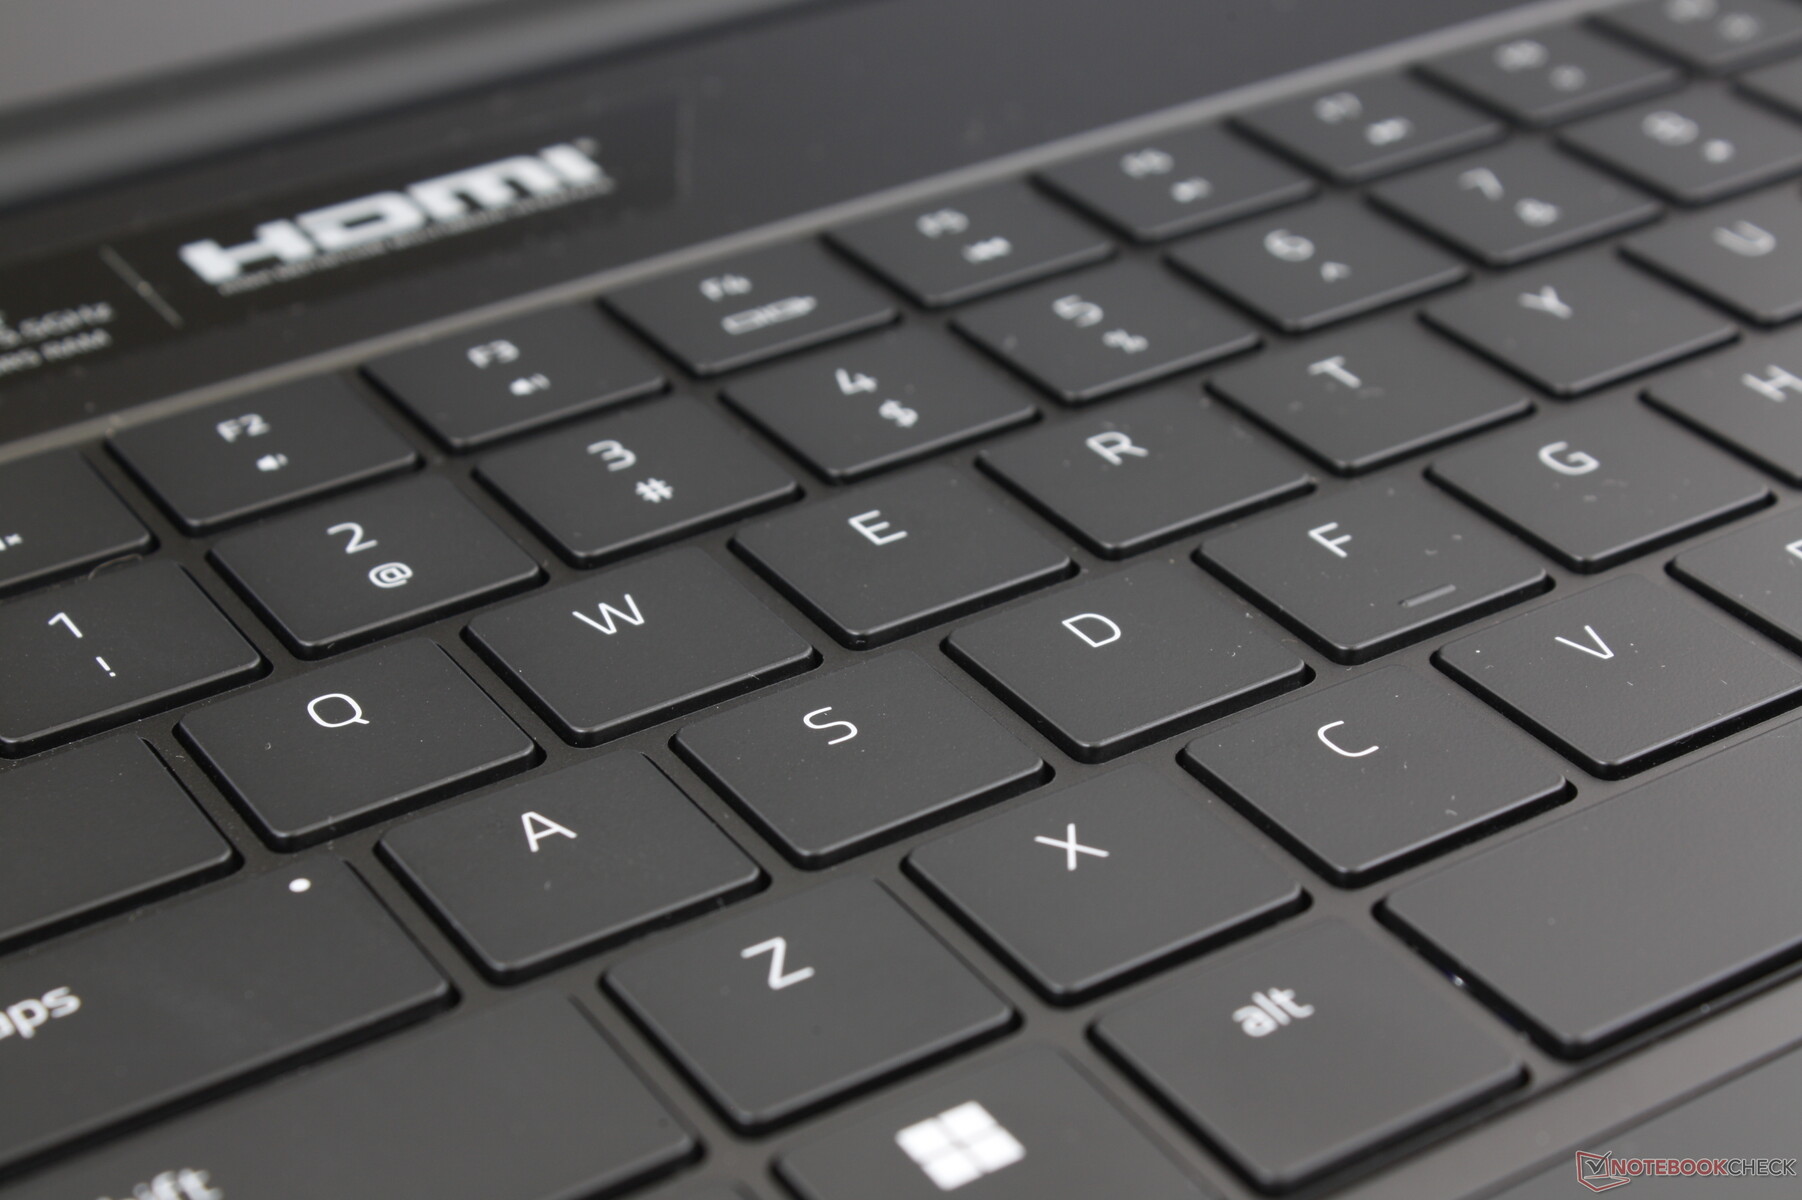
输入设备 - 与刀片16相同
键盘和触摸板
尽管两款机型的屏幕尺寸不同,但键盘和点击板都与Blade 16相同。甚至连点击板(17 x 9.7厘米)和键盘的尺寸都没有改变,因此我们的 现有评论所以我们对Blade 16打字体验的评论在Blade 18上也适用。太糟糕的是,Razer没有利用额外的表面积来设置更大的方向键或潜在的小键盘。
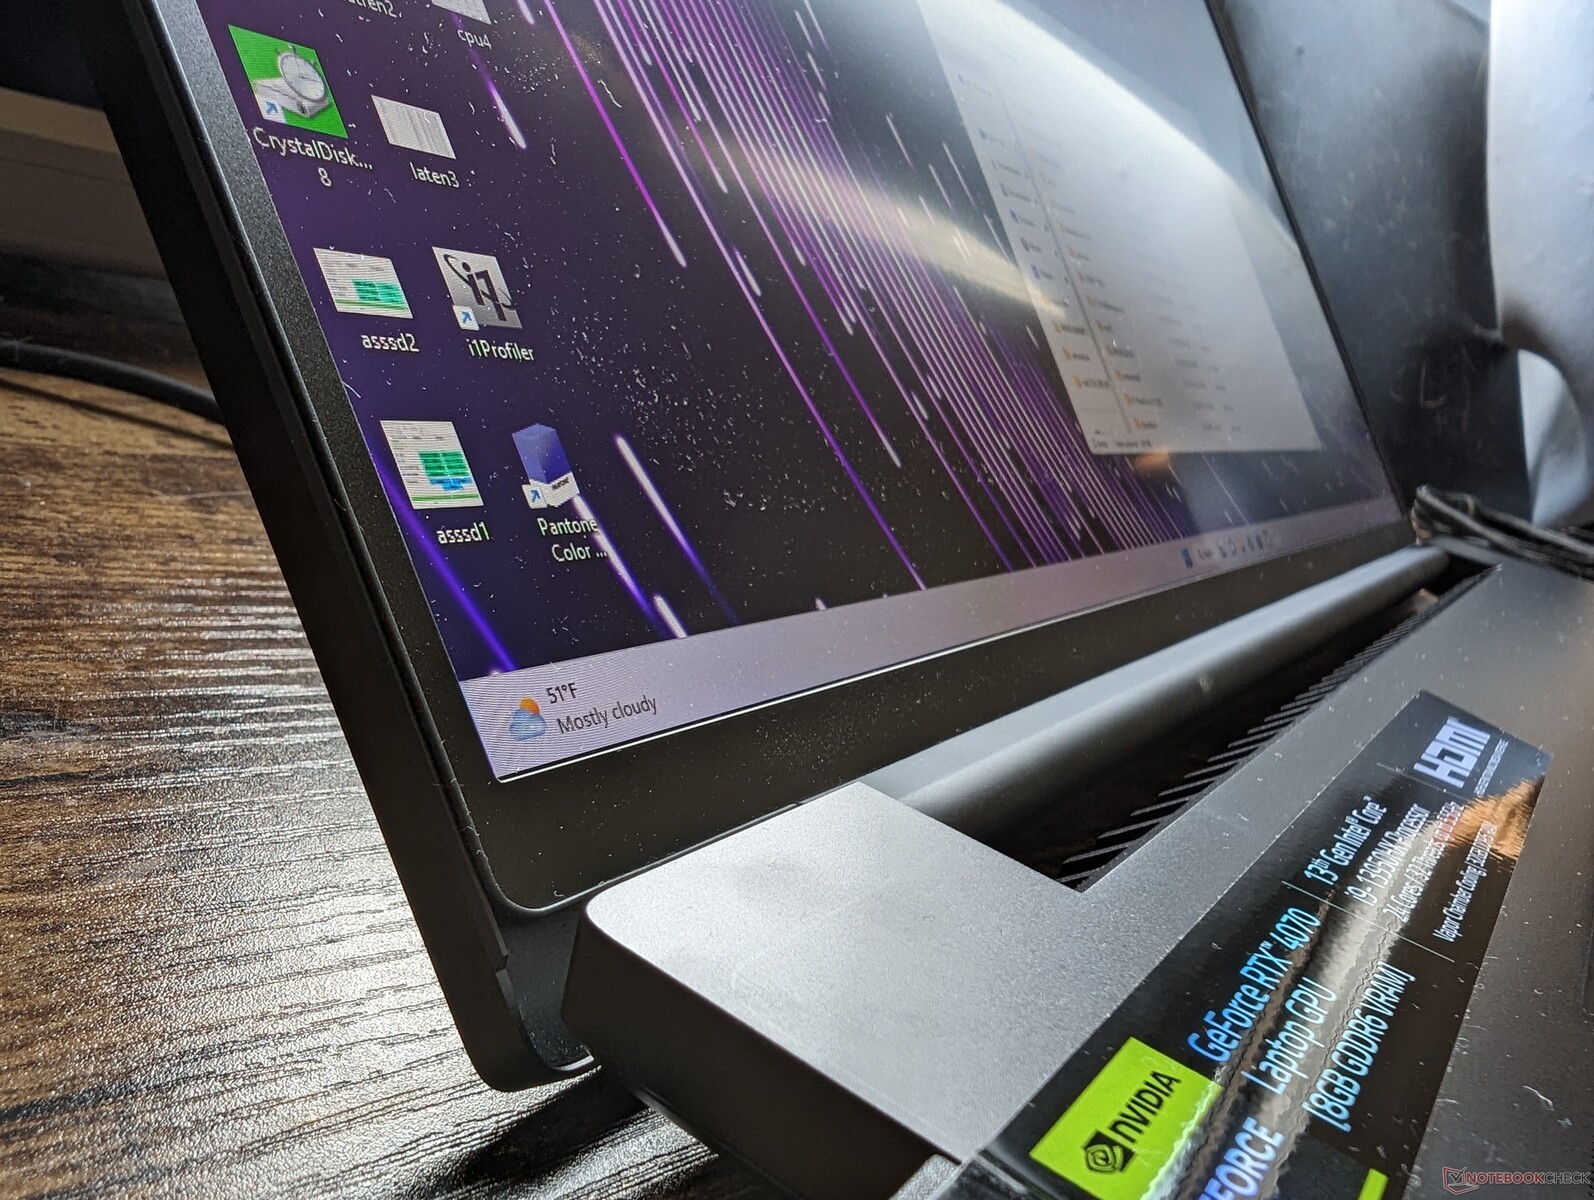
显示器 - 非常宽敞
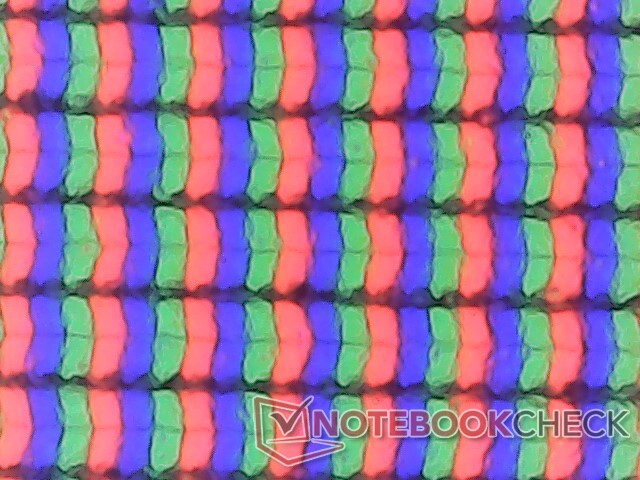
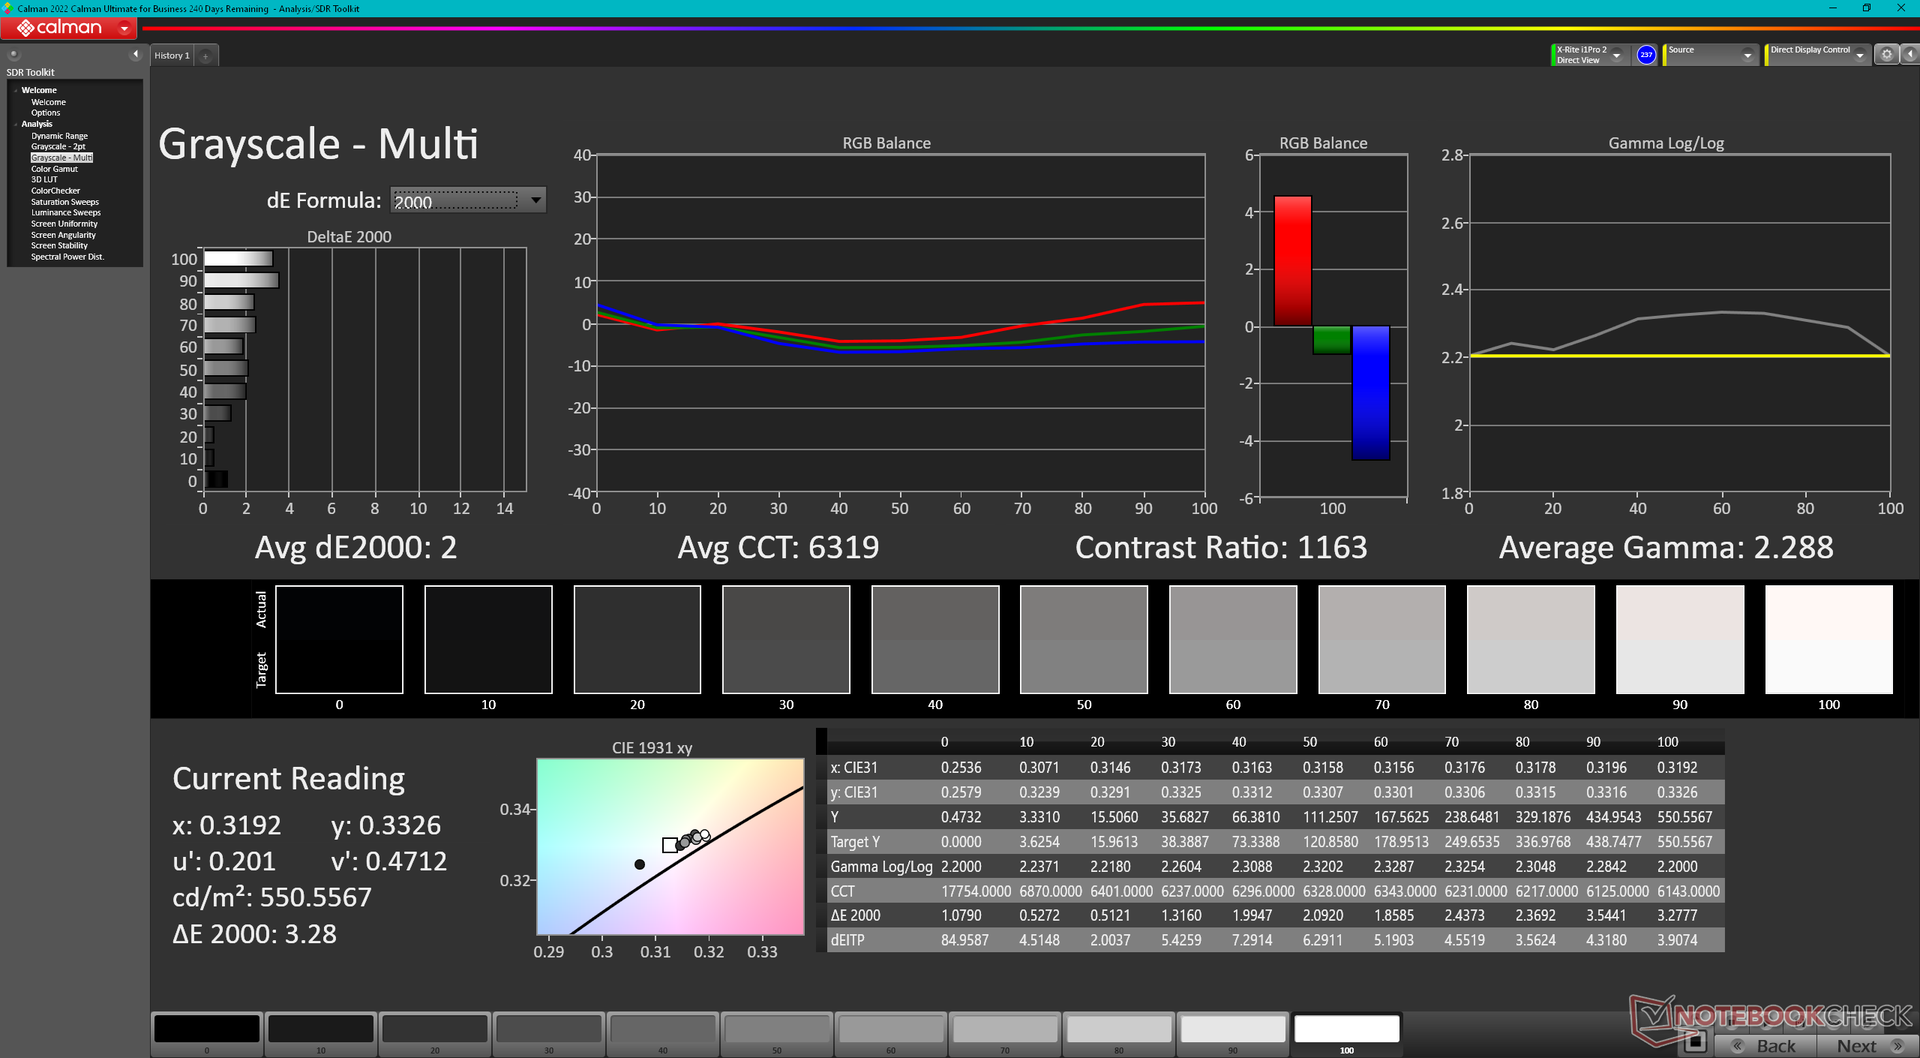
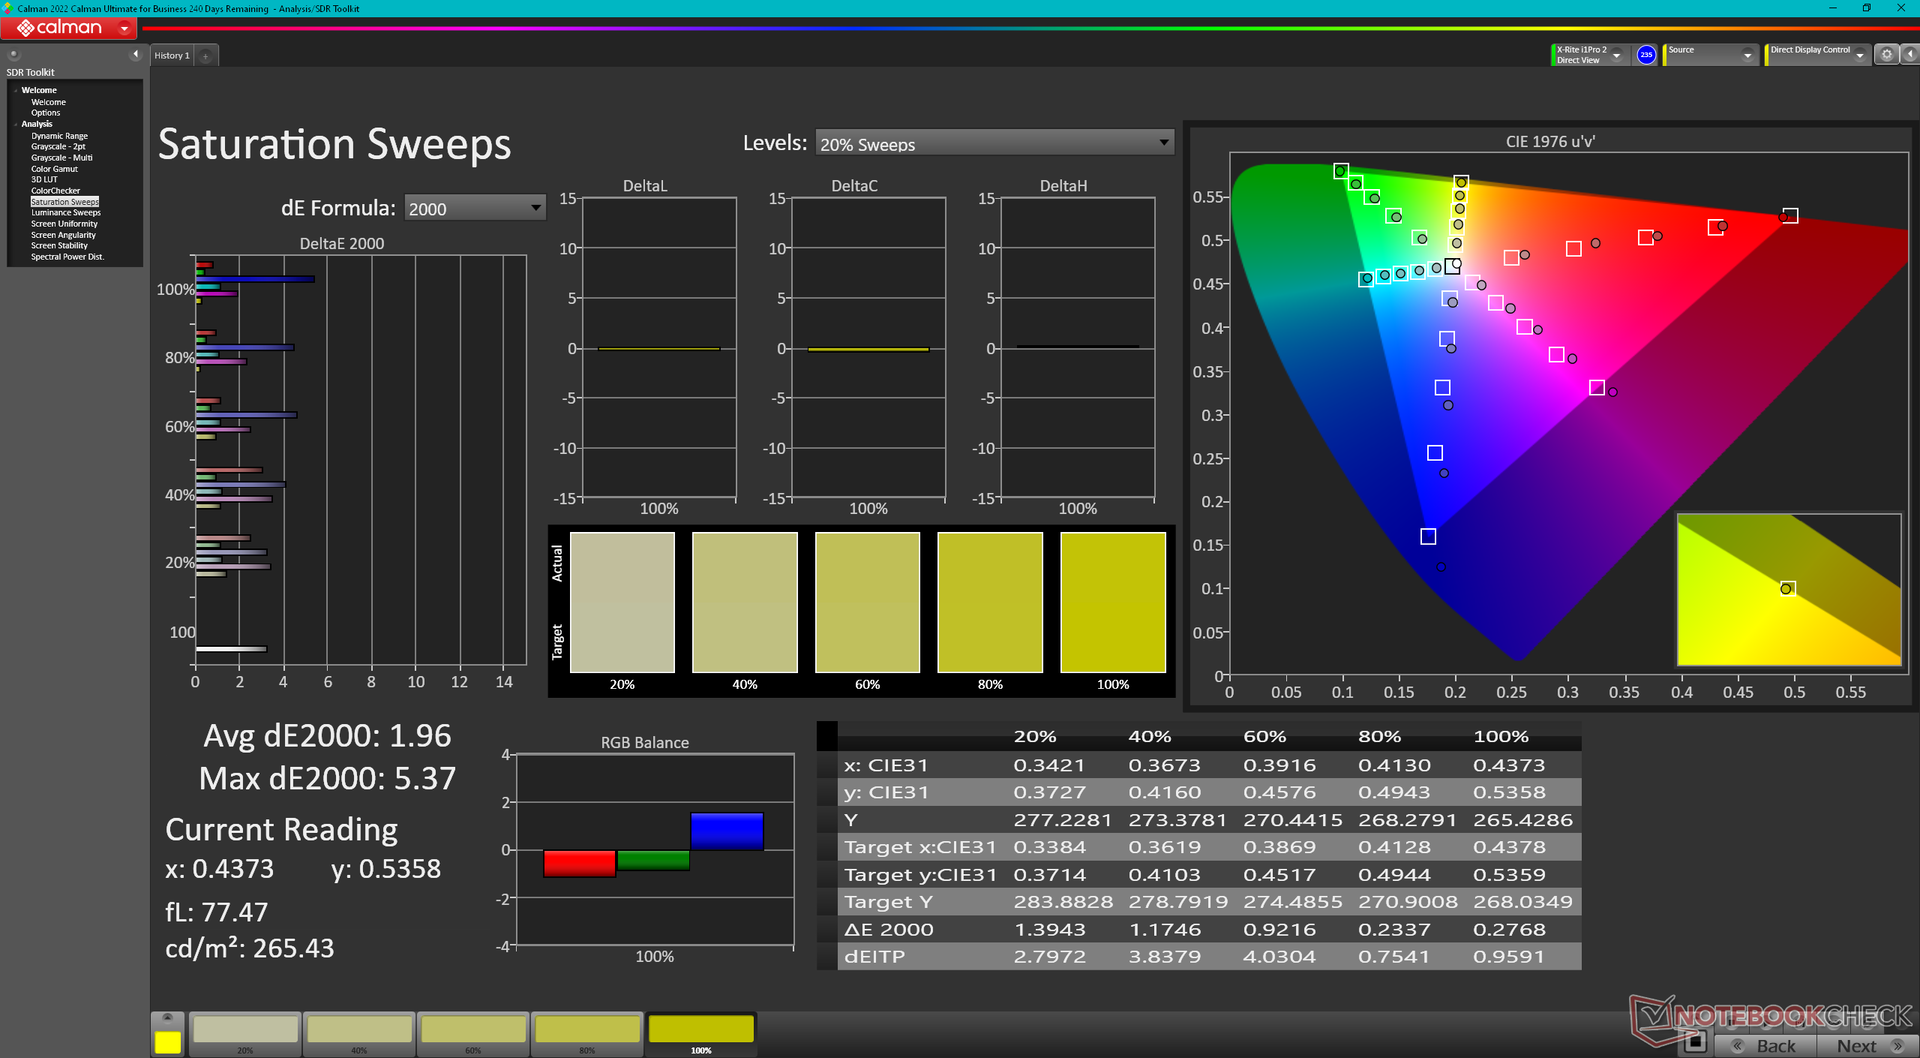
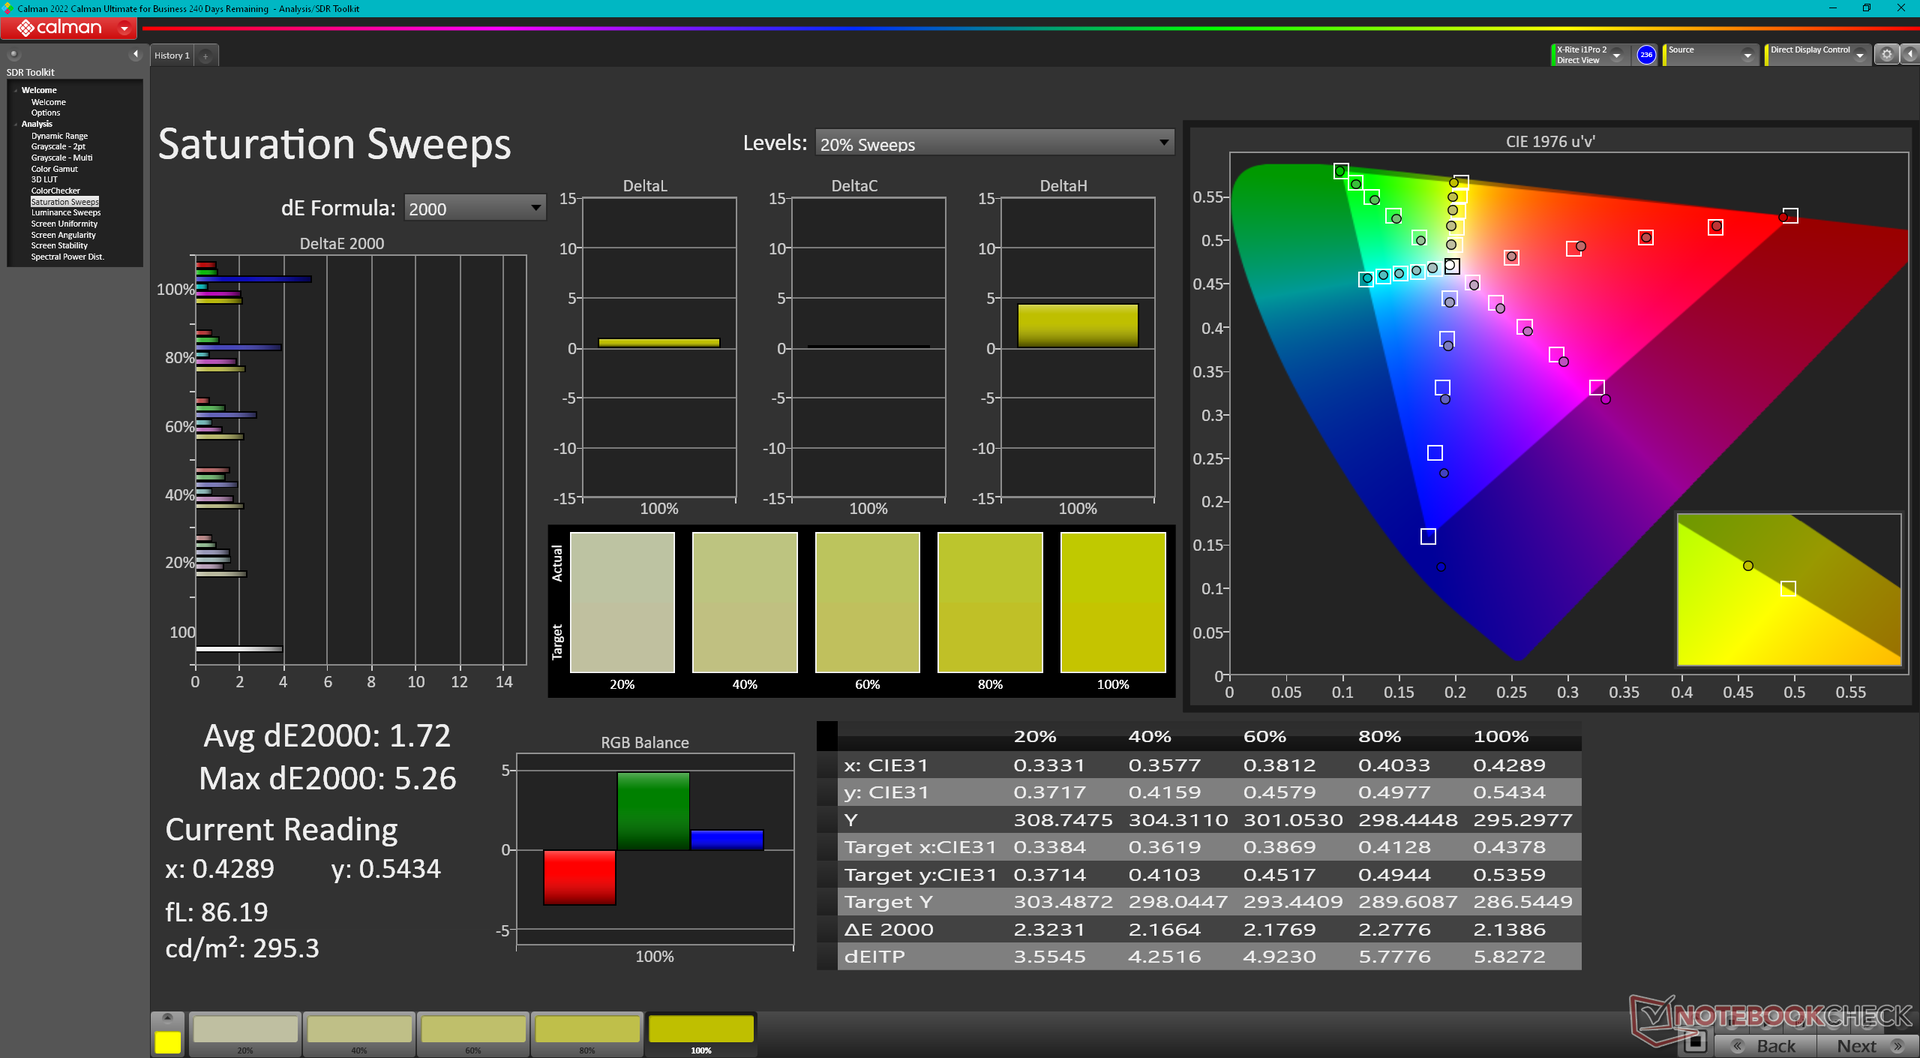
刀锋18在推出时没有第二个面板选项,可能是因为供应有限。事实上,18.0英寸的华硕ROG Strix Scar 18可能将使用与Blade 18相同的AU Optronics B180QAN01.0 IPS面板。也就是说,这仍然是一个高质量的面板,具有高端游戏笔记本电脑上常见的功能,包括快速的240赫兹原生刷新率,快速的3毫秒响应时间,完整的DCI-P3色彩覆盖,500尼特的亮度,以及工厂校准。我们用X-Rite色度计和示波器进行的独立测量已经证实了这些说法。
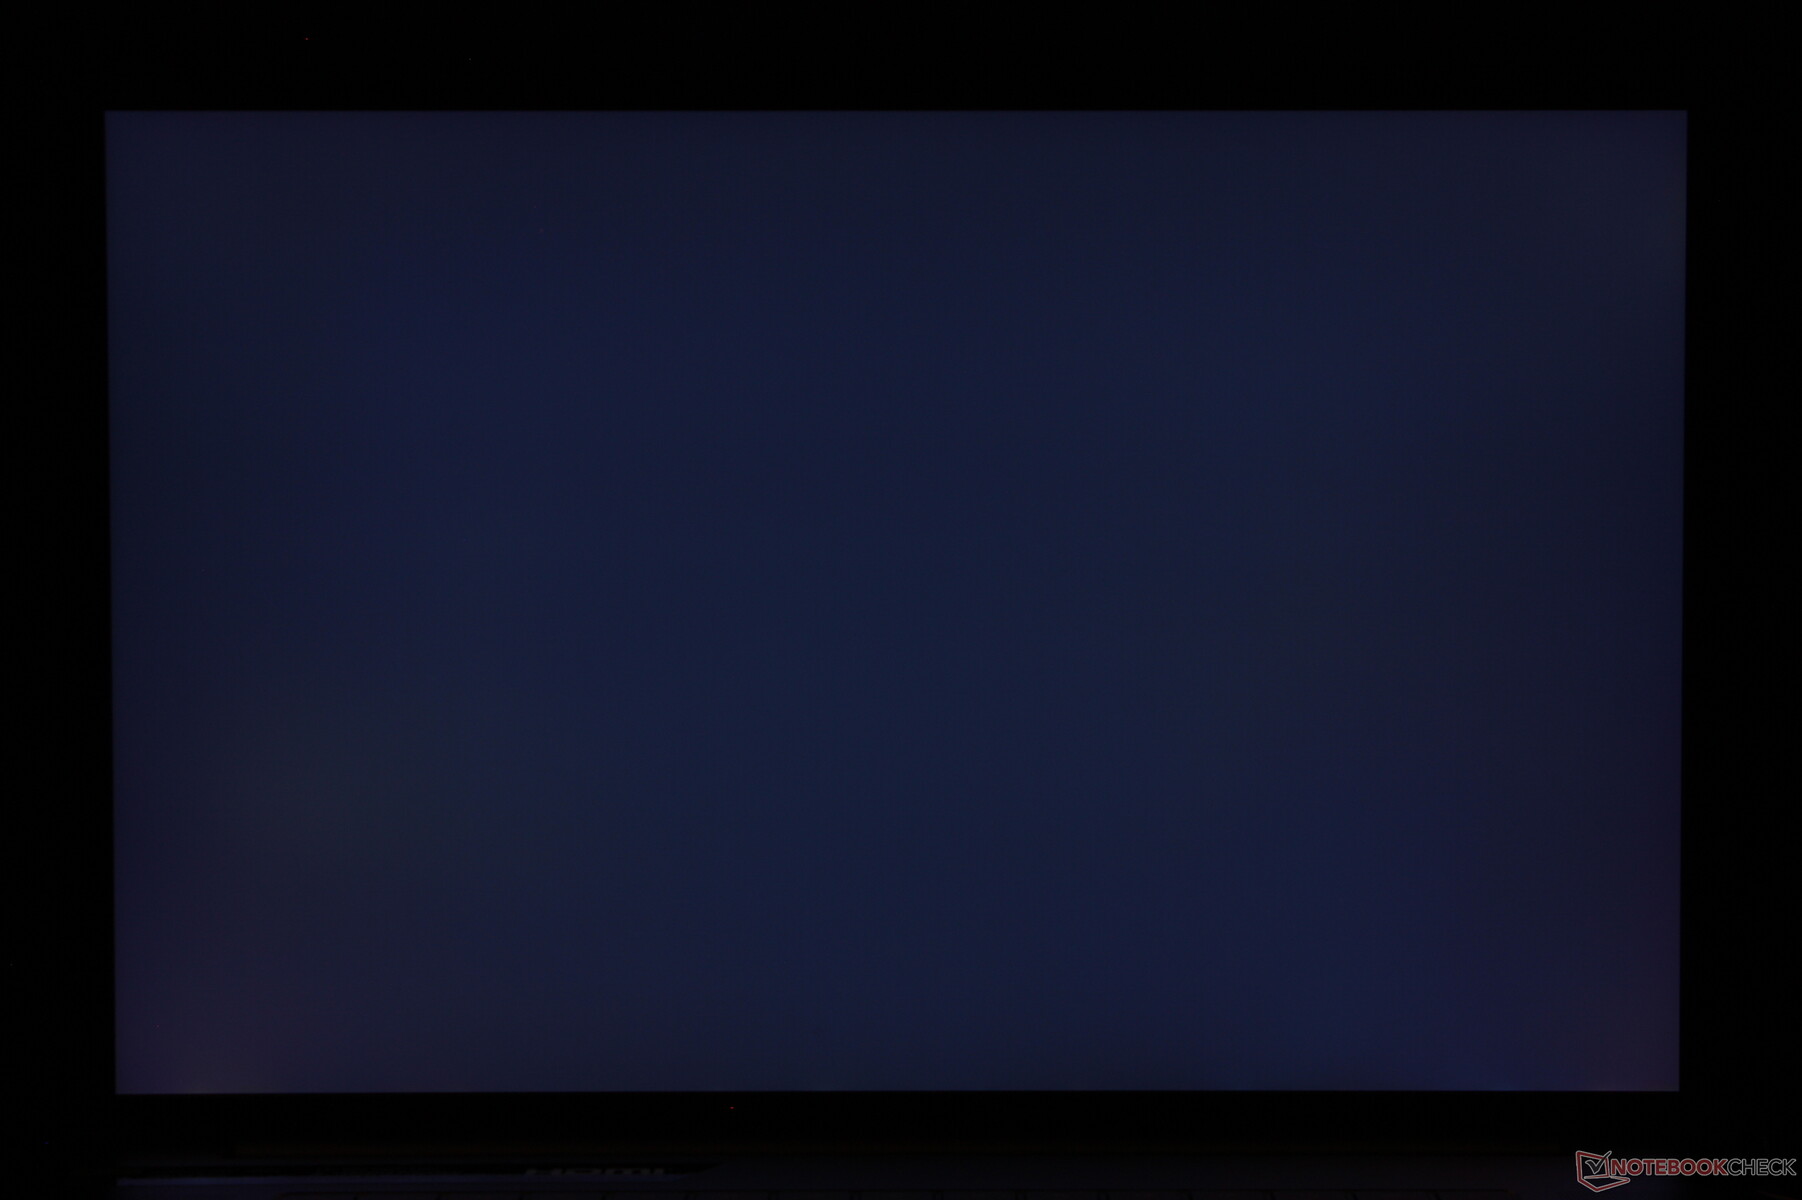
不幸的是,我们的测试装置上的显示器偶尔会在不同的亮度水平之间闪烁,似乎没有任何理由。这种闪烁与脉宽调制无关,因为该面板没有利用PWM进行亮度控制。这可能是屏幕的故障,但我们还不能确认它是软件还是硬件问题。据称,,一些已经购买刀片18的消费者已经购买了Blade 18的消费者也遇到了类似的闪烁问题。一旦我们得到Razer的官方消息,本节将被更新。
| |||||||||||||||||||||||||
Brightness Distribution: 89 %
Center on Battery: 549.6 cd/m²
Contrast: 1037:1 (Black: 0.53 cd/m²)
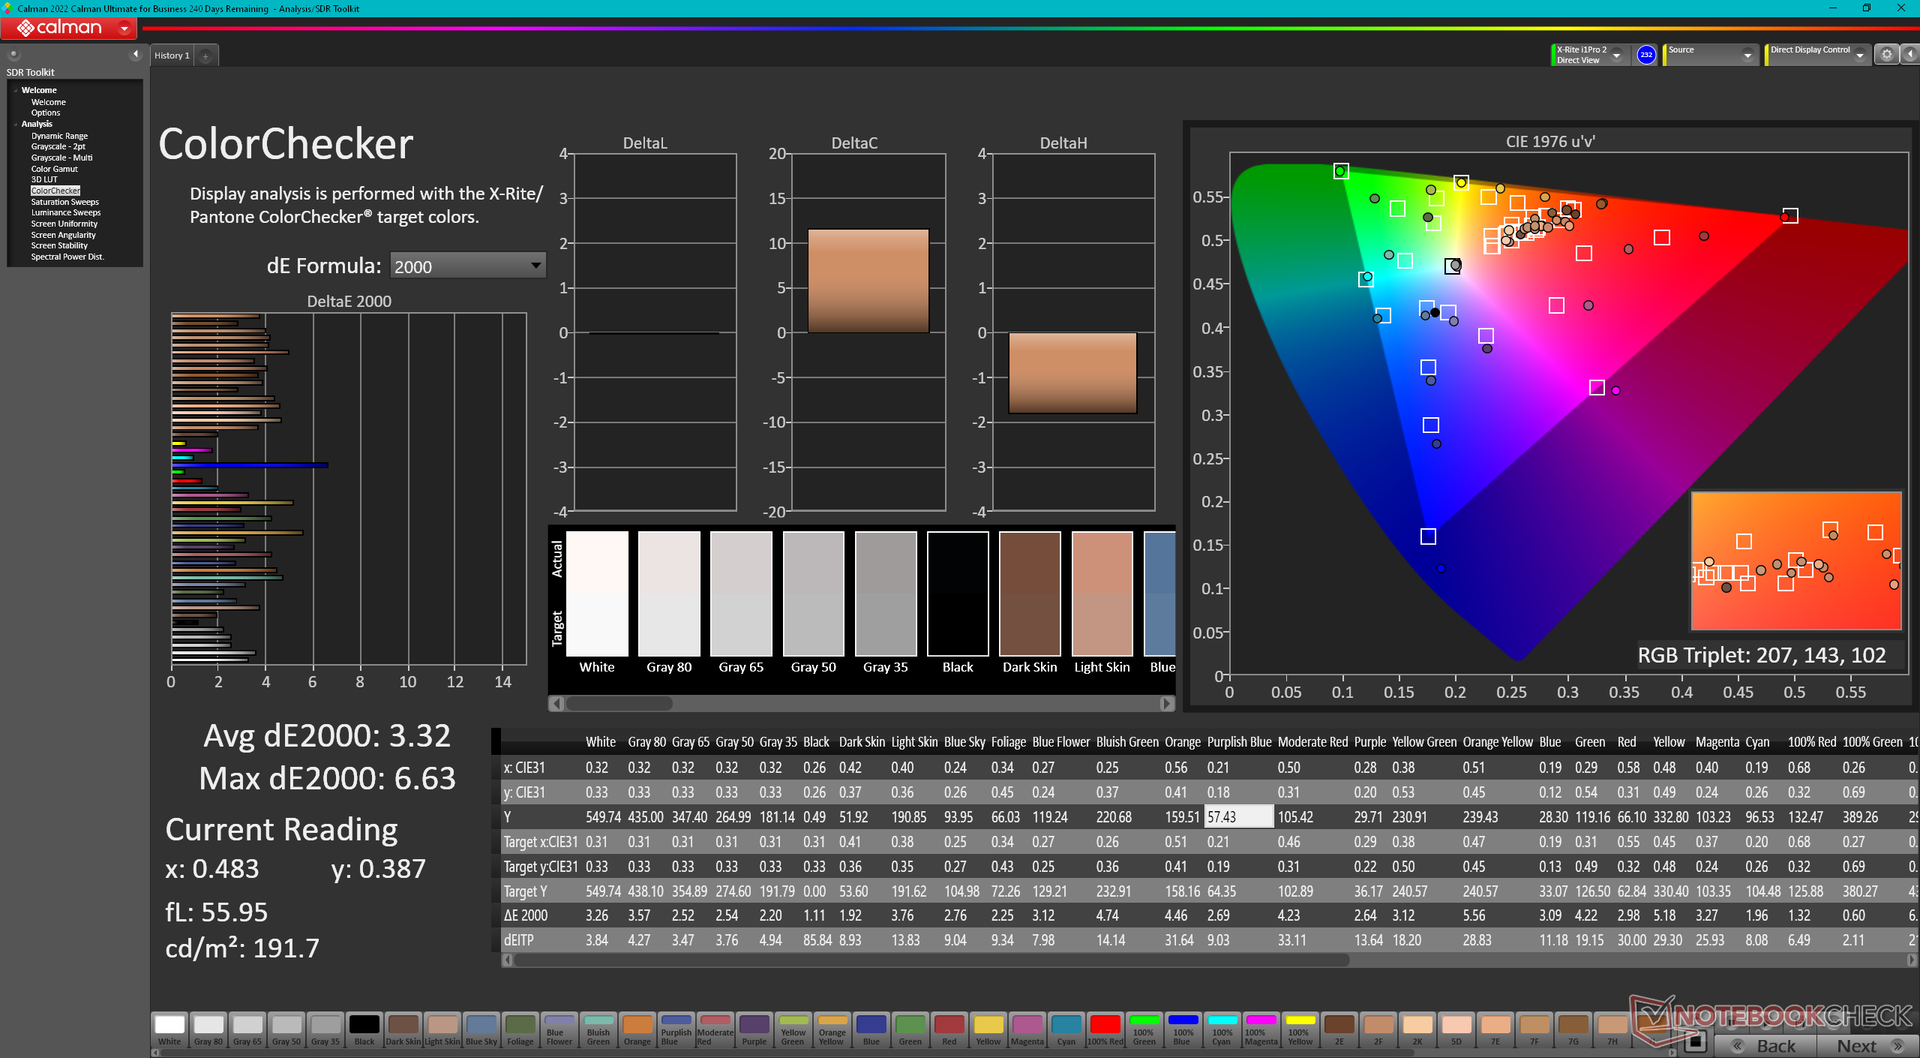
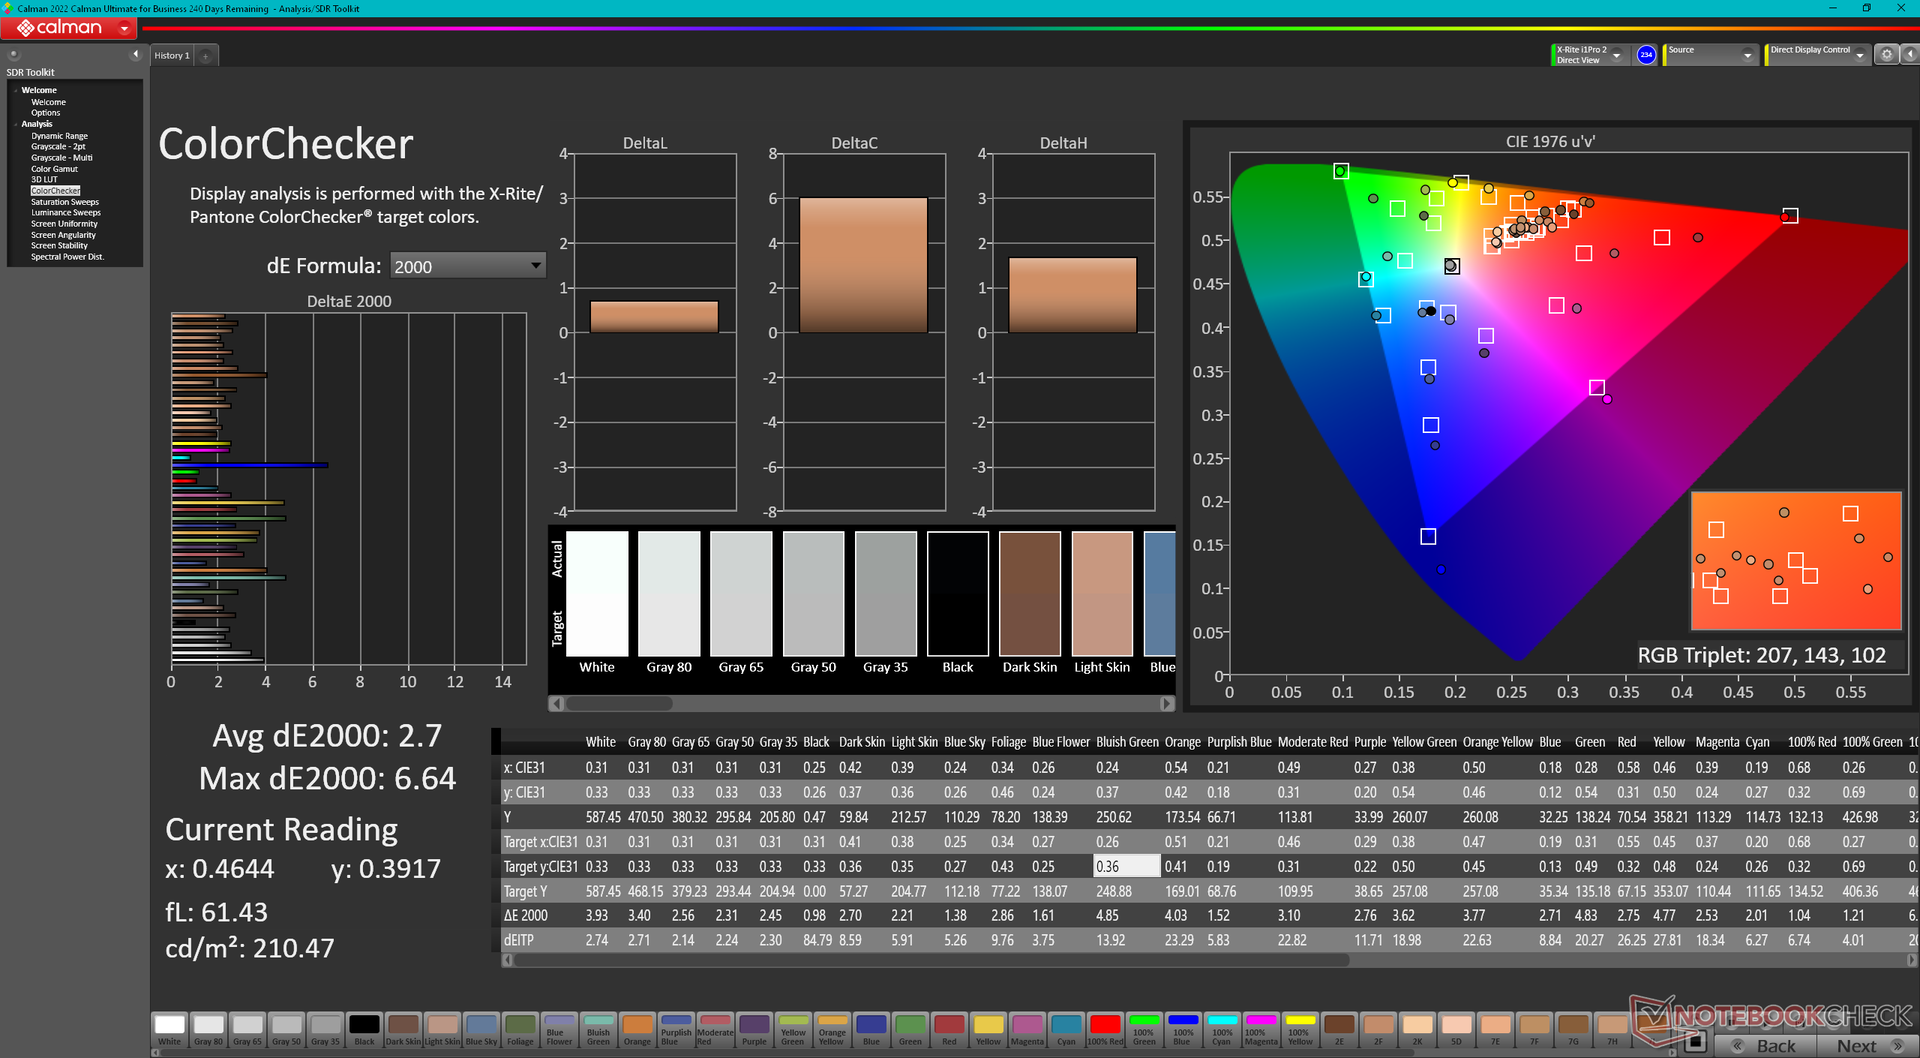
ΔE ColorChecker Calman: 3.32 | ∀{0.5-29.43 Ø4.71}
calibrated: 2.7
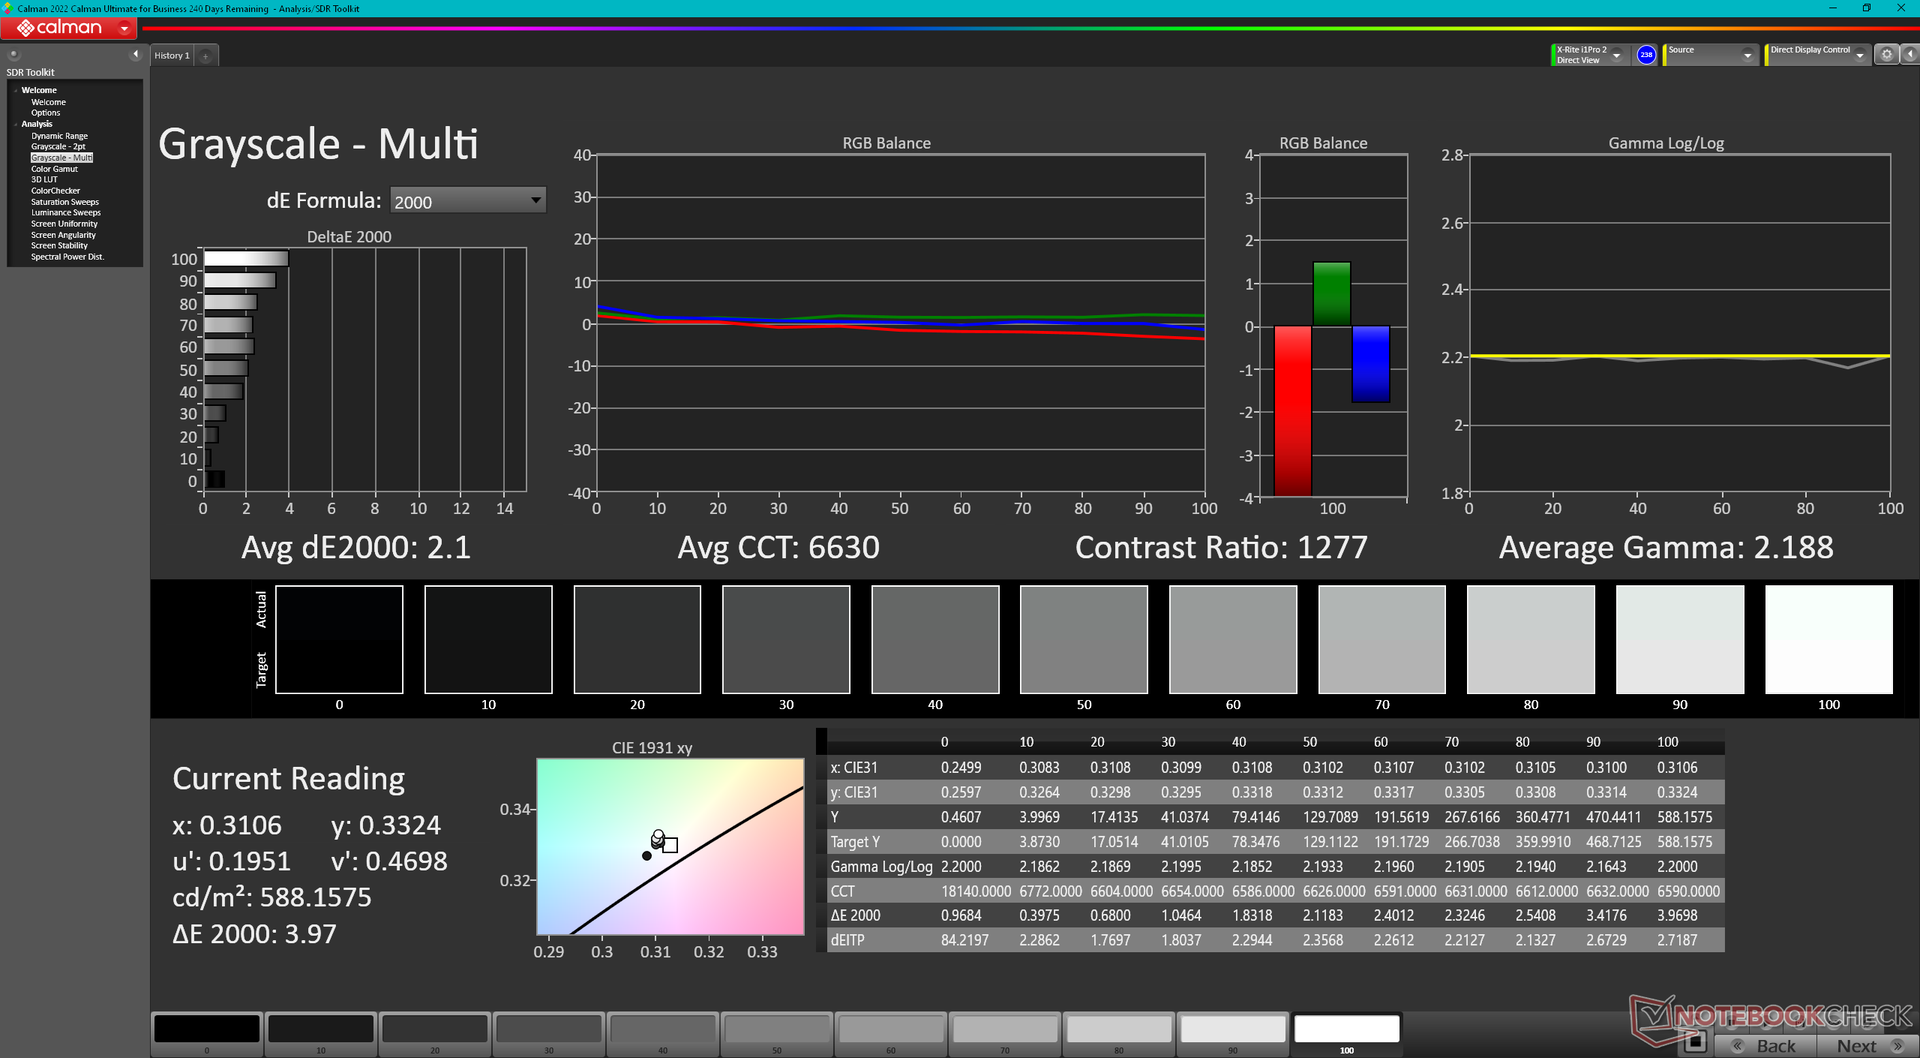
ΔE Greyscale Calman: 2 | ∀{0.09-98 Ø4.96}
85.3% AdobeRGB 1998 (Argyll 3D)
99.8% sRGB (Argyll 3D)
96.9% Display P3 (Argyll 3D)
Gamma: 2.29
CCT: 6319 K
| Razer Blade 18 RTX 4070 AU Optronics B180QAN01.0, IPS, 2560x1600, 18" | Razer Blade 17 Early 2022 AU Optronics B173ZAN06.9, IPS, 3840x2160, 17.3" | MSI Titan GT77 HX 13VI B173ZAN06.C, Mini-LED, 3840x2160, 17.3" | Gigabyte G7 KE AU Optronics B173HAN05.1, IPS, 1920x1080, 17.3" | Alienware m17 R5 (R9 6900HX, RX 6850M XT) AU Optronics AUODBA3, IPS, 3840x2160, 17" | Asus ROG Strix Scar 17 SE G733CX-LL014W NE173QHM-NZ2, IPS, 2560x1440, 17.3" | |
|---|---|---|---|---|---|---|
| Display | 2% | 2% | -14% | 1% | -0% | |
| Display P3 Coverage (%) | 96.9 | 99.4 3% | 94.9 -2% | 70.4 -27% | 97.2 0% | 97.1 0% |
| sRGB Coverage (%) | 99.8 | 100 0% | 99.9 0% | 99.8 0% | 99.6 0% | 99.9 0% |
| AdobeRGB 1998 Coverage (%) | 85.3 | 87.3 2% | 92.4 8% | 71.7 -16% | 88.4 4% | 84.8 -1% |
| Response Times | -25% | -524% | -12% | -168% | -31% | |
| Response Time Grey 50% / Grey 80% * (ms) | 4.2 ? | 7.5 ? -79% | 38.4 ? -814% | 5 ? -19% | 16.4 ? -290% | 5.7 ? -36% |
| Response Time Black / White * (ms) | 8 ? | 5.6 ? 30% | 26.6 ? -233% | 8.3 ? -4% | 11.6 ? -45% | 10.1 ? -26% |
| PWM Frequency (Hz) | 2380 ? | |||||
| Screen | 24% | 64905% | 19% | -40% | 16% | |
| Brightness middle (cd/m²) | 549.6 | 503 -8% | 606 10% | 307 -44% | 484 -12% | 320 -42% |
| Brightness (cd/m²) | 524 | 486 -7% | 602 15% | 301 -43% | 449 -14% | 303 -42% |
| Brightness Distribution (%) | 89 | 84 -6% | 93 4% | 93 4% | 87 -2% | 87 -2% |
| Black Level * (cd/m²) | 0.53 | 0.44 17% | 0.0001 100% | 0.2 62% | 0.55 -4% | 0.3 43% |
| Contrast (:1) | 1037 | 1143 10% | 6060000 584278% | 1535 48% | 880 -15% | 1067 3% |
| Colorchecker dE 2000 * | 3.32 | 1.08 67% | 4.8 -45% | 1.32 60% | 4.8 -45% | 1.1 67% |
| Colorchecker dE 2000 max. * | 6.63 | 4.54 32% | 8.2 -24% | 4.6 31% | 7.48 -13% | 2.7 59% |
| Colorchecker dE 2000 calibrated * | 2.7 | 0.6 78% | 1.8 33% | 1.03 62% | 4.74 -76% | |
| Greyscale dE 2000 * | 2 | 1.3 35% | 6.5 -225% | 2.1 -5% | 5.5 -175% | 1.1 45% |
| Gamma | 2.29 96% | 2.151 102% | 2.63 84% | 2.247 98% | 2.42 91% | 2.13 103% |
| CCT | 6319 103% | 6541 99% | 6596 99% | 6815 95% | 6148 106% | 6599 98% |
| Total Average (Program / Settings) | 0% /
12% | 21461% /
41650% | -2% /
8% | -69% /
-49% | -5% /
5% |
* ... smaller is better
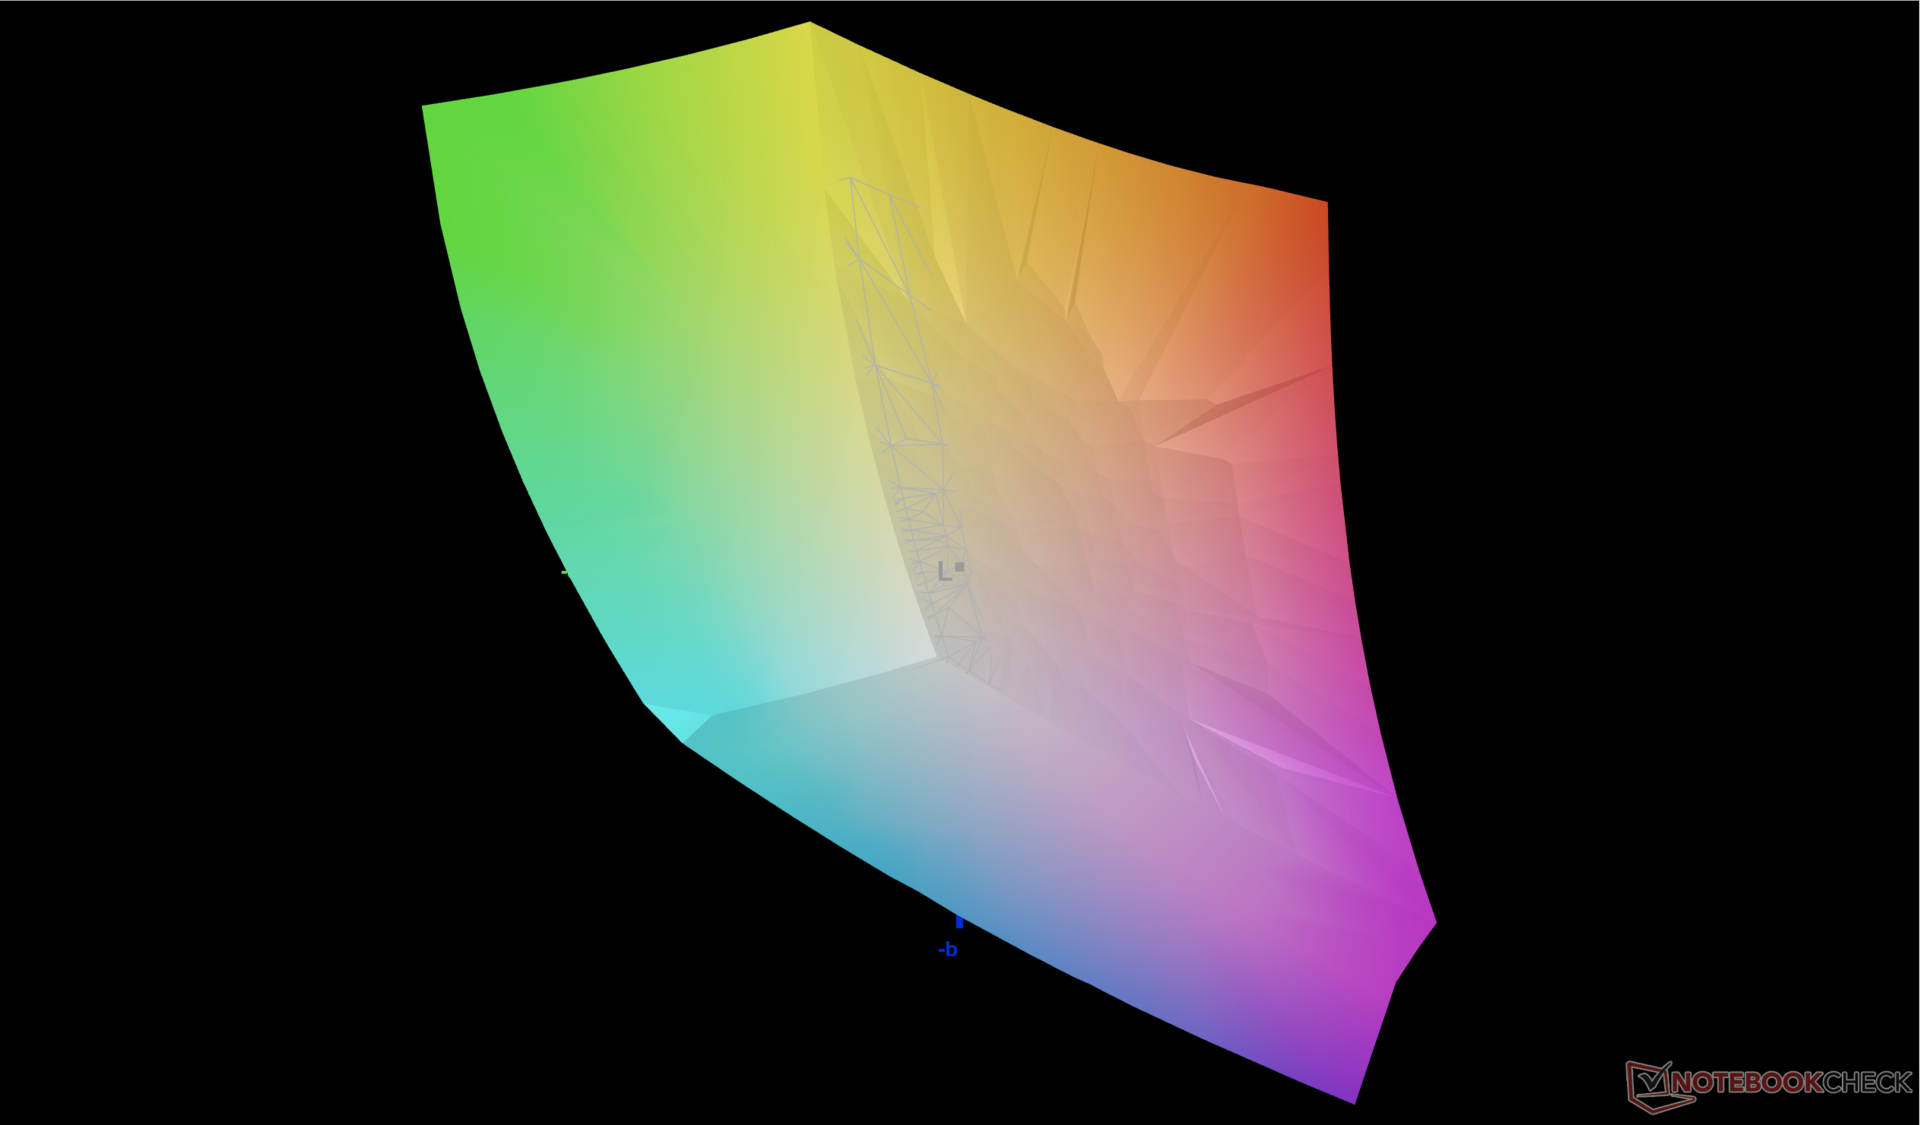
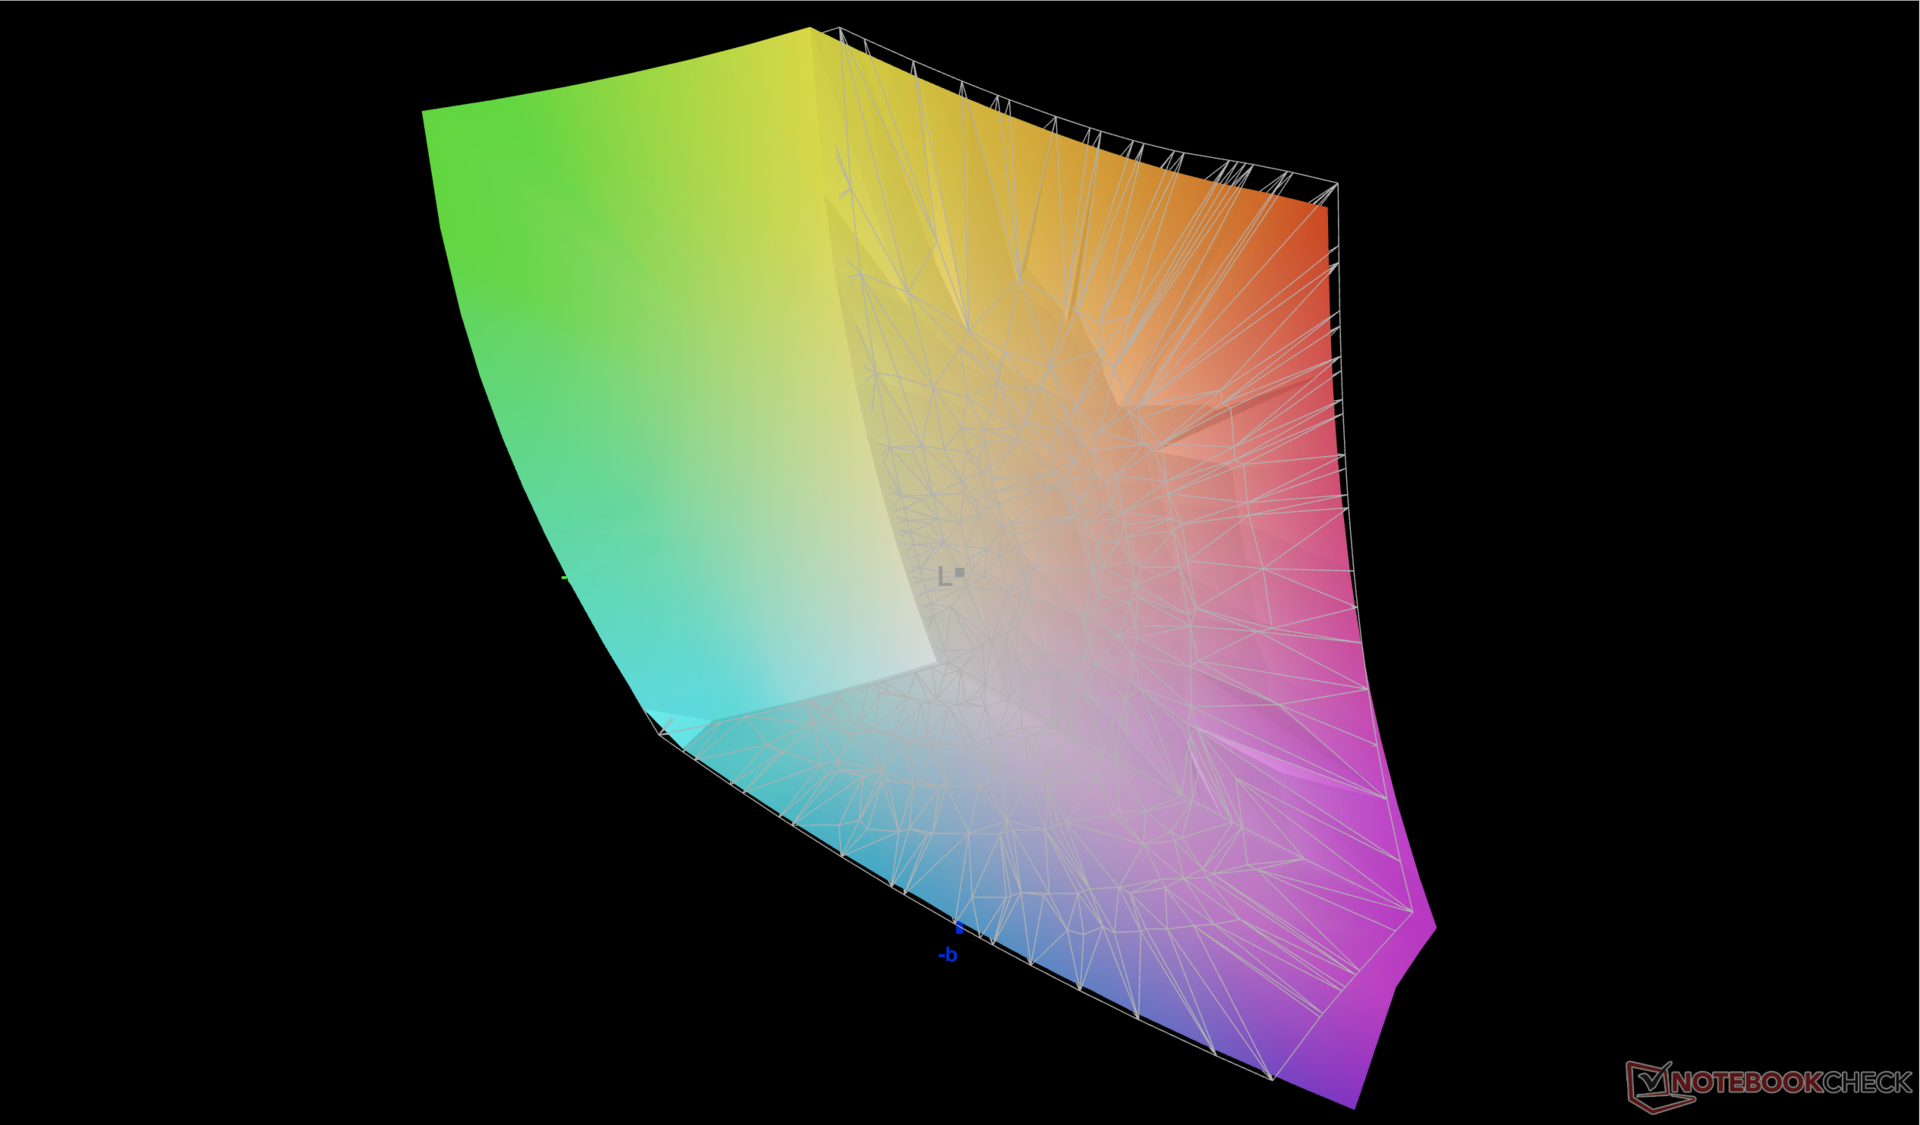
平均灰度和彩色deltaE值分别只有2.0和3.32,因为该面板是根据P3标准预先校准的。试图自己进一步校准面板不会使颜色有明显的改善。然而,蓝色似乎比任何其他原色或次要颜色表现得更不准确。
Display Response Times
| ↔ Response Time Black to White | ||
|---|---|---|
| 8 ms ... rise ↗ and fall ↘ combined | ↗ 3.8 ms rise | 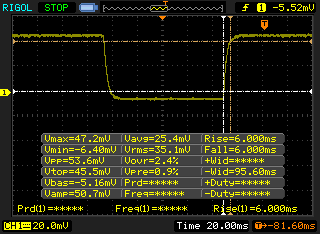 |
| ↘ 4.2 ms fall | ||
| The screen shows fast response rates in our tests and should be suited for gaming. In comparison, all tested devices range from 0.1 (minimum) to 240 (maximum) ms. » 22 % of all devices are better. This means that the measured response time is better than the average of all tested devices (19.8 ms). | ||
| ↔ Response Time 50% Grey to 80% Grey | ||
| 4.2 ms ... rise ↗ and fall ↘ combined | ↗ 2.1 ms rise | 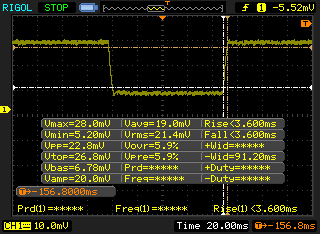 |
| ↘ 2.1 ms fall | ||
| The screen shows very fast response rates in our tests and should be very well suited for fast-paced gaming. In comparison, all tested devices range from 0.165 (minimum) to 636 (maximum) ms. » 16 % of all devices are better. This means that the measured response time is better than the average of all tested devices (31 ms). | ||
Screen Flickering / PWM (Pulse-Width Modulation)
| Screen flickering / PWM not detected | 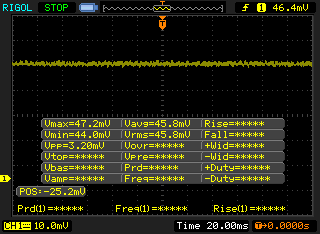 | ||
In comparison: 52 % of all tested devices do not use PWM to dim the display. If PWM was detected, an average of 7754 (minimum: 5 - maximum: 343500) Hz was measured. | |||
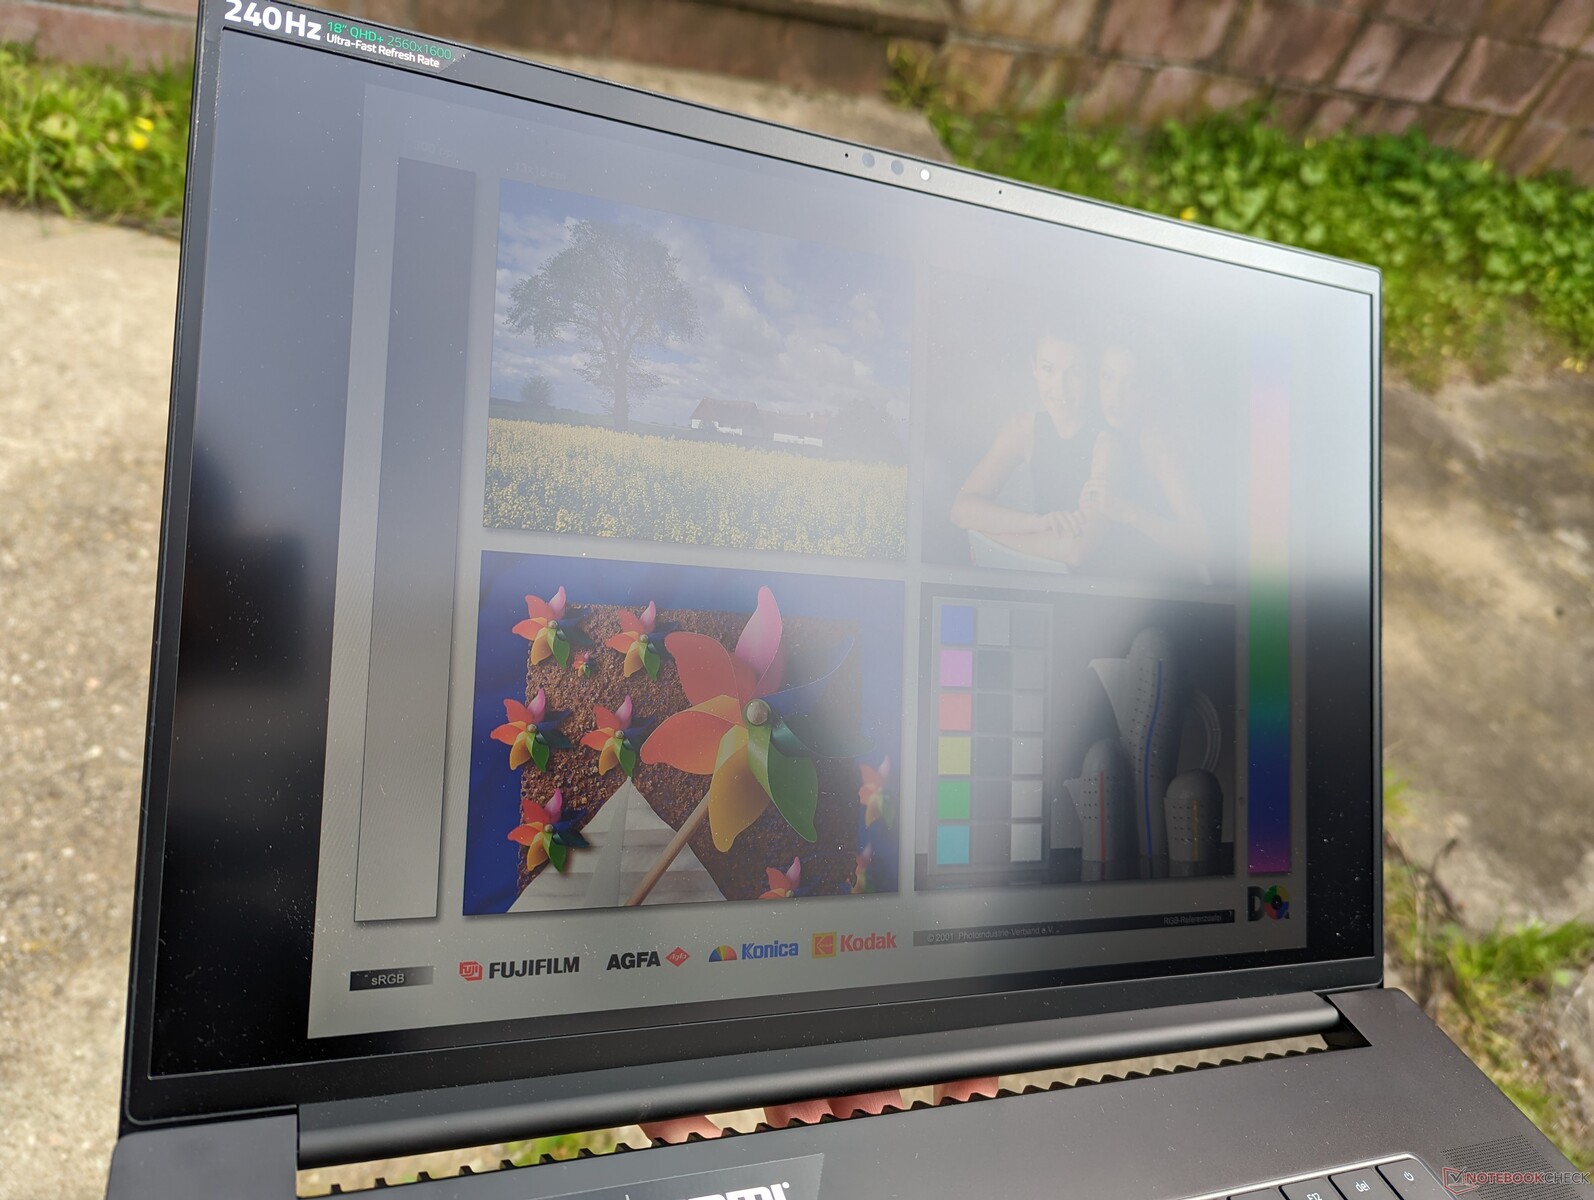
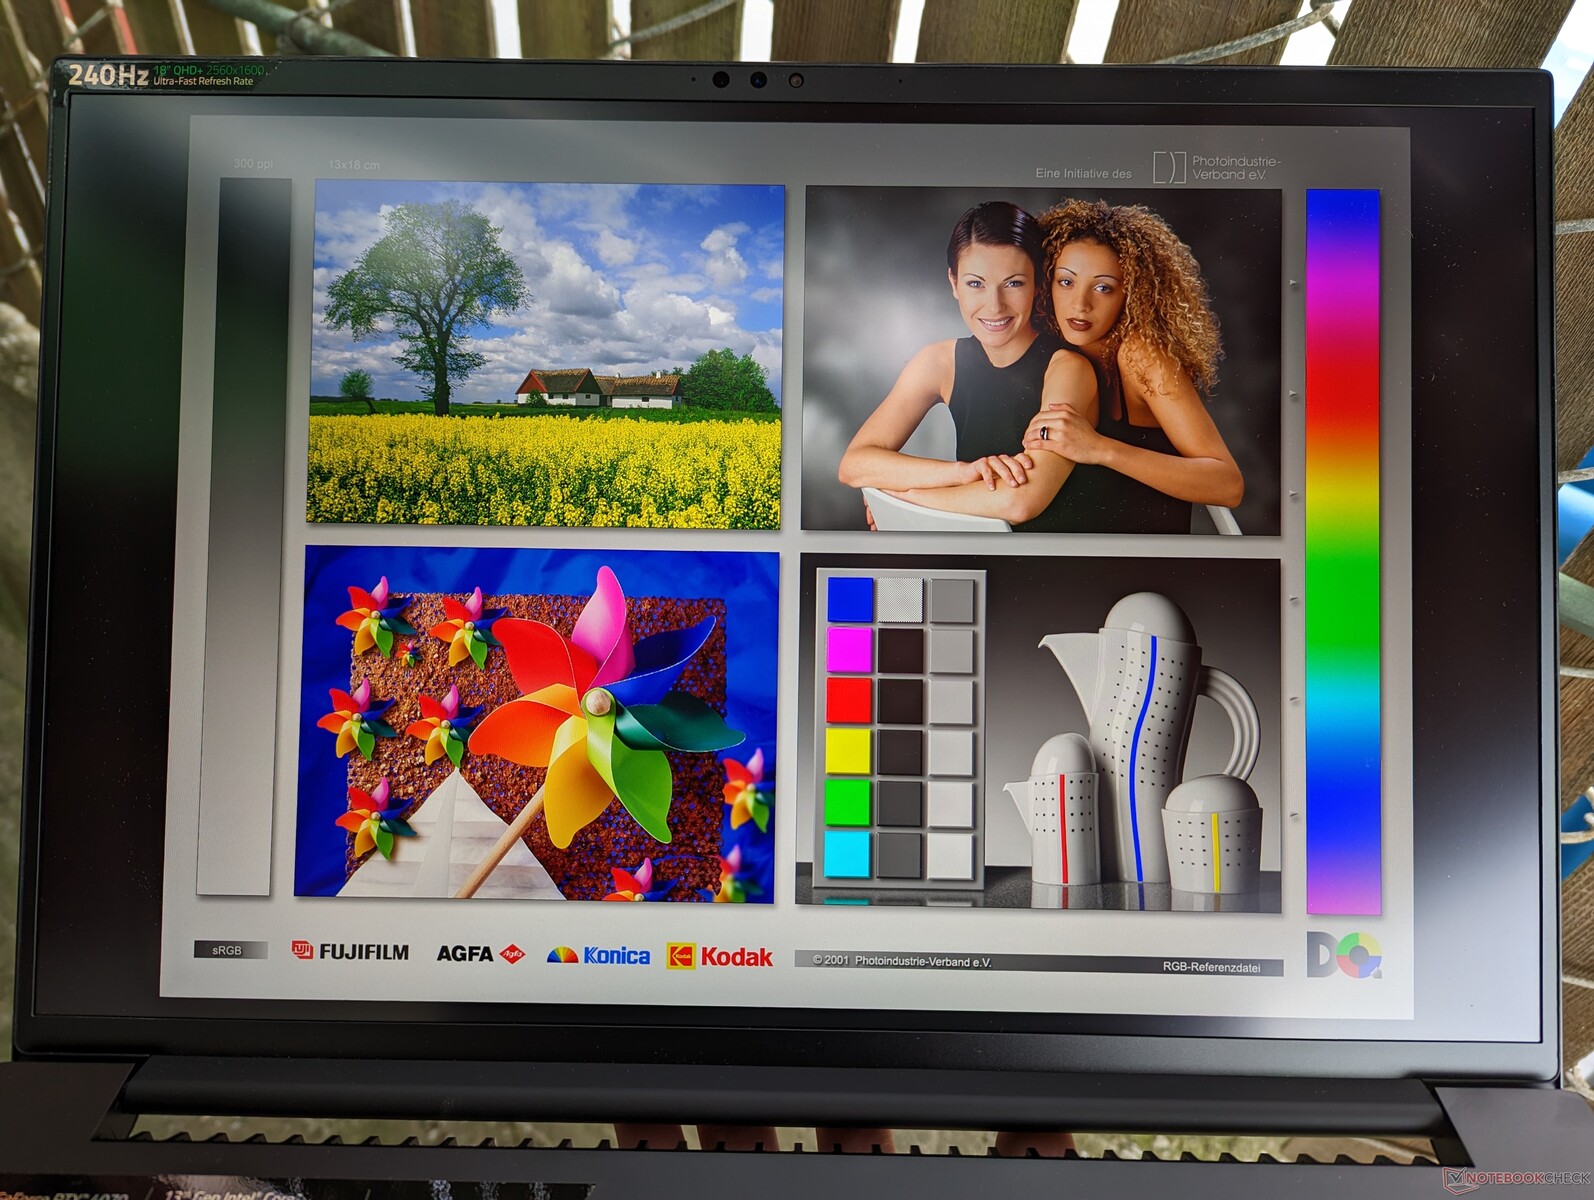
室外能见度与Blade 17相似,因为它们的显示屏都以500尼特的最大值为目标。为了获得最佳色彩并尽可能减少眩光,始终建议使用阴凉处。

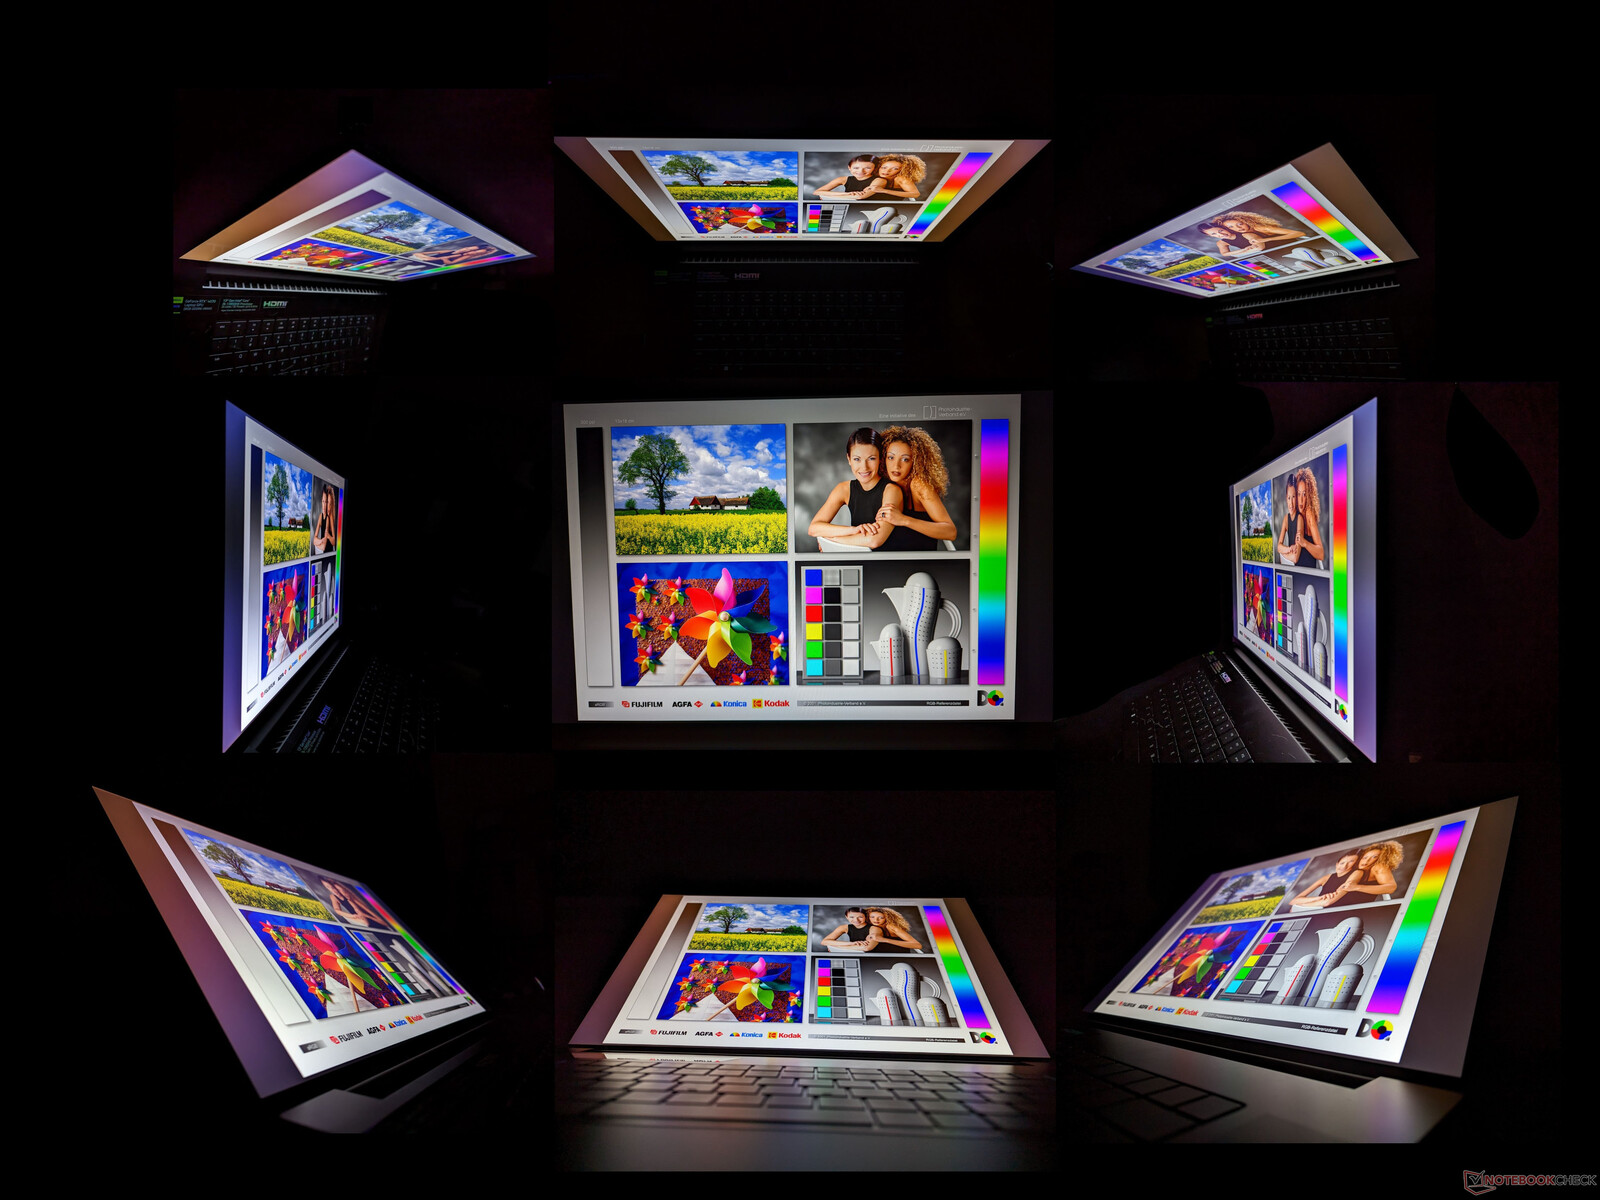
可视角度很宽,正如IPS面板所预期的那样。只有在从极端角度观看时,颜色和对比度才会发生变化。
性能--英特尔猛禽湖+英伟达艾达-洛夫莱斯
测试条件
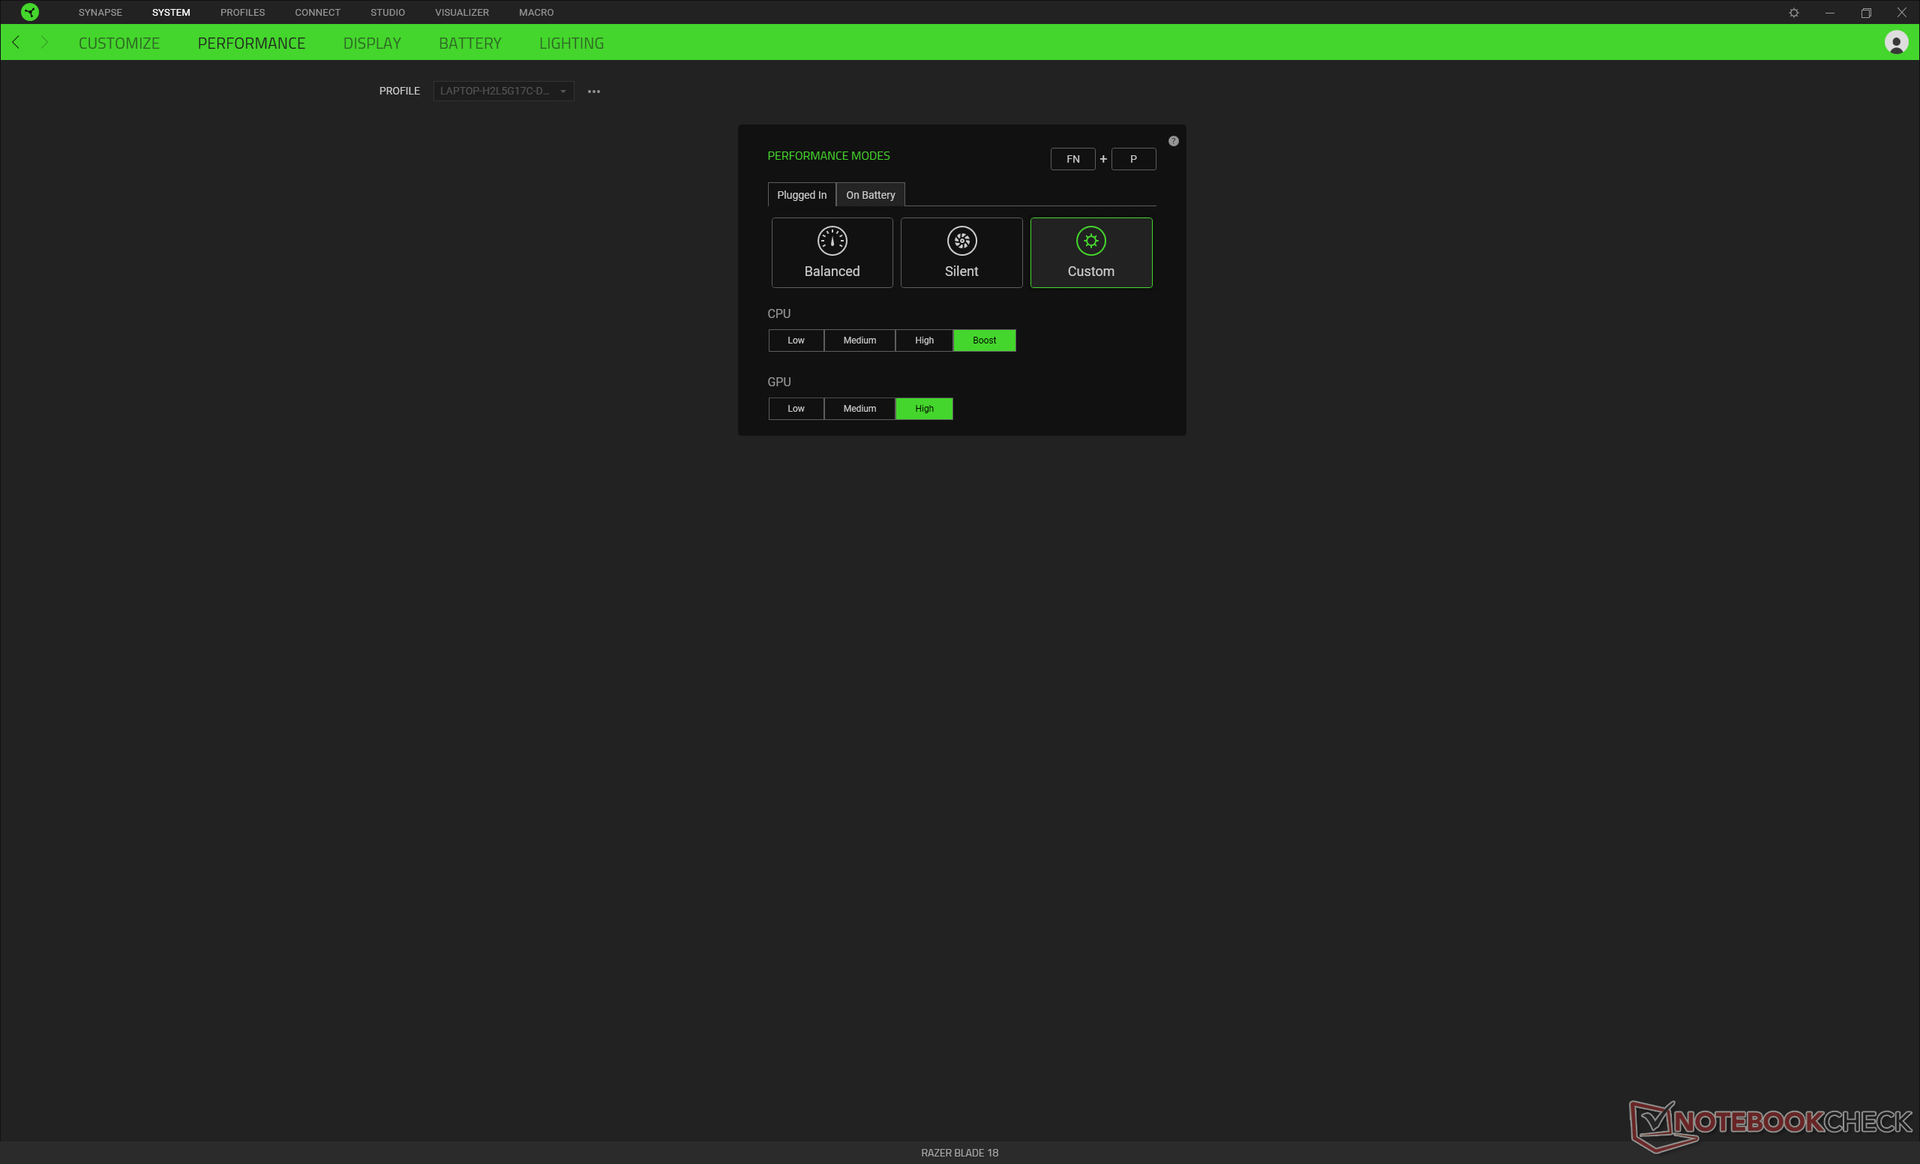
我们通过Windows将我们的设备设置为性能模式,并通过Razer Synapse软件将CPU和GPU分别设置为Boost和High,如下图所示。建议用户熟悉Synapse,因为它是调整任何RGB照明效果、性能配置文件、宏和其他辅助功能的枢纽。不幸的是,该软件并不总是可靠的,因为如果没有互联网连接,它有时会变得无反应或根本不启动。
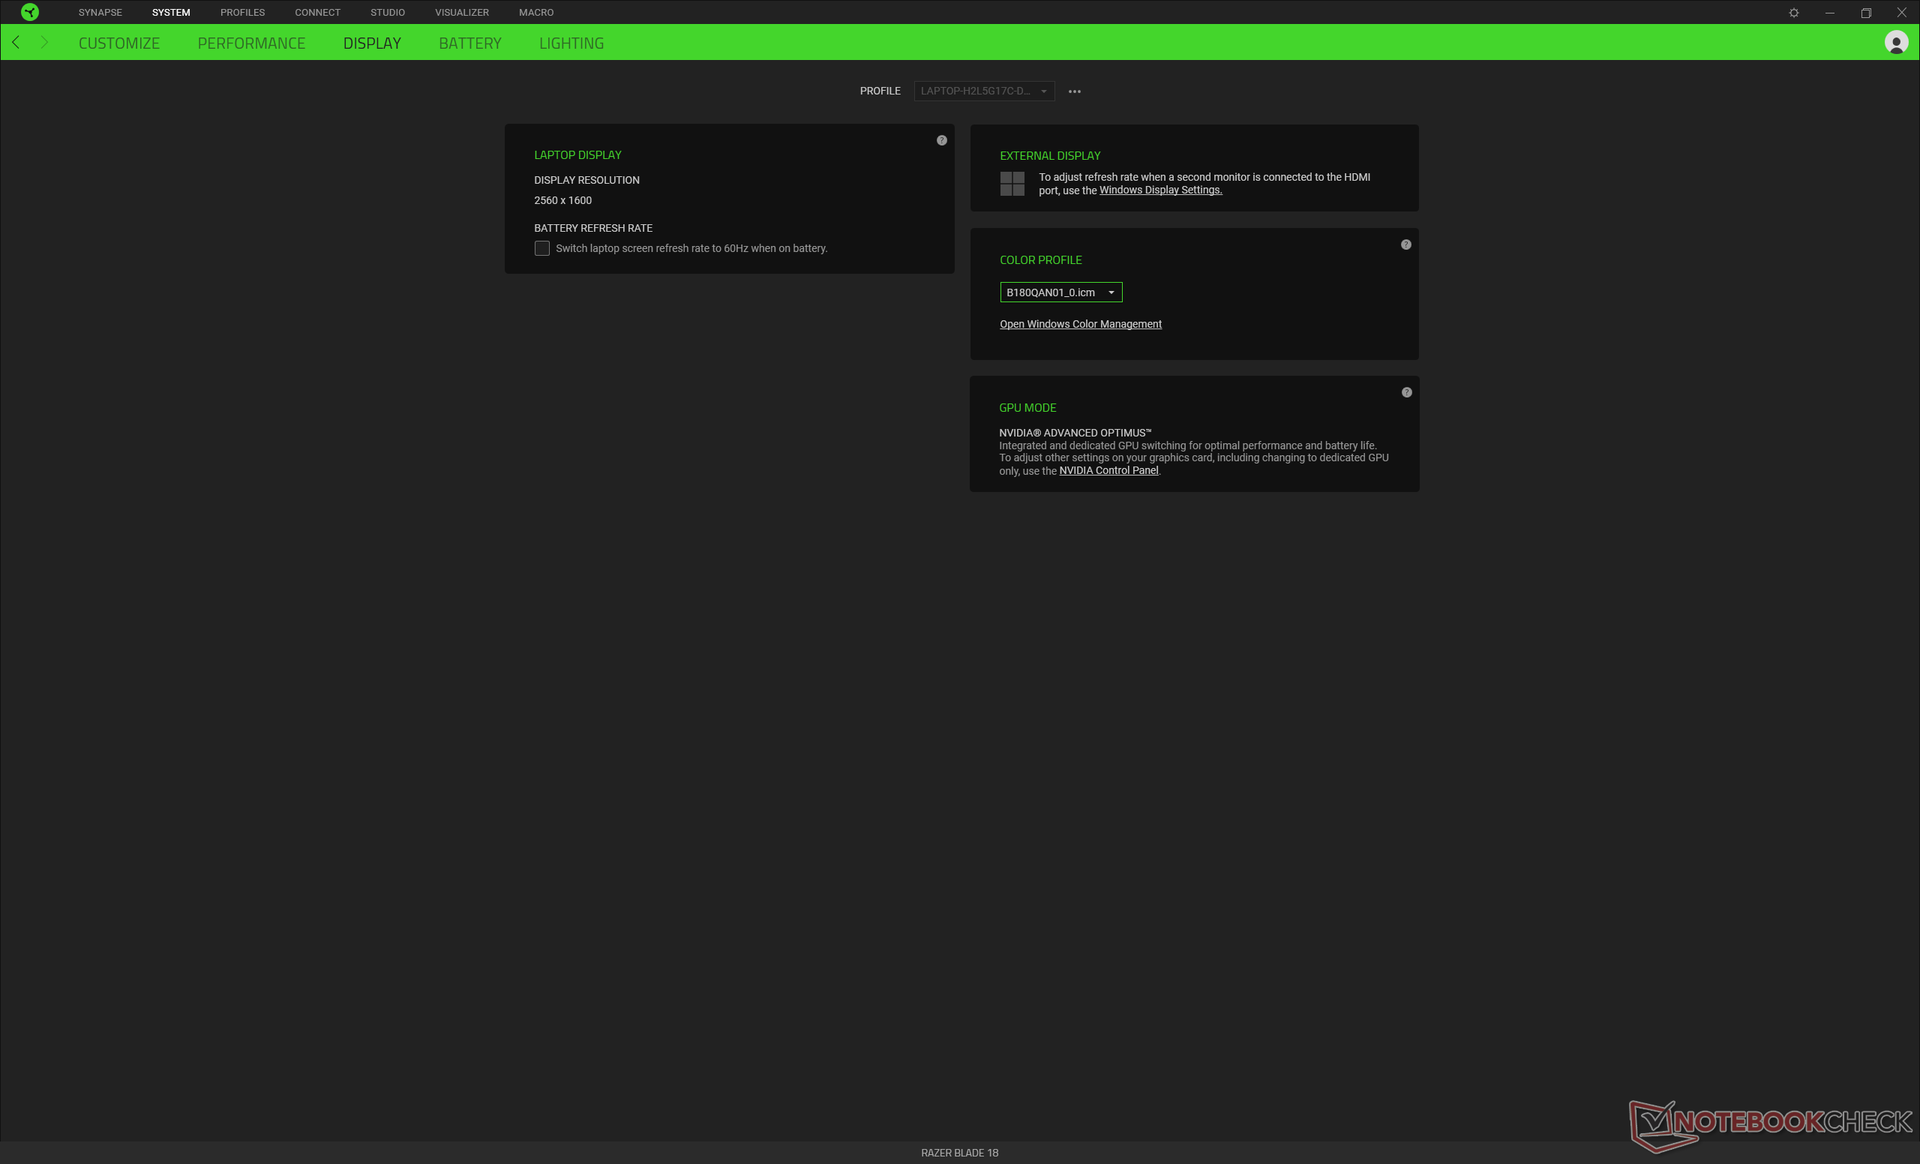
与Blade 16不同,Blade 18不支持MUX或Advanced Optimus。我们的设备也不支持G-Sync,尽管Razer正在宣传。我们已经就缺乏G-Sync的问题联系了雷蛇,并将在适当时候更新本节。
处理器
CPU性能仅在刀片16或GT77的几个百分点之内,两者都配备了相同的 Core i9-13950HX处理器。因此,这里的CPU似乎没有受到任何重大的节流问题的影响。多线程性能大约比上一代产品快45%。酷睿i9-12950HX以与库存的台式机相提并论 酷睿i9-12900K.在这方面,基因对基因的性能飞跃是很重要的。
我们通常的CineBench R15 xT循环测试结果不包括在下面,因为分数异常低,不能代表处理器的性能。运行CineBench R15会同时激活CPU和dGPU,因此CPU的性能有时会受到dGPU的功率限制。这个问题在其他一些笔记本电脑上也可以观察到。CineBench R23是一个纯粹的CPU基准测试,不激活dGPU,因此下面提供这些结果。
Cinebench R23 Multi Loop
Cinebench R23: Multi Core | Single Core
Cinebench R20: CPU (Multi Core) | CPU (Single Core)
Cinebench R15: CPU Multi 64Bit | CPU Single 64Bit
Blender: v2.79 BMW27 CPU
7-Zip 18.03: 7z b 4 | 7z b 4 -mmt1
Geekbench 5.5: Multi-Core | Single-Core
HWBOT x265 Benchmark v2.2: 4k Preset
LibreOffice : 20 Documents To PDF
R Benchmark 2.5: Overall mean
* ... smaller is better
AIDA64: FP32 Ray-Trace | FPU Julia | CPU SHA3 | CPU Queen | FPU SinJulia | FPU Mandel | CPU AES | CPU ZLib | FP64 Ray-Trace | CPU PhotoWorxx
| Performance rating | |
| MSI Titan GT77 HX 13VI | |
| Razer Blade 18 RTX 4070 | |
| Average Intel Core i9-13950HX | |
| Asus ROG Strix Scar 17 SE G733CX-LL014W | |
| Alienware m17 R5 (R9 6900HX, RX 6850M XT) | |
| Gigabyte G7 KE | |
| Razer Blade 17 Early 2022 | |
| AIDA64 / FP32 Ray-Trace | |
| MSI Titan GT77 HX 13VI | |
| Razer Blade 18 RTX 4070 | |
| Average Intel Core i9-13950HX (17993 - 28957, n=9) | |
| Asus ROG Strix Scar 17 SE G733CX-LL014W | |
| Alienware m17 R5 (R9 6900HX, RX 6850M XT) | |
| Gigabyte G7 KE | |
| Razer Blade 17 Early 2022 | |
| AIDA64 / FPU Julia | |
| MSI Titan GT77 HX 13VI | |
| Razer Blade 18 RTX 4070 | |
| Average Intel Core i9-13950HX (89362 - 144303, n=9) | |
| Alienware m17 R5 (R9 6900HX, RX 6850M XT) | |
| Asus ROG Strix Scar 17 SE G733CX-LL014W | |
| Gigabyte G7 KE | |
| Razer Blade 17 Early 2022 | |
| AIDA64 / CPU SHA3 | |
| MSI Titan GT77 HX 13VI | |
| Razer Blade 18 RTX 4070 | |
| Average Intel Core i9-13950HX (4518 - 7093, n=9) | |
| Asus ROG Strix Scar 17 SE G733CX-LL014W | |
| Alienware m17 R5 (R9 6900HX, RX 6850M XT) | |
| Gigabyte G7 KE | |
| Razer Blade 17 Early 2022 | |
| AIDA64 / CPU Queen | |
| MSI Titan GT77 HX 13VI | |
| Razer Blade 18 RTX 4070 | |
| Average Intel Core i9-13950HX (131931 - 140103, n=8) | |
| Alienware m17 R5 (R9 6900HX, RX 6850M XT) | |
| Asus ROG Strix Scar 17 SE G733CX-LL014W | |
| Razer Blade 17 Early 2022 | |
| Gigabyte G7 KE | |
| AIDA64 / FPU SinJulia | |
| MSI Titan GT77 HX 13VI | |
| Razer Blade 18 RTX 4070 | |
| Average Intel Core i9-13950HX (12318 - 17057, n=9) | |
| Alienware m17 R5 (R9 6900HX, RX 6850M XT) | |
| Asus ROG Strix Scar 17 SE G733CX-LL014W | |
| Gigabyte G7 KE | |
| Razer Blade 17 Early 2022 | |
| AIDA64 / FPU Mandel | |
| MSI Titan GT77 HX 13VI | |
| Razer Blade 18 RTX 4070 | |
| Average Intel Core i9-13950HX (44372 - 71038, n=9) | |
| Alienware m17 R5 (R9 6900HX, RX 6850M XT) | |
| Asus ROG Strix Scar 17 SE G733CX-LL014W | |
| Gigabyte G7 KE | |
| Razer Blade 17 Early 2022 | |
| AIDA64 / CPU AES | |
| Asus ROG Strix Scar 17 SE G733CX-LL014W | |
| Average Intel Core i9-13950HX (99981 - 204491, n=9) | |
| MSI Titan GT77 HX 13VI | |
| Razer Blade 18 RTX 4070 | |
| Gigabyte G7 KE | |
| Alienware m17 R5 (R9 6900HX, RX 6850M XT) | |
| Razer Blade 17 Early 2022 | |
| AIDA64 / CPU ZLib | |
| MSI Titan GT77 HX 13VI | |
| Razer Blade 18 RTX 4070 | |
| Average Intel Core i9-13950HX (1263 - 2069, n=9) | |
| Asus ROG Strix Scar 17 SE G733CX-LL014W | |
| Gigabyte G7 KE | |
| Alienware m17 R5 (R9 6900HX, RX 6850M XT) | |
| Razer Blade 17 Early 2022 | |
| AIDA64 / FP64 Ray-Trace | |
| MSI Titan GT77 HX 13VI | |
| Razer Blade 18 RTX 4070 | |
| Average Intel Core i9-13950HX (9649 - 15573, n=9) | |
| Asus ROG Strix Scar 17 SE G733CX-LL014W | |
| Alienware m17 R5 (R9 6900HX, RX 6850M XT) | |
| Gigabyte G7 KE | |
| Razer Blade 17 Early 2022 | |
| AIDA64 / CPU PhotoWorxx | |
| Razer Blade 18 RTX 4070 | |
| Average Intel Core i9-13950HX (40233 - 50864, n=9) | |
| Asus ROG Strix Scar 17 SE G733CX-LL014W | |
| MSI Titan GT77 HX 13VI | |
| Razer Blade 17 Early 2022 | |
| Alienware m17 R5 (R9 6900HX, RX 6850M XT) | |
| Gigabyte G7 KE | |
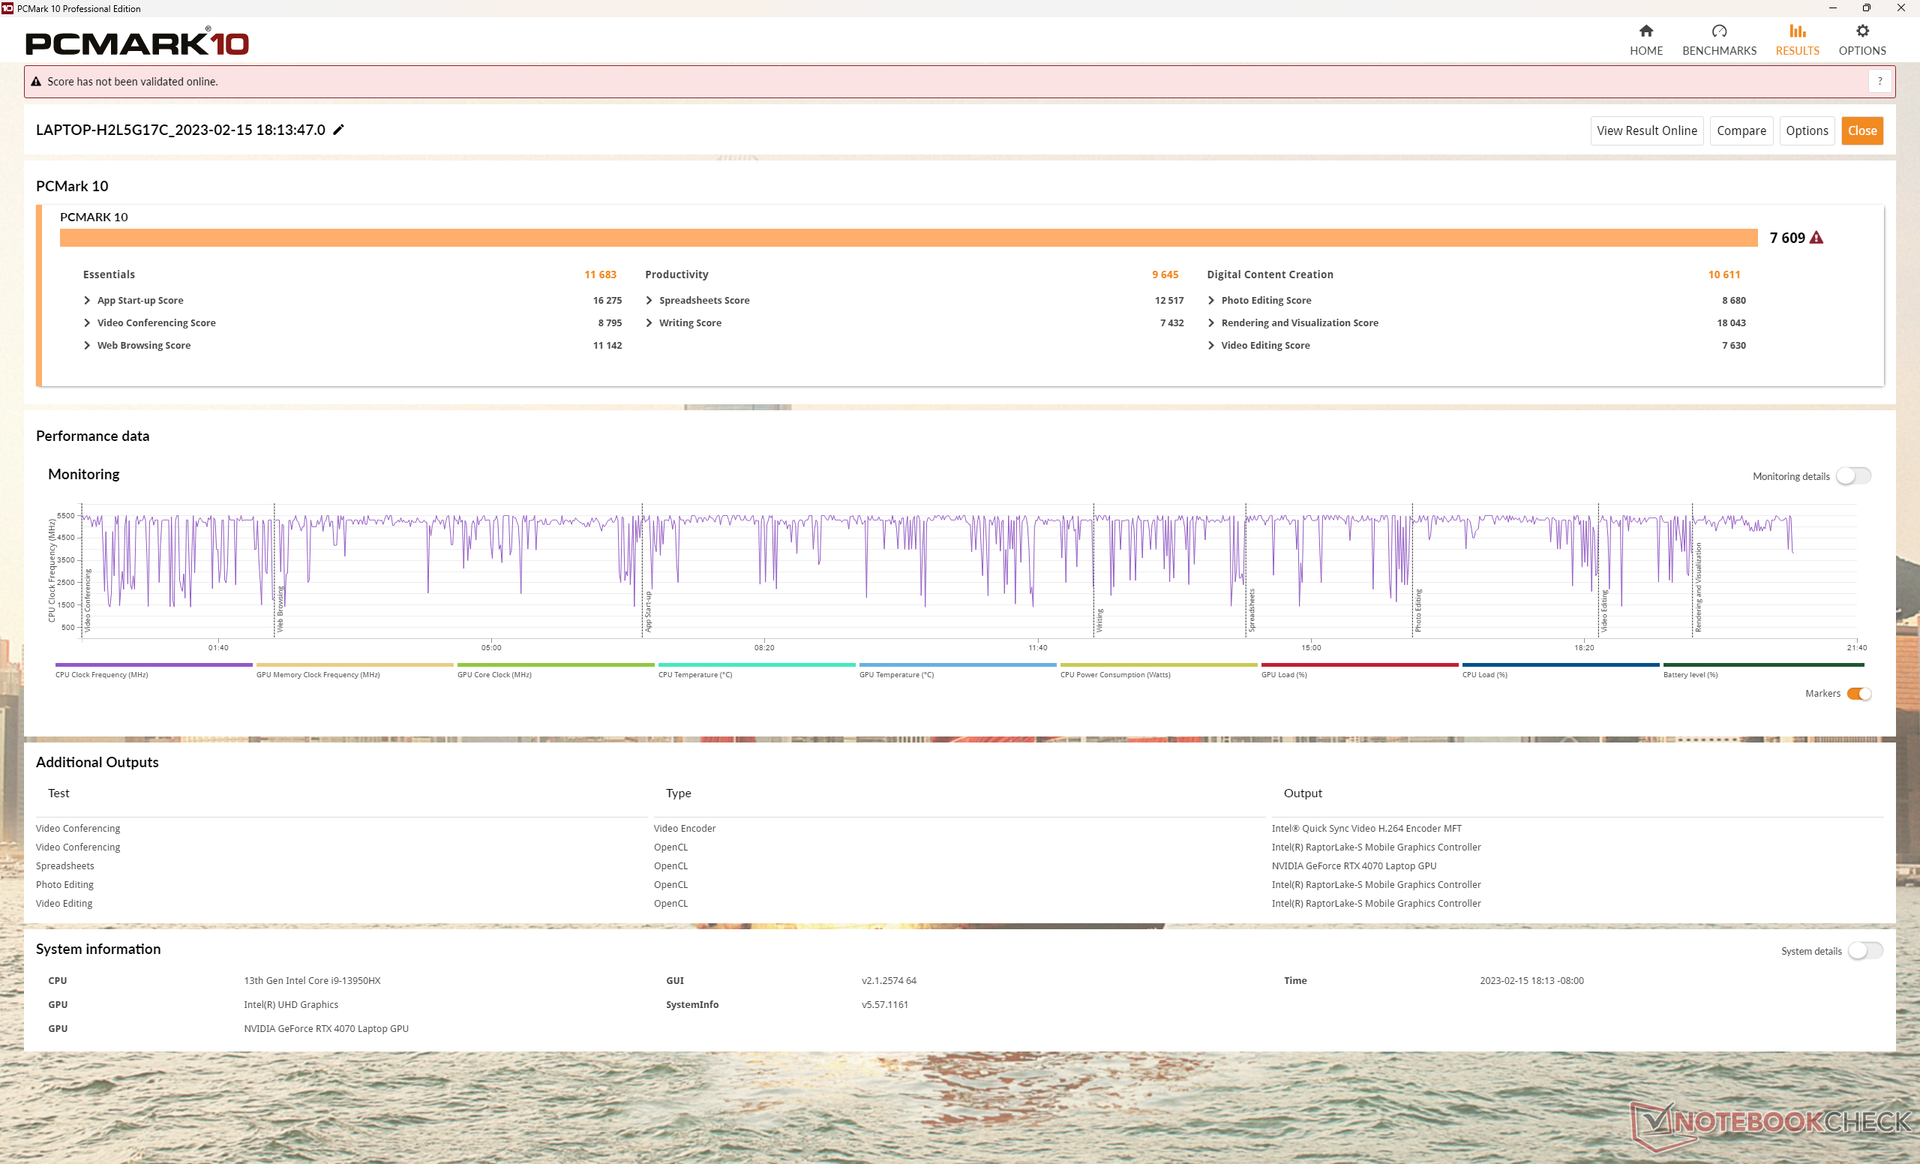
系统性能
PCMark 10的得分一直高于在 2022年的Blade 17即使差距不大。而 刀片16和微星GT77的得分更高,因为它们分别拥有更快的RTX 4080和4090 GPU。
CrossMark: Overall | Productivity | Creativity | Responsiveness
| PCMark 10 / Score | |
| MSI Titan GT77 HX 13VI | |
| Razer Blade 18 RTX 4070 | |
| Average Intel Core i9-13950HX, NVIDIA GeForce RTX 4070 Laptop GPU (n=1) | |
| Alienware m17 R5 (R9 6900HX, RX 6850M XT) | |
| Asus ROG Strix Scar 17 SE G733CX-LL014W | |
| Razer Blade 17 Early 2022 | |
| Gigabyte G7 KE | |
| PCMark 10 / Essentials | |
| MSI Titan GT77 HX 13VI | |
| Razer Blade 18 RTX 4070 | |
| Average Intel Core i9-13950HX, NVIDIA GeForce RTX 4070 Laptop GPU (n=1) | |
| Asus ROG Strix Scar 17 SE G733CX-LL014W | |
| Gigabyte G7 KE | |
| Razer Blade 17 Early 2022 | |
| Alienware m17 R5 (R9 6900HX, RX 6850M XT) | |
| PCMark 10 / Productivity | |
| Asus ROG Strix Scar 17 SE G733CX-LL014W | |
| MSI Titan GT77 HX 13VI | |
| Razer Blade 18 RTX 4070 | |
| Average Intel Core i9-13950HX, NVIDIA GeForce RTX 4070 Laptop GPU (n=1) | |
| Razer Blade 17 Early 2022 | |
| Alienware m17 R5 (R9 6900HX, RX 6850M XT) | |
| Gigabyte G7 KE | |
| PCMark 10 / Digital Content Creation | |
| MSI Titan GT77 HX 13VI | |
| Alienware m17 R5 (R9 6900HX, RX 6850M XT) | |
| Razer Blade 18 RTX 4070 | |
| Average Intel Core i9-13950HX, NVIDIA GeForce RTX 4070 Laptop GPU (n=1) | |
| Razer Blade 17 Early 2022 | |
| Asus ROG Strix Scar 17 SE G733CX-LL014W | |
| Gigabyte G7 KE | |
| CrossMark / Overall | |
| MSI Titan GT77 HX 13VI | |
| Razer Blade 18 RTX 4070 | |
| Average Intel Core i9-13950HX, NVIDIA GeForce RTX 4070 Laptop GPU (n=1) | |
| Asus ROG Strix Scar 17 SE G733CX-LL014W | |
| Gigabyte G7 KE | |
| Razer Blade 17 Early 2022 | |
| Alienware m17 R5 (R9 6900HX, RX 6850M XT) | |
| CrossMark / Productivity | |
| MSI Titan GT77 HX 13VI | |
| Razer Blade 18 RTX 4070 | |
| Average Intel Core i9-13950HX, NVIDIA GeForce RTX 4070 Laptop GPU (n=1) | |
| Asus ROG Strix Scar 17 SE G733CX-LL014W | |
| Gigabyte G7 KE | |
| Razer Blade 17 Early 2022 | |
| Alienware m17 R5 (R9 6900HX, RX 6850M XT) | |
| CrossMark / Creativity | |
| MSI Titan GT77 HX 13VI | |
| Razer Blade 18 RTX 4070 | |
| Average Intel Core i9-13950HX, NVIDIA GeForce RTX 4070 Laptop GPU (n=1) | |
| Asus ROG Strix Scar 17 SE G733CX-LL014W | |
| Razer Blade 17 Early 2022 | |
| Gigabyte G7 KE | |
| Alienware m17 R5 (R9 6900HX, RX 6850M XT) | |
| CrossMark / Responsiveness | |
| Gigabyte G7 KE | |
| Asus ROG Strix Scar 17 SE G733CX-LL014W | |
| Razer Blade 18 RTX 4070 | |
| Average Intel Core i9-13950HX, NVIDIA GeForce RTX 4070 Laptop GPU (n=1) | |
| MSI Titan GT77 HX 13VI | |
| Razer Blade 17 Early 2022 | |
| Alienware m17 R5 (R9 6900HX, RX 6850M XT) | |
| PCMark 10 Score | 7609 points | |
Help | ||
| AIDA64 / Memory Copy | |
| Razer Blade 18 RTX 4070 | |
| Average Intel Core i9-13950HX (61938 - 78813, n=9) | |
| MSI Titan GT77 HX 13VI | |
| Asus ROG Strix Scar 17 SE G733CX-LL014W | |
| Razer Blade 17 Early 2022 | |
| Alienware m17 R5 (R9 6900HX, RX 6850M XT) | |
| Gigabyte G7 KE | |
| AIDA64 / Memory Read | |
| Razer Blade 18 RTX 4070 | |
| Average Intel Core i9-13950HX (62368 - 86831, n=9) | |
| Asus ROG Strix Scar 17 SE G733CX-LL014W | |
| MSI Titan GT77 HX 13VI | |
| Razer Blade 17 Early 2022 | |
| Alienware m17 R5 (R9 6900HX, RX 6850M XT) | |
| Gigabyte G7 KE | |
| AIDA64 / Memory Write | |
| Razer Blade 18 RTX 4070 | |
| Average Intel Core i9-13950HX (59501 - 80441, n=9) | |
| Asus ROG Strix Scar 17 SE G733CX-LL014W | |
| MSI Titan GT77 HX 13VI | |
| Razer Blade 17 Early 2022 | |
| Alienware m17 R5 (R9 6900HX, RX 6850M XT) | |
| Gigabyte G7 KE | |
| AIDA64 / Memory Latency | |
| Alienware m17 R5 (R9 6900HX, RX 6850M XT) | |
| MSI Titan GT77 HX 13VI | |
| Gigabyte G7 KE | |
| Average Intel Core i9-13950HX (84.4 - 99.5, n=9) | |
| Asus ROG Strix Scar 17 SE G733CX-LL014W | |
| Razer Blade 18 RTX 4070 | |
* ... smaller is better
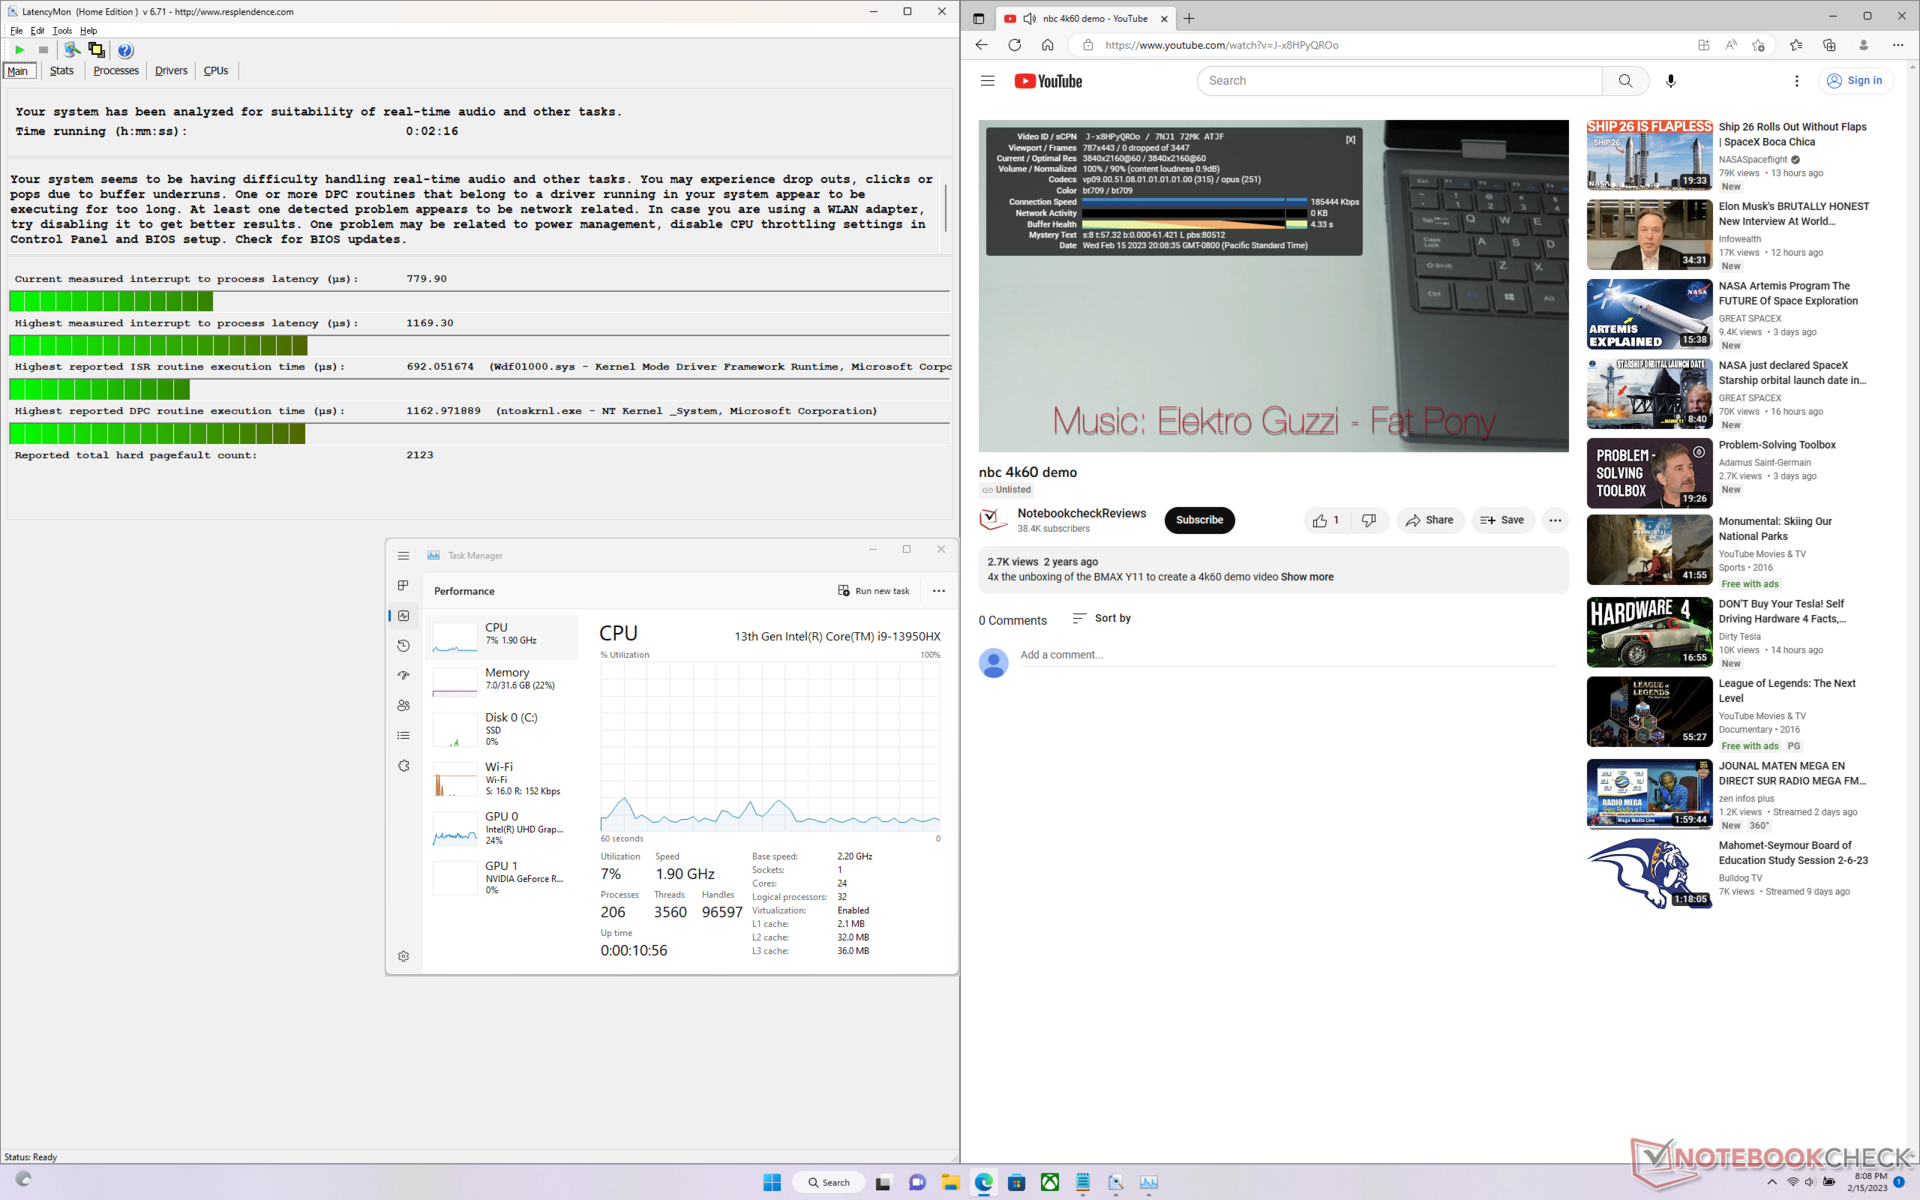
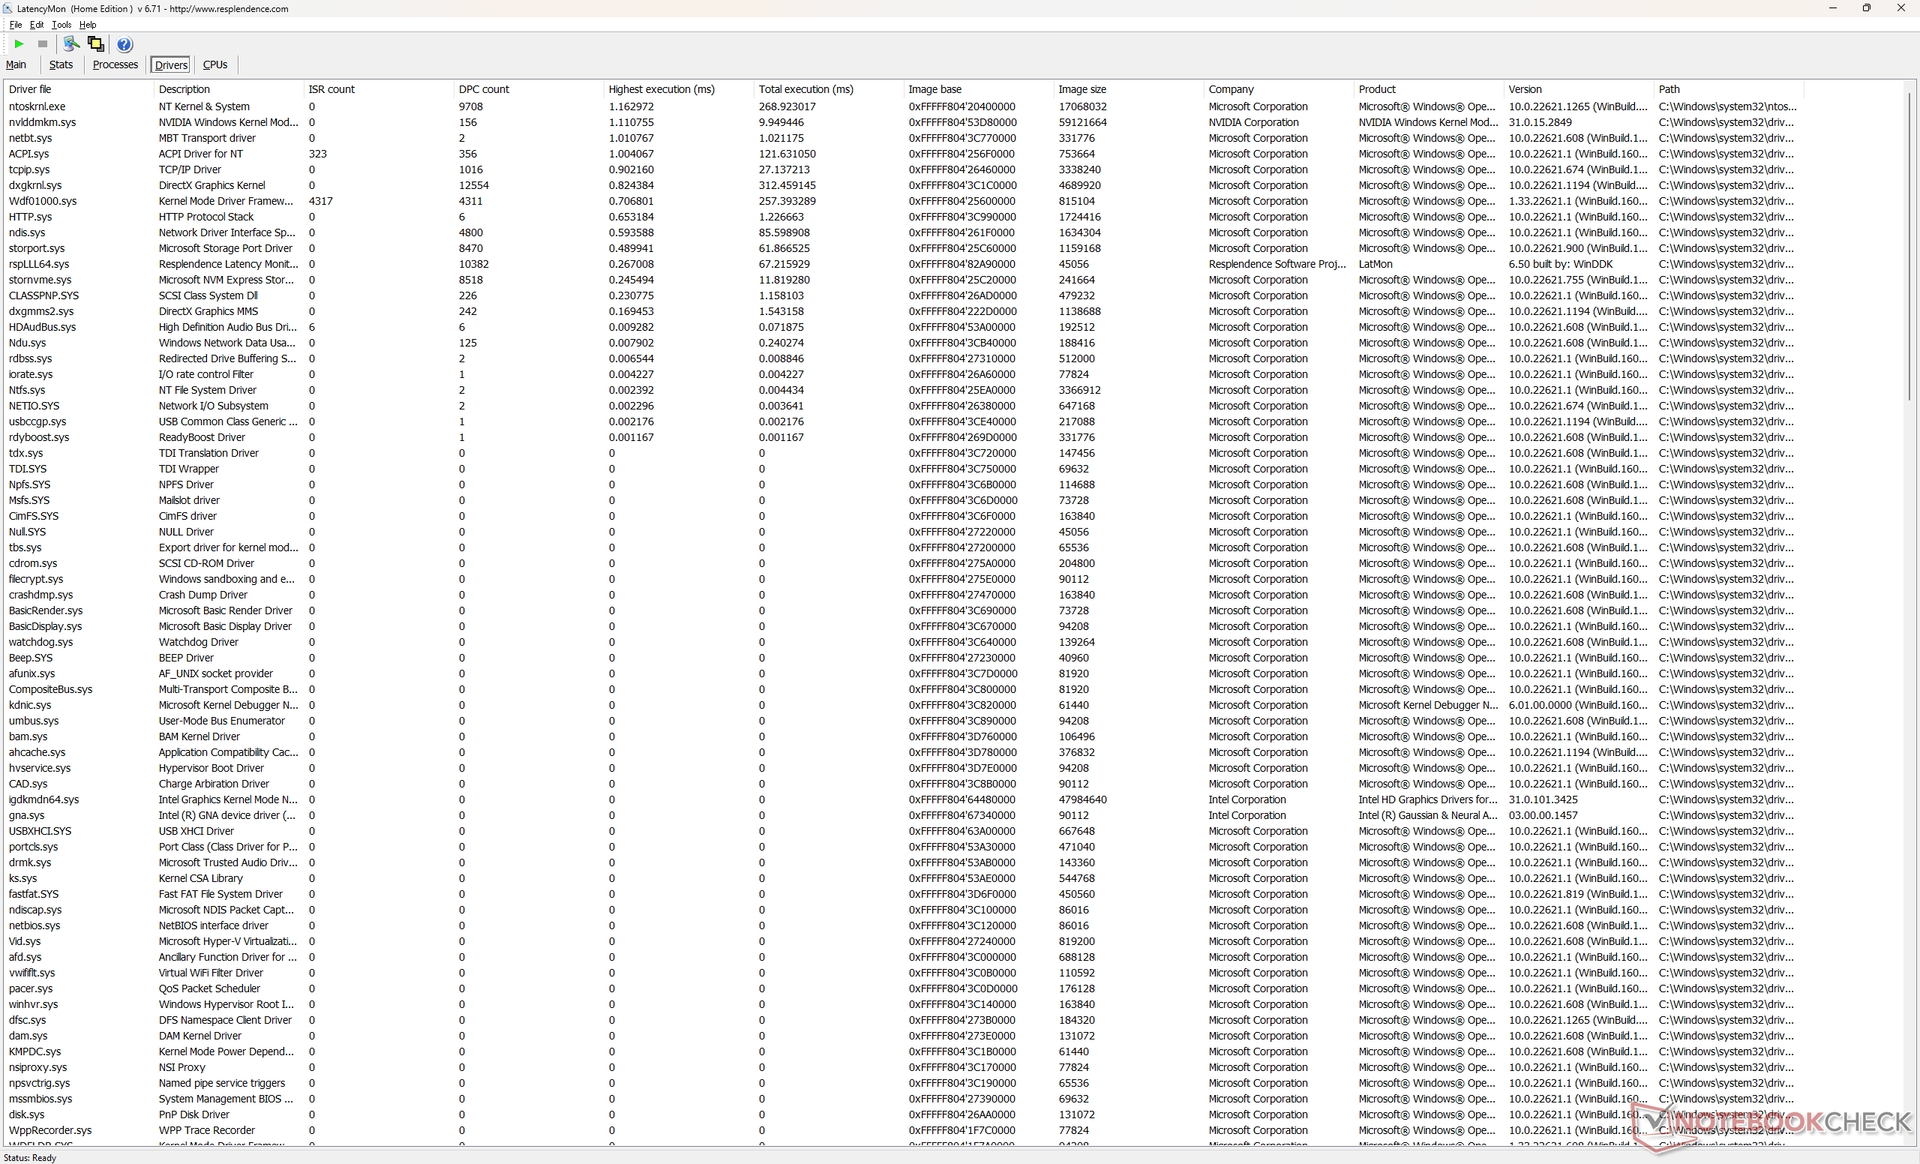
DPC延时
LatencyMon显示,在打开我们的主页的多个浏览器标签时有轻微的DPC问题。在60FPS下的4K视频播放是完美的,CPU和GPU利用率都很低。
| DPC Latencies / LatencyMon - interrupt to process latency (max), Web, Youtube, Prime95 | |
| MSI Titan GT77 HX 13VI | |
| Asus ROG Strix Scar 17 SE G733CX-LL014W | |
| Gigabyte G7 KE | |
| Alienware m17 R5 (R9 6900HX, RX 6850M XT) | |
| Razer Blade 18 RTX 4070 | |
| Razer Blade 17 Early 2022 | |
* ... smaller is better
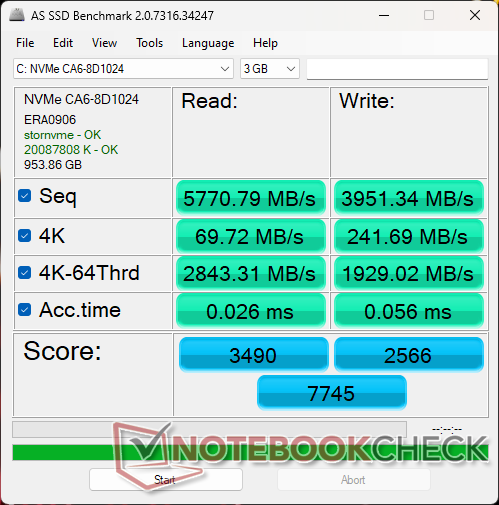
存储设备 - 多达两个固态硬盘
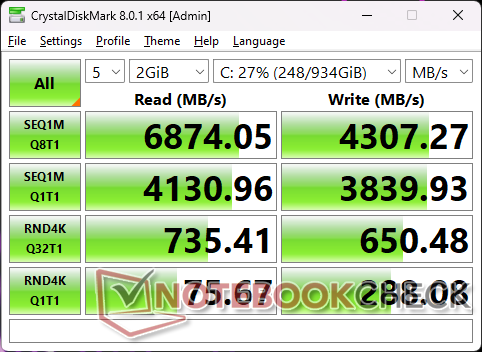
我们的测试装置配备了相同的 1TB SSTC CA6-8D1024的PCIe4 x4 NVMe SSD。 搭配的固态硬盘。.传输速率与流行的三星PM9A1相当,稳定的连续读取和写入速率分别接近6900MB/s和4300MB/s。Razer为两个固态硬盘插槽各配备了一个散热垫,将热量散发到金属底板上。

| Drive Performance rating - Percent | |
| Asus ROG Strix Scar 17 SE G733CX-LL014W | |
| Gigabyte G7 KE | |
| Razer Blade 17 Early 2022 | |
| MSI Titan GT77 HX 13VI | |
| Razer Blade 18 RTX 4070 | |
| Alienware m17 R5 (R9 6900HX, RX 6850M XT) | |
* ... smaller is better
Disk Throttling: DiskSpd Read Loop, Queue Depth 8
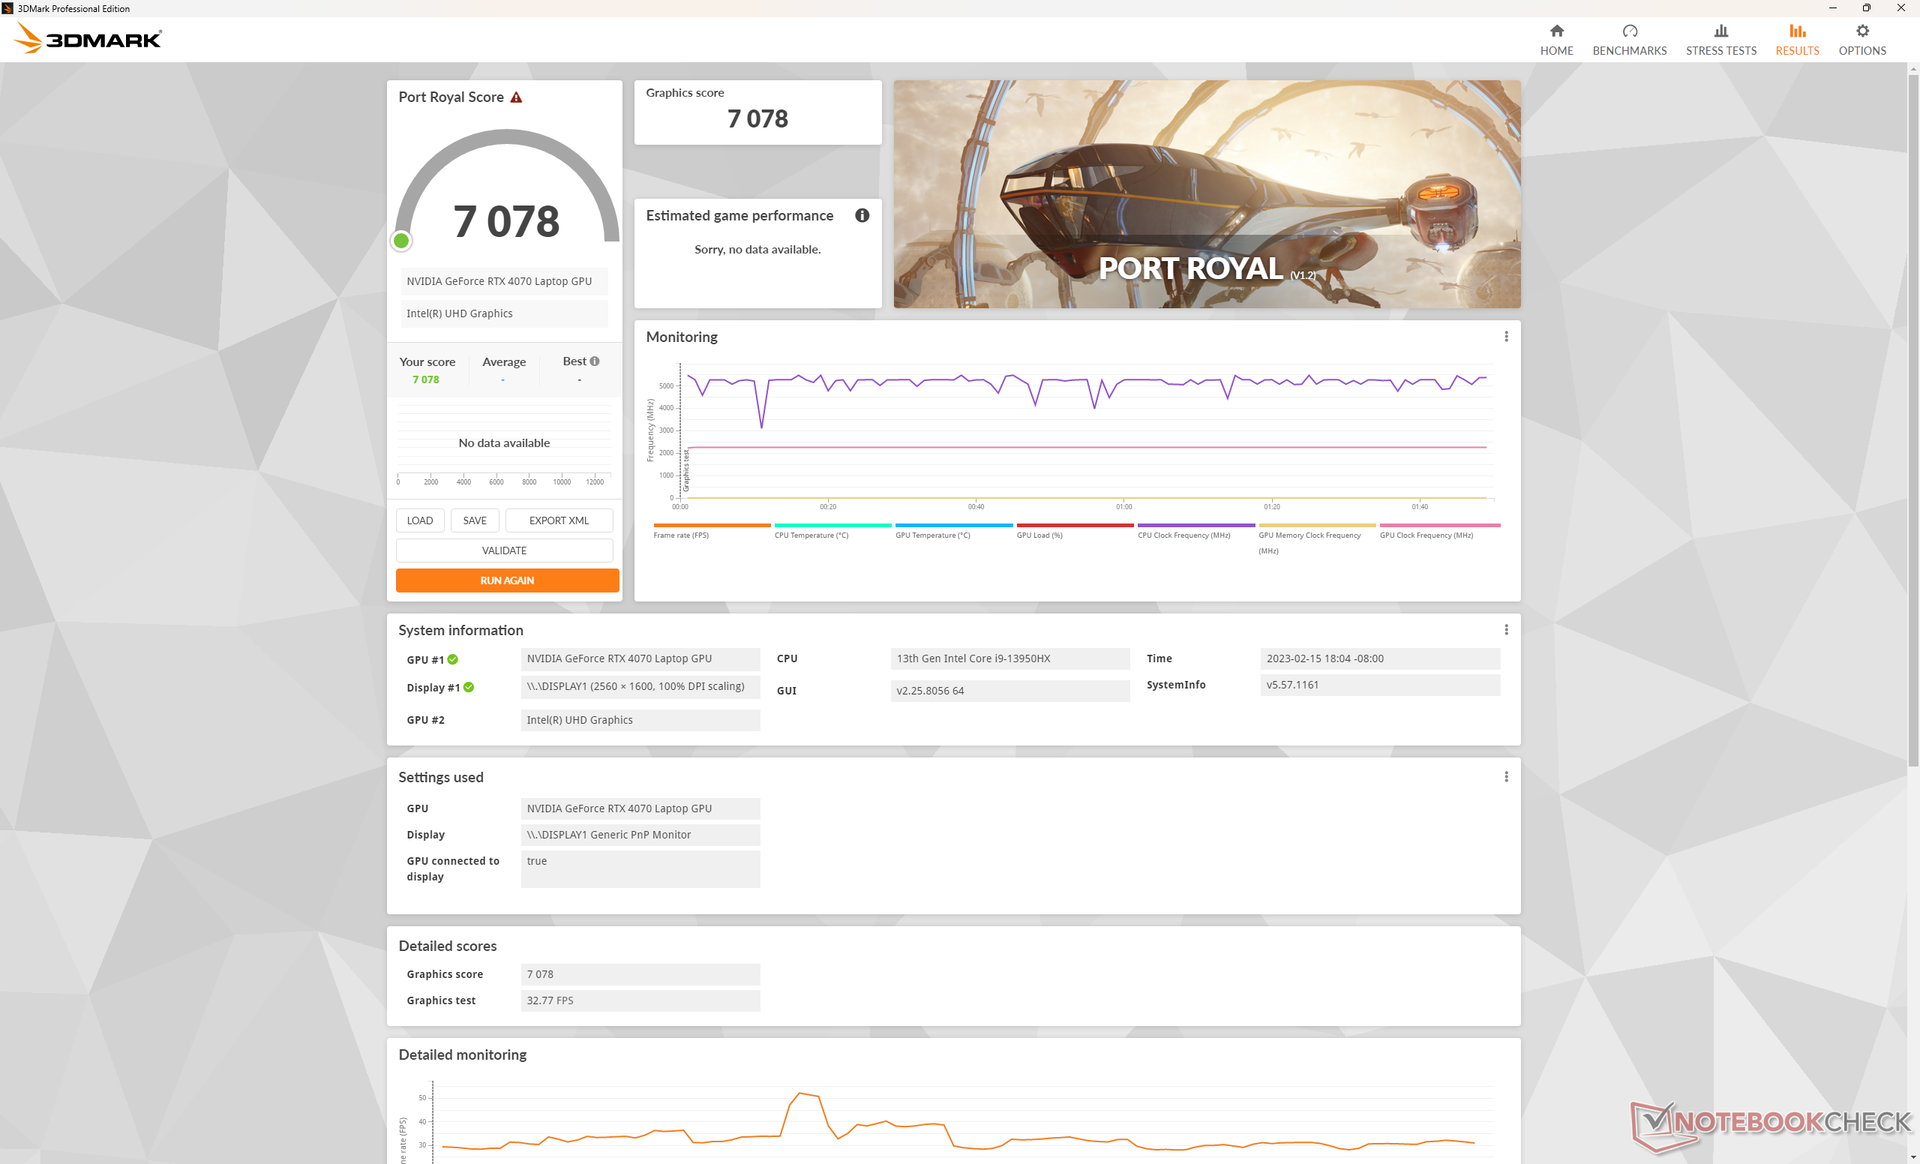
GPU性能--与台式机GeForce RTX 3070性能相似
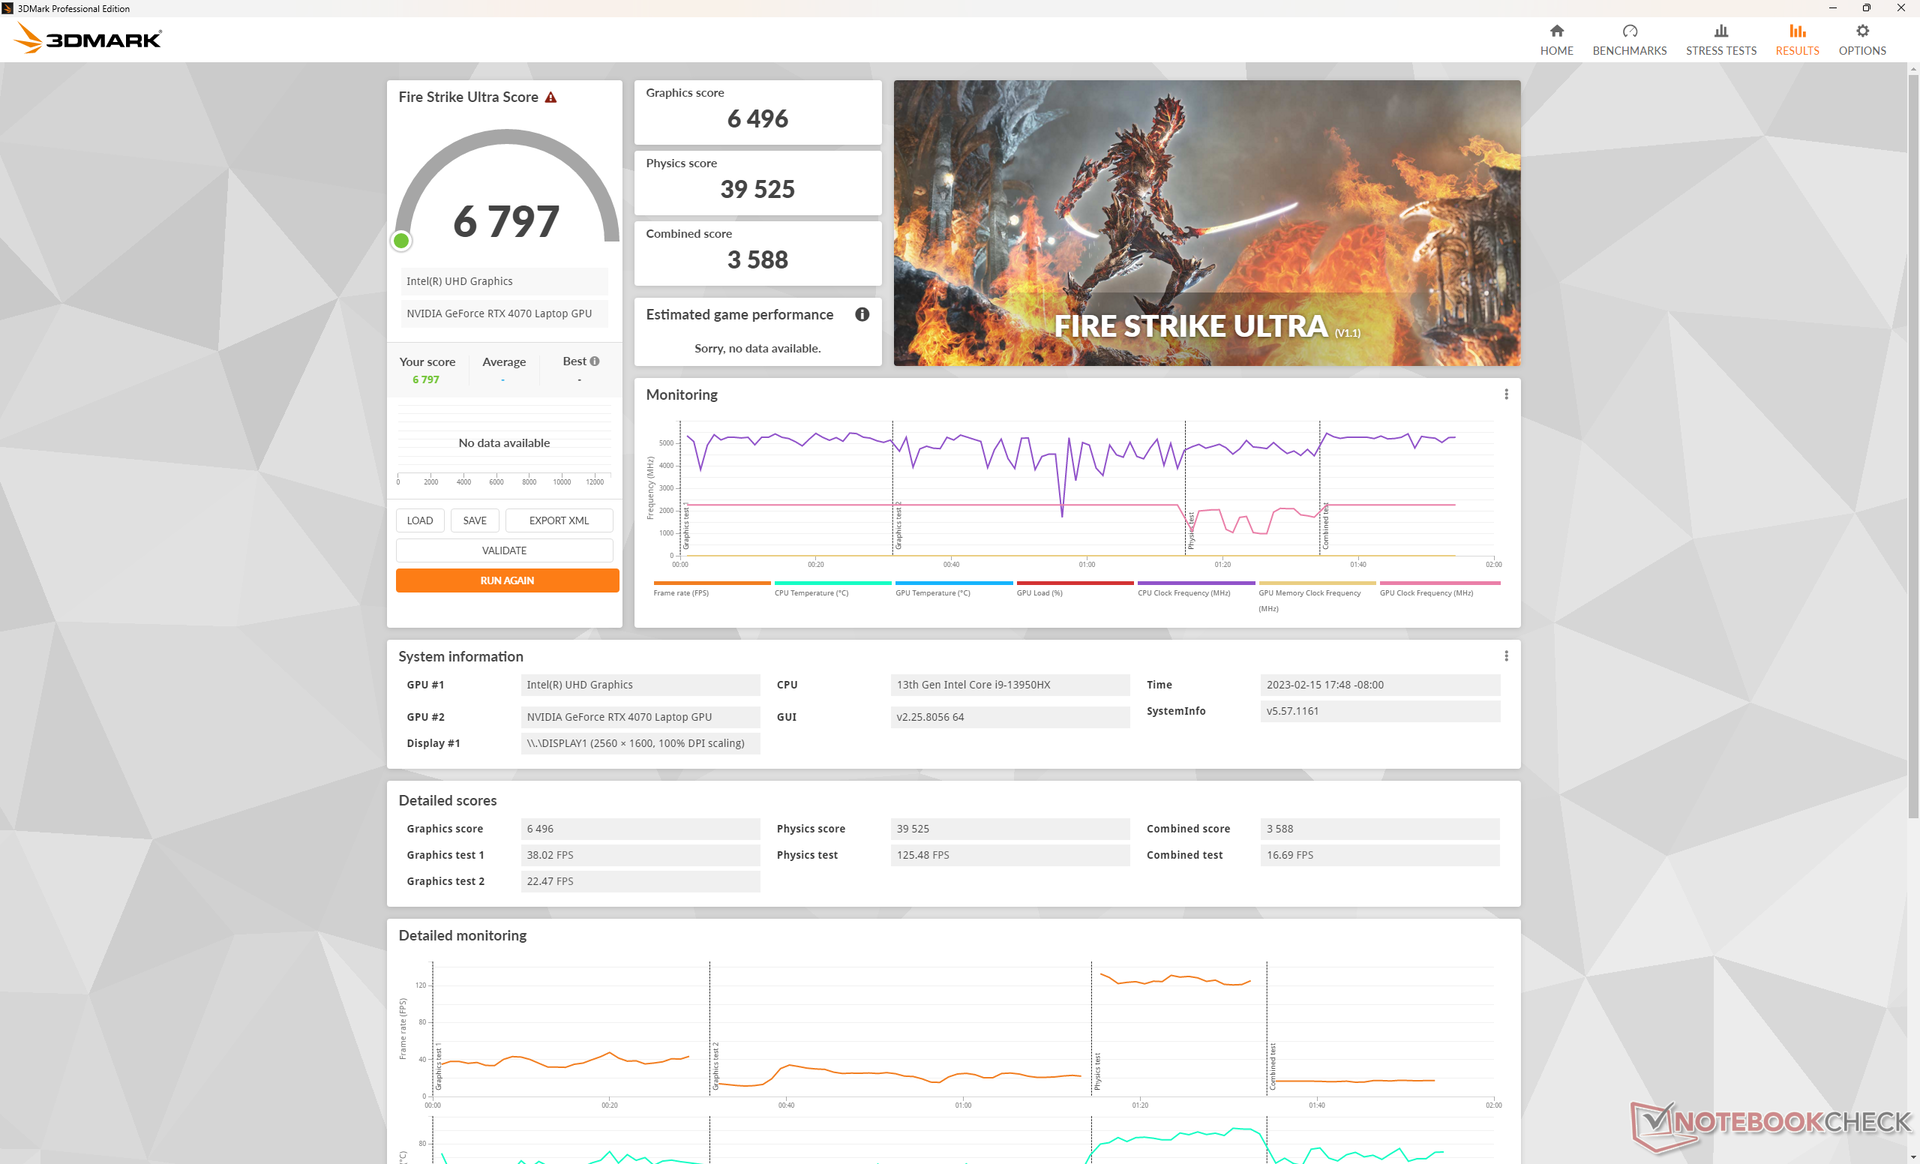
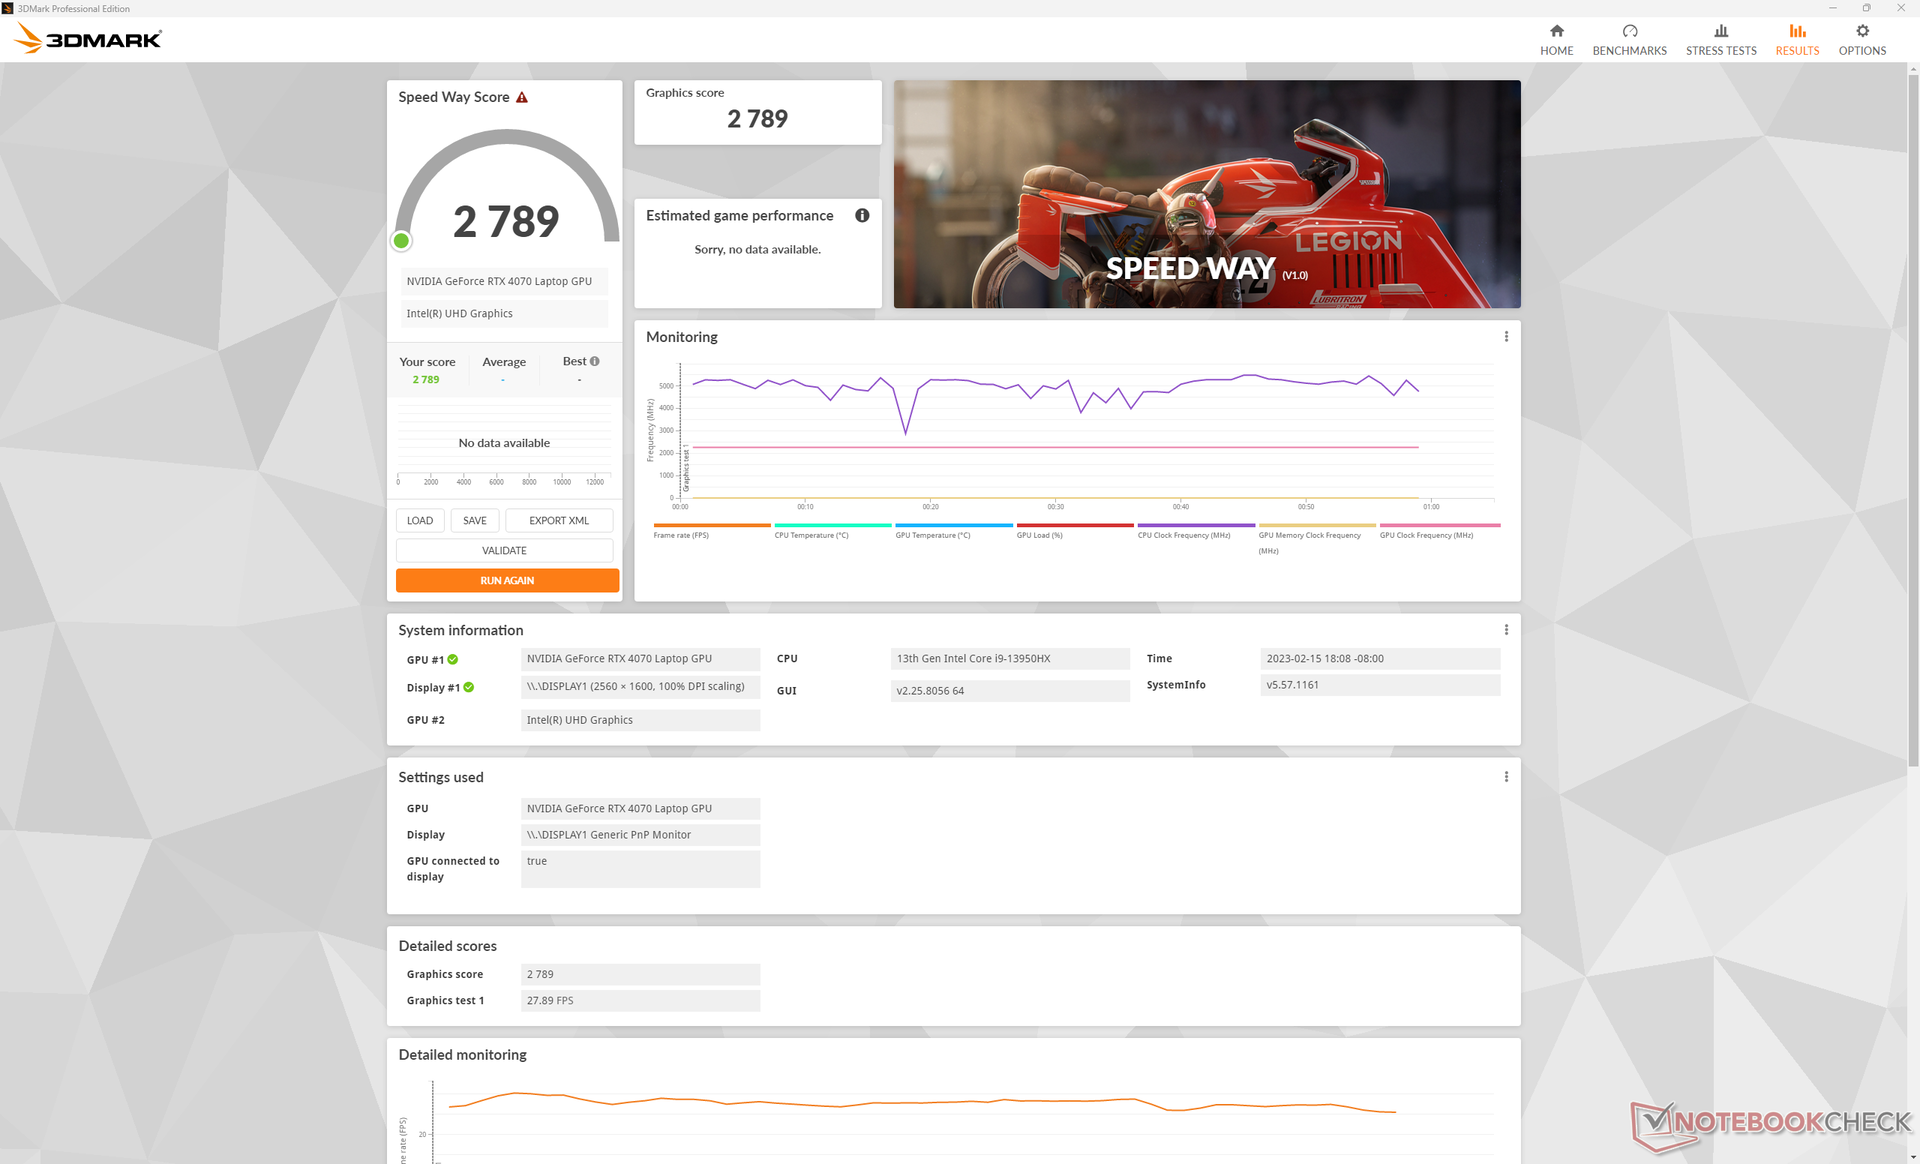
140瓦的移动GeForce RTX 4070 舒适地坐落在 移动RTX 3080和移动RTX 3080 Ti在原始性能方面。它只比即将推出的RTX3070快10%到20%。 移动RTX 3070然而,考虑到以下情况,这有点令人失望 移动RTX 4080比移动RTX 3080快40%到50%。 移动RTX 3080.这意味着移动RTX 4070和移动RTX 4080之间的性能差距在40%至60%时更为显著。
与桌面GPU相比,移动RTX 4070比桌面RTX 3070慢了约5%至10%。 桌面RTX 3070的速度要慢5%到10%。
GeForce 40 GPU的一大卖点是支持帧生成或DLSS 3。不幸的是,我们的Blade 18 RTX 4070测试装置在外部HDMI或USB-C 4K显示器上运行支持DLSS 3的游戏时,会出现问题。在所有测试的游戏中,帧率会无缘无故地下降到<30 FPS范围,而Blade 16 RTX 4080则没有这样的问题。奇怪的是,DLSS 3在内部Blade 18显示器上运行完全正常。我们已经与Razer联系,寻求潜在的解决方案,并将在适当时候更新本节。然而,就目前而言,如果启用DLSS 3,你会想在内部显示器上玩游戏。
在接下来的日子里,将对其他游戏进行基准测试。
| 3DMark Performance rating - Percent | |
| KFA2 GeForce RTX 4080 SG | |
| KFA2 GeForce RTX 4070 Ti SG | |
| MSI Titan GT77 HX 13VI | |
| Razer Blade 16 Early 2023 | |
| MSI GeForce RTX 3070 Gaming X Trio -1! | |
| Alienware m17 R5 (R9 6900HX, RX 6850M XT) -3! | |
| Razer Blade 17 Early 2022 -1! | |
| Alienware x17 RTX 3080 P48E -1! | |
| Average NVIDIA GeForce RTX 4070 Laptop GPU | |
| Razer Blade 18 RTX 4070 | |
| MSI Pulse GL76 12UGK | |
| Gigabyte G7 KE | |
| MSI GL75 10SFR -1! | |
| 3DMark 11 Performance | 34754 points | |
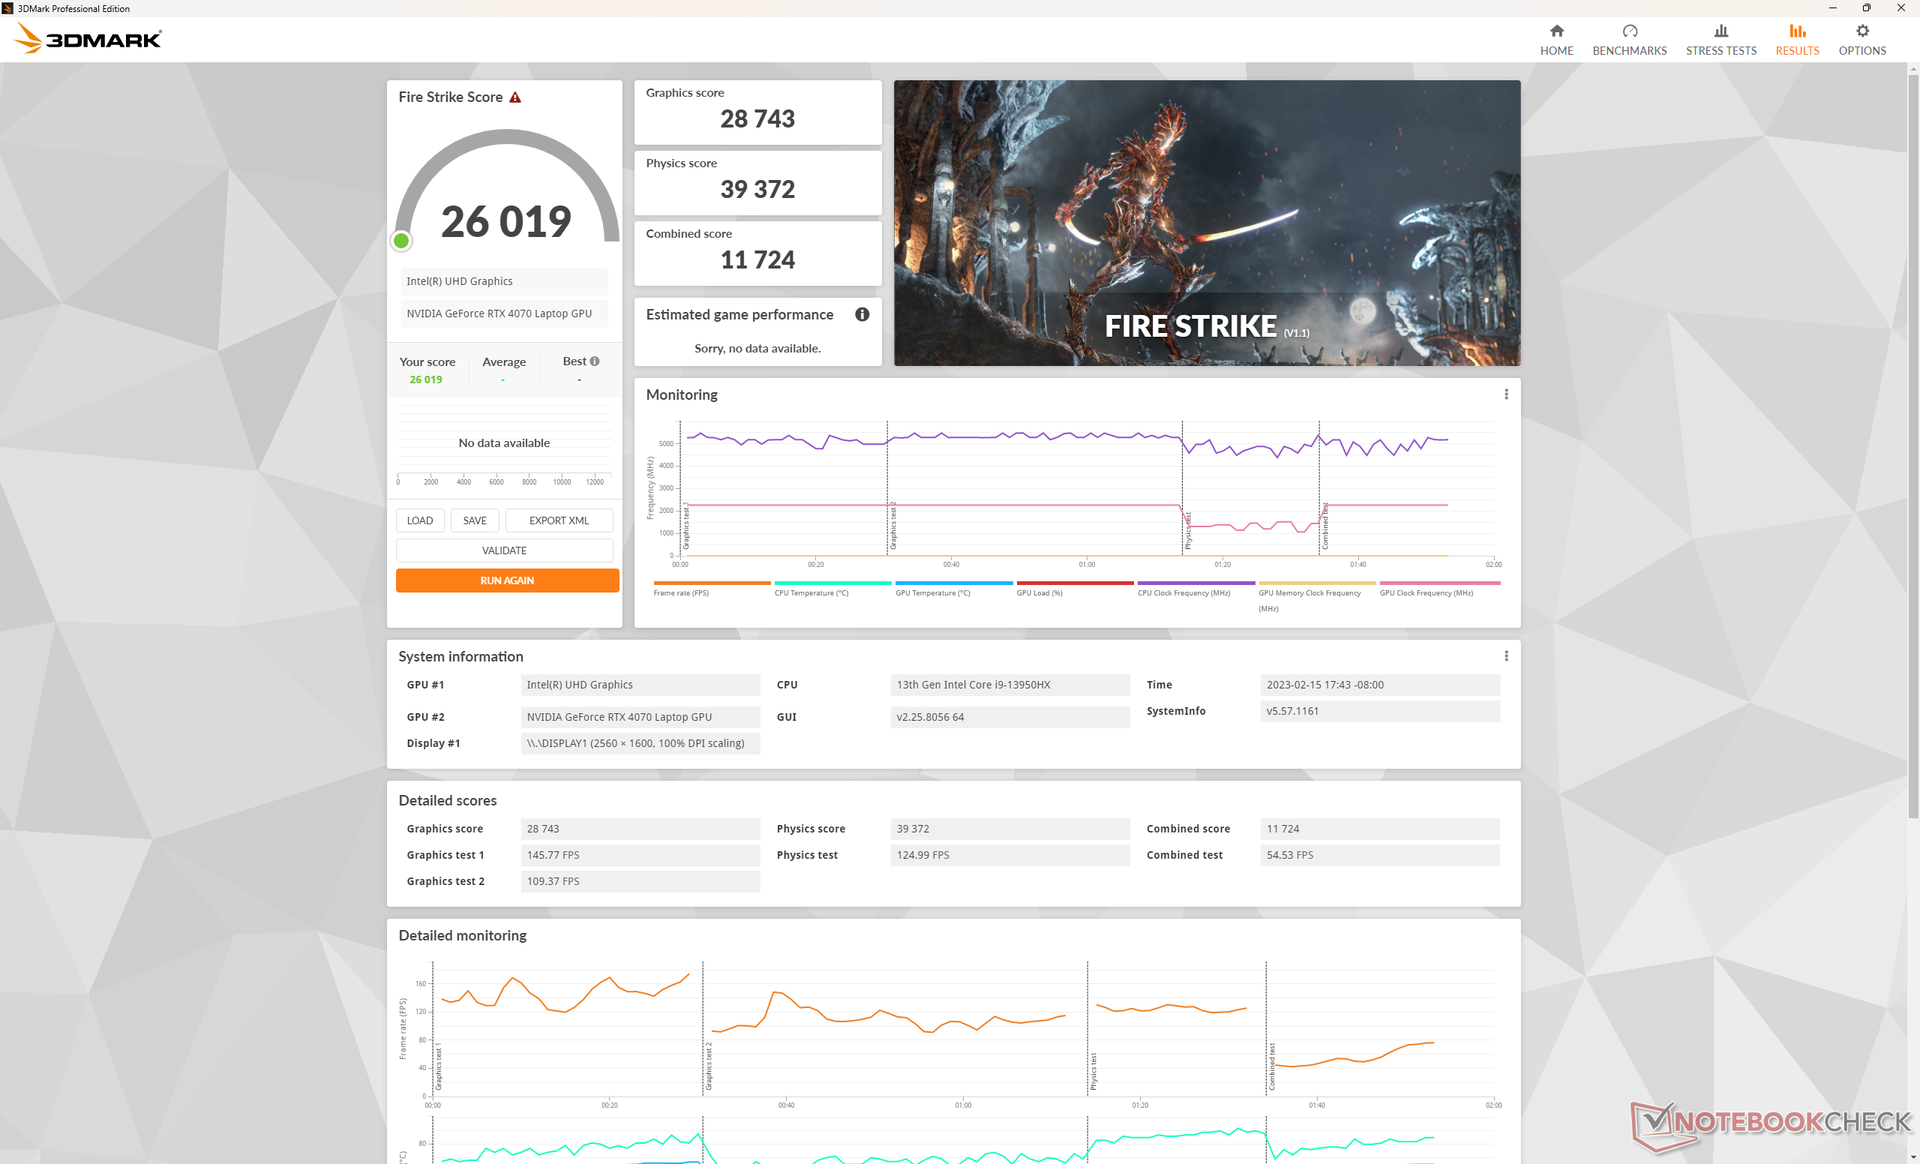
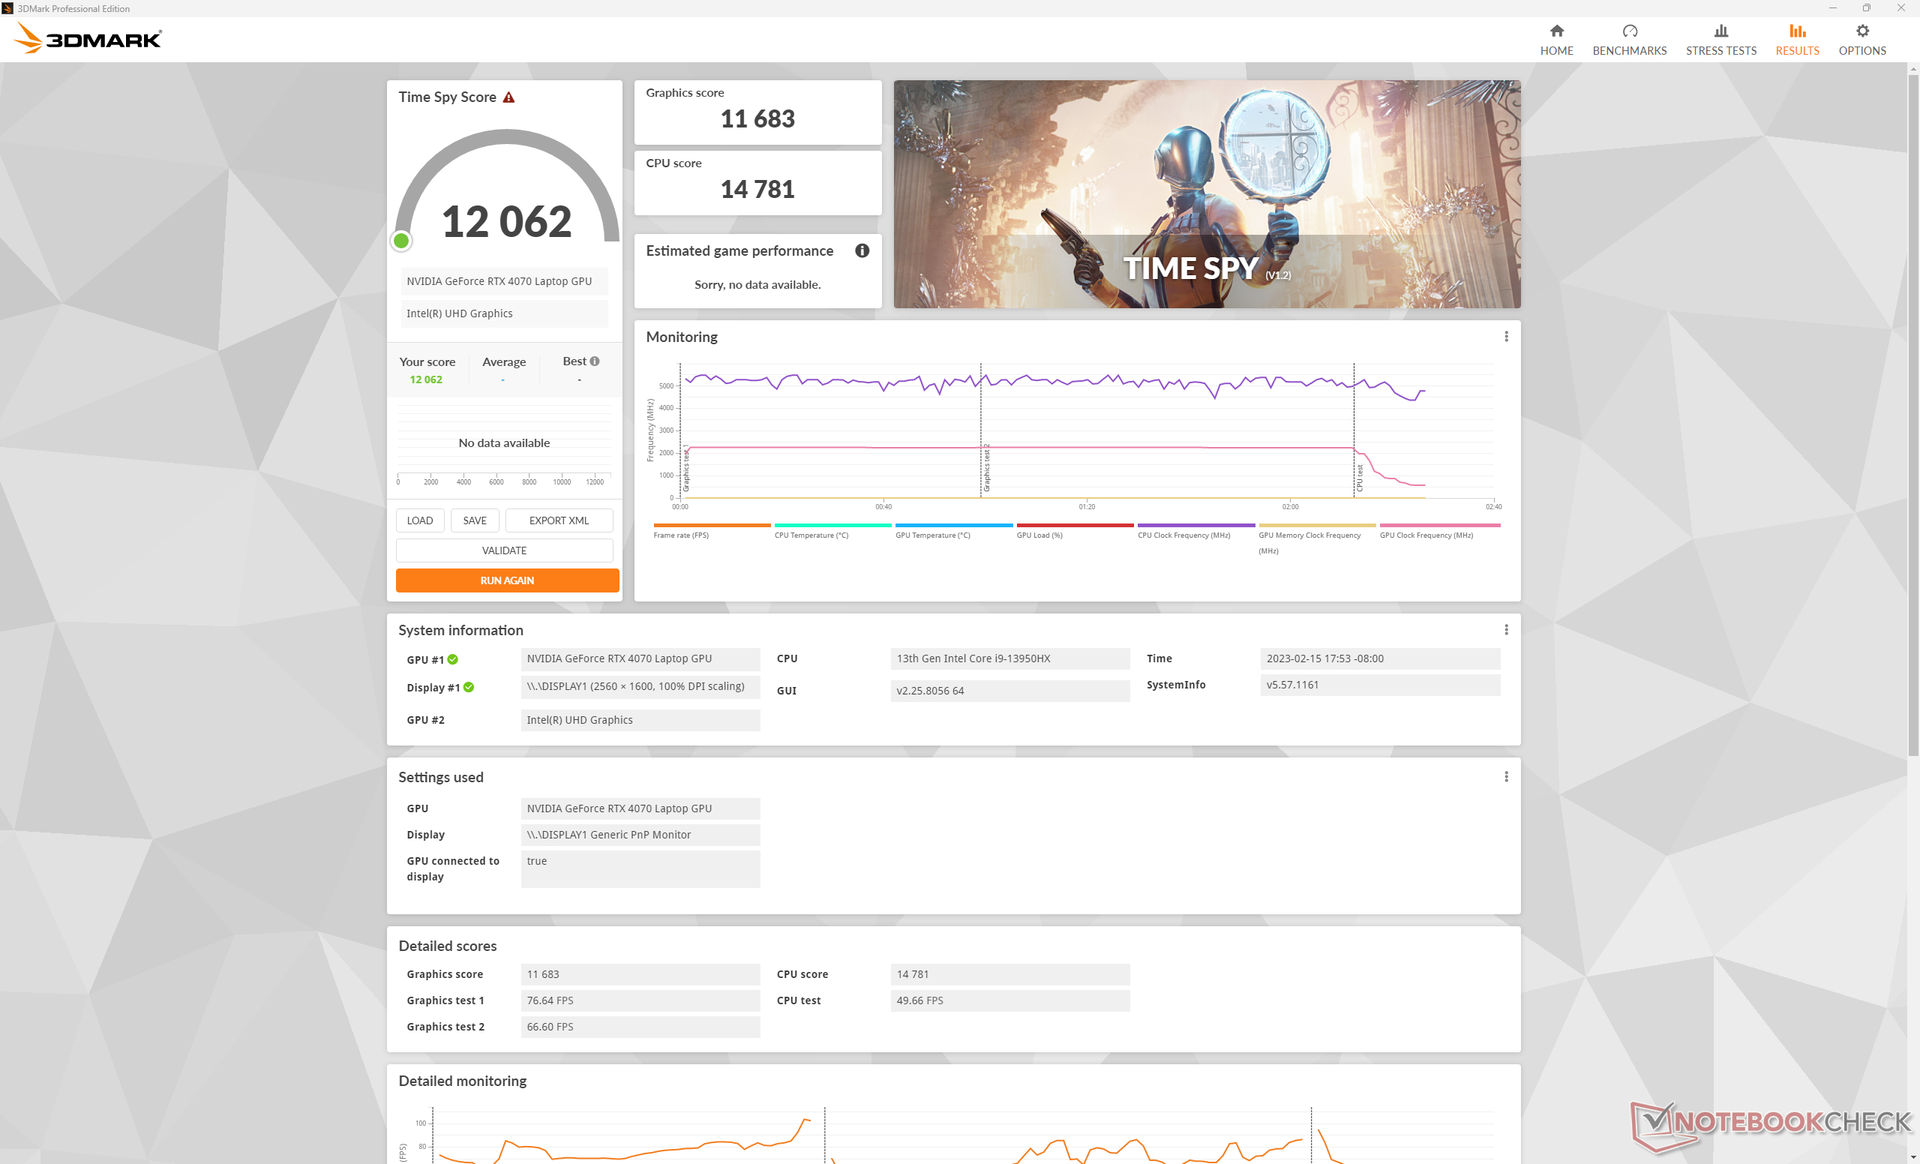
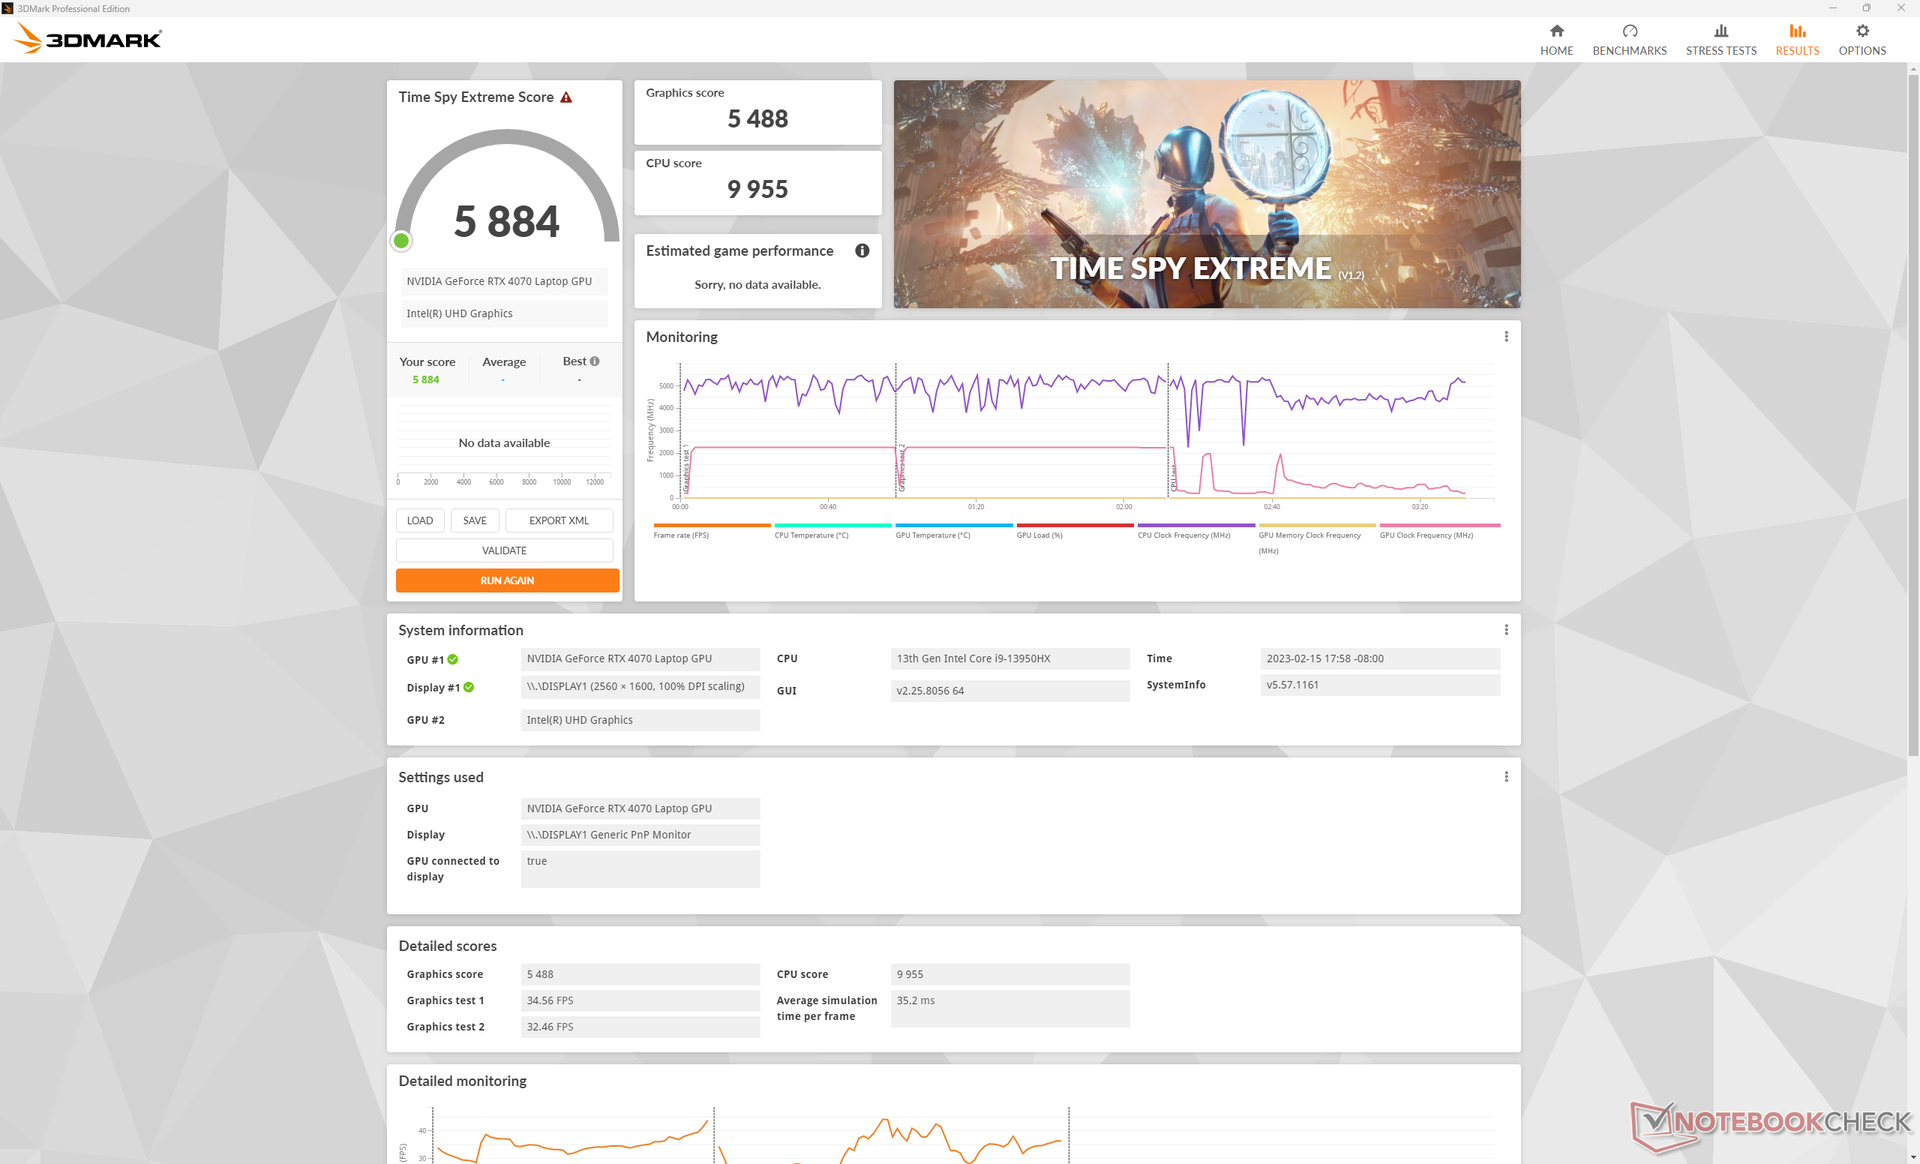
| 3DMark Fire Strike Score | 26019 points | |
| 3DMark Time Spy Score | 12062 points | |
Help | ||
* ... smaller is better
怠速运行 Witcher 3 一小时将返回稳定的帧率,没有反复的性能下降,表明没有中断后台应用程序或重大节流。
Witcher 3 FPS Chart
| low | med. | high | ultra | QHD | 4K | |
|---|---|---|---|---|---|---|
| GTA V (2015) | 186.1 | 184.7 | 181.6 | 121.4 | 87.6 | 88.5 |
| The Witcher 3 (2015) | 617 | 405.9 | 240.9 | 113.9 | 72.5 | |
| Dota 2 Reborn (2015) | 225 | 200 | 191 | 178.6 | 145.5 | |
| Final Fantasy XV Benchmark (2018) | 231 | 166.9 | 115.2 | 82 | 46.6 | |
| X-Plane 11.11 (2018) | 203 | 178.9 | 137.9 | 117.7 | ||
| Strange Brigade (2018) | 464 | 315 | 243 | 208 | 136.7 | 71.9 |
| Metro Exodus (2019) | 208.9 | 139.8 | 109.7 | 86.8 | 69 | 44 |
| Borderlands 3 (2019) | 258.5 | 200.1 | 131.8 | 100.3 | 68.7 | 35.7 |
| Hitman 3 (2021) | 294.3 | 234 | 208.4 | 197.4 | 129.9 | 68.5 |
| Cyberpunk 2077 1.6 (2022) | 147.8 | 125.7 | 111.5 | 92.1 | 54 | 23.3 |
排放
系统噪音 - 不玩游戏时很安静
在运行视频流或网络浏览等要求不高的负载时,内部风扇很安静。风扇的噪音通常徘徊在27dB(A)以下,而静音背景为23.5dB(A),在大多数情况下基本上听不到。考虑到木头下面的巨大尺寸和马力,这比预期的要安静。
运行更高的负载,如游戏,在稳定在48 dB(A)之前,风扇转速会缓慢而稳定地增加。如果压力达到100%的利用率,风扇噪音甚至可能达到54 dB(A)。50分贝(A)的低范围是大多数游戏笔记本电脑的典型特征,包括 GT77 或Razer自己的Blade 17。尽管尺寸不同,但Blade 18在游戏时的噪音与它的小兄弟姐妹一样大。
Noise level
| Idle |
| 23.8 / 23.8 / 26.8 dB(A) |
| Load |
| 37.3 / 53.5 dB(A) |
 | ||
30 dB silent 40 dB(A) audible 50 dB(A) loud |
||
min: | ||
| Razer Blade 18 RTX 4070 GeForce RTX 4070 Laptop GPU, i9-13950HX, SSSTC CA6-8D1024 | Razer Blade 17 Early 2022 GeForce RTX 3080 Ti Laptop GPU, i9-12900H, Samsung PM9A1 MZVL21T0HCLR | MSI Titan GT77 HX 13VI GeForce RTX 4090 Laptop GPU, i9-13950HX, Samsung PM9A1 MZVL22T0HBLB | Gigabyte G7 KE GeForce RTX 3060 Laptop GPU, i5-12500H, Gigabyte AG470S1TB-SI B10 | Alienware m17 R5 (R9 6900HX, RX 6850M XT) Radeon RX 6850M XT, R9 6900HX, SSSTC CA6-8D1024 | Asus ROG Strix Scar 17 SE G733CX-LL014W GeForce RTX 3080 Ti Laptop GPU, i9-12950HX, Samsung PM9A1 MZVL22T0HBLB | |
|---|---|---|---|---|---|---|
| Noise | -12% | -17% | -26% | 0% | 5% | |
| off / environment * (dB) | 23.5 | 26 -11% | 24.6 -5% | 27 -15% | 23 2% | 23.9 -2% |
| Idle Minimum * (dB) | 23.8 | 26 -9% | 29.2 -23% | 27 -13% | 23 3% | 23.9 -0% |
| Idle Average * (dB) | 23.8 | 27 -13% | 29.2 -23% | 35 -47% | 28.11 -18% | 23.9 -0% |
| Idle Maximum * (dB) | 26.8 | 32 -19% | 29.2 -9% | 38 -42% | 28.11 -5% | 23.9 11% |
| Load Average * (dB) | 37.3 | 50 -34% | 50.7 -36% | 52 -39% | 30.62 18% | 34.3 8% |
| Witcher 3 ultra * (dB) | 48 | 51 -6% | 53.3 -11% | 56 -17% | 49.75 -4% | |
| Load Maximum * (dB) | 53.5 | 51 5% | 61 -14% | 59 -10% | 50.17 6% | 45.9 14% |
* ... smaller is better
温度
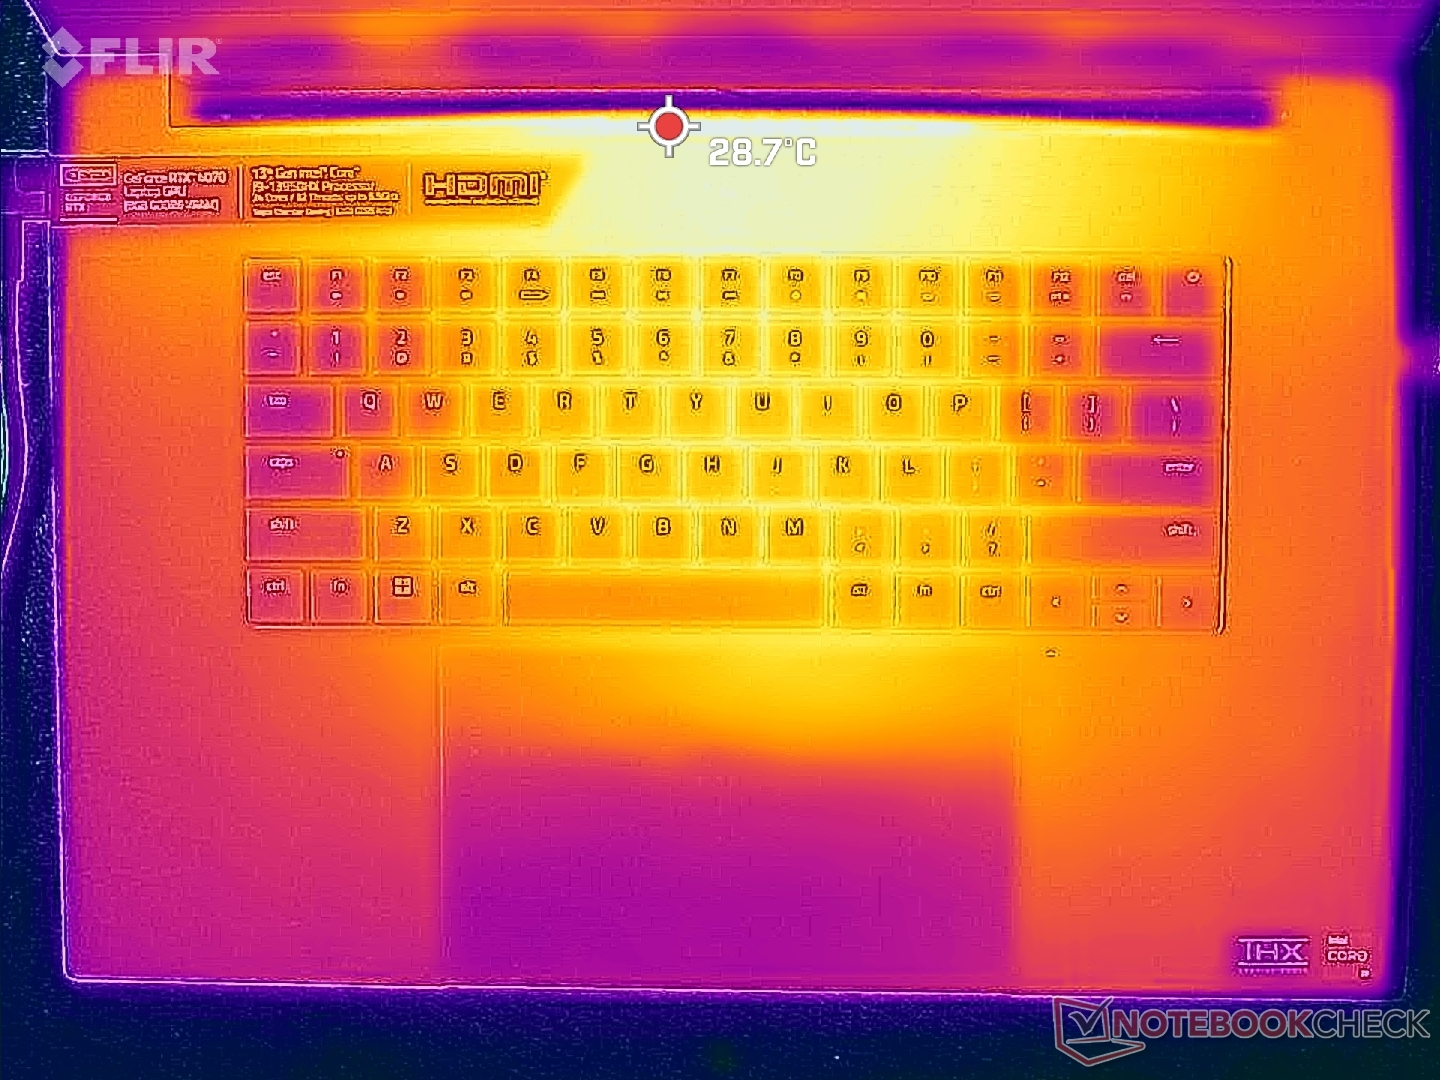
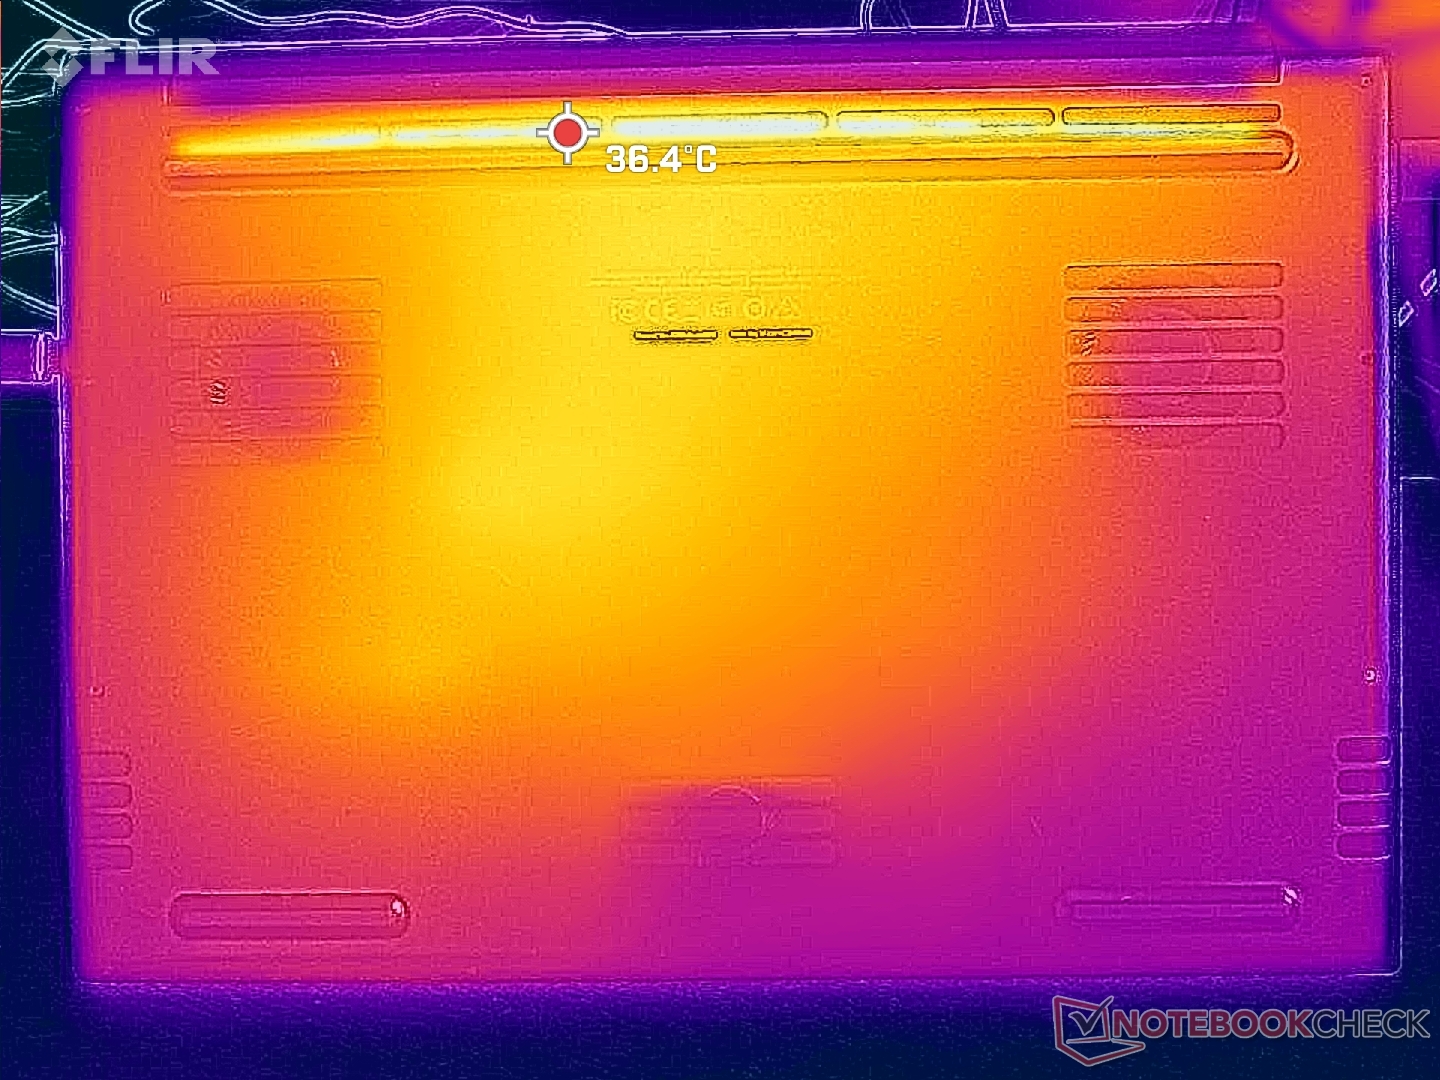
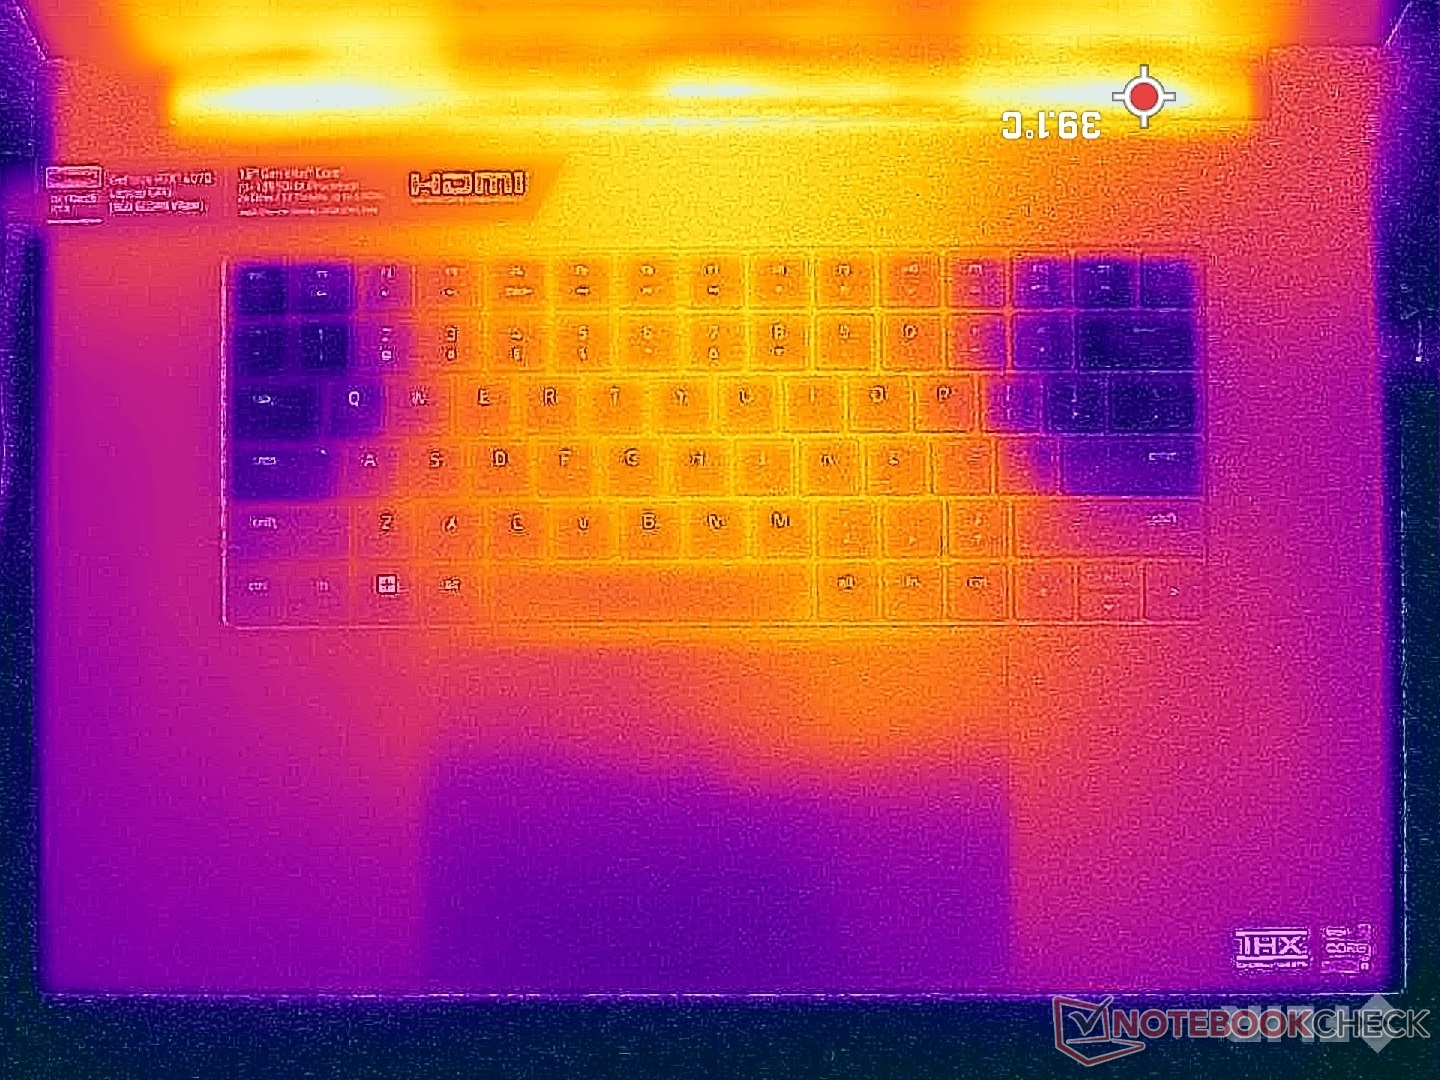
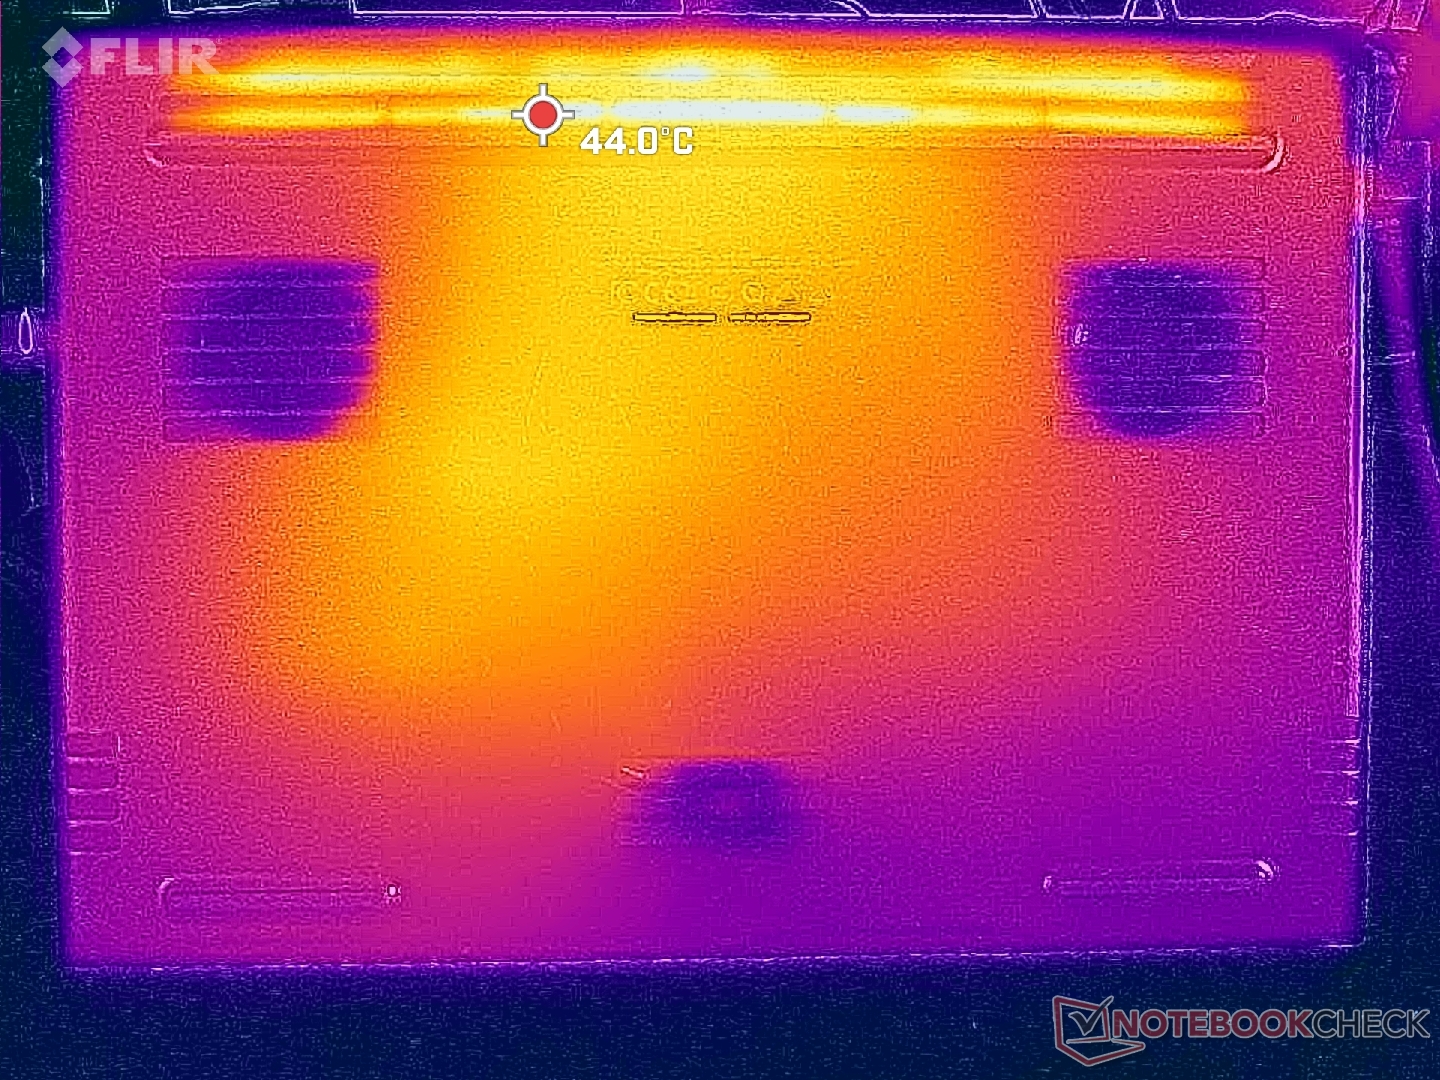
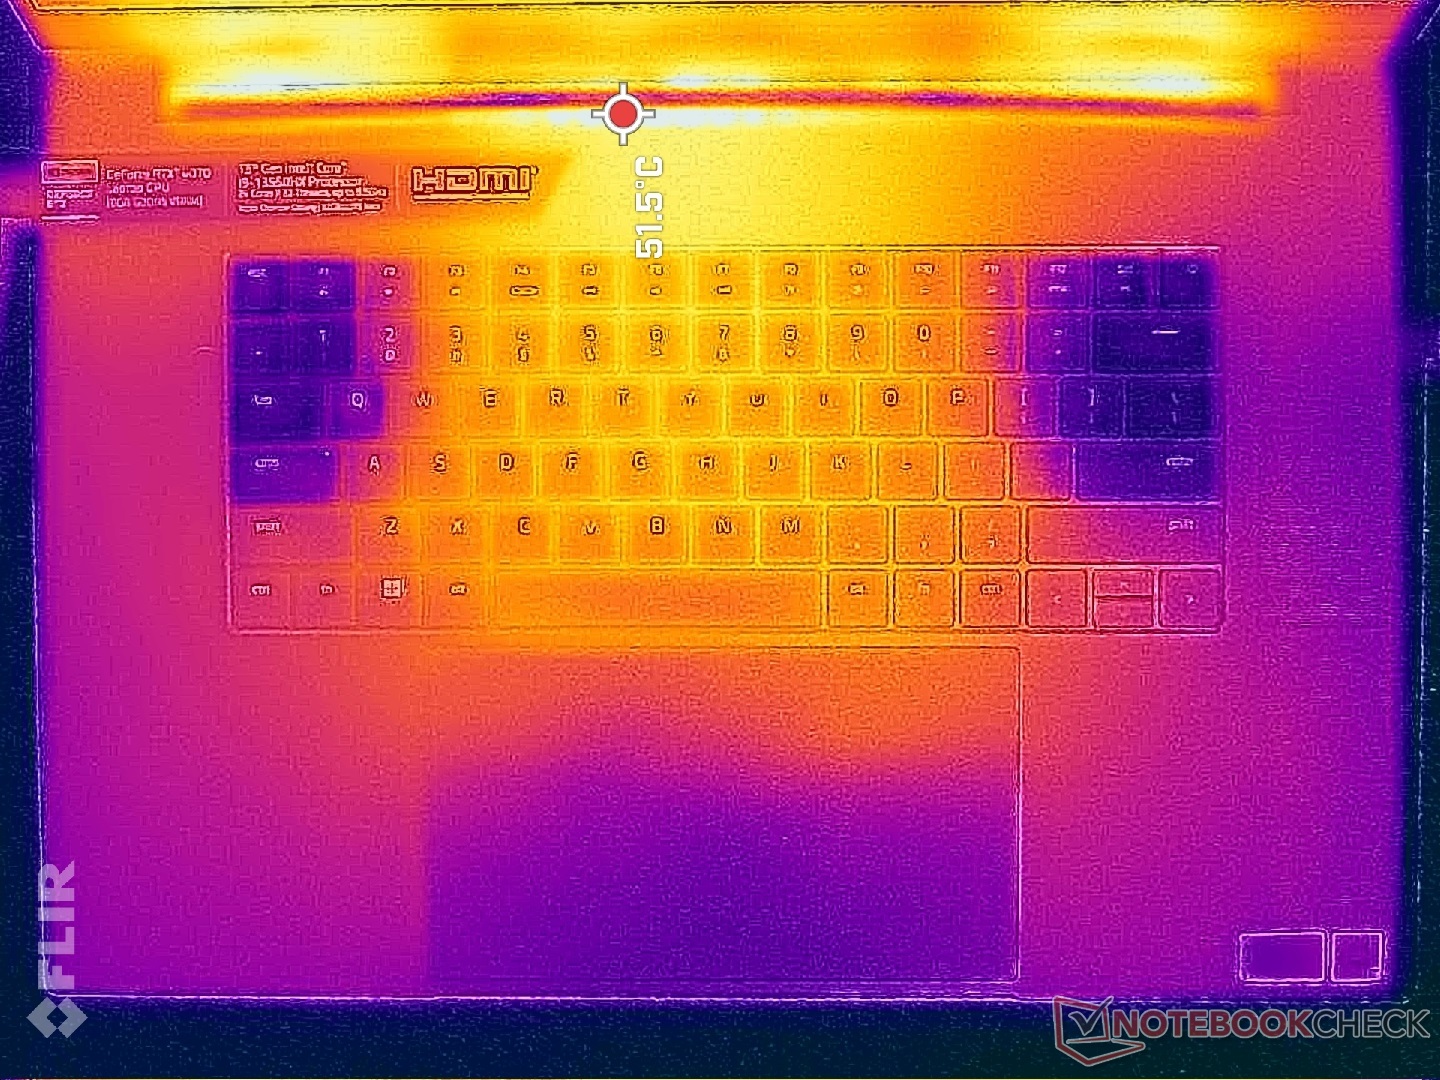
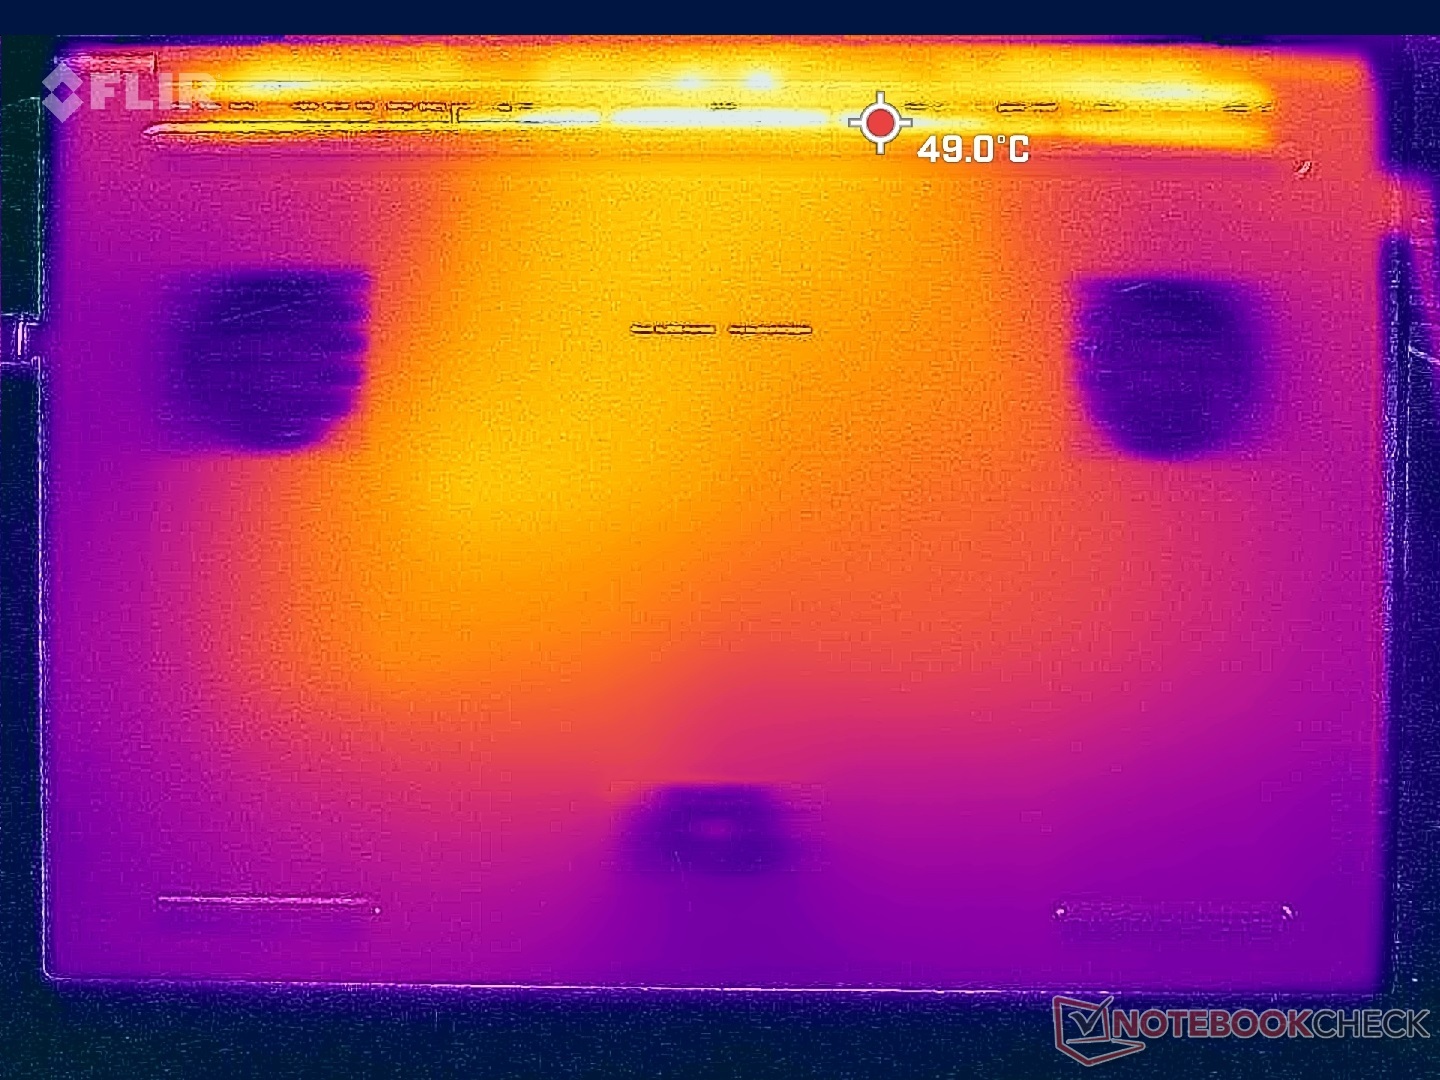
表面温度对于游戏笔记本电脑来说相对较低,这可能是由于18英寸的大尺寸,带有三个风扇的蒸汽室冷却器,以及140瓦的TGP GPU。更快的RTX 4080或4090配置可能会比我们在这里记录的更热,因为它们都有一个更高的175 W上限。
运行时的热点 Witcher 3顶端只有36摄氏度,底部为33摄氏度,而Alienware m17 R5的温度为50摄氏度至57摄氏度。 而Alienware m17 R5.配备RTX 4070的Blade 18是我们迄今为止测试过的最酷的游戏笔记本电脑之一,很明显,该机箱是为处理比我们的RTX 4070配置更强大的选项而建造的。
空转时的表面温度比预期的略高,因为风扇在低负荷时往往会空转。只要后缘通风良好,Blade 18就不会让皮肤感到不舒服。
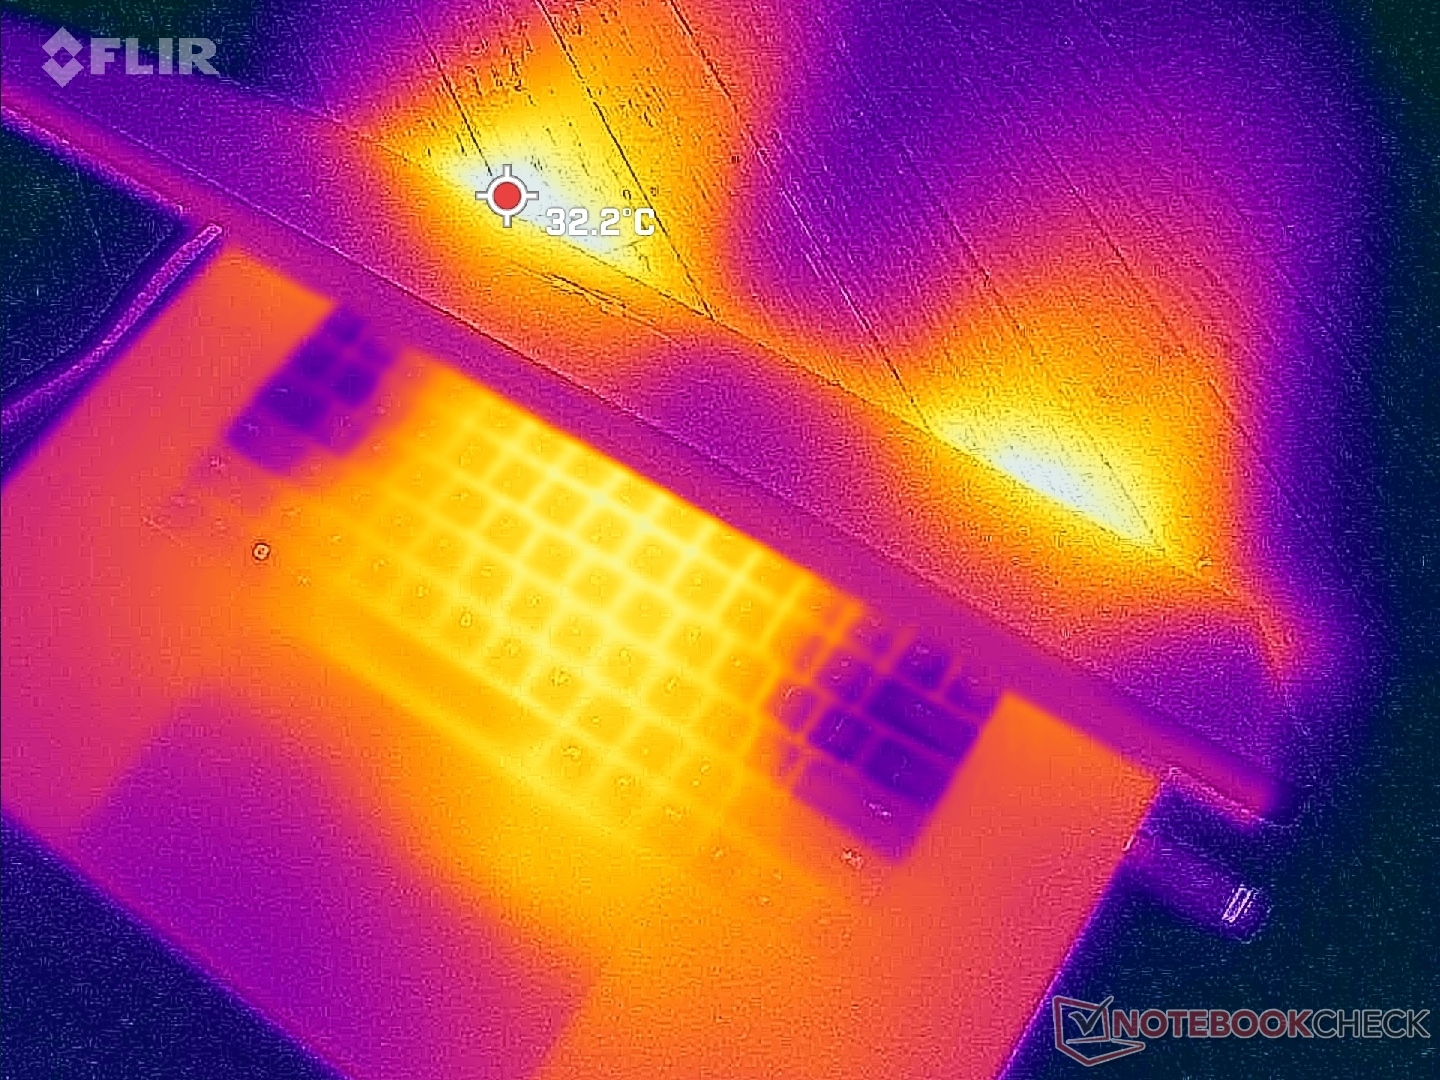
(+) The maximum temperature on the upper side is 39.2 °C / 103 F, compared to the average of 40.4 °C / 105 F, ranging from 21.2 to 68.8 °C for the class Gaming.
(+) The bottom heats up to a maximum of 35.6 °C / 96 F, compared to the average of 43.2 °C / 110 F
(+) In idle usage, the average temperature for the upper side is 28.1 °C / 83 F, compared to the device average of 33.9 °C / 93 F.
(+) Playing The Witcher 3, the average temperature for the upper side is 28.9 °C / 84 F, compared to the device average of 33.9 °C / 93 F.
(+) The palmrests and touchpad are cooler than skin temperature with a maximum of 26 °C / 78.8 F and are therefore cool to the touch.
(+) The average temperature of the palmrest area of similar devices was 28.8 °C / 83.8 F (+2.8 °C / 5 F).
| Razer Blade 18 RTX 4070 Intel Core i9-13950HX, NVIDIA GeForce RTX 4070 Laptop GPU | Razer Blade 17 Early 2022 Intel Core i9-12900H, NVIDIA GeForce RTX 3080 Ti Laptop GPU | MSI Titan GT77 HX 13VI Intel Core i9-13950HX, NVIDIA GeForce RTX 4090 Laptop GPU | Gigabyte G7 KE Intel Core i5-12500H, NVIDIA GeForce RTX 3060 Laptop GPU | Alienware m17 R5 (R9 6900HX, RX 6850M XT) AMD Ryzen 9 6900HX, AMD Radeon RX 6850M XT | Asus ROG Strix Scar 17 SE G733CX-LL014W Intel Core i9-12950HX, NVIDIA GeForce RTX 3080 Ti Laptop GPU | |
|---|---|---|---|---|---|---|
| Heat | -28% | 2% | -17% | -18% | -18% | |
| Maximum Upper Side * (°C) | 39.2 | 50 -28% | 40.6 -4% | 52 -33% | 53 -35% | 48.8 -24% |
| Maximum Bottom * (°C) | 35.6 | 56 -57% | 41.1 -15% | 54 -52% | 56 -57% | 52.4 -47% |
| Idle Upper Side * (°C) | 31.8 | 36 -13% | 26.2 18% | 28 12% | 30 6% | 30.4 4% |
| Idle Bottom * (°C) | 33.2 | 38 -14% | 30.3 9% | 32 4% | 29 13% | 34.1 -3% |
* ... smaller is better
压力测试
当运行Prime95对CPU施加压力时,时钟频率和电路板功耗将分别飙升至3.8 GHz和140 W,然后在大约70秒后降至3.1 GHz和110至120 W范围。核心温度将稳定在87摄氏度,而配备相同CPU的Blade 16则为82摄氏度。
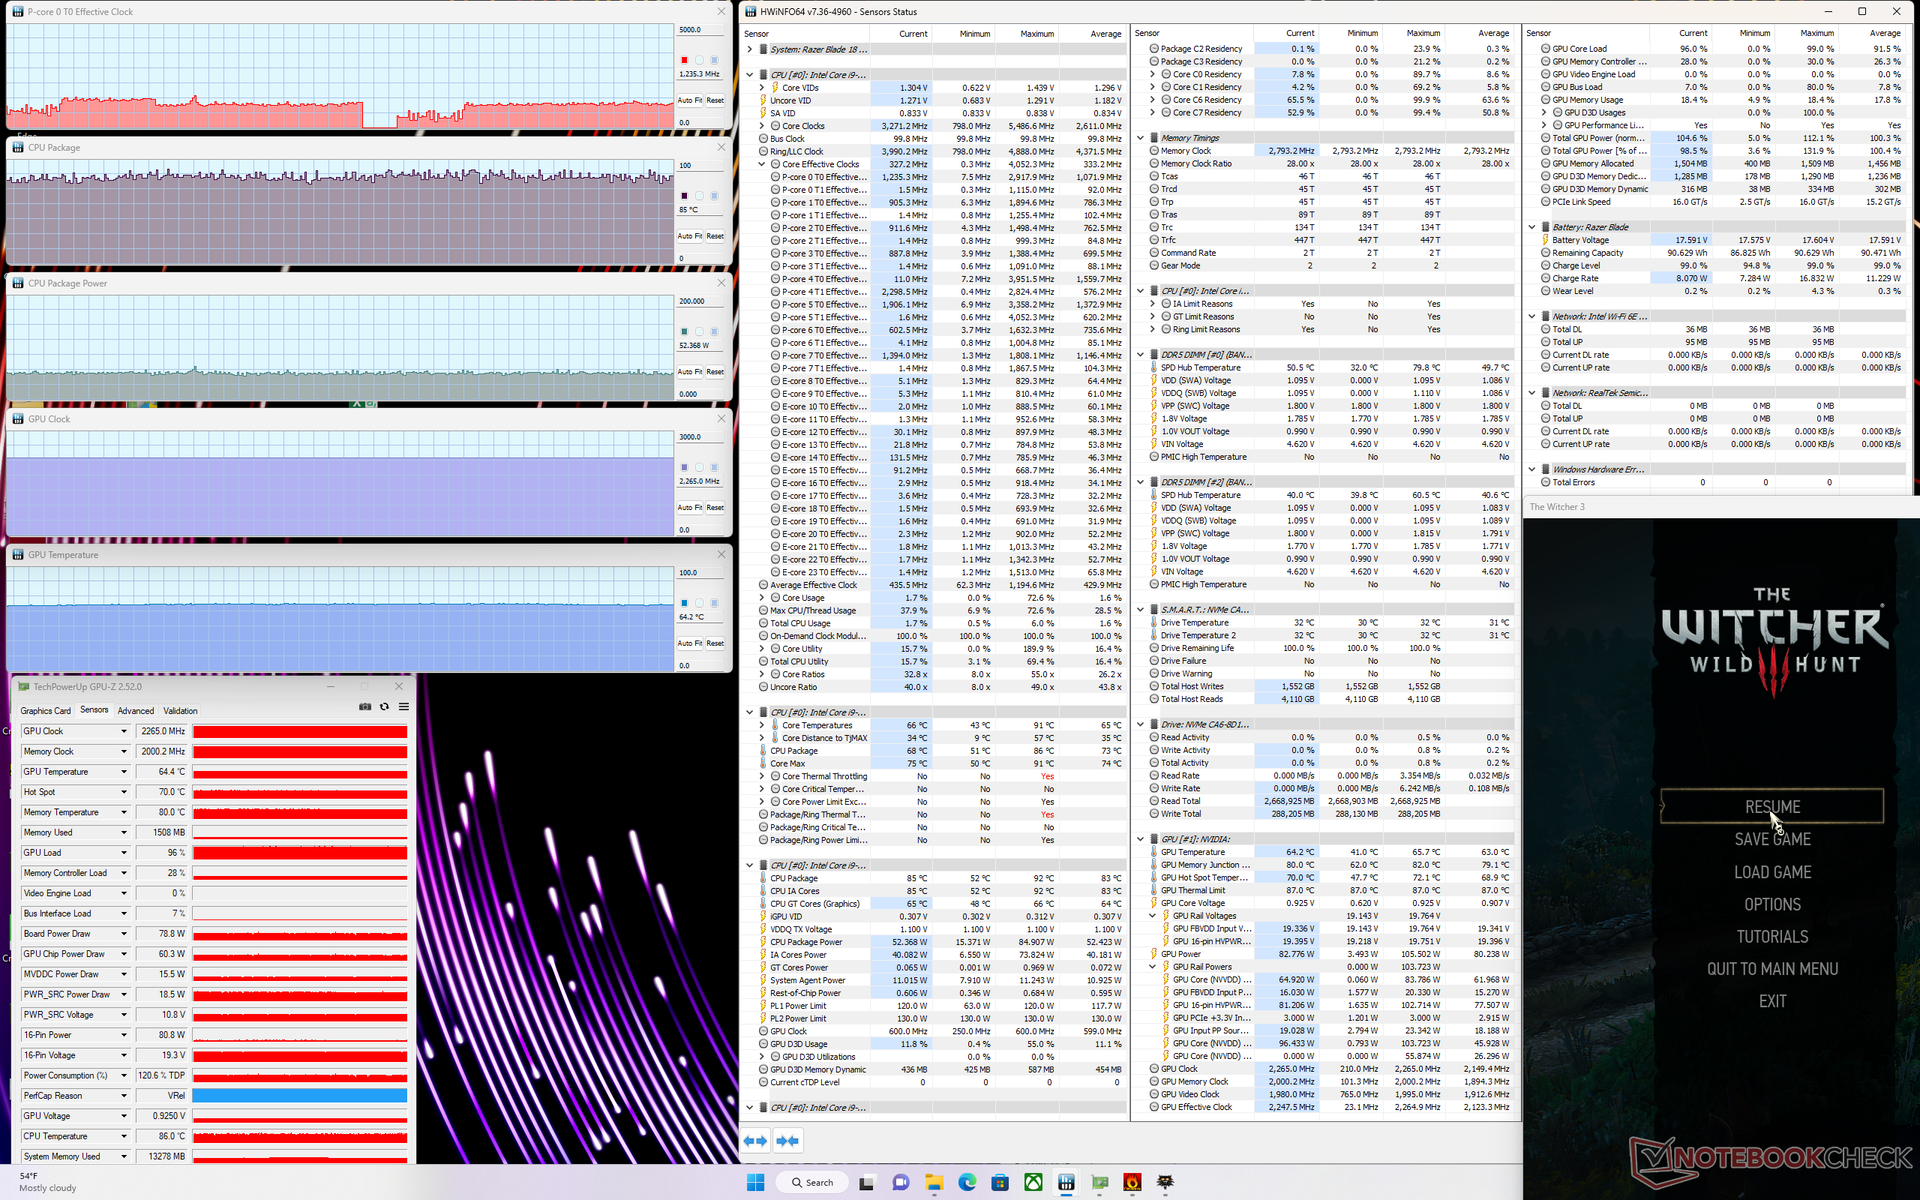
运行时,GPU时钟频率、温度和主板功耗将分别稳定在2265 MHz、64 C和80至90 W。 Witcher 3.GPU本身的额定功率为140 W TGP,因此,即使设置为性能模式,~80 W的范围也比预期的低得多。我们只有在运行《赛博朋克2077》这样要求更高的游戏时,才能使GPU达到100W的峰值。相比之下,RTX 4080 GPU在 刀锋16在运行相同的测试时,将稳定在~160 W,而其目标是175 W TGP。 Witcher 3测试。
用电池供电运行限制了性能。在电池上进行的3DMark 11测试将返回物理和图形分数,分别为10336和18043分,而在主电源上则为25874和39733分。
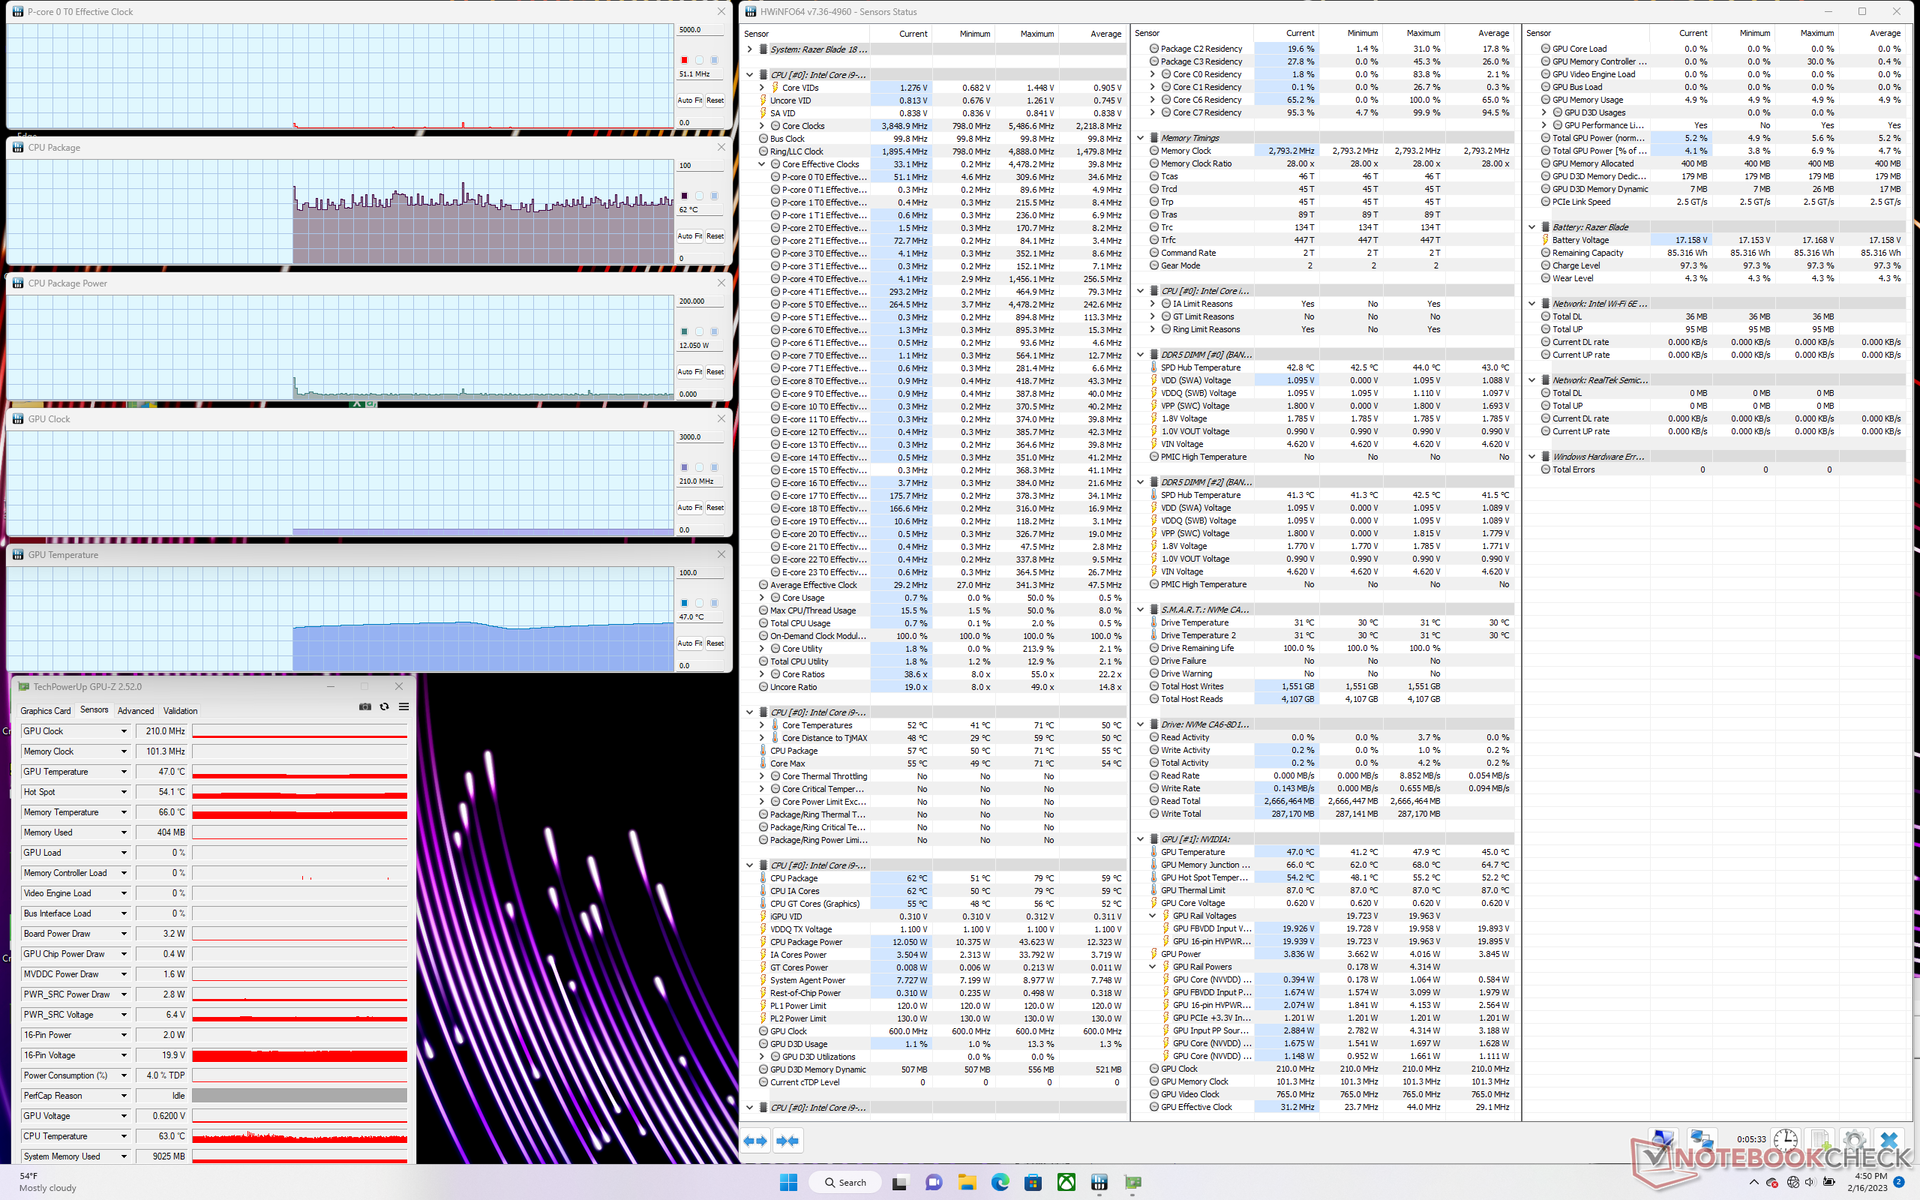
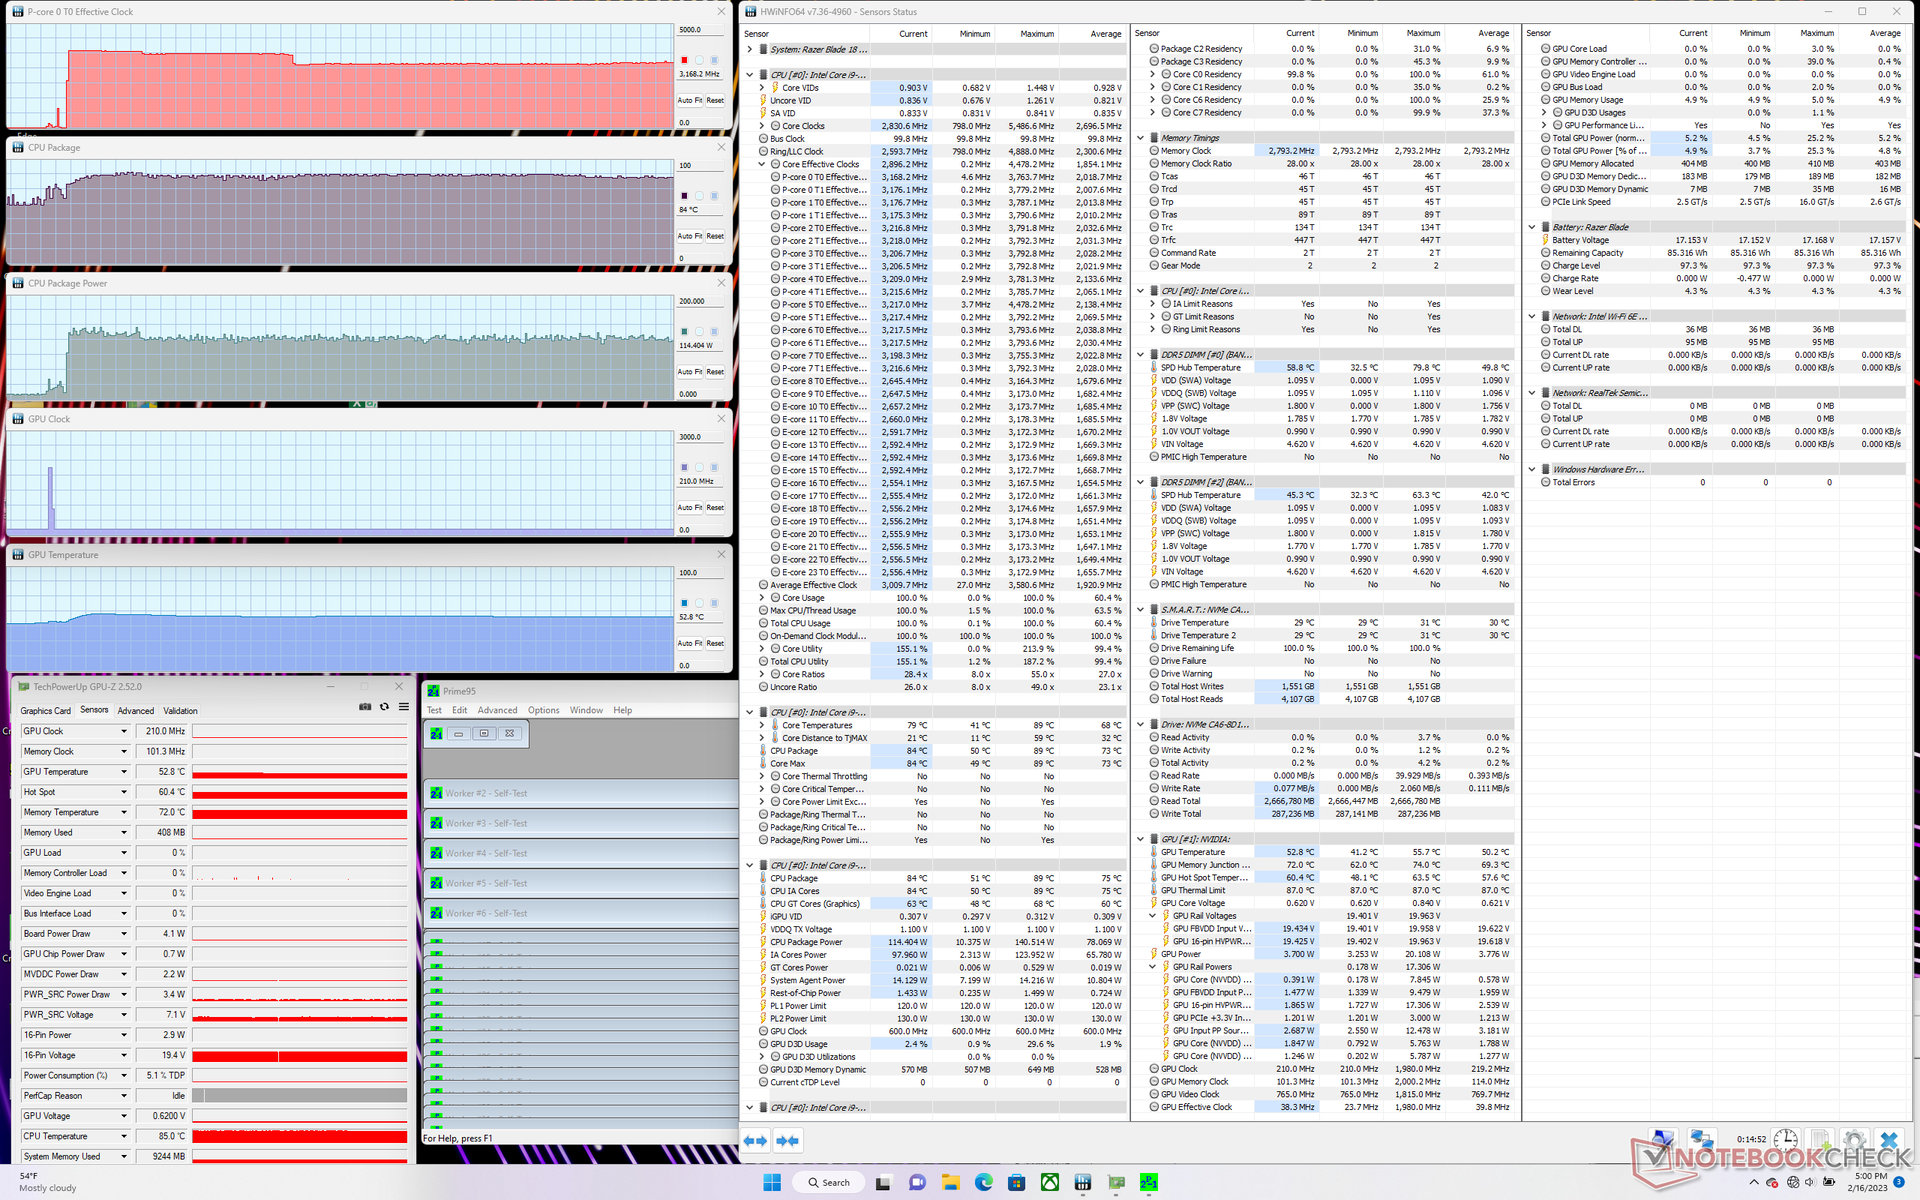
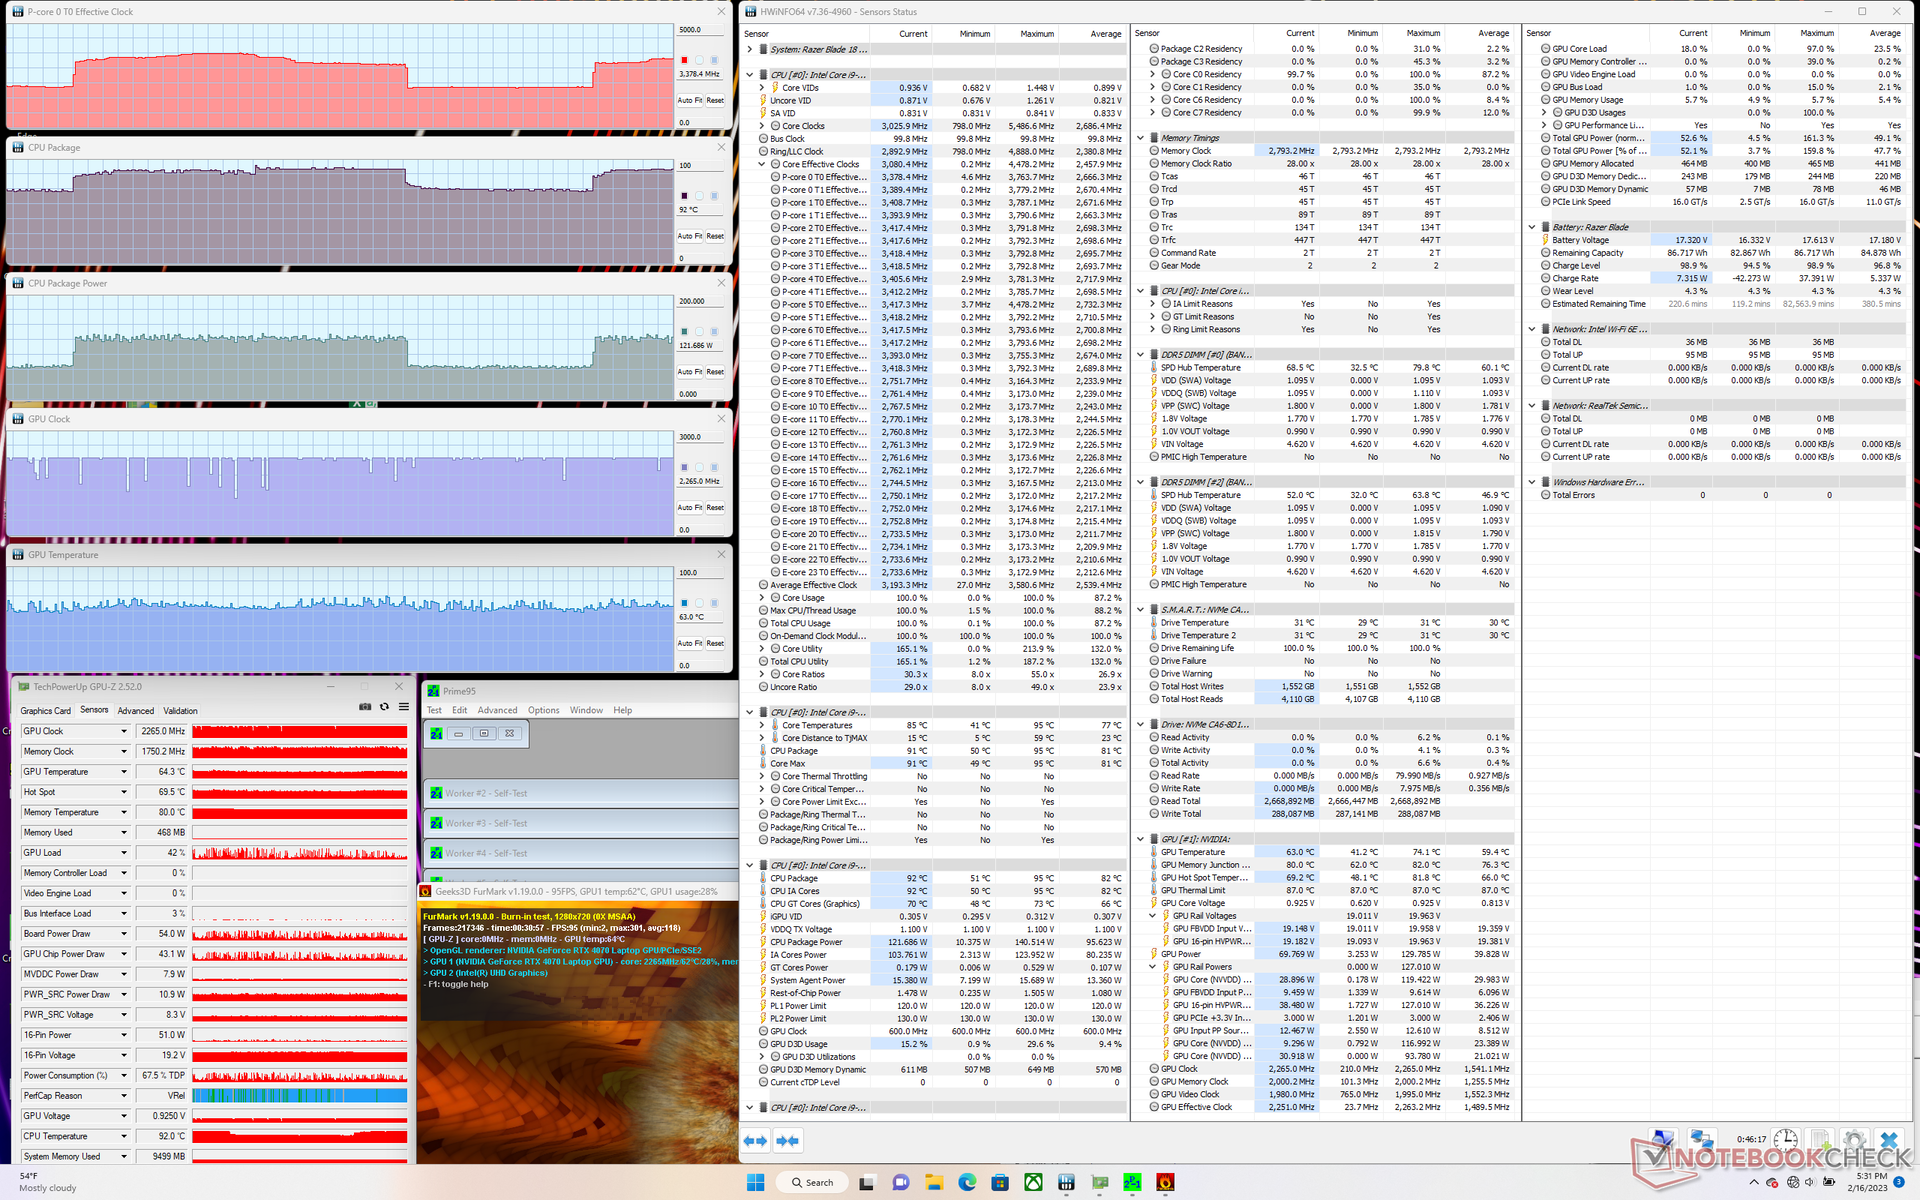
| CPU时钟(GHz) | GPU时钟(MHz) | CPU平均温度(°C) | GPU平均温度(°C) | |
| 系统空闲 | -- | -- | 62 | 47 |
| Prime95压力 | 3.2 | -- | 84 | 53 |
| Prime95 + FurMark 压力 | 2.0 - 3.7 | 2265 | 70 - 91 | 63 |
| Witcher 3 应力 | ~1.2 | 2265 | 85 | 64 |
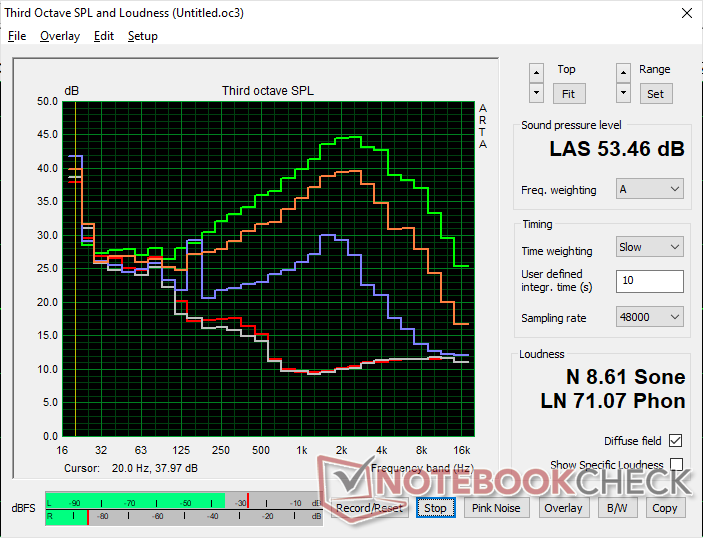
发言人
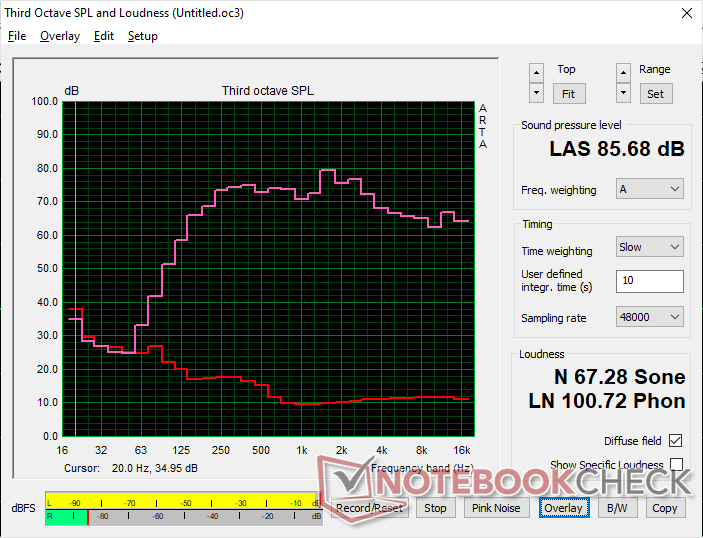
Razer Blade 18 RTX 4070 audio analysis
(+) | speakers can play relatively loud (85.7 dB)
Bass 100 - 315 Hz
(±) | reduced bass - on average 7.5% lower than median
(±) | linearity of bass is average (9.2% delta to prev. frequency)
Mids 400 - 2000 Hz
(+) | balanced mids - only 3.5% away from median
(+) | mids are linear (4.1% delta to prev. frequency)
Highs 2 - 16 kHz
(+) | balanced highs - only 4.8% away from median
(+) | highs are linear (3.8% delta to prev. frequency)
Overall 100 - 16.000 Hz
(+) | overall sound is linear (9.2% difference to median)
Compared to same class
» 3% of all tested devices in this class were better, 1% similar, 96% worse
» The best had a delta of 6%, average was 18%, worst was 132%
Compared to all devices tested
» 3% of all tested devices were better, 1% similar, 96% worse
» The best had a delta of 4%, average was 23%, worst was 134%
Apple MacBook Pro 16 2021 M1 Pro audio analysis
(+) | speakers can play relatively loud (84.7 dB)
Bass 100 - 315 Hz
(+) | good bass - only 3.8% away from median
(+) | bass is linear (5.2% delta to prev. frequency)
Mids 400 - 2000 Hz
(+) | balanced mids - only 1.3% away from median
(+) | mids are linear (2.1% delta to prev. frequency)
Highs 2 - 16 kHz
(+) | balanced highs - only 1.9% away from median
(+) | highs are linear (2.7% delta to prev. frequency)
Overall 100 - 16.000 Hz
(+) | overall sound is linear (4.6% difference to median)
Compared to same class
» 0% of all tested devices in this class were better, 0% similar, 100% worse
» The best had a delta of 5%, average was 17%, worst was 45%
Compared to all devices tested
» 0% of all tested devices were better, 0% similar, 100% worse
» The best had a delta of 4%, average was 23%, worst was 134%
能源管理--大显示器,大电力需求
消耗功率
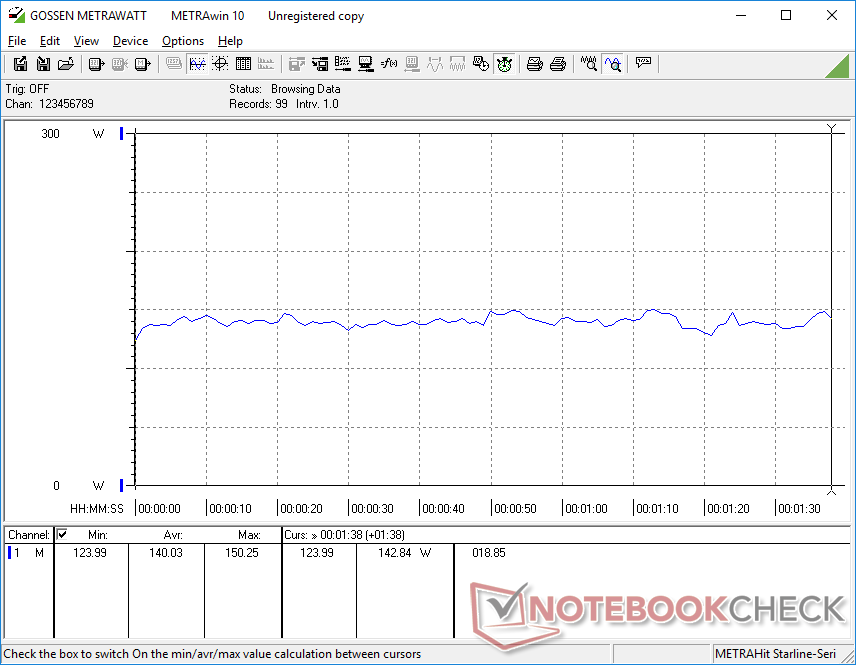
在桌面上闲置时的耗电量在24瓦和48瓦之间,取决于亮度设置和电源配置文件。事实上,最低和最高亮度设置之间的差异高达10瓦。这个范围明显高于大多数其他小型笔记本电脑,这可以解释下一节中的电池寿命结果不尽如人意。
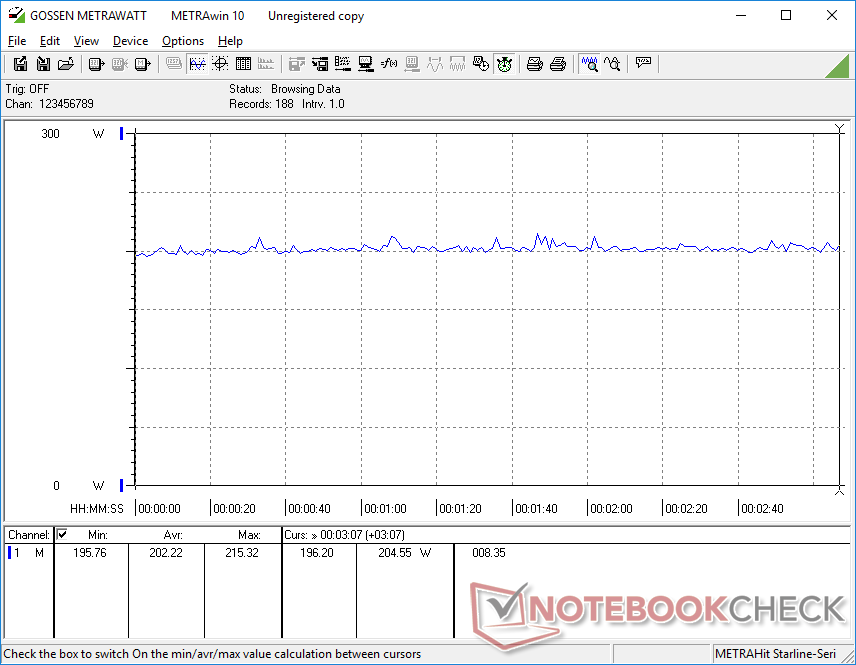
当运行 Witcher 3代表典型的游戏负载时,系统将需要平均202瓦,而搭载RTX 3080 Ti的Blade 17或华硕ROG Strix Scar 17则需要229瓦或225瓦。华硕ROG Strix Scar 17 SE分别为229W和225W。因此,我们的18英寸RTX 4070驱动的系统在提供与上一代移动RTX 3080 Ti几乎相同的图形性能的同时,耗电量减少了约10%。升级到RTX 4080或RTX 4090配置可能会多消耗约40 W至50 W的功率,与我们在Blade 16上观察到的情况类似。
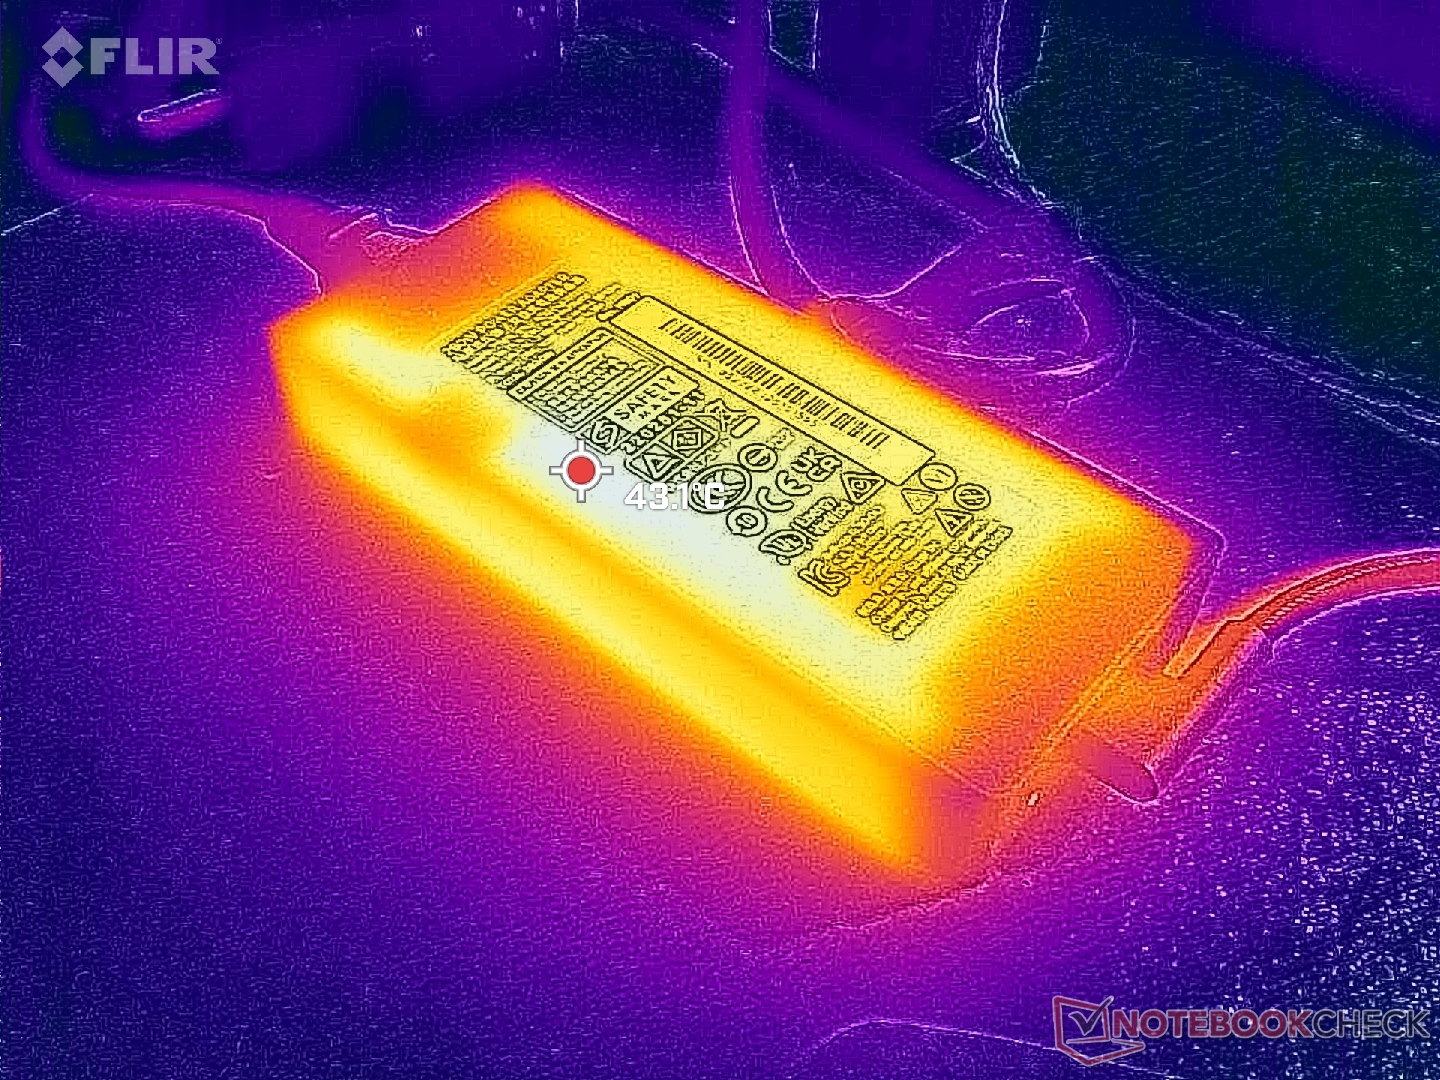
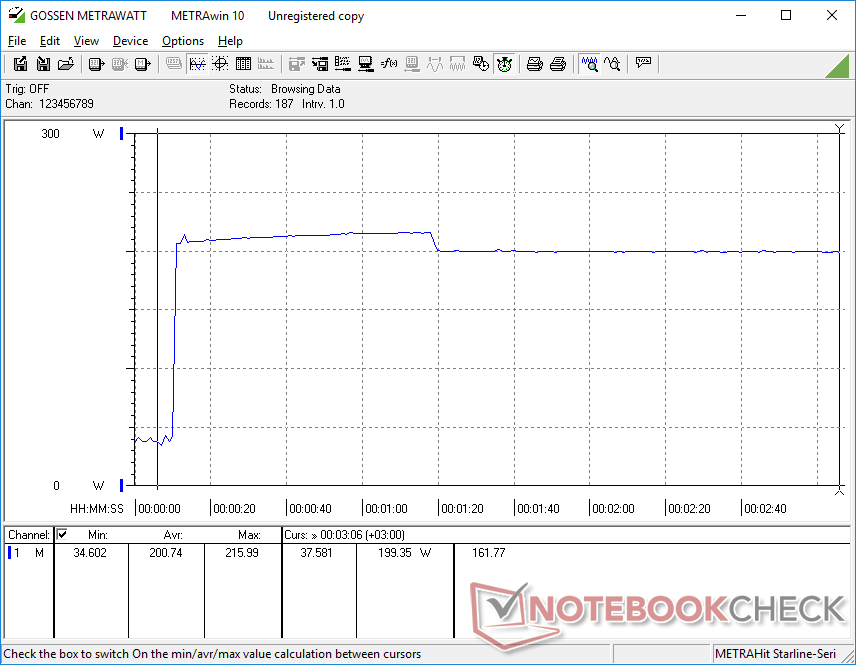
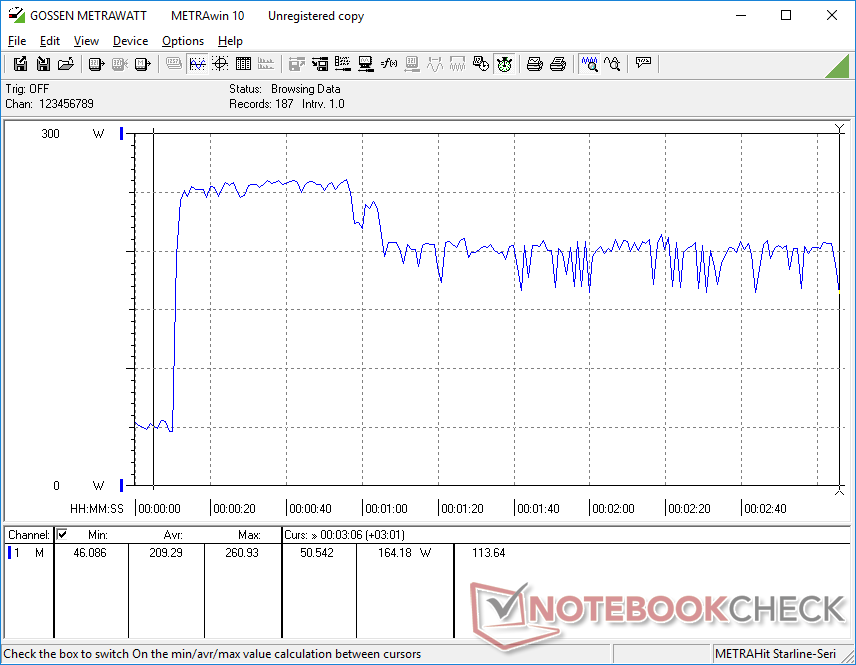
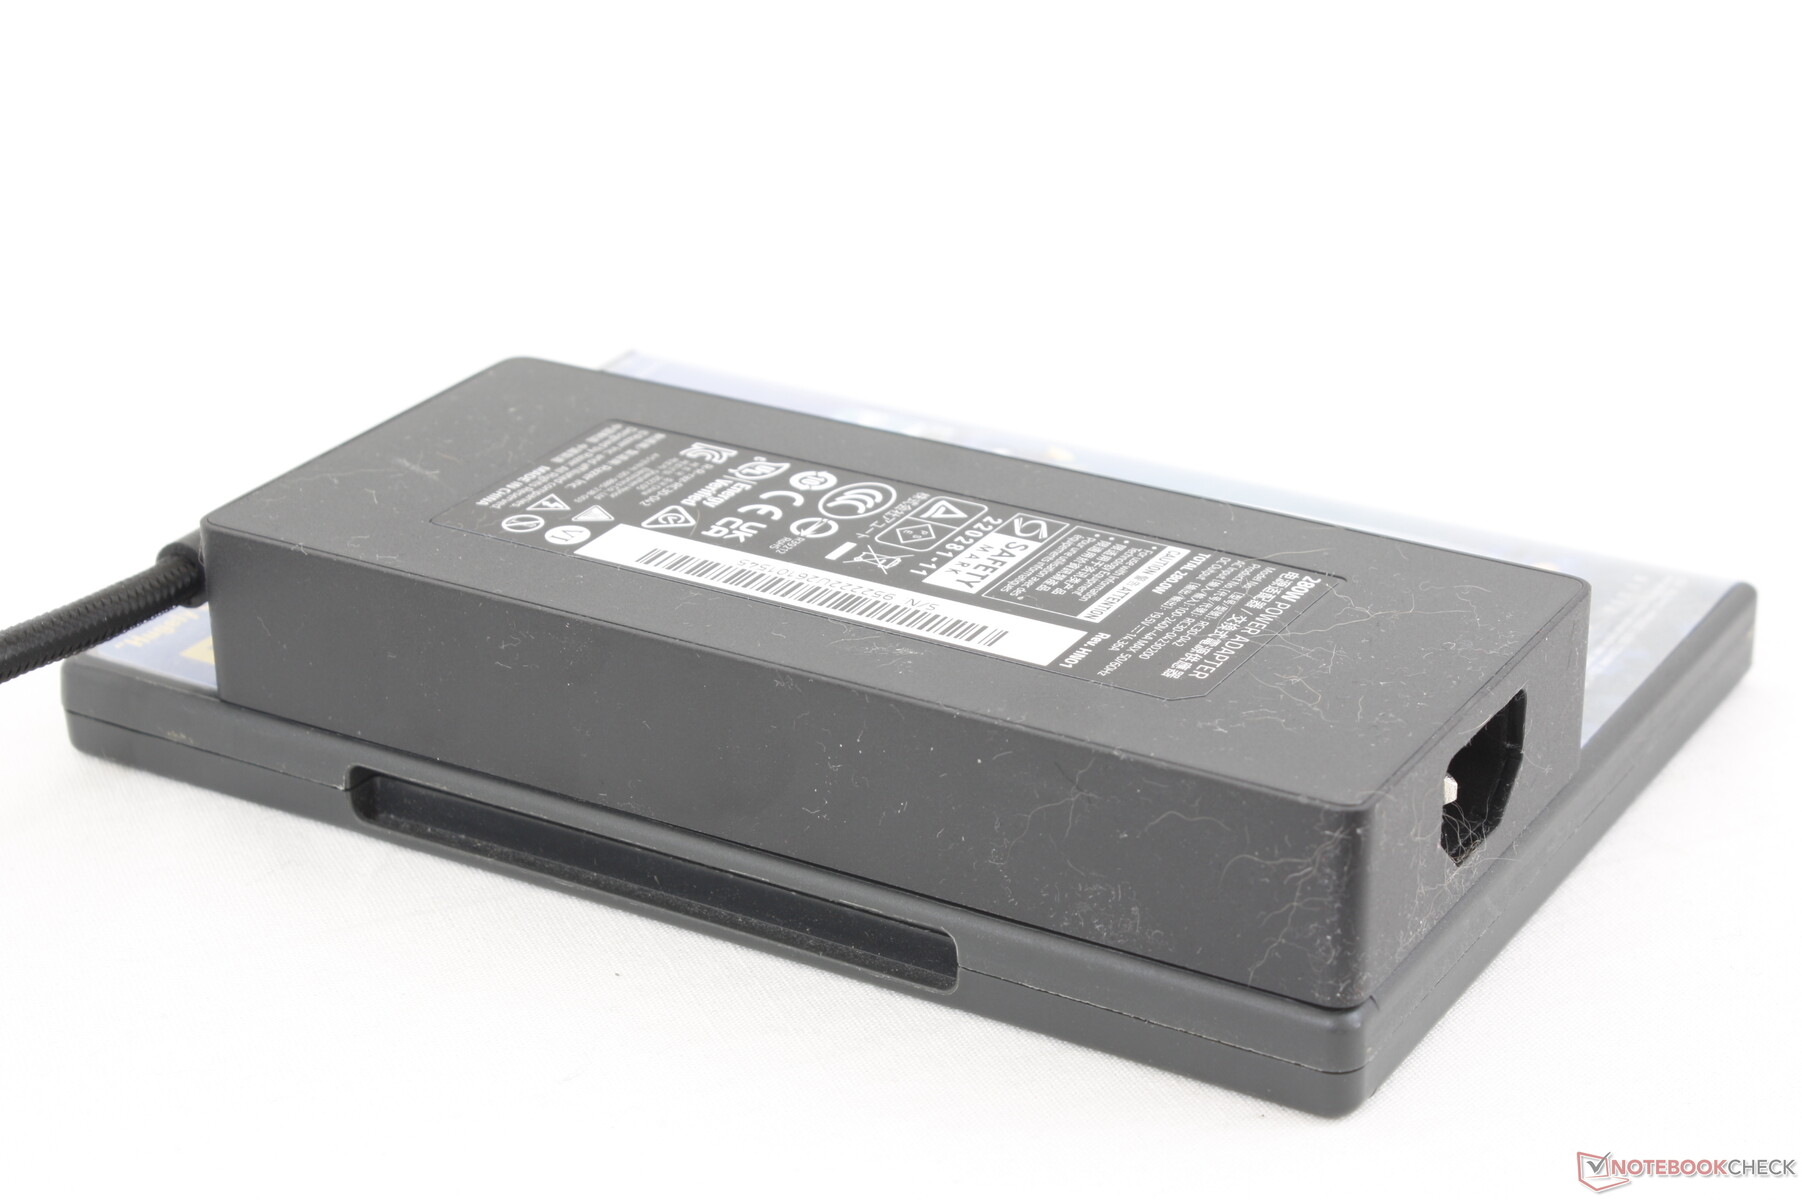
当同时运行Prime95和FurMark时,我们能够从中小型(约16.3 x 7 x 2.5厘米)280 W GaN交流适配器中记录到261 W的临时最大功耗。请记住,根据配置的不同,有两种不同的交流适配器:较小的280 W适配器用于RTX 4060和4070 SKUs,较大的330 W适配器用于RTX 4080和4090 SKUs。
| Off / Standby | |
| Idle | |
| Load |
|
Key:
min: | |
| Razer Blade 18 RTX 4070 i9-13950HX, GeForce RTX 4070 Laptop GPU, SSSTC CA6-8D1024, IPS, 2560x1600, 18" | Razer Blade 17 Early 2022 i9-12900H, GeForce RTX 3080 Ti Laptop GPU, Samsung PM9A1 MZVL21T0HCLR, IPS, 3840x2160, 17.3" | MSI Titan GT77 HX 13VI i9-13950HX, GeForce RTX 4090 Laptop GPU, Samsung PM9A1 MZVL22T0HBLB, Mini-LED, 3840x2160, 17.3" | Gigabyte G7 KE i5-12500H, GeForce RTX 3060 Laptop GPU, Gigabyte AG470S1TB-SI B10, IPS, 1920x1080, 17.3" | Alienware m17 R5 (R9 6900HX, RX 6850M XT) R9 6900HX, Radeon RX 6850M XT, SSSTC CA6-8D1024, IPS, 3840x2160, 17" | Asus ROG Strix Scar 17 SE G733CX-LL014W i9-12950HX, GeForce RTX 3080 Ti Laptop GPU, Samsung PM9A1 MZVL22T0HBLB, IPS, 2560x1440, 17.3" | |
|---|---|---|---|---|---|---|
| Power Consumption | 17% | 8% | 32% | 31% | 9% | |
| Idle Minimum * (Watt) | 24.5 | 17 31% | 14 43% | 15 39% | 13 47% | 19.3 21% |
| Idle Average * (Watt) | 34.1 | 23 33% | 21.6 37% | 17 50% | 16.5 52% | 26.5 22% |
| Idle Maximum * (Watt) | 47.7 | 34 29% | 24.8 48% | 24 50% | 17 64% | 27.1 43% |
| Load Average * (Watt) | 140 | 120 14% | 122.5 12% | 111 21% | 93 34% | 141 -1% |
| Witcher 3 ultra * (Watt) | 202 | 229 -13% | 265 -31% | 174.1 14% | 239 -18% | 225 -11% |
| Load Maximum * (Watt) | 261 | 243 7% | 418 -60% | 208 20% | 251 4% | 307.9 -18% |
* ... smaller is better
Power Consumption Witcher 3 / Stresstest
Power Consumption external Monitor
电池寿命
最大的刀锋型号也带有家族中最大的电池容量91.7Wh,这并非巧合。然而,电池寿命并不一定更长,在许多情况下甚至可能更短。我们能够在平衡电源配置文件上浏览网页4个小时,然后才需要充电,这几乎比去年的Blade 15短了整整一个小时。将显示器刷新率降至60赫兹,而不是240赫兹,可以略微延长电池寿命。
从空电到满电大约需要90分钟。用户还可以通过USB-C为系统充电,尽管速度较慢。
| Razer Blade 18 RTX 4070 i9-13950HX, GeForce RTX 4070 Laptop GPU, 91.7 Wh | Razer Blade 17 Early 2022 i9-12900H, GeForce RTX 3080 Ti Laptop GPU, 82 Wh | MSI Titan GT77 HX 13VI i9-13950HX, GeForce RTX 4090 Laptop GPU, 99.9 Wh | Gigabyte G7 KE i5-12500H, GeForce RTX 3060 Laptop GPU, 54 Wh | Alienware m17 R5 (R9 6900HX, RX 6850M XT) R9 6900HX, Radeon RX 6850M XT, 97 Wh | Asus ROG Strix Scar 17 SE G733CX-LL014W i9-12950HX, GeForce RTX 3080 Ti Laptop GPU, 90 Wh | |
|---|---|---|---|---|---|---|
| Battery runtime | 9% | 21% | 11% | 29% | 5% | |
| Reader / Idle (h) | 7 | 7.1 1% | 7.1 1% | |||
| WiFi v1.3 (h) | 4 | 3.8 -5% | 5.3 33% | 5.3 33% | 4.8 20% | 4.2 5% |
| Load (h) | 1.3 | 1.7 31% | 1.4 8% | 1.3 0% | 1.8 38% | |
| H.264 (h) | 4.8 | 6 | 2.2 | 4.9 |
Pros
Cons
结论--喜欢的是硬件,讨厌的是虫子
我们走的时候 对Blade 16印象深刻印象深刻,但对于Blade 18来说,情况就不一样了。我们的设备会表现出一些主要问题,包括在外部显示器上的DLSS 3性能有问题,在据称包括G-Sync的情况下缺少G-Sync支持,以及可能出现的闪烁显示问题。我们考虑在这些问题得到解决之前暂不做评论,但是Blade 18已经在向客户发货,因此我们认为告知可能在市场上购买该产品的读者是正确的。一旦我们从制造商那里得到适当的解决方案,本页面将更新为最终得分。
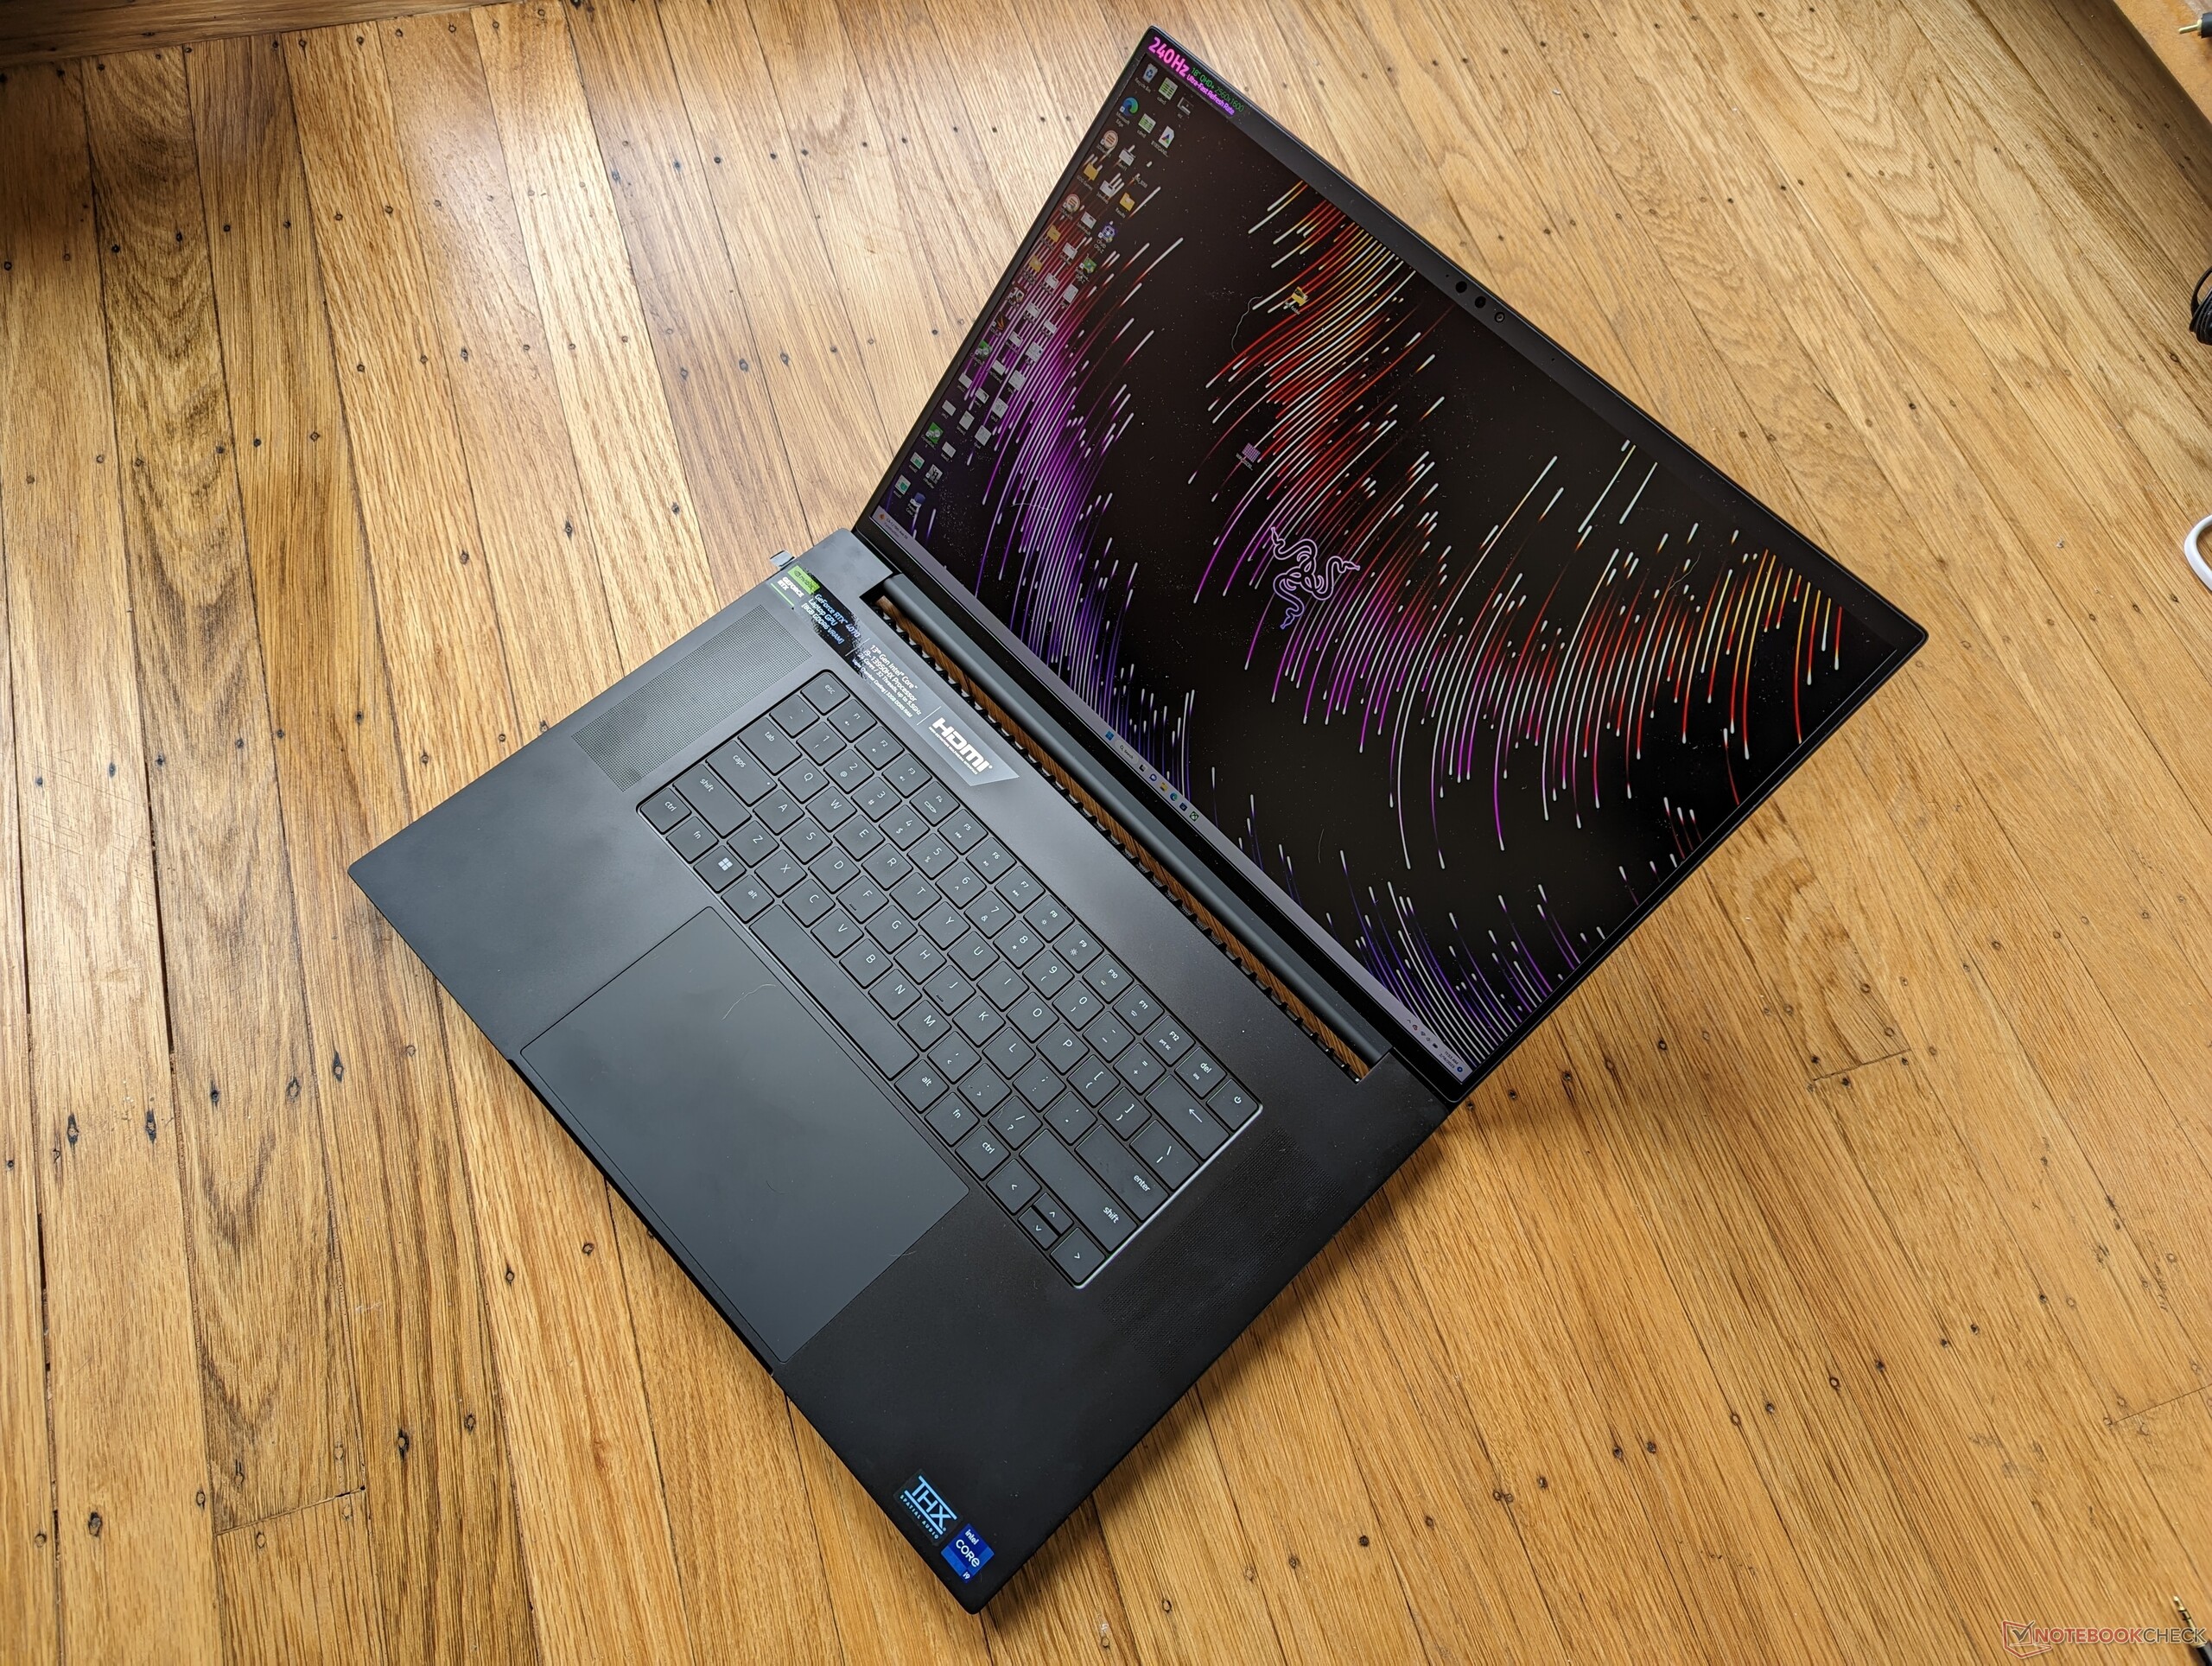
当超越上述问题时,Blade 18显示出成为Blade家族另一个优秀产品的潜力。18英寸的显示屏很华丽,相对于占地面积和重量来说很庞大。事实上,该系统并没有比Blade 17 ,这应该使它对那些可能已经在考虑使用Blade 17或其他17英寸游戏笔记本的用户非常有吸引力。其相对较小的GaN交流适配器进一步增加了Blade 18的便携-DTR混合性质。
刀锋18一开始可能听起来很庞大,但它实际上并不比现有的刀锋17大多少。它的大屏幕和高屏占比让人印象深刻。
至于移动RTX 4070,其性能可能不尽人意,取决于游戏。支持DLSS 3的标题在移动RTX 4070上运行得像黄油一样。否则,预计性能将与去年的移动RTX 3080或桌面RTX 3070相似。幸运的是,支持DLSS 3的游戏清单一直在稳步扩大。
对于被一些值得注意的发布问题所破坏的18英寸刀锋系列来说,这是一个总体上强有力的开始。如果一些关键问题没有得到解决,即将推出的华硕ROG Strix Scar 18和戴尔Alienware m18可能给Blade 18带来麻烦。
Transparency
The selection of devices to be reviewed is made by our editorial team. The test sample was provided to the author as a loan by the manufacturer or retailer for the purpose of this review. The lender had no influence on this review, nor did the manufacturer receive a copy of this review before publication. There was no obligation to publish this review. As an independent media company, Notebookcheck is not subjected to the authority of manufacturers, retailers or publishers.
This is how Notebookcheck is testing
Every year, Notebookcheck independently reviews hundreds of laptops and smartphones using standardized procedures to ensure that all results are comparable. We have continuously developed our test methods for around 20 years and set industry standards in the process. In our test labs, high-quality measuring equipment is utilized by experienced technicians and editors. These tests involve a multi-stage validation process. Our complex rating system is based on hundreds of well-founded measurements and benchmarks, which maintains objectivity. Further information on our test methods can be found here.
Price comparison

