申克 XMG 酷睿 16 游戏笔记本评测--联想Legion Pro 5 16 的真正竞争对手

我们测试的最后一款 XMG Core 是XMG Core 15(88 %)。RTX 3060.现在,申克又推出了 16 英寸版本的酷睿。我们将看看除了屏幕尺寸之外的所有变化。
我们将把酷睿 16 与LenovoLegion Pro 5 16 Gen 8 ,Acer Nitro 16 AN16-41 ,HP Omen Transcend 16 ,MSI Stealth 16 Studio 和HP Victus 16 进行比较。
潜在的竞争对手比较
Rating | Date | Model | Weight | Height | Size | Resolution | Price |
|---|---|---|---|---|---|---|---|
| 89.2 % v7 (old) | 10 / 2023 | Schenker XMG CORE 16 (L23) R7 7840HS, GeForce RTX 4070 Laptop GPU | 2.4 kg | 26.1 mm | 16.00" | 2560x1600 | |
| 88.4 % v7 (old) | 05 / 2023 | Lenovo Legion Pro 5 16ARX8 R7 7745HX, GeForce RTX 4070 Laptop GPU | 2.5 kg | 26.8 mm | 16.00" | 2560x1600 | |
| 88.1 % v7 (old) | 06 / 2023 | Acer Nitro 16 AN16-41 R7 7735HS, GeForce RTX 4070 Laptop GPU | 2.7 kg | 27.9 mm | 16.00" | 2560x1600 | |
| 87.9 % v7 (old) | 08 / 2023 | HP Omen Transcend 16 i9-13900HX, GeForce RTX 4070 Laptop GPU | 2.3 kg | 19.8 mm | 16.00" | 2560x1600 | |
| 88.8 % v7 (old) | 07 / 2023 | MSI Stealth 16 Studio A13VG i7-13700H, GeForce RTX 4070 Laptop GPU | 2 kg | 19.95 mm | 16.00" | 2560x1600 | |
| 85.1 % v7 (old) | 09 / 2023 | HP Victus 16-r0077ng i7-13700H, GeForce RTX 4070 Laptop GPU | 2.4 kg | 24 mm | 16.10" | 1920x1080 |
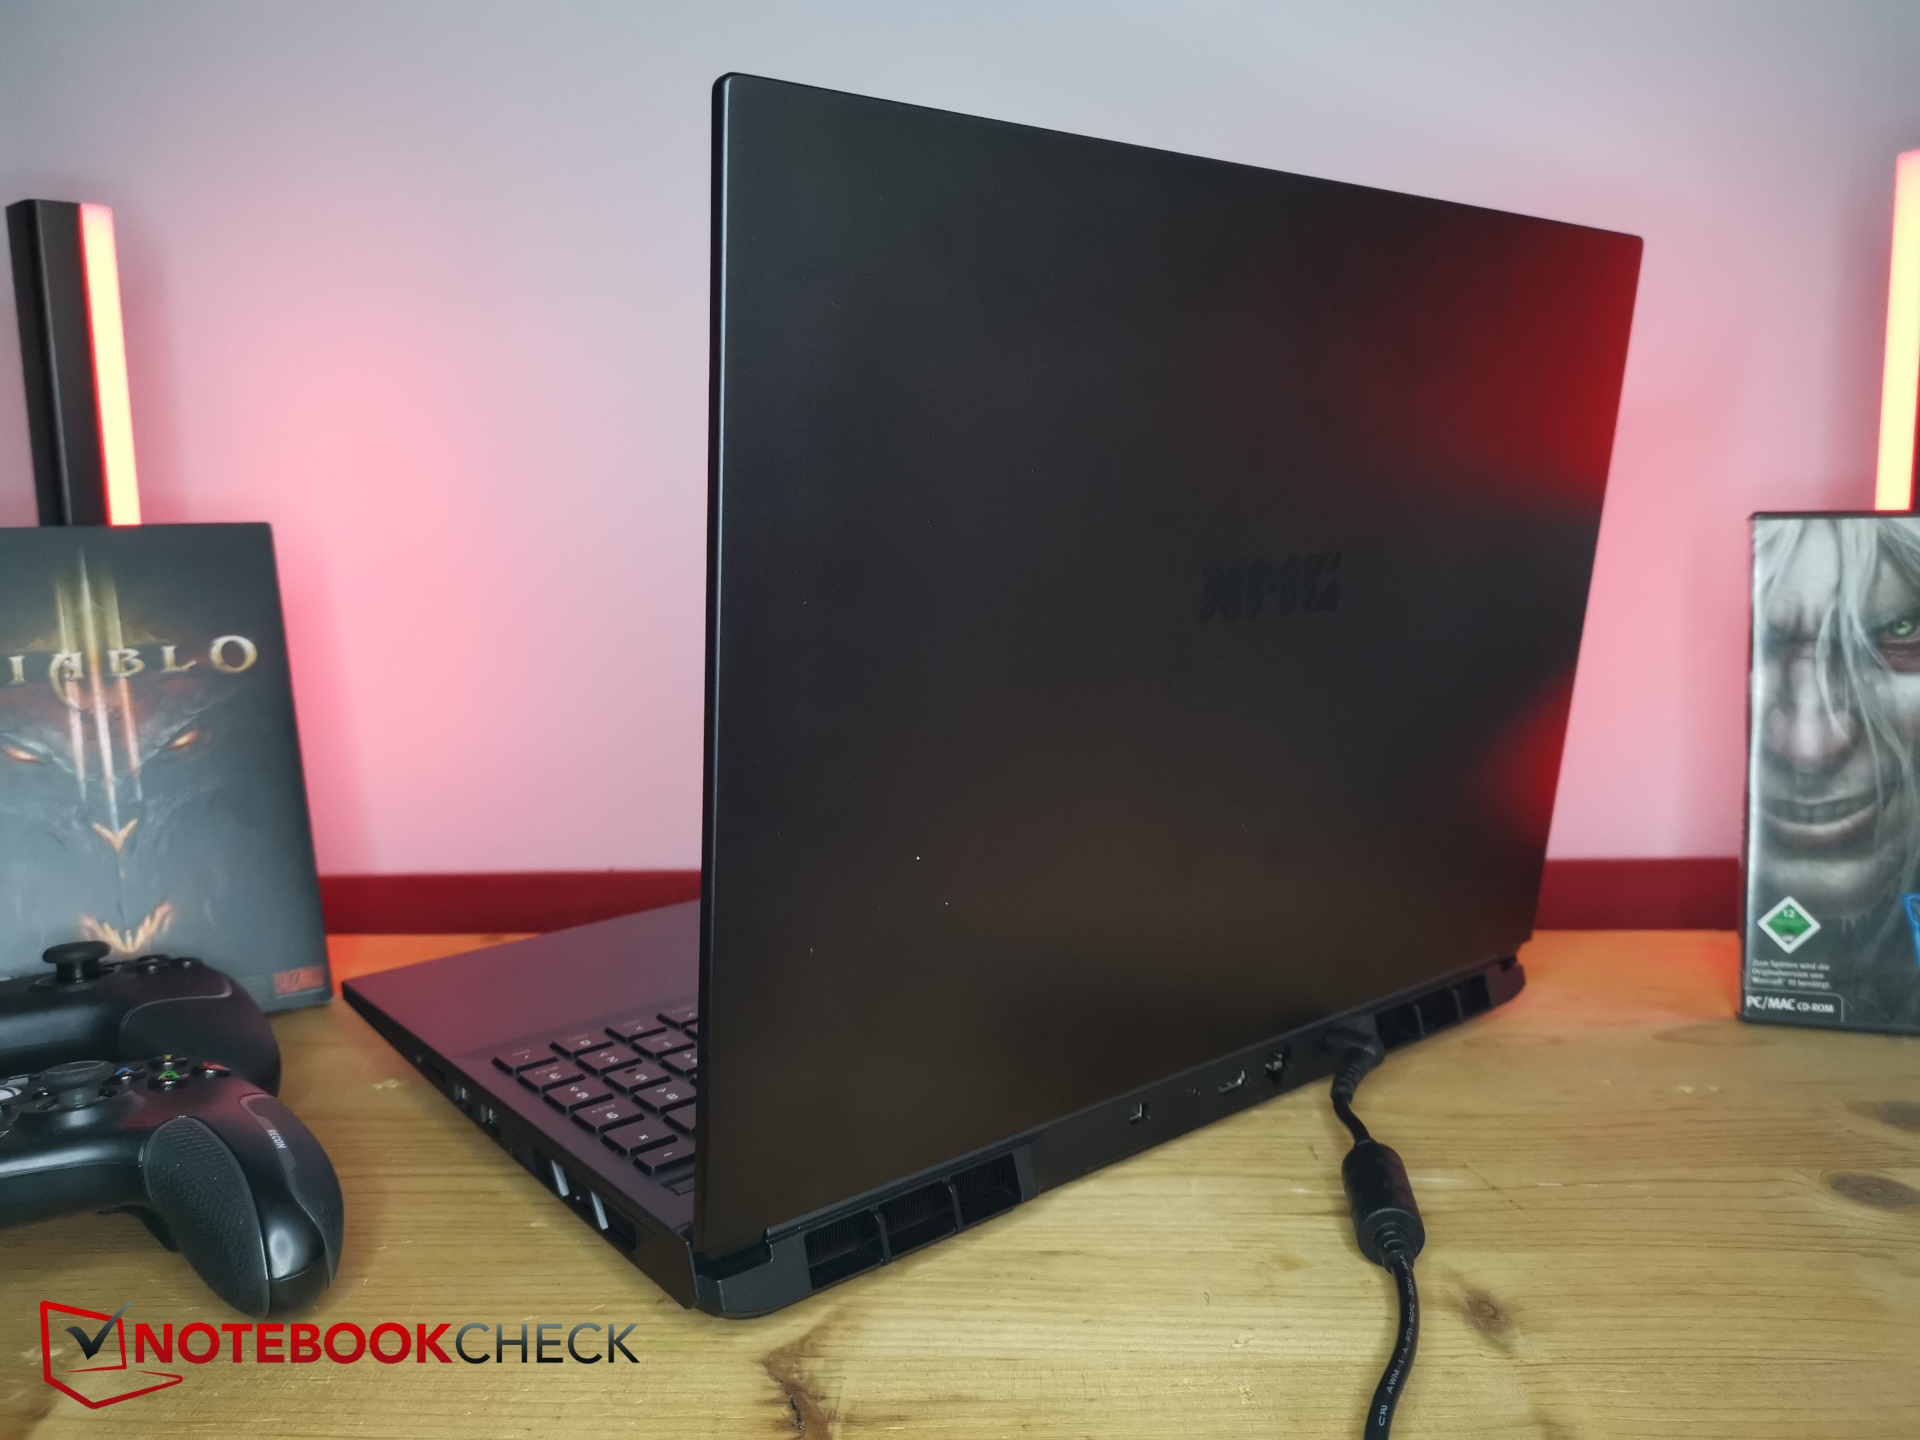
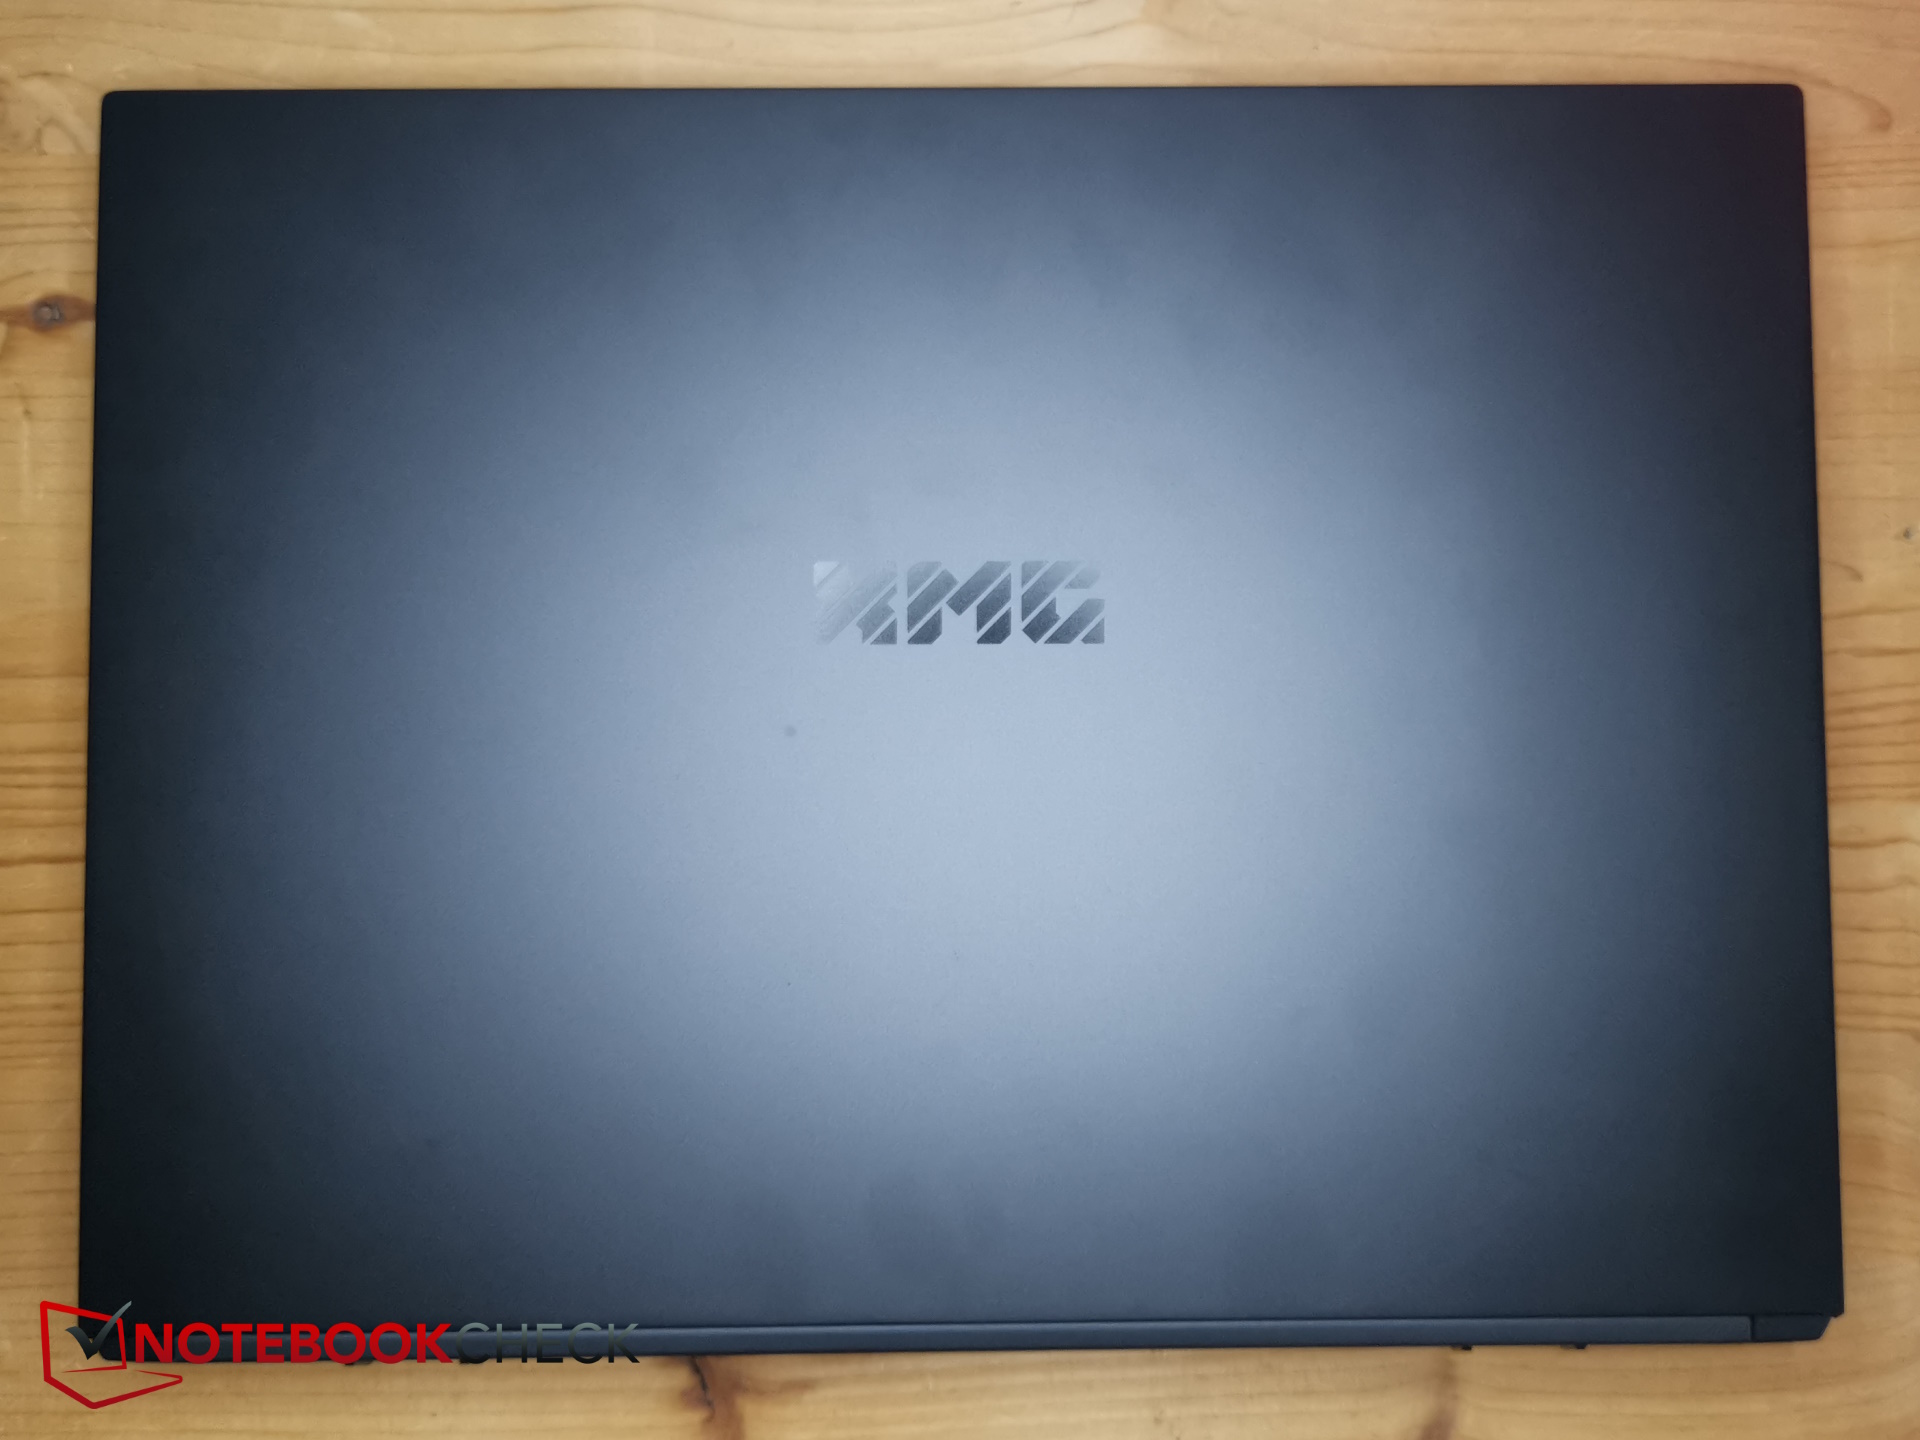
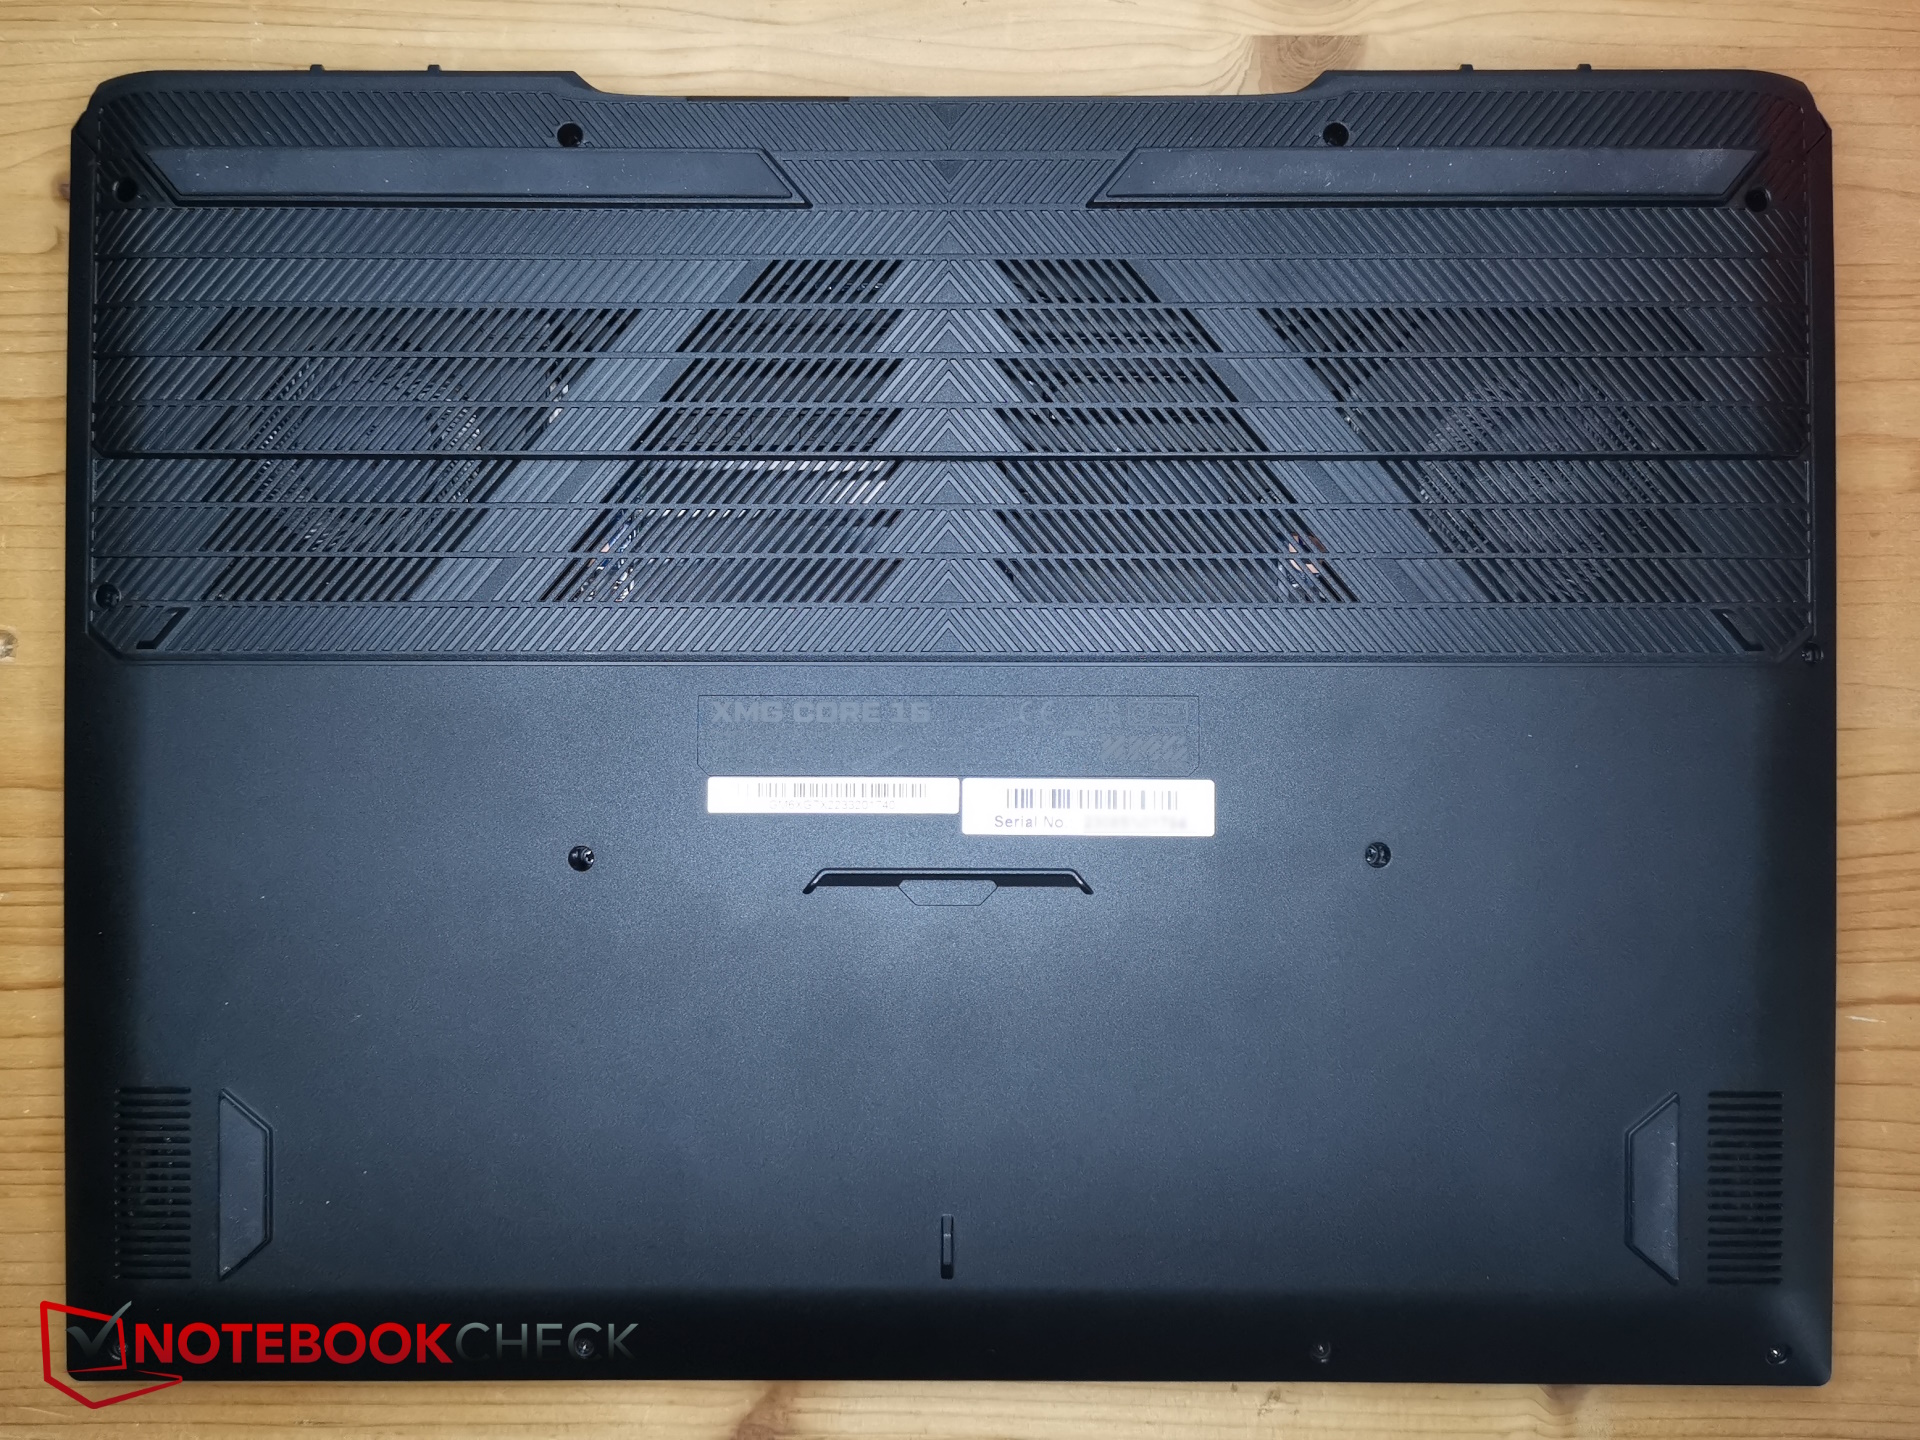
外壳与连接 - 时尚的 Core 16
这款笔记本电脑采用了申克典型的时尚风格--一切都保持深灰色。较硬的底座和较软的底板由塑料制成,闪亮的显示屏盖由金属制成。后者有点容易沾染指纹。盖子可以打开 135 度。
一切看起来都相当稳定,做工也不错。左侧底座仅在我们第一次尝试扭动时发出嘎吱声。
它的尺寸和重量一般,与LenovoLegion Pro 5 16 相仿。
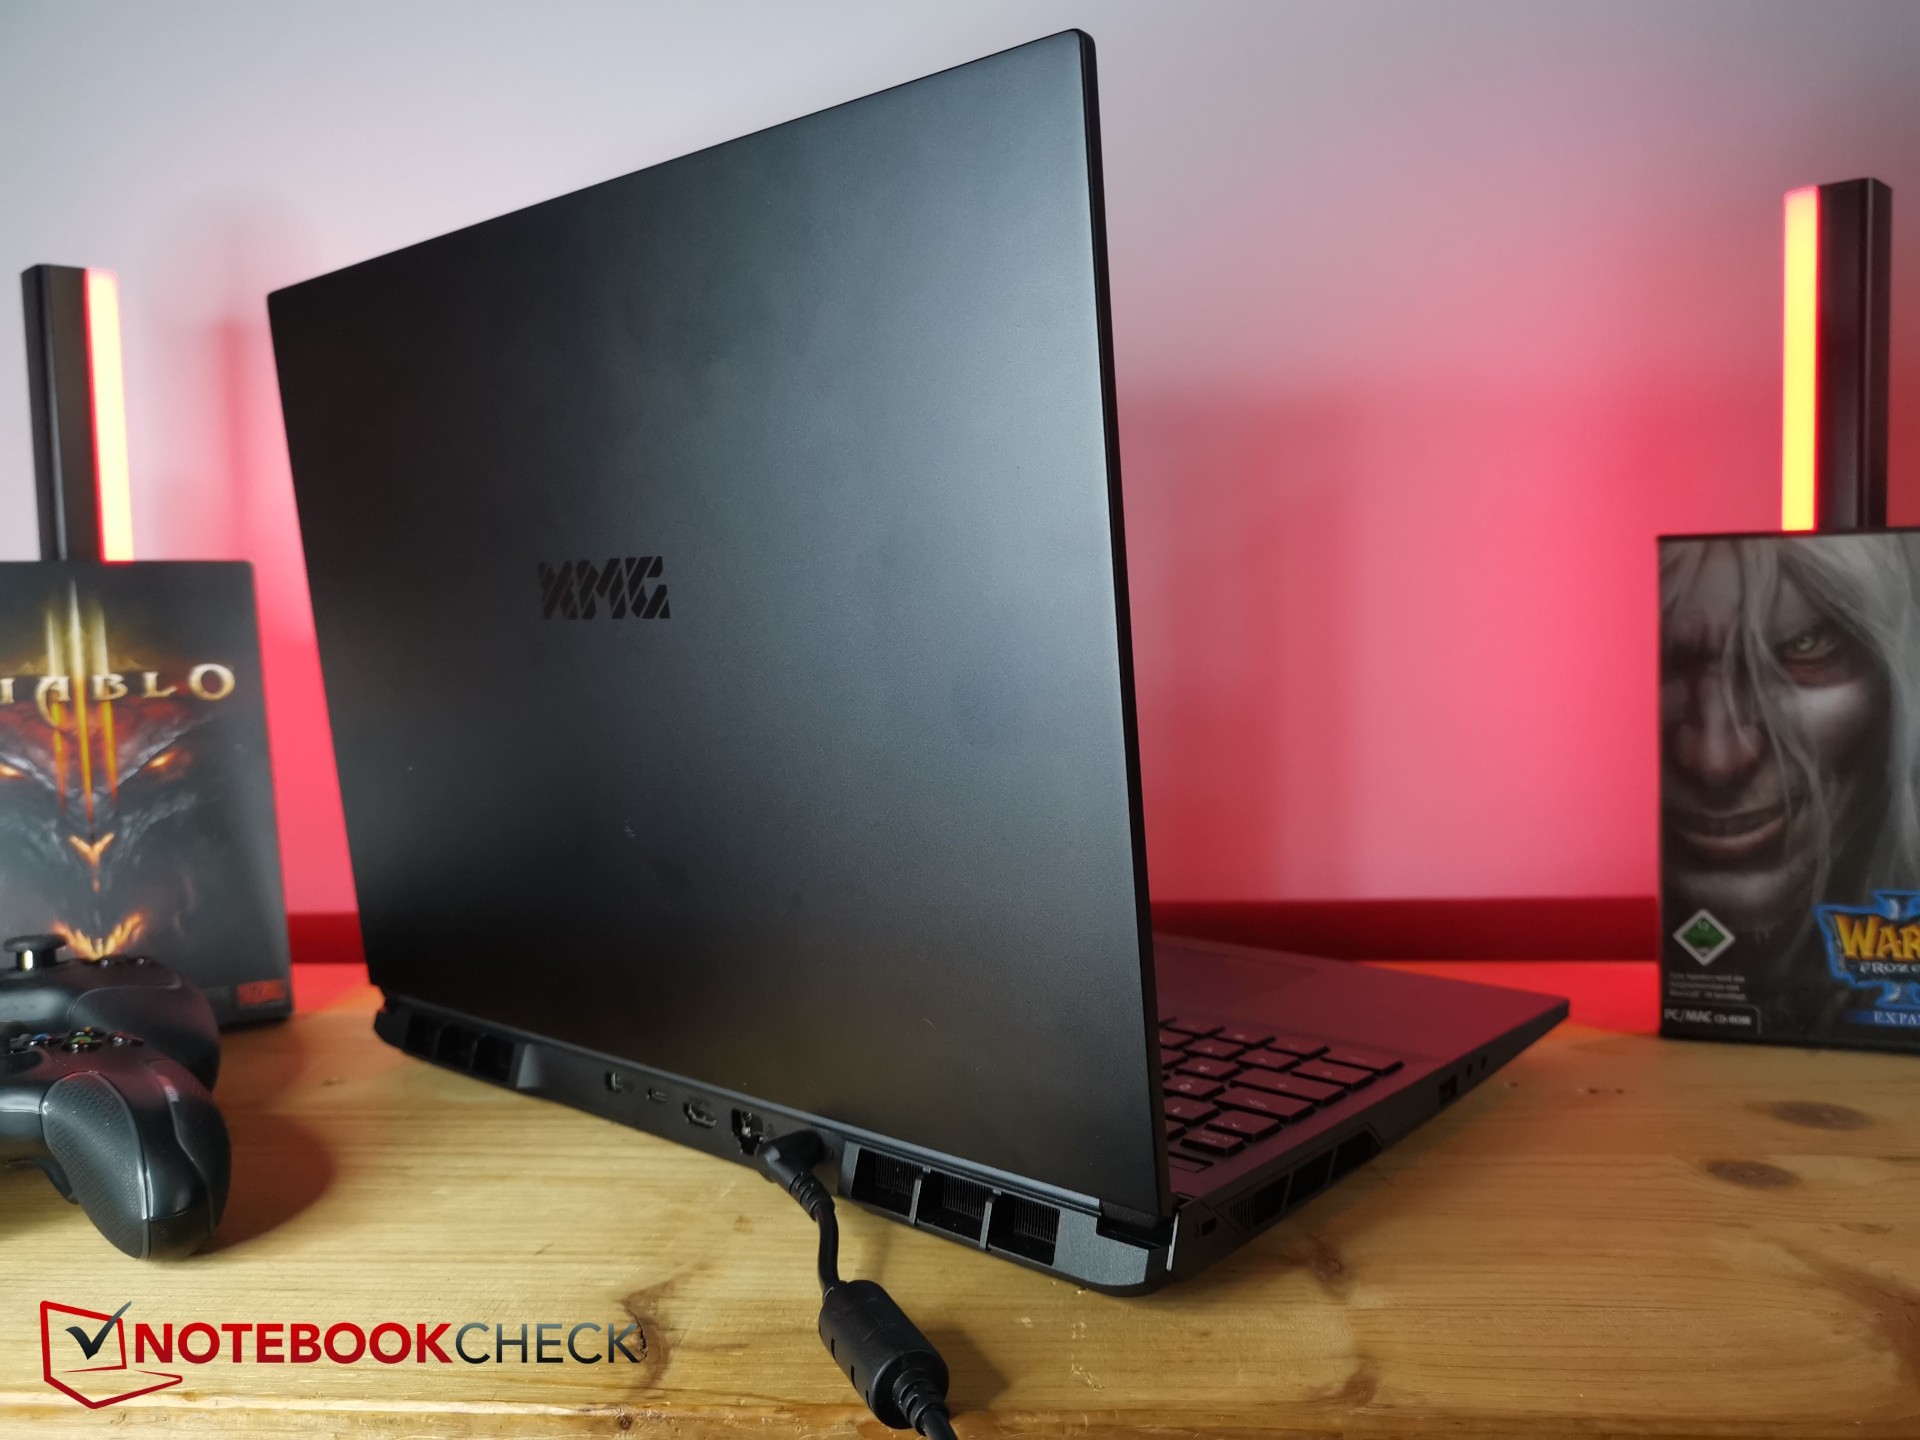
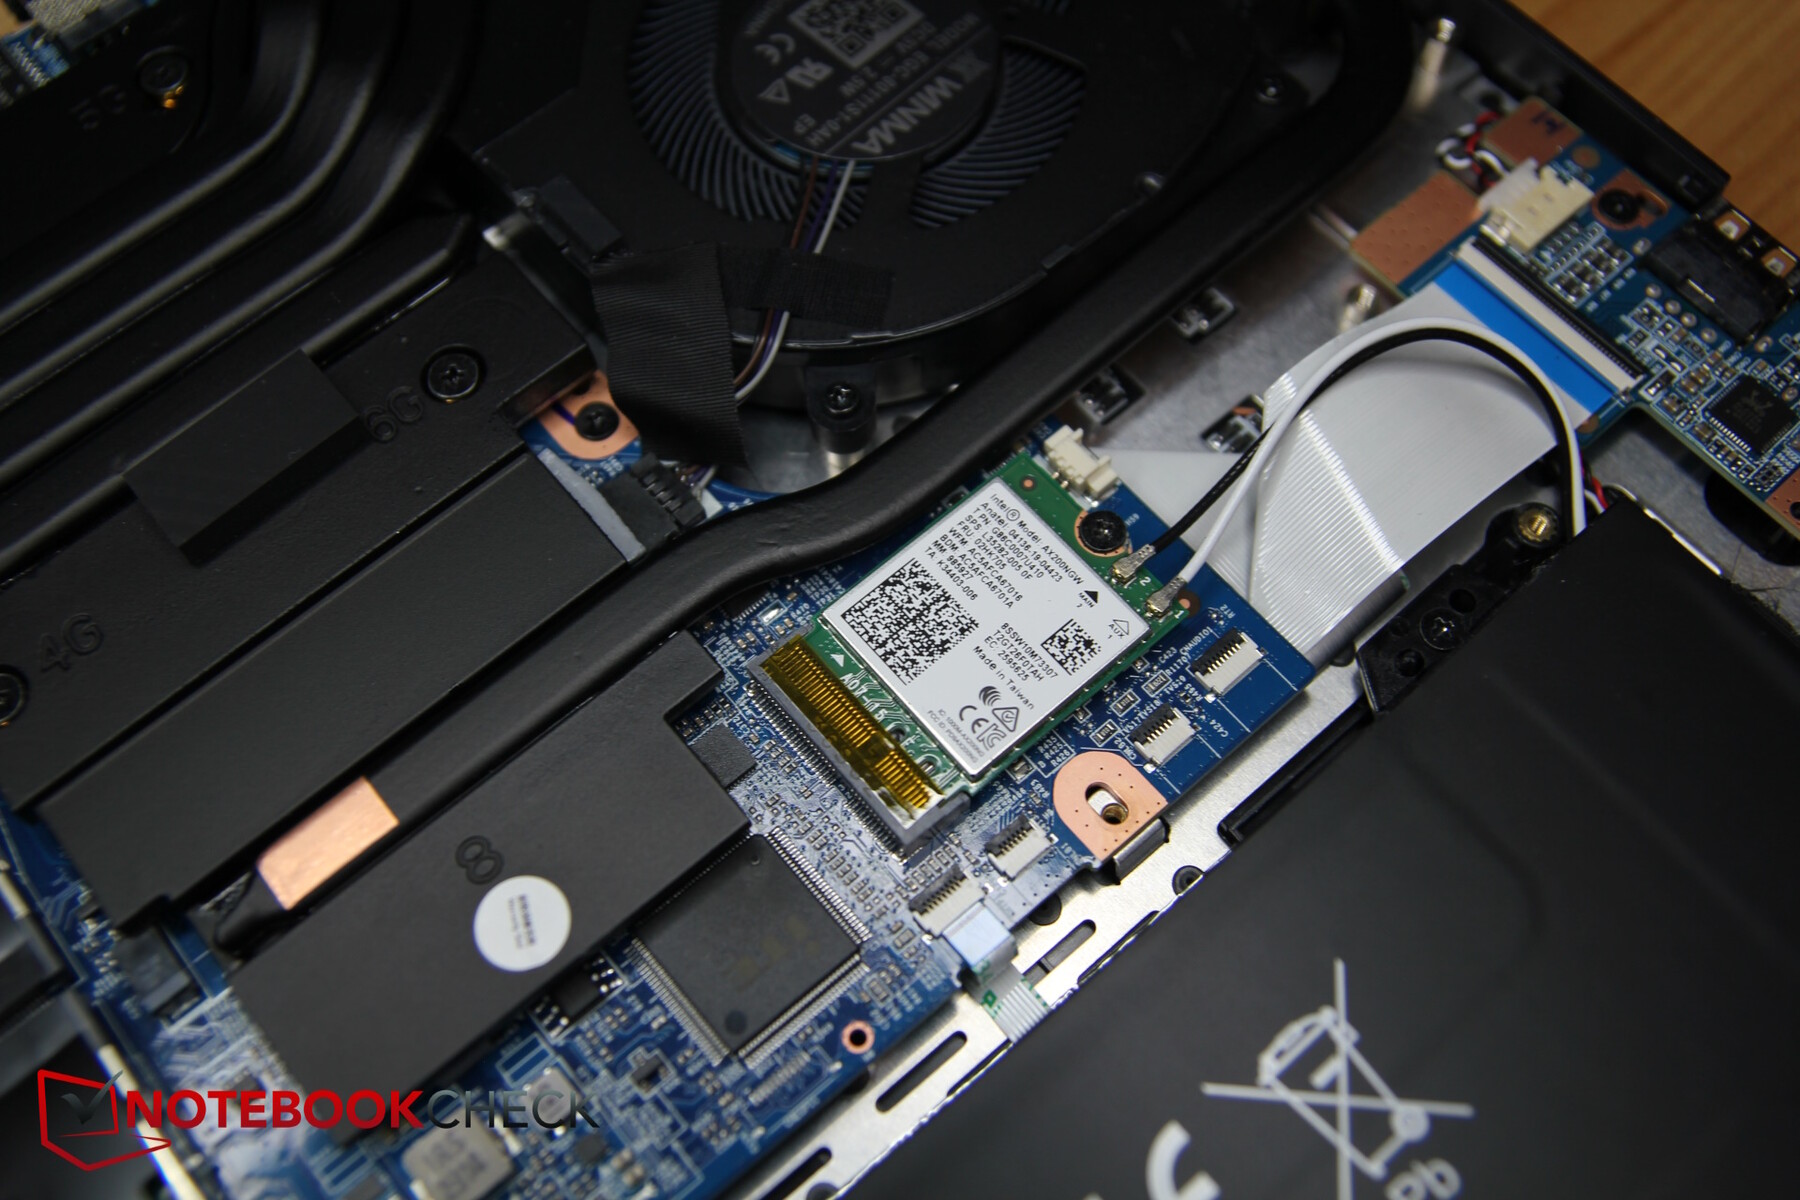
这款游戏笔记本包含所有最重要的端口,包括一个完整的 SD 读卡器。遗憾的是,USB-C 端口不支持 Thunderbolt、Power Delivery 或 DisplayPort。对于后者,笔记本电脑配备了专用的 MiniDisplayPort。该设备无法通过 USB-C 接口充电,左侧的 USB-A 接口仍为 2.0 类型!
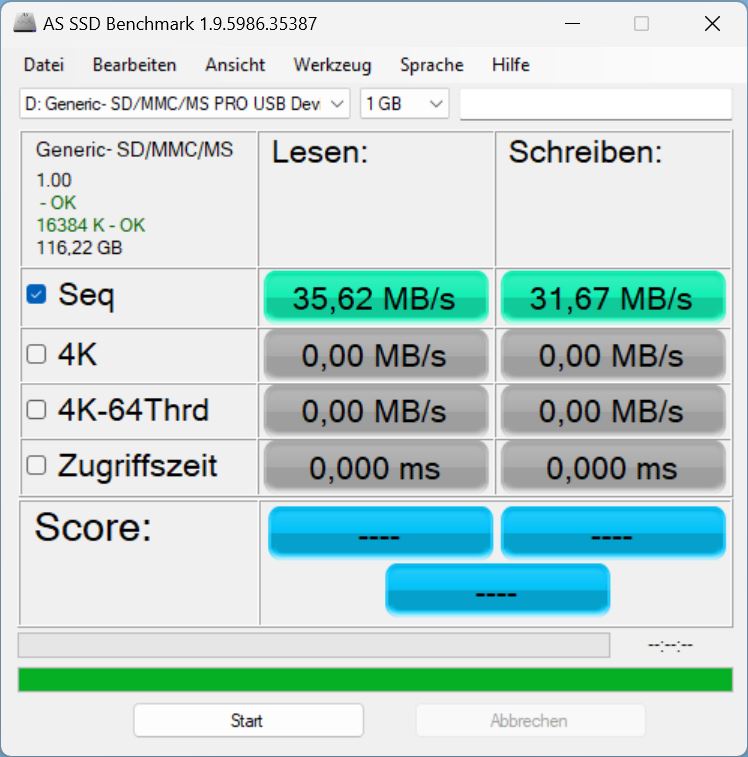
之前提到的 SD 读卡器速度非常慢,比所有前代产品和竞争对手都慢。至少它配备了一个读卡器。
英特尔 AX200 支持 WiFi 6,但仅限于 5 GHz 频率。它的传输速率不错,而且相对稳定。
| SD Card Reader | |
| average JPG Copy Test (av. of 3 runs) | |
| MSI Stealth 16 Studio A13VG | |
| Average of class Gaming (20.9 - 210, n=55, last 2 years) | |
| Acer Nitro 16 AN16-41 (AV Pro SD microSD 128 GB V60) | |
| Schenker XMG CORE 16 (L23) | |
| maximum AS SSD Seq Read Test (1GB) | |
| MSI Stealth 16 Studio A13VG | |
| Average of class Gaming (25.5 - 261, n=52, last 2 years) | |
| Acer Nitro 16 AN16-41 (AV Pro SD microSD 128 GB V60) | |
| Schenker XMG CORE 16 (L23) | |

 GeForce RTX 4070 Laptop GPU, R7 7840HS, Samsung 990 Pro 1 TB")
 GeForce RTX 4070 Laptop GPU, R7 7840HS, Samsung 990 Pro 1 TB")
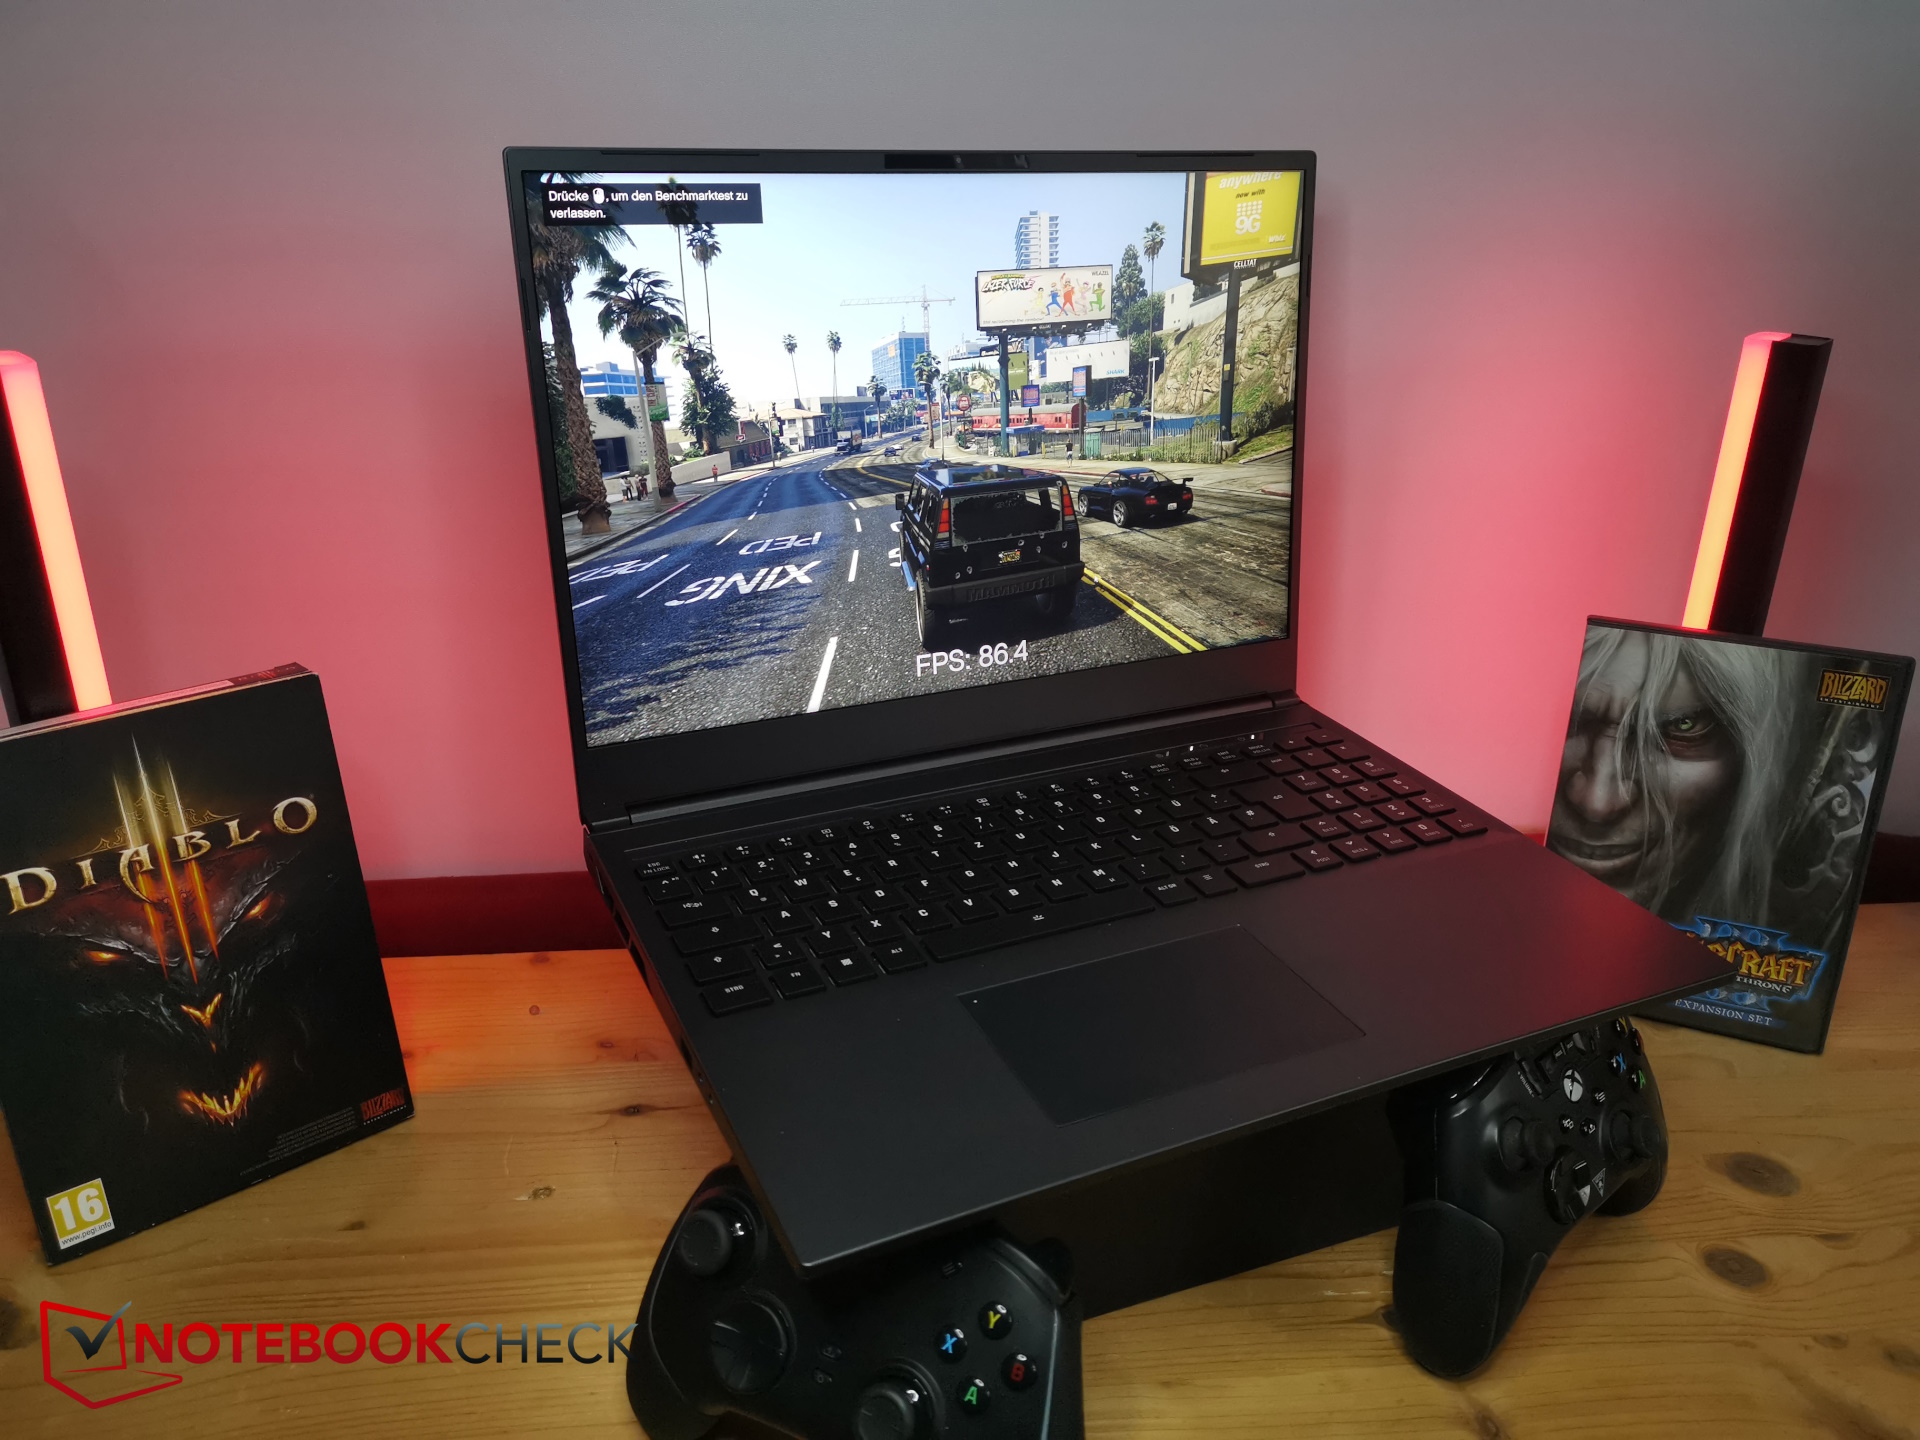
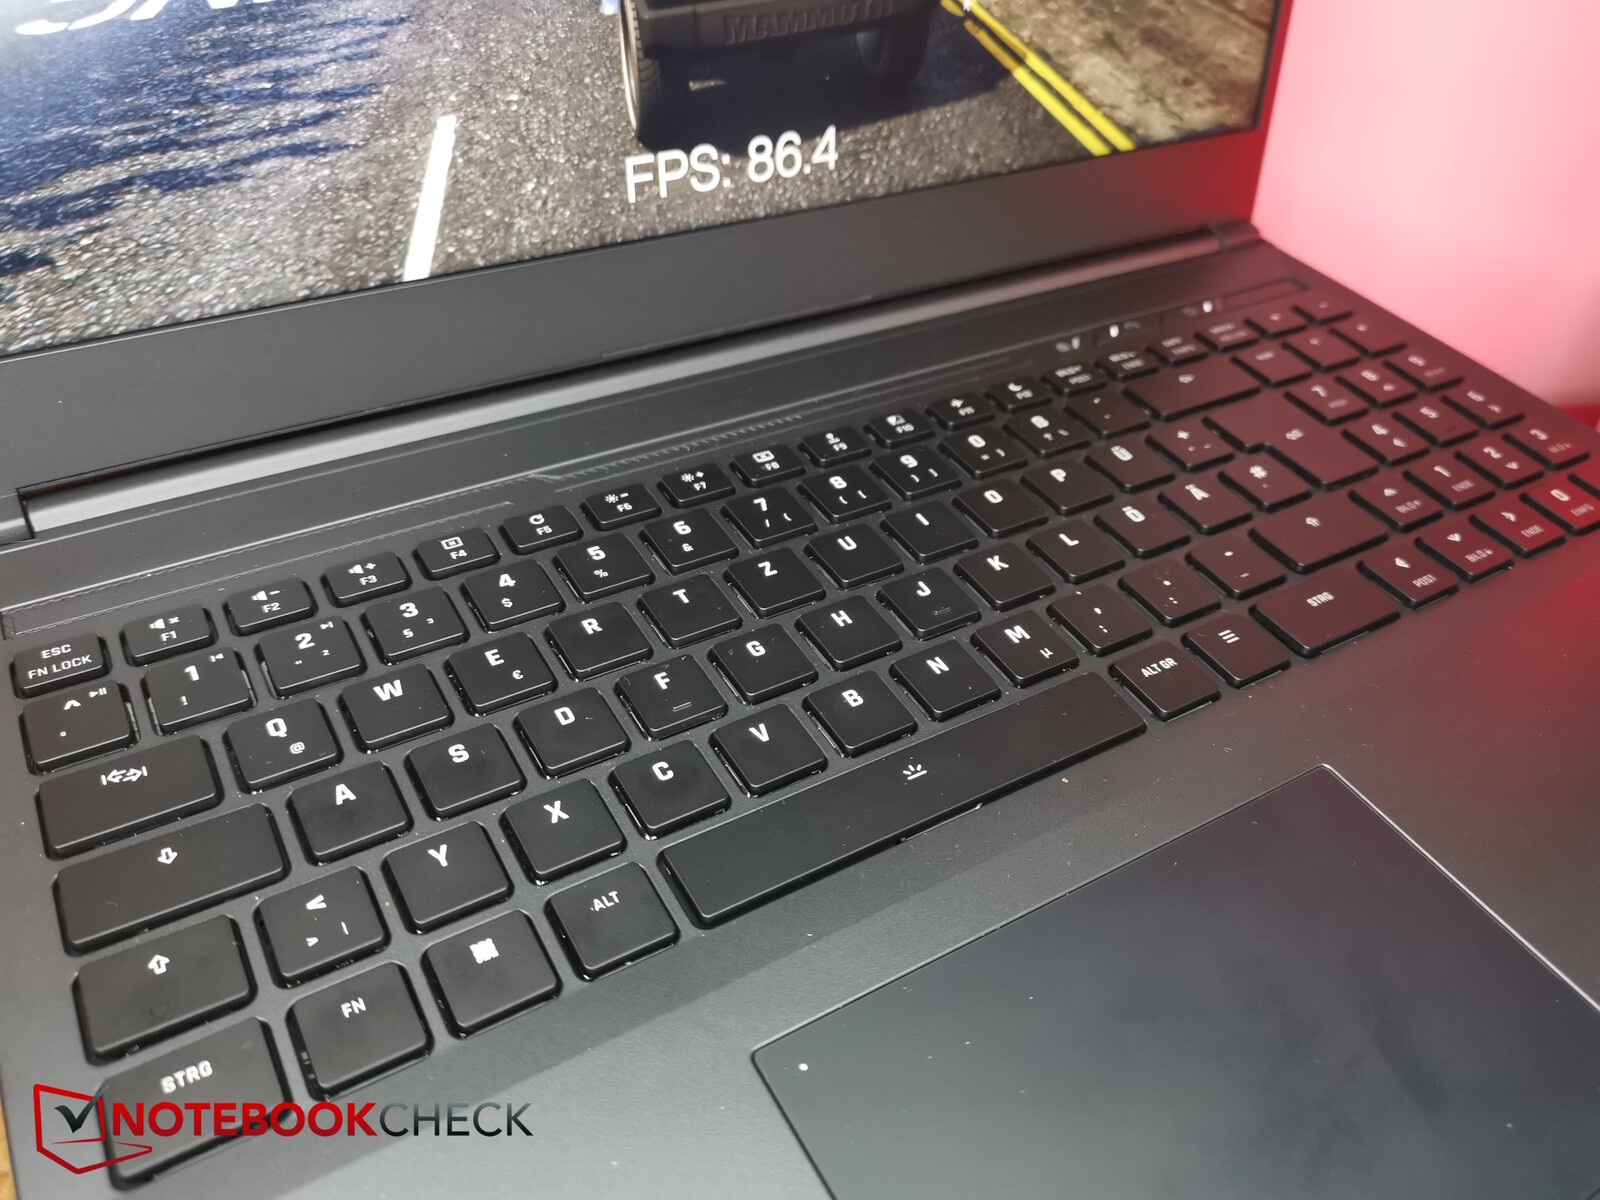
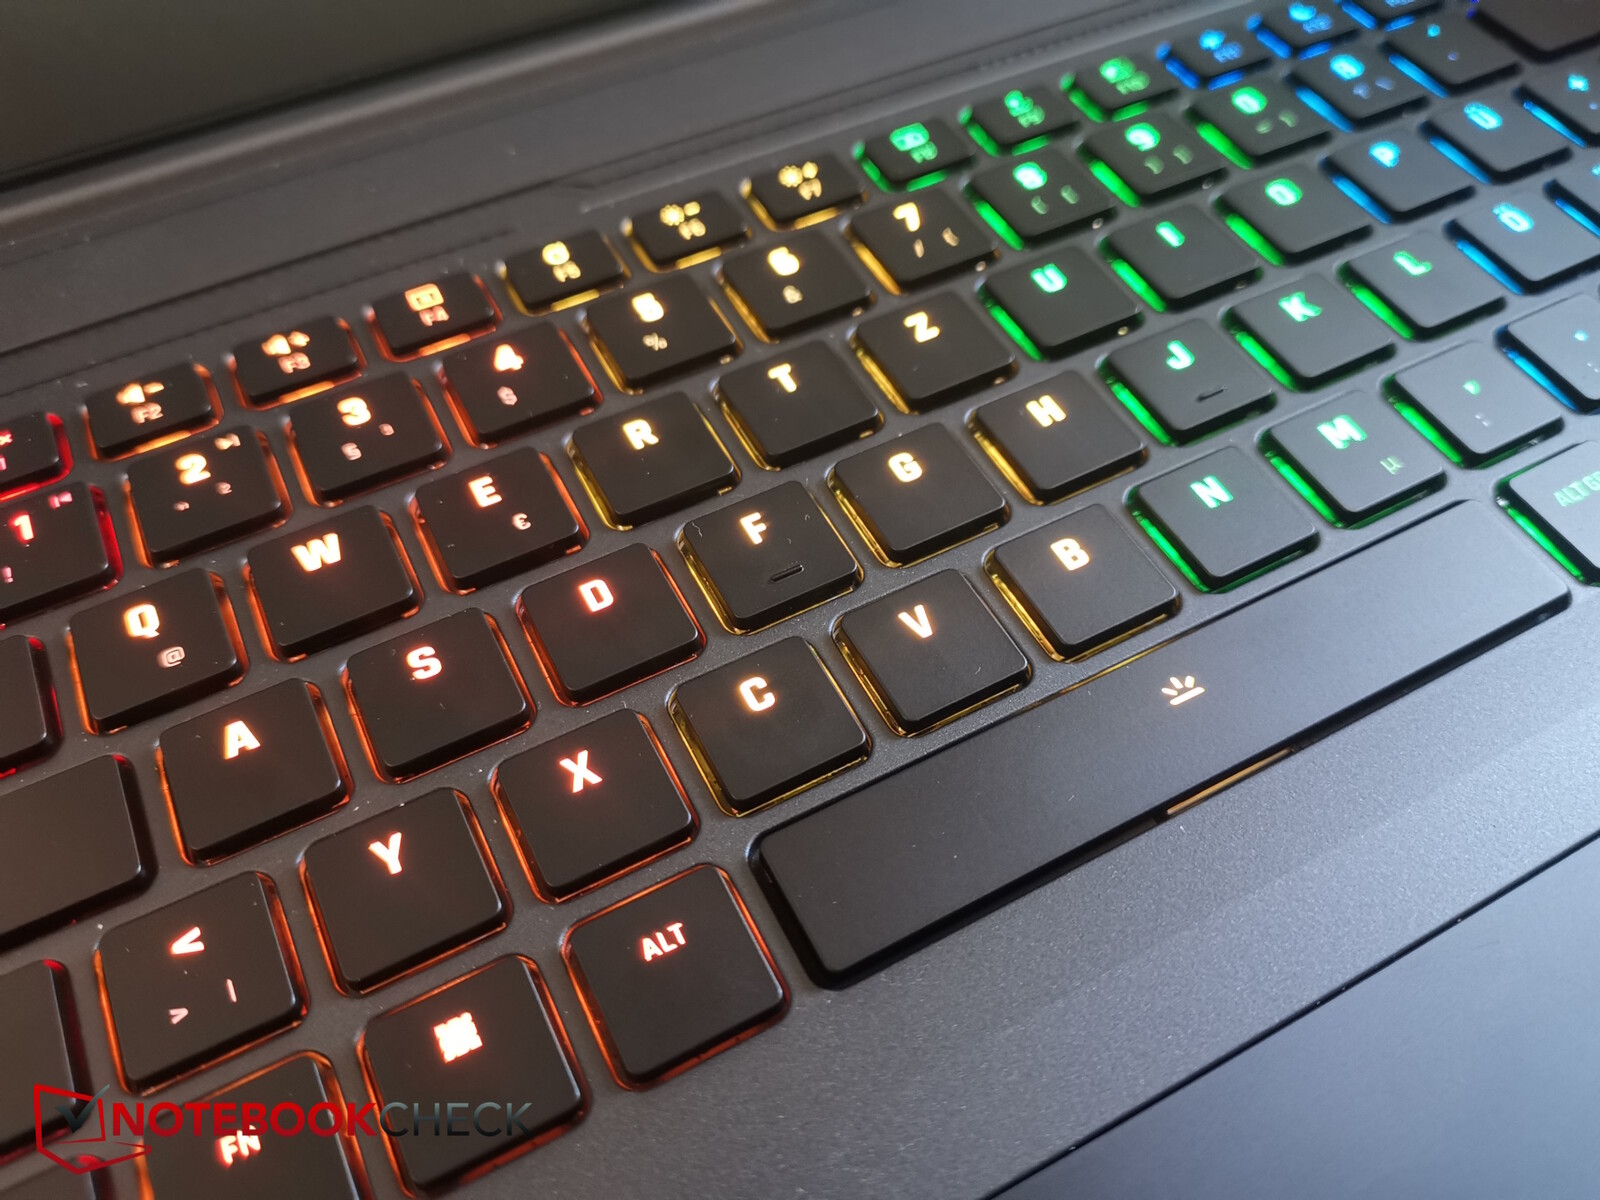
输入设备 - 机械或薄膜按键
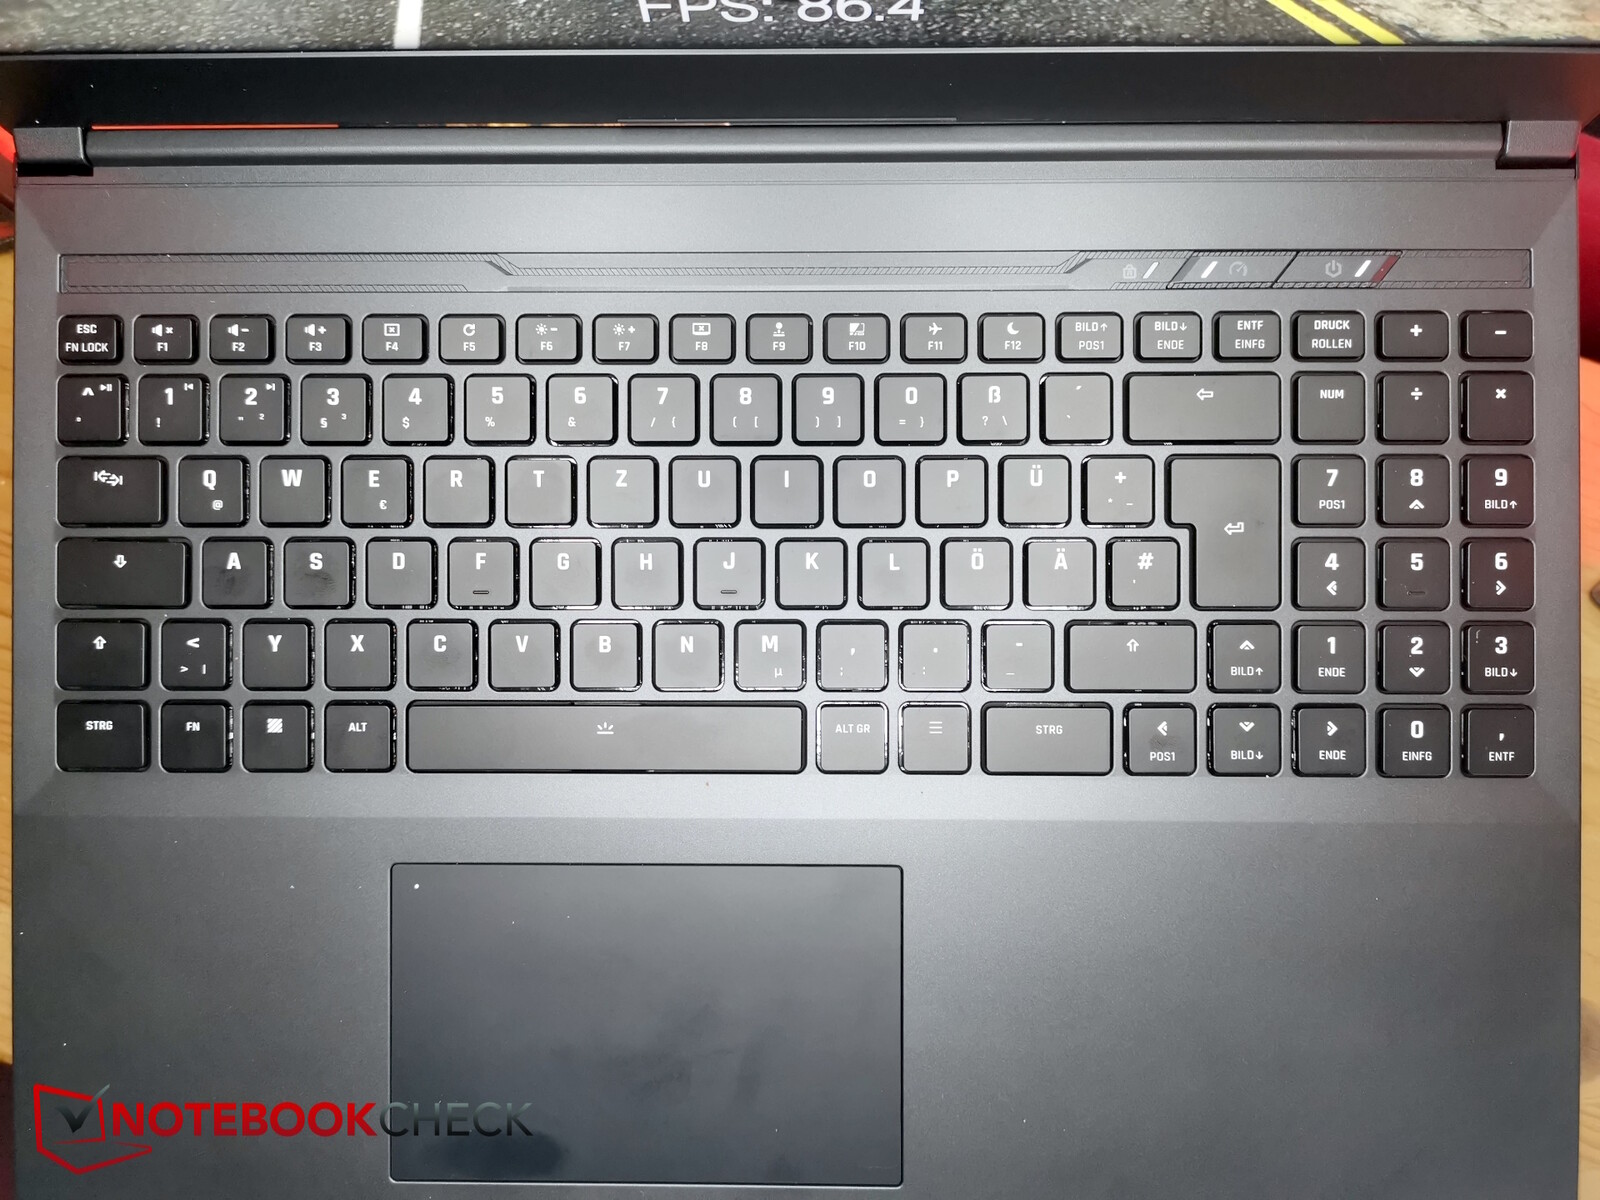
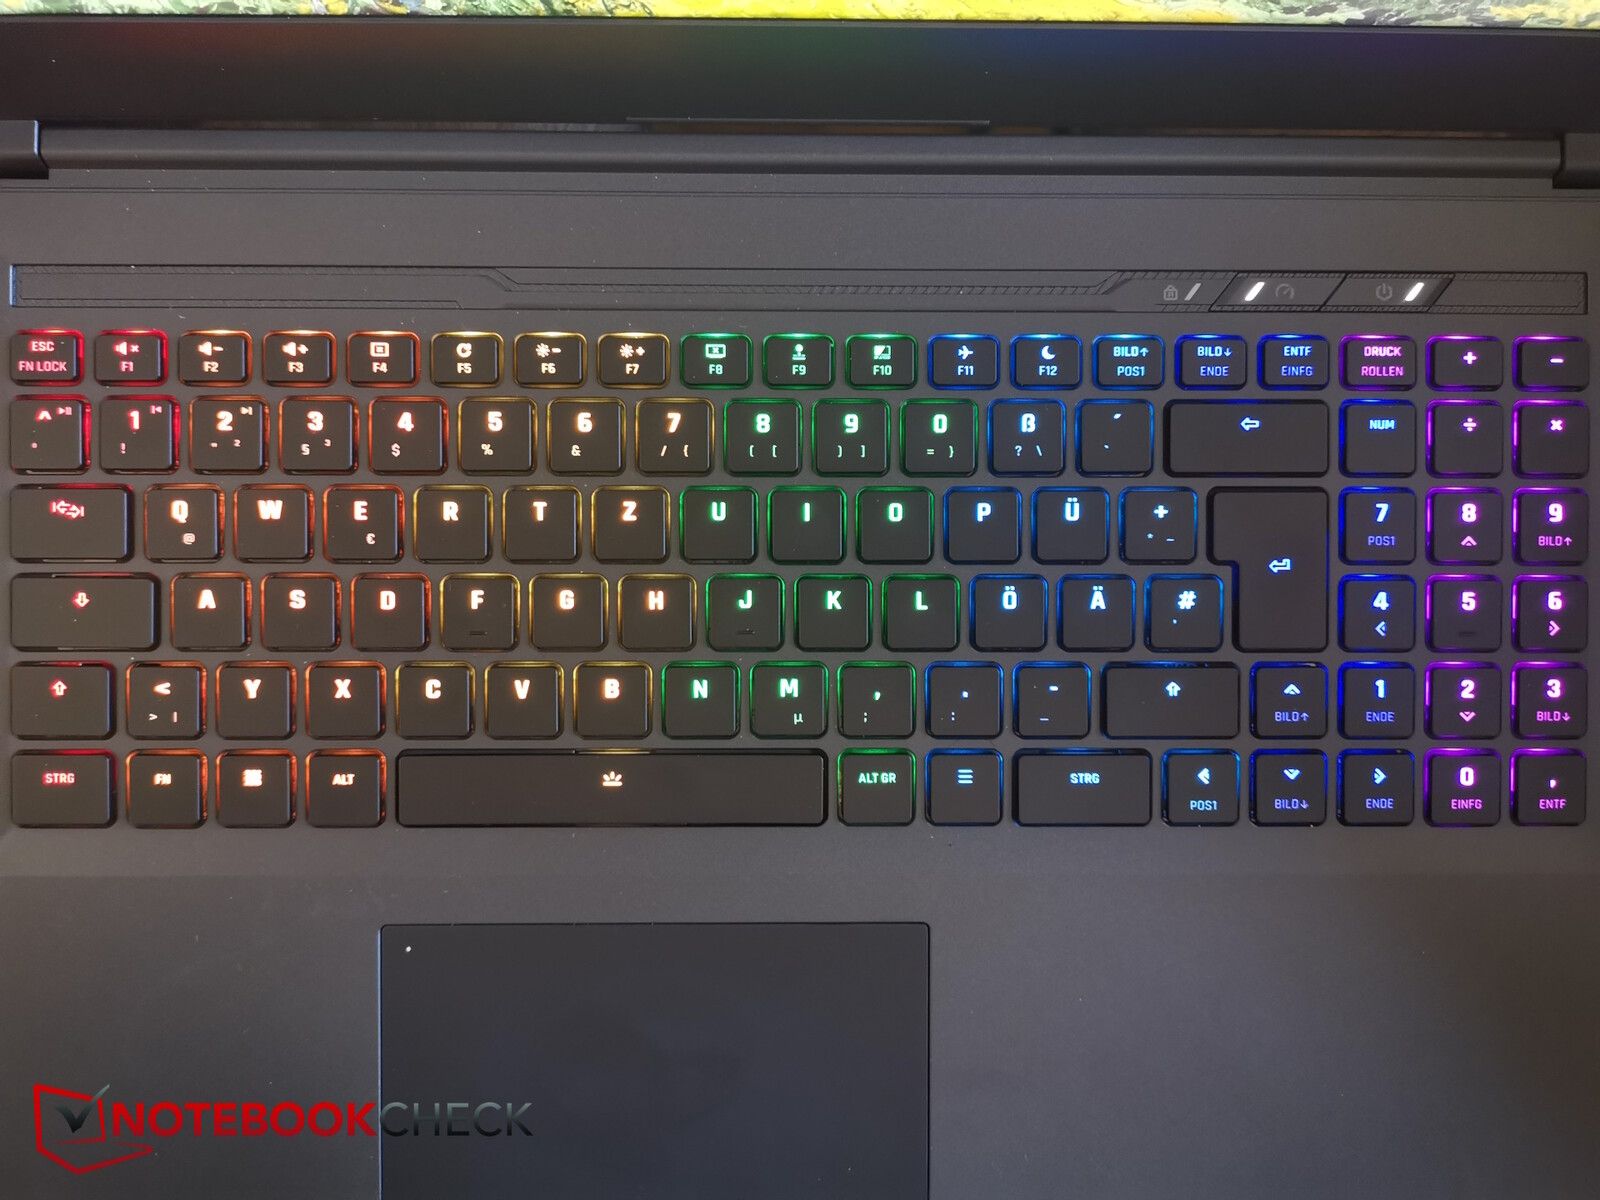
在这款笔记本电脑上,你可以选择机械键盘(如我们的测试机型)或 "静音薄膜键盘"。这两种键盘都带有 RGB 背光,但只有机械键盘才有独立的 RGB 灯光按键。静音薄膜键盘只有单区 RGB 灯光。
机械键盘只有功能键采用了更安静的薄膜开关。所有其他按键都有很好的压力点,并提供清晰的反馈。你必须喜欢打字时的巨大噪音,而且它肯定不适合带进图书馆。
像往常一样,申克采用了非常整洁的布局,没有任何装饰。包括数字键盘在内的所有按键都排成六排。这意味着您可以非常容易地找到所有按键--通常按键都很小(约 1.45 x 1.45 厘米)。
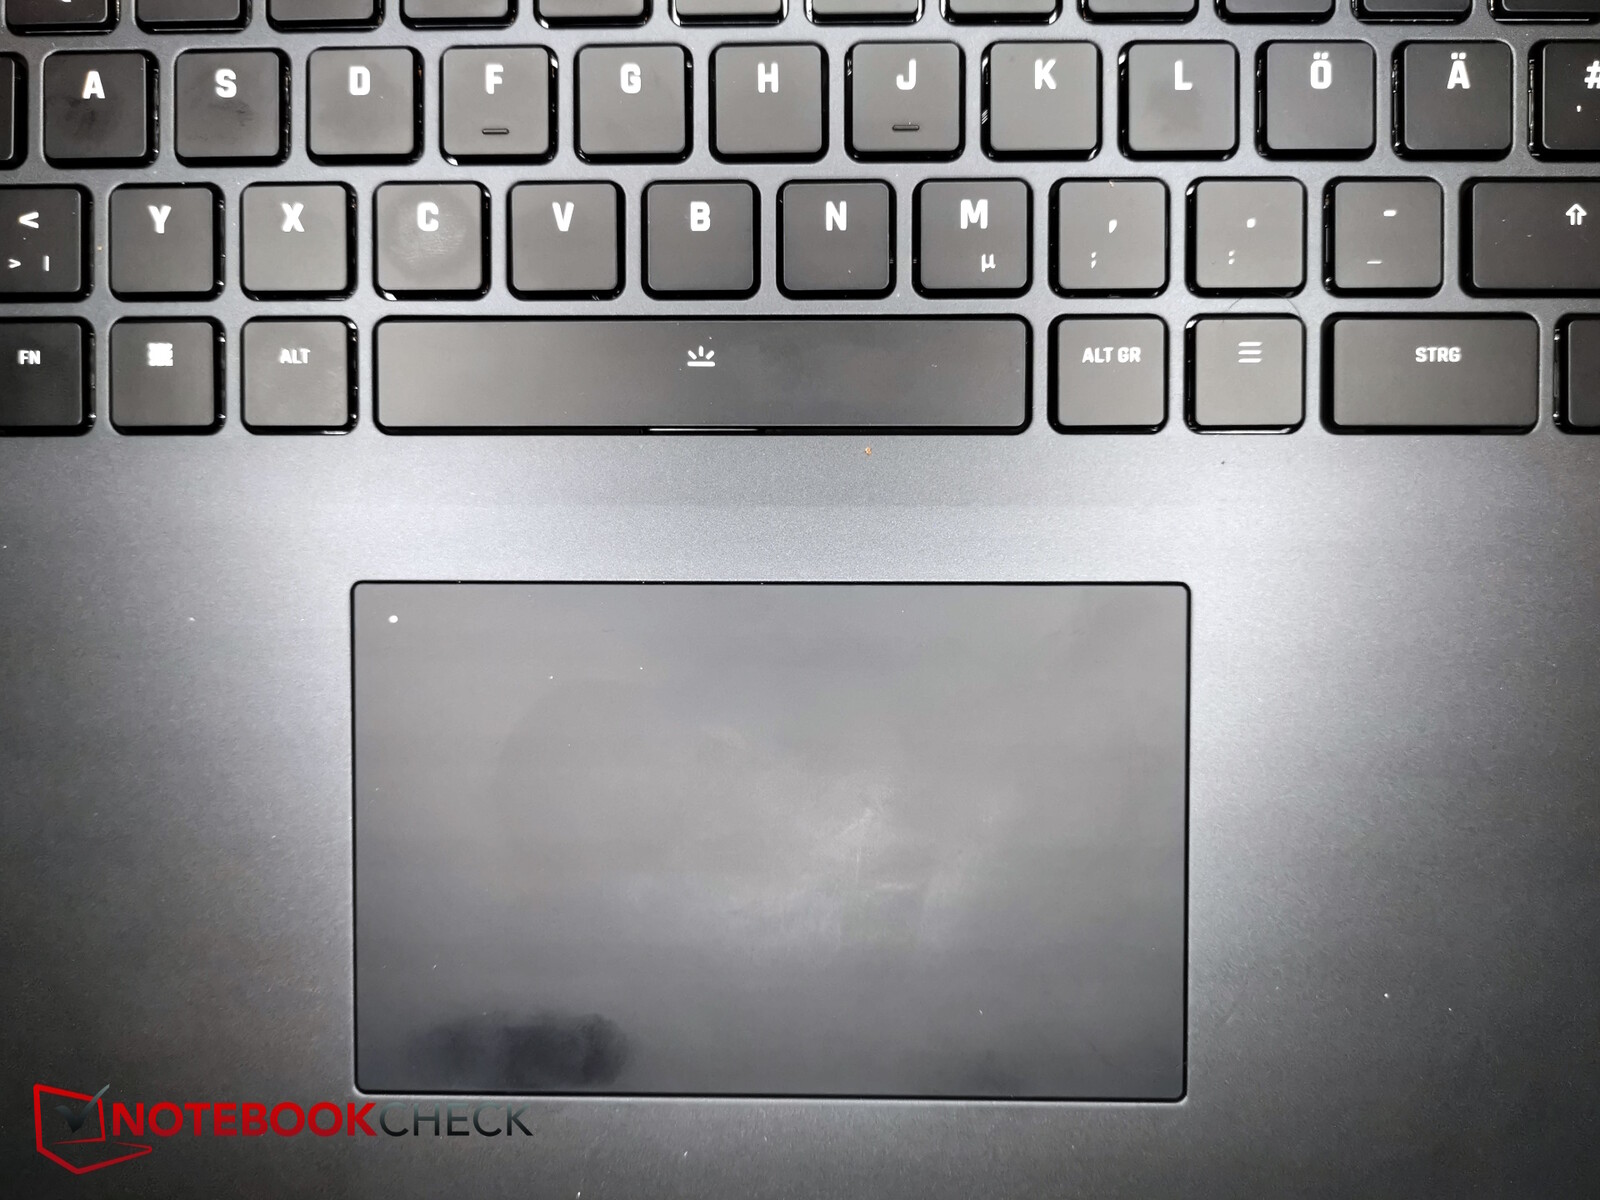
触摸板虽然有点小(约 11.7 x 7.2 厘米),但却非常光滑,即使你的手指还没有完全干透。双击左上角可以(取消)激活触摸板,一个微型 LED 灯会显示触摸板的当前状态。集成的点击按钮会给你适当的反馈,但声音不会太大。有时,点击会有点卡住,也就是说,当你松开拖放后,它不会立即释放。
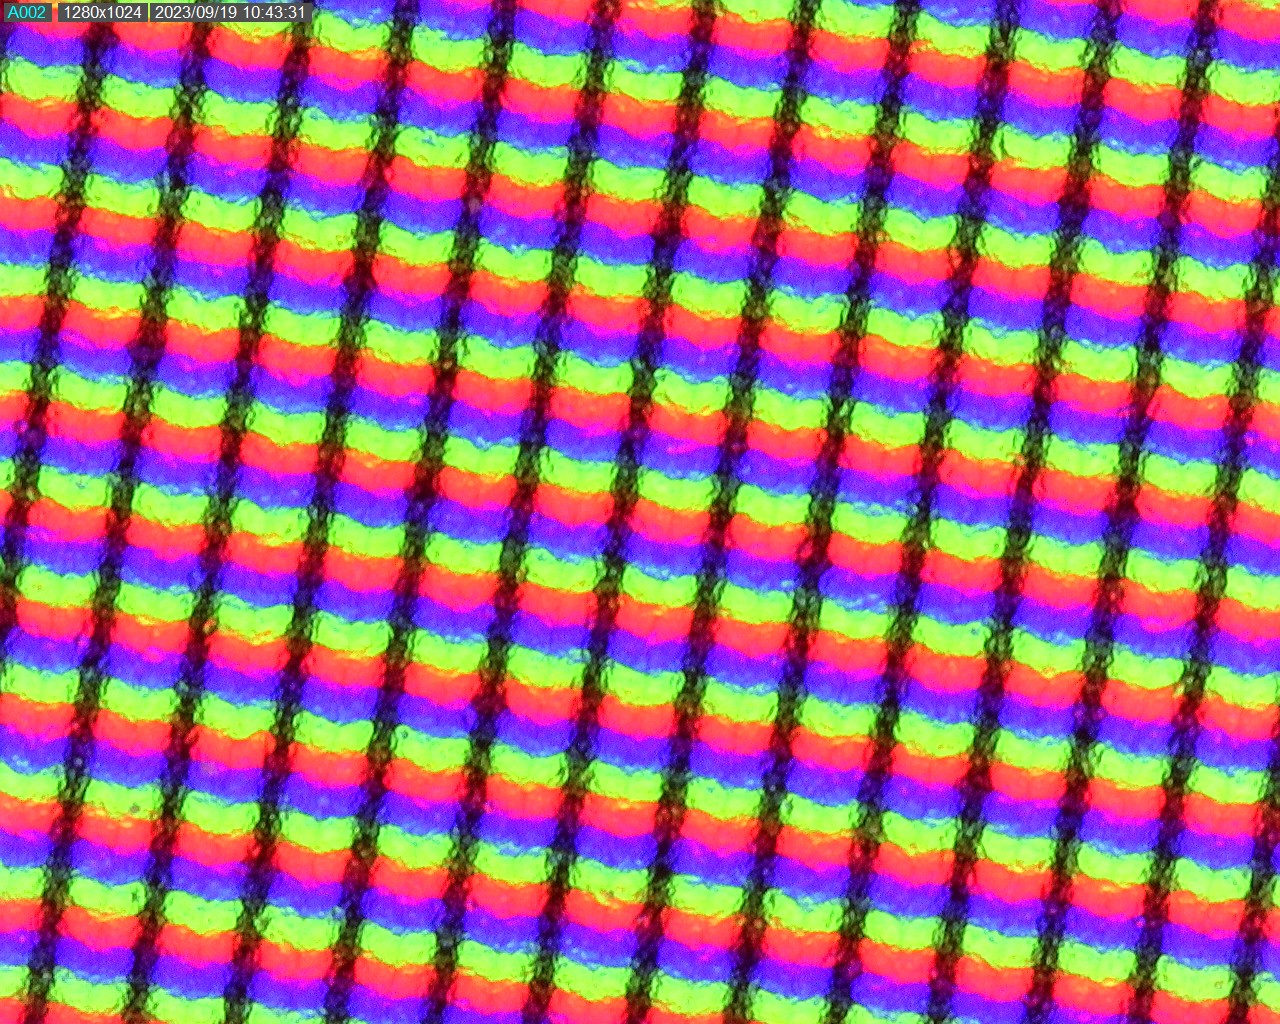
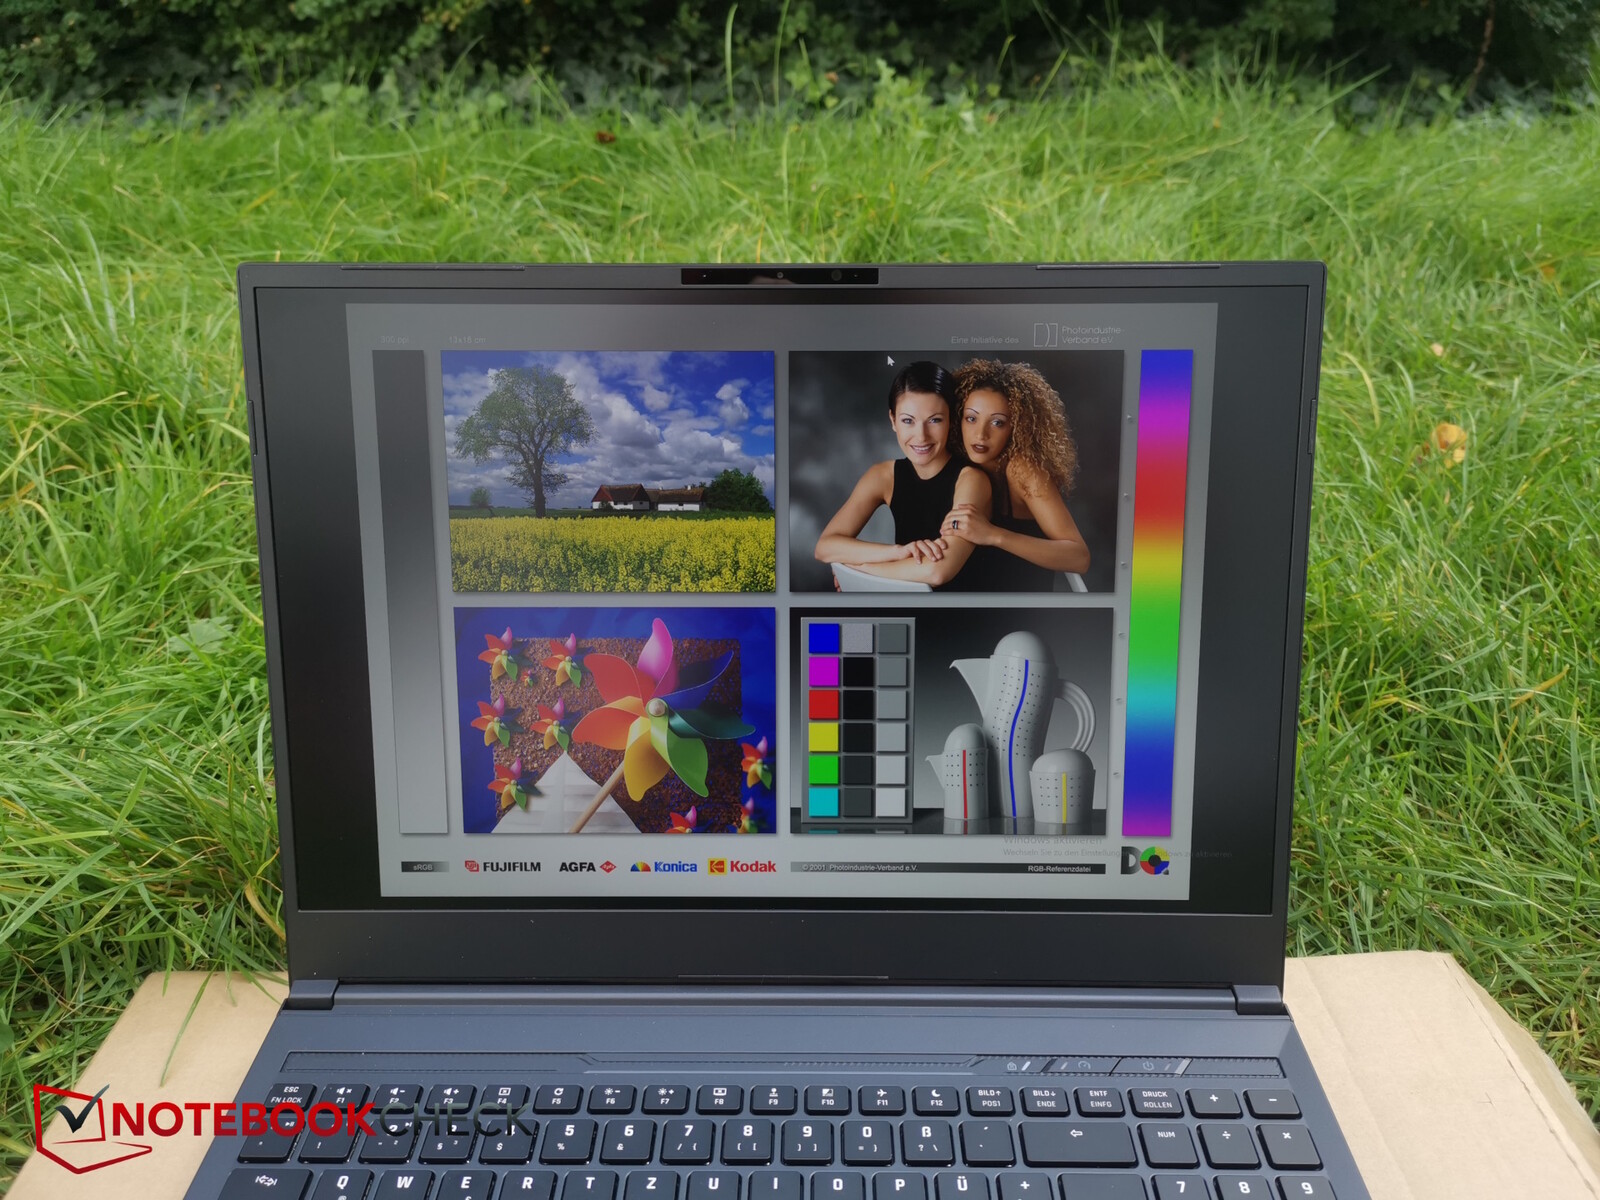
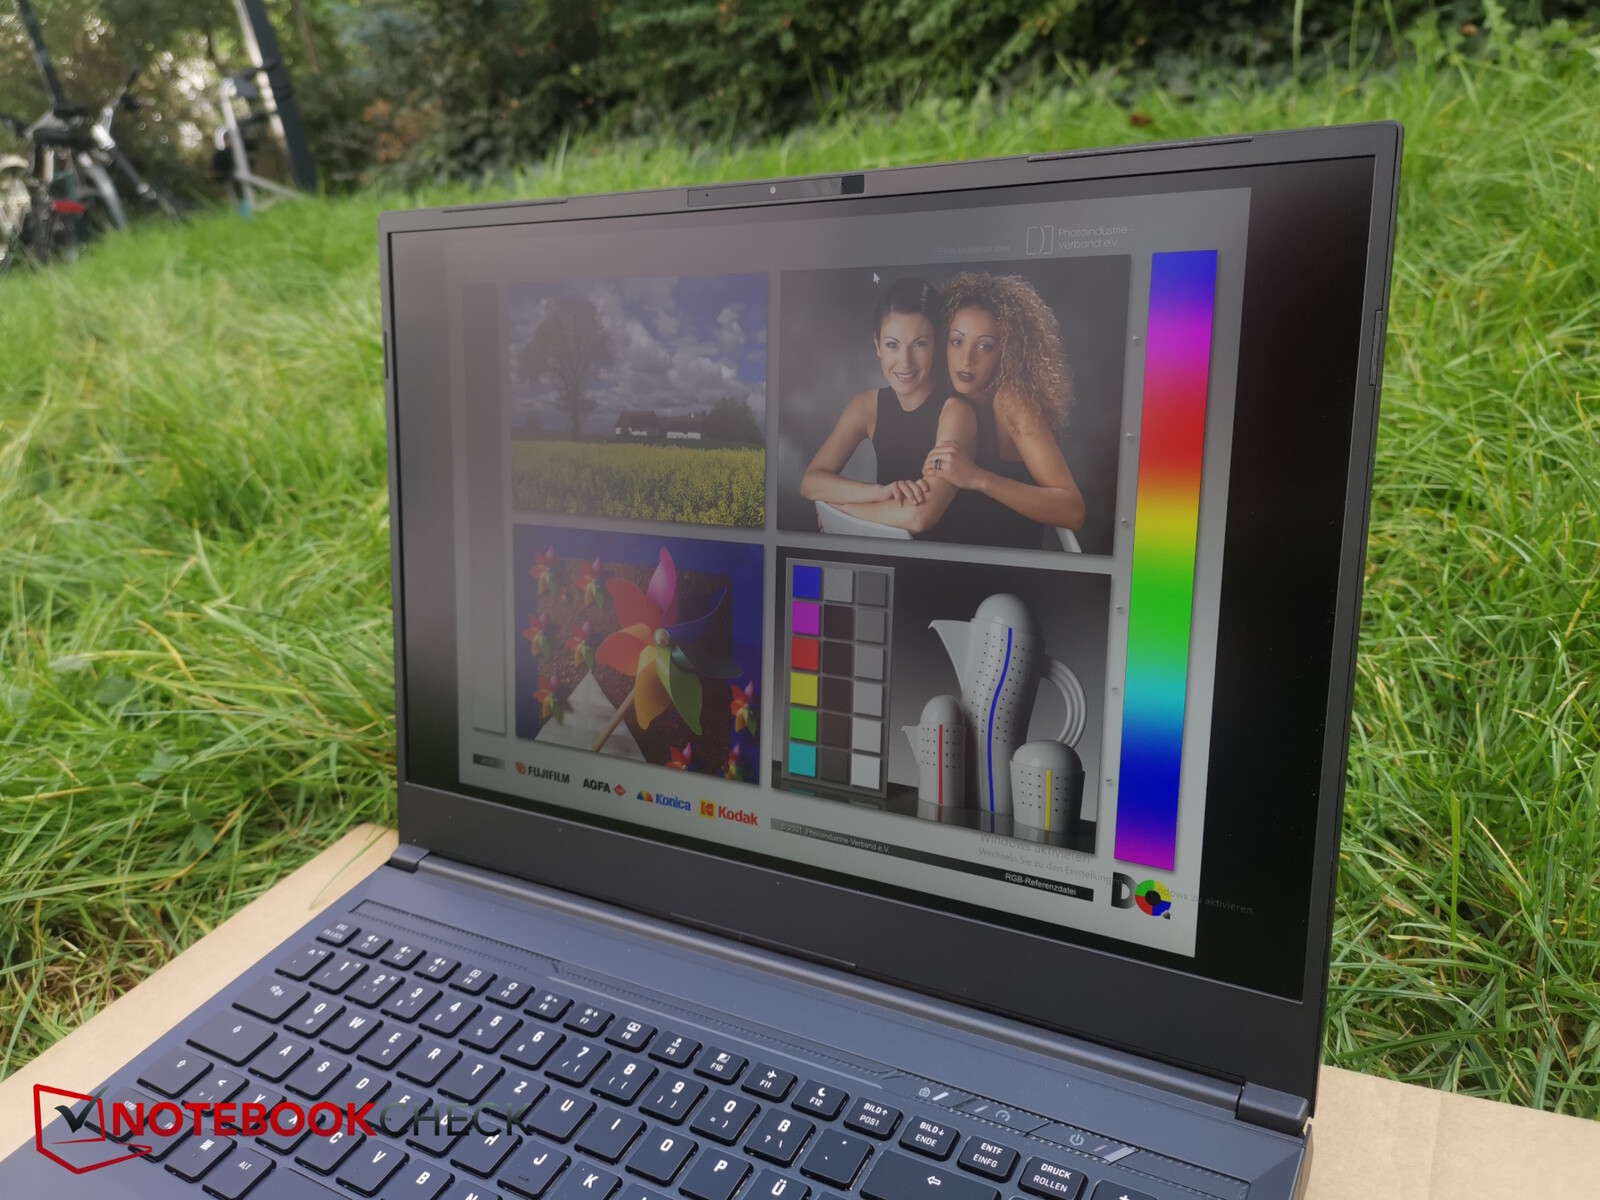
显示屏 - 著名的 16:10 1,600p IPS 面板
从外观上看,申克公司在其所有 16 英寸机型上都使用了相同的 1:10 240Hz 雾面显示屏,分辨率为 1600p。这意味着我们在申克 Vision 16 Pro和XMG Neo 16.
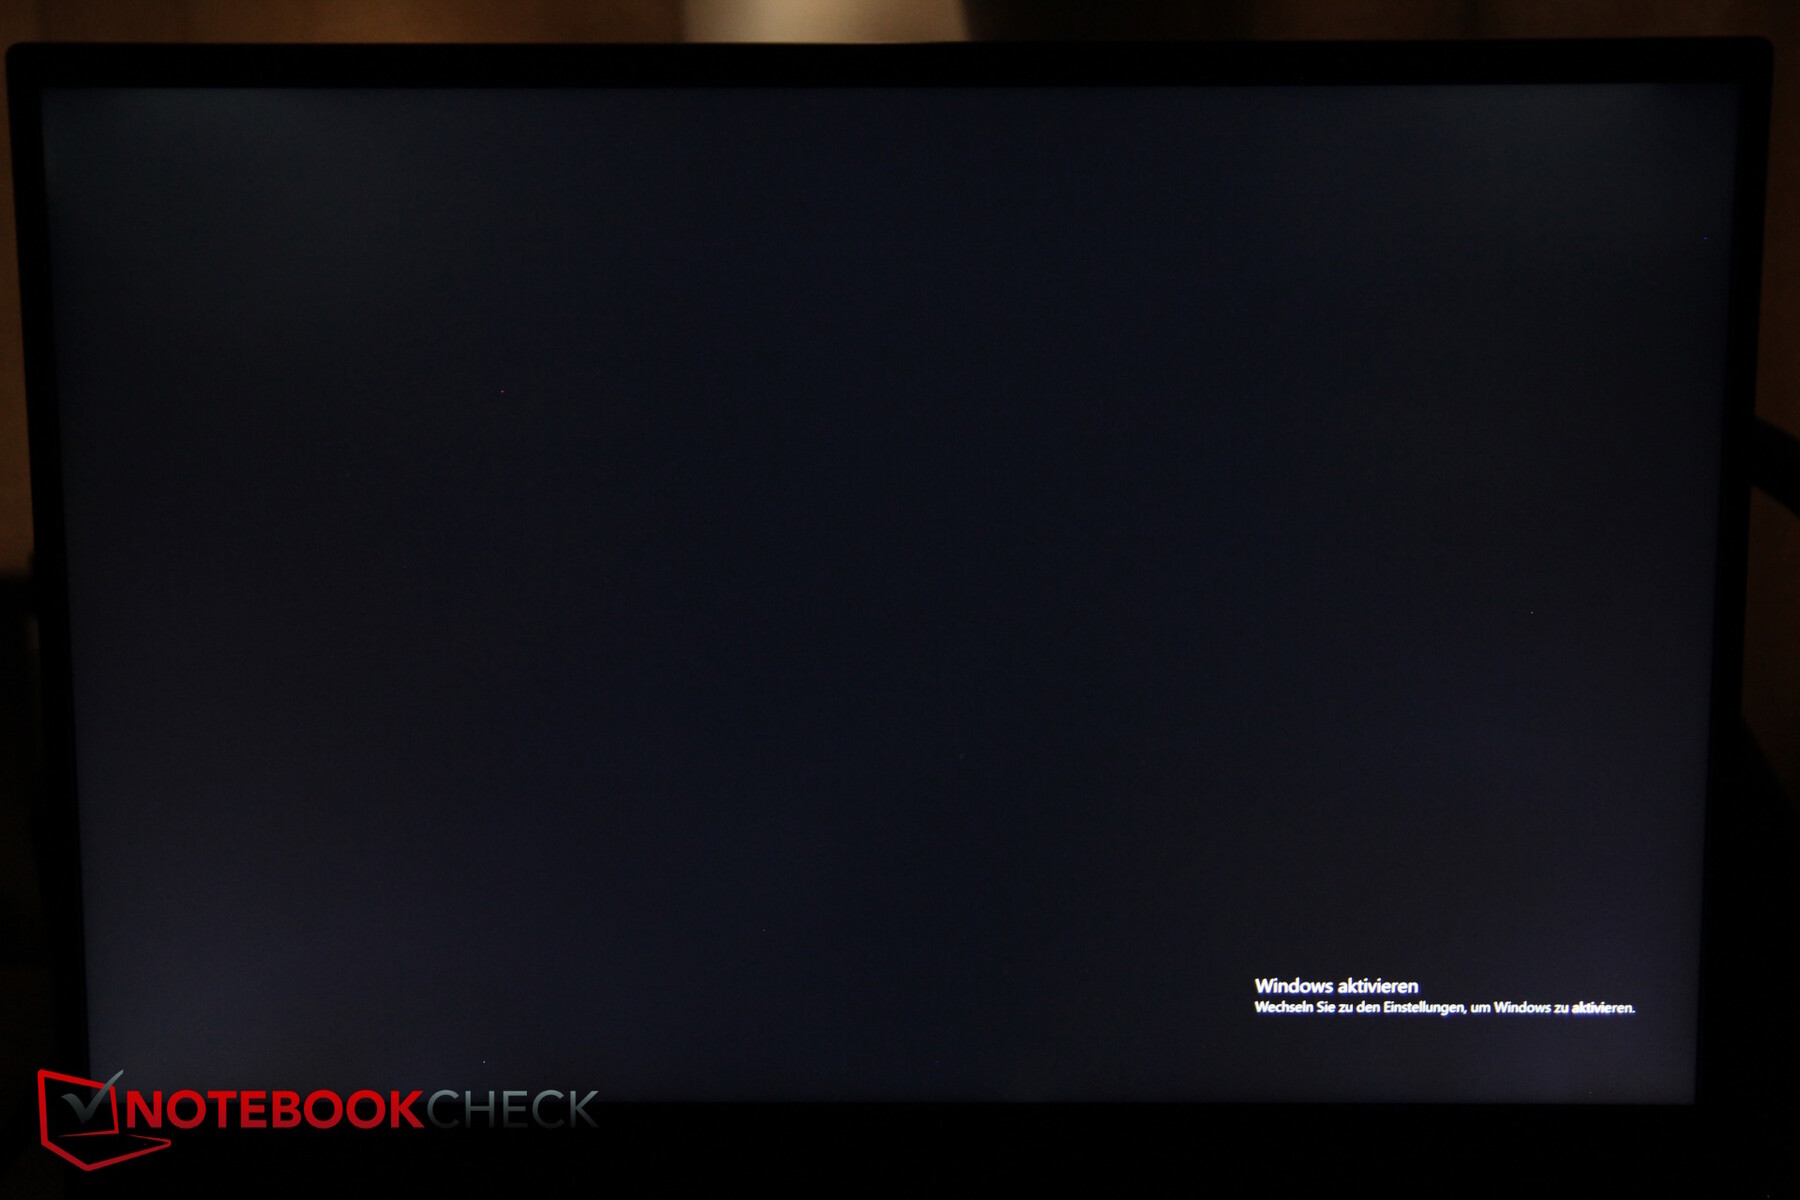
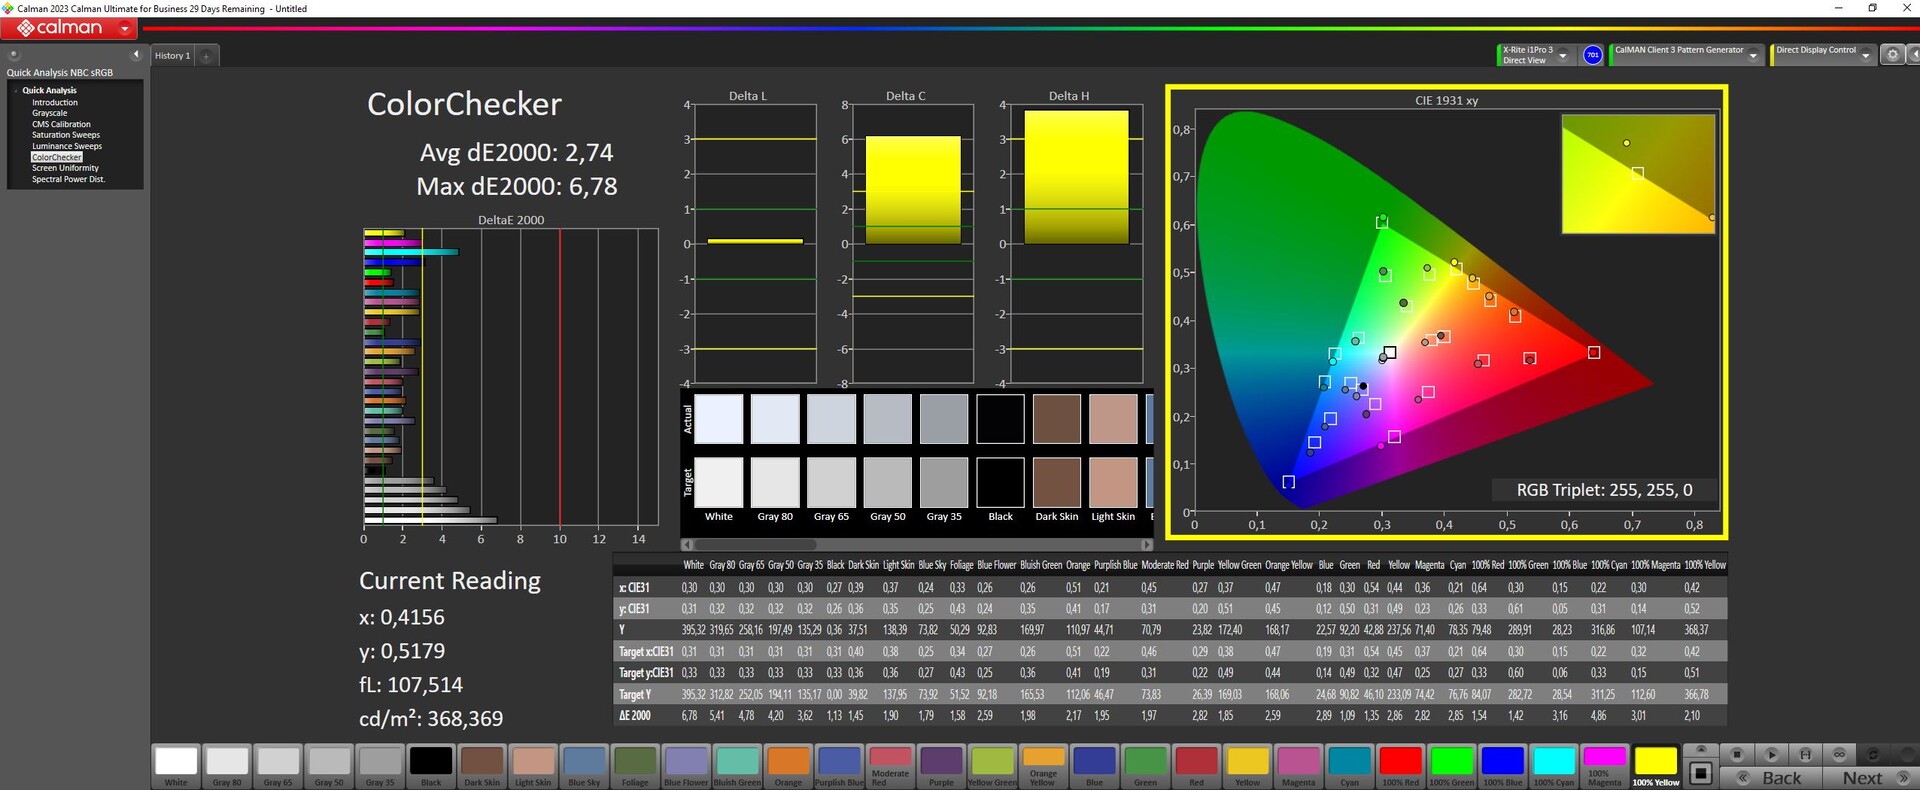
这块屏幕无疑达到了很好的效果。它的亮度为 350 尼特,对比度略高于 1,000:1。sRGB 显示速度足够快,我们没有注意到任何 PWM。你可以看到一些背光出血现象,但并不严重。
我们注意到的一点是,通过特殊按键改变亮度只有在再次松开按键时才会生效,这有点恼人。
| |||||||||||||||||||||||||
Brightness Distribution: 88 %
Center on Battery: 372 cd/m²
Contrast: 1139:1 (Black: 0.33 cd/m²)
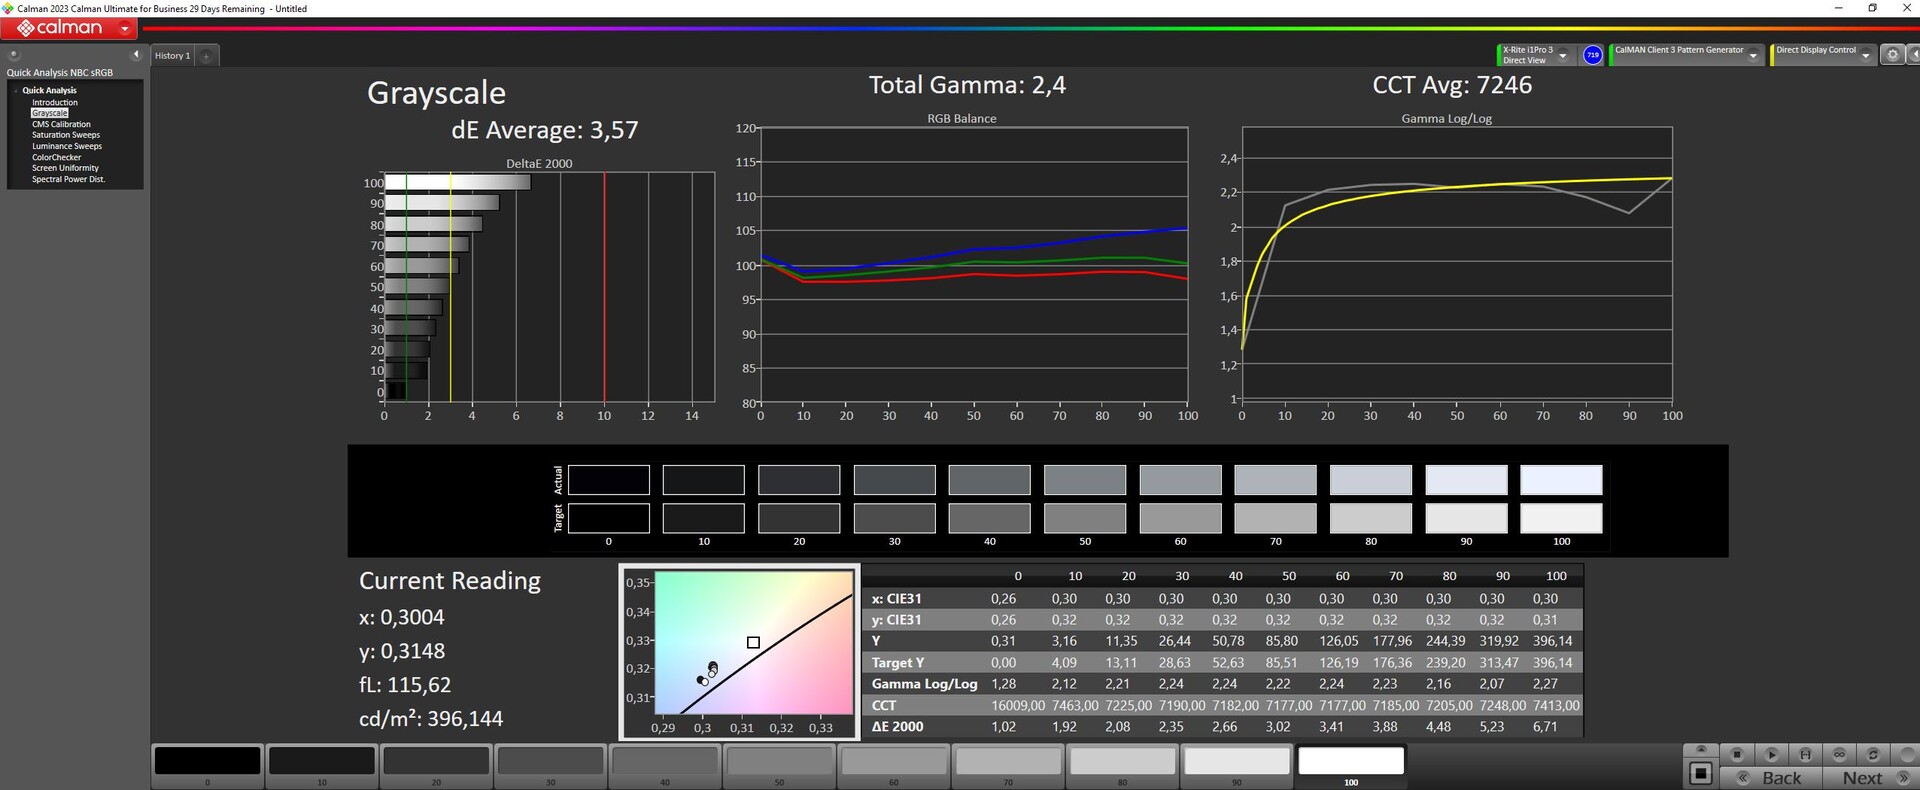
ΔE ColorChecker Calman: 2.74 | ∀{0.5-29.43 Ø4.71}
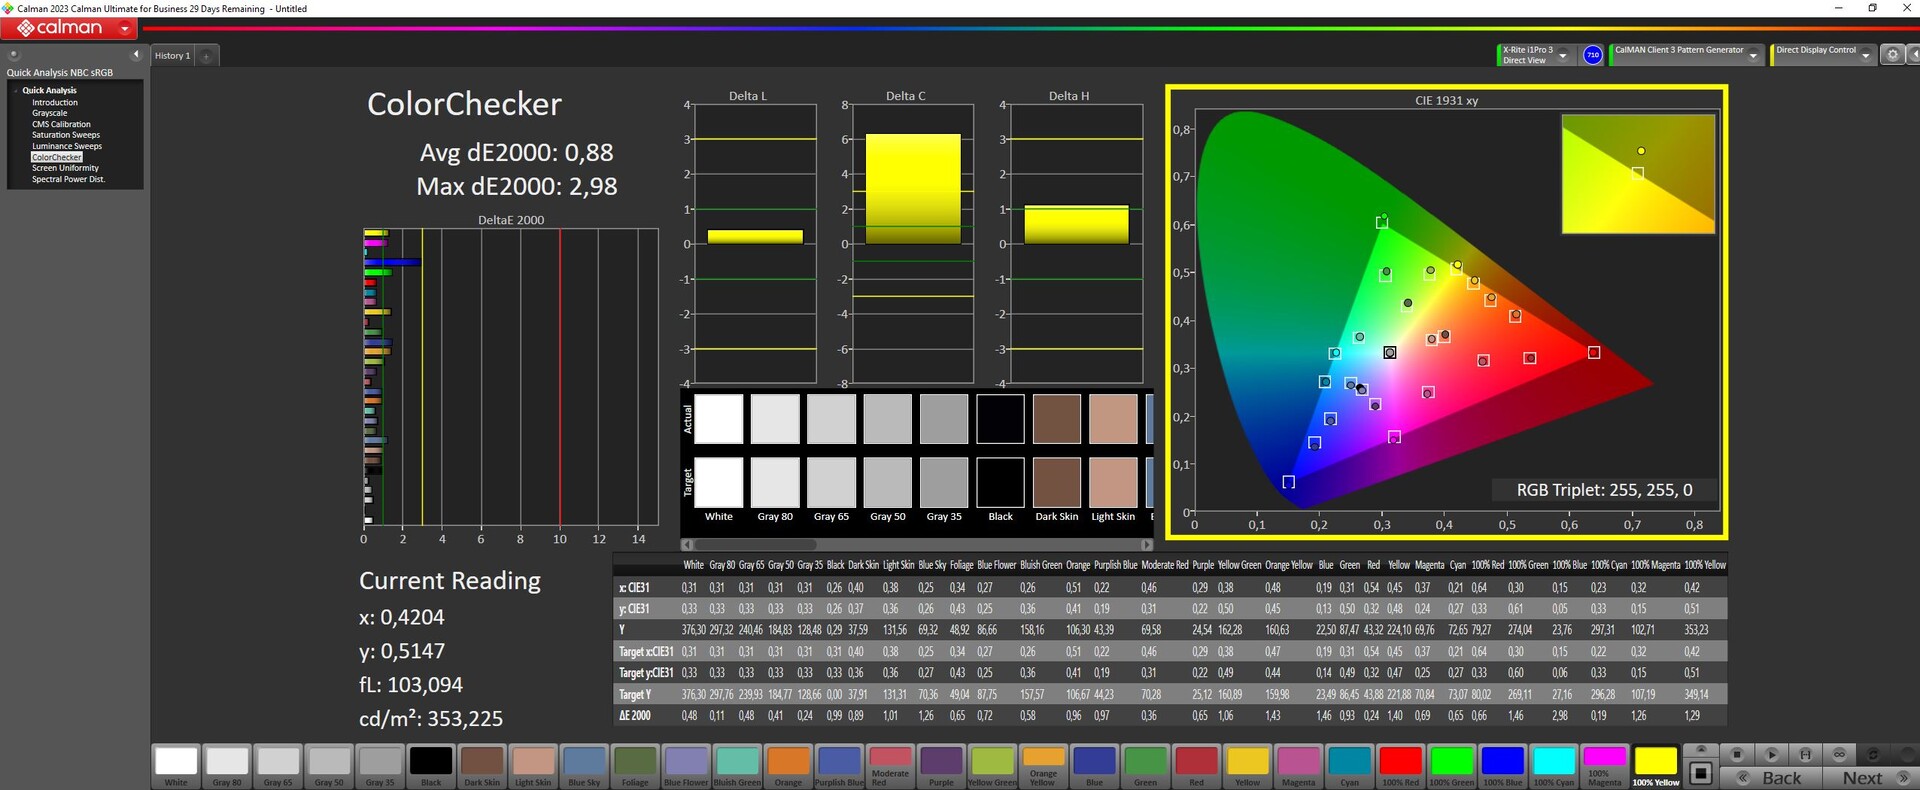
calibrated: 0.88
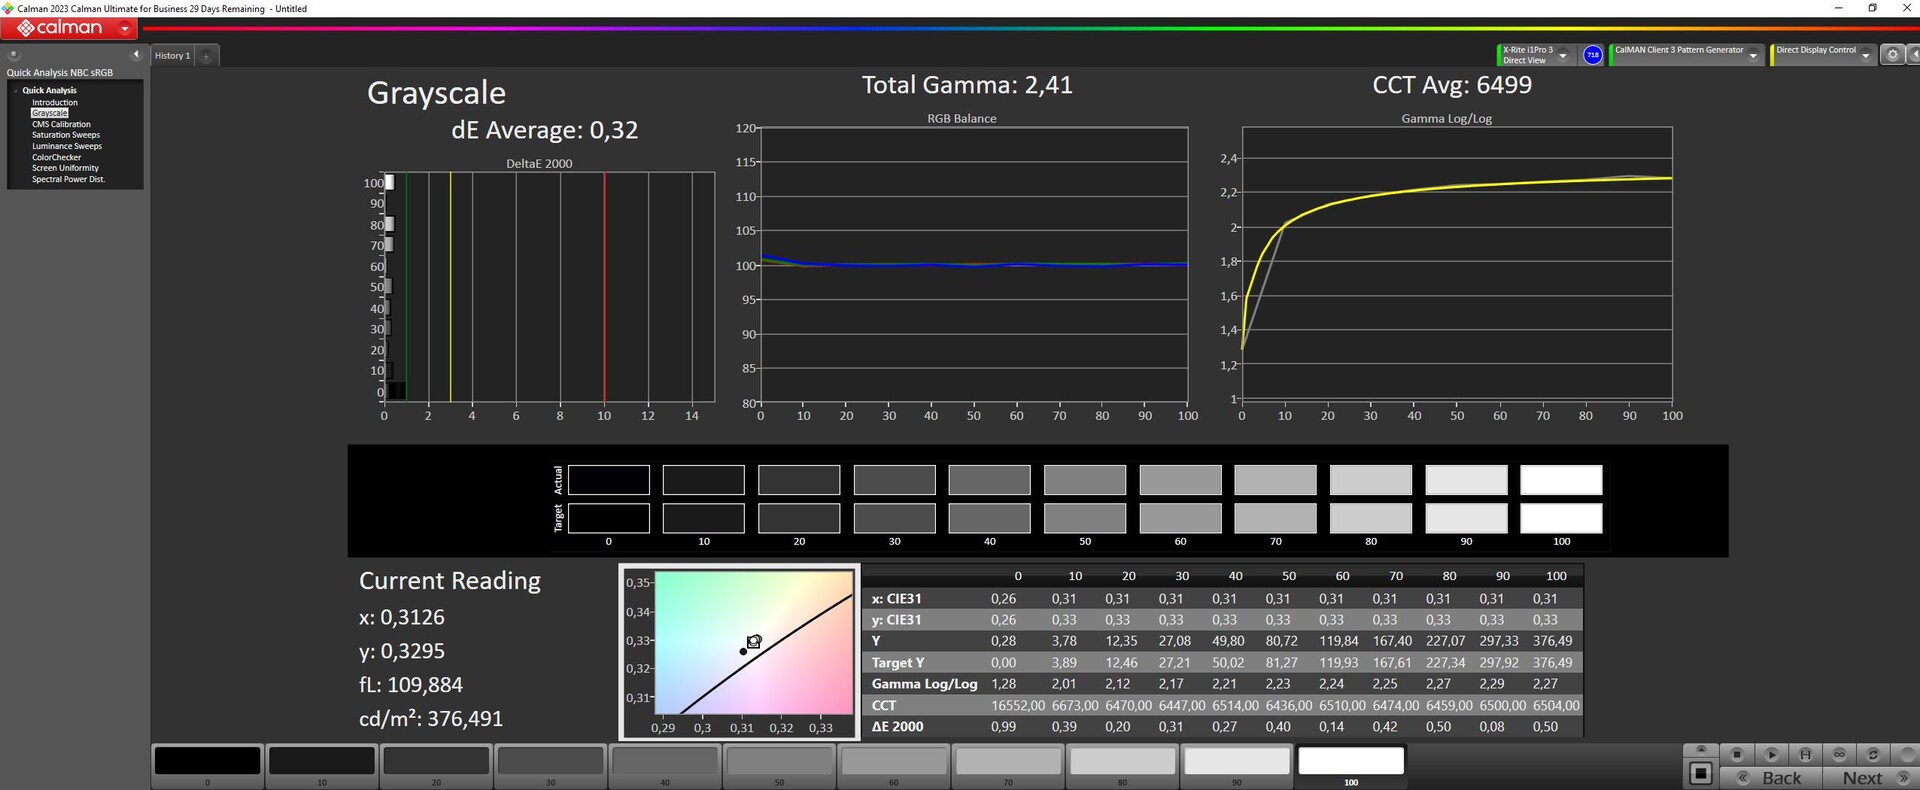
ΔE Greyscale Calman: 3.57 | ∀{0.09-98 Ø4.96}
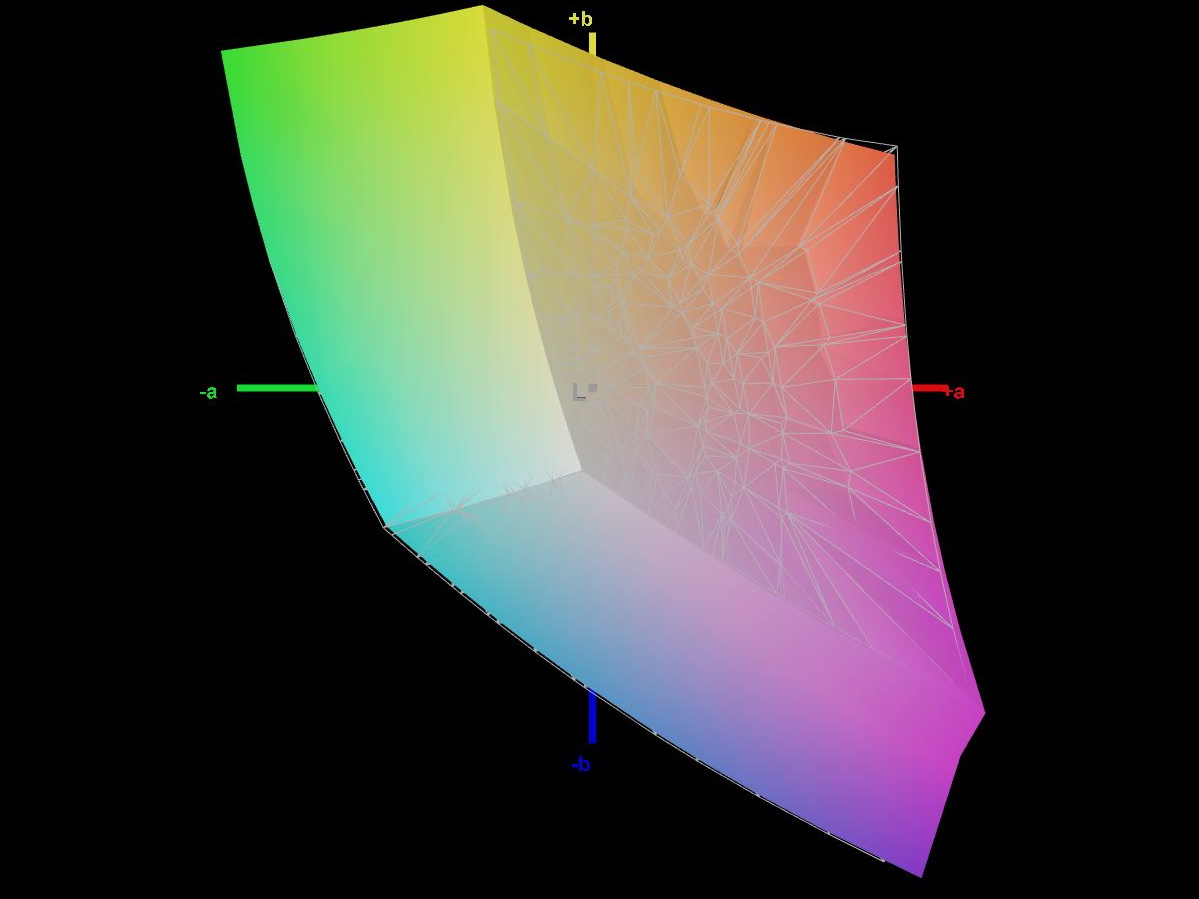
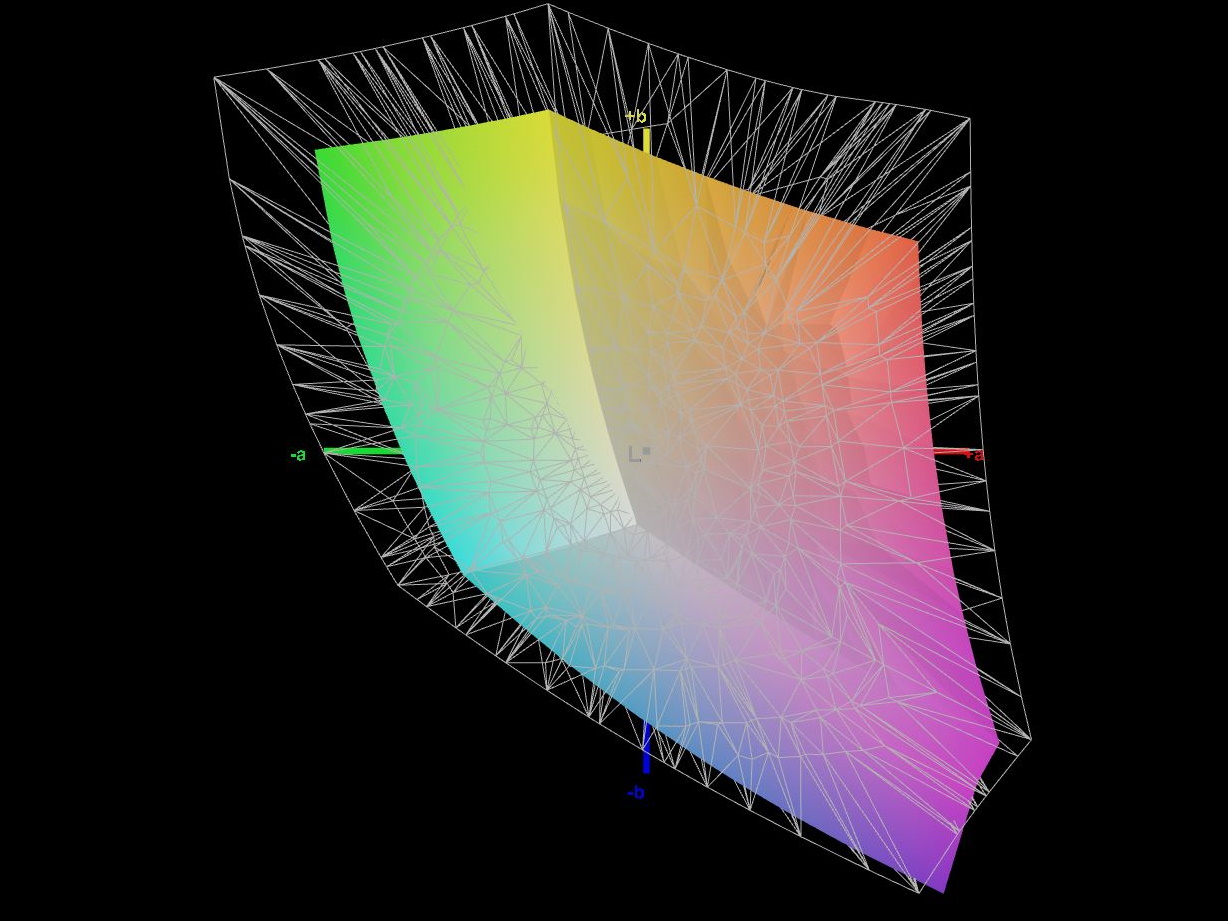
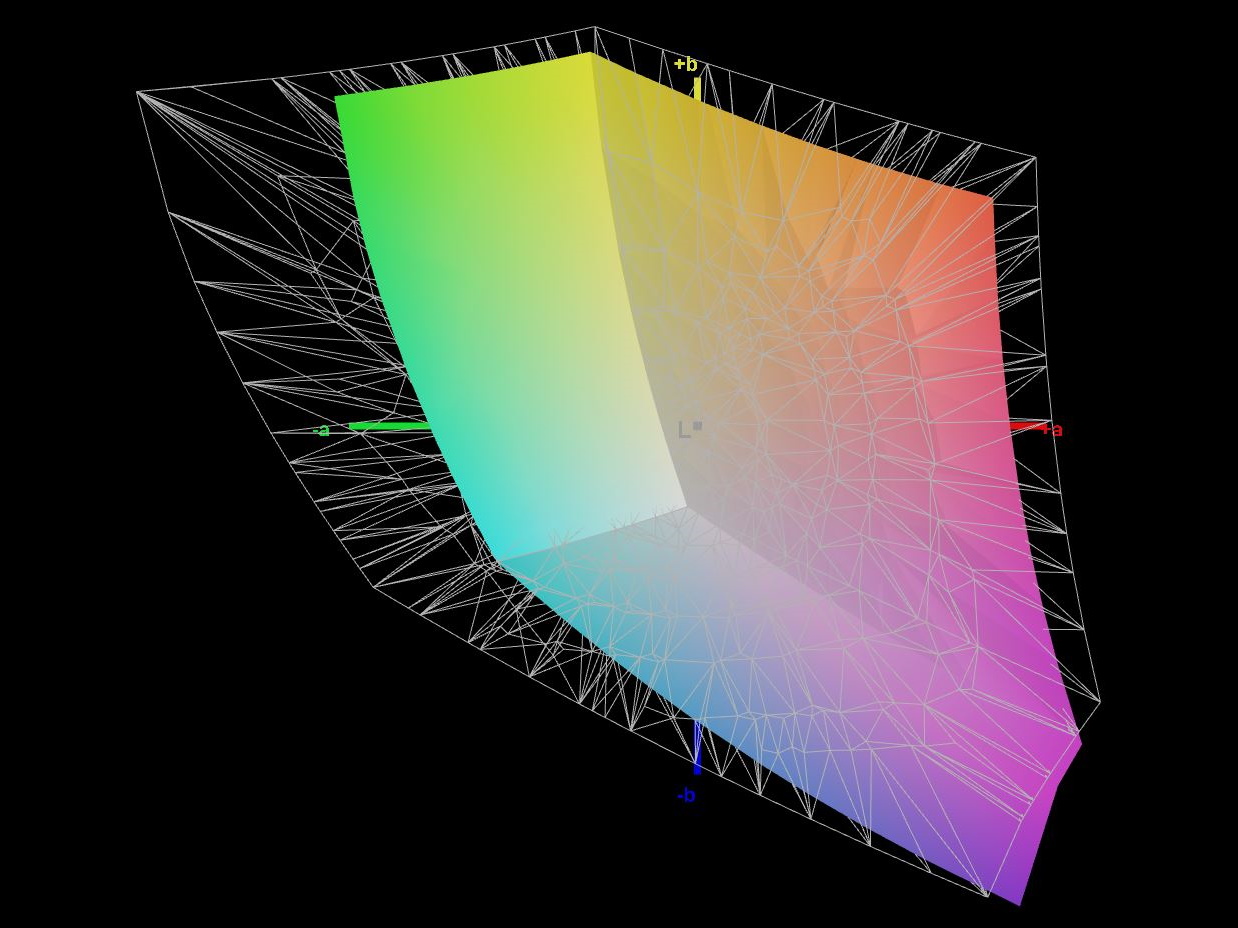
69.6% AdobeRGB 1998 (Argyll 3D)
98.6% sRGB (Argyll 3D)
68.3% Display P3 (Argyll 3D)
Gamma: 2.4
CCT: 7246 K
| Schenker XMG CORE 16 (L23) BOE0AF0 (), IPS, 2560x1600, 16" | Lenovo Legion Pro 5 16ARX8 CSOT T3 MNG007DA1-Q, IPS, 2560x1600, 16" | Acer Nitro 16 AN16-41 BOE CQ NE16QDM-NY1, IPS, 2560x1600, 16" | HP Omen Transcend 16 AUOA3A6, Mini-LED, 2560x1600, 16" | MSI Stealth 16 Studio A13VG AUO26A9, IPS, 2560x1600, 16" | HP Victus 16-r0077ng CMN162D, IPS, 1920x1080, 16.1" | |
|---|---|---|---|---|---|---|
| Display | 3% | 0% | 24% | 21% | -1% | |
| Display P3 Coverage (%) | 68.3 | 70.4 3% | 67.9 -1% | 99.2 45% | 96.4 41% | 66.7 -2% |
| sRGB Coverage (%) | 98.6 | 99.6 1% | 99.1 1% | 100 1% | 99.7 1% | 98 -1% |
| AdobeRGB 1998 Coverage (%) | 69.6 | 72.6 4% | 69.9 0% | 87.6 26% | 84.8 22% | 69 -1% |
| Response Times | 5% | 21% | -214% | 41% | -13% | |
| Response Time Grey 50% / Grey 80% * (ms) | 13.2 ? | 7 ? 47% | 11 ? 17% | 26.4 ? -100% | 4.4 ? 67% | 13.3 ? -1% |
| Response Time Black / White * (ms) | 6.6 ? | 9.1 ? -38% | 5 ? 24% | 28.2 ? -327% | 5.6 ? 15% | 8.2 ? -24% |
| PWM Frequency (Hz) | 3506 ? | |||||
| Screen | 26% | 18% | 195% | -30% | 17% | |
| Brightness middle (cd/m²) | 376 | 355.3 -6% | 520 38% | 791.1 110% | 424 13% | 308 -18% |
| Brightness (cd/m²) | 358 | 340 -5% | 494 38% | 800 123% | 411 15% | 285 -20% |
| Brightness Distribution (%) | 88 | 91 3% | 91 3% | 95 8% | 88 0% | 85 -3% |
| Black Level * (cd/m²) | 0.33 | 0.32 3% | 0.39 -18% | 0.04 88% | 0.37 -12% | 0.25 24% |
| Contrast (:1) | 1139 | 1110 -3% | 1333 17% | 19778 1636% | 1146 1% | 1232 8% |
| Colorchecker dE 2000 * | 2.74 | 1.13 59% | 1.94 29% | 4.37 -59% | 3.04 -11% | 1.3 53% |
| Colorchecker dE 2000 max. * | 6.78 | 2.78 59% | 5.62 17% | 10.39 -53% | 7.5 -11% | 2.76 59% |
| Colorchecker dE 2000 calibrated * | 0.88 | 0.32 64% | 0.74 16% | 1.04 -18% | 3.04 -245% | 0.92 -5% |
| Greyscale dE 2000 * | 3.57 | 1.4 61% | 2.94 18% | 6.5 -82% | 4.34 -22% | 1.7 52% |
| Gamma | 2.4 92% | 2.24 98% | 2.37 93% | 2.28 96% | 2.32 95% | 2.167 102% |
| CCT | 7246 90% | 6372 102% | 6443 101% | 6000 108% | 6952 93% | 6767 96% |
| Total Average (Program / Settings) | 11% /
18% | 13% /
14% | 2% /
100% | 11% /
-9% | 1% /
9% |
* ... smaller is better
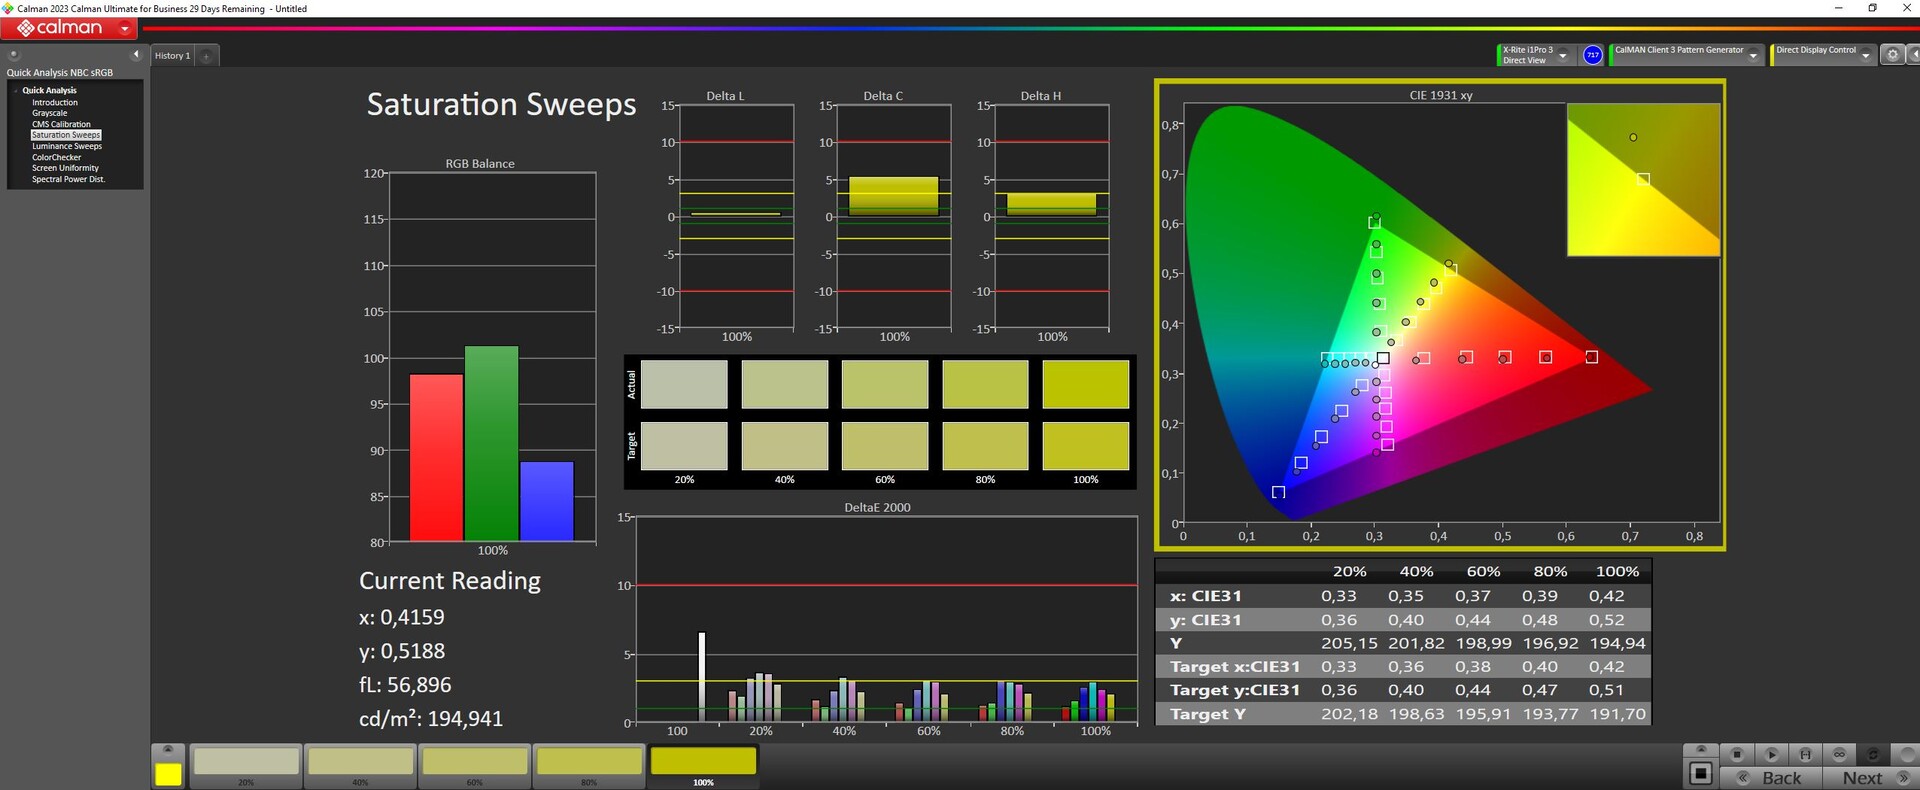
通过使用 Xrite 色彩测量设备和 Calman 软件,我们可以大幅提高屏幕的色彩表现(但并非完全理想),使色彩和灰度 DeltaE 值(标准偏差)降至 1。

Display Response Times
| ↔ Response Time Black to White | ||
|---|---|---|
| 6.6 ms ... rise ↗ and fall ↘ combined | ↗ 2.5 ms rise | 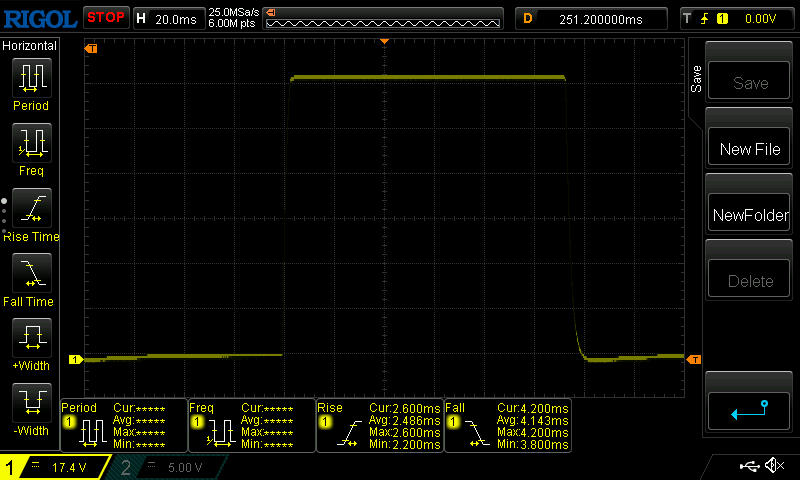 |
| ↘ 4.1 ms fall | ||
| The screen shows very fast response rates in our tests and should be very well suited for fast-paced gaming. In comparison, all tested devices range from 0.1 (minimum) to 240 (maximum) ms. » 21 % of all devices are better. This means that the measured response time is better than the average of all tested devices (19.8 ms). | ||
| ↔ Response Time 50% Grey to 80% Grey | ||
| 13.2 ms ... rise ↗ and fall ↘ combined | ↗ 6.1 ms rise | 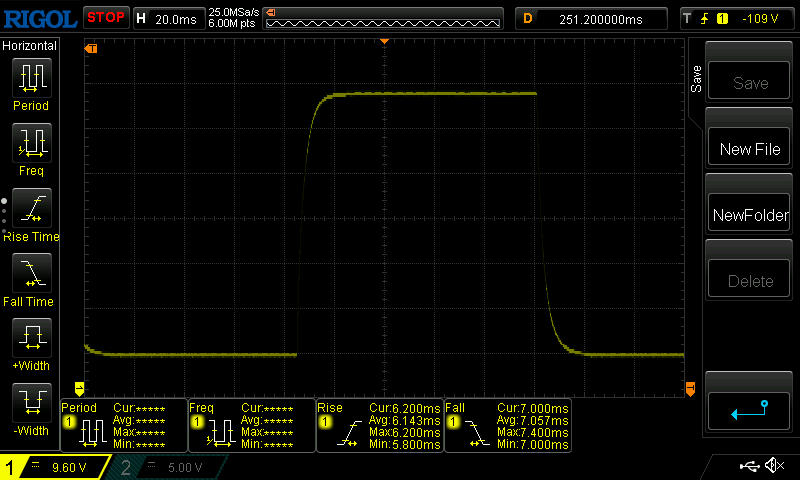 |
| ↘ 7.1 ms fall | ||
| The screen shows good response rates in our tests, but may be too slow for competitive gamers. In comparison, all tested devices range from 0.165 (minimum) to 636 (maximum) ms. » 27 % of all devices are better. This means that the measured response time is better than the average of all tested devices (30.9 ms). | ||
Screen Flickering / PWM (Pulse-Width Modulation)
| Screen flickering / PWM not detected |  | ||
In comparison: 52 % of all tested devices do not use PWM to dim the display. If PWM was detected, an average of 7748 (minimum: 5 - maximum: 343500) Hz was measured. | |||
在室外,当你正对着显示屏时,在阴暗处也能很好地阅读。

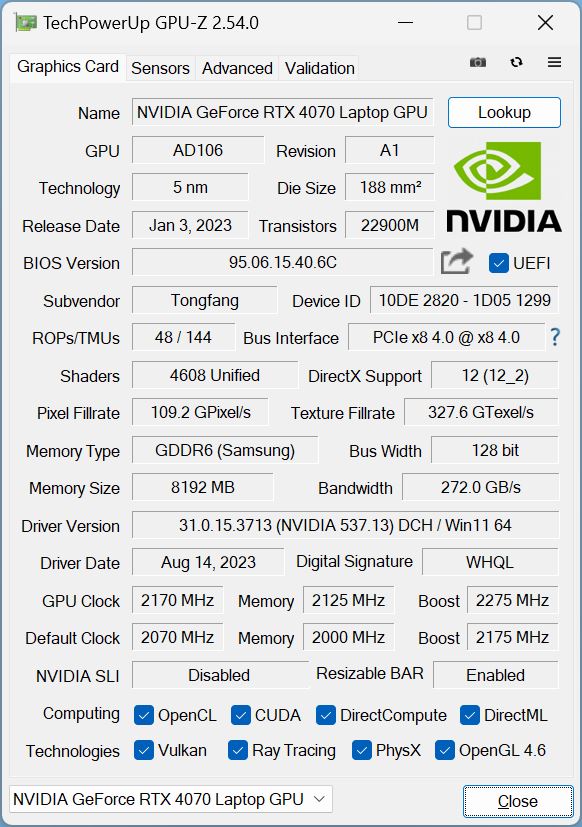
性能 - 强劲的 RTX 4070 和 Ryzen 7
......(英文RTX 4070是酷睿 16 成为游戏笔记本电脑的关键所在。专业人士和创意人士可能也会对这款设备感兴趣--不过,对于这些人来说,sRGB 色彩空间可能还不够,DisplayP3 也未涵盖在内。
与更普遍的英特尔 CPU 组合相比,该设备安装了AMD Ryzen 7 7840HS。安装。高端 CPU 加上 32GB 内存和显卡,实际上使这款设备更像是一款高端游戏笔记本电脑。几乎所有当前流行的游戏都能在其 1600p 原生分辨率下流畅运行,并获得最佳细节。
在申克的订购网站bestware.com,你可以对笔记本电脑进行大量配置,选择不同的固态硬盘和内存制造商,等等。您需要记住这一点,因为我们的测试只考虑了我们的具体配置。
测试条件
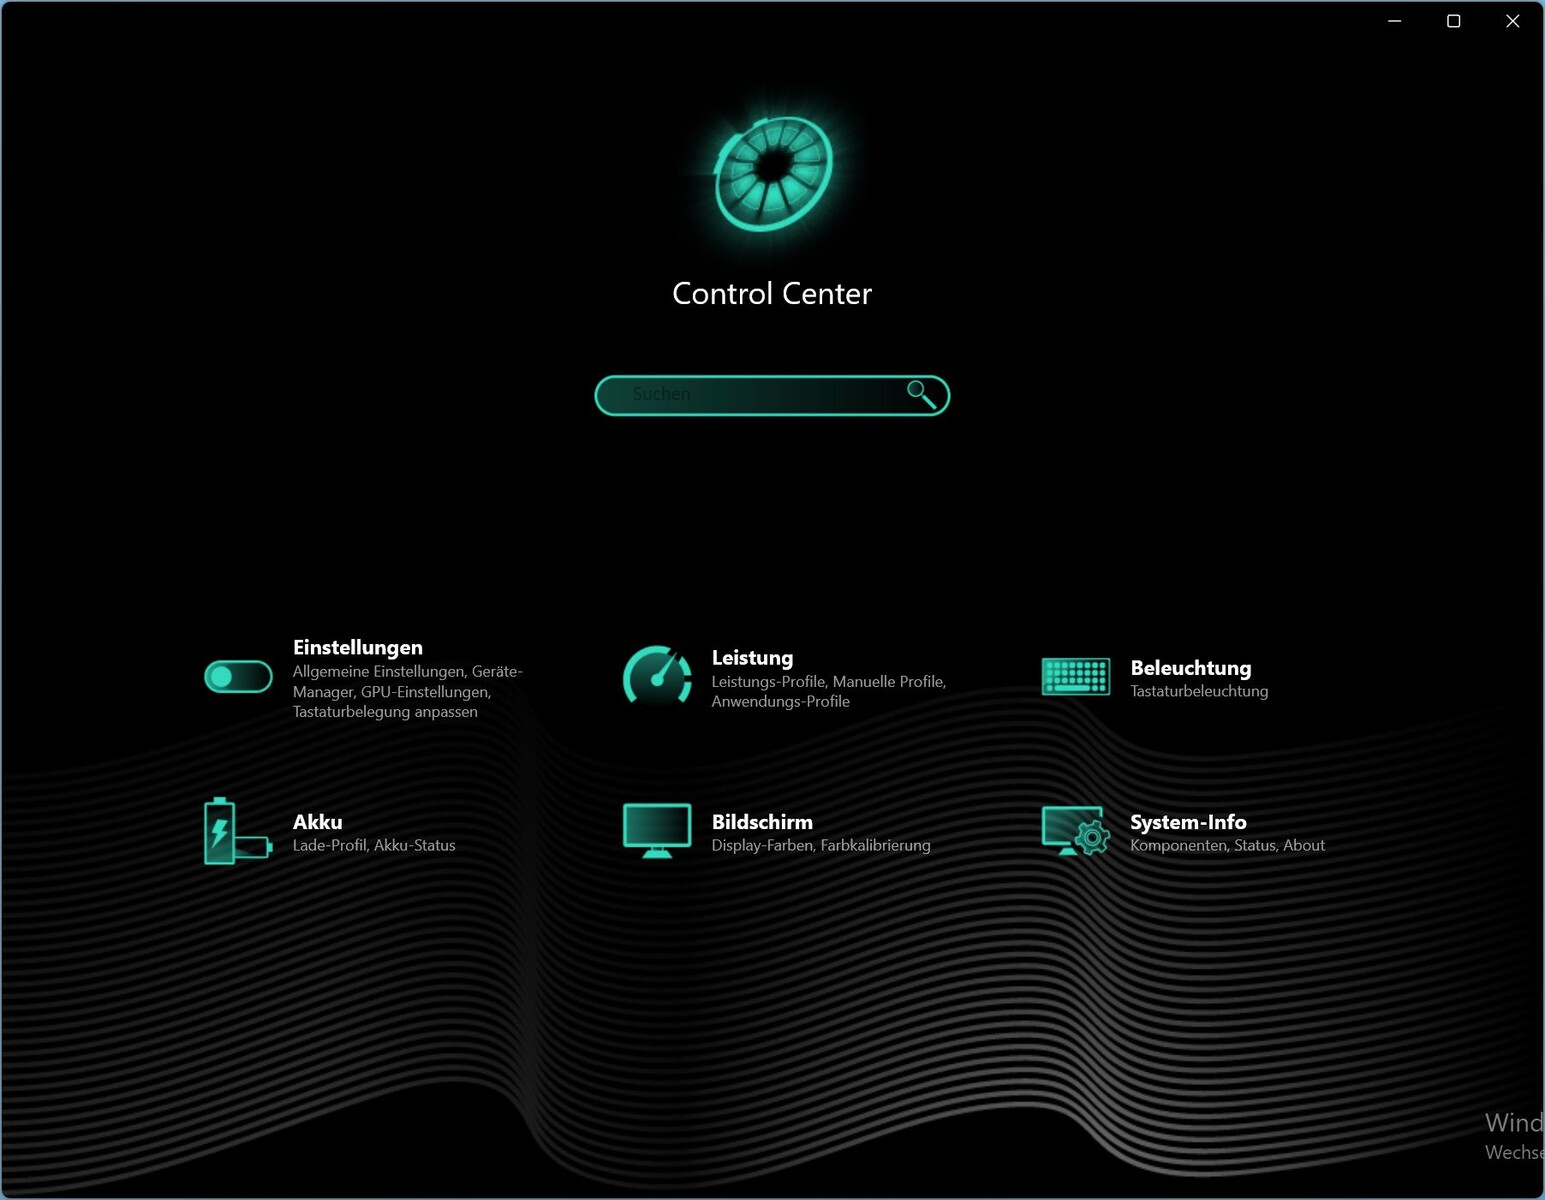
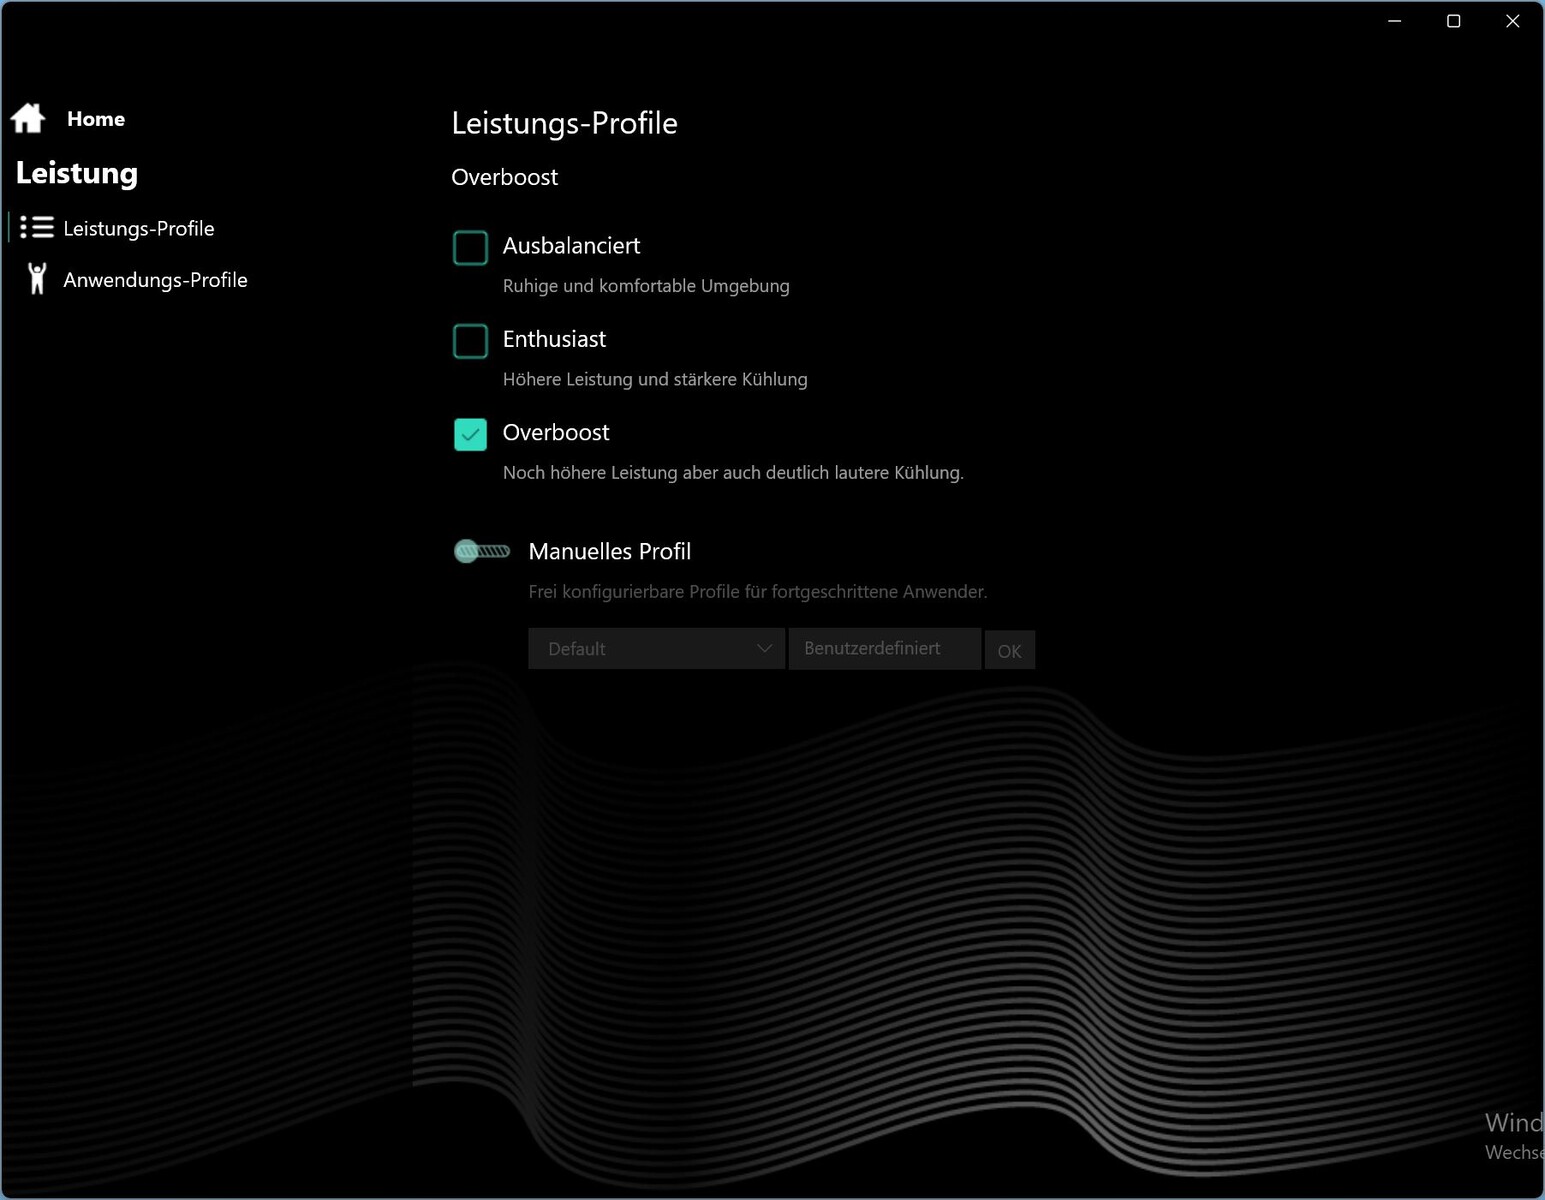
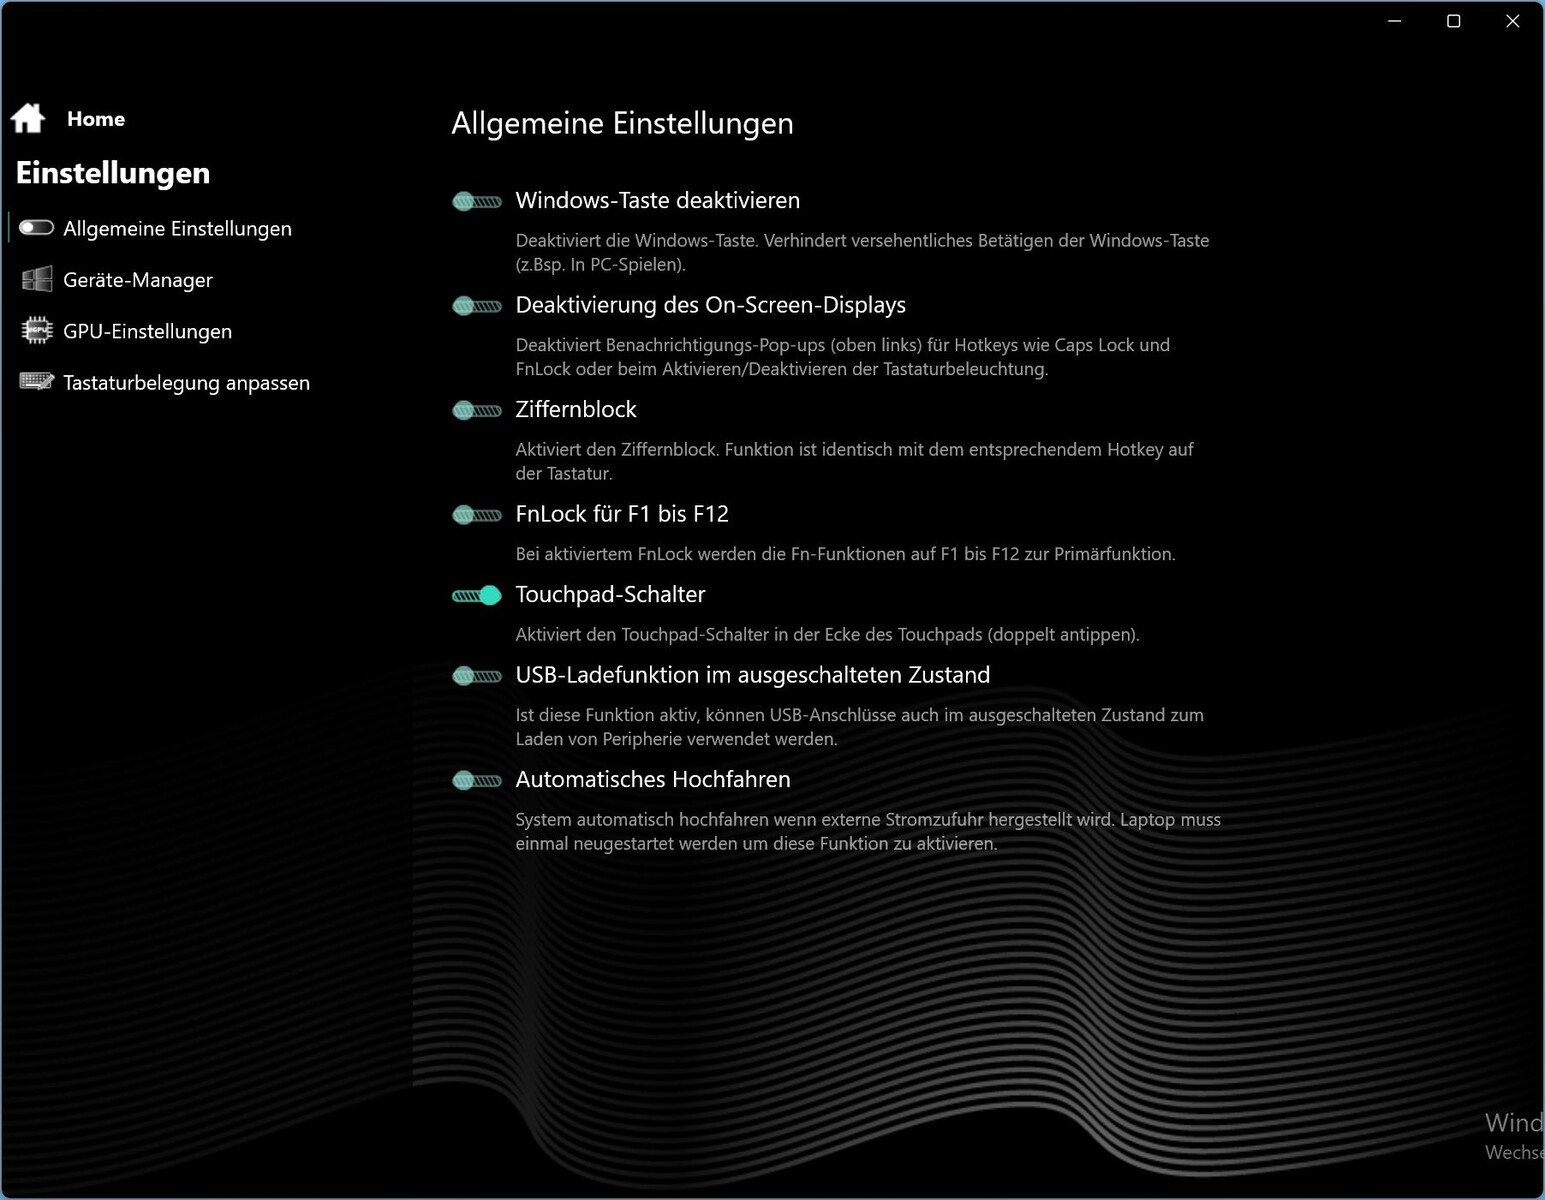
申克设备的控制中心可让您设置性能预设值以及手动设置单个性能参数。这意味着您可以根据个人需求改变游戏笔记本电脑的性能。其他设置也是如此,例如键盘照明、充电行为和显示屏。
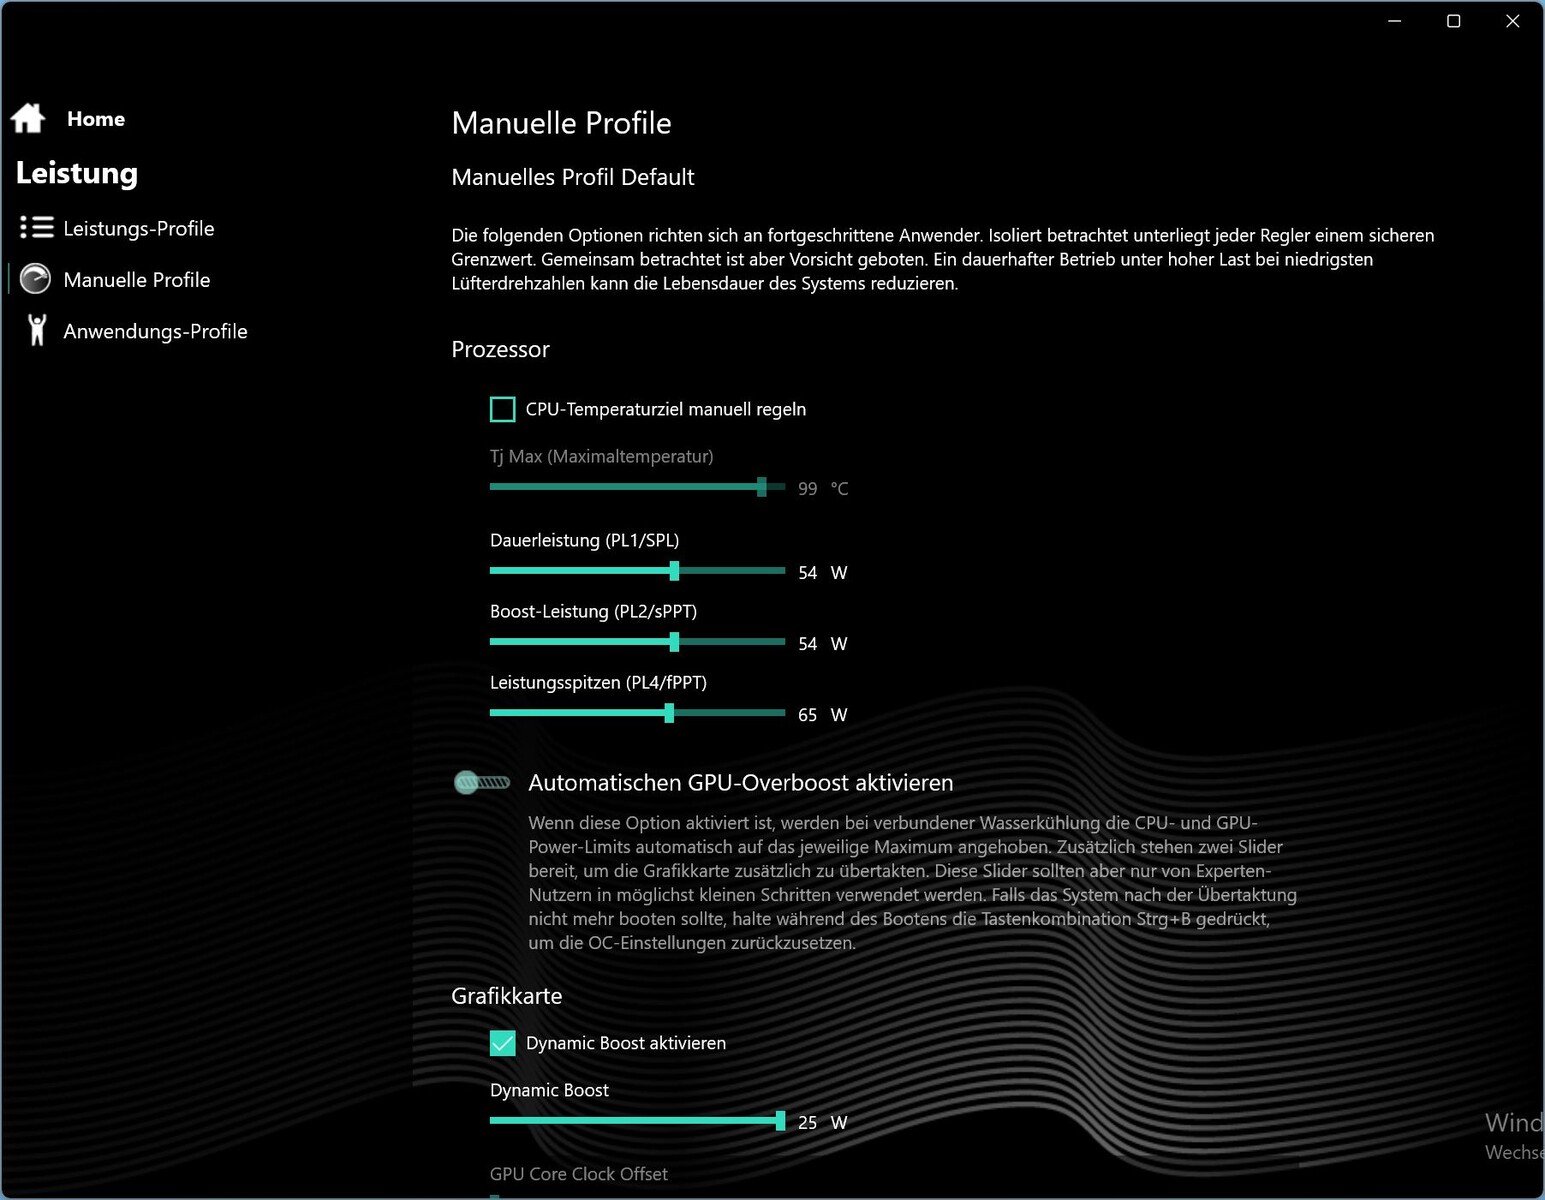
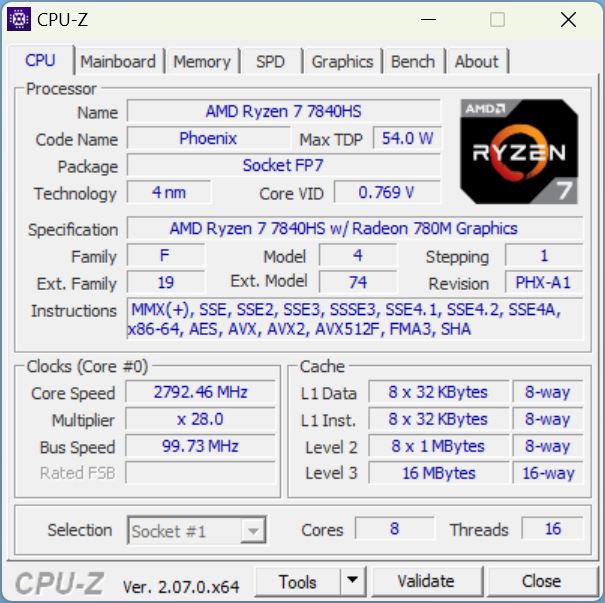
处理器
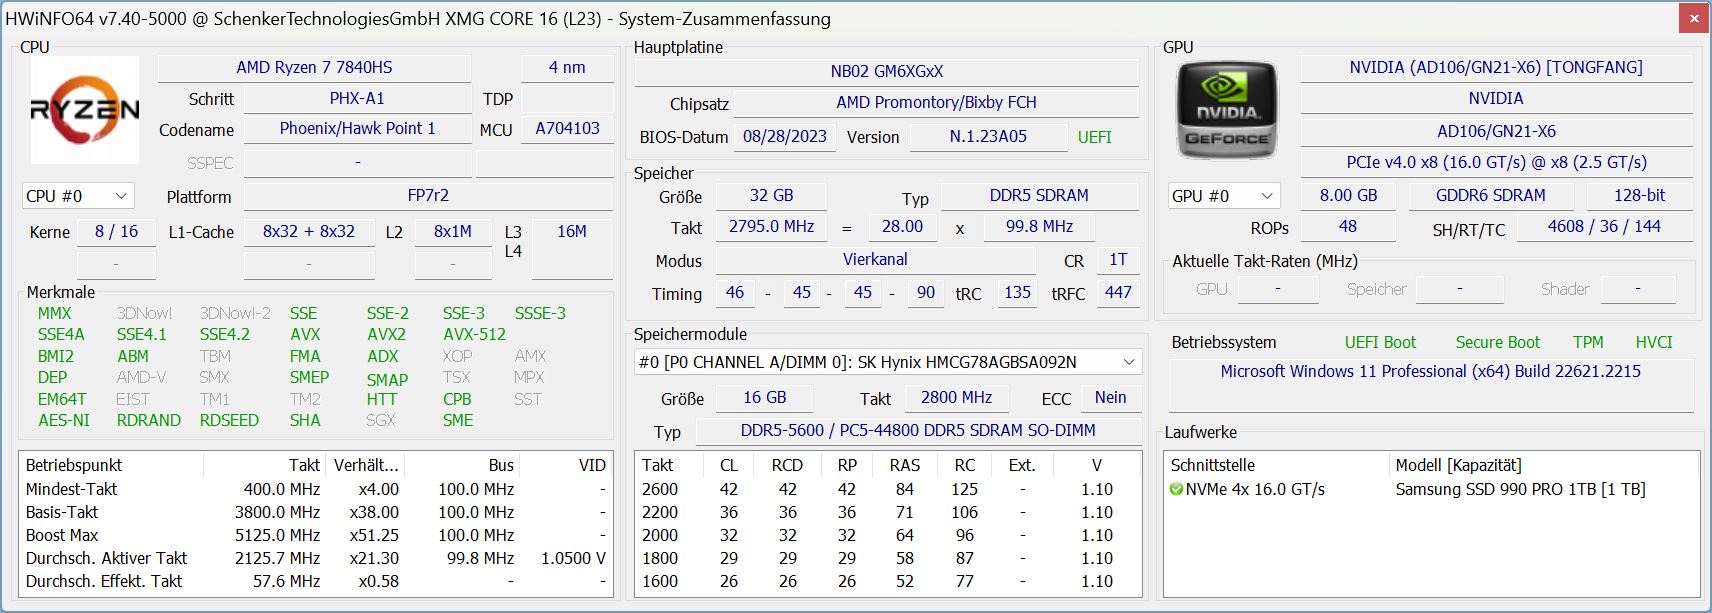
AMD 的 Ryzen 7 7840HS配备 8 个 Zen 4 内核,由于采用了 SMT 技术,线程数增加到 16 个。这些内核的主频从 3.8 GHz(基本主频)高达 5.1 GHz(单核提升)。这使它成为 Pheonix 系列中第二快的 CPU,仅次于Ryzen 9 7940HS.

相比之下,其性能与酷睿 i7-13700H.惠普Victus 16和微星 Stealth 16 Studio则更快。英特尔的 HX 处理器,尤其是更昂贵的i9-13900HX显然处于领先地位。
在 Cinebench R15 连续测试中,我们注意到性能没有下降--即使在第一次运行后,性能也始终保持在较高水平。这样,CPU 的 TDP 始终保持在 80 瓦。
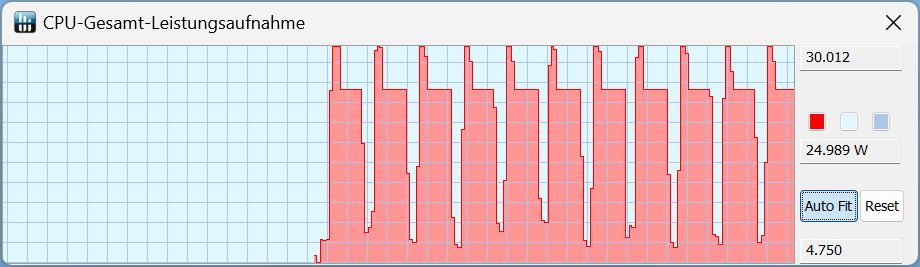
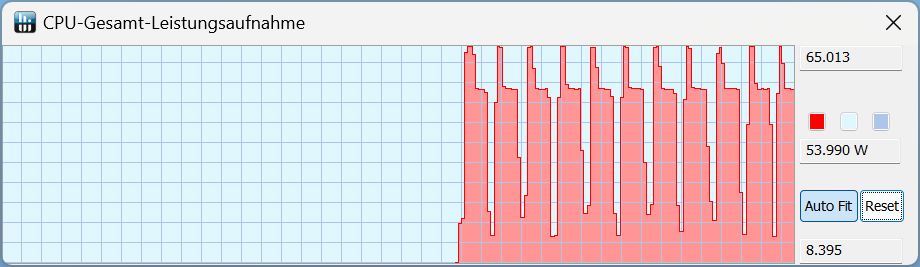
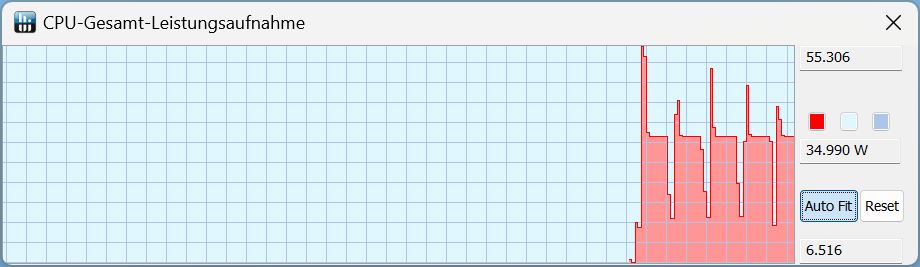
在 "发烧友 "模式下,开始运行时的功耗为 65 瓦,随后降至 55 瓦。在平衡模式下,CPU 仅在短时间内保持 50 至 55 瓦,随后降至 35 瓦。
在电池模式下,我们测得开始时有一小段时间为 30 瓦,随后为 25 瓦。其 Cinebench R15 分数从 2,681 降至 1,730 - 下降了 35%。
Cinebench R15 Multi continuous test
Cinebench R23: Multi Core | Single Core
Cinebench R20: CPU (Multi Core) | CPU (Single Core)
Cinebench R15: CPU Multi 64Bit | CPU Single 64Bit
Blender: v2.79 BMW27 CPU
7-Zip 18.03: 7z b 4 | 7z b 4 -mmt1
Geekbench 5.5: Multi-Core | Single-Core
HWBOT x265 Benchmark v2.2: 4k Preset
LibreOffice : 20 Documents To PDF
R Benchmark 2.5: Overall mean
| CPU Performance rating | |
| HP Omen Transcend 16 | |
| Average of class Gaming | |
| Lenovo Legion Pro 5 16ARX8 | |
| MSI Stealth 16 Studio A13VG | |
| Average AMD Ryzen 7 7840HS | |
| Schenker XMG CORE 16 (L23) | |
| HP Victus 16-r0077ng | |
| Acer Nitro 16 AN16-41 | |
| Cinebench R23 / Multi Core | |
| Average of class Gaming (10488 - 42661, n=108, last 2 years) | |
| HP Omen Transcend 16 | |
| MSI Stealth 16 Studio A13VG | |
| Lenovo Legion Pro 5 16ARX8 | |
| Schenker XMG CORE 16 (L23) | |
| Average AMD Ryzen 7 7840HS (14784 - 17214, n=19) | |
| HP Victus 16-r0077ng | |
| Acer Nitro 16 AN16-41 | |
| Cinebench R23 / Single Core | |
| HP Omen Transcend 16 | |
| Average of class Gaming (1166 - 2415, n=108, last 2 years) | |
| MSI Stealth 16 Studio A13VG | |
| Lenovo Legion Pro 5 16ARX8 | |
| Average AMD Ryzen 7 7840HS (1718 - 1812, n=19) | |
| Schenker XMG CORE 16 (L23) | |
| HP Victus 16-r0077ng | |
| Acer Nitro 16 AN16-41 | |
| Cinebench R20 / CPU (Multi Core) | |
| Average of class Gaming (4029 - 16433, n=107, last 2 years) | |
| HP Omen Transcend 16 | |
| MSI Stealth 16 Studio A13VG | |
| Lenovo Legion Pro 5 16ARX8 | |
| Schenker XMG CORE 16 (L23) | |
| Average AMD Ryzen 7 7840HS (5761 - 6744, n=19) | |
| HP Victus 16-r0077ng | |
| Acer Nitro 16 AN16-41 | |
| Cinebench R20 / CPU (Single Core) | |
| HP Omen Transcend 16 | |
| Average of class Gaming (442 - 913, n=107, last 2 years) | |
| MSI Stealth 16 Studio A13VG | |
| Lenovo Legion Pro 5 16ARX8 | |
| Schenker XMG CORE 16 (L23) | |
| Average AMD Ryzen 7 7840HS (661 - 705, n=19) | |
| HP Victus 16-r0077ng | |
| Acer Nitro 16 AN16-41 | |
| Cinebench R15 / CPU Multi 64Bit | |
| HP Omen Transcend 16 | |
| Average of class Gaming (1578 - 6330, n=106, last 2 years) | |
| Lenovo Legion Pro 5 16ARX8 | |
| MSI Stealth 16 Studio A13VG | |
| Schenker XMG CORE 16 (L23) | |
| Average AMD Ryzen 7 7840HS (2300 - 2729, n=19) | |
| Acer Nitro 16 AN16-41 | |
| HP Victus 16-r0077ng | |
| Cinebench R15 / CPU Single 64Bit | |
| HP Omen Transcend 16 | |
| Average of class Gaming (188.8 - 350, n=107, last 2 years) | |
| Lenovo Legion Pro 5 16ARX8 | |
| Average AMD Ryzen 7 7840HS (270 - 286, n=19) | |
| MSI Stealth 16 Studio A13VG | |
| Schenker XMG CORE 16 (L23) | |
| Acer Nitro 16 AN16-41 | |
| HP Victus 16-r0077ng | |
| Blender / v2.79 BMW27 CPU | |
| Acer Nitro 16 AN16-41 | |
| HP Victus 16-r0077ng | |
| Average AMD Ryzen 7 7840HS (185 - 231, n=20) | |
| Schenker XMG CORE 16 (L23) | |
| Lenovo Legion Pro 5 16ARX8 | |
| MSI Stealth 16 Studio A13VG | |
| Average of class Gaming (79 - 330, n=105, last 2 years) | |
| HP Omen Transcend 16 | |
| 7-Zip 18.03 / 7z b 4 | |
| HP Omen Transcend 16 | |
| Average of class Gaming (33491 - 148086, n=106, last 2 years) | |
| MSI Stealth 16 Studio A13VG | |
| Lenovo Legion Pro 5 16ARX8 | |
| Schenker XMG CORE 16 (L23) | |
| Average AMD Ryzen 7 7840HS (59538 - 73035, n=20) | |
| HP Victus 16-r0077ng | |
| Acer Nitro 16 AN16-41 | |
| 7-Zip 18.03 / 7z b 4 -mmt1 | |
| Lenovo Legion Pro 5 16ARX8 | |
| HP Omen Transcend 16 | |
| Schenker XMG CORE 16 (L23) | |
| Average AMD Ryzen 7 7840HS (6049 - 6754, n=20) | |
| Average of class Gaming (4199 - 7436, n=106, last 2 years) | |
| MSI Stealth 16 Studio A13VG | |
| Acer Nitro 16 AN16-41 | |
| HP Victus 16-r0077ng | |
| Geekbench 5.5 / Multi-Core | |
| HP Omen Transcend 16 | |
| Average of class Gaming (6460 - 28263, n=106, last 2 years) | |
| MSI Stealth 16 Studio A13VG | |
| Lenovo Legion Pro 5 16ARX8 | |
| Schenker XMG CORE 16 (L23) | |
| Average AMD Ryzen 7 7840HS (8446 - 12339, n=23) | |
| HP Victus 16-r0077ng | |
| Acer Nitro 16 AN16-41 | |
| Geekbench 5.5 / Single-Core | |
| Average of class Gaming (986 - 2474, n=106, last 2 years) | |
| HP Omen Transcend 16 | |
| Lenovo Legion Pro 5 16ARX8 | |
| Average AMD Ryzen 7 7840HS (1837 - 2017, n=23) | |
| Schenker XMG CORE 16 (L23) | |
| MSI Stealth 16 Studio A13VG | |
| HP Victus 16-r0077ng | |
| Acer Nitro 16 AN16-41 | |
| HWBOT x265 Benchmark v2.2 / 4k Preset | |
| Average of class Gaming (11.5 - 44.4, n=106, last 2 years) | |
| HP Omen Transcend 16 | |
| Lenovo Legion Pro 5 16ARX8 | |
| Schenker XMG CORE 16 (L23) | |
| Average AMD Ryzen 7 7840HS (11.7 - 21.8, n=20) | |
| MSI Stealth 16 Studio A13VG | |
| Acer Nitro 16 AN16-41 | |
| HP Victus 16-r0077ng | |
| LibreOffice / 20 Documents To PDF | |
| Schenker XMG CORE 16 (L23) | |
| HP Victus 16-r0077ng | |
| MSI Stealth 16 Studio A13VG | |
| Acer Nitro 16 AN16-41 | |
| Average of class Gaming (33.2 - 88.8, n=106, last 2 years) | |
| Average AMD Ryzen 7 7840HS (38.3 - 68.3, n=20) | |
| HP Omen Transcend 16 | |
| Lenovo Legion Pro 5 16ARX8 | |
| R Benchmark 2.5 / Overall mean | |
| HP Victus 16-r0077ng | |
| Acer Nitro 16 AN16-41 | |
| MSI Stealth 16 Studio A13VG | |
| Average AMD Ryzen 7 7840HS (0.4184 - 0.4739, n=20) | |
| Schenker XMG CORE 16 (L23) | |
| Average of class Gaming (0.3439 - 0.759, n=107, last 2 years) | |
| Lenovo Legion Pro 5 16ARX8 | |
| HP Omen Transcend 16 | |
* ... smaller is better
AIDA64: FP32 Ray-Trace | FPU Julia | CPU SHA3 | CPU Queen | FPU SinJulia | FPU Mandel | CPU AES | CPU ZLib | FP64 Ray-Trace | CPU PhotoWorxx
| Performance rating | |
| Average of class Gaming | |
| HP Omen Transcend 16 | |
| Average AMD Ryzen 7 7840HS | |
| Lenovo Legion Pro 5 16ARX8 | |
| Schenker XMG CORE 16 (L23) | |
| MSI Stealth 16 Studio A13VG | |
| Acer Nitro 16 AN16-41 | |
| HP Victus 16-r0077ng | |
| AIDA64 / FP32 Ray-Trace | |
| Average of class Gaming (10227 - 85542, n=106, last 2 years) | |
| Lenovo Legion Pro 5 16ARX8 | |
| Schenker XMG CORE 16 (L23) | |
| Average AMD Ryzen 7 7840HS (22845 - 28921, n=21) | |
| HP Omen Transcend 16 | |
| MSI Stealth 16 Studio A13VG | |
| Acer Nitro 16 AN16-41 | |
| HP Victus 16-r0077ng | |
| AIDA64 / FPU Julia | |
| Average of class Gaming (51376 - 372155, n=106, last 2 years) | |
| Lenovo Legion Pro 5 16ARX8 | |
| Schenker XMG CORE 16 (L23) | |
| HP Omen Transcend 16 | |
| Average AMD Ryzen 7 7840HS (97164 - 123167, n=21) | |
| Acer Nitro 16 AN16-41 | |
| MSI Stealth 16 Studio A13VG | |
| HP Victus 16-r0077ng | |
| AIDA64 / CPU SHA3 | |
| Average of class Gaming (2180 - 10115, n=106, last 2 years) | |
| HP Omen Transcend 16 | |
| Lenovo Legion Pro 5 16ARX8 | |
| Schenker XMG CORE 16 (L23) | |
| Average AMD Ryzen 7 7840HS (4293 - 5155, n=21) | |
| MSI Stealth 16 Studio A13VG | |
| Acer Nitro 16 AN16-41 | |
| HP Victus 16-r0077ng | |
| AIDA64 / CPU Queen | |
| Lenovo Legion Pro 5 16ARX8 | |
| HP Omen Transcend 16 | |
| Average of class Gaming (49785 - 173351, n=90, last 2 years) | |
| Average AMD Ryzen 7 7840HS (102271 - 125820, n=21) | |
| Acer Nitro 16 AN16-41 | |
| MSI Stealth 16 Studio A13VG | |
| Schenker XMG CORE 16 (L23) | |
| HP Victus 16-r0077ng | |
| AIDA64 / FPU SinJulia | |
| Lenovo Legion Pro 5 16ARX8 | |
| Schenker XMG CORE 16 (L23) | |
| Average AMD Ryzen 7 7840HS (13767 - 15525, n=21) | |
| Average of class Gaming (4424 - 33636, n=106, last 2 years) | |
| HP Omen Transcend 16 | |
| Acer Nitro 16 AN16-41 | |
| MSI Stealth 16 Studio A13VG | |
| HP Victus 16-r0077ng | |
| AIDA64 / FPU Mandel | |
| Average of class Gaming (25115 - 196829, n=106, last 2 years) | |
| Lenovo Legion Pro 5 16ARX8 | |
| Schenker XMG CORE 16 (L23) | |
| Average AMD Ryzen 7 7840HS (52084 - 65812, n=21) | |
| HP Omen Transcend 16 | |
| Acer Nitro 16 AN16-41 | |
| MSI Stealth 16 Studio A13VG | |
| HP Victus 16-r0077ng | |
| AIDA64 / CPU AES | |
| Average AMD Ryzen 7 7840HS (67389 - 177158, n=21) | |
| HP Omen Transcend 16 | |
| Average of class Gaming (39258 - 247074, n=106, last 2 years) | |
| Schenker XMG CORE 16 (L23) | |
| MSI Stealth 16 Studio A13VG | |
| Lenovo Legion Pro 5 16ARX8 | |
| HP Victus 16-r0077ng | |
| Acer Nitro 16 AN16-41 | |
| AIDA64 / CPU ZLib | |
| HP Omen Transcend 16 | |
| Average of class Gaming (574 - 2531, n=106, last 2 years) | |
| Lenovo Legion Pro 5 16ARX8 | |
| Schenker XMG CORE 16 (L23) | |
| Average AMD Ryzen 7 7840HS (944 - 1123, n=21) | |
| MSI Stealth 16 Studio A13VG | |
| HP Victus 16-r0077ng | |
| Acer Nitro 16 AN16-41 | |
| AIDA64 / FP64 Ray-Trace | |
| Average of class Gaming (5509 - 45446, n=106, last 2 years) | |
| Lenovo Legion Pro 5 16ARX8 | |
| Schenker XMG CORE 16 (L23) | |
| Average AMD Ryzen 7 7840HS (12248 - 15599, n=21) | |
| HP Omen Transcend 16 | |
| MSI Stealth 16 Studio A13VG | |
| Acer Nitro 16 AN16-41 | |
| HP Victus 16-r0077ng | |
| AIDA64 / CPU PhotoWorxx | |
| HP Omen Transcend 16 | |
| MSI Stealth 16 Studio A13VG | |
| Average of class Gaming (12271 - 89891, n=106, last 2 years) | |
| Schenker XMG CORE 16 (L23) | |
| HP Victus 16-r0077ng | |
| Average AMD Ryzen 7 7840HS (17615 - 41516, n=21) | |
| Lenovo Legion Pro 5 16ARX8 | |
| Acer Nitro 16 AN16-41 | |
系统性能
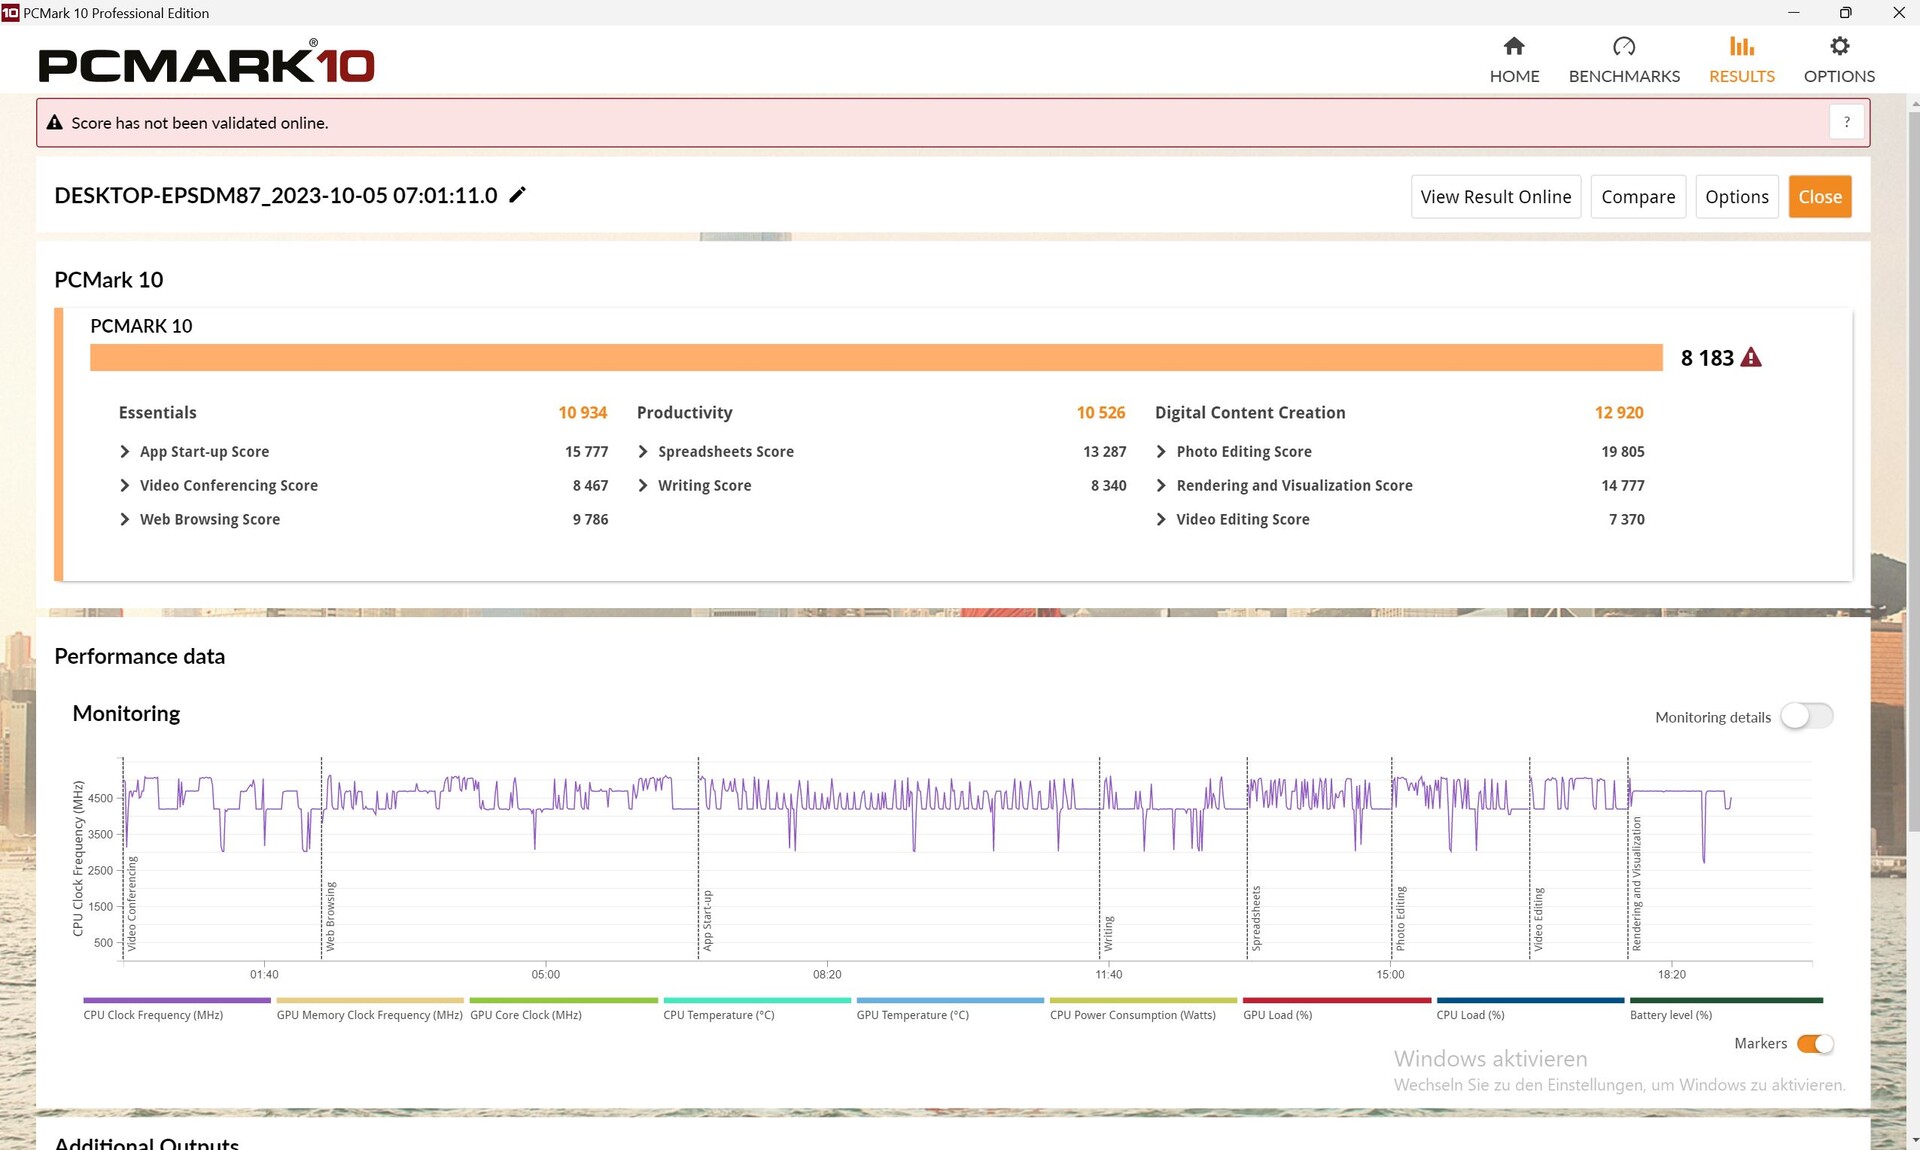
与 联想Legion Pro 5 16和HP Omen Transcend 16在系统性能方面,酷睿 16 遥遥领先。主观上,一切运行也都很流畅。
CrossMark: Overall | Productivity | Creativity | Responsiveness
| PCMark 10 / Score | |
| Average of class Gaming (5828 - 12414, n=94, last 2 years) | |
| Lenovo Legion Pro 5 16ARX8 | |
| Schenker XMG CORE 16 (L23) | |
| Average AMD Ryzen 7 7840HS, NVIDIA GeForce RTX 4070 Laptop GPU (8167 - 8183, n=2) | |
| HP Omen Transcend 16 | |
| MSI Stealth 16 Studio A13VG | |
| Acer Nitro 16 AN16-41 | |
| HP Victus 16-r0077ng | |
| PCMark 10 / Essentials | |
| HP Omen Transcend 16 | |
| Average AMD Ryzen 7 7840HS, NVIDIA GeForce RTX 4070 Laptop GPU (10934 - 11250, n=2) | |
| Lenovo Legion Pro 5 16ARX8 | |
| Schenker XMG CORE 16 (L23) | |
| HP Victus 16-r0077ng | |
| Average of class Gaming (8810 - 11935, n=98, last 2 years) | |
| Acer Nitro 16 AN16-41 | |
| MSI Stealth 16 Studio A13VG | |
| PCMark 10 / Productivity | |
| Average of class Gaming (6845 - 25323, n=96, last 2 years) | |
| Schenker XMG CORE 16 (L23) | |
| Average AMD Ryzen 7 7840HS, NVIDIA GeForce RTX 4070 Laptop GPU (10179 - 10526, n=2) | |
| Lenovo Legion Pro 5 16ARX8 | |
| HP Omen Transcend 16 | |
| MSI Stealth 16 Studio A13VG | |
| Acer Nitro 16 AN16-41 | |
| HP Victus 16-r0077ng | |
| PCMark 10 / Digital Content Creation | |
| Average of class Gaming (7602 - 19954, n=96, last 2 years) | |
| HP Omen Transcend 16 | |
| Lenovo Legion Pro 5 16ARX8 | |
| Schenker XMG CORE 16 (L23) | |
| Average AMD Ryzen 7 7840HS, NVIDIA GeForce RTX 4070 Laptop GPU (12908 - 12920, n=2) | |
| MSI Stealth 16 Studio A13VG | |
| Acer Nitro 16 AN16-41 | |
| HP Victus 16-r0077ng | |
| CrossMark / Overall | |
| Lenovo Legion Pro 5 16ARX8 | |
| Average of class Gaming (1366 - 2409, n=95, last 2 years) | |
| HP Omen Transcend 16 | |
| MSI Stealth 16 Studio A13VG | |
| Schenker XMG CORE 16 (L23) | |
| Average AMD Ryzen 7 7840HS, NVIDIA GeForce RTX 4070 Laptop GPU (n=1) | |
| Acer Nitro 16 AN16-41 | |
| CrossMark / Productivity | |
| Lenovo Legion Pro 5 16ARX8 | |
| Average of class Gaming (1386 - 2254, n=95, last 2 years) | |
| HP Omen Transcend 16 | |
| MSI Stealth 16 Studio A13VG | |
| Schenker XMG CORE 16 (L23) | |
| Average AMD Ryzen 7 7840HS, NVIDIA GeForce RTX 4070 Laptop GPU (n=1) | |
| Acer Nitro 16 AN16-41 | |
| CrossMark / Creativity | |
| HP Omen Transcend 16 | |
| Average of class Gaming (1343 - 2786, n=95, last 2 years) | |
| Lenovo Legion Pro 5 16ARX8 | |
| MSI Stealth 16 Studio A13VG | |
| Schenker XMG CORE 16 (L23) | |
| Average AMD Ryzen 7 7840HS, NVIDIA GeForce RTX 4070 Laptop GPU (n=1) | |
| Acer Nitro 16 AN16-41 | |
| CrossMark / Responsiveness | |
| Lenovo Legion Pro 5 16ARX8 | |
| Average of class Gaming (1226 - 2334, n=95, last 2 years) | |
| MSI Stealth 16 Studio A13VG | |
| HP Omen Transcend 16 | |
| Schenker XMG CORE 16 (L23) | |
| Average AMD Ryzen 7 7840HS, NVIDIA GeForce RTX 4070 Laptop GPU (n=1) | |
| Acer Nitro 16 AN16-41 | |
| PCMark 10 Score | 8183 points | |
Help | ||
| AIDA64 / Memory Copy | |
| HP Omen Transcend 16 | |
| Average of class Gaming (21750 - 129946, n=106, last 2 years) | |
| MSI Stealth 16 Studio A13VG | |
| Schenker XMG CORE 16 (L23) | |
| Average AMD Ryzen 7 7840HS (30937 - 72158, n=21) | |
| HP Victus 16-r0077ng | |
| Lenovo Legion Pro 5 16ARX8 | |
| Acer Nitro 16 AN16-41 | |
| AIDA64 / Memory Read | |
| HP Omen Transcend 16 | |
| Average of class Gaming (22956 - 118858, n=106, last 2 years) | |
| MSI Stealth 16 Studio A13VG | |
| HP Victus 16-r0077ng | |
| Schenker XMG CORE 16 (L23) | |
| Average AMD Ryzen 7 7840HS (30497 - 62147, n=21) | |
| Lenovo Legion Pro 5 16ARX8 | |
| Acer Nitro 16 AN16-41 | |
| AIDA64 / Memory Write | |
| Schenker XMG CORE 16 (L23) | |
| Average AMD Ryzen 7 7840HS (34590 - 93323, n=21) | |
| HP Omen Transcend 16 | |
| Average of class Gaming (22297 - 135096, n=106, last 2 years) | |
| MSI Stealth 16 Studio A13VG | |
| HP Victus 16-r0077ng | |
| Acer Nitro 16 AN16-41 | |
| Lenovo Legion Pro 5 16ARX8 | |
| AIDA64 / Memory Latency | |
| Average of class Gaming (75.3 - 259, n=106, last 2 years) | |
| HP Victus 16-r0077ng | |
| Acer Nitro 16 AN16-41 | |
| Average AMD Ryzen 7 7840HS (85.1 - 112, n=21) | |
| Schenker XMG CORE 16 (L23) | |
| HP Omen Transcend 16 | |
| MSI Stealth 16 Studio A13VG | |
| Lenovo Legion Pro 5 16ARX8 | |
* ... smaller is better
DPC 延迟
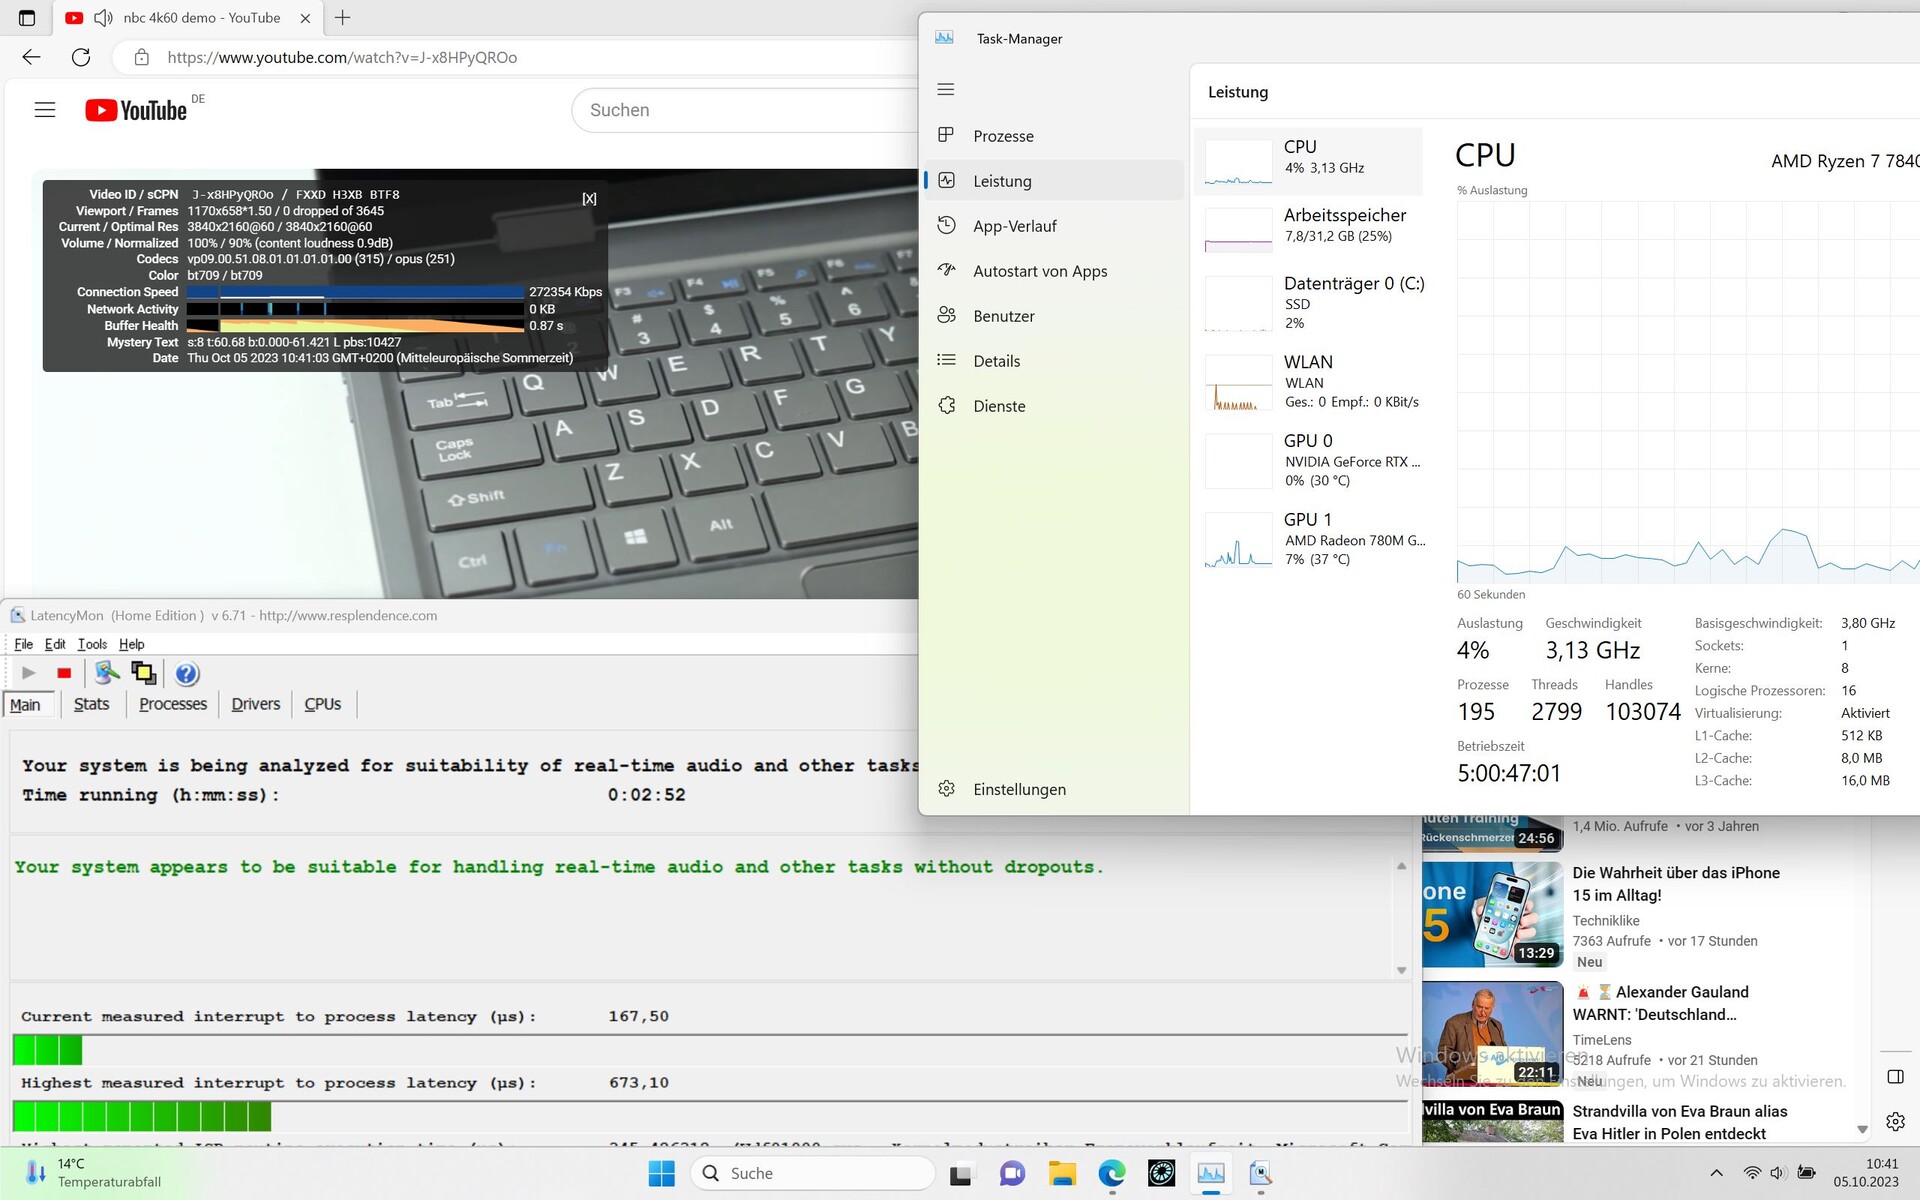
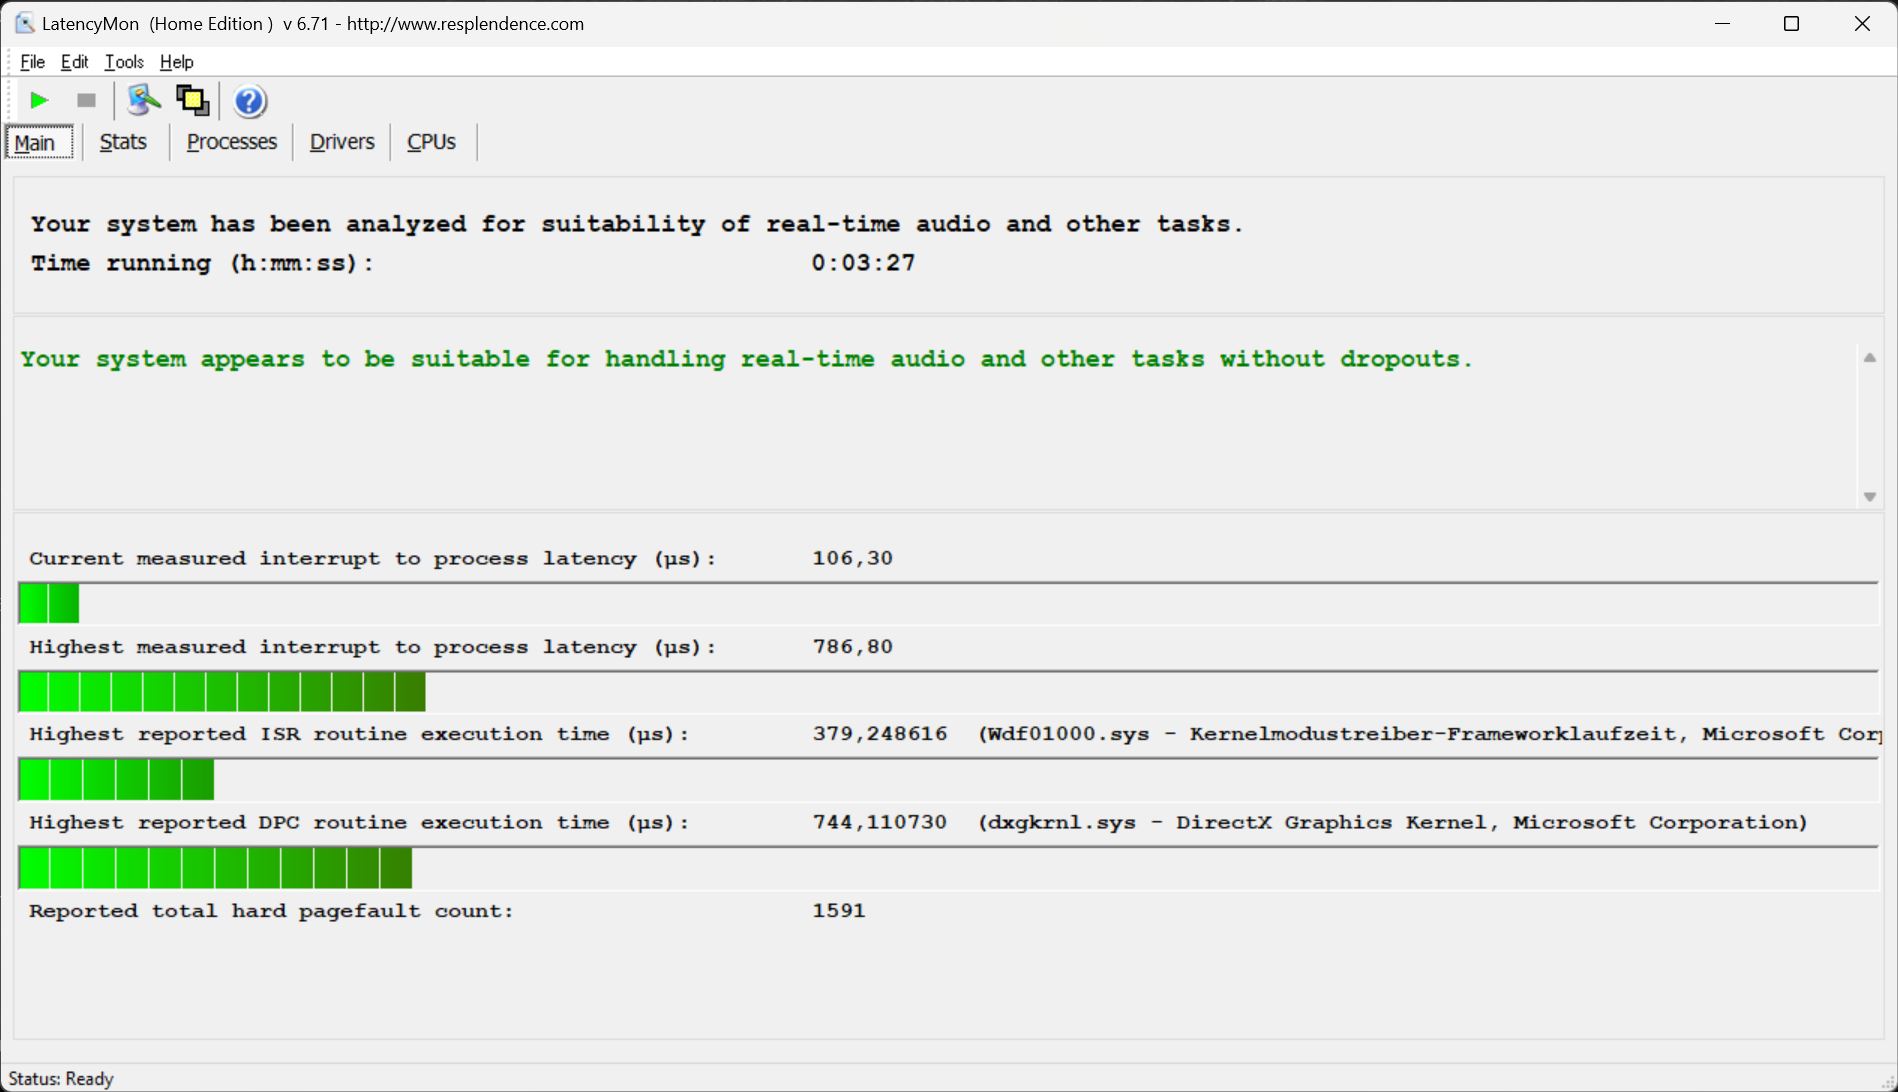
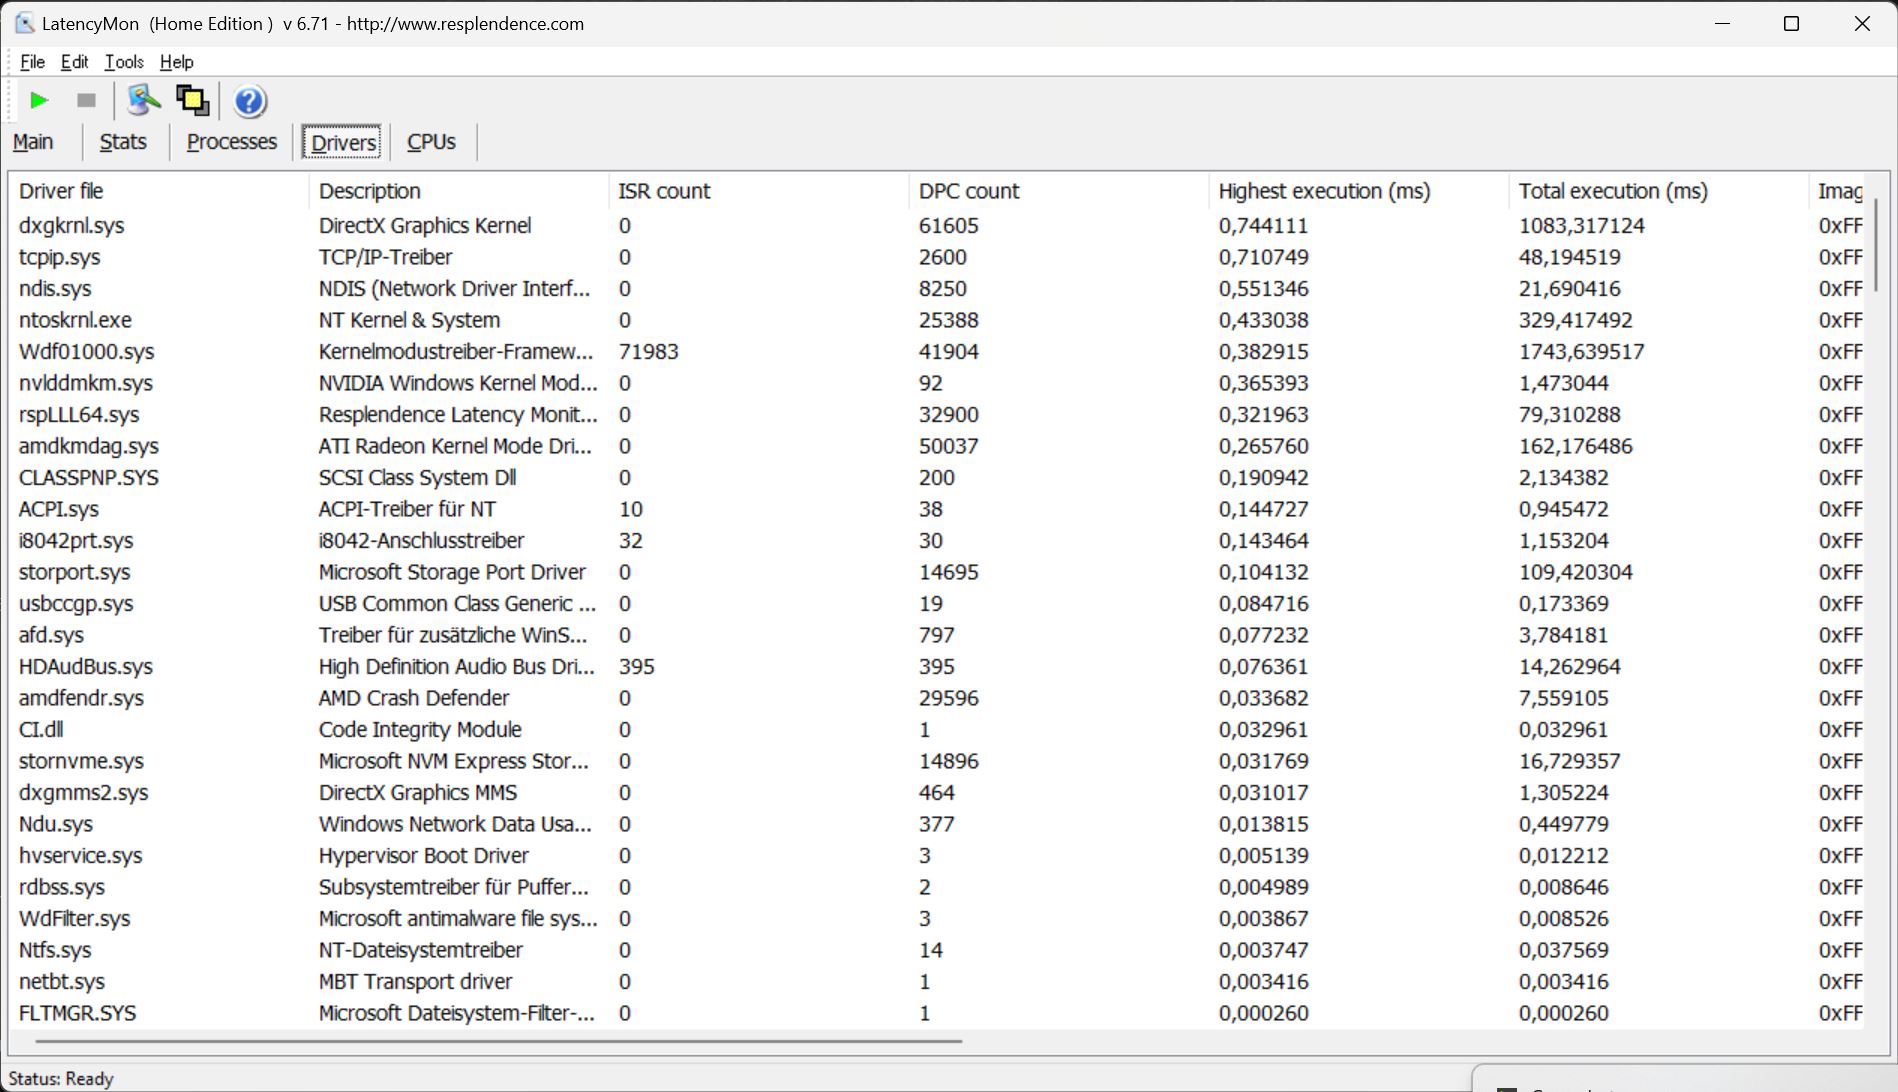
相比之下,根据 LatencyMon 的测试结果,酷睿 16 是为数不多的无需应对任何延迟的游戏笔记本电脑之一。至少,在我们的测试中,该工具没有发现任何异常高的延迟--非常好!我们的 4K/60 fps YouTube 视频播放流畅,没有掉帧。只有 联想Legion Pro 5 16在这一领域表现类似。
| DPC Latencies / LatencyMon - interrupt to process latency (max), Web, Youtube, Prime95 | |
| MSI Stealth 16 Studio A13VG | |
| HP Victus 16-r0077ng | |
| HP Omen Transcend 16 | |
| Acer Nitro 16 AN16-41 | |
| Schenker XMG CORE 16 (L23) | |
| Lenovo Legion Pro 5 16ARX8 | |
* ... smaller is better
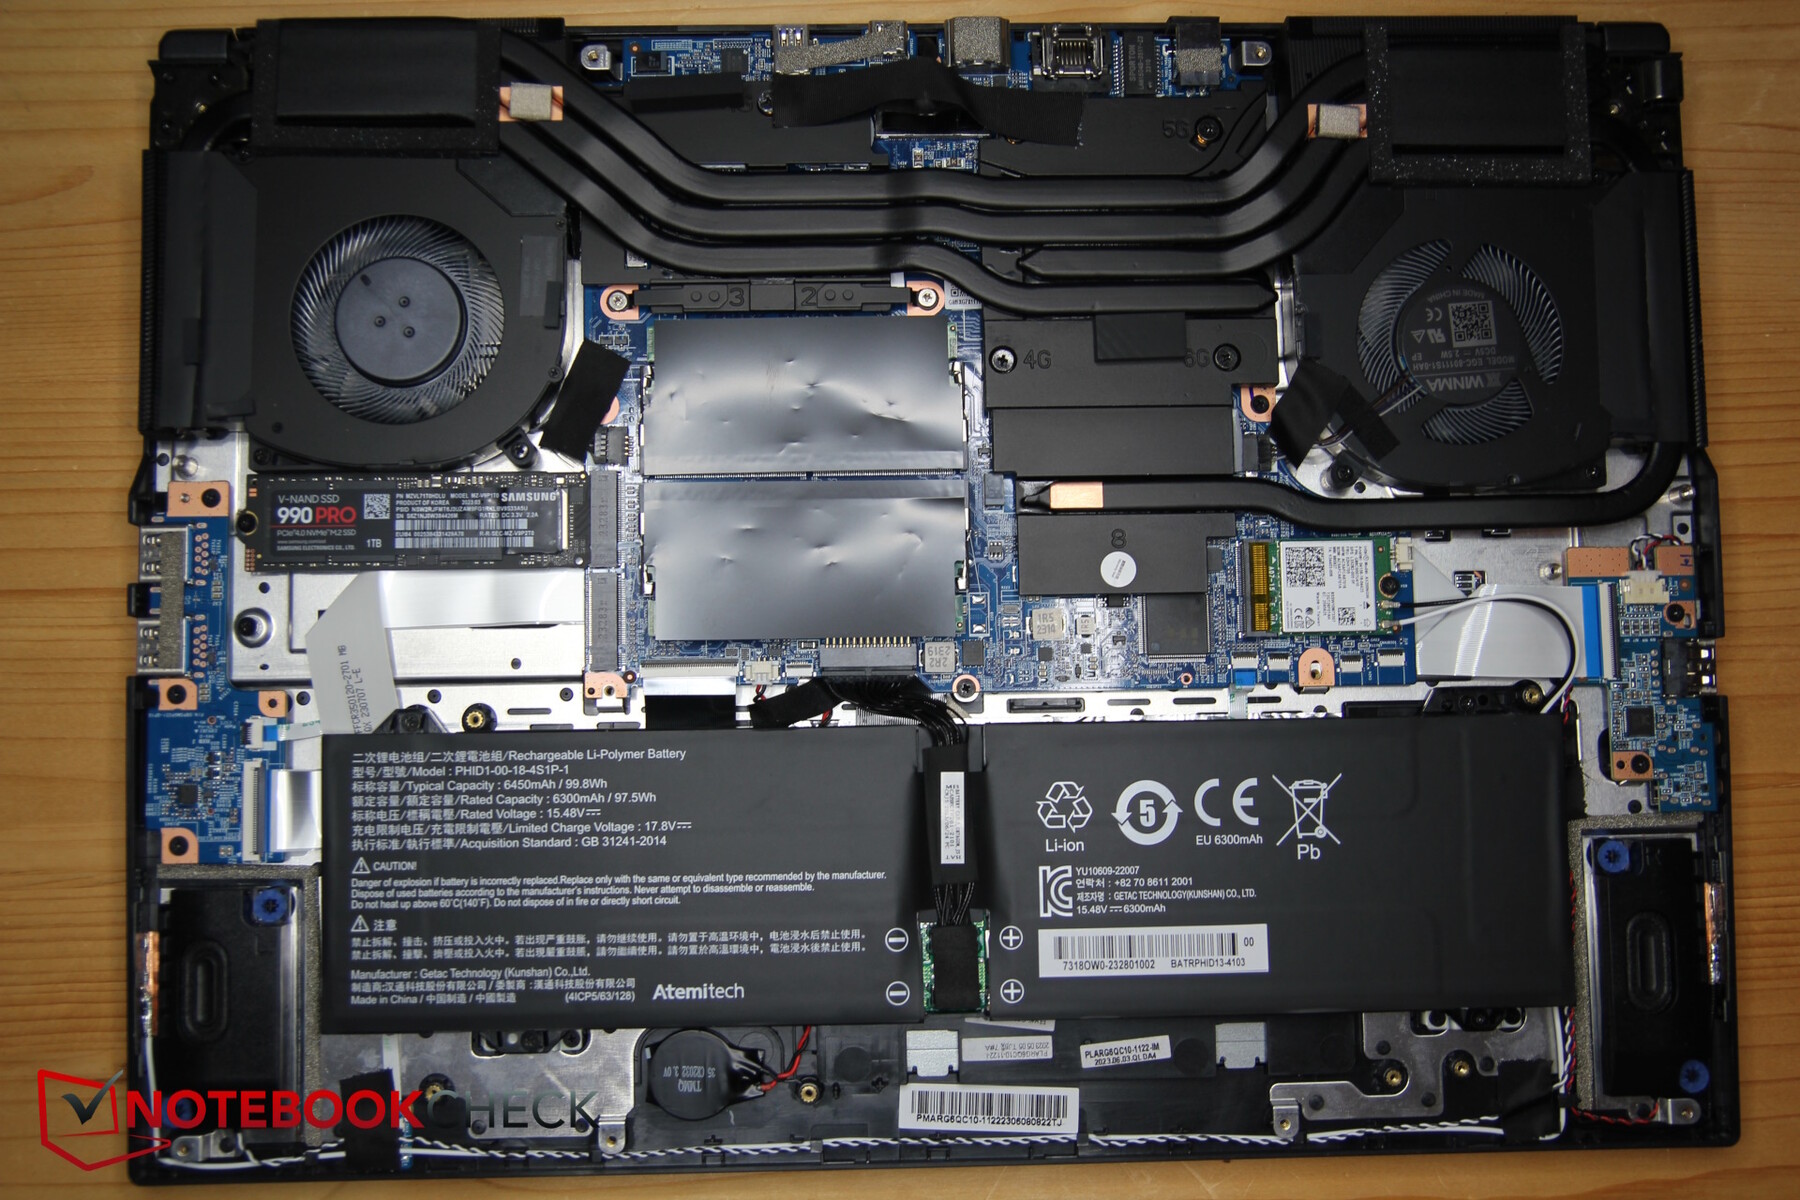
存储设备
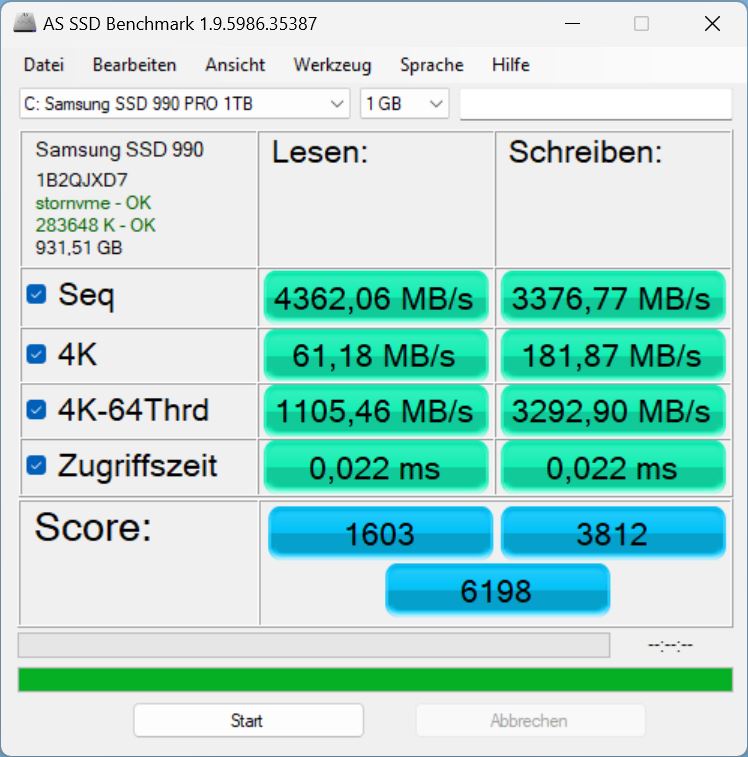
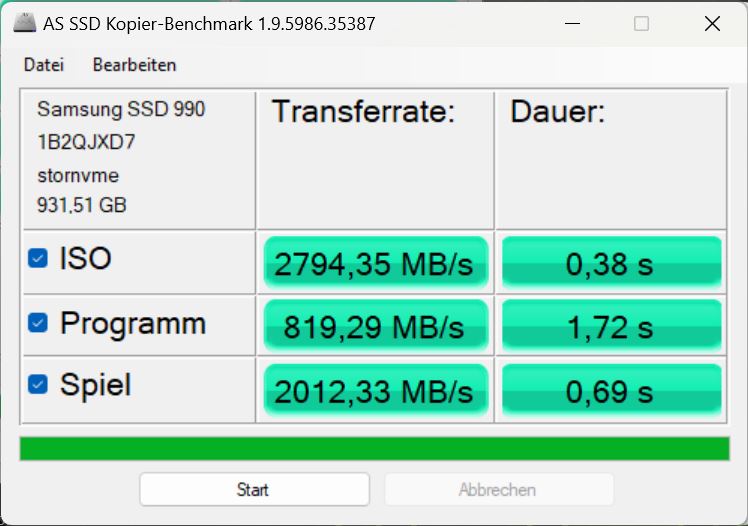
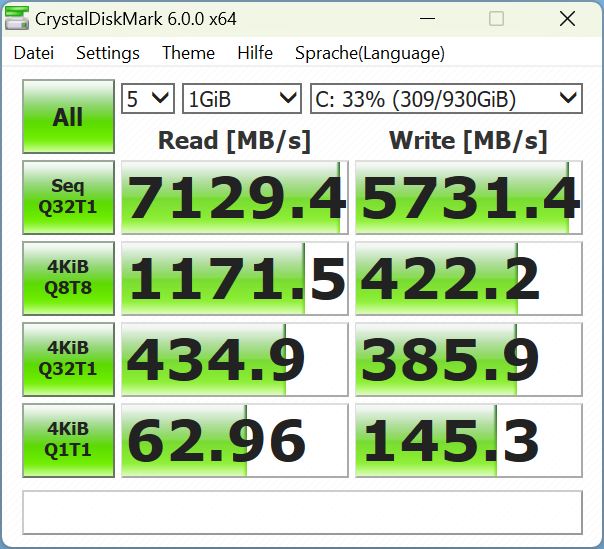
申克在设备中安装了 1 TB 的三星 990 Pro。这款固态硬盘是目前速度最快的型号之一--在我们的固态硬盘最佳列表中排名第四。在酷睿16中,它虽然没有发挥出全部潜能,但速度仍然非常快。此外,它的性能在很长一段时间内都能保持稳定,与同样快速的固态硬盘形成鲜明对比。联想Legion Pro 5 16.

* ... smaller is better
Reading continuous performance: DiskSpd Read Loop, Queue Depth 8
图形卡
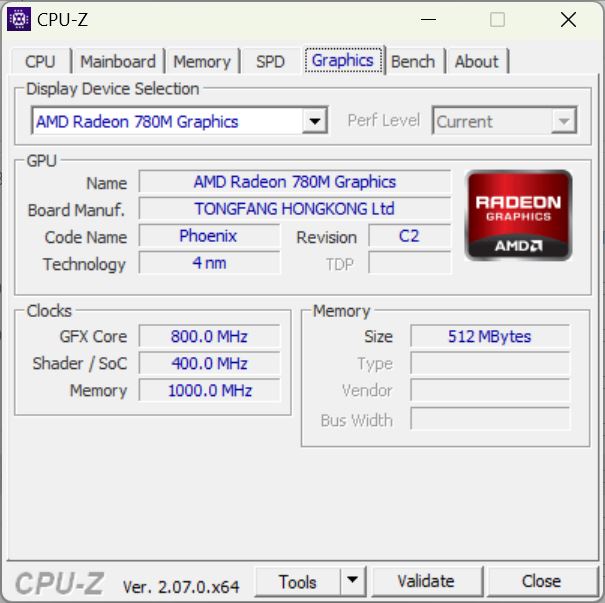
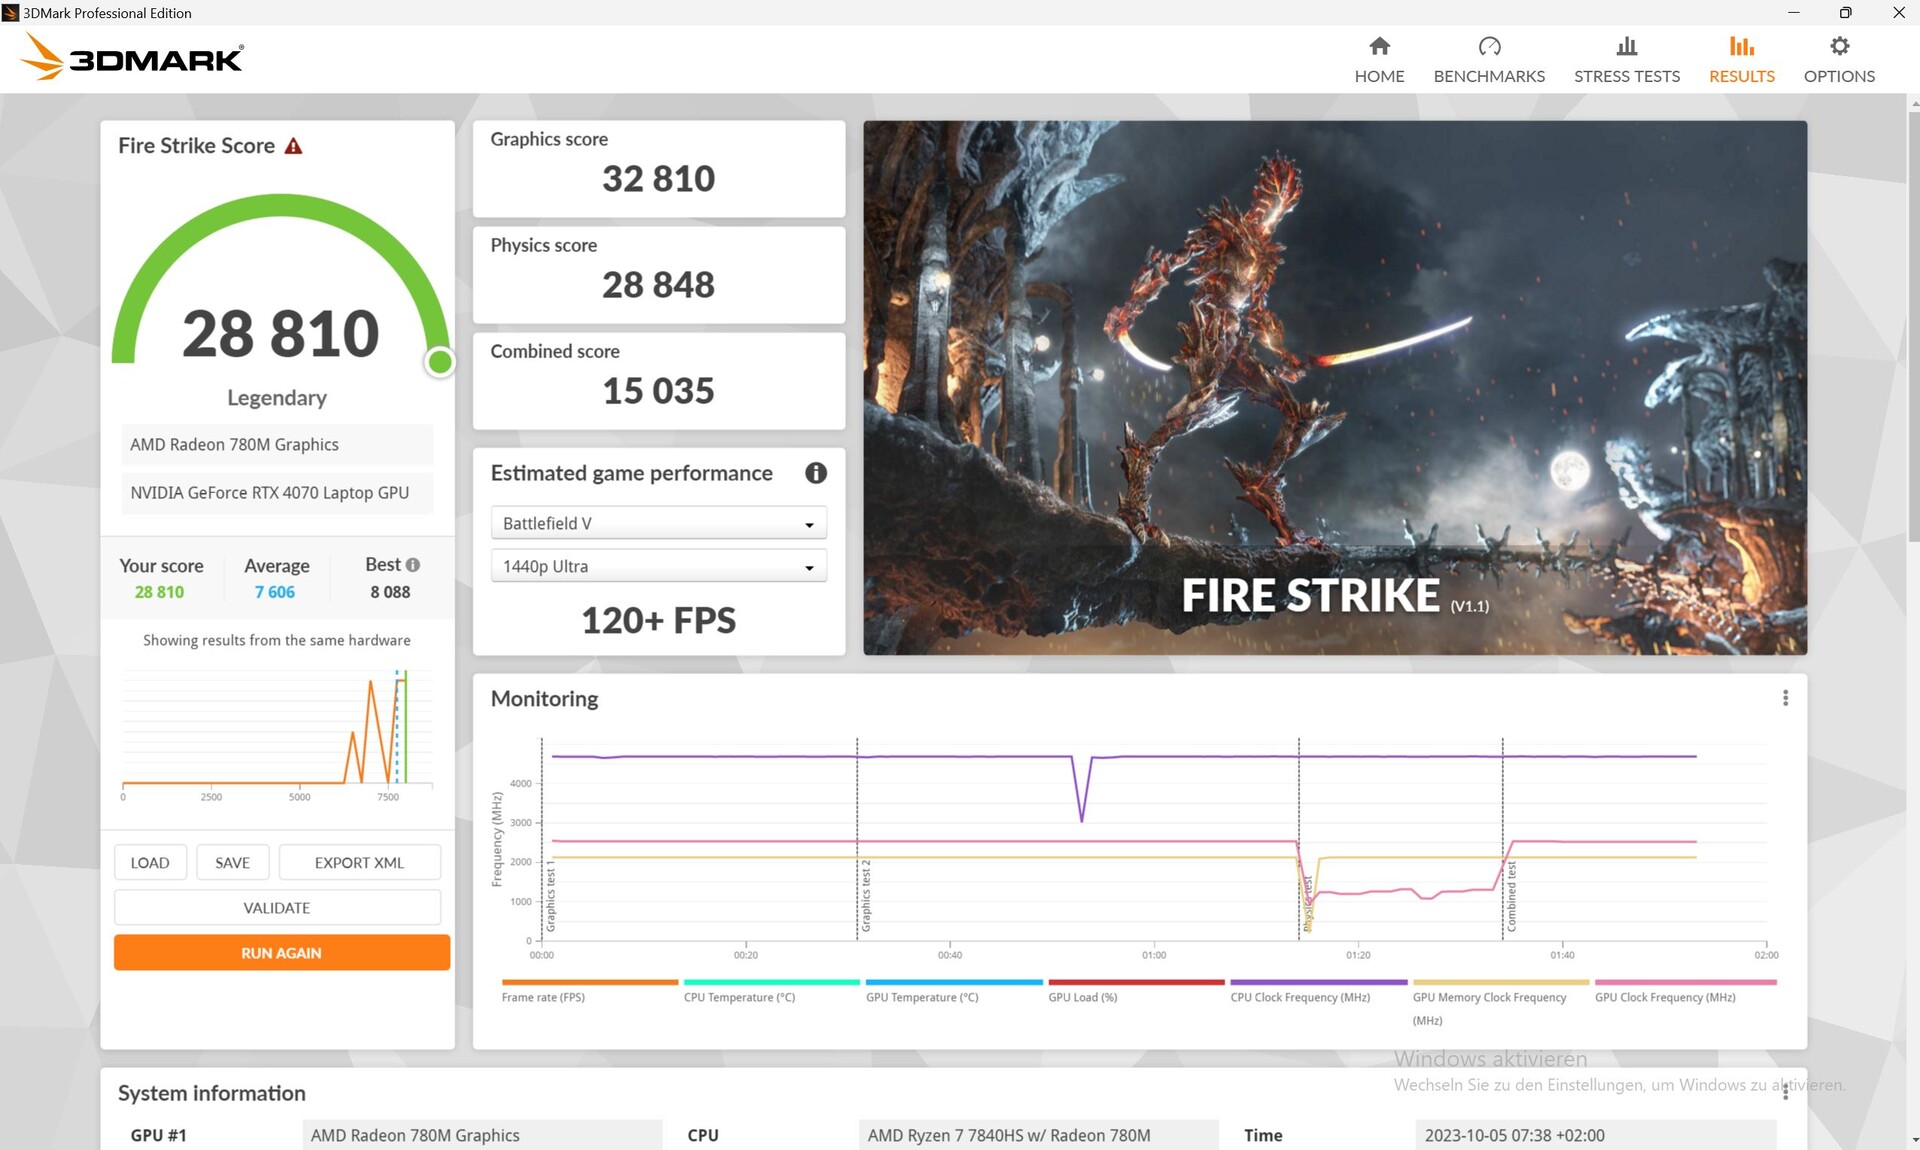
英伟达™ (NVIDIA®)英伟达GeForce RTX 4070 笔记本电脑 GPU可充分利用 140 瓦(115 瓦 + 25 瓦动态提升)的功率。另外,你也可以用更低的价格购买到笔记本电脑的RTX 4060.在 3DMarks 合成测试中,酷睿 16 遥遥领先于其他竞争对手--其性能比我们数据库中典型的 RTX 4070 平均值高出约 13%。
在电池模式下,当我们再次运行时,原来的 32,810 分只剩下 16,407 分。 Fire Strike再次运行时的 32,810 分仅剩下 16,407 分,下降了 50%。
酷睿 16 在游戏中的速度也很快,但这次它并没有拔得头筹。这可能是由于《DOTA 2》等重 CPU 的游戏所致。在这些游戏中,许多竞争对手都取得了更好的 CPU 性能。
在平衡模式下,它在运行《Witcher 3 》时的表现很奇怪:游戏运行速度约为 117 帧/秒,几乎与超速模式下的速度相当。这也意味着风扇运行时的噪音并没有降低。大约一分钟后,帧速率突然降到了 30,而风扇发出的噪音只有 28 分贝。看来这个模式并没有完全优化。
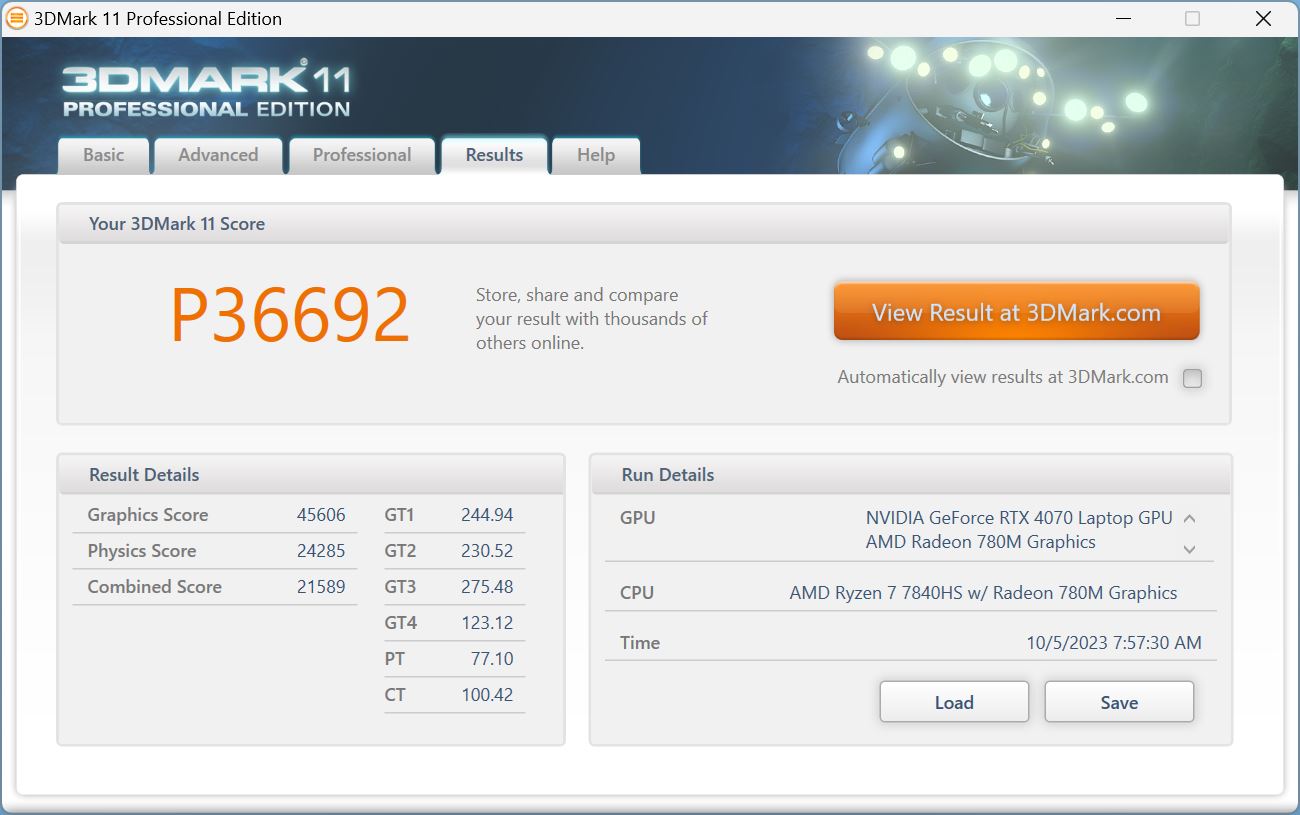
| 3DMark 11 Performance | 36692 points | |
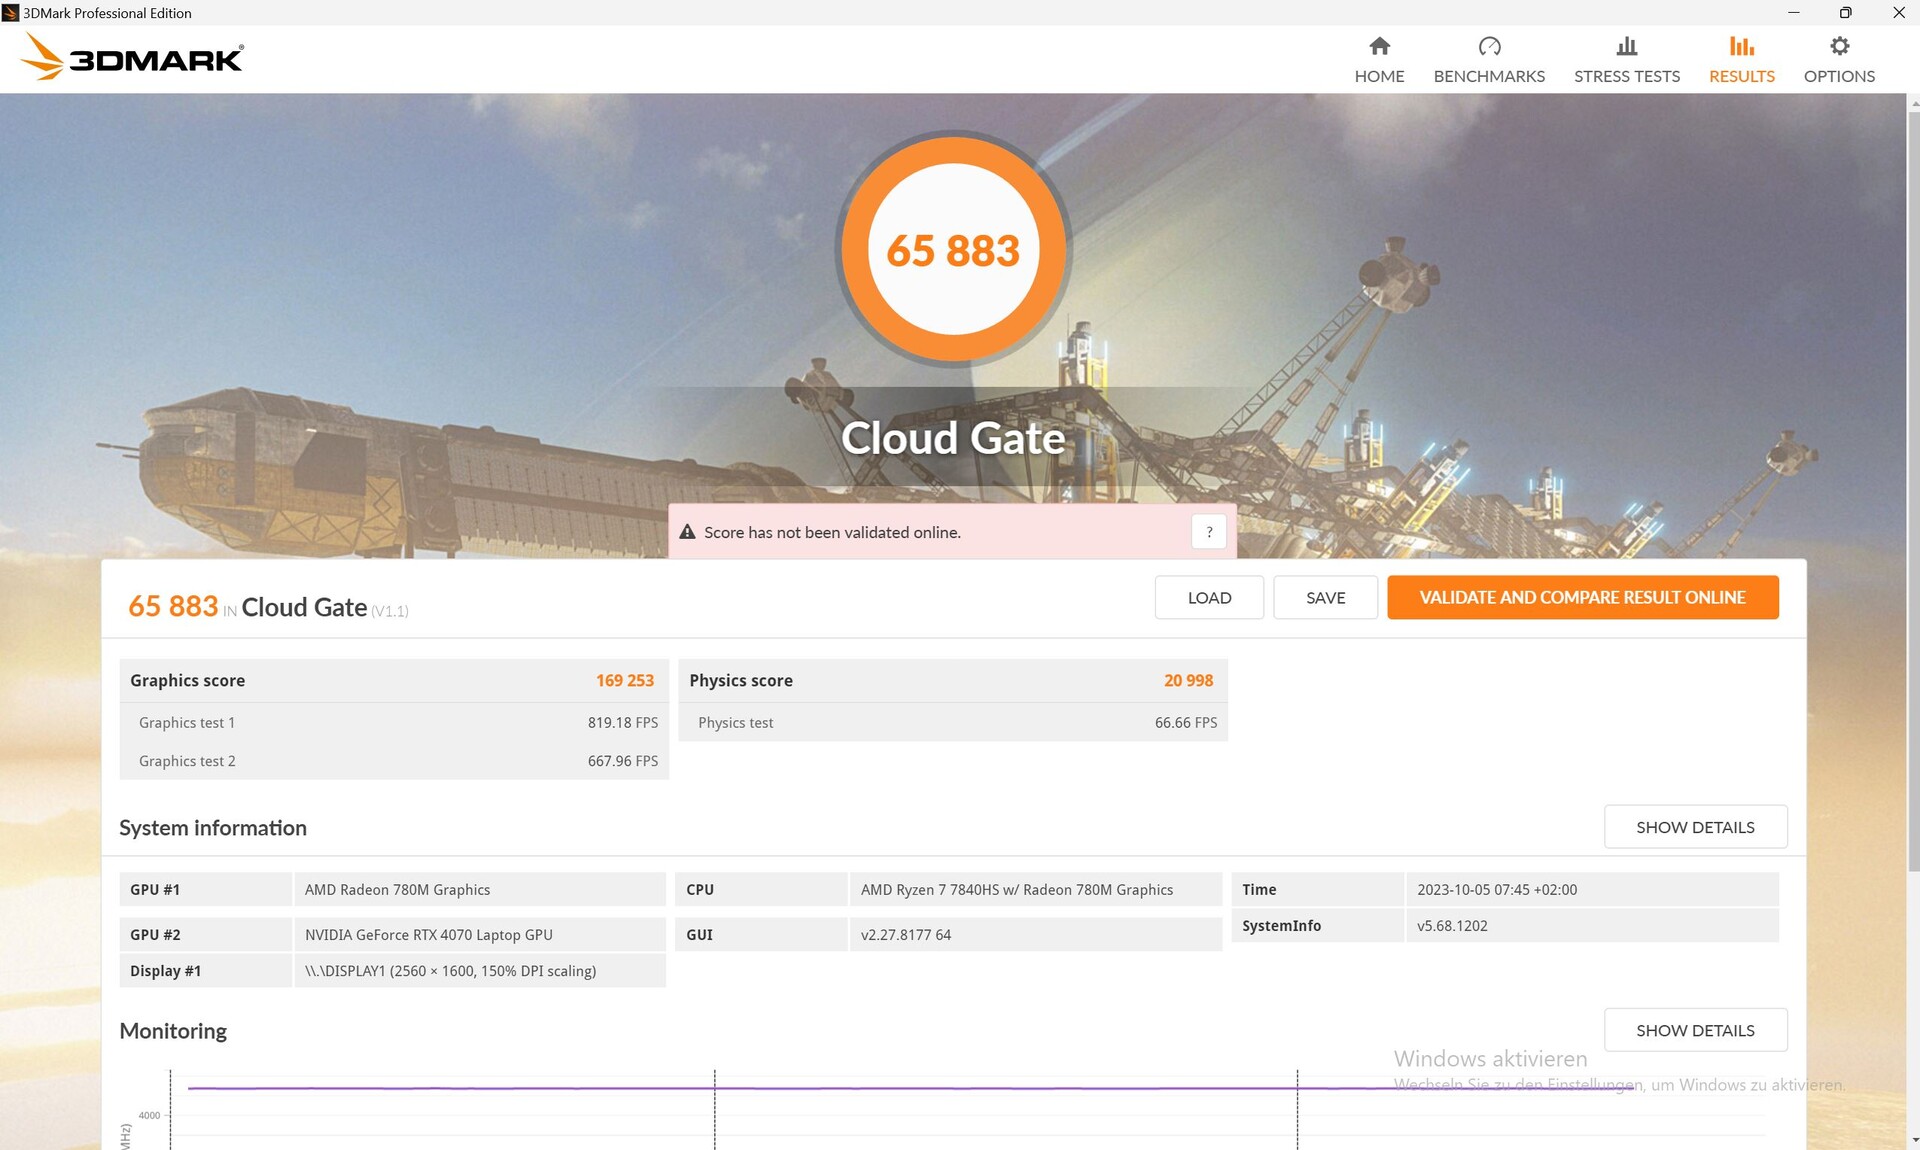
| 3DMark Cloud Gate Standard Score | 65883 points | |
| 3DMark Fire Strike Score | 28810 points | |
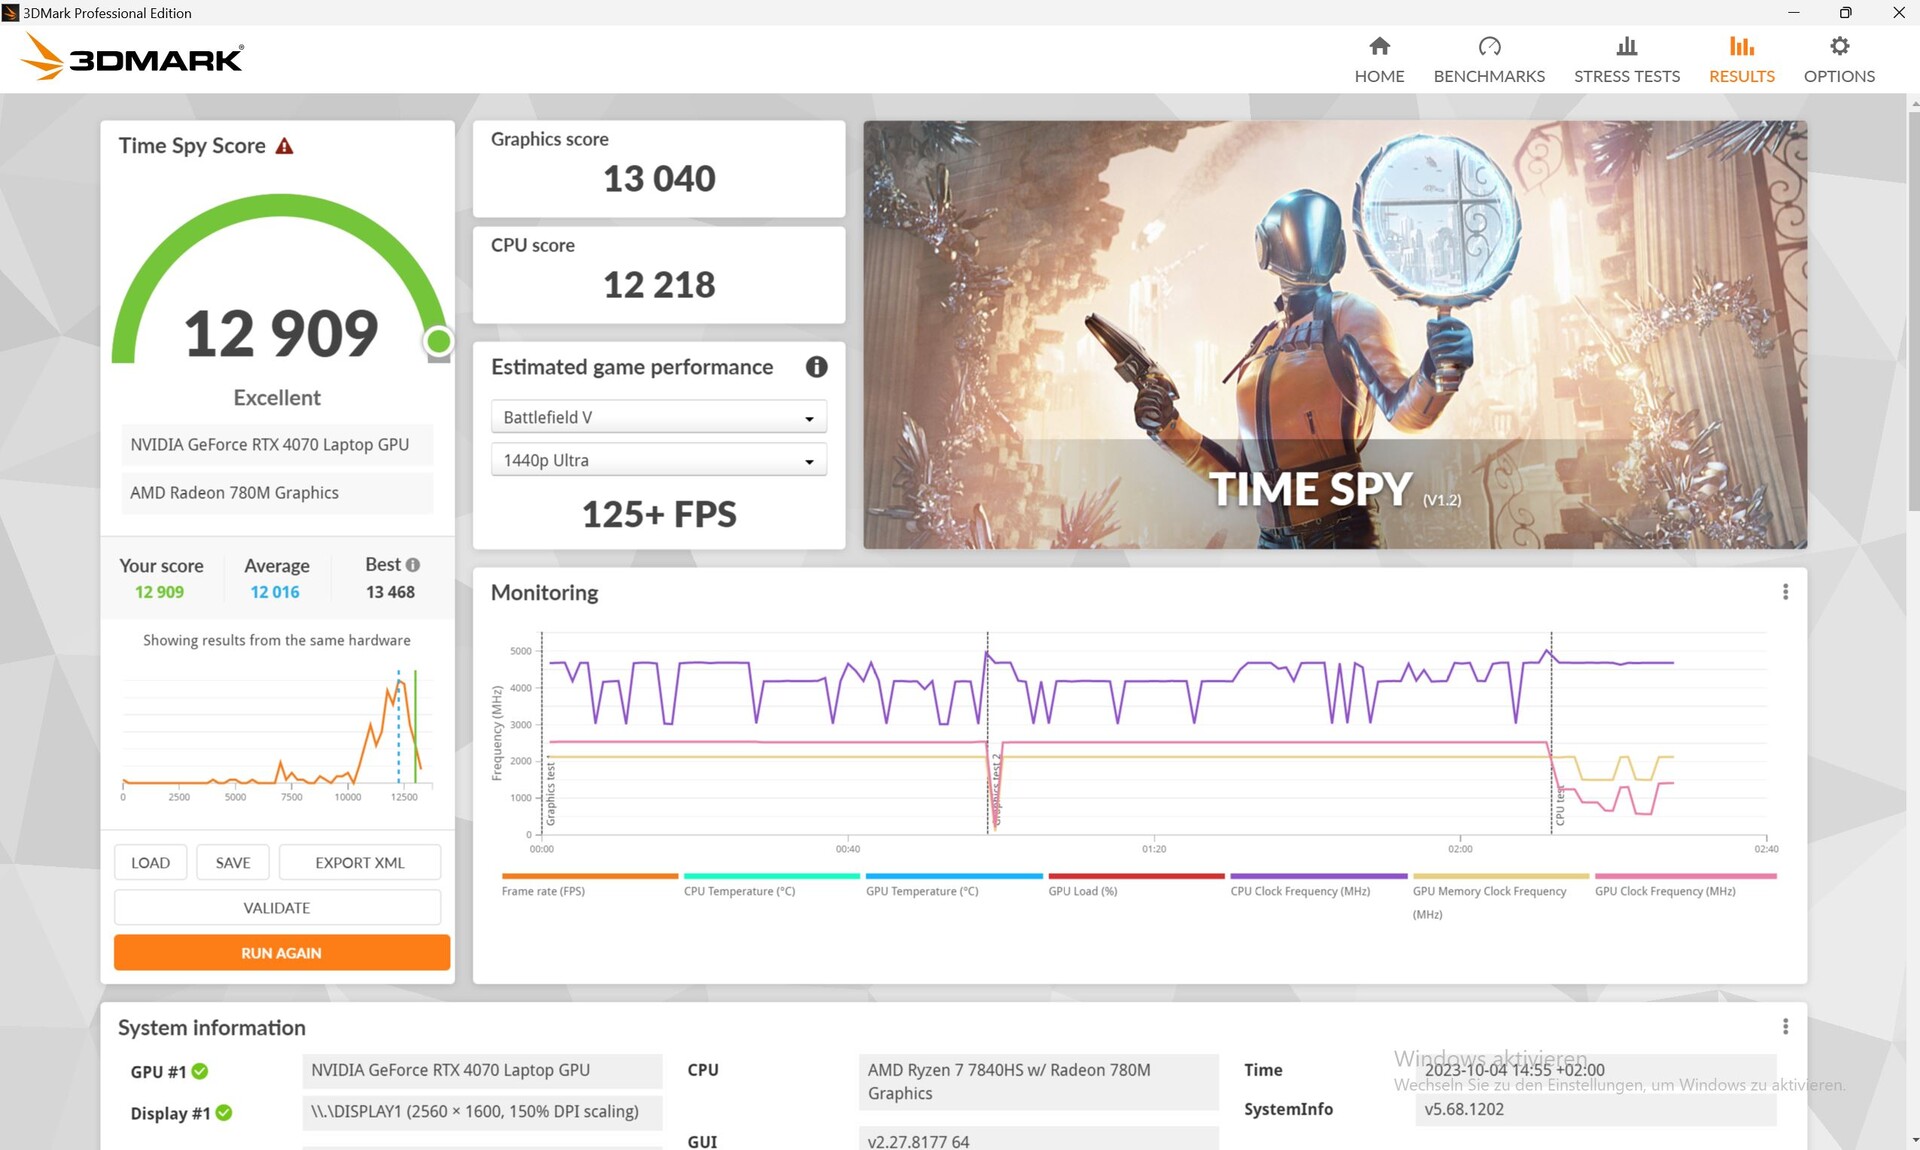
| 3DMark Time Spy Score | 12909 points | |
Help | ||
* ... smaller is better
| Performance rating - Percent | |
| Average of class Gaming | |
| Lenovo Legion Pro 5 16ARX8 | |
| HP Omen Transcend 16 -2! | |
| MSI Stealth 16 Studio A13VG | |
| Schenker XMG CORE 16 (L23) | |
| HP Victus 16-r0077ng | |
| Acer Nitro 16 AN16-41 | |
| The Witcher 3 - 1920x1080 Ultra Graphics & Postprocessing (HBAO+) | |
| Average of class Gaming (104.7 - 240, n=7, last 2 years) | |
| Schenker XMG CORE 16 (L23) | |
| Lenovo Legion Pro 5 16ARX8 | |
| MSI Stealth 16 Studio A13VG | |
| HP Victus 16-r0077ng | |
| Acer Nitro 16 AN16-41 | |
| HP Omen Transcend 16 | |
| GTA V - 1920x1080 Highest AA:4xMSAA + FX AF:16x | |
| Average of class Gaming (48.3 - 186.9, n=94, last 2 years) | |
| Lenovo Legion Pro 5 16ARX8 | |
| MSI Stealth 16 Studio A13VG | |
| Schenker XMG CORE 16 (L23) | |
| HP Victus 16-r0077ng | |
| Acer Nitro 16 AN16-41 | |
| Final Fantasy XV Benchmark - 1920x1080 High Quality | |
| Average of class Gaming (41 - 215, n=95, last 2 years) | |
| Schenker XMG CORE 16 (L23) | |
| Lenovo Legion Pro 5 16ARX8 | |
| MSI Stealth 16 Studio A13VG | |
| HP Victus 16-r0077ng | |
| Acer Nitro 16 AN16-41 | |
| Strange Brigade - 1920x1080 ultra AA:ultra AF:16 | |
| Average of class Gaming (76.3 - 458, n=87, last 2 years) | |
| Lenovo Legion Pro 5 16ARX8 | |
| Schenker XMG CORE 16 (L23) | |
| HP Omen Transcend 16 | |
| MSI Stealth 16 Studio A13VG | |
| Acer Nitro 16 AN16-41 | |
| HP Victus 16-r0077ng | |
| Dota 2 Reborn - 1920x1080 ultra (3/3) best looking | |
| Lenovo Legion Pro 5 16ARX8 | |
| HP Omen Transcend 16 | |
| MSI Stealth 16 Studio A13VG | |
| Average of class Gaming (84.8 - 252, n=108, last 2 years) | |
| Schenker XMG CORE 16 (L23) | |
| HP Victus 16-r0077ng | |
| Acer Nitro 16 AN16-41 | |
Witcher 3 FPS diagram
| low | med. | high | ultra | QHD | 4K | |
|---|---|---|---|---|---|---|
| GTA V (2015) | 185.4 | 174.1 | 116.1 | |||
| The Witcher 3 (2015) | 364.2 | 291.5 | 245.2 | 120 | 92 | |
| Dota 2 Reborn (2015) | 161.2 | 153.5 | 142.2 | 134.8 | 136.9 | |
| Final Fantasy XV Benchmark (2018) | 215 | 171.4 | 124.8 | 91 | ||
| X-Plane 11.11 (2018) | 123.7 | 108.3 | 85.5 | 85.7 | ||
| Strange Brigade (2018) | 367 | 302 | 249 | 218 | ||
| Hogwarts Legacy (2023) | 77.2 | 55.3 |
排放与动力 - 酷睿 16 动力强劲
噪音排放
在空闲模式下,风扇通常根本不转,尤其是在平衡模式下。即使在超频模式下,情况也是如此,但风扇有时也会快速转动。
在负载情况下,酷睿 16 的噪音水平会稳步上升,而不是大幅跃升。这意味着在平均负载下,例如在第一个 3DMark06 基准测试场景中,其噪音水平仍然相对较低。
在连续的游戏过程中,它的噪音会变大一些,但竞争对手的噪音水平也差不多--Acer Nitro 16 的噪音实际上大得让人难以忍受。微星 Stealth 16 Studio,尤其是性能较弱的HP Victus 16 仍然比较安静。
Noise level
| Idle |
| 23 / 28.48 / 28.48 dB(A) |
| Load |
| 30 / 54.12 dB(A) |
 | ||
30 dB silent 40 dB(A) audible 50 dB(A) loud |
||
min: | ||
| Schenker XMG CORE 16 (L23) GeForce RTX 4070 Laptop GPU, R7 7840HS, Samsung 990 Pro 1 TB | Lenovo Legion Pro 5 16ARX8 GeForce RTX 4070 Laptop GPU, R7 7745HX, Samsung PM9A1 MZVL21T0HCLR | Acer Nitro 16 AN16-41 GeForce RTX 4070 Laptop GPU, R7 7735HS, Samsung PM9A1 MZVL21T0HCLR | HP Omen Transcend 16 GeForce RTX 4070 Laptop GPU, i9-13900HX, SK hynix PC801 HFS002TEJ9X101N | MSI Stealth 16 Studio A13VG GeForce RTX 4070 Laptop GPU, i7-13700H, Micron 3400 2TB MTFDKBA2T0TFH | HP Victus 16-r0077ng GeForce RTX 4070 Laptop GPU, i7-13700H, Kioxia XG8 KXG80ZNV1T02 | |
|---|---|---|---|---|---|---|
| Noise | 5% | -6% | -12% | 5% | -8% | |
| off / environment * (dB) | 23 | 23.2 -1% | 25.7 -12% | 22.9 -0% | 24 -4% | 25 -9% |
| Idle Minimum * (dB) | 23 | 23.2 -1% | 25.7 -12% | 29.1 -27% | 24 -4% | 28 -22% |
| Idle Average * (dB) | 28.48 | 23.2 19% | 25.7 10% | 29.1 -2% | 24 16% | 29 -2% |
| Idle Maximum * (dB) | 28.48 | 26.2 8% | 26.3 8% | 29.1 -2% | 24 16% | 30 -5% |
| Load Average * (dB) | 30 | 31.4 -5% | 33.9 -13% | 45.7 -52% | 34.81 -16% | 43 -43% |
| Witcher 3 ultra * (dB) | 54.12 | 48.4 11% | 54.3 -0% | 44.05 19% | 46 15% | |
| Load Maximum * (dB) | 54.12 | 53.8 1% | 62 -15% | 54.3 -0% | 51.57 5% | 48 11% |
* ... smaller is better
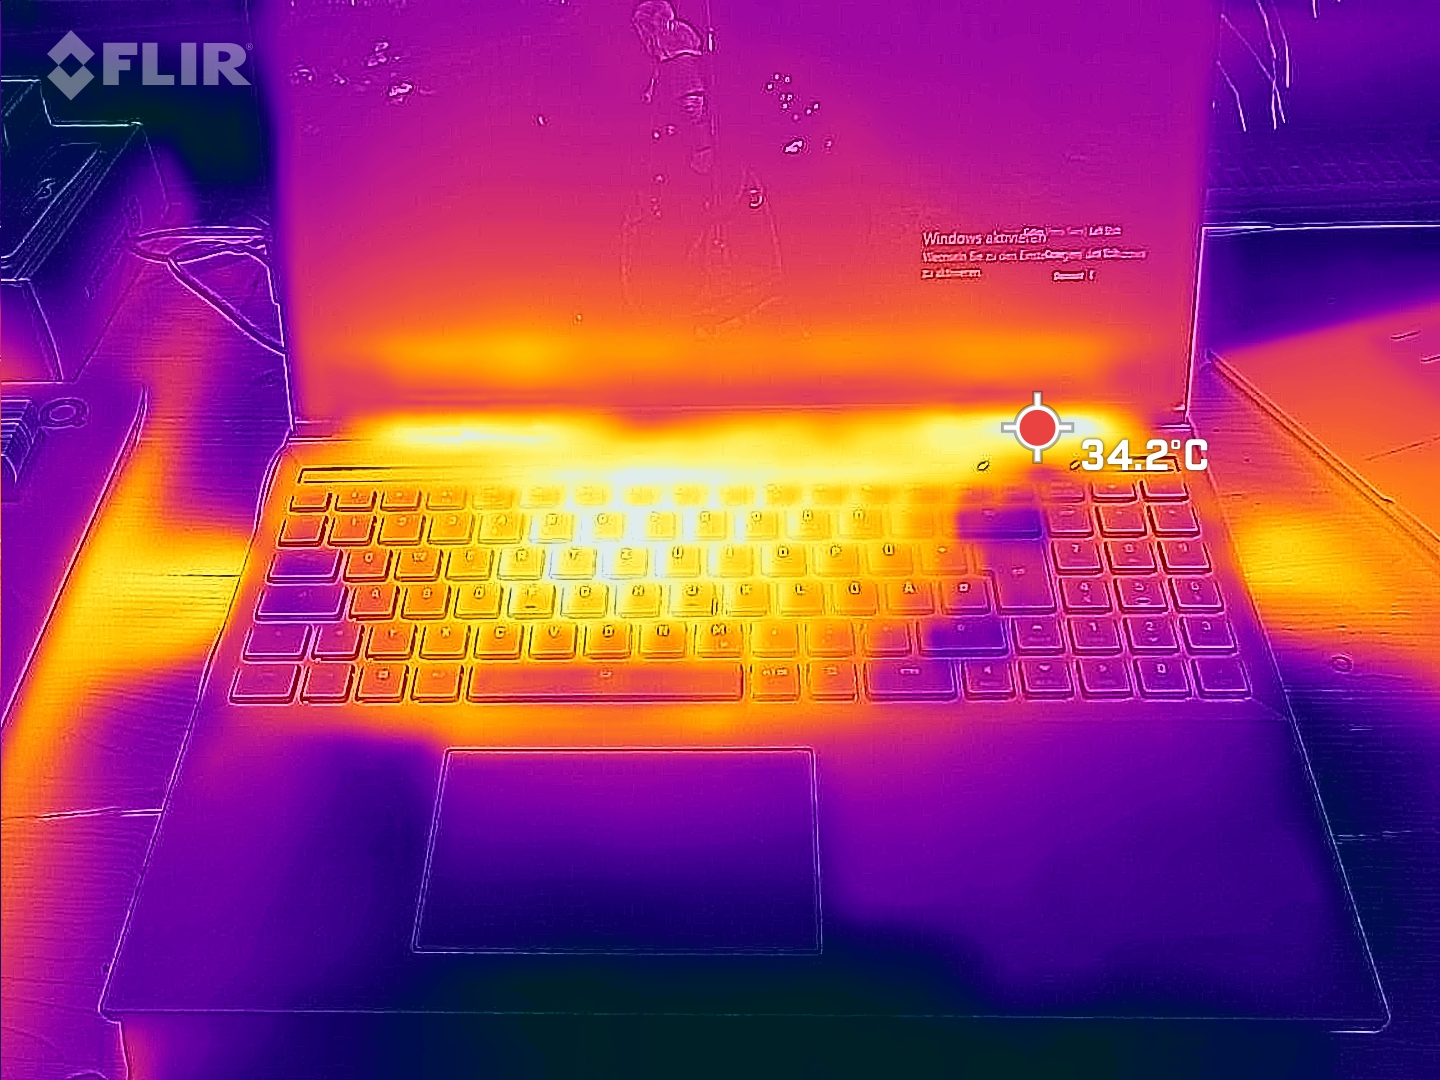
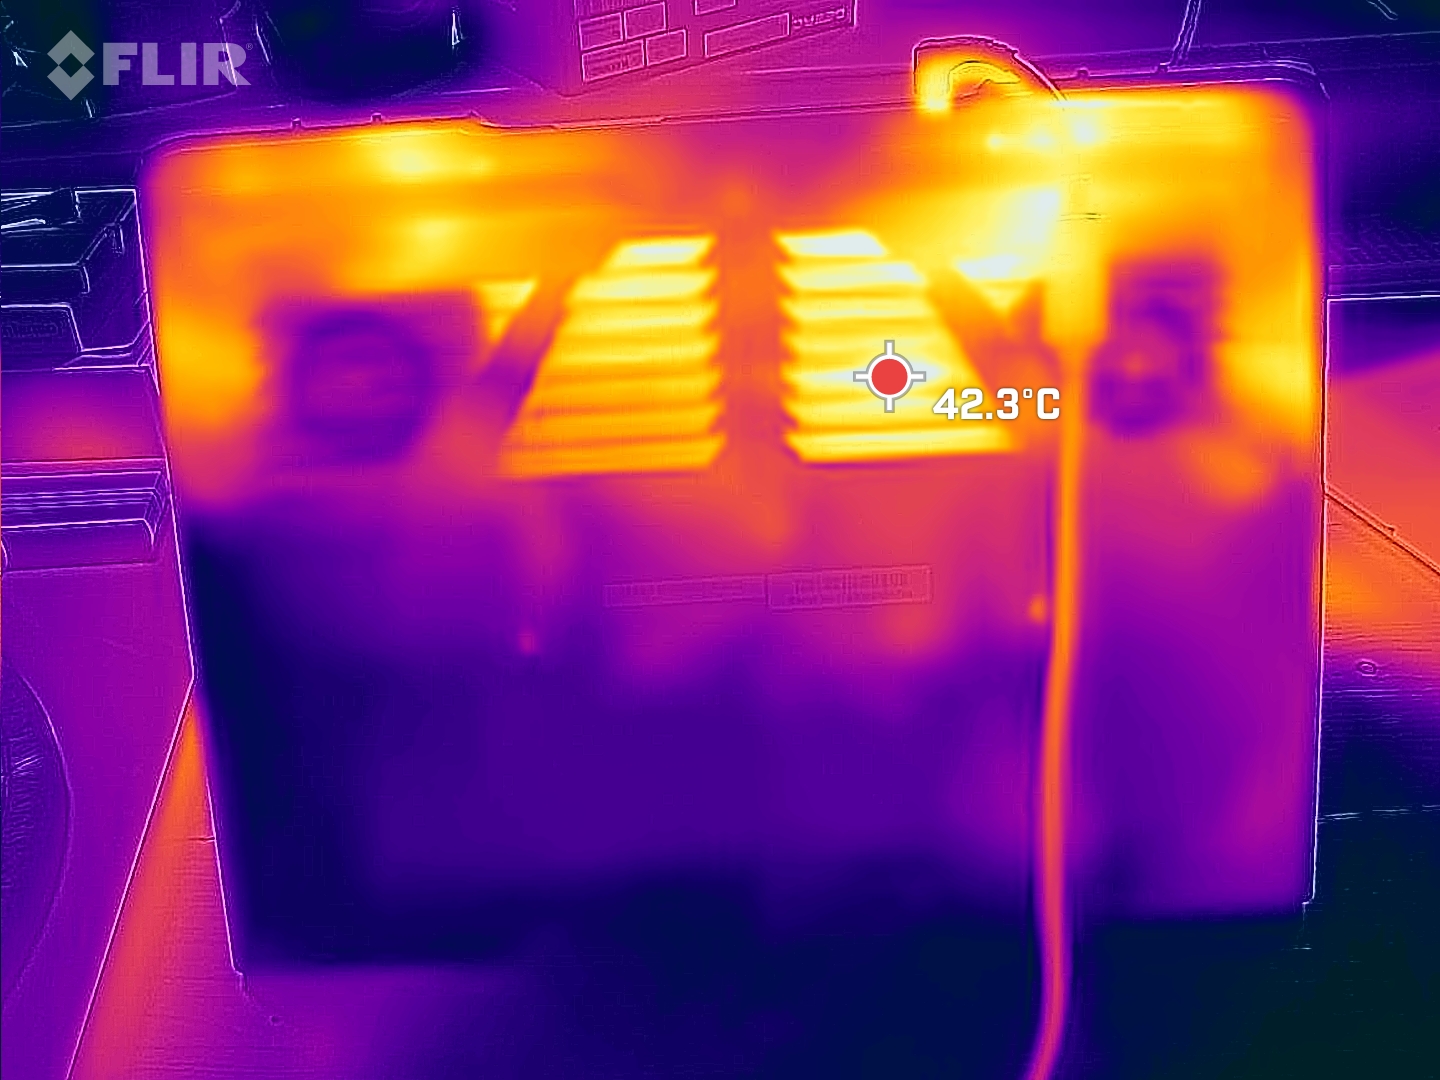
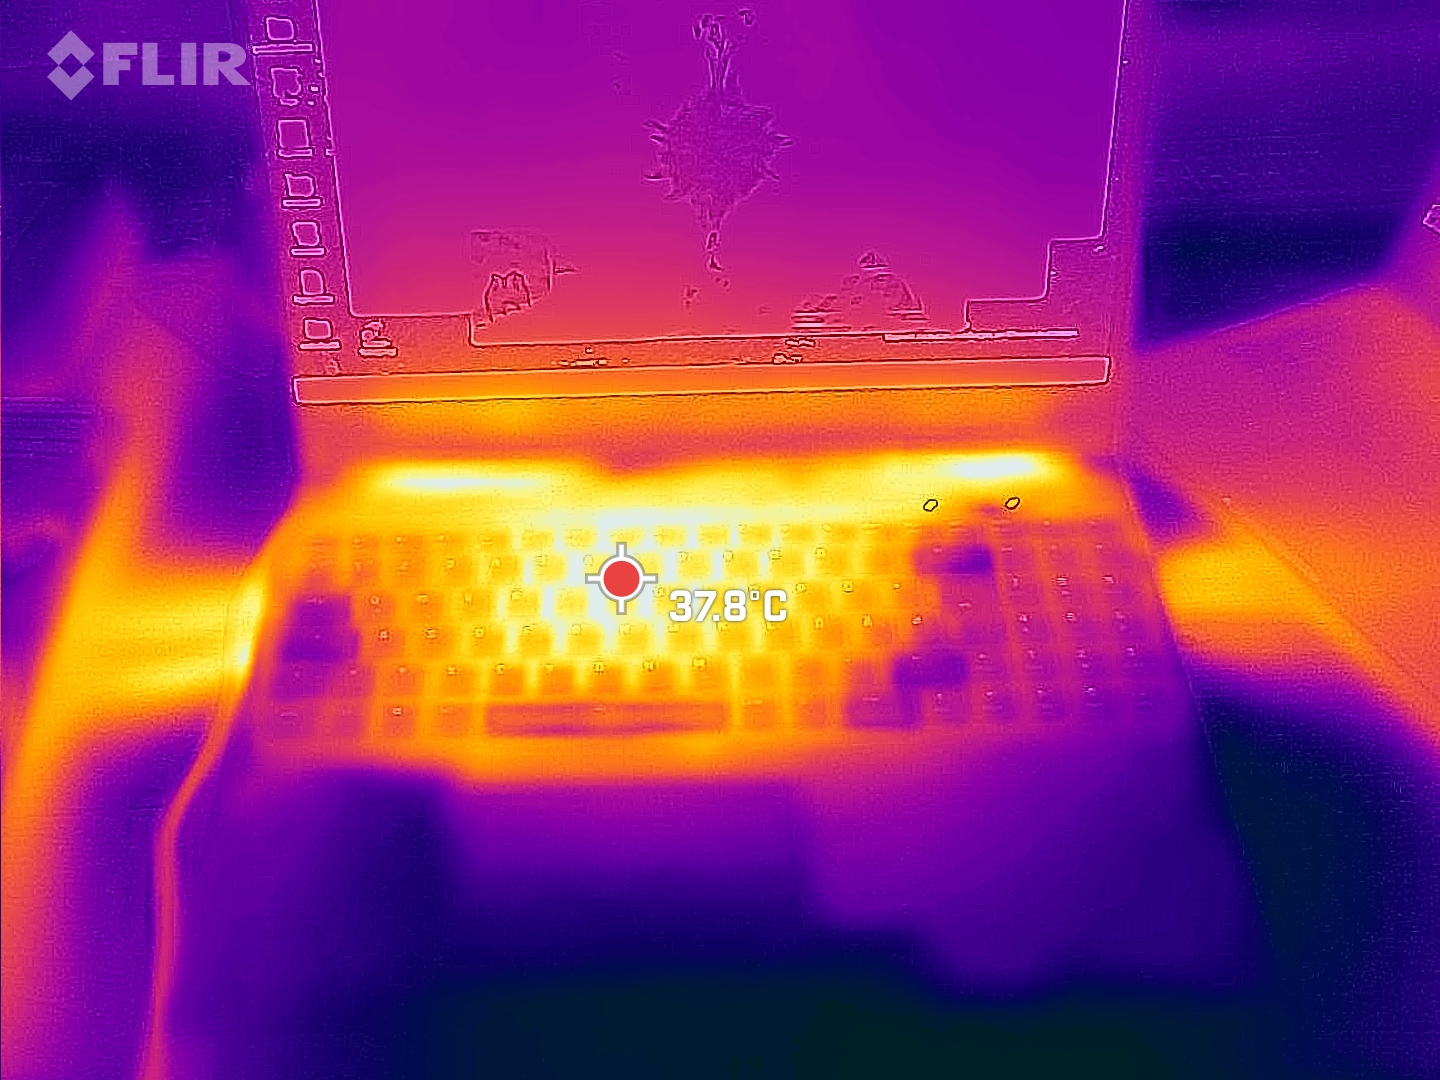
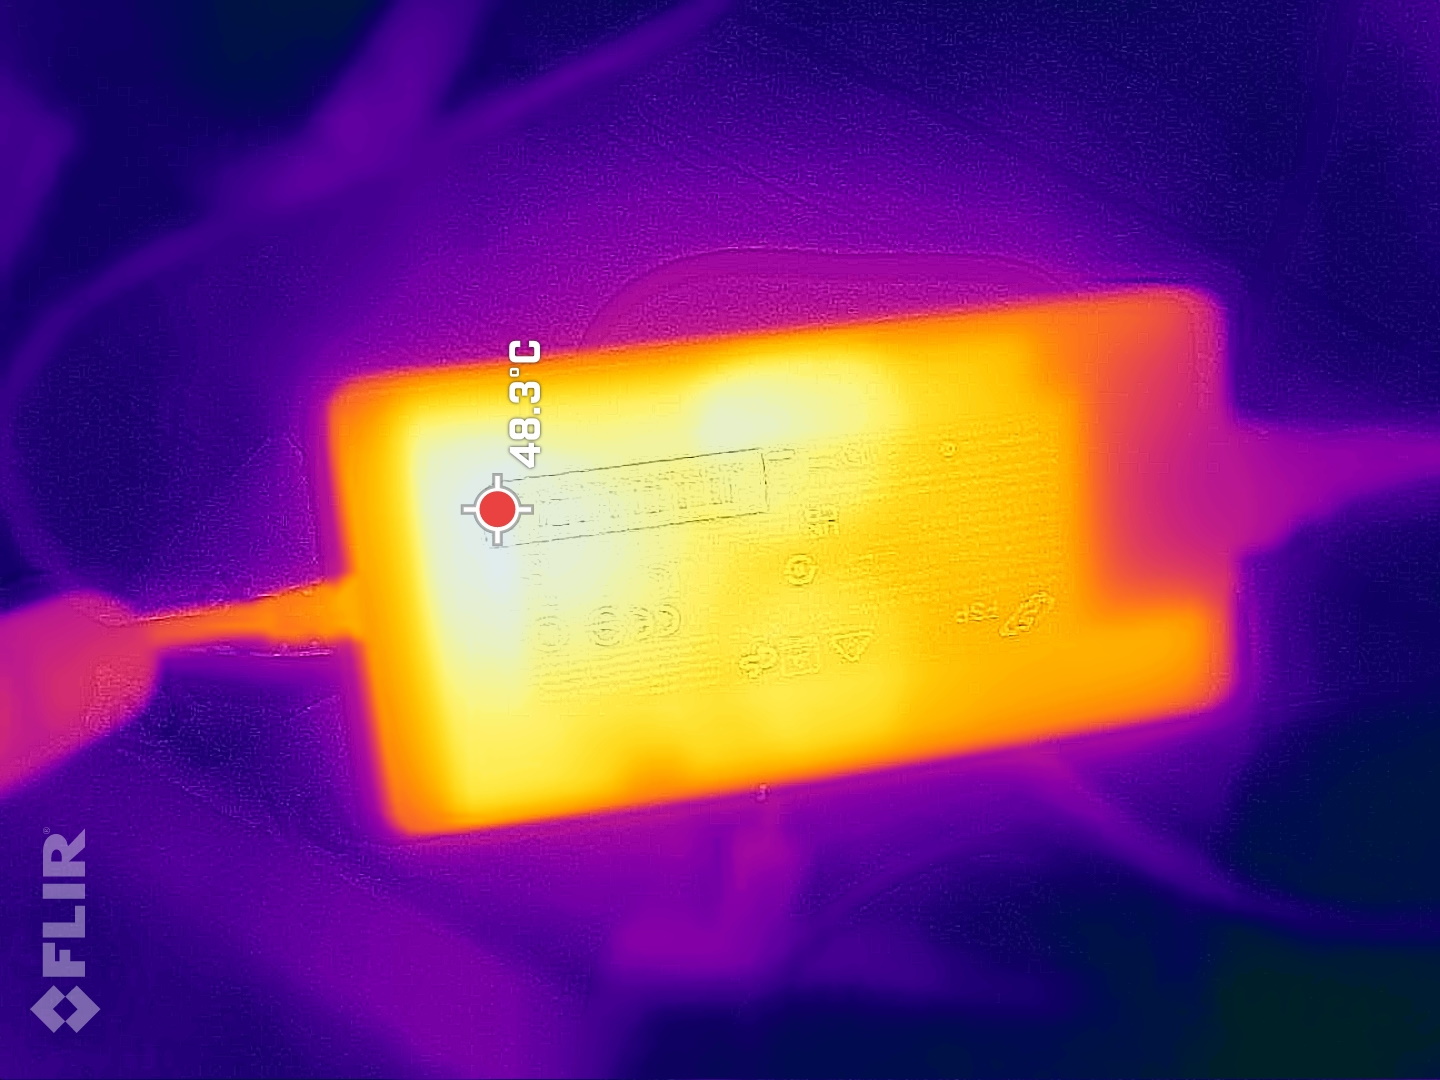
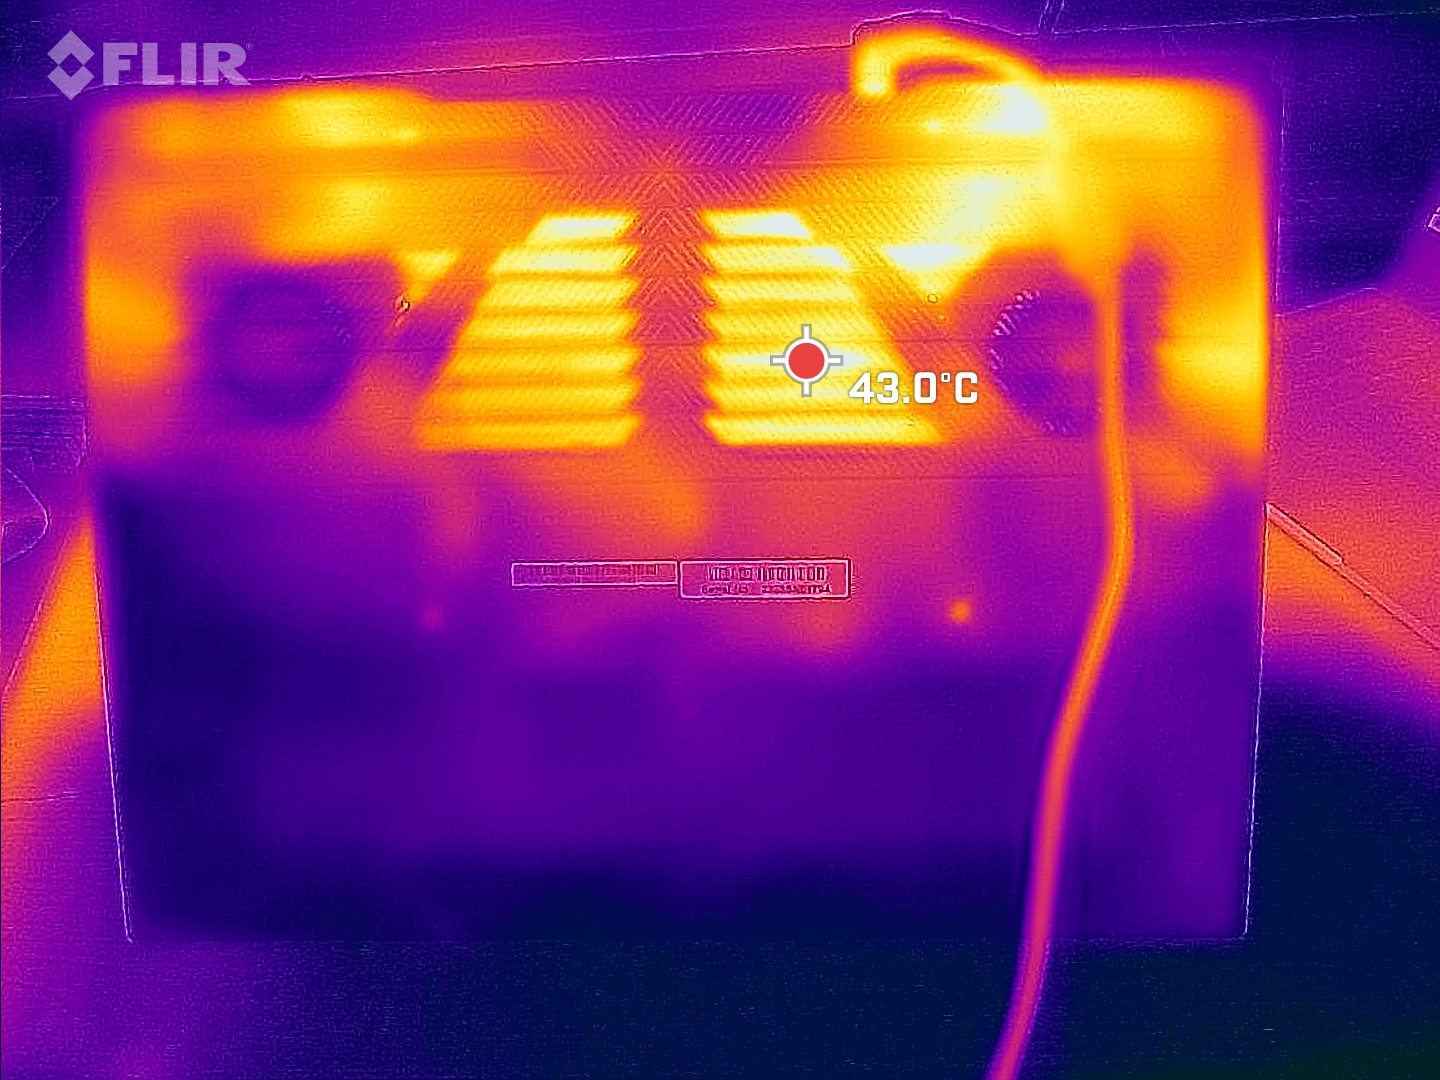
温度
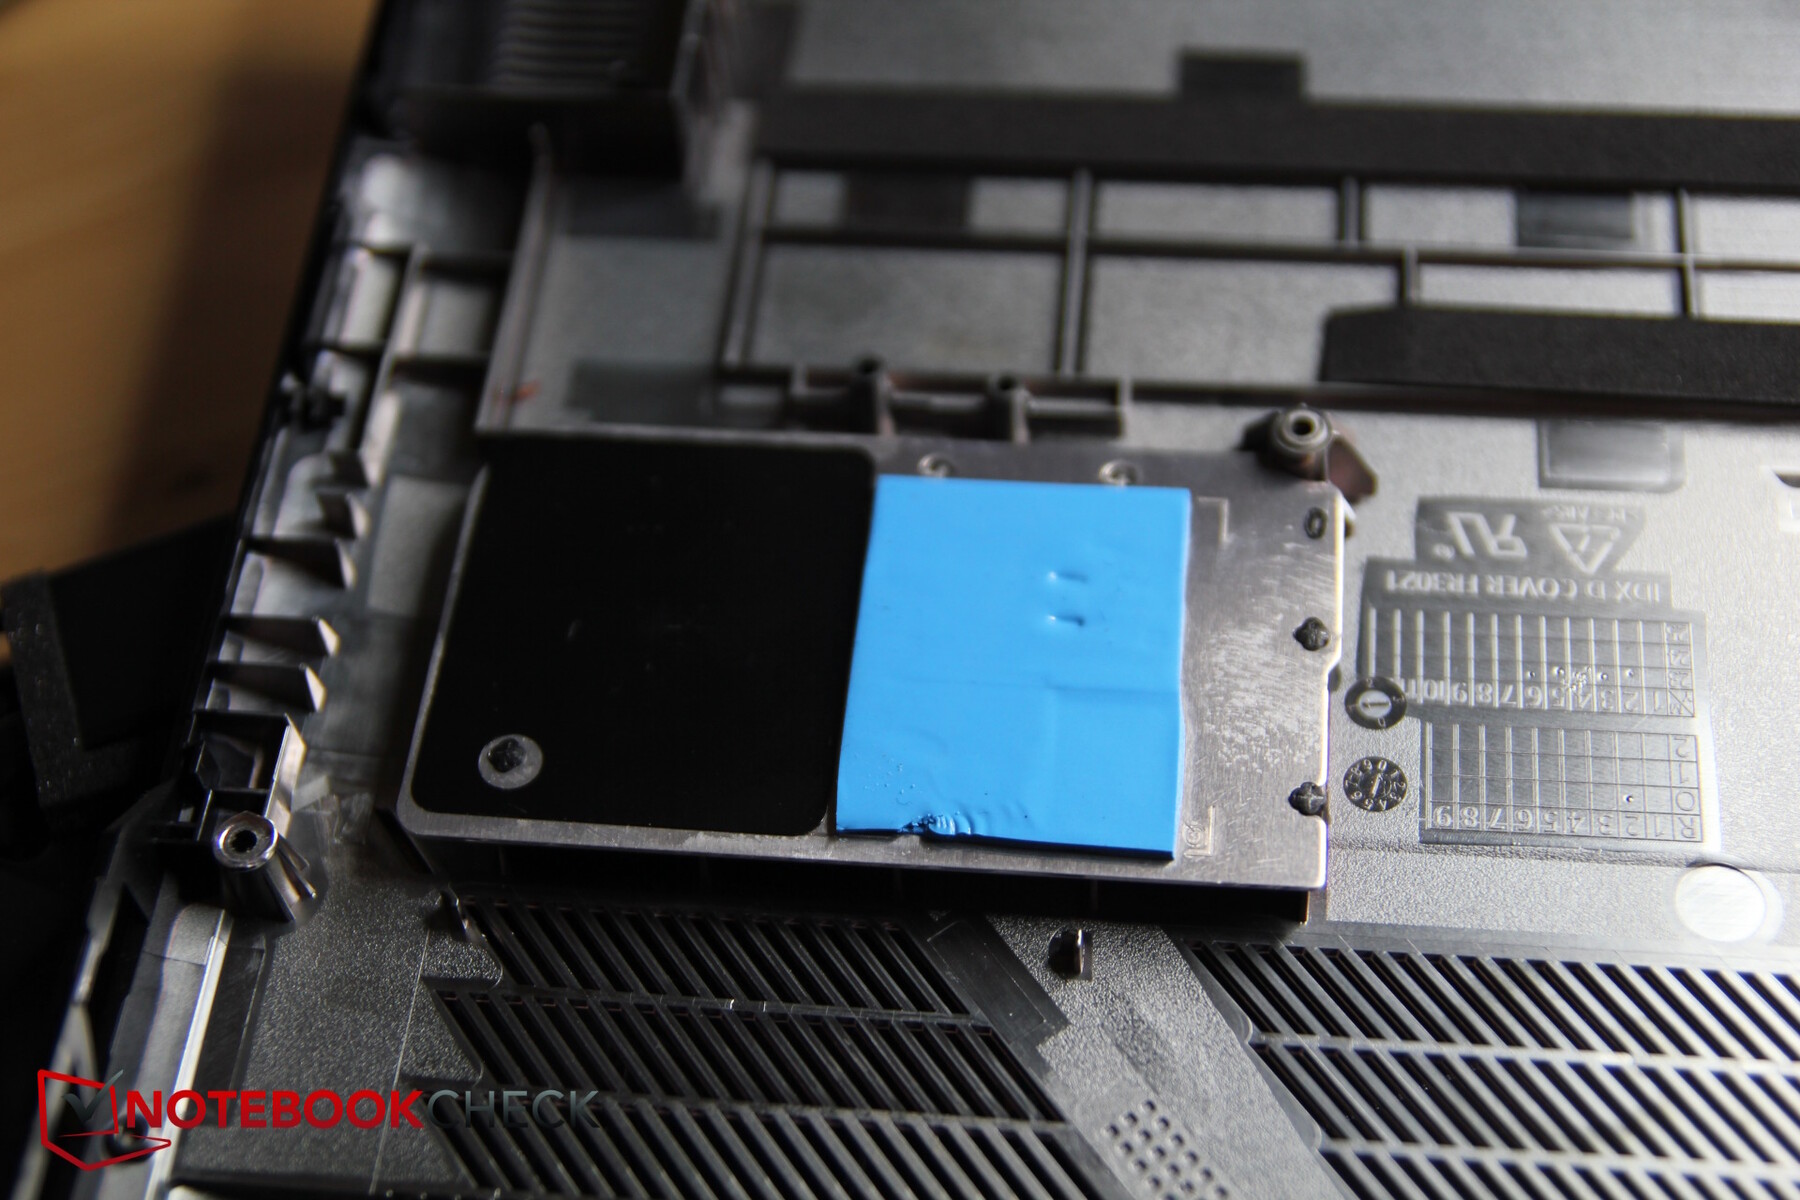
申克公司强调,它使用的是液态金属导热膏。酷睿 16 从未出现过发热现象--在持续负载的情况下,我们在背面中央测得的热点温度为 46 °C。左侧和 WASD 键的温度似乎略高于右侧。
(-) The maximum temperature on the upper side is 46 °C / 115 F, compared to the average of 40.4 °C / 105 F, ranging from 21.2 to 68.8 °C for the class Gaming.
(±) The bottom heats up to a maximum of 44 °C / 111 F, compared to the average of 43.2 °C / 110 F
(+) In idle usage, the average temperature for the upper side is 29.7 °C / 85 F, compared to the device average of 33.9 °C / 93 F.
(±) Playing The Witcher 3, the average temperature for the upper side is 35 °C / 95 F, compared to the device average of 33.9 °C / 93 F.
(+) The palmrests and touchpad are cooler than skin temperature with a maximum of 27 °C / 80.6 F and are therefore cool to the touch.
(±) The average temperature of the palmrest area of similar devices was 28.8 °C / 83.8 F (+1.8 °C / 3.2 F).
| Schenker XMG CORE 16 (L23) AMD Ryzen 7 7840HS, NVIDIA GeForce RTX 4070 Laptop GPU | Lenovo Legion Pro 5 16ARX8 AMD Ryzen 7 7745HX, NVIDIA GeForce RTX 4070 Laptop GPU | Acer Nitro 16 AN16-41 AMD Ryzen 7 7735HS, NVIDIA GeForce RTX 4070 Laptop GPU | HP Omen Transcend 16 Intel Core i9-13900HX, NVIDIA GeForce RTX 4070 Laptop GPU | MSI Stealth 16 Studio A13VG Intel Core i7-13700H, NVIDIA GeForce RTX 4070 Laptop GPU | HP Victus 16-r0077ng Intel Core i7-13700H, NVIDIA GeForce RTX 4070 Laptop GPU | |
|---|---|---|---|---|---|---|
| Heat | 8% | -3% | -1% | -26% | -10% | |
| Maximum Upper Side * (°C) | 46 | 41.8 9% | 41.5 10% | 47.4 -3% | 60 -30% | 51 -11% |
| Maximum Bottom * (°C) | 44 | 41.4 6% | 51.8 -18% | 54.4 -24% | 61 -39% | 54 -23% |
| Idle Upper Side * (°C) | 32 | 29 9% | 31.6 1% | 28.4 11% | 38.2 -19% | 37 -16% |
| Idle Bottom * (°C) | 33 | 30.4 8% | 34.5 -5% | 29.2 12% | 37.7 -14% | 29 12% |
* ... smaller is better
发言人
立体声扬声器音量不大,低音不多,中低音也不平衡。只有高音均衡且线性。要获得更好的音频体验,应使用耳机或外部系统。耳机插孔和麦克风插孔输入可用于连接前者。
Schenker XMG CORE 16 (L23) audio analysis
(±) | speaker loudness is average but good (79.4 dB)
Bass 100 - 315 Hz
(-) | nearly no bass - on average 21.6% lower than median
(±) | linearity of bass is average (11.4% delta to prev. frequency)
Mids 400 - 2000 Hz
(±) | higher mids - on average 5.4% higher than median
(+) | mids are linear (6.7% delta to prev. frequency)
Highs 2 - 16 kHz
(+) | balanced highs - only 2.3% away from median
(+) | highs are linear (6.6% delta to prev. frequency)
Overall 100 - 16.000 Hz
(±) | linearity of overall sound is average (17.1% difference to median)
Compared to same class
» 46% of all tested devices in this class were better, 12% similar, 42% worse
» The best had a delta of 6%, average was 18%, worst was 132%
Compared to all devices tested
» 31% of all tested devices were better, 8% similar, 61% worse
» The best had a delta of 4%, average was 23%, worst was 134%
Lenovo Legion Pro 5 16ARX8 audio analysis
(±) | speaker loudness is average but good (80.9 dB)
Bass 100 - 315 Hz
(-) | nearly no bass - on average 24% lower than median
(±) | linearity of bass is average (13.4% delta to prev. frequency)
Mids 400 - 2000 Hz
(+) | balanced mids - only 4.7% away from median
(+) | mids are linear (6.2% delta to prev. frequency)
Highs 2 - 16 kHz
(+) | balanced highs - only 2.5% away from median
(+) | highs are linear (6.2% delta to prev. frequency)
Overall 100 - 16.000 Hz
(±) | linearity of overall sound is average (21.9% difference to median)
Compared to same class
» 79% of all tested devices in this class were better, 6% similar, 16% worse
» The best had a delta of 6%, average was 18%, worst was 132%
Compared to all devices tested
» 63% of all tested devices were better, 7% similar, 30% worse
» The best had a delta of 4%, average was 23%, worst was 134%
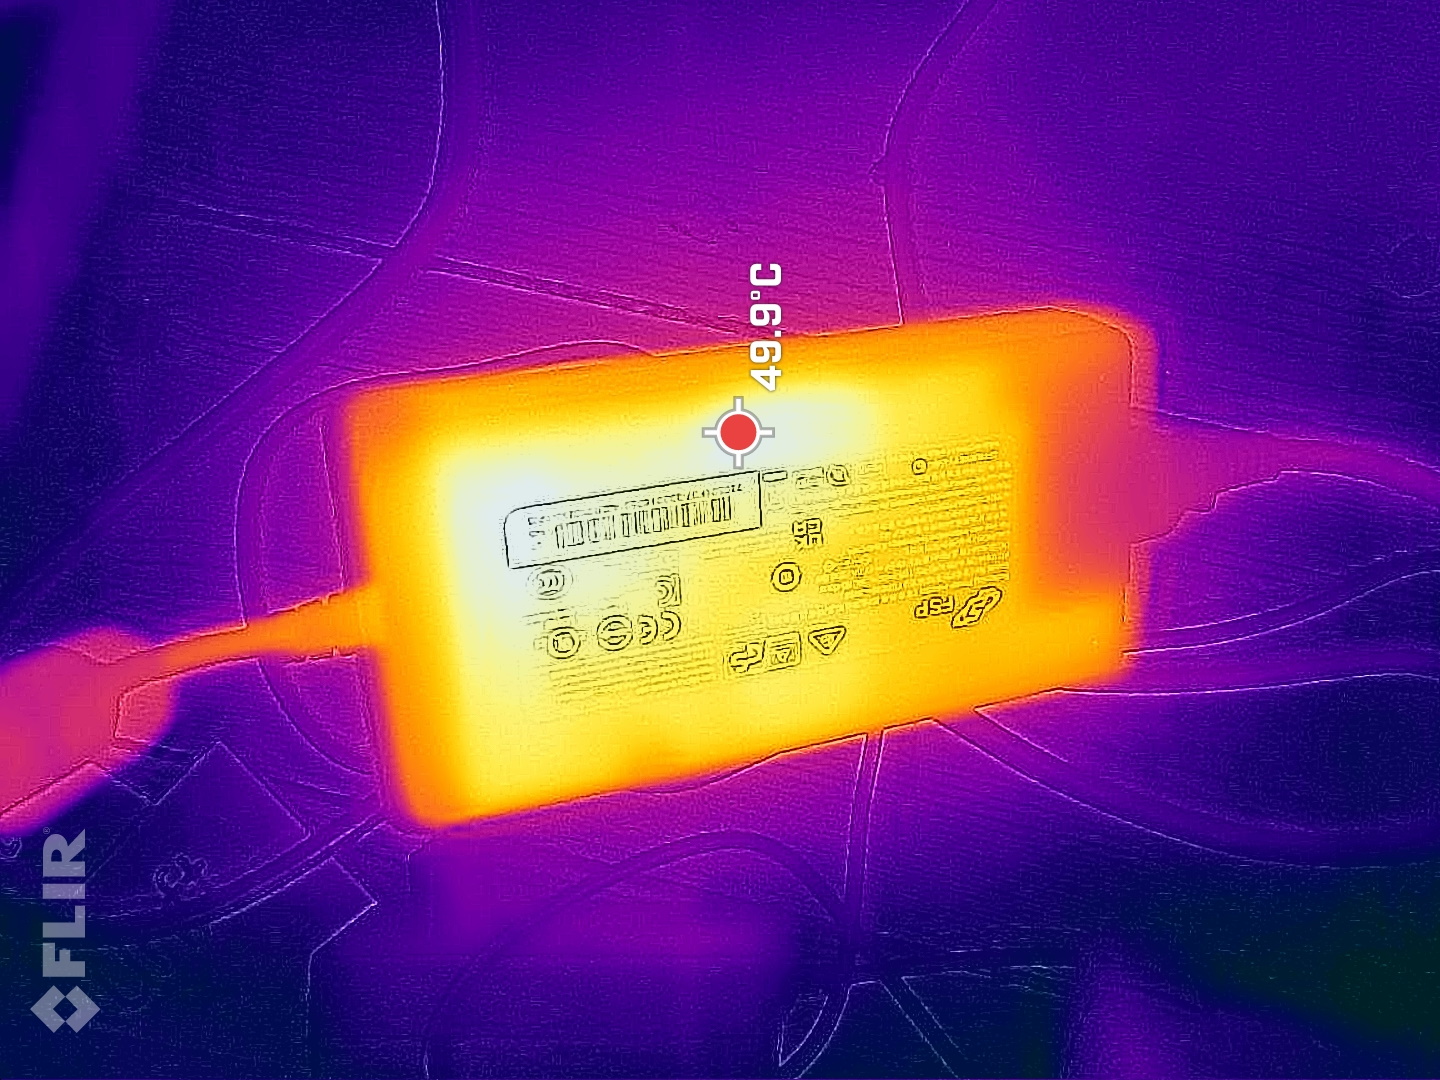
耗电量
在空闲模式下,它的功耗适中--我们已经习惯了上一代 XMG 机型较高的功耗值。在游戏模式下,它的耗电量与性能息息相关,这就是为什么这款笔记本电脑的耗电量介于两款笔记本电脑之间的原因。联想Legion Pro 5和HP Omen Transcend 16 之间。和MSI Stealth 16 Studio 之间。和HP Victus 16之间。
我们测得的短期最大功耗为 280 瓦--230 瓦的电源(现在是 FSP,而不是 LiteOn)可能会在这方面有些吃力。不过,在全高清超高清模式下运行 Witcher 3 时,酷睿的平均功耗为 179 瓦,这意味着电源应该有足够的储备用于游戏,而且可以始终可靠地为笔记本电脑充电。 不过,我们测得的功耗在压力测试 的前几分钟一直高于 230 瓦--请看下面的曲线。
| Off / Standby | |
| Idle | |
| Load |
|
Key:
min: | |
| Schenker XMG CORE 16 (L23) R7 7840HS, GeForce RTX 4070 Laptop GPU, Samsung 990 Pro 1 TB, IPS, 2560x1600, 16" | Lenovo Legion Pro 5 16ARX8 R7 7745HX, GeForce RTX 4070 Laptop GPU, Samsung PM9A1 MZVL21T0HCLR, IPS, 2560x1600, 16" | Acer Nitro 16 AN16-41 R7 7735HS, GeForce RTX 4070 Laptop GPU, Samsung PM9A1 MZVL21T0HCLR, IPS, 2560x1600, 16" | HP Omen Transcend 16 i9-13900HX, GeForce RTX 4070 Laptop GPU, SK hynix PC801 HFS002TEJ9X101N, Mini-LED, 2560x1600, 16" | MSI Stealth 16 Studio A13VG i7-13700H, GeForce RTX 4070 Laptop GPU, Micron 3400 2TB MTFDKBA2T0TFH, IPS, 2560x1600, 16" | HP Victus 16-r0077ng i7-13700H, GeForce RTX 4070 Laptop GPU, Kioxia XG8 KXG80ZNV1T02, IPS, 1920x1080, 16.1" | Average NVIDIA GeForce RTX 4070 Laptop GPU | Average of class Gaming | |
|---|---|---|---|---|---|---|---|---|
| Power Consumption | -26% | -19% | -82% | -6% | 1% | -25% | -33% | |
| Idle Minimum * (Watt) | 11 | 8.1 26% | 11.6 -5% | 19.2 -75% | 11 -0% | 8 27% | 13.2 ? -20% | 13 ? -18% |
| Idle Average * (Watt) | 15.2 | 15.9 -5% | 15.6 -3% | 22.7 -49% | 18 -18% | 13 14% | 18.2 ? -20% | 19 ? -25% |
| Idle Maximum * (Watt) | 16 | 37.2 -133% | 16.5 -3% | 55.4 -246% | 19 -19% | 22 -38% | 24.6 ? -54% | 24.5 ? -53% |
| Load Average * (Watt) | 64 | 90.9 -42% | 155 -142% | 128.4 -101% | 91 -42% | 86 -34% | 97 ? -52% | 111.1 ? -74% |
| Witcher 3 ultra * (Watt) | 179 | 189.6 -6% | 154.8 14% | 206 -15% | 130 27% | 141.8 21% | ||
| Load Maximum * (Watt) | 280 | 263.5 6% | 205 27% | 292 -4% | 228 19% | 233 17% | 221 ? 21% | 260 ? 7% |
* ... smaller is better
Power consumption Witcher 3 / stress test
Power consumption with external monitor
运行时间
申克在笔记本电脑中安装了一块 99 Wh 的电池。联想联想Legion Pro 5 16仅配备了 80 Wh 电池,但一些竞争对手,如MSI Stealth 16或HP Omen Transcend 16的电池容量相当。
即便如此,我们还是缺少控制中心的省电模式--平衡模式是最低可用模式。我们的 H.264 编码电影在亮度降低的情况下连续循环播放了 8 个多小时。在 150 尼特的 WLAN 测试中,Core 也达到了近 8.5 小时。只有Acer Nitro 16 能达到这一水平。
| Schenker XMG CORE 16 (L23) R7 7840HS, GeForce RTX 4070 Laptop GPU, 99 Wh | Lenovo Legion Pro 5 16ARX8 R7 7745HX, GeForce RTX 4070 Laptop GPU, 80 Wh | Acer Nitro 16 AN16-41 R7 7735HS, GeForce RTX 4070 Laptop GPU, 90 Wh | HP Omen Transcend 16 i9-13900HX, GeForce RTX 4070 Laptop GPU, 97 Wh | MSI Stealth 16 Studio A13VG i7-13700H, GeForce RTX 4070 Laptop GPU, 99.9 Wh | HP Victus 16-r0077ng i7-13700H, GeForce RTX 4070 Laptop GPU, 83 Wh | Average of class Gaming | |
|---|---|---|---|---|---|---|---|
| Battery runtime | -55% | -6% | -50% | -11% | -15% | -23% | |
| H.264 (h) | 10.2 | 10.2 0% | 7.7 -25% | 8.32 ? -18% | |||
| WiFi v1.3 (h) | 8.4 | 4 -52% | 9 7% | 4.2 -50% | 7.8 -7% | 7.1 -15% | 7.11 ? -15% |
| Load (h) | 2.4 | 1 -58% | 1.8 -25% | 1.2 -50% | 2.4 0% | 1.502 ? -37% | |
| Reader / Idle (h) | 6.5 | 12.2 | 6.3 | 11 | 8.27 ? |
Pros
Cons
结论 - 出色的游戏笔记本电脑,没有任何重大缺陷
配备 RTX 4070 的 16 英寸笔记本电脑起价约为 1,600 美元。但这并不意味着酷睿 16 完全物美价廉(见下文)。反过来,它确实提供了良好的 3D 性能、市场上最快的固态硬盘之一、可选的机械键盘、良好的 1,600p sRGB 面板和较低的 DeltaE 值等等。这是一款全面的游戏笔记本电脑,其性能恰到好处。要想获得更好的性能水平,就必须使用 HX 处理器,因为 RTX 4070 的性能非常出色。
你必须仔细观察这款设备,才能找到任何值得批评的地方。在极端情况下,230 瓦的电源可能会超负荷--至少在我们的压力测试中,电源超负荷运行了几分钟。在游戏中,这被证明是没有问题的。它的平衡模式还不够完善,只有在游戏一分钟后才真正起作用,性能下降到电池水平。
在我们的所有测试中,XMG 酷睿 16 凭借其强大的 RTX 4070 和校准良好的 sRGB 显示屏,被证明是一款优秀的游戏笔记本电脑。
酷睿 16 的最大竞争对手是联想Legion Pro 5 16ARX8它在很多方面表现类似,但价格更低。另一方面,它的运行时间也不尽如人意。
价格和供应情况
您可以通过bestware.com 购买申克的笔记本电脑。.我们的配置价格约为 2360 美元。
Schenker XMG CORE 16 (L23)
- 10/05/2023 v7 (old)
Christian Hintze
Transparency
The selection of devices to be reviewed is made by our editorial team. The test sample was provided to the author as a loan by the manufacturer or retailer for the purpose of this review. The lender had no influence on this review, nor did the manufacturer receive a copy of this review before publication. There was no obligation to publish this review. As an independent media company, Notebookcheck is not subjected to the authority of manufacturers, retailers or publishers.
This is how Notebookcheck is testing
Every year, Notebookcheck independently reviews hundreds of laptops and smartphones using standardized procedures to ensure that all results are comparable. We have continuously developed our test methods for around 20 years and set industry standards in the process. In our test labs, high-quality measuring equipment is utilized by experienced technicians and editors. These tests involve a multi-stage validation process. Our complex rating system is based on hundreds of well-founded measurements and benchmarks, which maintains objectivity. Further information on our test methods can be found here.
Price comparison

