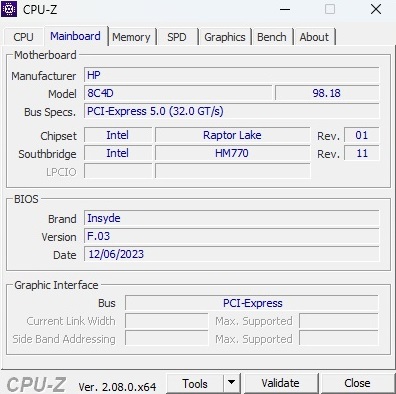
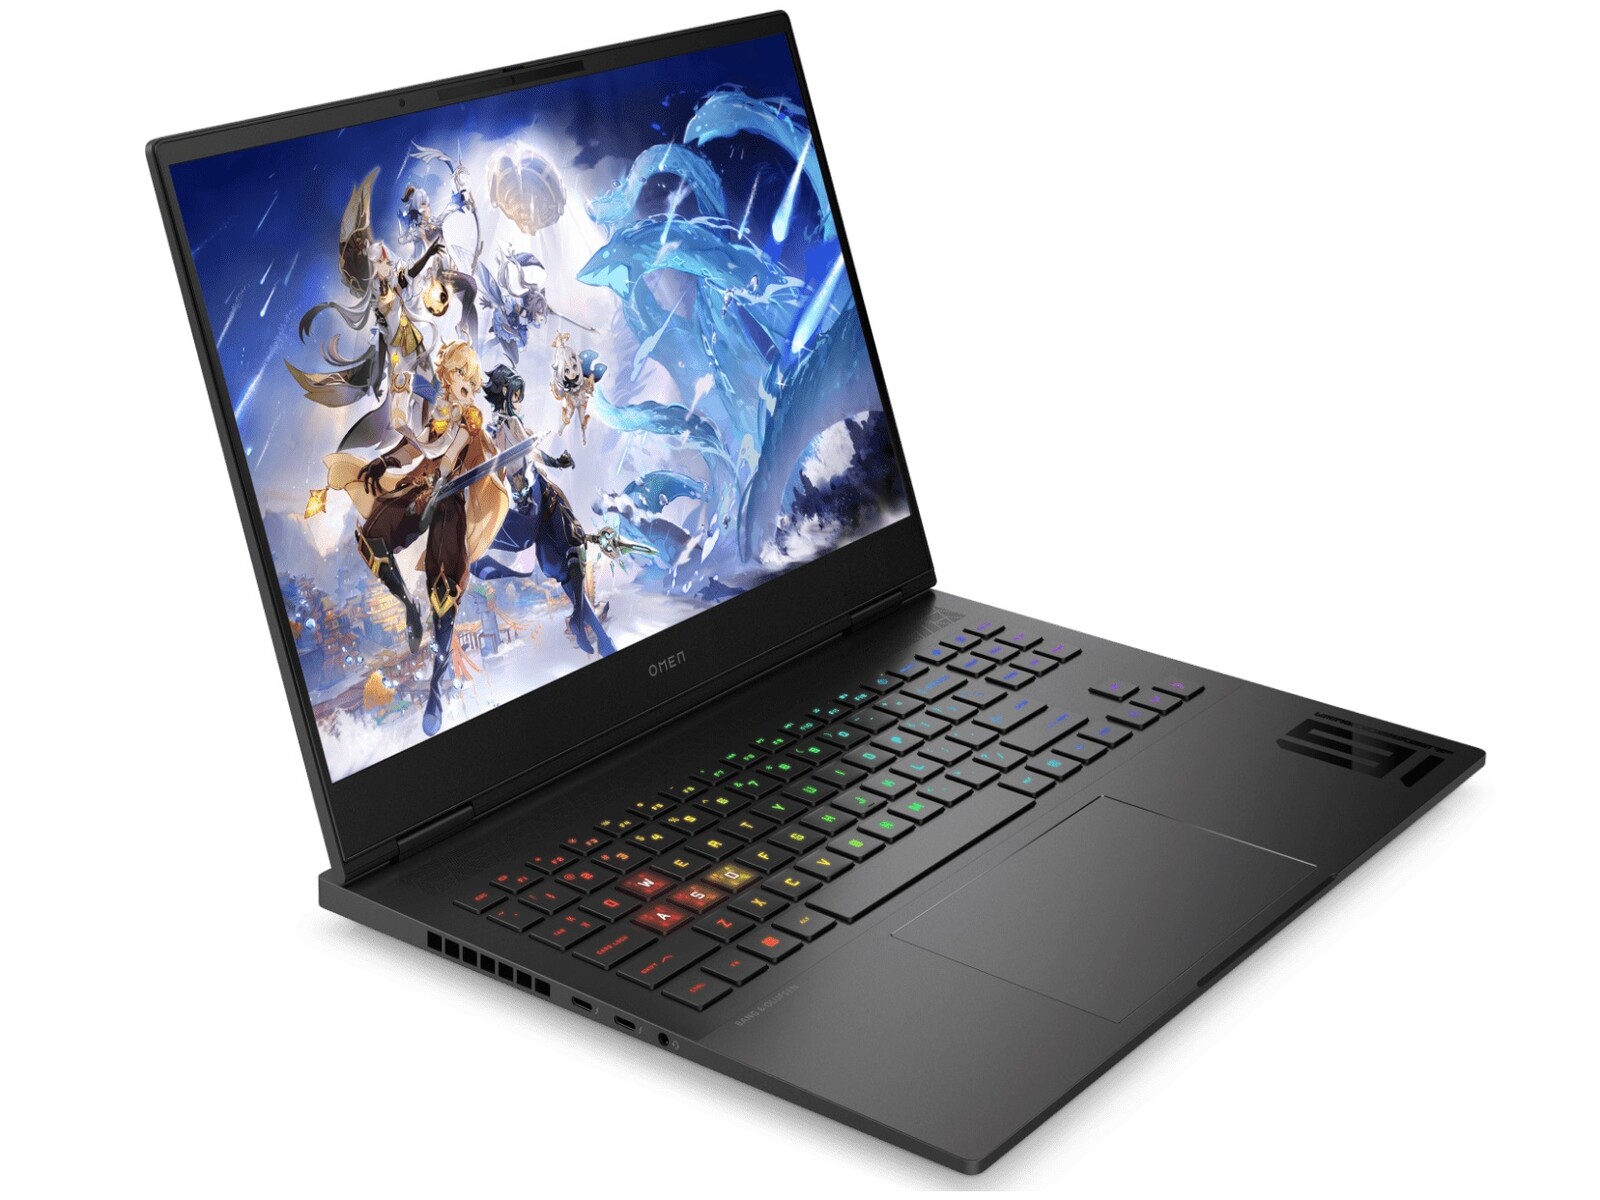
惠普 Omen Transcend 16 (2024) 笔记本电脑评测:配备 OLED 显示屏的 RTX 4070 游戏机

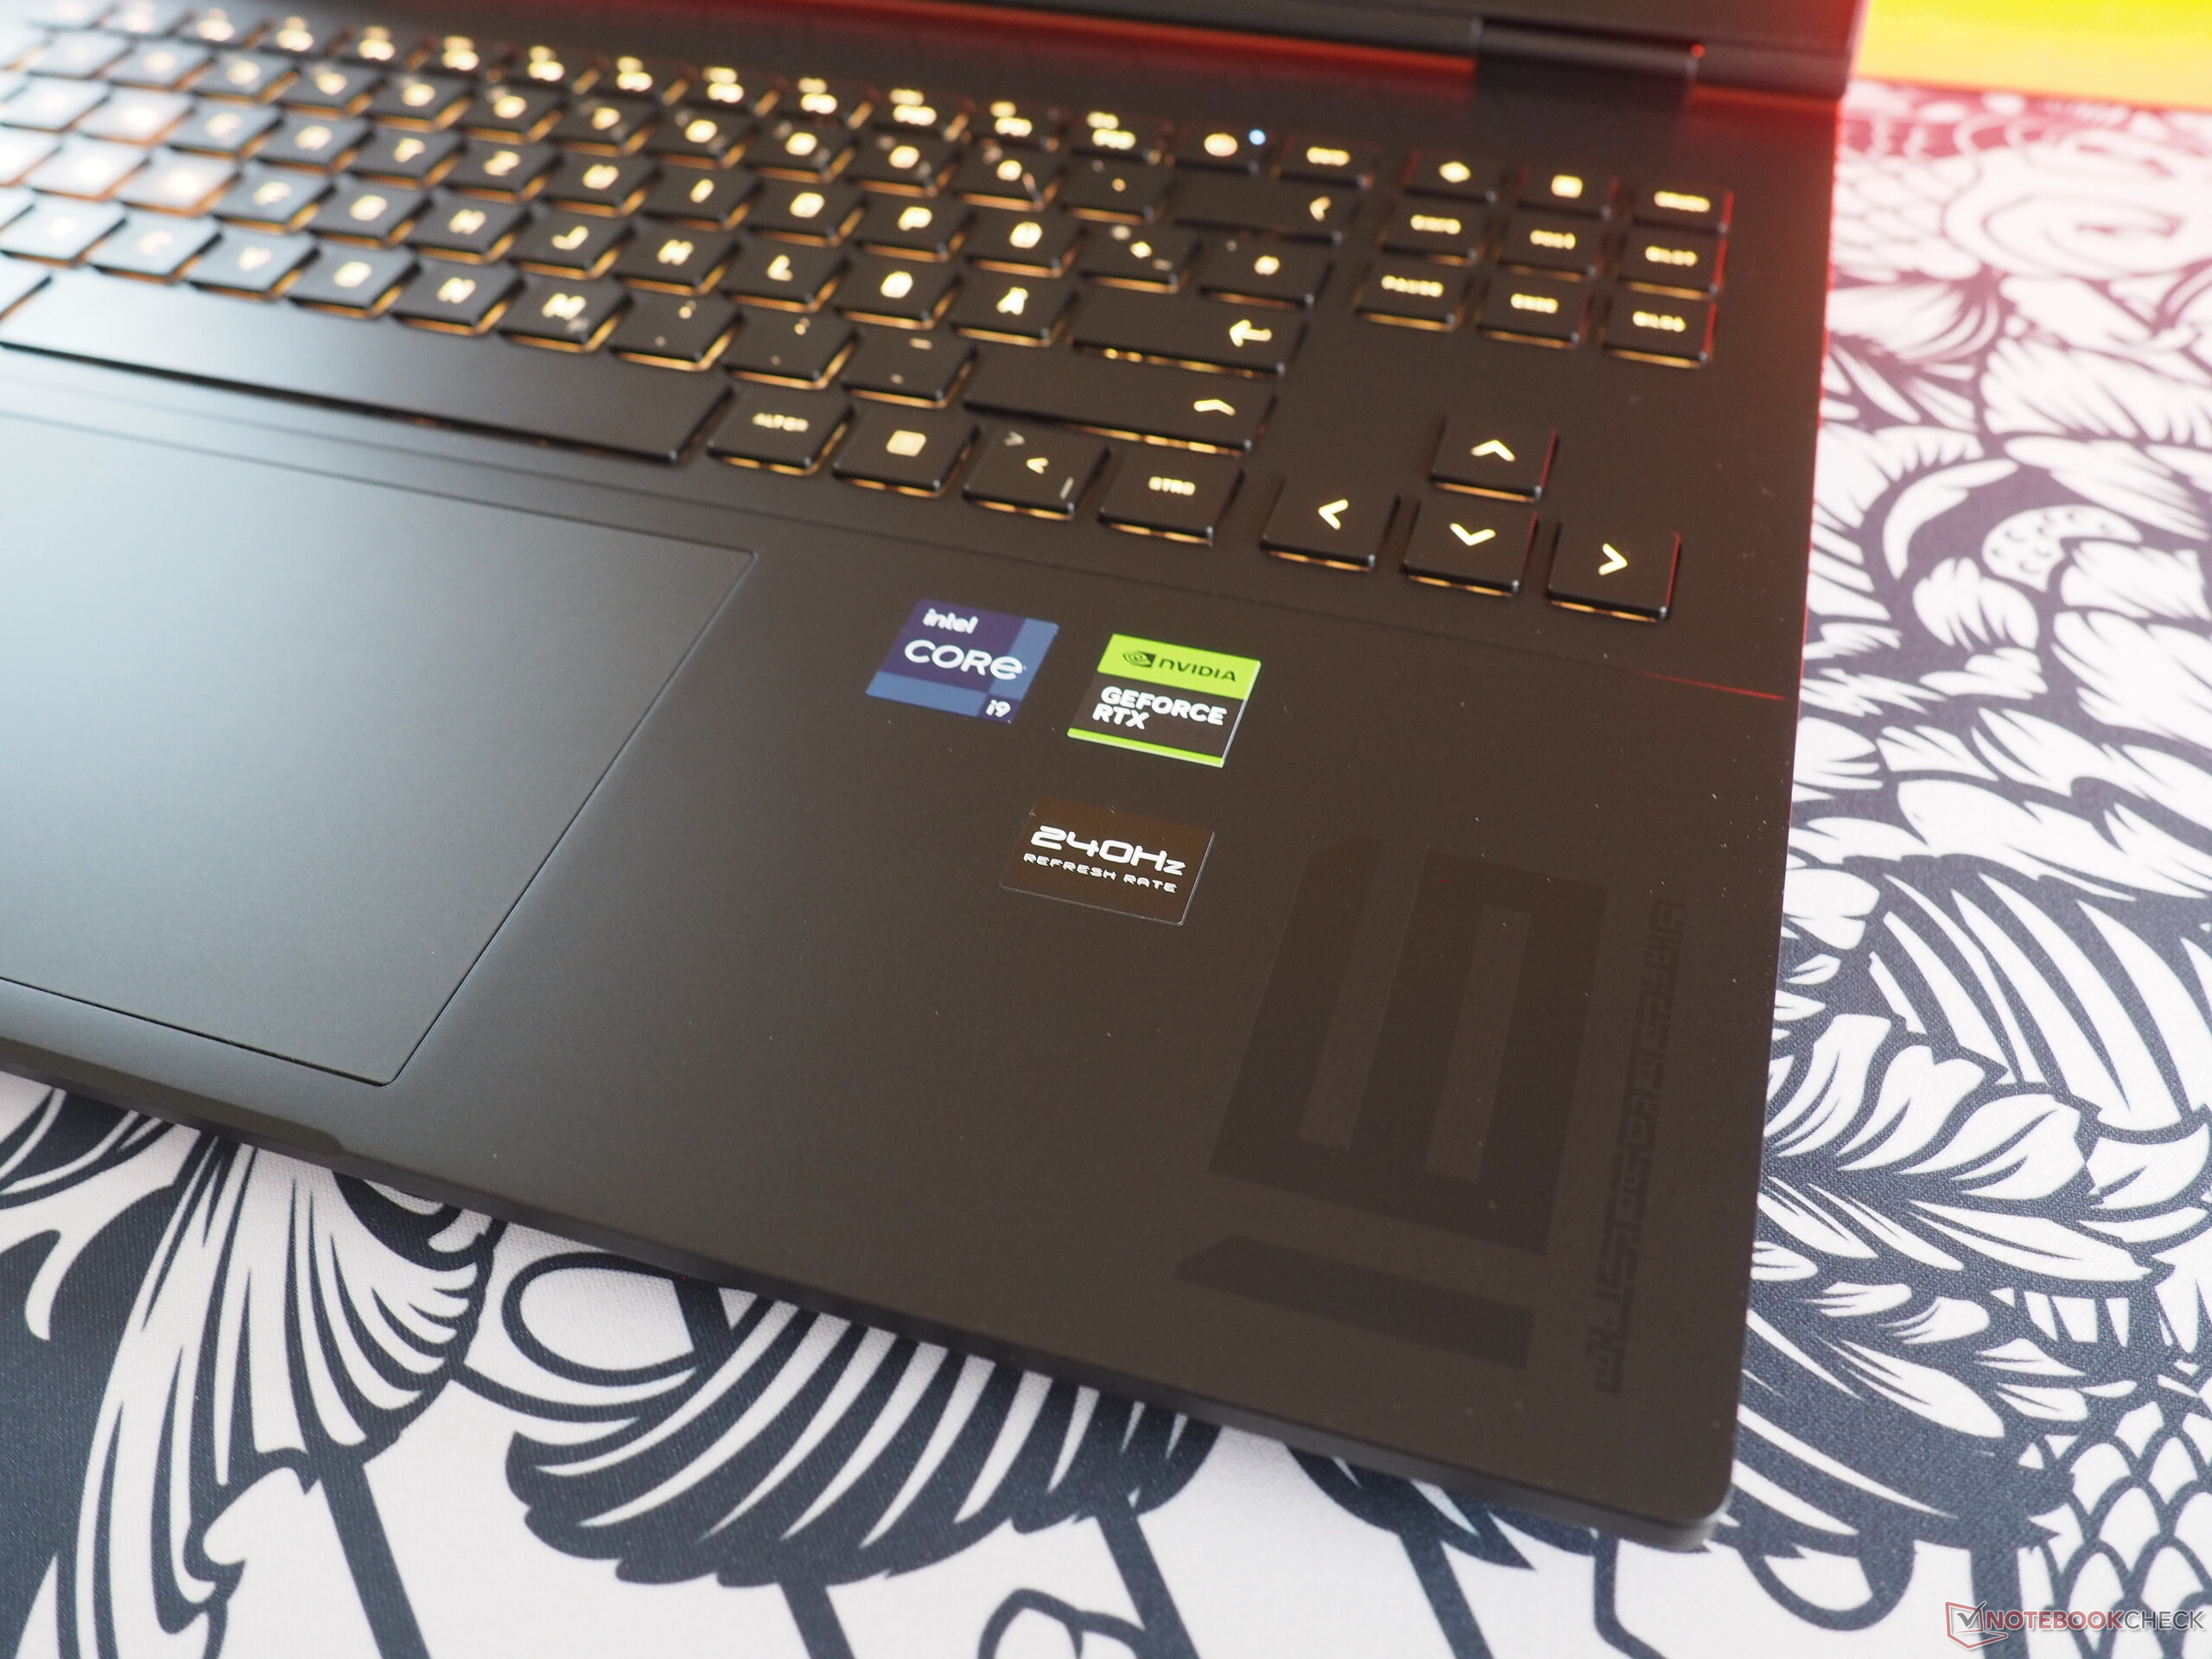
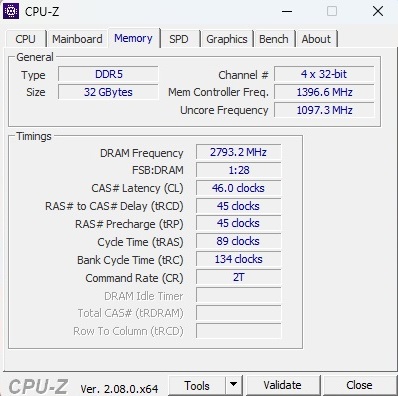
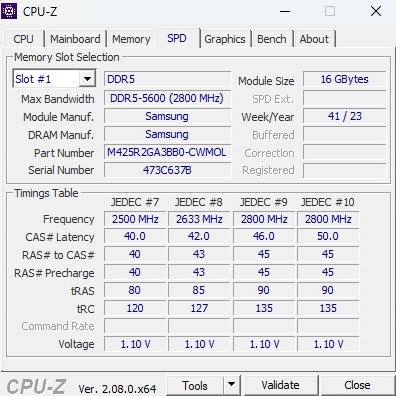
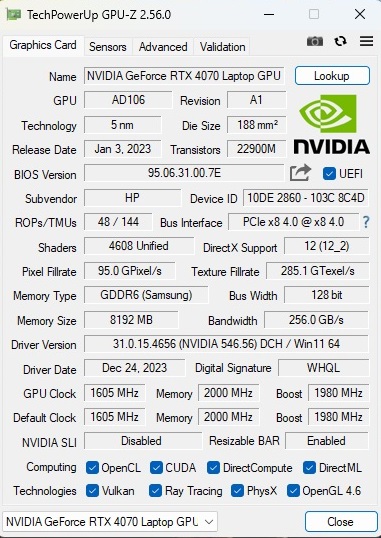
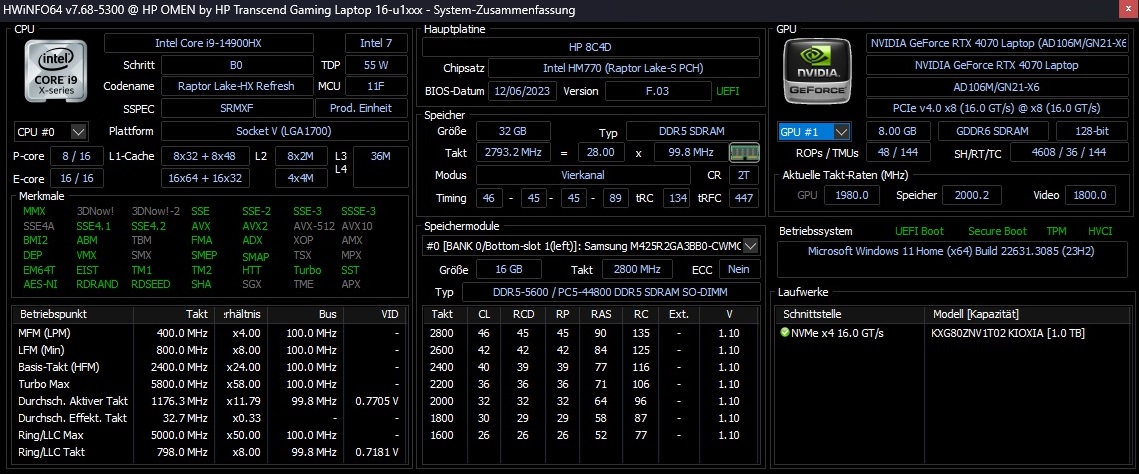
目前,以 u1095ng 结尾的 Omen Transcend 16 评论机型的售价略低于 3000 美元。在这个价格上,购买者可以获得 酷睿 i9-14900HX与 GeForce RTX 4070由于其 8GB 的 VRAM 相当微薄,它更倾向于属于中端而非高端类别。此外还有 32 GB DDR5-5600 内存(2x 16 GB SO-DIMM)和 1 TB M.2 NVMe 固态硬盘。最大的亮点是鲜艳的 OLED 面板,据说像素为 2,560 x 1,600,频率为 240 Hz,亮度为 400 cd/m²,100% DCI P3。此外,还配备了 Windows 11 Home 操作系统。
奥门超越 16 竞争对手可以找到其他 16 英寸游戏玩家配备GeForce RTX 4070 以及 华硕 ROG Zephyrus G16 2024(超 7 155H)、 申克 XMG 酷睿 16 L23(Ryzen 7 7840HS)和 联想Legion Pro 5 16ARX8(Ryzen 7 7745HX) 都出现在我们的对比设备表中。
由于机箱与前代产品基本相同,而前代产品采用了 酷睿 i9-13900HX(参见我们的 评测),我们将只简要介绍机箱、功能和输入设备类别。
潜在的竞争对手比较
Rating | Date | Model | Weight | Height | Size | Resolution | Price |
|---|---|---|---|---|---|---|---|
| 88.4 % v7 (old) | 02 / 2024 | HP Omen Transcend 16-u1095ng i9-14900HX, GeForce RTX 4070 Laptop GPU | 2.3 kg | 20 mm | 16.00" | 2560x1600 | |
| 87.9 % v7 (old) | 08 / 2023 | HP Omen Transcend 16 i9-13900HX, GeForce RTX 4070 Laptop GPU | 2.3 kg | 19.8 mm | 16.00" | 2560x1600 | |
| 92.3 % v7 (old) | 02 / 2024 | Asus ROG Zephyrus G16 2024 GU605M Ultra 7 155H, GeForce RTX 4070 Laptop GPU | 1.8 kg | 16.4 mm | 16.00" | 2560x1600 | |
| 89.2 % v7 (old) | 10 / 2023 | Schenker XMG CORE 16 (L23) R7 7840HS, GeForce RTX 4070 Laptop GPU | 2.4 kg | 26.1 mm | 16.00" | 2560x1600 | |
| 88.4 % v7 (old) | 05 / 2023 | Lenovo Legion Pro 5 16ARX8 R7 7745HX, GeForce RTX 4070 Laptop GPU | 2.5 kg | 26.8 mm | 16.00" | 2560x1600 |
案例
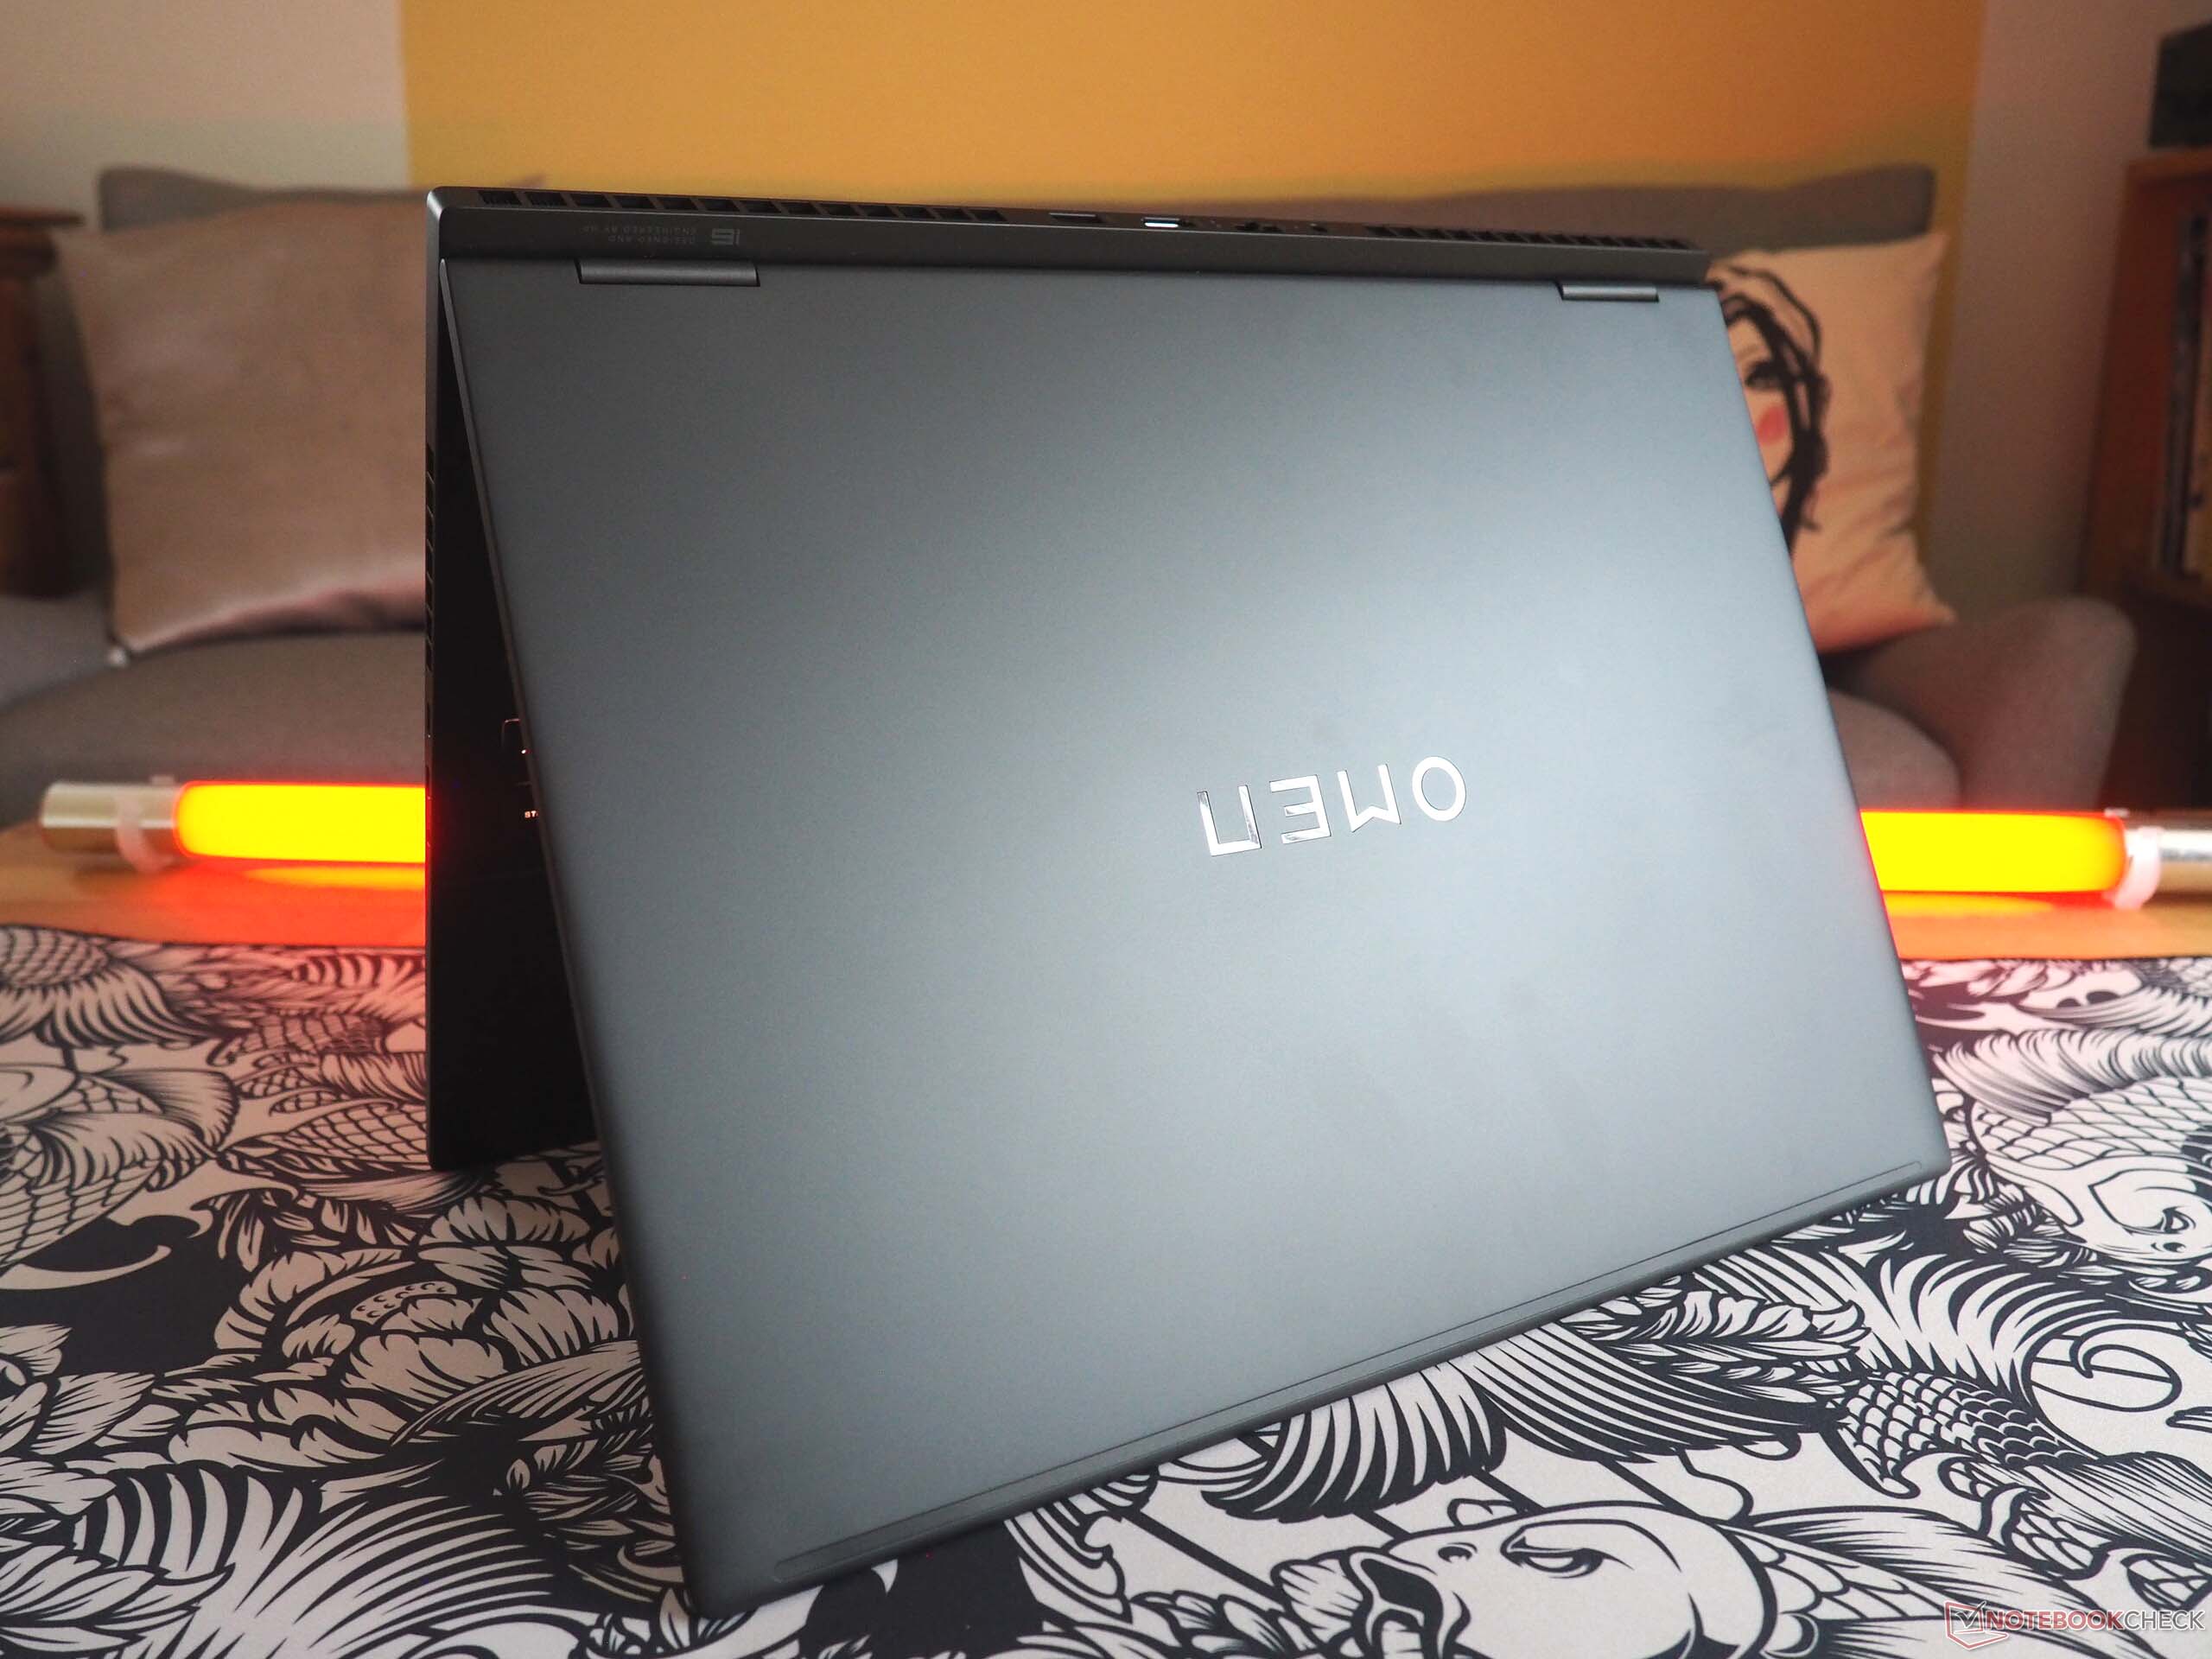
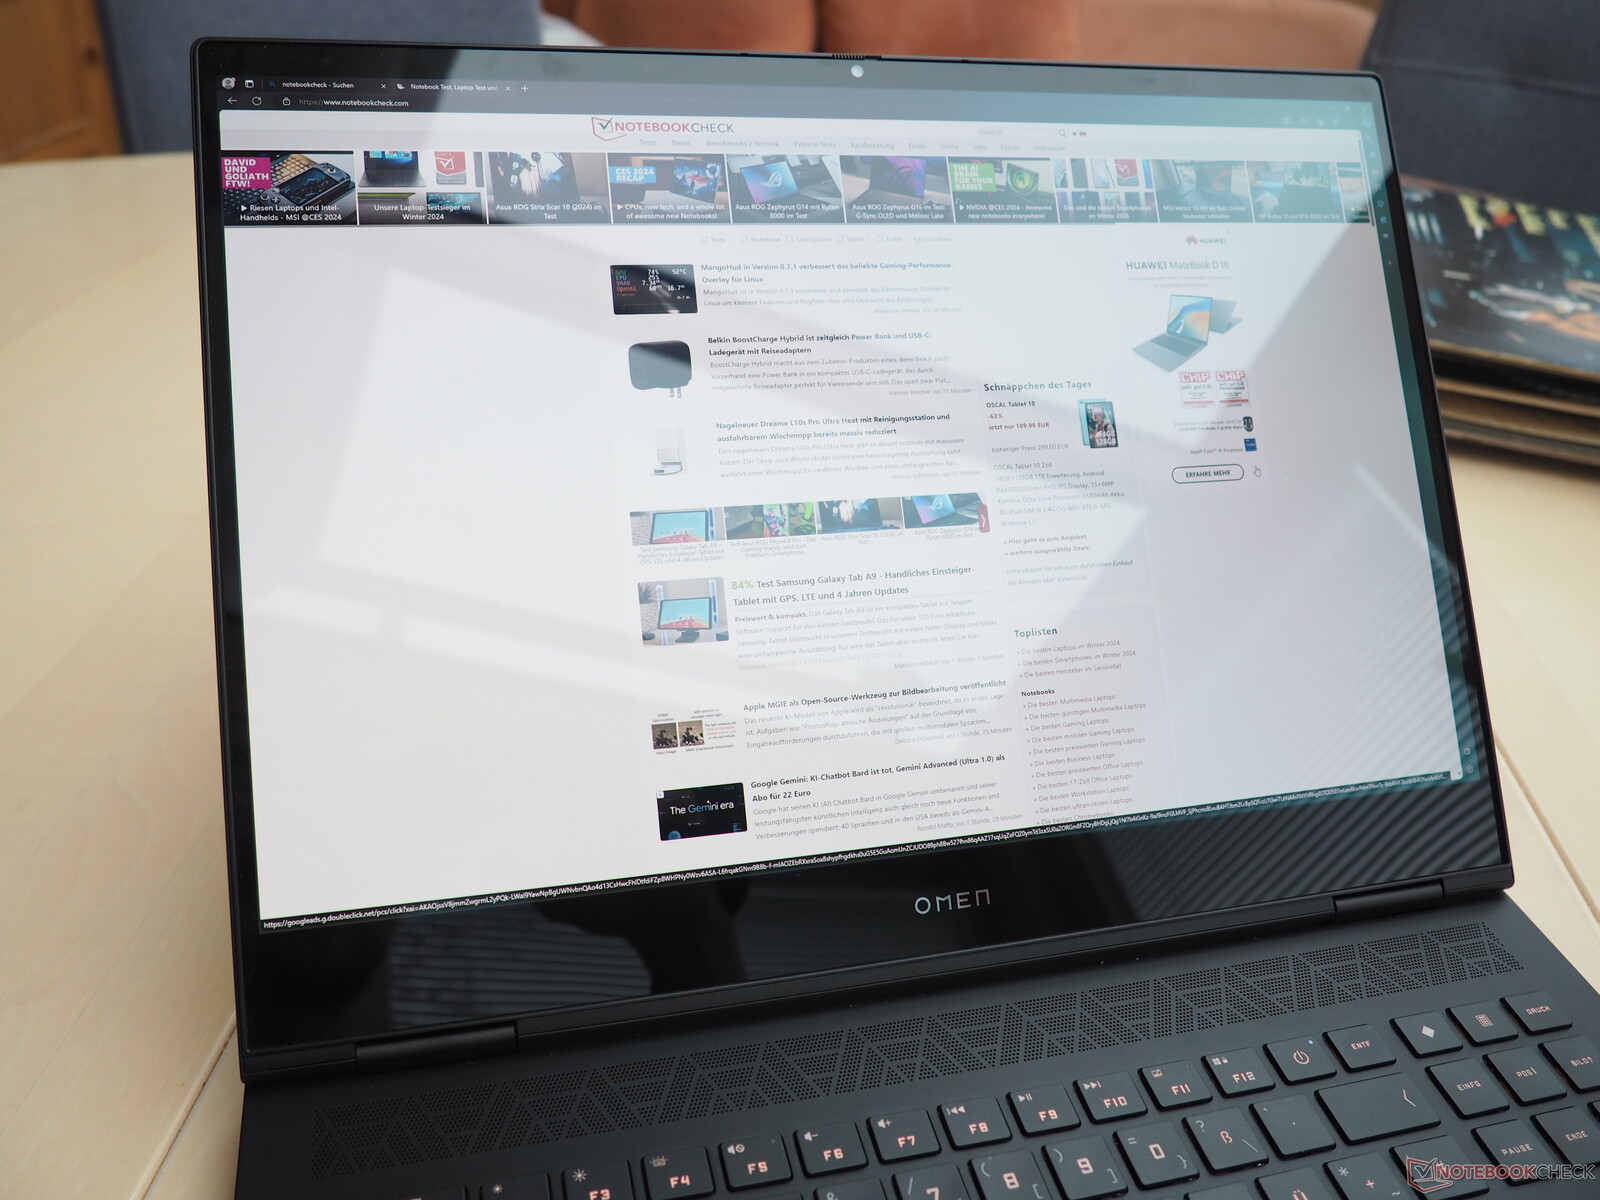
创见 16 的设计非常抢眼,从视觉角度来看,它的纤薄身形令人印象深刻(除了 Zephyrus G16 外,所有竞争设备都更厚)。在稳定性方面,底座至少能提供稳定的性能。相比之下,盖子--就像许多设备一样--的抗扭刚度还可以做得更好。乍一看,磨砂表面很有质感,但惠普大多只使用了塑料。在制造质量方面,没有什么可抱怨的。虽然铰链还可以做得更结实一些,但惠普 180° 的开合角度还是值得称赞的。说到重量,该设备的重量为 2.3 千克,在同类产品中处于中等水平,这使得这款 16 英寸的产品既不特别轻,也不特别重。


特点
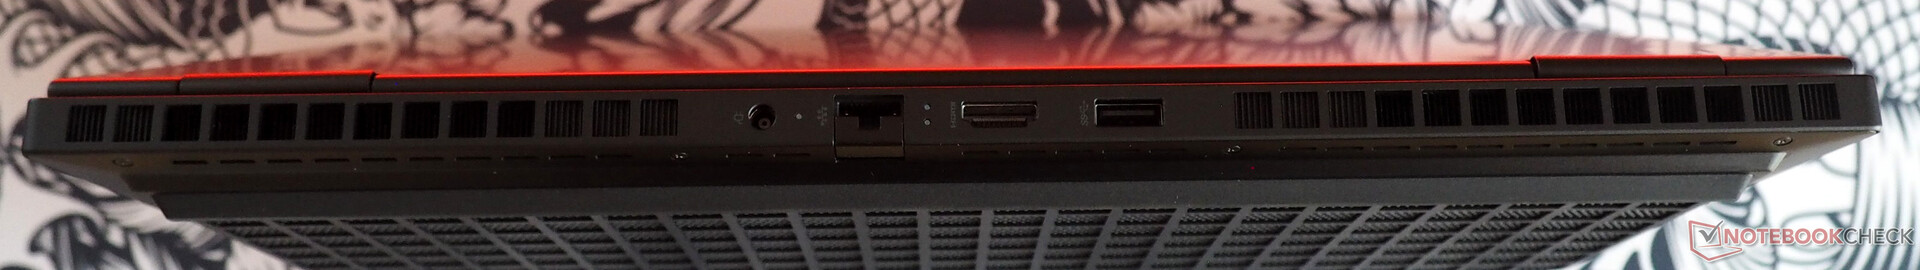
端口的选择可以说非常现代。背面有一个 RJ45 端口(可惜不是 2.5 Gbit LAN)、一个 HDMI 2.1 输出和一个 USB 3.0 端口(A 型),左侧有两个 Thunderbolt 4 端口(包括 Power Delivery)和一个音频插孔。右侧只有一个单独的 USB 3.0 端口(A 型)。没有 Kensington 锁和读卡器,买家也只能将就了。


交流
Wi-Fi 性能处于较高水平,发送速度接近 1,400 Mbit/s,接收数据速度约为 1,700 Mbit/s(与参考路由器的距离为 1 米),性能介于良好和非常良好之间。惠普为 Wi-Fi 6E AX211 安装了最新的英特尔无线模块。
网络摄像头
对于 200 万像素的网络摄像头,我们褒贬不一。虽然图像清晰度高于平均水平,但色彩准确度还有待提高。好在手动快门可以保护隐私。


配件
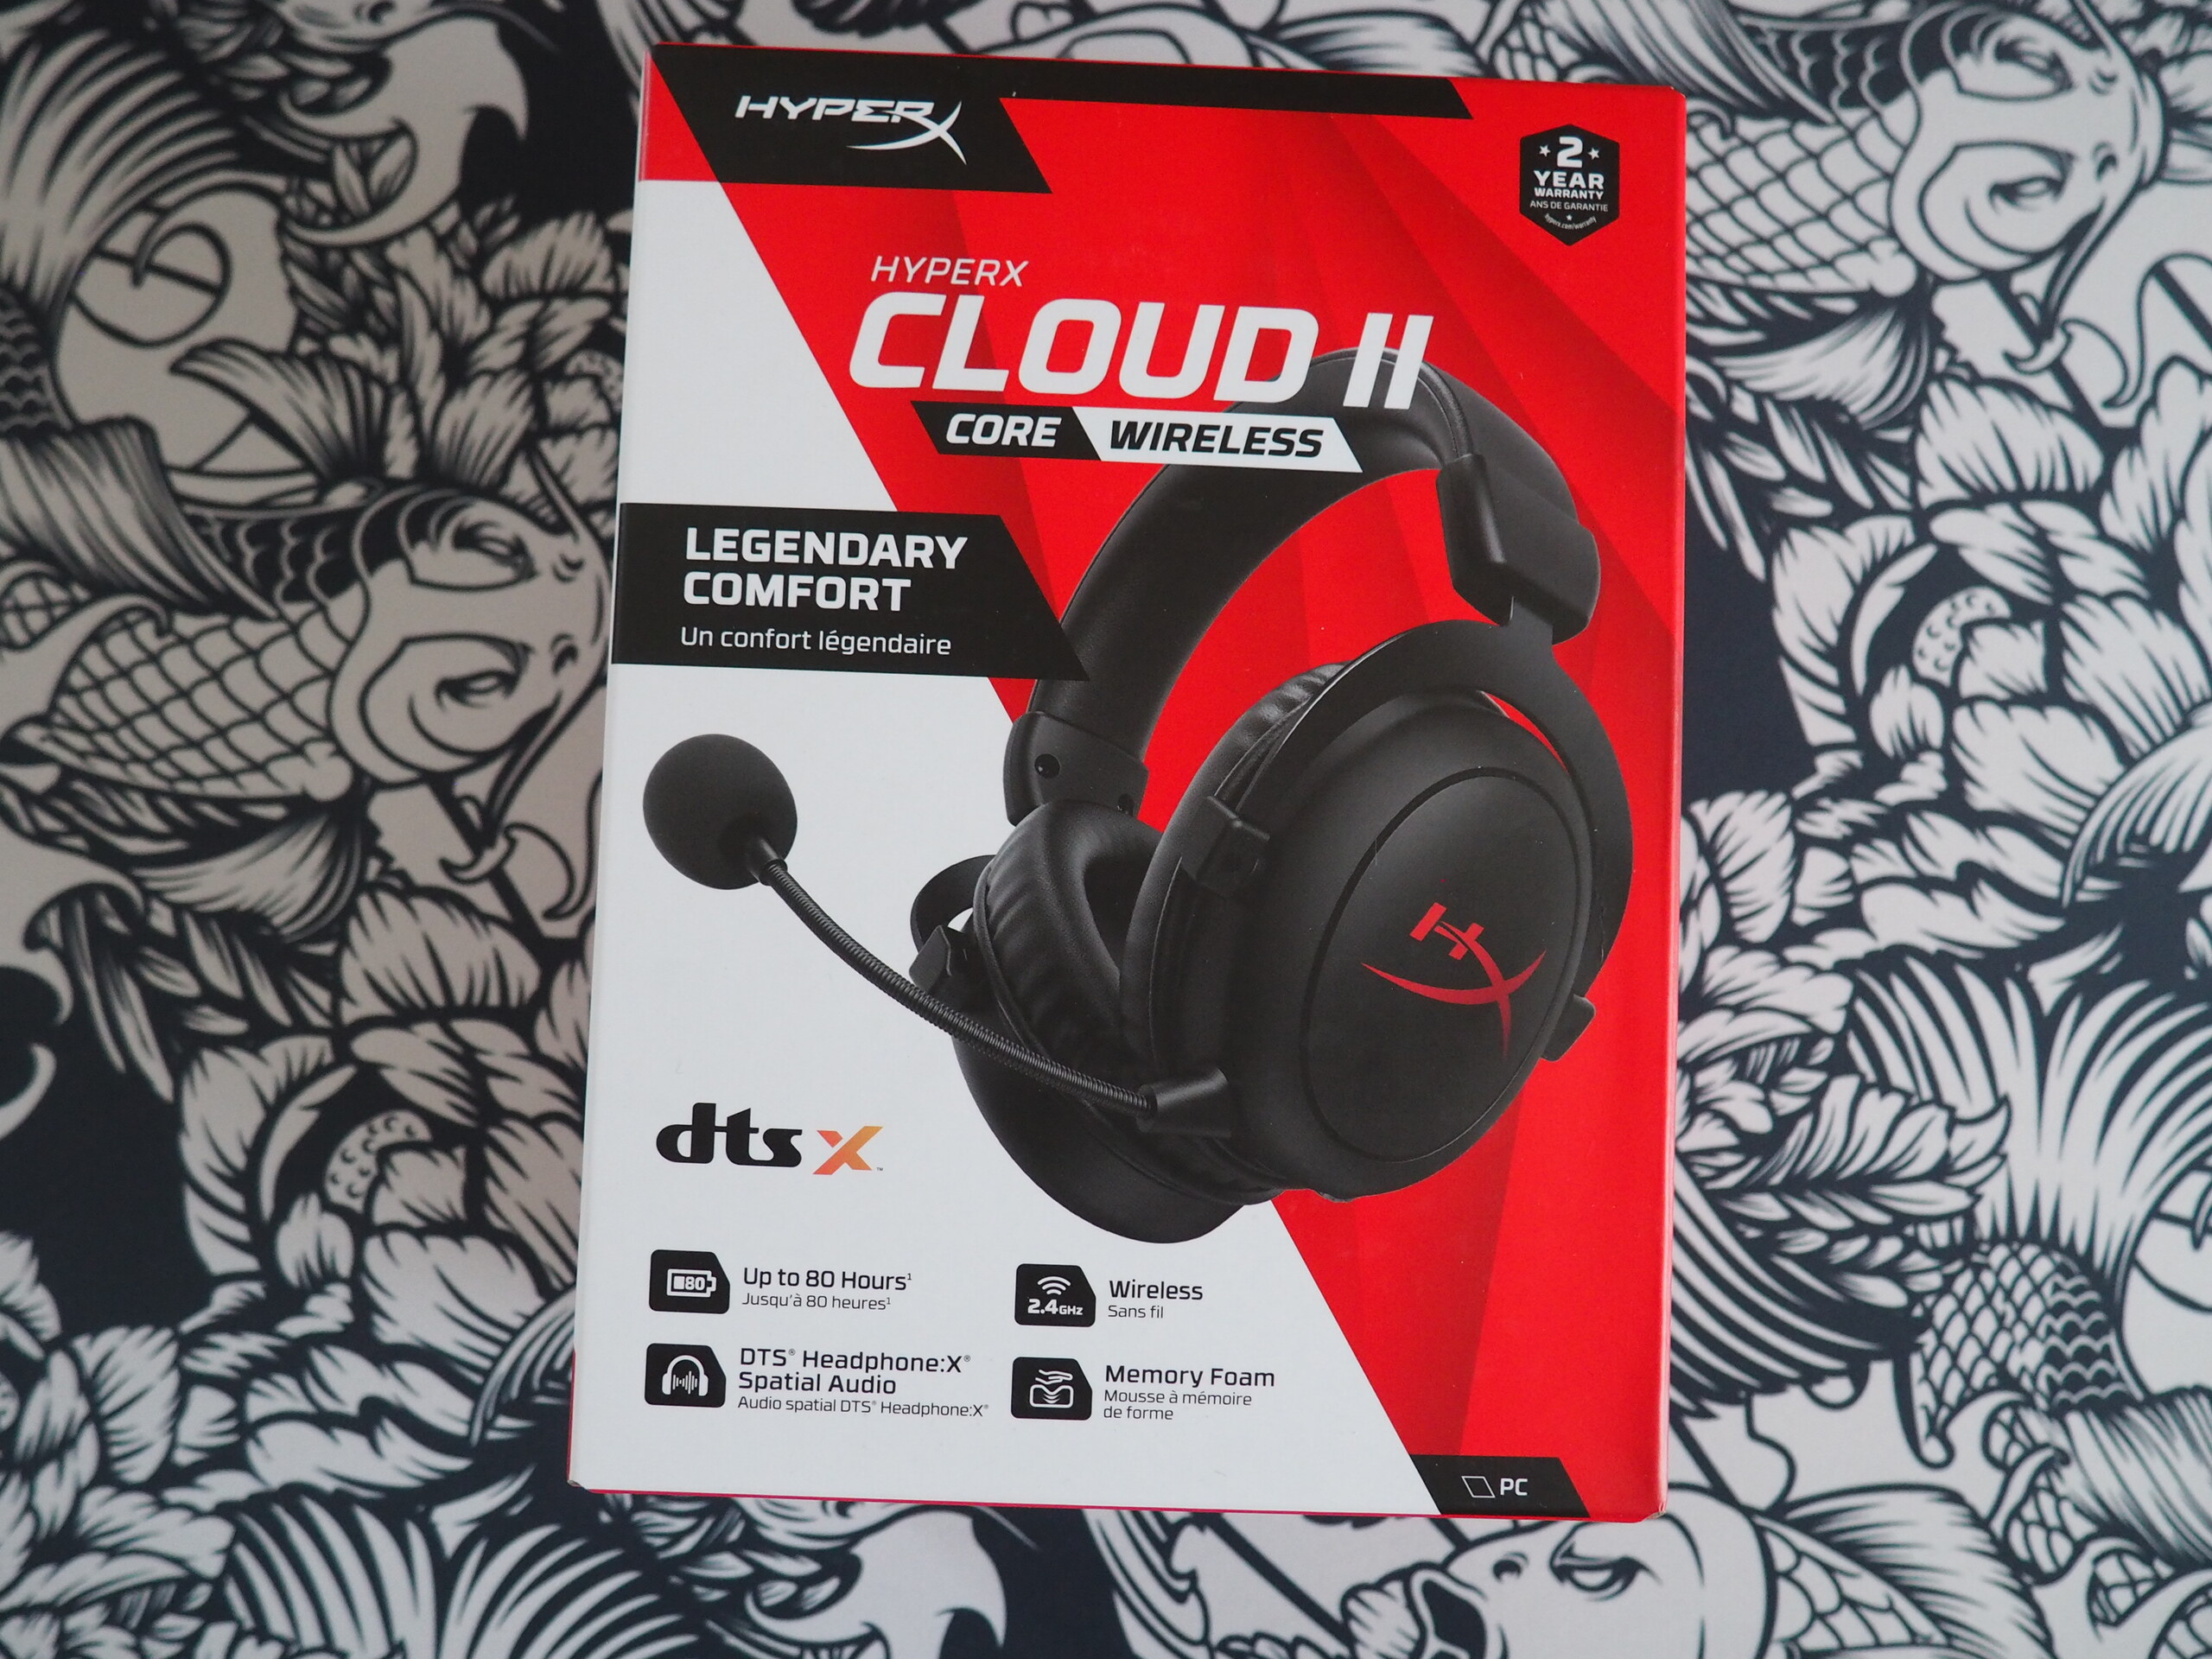
我们的评测设备还配备了 230 瓦超薄电源以及 HyperX 耳机(Cloud II Core 无线耳机)。
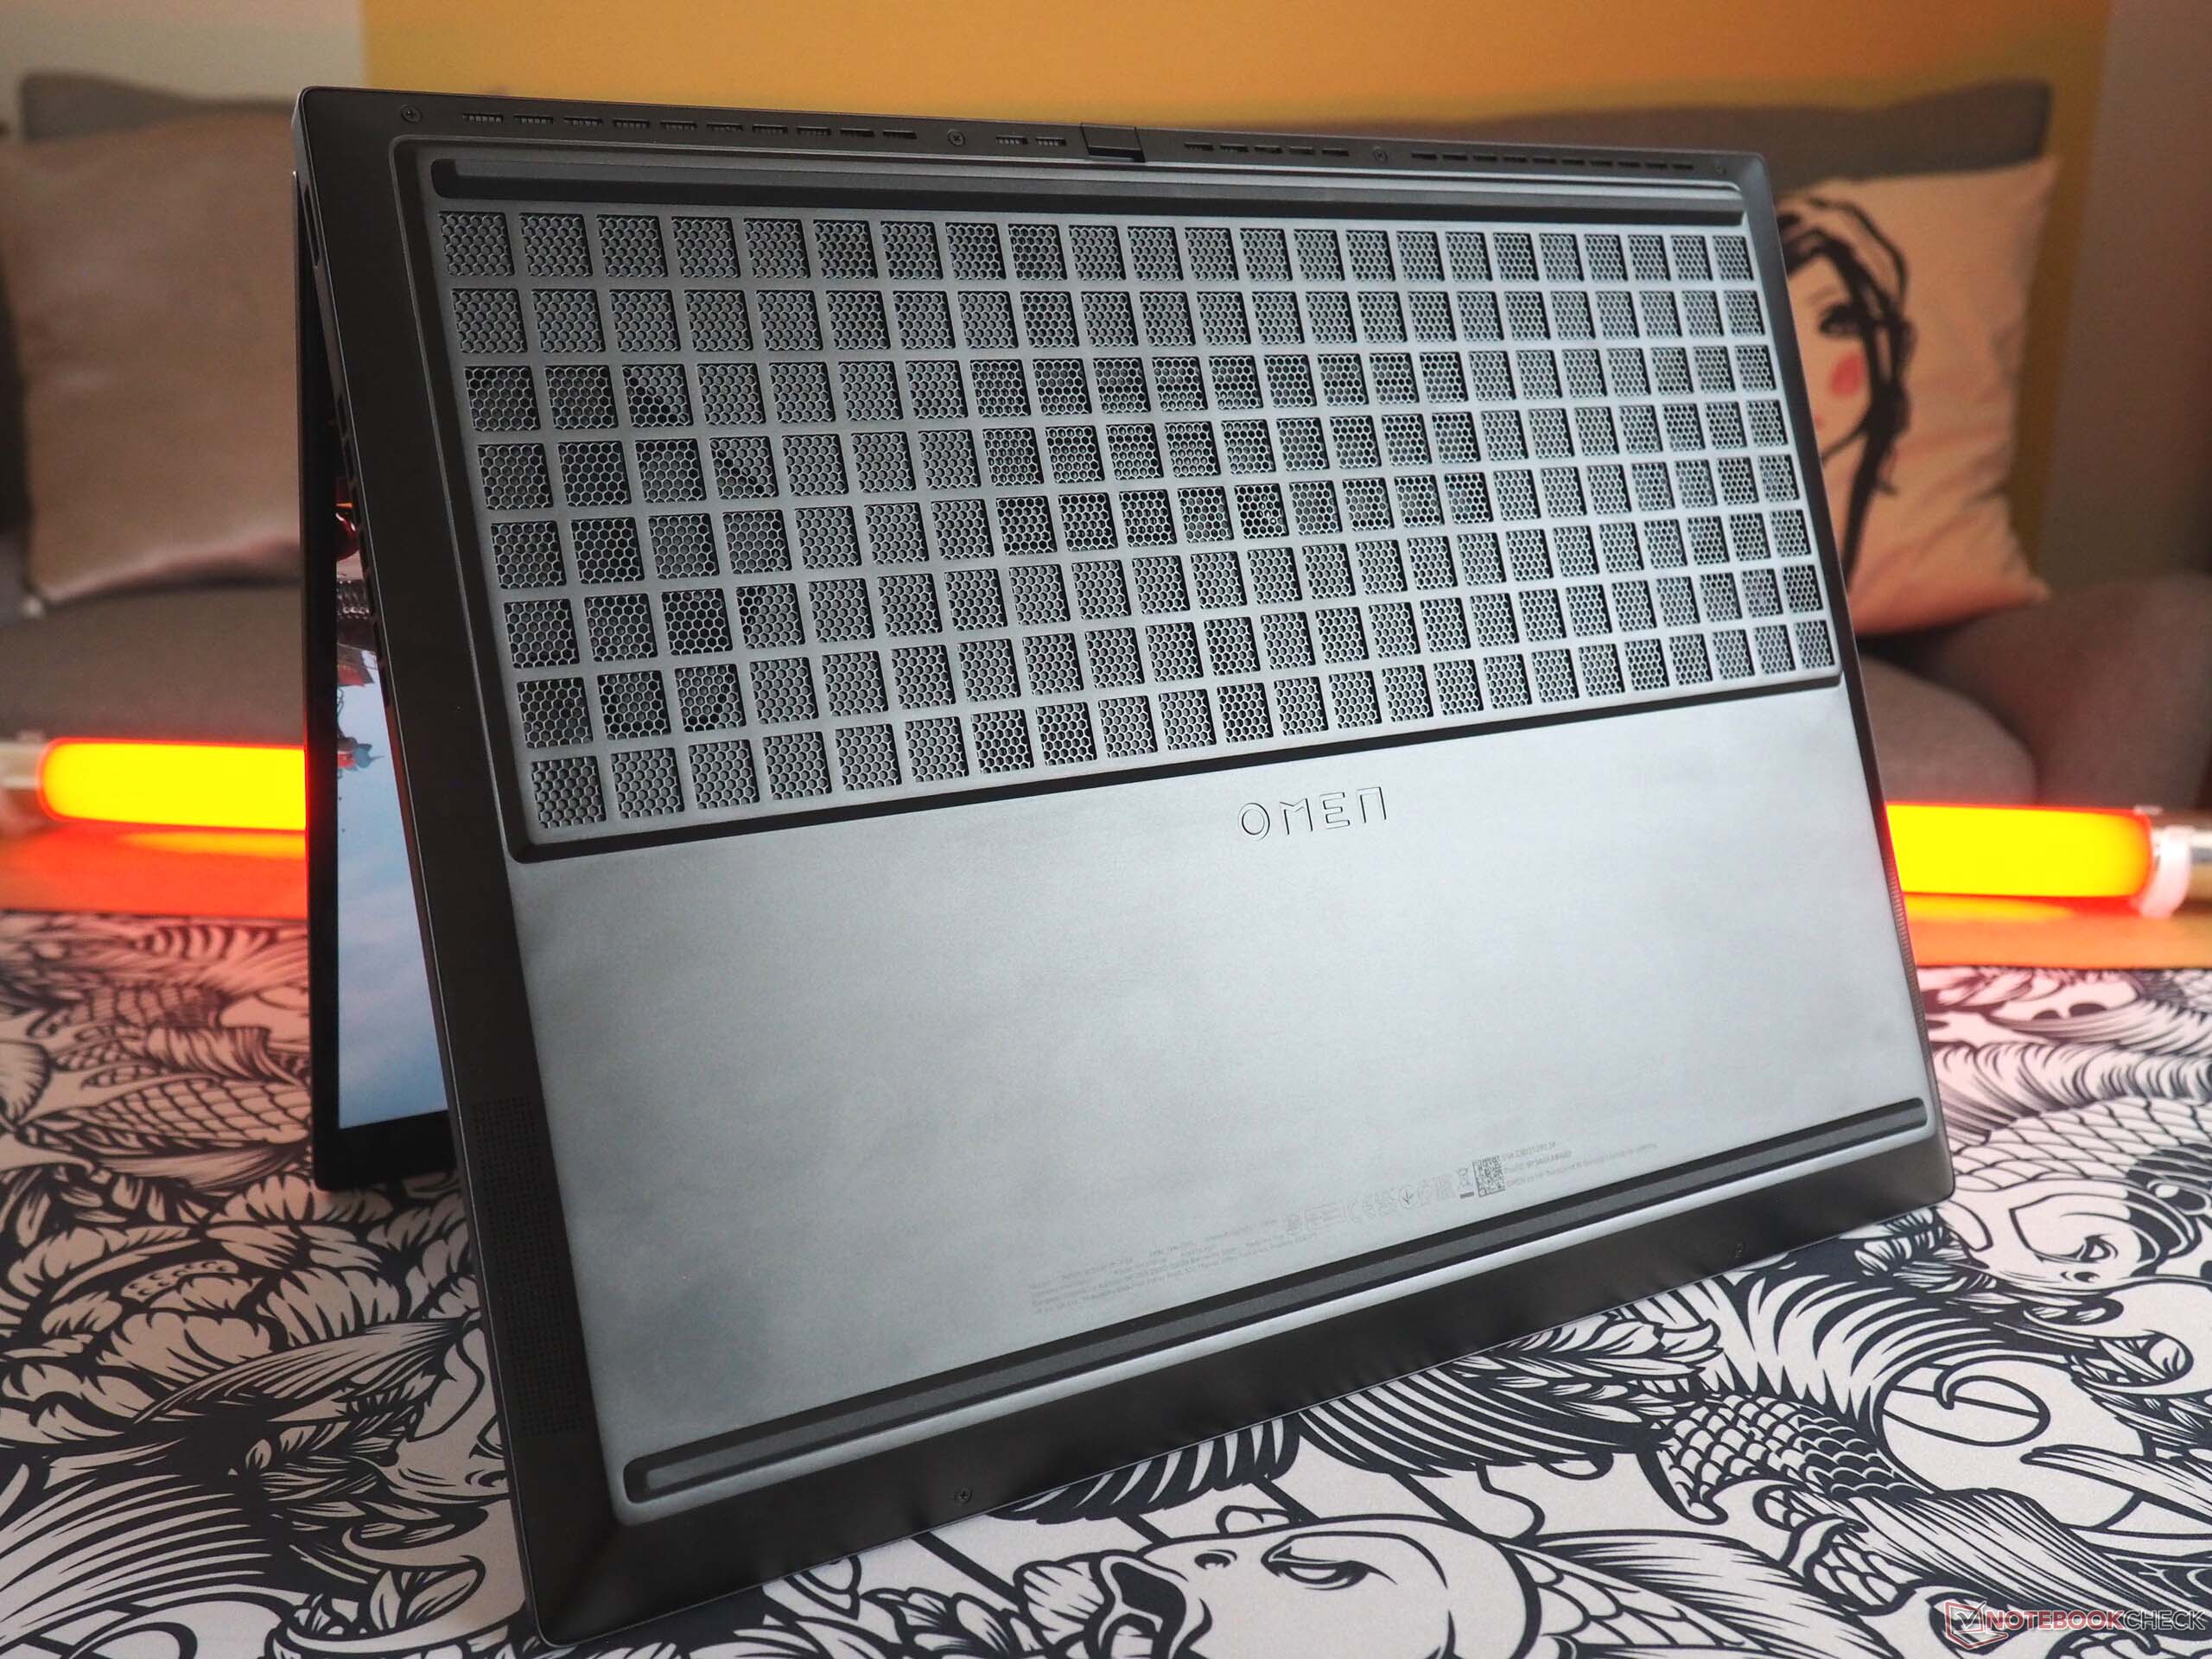
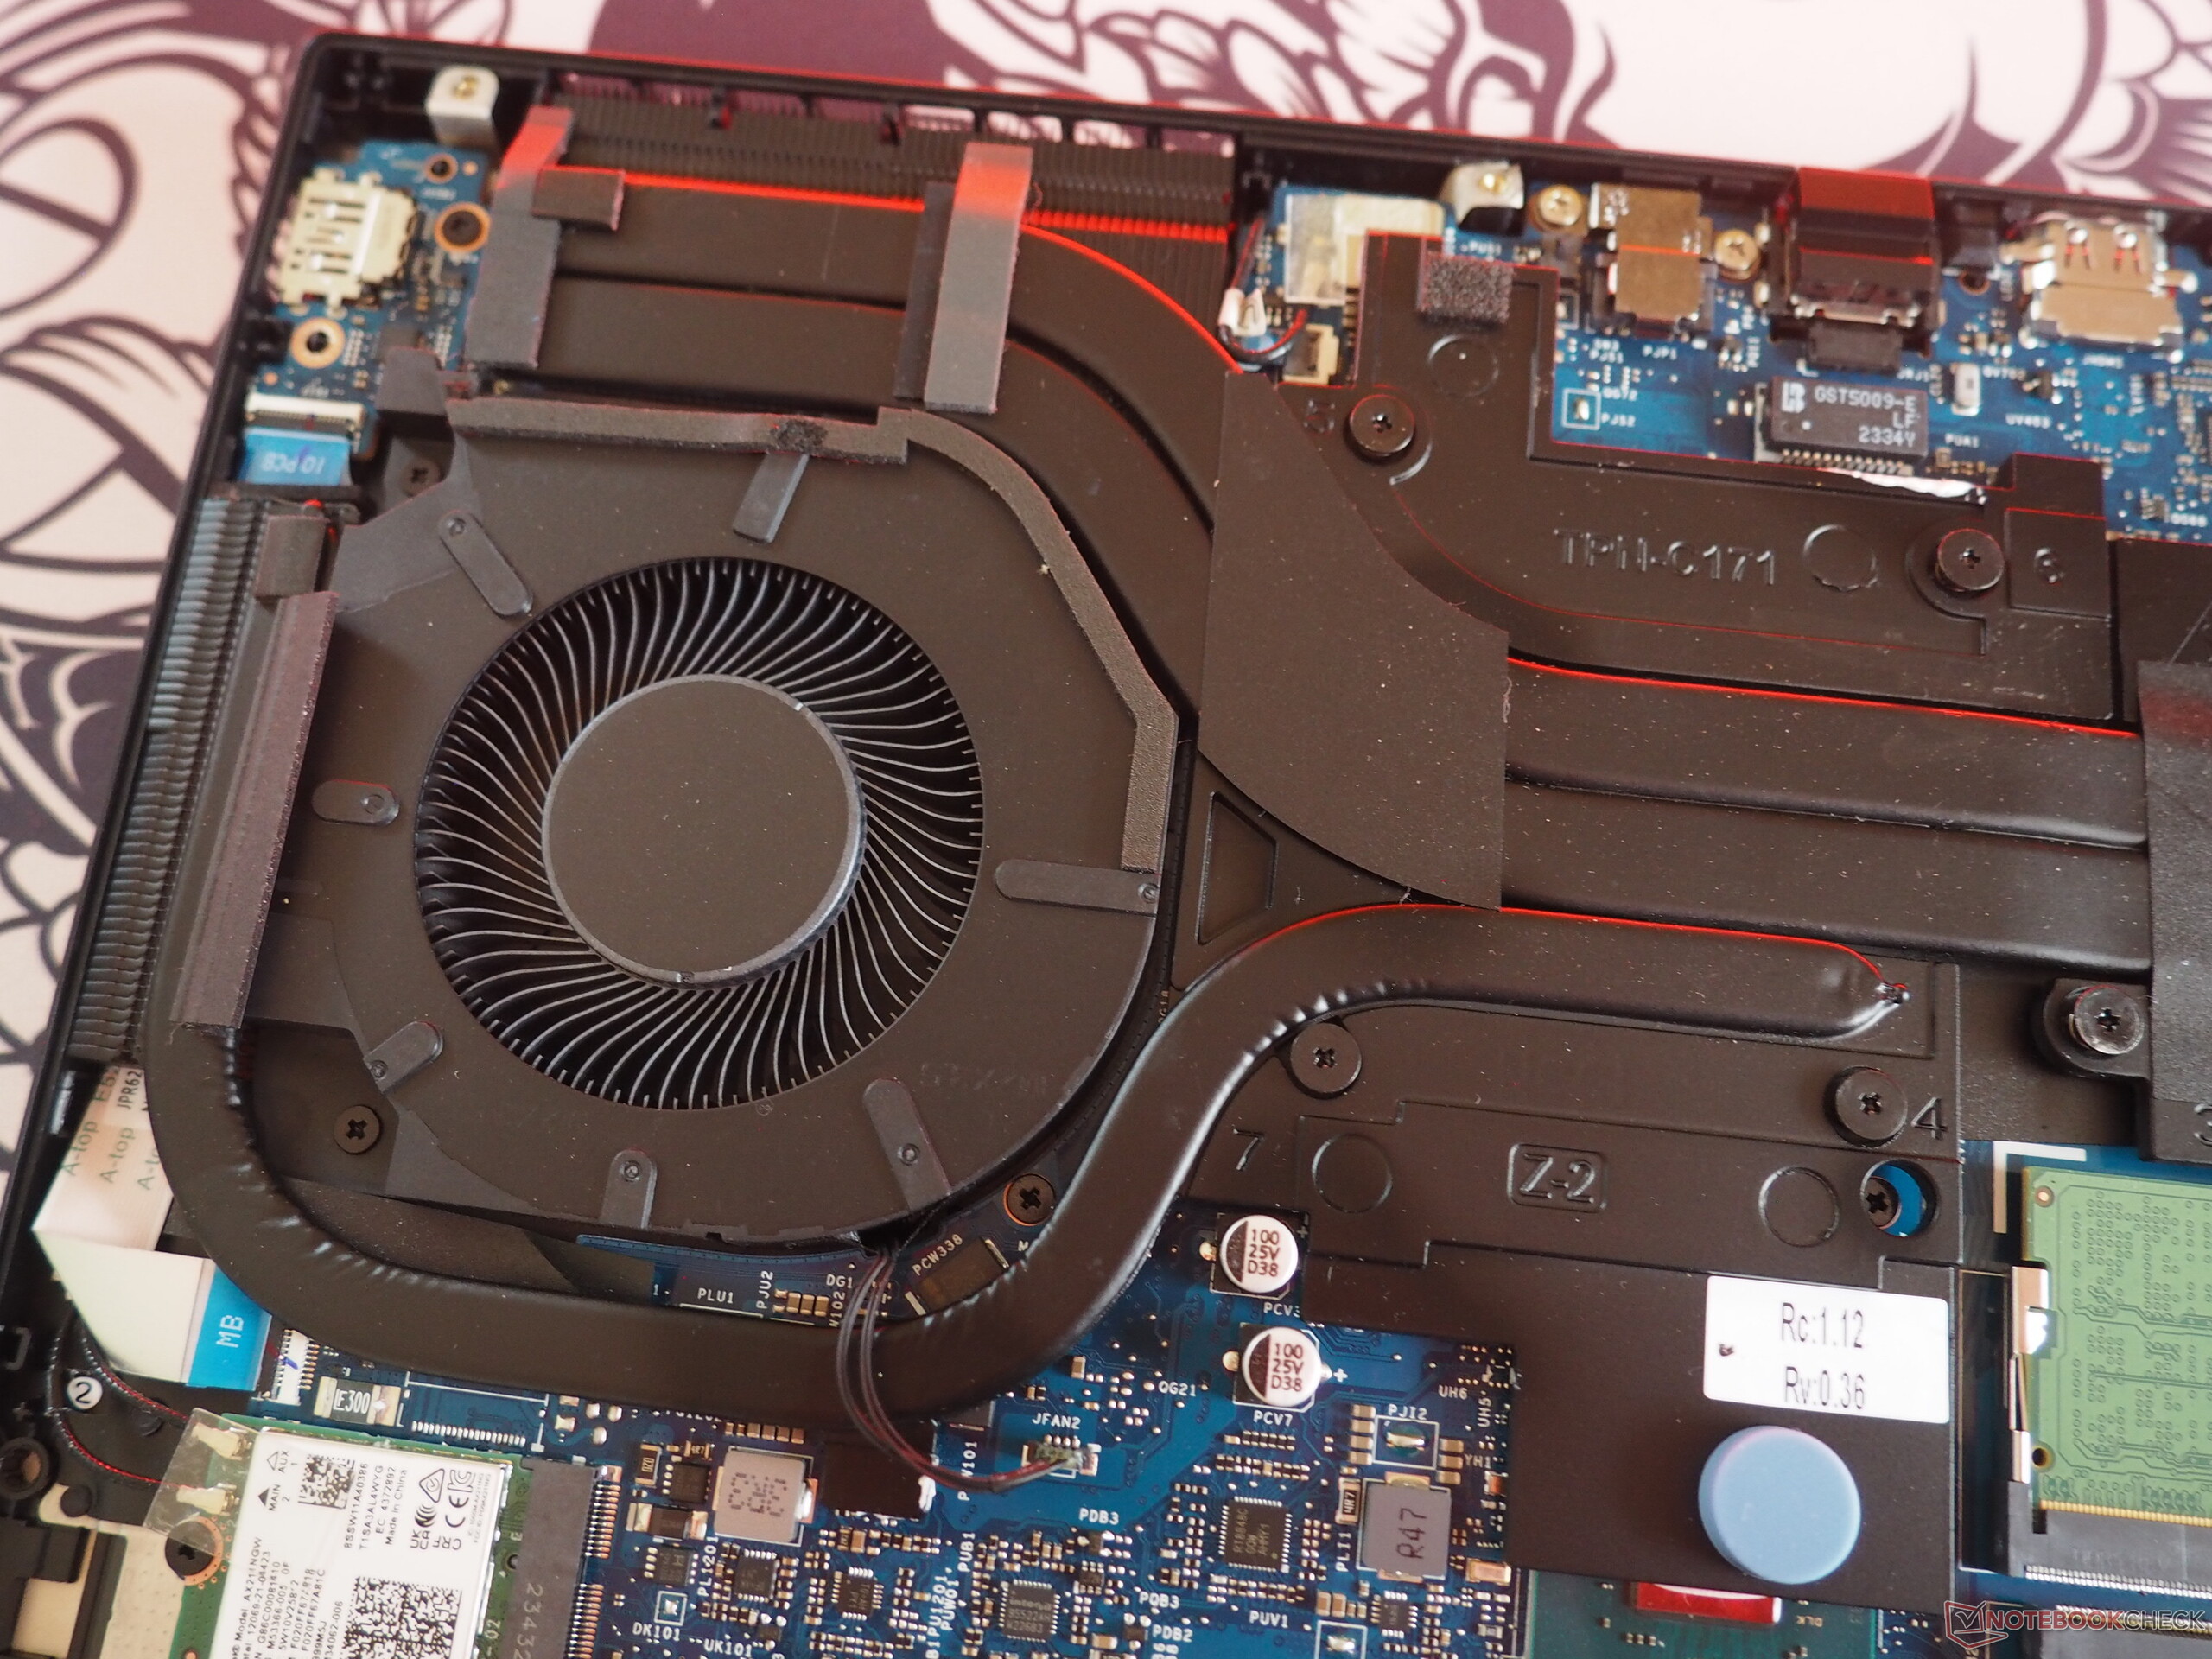
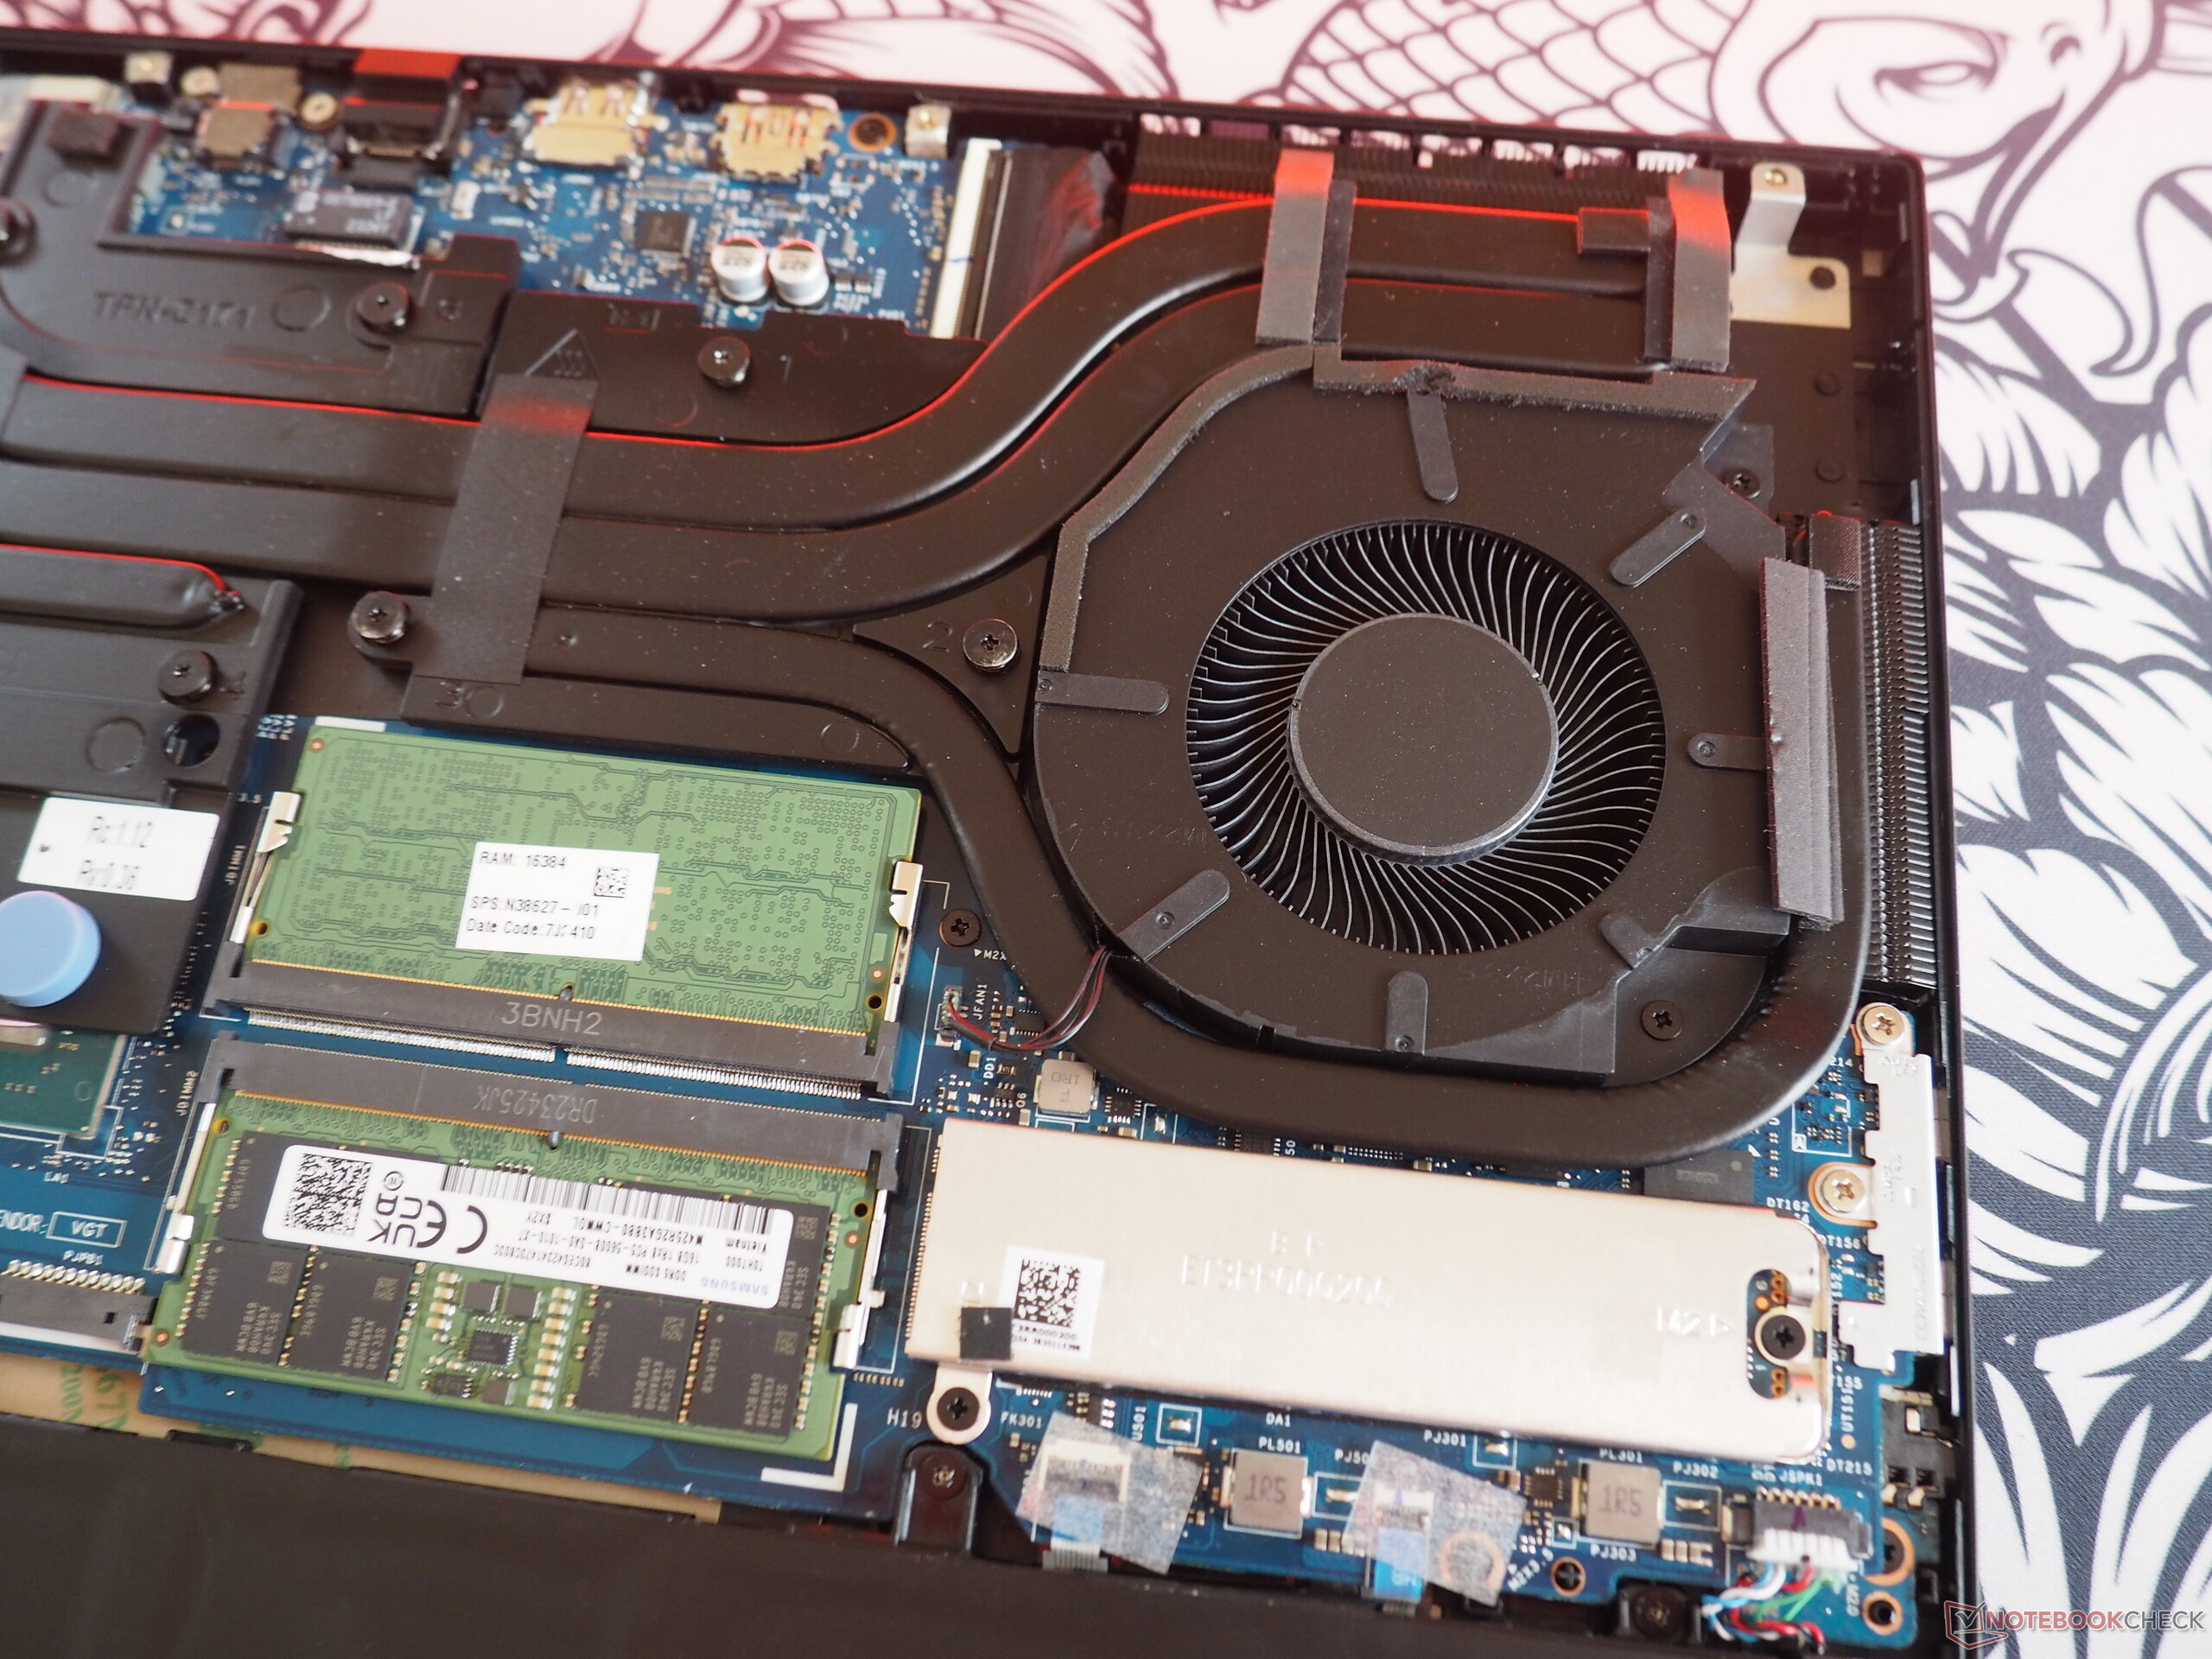
维护
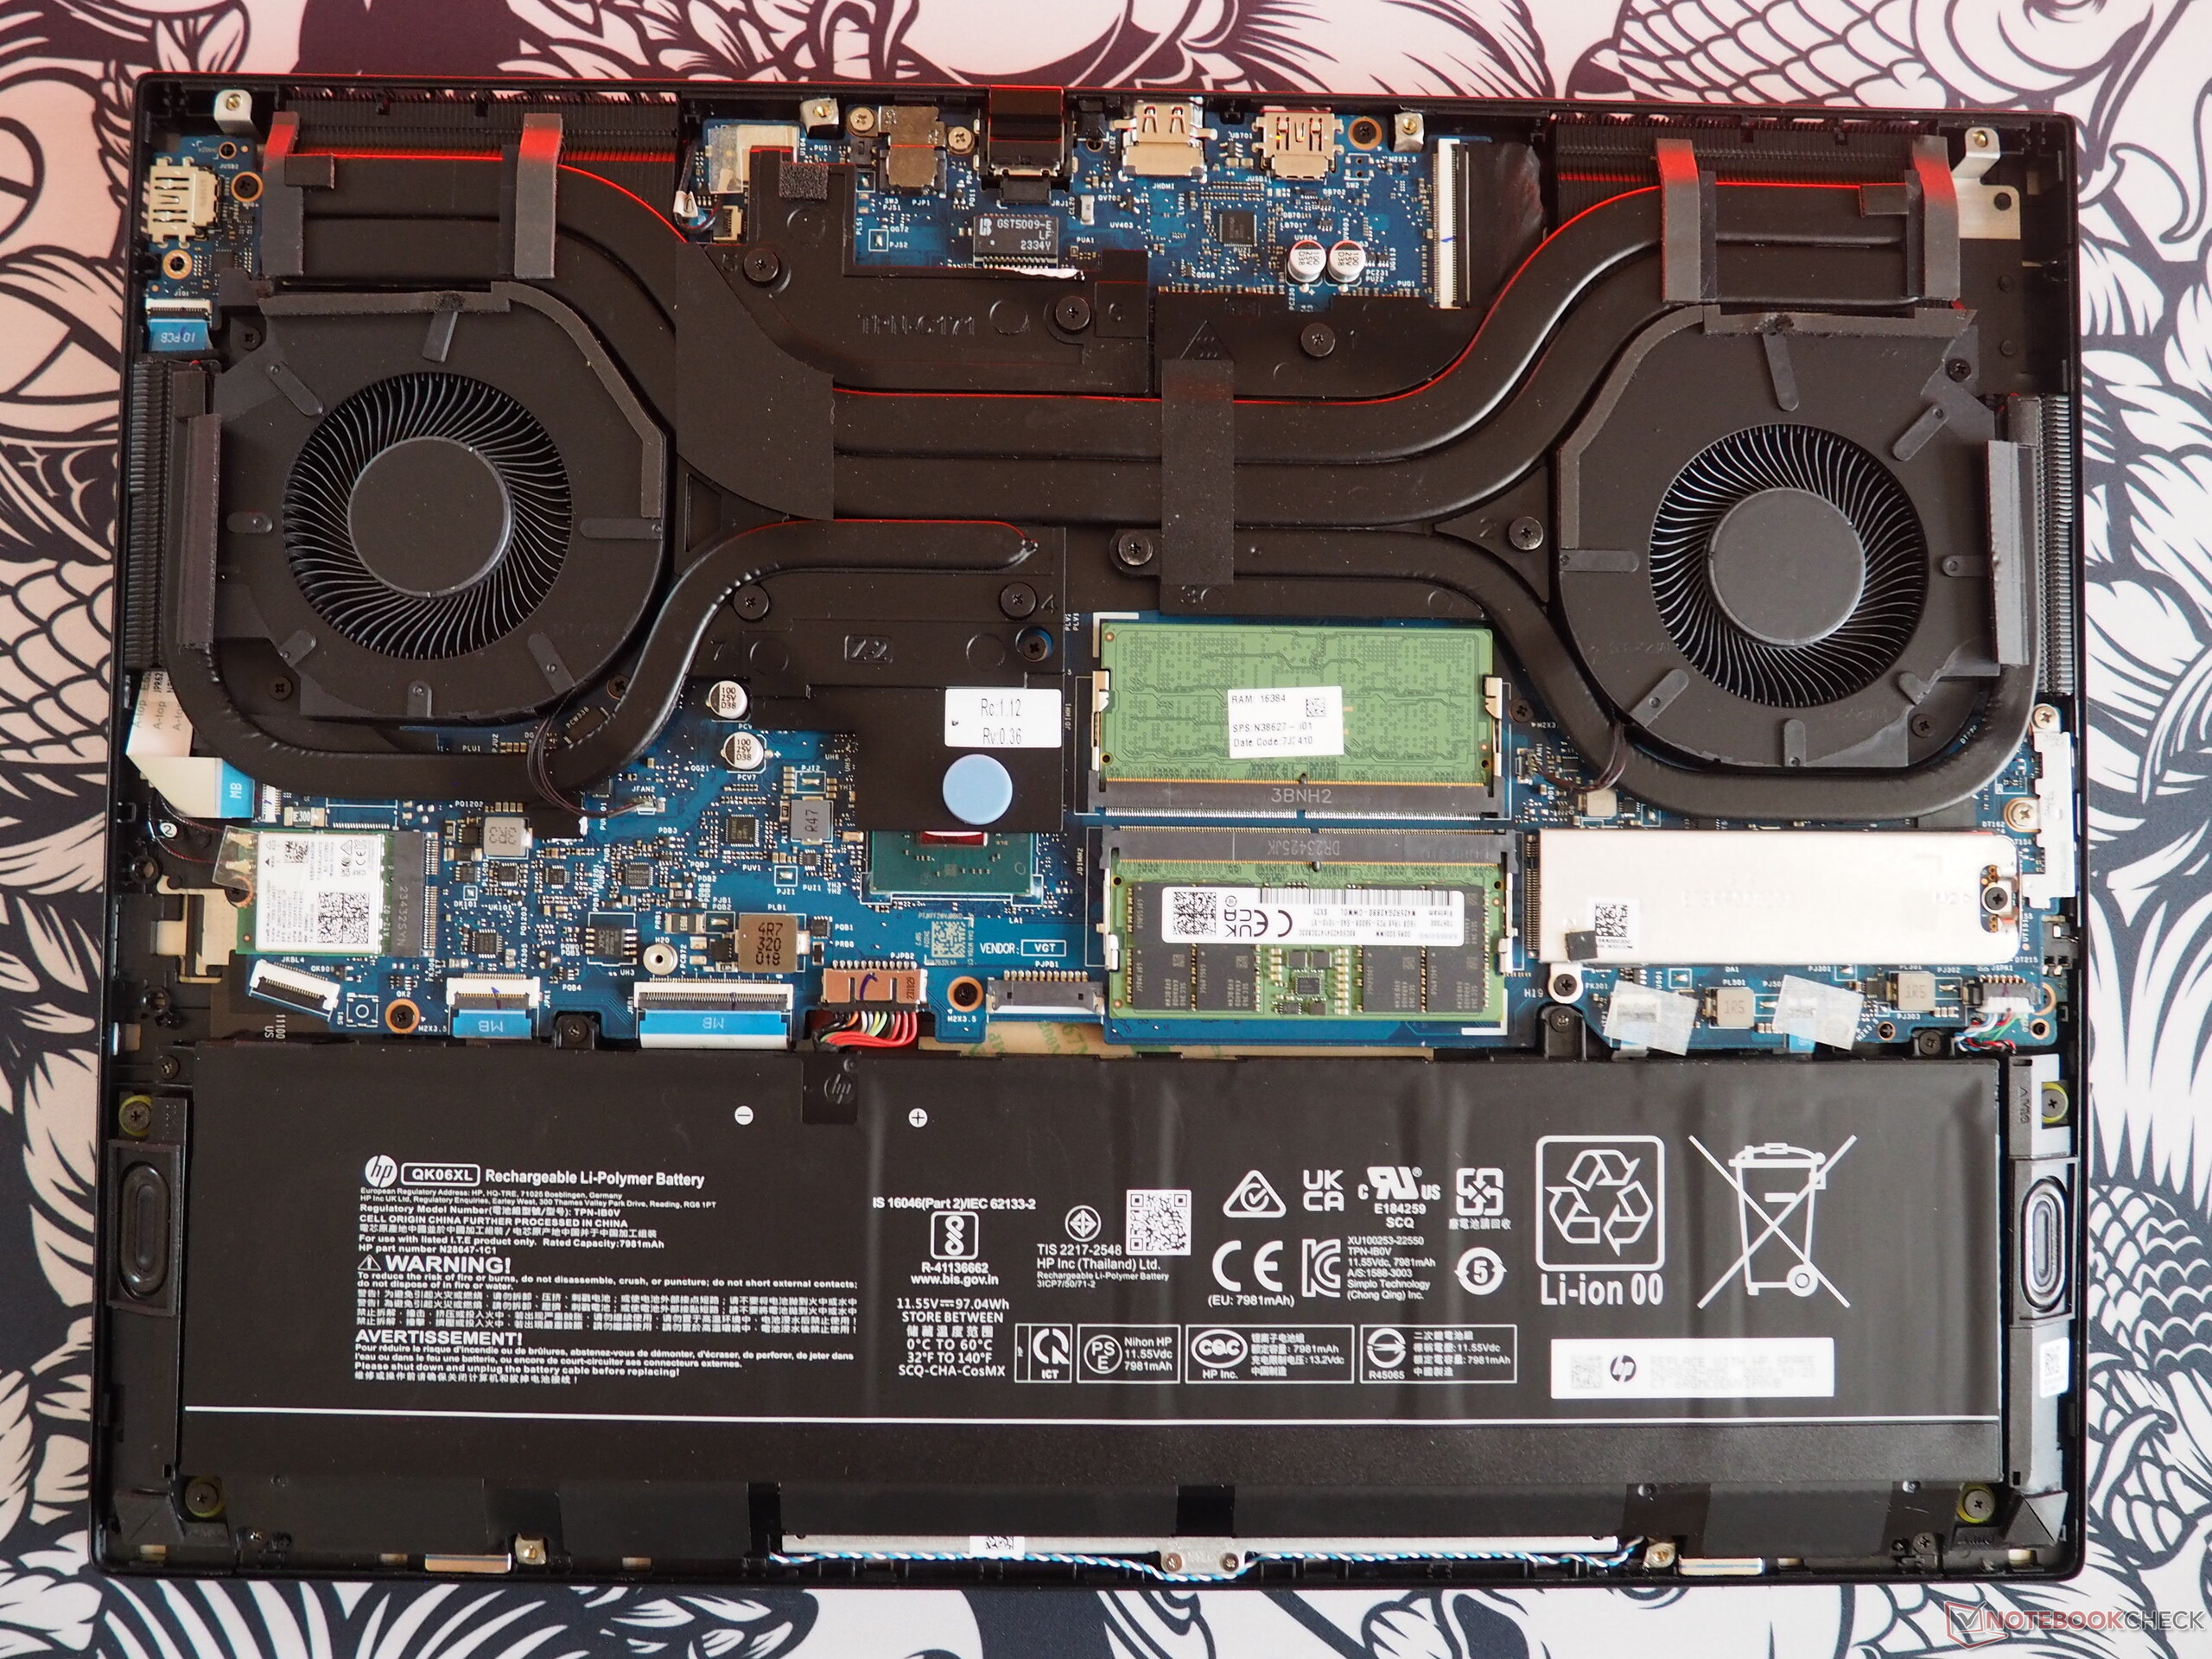
在维护方面,Omen 16 并不复杂。只需拧下六颗小十字螺丝,借助扁平工具即可将底板从固定位置抬起。在设备内部,所有重要组件都可以触及,无论是内存组、电池、M.2 插槽、风扇还是无线模块。
保修
保修期为 24 个月。
输入设备
键盘
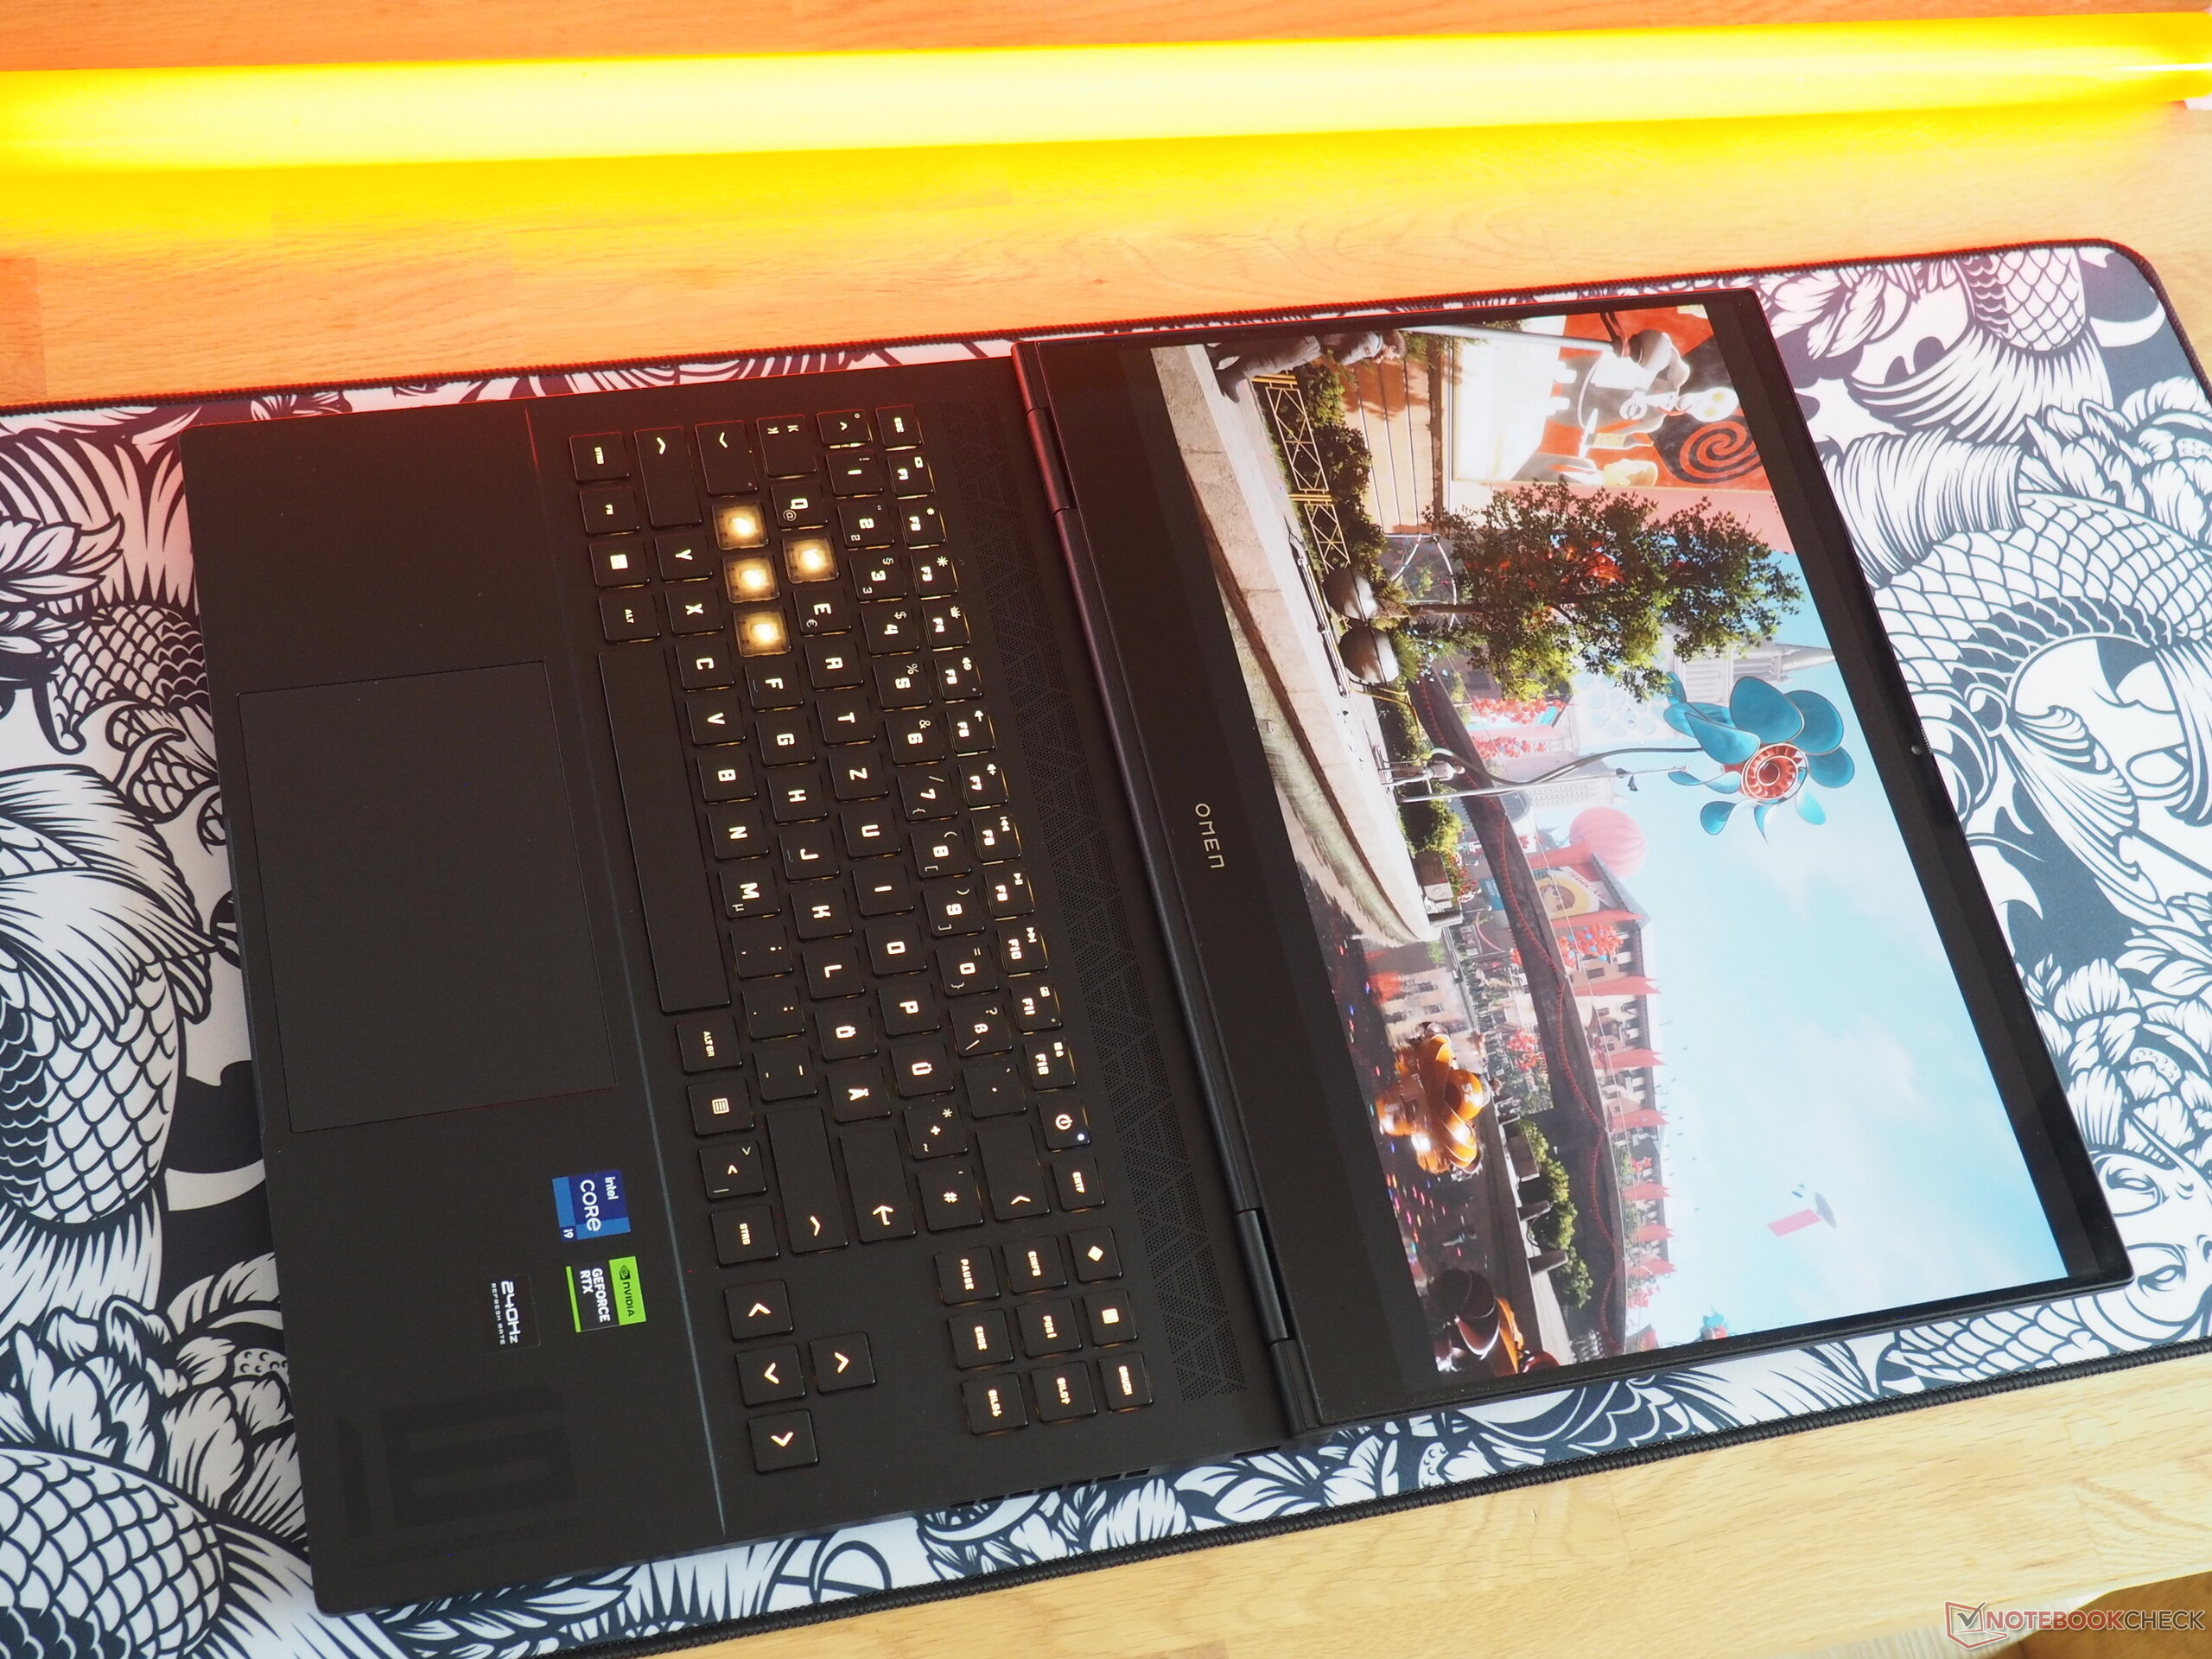
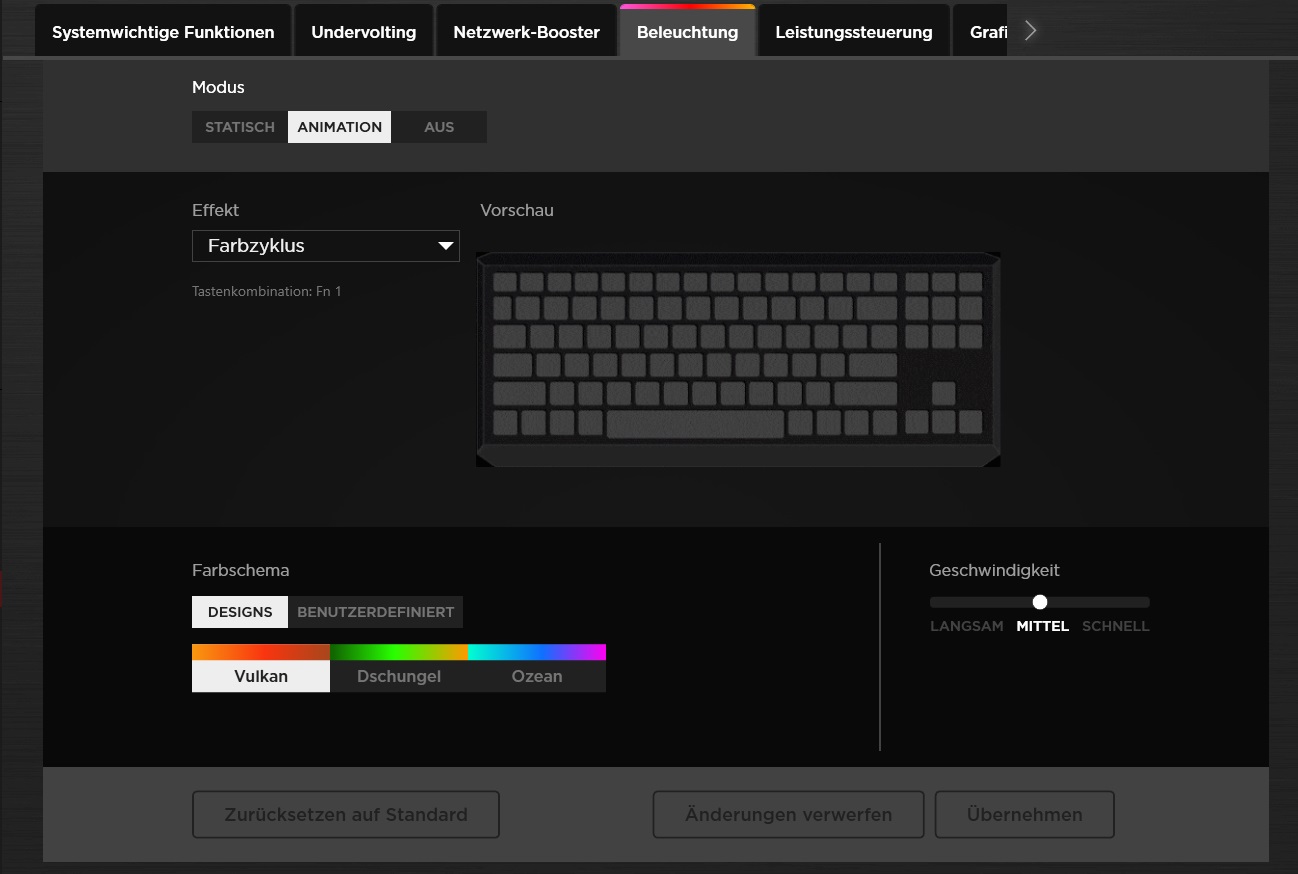
惠普的 WASD 键是透明的,看起来很有游戏玩家的感觉。这种布局非常独特,甚至需要一些时间来适应。制造商没有选择安装数字键盘,而是为这款 16 英寸的设备配备了独立、大小合适的方向键。其他一些决定(例如电源键的位置)确实让人难以理解。打字体验一般,惠普不得不使用机械模式以获得更好的反馈。喜欢背光键的用户可以期待多种颜色。
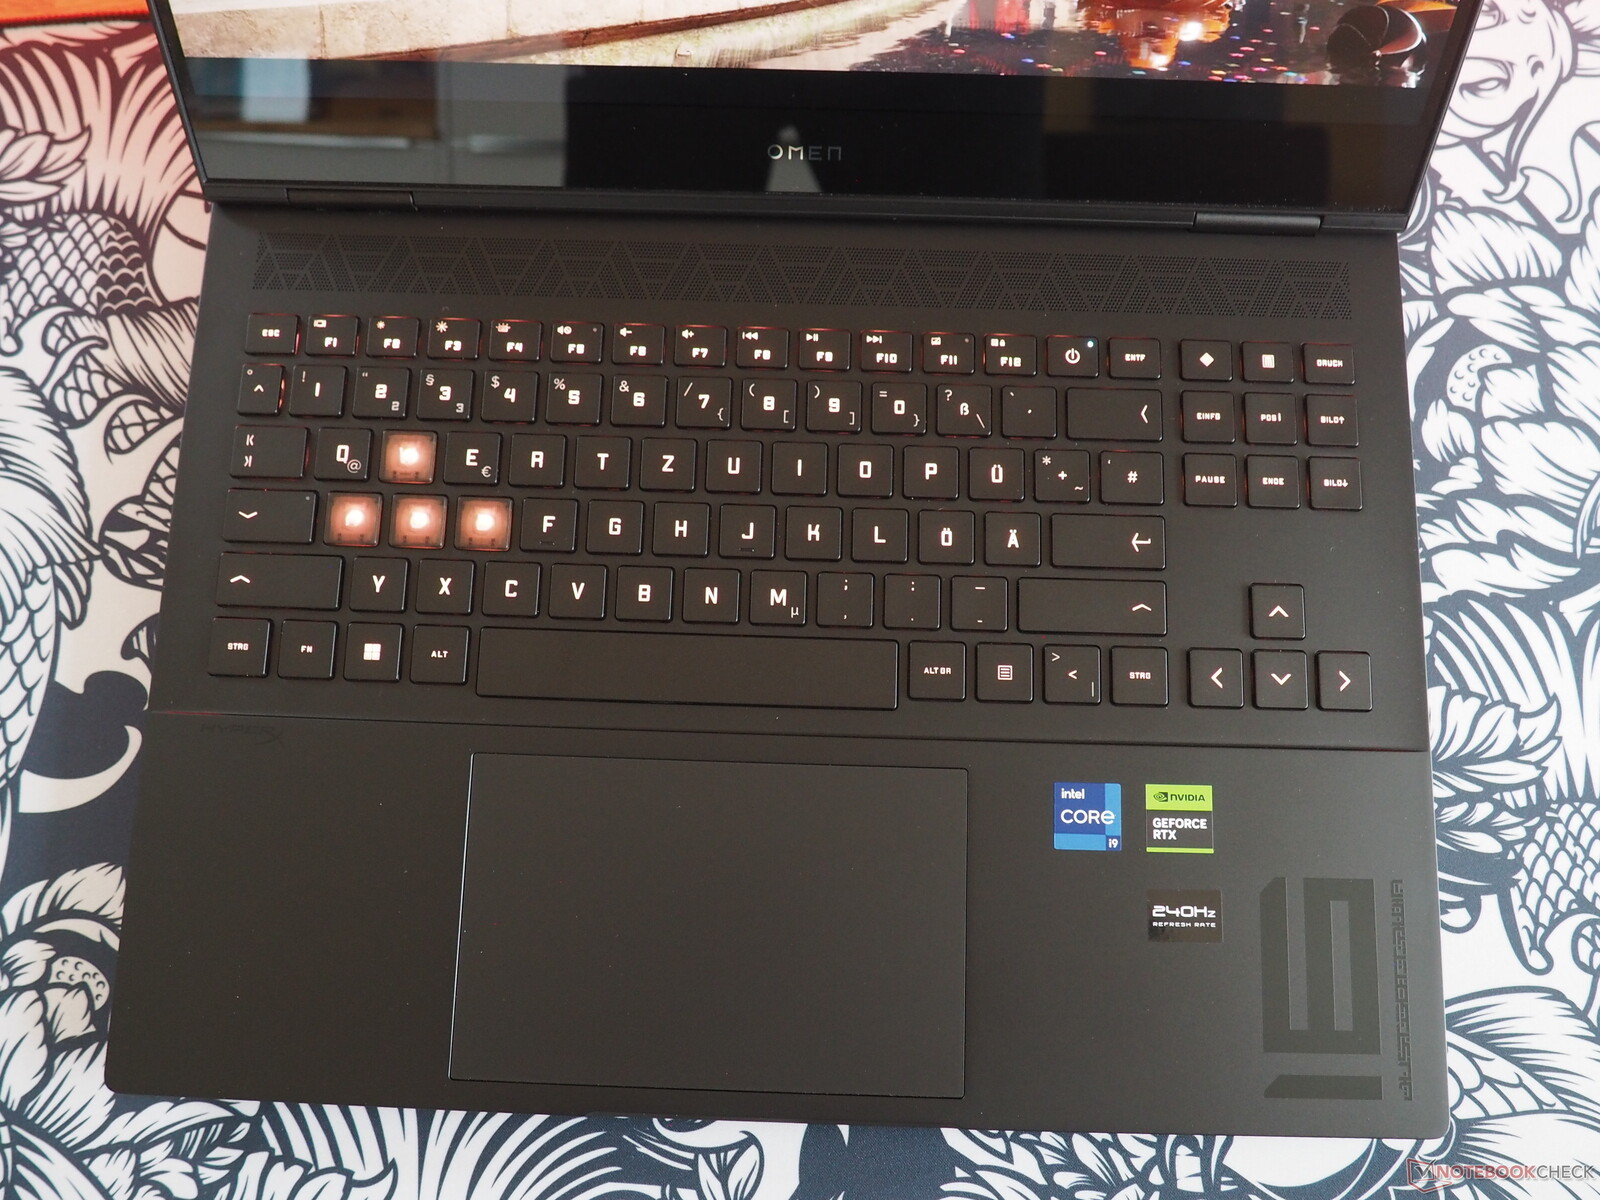
触摸板
触控板的尺寸约为 13.5 x 8.5 厘米,在精确度、流畅度和点击区域方面都不逊色。同样,手势支持也很直观。
显示屏
说到 OLED 面板,众说纷纭。在负面影响方面,存在的几个问题是:表面反光很强(这可能会使户外使用变得困难)、屏幕在任何亮度下都会闪烁以及潜在的烧损问题。
| |||||||||||||||||||||||||
Brightness Distribution: 98 %
Center on Battery: 390 cd/m²
Contrast: 19500:1 (Black: 0.02 cd/m²)
ΔE ColorChecker Calman: 1.94 | ∀{0.5-29.43 Ø4.72}
calibrated: 4.21
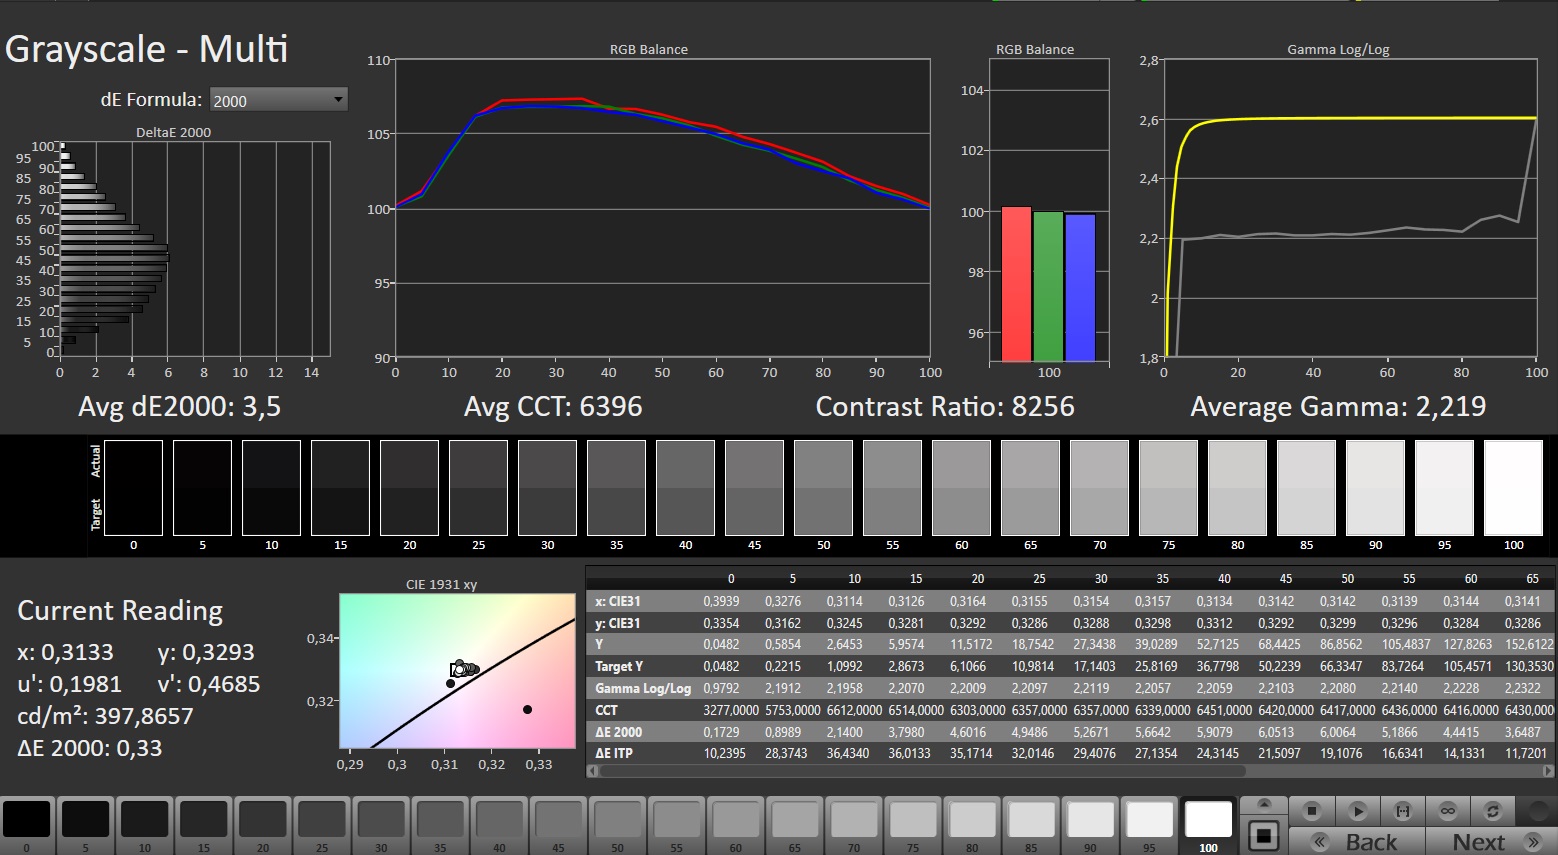
ΔE Greyscale Calman: 1.5 | ∀{0.09-98 Ø4.97}
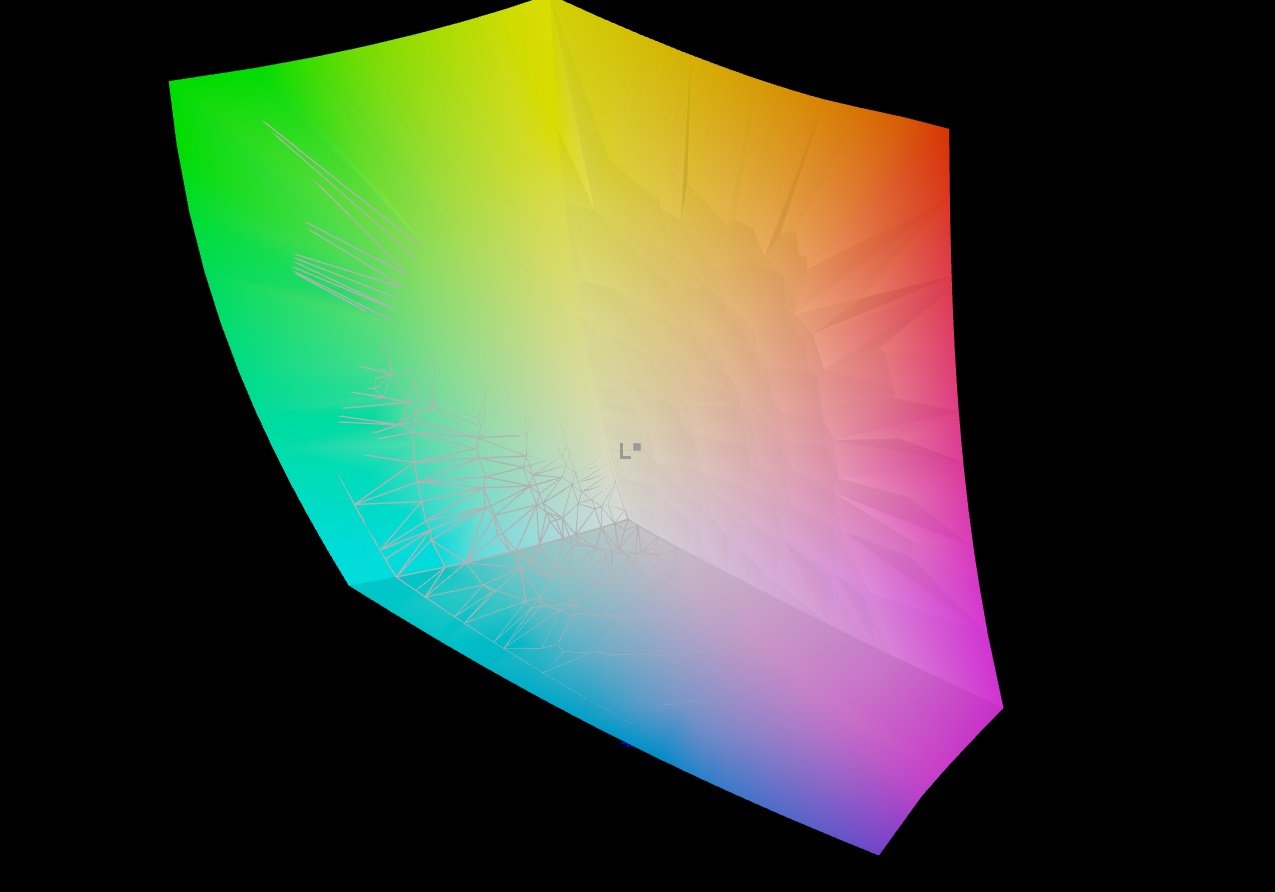
97% AdobeRGB 1998 (Argyll 3D)
100% sRGB (Argyll 3D)
99.8% Display P3 (Argyll 3D)
Gamma: 2.221
CCT: 6395 K
| HP Omen Transcend 16-u1095ng ATNA60DL02-0 (SDC41A4), OLED, 2560x1600, 16" | HP Omen Transcend 16 AUOA3A6, Mini-LED, 2560x1600, 16" | Asus ROG Zephyrus G16 2024 GU605M ATNA60DL01-0, OLED, 2560x1600, 16" | Schenker XMG CORE 16 (L23) BOE0AF0 (), IPS, 2560x1600, 16" | Lenovo Legion Pro 5 16ARX8 CSOT T3 MNG007DA1-Q, IPS, 2560x1600, 16" | |
|---|---|---|---|---|---|
| Display | -4% | 0% | -20% | -18% | |
| Display P3 Coverage (%) | 99.8 | 99.2 -1% | 99.9 0% | 68.3 -32% | 70.4 -29% |
| sRGB Coverage (%) | 100 | 100 0% | 100 0% | 98.6 -1% | 99.6 0% |
| AdobeRGB 1998 Coverage (%) | 97 | 87.6 -10% | 96.9 0% | 69.6 -28% | 72.6 -25% |
| Response Times | -13550% | -18% | -4850% | -3925% | |
| Response Time Grey 50% / Grey 80% * (ms) | 0.2 ? | 26.4 ? -13100% | 0.22 ? -10% | 13.2 ? -6500% | 7 ? -3400% |
| Response Time Black / White * (ms) | 0.2 ? | 28.2 ? -14000% | 0.25 ? -25% | 6.6 ? -3200% | 9.1 ? -4450% |
| PWM Frequency (Hz) | 120 ? | 3506 ? | 960 ? | ||
| Screen | -47% | 0% | -203% | -161% | |
| Brightness middle (cd/m²) | 390 | 791.1 103% | 416 7% | 376 -4% | 355.3 -9% |
| Brightness (cd/m²) | 392 | 800 104% | 418 7% | 358 -9% | 340 -13% |
| Brightness Distribution (%) | 98 | 95 -3% | 96 -2% | 88 -10% | 91 -7% |
| Black Level * (cd/m²) | 0.02 | 0.04 -100% | 0.33 -1550% | 0.32 -1500% | |
| Contrast (:1) | 19500 | 19778 1% | 1139 -94% | 1110 -94% | |
| Colorchecker dE 2000 * | 1.94 | 4.37 -125% | 1.6 18% | 2.74 -41% | 1.13 42% |
| Colorchecker dE 2000 max. * | 4.26 | 10.39 -144% | 2.1 51% | 6.78 -59% | 2.78 35% |
| Colorchecker dE 2000 calibrated * | 4.21 | 1.04 75% | 0.88 79% | 0.32 92% | |
| Greyscale dE 2000 * | 1.5 | 6.5 -333% | 2.7 -80% | 3.57 -138% | 1.4 7% |
| Gamma | 2.221 99% | 2.28 96% | 2.16 102% | 2.4 92% | 2.24 98% |
| CCT | 6395 102% | 6000 108% | 6331 103% | 7246 90% | 6372 102% |
| Total Average (Program / Settings) | -4534% /
-1967% | -6% /
-3% | -1691% /
-828% | -1368% /
-668% |
* ... smaller is better
作为回报,OLED 技术凭借出色的黑度(接近 0.0 cd/m²)获得了极佳的对比度,这是 IPS 面板无法比拟的。视角稳定性也是如此。
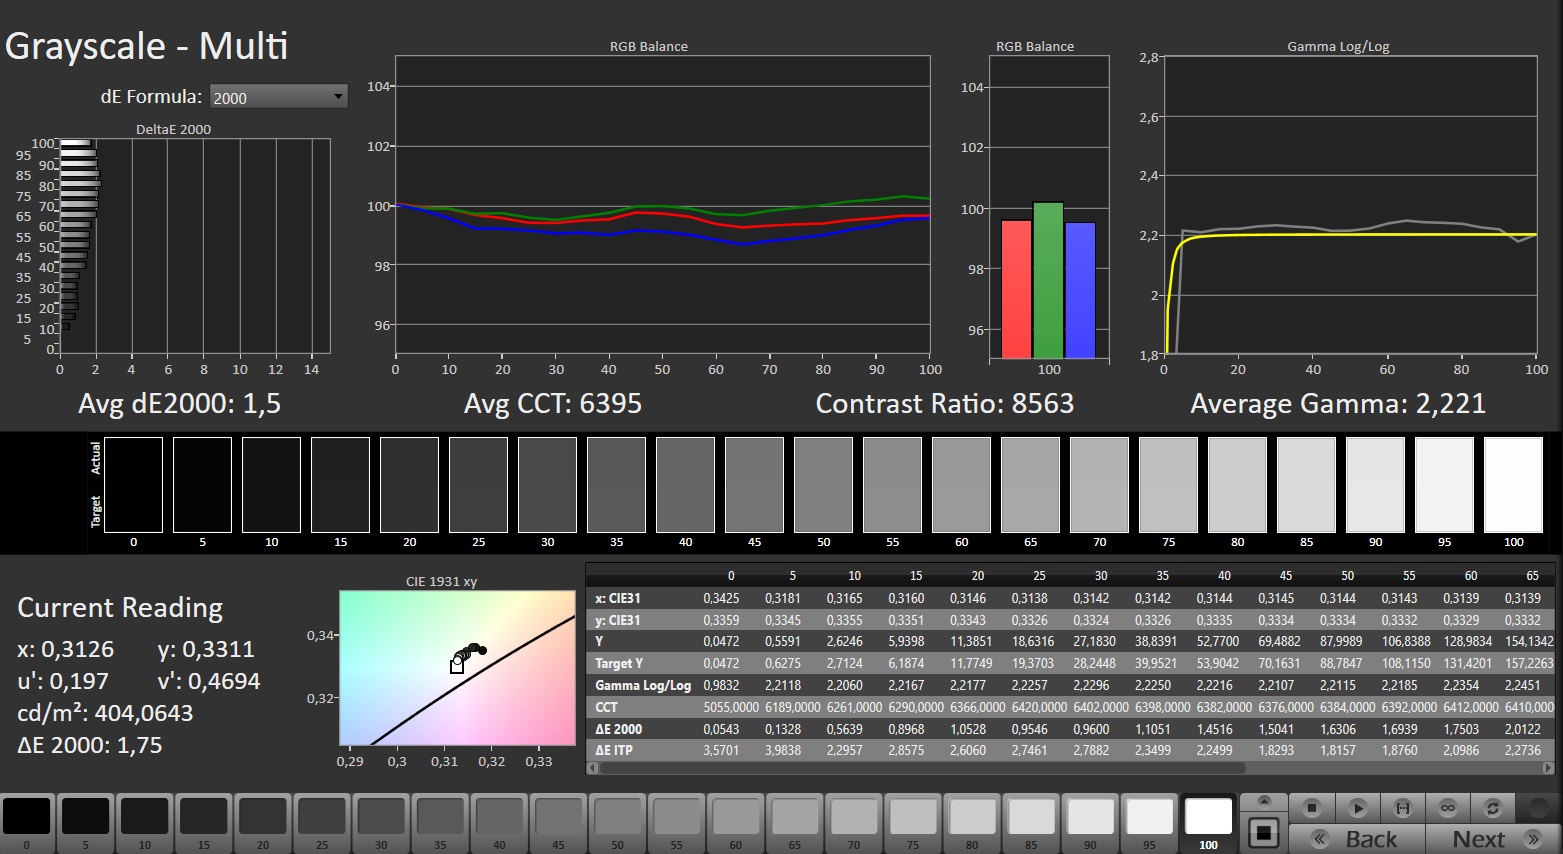
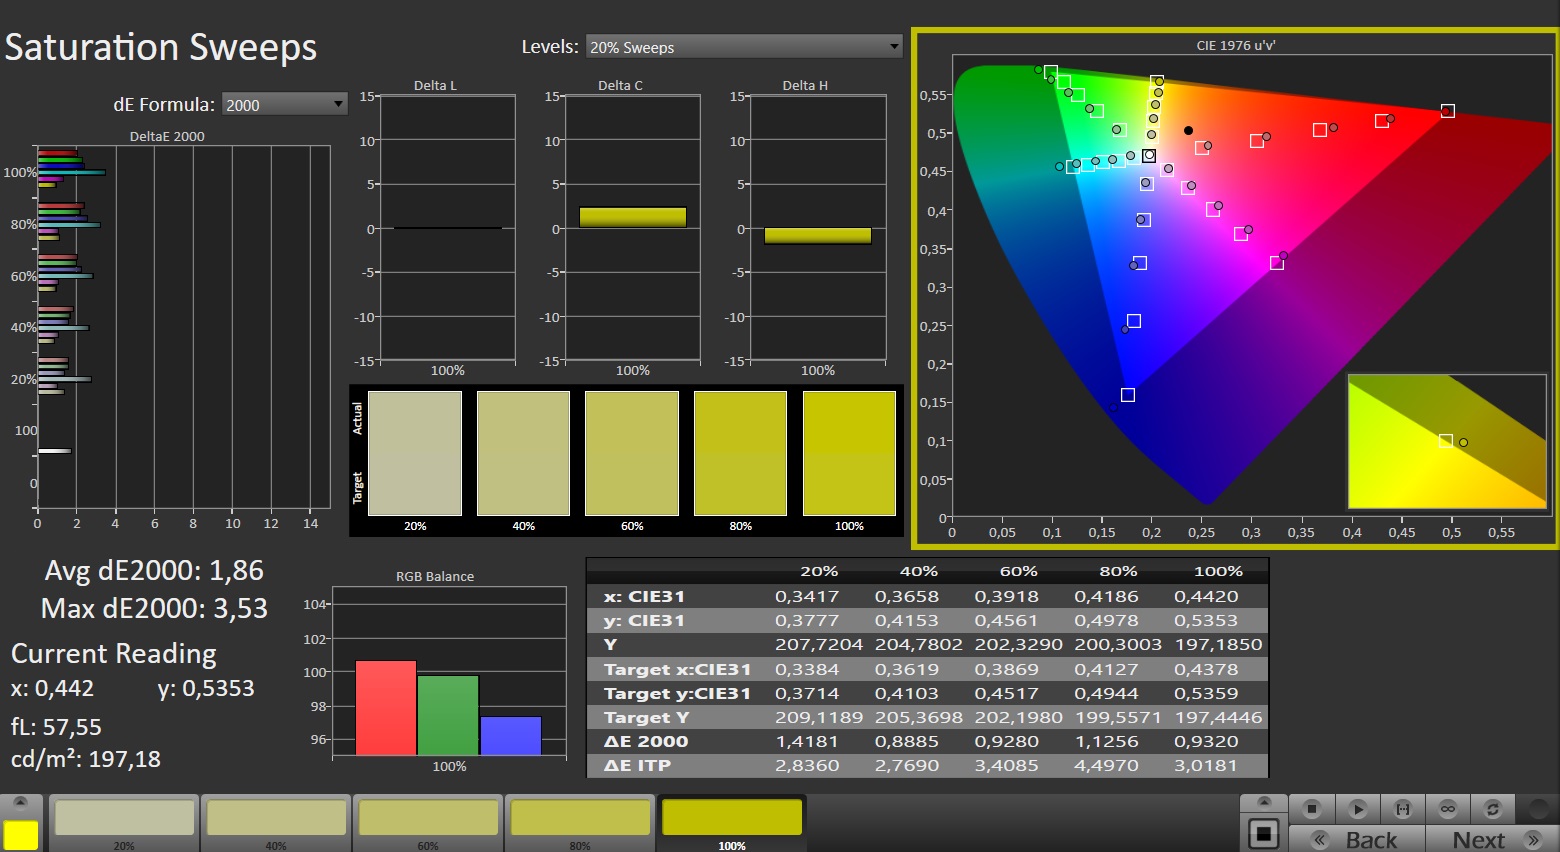
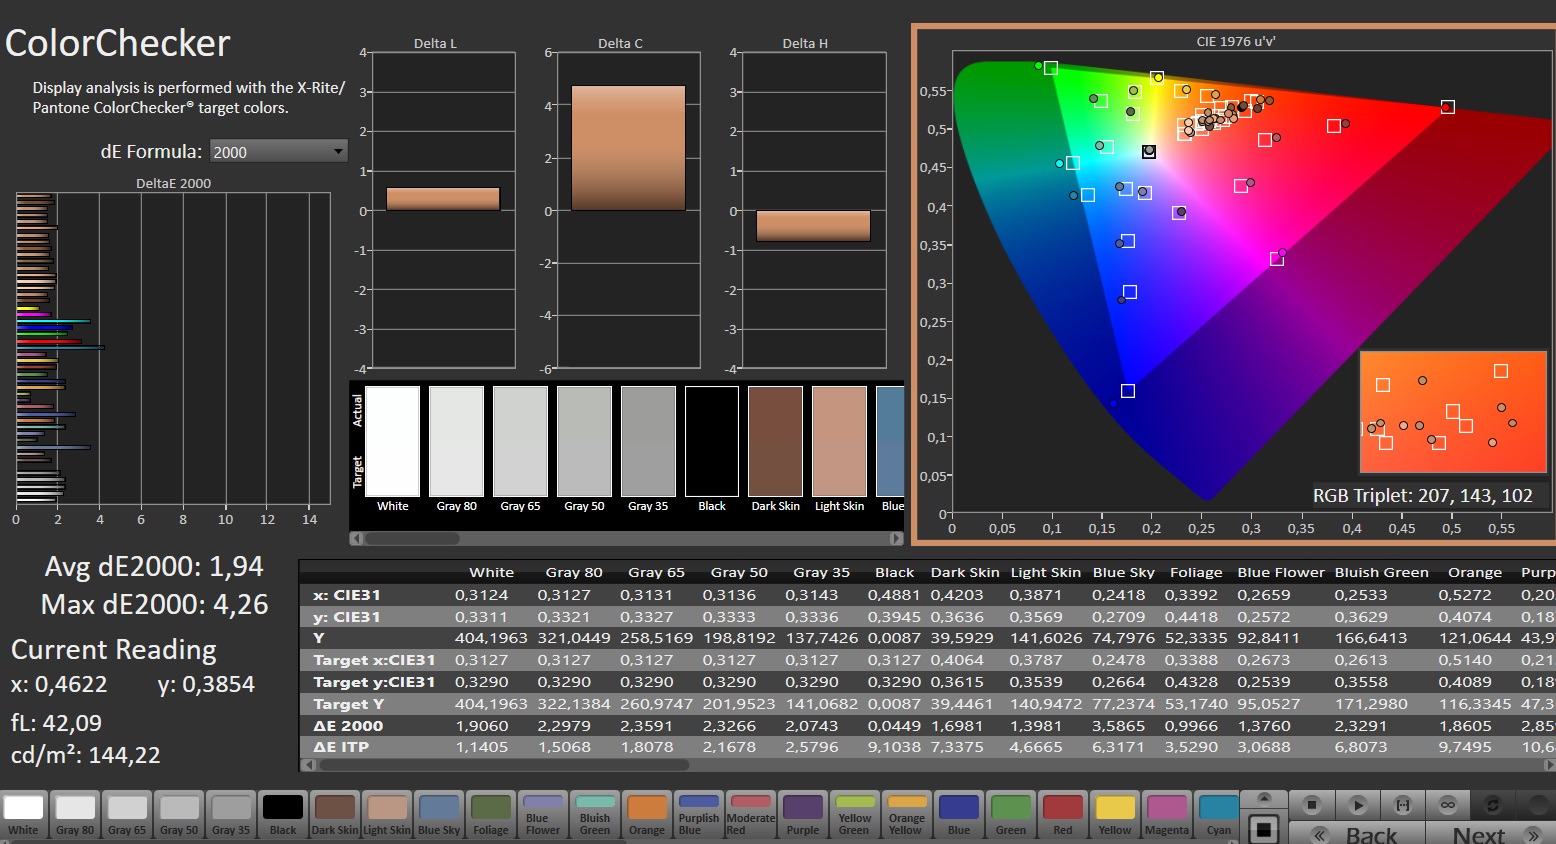
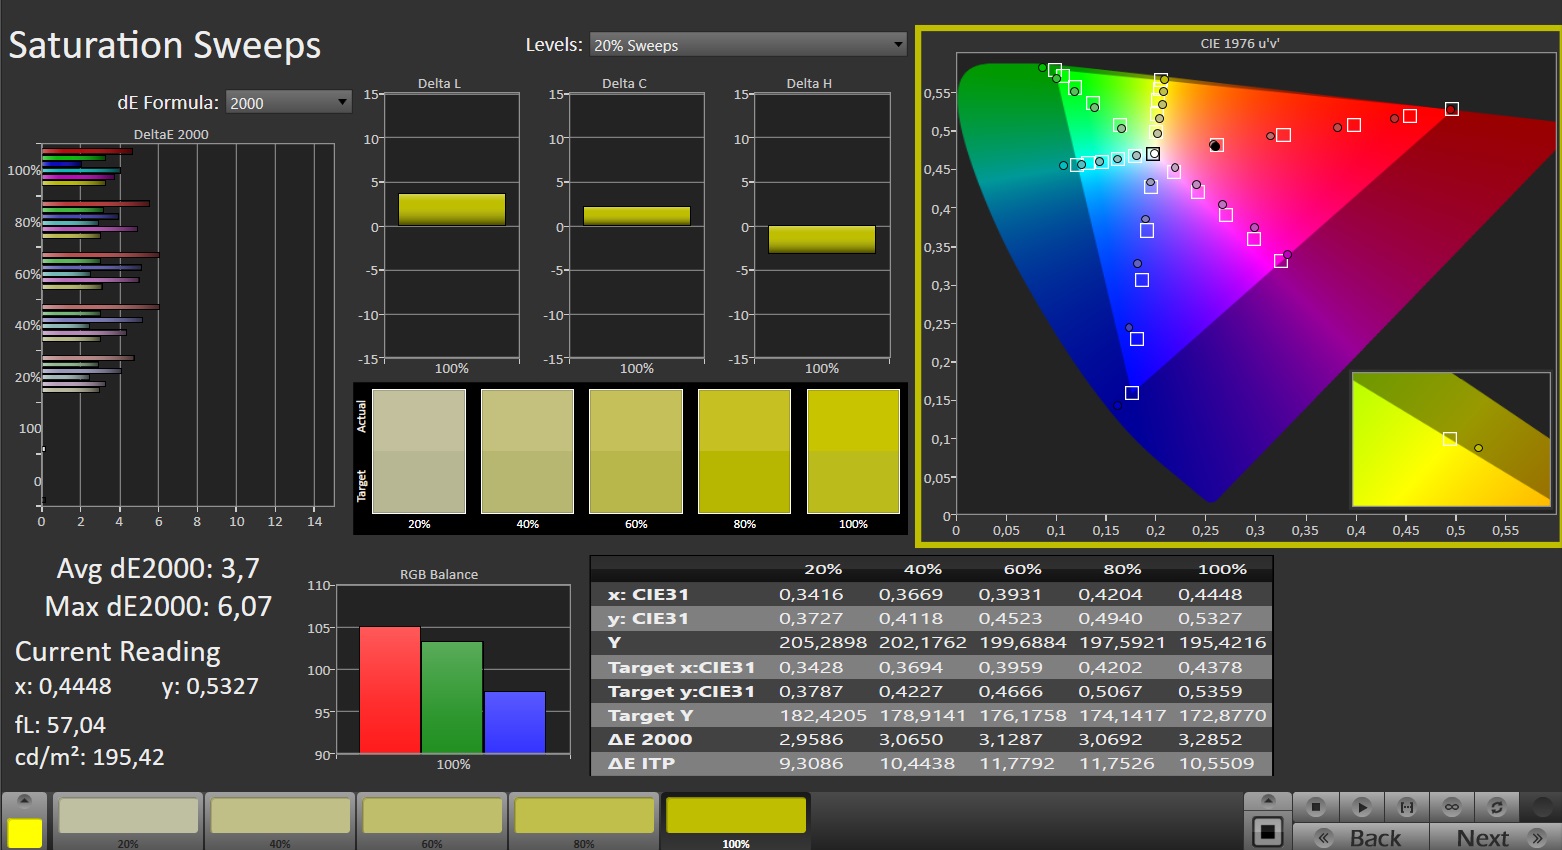
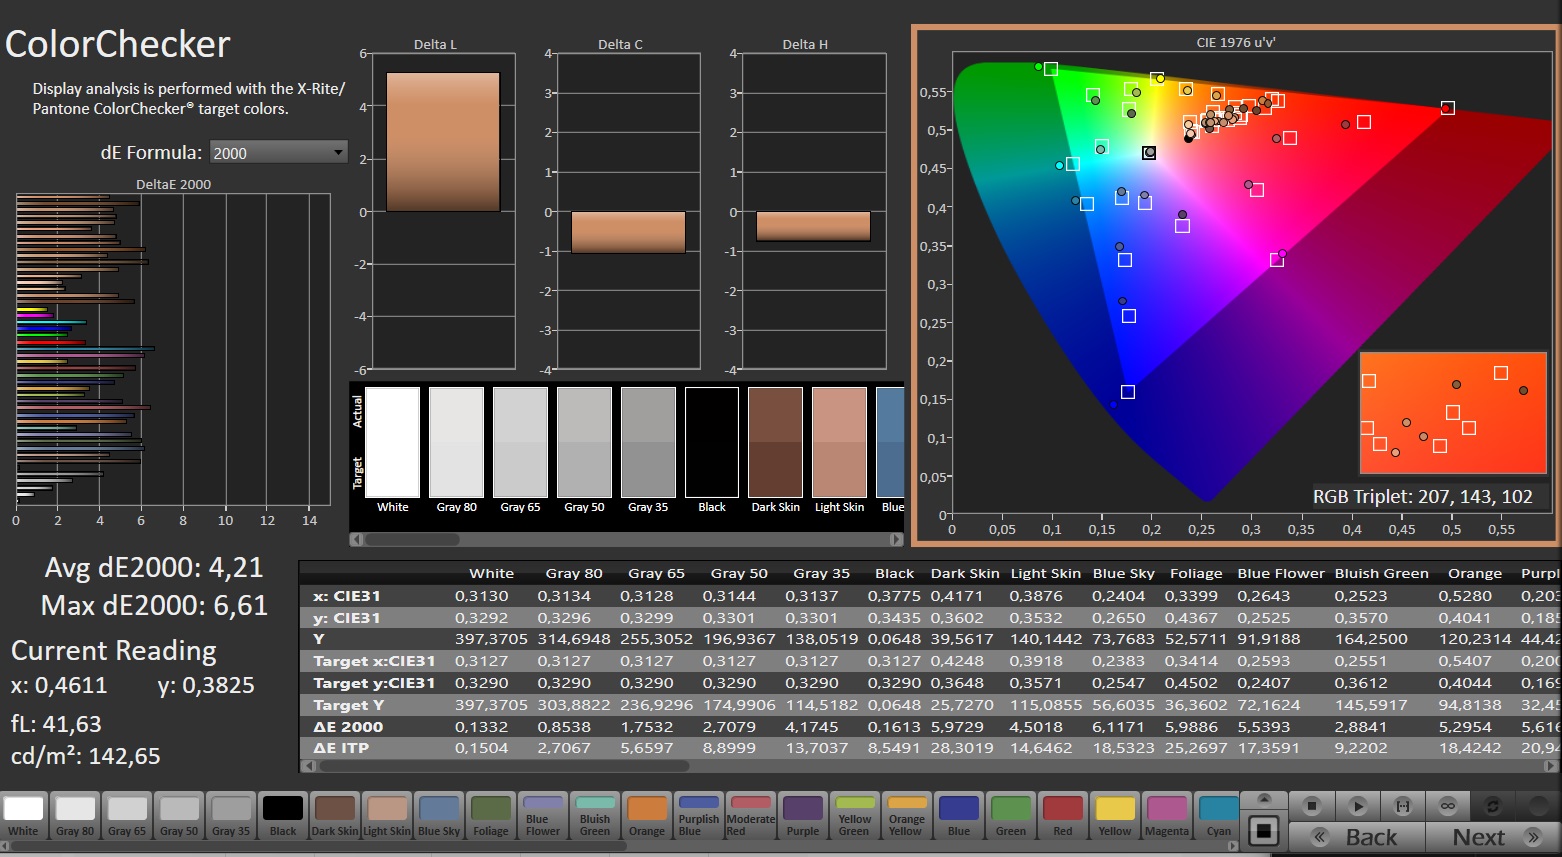
另外一个亮点是丰富的色彩空间:100% DCI P3 和 97% AdobeRGB 在游戏领域并非理所当然。色彩精确度方面也是如此,在校准之前就已经令人印象深刻。


短响应时间也值得称赞:传统的 IPS 面板只能达到 0.2 毫秒。前代产品的迷你 LED 显示屏亮度更高(800 对 392 cd/m²),但速度也明显更慢。

Display Response Times
| ↔ Response Time Black to White | ||
|---|---|---|
| 0.2 ms ... rise ↗ and fall ↘ combined | ↗ 0.1 ms rise | 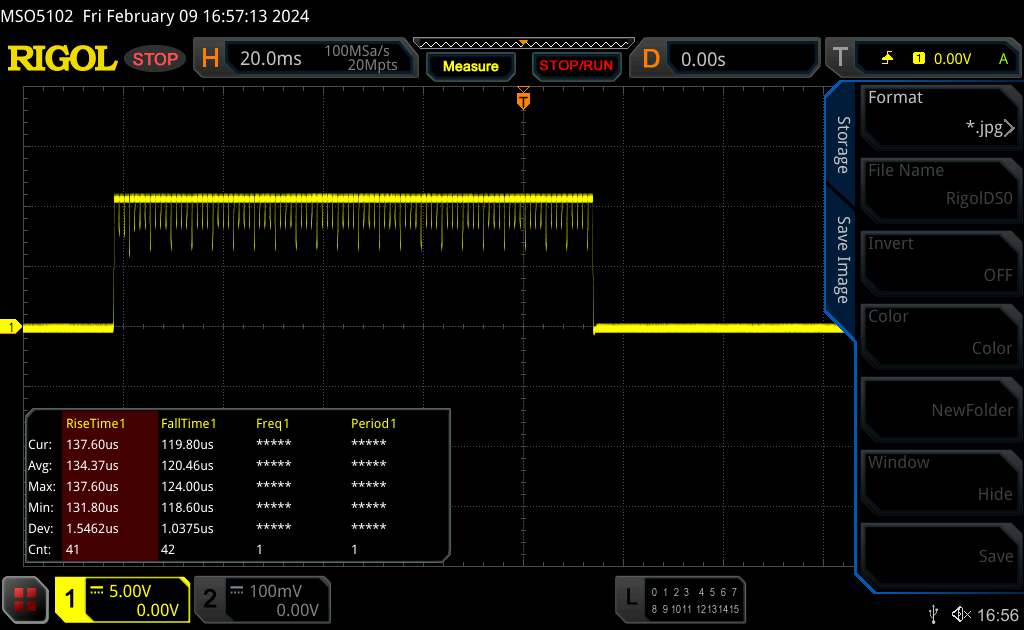 |
| ↘ 0.1 ms fall | ||
| The screen shows very fast response rates in our tests and should be very well suited for fast-paced gaming. In comparison, all tested devices range from 0.1 (minimum) to 240 (maximum) ms. » 0 % of all devices are better. This means that the measured response time is better than the average of all tested devices (19.8 ms). | ||
| ↔ Response Time 50% Grey to 80% Grey | ||
| 0.2 ms ... rise ↗ and fall ↘ combined | ↗ 0.1 ms rise | 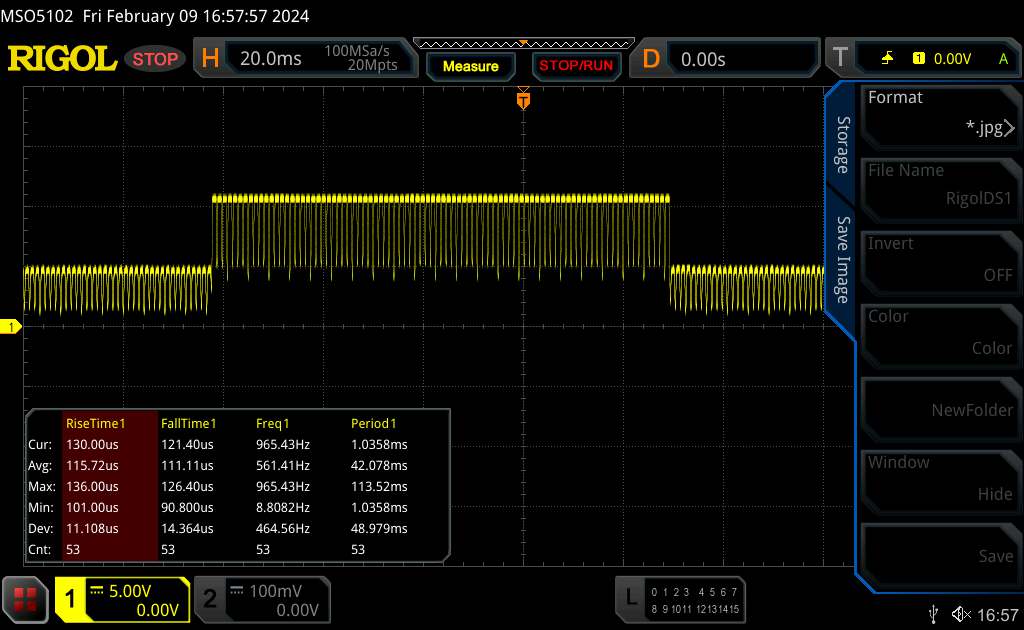 |
| ↘ 0.1 ms fall | ||
| The screen shows very fast response rates in our tests and should be very well suited for fast-paced gaming. In comparison, all tested devices range from 0.165 (minimum) to 636 (maximum) ms. » 0 % of all devices are better. This means that the measured response time is better than the average of all tested devices (31 ms). | ||
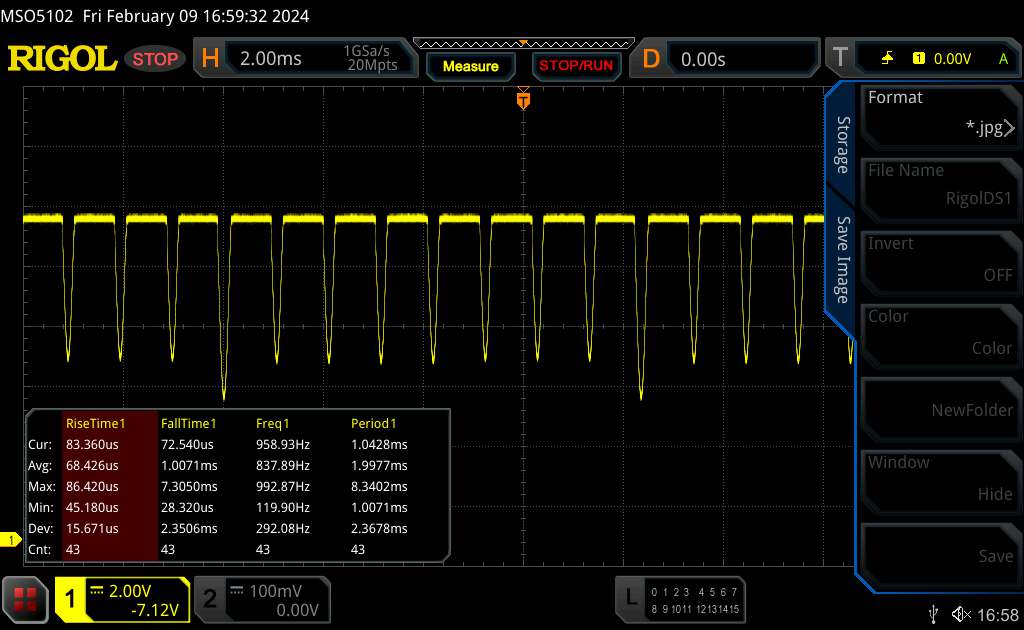
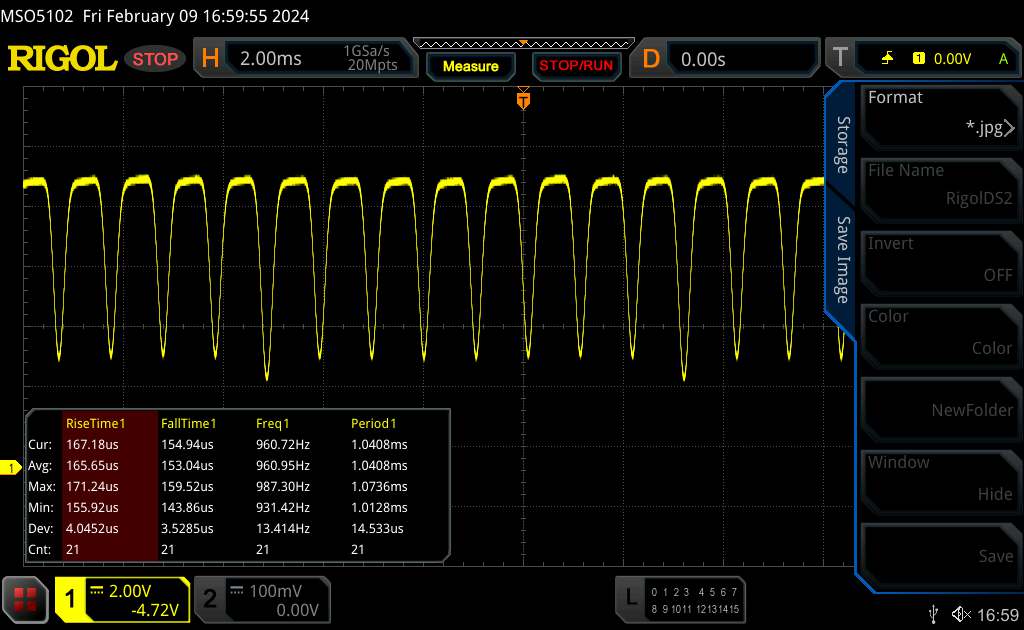
Screen Flickering / PWM (Pulse-Width Modulation)
| Screen flickering / PWM detected | 120 Hz | ≤ 100 % brightness setting | 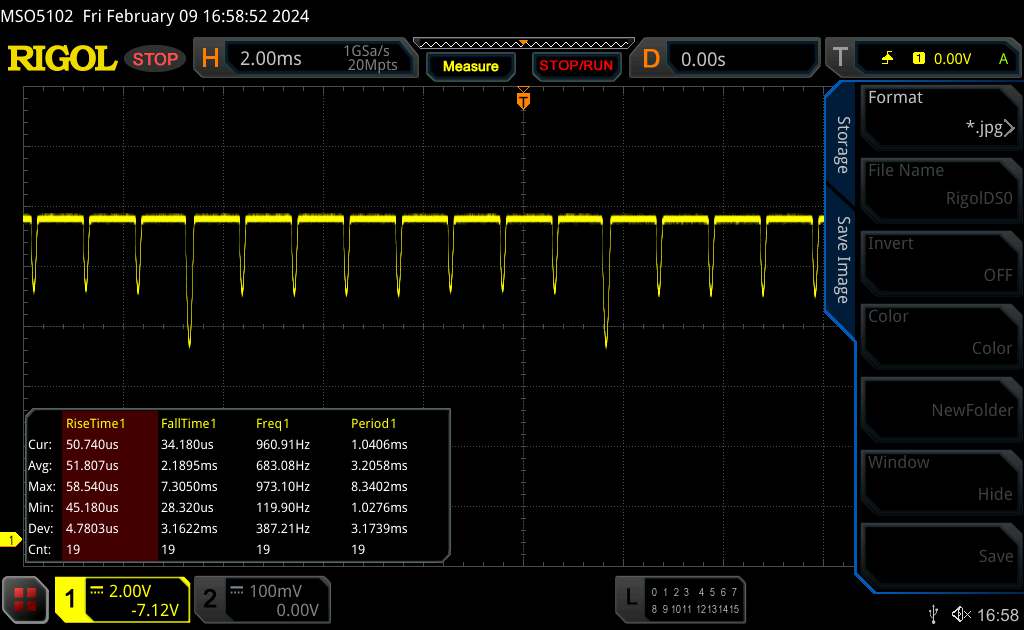 |
The display backlight flickers at 120 Hz (worst case, e.g., utilizing PWM) Flickering detected at a brightness setting of 100 % and below. There should be no flickering or PWM above this brightness setting. The frequency of 120 Hz is very low, so the flickering may cause eyestrain and headaches after extended use. In comparison: 52 % of all tested devices do not use PWM to dim the display. If PWM was detected, an average of 7750 (minimum: 5 - maximum: 343500) Hz was measured. | |||
性能
价格方面,Omen Transcend 16 的起价约为 1600 美元。入门级机型配备了 酷睿 i7-13700HX, a GeForce RTX 406016 GB 内存和分辨率较低的 IPS 显示屏。我们的评测机型则在价格和规格上更胜一筹。
测试条件
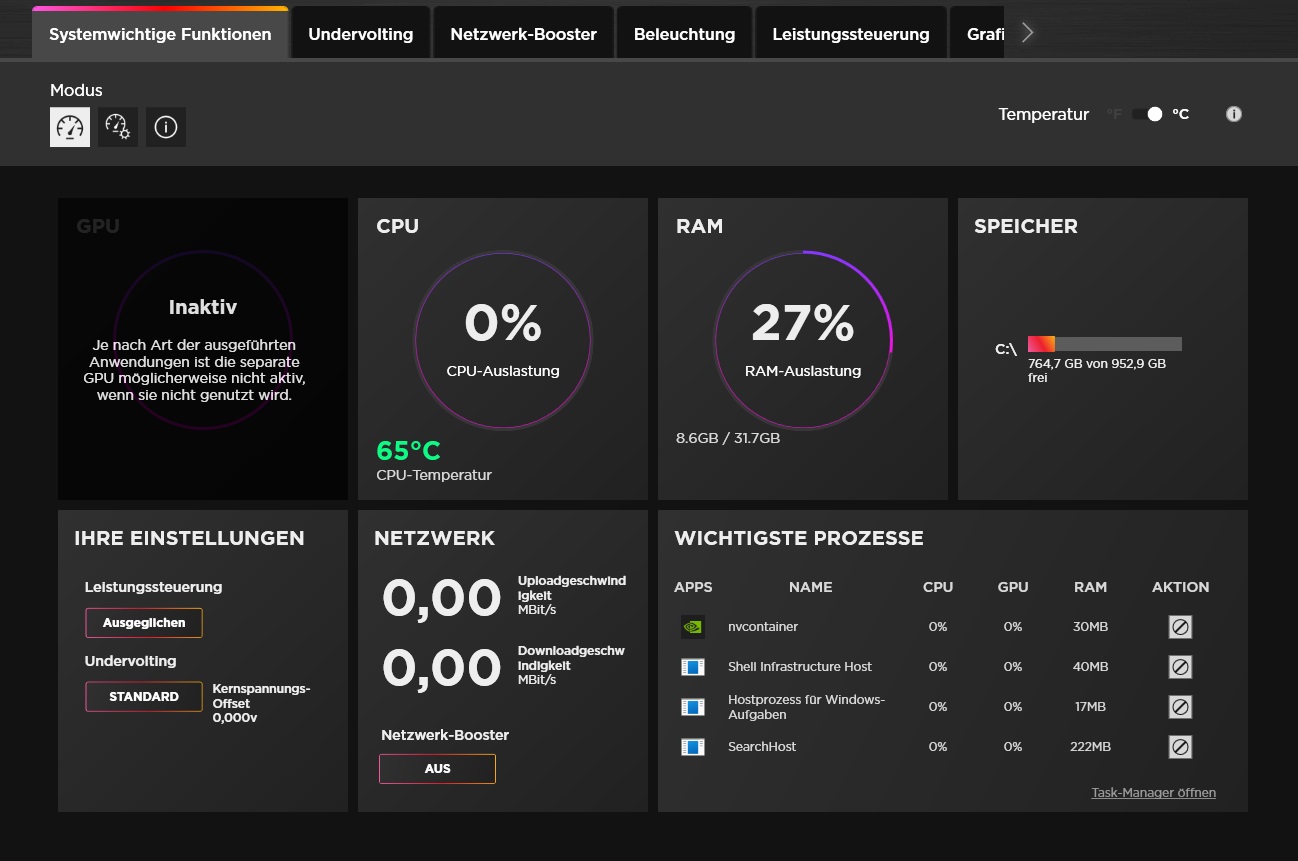
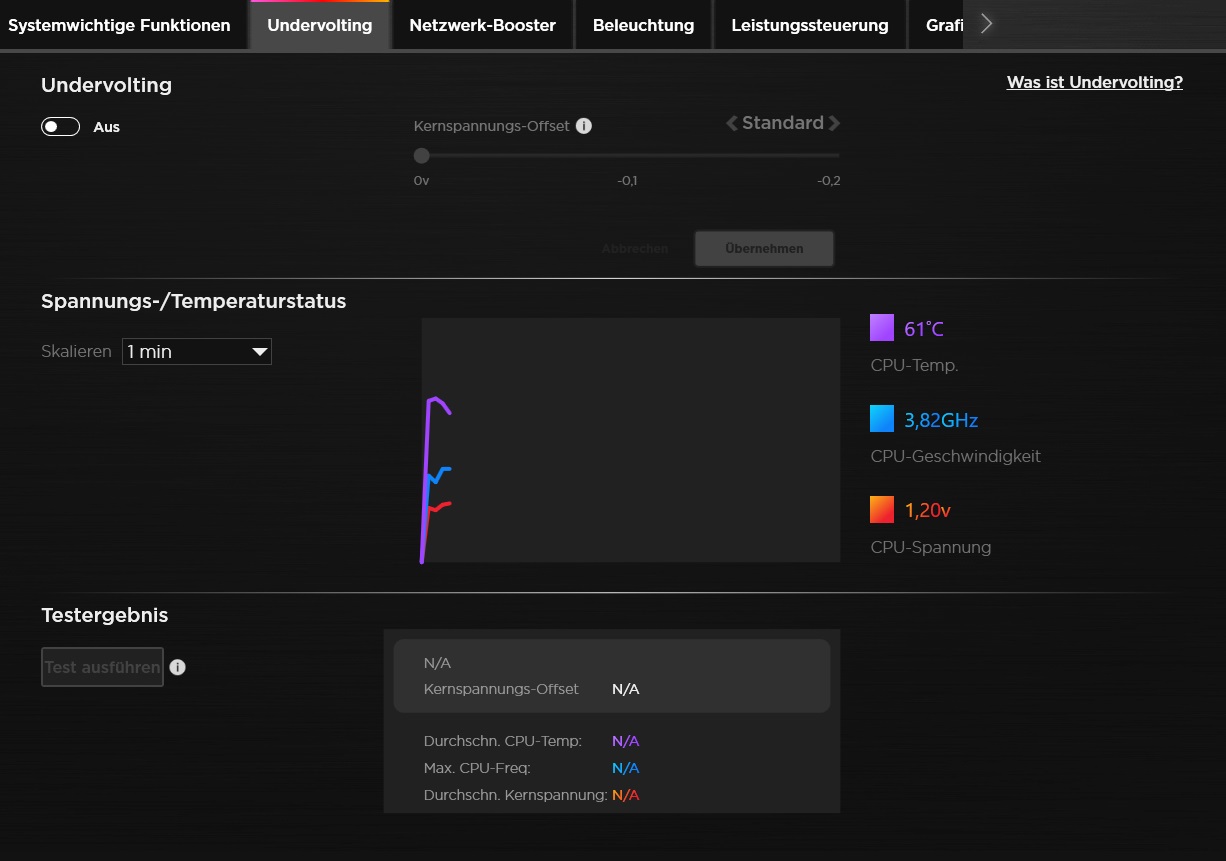
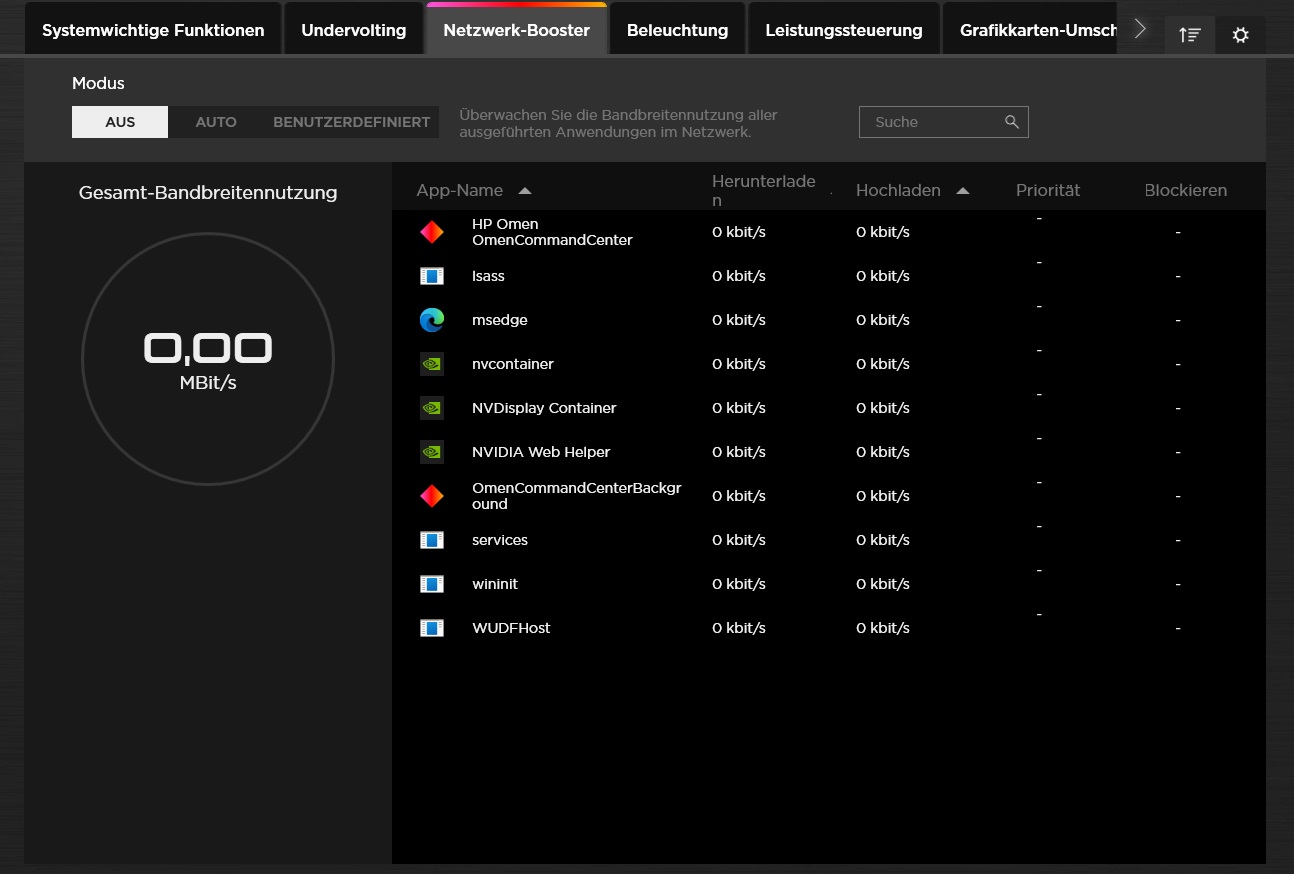
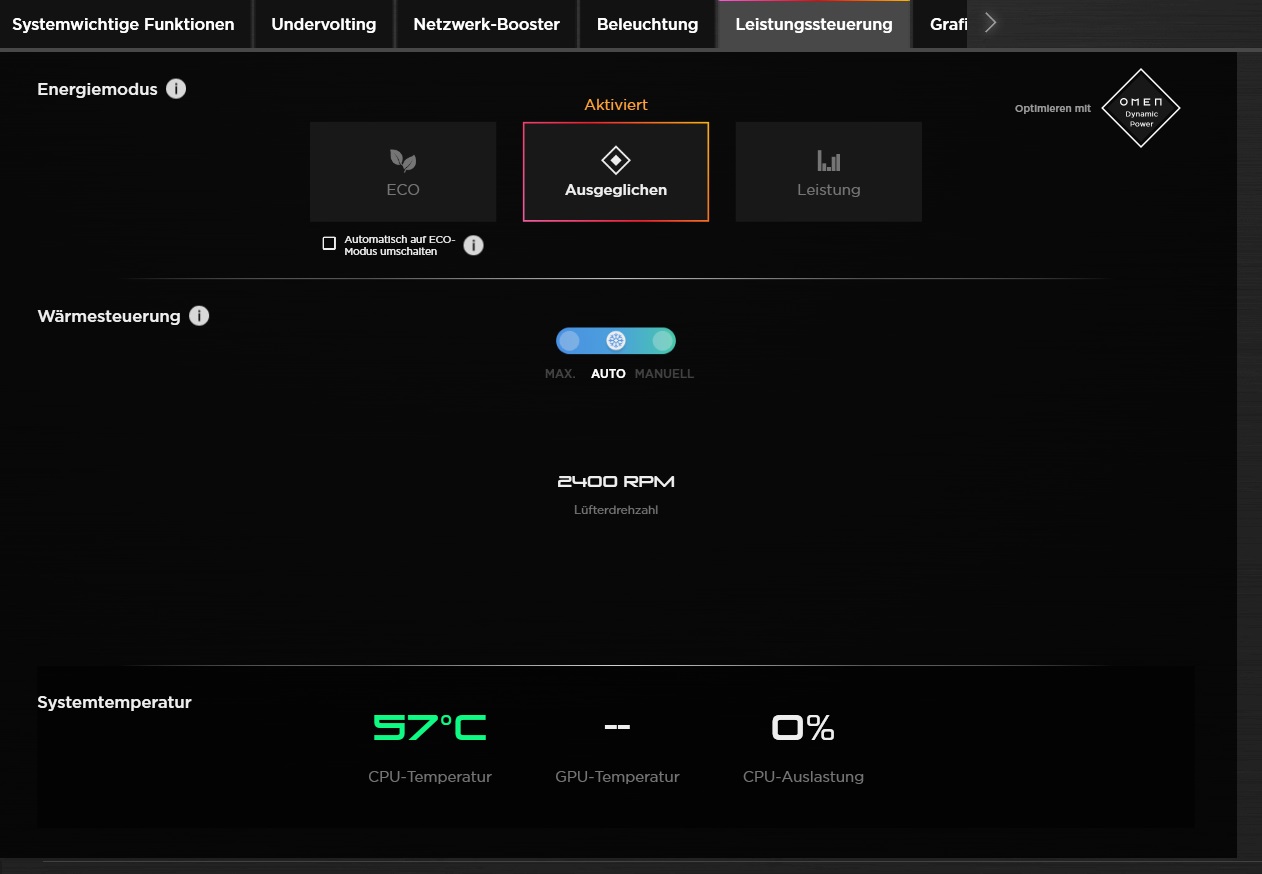
预装游戏集线器的性能管理有些难以进入。在相应的菜单中,有三种能源模式和一个热量管理器在等待。由于性能模式(与大多数游戏笔记本电脑类似)既能确保更好的性能,但也会产生不成比例的噪音,因此所有测量都是在平衡模式下进行的。因此,确定的数值只能在有限的范围内与前代产品进行比较。此外,风扇自动控制和图形自动切换功能都处于激活状态。

| Witcher 3 (FHD/Ultra) Eco Ausgegleichen | Leistung | ||
| 噪音 | 39 dB(A) 44 dB(A) 53 dB(A) | ||
| 性能 | 60 fps 锁定 114 fps 126 fps |
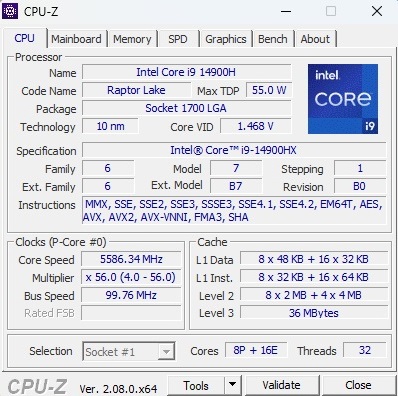
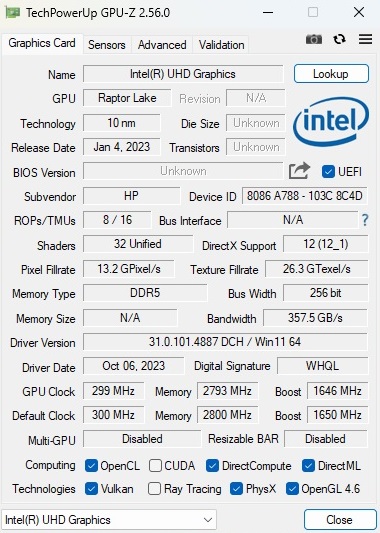
处理器
与 GPU 性能和机箱厚度相比,酷睿 i9-14900HX 的尺寸几乎超标。Raptor Lake 系列 10 nm 型号提供 8 个带超线程的性能核心和 16 个不带 HT 的效率核心,总共有 32 个线程。在平衡模式下,CPU 只能在有限的范围内发挥其潜力。最好的例子就是我们的 Cinebench 循环:虽然在最初几次运行中性能相对较高,但在短时间后,分数急剧下降(但随后保持在一个稳定的水平上)。总而言之,它只能达到 Ultra 7 155H (ROG Zephyrus G16) 或 Ryzen 7 7840HS (Schenker XMG Core 16) 的水平。
Cinebench R15 Multi Continuous Test
* ... smaller is better
AIDA64: FP32 Ray-Trace | FPU Julia | CPU SHA3 | CPU Queen | FPU SinJulia | FPU Mandel | CPU AES | CPU ZLib | FP64 Ray-Trace | CPU PhotoWorxx
| Performance rating | |
| Average of class Gaming | |
| Average Intel Core i9-14900HX | |
| HP Omen Transcend 16 | |
| Lenovo Legion Pro 5 16ARX8 | |
| Schenker XMG CORE 16 (L23) | |
| HP Omen Transcend 16-u1095ng | |
| Asus ROG Zephyrus G16 2024 GU605M | |
| AIDA64 / FP32 Ray-Trace | |
| Average of class Gaming (10227 - 85542, n=103, last 2 years) | |
| Lenovo Legion Pro 5 16ARX8 | |
| Schenker XMG CORE 16 (L23) | |
| Average Intel Core i9-14900HX (13098 - 33474, n=36) | |
| HP Omen Transcend 16 | |
| HP Omen Transcend 16-u1095ng | |
| Asus ROG Zephyrus G16 2024 GU605M | |
| AIDA64 / FPU Julia | |
| Average of class Gaming (51376 - 238426, n=103, last 2 years) | |
| Average Intel Core i9-14900HX (67573 - 166040, n=36) | |
| Lenovo Legion Pro 5 16ARX8 | |
| Schenker XMG CORE 16 (L23) | |
| HP Omen Transcend 16 | |
| HP Omen Transcend 16-u1095ng | |
| Asus ROG Zephyrus G16 2024 GU605M | |
| AIDA64 / CPU SHA3 | |
| Average of class Gaming (2180 - 9817, n=103, last 2 years) | |
| Average Intel Core i9-14900HX (3589 - 7979, n=36) | |
| HP Omen Transcend 16 | |
| Lenovo Legion Pro 5 16ARX8 | |
| Schenker XMG CORE 16 (L23) | |
| HP Omen Transcend 16-u1095ng | |
| Asus ROG Zephyrus G16 2024 GU605M | |
| AIDA64 / CPU Queen | |
| Average Intel Core i9-14900HX (118405 - 148966, n=36) | |
| Lenovo Legion Pro 5 16ARX8 | |
| HP Omen Transcend 16 | |
| HP Omen Transcend 16-u1095ng | |
| Average of class Gaming (49785 - 173351, n=89, last 2 years) | |
| Schenker XMG CORE 16 (L23) | |
| Asus ROG Zephyrus G16 2024 GU605M | |
| AIDA64 / FPU SinJulia | |
| Lenovo Legion Pro 5 16ARX8 | |
| Average Intel Core i9-14900HX (10475 - 18517, n=36) | |
| Schenker XMG CORE 16 (L23) | |
| Average of class Gaming (4424 - 33636, n=103, last 2 years) | |
| HP Omen Transcend 16 | |
| HP Omen Transcend 16-u1095ng | |
| Asus ROG Zephyrus G16 2024 GU605M | |
| AIDA64 / FPU Mandel | |
| Average of class Gaming (25115 - 128721, n=103, last 2 years) | |
| Lenovo Legion Pro 5 16ARX8 | |
| Schenker XMG CORE 16 (L23) | |
| Average Intel Core i9-14900HX (32543 - 83662, n=36) | |
| HP Omen Transcend 16 | |
| HP Omen Transcend 16-u1095ng | |
| Asus ROG Zephyrus G16 2024 GU605M | |
| AIDA64 / CPU AES | |
| Average Intel Core i9-14900HX (86964 - 241777, n=36) | |
| HP Omen Transcend 16 | |
| Average of class Gaming (39258 - 247074, n=103, last 2 years) | |
| Schenker XMG CORE 16 (L23) | |
| HP Omen Transcend 16-u1095ng | |
| Asus ROG Zephyrus G16 2024 GU605M | |
| Lenovo Legion Pro 5 16ARX8 | |
| AIDA64 / CPU ZLib | |
| Average Intel Core i9-14900HX (1054 - 2292, n=36) | |
| HP Omen Transcend 16 | |
| Average of class Gaming (574 - 2531, n=103, last 2 years) | |
| HP Omen Transcend 16-u1095ng | |
| Lenovo Legion Pro 5 16ARX8 | |
| Asus ROG Zephyrus G16 2024 GU605M | |
| Schenker XMG CORE 16 (L23) | |
| AIDA64 / FP64 Ray-Trace | |
| Average of class Gaming (5509 - 45446, n=103, last 2 years) | |
| Lenovo Legion Pro 5 16ARX8 | |
| Schenker XMG CORE 16 (L23) | |
| Average Intel Core i9-14900HX (6809 - 18349, n=36) | |
| HP Omen Transcend 16 | |
| HP Omen Transcend 16-u1095ng | |
| Asus ROG Zephyrus G16 2024 GU605M | |
| AIDA64 / CPU PhotoWorxx | |
| HP Omen Transcend 16 | |
| HP Omen Transcend 16-u1095ng | |
| Asus ROG Zephyrus G16 2024 GU605M | |
| Average Intel Core i9-14900HX (23903 - 54702, n=36) | |
| Average of class Gaming (12271 - 89891, n=103, last 2 years) | |
| Schenker XMG CORE 16 (L23) | |
| Lenovo Legion Pro 5 16ARX8 | |
系统性能
在系统性能方面,创见的表现不俗,但仍未跻身前列。在内存速度方面,创见稳居第二。
CrossMark: Overall | Productivity | Creativity | Responsiveness
WebXPRT 3: Overall
WebXPRT 4: Overall
Mozilla Kraken 1.1: Total
| PCMark 10 / Score | |
| Average of class Gaming (5828 - 11730, n=92, last 2 years) | |
| Lenovo Legion Pro 5 16ARX8 | |
| Average Intel Core i9-14900HX, NVIDIA GeForce RTX 4070 Laptop GPU (7768 - 8550, n=8) | |
| Schenker XMG CORE 16 (L23) | |
| HP Omen Transcend 16 | |
| HP Omen Transcend 16-u1095ng | |
| Asus ROG Zephyrus G16 2024 GU605M | |
| PCMark 10 / Essentials | |
| HP Omen Transcend 16 | |
| Lenovo Legion Pro 5 16ARX8 | |
| Schenker XMG CORE 16 (L23) | |
| Average Intel Core i9-14900HX, NVIDIA GeForce RTX 4070 Laptop GPU (10104 - 11815, n=8) | |
| Average of class Gaming (8810 - 11935, n=96, last 2 years) | |
| HP Omen Transcend 16-u1095ng | |
| Asus ROG Zephyrus G16 2024 GU605M | |
| PCMark 10 / Productivity | |
| Average of class Gaming (6845 - 21327, n=94, last 2 years) | |
| Schenker XMG CORE 16 (L23) | |
| Average Intel Core i9-14900HX, NVIDIA GeForce RTX 4070 Laptop GPU (9577 - 11103, n=8) | |
| HP Omen Transcend 16-u1095ng | |
| Lenovo Legion Pro 5 16ARX8 | |
| HP Omen Transcend 16 | |
| Asus ROG Zephyrus G16 2024 GU605M | |
| PCMark 10 / Digital Content Creation | |
| Average of class Gaming (7602 - 19954, n=94, last 2 years) | |
| HP Omen Transcend 16 | |
| Lenovo Legion Pro 5 16ARX8 | |
| Average Intel Core i9-14900HX, NVIDIA GeForce RTX 4070 Laptop GPU (12114 - 14827, n=8) | |
| Schenker XMG CORE 16 (L23) | |
| HP Omen Transcend 16-u1095ng | |
| Asus ROG Zephyrus G16 2024 GU605M | |
| CrossMark / Overall | |
| Average Intel Core i9-14900HX, NVIDIA GeForce RTX 4070 Laptop GPU (2002 - 2312, n=7) | |
| Lenovo Legion Pro 5 16ARX8 | |
| Average of class Gaming (1366 - 2409, n=93, last 2 years) | |
| HP Omen Transcend 16 | |
| Asus ROG Zephyrus G16 2024 GU605M | |
| Schenker XMG CORE 16 (L23) | |
| CrossMark / Productivity | |
| Average Intel Core i9-14900HX, NVIDIA GeForce RTX 4070 Laptop GPU (1827 - 2191, n=7) | |
| Lenovo Legion Pro 5 16ARX8 | |
| Average of class Gaming (1386 - 2254, n=93, last 2 years) | |
| HP Omen Transcend 16 | |
| Schenker XMG CORE 16 (L23) | |
| Asus ROG Zephyrus G16 2024 GU605M | |
| CrossMark / Creativity | |
| Average Intel Core i9-14900HX, NVIDIA GeForce RTX 4070 Laptop GPU (2258 - 2458, n=7) | |
| HP Omen Transcend 16 | |
| Average of class Gaming (1343 - 2729, n=93, last 2 years) | |
| Lenovo Legion Pro 5 16ARX8 | |
| Asus ROG Zephyrus G16 2024 GU605M | |
| Schenker XMG CORE 16 (L23) | |
| CrossMark / Responsiveness | |
| Average Intel Core i9-14900HX, NVIDIA GeForce RTX 4070 Laptop GPU (1734 - 2330, n=7) | |
| Lenovo Legion Pro 5 16ARX8 | |
| Average of class Gaming (1226 - 2334, n=93, last 2 years) | |
| HP Omen Transcend 16 | |
| Schenker XMG CORE 16 (L23) | |
| Asus ROG Zephyrus G16 2024 GU605M | |
| WebXPRT 3 / Overall | |
| Lenovo Legion Pro 5 16ARX8 | |
| HP Omen Transcend 16-u1095ng | |
| HP Omen Transcend 16 | |
| Average Intel Core i9-14900HX, NVIDIA GeForce RTX 4070 Laptop GPU (269 - 342, n=8) | |
| Average of class Gaming (220 - 532, n=97, last 2 years) | |
| Schenker XMG CORE 16 (L23) | |
| Asus ROG Zephyrus G16 2024 GU605M | |
| WebXPRT 4 / Overall | |
| HP Omen Transcend 16 | |
| Average Intel Core i9-14900HX, NVIDIA GeForce RTX 4070 Laptop GPU (291 - 304, n=6) | |
| Average of class Gaming (165 - 354, n=97, last 2 years) | |
| Lenovo Legion Pro 5 16ARX8 | |
| Asus ROG Zephyrus G16 2024 GU605M | |
| Mozilla Kraken 1.1 / Total | |
| Asus ROG Zephyrus G16 2024 GU605M | |
| Schenker XMG CORE 16 (L23) | |
| Lenovo Legion Pro 5 16ARX8 | |
| Average of class Gaming (391 - 590, n=99, last 2 years) | |
| HP Omen Transcend 16 | |
| Average Intel Core i9-14900HX, NVIDIA GeForce RTX 4070 Laptop GPU (431 - 469, n=8) | |
| HP Omen Transcend 16-u1095ng | |
* ... smaller is better
| PCMark 10 Score | 7866 points | |
Help | ||
| AIDA64 / Memory Copy | |
| Asus ROG Zephyrus G16 2024 GU605M | |
| HP Omen Transcend 16-u1095ng | |
| HP Omen Transcend 16 | |
| Average Intel Core i9-14900HX (38028 - 83392, n=36) | |
| Average of class Gaming (21750 - 129946, n=103, last 2 years) | |
| Schenker XMG CORE 16 (L23) | |
| Lenovo Legion Pro 5 16ARX8 | |
| AIDA64 / Memory Read | |
| Asus ROG Zephyrus G16 2024 GU605M | |
| HP Omen Transcend 16-u1095ng | |
| HP Omen Transcend 16 | |
| Average Intel Core i9-14900HX (43306 - 87568, n=36) | |
| Average of class Gaming (22956 - 118858, n=103, last 2 years) | |
| Schenker XMG CORE 16 (L23) | |
| Lenovo Legion Pro 5 16ARX8 | |
| AIDA64 / Memory Write | |
| Schenker XMG CORE 16 (L23) | |
| HP Omen Transcend 16-u1095ng | |
| HP Omen Transcend 16 | |
| Average of class Gaming (22297 - 135096, n=103, last 2 years) | |
| Asus ROG Zephyrus G16 2024 GU605M | |
| Average Intel Core i9-14900HX (37146 - 80589, n=36) | |
| Lenovo Legion Pro 5 16ARX8 | |
| AIDA64 / Memory Latency | |
| Asus ROG Zephyrus G16 2024 GU605M | |
| Average of class Gaming (75.3 - 259, n=103, last 2 years) | |
| Schenker XMG CORE 16 (L23) | |
| HP Omen Transcend 16 | |
| Lenovo Legion Pro 5 16ARX8 | |
| HP Omen Transcend 16-u1095ng | |
| Average Intel Core i9-14900HX (76.1 - 105, n=36) | |
* ... smaller is better
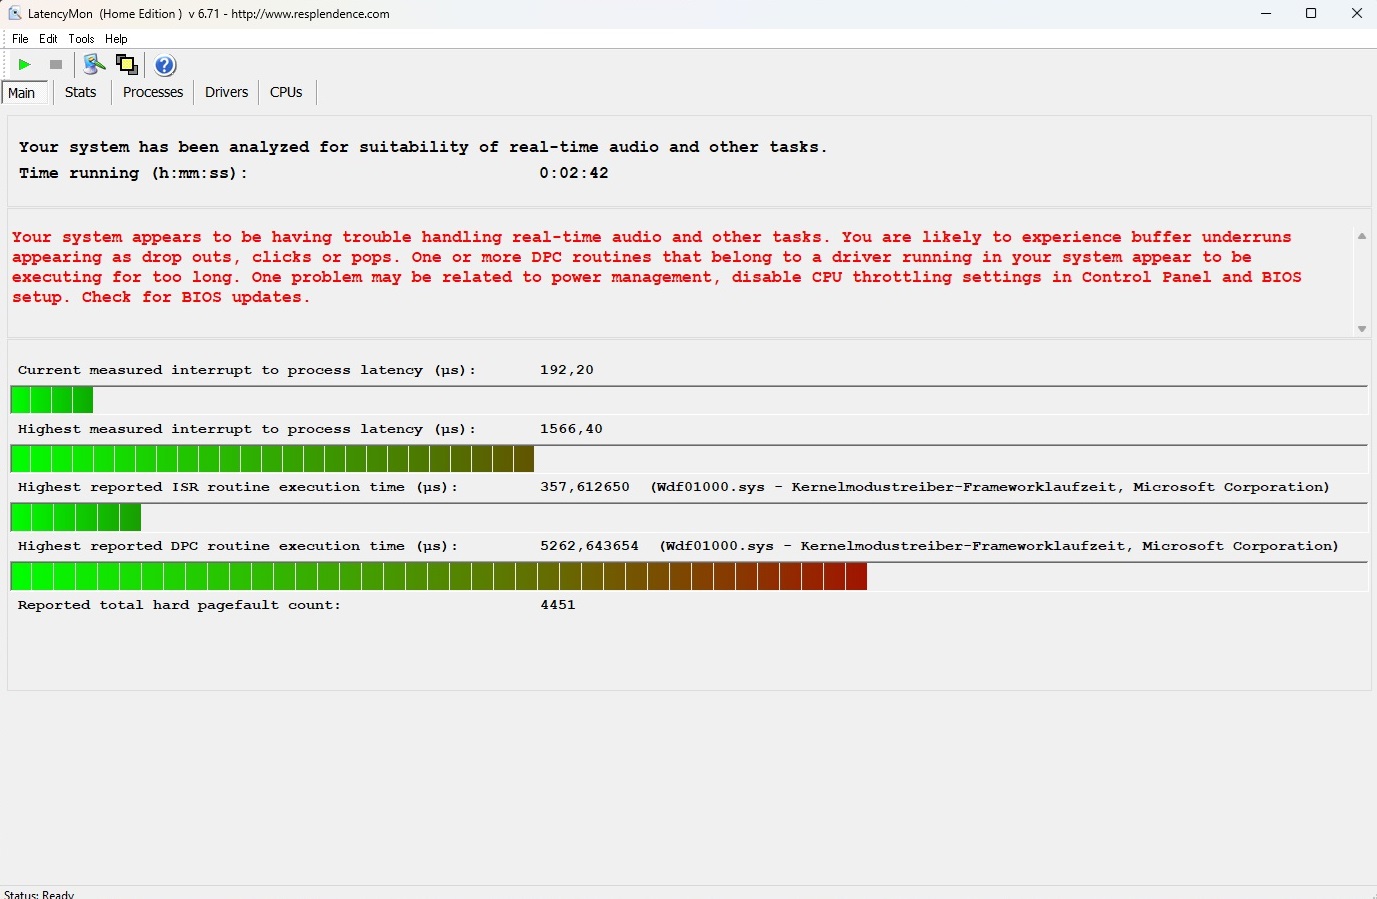
DPC 延迟
与前代产品一样,新的 Omen 16 也需要应对相对较高的延迟,这可能会在某些应用场景(例如,实时处理音频和视频)中造成问题。
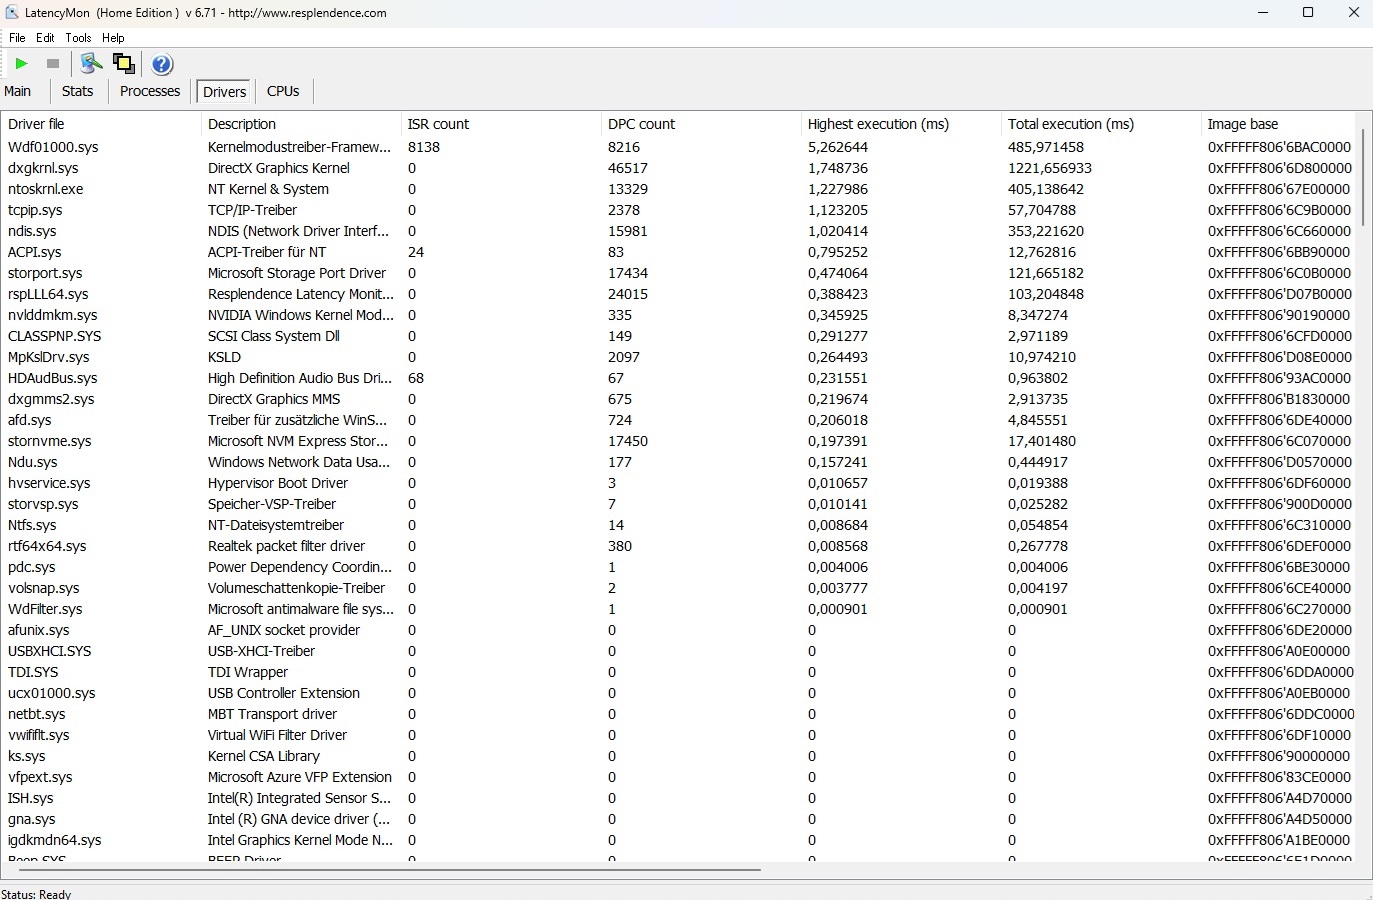
| DPC Latencies / LatencyMon - interrupt to process latency (max), Web, Youtube, Prime95 | |
| Asus ROG Zephyrus G16 2024 GU605M | |
| HP Omen Transcend 16-u1095ng | |
| HP Omen Transcend 16 | |
| Schenker XMG CORE 16 (L23) | |
| Lenovo Legion Pro 5 16ARX8 | |
* ... smaller is better
大容量存储器
与 CPU 性能相比,我们观察到固态硬盘的性能没有下降。安装的 Kioxia 硬盘比旧创见中的 SK hynix 硬盘稍慢,但尽管如此,它仍能提供足够高的速度。遗憾的是,这款 16 英寸机型只有一个 M.2 插槽,这意味着必须更换内置的固态硬盘才能扩展存储空间。

* ... smaller is better
Continuous Performance Read: DiskSpd Read Loop, Queue Depth 8
图形卡
GeForce RTX 4070 基于 Ada Lovelace 架构,就性能而言,它比 RTX 4080 更接近 RTX 4060。 RTX 4080.尽管 TGP 达到了 130 瓦,但 Omen 16 在基准测试中的表现略低于平均水平,不过与竞争对手的差距有时非常小。由于 VRAM 容量较低,RTX 4070 的面向未来能力相当差。在某些游戏中,8 GB 可能已经成为限制因素。在我们看来,Nvidia 应该至少提供 12 GB 的 GPU,尤其是这种笔记本电脑并不便宜。
| 3DMark Performance rating - Percent | |
| Average of class Gaming | |
| Schenker XMG CORE 16 (L23) | |
| Lenovo Legion Pro 5 16ARX8 -1! | |
| Average NVIDIA GeForce RTX 4070 Laptop GPU | |
| HP Omen Transcend 16 -1! | |
| HP Omen Transcend 16-u1095ng | |
| Asus ROG Zephyrus G16 2024 GU605M -1! | |
| 3DMark 11 Performance | 32528 points | |
| 3DMark Cloud Gate Standard Score | 53528 points | |
| 3DMark Fire Strike Score | 23683 points | |
| 3DMark Time Spy Score | 11682 points | |
Help | ||
* ... smaller is better
游戏性能
创见 16 的速度足够快,几乎可以在原生 2,560 x 1,600 分辨率和高至最高设置下玩所有游戏。只有在要求极高或优化不佳的游戏中才会出现问题,例如 笼罩.对于 4K 显示器,我们建议至少使用 RTX 4080。
| The Witcher 3 - 1920x1080 Ultra Graphics & Postprocessing (HBAO+) | |
| Average of class Gaming (104.7 - 240, n=6, last 2 years) | |
| Schenker XMG CORE 16 (L23) | |
| Lenovo Legion Pro 5 16ARX8 | |
| HP Omen Transcend 16-u1095ng | |
| Average NVIDIA GeForce RTX 4070 Laptop GPU (69.8 - 133.7, n=57) | |
| HP Omen Transcend 16 | |
| Asus ROG Zephyrus G16 2024 GU605M | |
| Final Fantasy XV Benchmark - 1920x1080 High Quality | |
| Average of class Gaming (41 - 215, n=94, last 2 years) | |
| Schenker XMG CORE 16 (L23) | |
| Lenovo Legion Pro 5 16ARX8 | |
| Average NVIDIA GeForce RTX 4070 Laptop GPU (41 - 131.9, n=65) | |
| HP Omen Transcend 16-u1095ng | |
| Asus ROG Zephyrus G16 2024 GU605M | |
| Enshrouded - 2560x1440 Max. Quality AA:FX | |
| HP Omen Transcend 16-u1095ng | |
| Average NVIDIA GeForce RTX 4070 Laptop GPU (38.9 - 42.3, n=2) | |
| XMG Pro 15 E23 | |
| Palworld - 2560x1440 Epic Preset AA:TSR | |
| XMG Pro 15 E23 | |
| Average NVIDIA GeForce RTX 4070 Laptop GPU (69.1 - 81.3, n=2) | |
| HP Omen Transcend 16-u1095ng | |
| Prince of Persia The Lost Crown - 2560x1440 Ultra Preset AA:SM | |
| Average of class Gaming (352 - 357, n=4, last 2 years) | |
| XMG Pro 15 E23 | |
| Average NVIDIA GeForce RTX 4070 Laptop GPU (325 - 354, n=2) | |
| HP Omen Transcend 16-u1095ng | |
| Ready or Not - 2560x1440 Epic Preset | |
| XMG Pro 15 E23 | |
| Average NVIDIA GeForce RTX 4070 Laptop GPU (84.8 - 95.6, n=2) | |
| HP Omen Transcend 16-u1095ng | |
| The Finals - 2560x1440 Epic Preset | |
| XMG Pro 15 E23 | |
| Average NVIDIA GeForce RTX 4070 Laptop GPU (82.8 - 94.6, n=3) | |
| HP Omen Transcend 16-u1095ng | |
| Average of class Gaming (n=1last 2 years) | |
我们使用了角色扮演游戏、 游戏Witcher 3(全高清/超高清)来查看 3D 性能在较长时间内的表现,即使在大约一个小时后,帧速率仍然非常稳定。
Witcher 3 FPS diagram
| low | med. | high | ultra | QHD | |
|---|---|---|---|---|---|
| GTA V (2015) | 181.2 | 175.3 | 115.8 | ||
| The Witcher 3 (2015) | 114 | ||||
| Dota 2 Reborn (2015) | 202 | 178.9 | 167 | 154.1 | |
| Final Fantasy XV Benchmark (2018) | 147.5 | 108.3 | |||
| X-Plane 11.11 (2018) | 166.6 | 141.7 | 114.9 | ||
| Strange Brigade (2018) | 272 | 220 | 194.2 | ||
| The Finals (2023) | 168 | 130.2 | 82.8 | ||
| Ready or Not (2023) | 194.2 | 134 | 84.8 | ||
| Prince of Persia The Lost Crown (2024) | 358 | 358 | 325 | ||
| Palworld (2024) | 102.2 | 96.6 | 69.1 | ||
| Enshrouded (2024) | 66.6 | 56.5 | 42.3 | ||
| Helldivers 2 (2024) | 91.5 | 91.1 | 69.2 |
排放量
噪音排放
如果只使用平衡模式,16 英寸设备的声音不会太大。44 至 47 分贝(A)的 3D 噪音水平可以听到,但并不令人讨厌(后者适用于录音超过 50 分贝的性能模式)。在空闲模式下,风扇持续工作,噪音为 29 至 31 dB(A),并不理想。
Noise level
| Idle |
| 29 / 30 / 31 dB(A) |
| Load |
| 45 / 47 dB(A) |
 | ||
30 dB silent 40 dB(A) audible 50 dB(A) loud |
||
min: | ||
| HP Omen Transcend 16-u1095ng i9-14900HX, GeForce RTX 4070 Laptop GPU | HP Omen Transcend 16 i9-13900HX, GeForce RTX 4070 Laptop GPU | Asus ROG Zephyrus G16 2024 GU605M Ultra 7 155H, GeForce RTX 4070 Laptop GPU | Schenker XMG CORE 16 (L23) R7 7840HS, GeForce RTX 4070 Laptop GPU | Lenovo Legion Pro 5 16ARX8 R7 7745HX, GeForce RTX 4070 Laptop GPU | |
|---|---|---|---|---|---|
| Noise | -4% | 7% | 5% | 10% | |
| off / environment * (dB) | 24 | 22.9 5% | 23.9 -0% | 23 4% | 23.2 3% |
| Idle Minimum * (dB) | 29 | 29.1 -0% | 23.9 18% | 23 21% | 23.2 20% |
| Idle Average * (dB) | 30 | 29.1 3% | 27.8 7% | 28.48 5% | 23.2 23% |
| Idle Maximum * (dB) | 31 | 29.1 6% | 30.1 3% | 28.48 8% | 26.2 15% |
| Load Average * (dB) | 45 | 45.7 -2% | 34.2 24% | 30 33% | 31.4 30% |
| Witcher 3 ultra * (dB) | 44 | 54.3 -23% | 46.4 -5% | 54.12 -23% | 48.4 -10% |
| Load Maximum * (dB) | 47 | 54.3 -16% | 46.4 1% | 54.12 -15% | 53.8 -14% |
* ... smaller is better
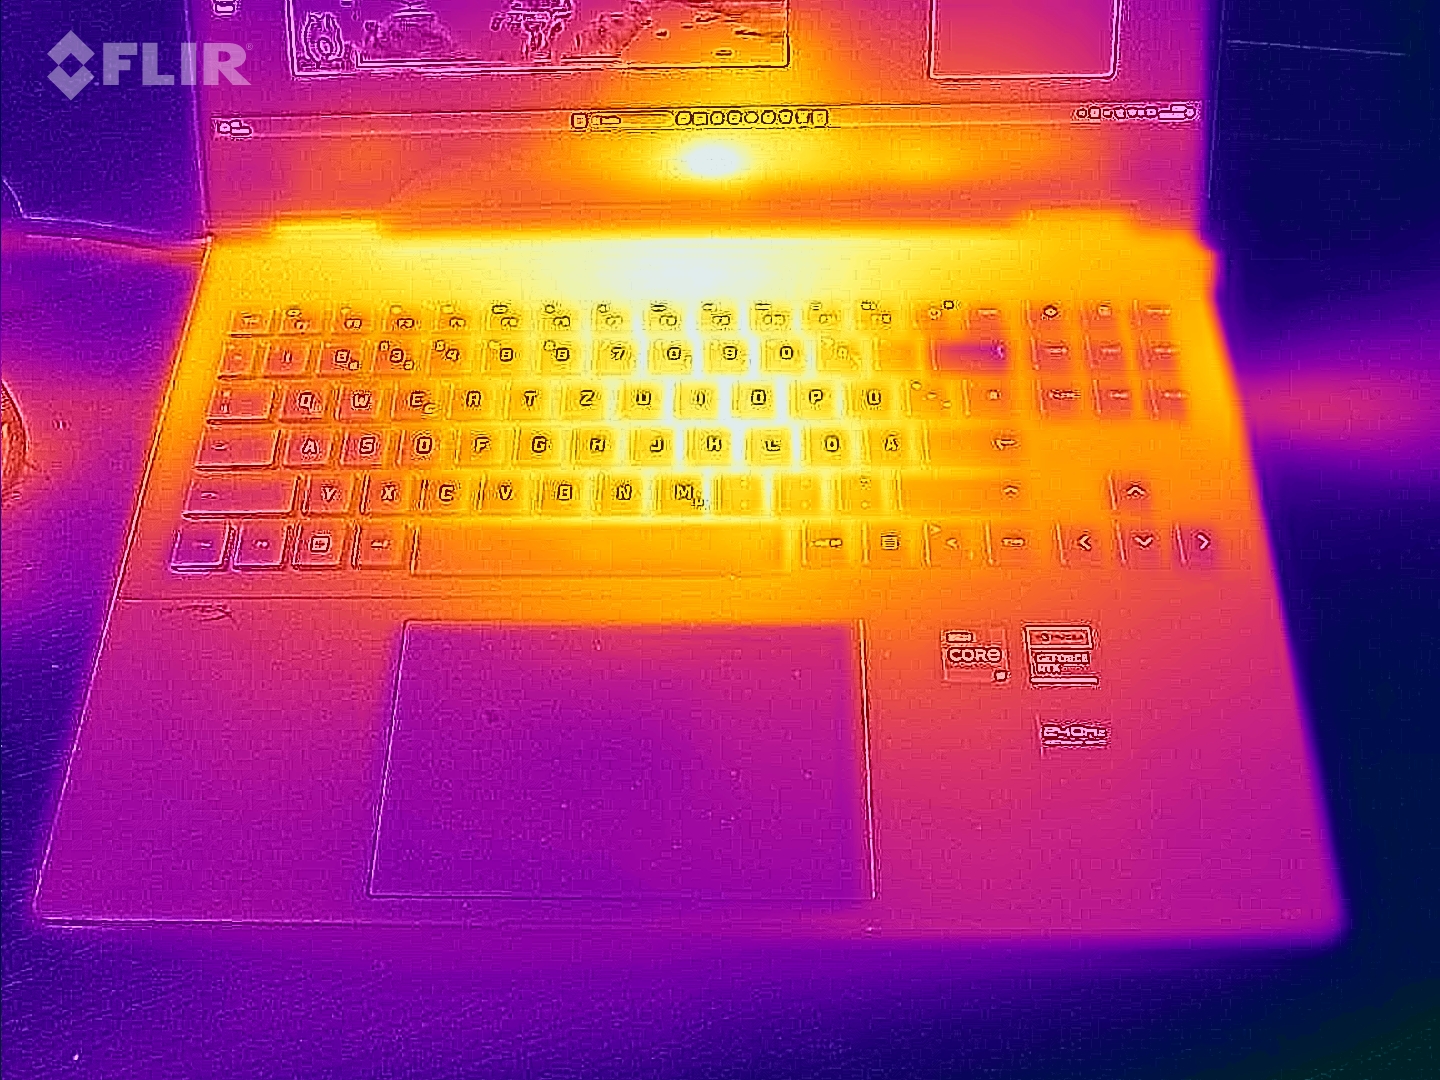
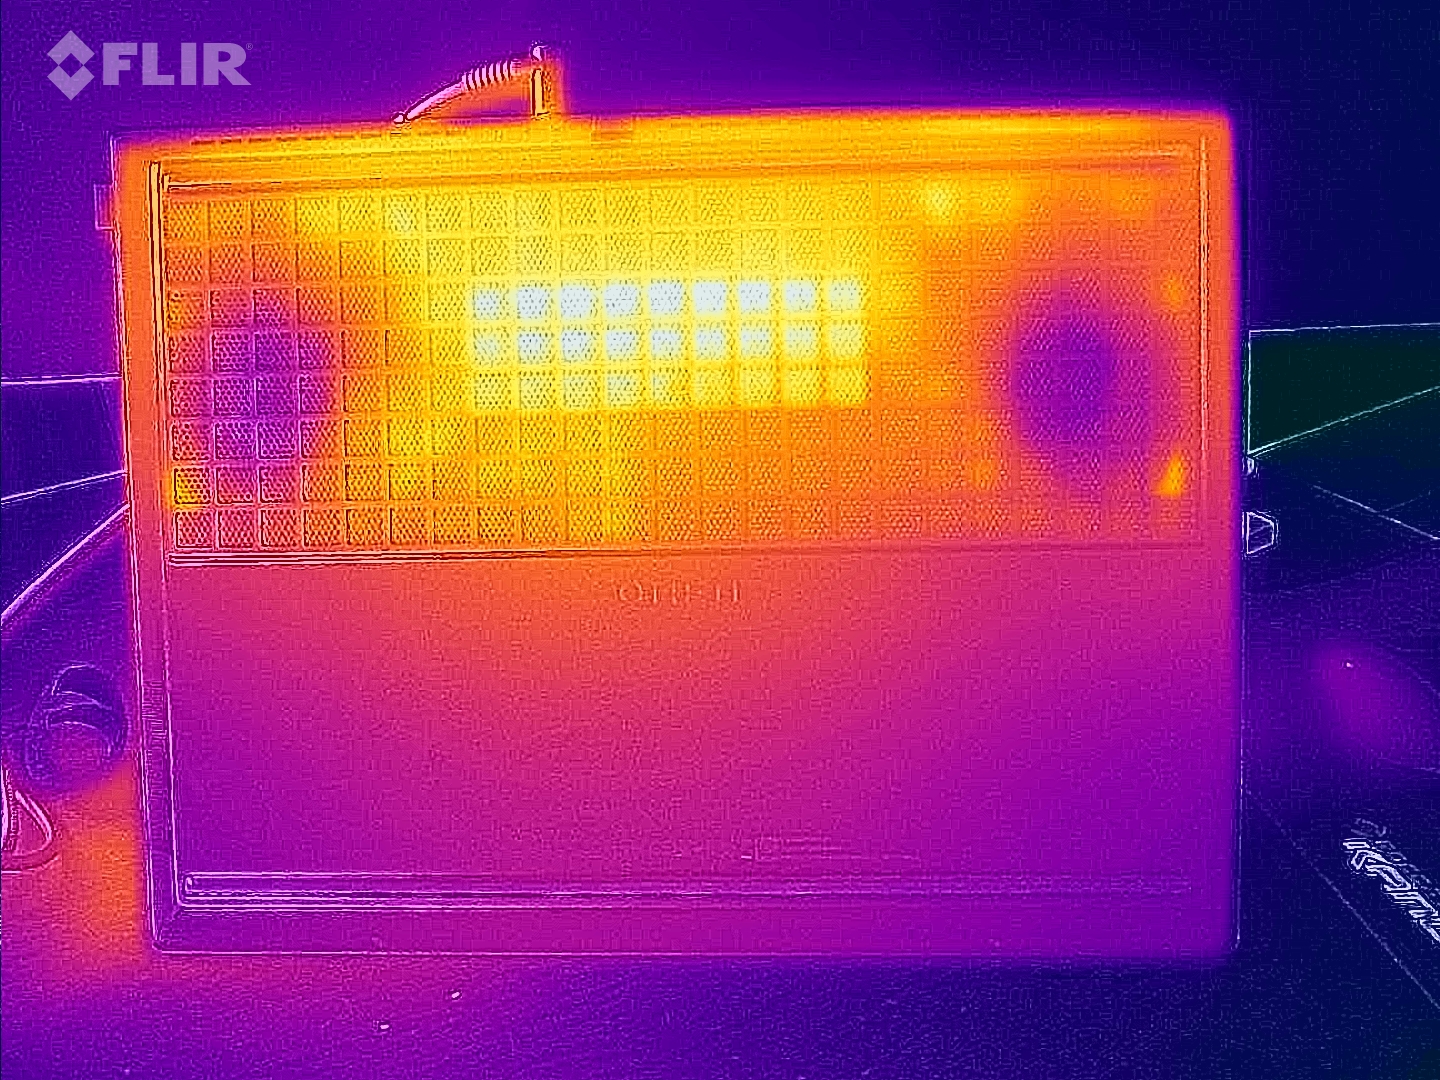
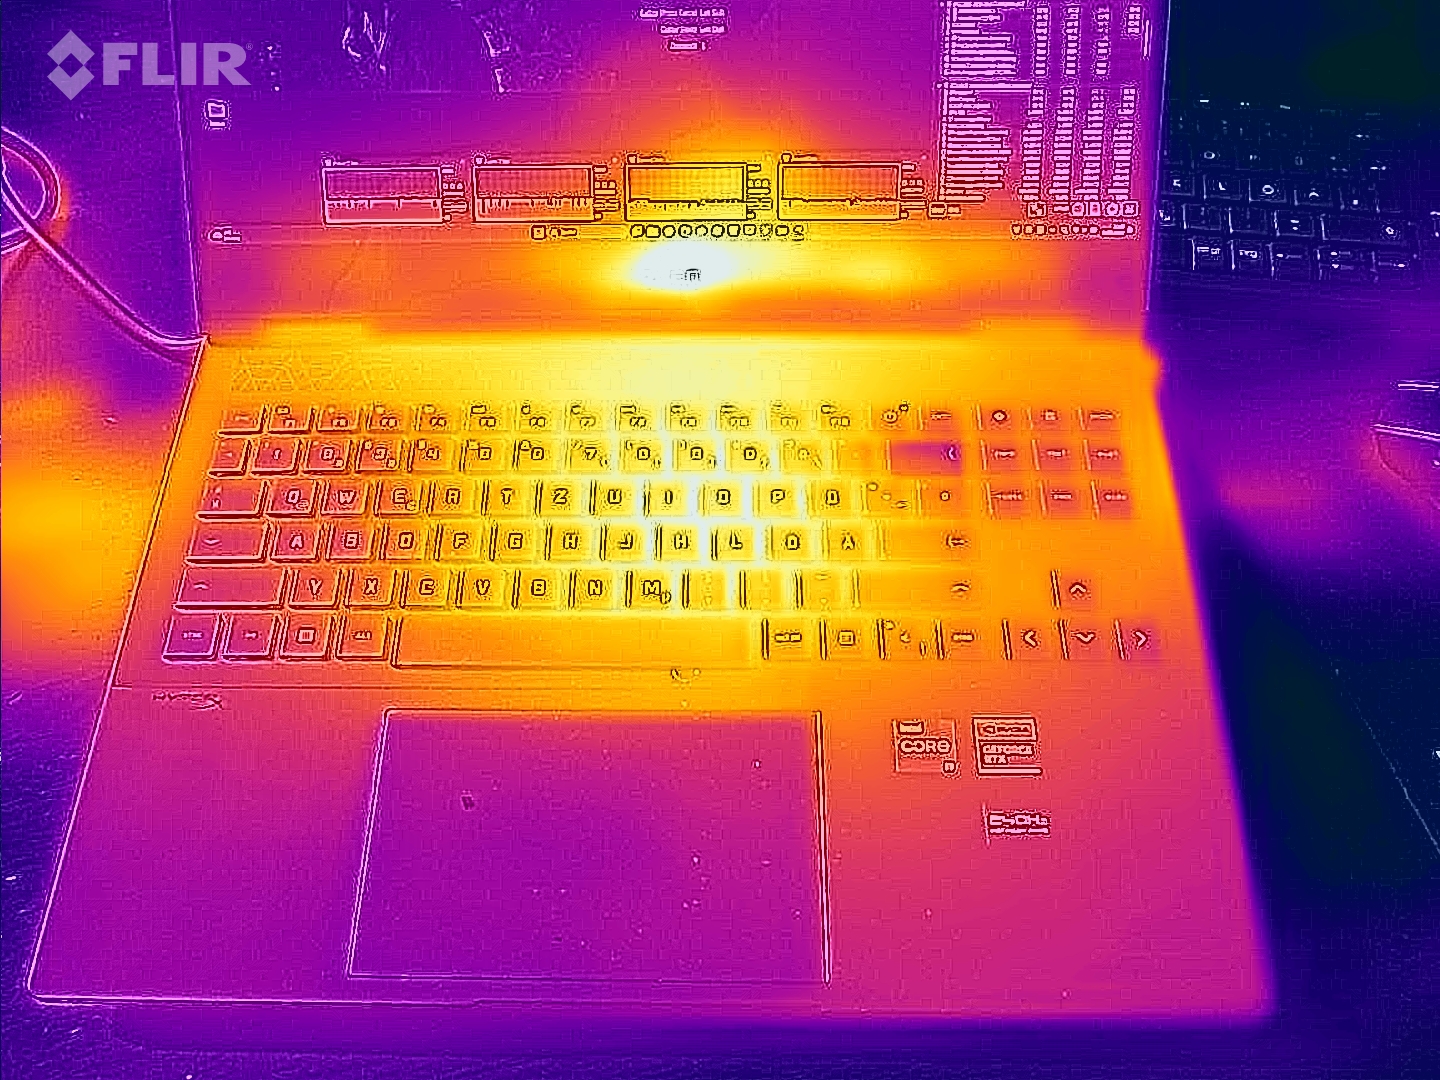
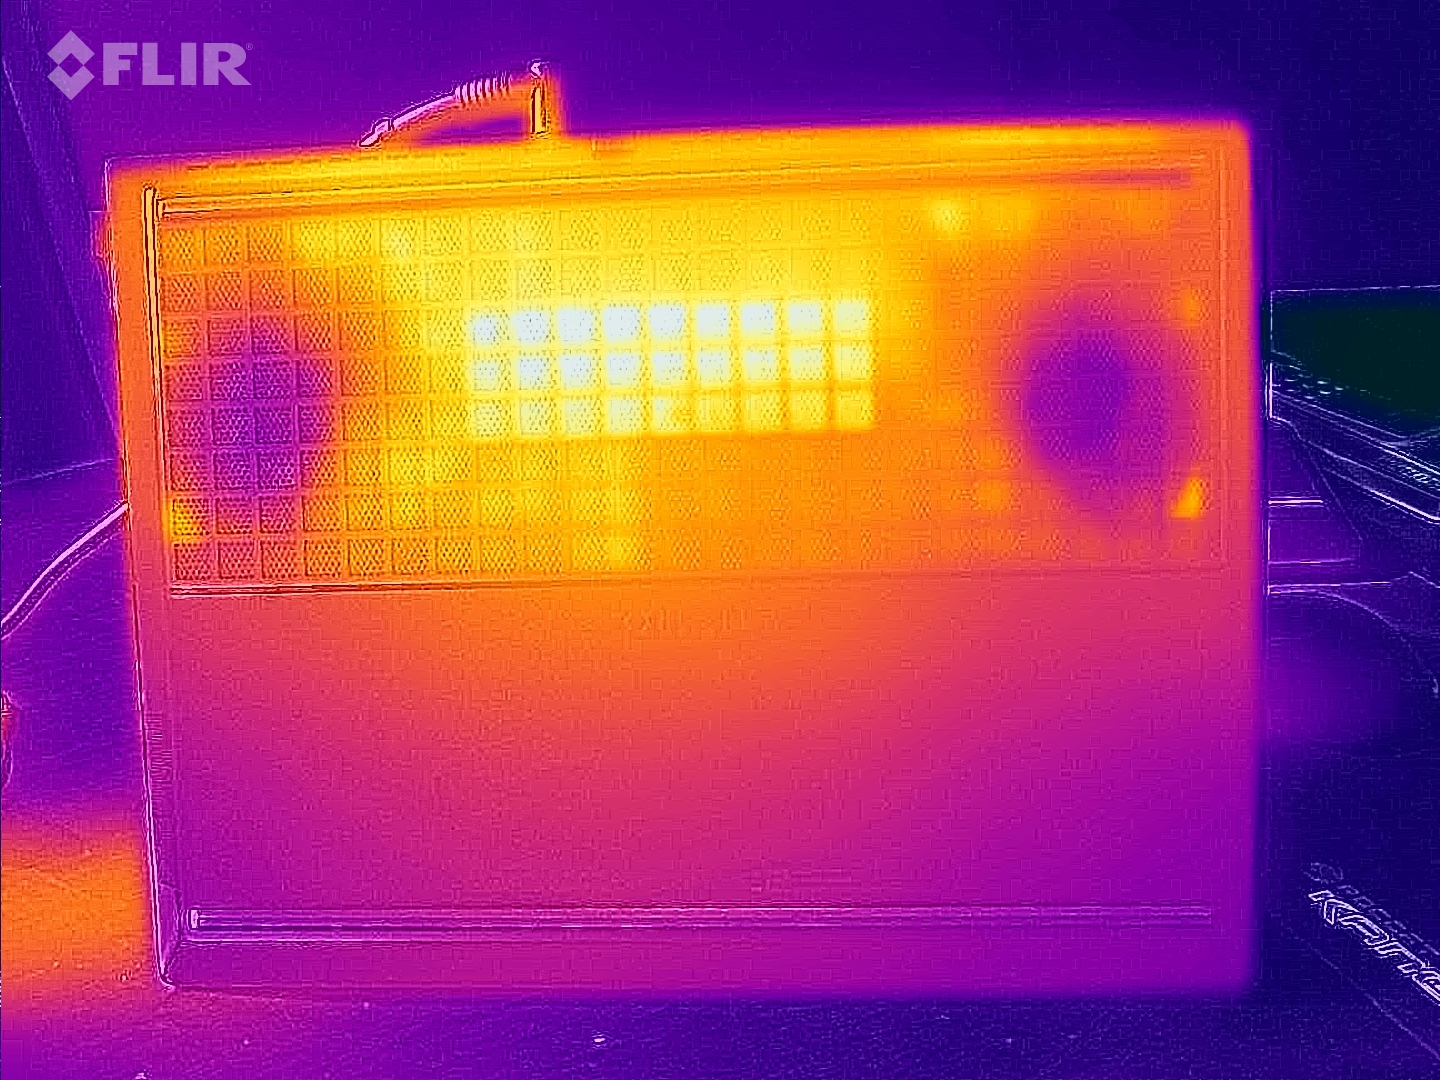
温度
虽然笔记本顶部的温度在同类产品中处于中等水平,但在负载情况下,机箱底部的温度却高于同类产品。最高 63 °C(游戏时)会使用户无法将设备放在膝盖上使用。而在空闲运行时,情况则要舒适得多,机箱最高温度保持在 30 °C,凉爽宜人。
(-) The maximum temperature on the upper side is 49 °C / 120 F, compared to the average of 40.4 °C / 105 F, ranging from 21.2 to 68.8 °C for the class Gaming.
(-) The bottom heats up to a maximum of 63 °C / 145 F, compared to the average of 43.2 °C / 110 F
(+) In idle usage, the average temperature for the upper side is 26.6 °C / 80 F, compared to the device average of 33.9 °C / 93 F.
(-) Playing The Witcher 3, the average temperature for the upper side is 40.3 °C / 105 F, compared to the device average of 33.9 °C / 93 F.
(+) The palmrests and touchpad are reaching skin temperature as a maximum (35 °C / 95 F) and are therefore not hot.
(-) The average temperature of the palmrest area of similar devices was 28.8 °C / 83.8 F (-6.2 °C / -11.2 F).
| HP Omen Transcend 16-u1095ng i9-14900HX, GeForce RTX 4070 Laptop GPU | HP Omen Transcend 16 i9-13900HX, GeForce RTX 4070 Laptop GPU | Asus ROG Zephyrus G16 2024 GU605M Ultra 7 155H, GeForce RTX 4070 Laptop GPU | Schenker XMG CORE 16 (L23) R7 7840HS, GeForce RTX 4070 Laptop GPU | Lenovo Legion Pro 5 16ARX8 R7 7745HX, GeForce RTX 4070 Laptop GPU | |
|---|---|---|---|---|---|
| Heat | 5% | 6% | 4% | 12% | |
| Maximum Upper Side * (°C) | 49 | 47.4 3% | 50.3 -3% | 46 6% | 41.8 15% |
| Maximum Bottom * (°C) | 63 | 54.4 14% | 48 24% | 44 30% | 41.4 34% |
| Idle Upper Side * (°C) | 30 | 28.4 5% | 28.8 4% | 32 -7% | 29 3% |
| Idle Bottom * (°C) | 29 | 29.2 -1% | 29.8 -3% | 33 -14% | 30.4 -5% |
* ... smaller is better
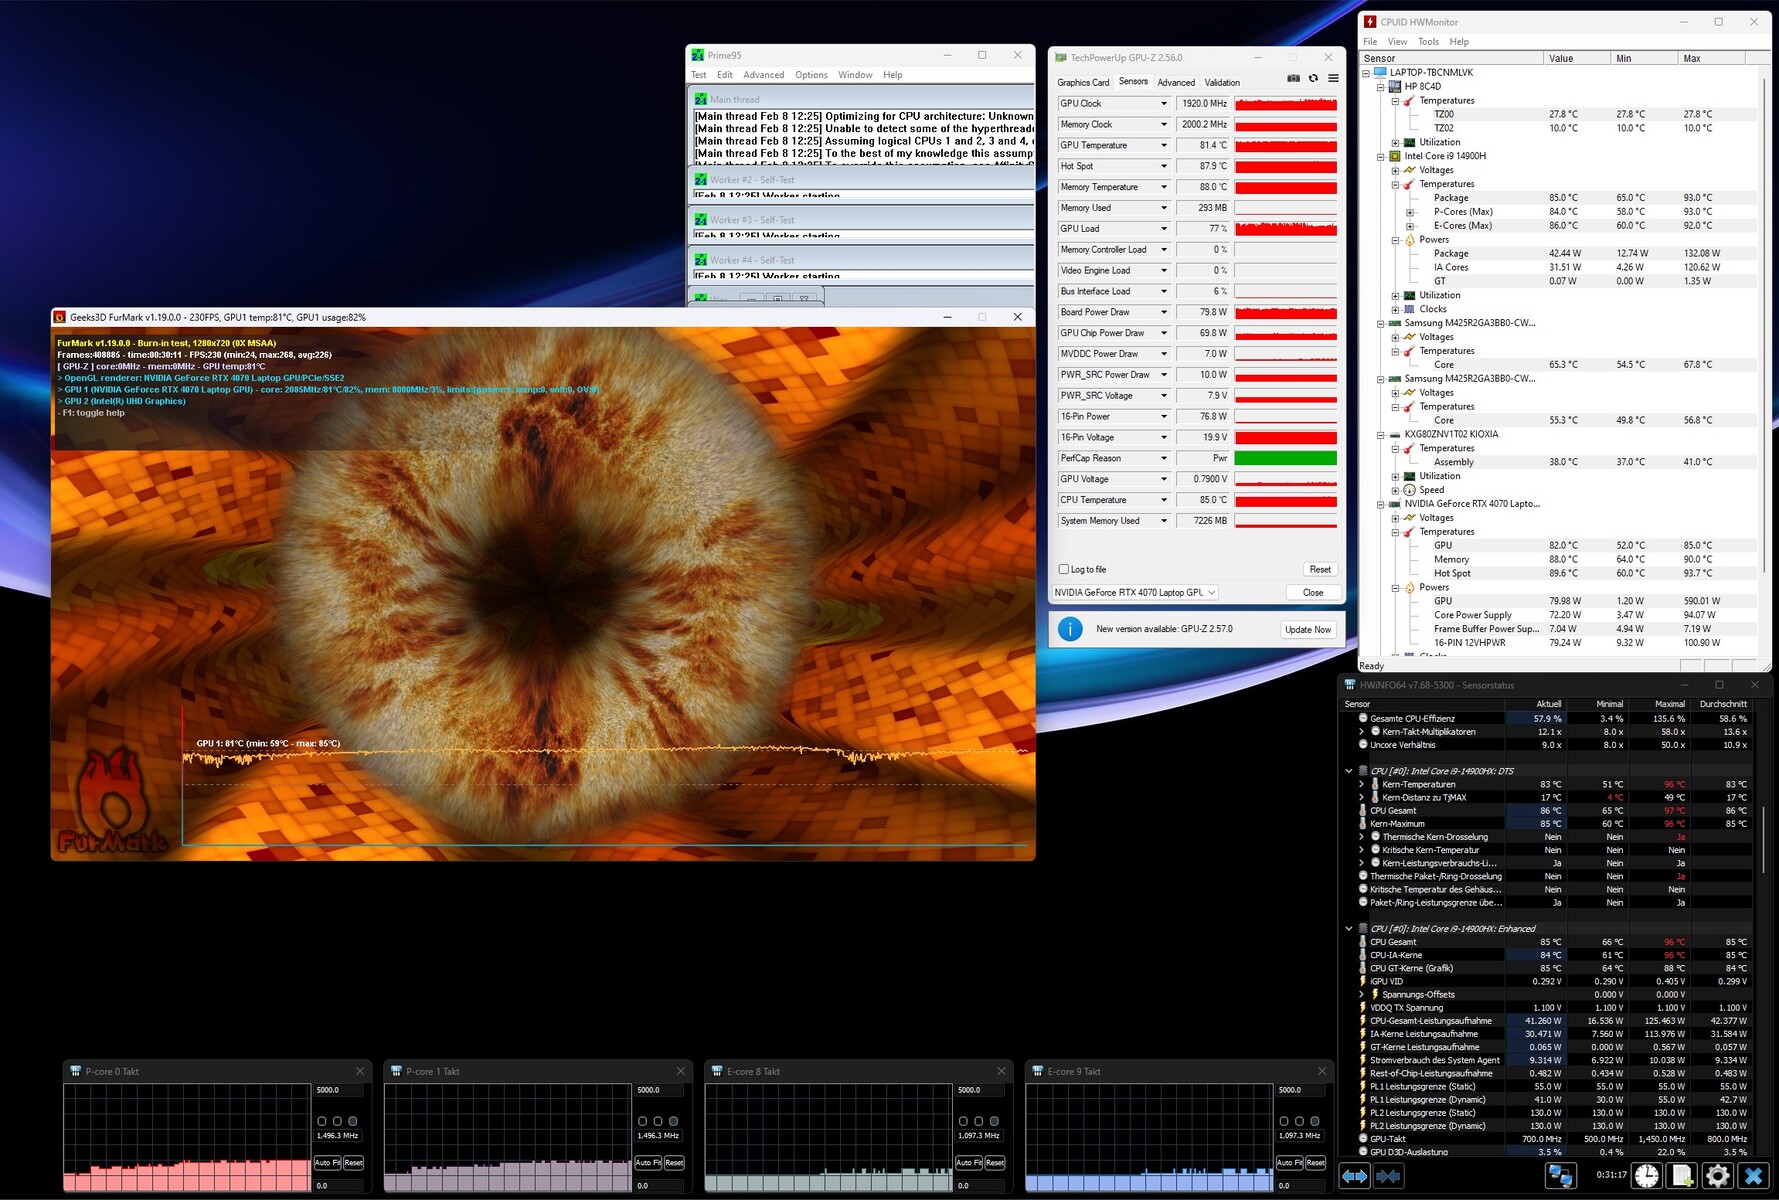
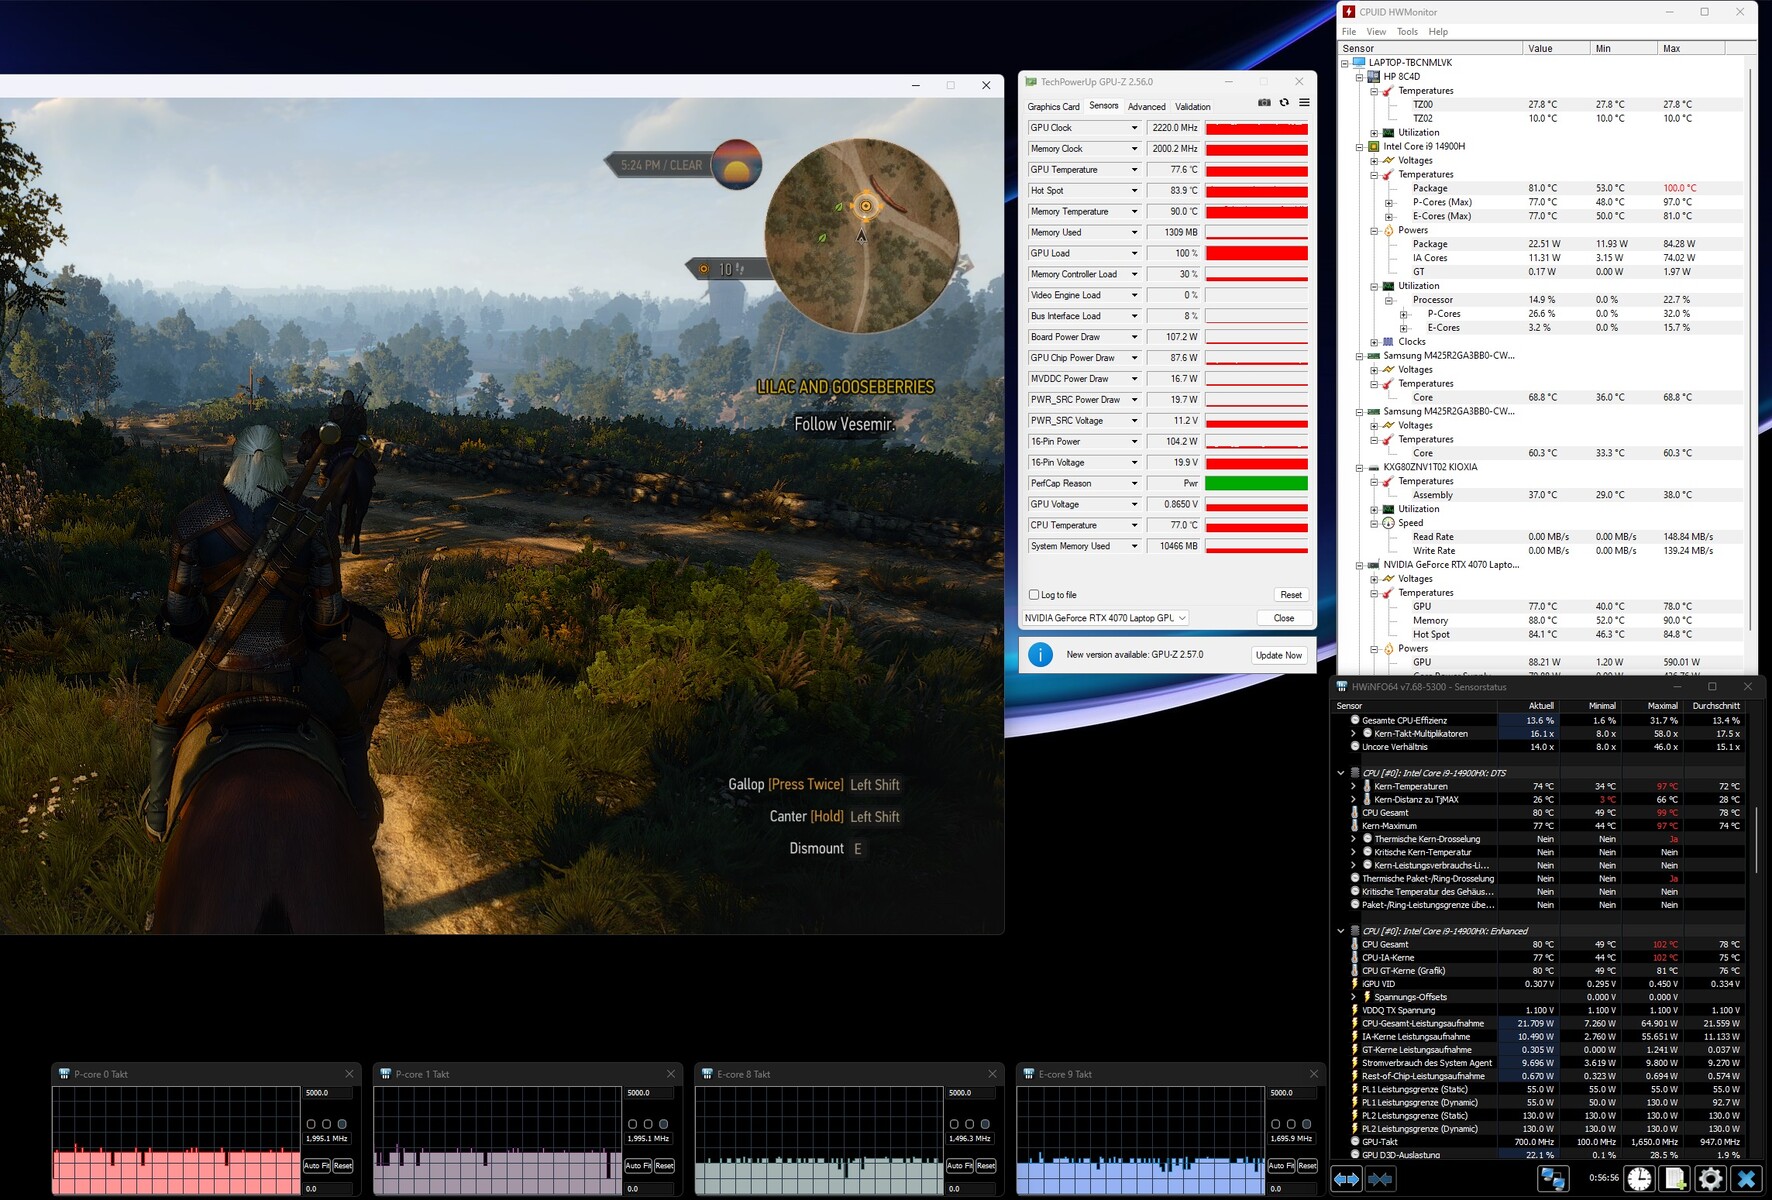
压力测试
在使用 Furmark 和 Prime95 工具进行的压力测试中,60 分钟后,CPU 稳定在 85 °C左右,而 GPU 则达到 81 °C(热点为 88 °C)--这两个数值都相对较高,但并无大碍。
发言人
音质略好于整体游戏笔记本电脑的平均水平,不过,正如通常的情况一样,低音不够强劲,还可以更有力、更精确。最大音量为 82 dB(A),还算不错。
HP Omen Transcend 16-u1095ng audio analysis
(+) | speakers can play relatively loud (82 dB)
Bass 100 - 315 Hz
(-) | nearly no bass - on average 21.9% lower than median
(±) | linearity of bass is average (11% delta to prev. frequency)
Mids 400 - 2000 Hz
(+) | balanced mids - only 3.2% away from median
(+) | mids are linear (5.3% delta to prev. frequency)
Highs 2 - 16 kHz
(+) | balanced highs - only 1.4% away from median
(+) | highs are linear (5.2% delta to prev. frequency)
Overall 100 - 16.000 Hz
(+) | overall sound is linear (14.5% difference to median)
Compared to same class
» 27% of all tested devices in this class were better, 7% similar, 66% worse
» The best had a delta of 6%, average was 18%, worst was 132%
Compared to all devices tested
» 18% of all tested devices were better, 4% similar, 77% worse
» The best had a delta of 4%, average was 23%, worst was 134%
Asus ROG Zephyrus G16 2024 GU605M audio analysis
(+) | speakers can play relatively loud (83.3 dB)
Bass 100 - 315 Hz
(+) | good bass - only 3.8% away from median
(±) | linearity of bass is average (8.1% delta to prev. frequency)
Mids 400 - 2000 Hz
(+) | balanced mids - only 3.5% away from median
(+) | mids are linear (2.4% delta to prev. frequency)
Highs 2 - 16 kHz
(+) | balanced highs - only 2.2% away from median
(+) | highs are linear (3.7% delta to prev. frequency)
Overall 100 - 16.000 Hz
(+) | overall sound is linear (7.3% difference to median)
Compared to same class
» 1% of all tested devices in this class were better, 0% similar, 99% worse
» The best had a delta of 6%, average was 18%, worst was 132%
Compared to all devices tested
» 1% of all tested devices were better, 0% similar, 99% worse
» The best had a delta of 4%, average was 23%, worst was 134%
能源管理
耗电量
能耗要求与该性能类别中的标准值相似。闲置时的能耗为 10 至 32 瓦,负载时的能耗为 128 至 242 瓦,既不算高,也不算低。
| Off / Standby | |
| Idle | |
| Load |
|
Key:
min: | |
| HP Omen Transcend 16-u1095ng i9-14900HX, GeForce RTX 4070 Laptop GPU | HP Omen Transcend 16 i9-13900HX, GeForce RTX 4070 Laptop GPU | Asus ROG Zephyrus G16 2024 GU605M Ultra 7 155H, GeForce RTX 4070 Laptop GPU | Schenker XMG CORE 16 (L23) R7 7840HS, GeForce RTX 4070 Laptop GPU | Lenovo Legion Pro 5 16ARX8 R7 7745HX, GeForce RTX 4070 Laptop GPU | Average of class Gaming | |
|---|---|---|---|---|---|---|
| Power Consumption | -42% | 33% | 12% | 1% | -1% | |
| Idle Minimum * (Watt) | 10 | 19.2 -92% | 8.3 17% | 11 -10% | 8.1 19% | 13 ? -30% |
| Idle Average * (Watt) | 18 | 22.7 -26% | 12.5 31% | 15.2 16% | 15.9 12% | 18.7 ? -4% |
| Idle Maximum * (Watt) | 32 | 55.4 -73% | 12.8 60% | 16 50% | 37.2 -16% | 24.3 ? 24% |
| Load Average * (Watt) | 128 | 128.4 -0% | 71.3 44% | 64 50% | 90.9 29% | 110.2 ? 14% |
| Witcher 3 ultra * (Watt) | 148.4 | 206 -39% | 127.5 14% | 179 -21% | 189.6 -28% | |
| Load Maximum * (Watt) | 242 | 292 -21% | 169.1 30% | 280 -16% | 263.5 -9% | 258 ? -7% |
* ... smaller is better
Power consumption Witcher 3 / stress test
Power consumption with an external monitor
电池寿命
说到电池模式下的能耗要求,惠普还有一些工作要做。尽管配备了强劲的 97 Wh 电池,但在我们的 Wi-Fi 测试中,在亮度降低至 150 cd/m² 的情况下,这款 16 英寸的机器仅能坚持不到 5 个小时。作为对比:ROG Zyphrus G16 的续航时间超过了 7 小时,XMG Core 16 甚至超过了 8 小时。
| HP Omen Transcend 16-u1095ng i9-14900HX, GeForce RTX 4070 Laptop GPU, 97 Wh | HP Omen Transcend 16 i9-13900HX, GeForce RTX 4070 Laptop GPU, 97 Wh | Asus ROG Zephyrus G16 2024 GU605M Ultra 7 155H, GeForce RTX 4070 Laptop GPU, 90 Wh | Schenker XMG CORE 16 (L23) R7 7840HS, GeForce RTX 4070 Laptop GPU, 99 Wh | Lenovo Legion Pro 5 16ARX8 R7 7745HX, GeForce RTX 4070 Laptop GPU, 80 Wh | Average of class Gaming | |
|---|---|---|---|---|---|---|
| Battery runtime | -14% | 49% | 71% | -18% | 46% | |
| WiFi v1.3 (h) | 4.9 | 4.2 -14% | 7.3 49% | 8.4 71% | 4 -18% | 7.15 ? 46% |
| Reader / Idle (h) | 6.3 | 6.5 | 8.71 ? | |||
| Load (h) | 1.2 | 1.2 | 2.4 | 1 | 1.502 ? | |
| H.264 (h) | 11.2 | 10.2 | 8.64 ? |
Pros
Cons
判决
首先,Omen Transcend 16-u1095ng 试图通过绚丽的 OLED 显示屏吸引潜在客户,这对游戏玩家和创作者都有好处。
如果你能接受反射率很高的屏幕,并且对闪烁没有意见,那么你就能得到一个色彩艳丽、对比度极高、响应时间极快的显示屏,而且黑度和可视角度都很出色。
排放和速度方面有一些减分项。在性能模式下,16 英寸机器的噪音令人不快,而平衡模式的性能似乎低于平均水平。除此之外,Omen Transcend 16 在外壳质量、输入设备和端口选择方面与其他游戏笔记本电脑相似。
总体而言,总分与 XMG 酷睿 16 L23或 Legion Pro 5 16ARX8.如果您想在 16 英寸产品中寻找一款特别轻巧的设备,不妨考虑一下新的 ROG Zeyphrus G16.
价格和供应情况
在我们进行评测时,搭载酷睿 i9-14900HX 和GeForce RTX 4070 的 HP Omen Transcend 16-u1095ng 目前在惠普在线商店、亚马逊或百思买均无货。
HP Omen Transcend 16-u1095ng
- 02/12/2024 v7 (old)
Florian Glaser
Transparency
The selection of devices to be reviewed is made by our editorial team. The test sample was provided to the author as a loan by the manufacturer or retailer for the purpose of this review. The lender had no influence on this review, nor did the manufacturer receive a copy of this review before publication. There was no obligation to publish this review. As an independent media company, Notebookcheck is not subjected to the authority of manufacturers, retailers or publishers.
This is how Notebookcheck is testing
Every year, Notebookcheck independently reviews hundreds of laptops and smartphones using standardized procedures to ensure that all results are comparable. We have continuously developed our test methods for around 20 years and set industry standards in the process. In our test labs, high-quality measuring equipment is utilized by experienced technicians and editors. These tests involve a multi-stage validation process. Our complex rating system is based on hundreds of well-founded measurements and benchmarks, which maintains objectivity. Further information on our test methods can be found here.
Price comparison

