Alienware m16 R2 笔记本电脑评测:巨大而冒险的变化

Alienware m16 R2 是继 m16 R1的继承者,但并不是你所期望的那样。新机型对 m16 系列进行了彻底的重新设计和思考,试图同时吸引游戏玩家和普通用户,而 Alienware 的其他产品则主要面向铁杆游戏玩家。仅这一点就使 m16 R2 成为多年来最有趣的 Alienware 笔记本电脑之一,因为它牺牲了 m16 R1 上的一些高端 CPU 和 GPU 选项,转而采用更小的设计。
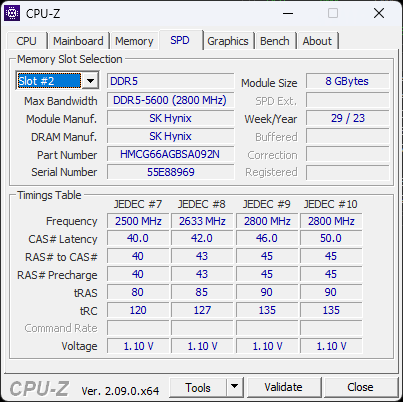
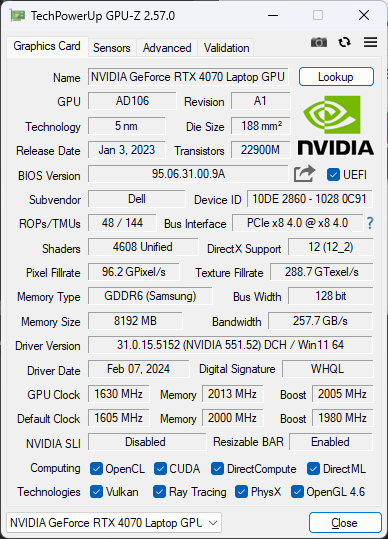
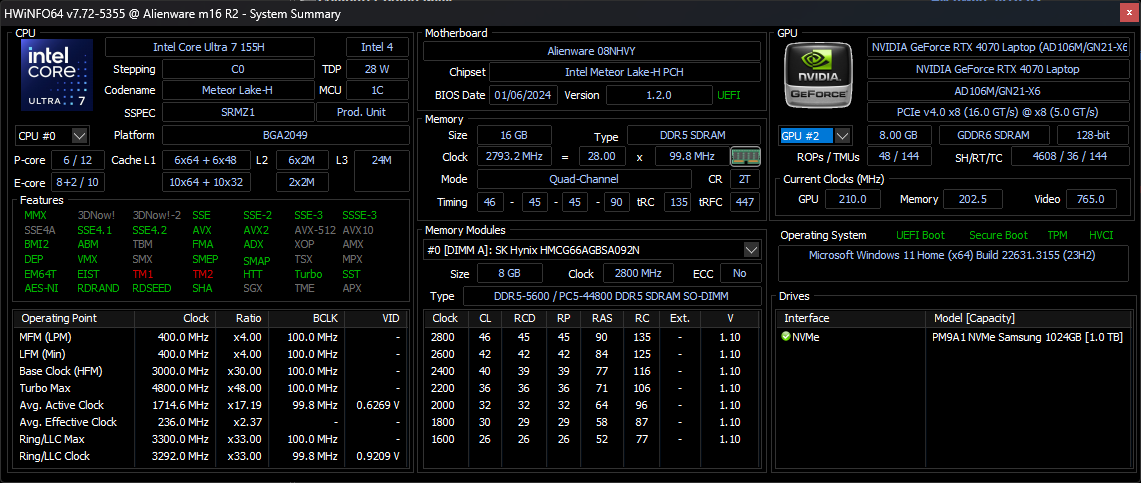
我们的评测机是高端配置,配备 Meteor Lake-H Core Ultra 7 155H CPU、GeForce RTX 4070 GPU 和 1600p 240 Hz IPS 显示屏,售价约为 1850 美元。低端 SKU 可以配置 RTX 4050 或 4060,高端 SKU 包括 Core Ultra 9,但所有配置都仅限于相同的 1600p240 IPS 显示屏和 RTX 4070。
Alienware m16 R2 的替代产品包括其他高性能 16 英寸笔记本电脑,如 雷蛇刀锋 16, HP Omen Transcend 16, 华硕 ROG Zephyrus G16或 联想Legion Slim 7 16.
更多 Alienware 评论:
潜在的竞争对手比较
Rating | Date | Model | Weight | Height | Size | Resolution | Price |
|---|---|---|---|---|---|---|---|
| 90.2 % v7 (old) | 03 / 2024 | Alienware m16 R2 Ultra 7 155H, GeForce RTX 4070 Laptop GPU | 2.5 kg | 23.5 mm | 16.00" | 2560x1600 | |
| 88.3 % v7 (old) | 09 / 2023 | Alienware m16 R1 Intel i7-13700HX, GeForce RTX 4060 Laptop GPU | 3 kg | 25.4 mm | 16.00" | 2560x1600 | |
| 88.4 % v7 (old) | 06 / 2023 | Alienware x16 R1 i9-13900HK, GeForce RTX 4080 Laptop GPU | 2.6 kg | 18.57 mm | 16.00" | 2560x1600 | |
| 88.4 % v7 (old) | 02 / 2024 | HP Omen Transcend 16-u1095ng i9-14900HX, GeForce RTX 4070 Laptop GPU | 2.3 kg | 20 mm | 16.00" | 2560x1600 | |
| 92.3 % v7 (old) | 02 / 2024 | Asus ROG Zephyrus G16 2024 GU605M Ultra 7 155H, GeForce RTX 4070 Laptop GPU | 1.8 kg | 16.4 mm | 16.00" | 2560x1600 | |
| 90.4 % v7 (old) | 11 / 2023 | Lenovo Legion Slim 7 16APH8 R7 7840HS, GeForce RTX 4060 Laptop GPU | 2.1 kg | 20 mm | 16.00" | 2560x1600 |
案例 - 重新定义传奇 3.0
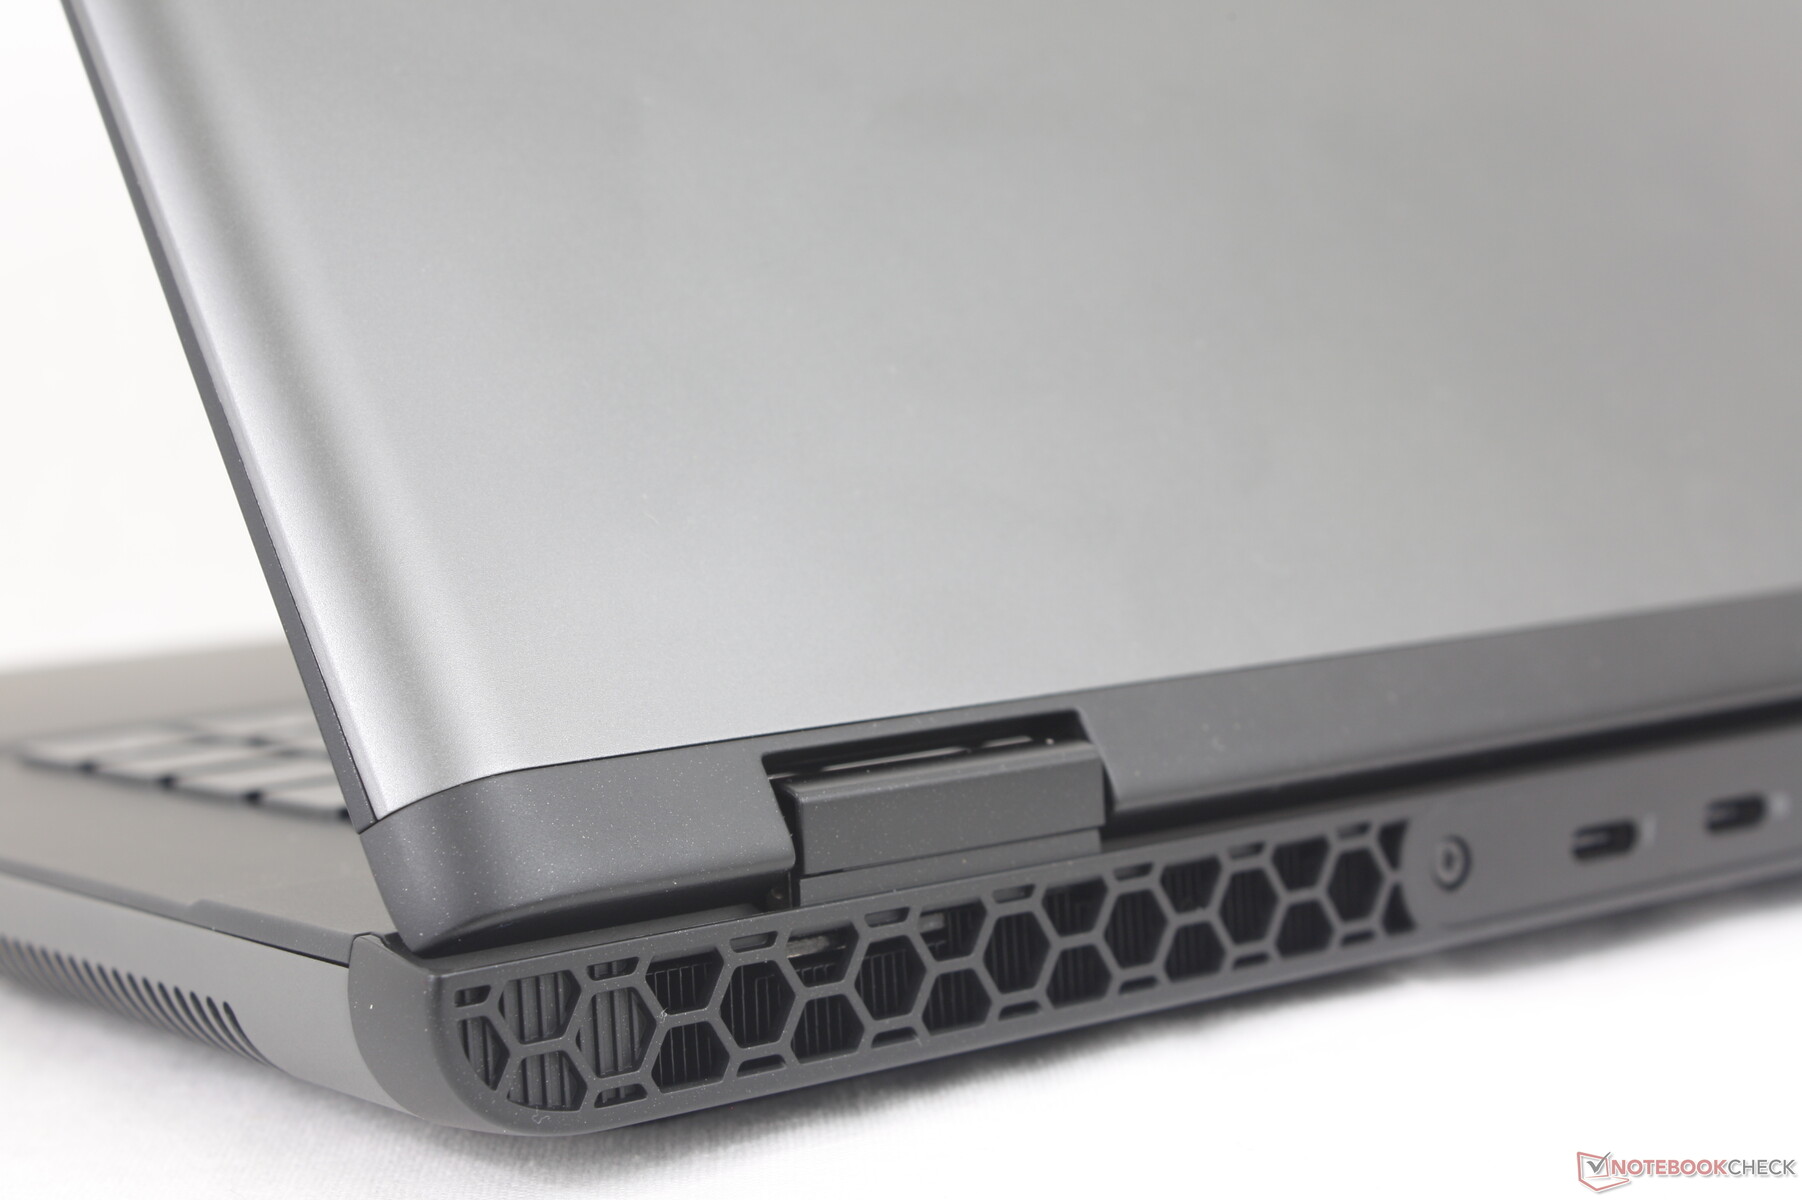
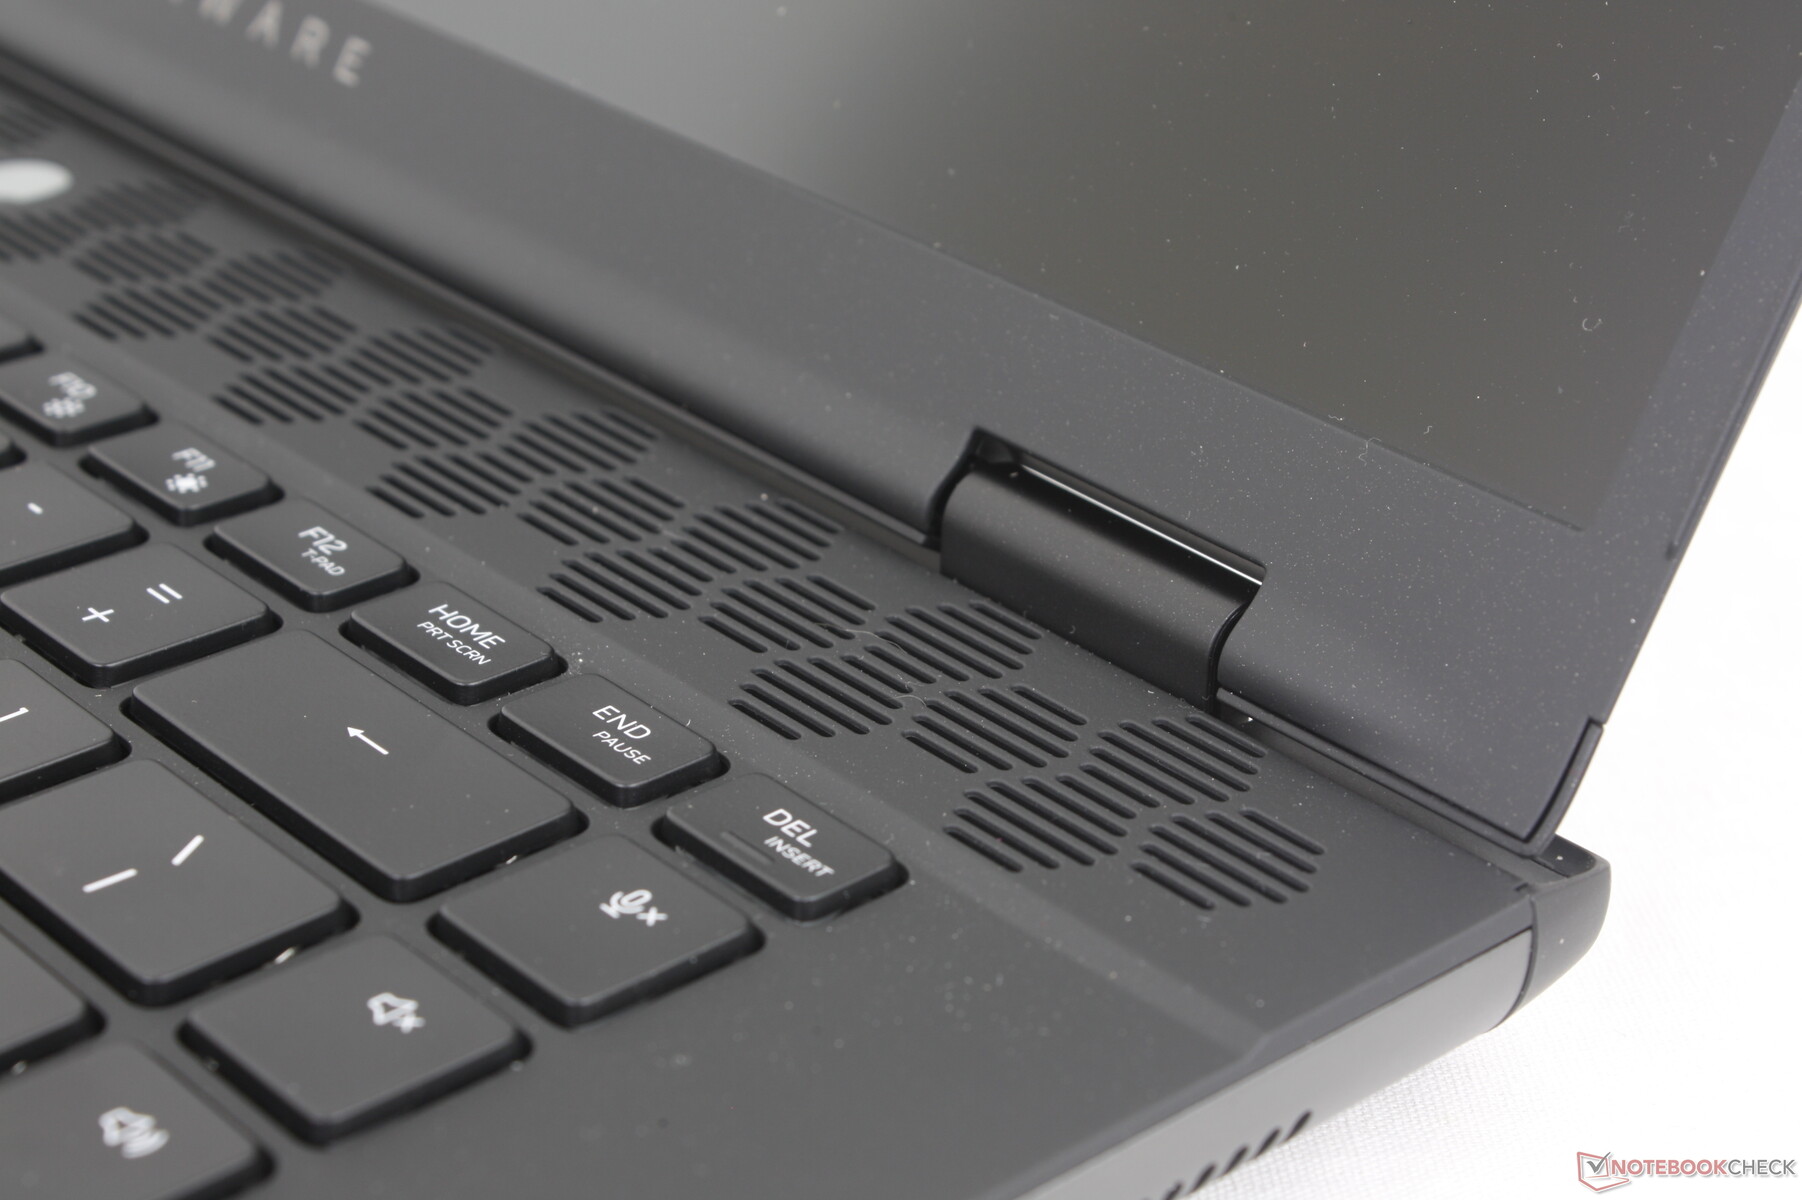
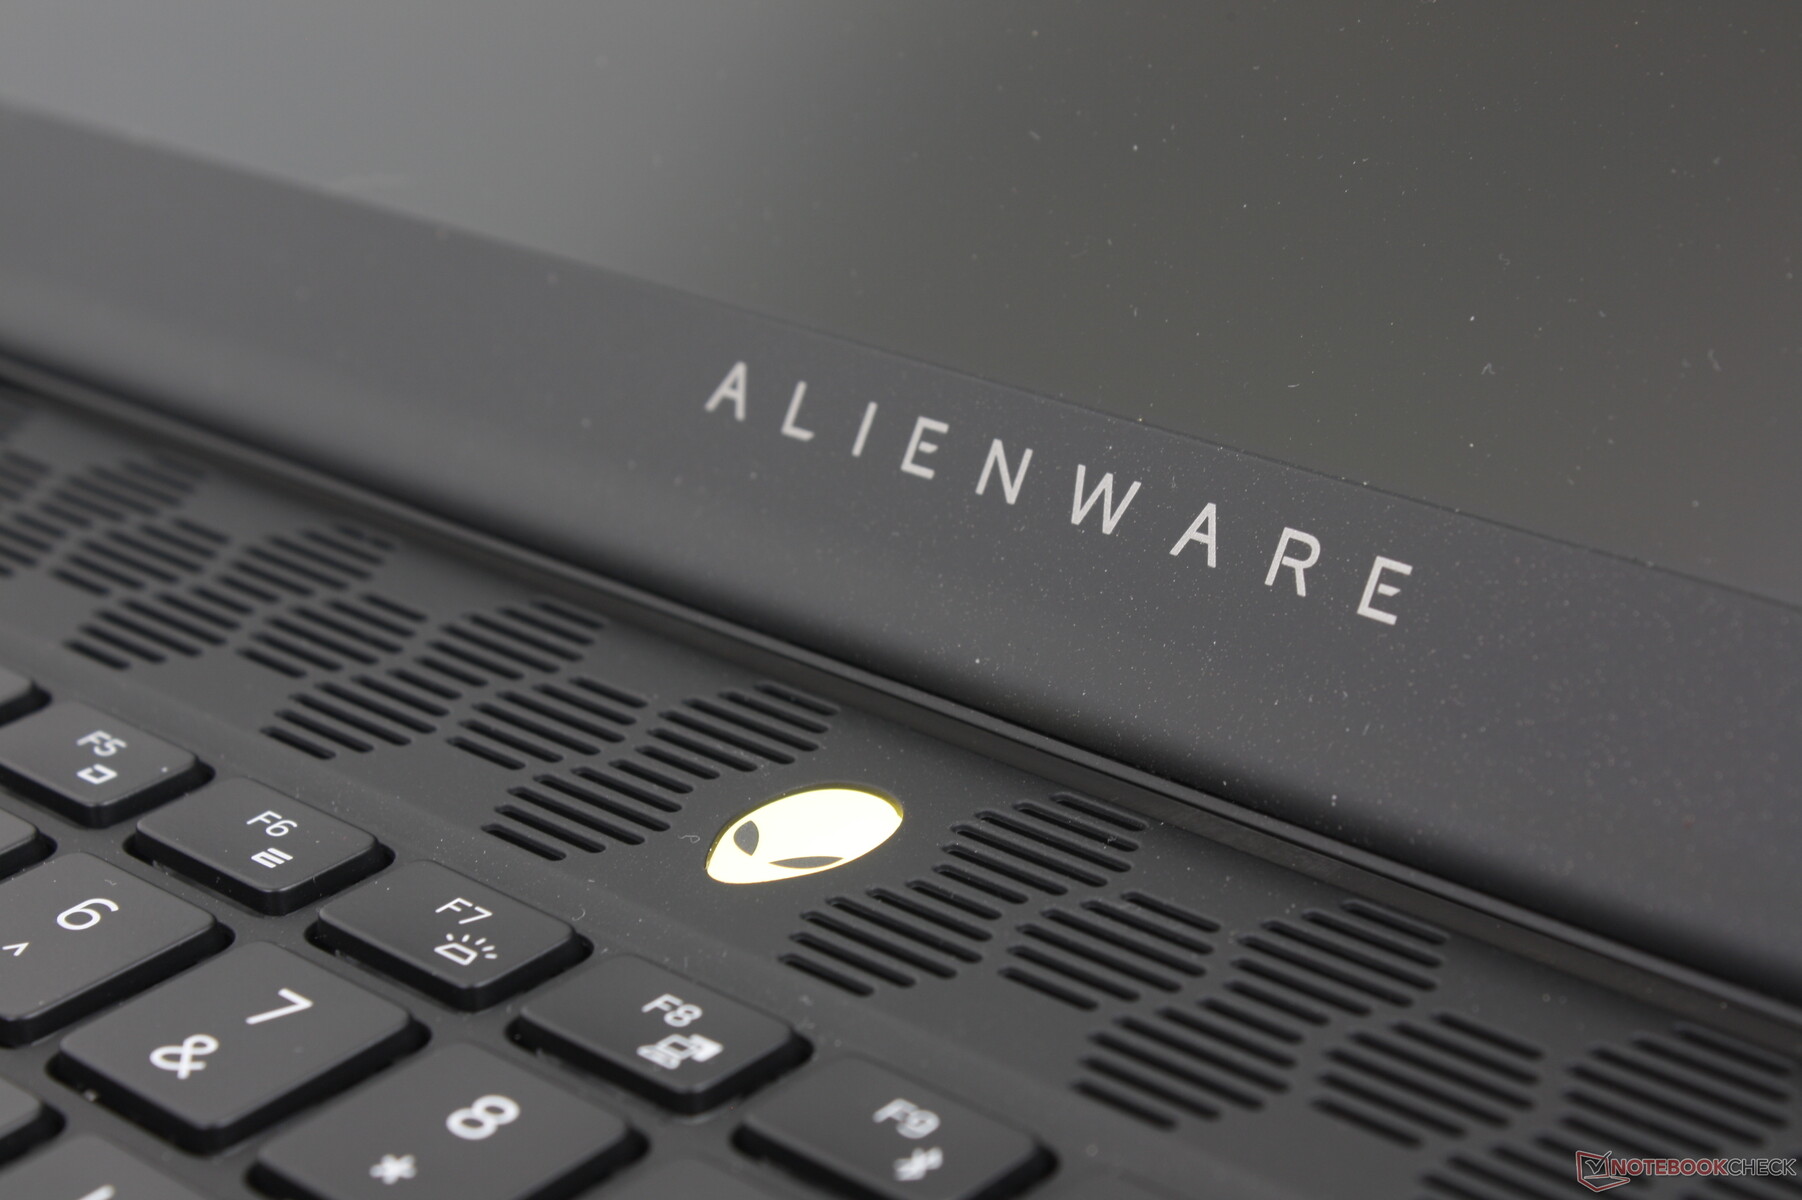
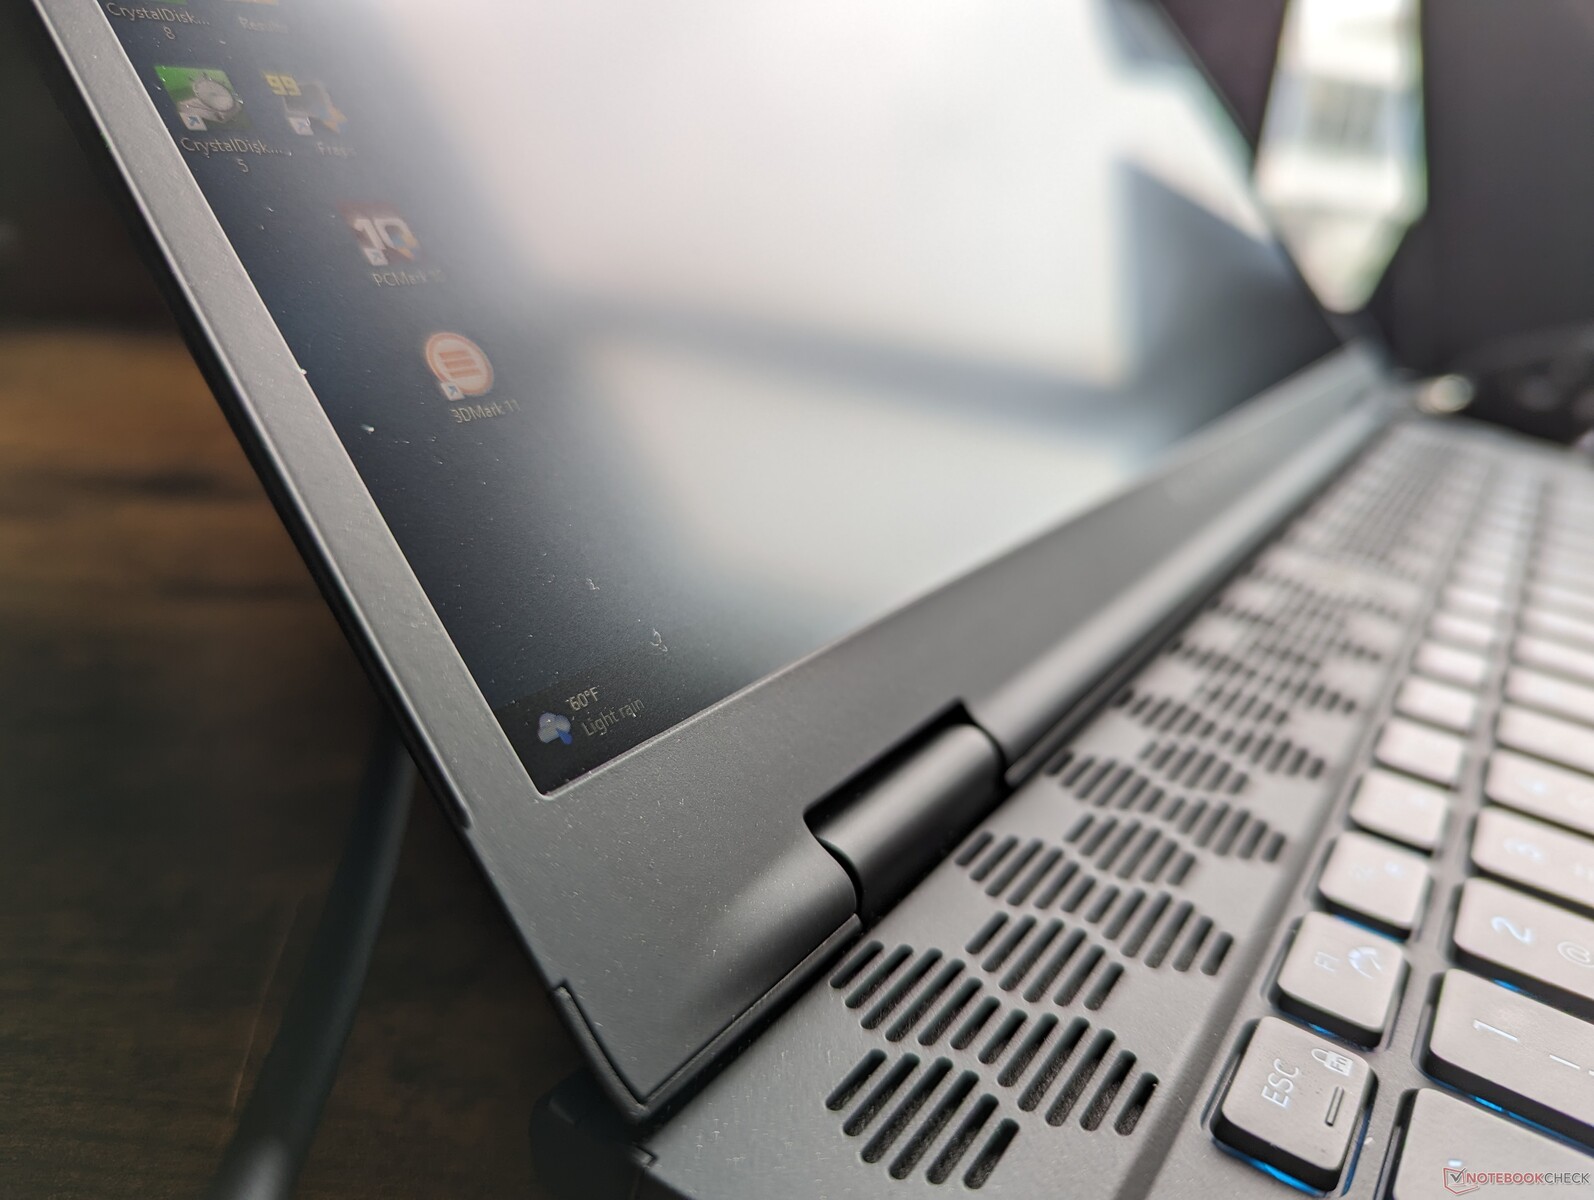
撠 Alienware m16 R1戴尔推出 m16 R2 还不到一年时间,就已经对机箱设计进行了修改。最显著的变化是取消了机身后部突出的散热板,使机身占地面积比以前更小。机身背面的 RGB LED 圆环也不见了,键盘也被向上推,以便为更大的掌托和更大的点击板腾出空间。
机箱材料与以前一样,质感和手感相似。机身的刚性没有任何明显的变化,因此从上到下仍然感觉相当坚固,没有重大的吱吱作响或明显的薄弱点。
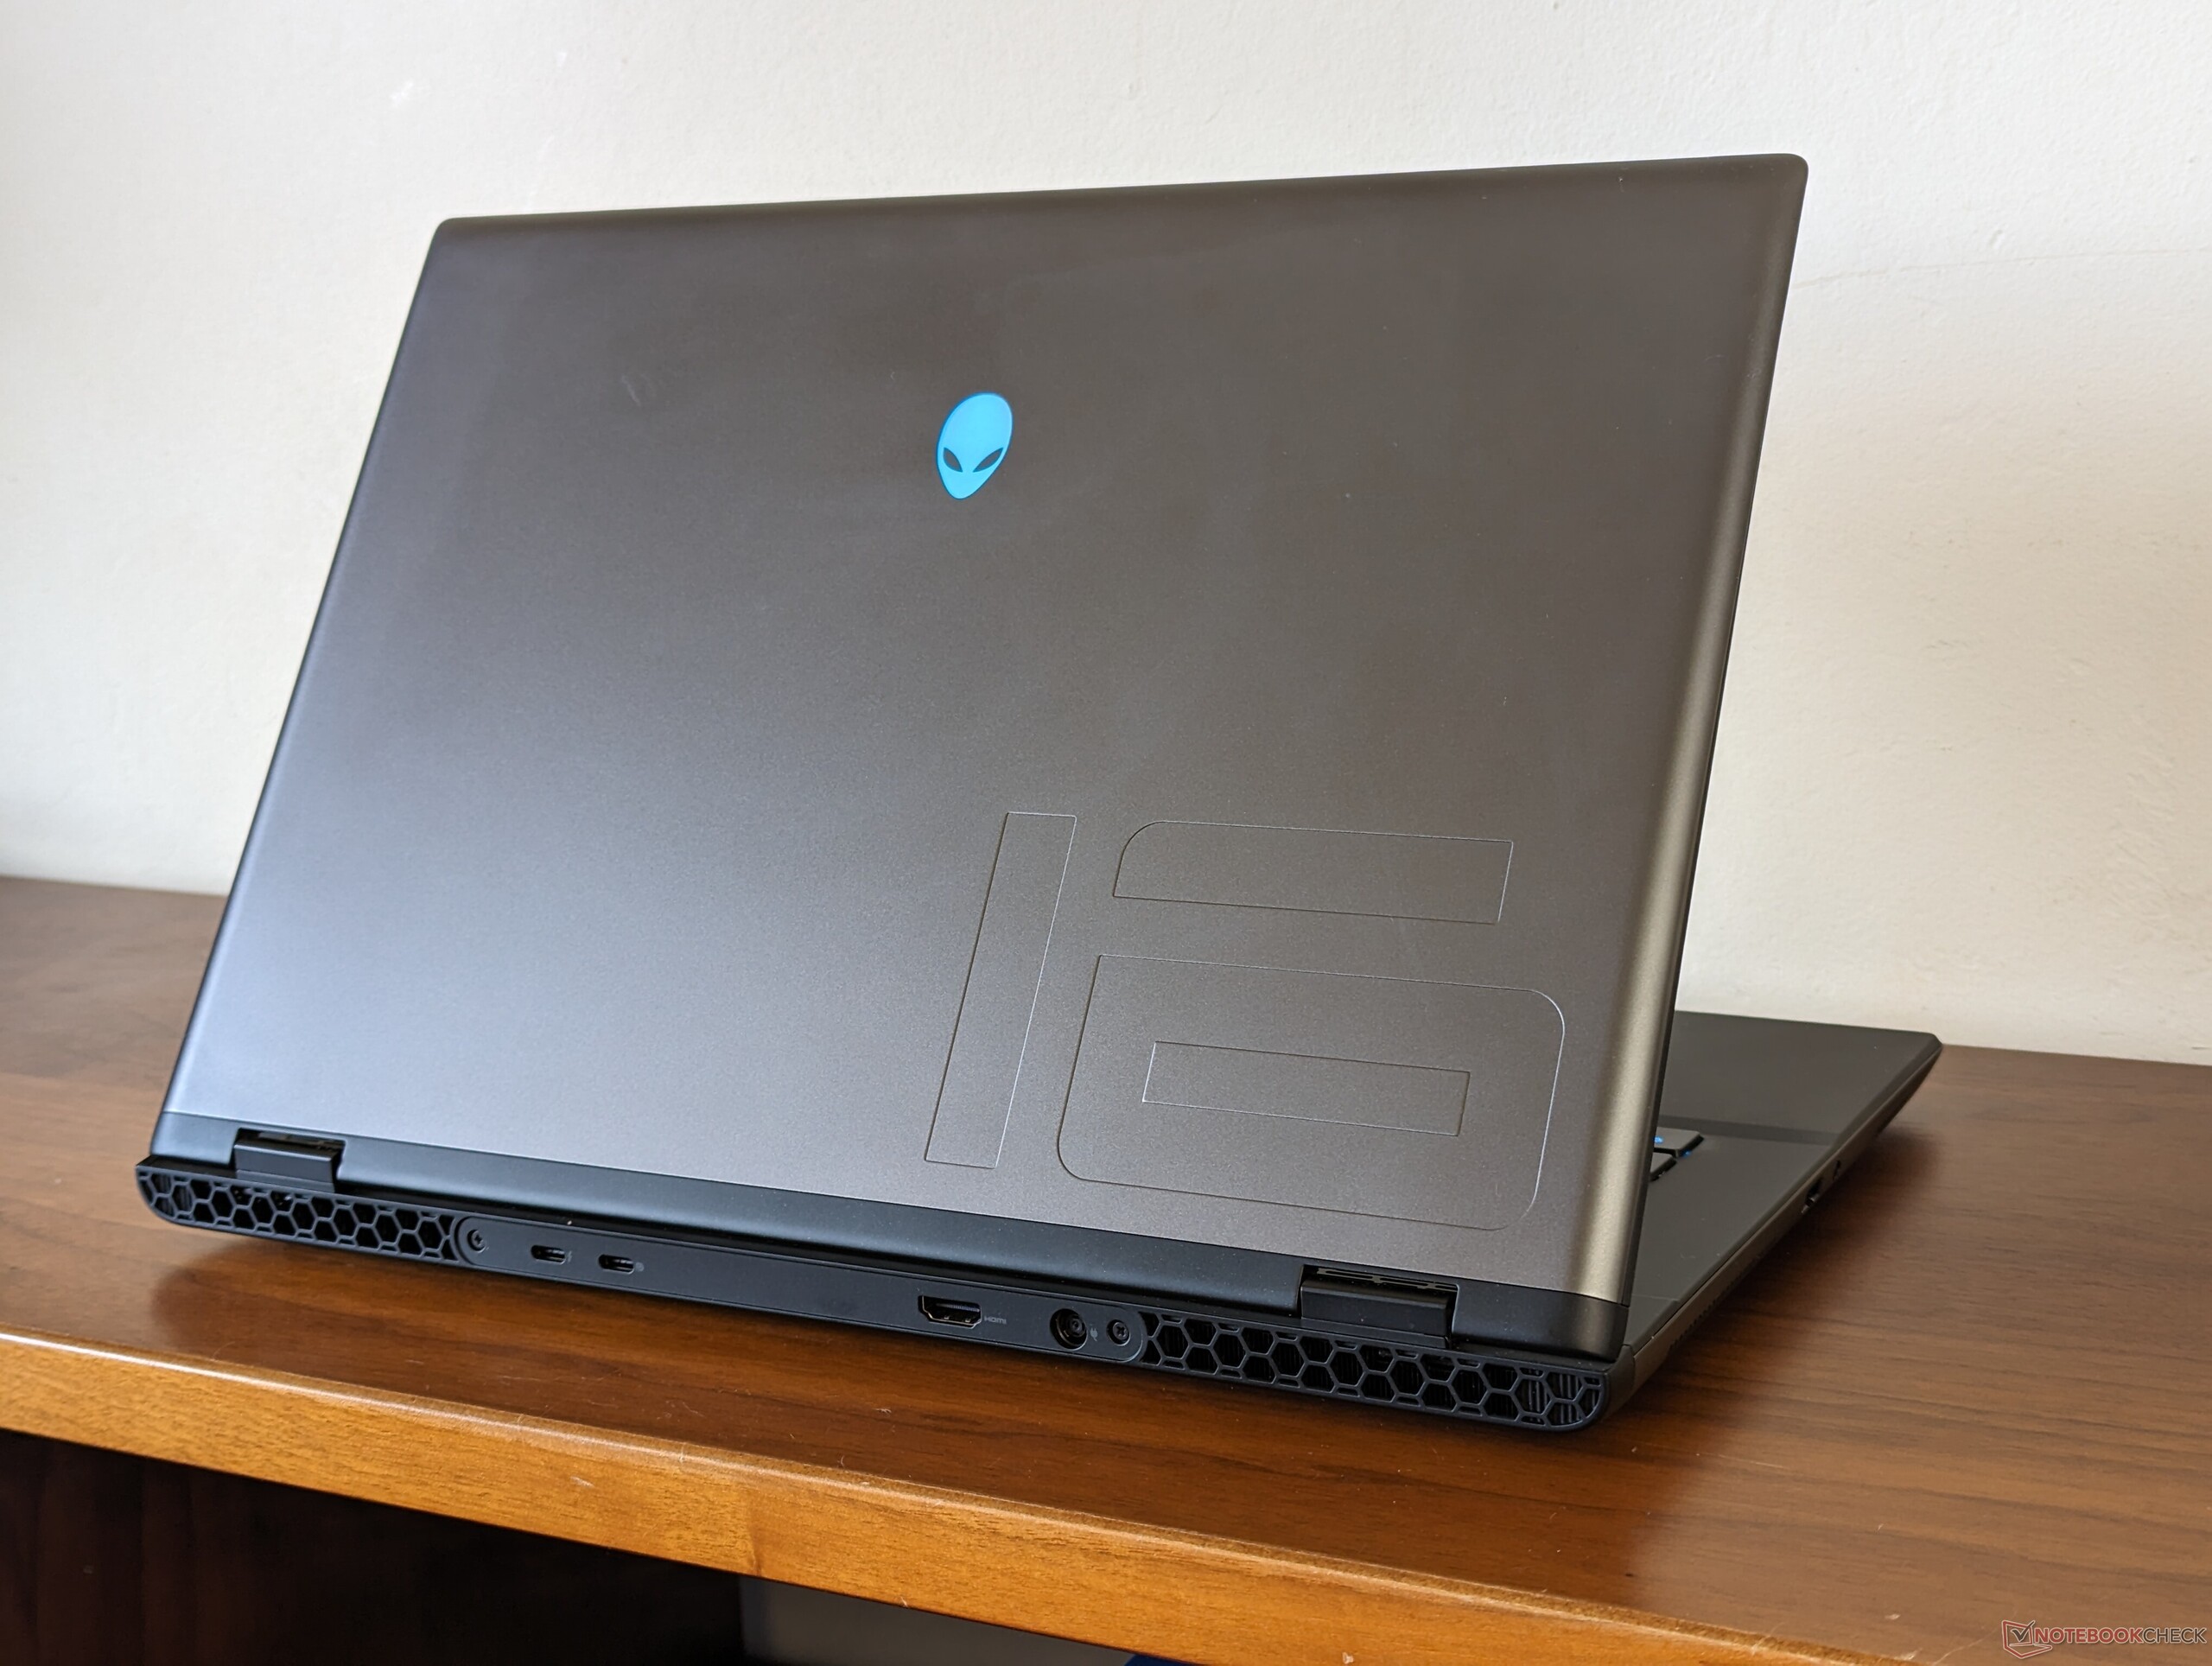
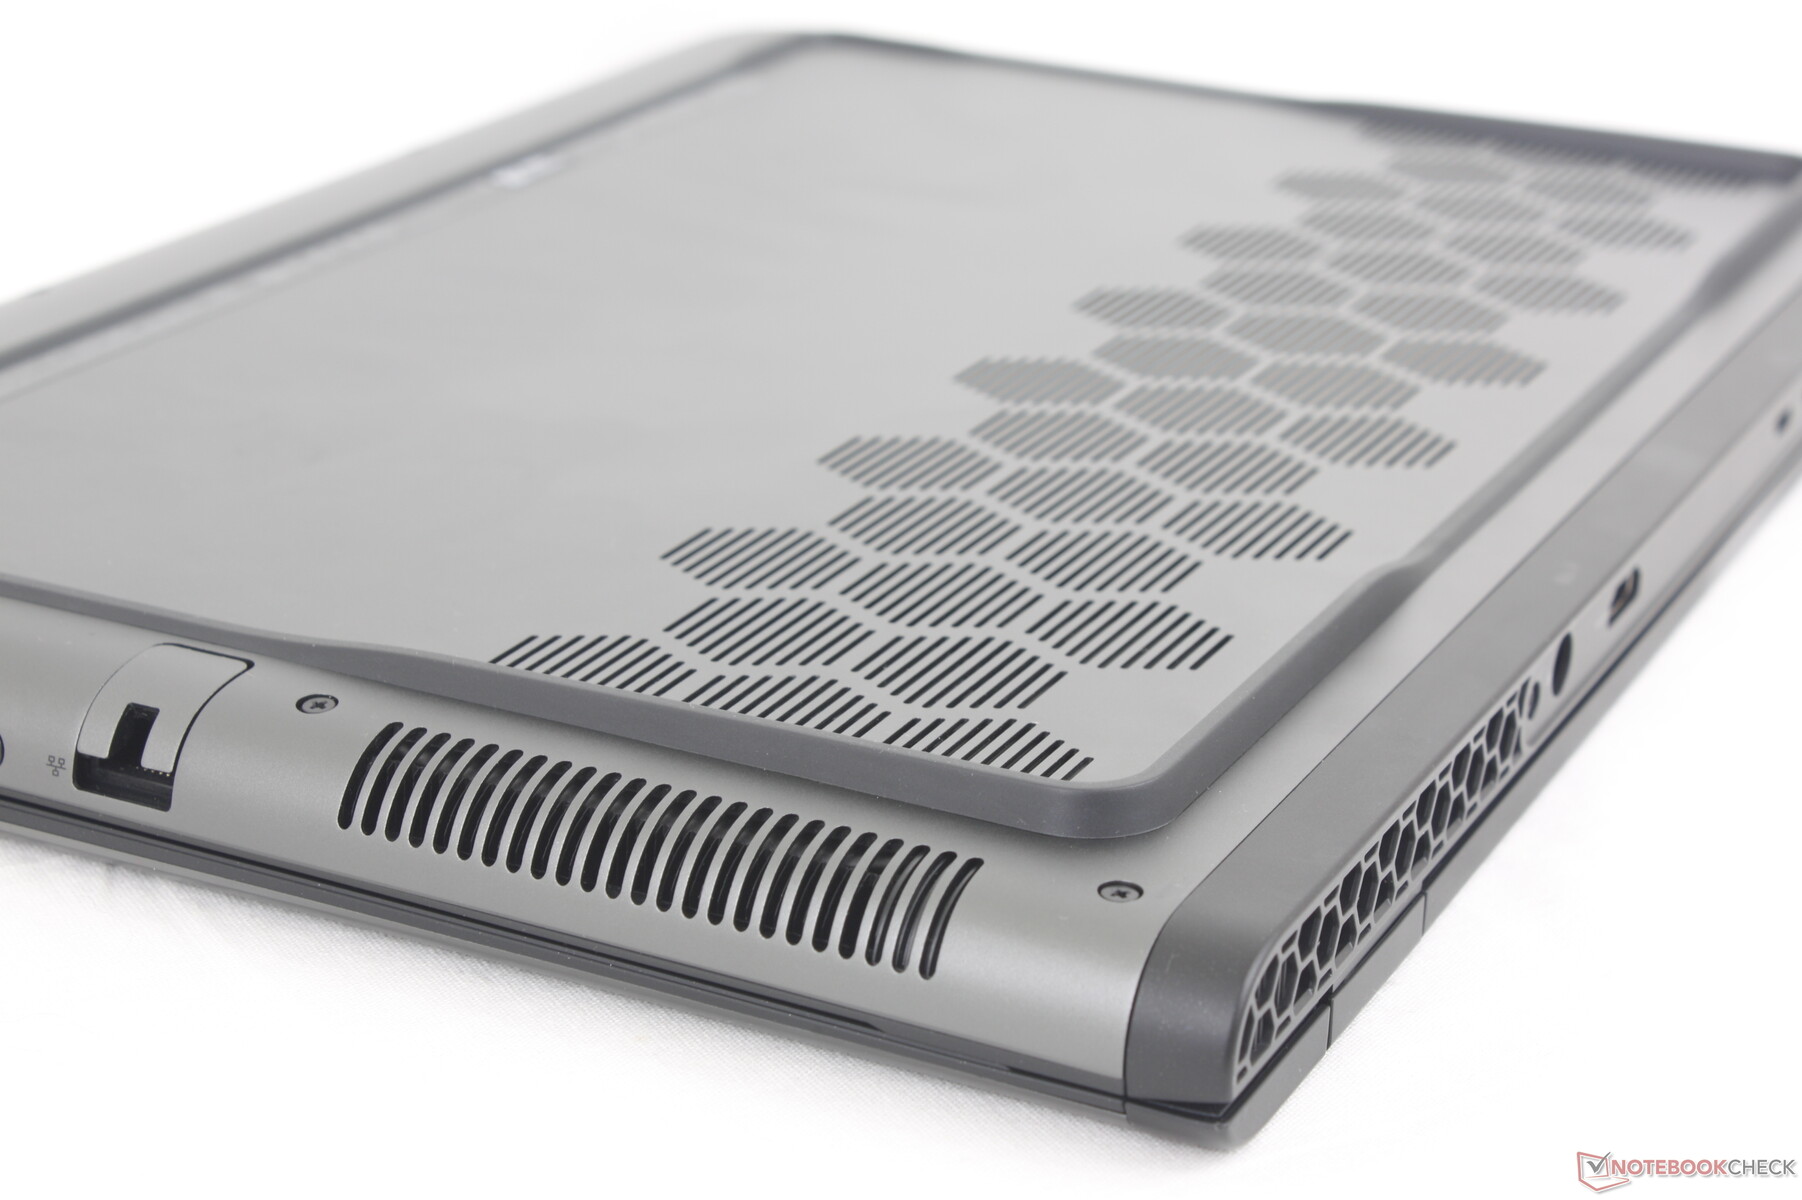
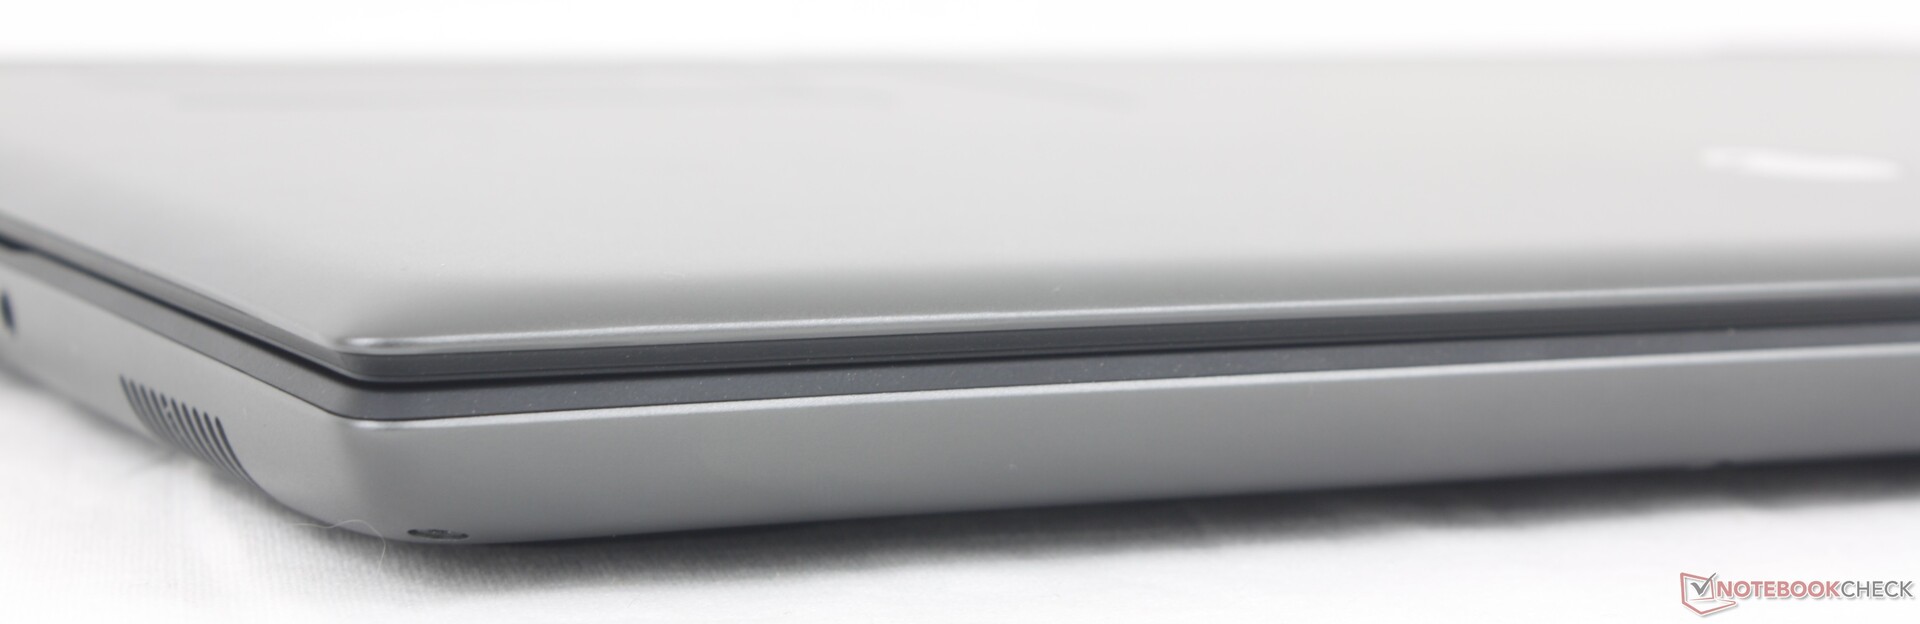
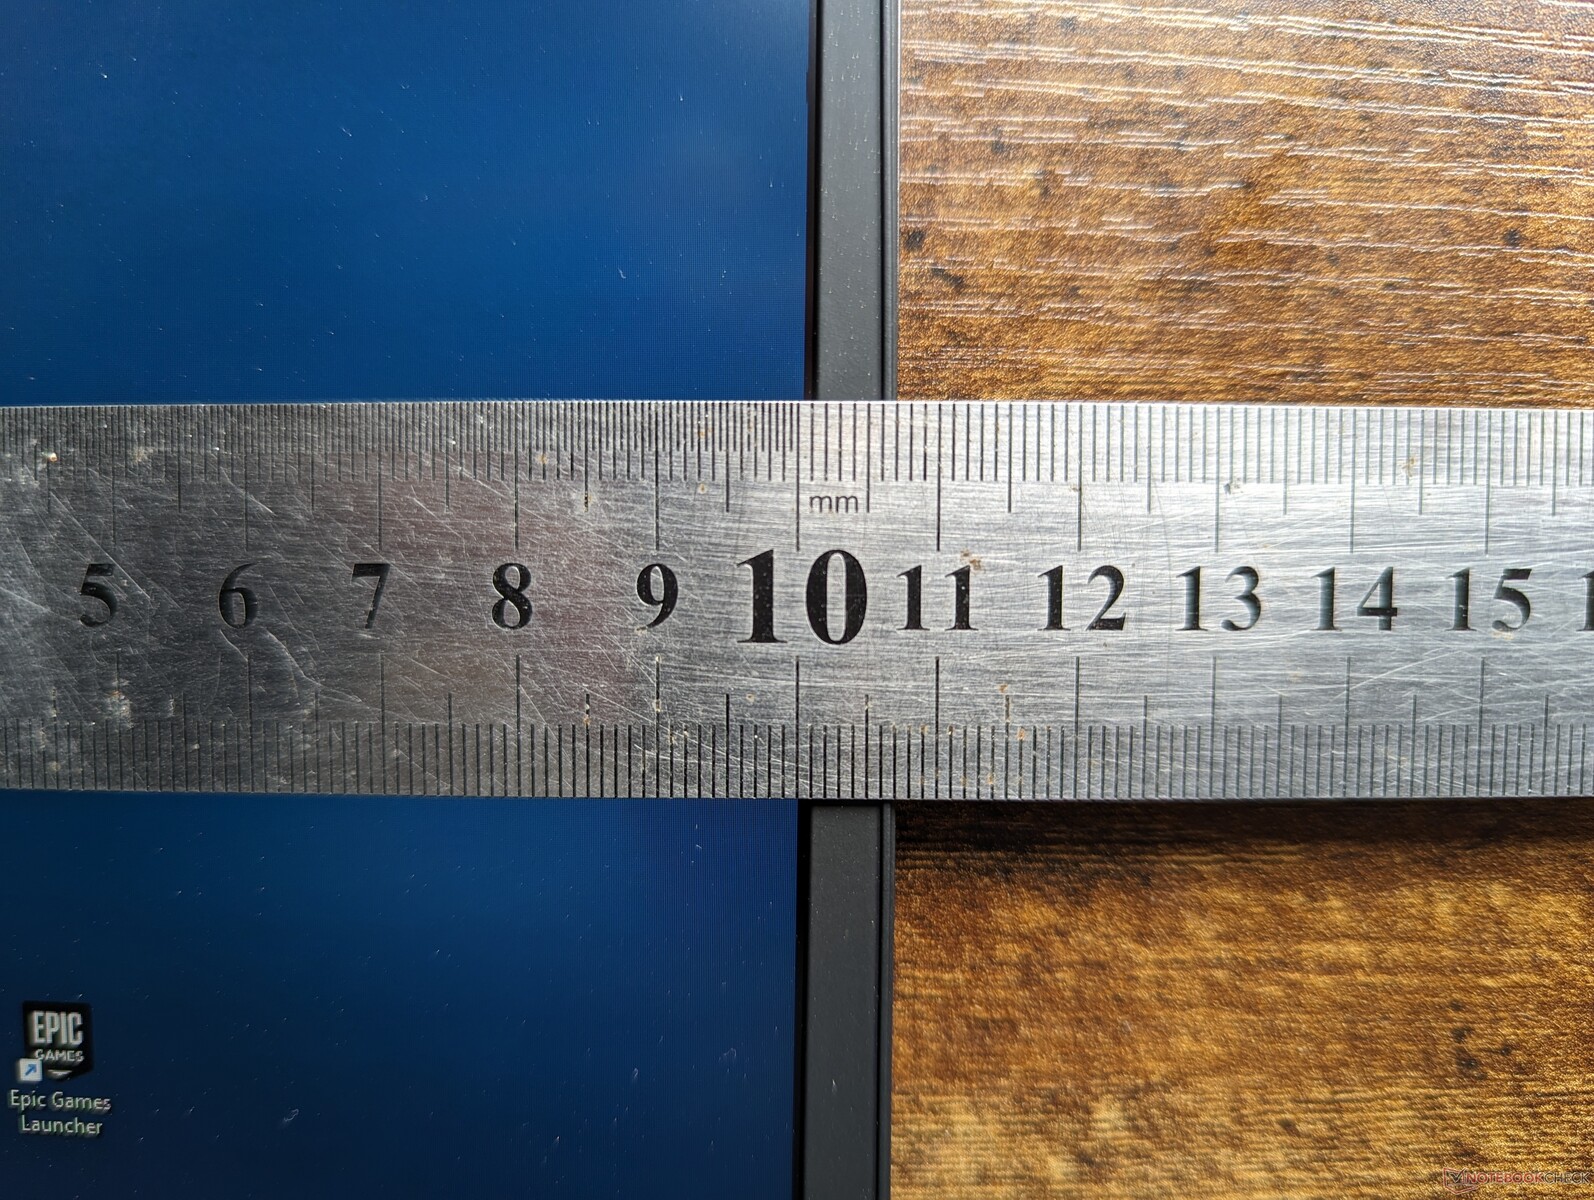
底盘的重大改变导致重量和尺寸的大幅削减。与 m16 R1 相比,m16 R2 重量减轻了约 17%,体积缩小了 22%,从而提高了便携性。由于原来的 m16 R1 尺寸较宽,需要较大的背包,而较小的占地面积也有助于将系统装入较小的背包中。
尺寸的缩小还不足以使 m16 R2 成为同类产品中最小的,因为这两款产品都是 雷蛇刀锋 16和 华硕 Zephyrus G16仍然更轻、更小。
连通性 - 所有基础知识都在这里
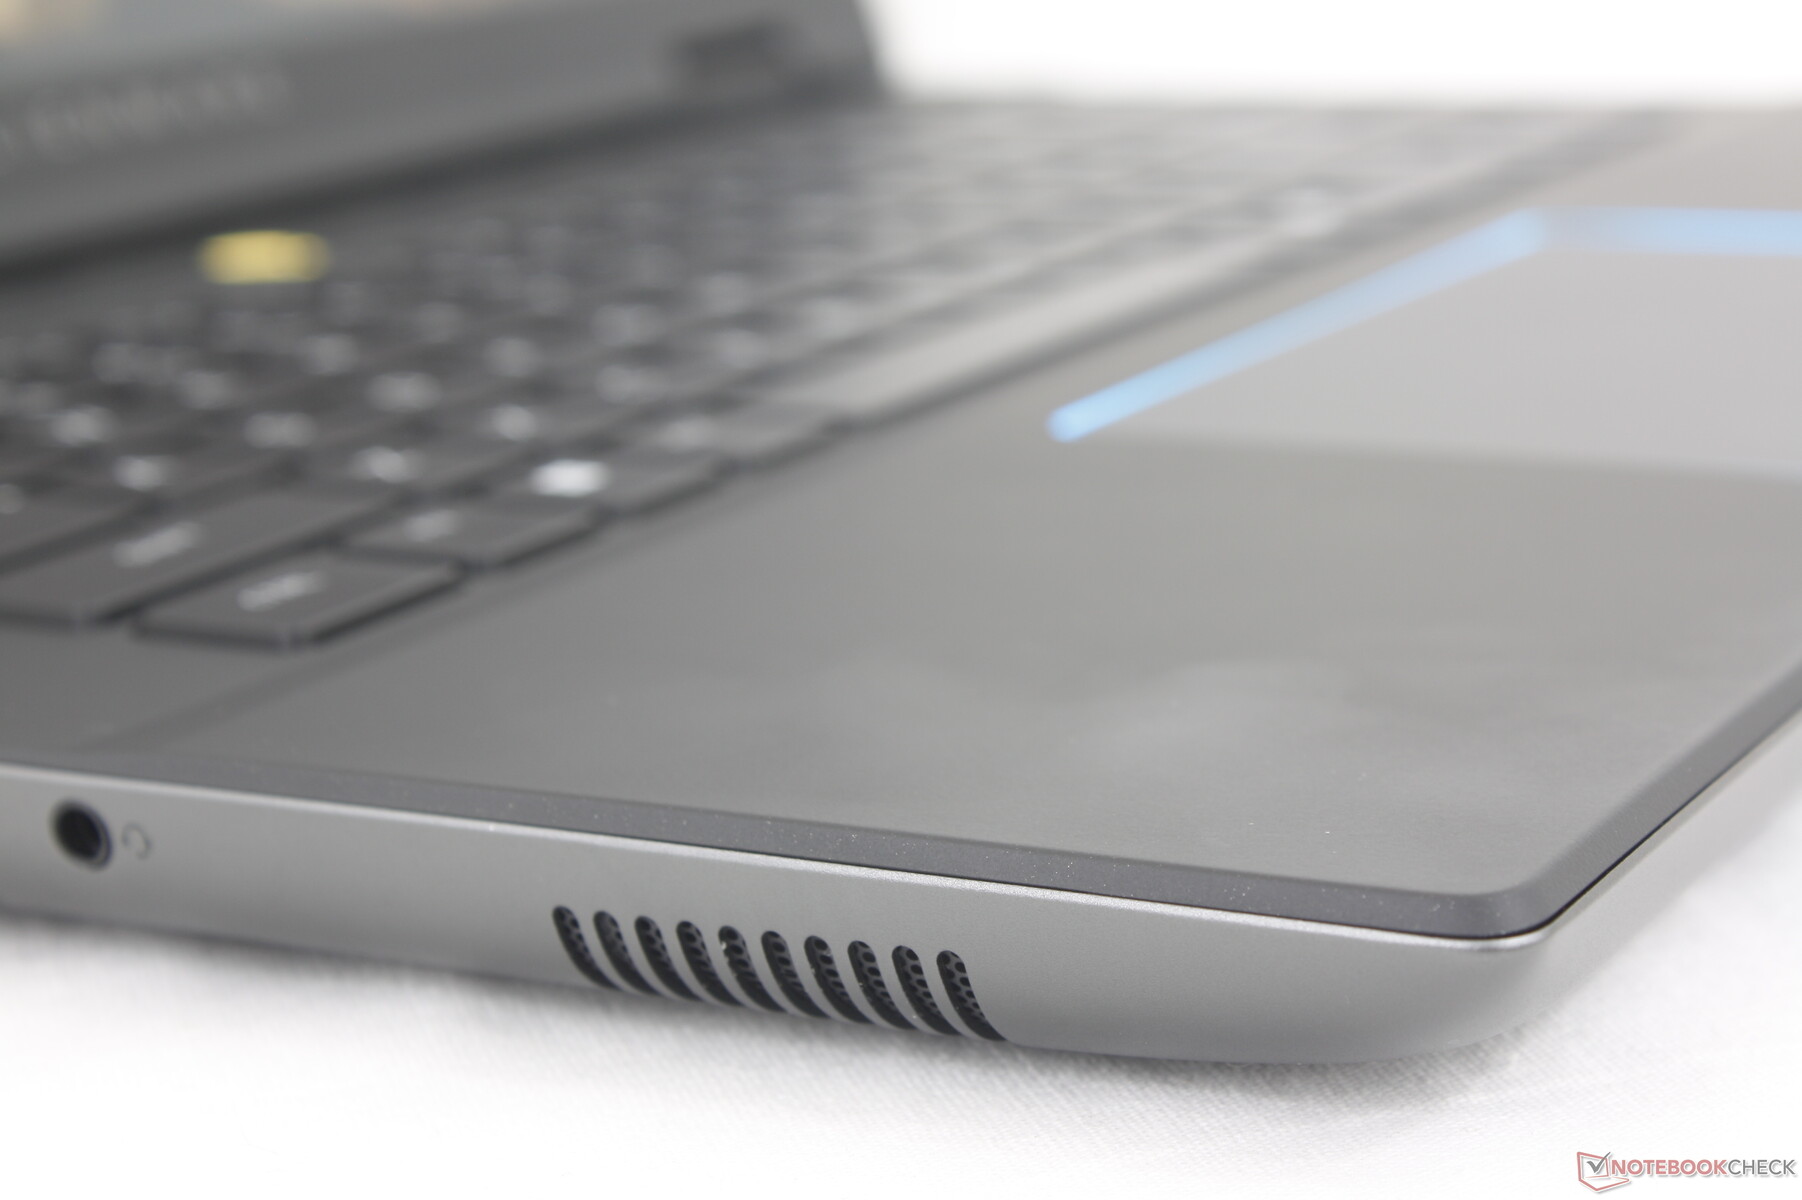
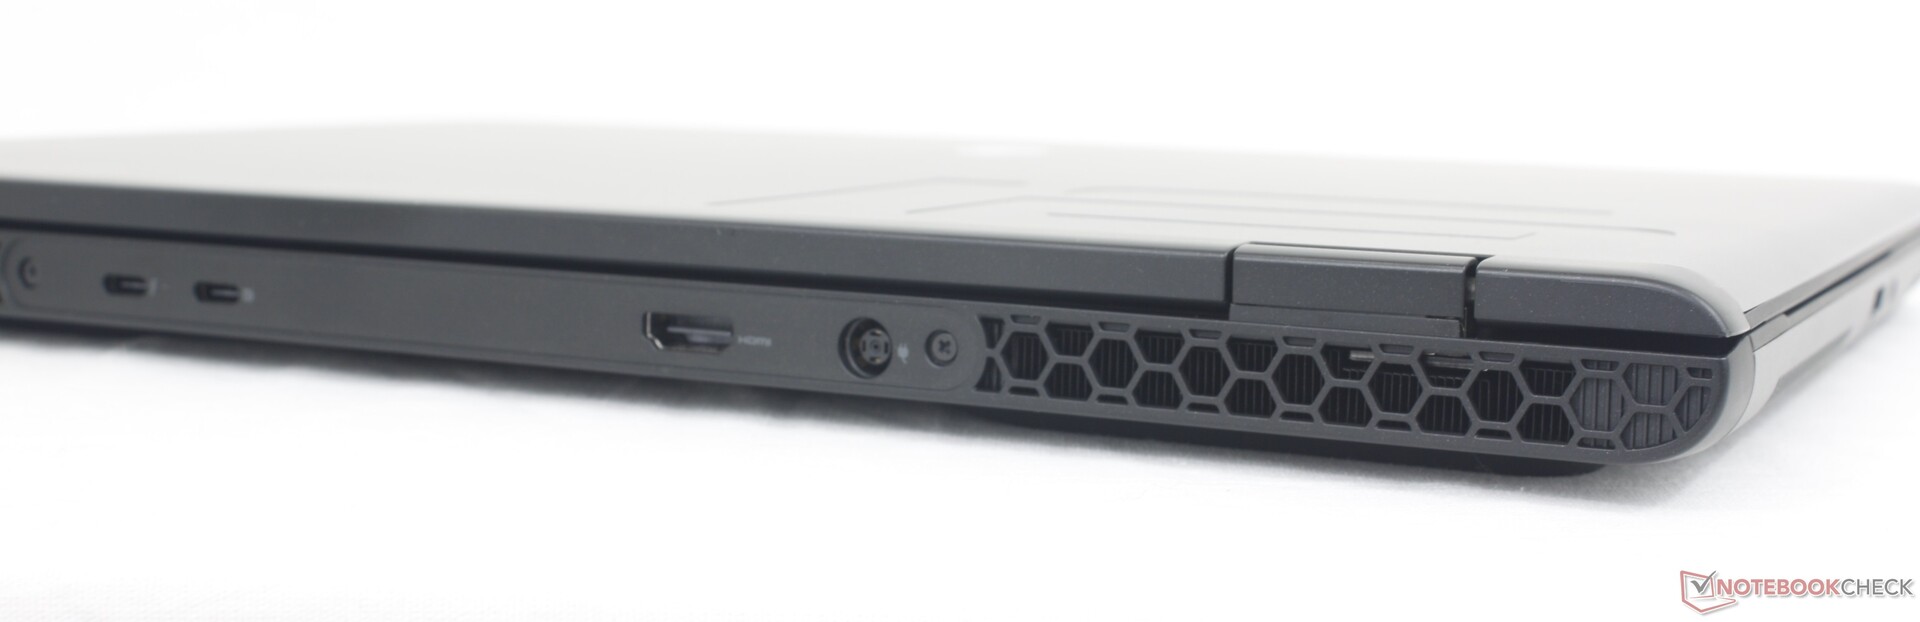
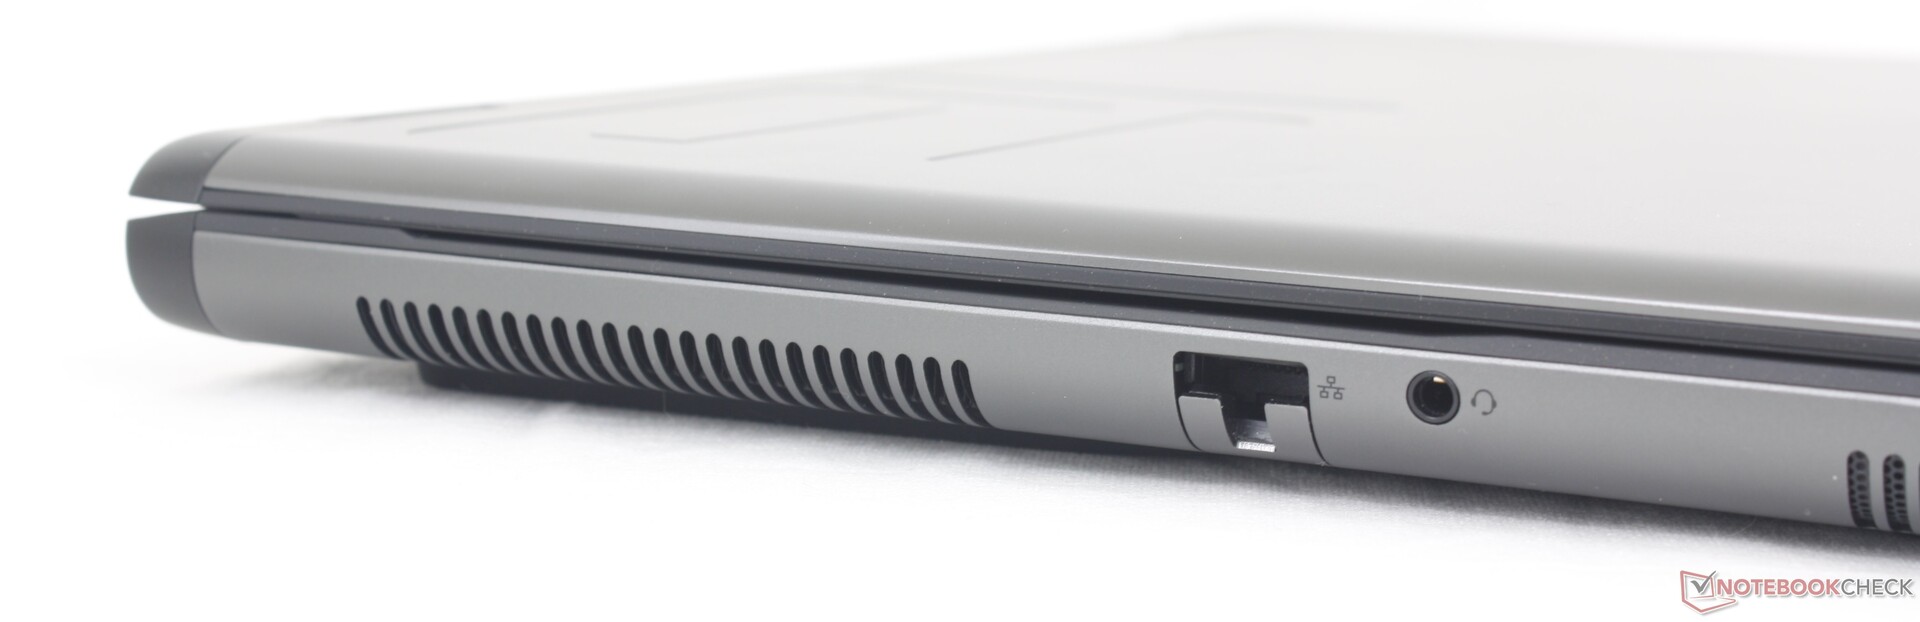
除了迷你 DisplayPort 外,去年 m16 R1 的所有端口都已回归。端口位置发生了变化,RJ-45 和音频插孔移到了左侧边缘,而 m16 R1 上的大部分端口都在后部,很不方便。
请记住,两个 USB-C 端口中只有一个支持 Power Delivery。在其他方面,这两个端口都兼容外接显示器。
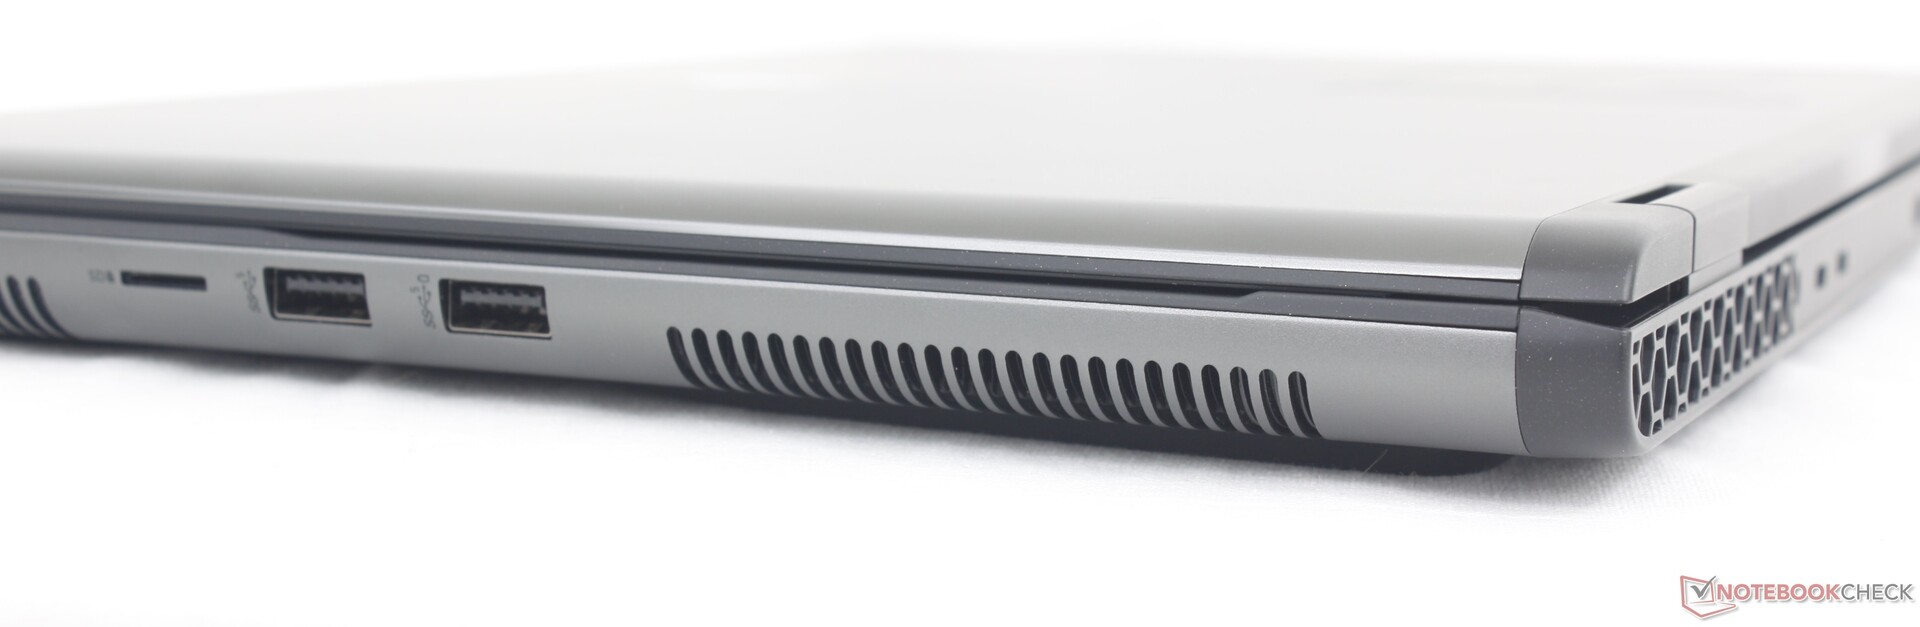
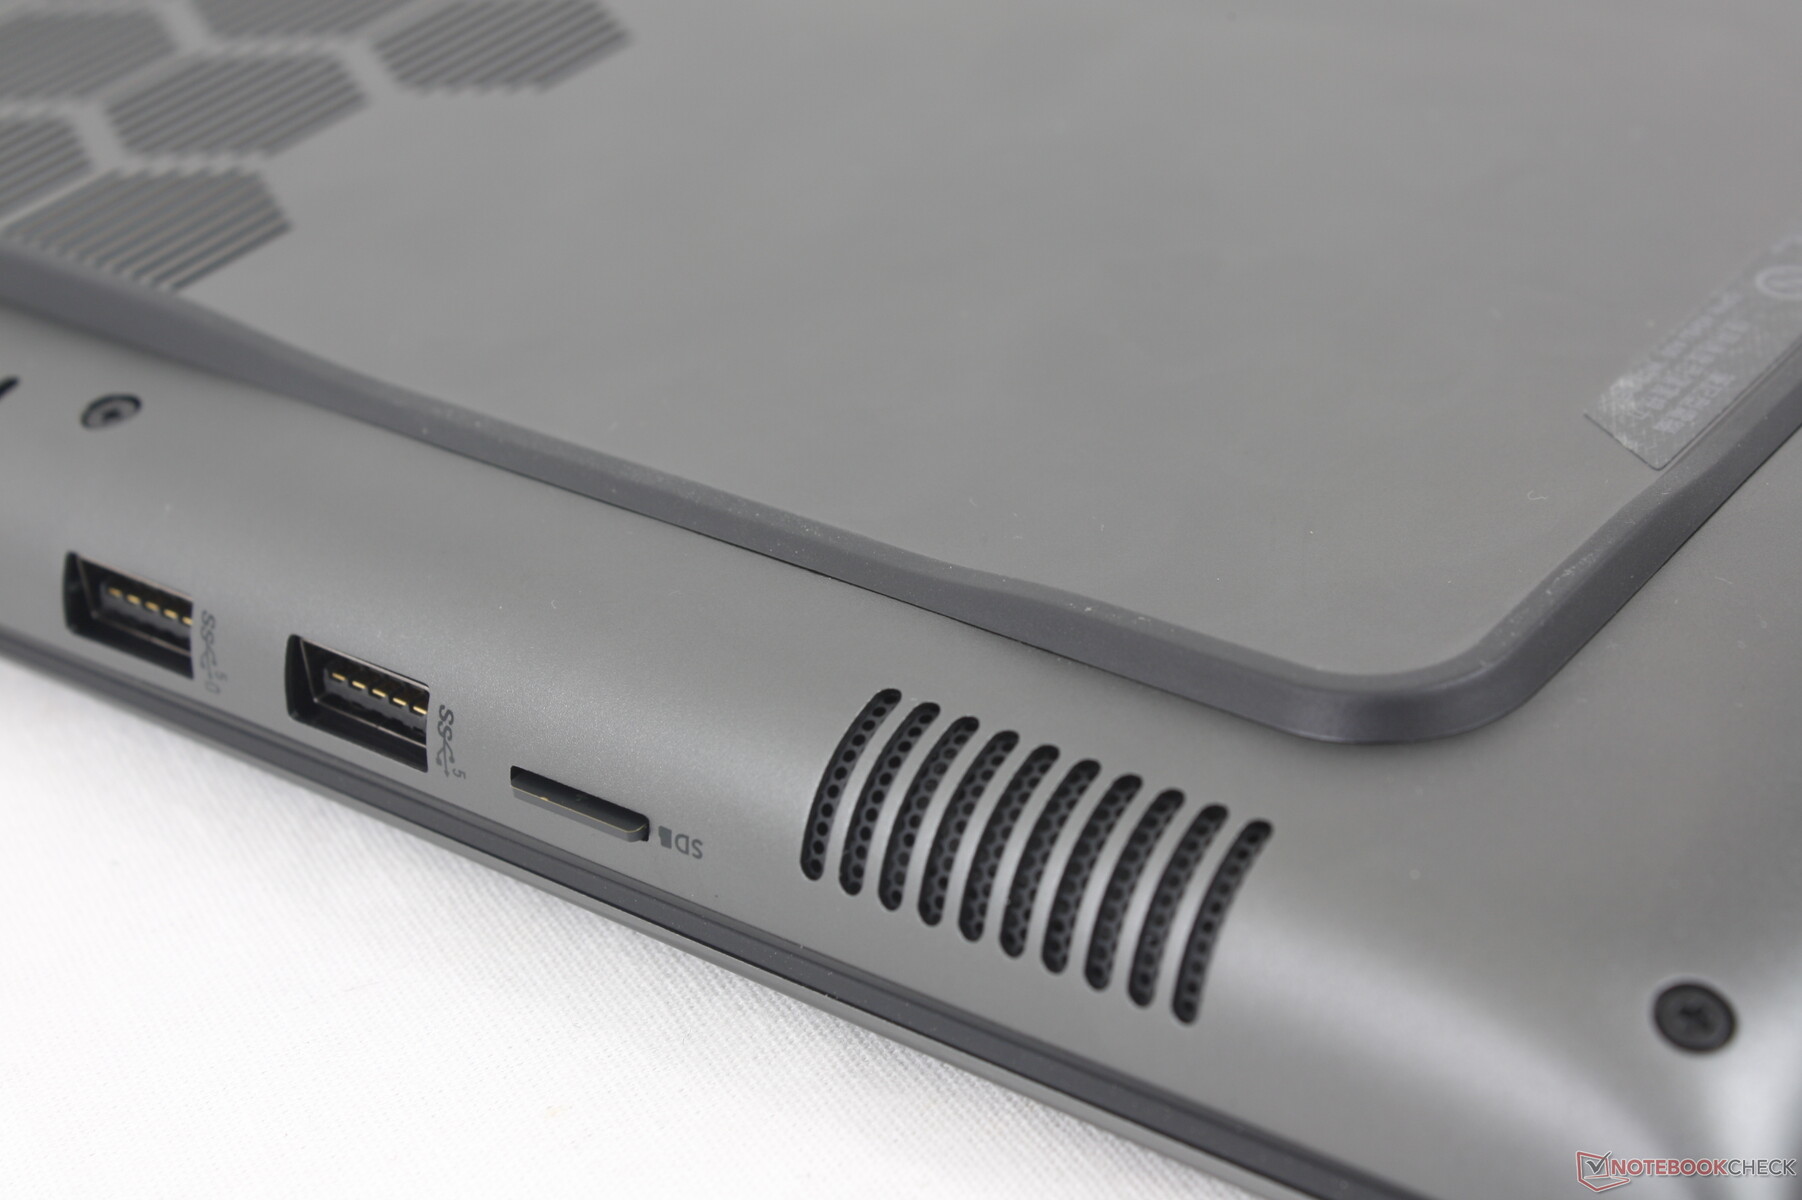
SD 读卡器
m16 R1 配备了全尺寸 SD 读卡器,而 m16 R2 则遗憾地改用了 MicroSD 读卡器,这可能会让一些内容创作者感到不快。尽管改用了 MicroSD,但传输速率与我们在 m16 R1 上记录的传输速率大致相同。
| SD Card Reader | |
| average JPG Copy Test (av. of 3 runs) | |
| Alienware m16 R1 Intel (AV PRO microSD 128 GB V60) | |
| Lenovo Legion Slim 7 16APH8 (AV PRO microSD 128 GB V60) | |
| Asus ROG Zephyrus G16 2024 GU605M | |
| Alienware m16 R2 (AV PRO microSD 128 GB V60) | |
| Alienware x16 R1 (AV PRO microSD 128 GB V60) | |
| maximum AS SSD Seq Read Test (1GB) | |
| Alienware x16 R1 (AV PRO microSD 128 GB V60) | |
| Alienware m16 R2 (AV PRO microSD 128 GB V60) | |
| Alienware m16 R1 Intel (AV PRO microSD 128 GB V60) | |
| Asus ROG Zephyrus G16 2024 GU605M | |
| Lenovo Legion Slim 7 16APH8 (AV PRO microSD 128 GB V60) | |
交流
英特尔杀手 AX1675 标配 Wi-Fi 6E 连接,可选择升级到 BE202 以兼容 Wi-Fi 7。在与华硕 AXE11000 测试路由器配对时,我们没有遇到任何问题。
| Networking | |
| iperf3 transmit AXE11000 | |
| Asus ROG Zephyrus G16 2024 GU605M | |
| HP Omen Transcend 16-u1095ng | |
| Alienware m16 R1 Intel | |
| Alienware m16 R2 | |
| Alienware x16 R1 | |
| Lenovo Legion Slim 7 16APH8 | |
| iperf3 receive AXE11000 | |
| Lenovo Legion Slim 7 16APH8 | |
| HP Omen Transcend 16-u1095ng | |
| Alienware m16 R1 Intel | |
| Asus ROG Zephyrus G16 2024 GU605M | |
| Alienware x16 R1 | |
| Alienware m16 R2 | |
| iperf3 transmit AXE11000 6GHz | |
| Alienware m16 R2 | |
| Alienware x16 R1 | |
| iperf3 receive AXE11000 6GHz | |
| Alienware m16 R2 | |
| Alienware x16 R1 | |
网络摄像头
标配 200 万像素网络摄像头,支持 Windows Hello 红外功能。没有集成隐私快门。


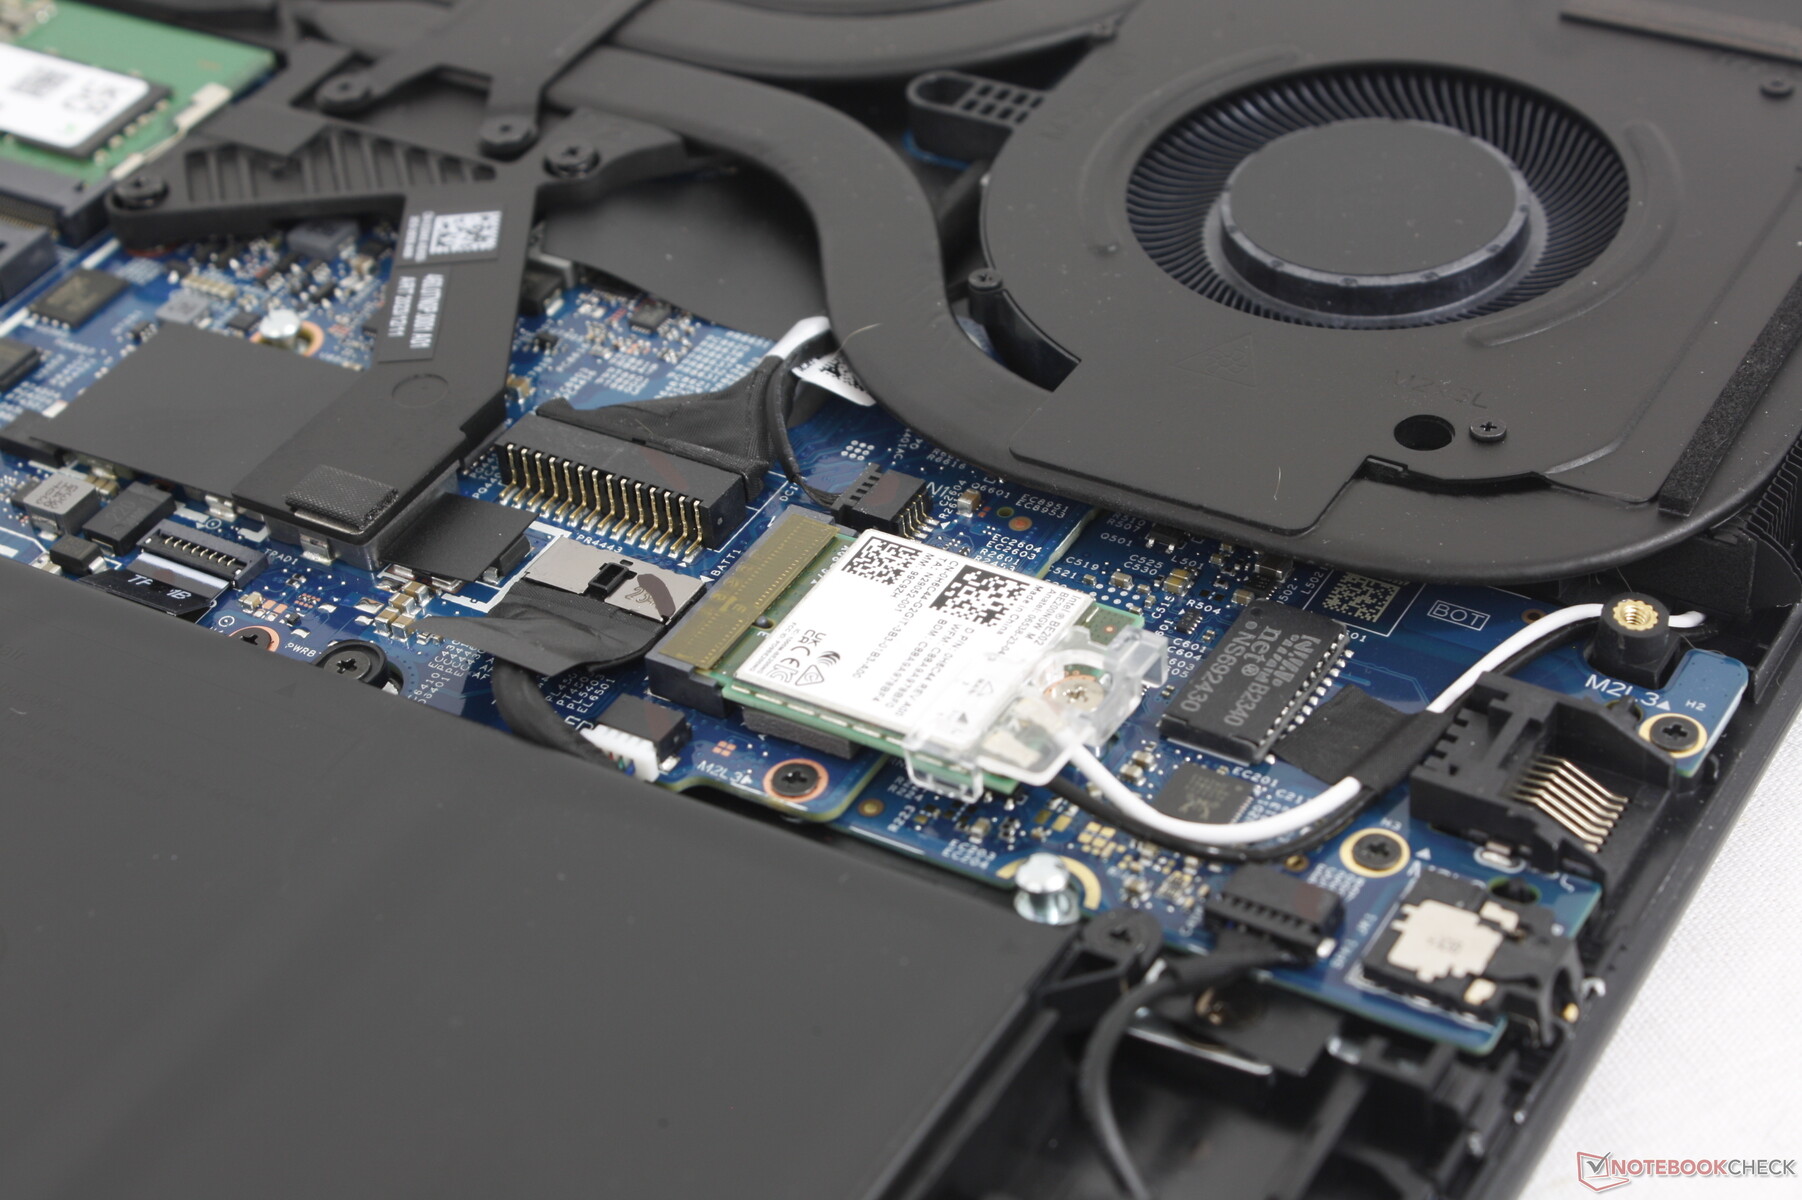
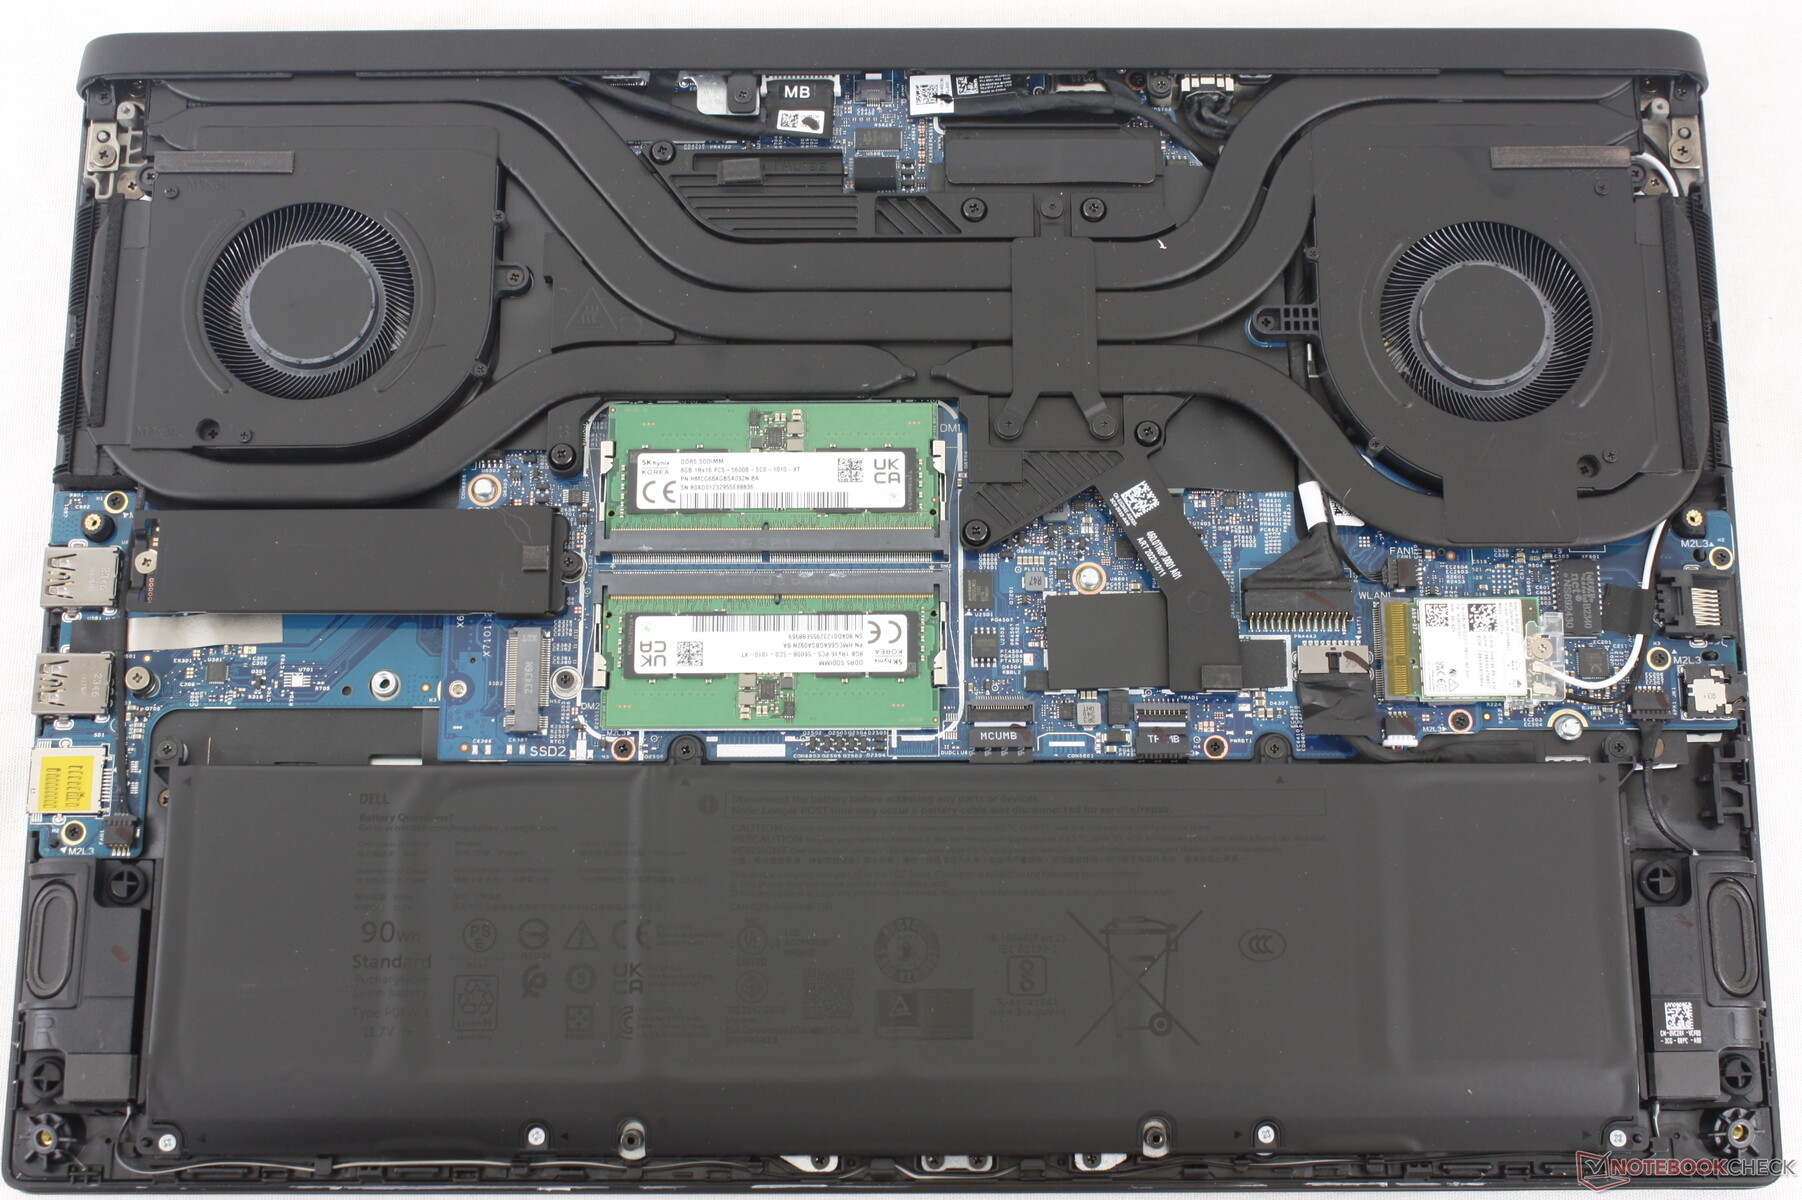
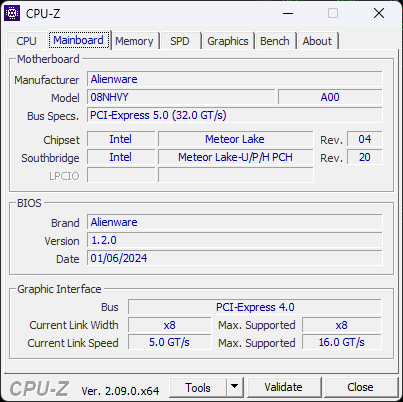
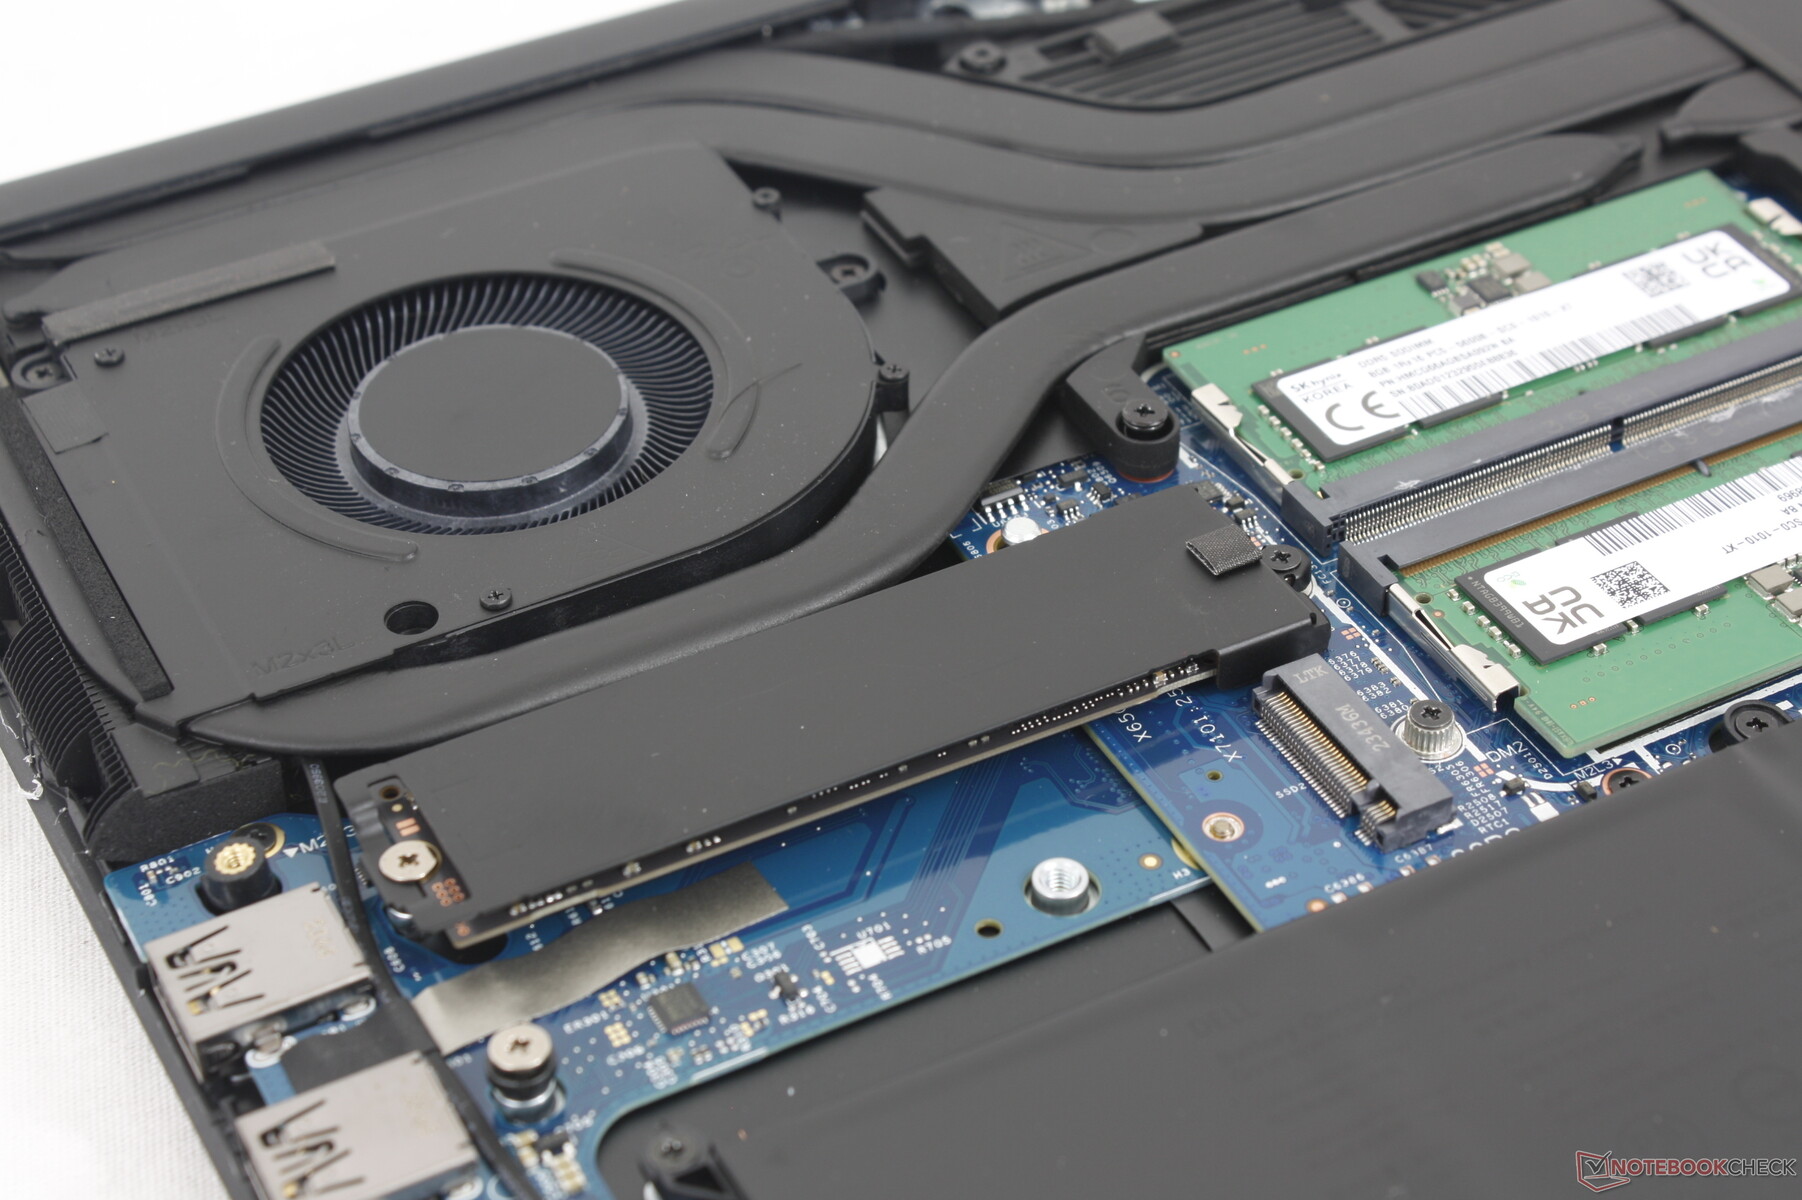
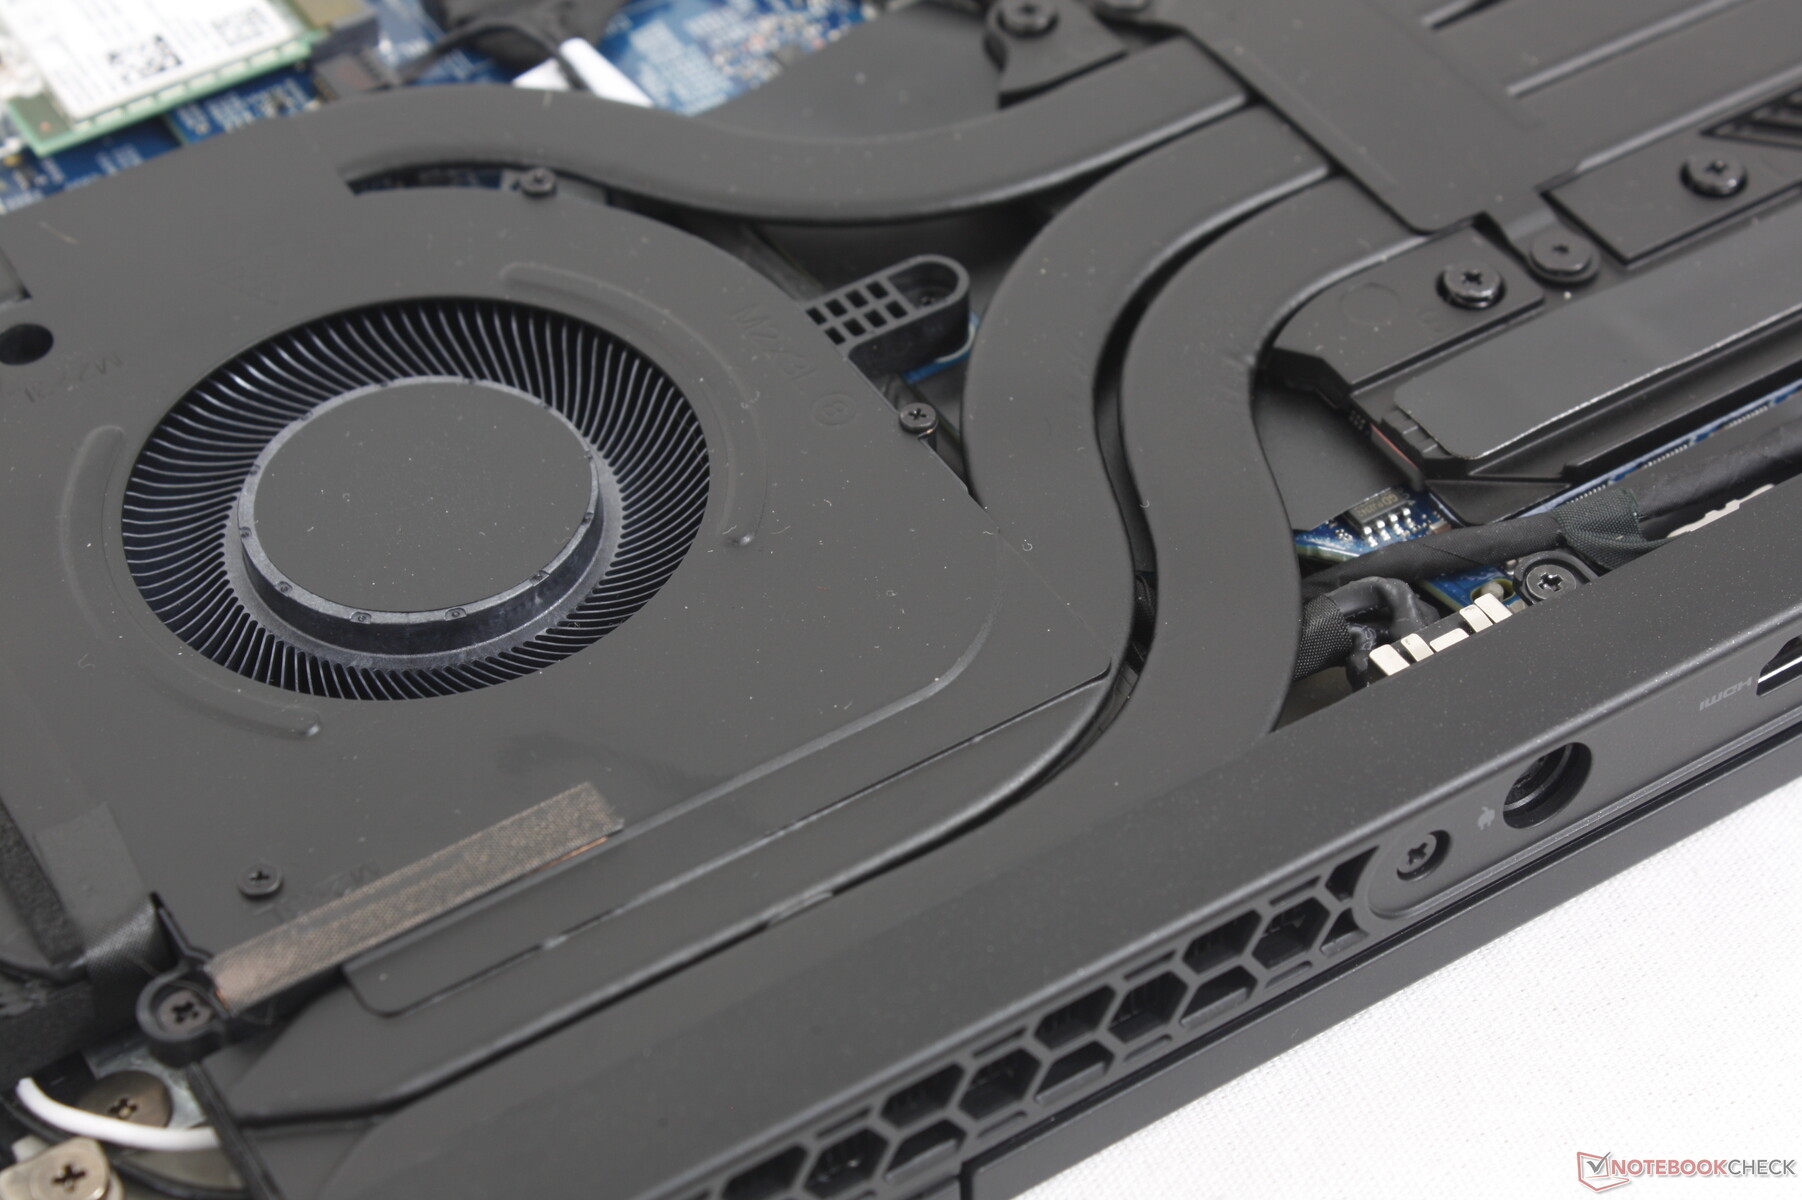
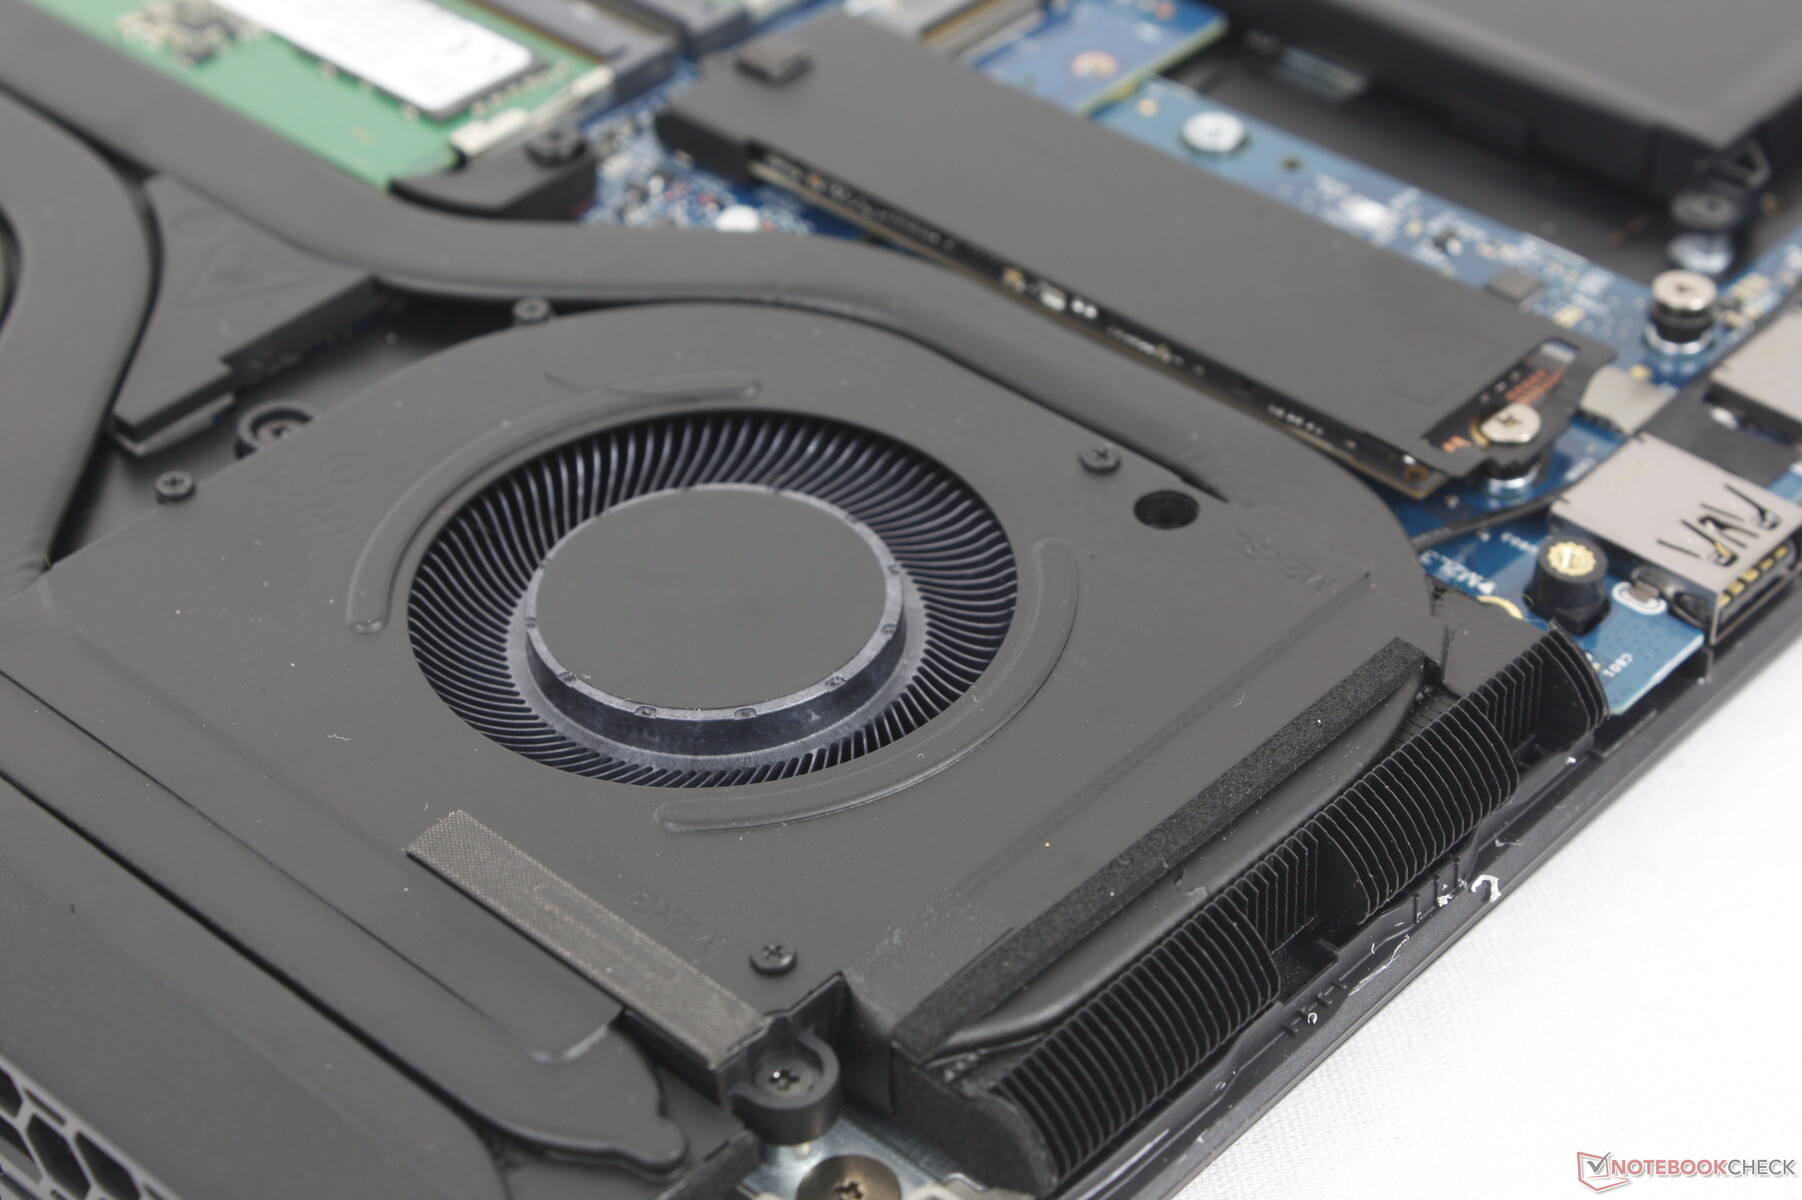
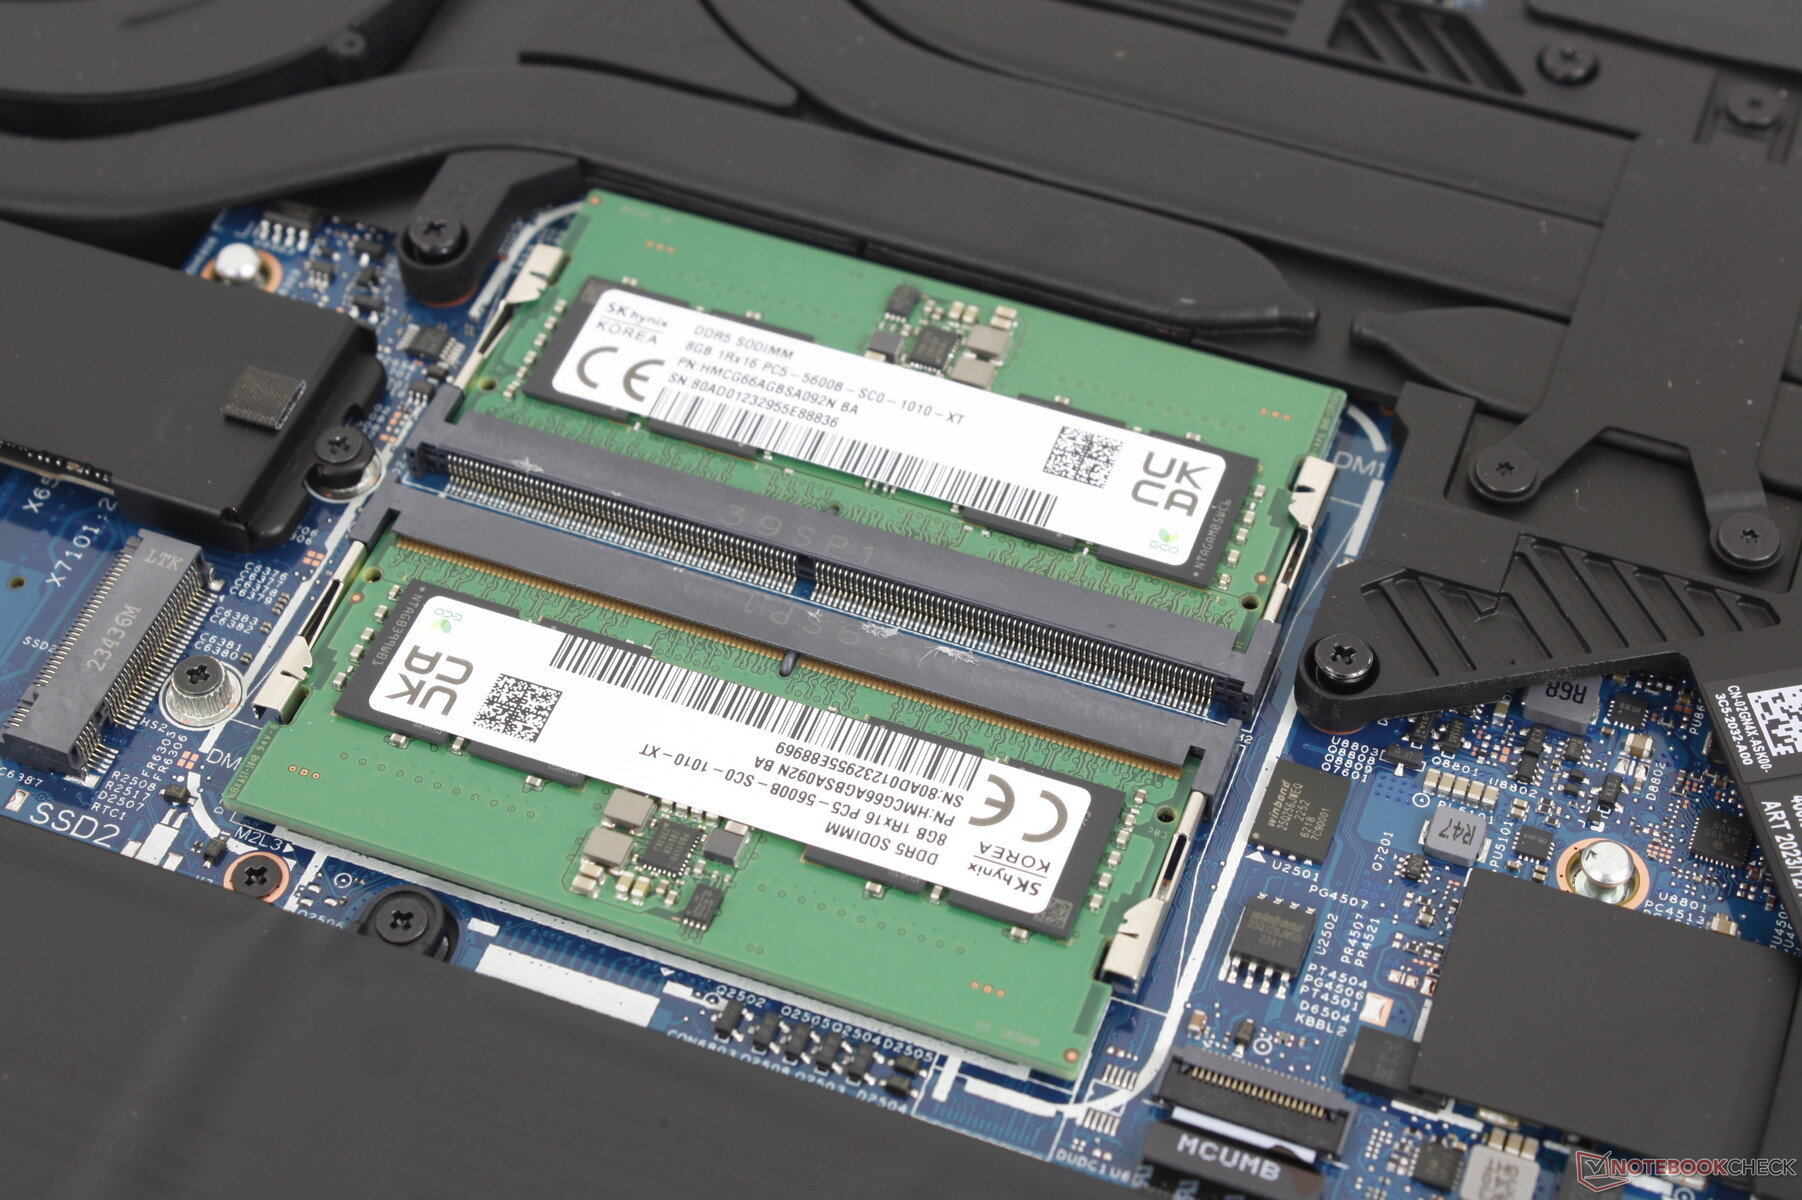
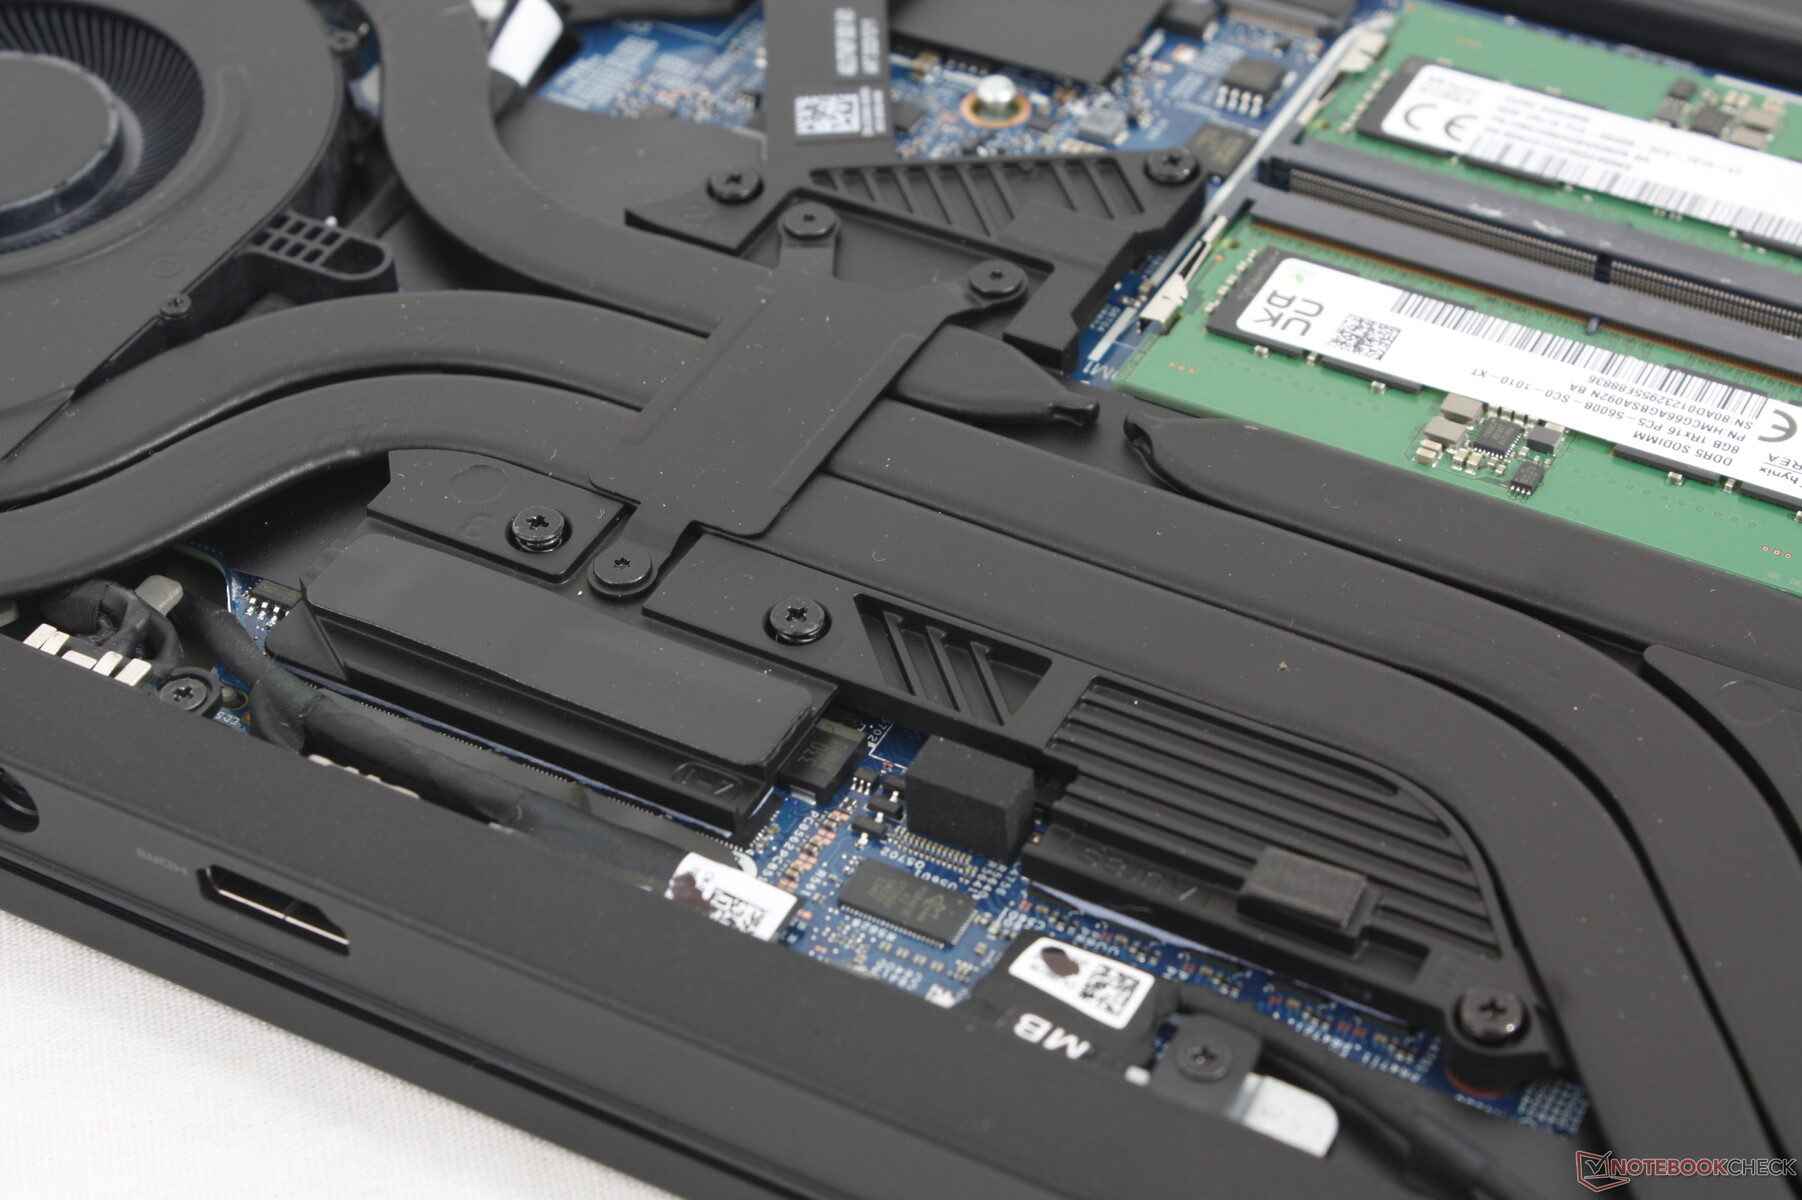
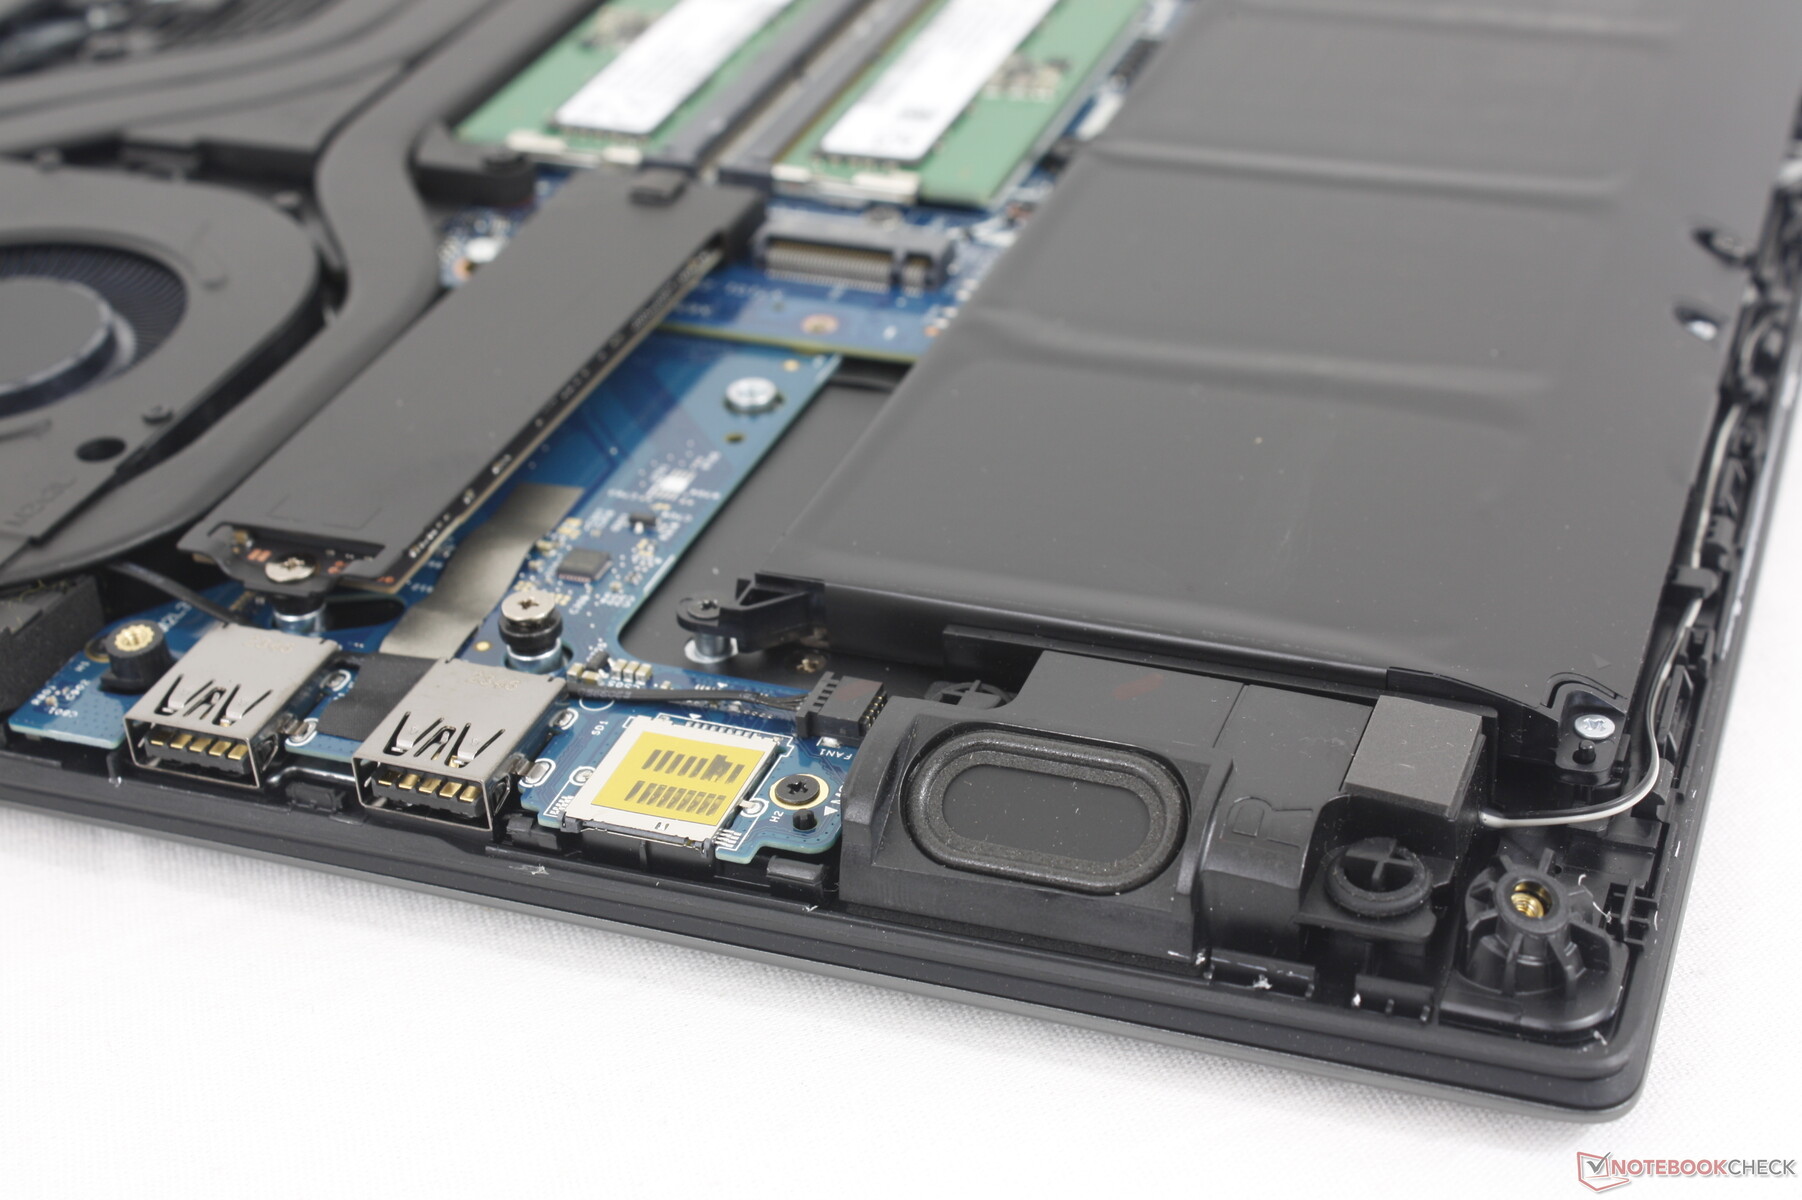
维护
底板由 8 颗十字螺丝固定,便于维修。内存和无线局域网仍可拆卸,但存储配置发生了变化;系统现在支持两个 M.2 2280 固态硬盘,而不是去年设计的一个 M.2 2280 和两个 M.2 2230 固态硬盘。
配件和保修
零售包装盒上除了常见的交流适配器和文件外,还有几张 Alienware 的徽标贴纸。如果在美国购买,制造商提供标准的一年有限保修服务。
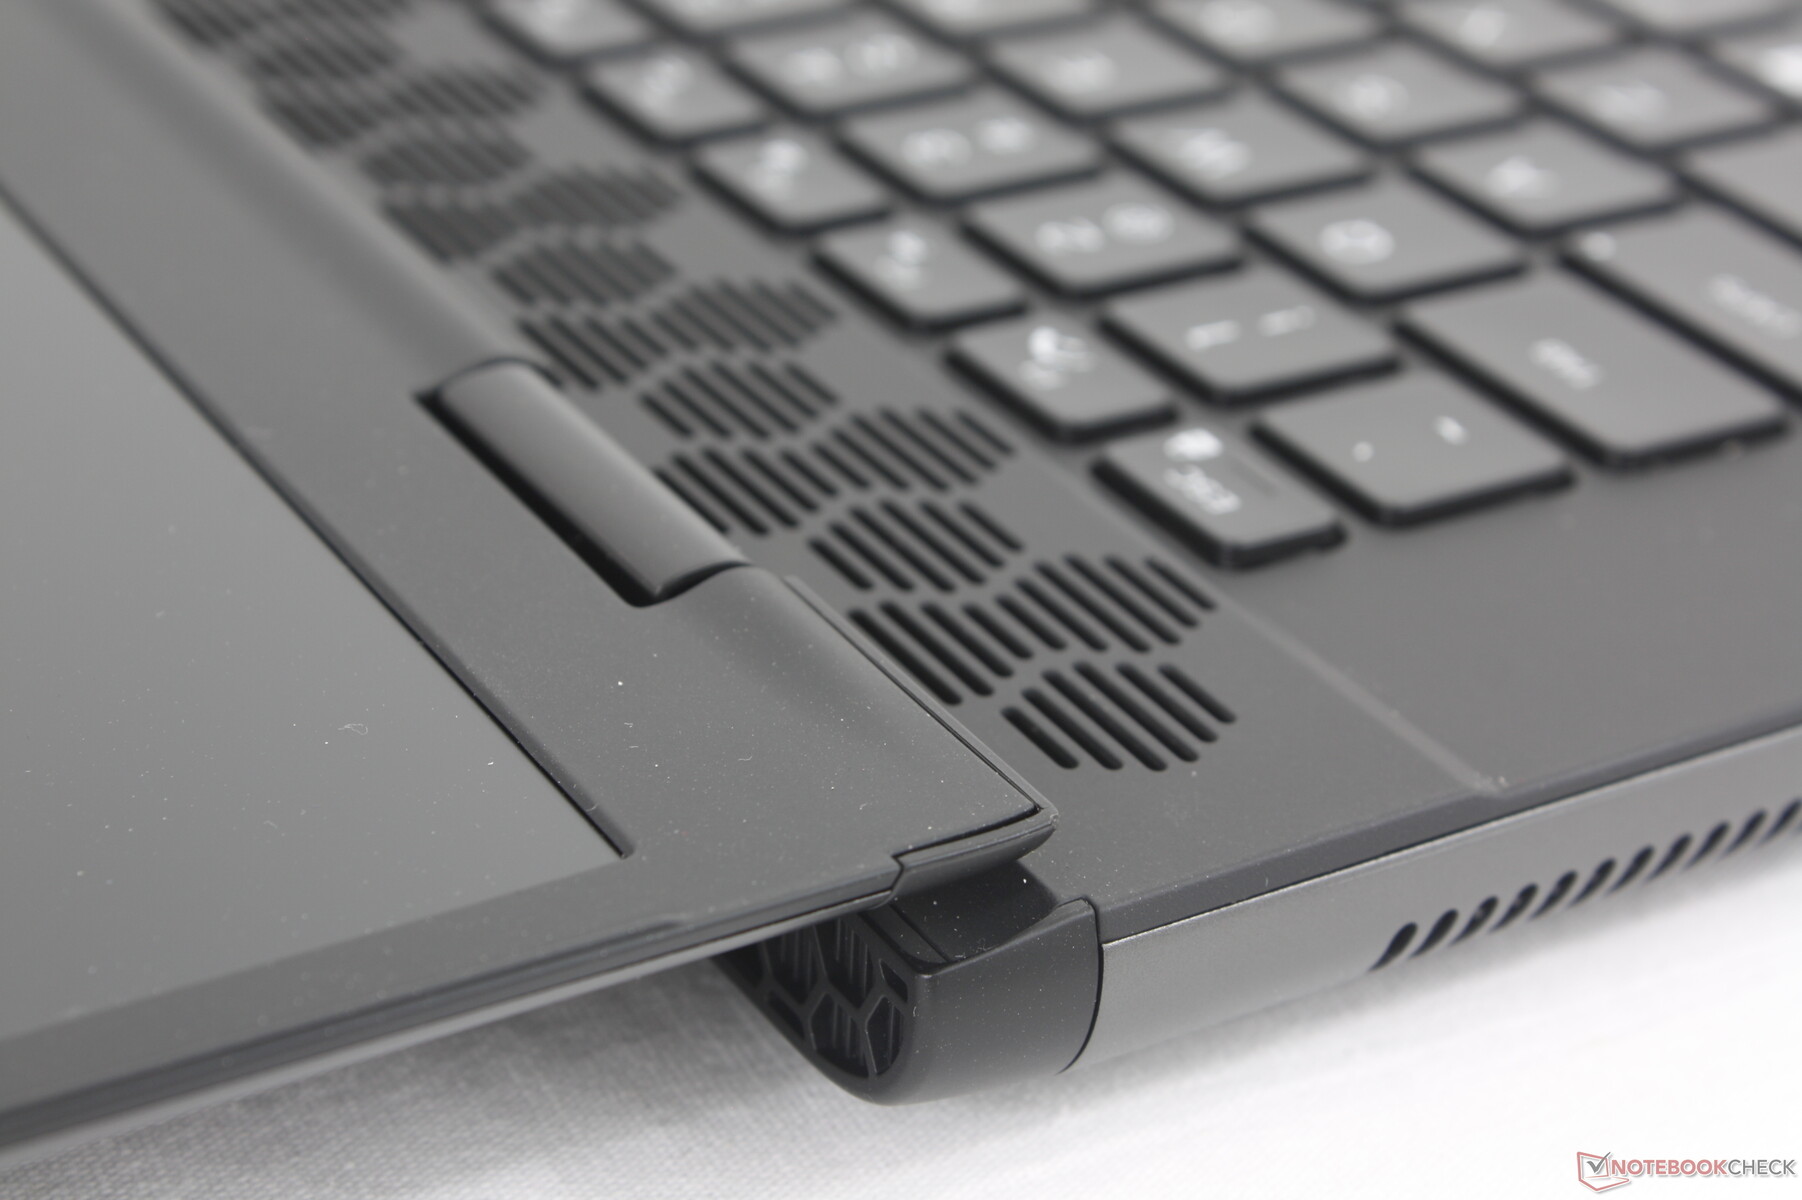
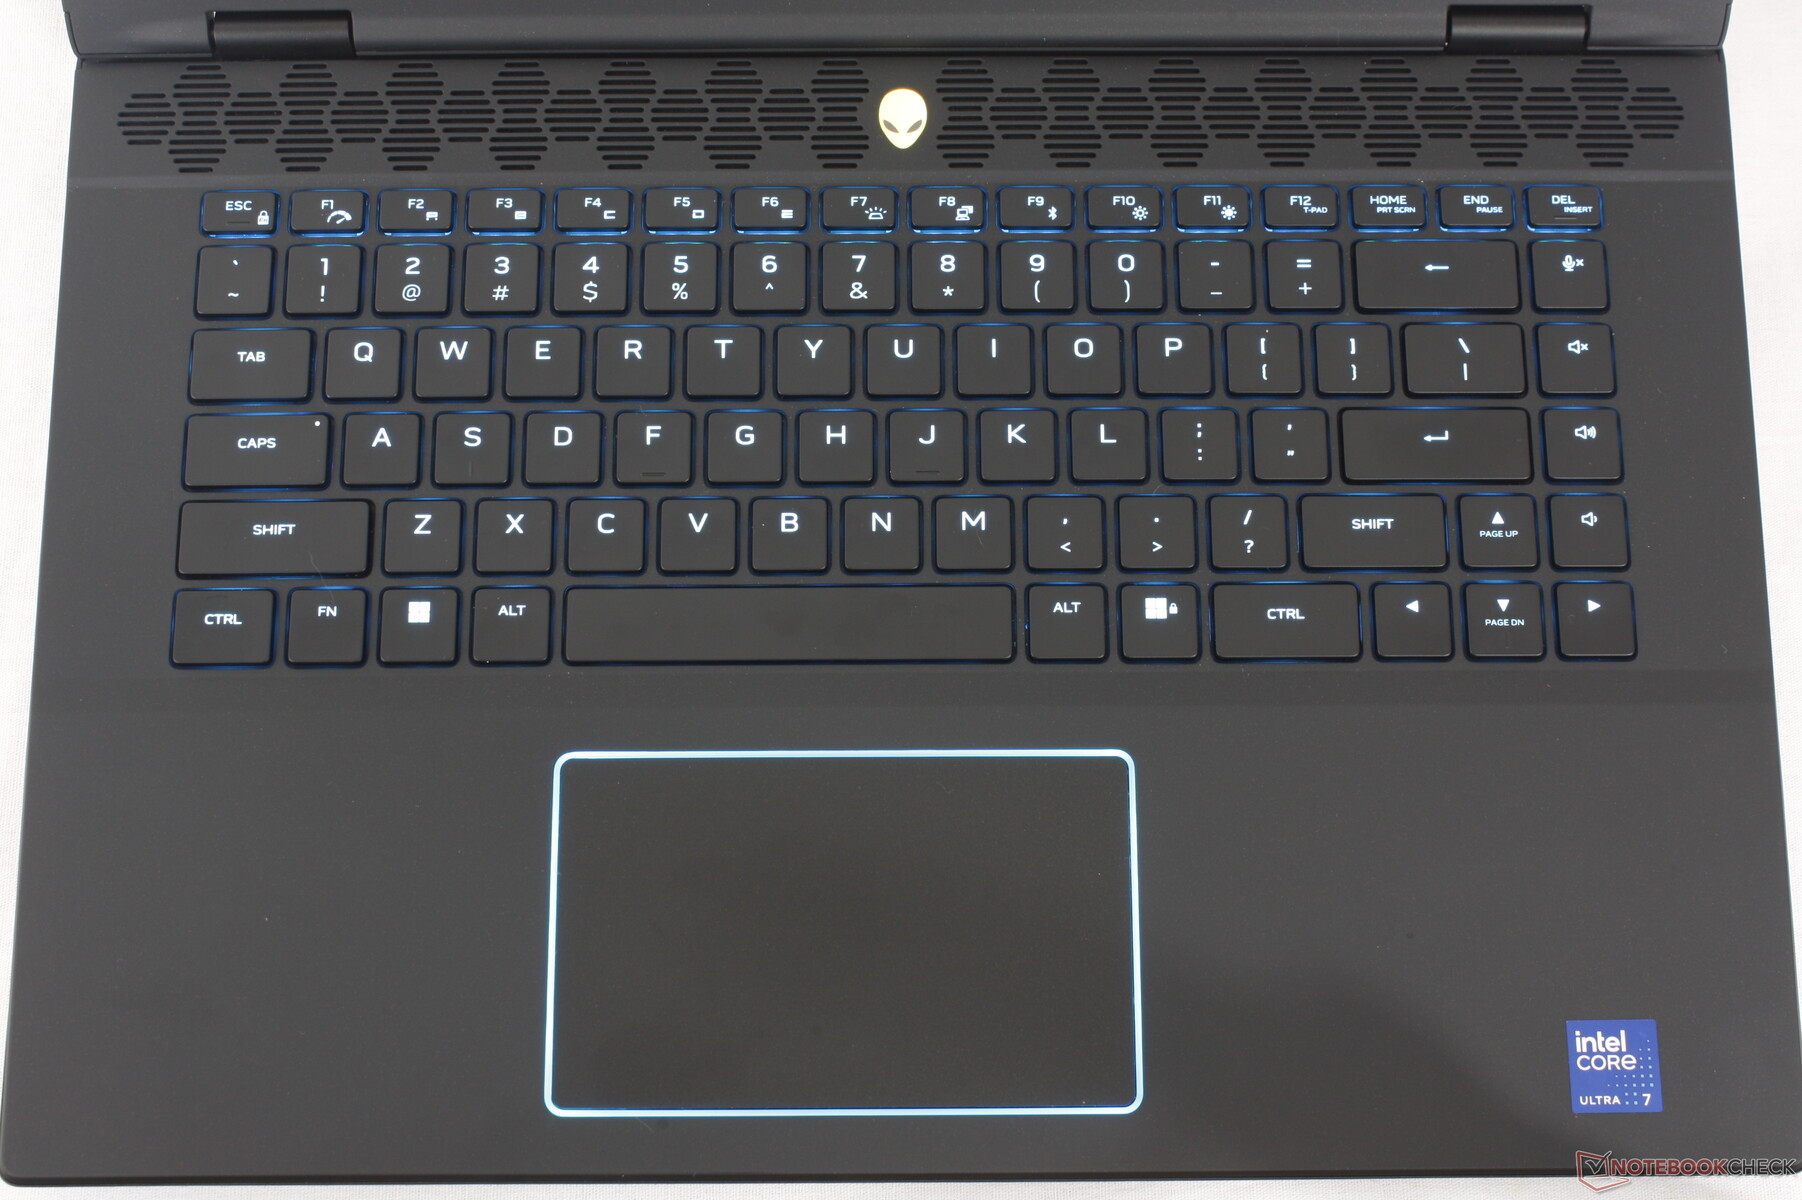
输入设备 - 无需机械操作
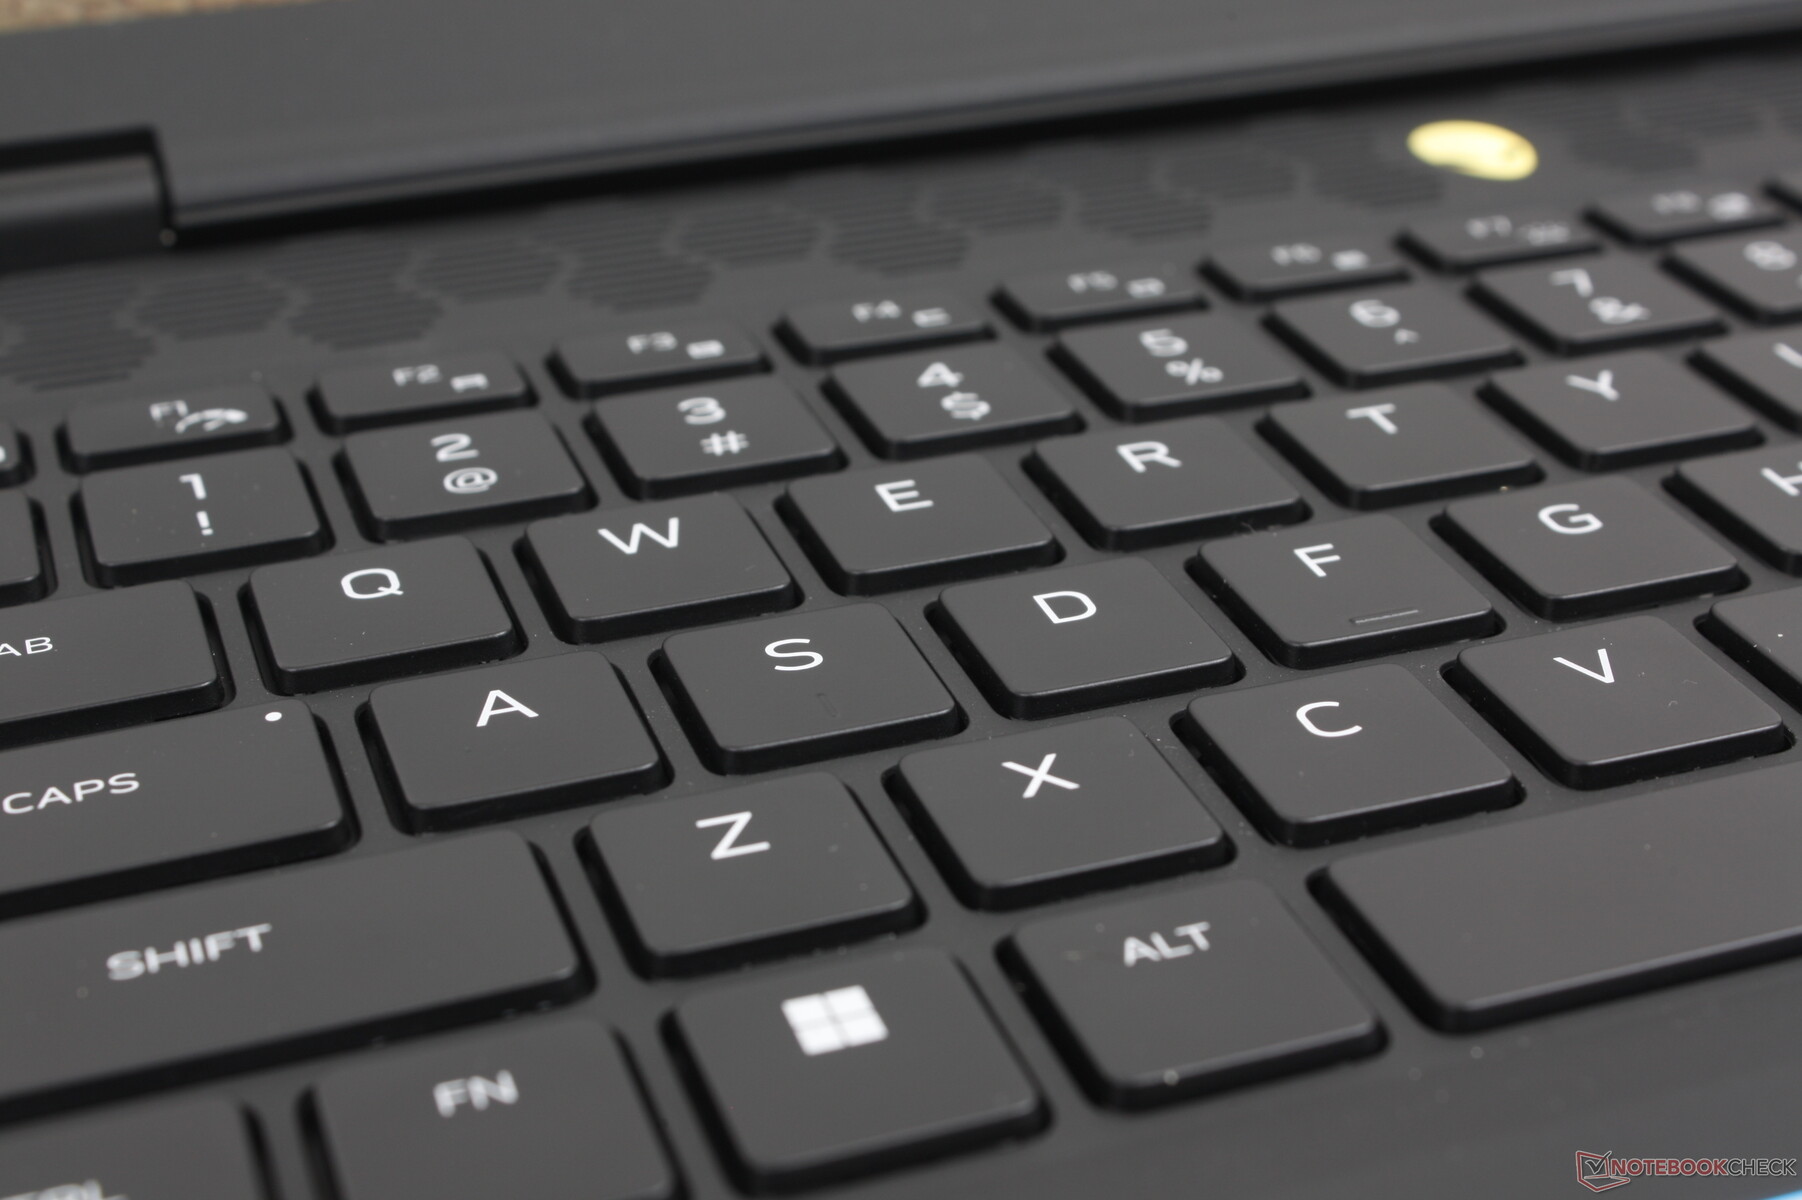
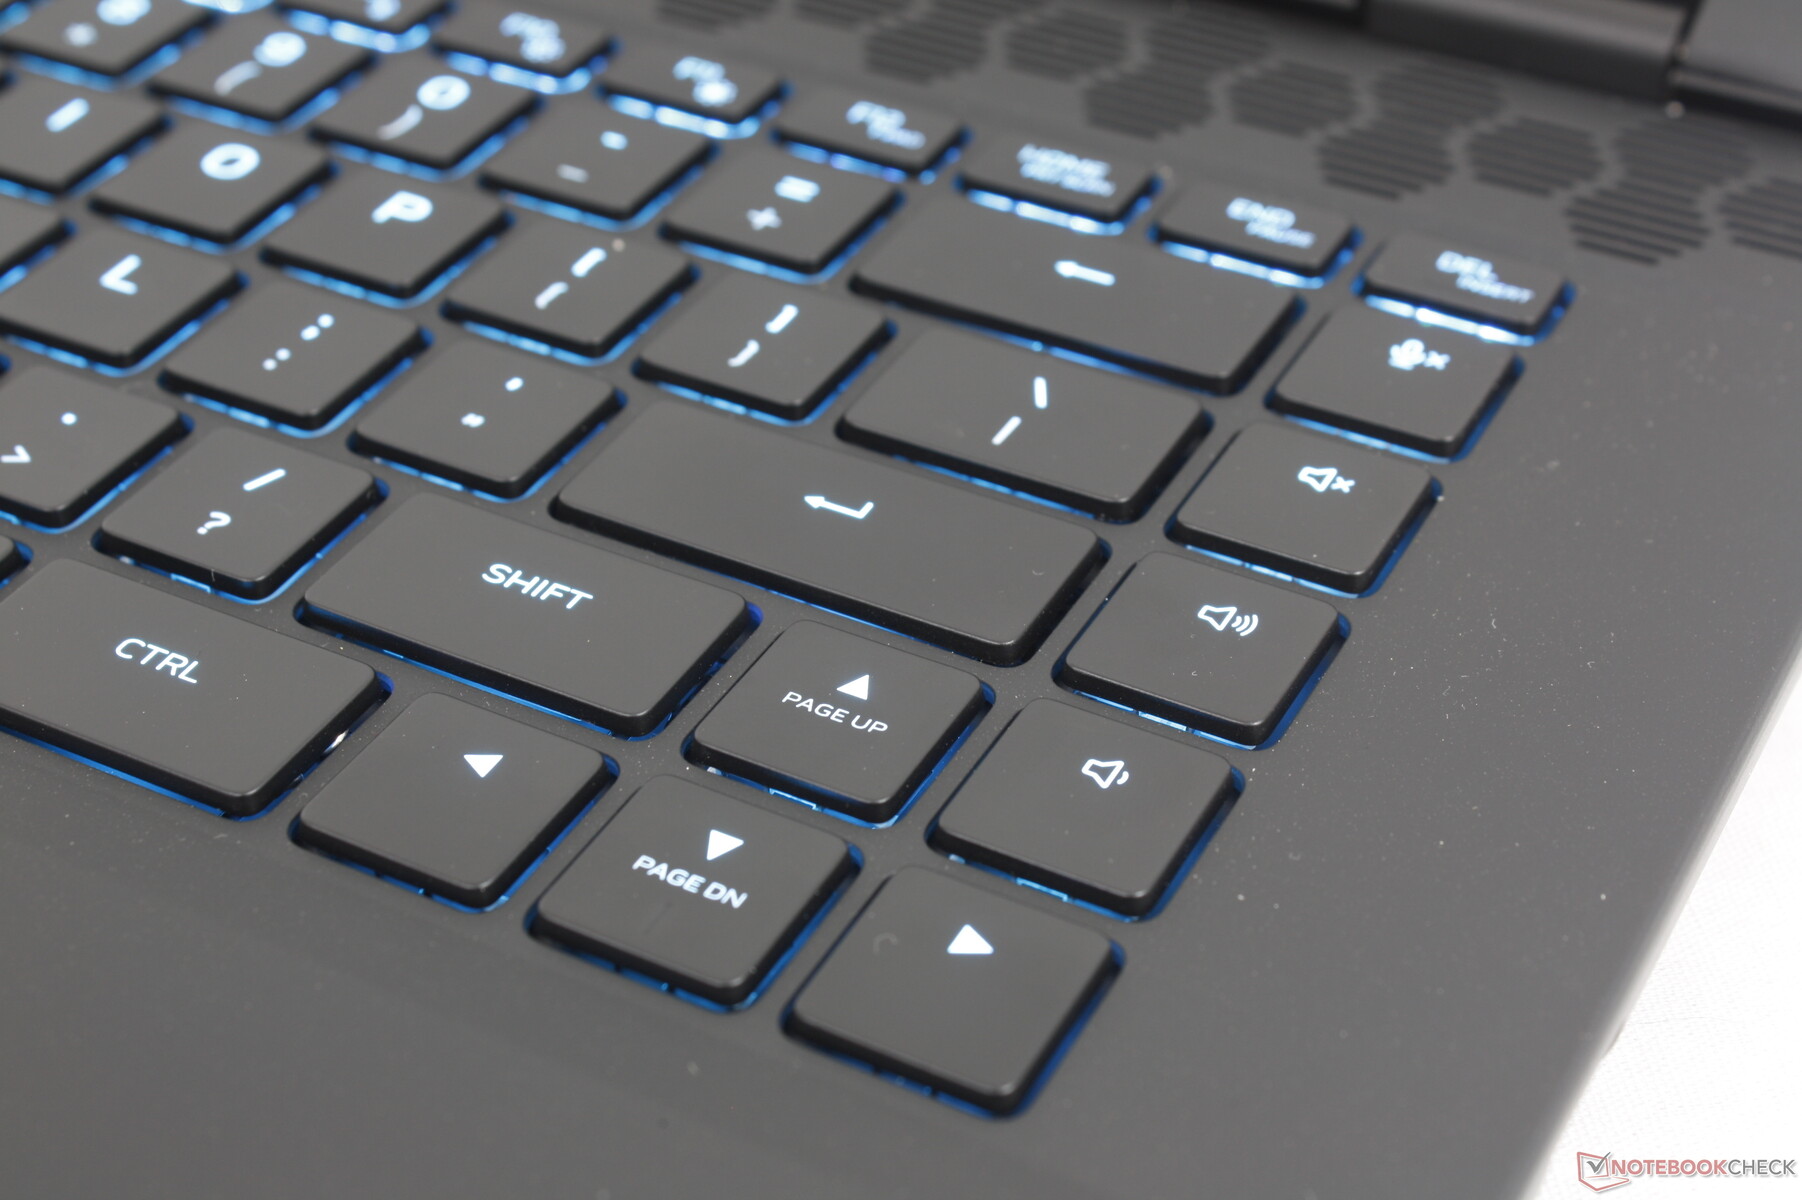
键盘
该系统使用 1.8 毫米行程的薄膜式按键,没有更多的机械选项,以保持较低的重量,并吸引游戏玩家以外的更多受众。不过,与大多数其他游戏笔记本电脑(包括 微星 Raider GE68或 HP Omen Transcend 16.尤其是空格键和回车键,在按下时比 QWERTY 主键更响亮、更清晰。
今年键盘新增了一个方便的 "隐形模式 "功能,该功能与 F2 键绑定,可将系统切换到静音模式,而无需首先启动 Alienware 命令中心。除此之外,键盘布局与最初的 m16 R1 保持一致。
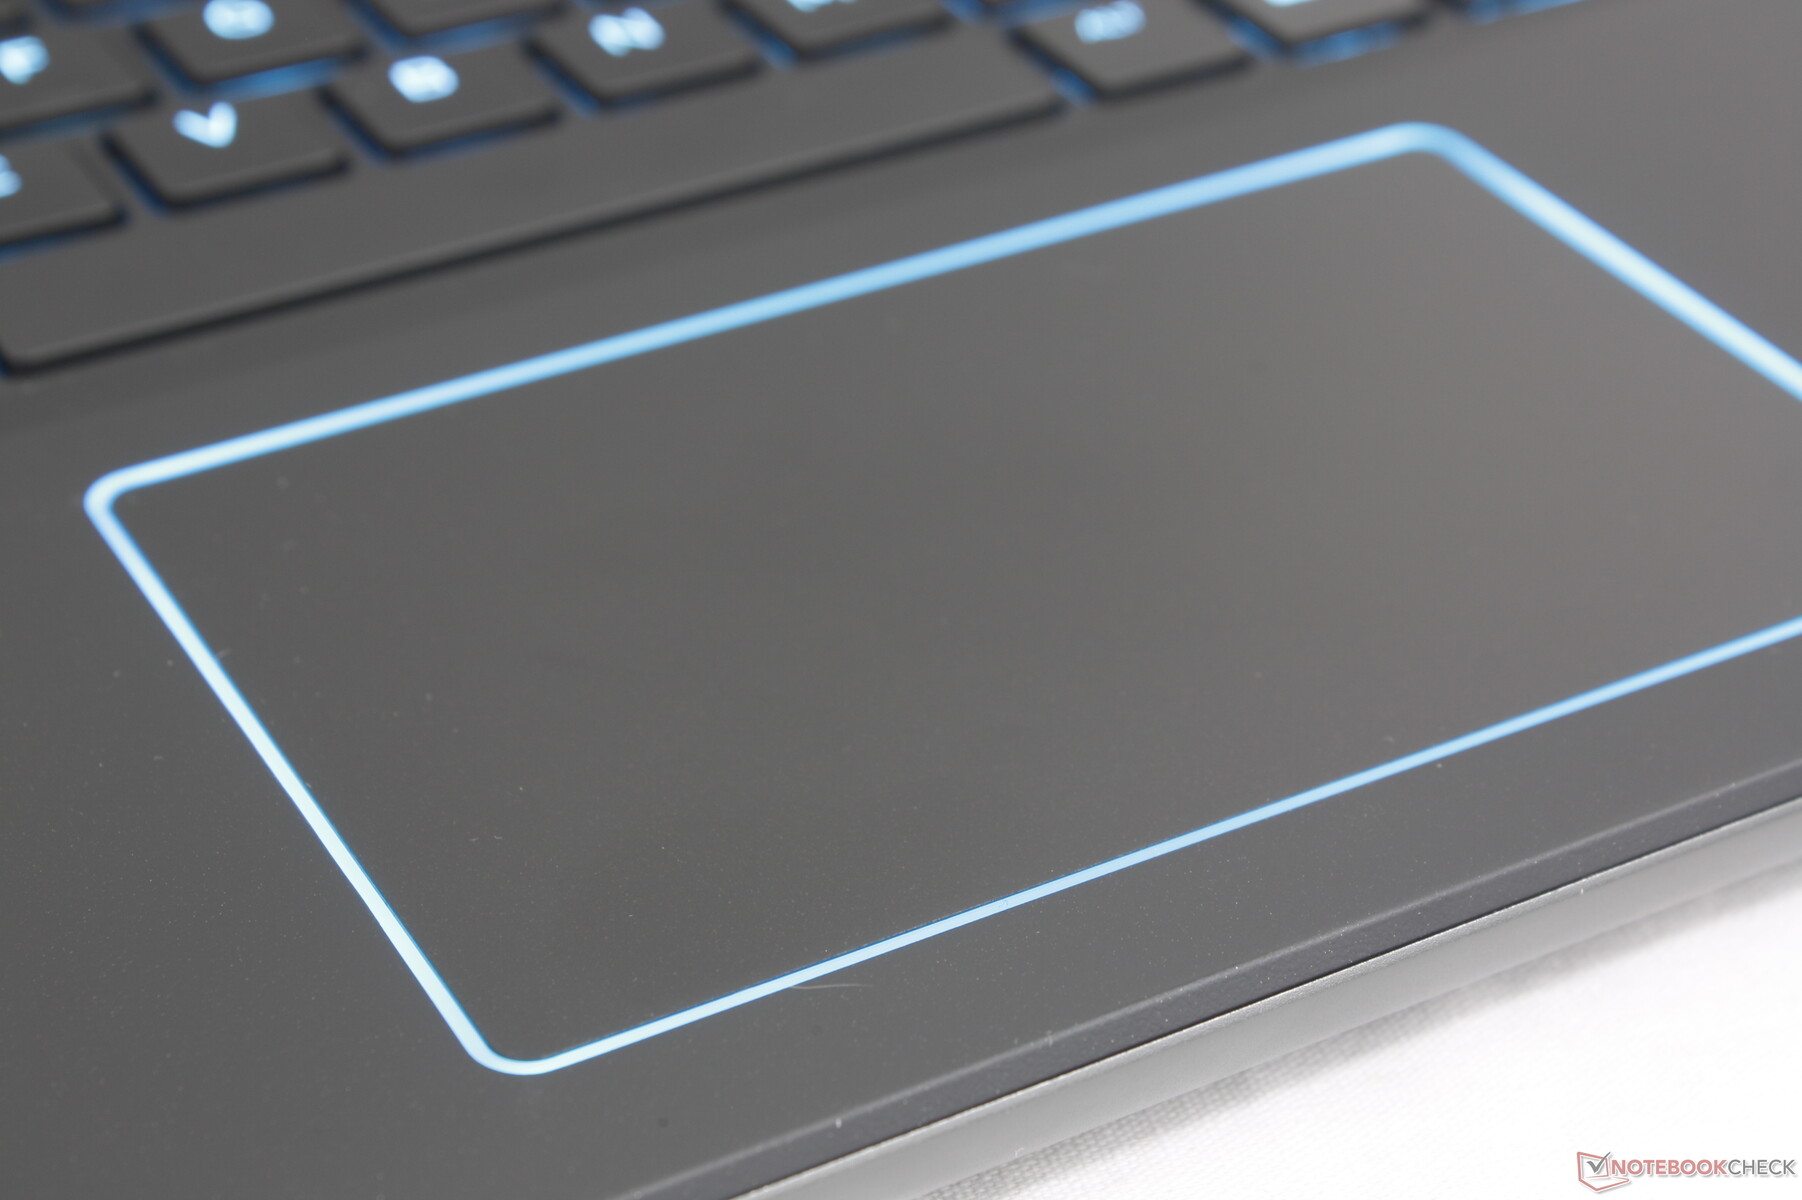
触摸板
点击板的尺寸比去年的型号略大(11.5 x 7 厘米对 11.3 x 6.6 厘米),周边还新增了 RGB 灯光。不过,点击时的反馈仍然是海绵状的,而且非常浅,手感并不令人满意。对于基本的指向和点击操作,它的工作足够稳定,但对于拖放等更紧凑的操作,仍建议使用鼠标。
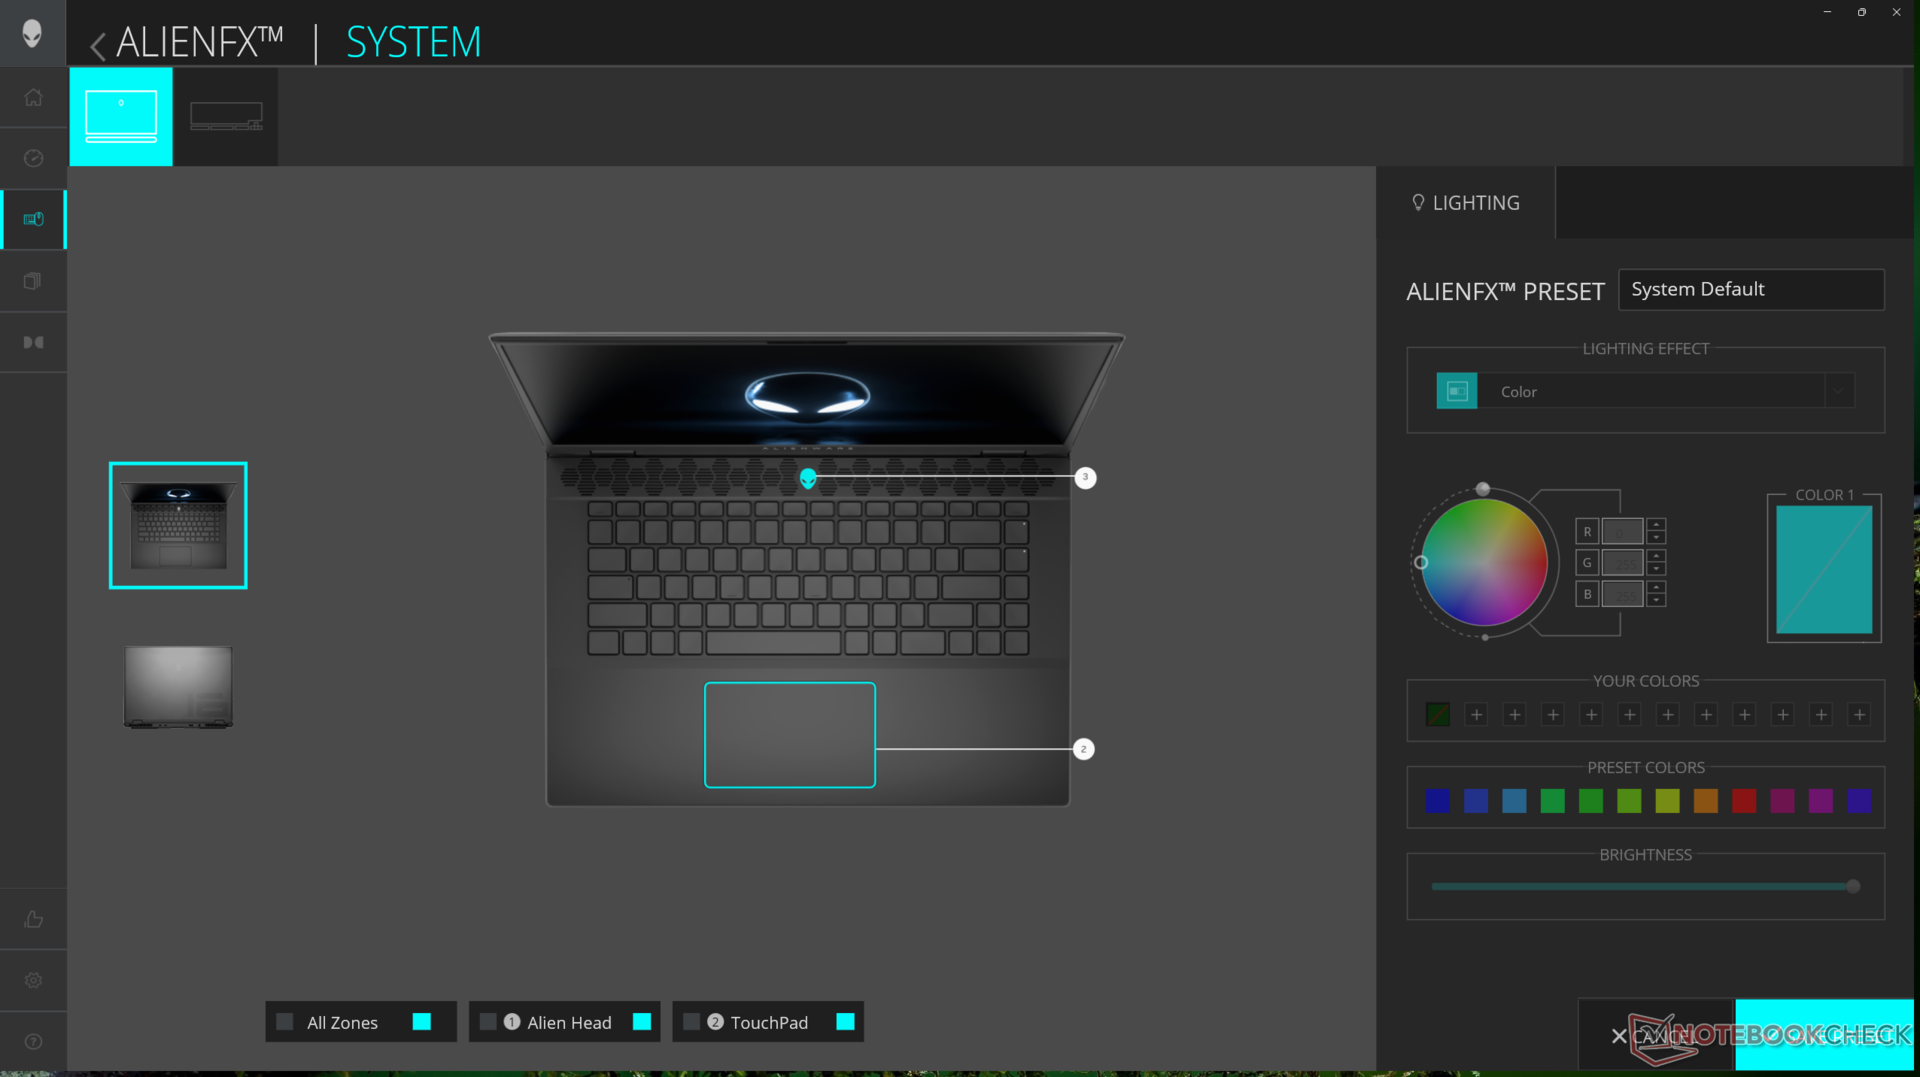
令人讨厌的是,RGB 灯光只能通过 Alienware 命令中心启用或禁用,因为没有热键来切换它。调整 RGB 键的亮度不会影响点击板周围的灯光。
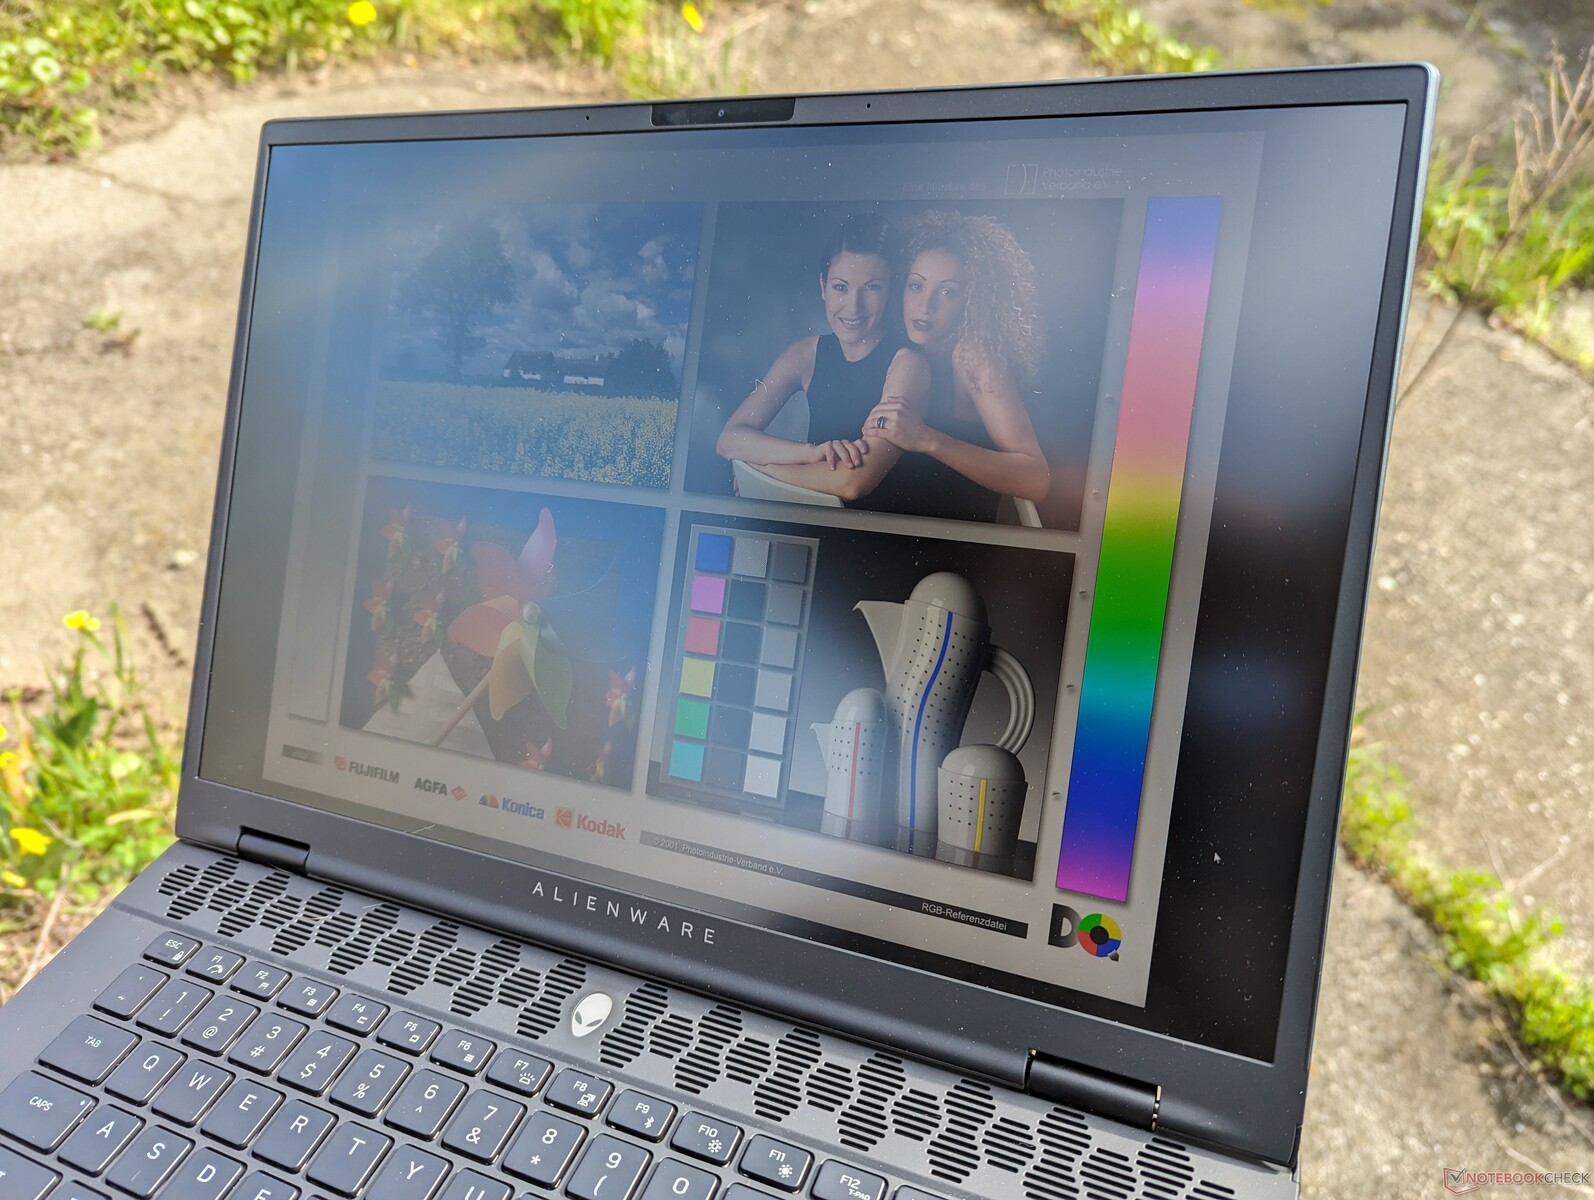
显示屏 - 240 Hz 和全 sRGB 现在是标准配置
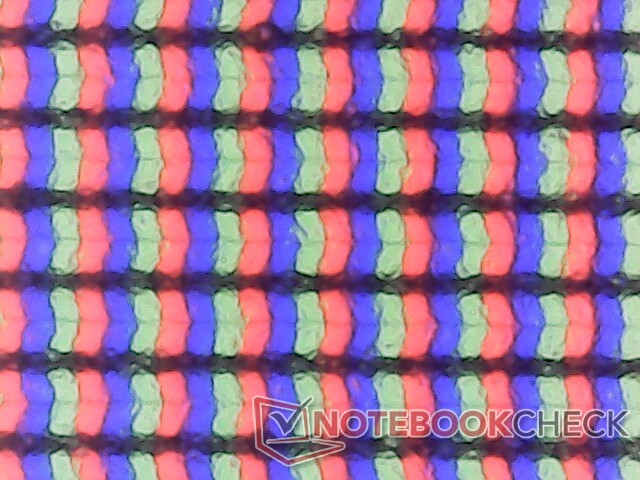
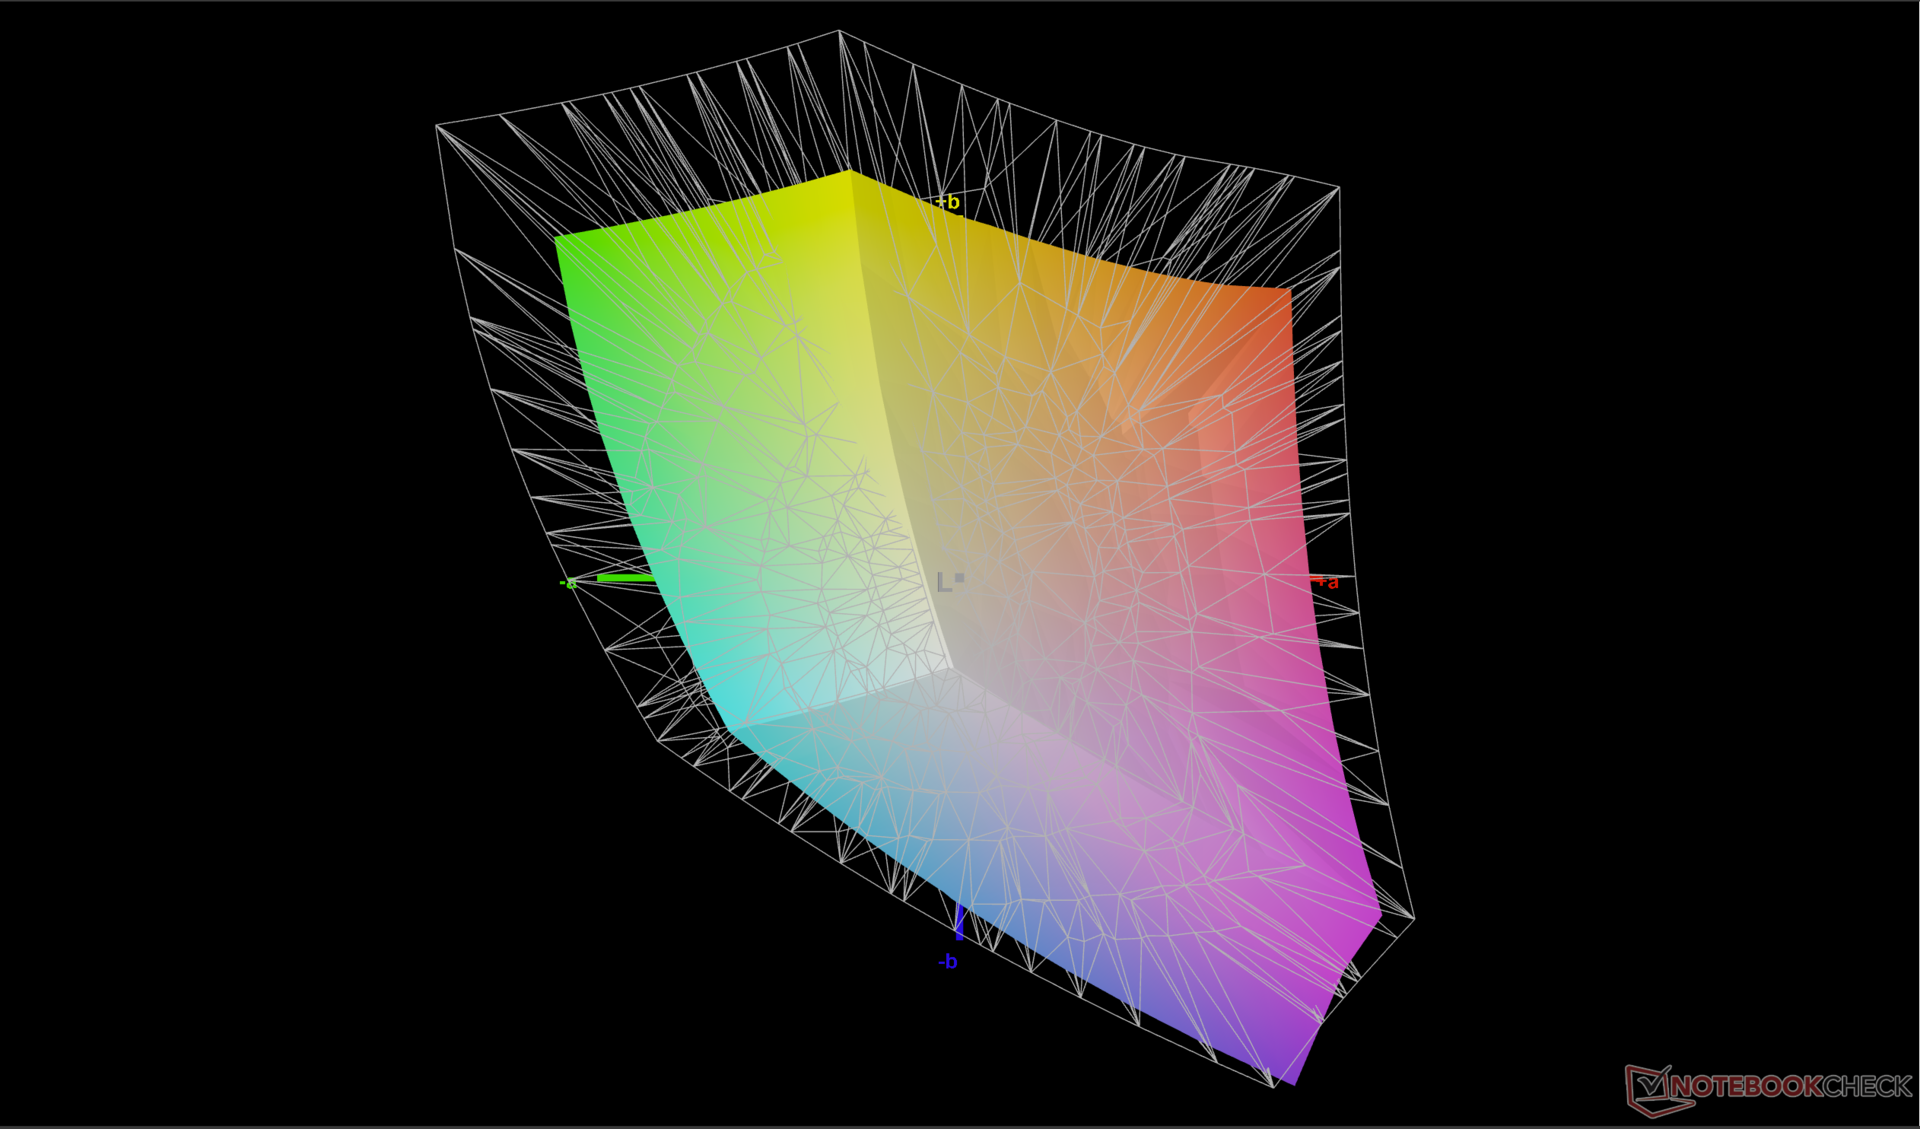
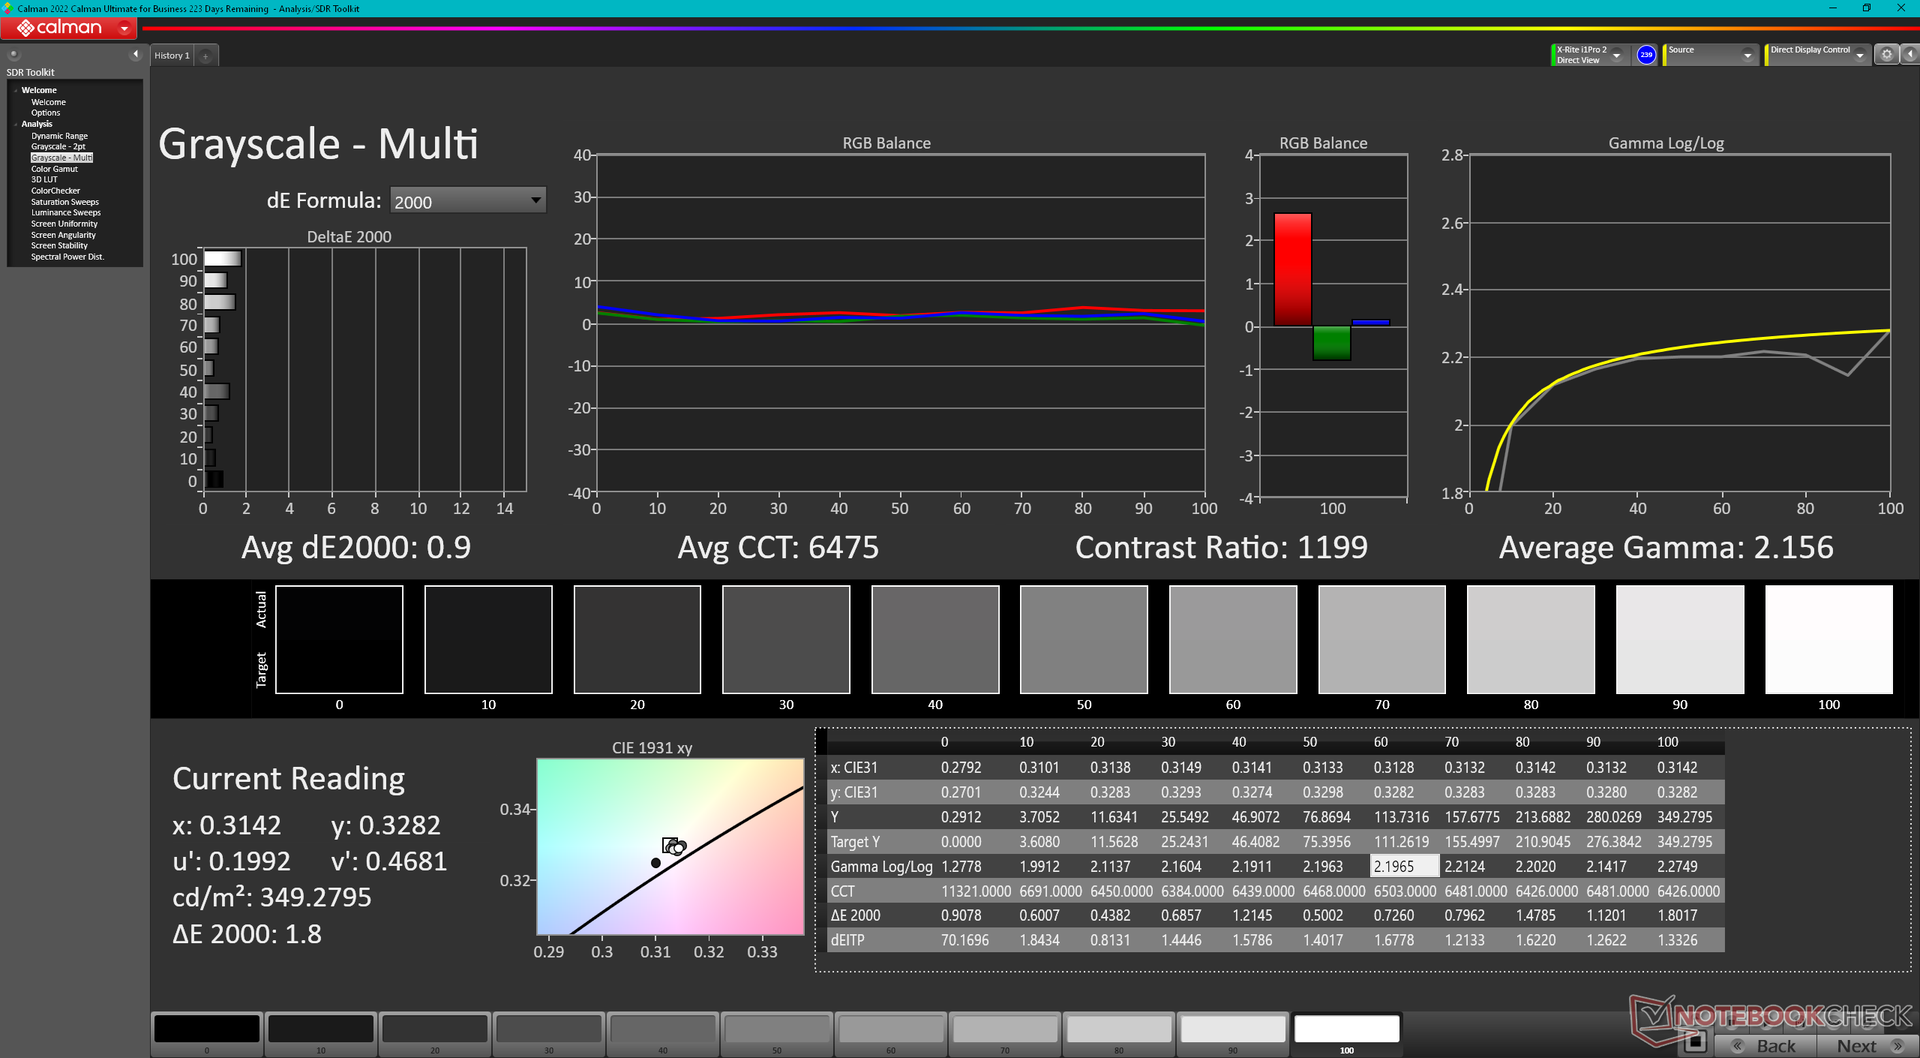
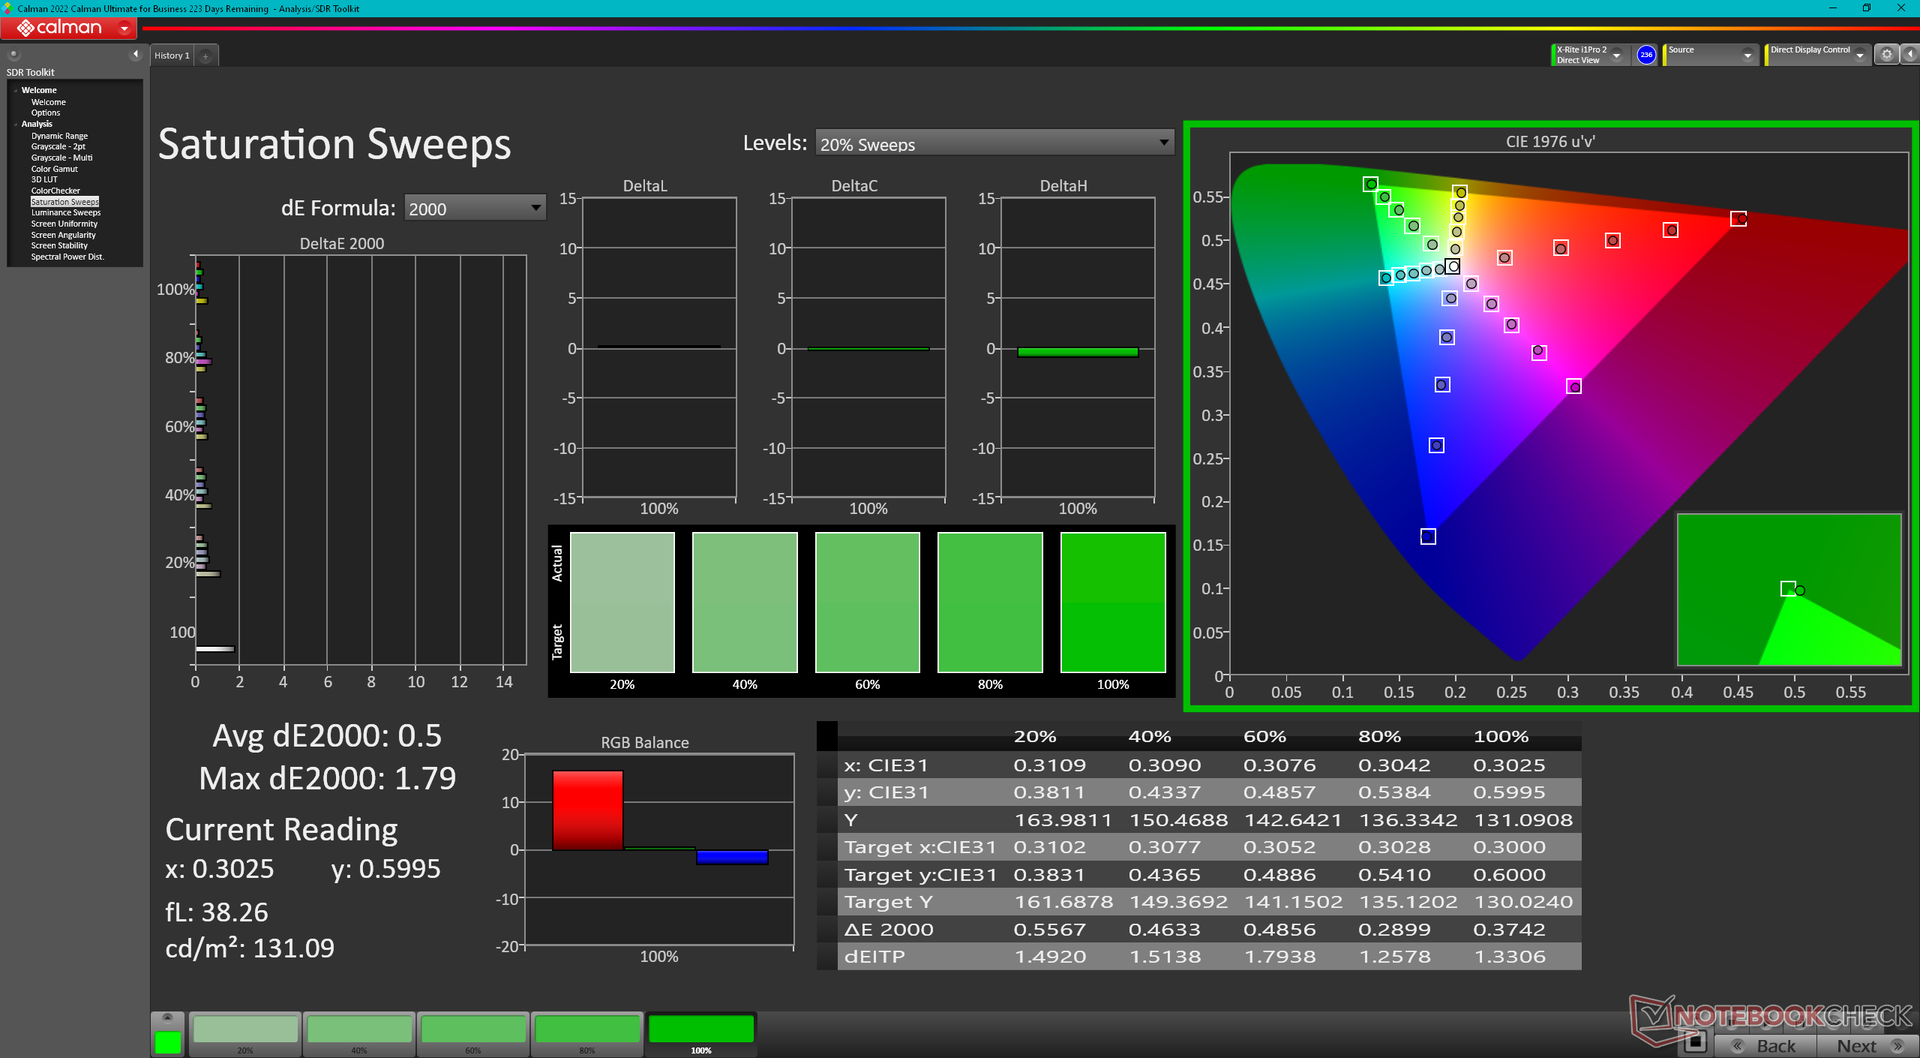
该机型采用京东方 NE16NYH 面板,而去年 m16 R1 采用的是京东方 NE16NYB 面板。更新的面板具有更快的原生刷新率(240 Hz 对 165 Hz),而所有其他属性基本保持不变,包括快速的黑白响应时间、约 1000:1 的对比度、完整的 sRGB 覆盖范围以及 300 至 350 nit 的最大亮度。这款显示器既适合游戏,也适合业余编辑。
尽管新面板可能很流畅,但它仍然缺乏 DCI-P3 色彩和 Windows 可变刷新率。前者会吸引更多的专业图形编辑人员,而后者则会改善电池续航时间。x16 R1、HP Omen Transcend 16 和 华硕 ROG Zephyrus G16.由于显示屏亮度不够,无法满足 HDR400+ 的先决条件,因此也不支持 HDR。
| |||||||||||||||||||||||||
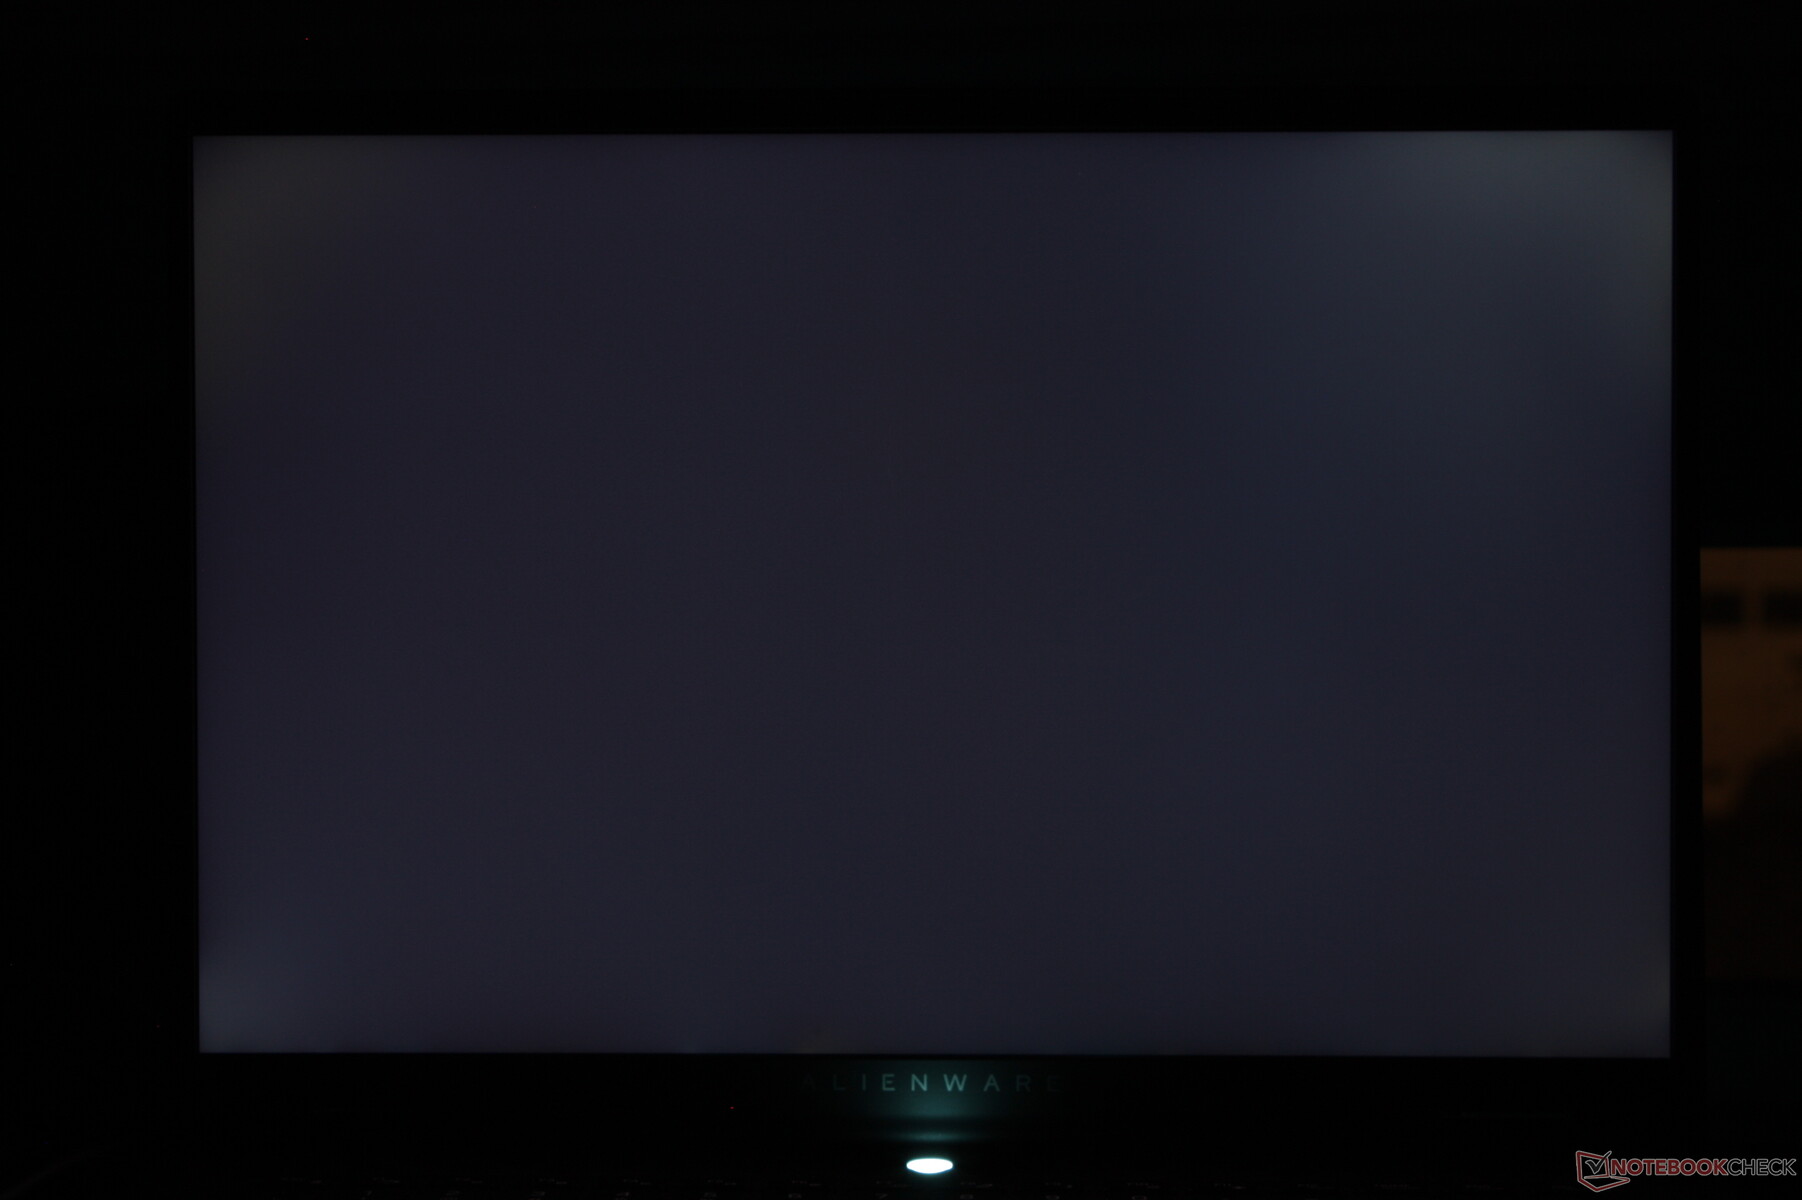
Brightness Distribution: 87 %
Center on Battery: 345.8 cd/m²
Contrast: 1153:1 (Black: 0.3 cd/m²)
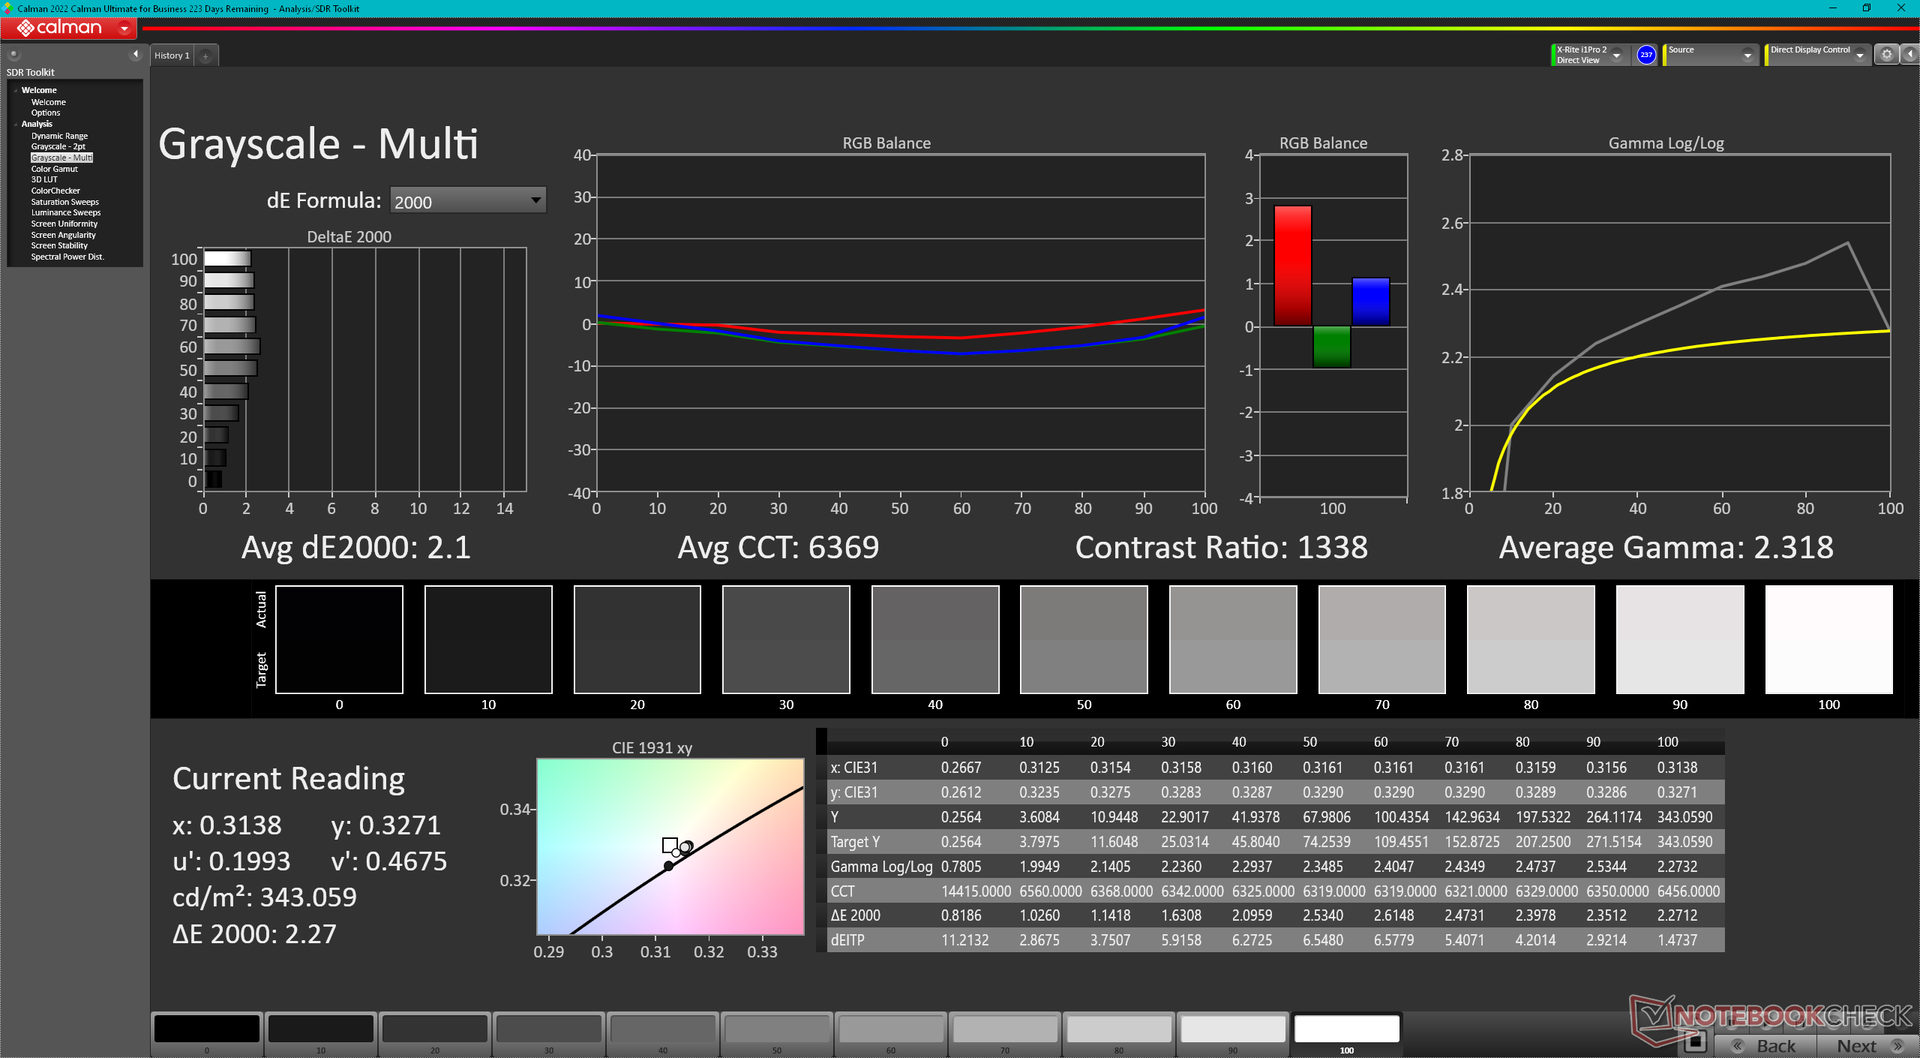
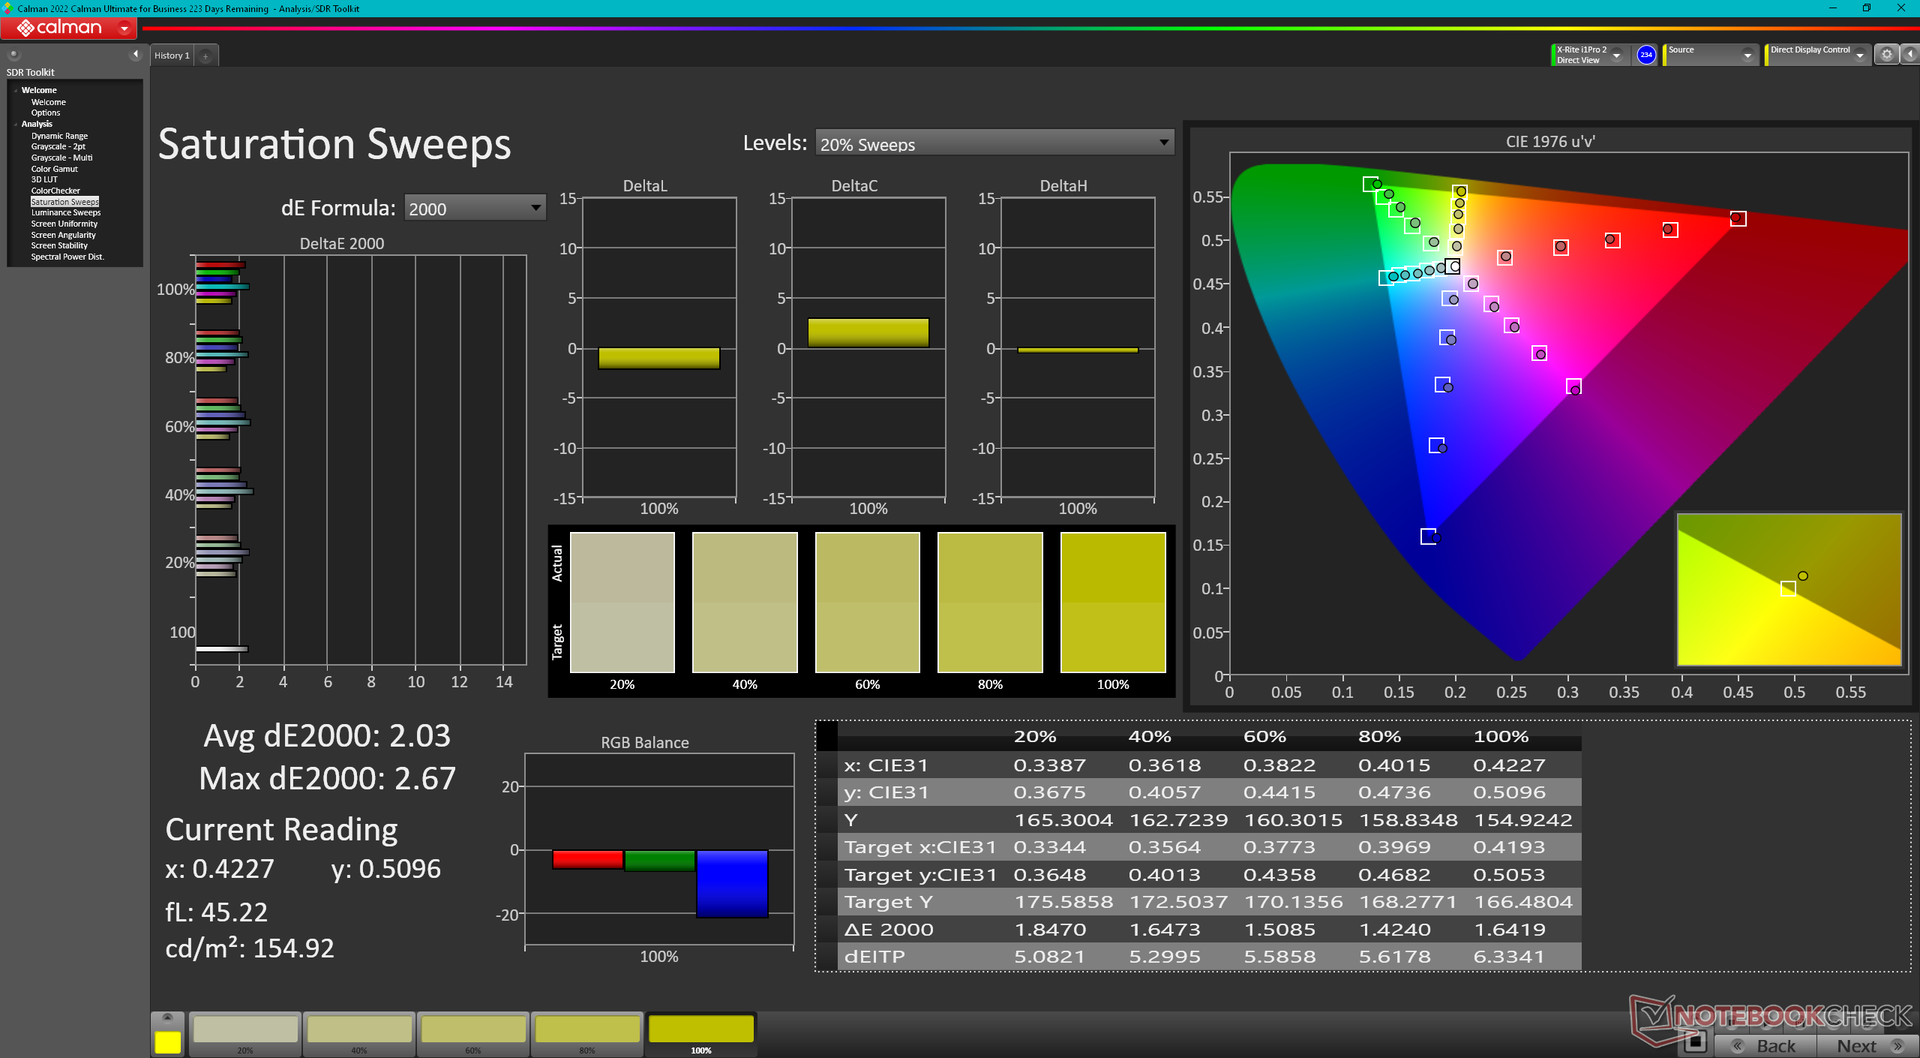
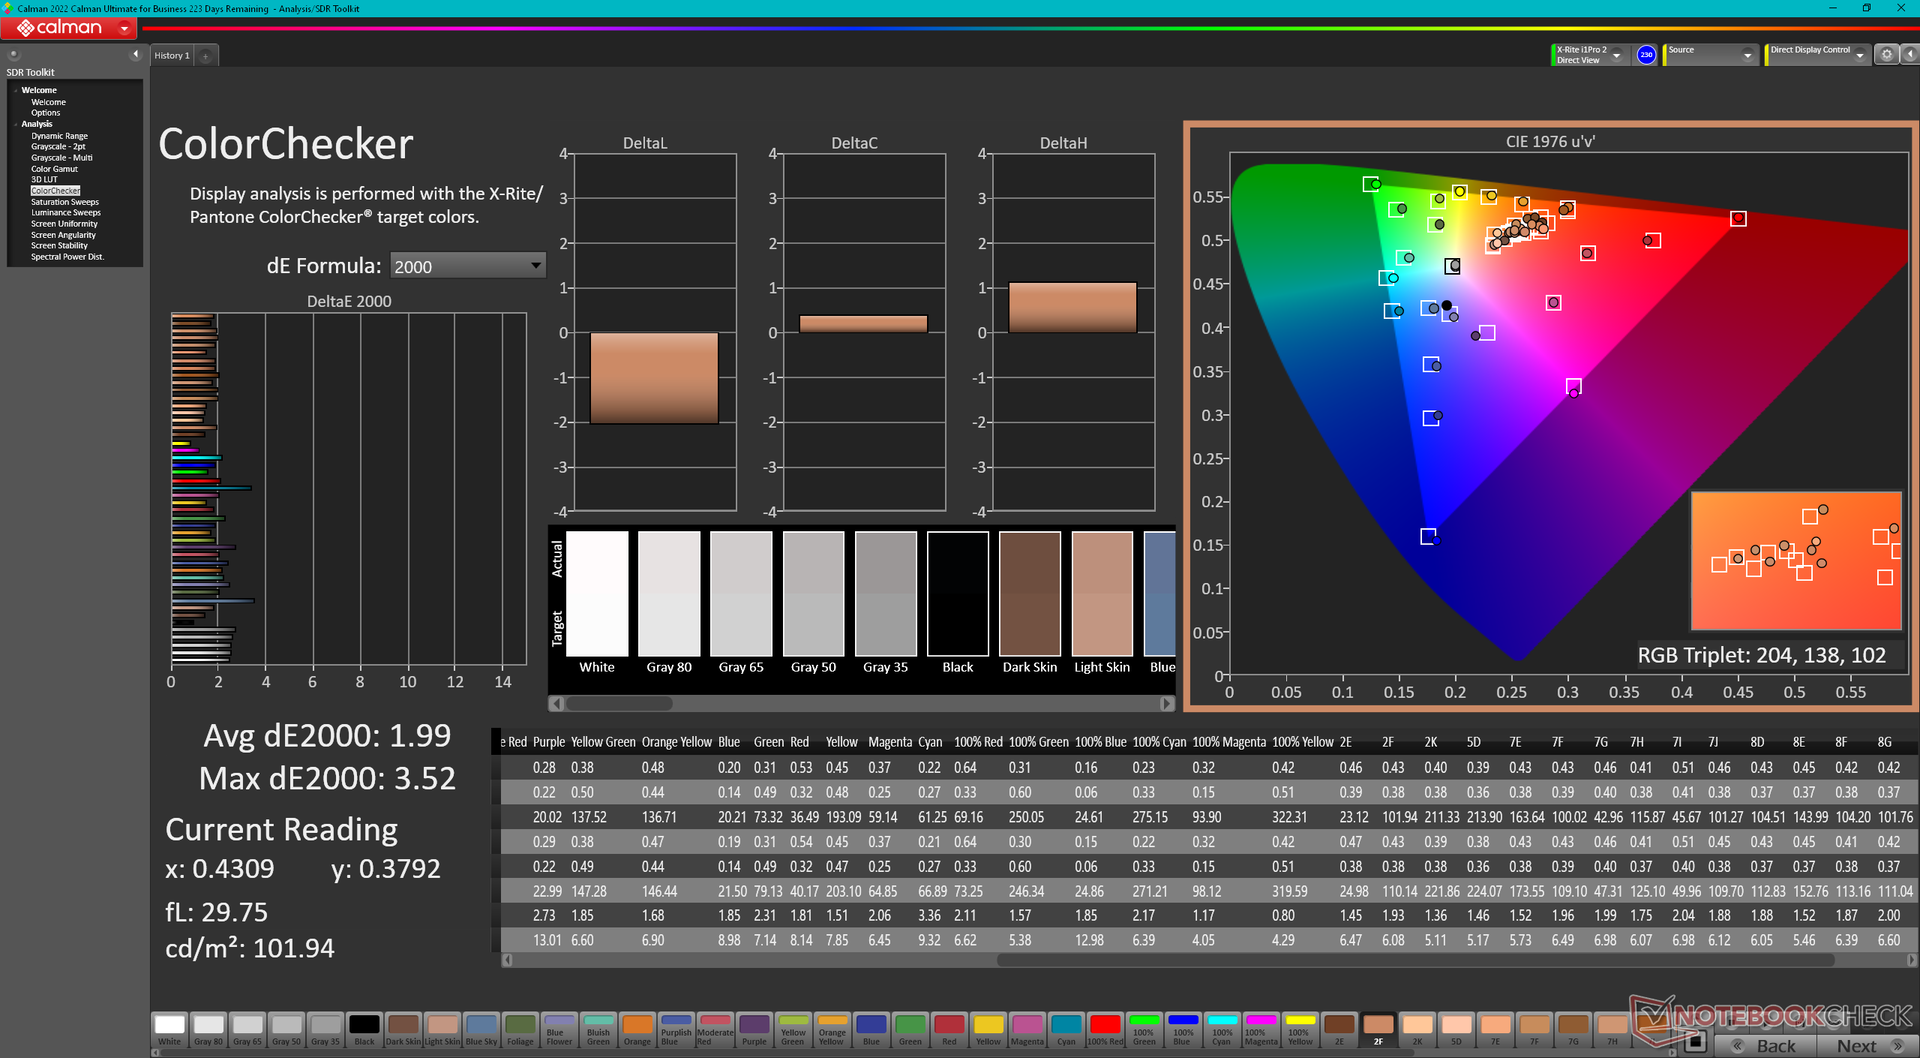
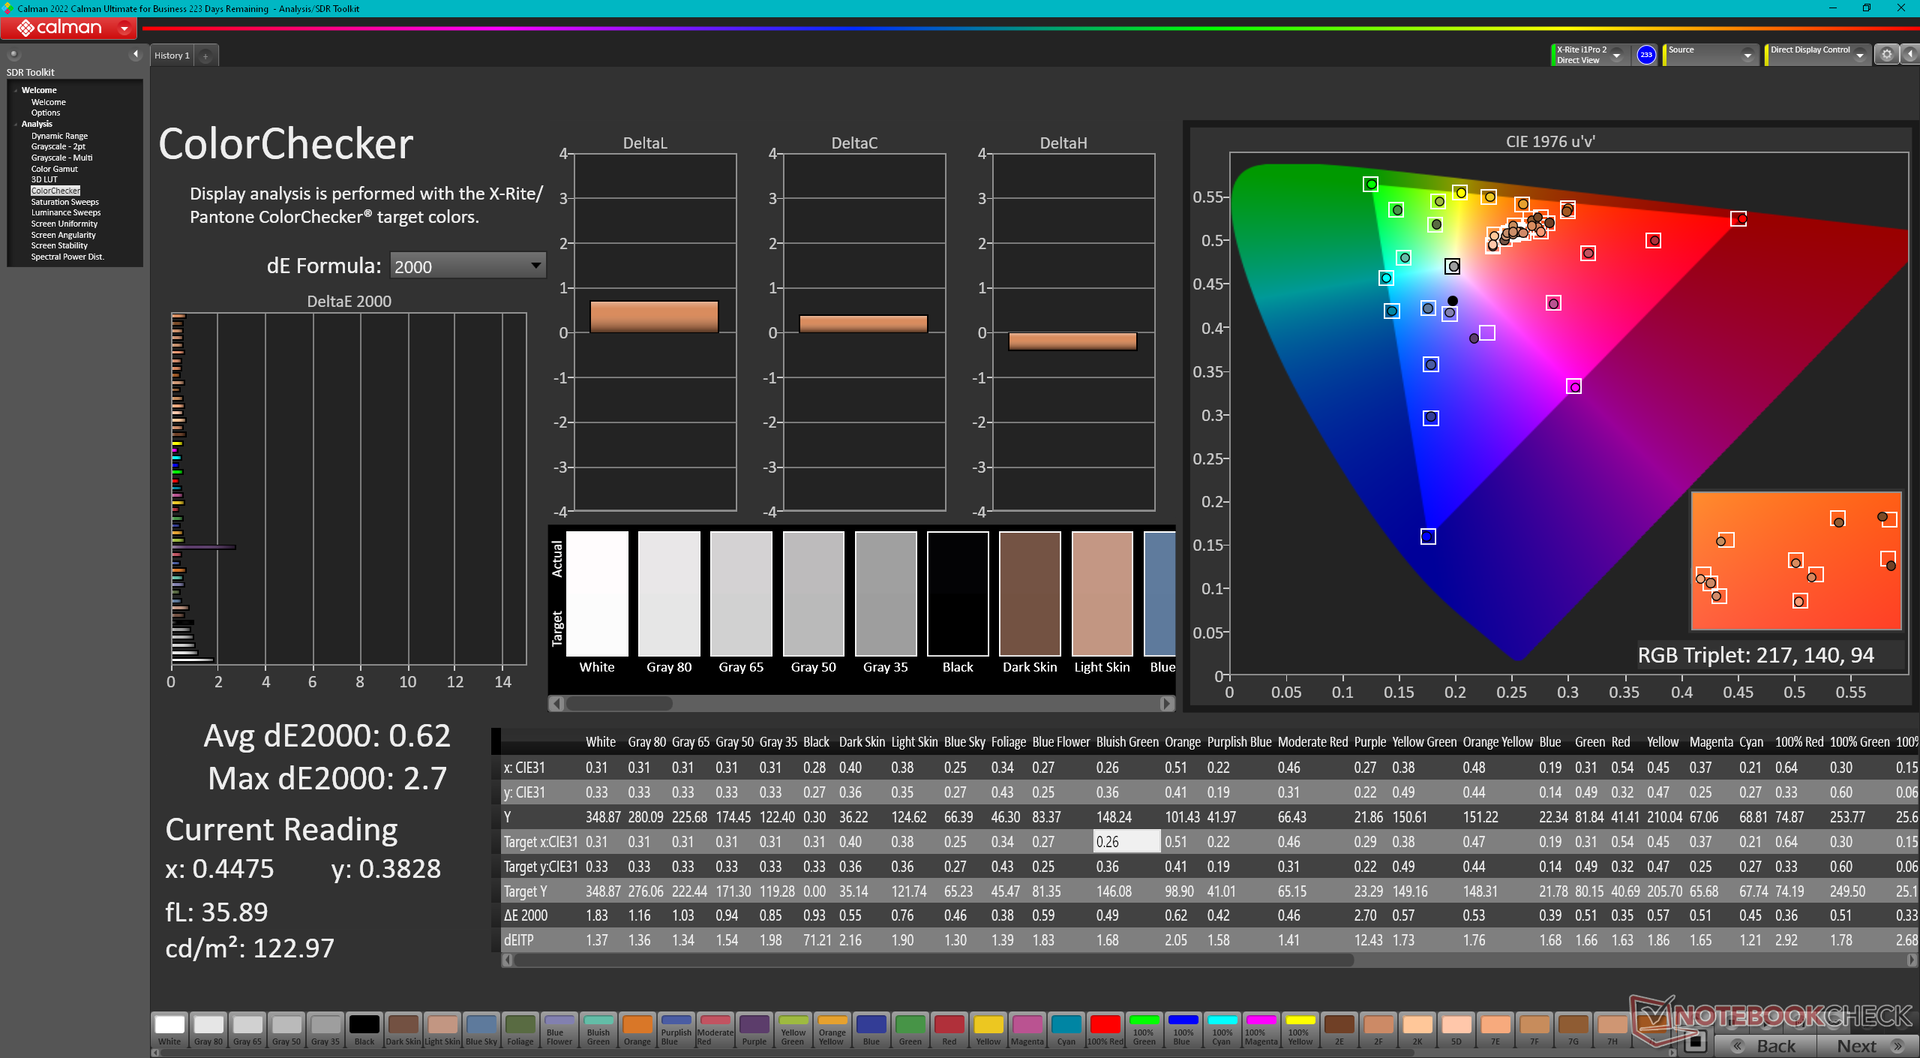
ΔE ColorChecker Calman: 1.99 | ∀{0.5-29.43 Ø4.71}
calibrated: 0.62
ΔE Greyscale Calman: 2.1 | ∀{0.09-98 Ø4.96}
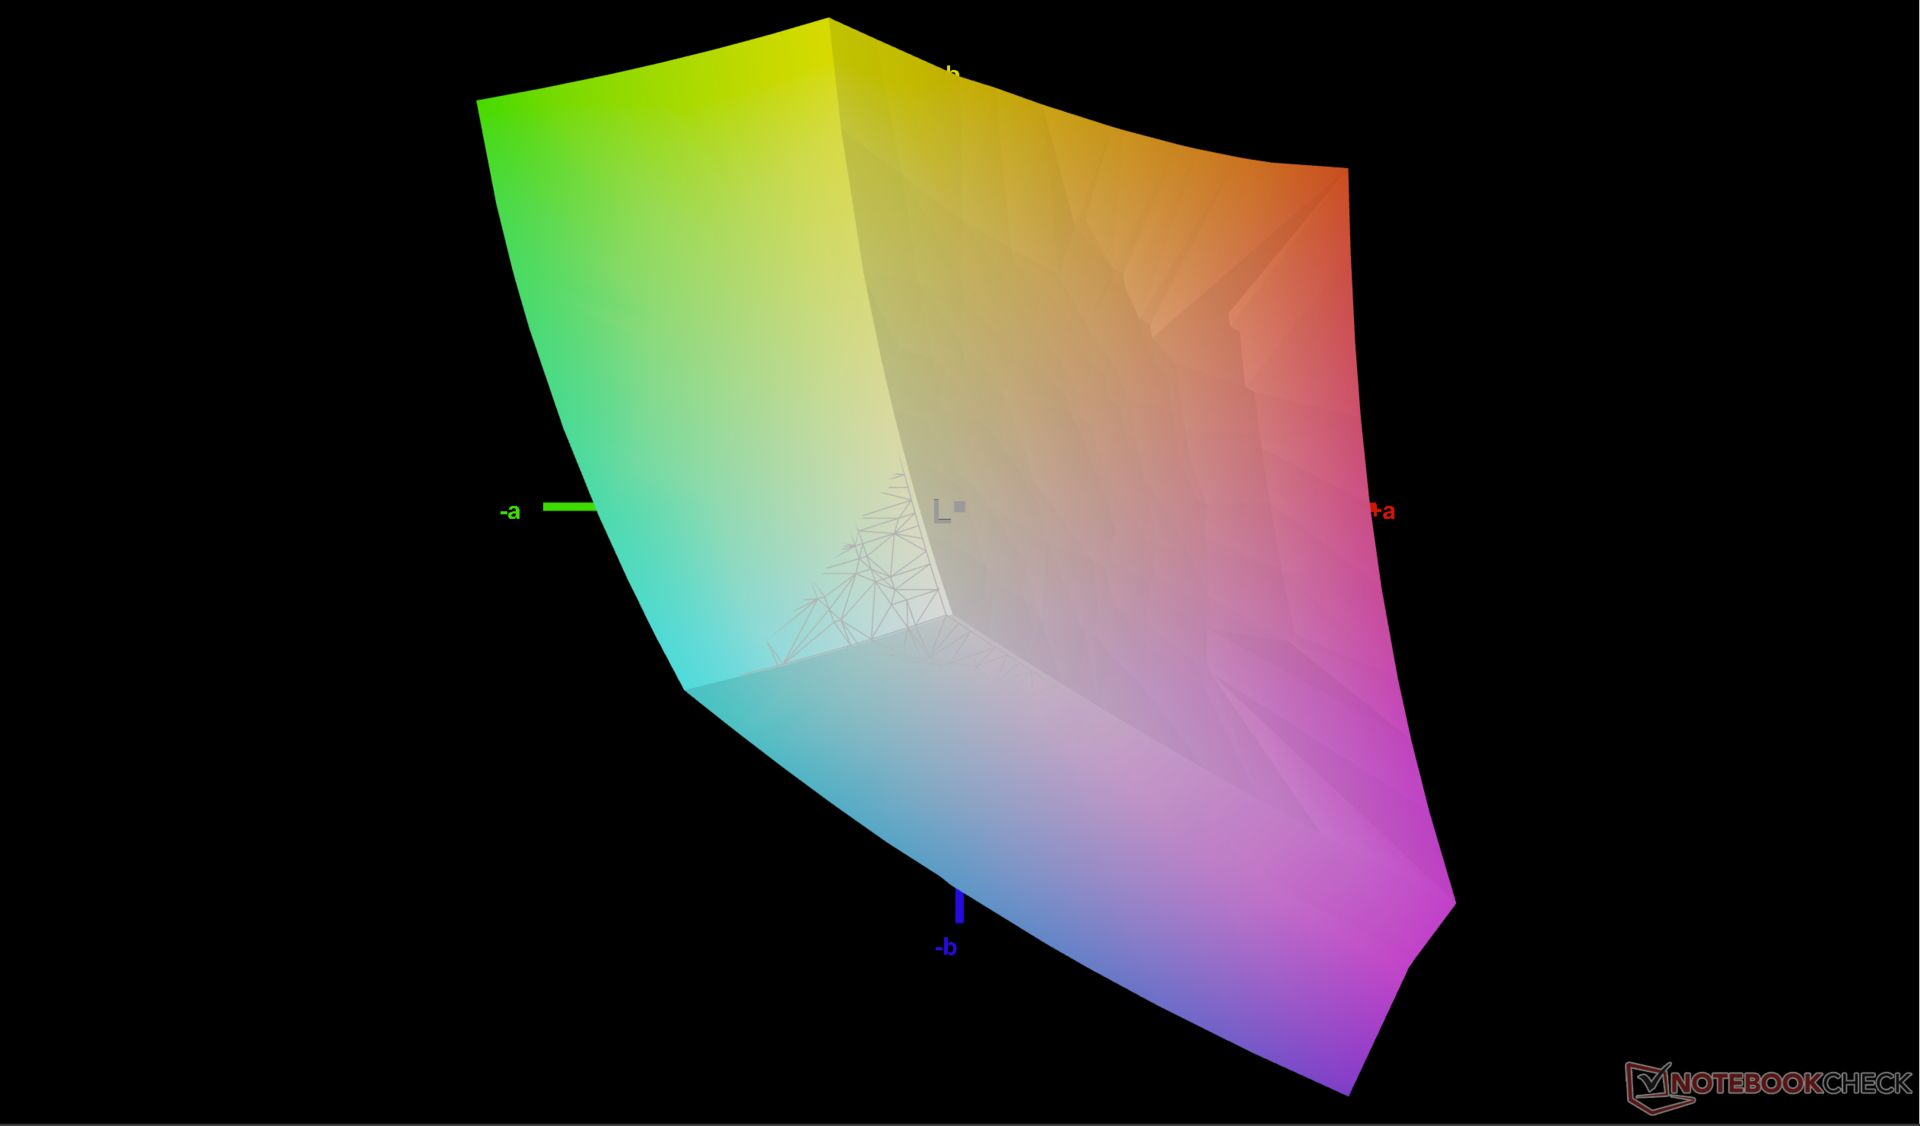
71.4% AdobeRGB 1998 (Argyll 3D)
100% sRGB (Argyll 3D)
71% Display P3 (Argyll 3D)
Gamma: 2.32
CCT: 6369 K
| Alienware m16 R2 BOE NE16NYH, IPS, 2560x1600, 16" | Alienware m16 R1 Intel BOE NE16NYB, IPS, 2560x1600, 16" | Alienware x16 R1 BOE NE16NZ4, IPS, 2560x1600, 16" | HP Omen Transcend 16-u1095ng ATNA60DL02-0 (SDC41A4), OLED, 2560x1600, 16" | Asus ROG Zephyrus G16 2024 GU605M ATNA60DL01-0, OLED, 2560x1600, 16" | Lenovo Legion Slim 7 16APH8 BOE NE160QDM-NZ3, IPS, 2560x1600, 16" | |
|---|---|---|---|---|---|---|
| Display | -3% | 21% | 26% | 26% | 0% | |
| Display P3 Coverage (%) | 71 | 67.7 -5% | 99.2 40% | 99.8 41% | 99.9 41% | 70.3 -1% |
| sRGB Coverage (%) | 100 | 97.2 -3% | 100 0% | 100 0% | 100 0% | 99.6 0% |
| AdobeRGB 1998 Coverage (%) | 71.4 | 70 -2% | 88.6 24% | 97 36% | 96.9 36% | 72.4 1% |
| Response Times | 23% | -4% | 97% | 97% | -45% | |
| Response Time Grey 50% / Grey 80% * (ms) | 5.7 ? | 4 ? 30% | 5.1 ? 11% | 0.2 ? 96% | 0.22 ? 96% | 12.6 ? -121% |
| Response Time Black / White * (ms) | 8.7 ? | 7.3 ? 16% | 10.3 ? -18% | 0.2 ? 98% | 0.25 ? 97% | 5.9 ? 32% |
| PWM Frequency (Hz) | 120 ? | 960 ? | ||||
| Screen | -20% | -13% | 129% | 14% | 5% | |
| Brightness middle (cd/m²) | 345.8 | 306 -12% | 302.2 -13% | 390 13% | 416 20% | 545 58% |
| Brightness (cd/m²) | 337 | 302 -10% | 285 -15% | 392 16% | 418 24% | 502 49% |
| Brightness Distribution (%) | 87 | 89 2% | 89 2% | 98 13% | 96 10% | 82 -6% |
| Black Level * (cd/m²) | 0.3 | 0.3 -0% | 0.26 13% | 0.02 93% | 0.48 -60% | |
| Contrast (:1) | 1153 | 1020 -12% | 1162 1% | 19500 1591% | 1135 -2% | |
| Colorchecker dE 2000 * | 1.99 | 2.57 -29% | 1.63 18% | 1.94 3% | 1.6 20% | 1.36 32% |
| Colorchecker dE 2000 max. * | 3.52 | 4.26 -21% | 4.13 -17% | 4.26 -21% | 2.1 40% | 3.11 12% |
| Colorchecker dE 2000 calibrated * | 0.62 | 0.85 -37% | 1.17 -89% | 4.21 -579% | 1.04 -68% | |
| Greyscale dE 2000 * | 2.1 | 3.3 -57% | 2.5 -19% | 1.5 29% | 2.7 -29% | 1.4 33% |
| Gamma | 2.32 95% | 1.997 110% | 2.23 99% | 2.221 99% | 2.16 102% | 2.253 98% |
| CCT | 6369 102% | 6895 94% | 6590 99% | 6395 102% | 6331 103% | 6631 98% |
| Total Average (Program / Settings) | 0% /
-10% | 1% /
-4% | 84% /
102% | 46% /
32% | -13% /
-3% |
* ... smaller is better
显示器开箱后校准良好,灰度和色彩 deltaE 平均值分别仅为 2.1 和 1.99。如果使用我们的 X-Rite 色度计进一步校准,结果会进一步改善,分别小于 1,但这对大多数用户来说应该没有必要。我们的校准 ICM 配置文件可在上面免费下载。
Display Response Times
| ↔ Response Time Black to White | ||
|---|---|---|
| 8.7 ms ... rise ↗ and fall ↘ combined | ↗ 4.6 ms rise | 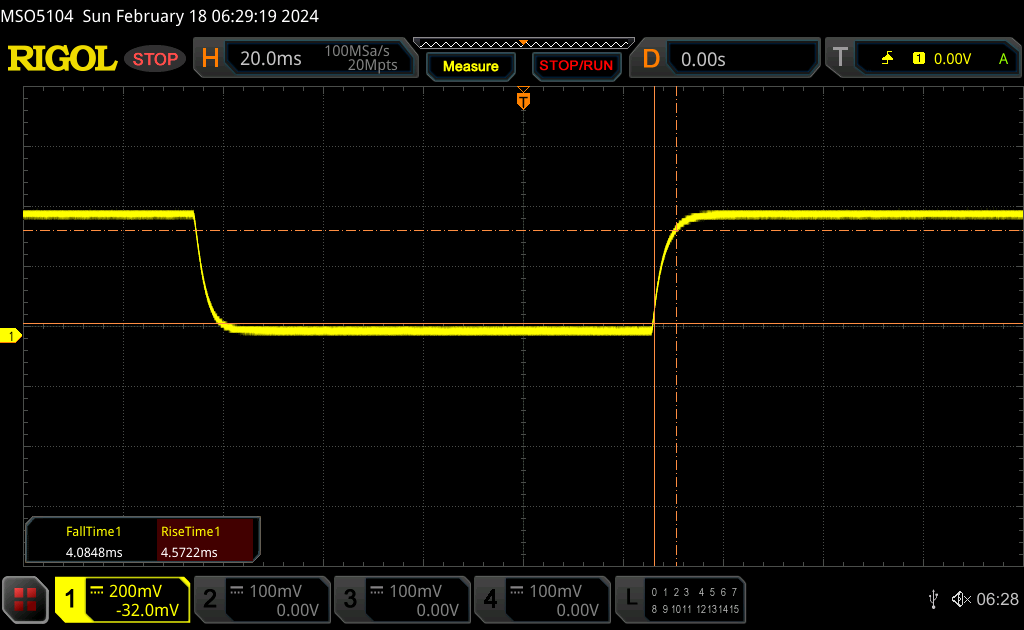 |
| ↘ 4.1 ms fall | ||
| The screen shows fast response rates in our tests and should be suited for gaming. In comparison, all tested devices range from 0.1 (minimum) to 240 (maximum) ms. » 24 % of all devices are better. This means that the measured response time is better than the average of all tested devices (19.8 ms). | ||
| ↔ Response Time 50% Grey to 80% Grey | ||
| 5.7 ms ... rise ↗ and fall ↘ combined | ↗ 2.6 ms rise | 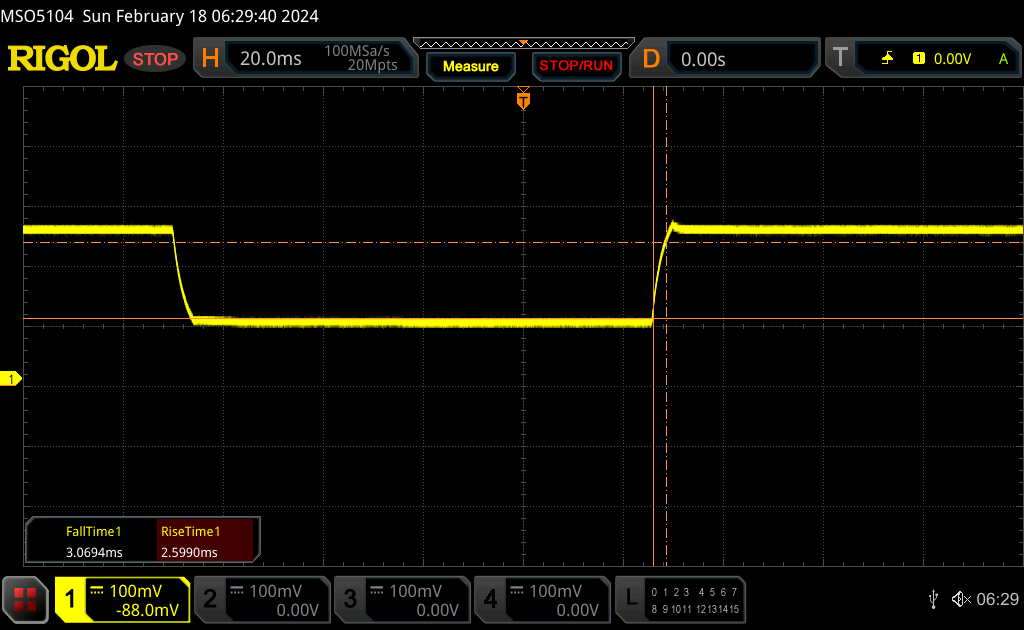 |
| ↘ 3.1 ms fall | ||
| The screen shows very fast response rates in our tests and should be very well suited for fast-paced gaming. In comparison, all tested devices range from 0.165 (minimum) to 636 (maximum) ms. » 18 % of all devices are better. This means that the measured response time is better than the average of all tested devices (31 ms). | ||
Screen Flickering / PWM (Pulse-Width Modulation)
| Screen flickering / PWM not detected | 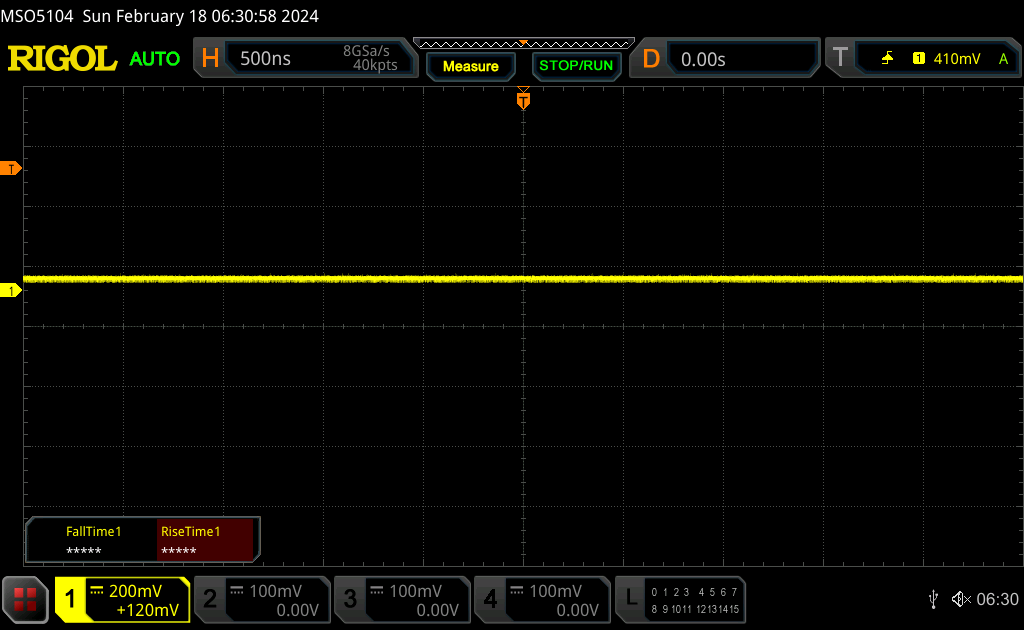 | ||
In comparison: 52 % of all tested devices do not use PWM to dim the display. If PWM was detected, an average of 7757 (minimum: 5 - maximum: 343500) Hz was measured. | |||
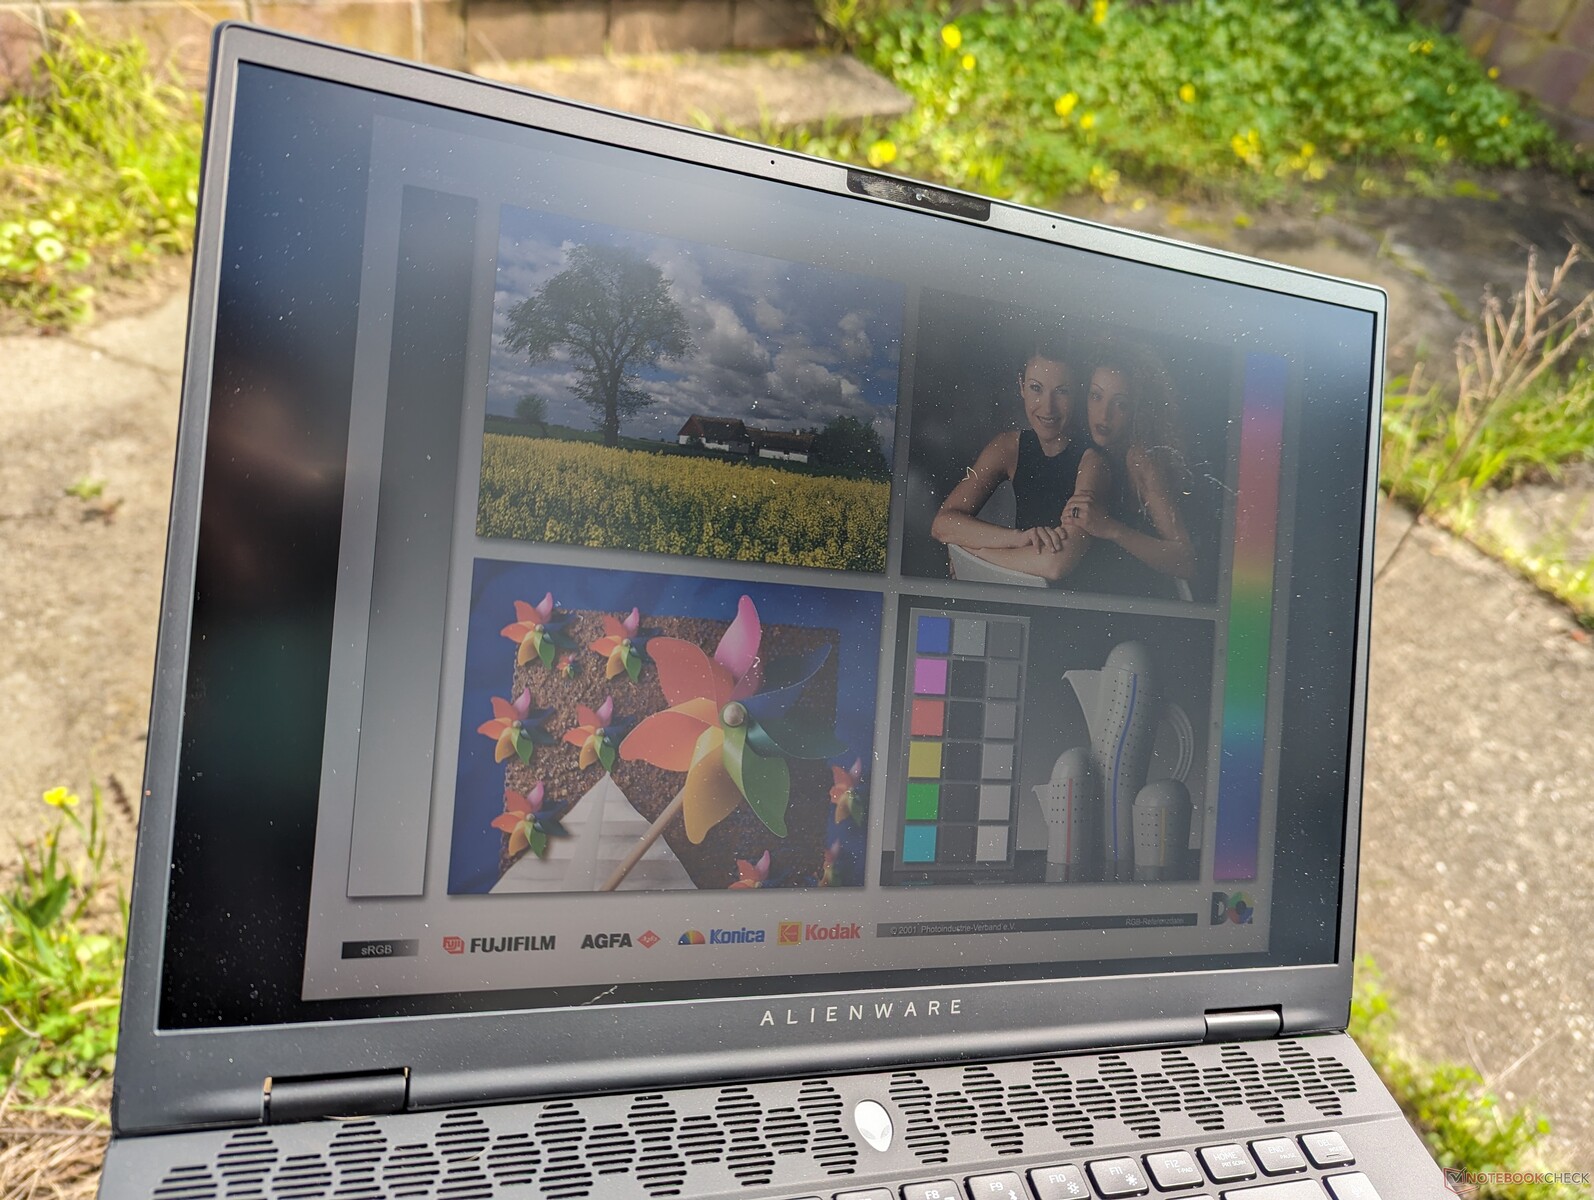
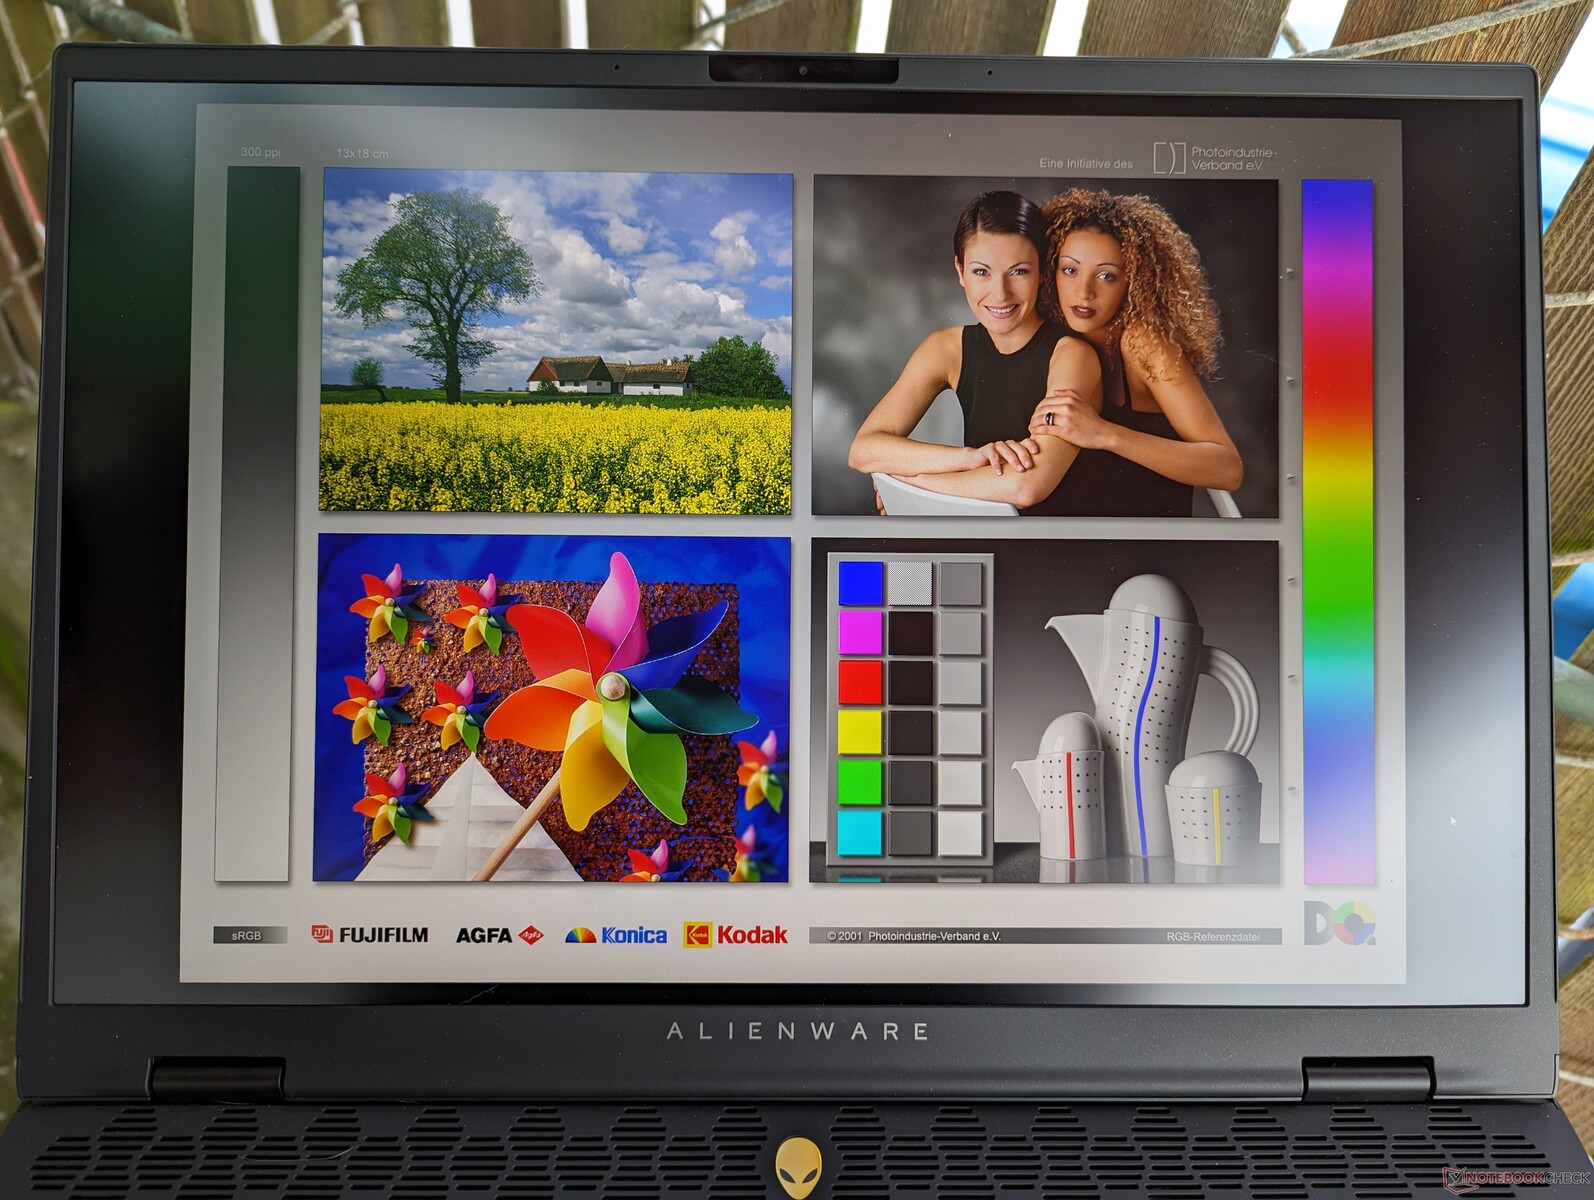
室外能见度与以前差不多,因此建议尽可能呆在阴凉处,以减少眩光并保持色彩。不过,较轻的重量和较小的尺寸确实使系统更容易操作。

性能 - 从猛禽湖-HX 到流星湖-H
测试条件
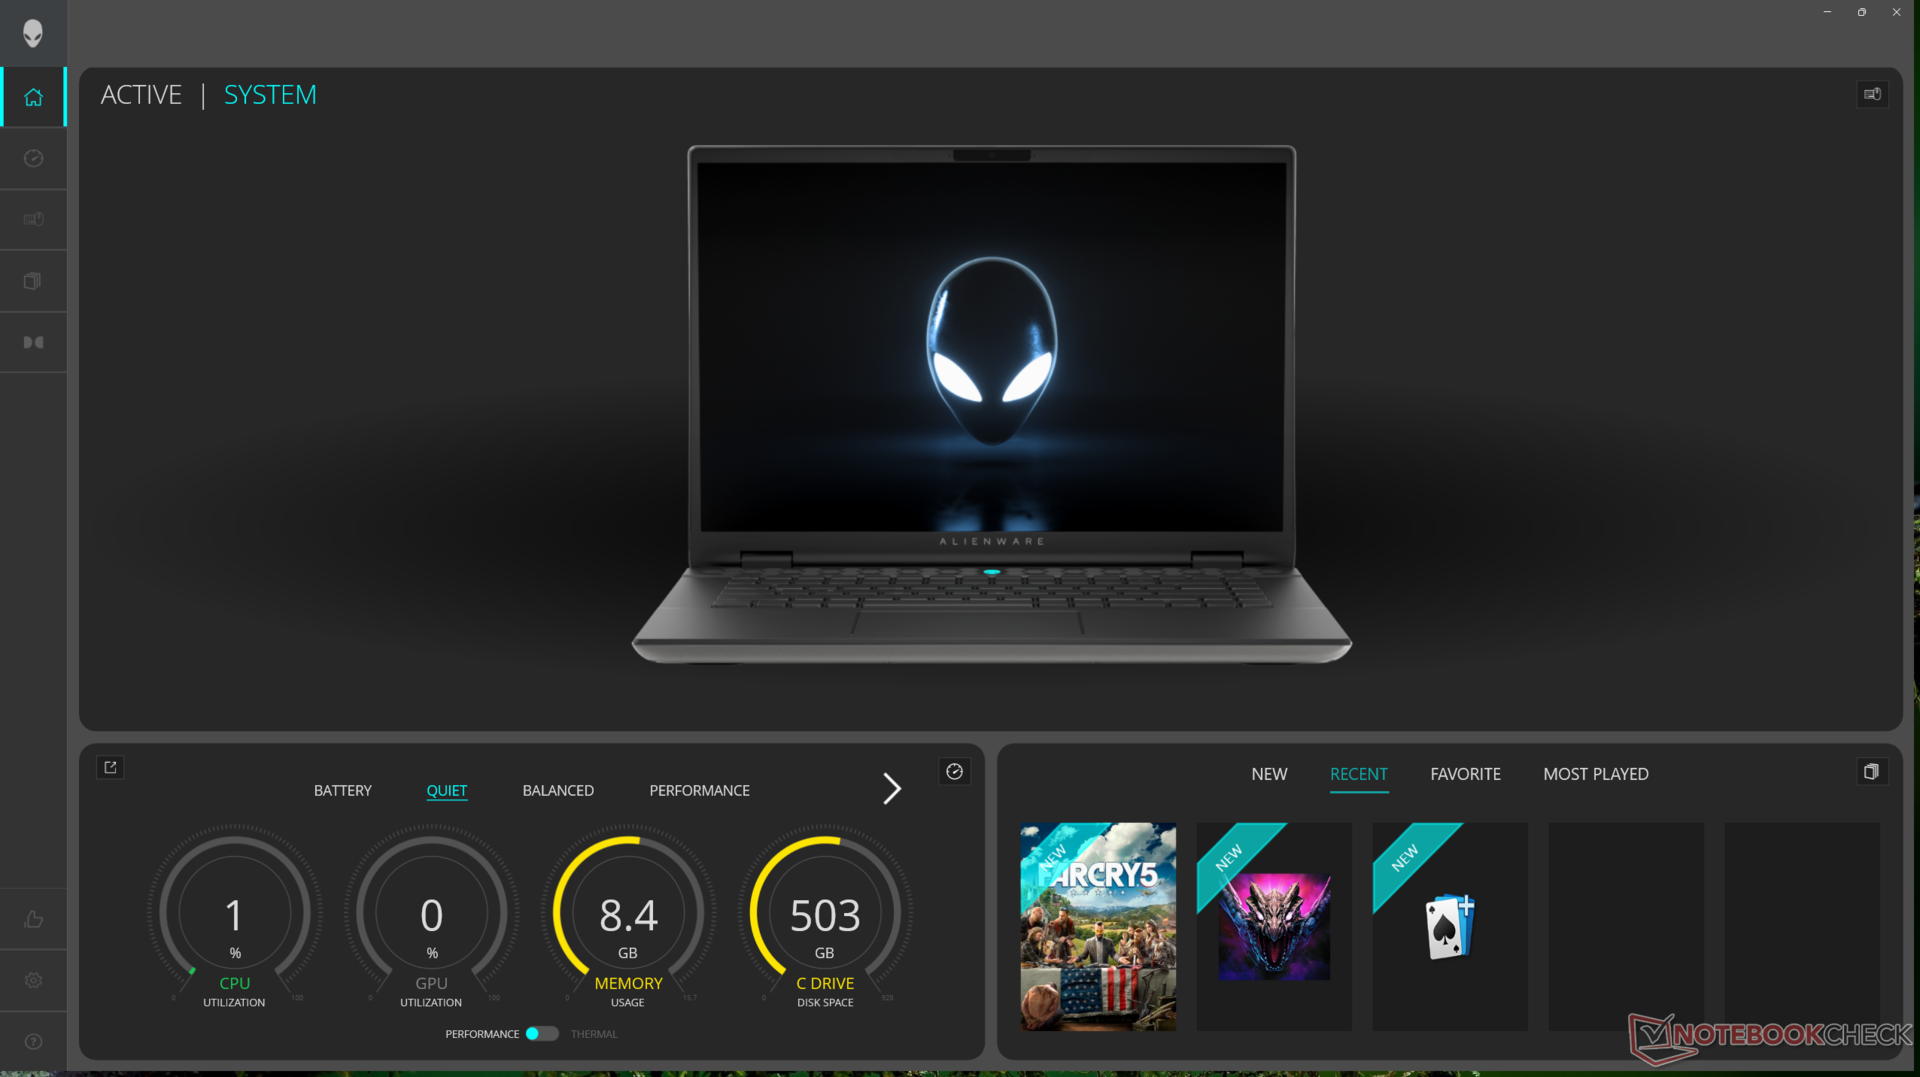
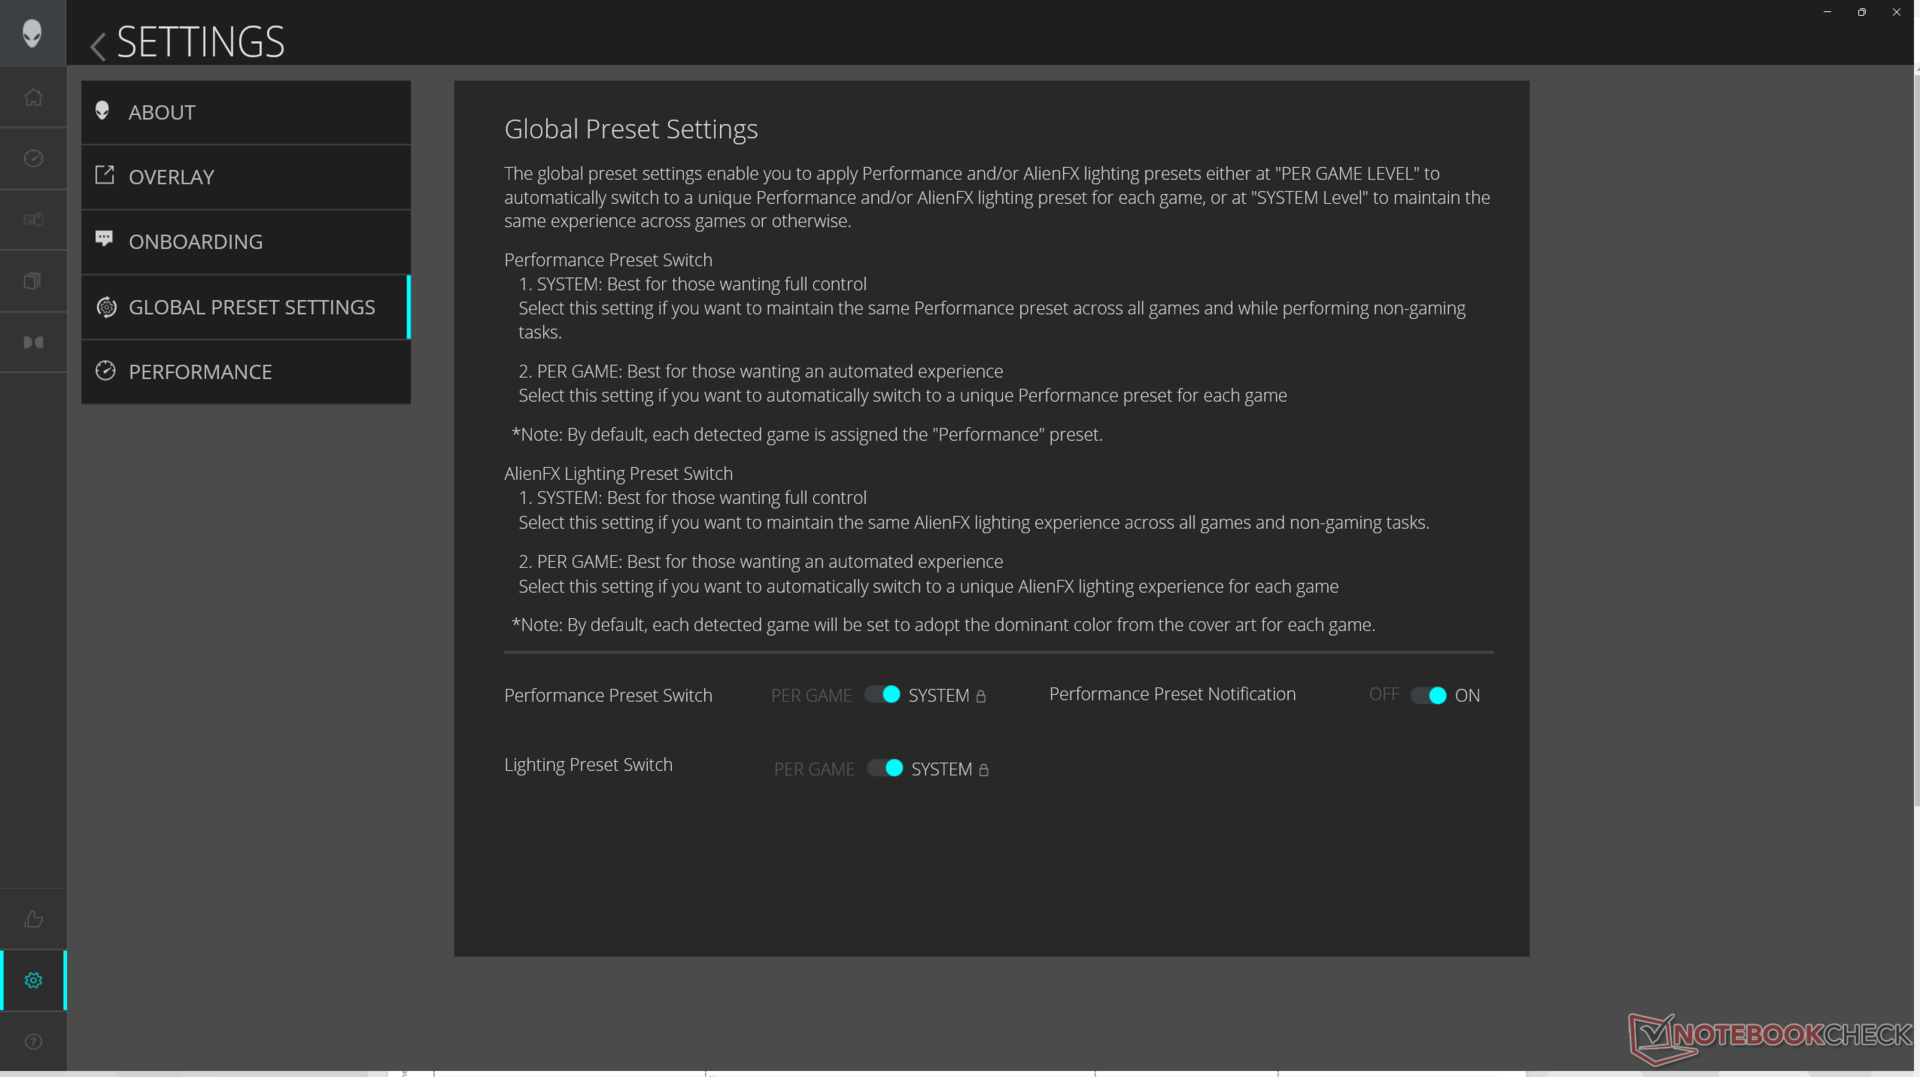
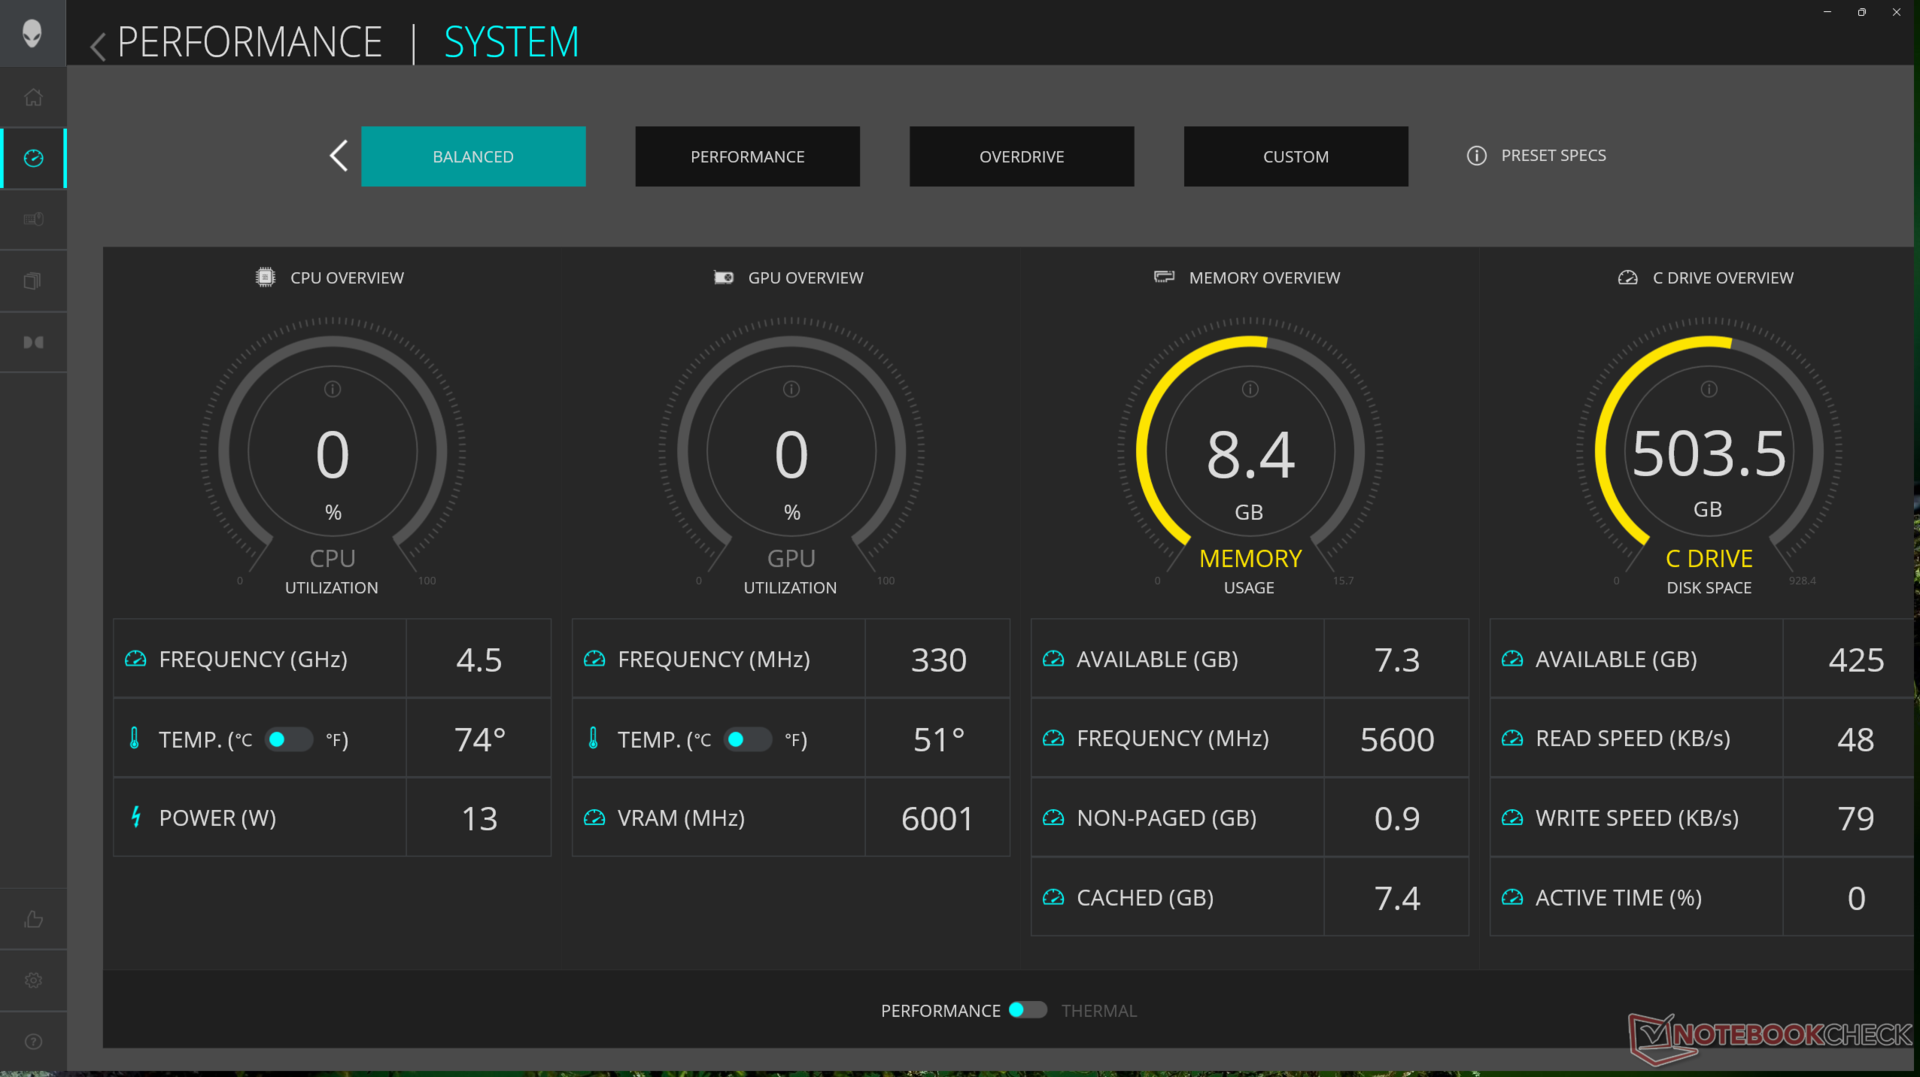
在运行下面的基准测试之前,我们将 Alienware Command Center (ACC) 设置为 Overdrive 模式,将 Nvidia Control Panel 设置为 dGPU 模式。ACC 经过更新后运行更加流畅,没有了我们在 m16 R1 上遇到的许多问题。例如,它现在几乎可以在开机时立即启动,而风扇配置文件模式和 AlienFX RGB 灯光不再在未通知用户的情况下自动更改。
尽管如此,我们还是遇到了一个错误,那就是即使反复检查了 Windows 电源设置,系统有时还是无法在盖上盖子后正确进入睡眠模式。这导致几个小时后笔记本电脑温度很高,电池电量完全耗尽。
高级优化和 G-Sync 均受支持,这意味着用户无需软重启即可在 iGPU 和 dGPU 模式之间切换。请注意,系统必须设置为 dGPU 模式,G-Sync 才能工作。
处理器
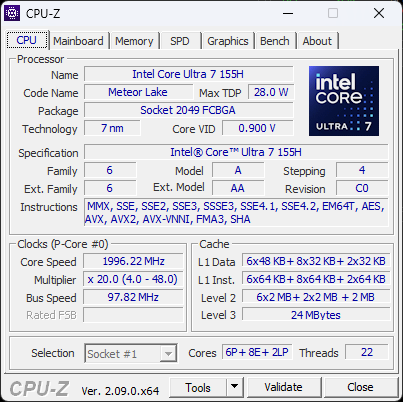
我们的 Core Ultra 7 155H比 酷睿 i7-13700HX慢约 15%。它基本上与最近的 Ryzen 9 8945HS.与其他 Meteor Lake CPU 一样,酷睿至强 7 155H 集成了一个 NPU,用于加速 AI 任务,如 Microsoft Co-Pilot。不过,目前大多数 AI 应用都是基于云的,没有本地运行的选项,因此新 CPU 集成的 AI 功能目前还非常有限。
尽管与酷睿 i7-13700HX 相比性能上有差距,但 m16 R2 运行酷睿至尊 7 155H 的速度明显快于其他配备相同处理器的笔记本电脑。例如,最近的 微星威望 16运行速度几乎要慢 20%。
戴尔表示,它计划在不久的将来推出 Ultra 9 185H SKU,这将有助于缩小与酷睿 i7-13700HX 的性能差距。由于散热限制,戴尔没有提供要求更高的酷睿 i7-14700HX 或酷睿 i9-14900HX;戴尔优先考虑最大限度地提高 GPU TGP,而不是 CPU TDP。
Cinebench R15 Multi Loop
Cinebench R23: Multi Core | Single Core
Cinebench R20: CPU (Multi Core) | CPU (Single Core)
Cinebench R15: CPU Multi 64Bit | CPU Single 64Bit
Blender: v2.79 BMW27 CPU
7-Zip 18.03: 7z b 4 | 7z b 4 -mmt1
Geekbench 6.7: Multi-Core | Single-Core
Geekbench 5.5: Multi-Core | Single-Core
HWBOT x265 Benchmark v2.2: 4k Preset
LibreOffice : 20 Documents To PDF
R Benchmark 2.5: Overall mean
| Geekbench 6.7 / Multi-Core | |
| Lenovo Legion 9 16IRX8 | |
| HP Omen Transcend 16-u1095ng | |
| Alienware m16 R1 Intel | |
| Razer Blade 14 RZ09-0508 | |
| Asus ROG Zephyrus G16 2024 GU605M | |
| Framework Laptop 16 | |
| Lenovo Legion Slim 7 16APH8 | |
| Alienware m16 R2 | |
| Alienware m16 R1 AMD | |
| Average Intel Core Ultra 7 155H (7732 - 13656, n=55) | |
| Geekbench 6.7 / Single-Core | |
| Lenovo Legion 9 16IRX8 | |
| HP Omen Transcend 16-u1095ng | |
| Alienware m16 R1 AMD | |
| Razer Blade 14 RZ09-0508 | |
| Alienware m16 R1 Intel | |
| Framework Laptop 16 | |
| Lenovo Legion Slim 7 16APH8 | |
| Asus ROG Zephyrus G16 2024 GU605M | |
| Alienware m16 R2 | |
| Average Intel Core Ultra 7 155H (1901 - 2473, n=52) | |
Cinebench R23: Multi Core | Single Core
Cinebench R20: CPU (Multi Core) | CPU (Single Core)
Cinebench R15: CPU Multi 64Bit | CPU Single 64Bit
Blender: v2.79 BMW27 CPU
7-Zip 18.03: 7z b 4 | 7z b 4 -mmt1
Geekbench 6.7: Multi-Core | Single-Core
Geekbench 5.5: Multi-Core | Single-Core
HWBOT x265 Benchmark v2.2: 4k Preset
LibreOffice : 20 Documents To PDF
R Benchmark 2.5: Overall mean
* ... smaller is better
AIDA64: FP32 Ray-Trace | FPU Julia | CPU SHA3 | CPU Queen | FPU SinJulia | FPU Mandel | CPU AES | CPU ZLib | FP64 Ray-Trace | CPU PhotoWorxx
| Performance rating | |
| Lenovo Legion Slim 7 16APH8 | |
| Alienware m16 R1 Intel | |
| Alienware x16 R1 | |
| HP Omen Transcend 16-u1095ng | |
| Alienware m16 R2 | |
| Asus ROG Zephyrus G16 2024 GU605M | |
| Average Intel Core Ultra 7 155H | |
| AIDA64 / FP32 Ray-Trace | |
| Lenovo Legion Slim 7 16APH8 | |
| Alienware m16 R1 Intel | |
| Alienware m16 R2 | |
| Alienware x16 R1 | |
| HP Omen Transcend 16-u1095ng | |
| Asus ROG Zephyrus G16 2024 GU605M | |
| Average Intel Core Ultra 7 155H (6670 - 18470, n=50) | |
| AIDA64 / FPU Julia | |
| Lenovo Legion Slim 7 16APH8 | |
| Alienware m16 R1 Intel | |
| Alienware m16 R2 | |
| Alienware x16 R1 | |
| HP Omen Transcend 16-u1095ng | |
| Asus ROG Zephyrus G16 2024 GU605M | |
| Average Intel Core Ultra 7 155H (40905 - 93181, n=50) | |
| AIDA64 / CPU SHA3 | |
| Alienware m16 R1 Intel | |
| Lenovo Legion Slim 7 16APH8 | |
| HP Omen Transcend 16-u1095ng | |
| Alienware m16 R2 | |
| Alienware x16 R1 | |
| Asus ROG Zephyrus G16 2024 GU605M | |
| Average Intel Core Ultra 7 155H (1940 - 4436, n=50) | |
| AIDA64 / CPU Queen | |
| HP Omen Transcend 16-u1095ng | |
| Alienware x16 R1 | |
| Lenovo Legion Slim 7 16APH8 | |
| Alienware m16 R1 Intel | |
| Asus ROG Zephyrus G16 2024 GU605M | |
| Alienware m16 R2 | |
| Average Intel Core Ultra 7 155H (64698 - 94181, n=50) | |
| AIDA64 / FPU SinJulia | |
| Lenovo Legion Slim 7 16APH8 | |
| Alienware m16 R1 Intel | |
| HP Omen Transcend 16-u1095ng | |
| Alienware x16 R1 | |
| Asus ROG Zephyrus G16 2024 GU605M | |
| Alienware m16 R2 | |
| Average Intel Core Ultra 7 155H (5639 - 10647, n=50) | |
| AIDA64 / FPU Mandel | |
| Lenovo Legion Slim 7 16APH8 | |
| Alienware m16 R1 Intel | |
| Alienware m16 R2 | |
| Alienware x16 R1 | |
| HP Omen Transcend 16-u1095ng | |
| Asus ROG Zephyrus G16 2024 GU605M | |
| Average Intel Core Ultra 7 155H (18236 - 47685, n=50) | |
| AIDA64 / CPU AES | |
| Alienware m16 R1 Intel | |
| HP Omen Transcend 16-u1095ng | |
| Alienware m16 R2 | |
| Alienware x16 R1 | |
| Asus ROG Zephyrus G16 2024 GU605M | |
| Average Intel Core Ultra 7 155H (45713 - 152179, n=50) | |
| Lenovo Legion Slim 7 16APH8 | |
| AIDA64 / CPU ZLib | |
| Alienware m16 R1 Intel | |
| HP Omen Transcend 16-u1095ng | |
| Alienware x16 R1 | |
| Alienware m16 R2 | |
| Asus ROG Zephyrus G16 2024 GU605M | |
| Lenovo Legion Slim 7 16APH8 | |
| Average Intel Core Ultra 7 155H (557 - 1250, n=50) | |
| AIDA64 / FP64 Ray-Trace | |
| Lenovo Legion Slim 7 16APH8 | |
| Alienware m16 R1 Intel | |
| Alienware x16 R1 | |
| Alienware m16 R2 | |
| HP Omen Transcend 16-u1095ng | |
| Asus ROG Zephyrus G16 2024 GU605M | |
| Average Intel Core Ultra 7 155H (3569 - 9802, n=50) | |
| AIDA64 / CPU PhotoWorxx | |
| Alienware x16 R1 | |
| HP Omen Transcend 16-u1095ng | |
| Asus ROG Zephyrus G16 2024 GU605M | |
| Average Intel Core Ultra 7 155H (32719 - 54223, n=50) | |
| Lenovo Legion Slim 7 16APH8 | |
| Alienware m16 R2 | |
| Alienware m16 R1 Intel | |
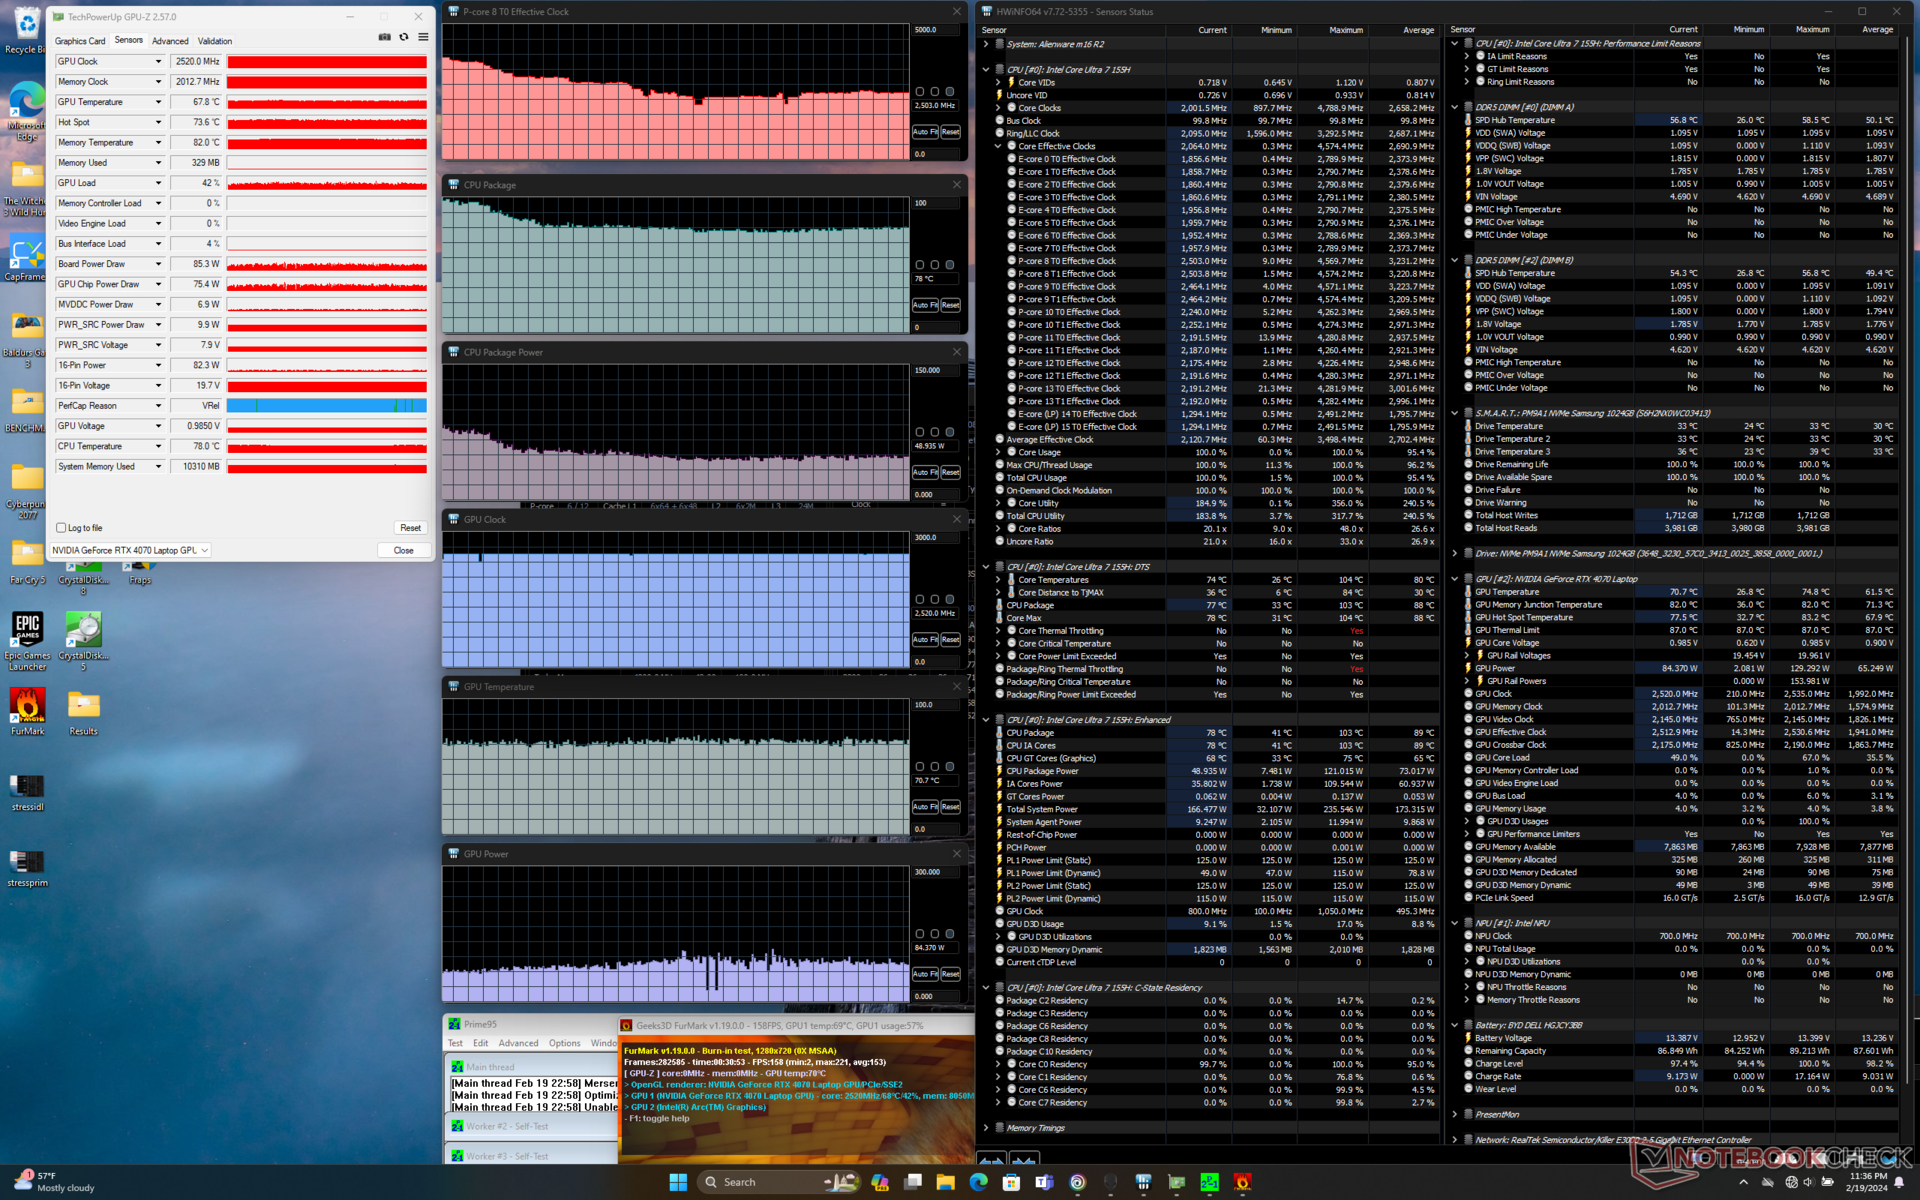
压力测试
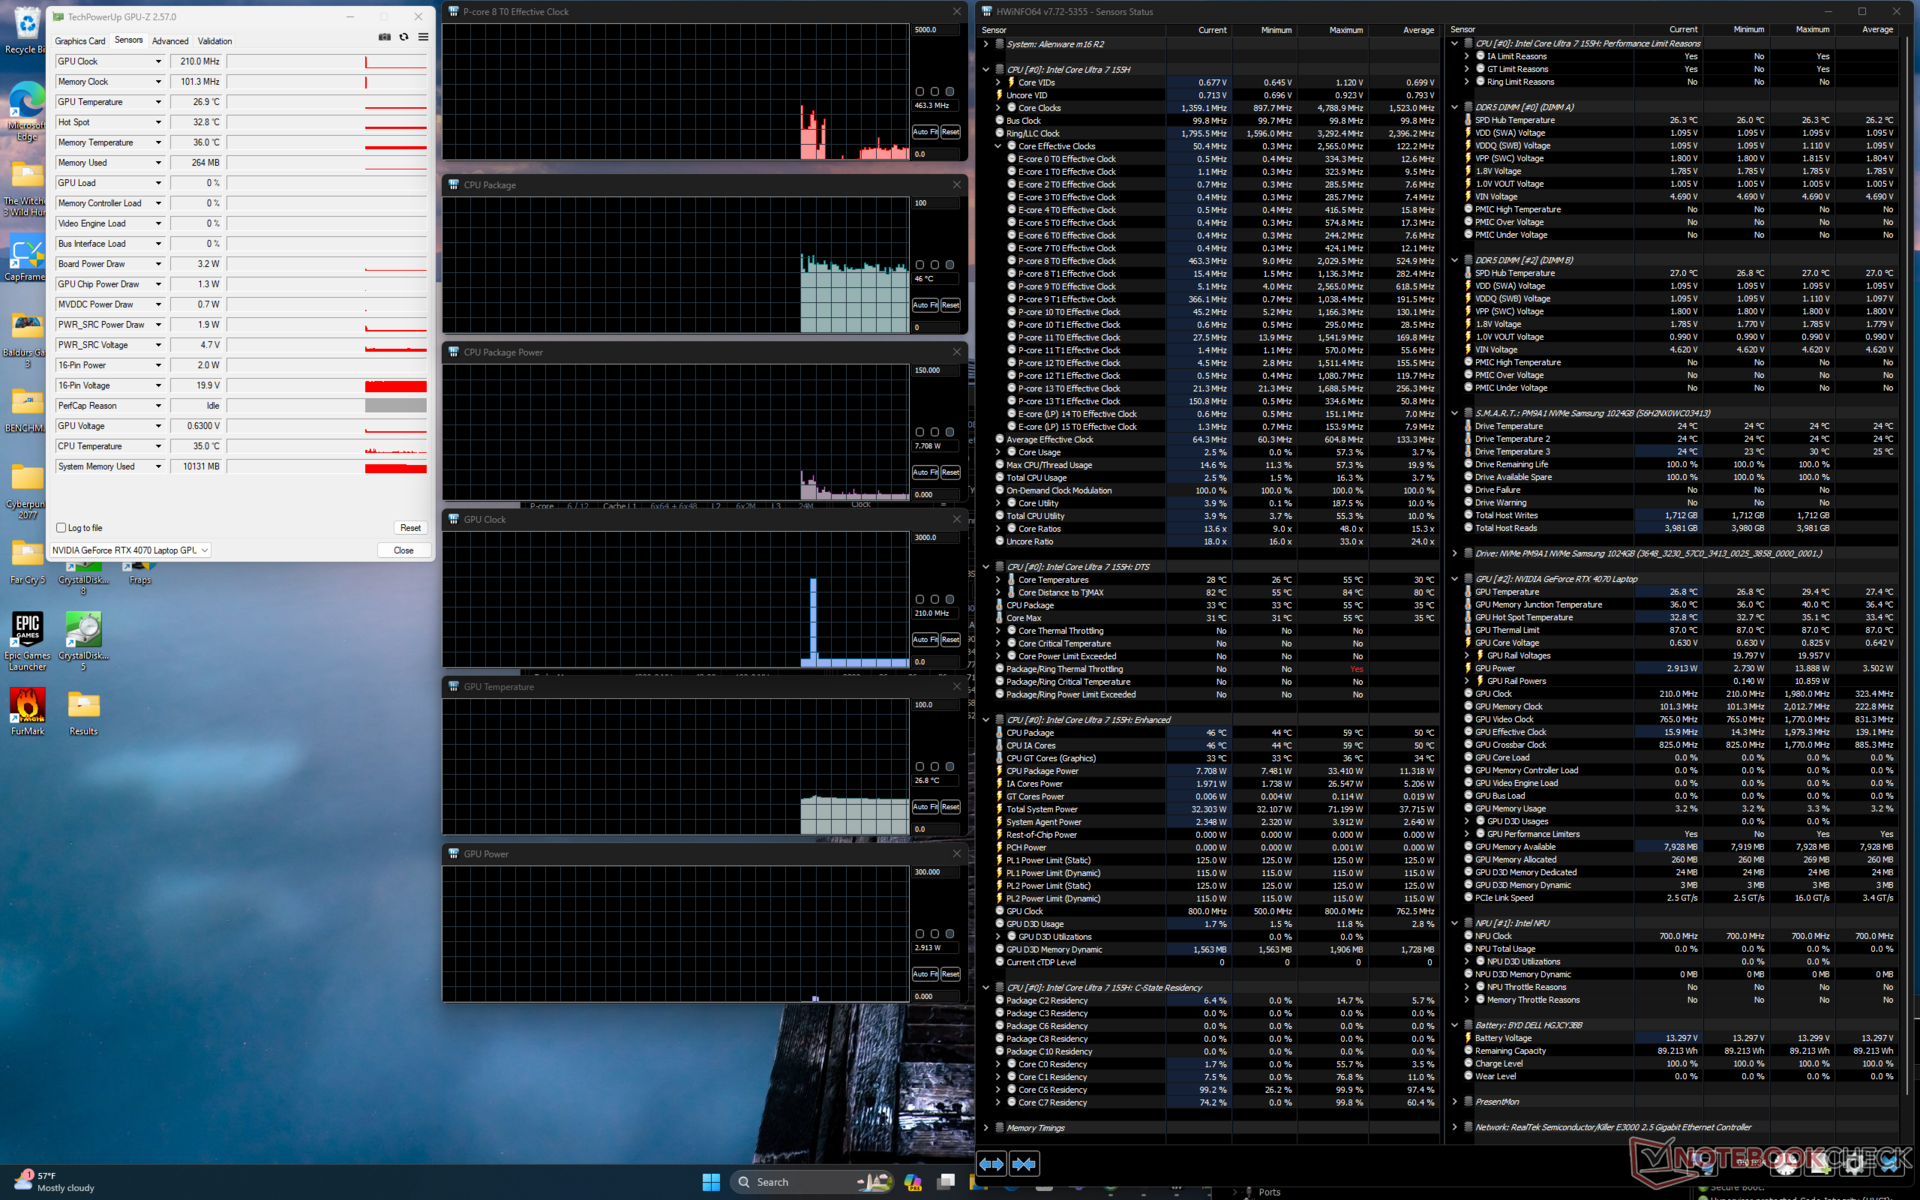
在超频模式下运行 Prime95 时,CPU 会在几秒钟内提升到 4.6 GHz 和 115 W,然后稳步下降,最终稳定在 3.4 GHz 和 102 W。不过,核心温度极高,达到 100 C,表明 CPU 已将散热解决方案推向极限。
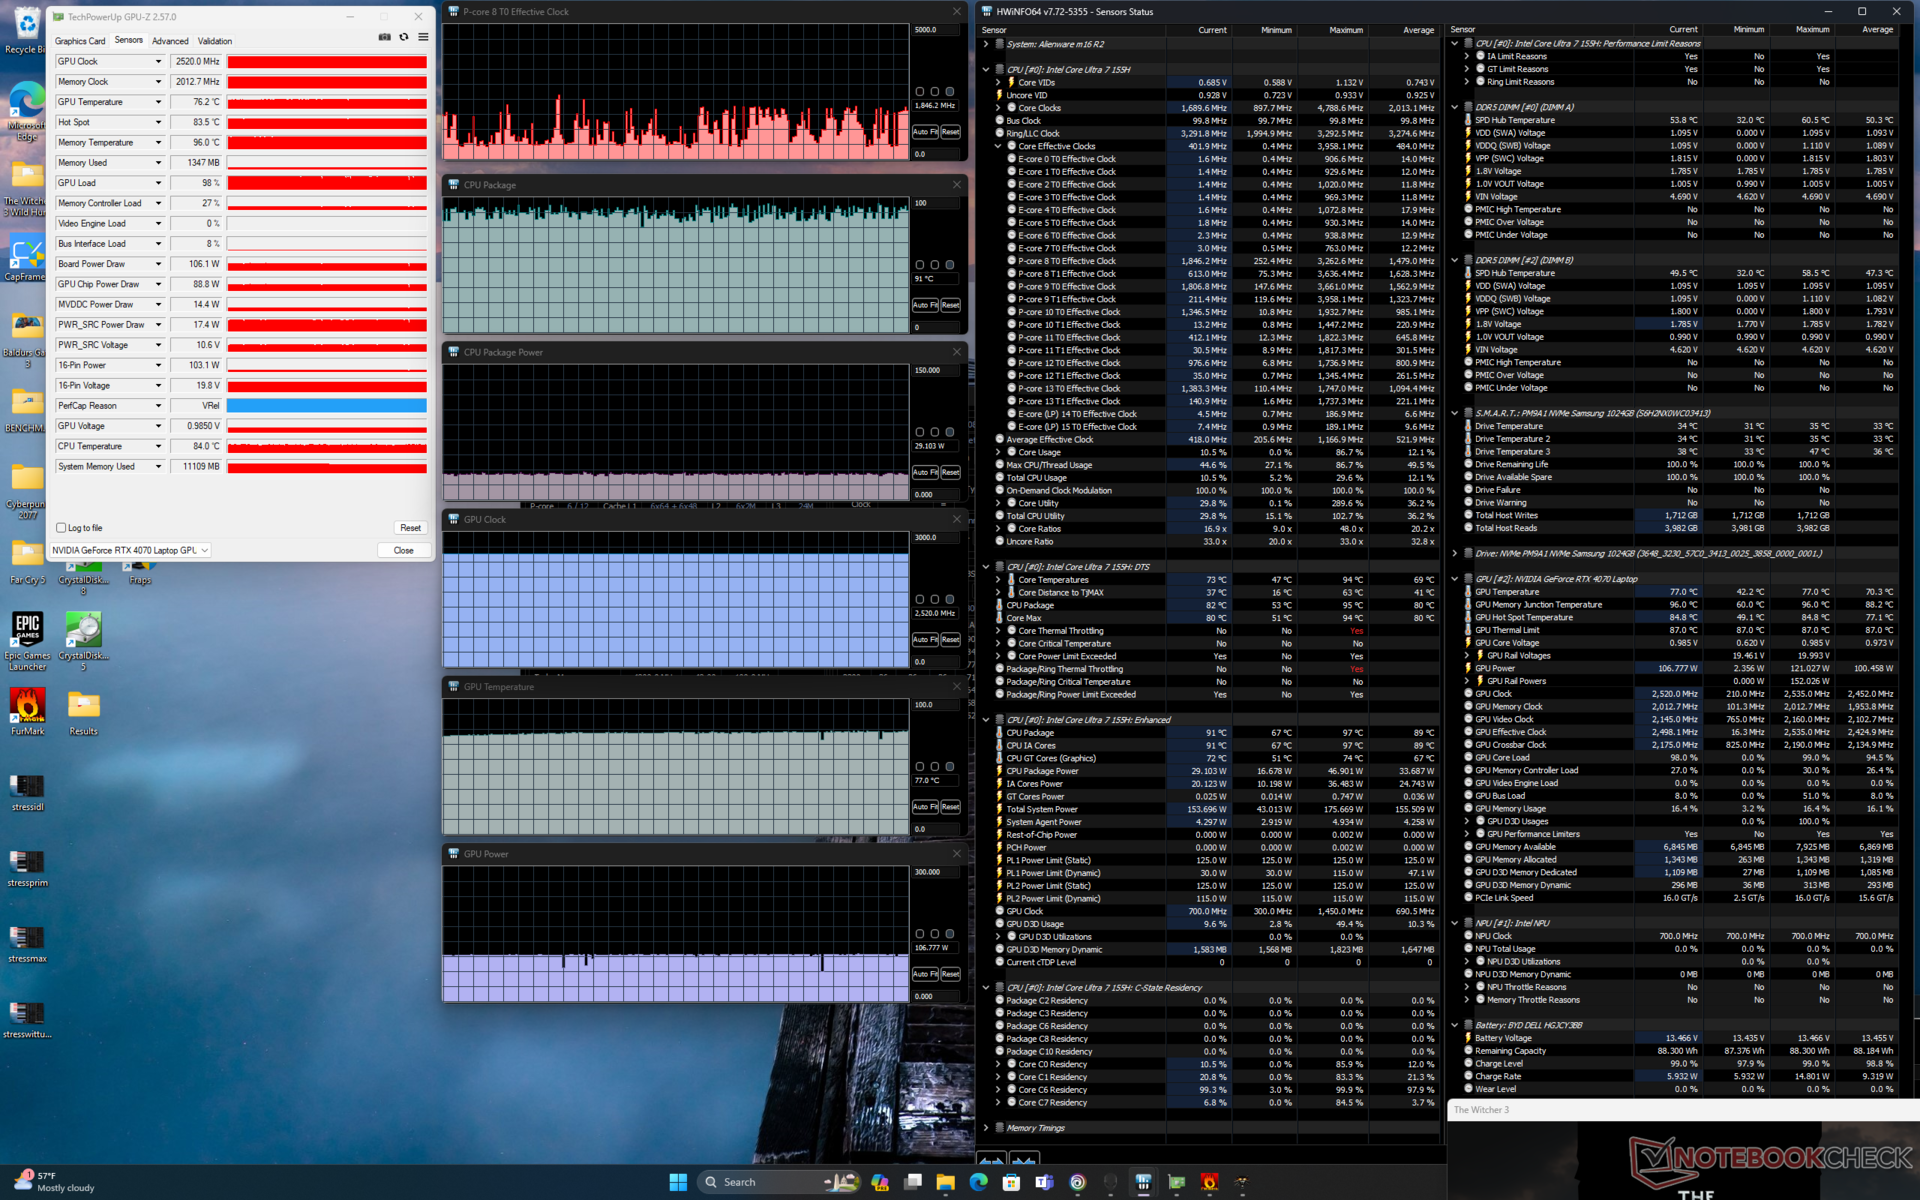
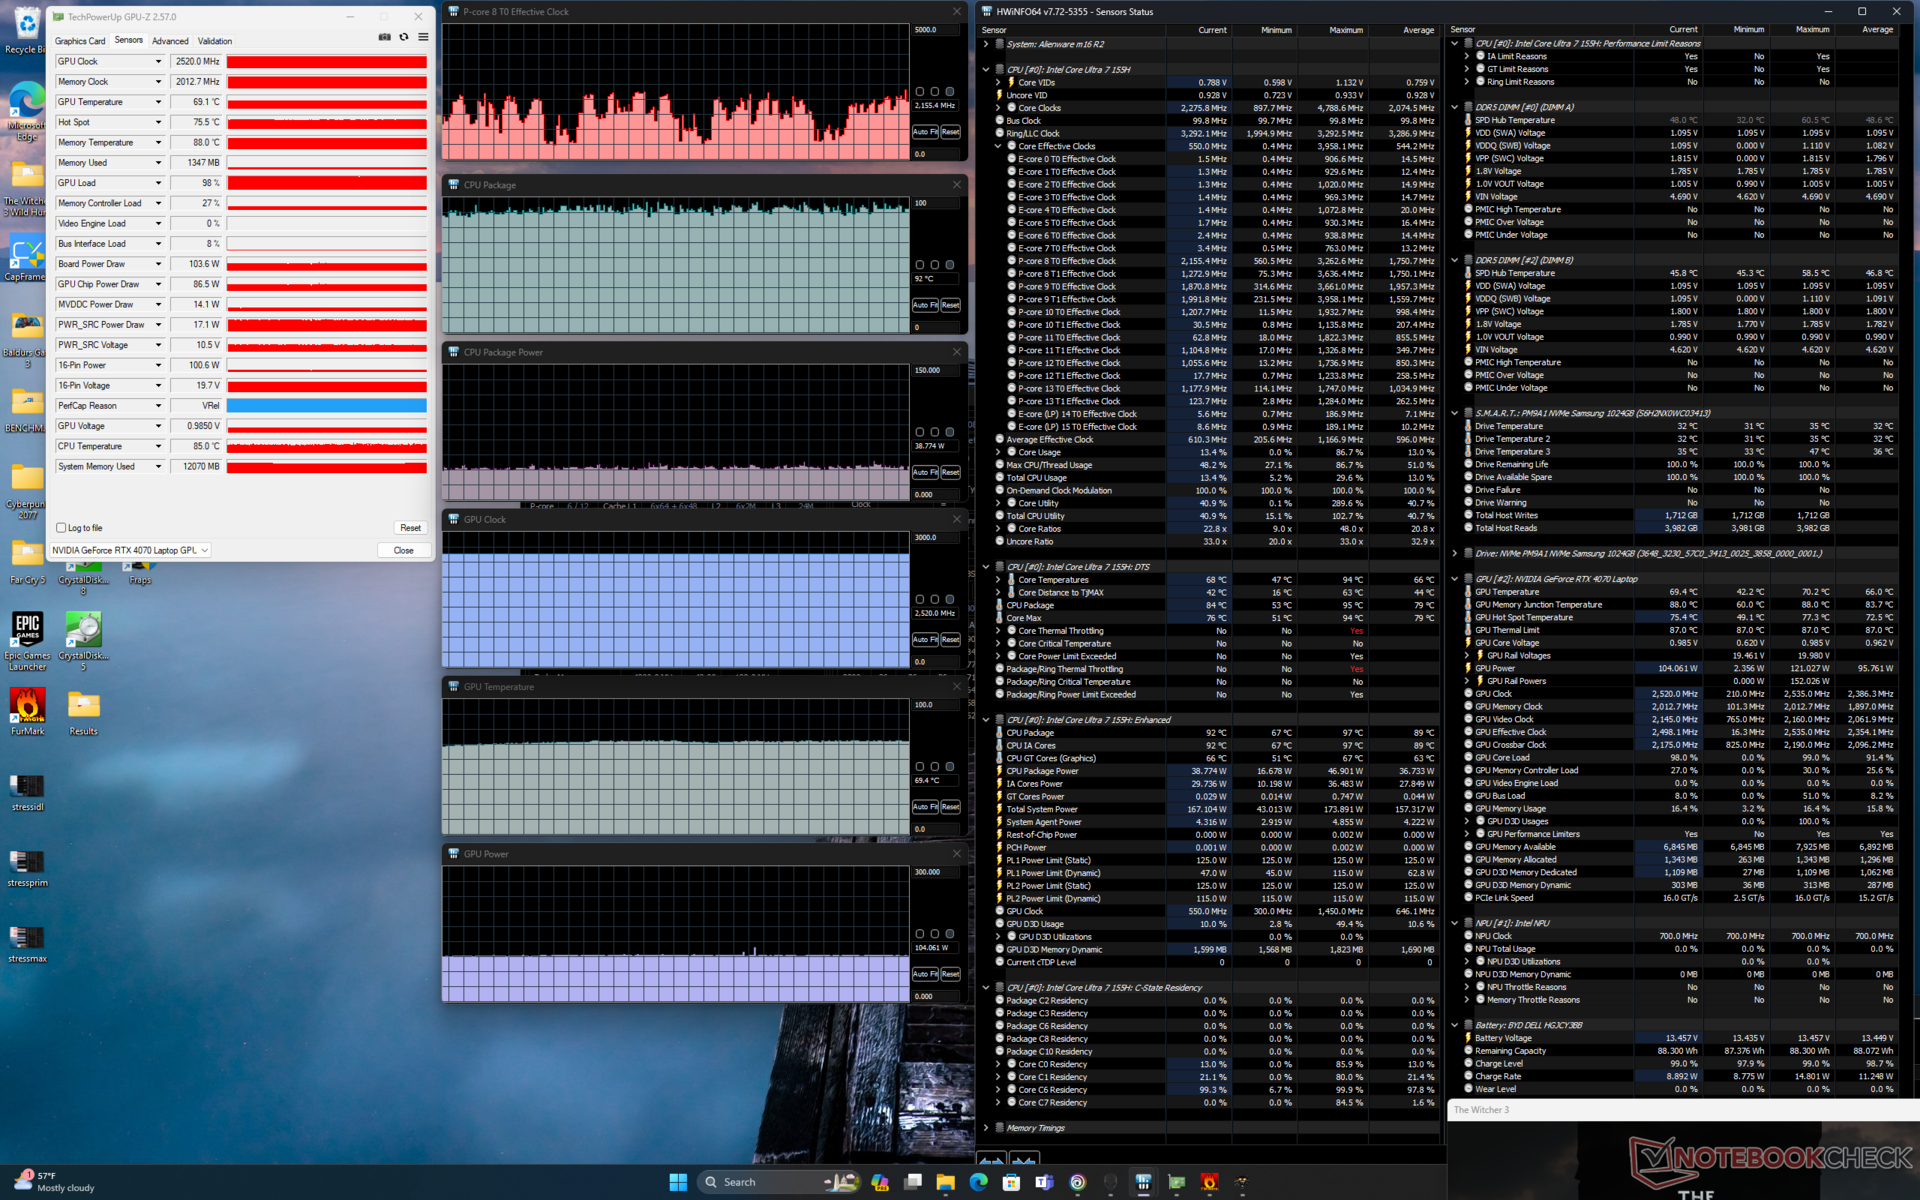
有趣的是,在平衡、性能或超频模式下运行时,GPU 时钟率或主板功耗几乎没有变化。 Witcher 3这与我们在 GPU 性能部分的发现相关。相反,在 "性能 "或 "超频 "模式下,GPU 温度往往会降低,这是因为这些模式下风扇的上限声音较大。换句话说,时钟频率和实时 TGP 保持不变,而风扇噪音会发生变化。在不同模式下,CPU 性能可能会有一些微小的变化,但无论如何,大多数游戏都不会占用 CPU。
值得注意的是,虽然 Nvidia 控制面板显示 GPU 的额定 TGP 为 140 W,但在游戏时它往往会稳定在 106 W。我们能够达到 121 W 的临时最大值。
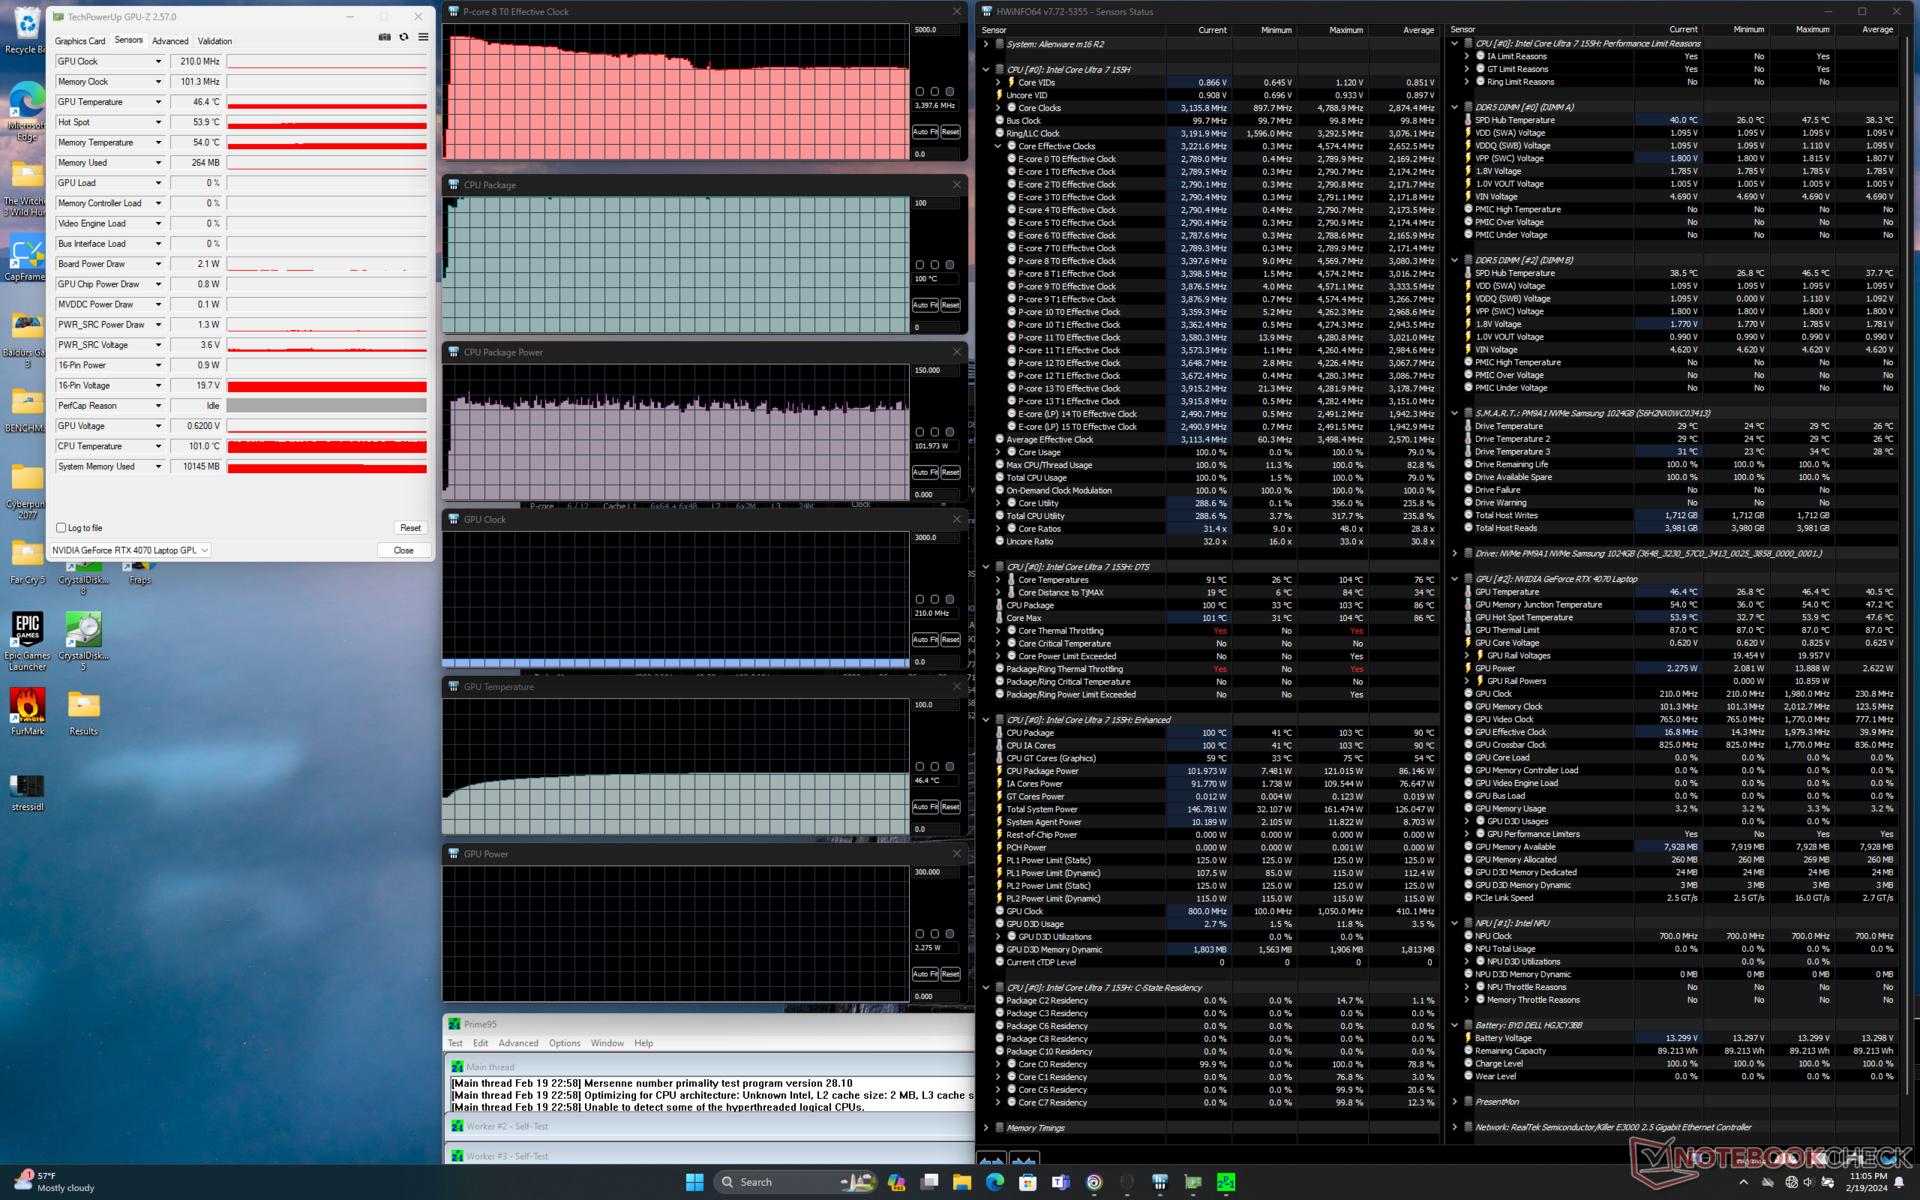

| CPU 时钟 (GHz) | GPU 时钟 (MHz) | CPU 平均温度 (°C) | GPU 平均温度(°C) | |
| 系统闲置 | -- | -- | 46 | 27 |
| Prime95 压力 | 3.4 | -- | 100 | 47 |
| Prime95 + FurMark 压力 | 2.5 | 2520 | 78 | 71 |
| Witcher 3 压力(平衡模式) | ~1.8 | 2502 | 93 | 80 |
| Witcher 3 压力(性能模式) | ~1.8 | 2520 | 91 | 77 |
| Witcher 3 压力(超速模式) | ~2.0 | 2520 | 92 | 69 |
系统性能
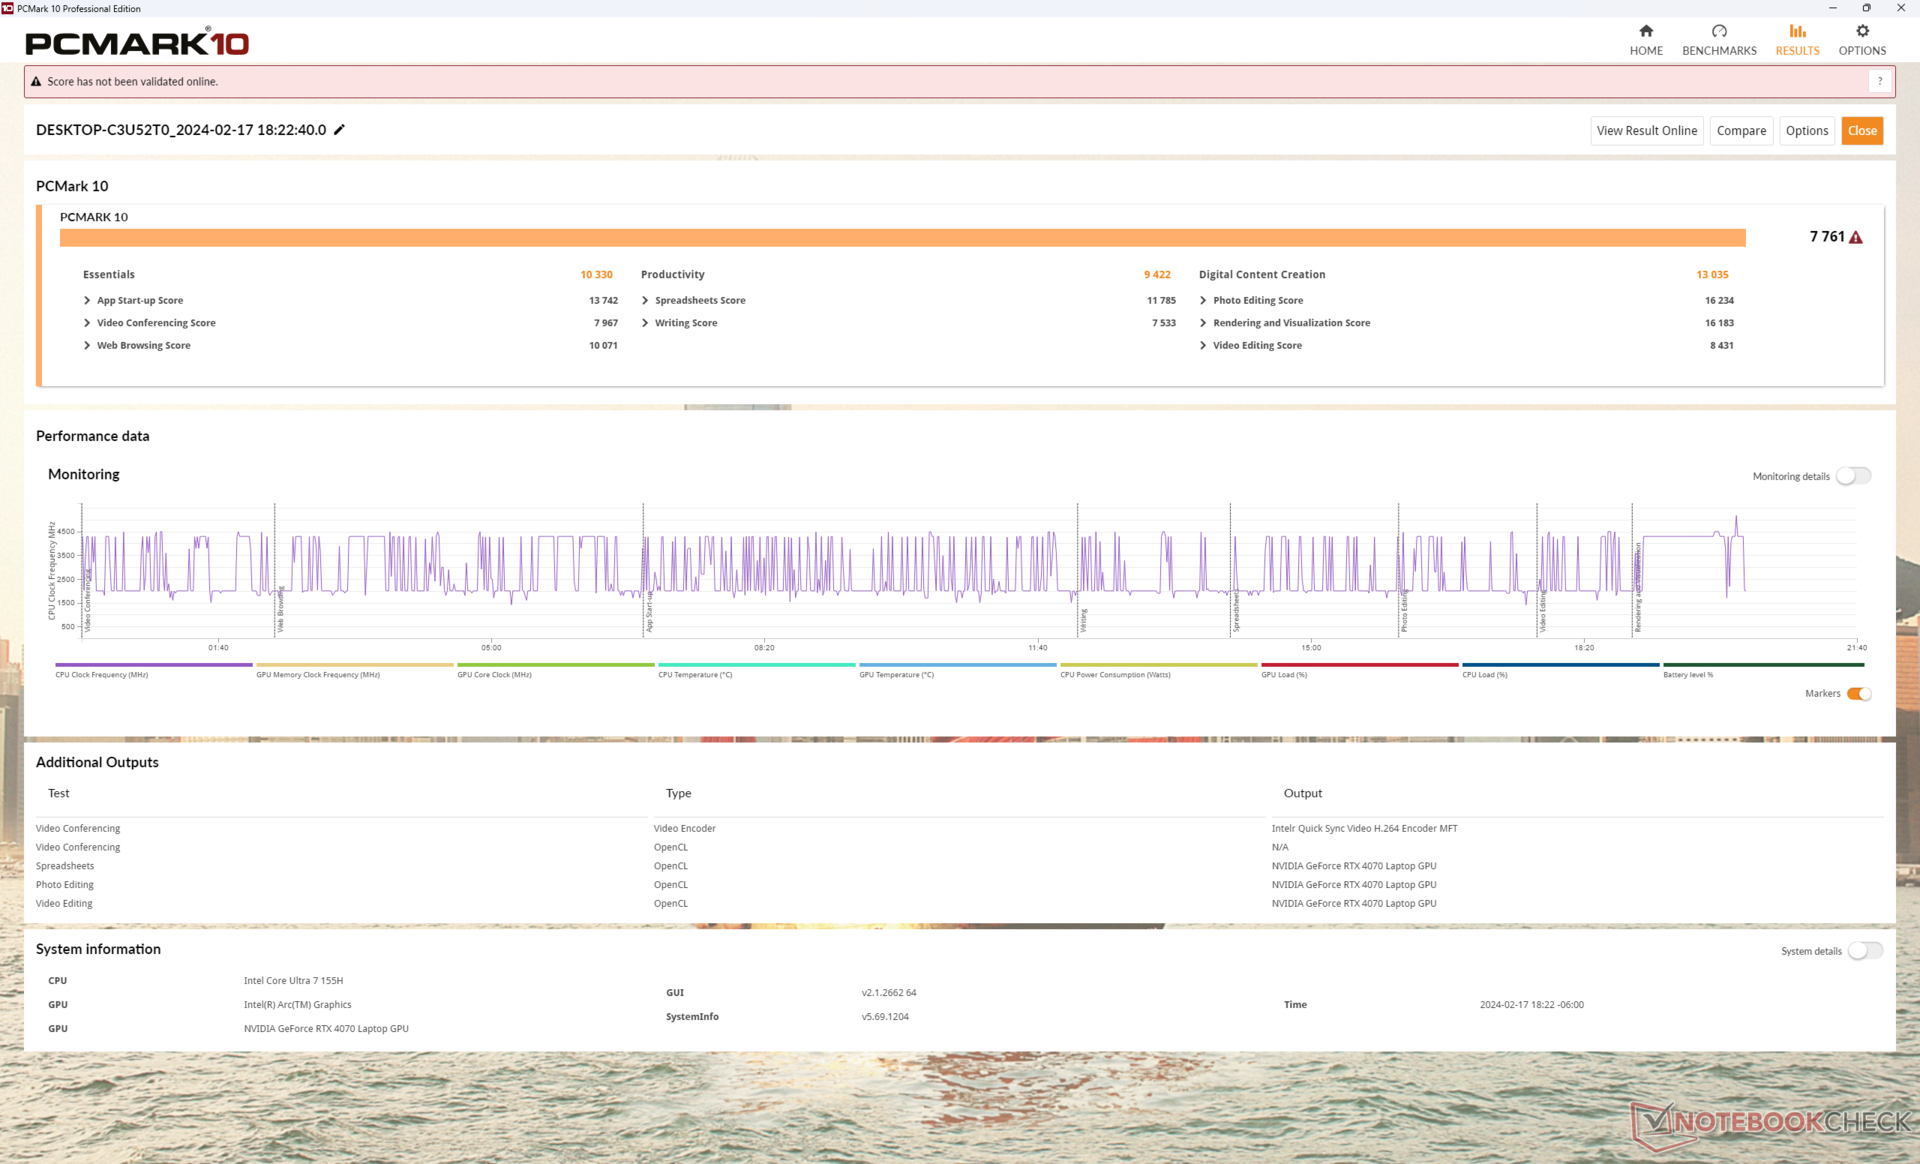
由于 m16 R2 配备了速度较慢的 RTX 4070,因此除了数字内容创建子测试得分较低外,PCMark 10 结果与 m16 R1 相当。在其他方面,系统性能与 m16 R2 非常相似,尽管采用了更新一代的 CPU,但在大多数日常负载中并无明显提升。
CrossMark: Overall | Productivity | Creativity | Responsiveness
WebXPRT 3: Overall
WebXPRT 4: Overall
Mozilla Kraken 1.1: Total
| PCMark 10 / Score | |
| Alienware x16 R1 | |
| HP Omen Transcend 16-u1095ng | |
| Alienware m16 R2 | |
| Lenovo Legion Slim 7 16APH8 | |
| Average Intel Core Ultra 7 155H, NVIDIA GeForce RTX 4070 Laptop GPU (7084 - 7761, n=4) | |
| Alienware m16 R1 Intel | |
| Asus ROG Zephyrus G16 2024 GU605M | |
| PCMark 10 / Essentials | |
| Alienware x16 R1 | |
| Alienware m16 R1 Intel | |
| HP Omen Transcend 16-u1095ng | |
| Lenovo Legion Slim 7 16APH8 | |
| Alienware m16 R2 | |
| Average Intel Core Ultra 7 155H, NVIDIA GeForce RTX 4070 Laptop GPU (10038 - 10393, n=4) | |
| Asus ROG Zephyrus G16 2024 GU605M | |
| PCMark 10 / Productivity | |
| HP Omen Transcend 16-u1095ng | |
| Alienware x16 R1 | |
| Lenovo Legion Slim 7 16APH8 | |
| Alienware m16 R1 Intel | |
| Alienware m16 R2 | |
| Average Intel Core Ultra 7 155H, NVIDIA GeForce RTX 4070 Laptop GPU (9192 - 9518, n=4) | |
| Asus ROG Zephyrus G16 2024 GU605M | |
| PCMark 10 / Digital Content Creation | |
| Alienware x16 R1 | |
| Alienware m16 R2 | |
| HP Omen Transcend 16-u1095ng | |
| Average Intel Core Ultra 7 155H, NVIDIA GeForce RTX 4070 Laptop GPU (10100 - 13035, n=4) | |
| Lenovo Legion Slim 7 16APH8 | |
| Asus ROG Zephyrus G16 2024 GU605M | |
| Alienware m16 R1 Intel | |
| CrossMark / Overall | |
| Alienware m16 R1 Intel | |
| Alienware x16 R1 | |
| Alienware m16 R2 | |
| Average Intel Core Ultra 7 155H, NVIDIA GeForce RTX 4070 Laptop GPU (1687 - 1848, n=4) | |
| Asus ROG Zephyrus G16 2024 GU605M | |
| CrossMark / Productivity | |
| Alienware m16 R1 Intel | |
| Alienware x16 R1 | |
| Alienware m16 R2 | |
| Average Intel Core Ultra 7 155H, NVIDIA GeForce RTX 4070 Laptop GPU (1589 - 1750, n=4) | |
| Asus ROG Zephyrus G16 2024 GU605M | |
| CrossMark / Creativity | |
| Alienware m16 R1 Intel | |
| Alienware x16 R1 | |
| Asus ROG Zephyrus G16 2024 GU605M | |
| Average Intel Core Ultra 7 155H, NVIDIA GeForce RTX 4070 Laptop GPU (1860 - 2014, n=4) | |
| Alienware m16 R2 | |
| CrossMark / Responsiveness | |
| Alienware x16 R1 | |
| Alienware m16 R1 Intel | |
| Alienware m16 R2 | |
| Average Intel Core Ultra 7 155H, NVIDIA GeForce RTX 4070 Laptop GPU (1424 - 1683, n=4) | |
| Asus ROG Zephyrus G16 2024 GU605M | |
| WebXPRT 3 / Overall | |
| HP Omen Transcend 16-u1095ng | |
| Alienware m16 R1 Intel | |
| Alienware x16 R1 | |
| Alienware m16 R2 | |
| Asus ROG Zephyrus G16 2024 GU605M | |
| Average Intel Core Ultra 7 155H, NVIDIA GeForce RTX 4070 Laptop GPU (264 - 294, n=4) | |
| WebXPRT 4 / Overall | |
| Alienware m16 R1 Intel | |
| Alienware x16 R1 | |
| Alienware m16 R2 | |
| Asus ROG Zephyrus G16 2024 GU605M | |
| Average Intel Core Ultra 7 155H, NVIDIA GeForce RTX 4070 Laptop GPU (247 - 257, n=4) | |
| Mozilla Kraken 1.1 / Total | |
| Average Intel Core Ultra 7 155H, NVIDIA GeForce RTX 4070 Laptop GPU (546 - 568, n=3) | |
| Asus ROG Zephyrus G16 2024 GU605M | |
| Alienware m16 R2 | |
| Alienware m16 R1 Intel | |
| Alienware x16 R1 | |
| HP Omen Transcend 16-u1095ng | |
* ... smaller is better
| PCMark 10 Score | 7761 points | |
Help | ||
| AIDA64 / Memory Copy | |
| Asus ROG Zephyrus G16 2024 GU605M | |
| Average Intel Core Ultra 7 155H (62397 - 96791, n=50) | |
| HP Omen Transcend 16-u1095ng | |
| Alienware x16 R1 | |
| Lenovo Legion Slim 7 16APH8 | |
| Alienware m16 R2 | |
| Alienware m16 R1 Intel | |
| AIDA64 / Memory Read | |
| Asus ROG Zephyrus G16 2024 GU605M | |
| HP Omen Transcend 16-u1095ng | |
| Average Intel Core Ultra 7 155H (60544 - 90647, n=50) | |
| Alienware m16 R2 | |
| Alienware x16 R1 | |
| Alienware m16 R1 Intel | |
| Lenovo Legion Slim 7 16APH8 | |
| AIDA64 / Memory Write | |
| Lenovo Legion Slim 7 16APH8 | |
| Alienware x16 R1 | |
| HP Omen Transcend 16-u1095ng | |
| Asus ROG Zephyrus G16 2024 GU605M | |
| Average Intel Core Ultra 7 155H (58692 - 93451, n=50) | |
| Alienware m16 R2 | |
| Alienware m16 R1 Intel | |
| AIDA64 / Memory Latency | |
| Average Intel Core Ultra 7 155H (116.2 - 233, n=50) | |
| Asus ROG Zephyrus G16 2024 GU605M | |
| Alienware m16 R2 | |
| Alienware x16 R1 | |
| Lenovo Legion Slim 7 16APH8 | |
| Alienware m16 R1 Intel | |
| HP Omen Transcend 16-u1095ng | |
* ... smaller is better
DPC 延迟
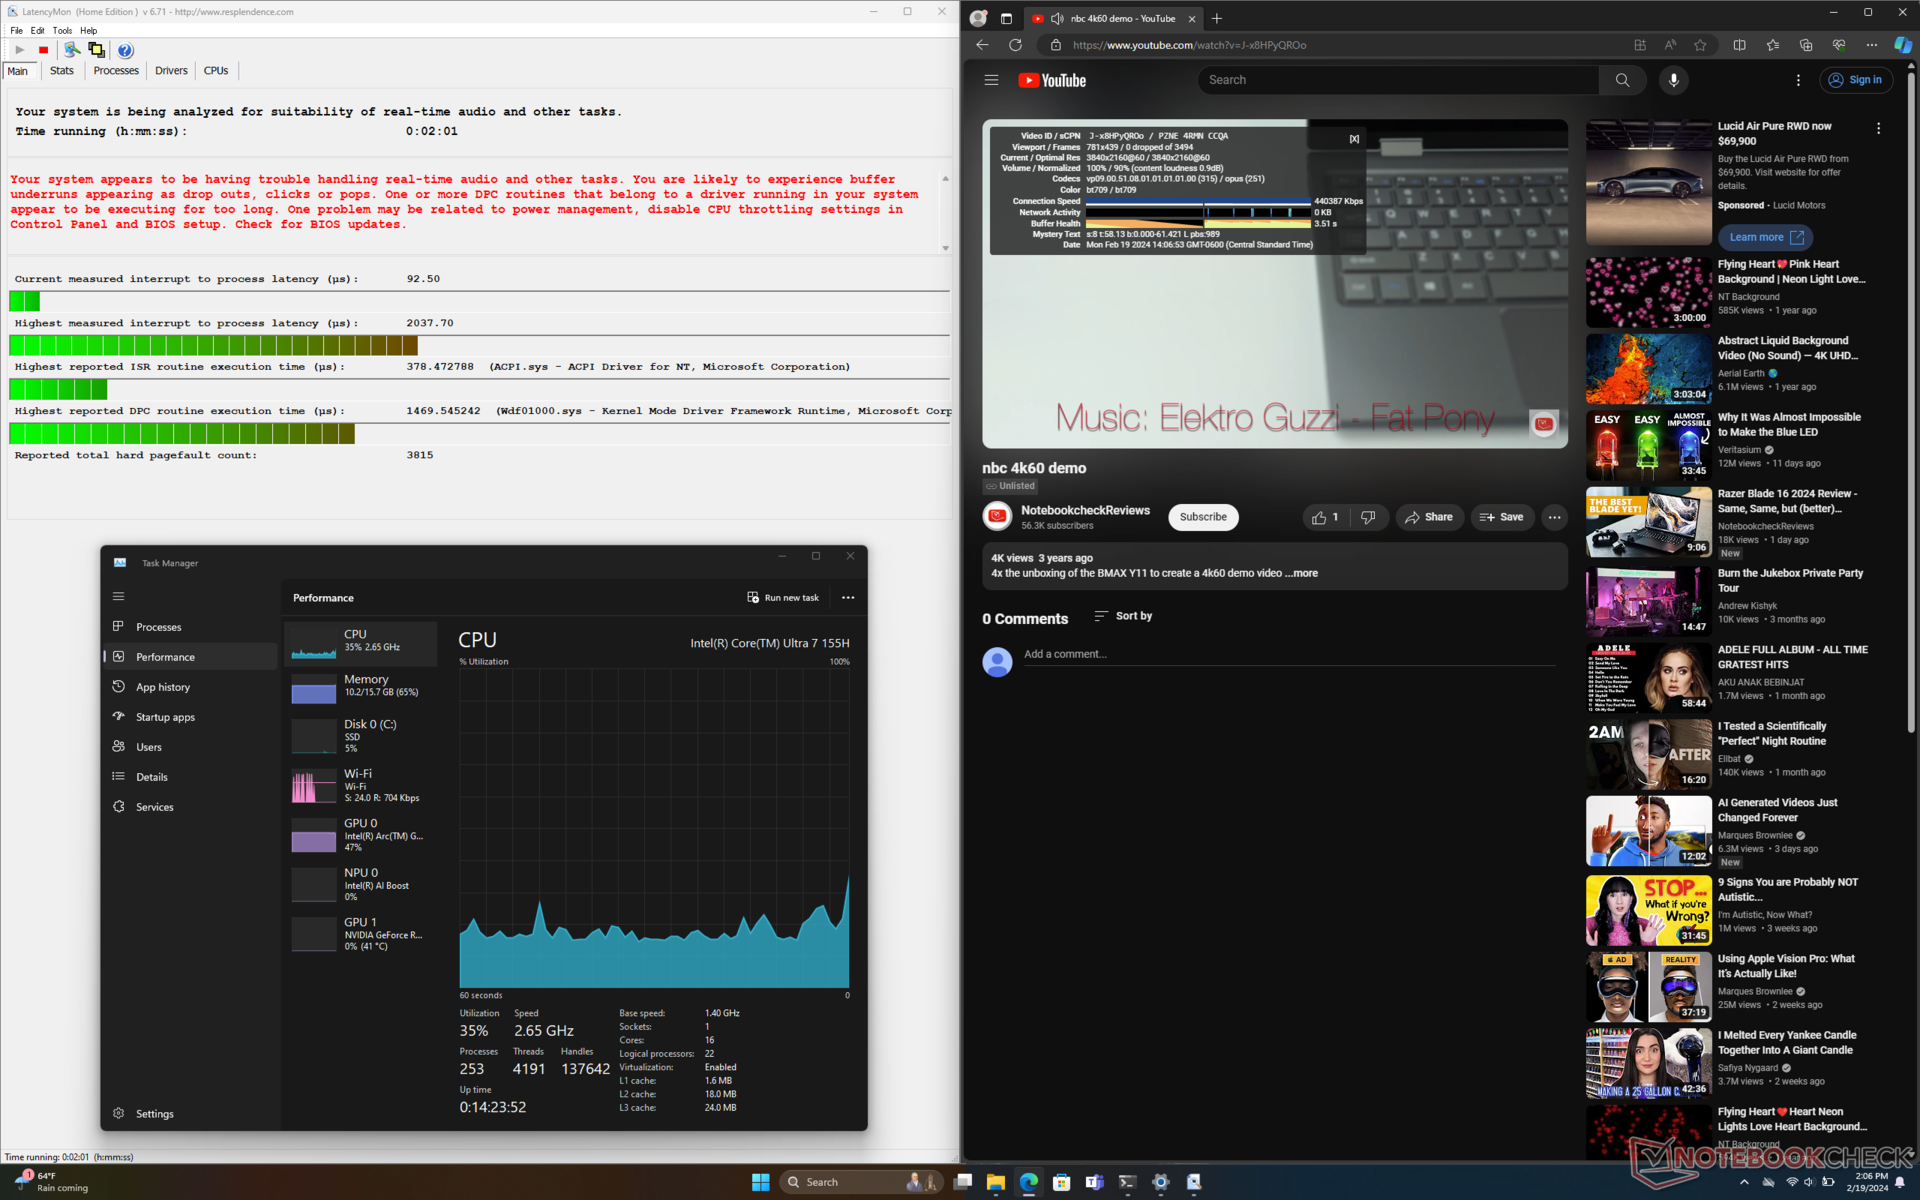
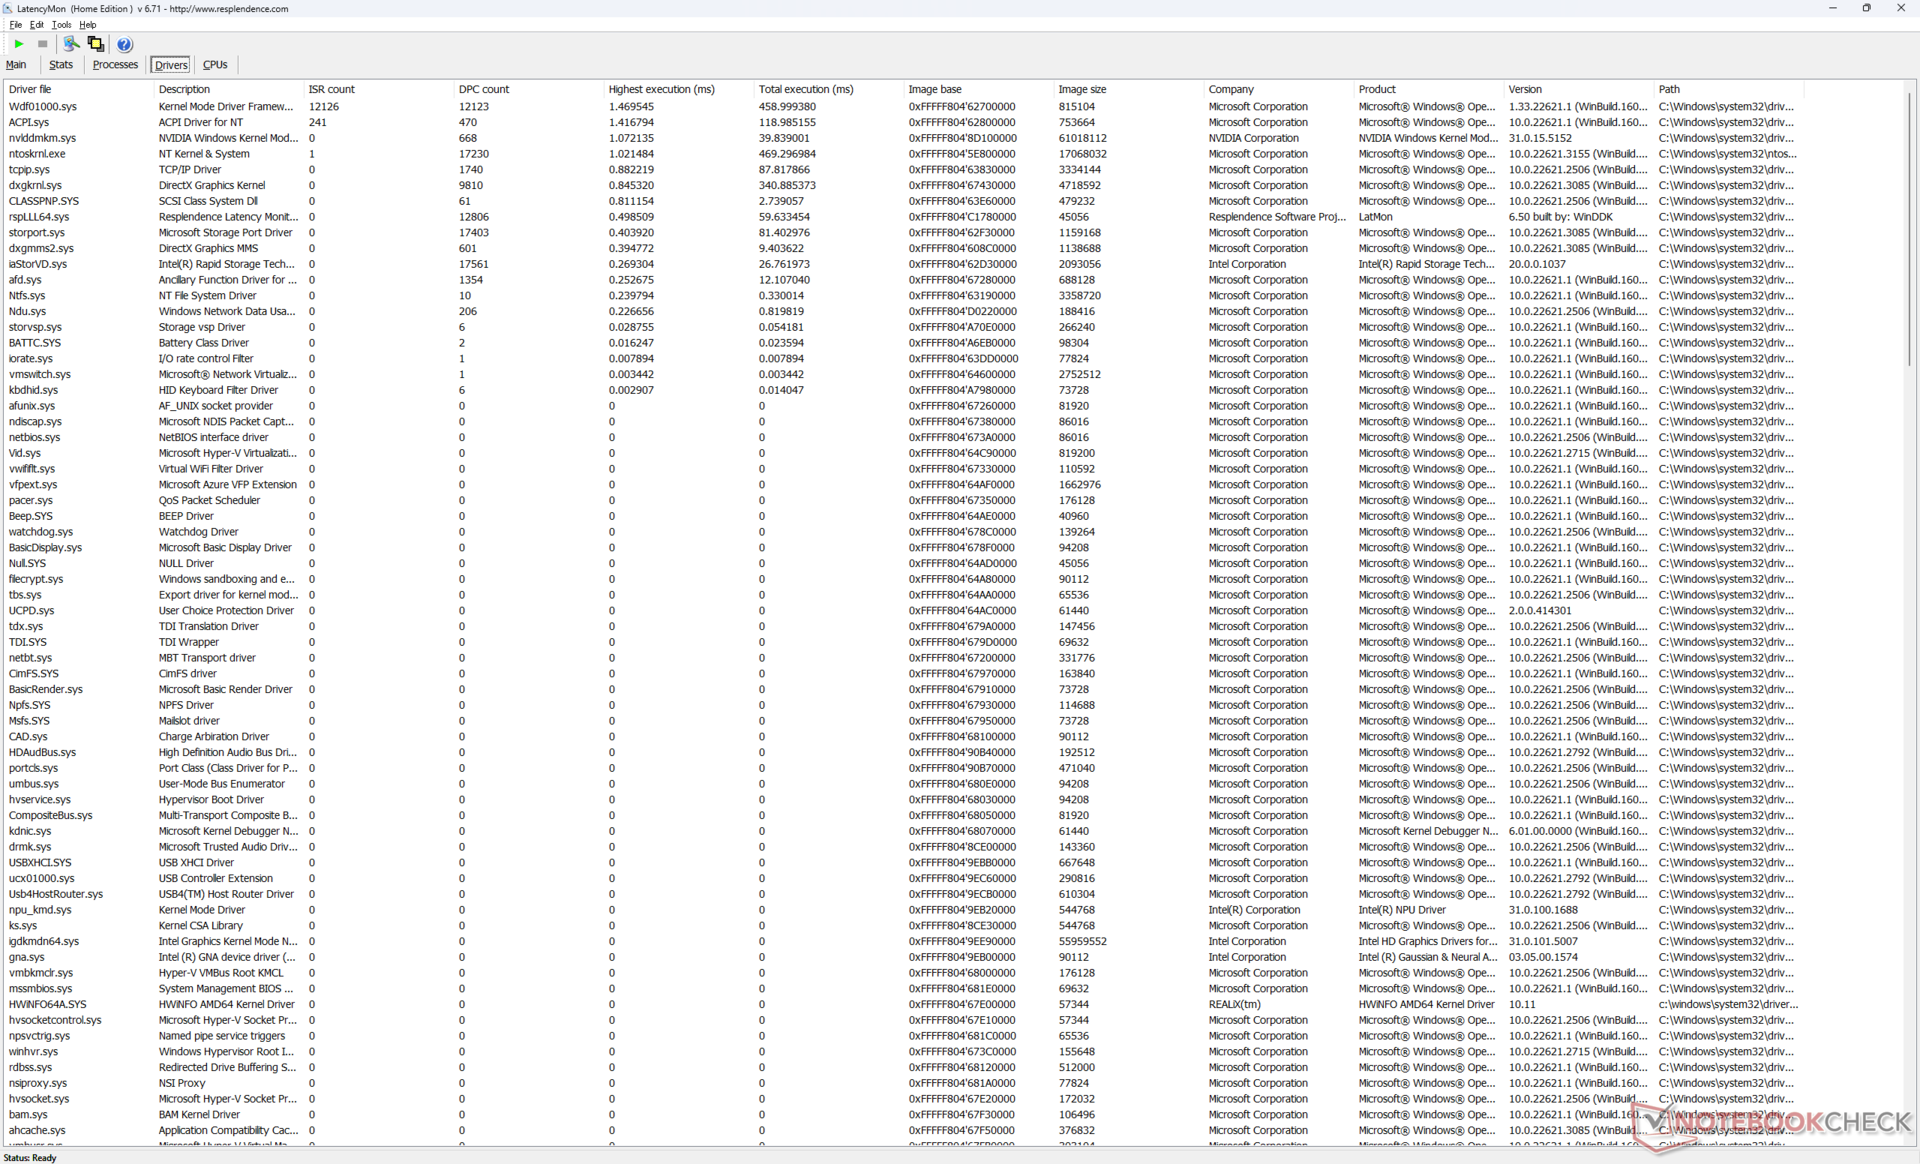
LatencyMon 显示,在打开我们主页的多个标签页时存在 DPC 问题。在其他方面,以 60 FPS 播放 4K 视频也非常完美,没有掉帧记录。
| DPC Latencies / LatencyMon - interrupt to process latency (max), Web, Youtube, Prime95 | |
| Alienware m16 R1 Intel | |
| Asus ROG Zephyrus G16 2024 GU605M | |
| Alienware m16 R2 | |
| HP Omen Transcend 16-u1095ng | |
| Alienware x16 R1 | |
| Lenovo Legion Slim 7 16APH8 | |
* ... smaller is better
存储设备
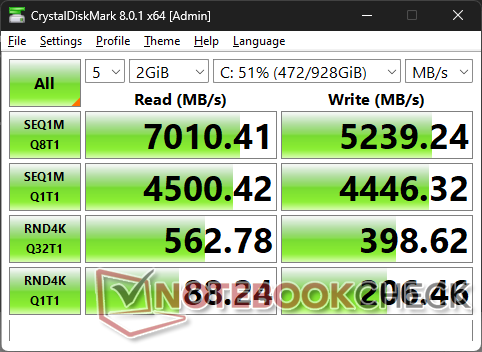
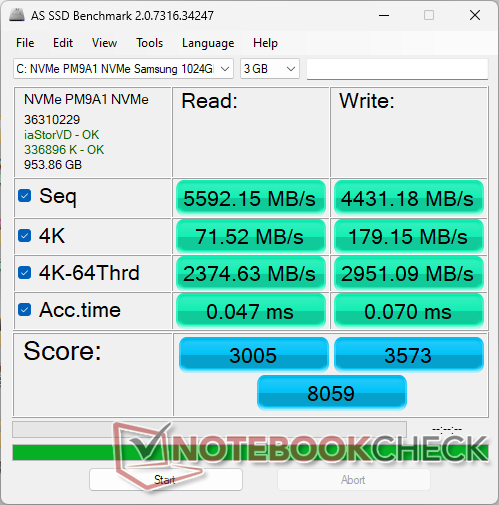
我们的设备配有 三星 PM9A1PCIe4 x4 NVMe 固态硬盘,而不是去年 m16 R1 上的 Kioxia。该硬盘在长时间保持 7000 MB/s 的最大传输速率方面没有任何问题。两个 M.2 2280 插槽均配有散热器。

| Drive Performance rating - Percent | |
| Alienware x16 R1 | |
| Alienware m16 R2 | |
| Alienware m16 R1 Intel | |
| Lenovo Legion Slim 7 16APH8 | |
| HP Omen Transcend 16-u1095ng | |
| Asus ROG Zephyrus G16 2024 GU605M | |
* ... smaller is better
Disk Throttling: DiskSpd Read Loop, Queue Depth 8
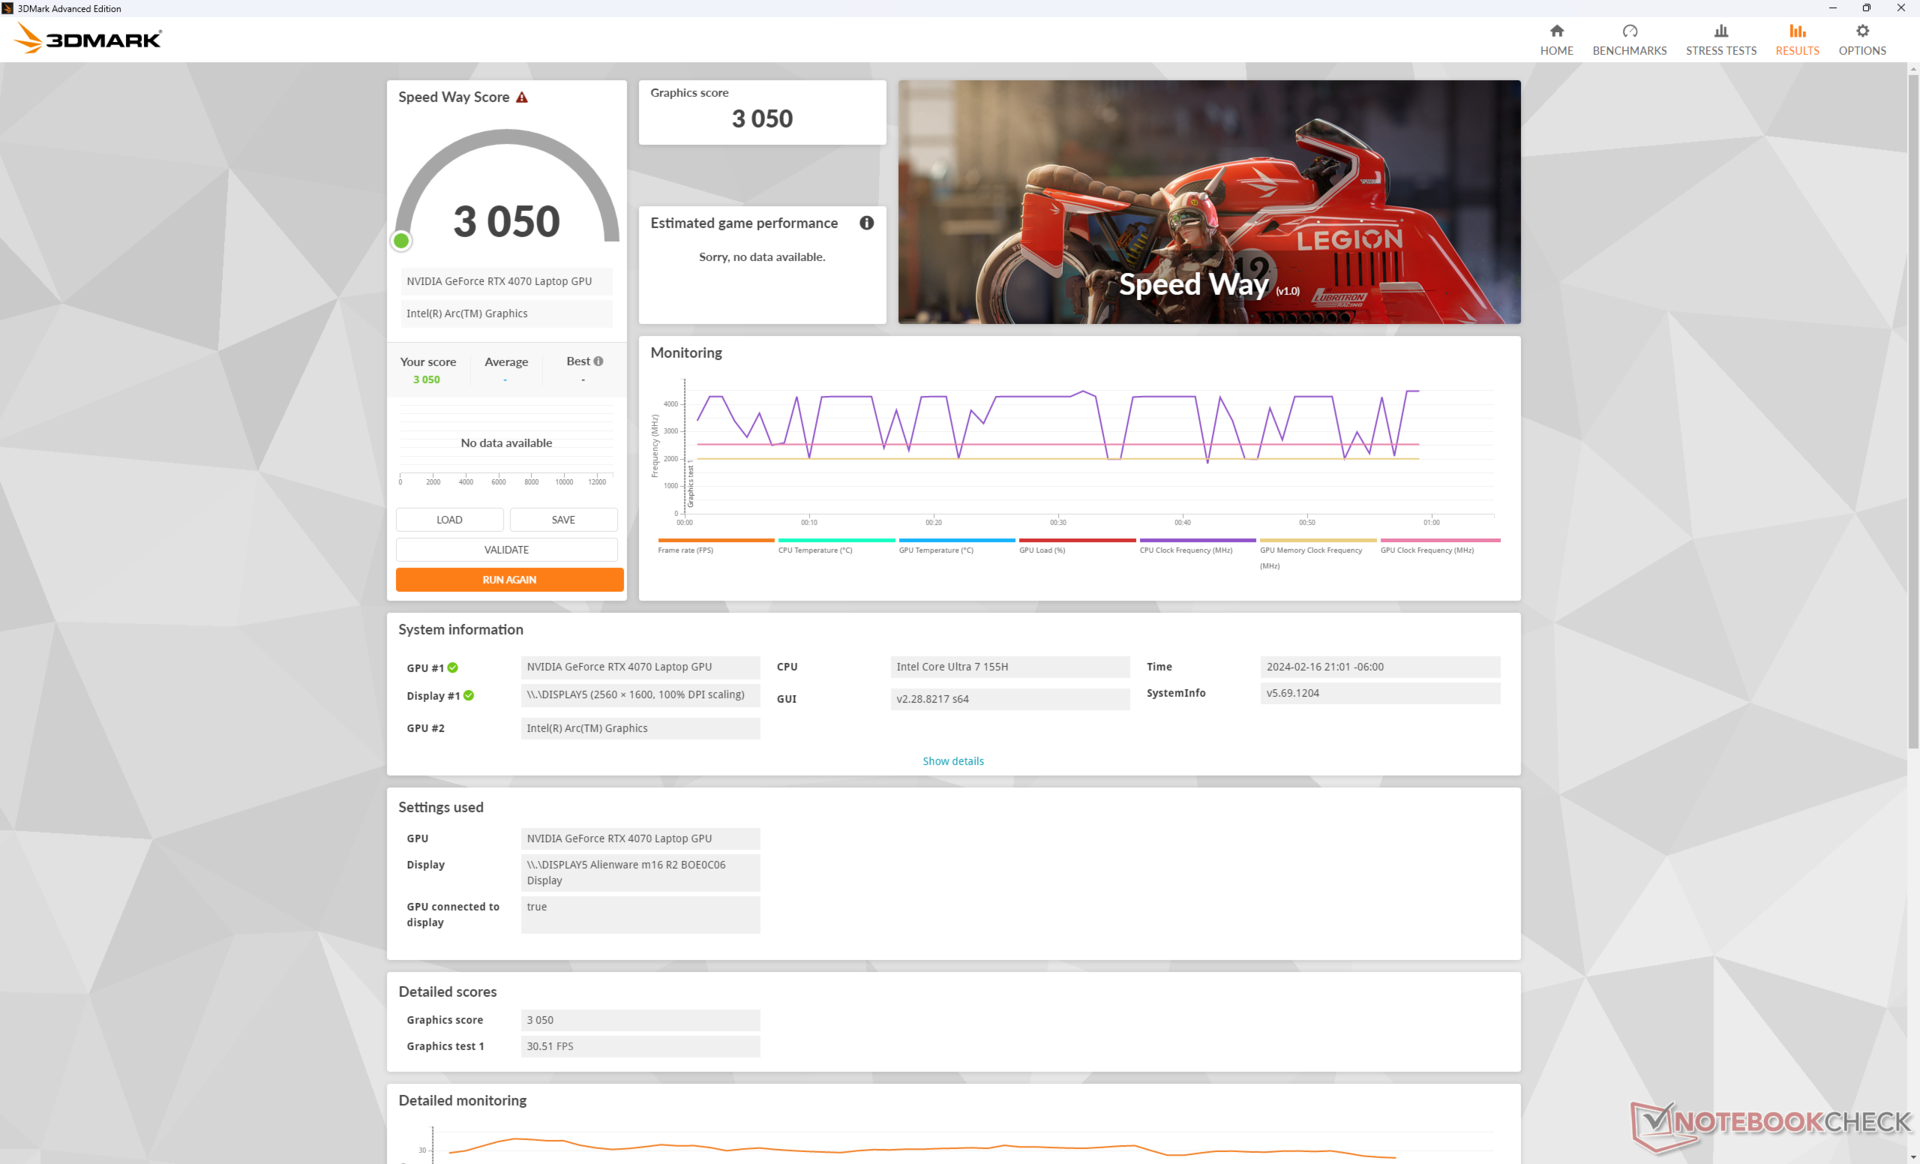
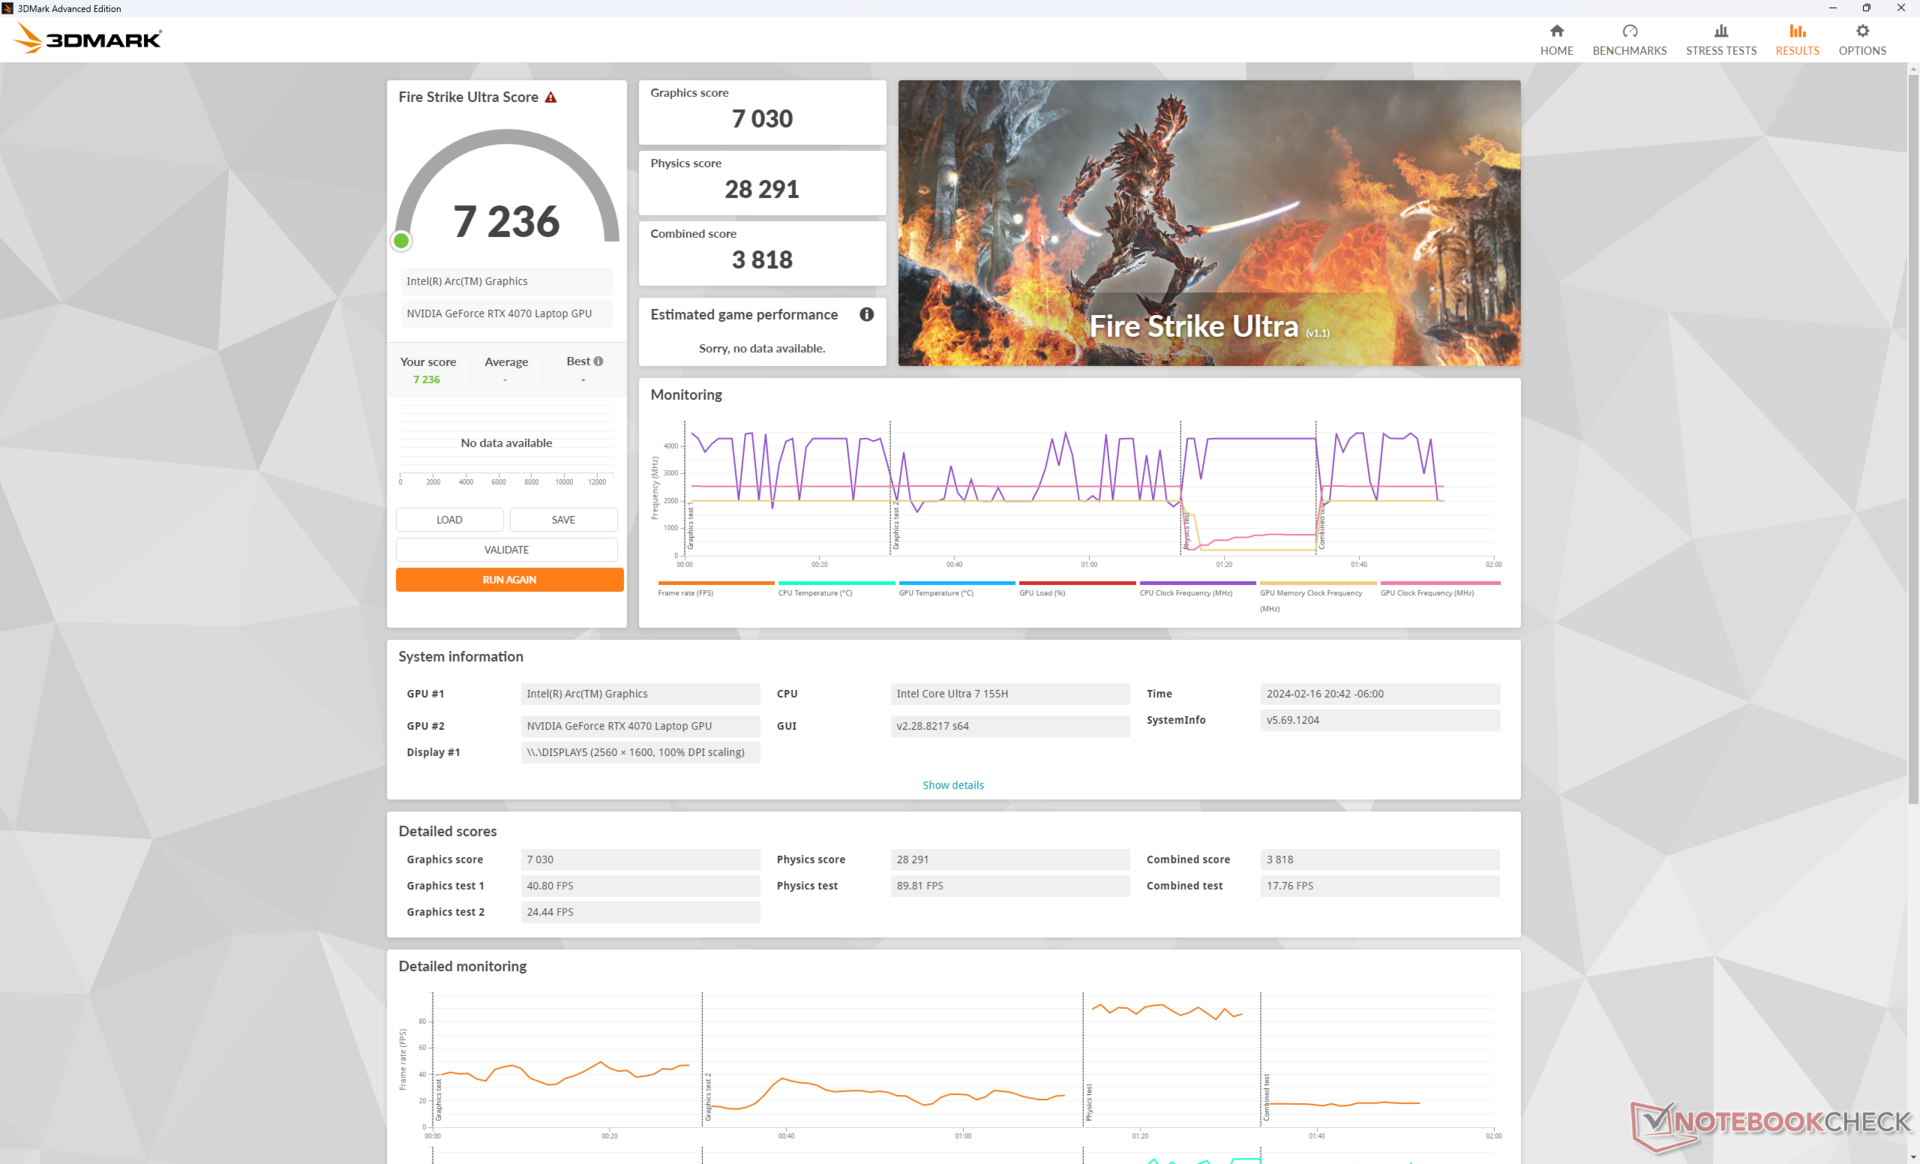
图形处理器性能
140 WGeForce RTX 4070 的图形性能比我们数据库中配备相同 GPU 的普通笔记本电脑快约 10%。虽然由于没有RTX 4080 或4090选项,比 m16 R1 降级多达 30% 至 45%,但至少可以看到 RTX 4070 的性能比预期的要好。想要 RTX 4080 或 4090 的用户只能考虑更老的 m16 R1 或价格更高的Alienware x16 系列 。
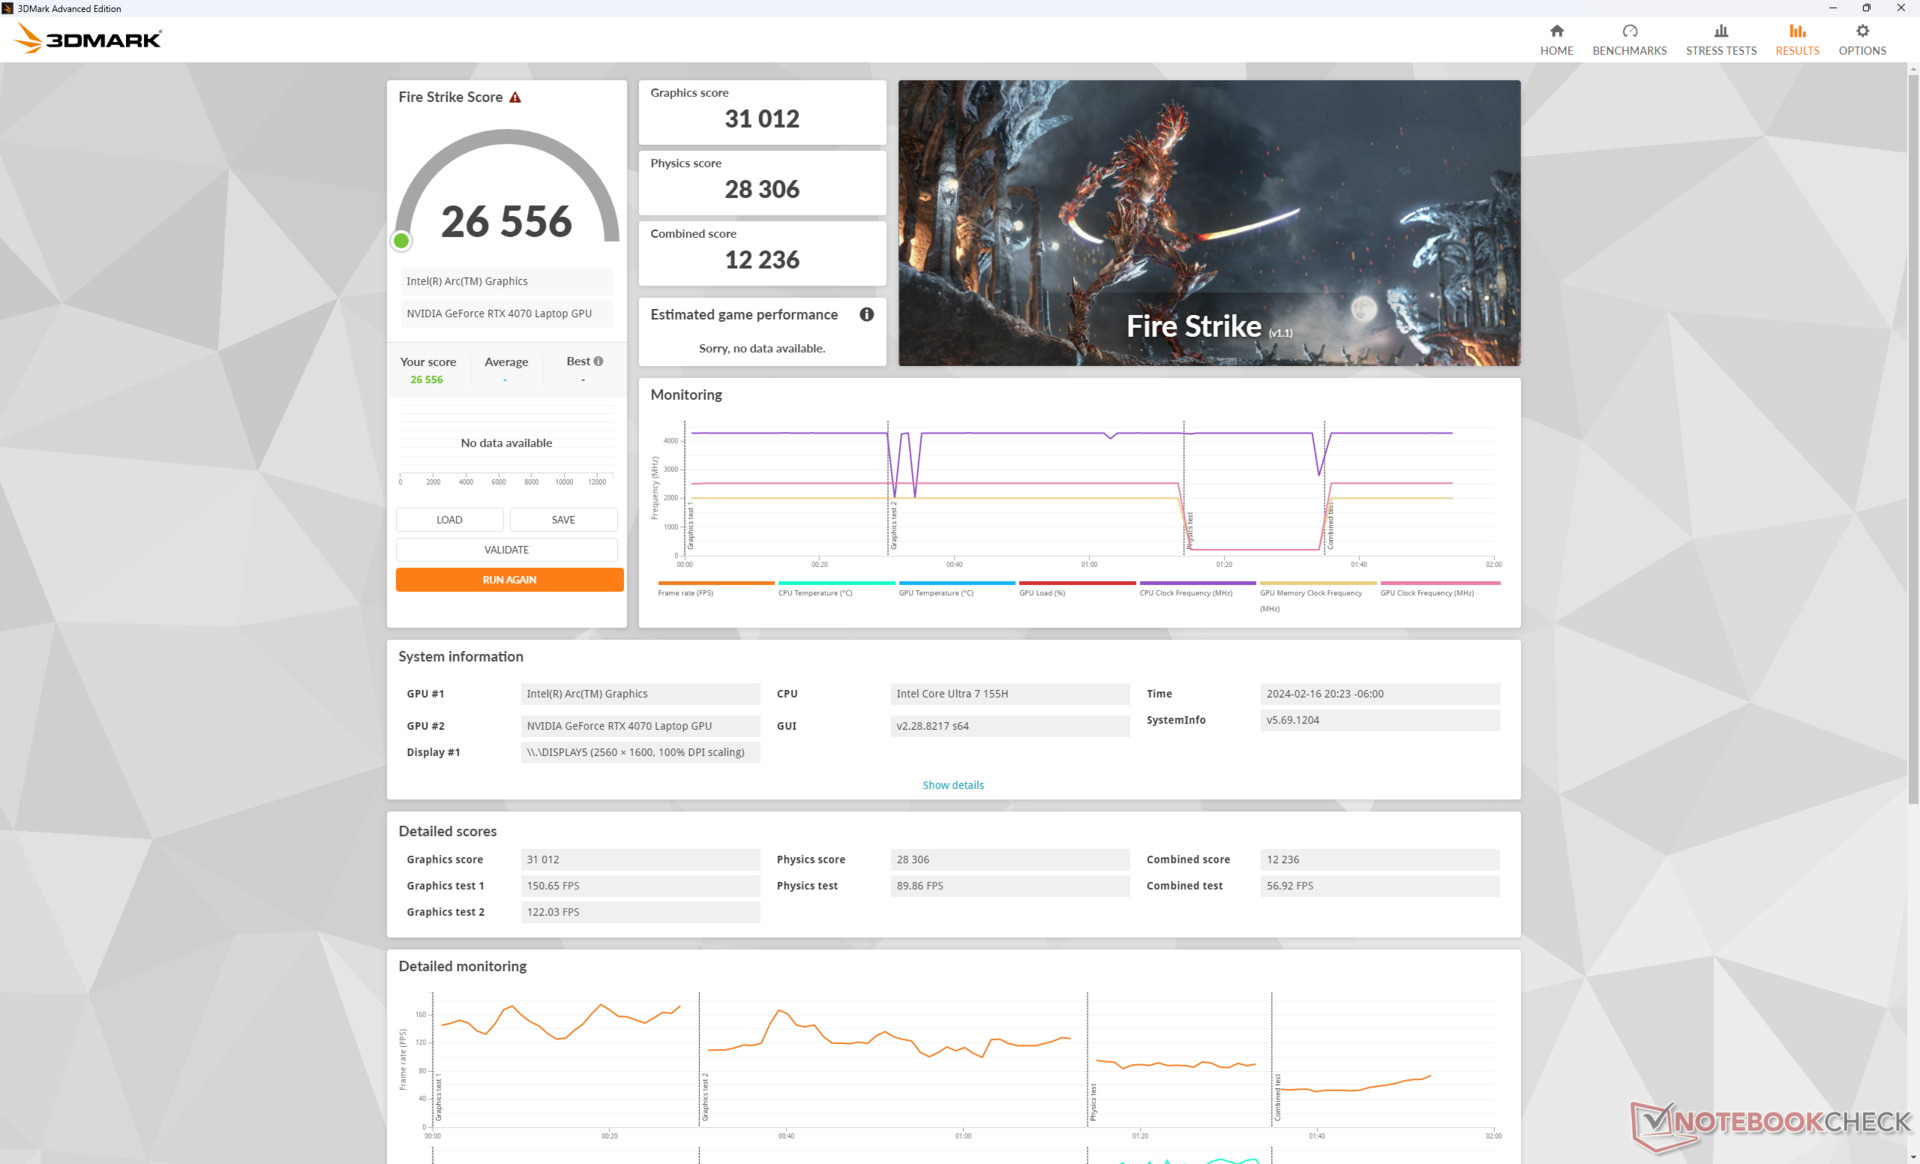
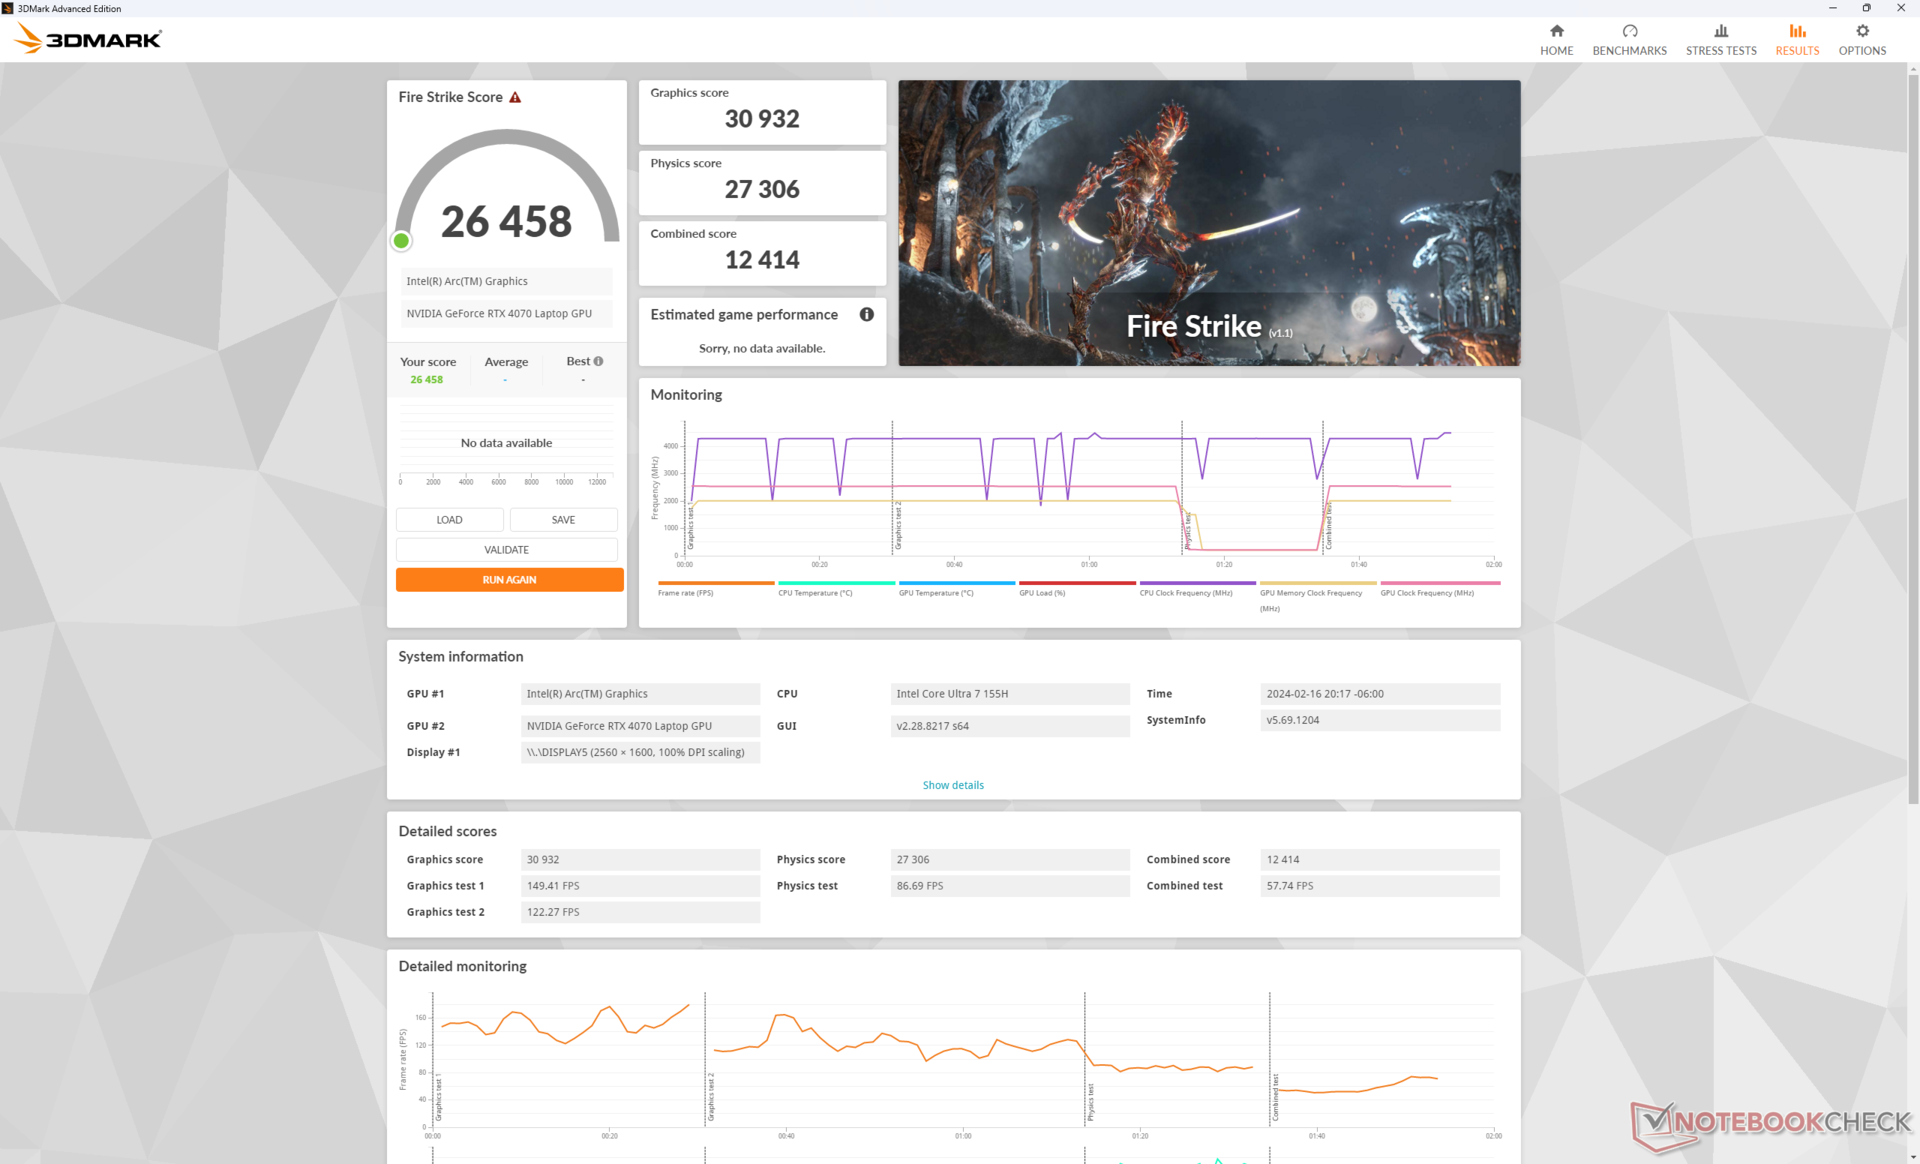
有趣的是,Overdrive、Performance 和 Balanced 三种模式之间的性能差异微乎其微。这令人惊讶,因为在大多数其他游戏笔记本电脑上,降到平衡模式通常会导致 10% 到 30% 的性能损失,但在我们的 Alienware m16 R2 上,Fire Strike 分数几乎保持不变。戴尔在这款机型的开发过程中肯定改变了风扇噪音曲线和随之而来的性能表现。
| 电源配置文件 | 图形分数 | 物理得分 | 综合得分 |
| 超速模式 | 30932 | 27306 | 12414 |
| 性能模式 | 31012 (-0%) | 28306 (-0%) | 12236 (-0%) |
| 平衡模式 | 30603 (-0%) | 28281 (-0%) | 12448 (-0%) |
| 电池电量 | 24398 (-21%) | 24684 (-10%) | 10088 (-19%) |
降级至 RTX 4060配置预计会对性能产生 10% 至 15% 的影响。
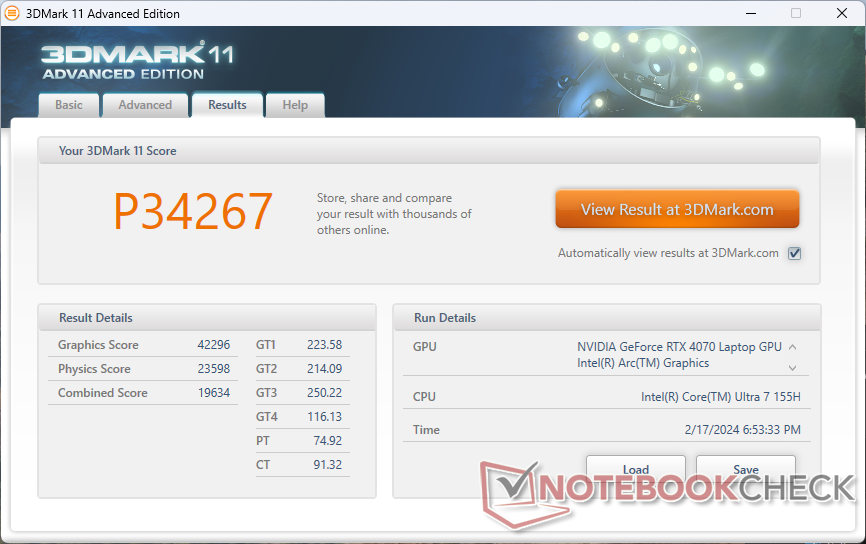
| 3DMark 11 Performance | 34267 points | |
| 3DMark Fire Strike Score | 26458 points | |
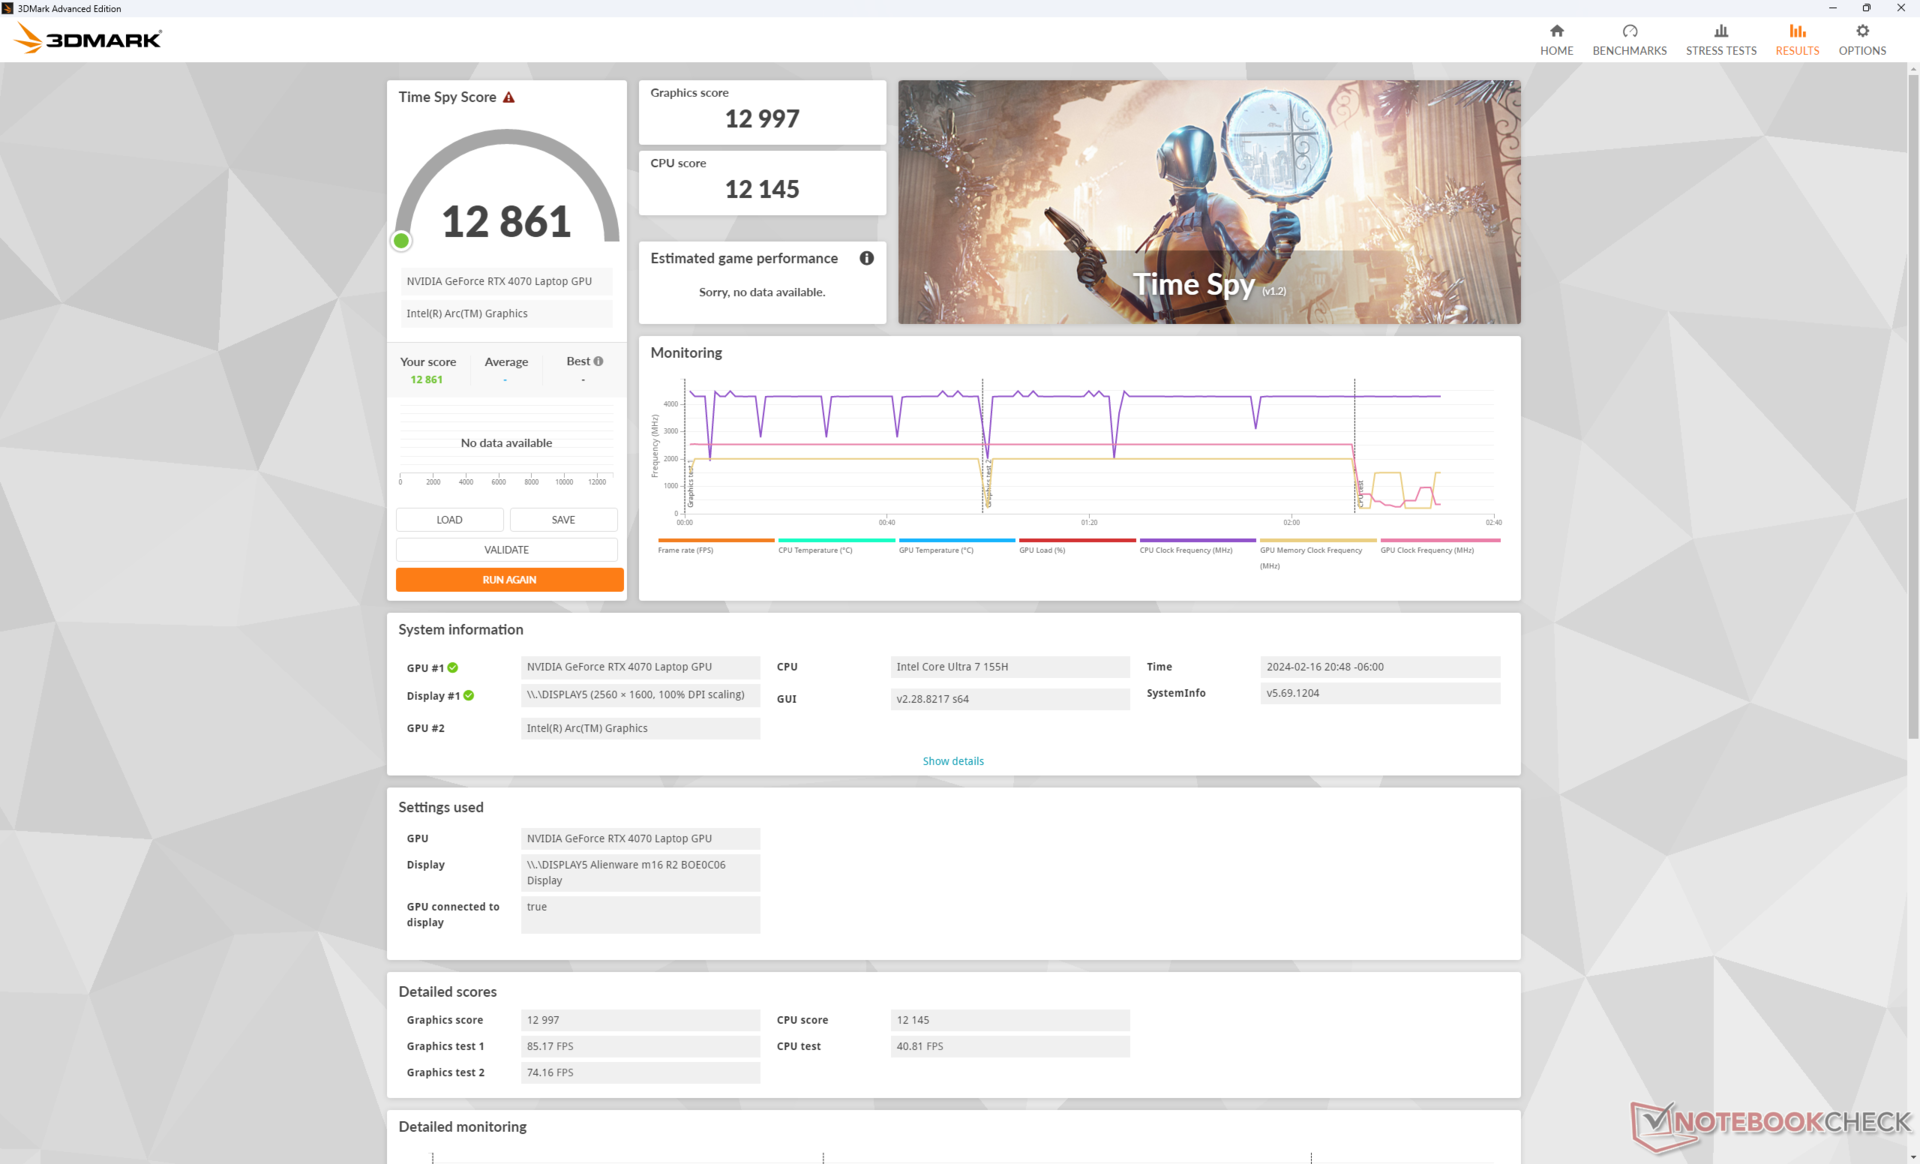
| 3DMark Time Spy Score | 12861 points | |
Help | ||
* ... smaller is better
| F1 22 | |
| 1920x1080 Ultra High Preset AA:T AF:16x | |
| Lenovo Legion 9 16IRX8 | |
| Alienware m16 R1 AMD | |
| Alienware m16 R2 | |
| Average NVIDIA GeForce RTX 4070 Laptop GPU (39.2 - 88.7, n=32) | |
| Lenovo Legion 5 16IRX G9 | |
| HP Victus 16-r0076TX | |
| Framework Laptop 16 | |
| 2560x1440 Ultra High Preset AA:T AF:16x | |
| Lenovo Legion 9 16IRX8 | |
| Alienware m16 R1 AMD | |
| Alienware m16 R2 | |
| Average NVIDIA GeForce RTX 4070 Laptop GPU (10.6 - 58.8, n=30) | |
| Lenovo Legion 5 16IRX G9 | |
| Framework Laptop 16 | |
| 3840x2160 Ultra High Preset AA:T AF:16x | |
| Alienware m16 R1 AMD | |
| Alienware m16 R2 | |
| Average NVIDIA GeForce RTX 4070 Laptop GPU (4.7 - 27.6, n=15) | |
| Framework Laptop 16 | |
| The Witcher 3 | |
| 1920x1080 Ultra Graphics & Postprocessing (HBAO+) | |
| Lenovo Legion 9 16IRX8 | |
| Alienware m16 R1 AMD | |
| Alienware m16 R2 | |
| Lenovo Legion 7 16IAX7-82TD004SGE | |
| HP Omen Transcend 16-u1095ng | |
| Average NVIDIA GeForce RTX 4070 Laptop GPU (69.8 - 133.7, n=57) | |
| Asus ROG Zephyrus M16 GU603Z | |
| Lenovo Legion 5 16IRX G9 | |
| HP Victus 16-r0076TX | |
| Lenovo Legion S7 16ARHA7 | |
| Asus ROG Zephyrus M16 GU603H | |
| Dell G16 7620 | |
| Framework Laptop 16 | |
| 3840x2160 High Graphics & Postprocessing (Nvidia HairWorks Off) | |
| Alienware m16 R1 AMD | |
| Alienware m16 R2 | |
| Average NVIDIA GeForce RTX 4070 Laptop GPU (26.5 - 83.5, n=16) | |
| Framework Laptop 16 | |
| Tiny Tina's Wonderlands | |
| 1920x1080 Badass Preset (DX12) | |
| Lenovo Legion 9 16IRX8 | |
| Alienware m16 R1 AMD | |
| Alienware m16 R2 | |
| Average NVIDIA GeForce RTX 4070 Laptop GPU (58.6 - 115.9, n=18) | |
| Framework Laptop 16 | |
| 2560x1440 Badass Preset (DX12) | |
| Lenovo Legion 9 16IRX8 | |
| Alienware m16 R1 AMD | |
| Alienware m16 R2 | |
| Average NVIDIA GeForce RTX 4070 Laptop GPU (49.8 - 79.5, n=17) | |
| Framework Laptop 16 | |
| 3840x2160 Badass Preset (DX12) | |
| Alienware m16 R1 AMD | |
| Average NVIDIA GeForce RTX 4070 Laptop GPU (28.3 - 39.7, n=13) | |
| Alienware m16 R2 | |
| Framework Laptop 16 | |
| Baldur's Gate 3 | |
| 1920x1080 Ultra Preset AA:T | |
| Alienware m16 R2 | |
| Average NVIDIA GeForce RTX 4070 Laptop GPU (66.7 - 128.5, n=30) | |
| Framework Laptop 16 | |
| 2560x1440 Ultra Preset AA:T | |
| Alienware m16 R2 | |
| Average NVIDIA GeForce RTX 4070 Laptop GPU (54.4 - 89.6, n=25) | |
| Framework Laptop 16 | |
| 3840x2160 Ultra Preset AA:T | |
| Alienware m16 R2 | |
| Average NVIDIA GeForce RTX 4070 Laptop GPU (33.4 - 45.2, n=12) | |
| Framework Laptop 16 | |
| Cyberpunk 2077 | |
| 1920x1080 Ultra Preset (FSR off) | |
| Lenovo Legion 9 16IRX8 | |
| Alienware m16 R2 | |
| Lenovo Legion 5 16IRX G9 | |
| Average NVIDIA GeForce RTX 4070 Laptop GPU (30.7 - 90.7, n=40) | |
| Framework Laptop 16 | |
| 2560x1440 Ultra Preset (FSR off) | |
| Lenovo Legion 9 16IRX8 | |
| Alienware m16 R2 | |
| Lenovo Legion 5 16IRX G9 | |
| Average NVIDIA GeForce RTX 4070 Laptop GPU (24.8 - 57.1, n=37) | |
| Framework Laptop 16 | |
| 3840x2160 Ultra Preset (FSR off) | |
| Average NVIDIA GeForce RTX 4070 Laptop GPU (20.2 - 24, n=13) | |
| Alienware m16 R2 | |
| Framework Laptop 16 | |
Witcher 3 FPS Chart
| low | med. | high | ultra | QHD | 4K | |
|---|---|---|---|---|---|---|
| The Witcher 3 (2015) | 399.6 | 344.6 | 240.5 | 121.3 | 72 | |
| Dota 2 Reborn (2015) | 166.8 | 149 | 149.5 | 139.7 | 130.6 | |
| Final Fantasy XV Benchmark (2018) | 184.6 | 165.1 | 119.3 | 85.2 | 48.5 | |
| X-Plane 11.11 (2018) | 132.3 | 116 | 90.8 | 78.2 | ||
| Far Cry 5 (2018) | 146 | 134 | 123 | 115 | 61 | |
| Strange Brigade (2018) | 427 | 308 | 255 | 219 | 141.7 | 73.8 |
| Tiny Tina's Wonderlands (2022) | 244 | 202.8 | 138.3 | 107.6 | 74.6 | 34.8 |
| F1 22 (2022) | 235 | 225 | 217 | 83.6 | 52.9 | 26.6 |
| Baldur's Gate 3 (2023) | 168.7 | 148.9 | 129.3 | 128.5 | 88.3 | 44.3 |
| Cyberpunk 2077 (2023) | 125.7 | 114.1 | 95.6 | 83.1 | 52.7 | 21 |
排放量
系统噪音
与 m16 R1 相比,风扇噪音有了明显改善。例如,在平衡模式下运行3DMark 06时,m16 R2 会在 32 dB(A) 的噪音下保持较长时间的安静,而 m16 R1 则会在整个基准测试场景中发出 52 dB(A) 的超大噪音。这使得 m16 R2 更容易与竞争对手相媲美,如 联想Legion Slim 7等竞争对手相比。
游戏时的风扇噪音与所选的电源配置文件密切相关。例如,当运行在平衡模式、性能模式和性能模式时,风扇噪音分别为 52 dB(A)、54 dB(A)和 62 dB(A)。 Witcher 3分别为 52 dB(A)、54 dB(A) 和 62 dB(A)。如上所述,这三种模式之间的性能差距很小,因此我们建议在大多数情况下使用 "性能 "模式,避免使用 "超速 "模式。62 dB(A) 的最大音量比我们在性能更强的 Alienware x16 R1 上记录到的音量要大得多,但该模式主要用于最终用户超频;性能模式足以满足现有设置的要求。
Noise level
| Idle |
| 25.3 / 25.3 / 25.3 dB(A) |
| Load |
| 31.7 / 62 dB(A) |
 | ||
30 dB silent 40 dB(A) audible 50 dB(A) loud |
||
min: | ||
| Alienware m16 R2 GeForce RTX 4070 Laptop GPU, Ultra 7 155H, Samsung PM9A1 MZVL21T0HCLR | Alienware m16 R1 Intel GeForce RTX 4060 Laptop GPU, i7-13700HX, Kioxia KXG70ZNV512G | Alienware x16 R1 GeForce RTX 4080 Laptop GPU, i9-13900HK, SK hynix PC801 HFS001TEJ9X101N | HP Omen Transcend 16-u1095ng GeForce RTX 4070 Laptop GPU, i9-14900HX, Kioxia XG8 KXG80ZNV1T02 | Asus ROG Zephyrus G16 2024 GU605M GeForce RTX 4070 Laptop GPU, Ultra 7 155H, WD PC SN560 SDDPNQE-1T00 | Lenovo Legion Slim 7 16APH8 GeForce RTX 4060 Laptop GPU, R7 7840HS, WDC PC SN810 1TB | |
|---|---|---|---|---|---|---|
| Noise | -8% | 1% | -8% | 2% | 0% | |
| off / environment * (dB) | 24.7 | 25 -1% | 22.7 8% | 24 3% | 23.9 3% | 24 3% |
| Idle Minimum * (dB) | 25.3 | 25 1% | 23.1 9% | 29 -15% | 23.9 6% | 25 1% |
| Idle Average * (dB) | 25.3 | 26 -3% | 25.8 -2% | 30 -19% | 27.8 -10% | 28 -11% |
| Idle Maximum * (dB) | 25.3 | 27 -7% | 25.8 -2% | 31 -23% | 30.1 -19% | 31 -23% |
| Load Average * (dB) | 31.7 | 52 -64% | 39.3 -24% | 45 -42% | 34.2 -8% | 33 -4% |
| Witcher 3 ultra * (dB) | 53.8 | 51 5% | 49.9 7% | 44 18% | 46.4 14% | 47 13% |
| Load Maximum * (dB) | 62 | 53 15% | 54.8 12% | 47 24% | 46.4 25% | 49 21% |
* ... smaller is better
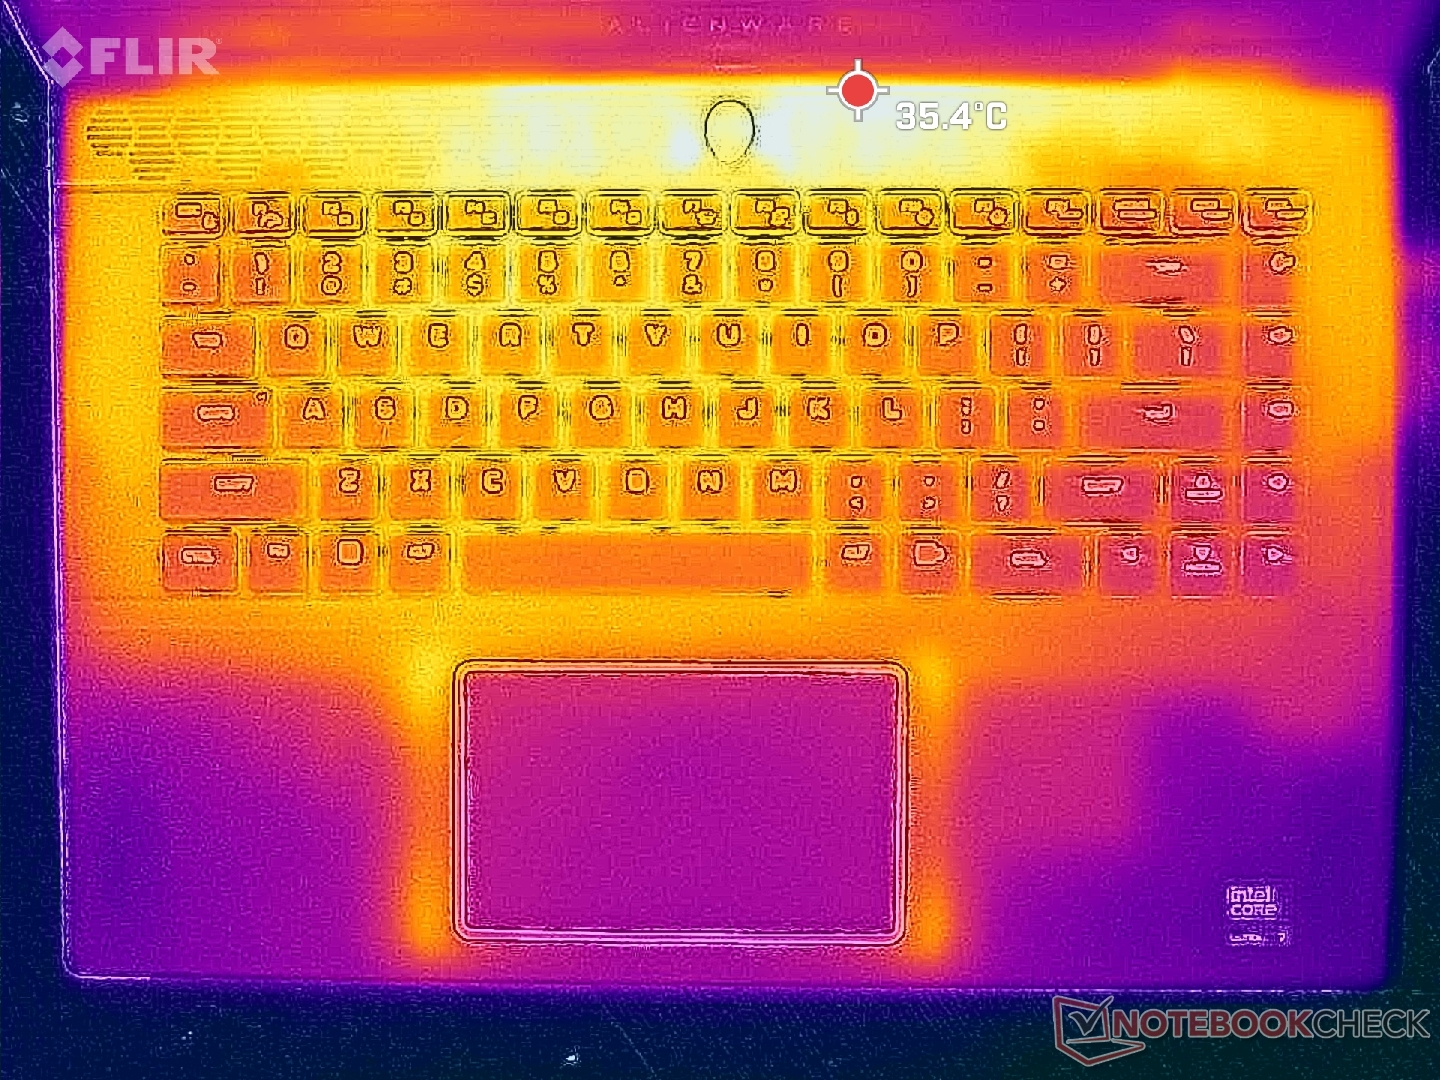
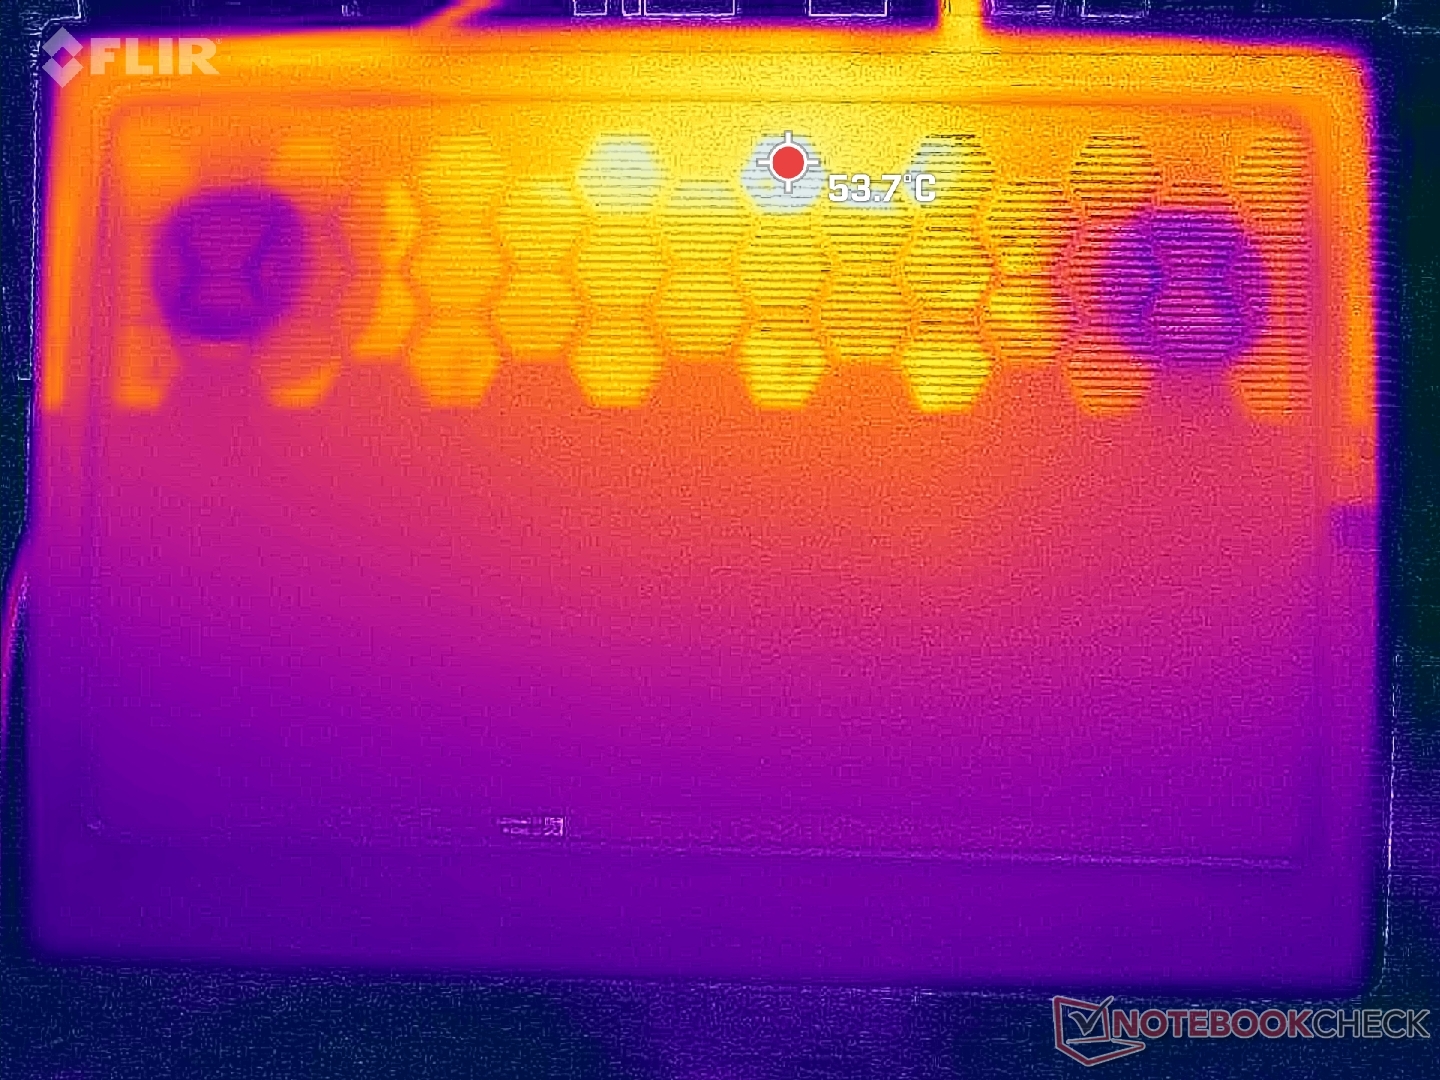
温度
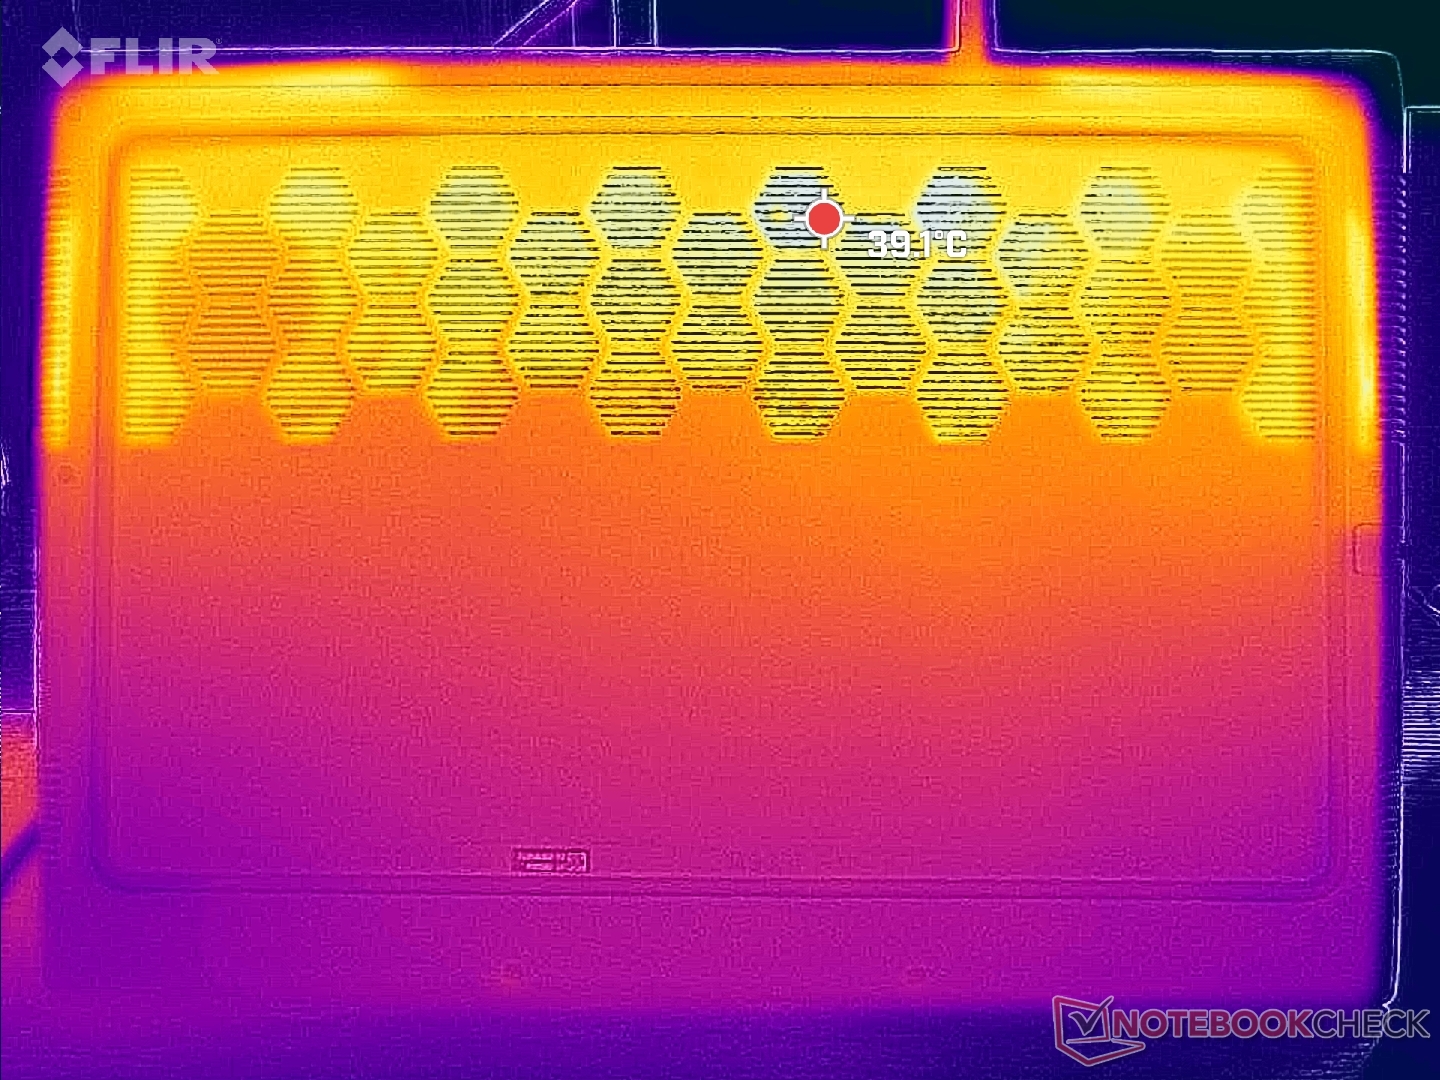
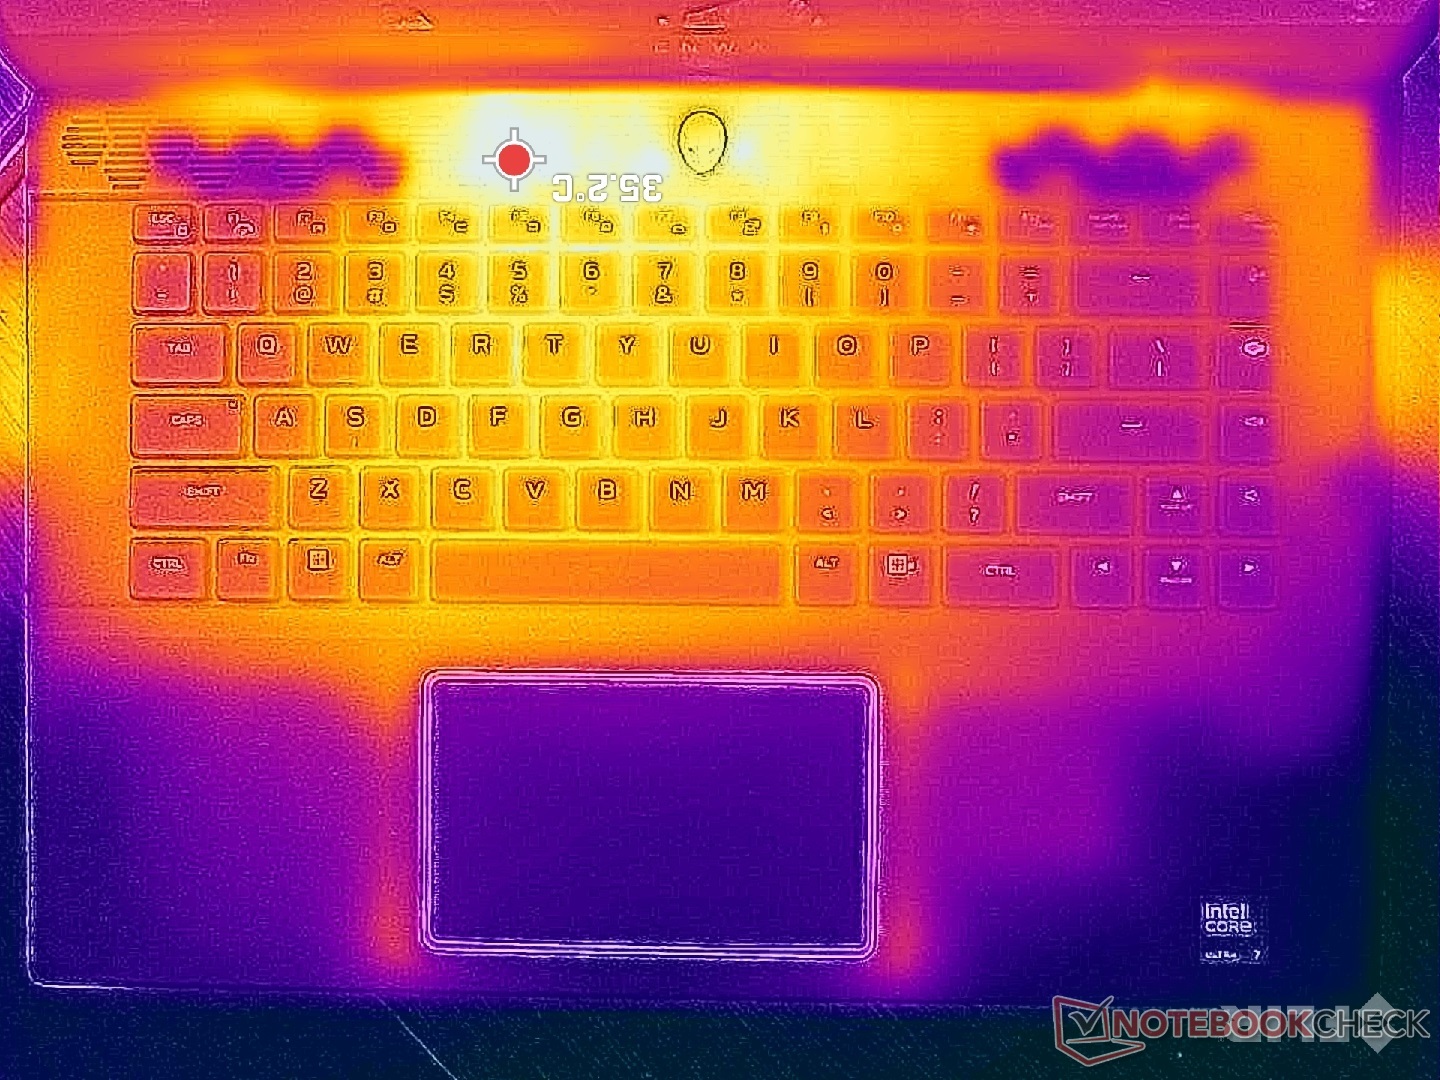
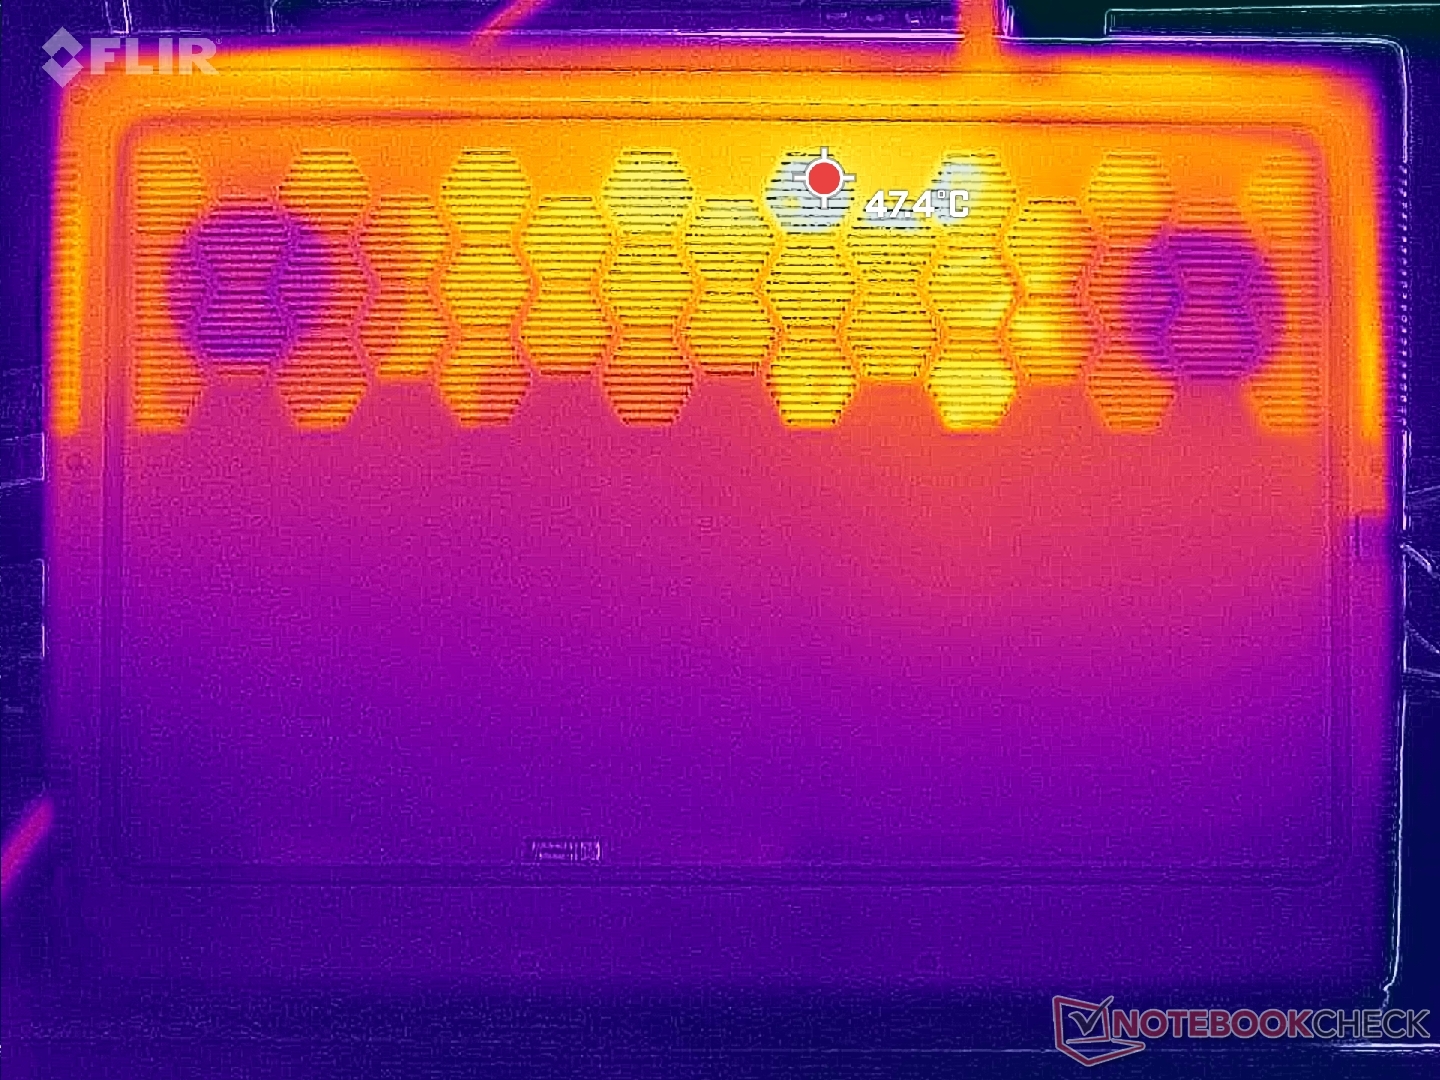
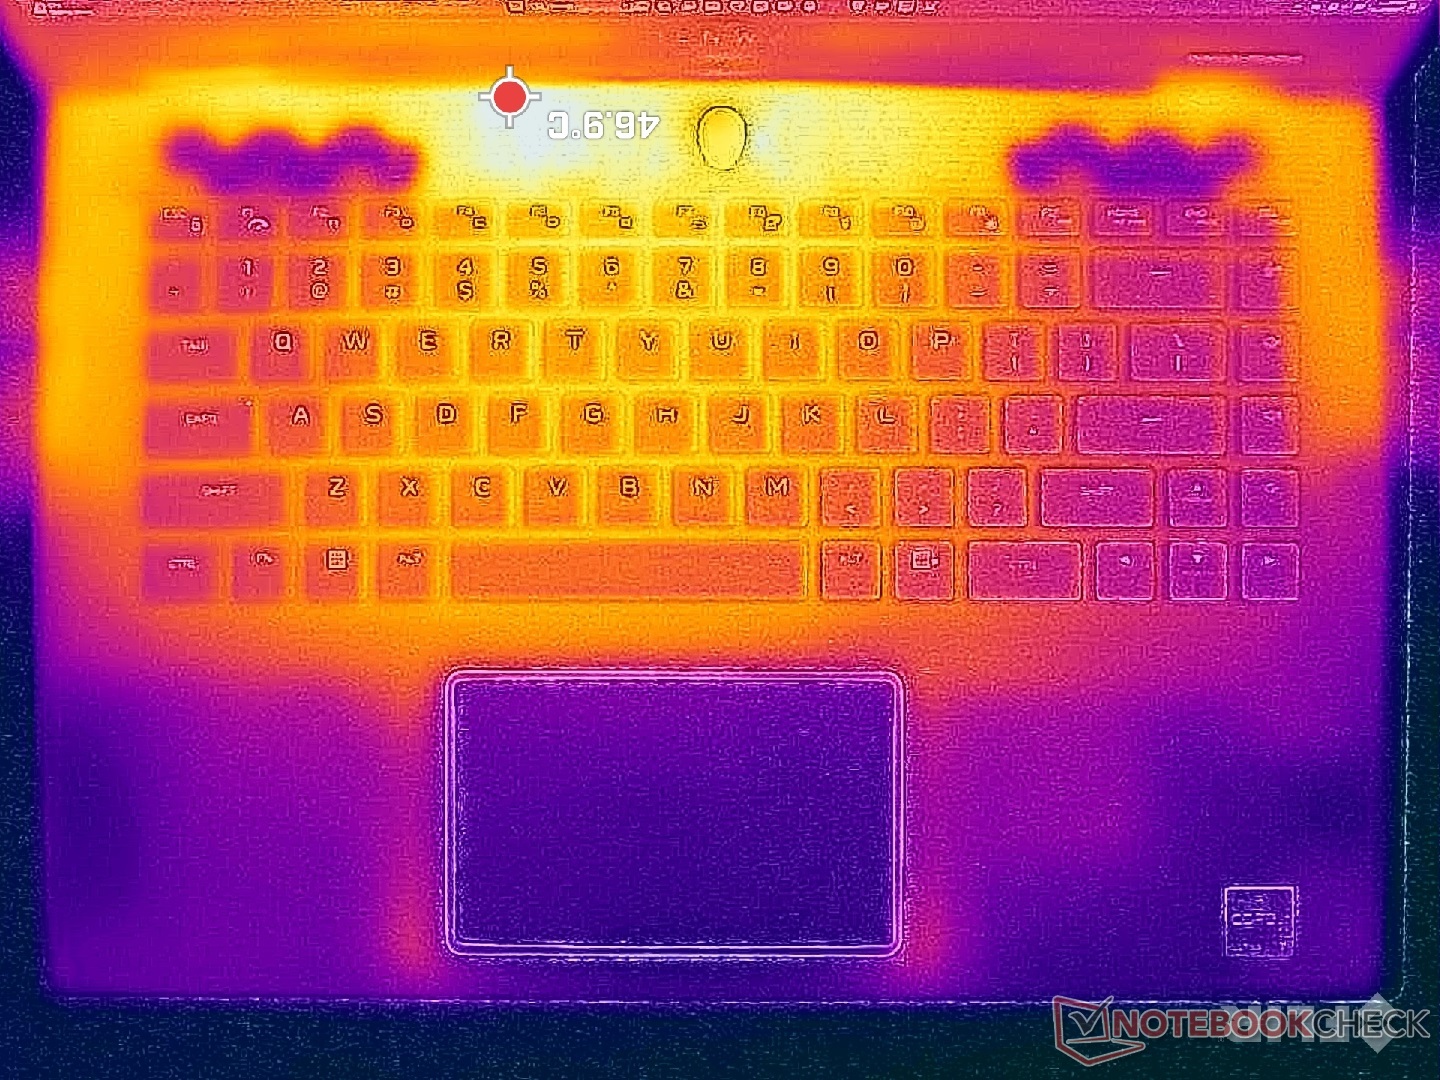
在运行游戏等高负荷运行时,发热点主要集中在机身后部,手不太可能接触到的地方。掌托和键盘的温度分别在 20 摄氏度和 30 摄氏度之间,而机身后部则接近 50 摄氏度。 刀锋 16但仍比 HP Omen Transcend 16某些区域的温度可能会超过 60 摄氏度。
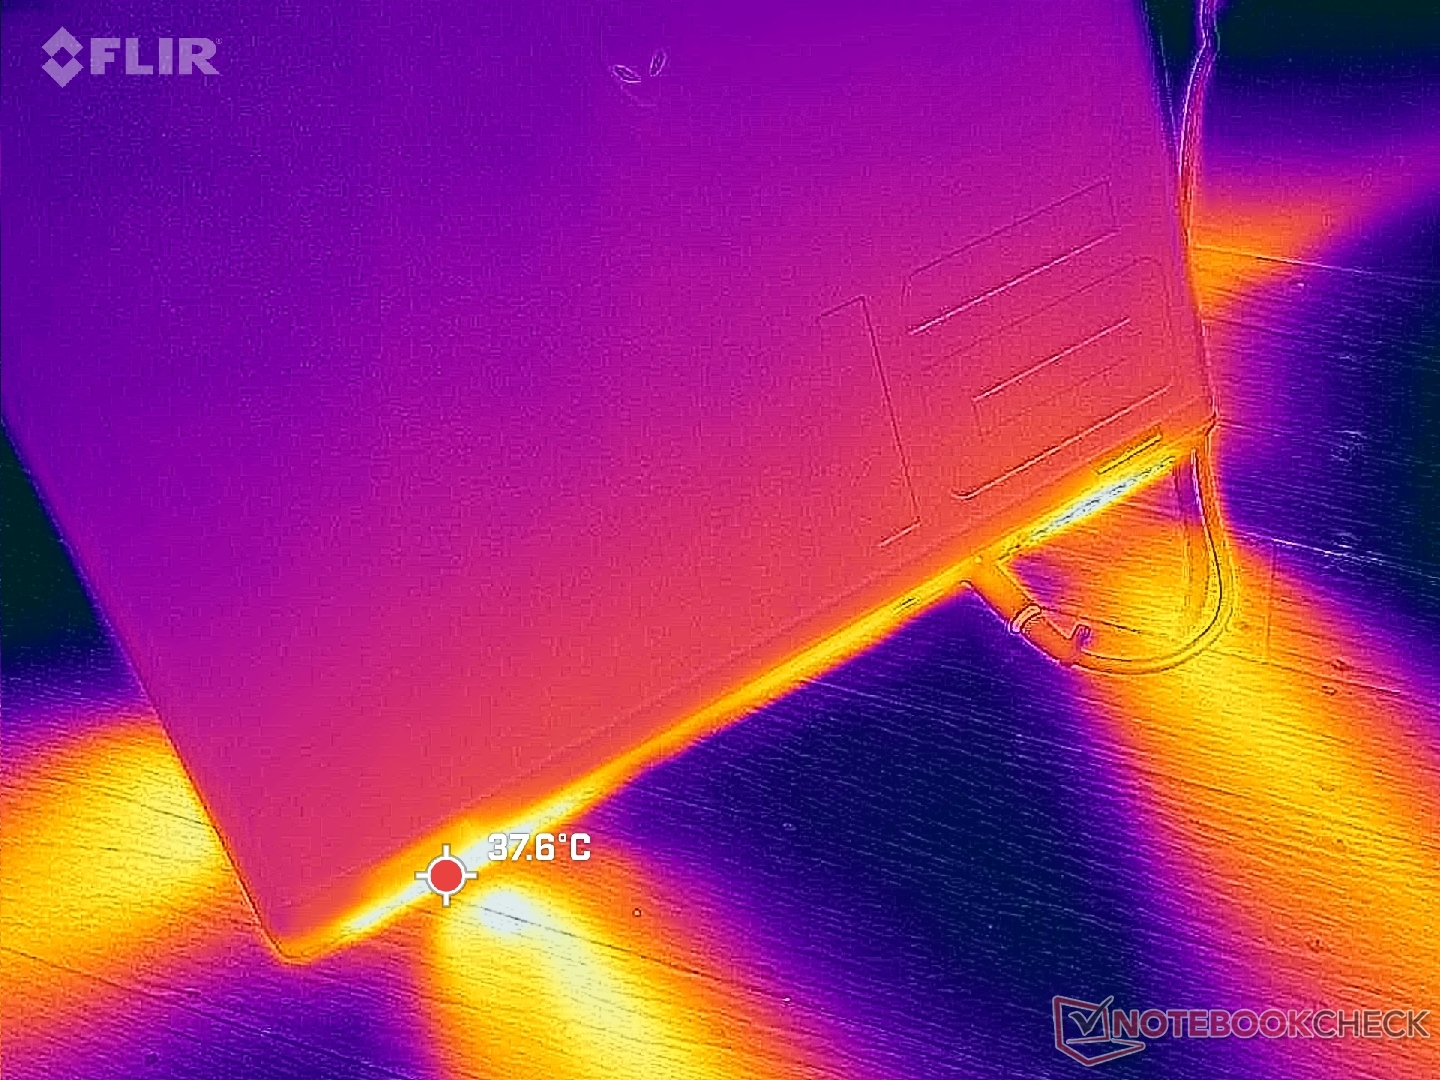
(±) The maximum temperature on the upper side is 44.8 °C / 113 F, compared to the average of 40.4 °C / 105 F, ranging from 21.2 to 68.8 °C for the class Gaming.
(-) The bottom heats up to a maximum of 48 °C / 118 F, compared to the average of 43.2 °C / 110 F
(+) In idle usage, the average temperature for the upper side is 30.9 °C / 88 F, compared to the device average of 33.9 °C / 93 F.
(+) Playing The Witcher 3, the average temperature for the upper side is 28.7 °C / 84 F, compared to the device average of 33.9 °C / 93 F.
(+) The palmrests and touchpad are cooler than skin temperature with a maximum of 27.2 °C / 81 F and are therefore cool to the touch.
(±) The average temperature of the palmrest area of similar devices was 28.8 °C / 83.8 F (+1.6 °C / 2.8 F).
| Alienware m16 R2 Intel Core Ultra 7 155H, NVIDIA GeForce RTX 4070 Laptop GPU | Alienware m16 R1 Intel Intel Core i7-13700HX, NVIDIA GeForce RTX 4060 Laptop GPU | Alienware x16 R1 Intel Core i9-13900HK, NVIDIA GeForce RTX 4080 Laptop GPU | HP Omen Transcend 16-u1095ng Intel Core i9-14900HX, NVIDIA GeForce RTX 4070 Laptop GPU | Asus ROG Zephyrus G16 2024 GU605M Intel Core Ultra 7 155H, NVIDIA GeForce RTX 4070 Laptop GPU | Lenovo Legion Slim 7 16APH8 AMD Ryzen 7 7840HS, NVIDIA GeForce RTX 4060 Laptop GPU | |
|---|---|---|---|---|---|---|
| Heat | -3% | 3% | 3% | 10% | 8% | |
| Maximum Upper Side * (°C) | 44.8 | 49 -9% | 47.2 -5% | 49 -9% | 50.3 -12% | 46 -3% |
| Maximum Bottom * (°C) | 48 | 48 -0% | 47.8 -0% | 63 -31% | 48 -0% | 46 4% |
| Idle Upper Side * (°C) | 37.2 | 40 -8% | 36.8 1% | 30 19% | 28.8 23% | 33 11% |
| Idle Bottom * (°C) | 42 | 39 7% | 35.8 15% | 29 31% | 29.8 29% | 34 19% |
* ... smaller is better
发言人
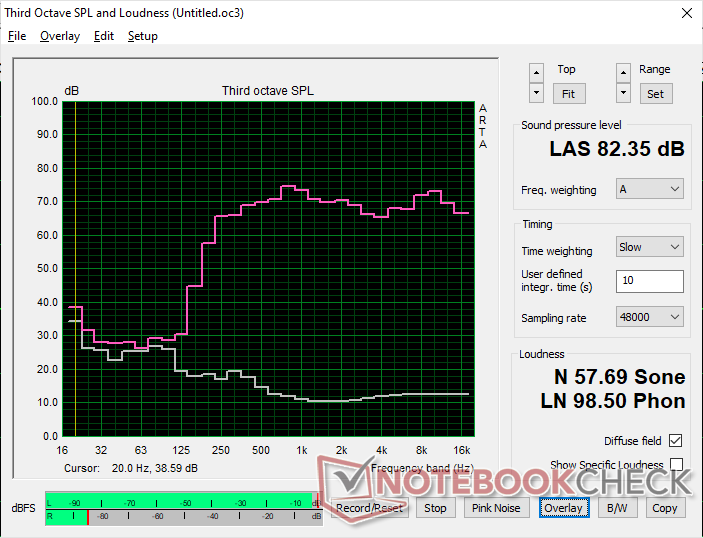
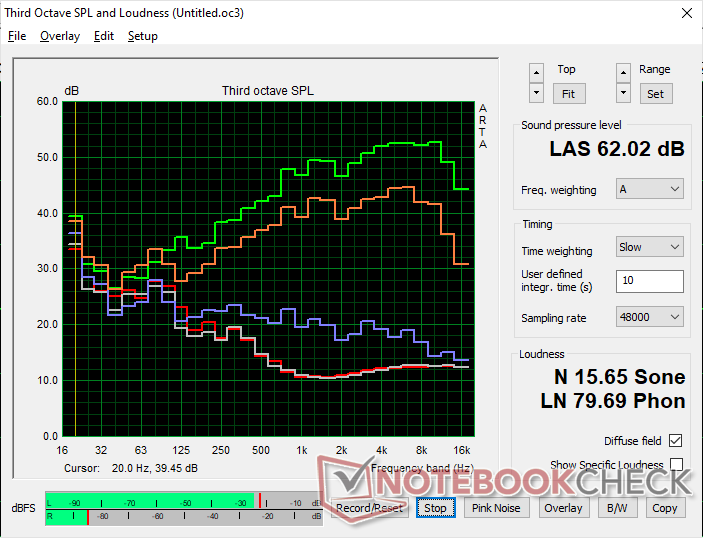
Alienware m16 R2 audio analysis
(+) | speakers can play relatively loud (82.4 dB)
Bass 100 - 315 Hz
(-) | nearly no bass - on average 20.1% lower than median
(±) | linearity of bass is average (11.1% delta to prev. frequency)
Mids 400 - 2000 Hz
(+) | balanced mids - only 2.2% away from median
(+) | mids are linear (3.1% delta to prev. frequency)
Highs 2 - 16 kHz
(+) | balanced highs - only 2.2% away from median
(+) | highs are linear (3.5% delta to prev. frequency)
Overall 100 - 16.000 Hz
(+) | overall sound is linear (12.9% difference to median)
Compared to same class
» 17% of all tested devices in this class were better, 4% similar, 79% worse
» The best had a delta of 6%, average was 18%, worst was 132%
Compared to all devices tested
» 12% of all tested devices were better, 3% similar, 85% worse
» The best had a delta of 4%, average was 23%, worst was 134%
Apple MacBook Pro 16 2021 M1 Pro audio analysis
(+) | speakers can play relatively loud (84.7 dB)
Bass 100 - 315 Hz
(+) | good bass - only 3.8% away from median
(+) | bass is linear (5.2% delta to prev. frequency)
Mids 400 - 2000 Hz
(+) | balanced mids - only 1.3% away from median
(+) | mids are linear (2.1% delta to prev. frequency)
Highs 2 - 16 kHz
(+) | balanced highs - only 1.9% away from median
(+) | highs are linear (2.7% delta to prev. frequency)
Overall 100 - 16.000 Hz
(+) | overall sound is linear (4.6% difference to median)
Compared to same class
» 0% of all tested devices in this class were better, 0% similar, 100% worse
» The best had a delta of 5%, average was 17%, worst was 45%
Compared to all devices tested
» 0% of all tested devices were better, 0% similar, 100% worse
» The best had a delta of 4%, average was 23%, worst was 134%
能源管理 - 更精简、更省电
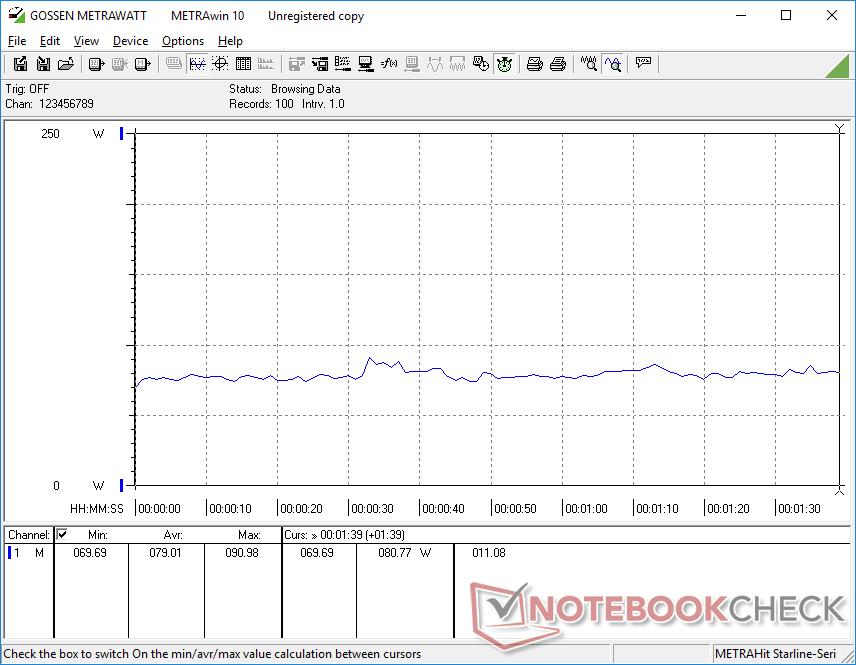
耗电量
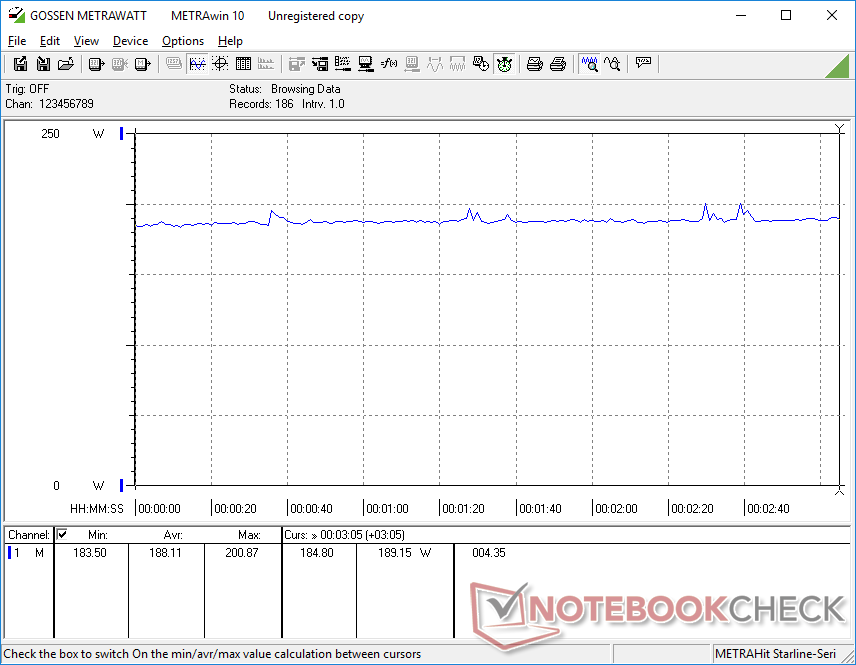
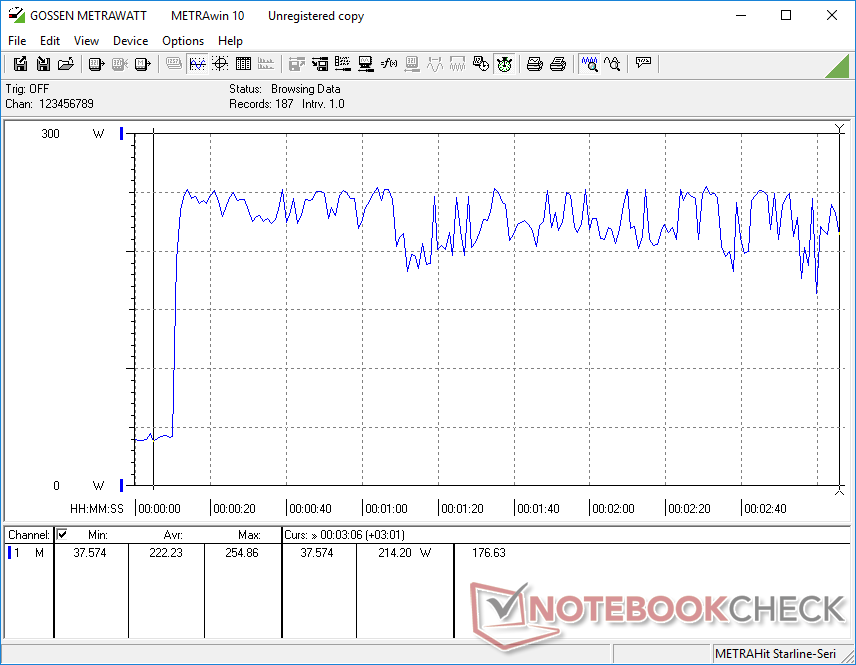
在静音模式和 iGPU 模式下,当设置为最低亮度时,台式机的空转功率可低至 8 瓦;而在超频模式和 dGPU 模式下,当设置为最高亮度时,空转功率可高达 40 瓦。如下一节所示,在不需要额外马力来延长电池寿命的情况下,你需要开启平衡模式和 iGPU 模式。
在玩游戏或运行 CPU 高负载时,总体功耗与我们在搭载 RTX 4060 的 m16 R1 上记录的功耗基本相同,每瓦性能略高。
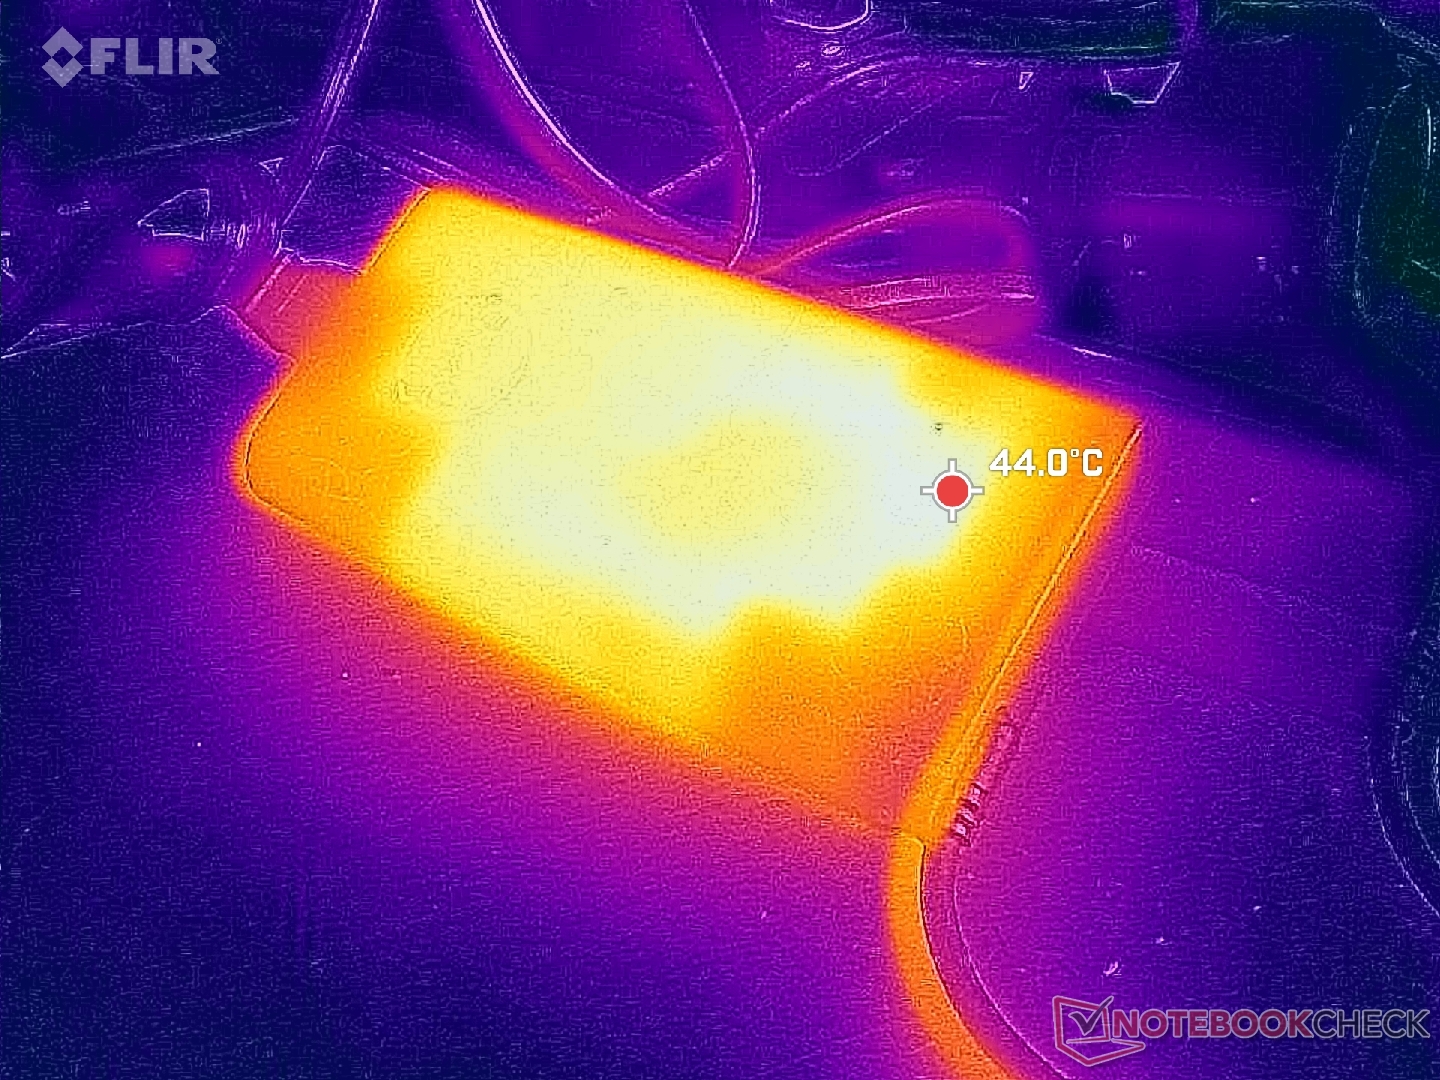
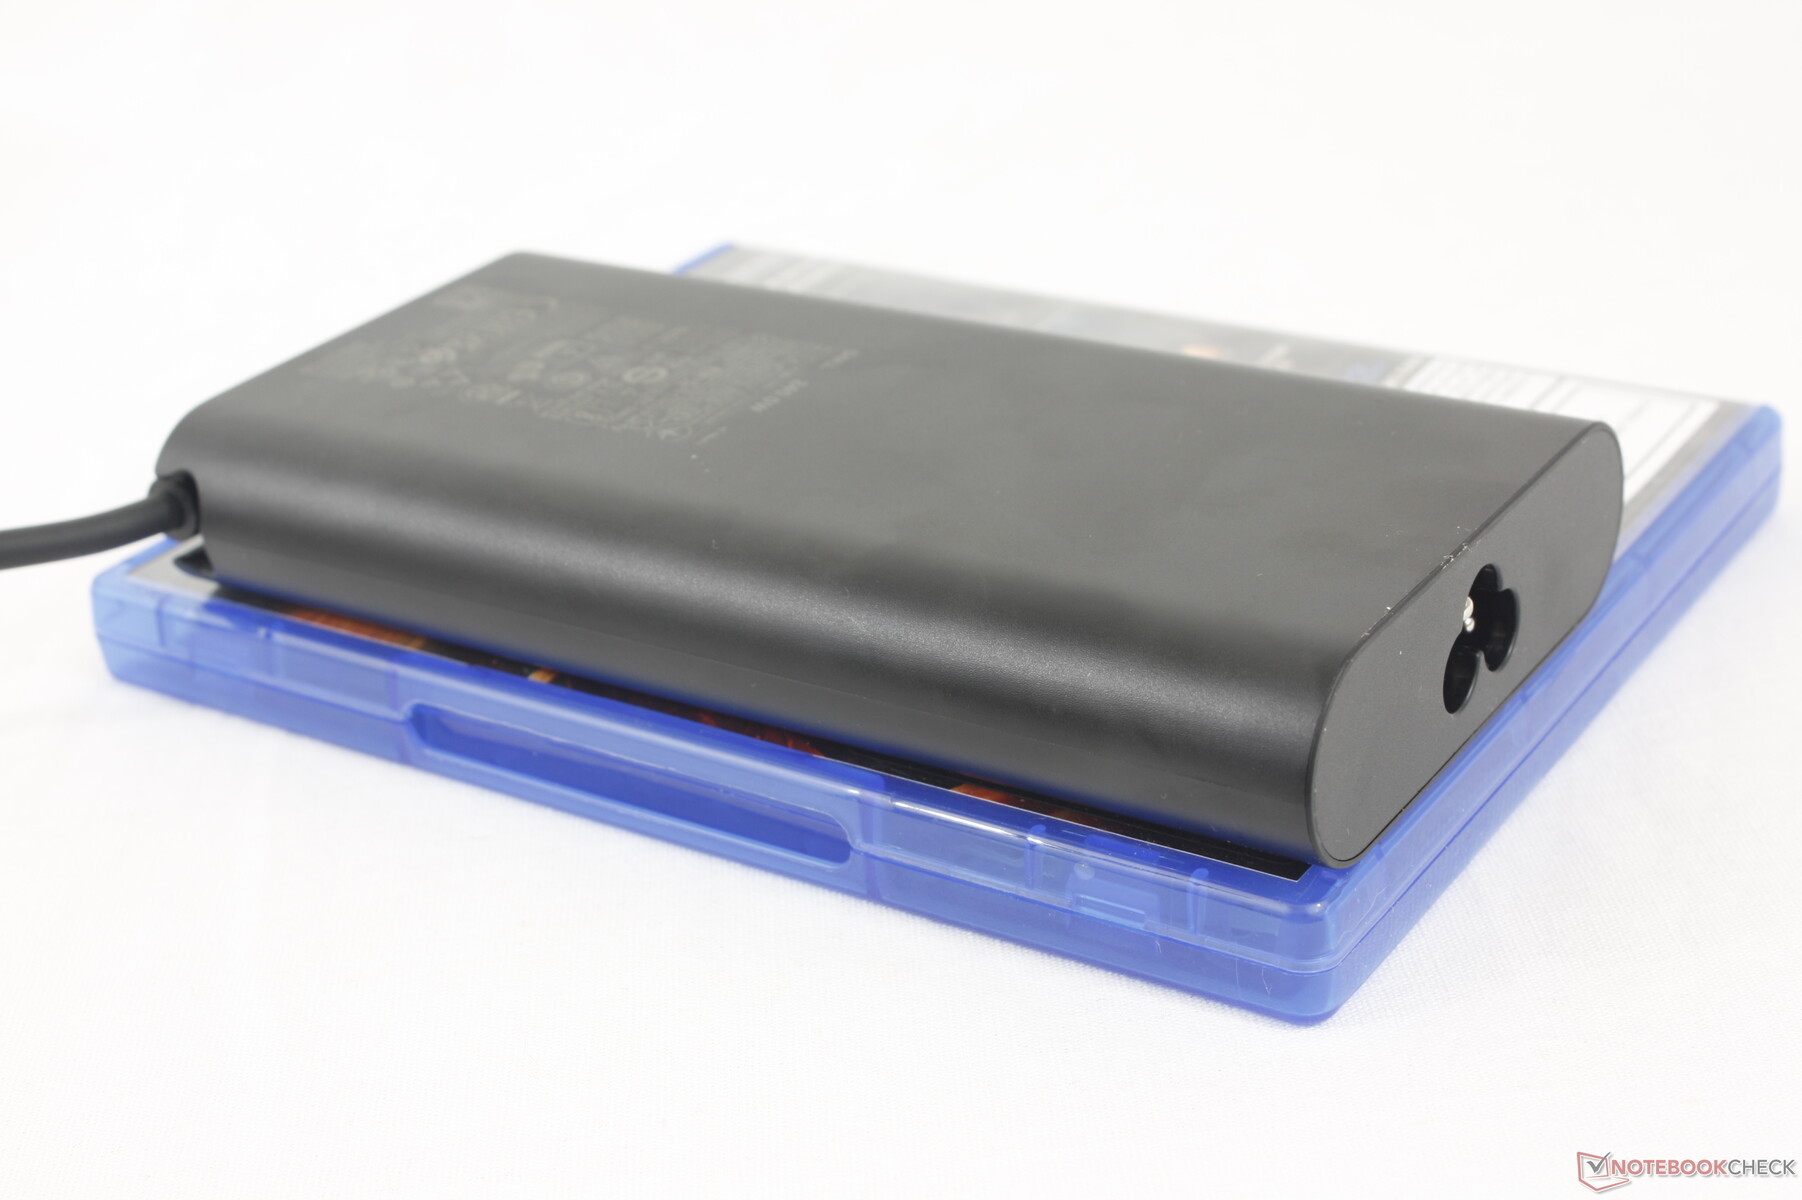
m16 R2 可配置小型(约 15.2 x 7.7 x 2.3 厘米)240 瓦 GaN 交流适配器,而 m16 R1 则配置较大(约 20 x 10 x 4.5 厘米)330 瓦适配器,以适应 RTX 4080 和 4090 配置。某些 SKU(如我们的产品)可能会配备 280 W AC 适配器。

| Off / Standby | |
| Idle | |
| Load |
|
Key:
min: | |
| Alienware m16 R2 Ultra 7 155H, GeForce RTX 4070 Laptop GPU, Samsung PM9A1 MZVL21T0HCLR, IPS, 2560x1600, 16" | Alienware m16 R1 Intel i7-13700HX, GeForce RTX 4060 Laptop GPU, Kioxia KXG70ZNV512G, IPS, 2560x1600, 16" | Alienware x16 R1 i9-13900HK, GeForce RTX 4080 Laptop GPU, SK hynix PC801 HFS001TEJ9X101N, IPS, 2560x1600, 16" | HP Omen Transcend 16-u1095ng i9-14900HX, GeForce RTX 4070 Laptop GPU, Kioxia XG8 KXG80ZNV1T02, OLED, 2560x1600, 16" | Asus ROG Zephyrus G16 2024 GU605M Ultra 7 155H, GeForce RTX 4070 Laptop GPU, WD PC SN560 SDDPNQE-1T00, OLED, 2560x1600, 16" | Lenovo Legion Slim 7 16APH8 R7 7840HS, GeForce RTX 4060 Laptop GPU, WDC PC SN810 1TB, IPS, 2560x1600, 16" | |
|---|---|---|---|---|---|---|
| Power Consumption | -10% | -77% | -13% | 24% | -67% | |
| Idle Minimum * (Watt) | 8.1 | 10 -23% | 25.2 -211% | 10 -23% | 8.3 -2% | 33 -307% |
| Idle Average * (Watt) | 13 | 14 -8% | 29.9 -130% | 18 -38% | 12.5 4% | 35 -169% |
| Idle Maximum * (Watt) | 40.3 | 21 48% | 49.8 -24% | 32 21% | 12.8 68% | 45 -12% |
| Load Average * (Watt) | 79 | 119 -51% | 105.4 -33% | 128 -62% | 71.3 10% | 59 25% |
| Witcher 3 ultra * (Watt) | 188.1 | 186.7 1% | 263 -40% | 148.4 21% | 127.5 32% | 131 30% |
| Load Maximum * (Watt) | 254.9 | 323 -27% | 313.8 -23% | 242 5% | 169.1 34% | 177 31% |
* ... smaller is better
Power Consumption Witcher 3 / Stresstest
Power Consumption external Monitor
电池寿命
尽管采用了更小的机身设计,但今年的电池容量实际上略有增加,达到了 90 Wh。此外,戴尔似乎还解决了我们在许多旧款 Alienware 笔记本电脑上遇到的电池续航问题;在平衡和 Optimus 模式下浏览网页的时间长达 8 小时,而 Alienware m16 R1 几乎只有它的一半。该系统甚至比最新的 华硕 ROG Zephyrus G16 GU605M将近一个小时。
从空电充至满电大约需要 90 分钟。另外,充至 85% 的电量也只需不到 40 分钟。该机型还可以通过普通的 USB-C 适配器充电,但速度要慢得多。
| Alienware m16 R2 Ultra 7 155H, GeForce RTX 4070 Laptop GPU, 90 Wh | Alienware m16 R1 Intel i7-13700HX, GeForce RTX 4060 Laptop GPU, 86 Wh | Alienware x16 R1 i9-13900HK, GeForce RTX 4080 Laptop GPU, 90 Wh | HP Omen Transcend 16-u1095ng i9-14900HX, GeForce RTX 4070 Laptop GPU, 97 Wh | Asus ROG Zephyrus G16 2024 GU605M Ultra 7 155H, GeForce RTX 4070 Laptop GPU, 90 Wh | Lenovo Legion Slim 7 16APH8 R7 7840HS, GeForce RTX 4060 Laptop GPU, 99.9 Wh | |
|---|---|---|---|---|---|---|
| Battery runtime | -30% | -47% | -40% | 5% | -12% | |
| Reader / Idle (h) | 12.6 | 6.4 -49% | 7.3 -42% | |||
| WiFi v1.3 (h) | 8.1 | 4.8 -41% | 2.5 -69% | 4.9 -40% | 7.3 -10% | 7.1 -12% |
| Load (h) | 1 | 1 0% | 0.7 -30% | 1.2 20% | ||
| H.264 (h) | 5.6 | 11.2 |
Pros
Cons
结论 - 在游戏和混合工作之间取得新平衡
Alienware m16 R2 有一个明确的目标:比 Alienware m16 R1 更小。 m16 R1即使这意味着要牺牲性能。该机型无疑比以前便携得多,但用户却因此失去了GeForce RTX 4080/4090 显卡、酷睿 HX CPU 和机械按键。戴尔希望通过去掉这些发烧级功能而采用更小巧的设计,更精简的 m16 R2 可以吸引更多的混合型工作者、学生和主流游戏玩家,他们可能已经跳过了更 "硬核"、更不适合旅行的 m16 R1 或 x16 R1.
最终的结果是,该系统在性能、电池寿命和便携性等各方面都取得了极佳的平衡,而 m16 R1 则以重量和运行时间为代价,几乎完全专注于性能。甚至连风扇的噪音水平和行为都有所改善,更适合在不需要额外马力的教室或办公室环境中使用。由于所有硬件和软件的改变,这绝对是我们测试过的最全面的 Alienware 笔记本电脑。
如果你满足于GeForce RTX 4060 或 4070 显卡,那么 Alienware m16 R2 很容易成为该系列中最好的全能选择。如果你需要更强大的性能,又想保持便携性,那么价格更高的 Blade 16 仍然是你的不二之选。
虽然 m16 R2 给人留下了深刻印象,并时常给人带来惊喜,但它在 16 英寸产品中仍面临着激烈的竞争。雷蛇 雷蛇刀锋 16为例,它仍然比 m16 R2 更轻、更小、更快,而且具有更深的 DCI-P3 色彩。华硕 华硕 ROG Zephyrus G16同样重量更轻、显示选项更多,但 GPU 性能略逊一筹。在这种情况下,戴尔将 Alienware m16 R2 定价为低于 Razer 和华硕系统。
价格和供应情况
戴尔现在出货的Alienware m16 R2起价为1650美元(RTX 4060)或1850美元以上(RTX 4070配置)。入门级 RTX 4050 配置的售价也为 1500 美元。
Alienware m16 R2
- 02/24/2024 v7 (old)
Allen Ngo
Transparency
The selection of devices to be reviewed is made by our editorial team. The test sample was provided to the author as a loan by the manufacturer or retailer for the purpose of this review. The lender had no influence on this review, nor did the manufacturer receive a copy of this review before publication. There was no obligation to publish this review. As an independent media company, Notebookcheck is not subjected to the authority of manufacturers, retailers or publishers.
This is how Notebookcheck is testing
Every year, Notebookcheck independently reviews hundreds of laptops and smartphones using standardized procedures to ensure that all results are comparable. We have continuously developed our test methods for around 20 years and set industry standards in the process. In our test labs, high-quality measuring equipment is utilized by experienced technicians and editors. These tests involve a multi-stage validation process. Our complex rating system is based on hundreds of well-founded measurements and benchmarks, which maintains objectivity. Further information on our test methods can be found here.
Price comparison

