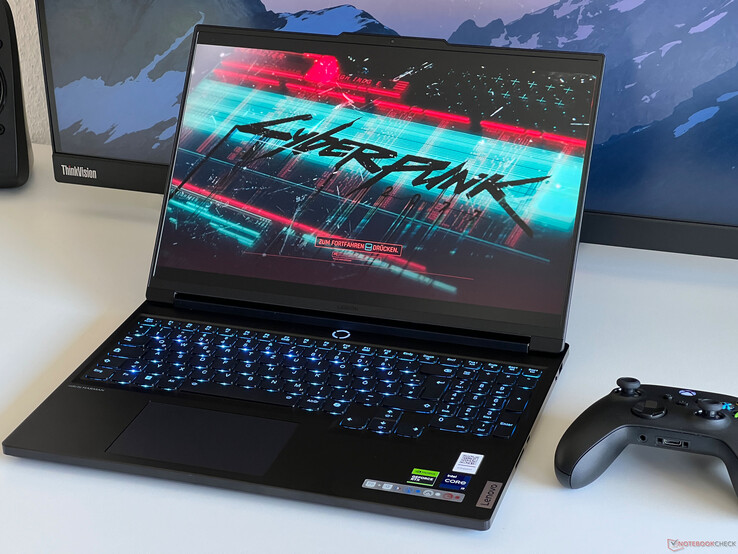
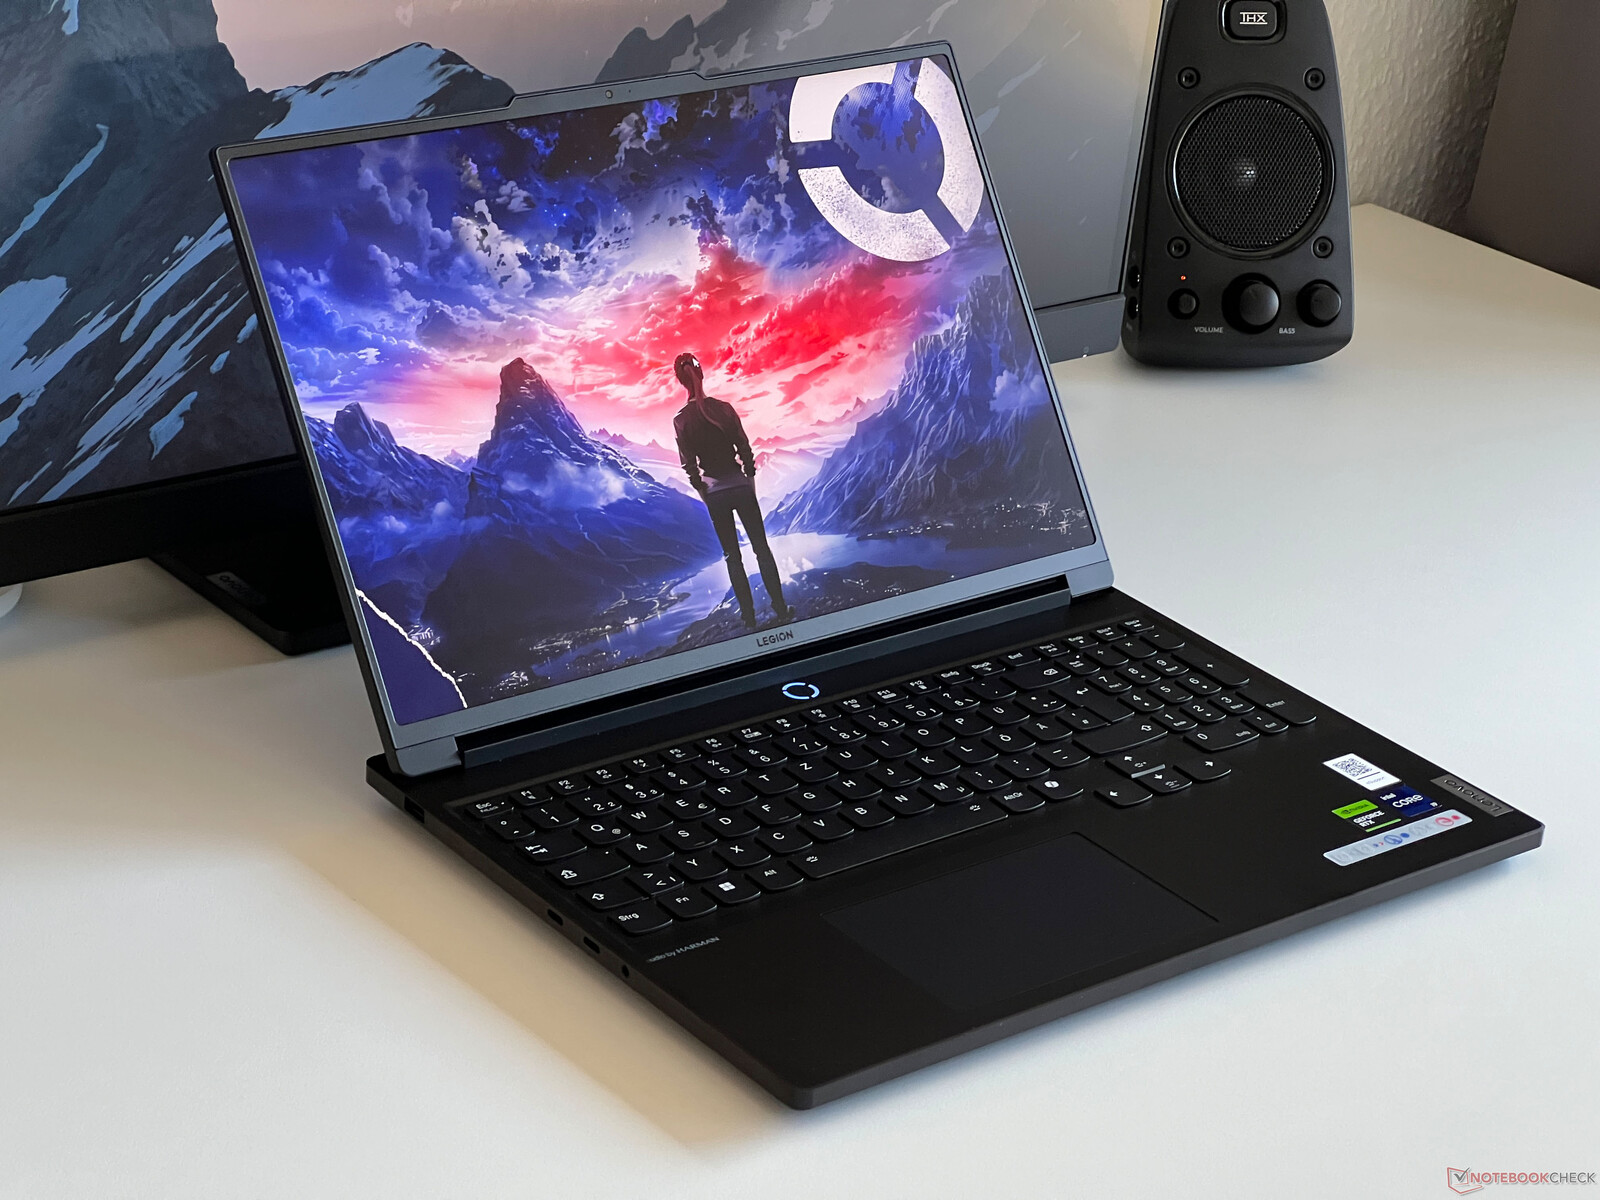
联想Legion 7 16 G9 笔记本电脑评测--配备 3.2K 显示屏、HX CPU 和超频 RTX 4070 的游戏本
Legion 7 16 是 Legion Pro 7 16 的我们最近才评测过它。两者之间存在差异,尤其是在显卡方面,普通Legion 7 的最大可用 GPU 为 RTX 4070 笔记本电脑。不过,在处理器方面,使用了相同的英特尔 HX 芯片,除了 WQHD 面板外,还可选配高分辨率、165 Hz 3.2K IPS 面板。
我们的评测设备是售价 2,249 美元的校园版,配备了 酷睿 i9-14900HXGeForce RTX 4070 笔记本电脑、32 GB 内存、1 TB 固态硬盘以及 3.2K 面板。目前,普通用户还没有相应的变体,但价格应该会高出 250-300 美元左右。
潜在的竞争对手比较
Rating | Date | Model | Weight | Height | Size | Resolution | Price |
|---|---|---|---|---|---|---|---|
| 90.8 % v7 (old) | 04 / 2024 | Lenovo Legion 7 16 IRX G9 i9-14900HX, GeForce RTX 4070 Laptop GPU | 2.3 kg | 19.8 mm | 16.00" | 3200x2000 | |
| 89.3 % v7 (old) | 04 / 2024 | Lenovo Legion Pro 5 16IRX9 i9-14900HX, GeForce RTX 4070 Laptop GPU | 2.5 kg | 26.95 mm | 16.00" | 2560x1600 | |
| 87.4 % v7 (old) | 04 / 2024 | Aorus 16X 2024 i9-14900HX, GeForce RTX 4070 Laptop GPU | 2.3 kg | 20 mm | 16.00" | 2560x1600 | |
| 88.4 % v7 (old) | 02 / 2024 | HP Omen Transcend 16-u1095ng i9-14900HX, GeForce RTX 4070 Laptop GPU | 2.3 kg | 20 mm | 16.00" | 2560x1600 | |
| 90.2 % v7 (old) | 03 / 2024 | Alienware m16 R2 Ultra 7 155H, GeForce RTX 4070 Laptop GPU | 2.5 kg | 23.5 mm | 16.00" | 2560x1600 | |
| 89.2 % v7 (old) | 10 / 2023 | Schenker XMG CORE 16 (L23) R7 7840HS, GeForce RTX 4070 Laptop GPU | 2.4 kg | 26.1 mm | 16.00" | 2560x1600 | |
| 89.5 % v7 (old) | 03 / 2024 | Lenovo Legion Pro 7 16IRX9H i9-14900HX, GeForce RTX 4080 Laptop GPU | 2.7 kg | 21.95 mm | 16.00" | 2560x1600 |
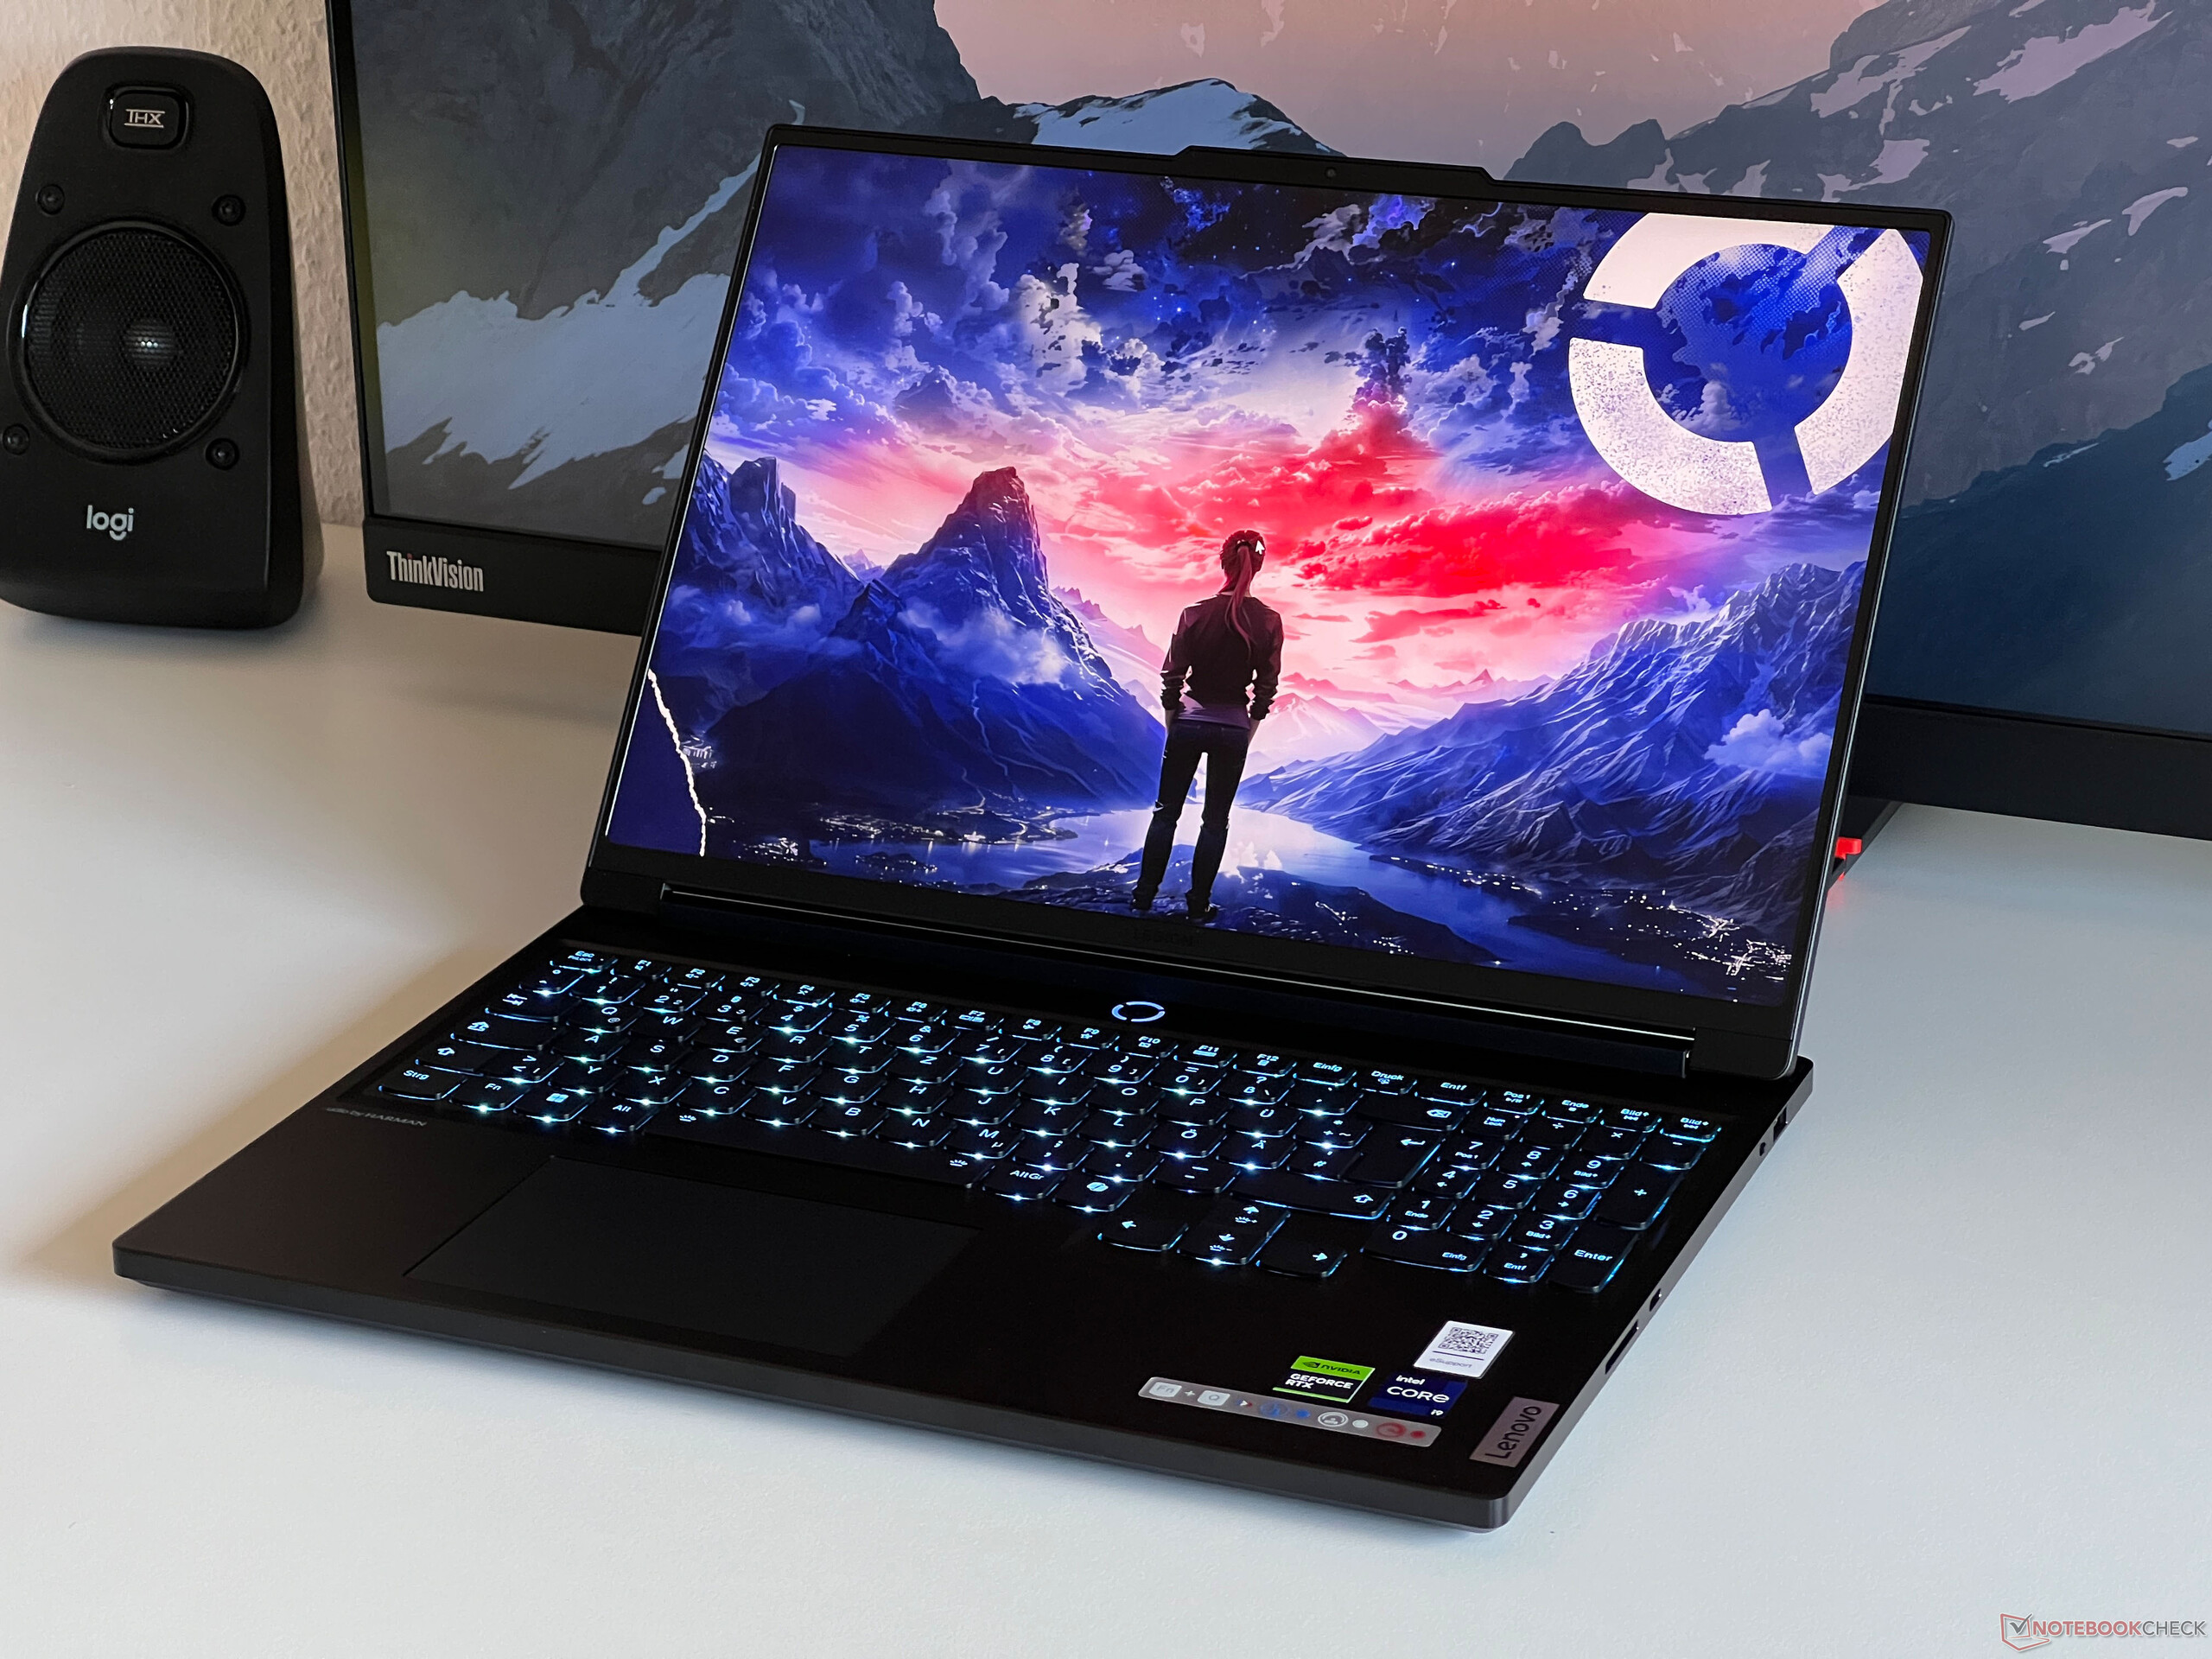
外壳 - 黑色铝质指纹磁铁
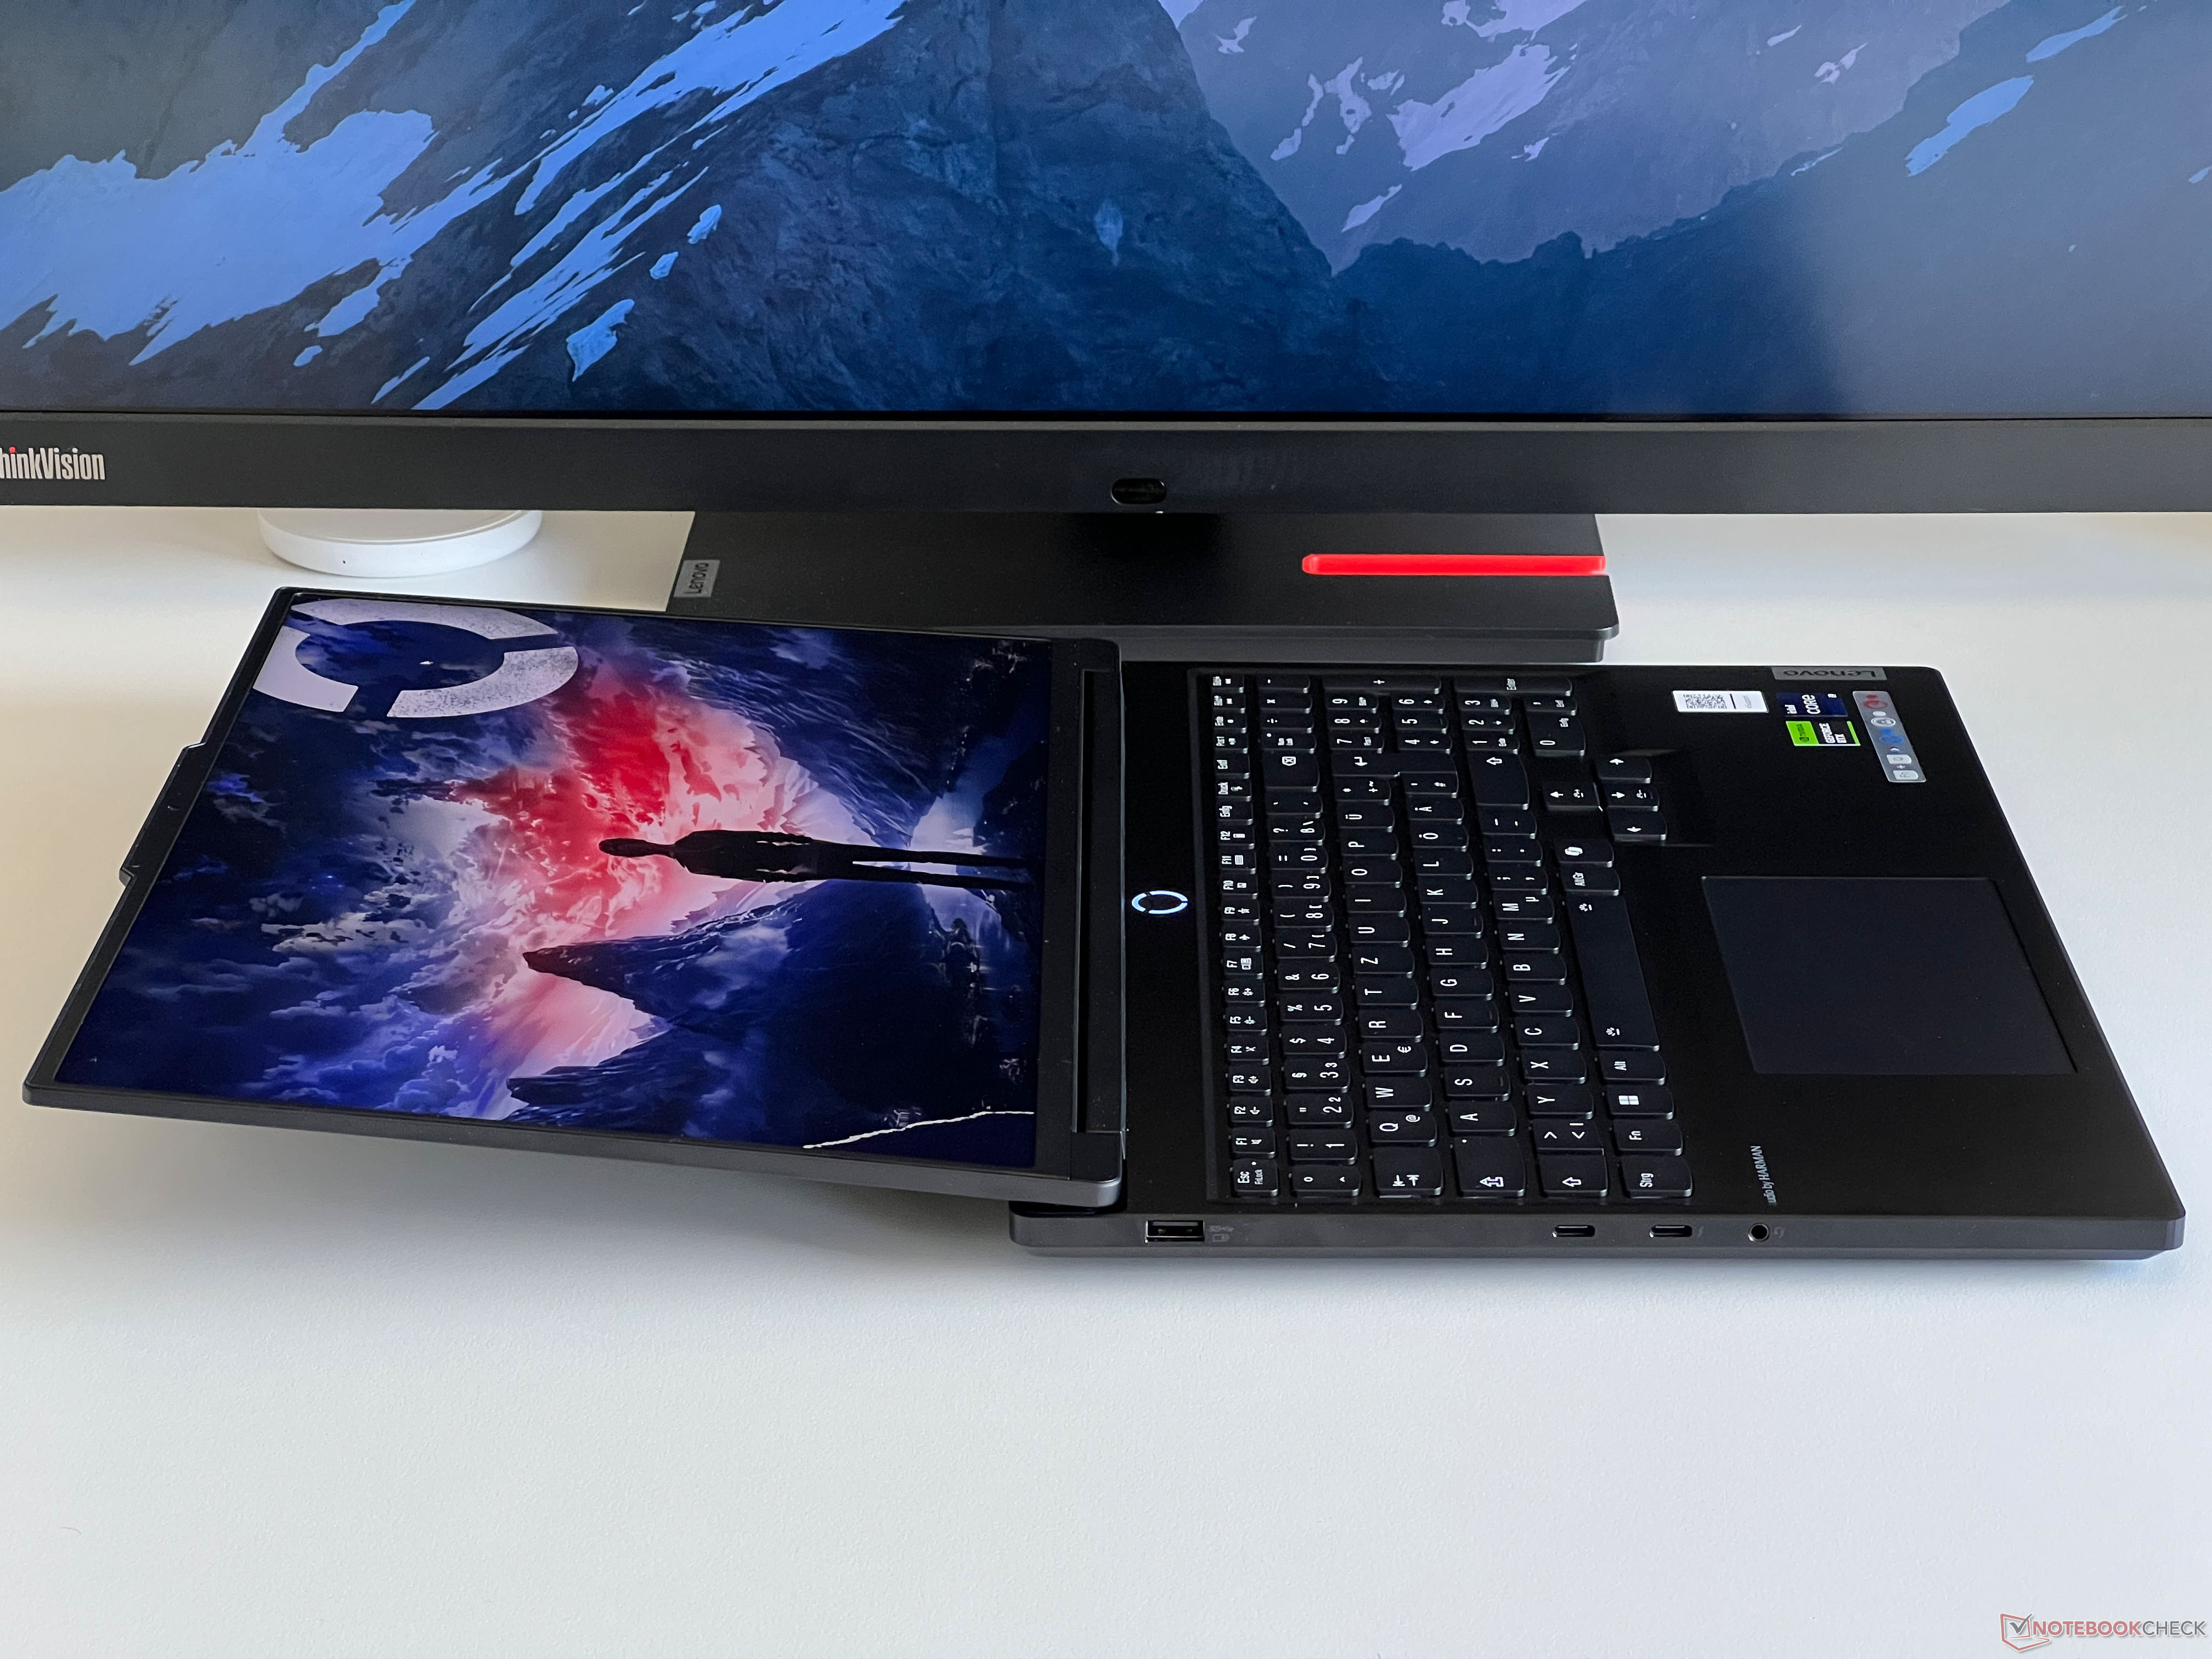
Legion 7 16 是一款相当轻薄的游戏笔记本电脑,由于采用了黑色铝制外壳,因此也显得非常低调。与Legion Pro 7 不同的是,它的侧面没有突出的散热元件。从外观上看,这款笔记本的外壳非常漂亮,但由于光滑的表面会神奇地吸附指纹,所以只能保持很短的时间。因此,你应该随时准备一块抹布来清洁保护壳。屏幕边框非常薄,只有摄像头的凸起破坏了外观,不过这确实方便了打开保护套。
保护套的稳定性和制造质量都非常好,我们无法听到任何嘎吱嘎吱的声音。此外,键盘在受力时几乎不可能弯曲。薄薄的显示屏盖子略微灵活一些,但我们也无法在这方面造成任何图像失真。就我们的口味而言,铰链可以再坚固一些,因为在调节打开角度(最大约 170 度)时会有明显的摇晃。
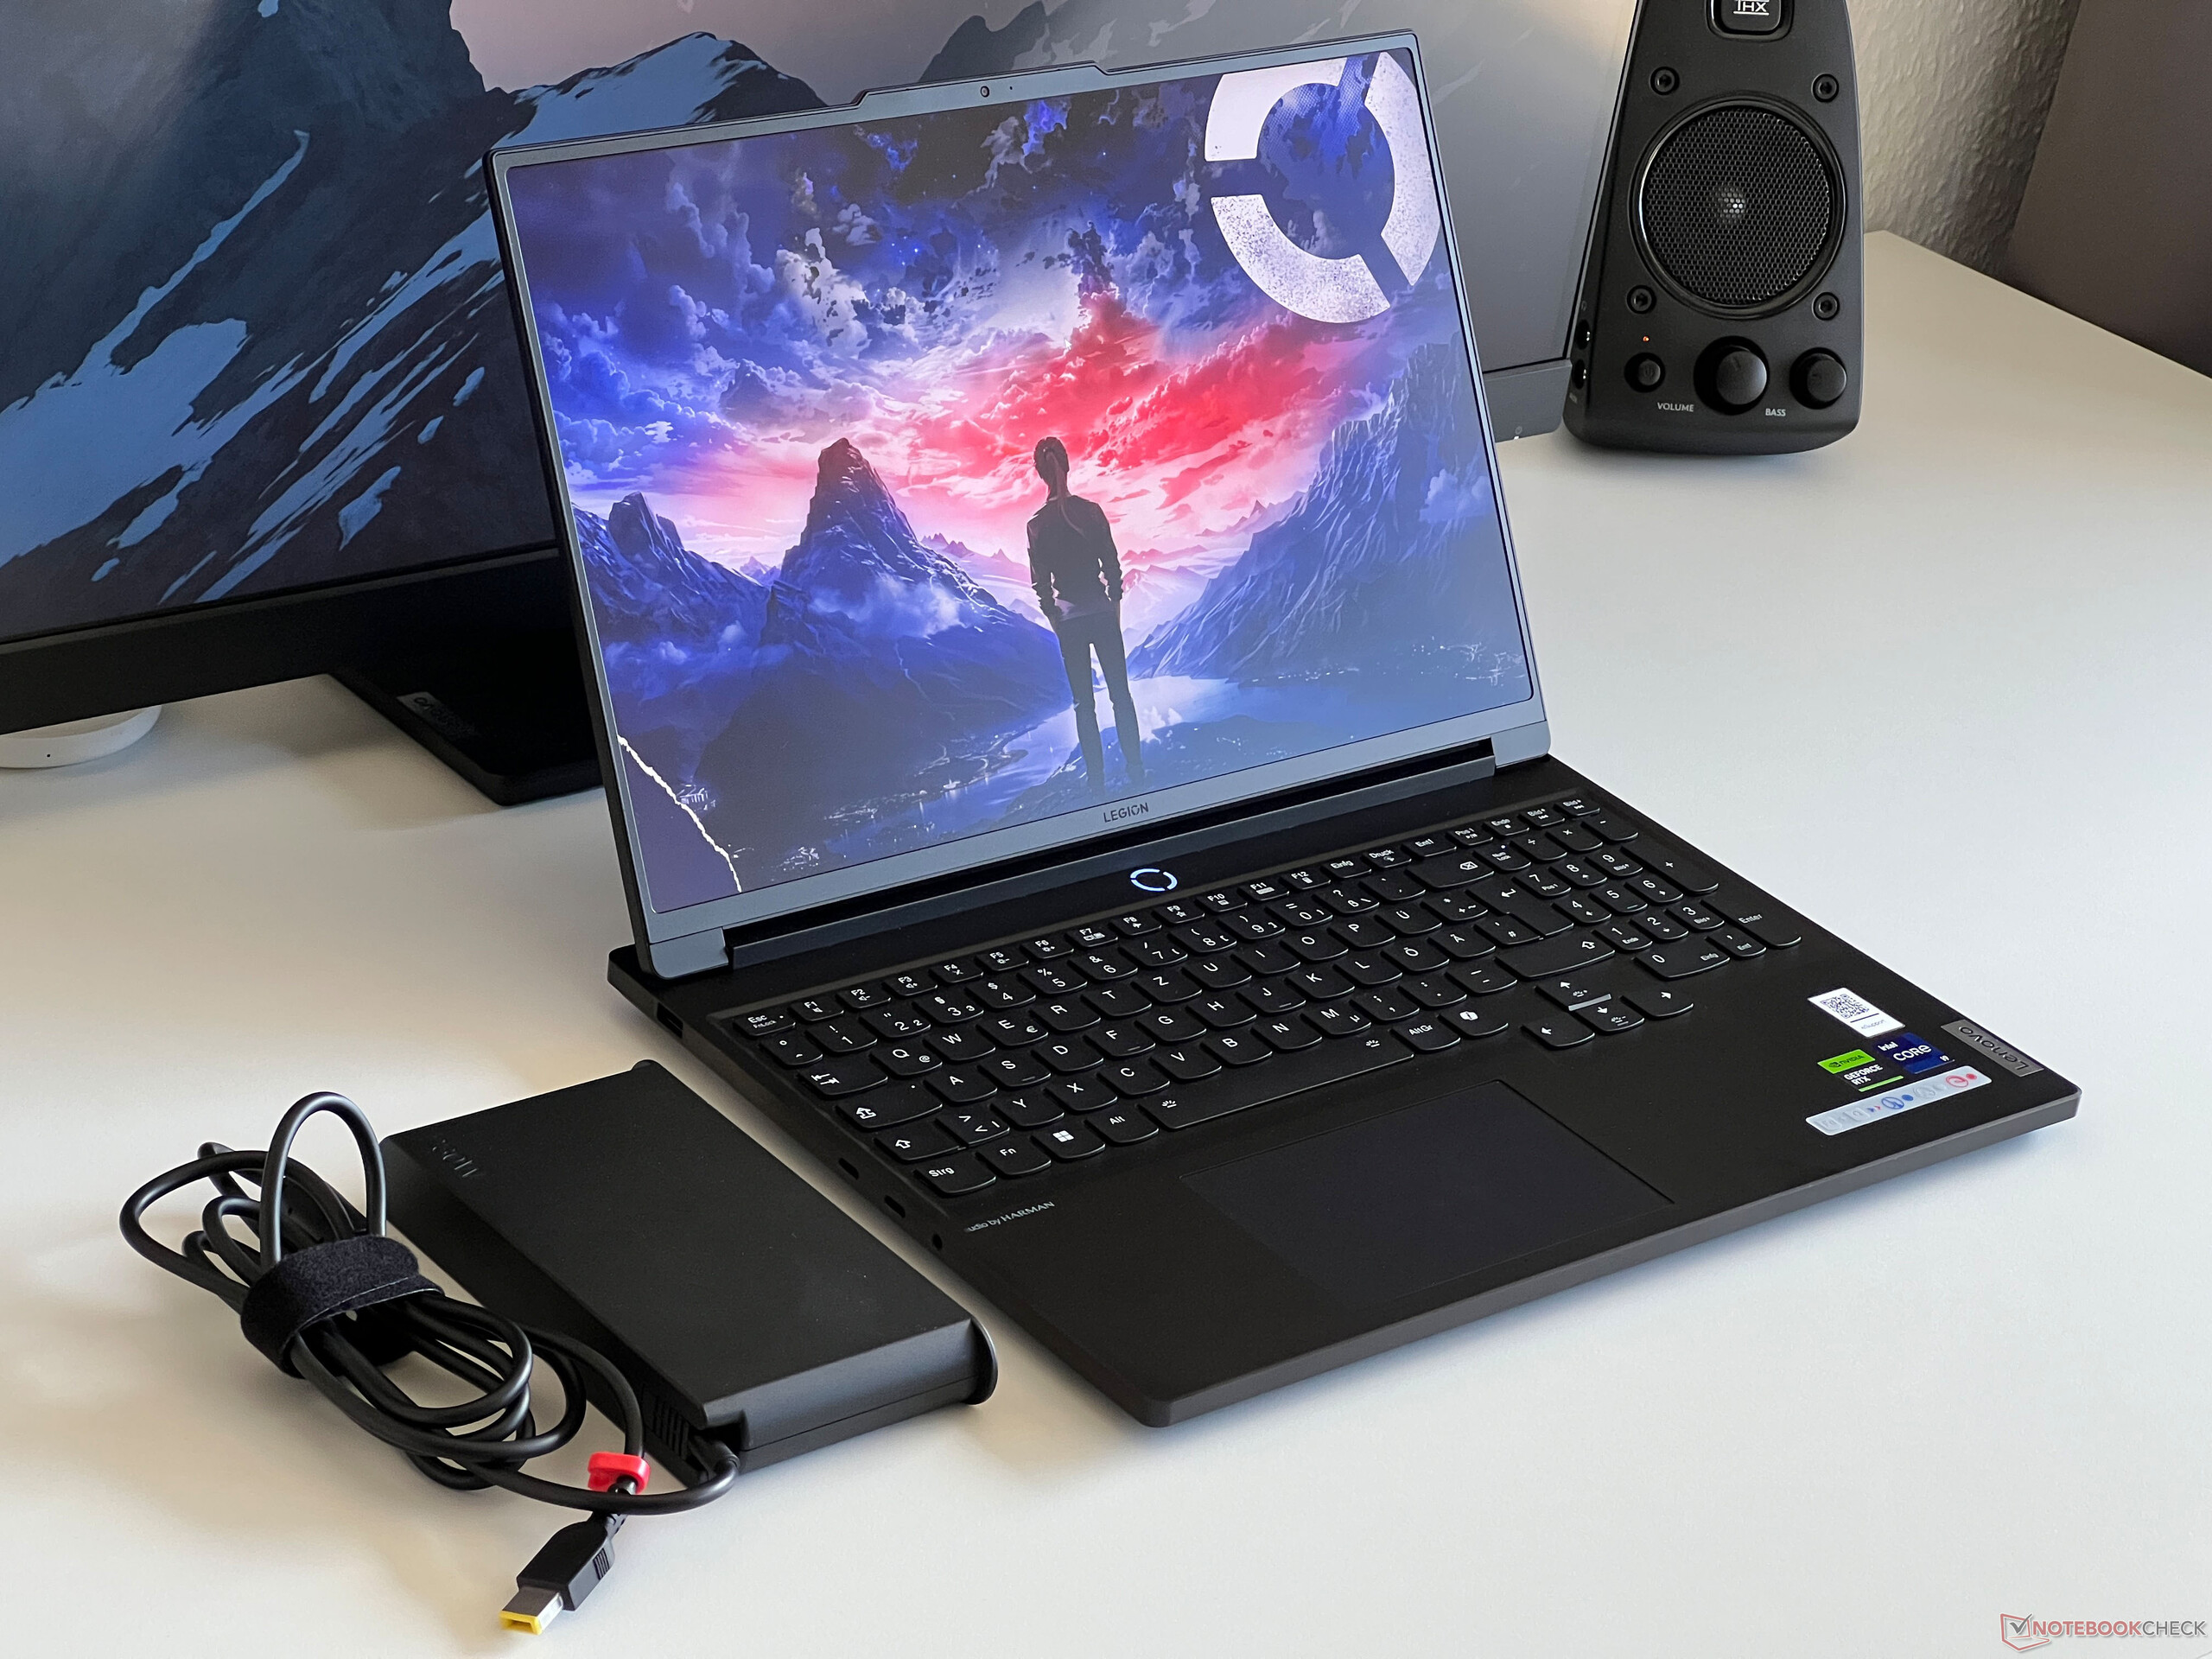
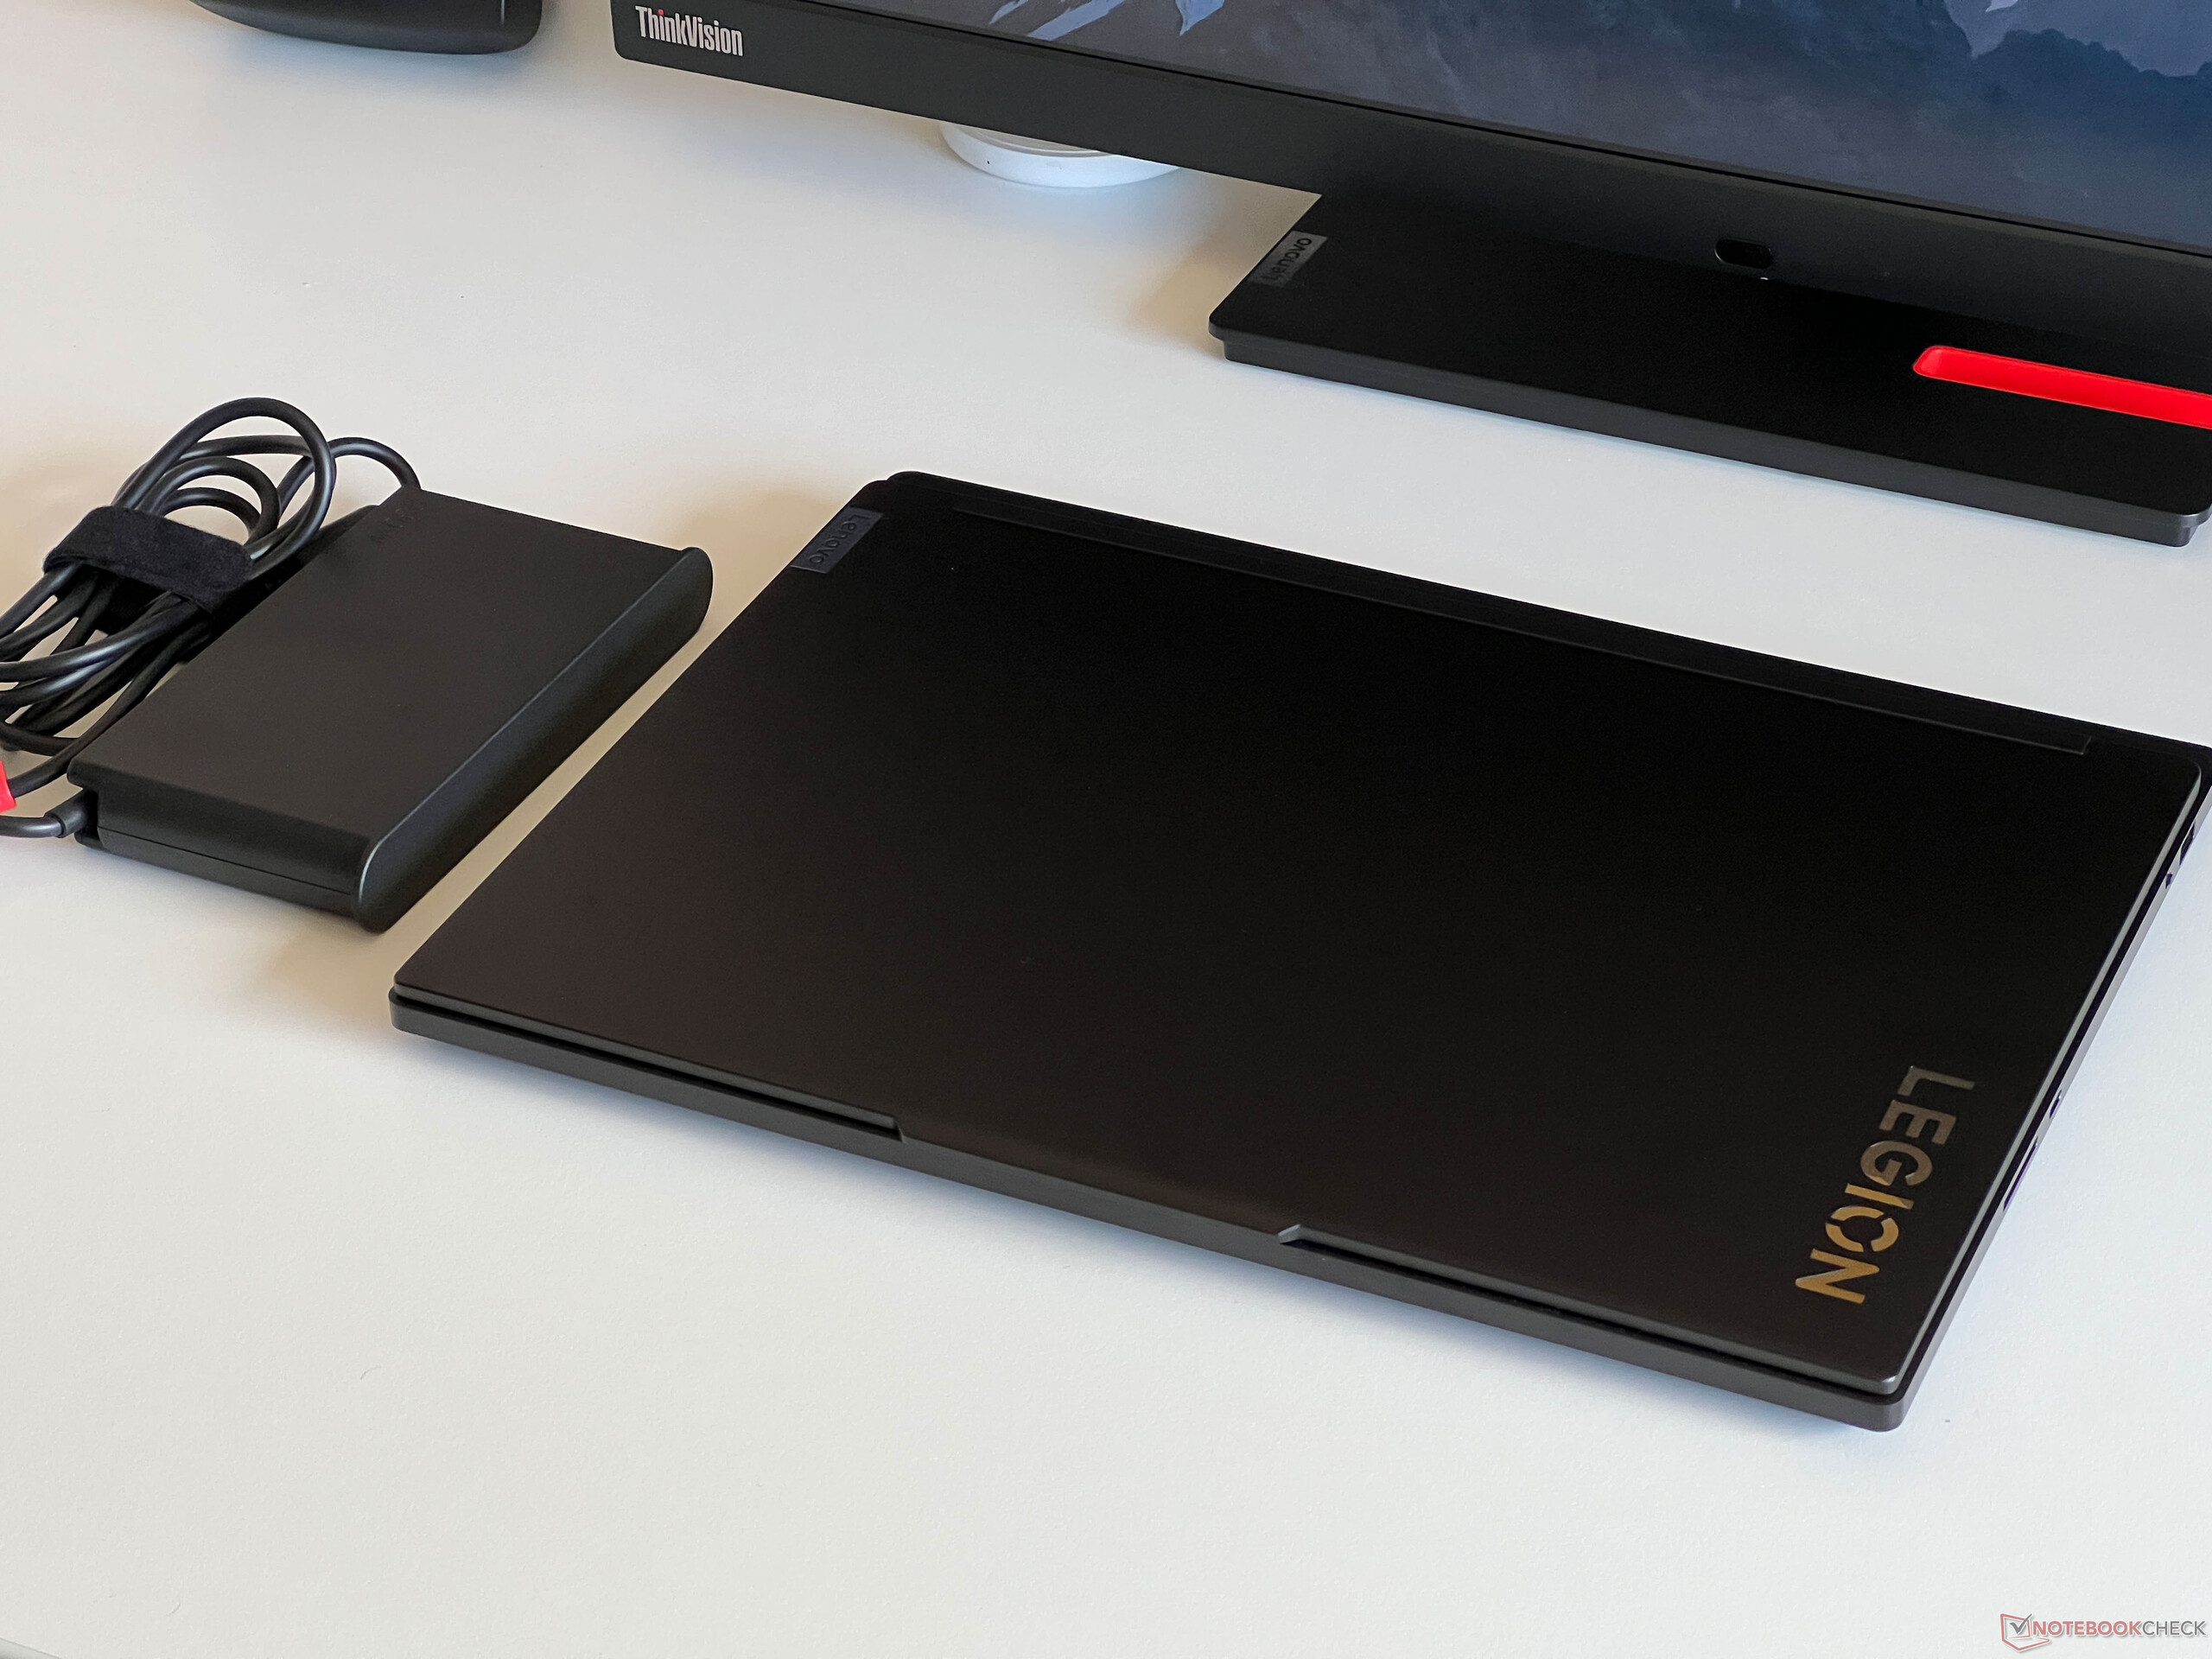
Legion 7 16 是我们对比组中最轻薄的设备之一,但就重量和整体占地面积而言,两者并无巨大差异。230 瓦 PSU 的重量为 948 克。
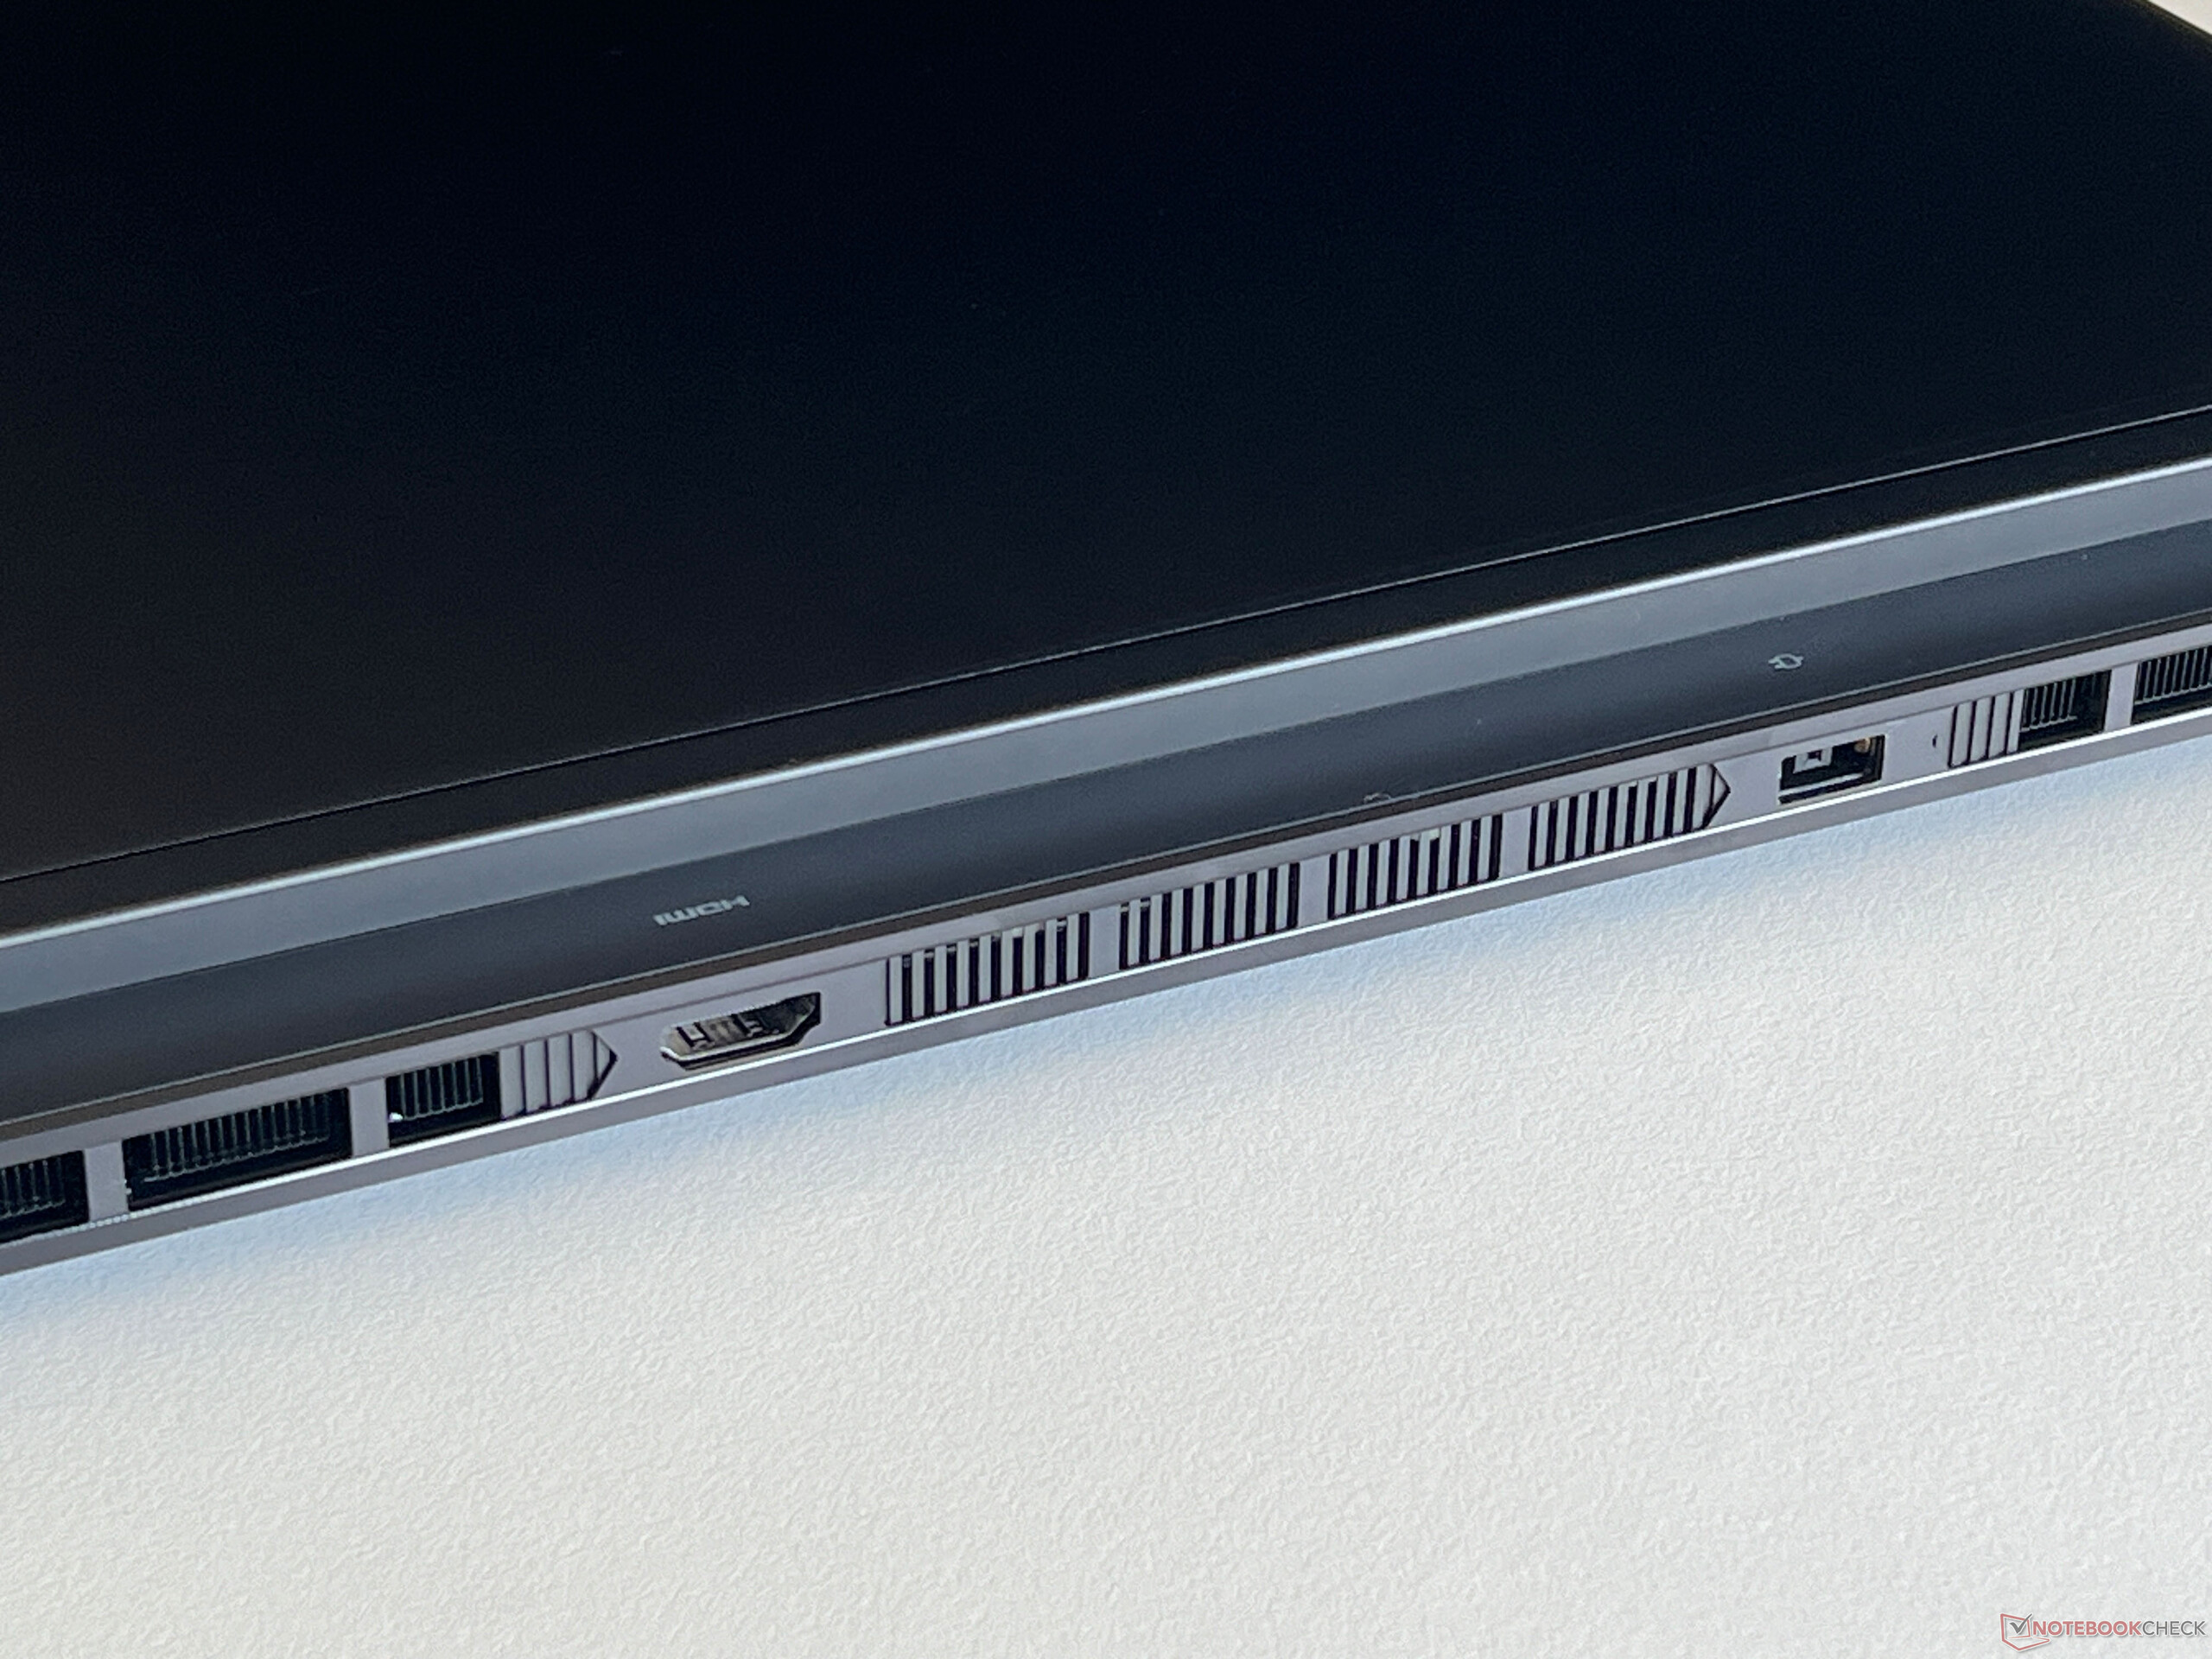
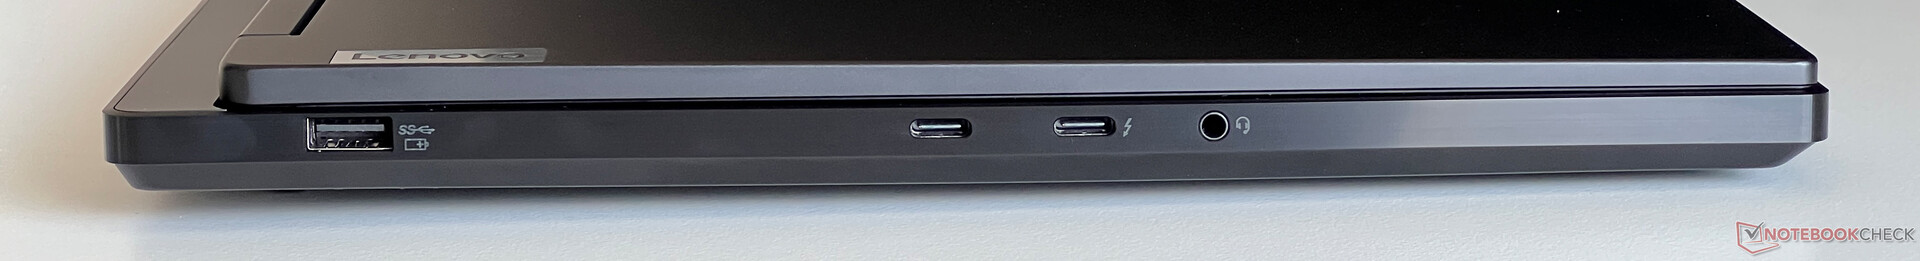
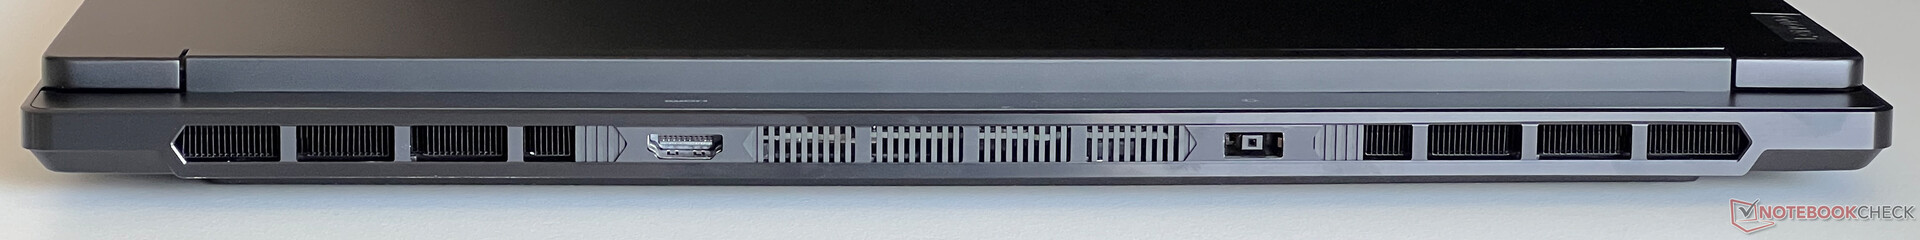
功能 - Thunderbolt,但没有以太网
端口分布在笔记本电脑的侧面和背面。在这方面,普通的Legion 7 要比昂贵的Legion Pro 7 好一些,因为散热口只位于背面。除了以太网端口外,所有重要的标准都在这里,这对于游戏玩家来说并不理想。Thunderbolt 端口通过 iGPU 连接,这意味着当你连接外部显示器时,Nvidia GPU 不必总是处于激活状态。所有其他视频输出都直接通过 dGPU 运行。
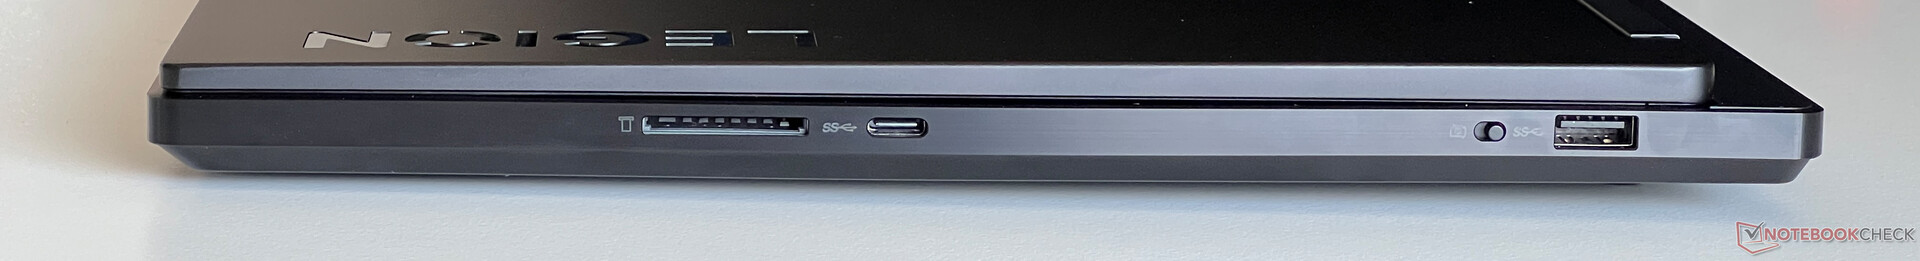
SD 读卡器
与我们的参考卡(Angelbird AV Pro V60)搭配使用时,右侧读卡器的平均传输速度可达 75-90 MB/s。不过,插入的卡明显突出于机壳。
| SD Card Reader | |
| average JPG Copy Test (av. of 3 runs) | |
| Aorus 16X 2024 (AV PRO microSD 128 GB V60) | |
| Average of class Gaming (20.9 - 210, n=54, last 2 years) | |
| Lenovo Legion 7 16 IRX G9 (Angelbird AV Pro V60) | |
| Alienware m16 R2 (AV PRO microSD 128 GB V60) | |
| Schenker XMG CORE 16 (L23) | |
| maximum AS SSD Seq Read Test (1GB) | |
| Alienware m16 R2 (AV PRO microSD 128 GB V60) | |
| Aorus 16X 2024 (AV PRO microSD 128 GB V60) | |
| Average of class Gaming (25.5 - 261, n=51, last 2 years) | |
| Lenovo Legion 7 16 IRX G9 (Angelbird AV Pro V60) | |
| Schenker XMG CORE 16 (L23) | |
交流
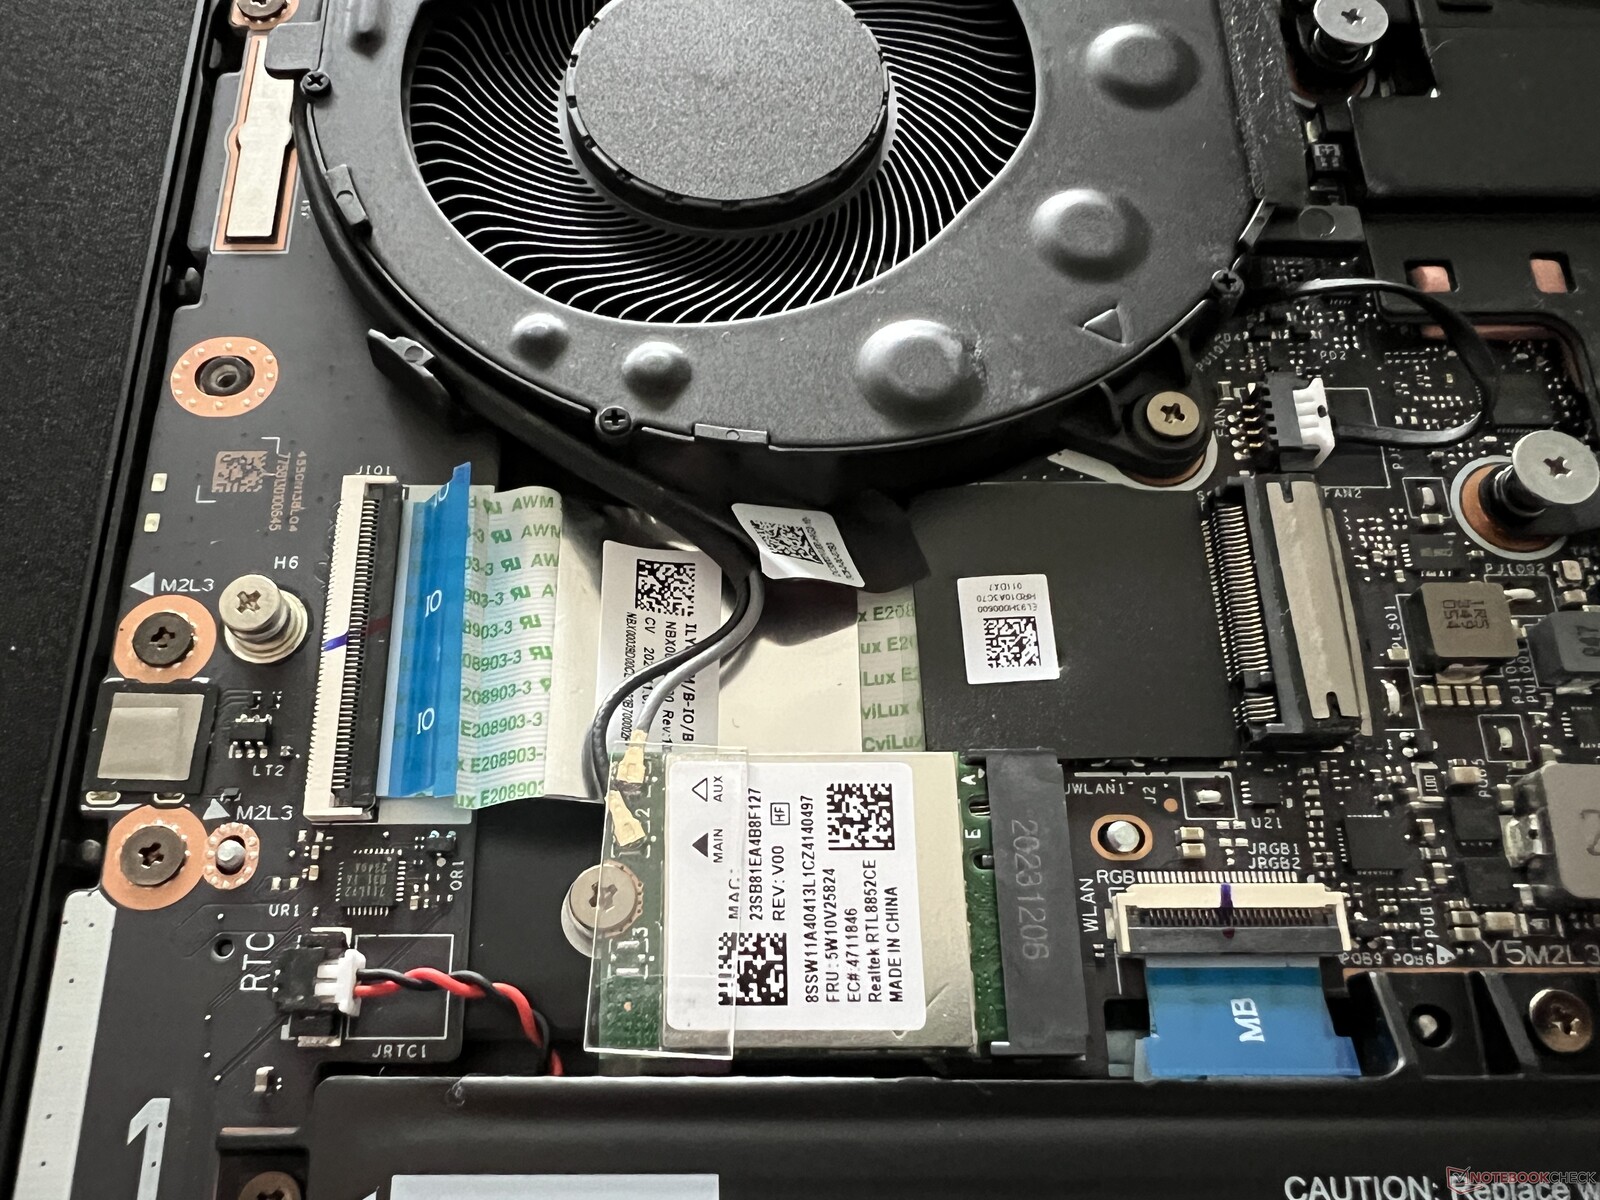
Legion 内安装了 Realtek Wi-Fi 6E 模块。该模块性能良好,与我们的华硕参考路由器配合使用,传输速度高且稳定。该笔记本支持蓝牙 5.1,但没有以太网端口。
| Networking | |
| Lenovo Legion 7 16 IRX G9 | |
| iperf3 transmit AXE11000 | |
| iperf3 receive AXE11000 | |
| Lenovo Legion Pro 5 16IRX9 | |
| iperf3 transmit AXE11000 | |
| iperf3 receive AXE11000 | |
| iperf3 transmit AXE11000 6GHz | |
| iperf3 receive AXE11000 6GHz | |
| Aorus 16X 2024 | |
| iperf3 transmit AXE11000 | |
| iperf3 receive AXE11000 | |
| HP Omen Transcend 16-u1095ng | |
| iperf3 transmit AXE11000 | |
| iperf3 receive AXE11000 | |
| Alienware m16 R2 | |
| iperf3 transmit AXE11000 | |
| iperf3 receive AXE11000 | |
| iperf3 transmit AXE11000 6GHz | |
| iperf3 receive AXE11000 6GHz | |
| Schenker XMG CORE 16 (L23) | |
| iperf3 transmit AXE11000 | |
| iperf3 receive AXE11000 | |
| Lenovo Legion Pro 7 16IRX9H | |
| iperf3 transmit AXE11000 | |
| iperf3 receive AXE11000 | |
网络摄像头
1080p 网络摄像头位于屏幕上边框内,提供一个电子快门(开关在右侧),但即使在光线良好的条件下,它也只能捕捉到一般的图像。与目前的 Meteor Lake 设备不同,该网络摄像头不支持 Windows Studio Effects。


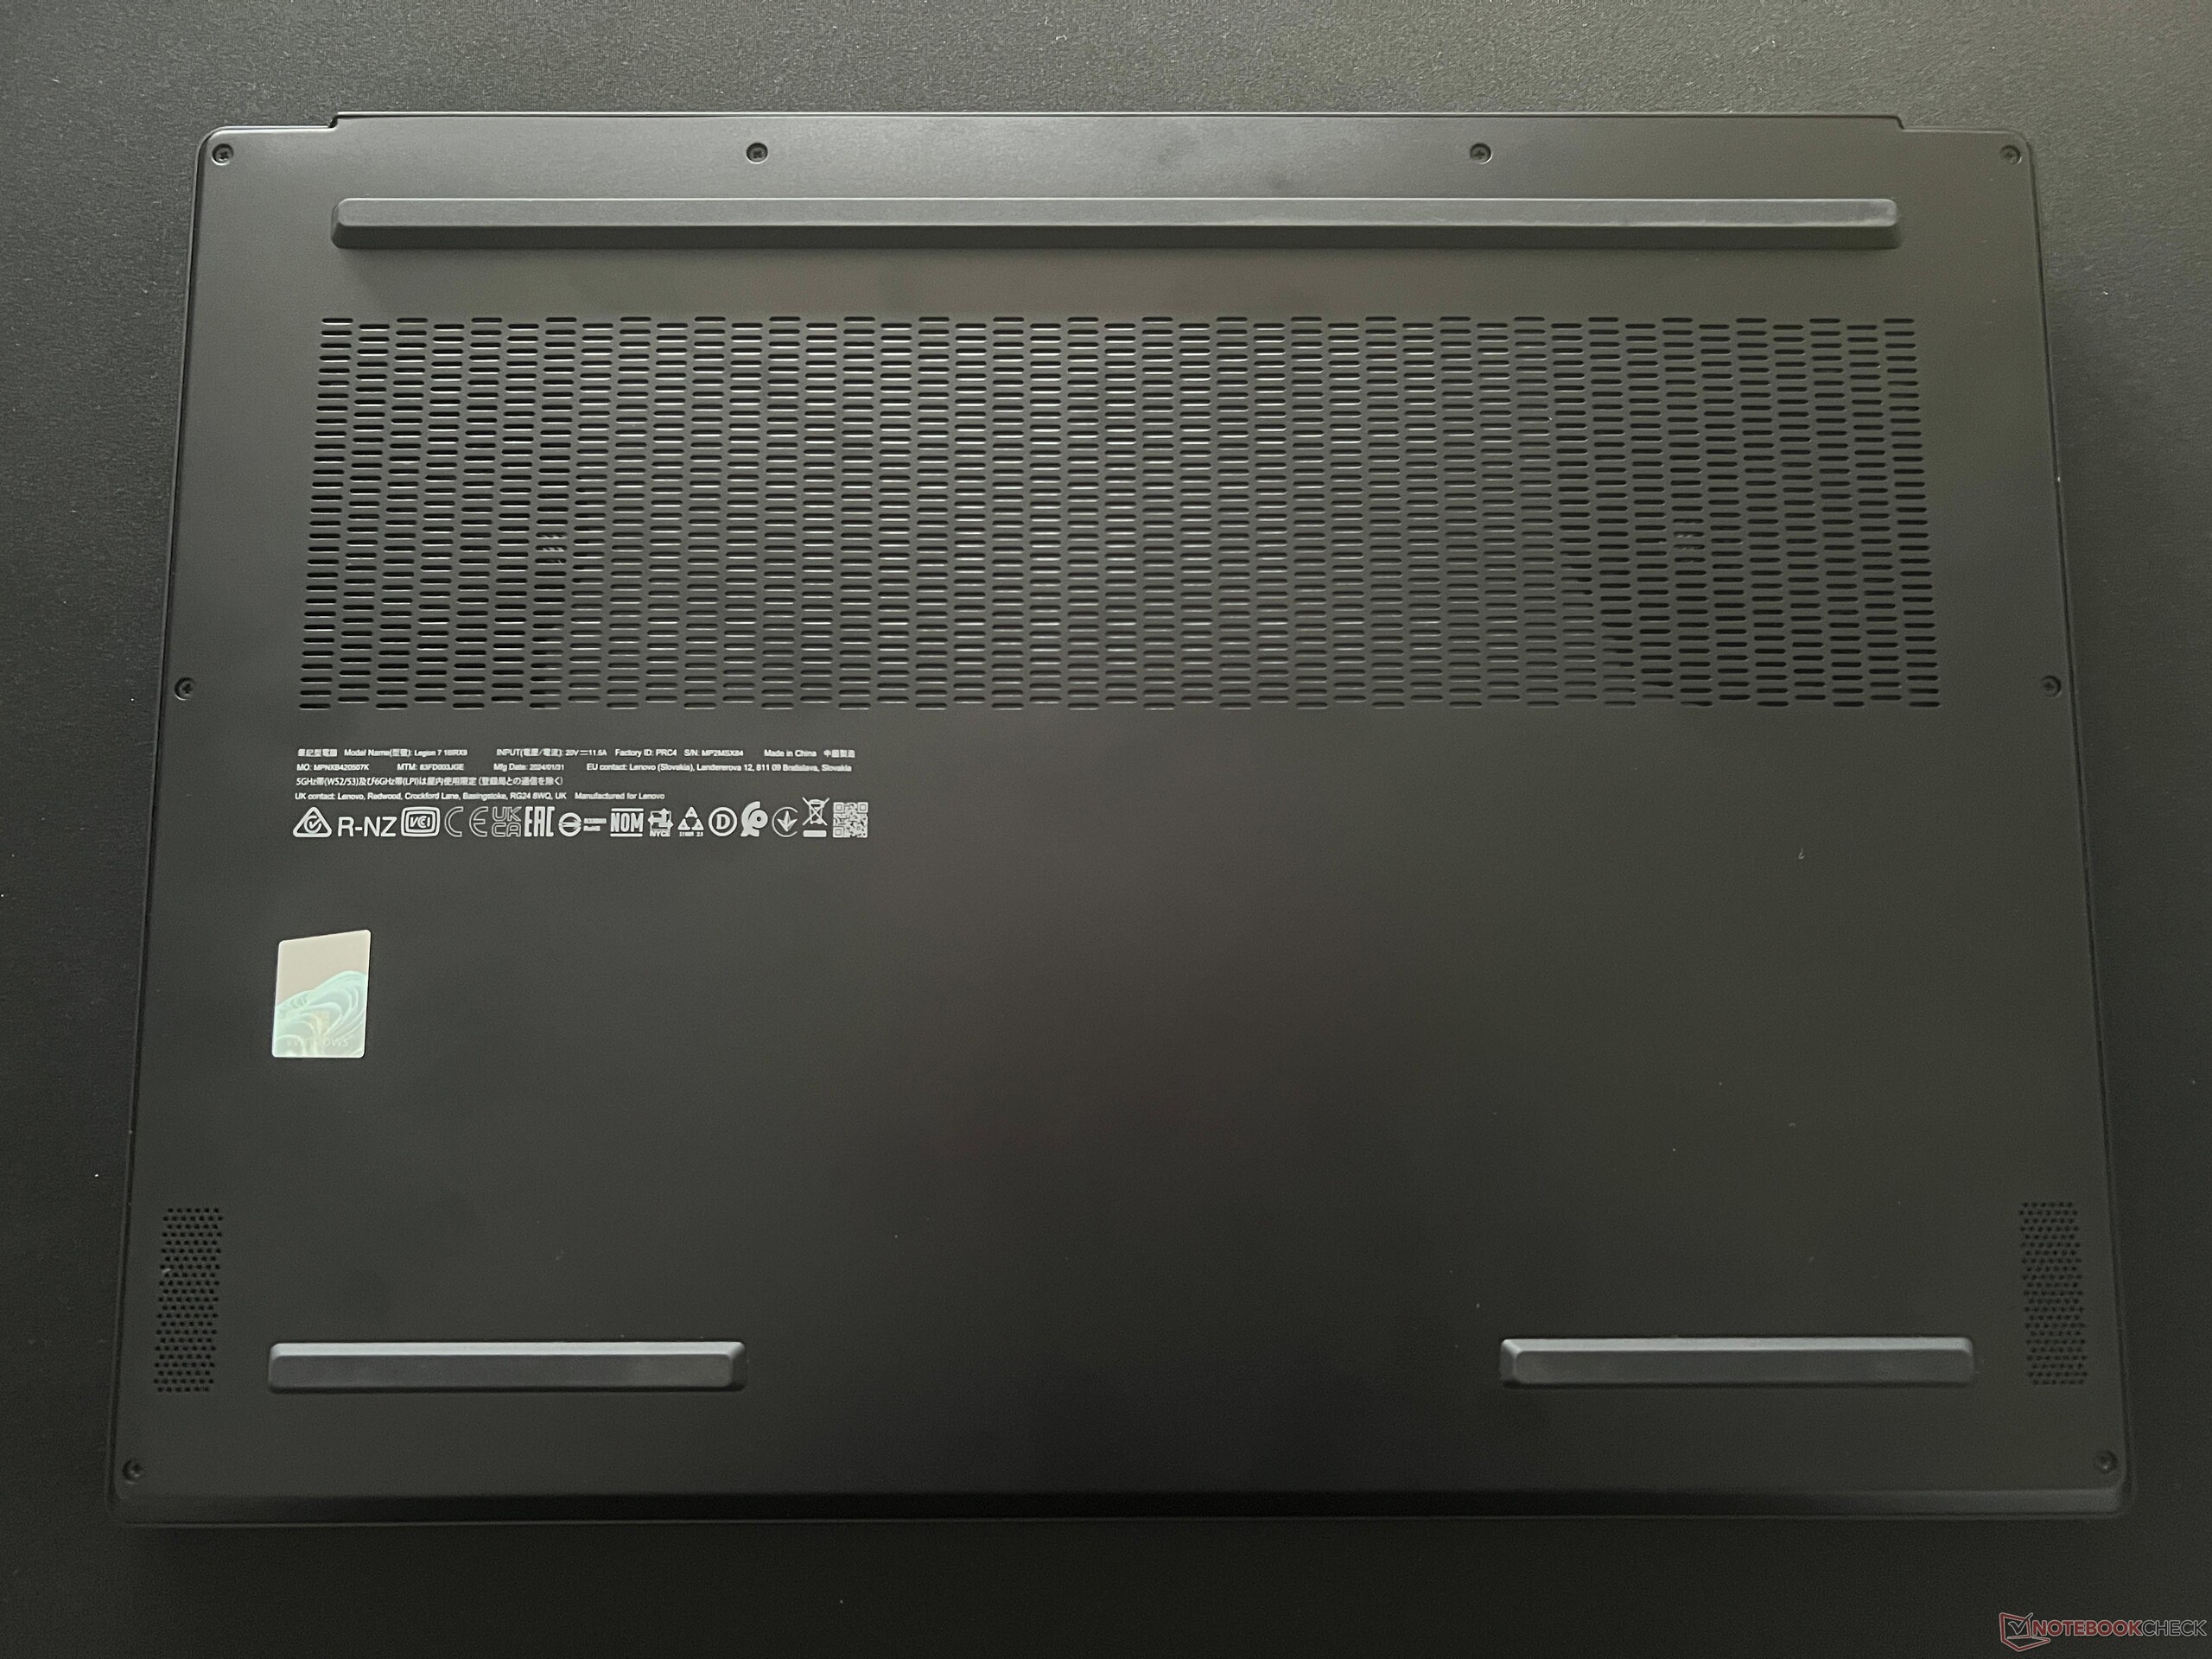
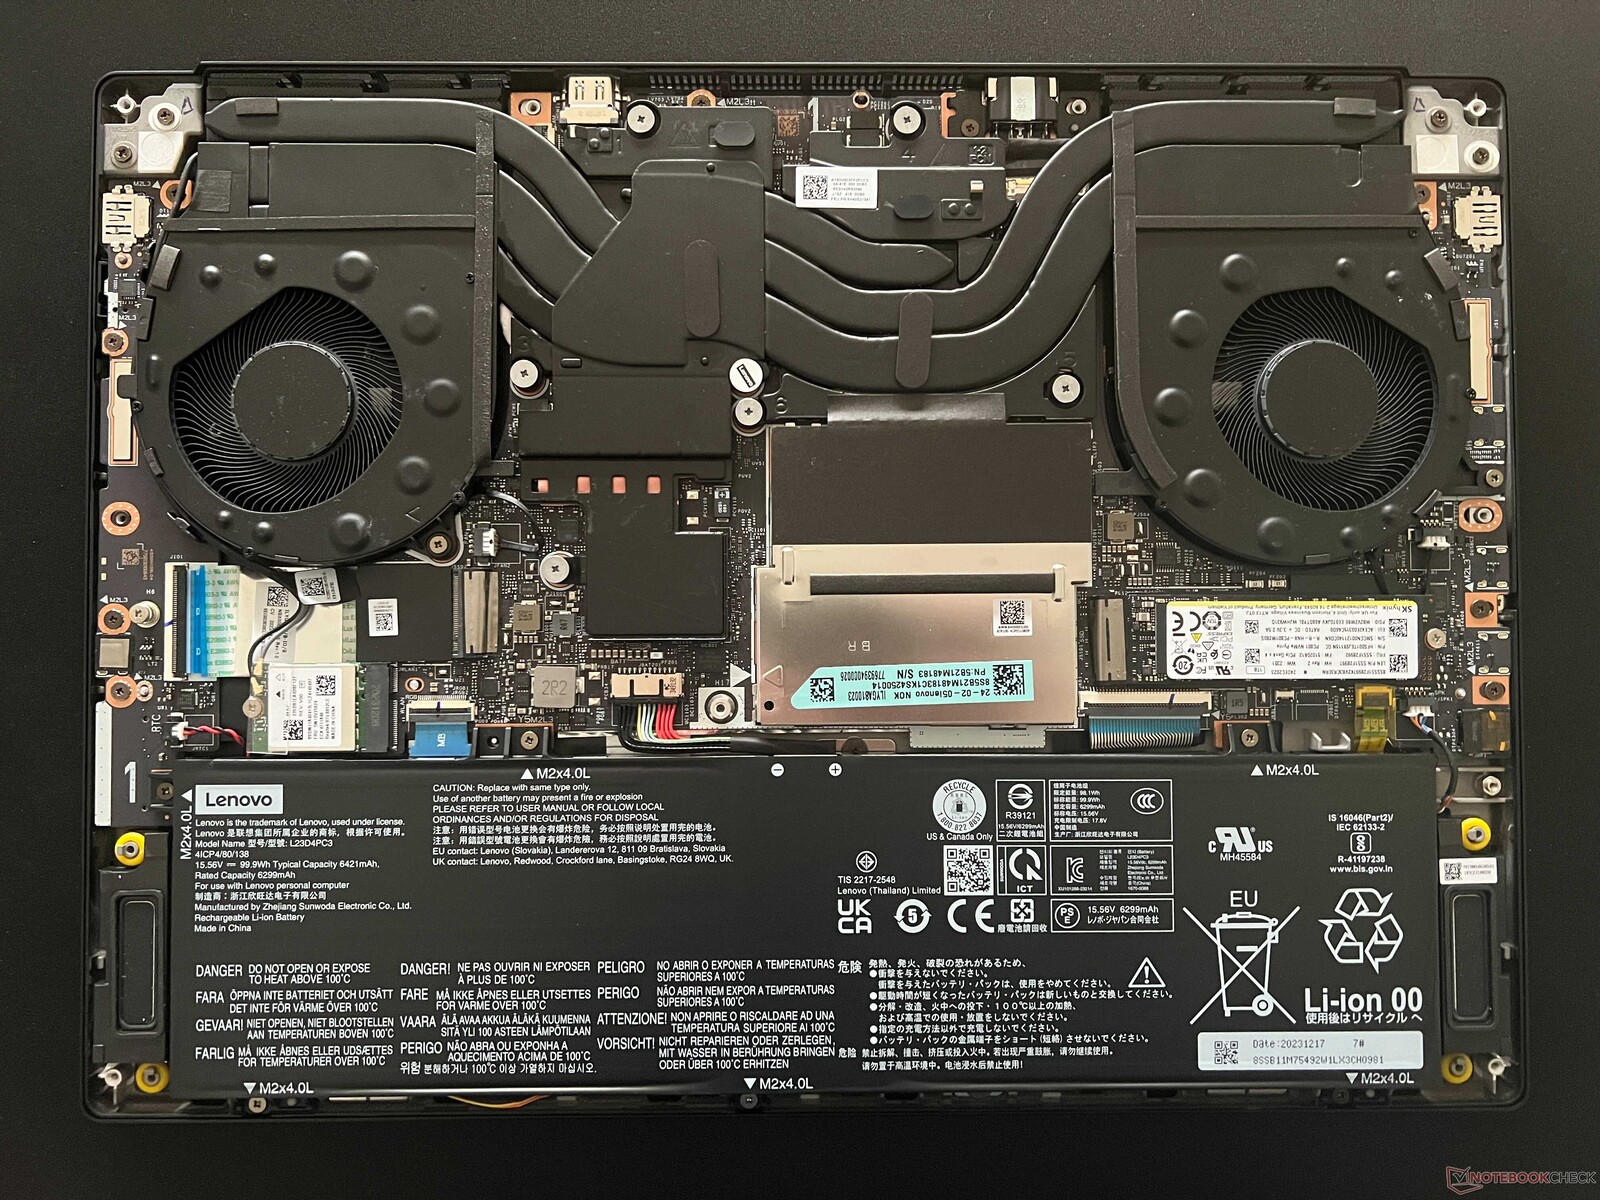
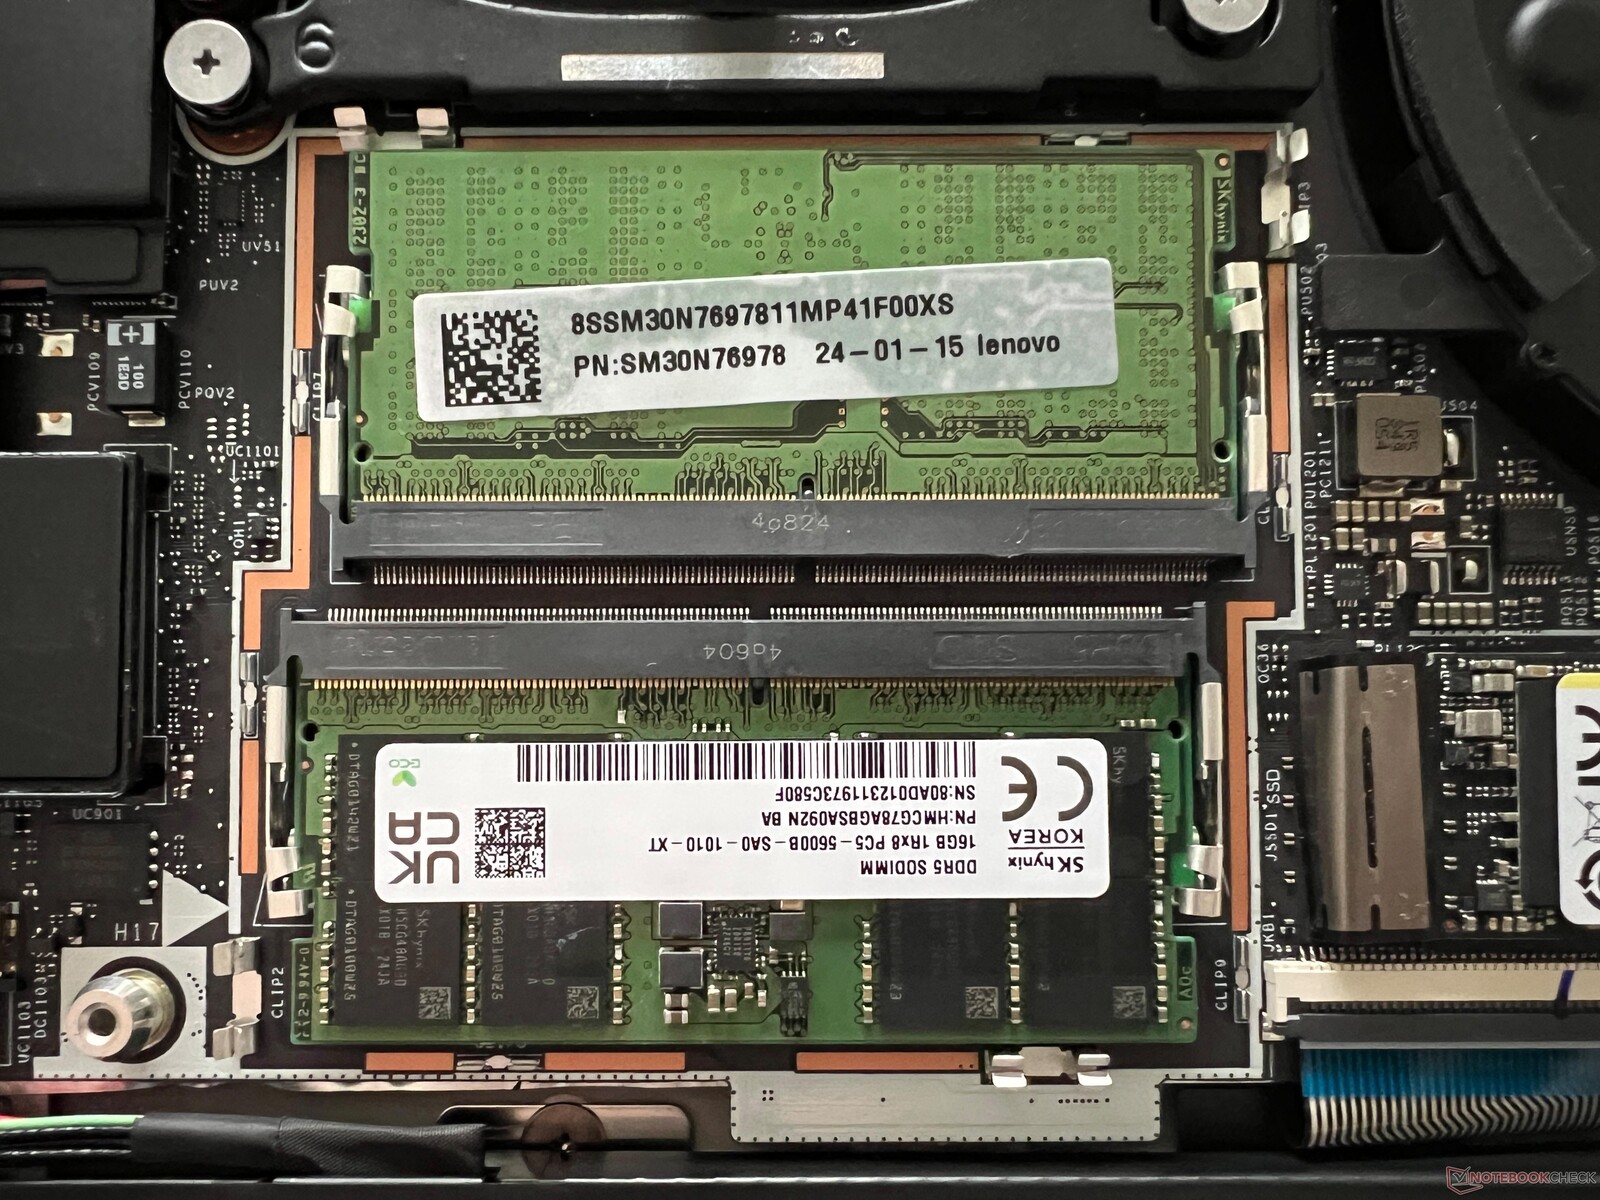
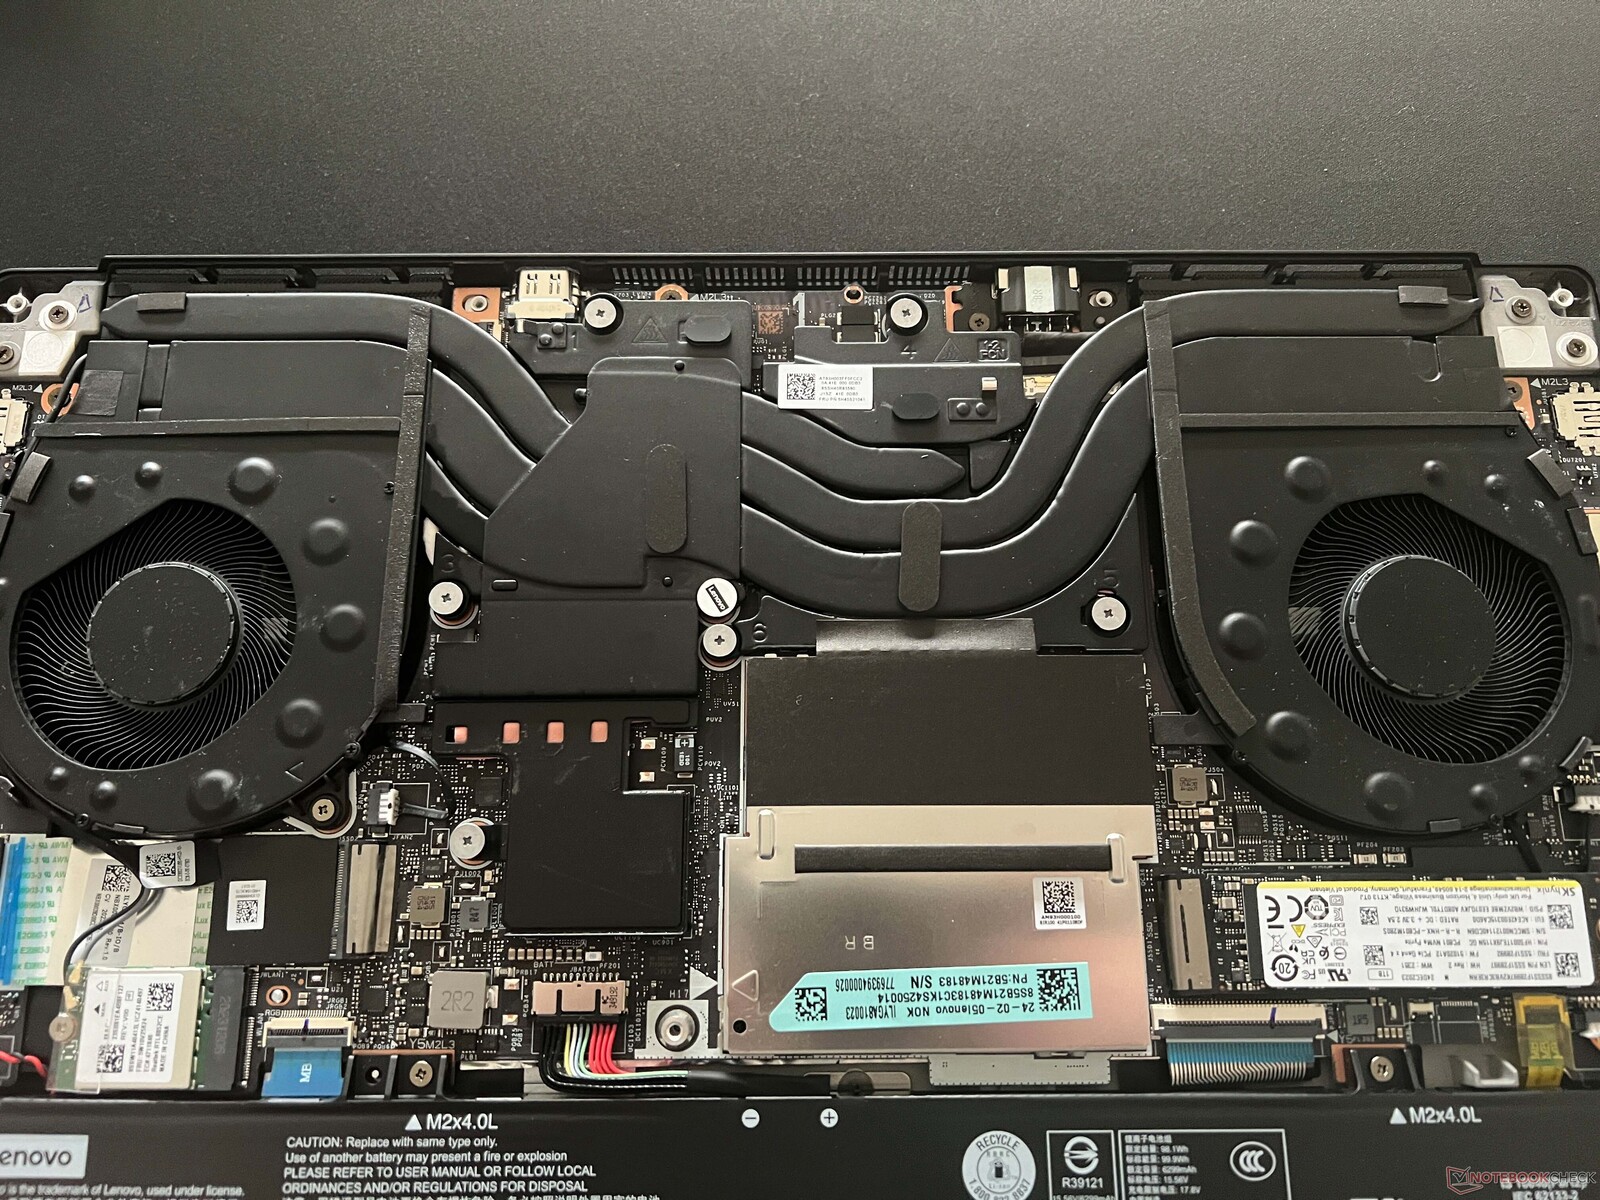
维护
底盖由普通的十字螺丝固定,非常容易拆卸。除了两个内存模块外,还有两个 M.2 2280 插槽,不过第二个插槽的使用受到 Wi-Fi 线缆的阻碍。同样,Wi-Fi 模块和电池也可以更换。
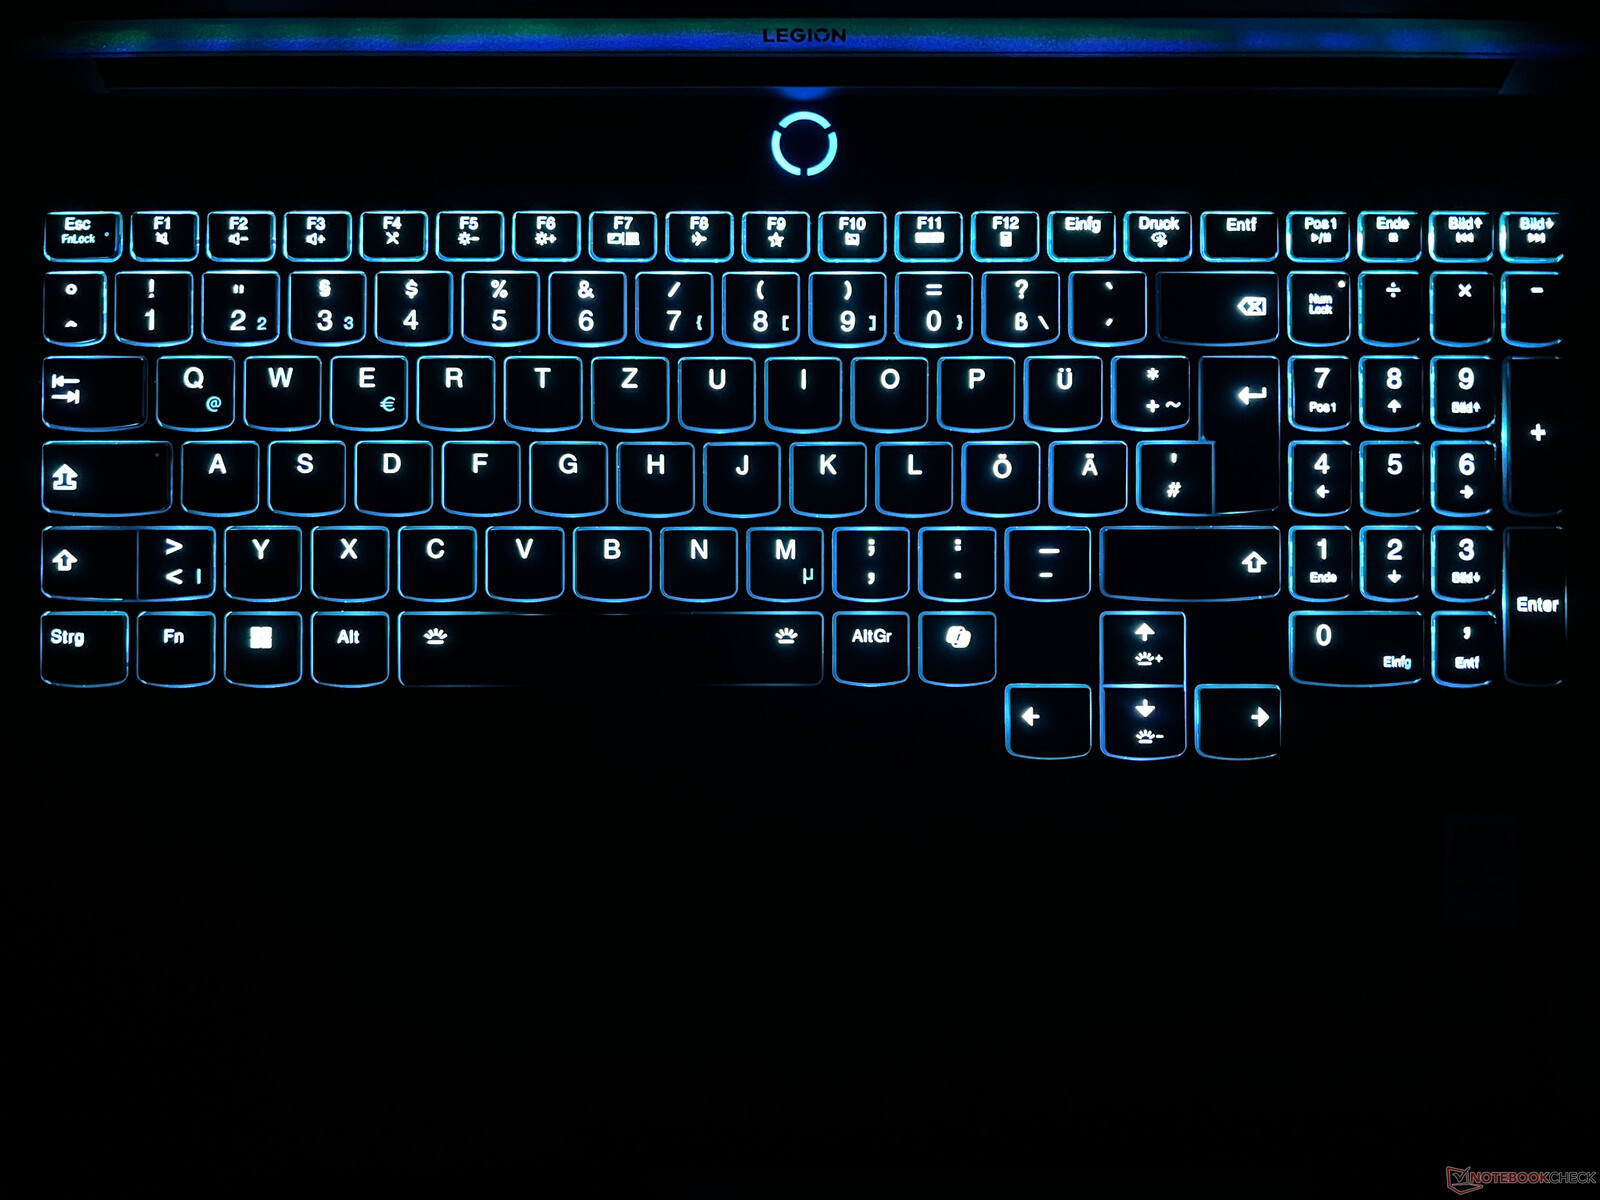
输入设备 - 数字键盘和独立按键照明
联想为Legion 7 16 配备了非常舒适的薄膜键盘,其中包括专用数字键盘和独立按键照明。总的来说,准确而安静的按键敲击声让人毫无怨言。即使是较长的文本也能轻松输入。数字键盘的按键稍窄,但在实际使用中没有任何问题。方向键大得令人愉悦,电源键上集成了指纹扫描仪。
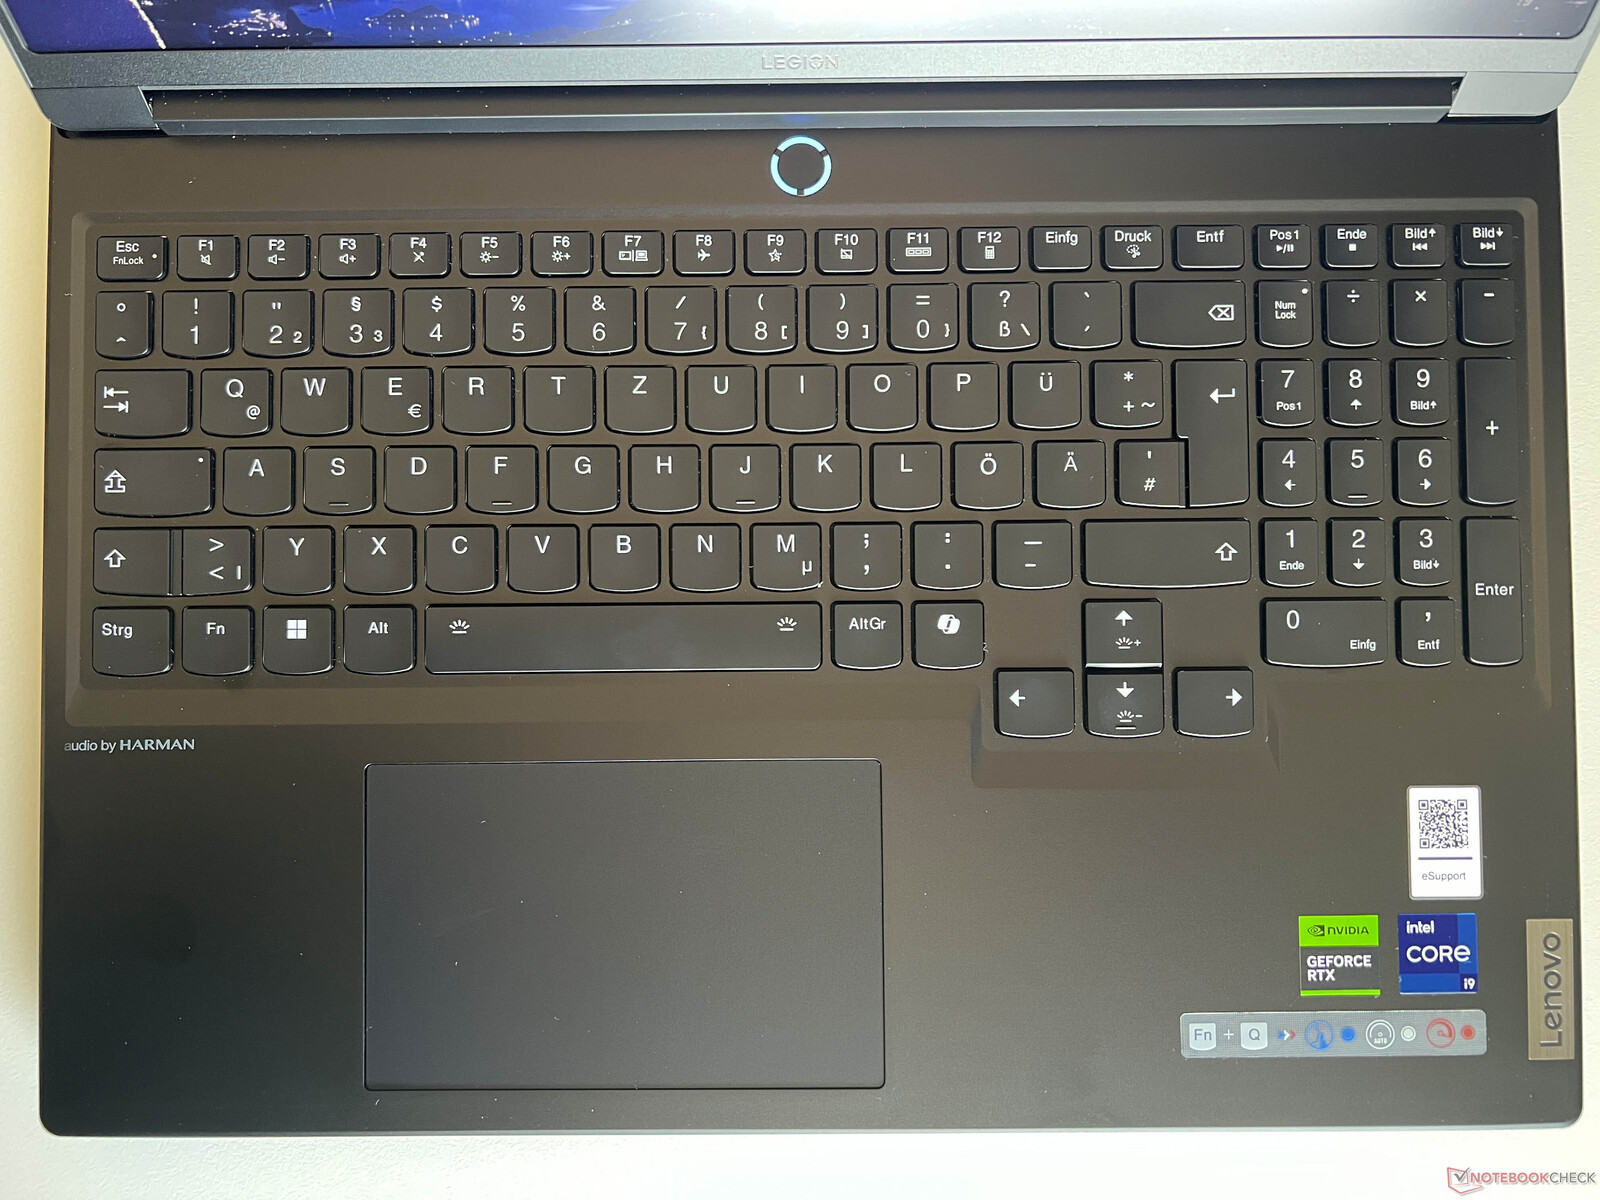
点击板的位置略微偏左,大小为 12 x 7.5 厘米,比例匀称。轻扫操作可以很好地实现,而且可以点击键盘的下部区域,尽管声音比较大。因此,您只能轻触鼠标垫。Legion Speed Mouse Mad M 也包括在内。
显示屏 - 3.2K、165 Hz、IPS 面板和 G-Sync

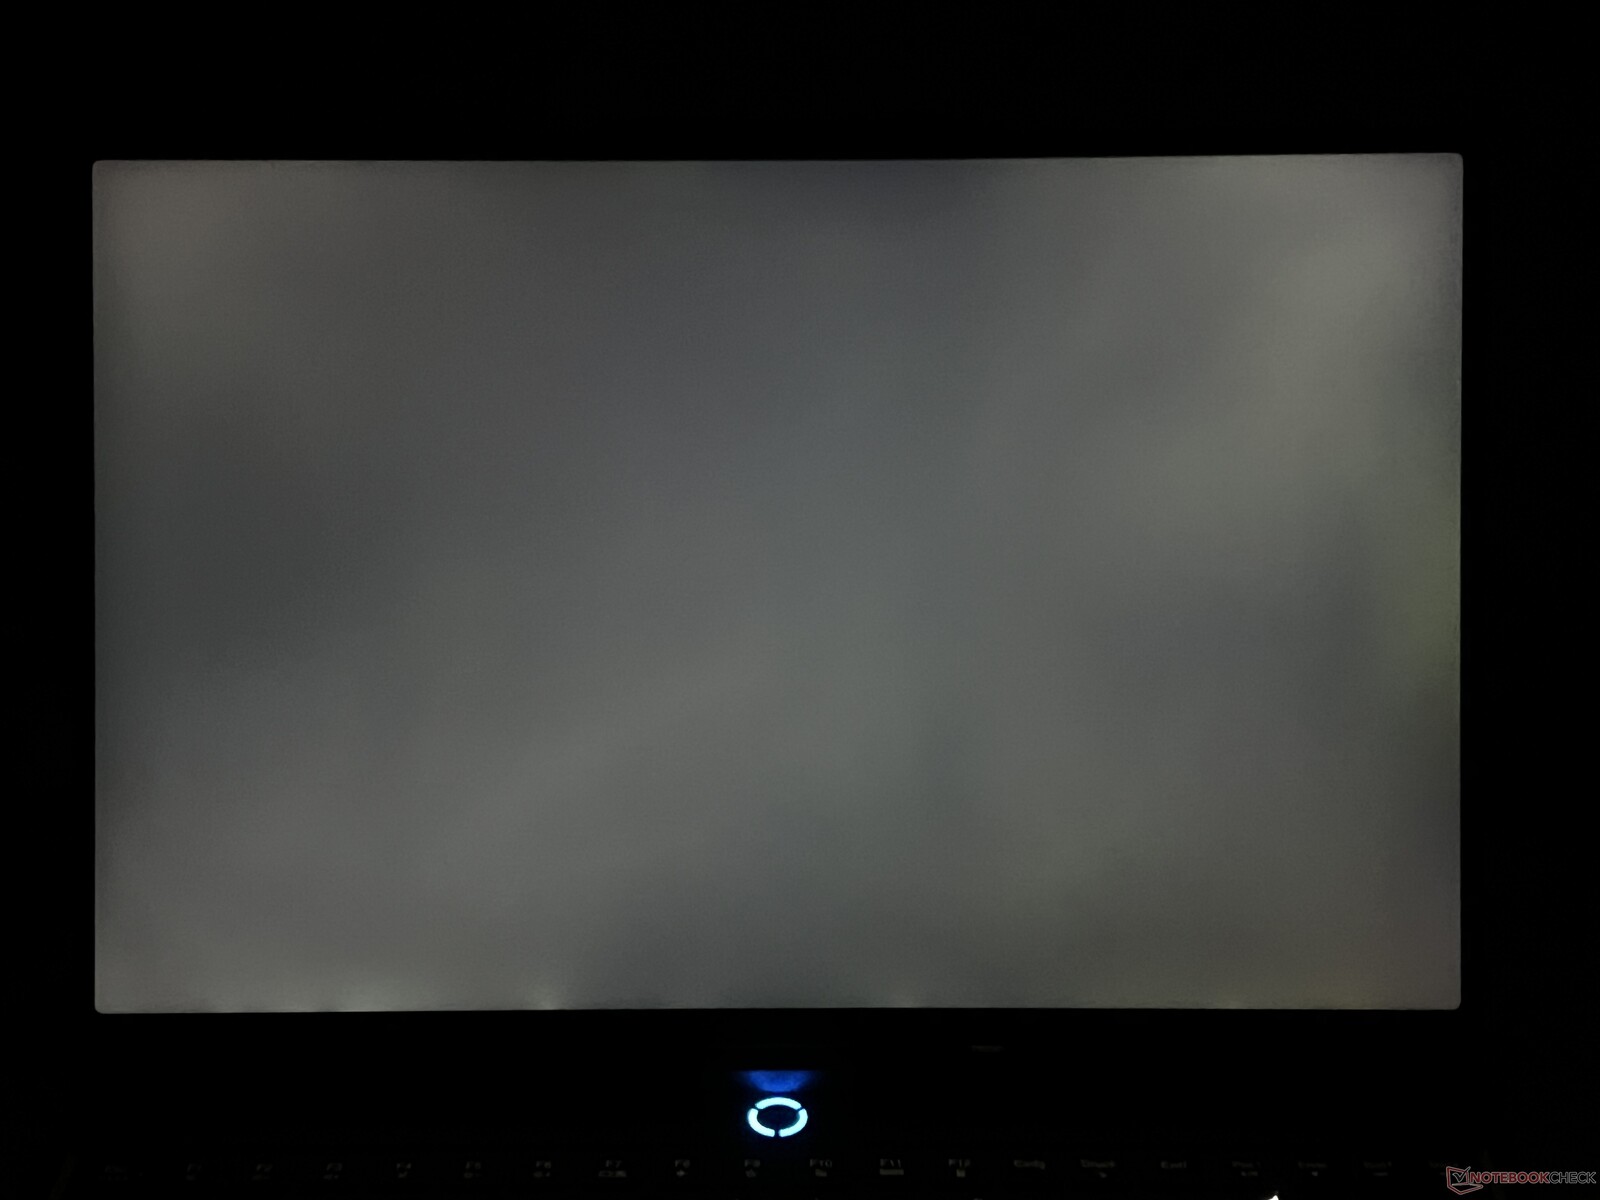
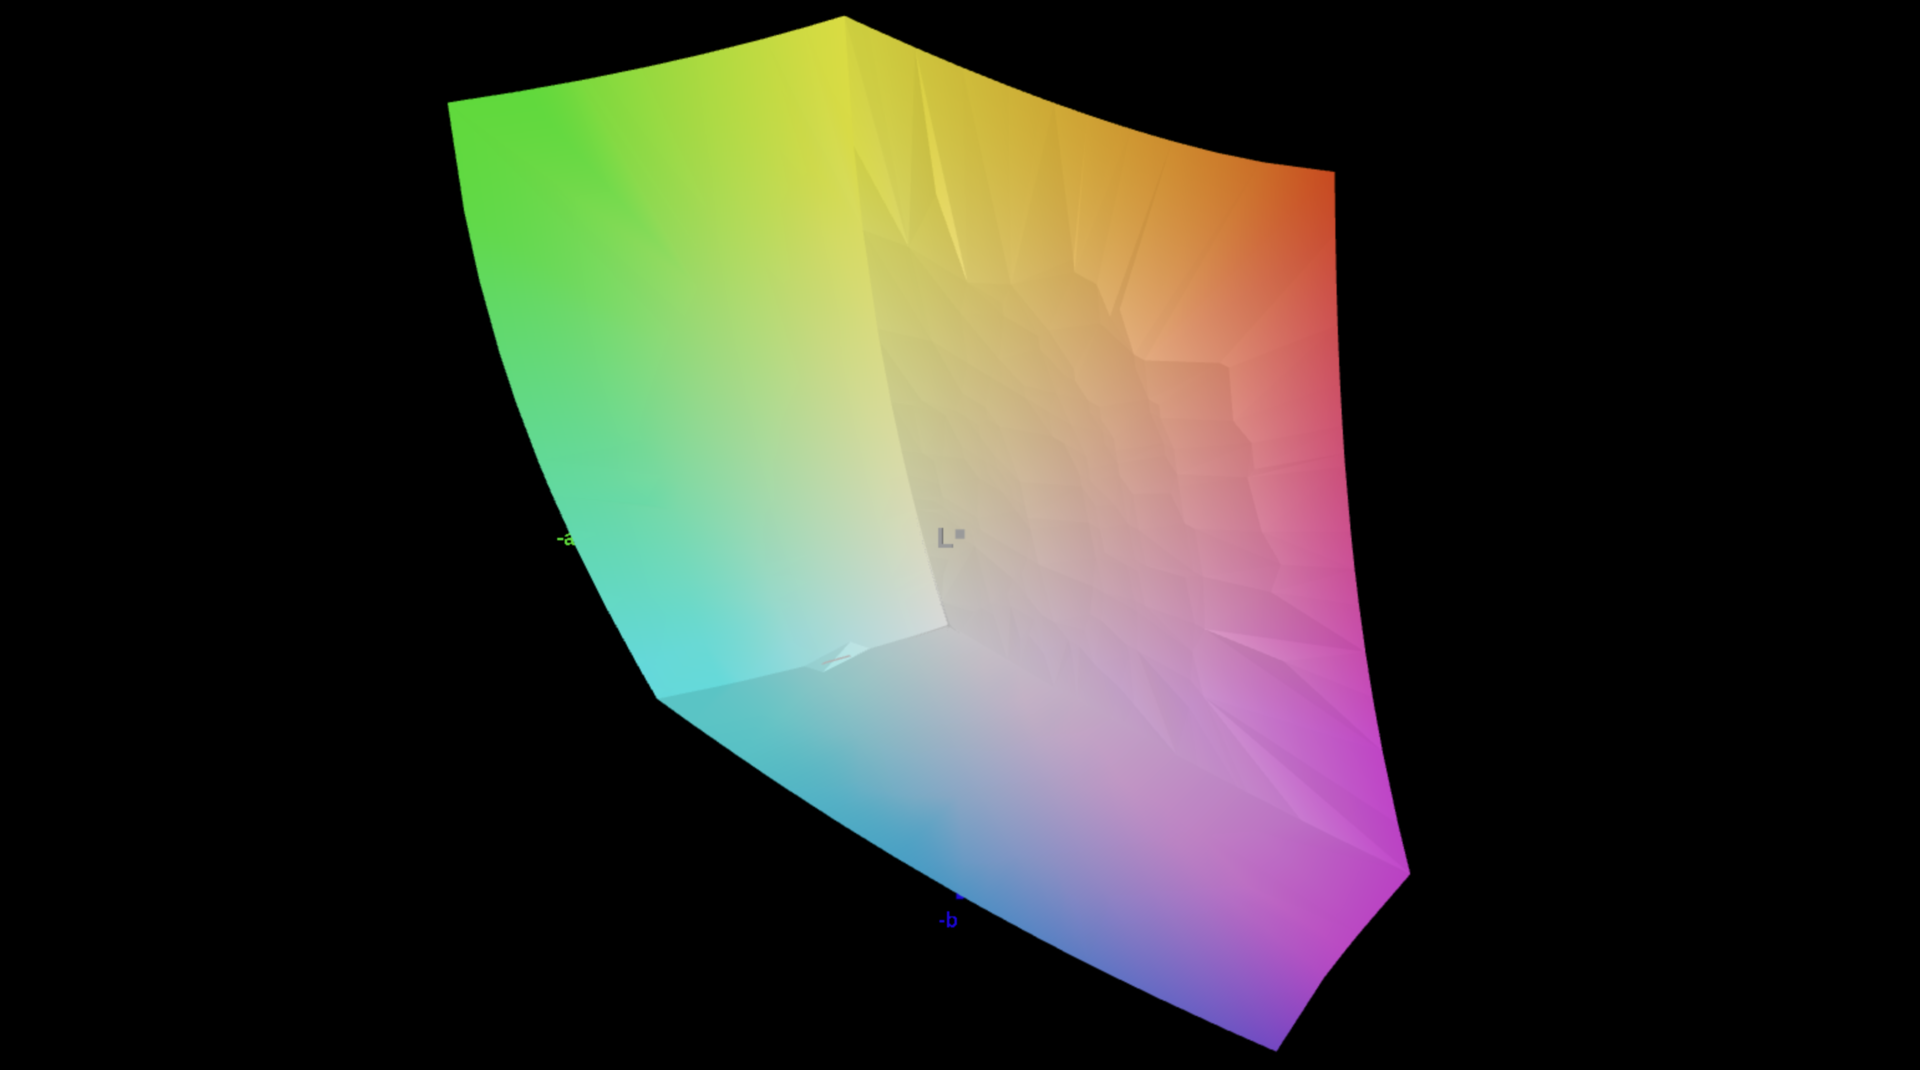
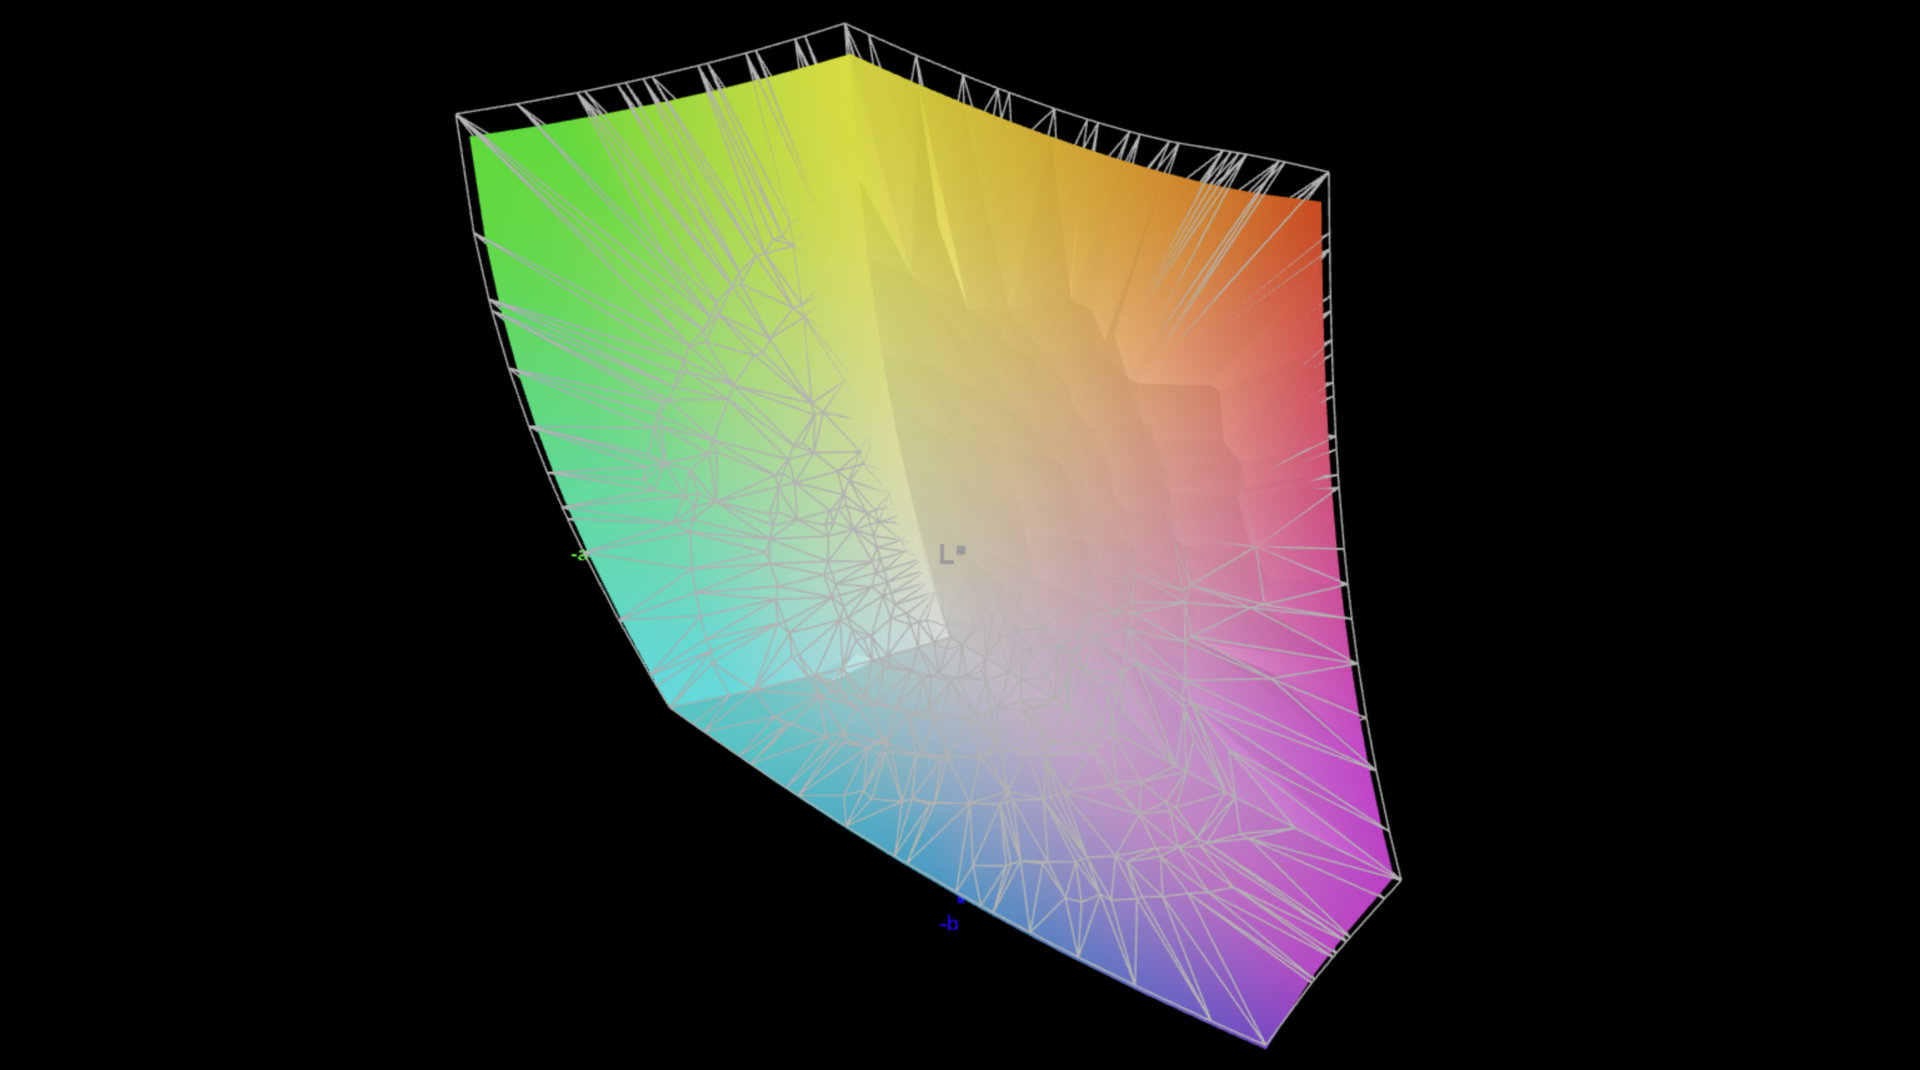
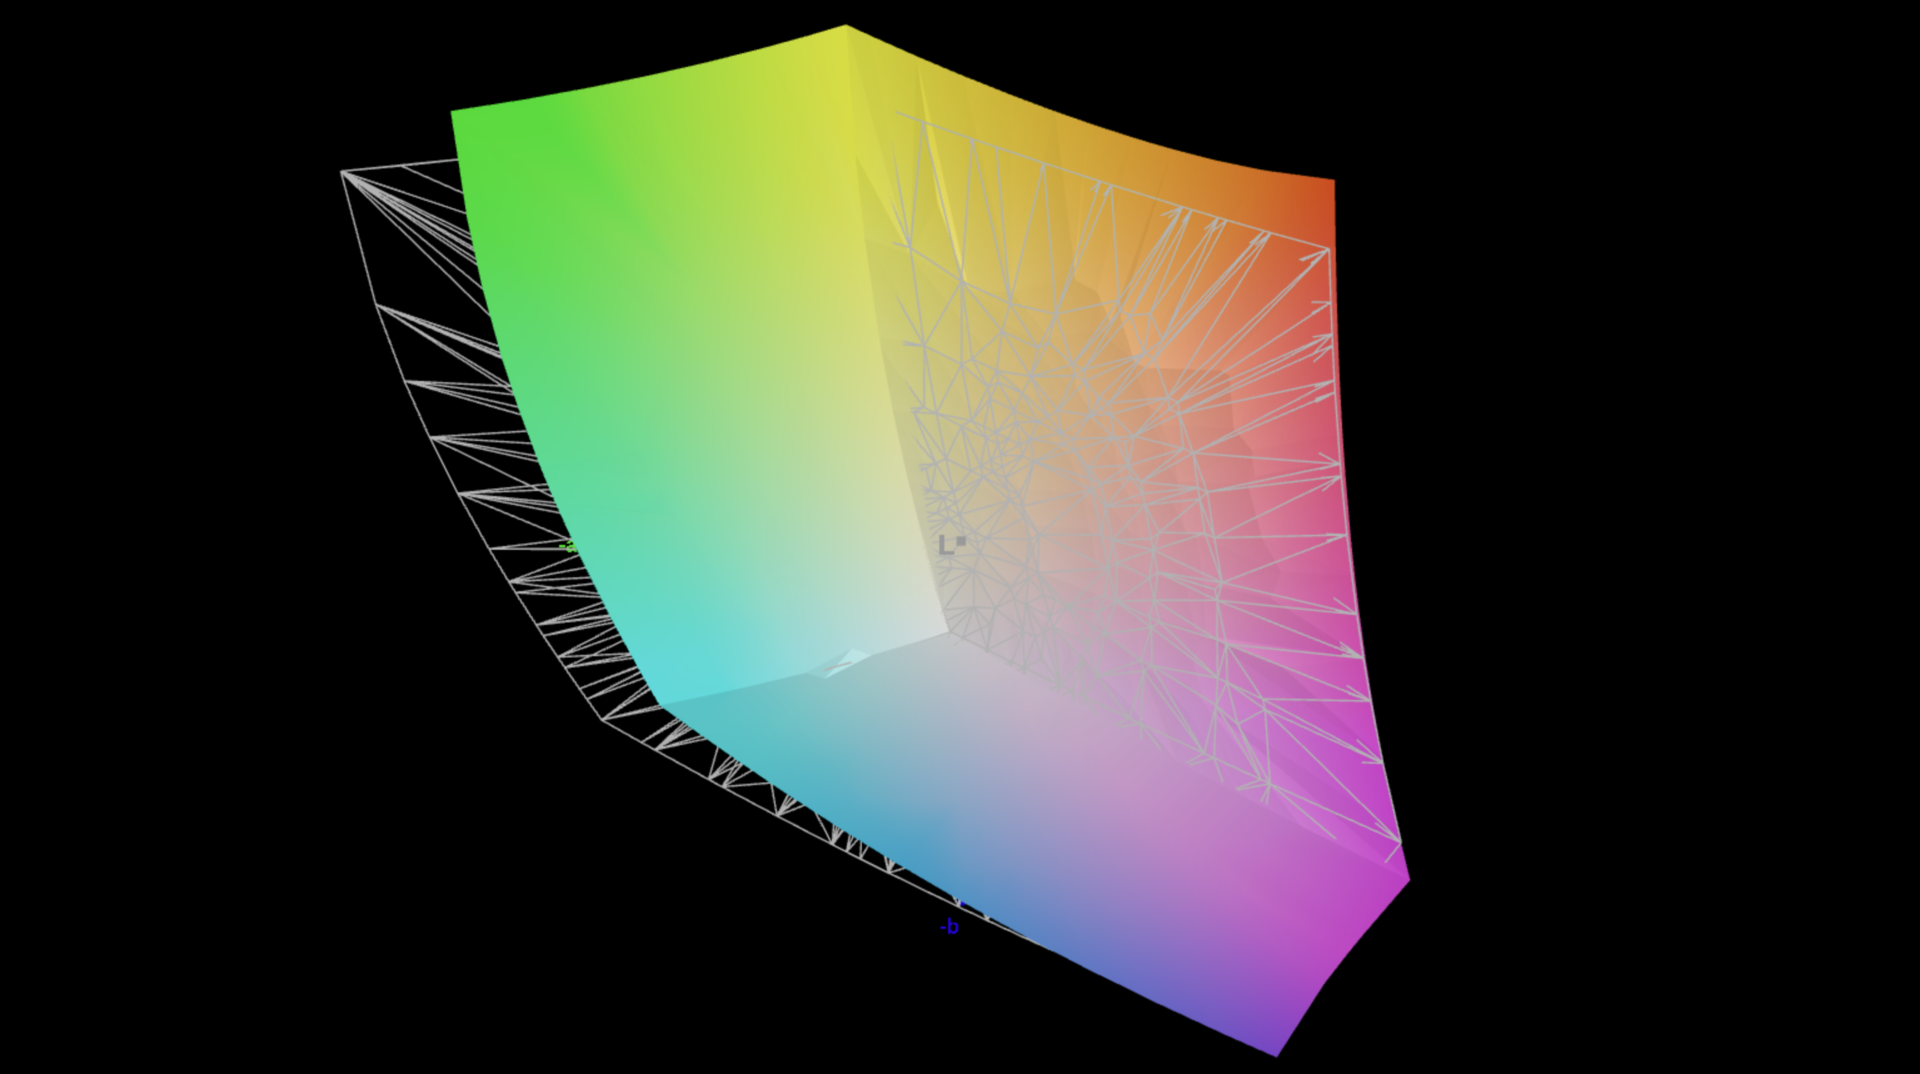
Legion 7 16 评论机配备了高分辨率、16:10 长宽比、IPS 显示屏(3200 x 2000 像素)。由于显示屏的高分辨率,主观图像质量不错,内容显示非常清晰。同样,色彩也很鲜艳,但目前的 OLED 面板能提供更生动的图像。当显示亮度较高的内容时,表面会出现轻微的颗粒感,不过联想通过将 Windows 暗模式作为标准配置,在很大程度上避免了这一问题。得益于 165 Hz 的刷新率,移动非常流畅,响应时间也很快。没有使用 PWM 闪烁。
平均亮度约为 400 cd/m²,但黑色值为 0.43 cd/m²,相当高,这也解释了为什么最大对比度仅为 1.000:1。此外,在全亮度和暗色内容下,会出现明显的漏光现象。
| |||||||||||||||||||||||||
Brightness Distribution: 89 %
Center on Battery: 412 cd/m²
Contrast: 958:1 (Black: 0.43 cd/m²)
ΔE ColorChecker Calman: 0.9 | ∀{0.5-29.43 Ø4.71}
calibrated: 0.6
ΔE Greyscale Calman: 1.4 | ∀{0.09-98 Ø4.96}
87.2% AdobeRGB 1998 (Argyll 3D)
100% sRGB (Argyll 3D)
95% Display P3 (Argyll 3D)
Gamma: 2.23
CCT: 6731 K
| Lenovo Legion 7 16 IRX G9 MNG007ZA1-2, IPS, 3200x2000, 16" | Lenovo Legion Pro 7 16IRX9H BOE CQ NE16QDM-NZB, IPS, 2560x1600, 16" | Lenovo Legion Pro 5 16IRX9 BOE NE160QDM-NYC, IPS, 2560x1600, 16" | Aorus 16X 2024 BOE CQ NE160QDM-NY1, IPS, 2560x1600, 16" | HP Omen Transcend 16-u1095ng ATNA60DL02-0 (SDC41A4), OLED, 2560x1600, 16" | Alienware m16 R2 BOE NE16NYH, IPS, 2560x1600, 16" | Schenker XMG CORE 16 (L23) BOE0AF0 (), IPS, 2560x1600, 16" | |
|---|---|---|---|---|---|---|---|
| Display | 1% | -16% | -18% | 5% | -14% | -16% | |
| Display P3 Coverage (%) | 95 | 98.5 4% | 69.3 -27% | 67.2 -29% | 99.8 5% | 71 -25% | 68.3 -28% |
| sRGB Coverage (%) | 100 | 99.9 0% | 99.4 -1% | 96.7 -3% | 100 0% | 100 0% | 98.6 -1% |
| AdobeRGB 1998 Coverage (%) | 87.2 | 86.7 -1% | 70.1 -20% | 69.3 -21% | 97 11% | 71.4 -18% | 69.6 -20% |
| Response Times | 16% | -4% | 37% | 98% | 20% | 8% | |
| Response Time Grey 50% / Grey 80% * (ms) | 14.4 ? | 12.6 ? 12% | 11.9 ? 17% | 7.5 ? 48% | 0.2 ? 99% | 5.7 ? 60% | 13.2 ? 8% |
| Response Time Black / White * (ms) | 7.2 ? | 5.8 ? 19% | 8.9 ? -24% | 5.4 ? 25% | 0.2 ? 97% | 8.7 ? -21% | 6.6 ? 8% |
| PWM Frequency (Hz) | 120 ? | ||||||
| Screen | 3% | -11% | -58% | 133% | -26% | -69% | |
| Brightness middle (cd/m²) | 412 | 487 18% | 384 -7% | 542 32% | 390 -5% | 345.8 -16% | 376 -9% |
| Brightness (cd/m²) | 396 | 460 16% | 366 -8% | 504 27% | 392 -1% | 337 -15% | 358 -10% |
| Brightness Distribution (%) | 89 | 88 -1% | 91 2% | 86 -3% | 98 10% | 87 -2% | 88 -1% |
| Black Level * (cd/m²) | 0.43 | 0.42 2% | 0.35 19% | 0.45 -5% | 0.02 95% | 0.3 30% | 0.33 23% |
| Contrast (:1) | 958 | 1160 21% | 1097 15% | 1204 26% | 19500 1935% | 1153 20% | 1139 19% |
| Colorchecker dE 2000 * | 0.9 | 1.12 -24% | 0.97 -8% | 2.73 -203% | 1.94 -116% | 1.99 -121% | 2.74 -204% |
| Colorchecker dE 2000 max. * | 2 | 2.26 -13% | 3.57 -79% | 5.29 -165% | 4.26 -113% | 3.52 -76% | 6.78 -239% |
| Colorchecker dE 2000 calibrated * | 0.6 | 0.54 10% | 0.77 -28% | 1.32 -120% | 4.21 -602% | 0.62 -3% | 0.88 -47% |
| Greyscale dE 2000 * | 1.4 | 1.4 -0% | 1.5 -7% | 2.9 -107% | 1.5 -7% | 2.1 -50% | 3.57 -155% |
| Gamma | 2.23 99% | 2.242 98% | 2.24 98% | 2.192 100% | 2.221 99% | 2.32 95% | 2.4 92% |
| CCT | 6731 97% | 6809 95% | 6709 97% | 6173 105% | 6395 102% | 6369 102% | 7246 90% |
| Total Average (Program / Settings) | 7% /
5% | -10% /
-11% | -13% /
-36% | 79% /
101% | -7% /
-17% | -26% /
-47% |
* ... smaller is better
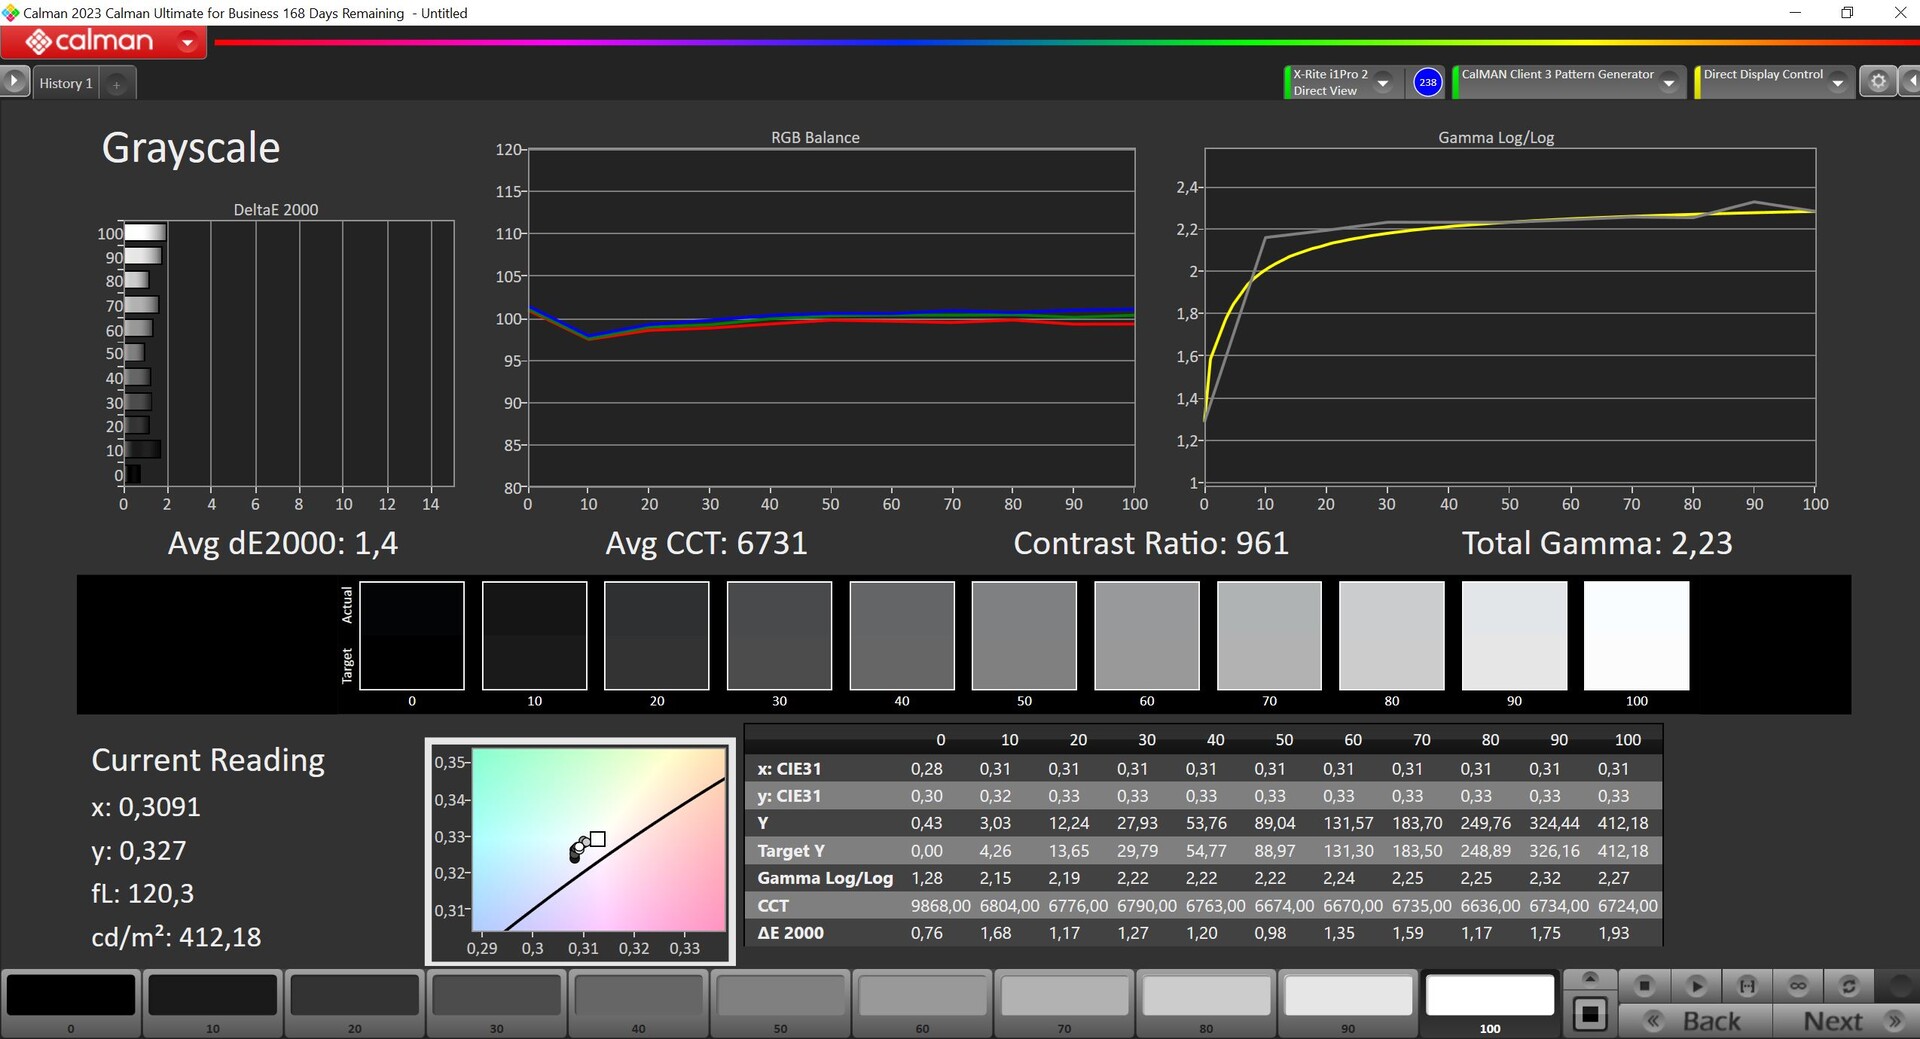

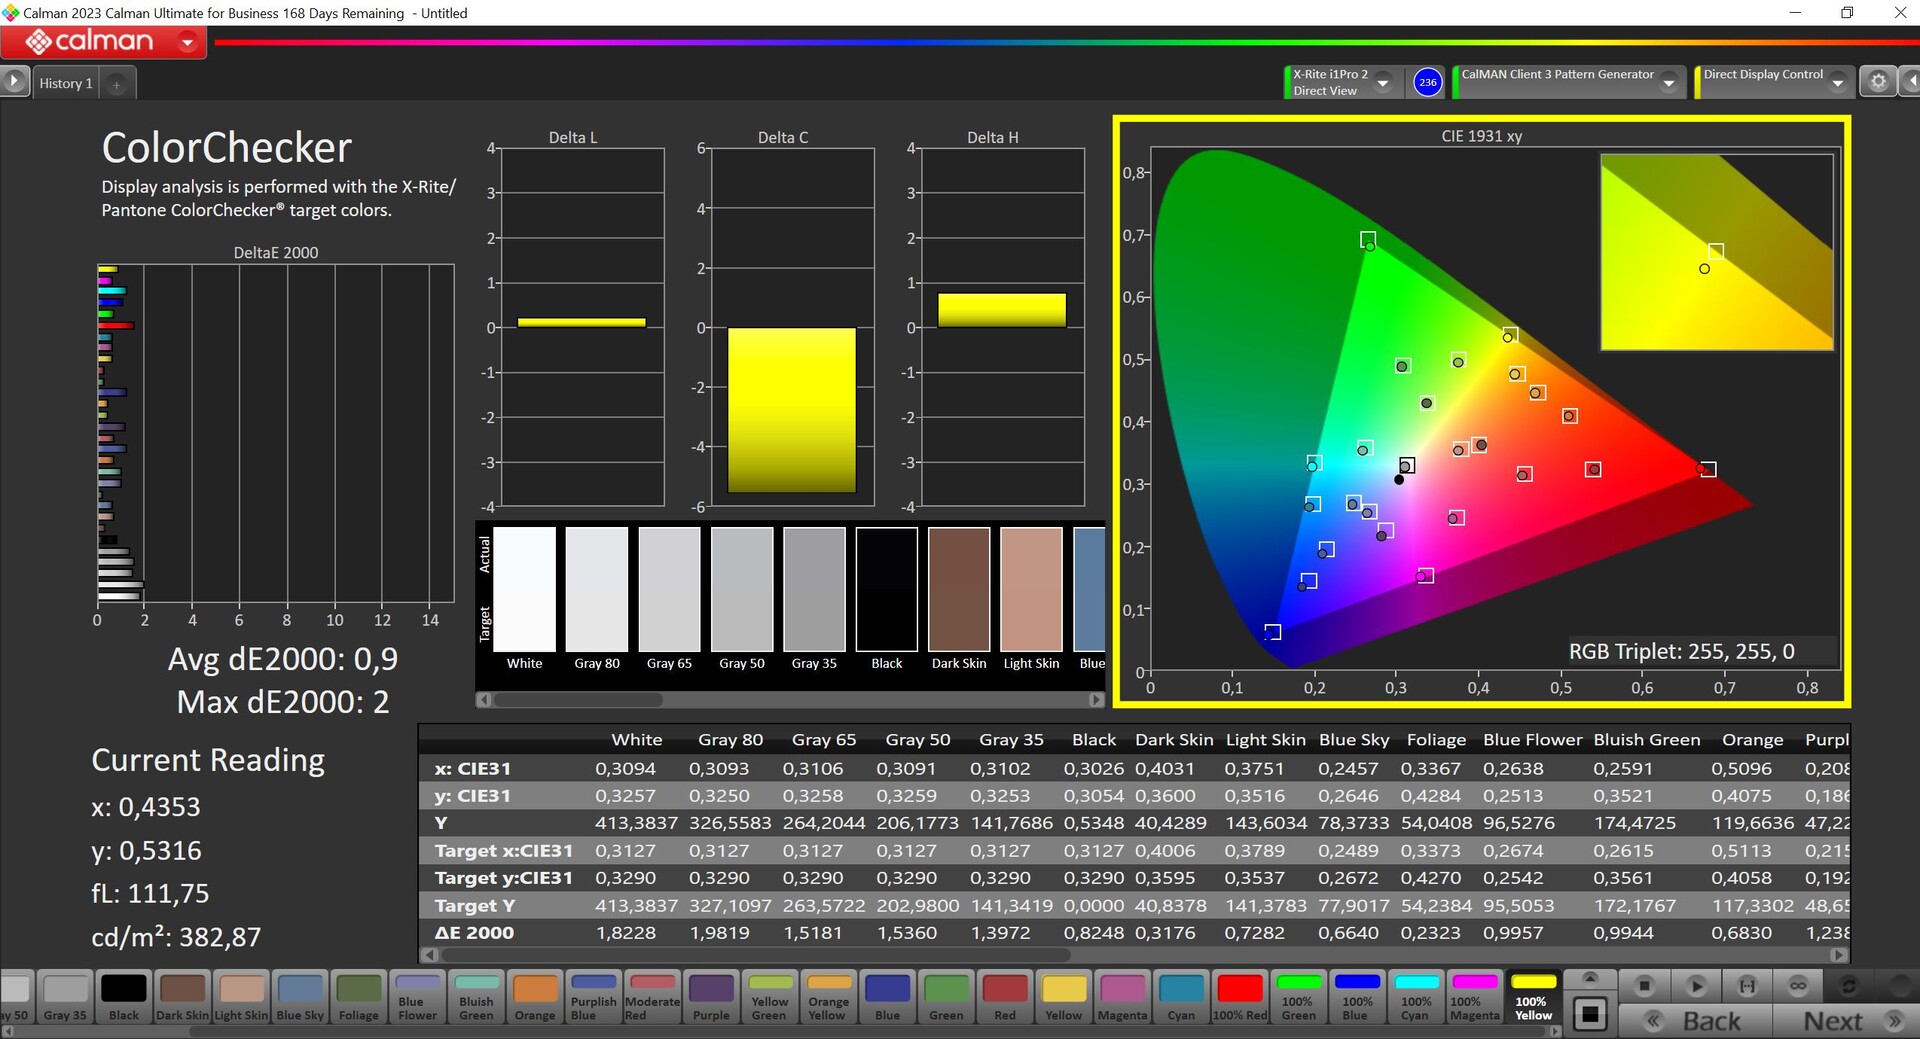
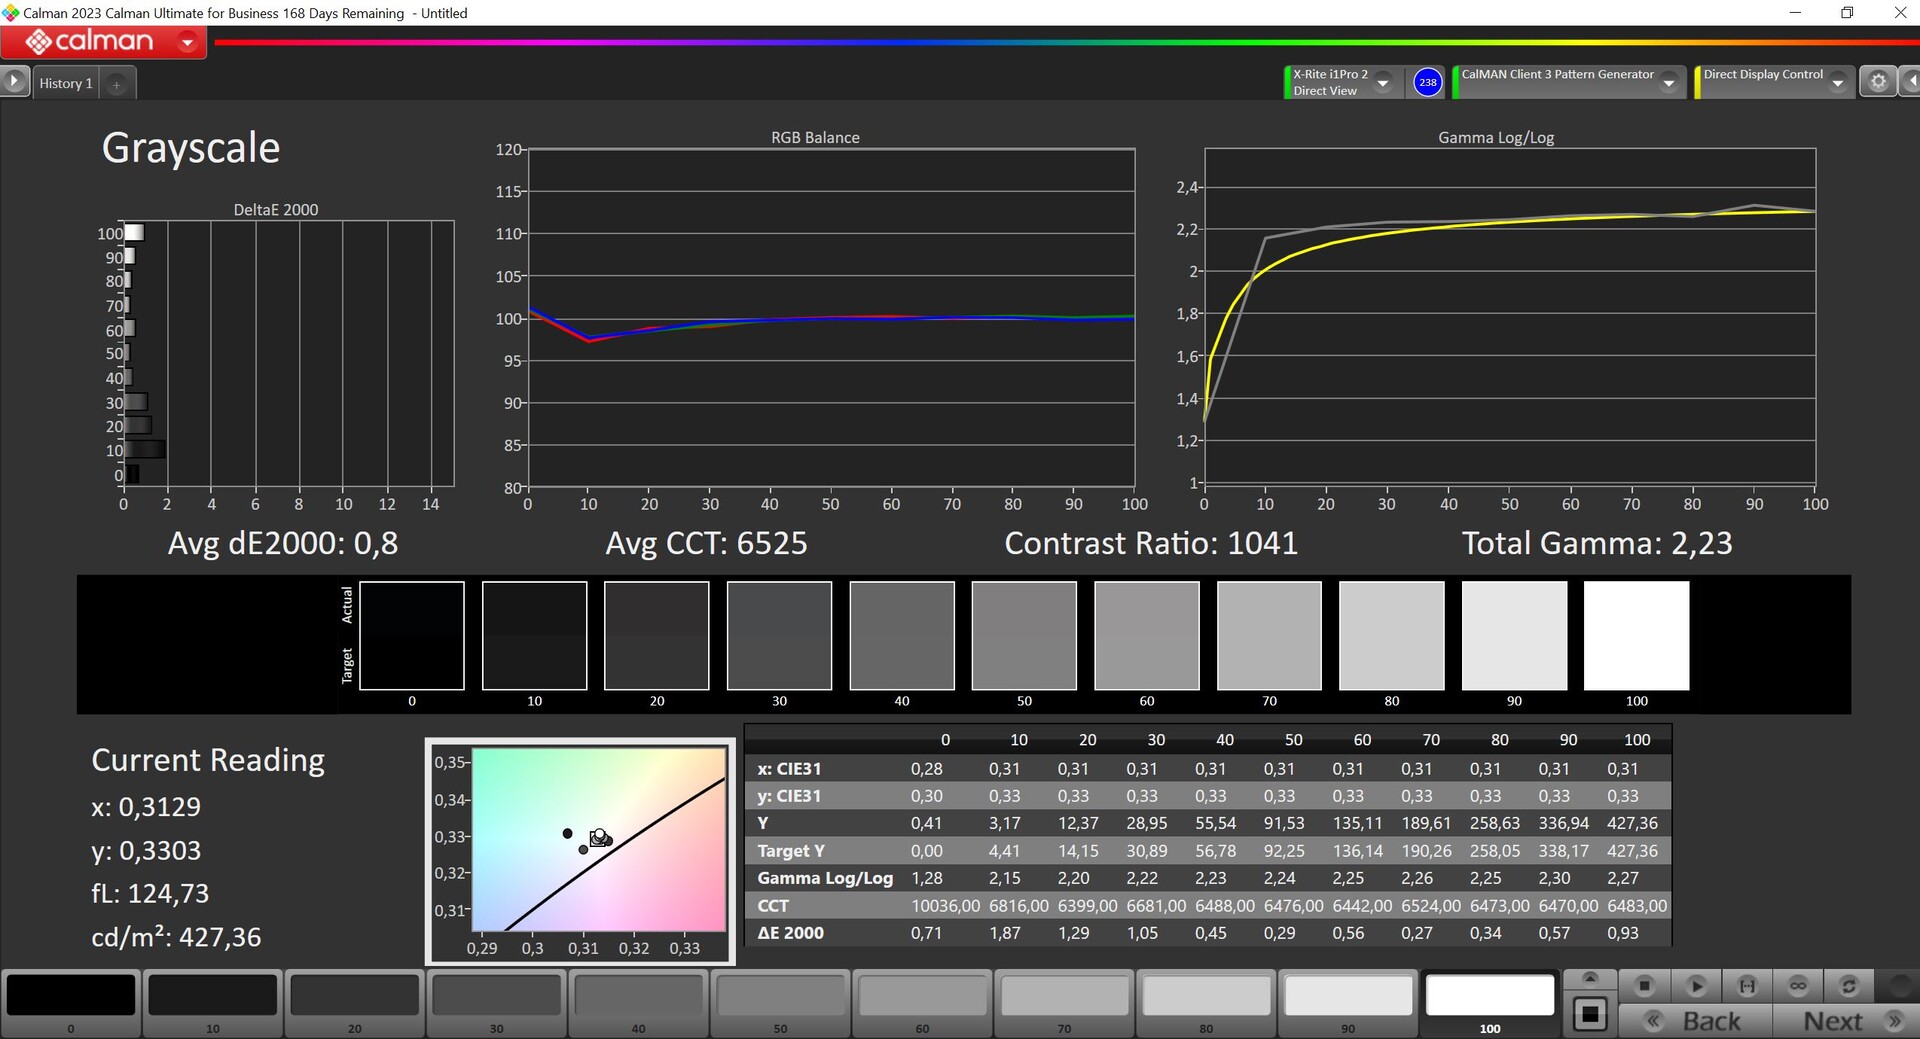
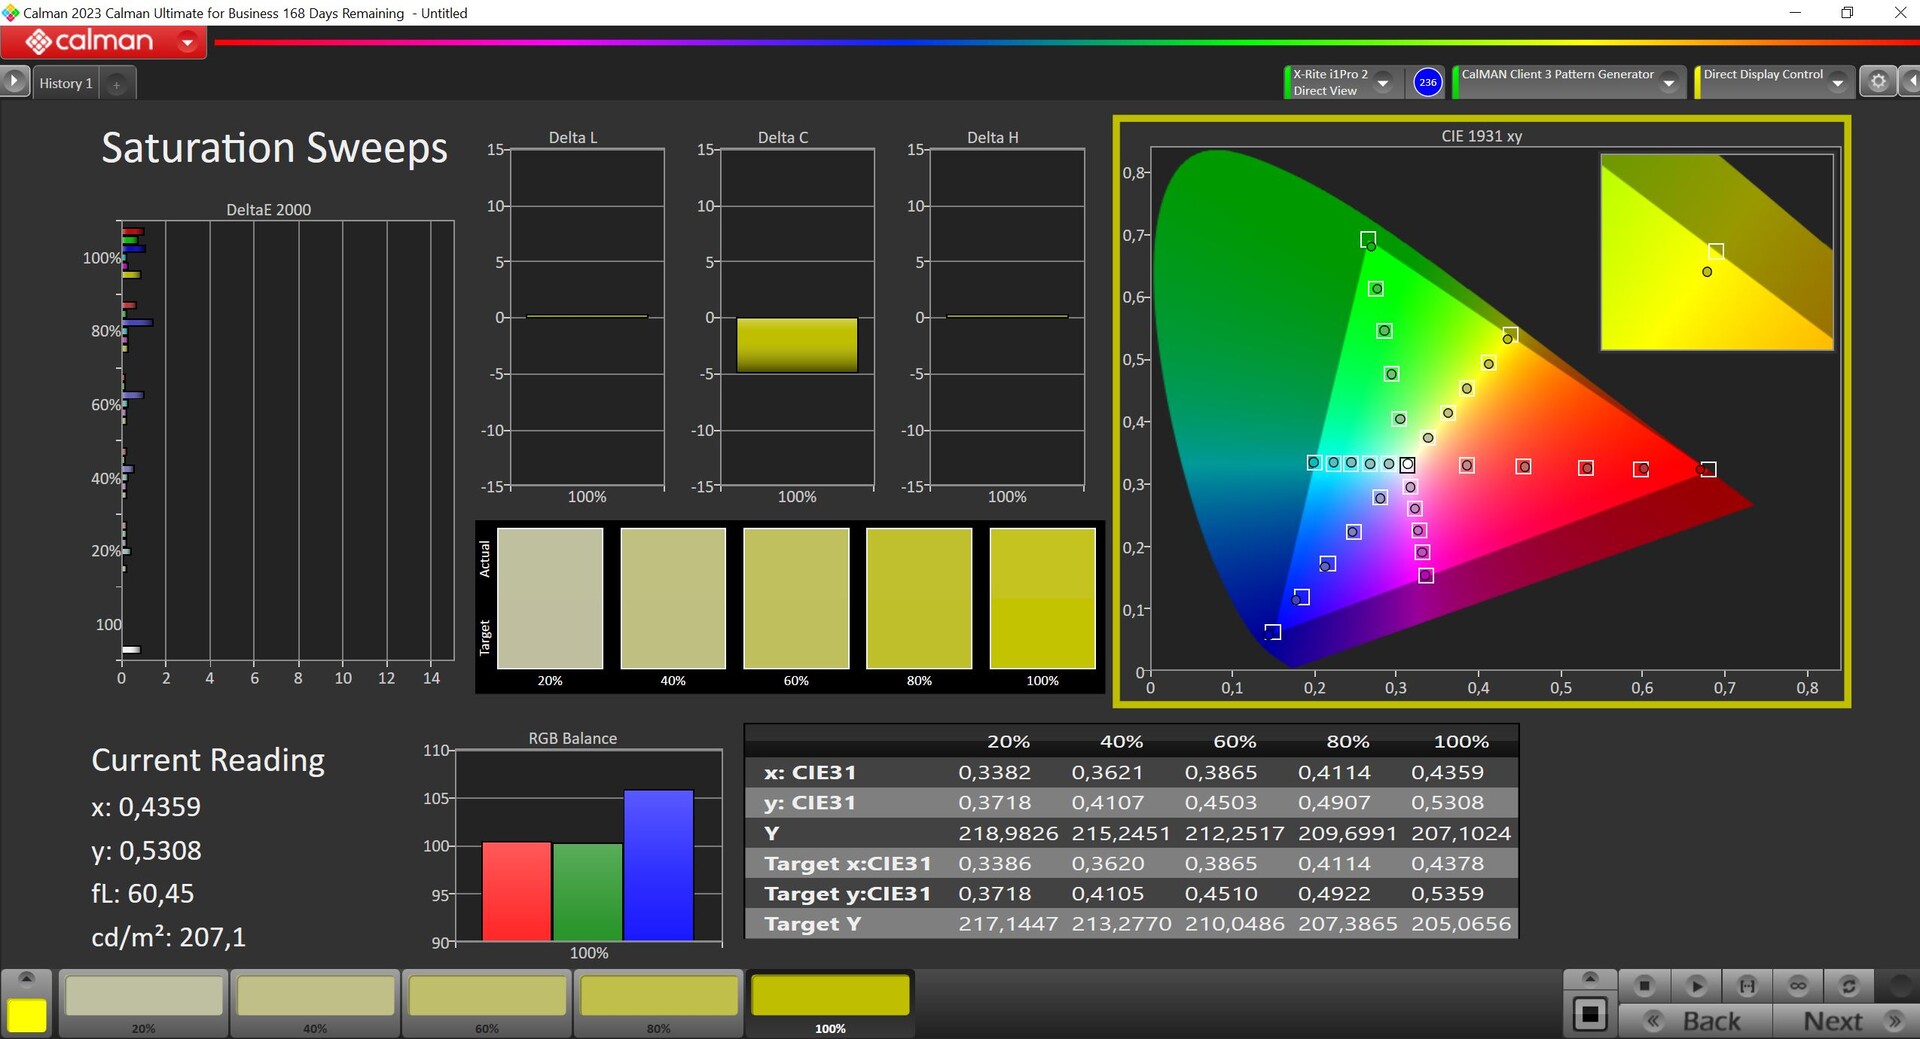
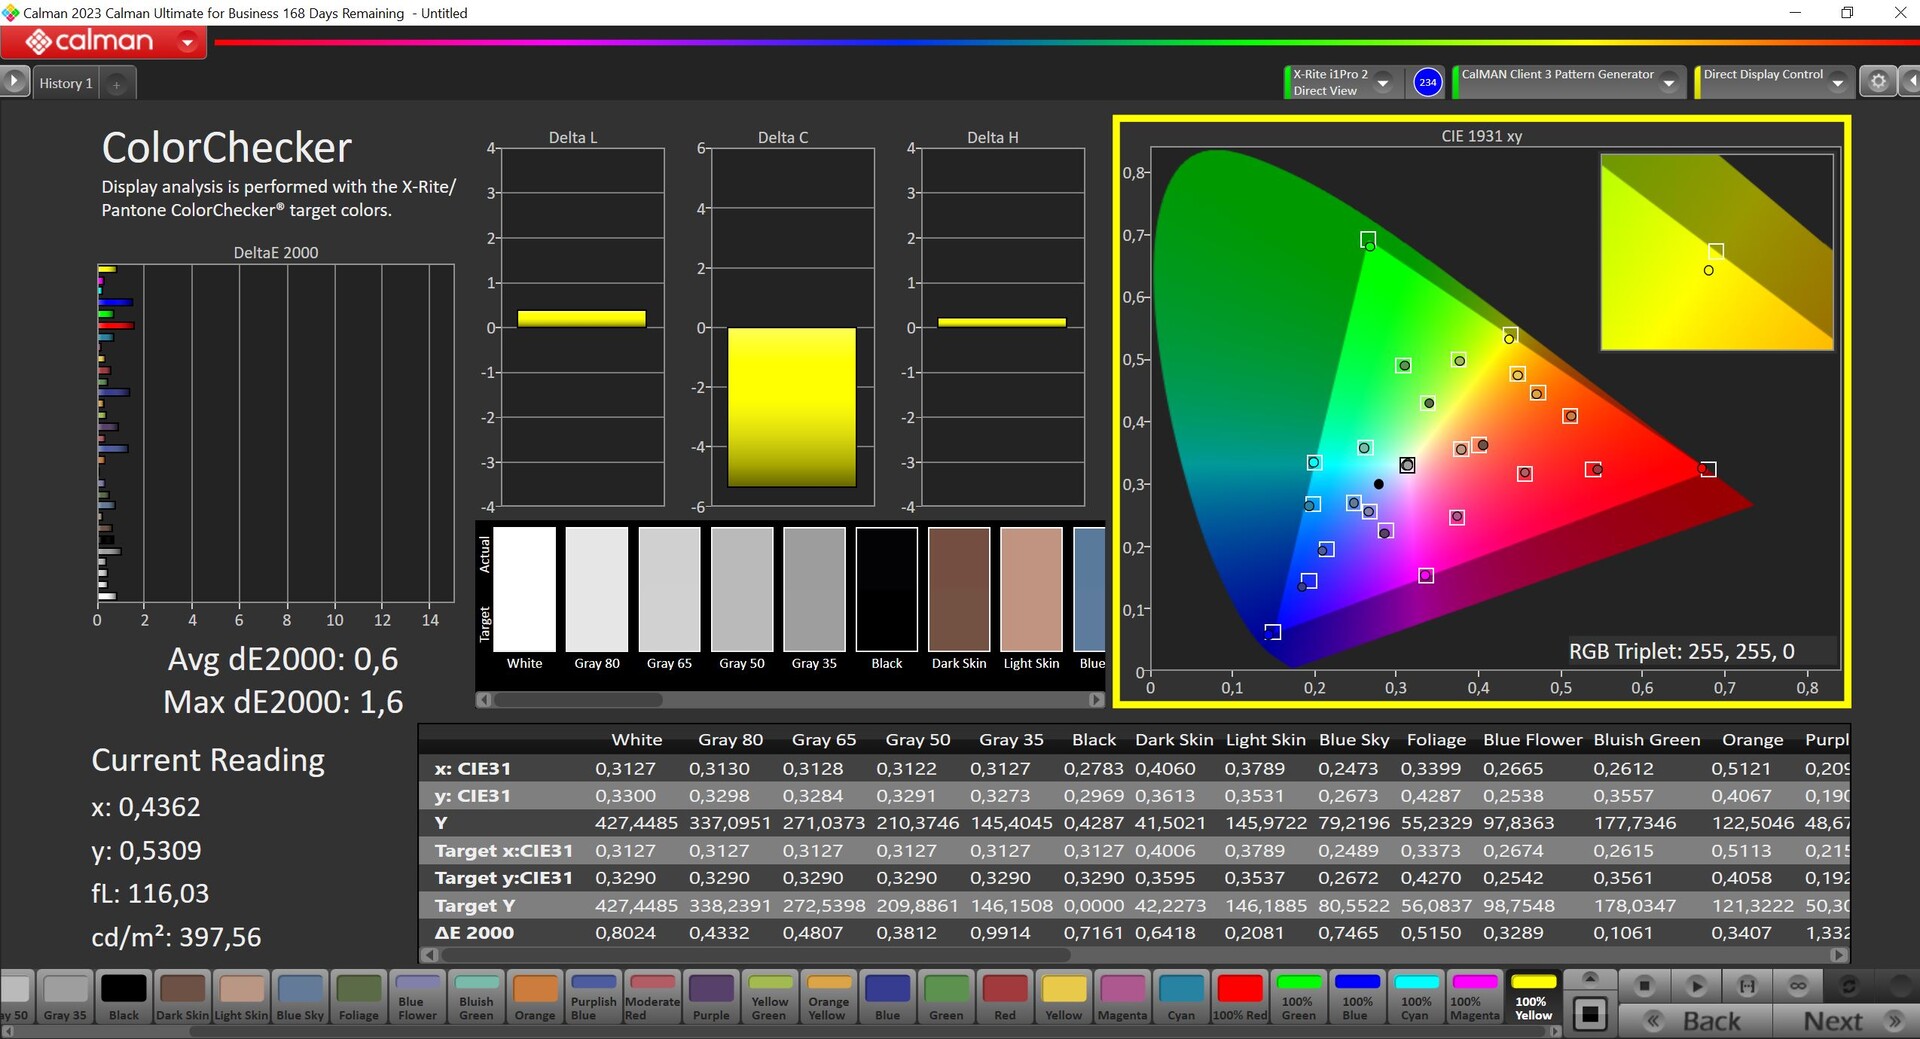
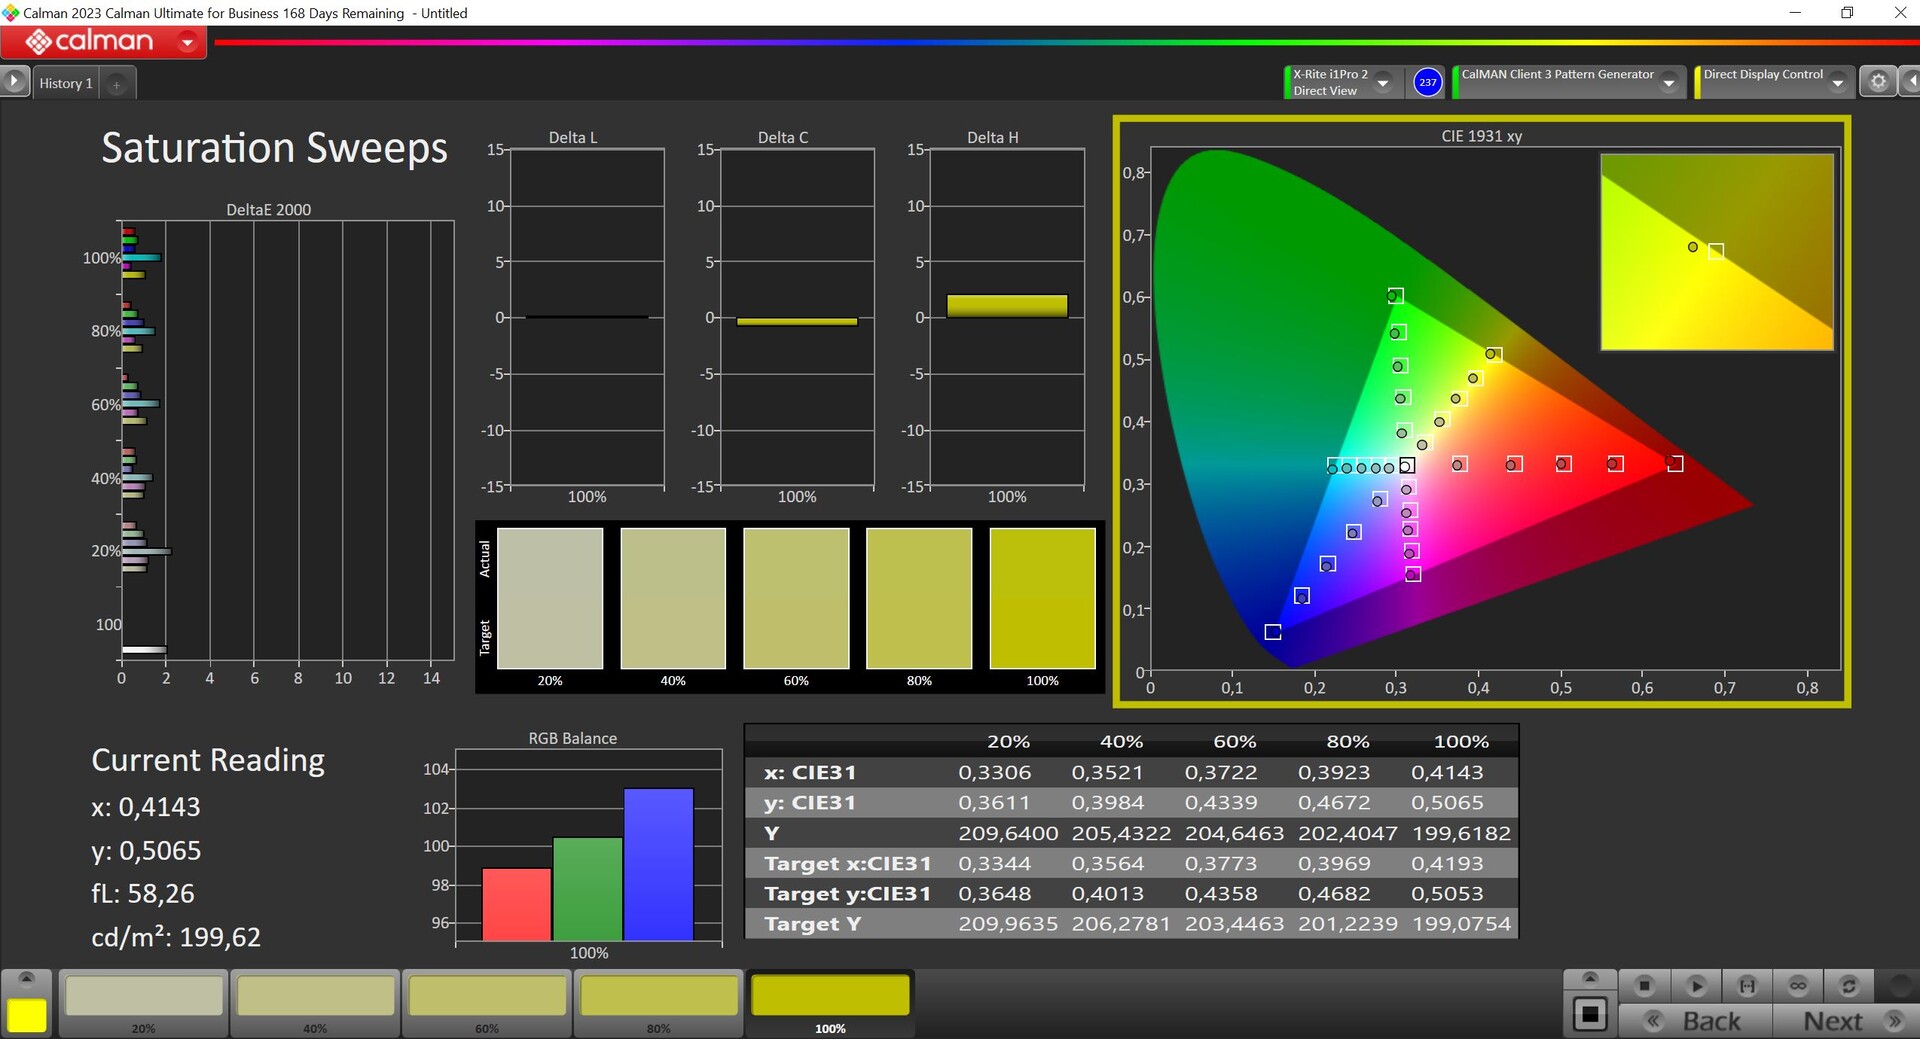
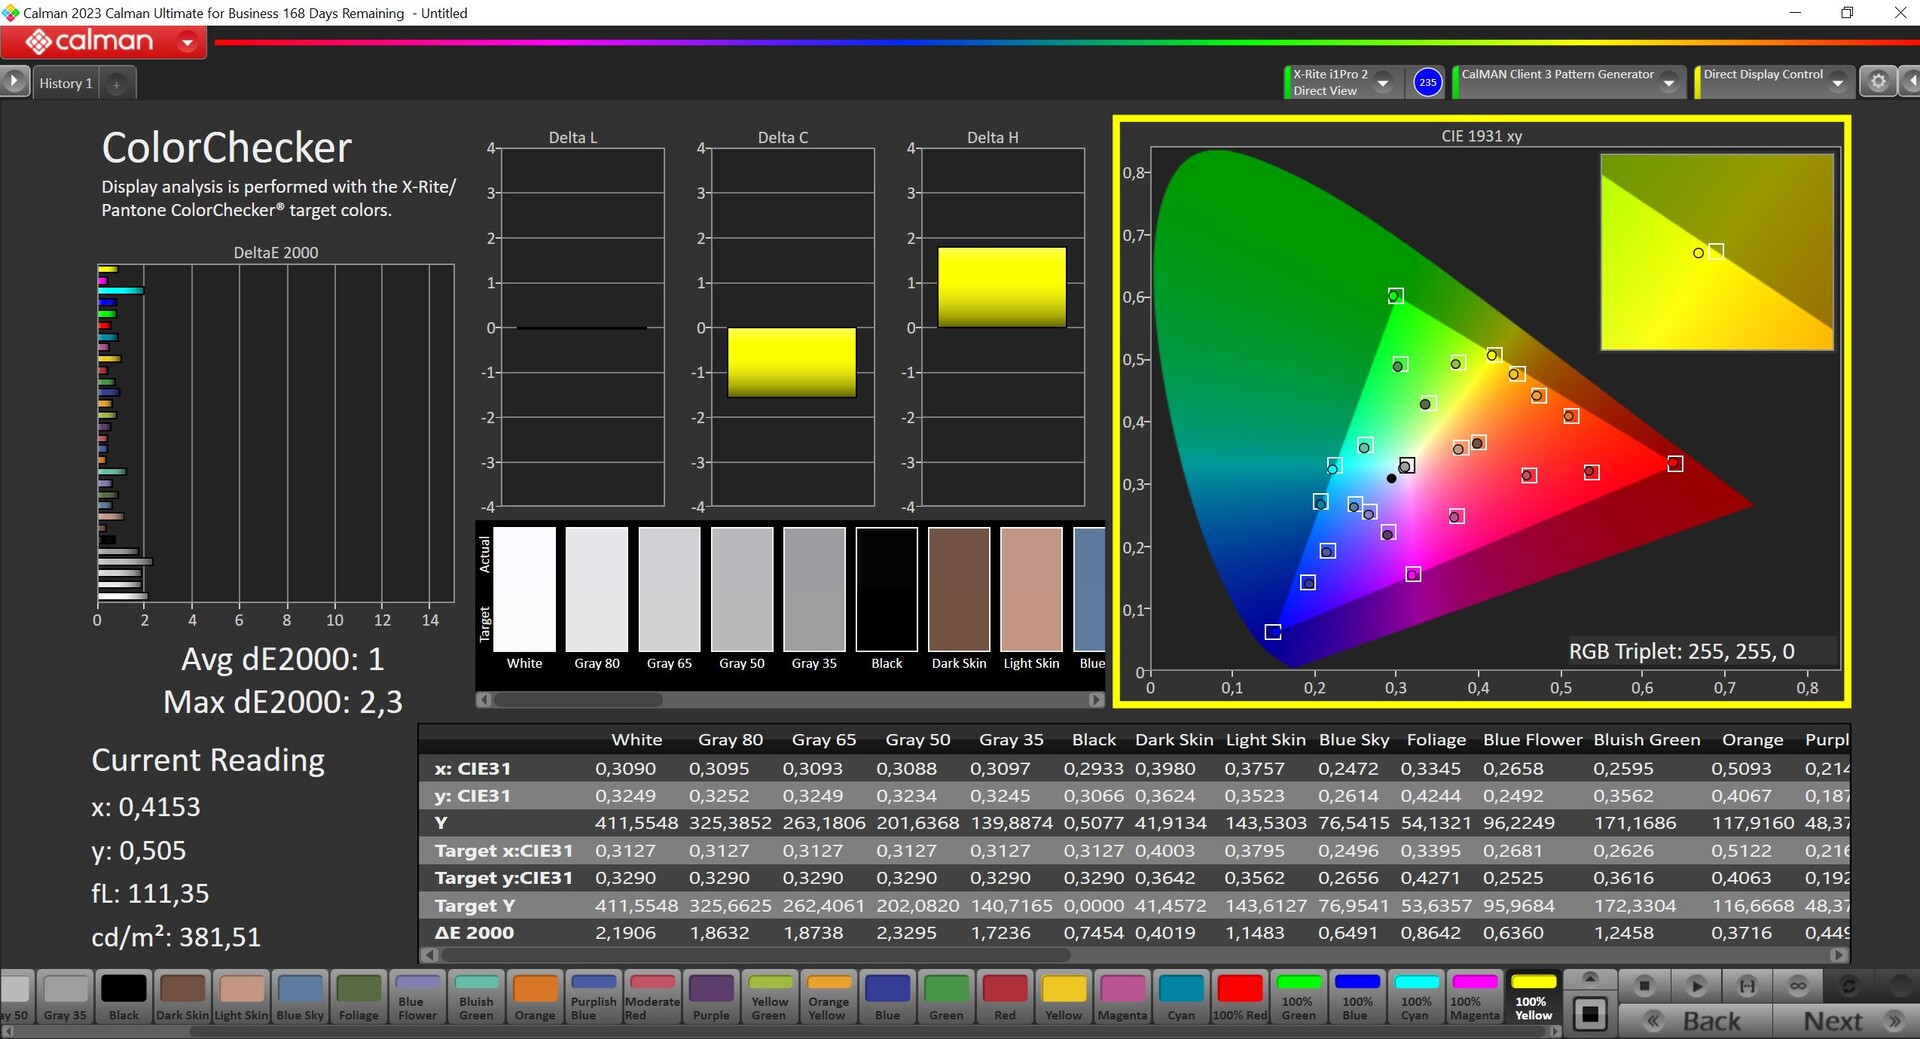
我们使用专业的 CalMAN 软件(X-Rite i1 Pro 2)对面板进行了分析。联想提供了各种配置文件,开箱即用的默认配置文件可提供准确的图像。此外,还有一个原生配置文件可供选择,该配置文件具有更高的最大亮度(约 455 cd/m²),但色温过高,色彩偏差也较大。通过校准,我们能够进一步改善图像,并可在上面免费下载相应的配置文件。同样,联想还提供了非常精确的 sRGB 模式,这对于编辑图像尤为重要。sRGB 色彩空间完全覆盖;P3 至 95%。

Display Response Times
| ↔ Response Time Black to White | ||
|---|---|---|
| 7.2 ms ... rise ↗ and fall ↘ combined | ↗ 2.9 ms rise | 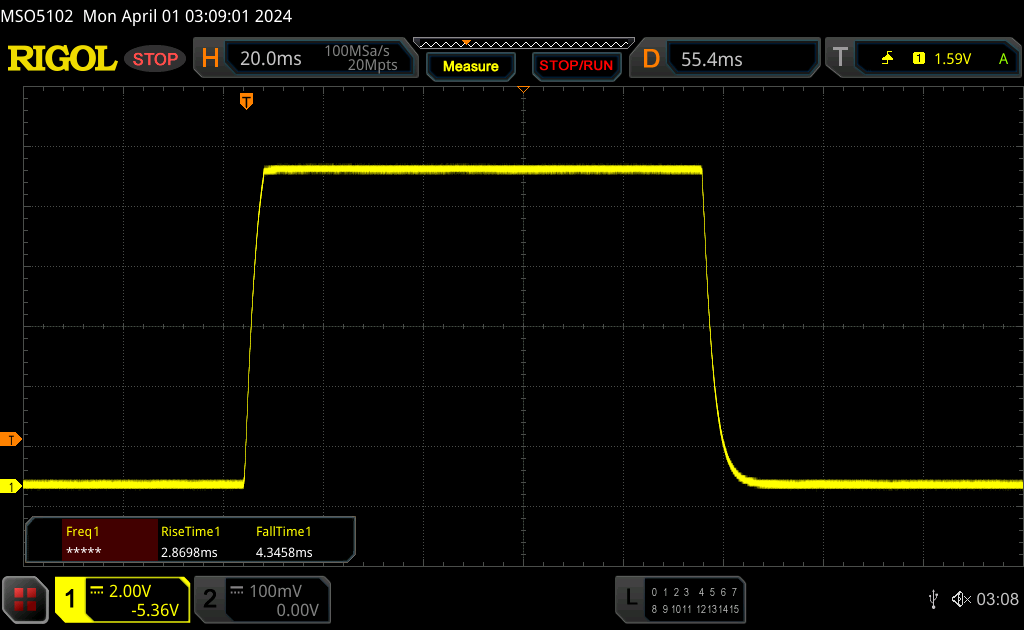 |
| ↘ 4.3 ms fall | ||
| The screen shows very fast response rates in our tests and should be very well suited for fast-paced gaming. In comparison, all tested devices range from 0.1 (minimum) to 240 (maximum) ms. » 22 % of all devices are better. This means that the measured response time is better than the average of all tested devices (19.8 ms). | ||
| ↔ Response Time 50% Grey to 80% Grey | ||
| 14.4 ms ... rise ↗ and fall ↘ combined | ↗ 6.9 ms rise | 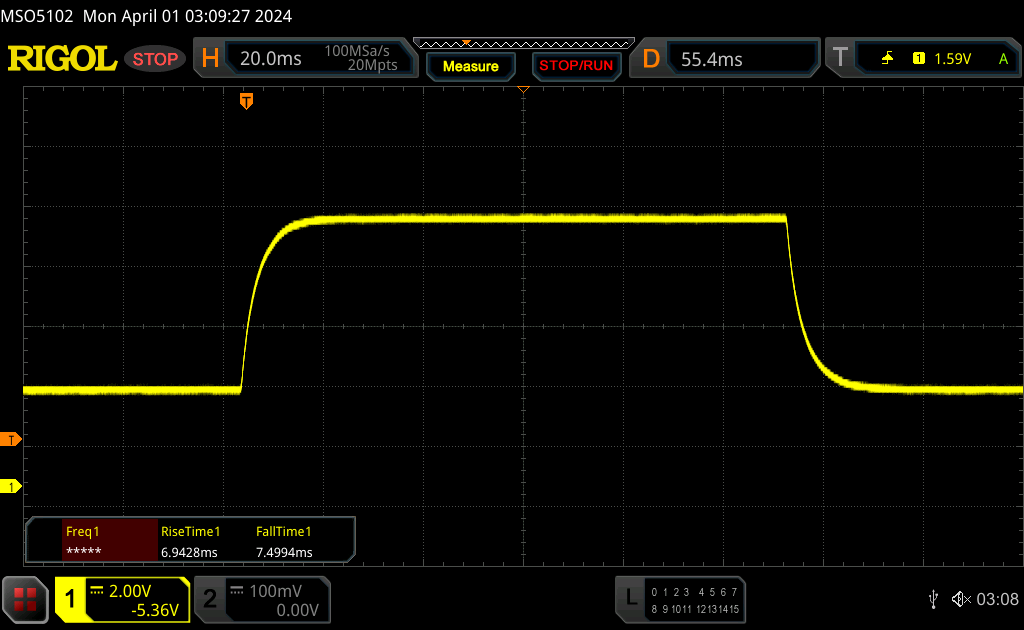 |
| ↘ 7.5 ms fall | ||
| The screen shows good response rates in our tests, but may be too slow for competitive gamers. In comparison, all tested devices range from 0.165 (minimum) to 636 (maximum) ms. » 28 % of all devices are better. This means that the measured response time is better than the average of all tested devices (31 ms). | ||
Screen Flickering / PWM (Pulse-Width Modulation)
| Screen flickering / PWM not detected | 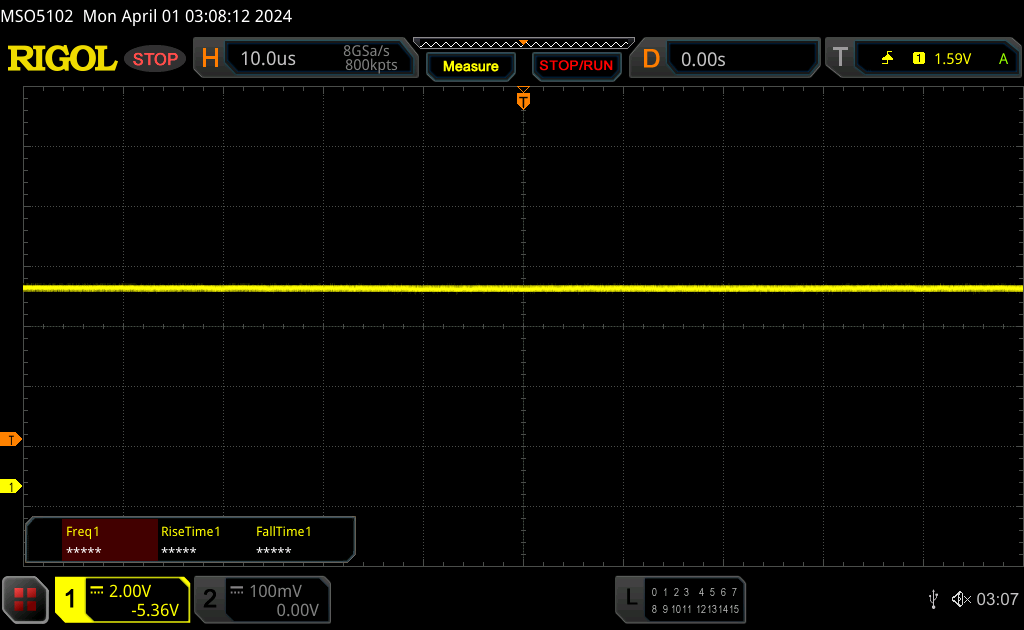 | ||
In comparison: 52 % of all tested devices do not use PWM to dim the display. If PWM was detected, an average of 7754 (minimum: 5 - maximum: 343500) Hz was measured. | |||


由于采用了哑光显示屏,该面板也可以在户外使用,但在明亮的日子里,亮度可能会更高。IPS 面板的视角稳定性非常好。

性能 - Raptor Lake HX 和超频 RTX 4070 笔记本电脑
测试条件
像往常一样,联想提供了各种能耗配置文件,我们在下表中汇总了相应的性能数据。当前配置文件也通过电源按钮的 LED 显示。我们在性能模式下进行了基准测试和测量,在该模式下 GPU 会自动略微超频(核心频率 +100 MHz,VRAM 频率 +200 MHz)。使用电池模式时,性能模式不可用。
| 能源概况 | CPU 负载 | CB R23 Multi | GPU 负载 | Time Spy 图形 | 赛博朋克 2077 QHD Ultra |
最大风扇音量 |
|---|---|---|---|---|---|---|
| 静音模式 | 65 -> 54 瓦 | 20,203 点 | 65 瓦 | 8,239 点 | 35 FPS | 38.4 dB(A) |
| 平衡 | 120 -> 85 瓦 | 24,142 点 | 95 瓦 | 9,853 点 | 41.5 FPS | 50.7 dB(A) |
| 性能模式 | 154 -> 90 瓦 | 31,127 分 | 115 瓦 | 12,174 分 | 51.4 FPS | 54.1 dB(A) |
注:我们尝试更新 Nvidia 驱动程序,但未成功。官方驱动程序因兼容性问题终止了安装。到目前为止,联想本身只提供了预装的 537.70 驱动程序,这也是我们不可避免要使用的驱动程序。
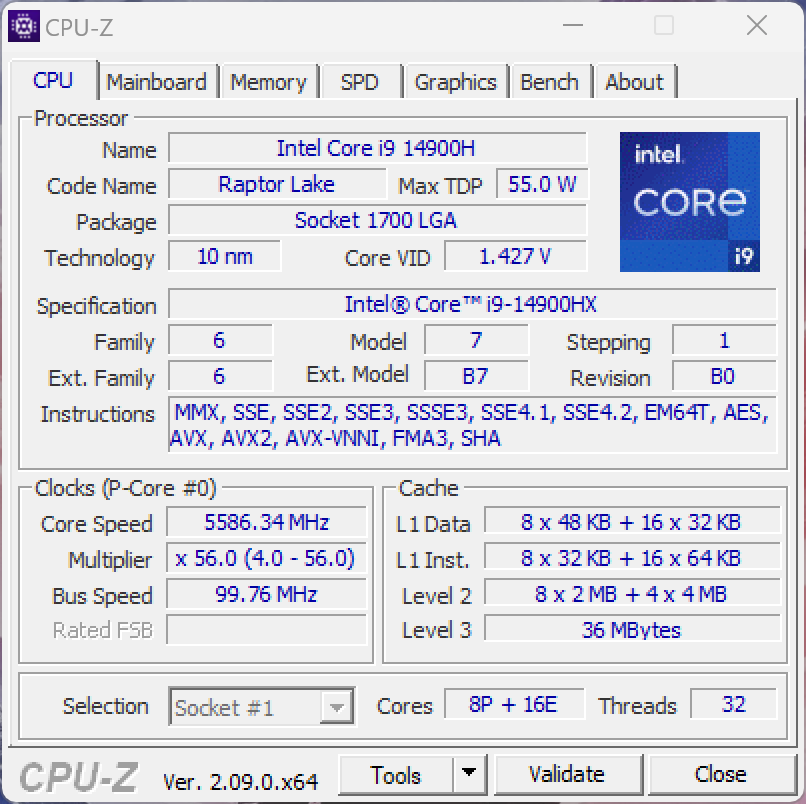
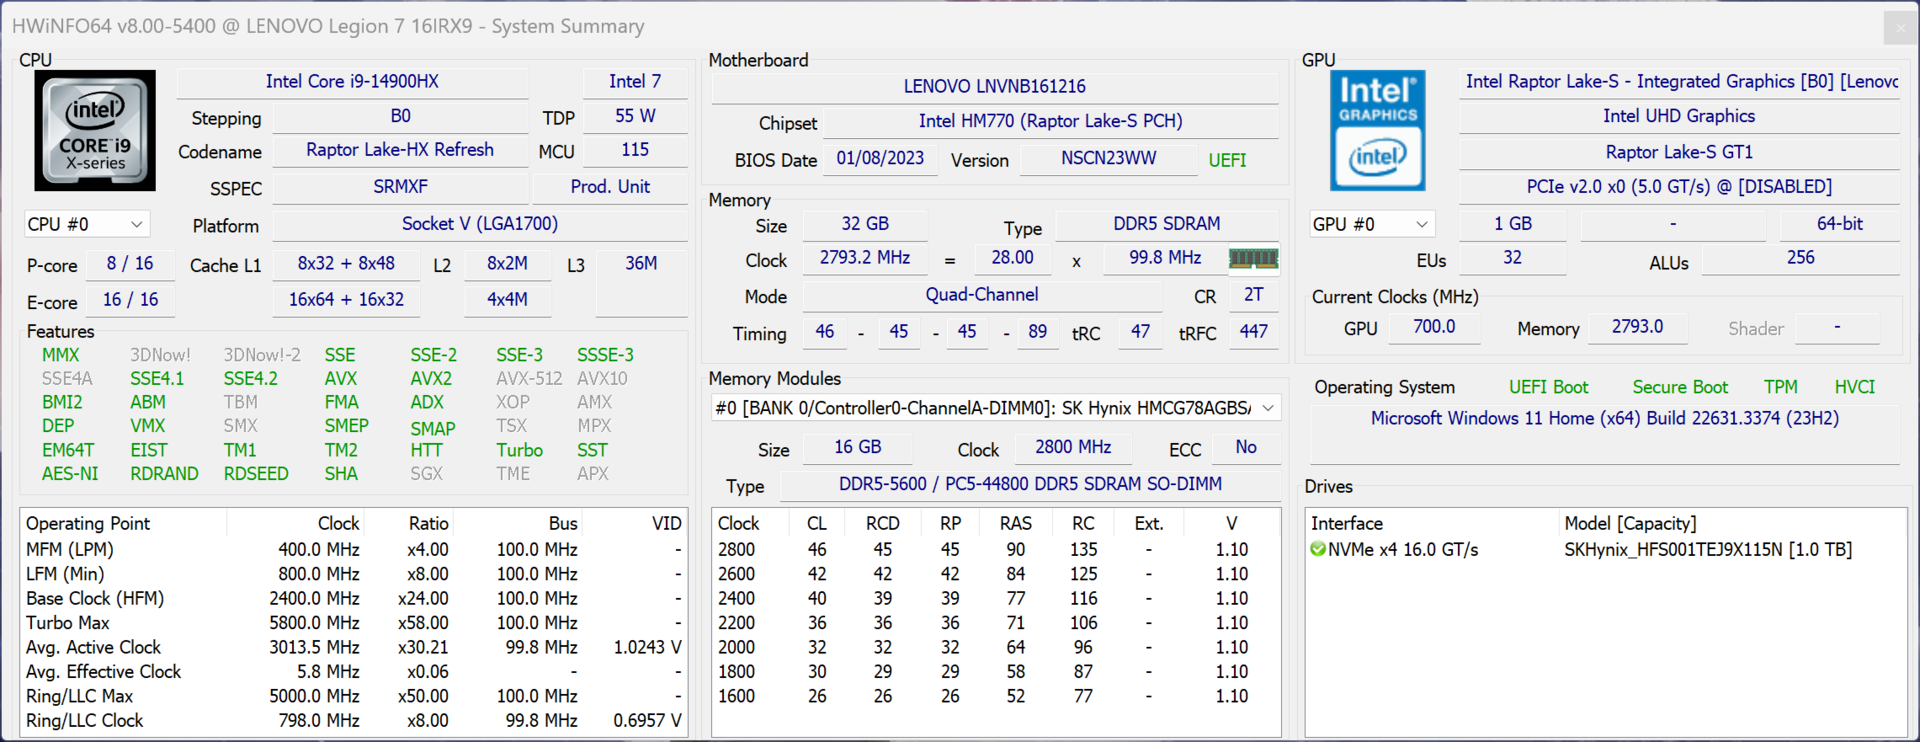
处理器 - 酷睿 i9-14900HX
联想还为普通的Legion 7 16 配备了 酷睿 i9-14900HX处理器,这是最快的 Raptor Lake 移动处理器,也可以在更昂贵的 Legion Pro 7.与两款较厚的Legion Pro 7/5 16 机型相比,较薄的机身在功耗限制方面有一定影响,在短暂达到 154 瓦之后又降至 90 瓦。总之,无论是多核测试还是单核测试,性能都非常出色。在电池模式下,处理器的最大功耗为 60 瓦,这也是多核性能降低约 40% 的原因。其他 CPU 基准测试可在 我们的技术部分.
Cinebench R15 Multi Continuous Test
Cinebench R23: Multi Core | Single Core
Cinebench R20: CPU (Multi Core) | CPU (Single Core)
Cinebench R15: CPU Multi 64Bit | CPU Single 64Bit
Blender: v2.79 BMW27 CPU
7-Zip 18.03: 7z b 4 | 7z b 4 -mmt1
Geekbench 6.7: Multi-Core | Single-Core
Geekbench 5.5: Multi-Core | Single-Core
HWBOT x265 Benchmark v2.2: 4k Preset
LibreOffice : 20 Documents To PDF
R Benchmark 2.5: Overall mean
| CPU Performance rating | |
| Lenovo Legion Pro 7 16IRX9H | |
| Lenovo Legion 7 16 IRX G9 | |
| Lenovo Legion Pro 5 16IRX9 | |
| Aorus 16X 2024 | |
| Average Intel Core i9-14900HX | |
| Average of class Gaming | |
| HP Omen Transcend 16-u1095ng | |
| Alienware m16 R2 -1! | |
| Schenker XMG CORE 16 (L23) | |
| Cinebench R23 / Multi Core | |
| Lenovo Legion Pro 7 16IRX9H | |
| Lenovo Legion 7 16 IRX G9 | |
| Lenovo Legion Pro 5 16IRX9 | |
| Average Intel Core i9-14900HX (17078 - 36249, n=37) | |
| Aorus 16X 2024 | |
| Average of class Gaming (10488 - 42661, n=107, last 2 years) | |
| HP Omen Transcend 16-u1095ng | |
| Alienware m16 R2 | |
| Schenker XMG CORE 16 (L23) | |
| Cinebench R23 / Single Core | |
| Lenovo Legion Pro 7 16IRX9H | |
| Lenovo Legion 7 16 IRX G9 | |
| Aorus 16X 2024 | |
| HP Omen Transcend 16-u1095ng | |
| Average Intel Core i9-14900HX (1720 - 2245, n=37) | |
| Lenovo Legion Pro 5 16IRX9 | |
| Average of class Gaming (1166 - 2415, n=107, last 2 years) | |
| Schenker XMG CORE 16 (L23) | |
| Alienware m16 R2 | |
| Cinebench R20 / CPU (Multi Core) | |
| Lenovo Legion Pro 7 16IRX9H | |
| Lenovo Legion 7 16 IRX G9 | |
| Lenovo Legion Pro 5 16IRX9 | |
| Average Intel Core i9-14900HX (6579 - 13832, n=37) | |
| Aorus 16X 2024 | |
| Average of class Gaming (4029 - 16433, n=106, last 2 years) | |
| HP Omen Transcend 16-u1095ng | |
| Alienware m16 R2 | |
| Schenker XMG CORE 16 (L23) | |
| Cinebench R20 / CPU (Single Core) | |
| Lenovo Legion 7 16 IRX G9 | |
| Aorus 16X 2024 | |
| HP Omen Transcend 16-u1095ng | |
| Lenovo Legion Pro 7 16IRX9H | |
| Average Intel Core i9-14900HX (657 - 859, n=37) | |
| Lenovo Legion Pro 5 16IRX9 | |
| Average of class Gaming (442 - 913, n=106, last 2 years) | |
| Schenker XMG CORE 16 (L23) | |
| Alienware m16 R2 | |
| Cinebench R15 / CPU Multi 64Bit | |
| Lenovo Legion Pro 7 16IRX9H | |
| Lenovo Legion 7 16 IRX G9 | |
| Lenovo Legion Pro 5 16IRX9 | |
| Average Intel Core i9-14900HX (3263 - 5589, n=38) | |
| Aorus 16X 2024 | |
| Average of class Gaming (1578 - 6330, n=105, last 2 years) | |
| HP Omen Transcend 16-u1095ng | |
| Alienware m16 R2 | |
| Schenker XMG CORE 16 (L23) | |
| Cinebench R15 / CPU Single 64Bit | |
| Lenovo Legion Pro 7 16IRX9H | |
| Aorus 16X 2024 | |
| Lenovo Legion 7 16 IRX G9 | |
| Average Intel Core i9-14900HX (247 - 323, n=37) | |
| Lenovo Legion Pro 5 16IRX9 | |
| HP Omen Transcend 16-u1095ng | |
| Average of class Gaming (188.8 - 350, n=106, last 2 years) | |
| Schenker XMG CORE 16 (L23) | |
| Alienware m16 R2 | |
| Blender / v2.79 BMW27 CPU | |
| Schenker XMG CORE 16 (L23) | |
| HP Omen Transcend 16-u1095ng | |
| Average of class Gaming (79 - 330, n=104, last 2 years) | |
| Aorus 16X 2024 | |
| Lenovo Legion 7 16 IRX G9 | |
| Average Intel Core i9-14900HX (91 - 206, n=37) | |
| Lenovo Legion Pro 5 16IRX9 | |
| Lenovo Legion Pro 7 16IRX9H | |
| 7-Zip 18.03 / 7z b 4 | |
| Lenovo Legion Pro 7 16IRX9H | |
| Lenovo Legion Pro 5 16IRX9 | |
| Average Intel Core i9-14900HX (66769 - 136645, n=37) | |
| Lenovo Legion 7 16 IRX G9 | |
| Aorus 16X 2024 | |
| Average of class Gaming (33491 - 148086, n=105, last 2 years) | |
| HP Omen Transcend 16-u1095ng | |
| Schenker XMG CORE 16 (L23) | |
| Alienware m16 R2 | |
| 7-Zip 18.03 / 7z b 4 -mmt1 | |
| Lenovo Legion Pro 7 16IRX9H | |
| Aorus 16X 2024 | |
| Lenovo Legion 7 16 IRX G9 | |
| HP Omen Transcend 16-u1095ng | |
| Average Intel Core i9-14900HX (5452 - 7545, n=37) | |
| Lenovo Legion Pro 5 16IRX9 | |
| Schenker XMG CORE 16 (L23) | |
| Average of class Gaming (4199 - 7436, n=105, last 2 years) | |
| Alienware m16 R2 | |
| Geekbench 6.7 / Multi-Core | |
| Lenovo Legion Pro 7 16IRX9H | |
| Lenovo Legion Pro 5 16IRX9 | |
| Lenovo Legion 7 16 IRX G9 | |
| Aorus 16X 2024 | |
| Average Intel Core i9-14900HX (13158 - 19665, n=37) | |
| HP Omen Transcend 16-u1095ng | |
| Average of class Gaming (6625 - 22850, n=106, last 2 years) | |
| Schenker XMG CORE 16 (L23) | |
| Alienware m16 R2 | |
| Geekbench 6.7 / Single-Core | |
| Aorus 16X 2024 | |
| Lenovo Legion Pro 7 16IRX9H | |
| Lenovo Legion 7 16 IRX G9 | |
| Average Intel Core i9-14900HX (2419 - 3129, n=37) | |
| Lenovo Legion Pro 5 16IRX9 | |
| Average of class Gaming (1490 - 3259, n=106, last 2 years) | |
| HP Omen Transcend 16-u1095ng | |
| Schenker XMG CORE 16 (L23) | |
| Alienware m16 R2 | |
| Geekbench 5.5 / Multi-Core | |
| Lenovo Legion Pro 5 16IRX9 | |
| Lenovo Legion Pro 7 16IRX9H | |
| Lenovo Legion 7 16 IRX G9 | |
| Aorus 16X 2024 | |
| Average Intel Core i9-14900HX (8618 - 23194, n=37) | |
| HP Omen Transcend 16-u1095ng | |
| Average of class Gaming (6460 - 28263, n=105, last 2 years) | |
| Alienware m16 R2 | |
| Schenker XMG CORE 16 (L23) | |
| Geekbench 5.5 / Single-Core | |
| Aorus 16X 2024 | |
| Lenovo Legion Pro 7 16IRX9H | |
| Lenovo Legion 7 16 IRX G9 | |
| Average Intel Core i9-14900HX (1669 - 2210, n=37) | |
| Average of class Gaming (986 - 2474, n=105, last 2 years) | |
| HP Omen Transcend 16-u1095ng | |
| Lenovo Legion Pro 5 16IRX9 | |
| Schenker XMG CORE 16 (L23) | |
| Alienware m16 R2 | |
| HWBOT x265 Benchmark v2.2 / 4k Preset | |
| Lenovo Legion Pro 7 16IRX9H | |
| Lenovo Legion Pro 5 16IRX9 | |
| Average Intel Core i9-14900HX (16.8 - 38.9, n=37) | |
| Lenovo Legion 7 16 IRX G9 | |
| Average of class Gaming (11.5 - 44.4, n=105, last 2 years) | |
| Aorus 16X 2024 | |
| HP Omen Transcend 16-u1095ng | |
| Schenker XMG CORE 16 (L23) | |
| Alienware m16 R2 | |
| LibreOffice / 20 Documents To PDF | |
| Schenker XMG CORE 16 (L23) | |
| HP Omen Transcend 16-u1095ng | |
| Alienware m16 R2 | |
| Average of class Gaming (33.2 - 88.8, n=105, last 2 years) | |
| Lenovo Legion 7 16 IRX G9 | |
| Average Intel Core i9-14900HX (19 - 85.1, n=37) | |
| Lenovo Legion Pro 5 16IRX9 | |
| Aorus 16X 2024 | |
| Lenovo Legion Pro 7 16IRX9H | |
| R Benchmark 2.5 / Overall mean | |
| Alienware m16 R2 | |
| Schenker XMG CORE 16 (L23) | |
| Average of class Gaming (0.3439 - 0.759, n=106, last 2 years) | |
| HP Omen Transcend 16-u1095ng | |
| Lenovo Legion 7 16 IRX G9 | |
| Lenovo Legion Pro 5 16IRX9 | |
| Lenovo Legion Pro 7 16IRX9H | |
| Average Intel Core i9-14900HX (0.3604 - 0.4859, n=37) | |
| Aorus 16X 2024 | |
* ... smaller is better
AIDA64: FP32 Ray-Trace | FPU Julia | CPU SHA3 | CPU Queen | FPU SinJulia | FPU Mandel | CPU AES | CPU ZLib | FP64 Ray-Trace | CPU PhotoWorxx
| Performance rating | |
| Lenovo Legion Pro 7 16IRX9H | |
| Average of class Gaming | |
| Lenovo Legion Pro 5 16IRX9 | |
| Average Intel Core i9-14900HX | |
| Aorus 16X 2024 | |
| Lenovo Legion 7 16 IRX G9 | |
| Schenker XMG CORE 16 (L23) | |
| HP Omen Transcend 16-u1095ng | |
| Alienware m16 R2 | |
| AIDA64 / FP32 Ray-Trace | |
| Average of class Gaming (10227 - 85542, n=105, last 2 years) | |
| Lenovo Legion Pro 7 16IRX9H | |
| Schenker XMG CORE 16 (L23) | |
| Lenovo Legion 7 16 IRX G9 | |
| Lenovo Legion Pro 5 16IRX9 | |
| Average Intel Core i9-14900HX (13098 - 33474, n=36) | |
| Aorus 16X 2024 | |
| Alienware m16 R2 | |
| HP Omen Transcend 16-u1095ng | |
| AIDA64 / FPU Julia | |
| Average of class Gaming (51376 - 238426, n=105, last 2 years) | |
| Lenovo Legion Pro 7 16IRX9H | |
| Lenovo Legion Pro 5 16IRX9 | |
| Average Intel Core i9-14900HX (67573 - 166040, n=36) | |
| Schenker XMG CORE 16 (L23) | |
| Lenovo Legion 7 16 IRX G9 | |
| Aorus 16X 2024 | |
| Alienware m16 R2 | |
| HP Omen Transcend 16-u1095ng | |
| AIDA64 / CPU SHA3 | |
| Lenovo Legion Pro 7 16IRX9H | |
| Average of class Gaming (2180 - 10115, n=105, last 2 years) | |
| Lenovo Legion Pro 5 16IRX9 | |
| Average Intel Core i9-14900HX (3589 - 7979, n=36) | |
| Aorus 16X 2024 | |
| Lenovo Legion 7 16 IRX G9 | |
| Schenker XMG CORE 16 (L23) | |
| HP Omen Transcend 16-u1095ng | |
| Alienware m16 R2 | |
| AIDA64 / CPU Queen | |
| Lenovo Legion Pro 7 16IRX9H | |
| Lenovo Legion Pro 5 16IRX9 | |
| Lenovo Legion 7 16 IRX G9 | |
| Aorus 16X 2024 | |
| Average Intel Core i9-14900HX (118405 - 148966, n=36) | |
| HP Omen Transcend 16-u1095ng | |
| Average of class Gaming (49785 - 173351, n=90, last 2 years) | |
| Schenker XMG CORE 16 (L23) | |
| Alienware m16 R2 | |
| AIDA64 / FPU SinJulia | |
| Lenovo Legion Pro 7 16IRX9H | |
| Lenovo Legion Pro 5 16IRX9 | |
| Average Intel Core i9-14900HX (10475 - 18517, n=36) | |
| Schenker XMG CORE 16 (L23) | |
| Aorus 16X 2024 | |
| Average of class Gaming (4424 - 33636, n=105, last 2 years) | |
| Lenovo Legion 7 16 IRX G9 | |
| HP Omen Transcend 16-u1095ng | |
| Alienware m16 R2 | |
| AIDA64 / FPU Mandel | |
| Average of class Gaming (25115 - 128721, n=105, last 2 years) | |
| Lenovo Legion Pro 7 16IRX9H | |
| Schenker XMG CORE 16 (L23) | |
| Lenovo Legion Pro 5 16IRX9 | |
| Average Intel Core i9-14900HX (32543 - 83662, n=36) | |
| Aorus 16X 2024 | |
| Alienware m16 R2 | |
| Lenovo Legion 7 16 IRX G9 | |
| HP Omen Transcend 16-u1095ng | |
| AIDA64 / CPU AES | |
| Average Intel Core i9-14900HX (86964 - 241777, n=36) | |
| Lenovo Legion Pro 7 16IRX9H | |
| Lenovo Legion Pro 5 16IRX9 | |
| Aorus 16X 2024 | |
| Lenovo Legion 7 16 IRX G9 | |
| Average of class Gaming (39258 - 247074, n=105, last 2 years) | |
| Schenker XMG CORE 16 (L23) | |
| HP Omen Transcend 16-u1095ng | |
| Alienware m16 R2 | |
| AIDA64 / CPU ZLib | |
| Lenovo Legion Pro 7 16IRX9H | |
| Lenovo Legion Pro 5 16IRX9 | |
| Average Intel Core i9-14900HX (1054 - 2292, n=36) | |
| Aorus 16X 2024 | |
| Lenovo Legion 7 16 IRX G9 | |
| Average of class Gaming (574 - 2531, n=105, last 2 years) | |
| HP Omen Transcend 16-u1095ng | |
| Alienware m16 R2 | |
| Schenker XMG CORE 16 (L23) | |
| AIDA64 / FP64 Ray-Trace | |
| Average of class Gaming (5509 - 45446, n=105, last 2 years) | |
| Lenovo Legion Pro 7 16IRX9H | |
| Schenker XMG CORE 16 (L23) | |
| Lenovo Legion Pro 5 16IRX9 | |
| Average Intel Core i9-14900HX (6809 - 18349, n=36) | |
| Lenovo Legion 7 16 IRX G9 | |
| Aorus 16X 2024 | |
| Alienware m16 R2 | |
| HP Omen Transcend 16-u1095ng | |
| AIDA64 / CPU PhotoWorxx | |
| Lenovo Legion Pro 5 16IRX9 | |
| HP Omen Transcend 16-u1095ng | |
| Aorus 16X 2024 | |
| Lenovo Legion 7 16 IRX G9 | |
| Lenovo Legion Pro 7 16IRX9H | |
| Average Intel Core i9-14900HX (23903 - 54702, n=36) | |
| Average of class Gaming (12271 - 89891, n=105, last 2 years) | |
| Schenker XMG CORE 16 (L23) | |
| Alienware m16 R2 | |
系统性能
主观性能印象极佳,基准测试也没有发现任何问题。 只有在图形模式之间切换时偶尔会出现卡顿,例如在游戏启动时。对于使用高级擎天柱的笔记本电脑来说,这种情况很正常。
CrossMark: Overall | Productivity | Creativity | Responsiveness
WebXPRT 3: Overall
WebXPRT 4: Overall
Mozilla Kraken 1.1: Total
| PCMark 10 / Score | |
| Lenovo Legion Pro 7 16IRX9H | |
| Lenovo Legion Pro 5 16IRX9 | |
| Average of class Gaming (5828 - 12414, n=93, last 2 years) | |
| Aorus 16X 2024 | |
| Average Intel Core i9-14900HX, NVIDIA GeForce RTX 4070 Laptop GPU (7768 - 8550, n=8) | |
| Schenker XMG CORE 16 (L23) | |
| Lenovo Legion 7 16 IRX G9 | |
| HP Omen Transcend 16-u1095ng | |
| Alienware m16 R2 | |
| PCMark 10 / Essentials | |
| Lenovo Legion Pro 7 16IRX9H | |
| Lenovo Legion Pro 5 16IRX9 | |
| Aorus 16X 2024 | |
| Lenovo Legion 7 16 IRX G9 | |
| Schenker XMG CORE 16 (L23) | |
| Average Intel Core i9-14900HX, NVIDIA GeForce RTX 4070 Laptop GPU (10104 - 11815, n=8) | |
| Average of class Gaming (8810 - 11935, n=97, last 2 years) | |
| HP Omen Transcend 16-u1095ng | |
| Alienware m16 R2 | |
| PCMark 10 / Productivity | |
| Lenovo Legion Pro 7 16IRX9H | |
| Average of class Gaming (6845 - 25323, n=95, last 2 years) | |
| Aorus 16X 2024 | |
| Schenker XMG CORE 16 (L23) | |
| Average Intel Core i9-14900HX, NVIDIA GeForce RTX 4070 Laptop GPU (9577 - 11103, n=8) | |
| HP Omen Transcend 16-u1095ng | |
| Lenovo Legion Pro 5 16IRX9 | |
| Lenovo Legion 7 16 IRX G9 | |
| Alienware m16 R2 | |
| PCMark 10 / Digital Content Creation | |
| Lenovo Legion Pro 5 16IRX9 | |
| Lenovo Legion Pro 7 16IRX9H | |
| Average of class Gaming (7602 - 19954, n=95, last 2 years) | |
| Lenovo Legion 7 16 IRX G9 | |
| Average Intel Core i9-14900HX, NVIDIA GeForce RTX 4070 Laptop GPU (12114 - 14827, n=8) | |
| Aorus 16X 2024 | |
| Alienware m16 R2 | |
| Schenker XMG CORE 16 (L23) | |
| HP Omen Transcend 16-u1095ng | |
| CrossMark / Overall | |
| Lenovo Legion Pro 7 16IRX9H | |
| Aorus 16X 2024 | |
| Lenovo Legion 7 16 IRX G9 | |
| Average Intel Core i9-14900HX, NVIDIA GeForce RTX 4070 Laptop GPU (2002 - 2312, n=7) | |
| Lenovo Legion Pro 5 16IRX9 | |
| Average of class Gaming (1366 - 2409, n=94, last 2 years) | |
| Alienware m16 R2 | |
| Schenker XMG CORE 16 (L23) | |
| CrossMark / Productivity | |
| Lenovo Legion Pro 7 16IRX9H | |
| Aorus 16X 2024 | |
| Lenovo Legion 7 16 IRX G9 | |
| Average Intel Core i9-14900HX, NVIDIA GeForce RTX 4070 Laptop GPU (1827 - 2191, n=7) | |
| Average of class Gaming (1386 - 2254, n=94, last 2 years) | |
| Lenovo Legion Pro 5 16IRX9 | |
| Alienware m16 R2 | |
| Schenker XMG CORE 16 (L23) | |
| CrossMark / Creativity | |
| Lenovo Legion Pro 7 16IRX9H | |
| Aorus 16X 2024 | |
| Lenovo Legion 7 16 IRX G9 | |
| Average Intel Core i9-14900HX, NVIDIA GeForce RTX 4070 Laptop GPU (2258 - 2458, n=7) | |
| Lenovo Legion Pro 5 16IRX9 | |
| Average of class Gaming (1343 - 2786, n=94, last 2 years) | |
| Alienware m16 R2 | |
| Schenker XMG CORE 16 (L23) | |
| CrossMark / Responsiveness | |
| Lenovo Legion 7 16 IRX G9 | |
| Aorus 16X 2024 | |
| Lenovo Legion Pro 7 16IRX9H | |
| Average Intel Core i9-14900HX, NVIDIA GeForce RTX 4070 Laptop GPU (1734 - 2330, n=7) | |
| Lenovo Legion Pro 5 16IRX9 | |
| Average of class Gaming (1226 - 2334, n=94, last 2 years) | |
| Alienware m16 R2 | |
| Schenker XMG CORE 16 (L23) | |
| WebXPRT 3 / Overall | |
| Lenovo Legion Pro 7 16IRX9H | |
| HP Omen Transcend 16-u1095ng | |
| Lenovo Legion 7 16 IRX G9 | |
| Aorus 16X 2024 | |
| Lenovo Legion Pro 5 16IRX9 | |
| Average Intel Core i9-14900HX, NVIDIA GeForce RTX 4070 Laptop GPU (269 - 342, n=8) | |
| Average of class Gaming (220 - 532, n=98, last 2 years) | |
| Alienware m16 R2 | |
| Schenker XMG CORE 16 (L23) | |
| WebXPRT 4 / Overall | |
| Lenovo Legion Pro 7 16IRX9H | |
| Average Intel Core i9-14900HX, NVIDIA GeForce RTX 4070 Laptop GPU (291 - 304, n=6) | |
| Lenovo Legion 7 16 IRX G9 | |
| Lenovo Legion Pro 5 16IRX9 | |
| Average of class Gaming (165 - 354, n=98, last 2 years) | |
| Alienware m16 R2 | |
| Mozilla Kraken 1.1 / Total | |
| Alienware m16 R2 | |
| Schenker XMG CORE 16 (L23) | |
| Average of class Gaming (391 - 590, n=100, last 2 years) | |
| Lenovo Legion Pro 5 16IRX9 | |
| Average Intel Core i9-14900HX, NVIDIA GeForce RTX 4070 Laptop GPU (431 - 469, n=8) | |
| Lenovo Legion 7 16 IRX G9 | |
| Lenovo Legion Pro 7 16IRX9H | |
| HP Omen Transcend 16-u1095ng | |
| Aorus 16X 2024 | |
* ... smaller is better
| PCMark 10 Score | 8023 points | |
Help | ||
| AIDA64 / Memory Copy | |
| Lenovo Legion Pro 5 16IRX9 | |
| Lenovo Legion 7 16 IRX G9 | |
| Aorus 16X 2024 | |
| Lenovo Legion Pro 7 16IRX9H | |
| HP Omen Transcend 16-u1095ng | |
| Average Intel Core i9-14900HX (38028 - 83392, n=36) | |
| Average of class Gaming (21750 - 129946, n=105, last 2 years) | |
| Schenker XMG CORE 16 (L23) | |
| Alienware m16 R2 | |
| AIDA64 / Memory Read | |
| Aorus 16X 2024 | |
| Lenovo Legion Pro 5 16IRX9 | |
| Lenovo Legion Pro 7 16IRX9H | |
| Lenovo Legion 7 16 IRX G9 | |
| HP Omen Transcend 16-u1095ng | |
| Average Intel Core i9-14900HX (43306 - 87568, n=36) | |
| Alienware m16 R2 | |
| Average of class Gaming (22956 - 118858, n=105, last 2 years) | |
| Schenker XMG CORE 16 (L23) | |
| AIDA64 / Memory Write | |
| Schenker XMG CORE 16 (L23) | |
| HP Omen Transcend 16-u1095ng | |
| Aorus 16X 2024 | |
| Lenovo Legion Pro 5 16IRX9 | |
| Average of class Gaming (22297 - 135096, n=105, last 2 years) | |
| Lenovo Legion 7 16 IRX G9 | |
| Average Intel Core i9-14900HX (37146 - 80589, n=36) | |
| Lenovo Legion Pro 7 16IRX9H | |
| Alienware m16 R2 | |
| AIDA64 / Memory Latency | |
| Alienware m16 R2 | |
| Average of class Gaming (75.3 - 259, n=105, last 2 years) | |
| Schenker XMG CORE 16 (L23) | |
| HP Omen Transcend 16-u1095ng | |
| Average Intel Core i9-14900HX (76.1 - 105, n=36) | |
| Lenovo Legion 7 16 IRX G9 | |
| Lenovo Legion Pro 5 16IRX9 | |
| Aorus 16X 2024 | |
| Lenovo Legion Pro 7 16IRX9H | |
* ... smaller is better
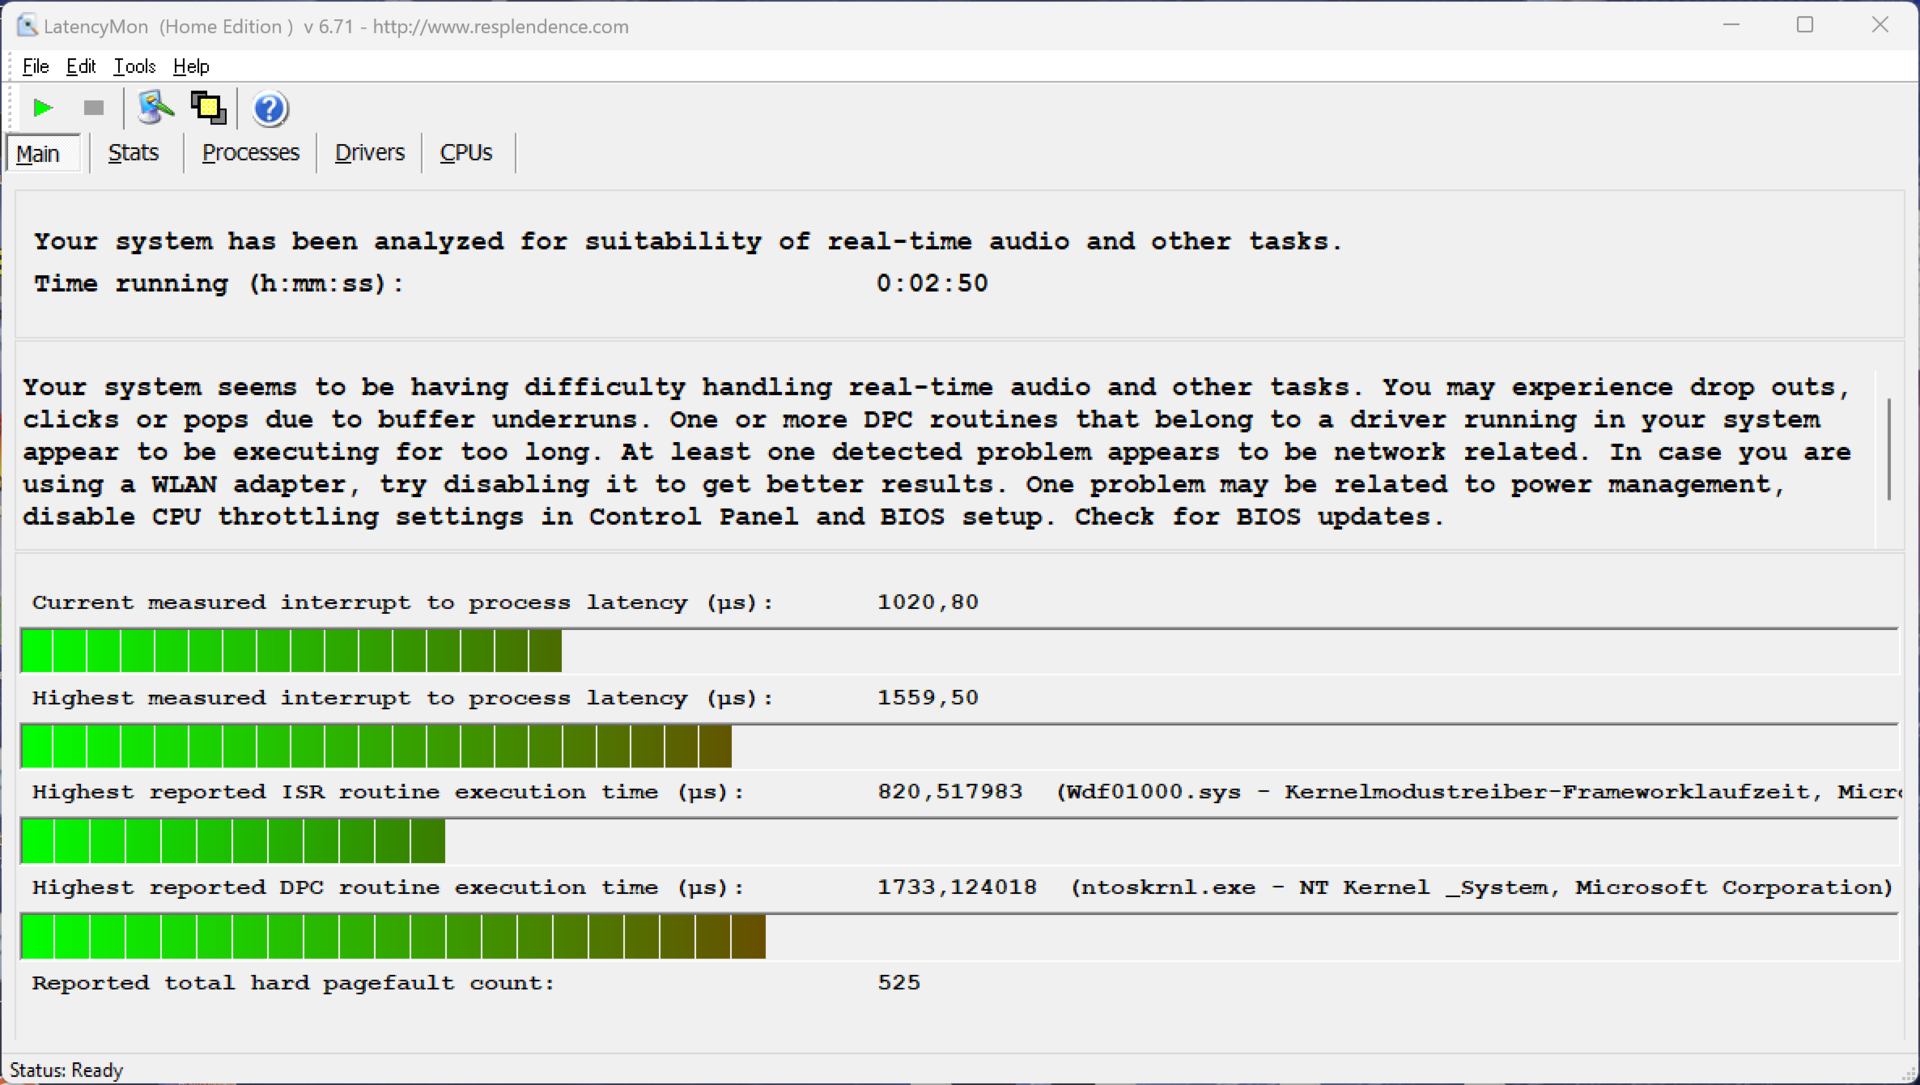
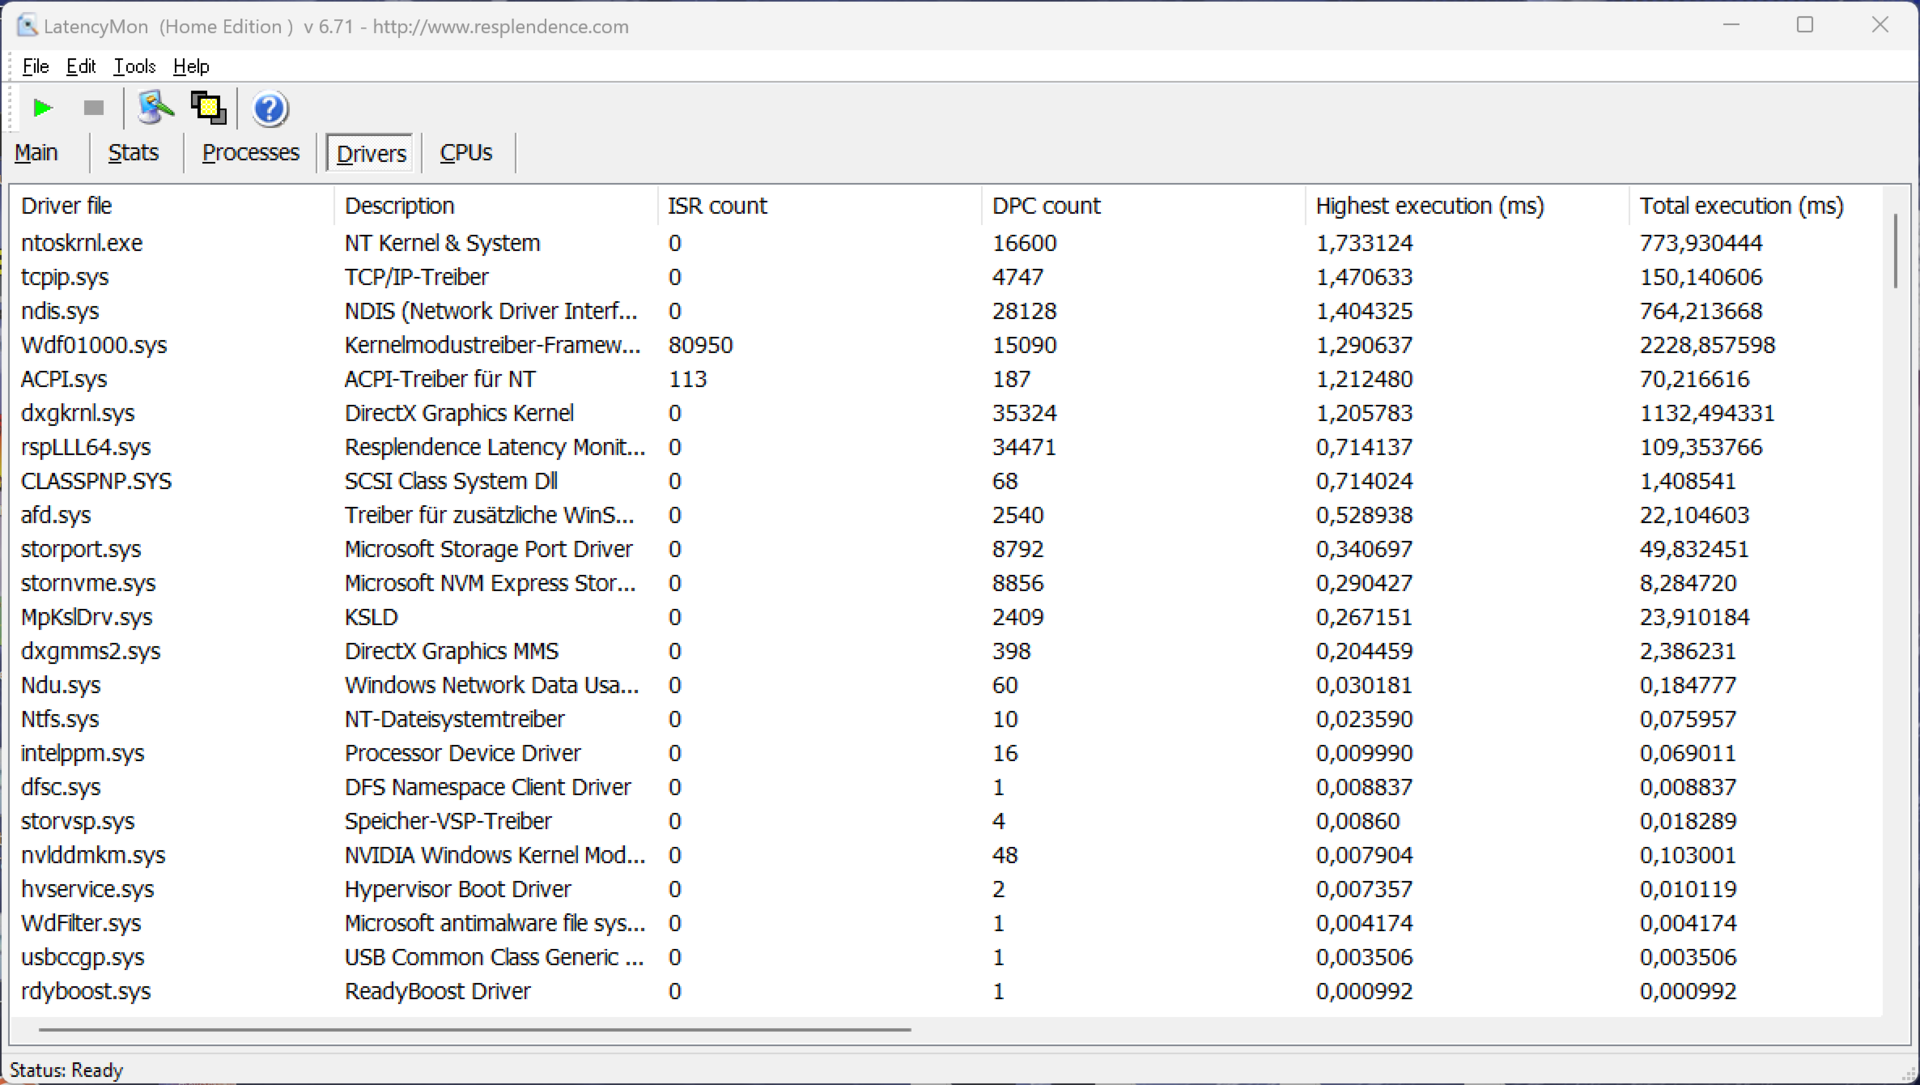
DPC 延迟
在我们使用当前 BIOS 版本进行的标准化延迟测试(上网、4K YouTube 播放、CPU 负载)中,评测设备在使用实时音频应用程序时表现出了一些局限性。
| DPC Latencies / LatencyMon - interrupt to process latency (max), Web, Youtube, Prime95 | |
| Alienware m16 R2 | |
| HP Omen Transcend 16-u1095ng | |
| Lenovo Legion 7 16 IRX G9 | |
| Lenovo Legion Pro 7 16IRX9H | |
| Aorus 16X 2024 | |
| Lenovo Legion Pro 5 16IRX9 | |
| Schenker XMG CORE 16 (L23) | |
* ... smaller is better
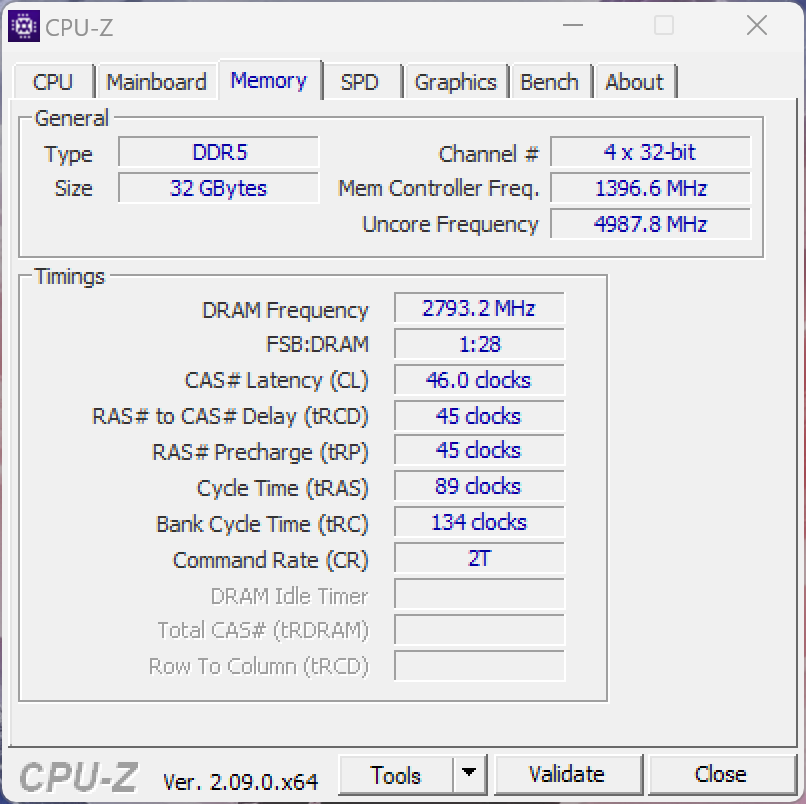
大容量存储器
在评测设备中,联想安装了 SK Hynix 1 TB PCIe 4.0 固态硬盘,但首次启动后,用户可使用 877 GB。该固态硬盘的传输速度高达 7 GB/s,非常快,总体而言,比竞争对手要快一些。不过,虽然在持续负载下性能并不总是保持稳定,但在日常情况下你并不会注意到这一点。其他固态硬盘基准测试 在此列出.

* ... smaller is better
Continuous Performance Read: DiskSpd Read Loop, Queue Depth 8
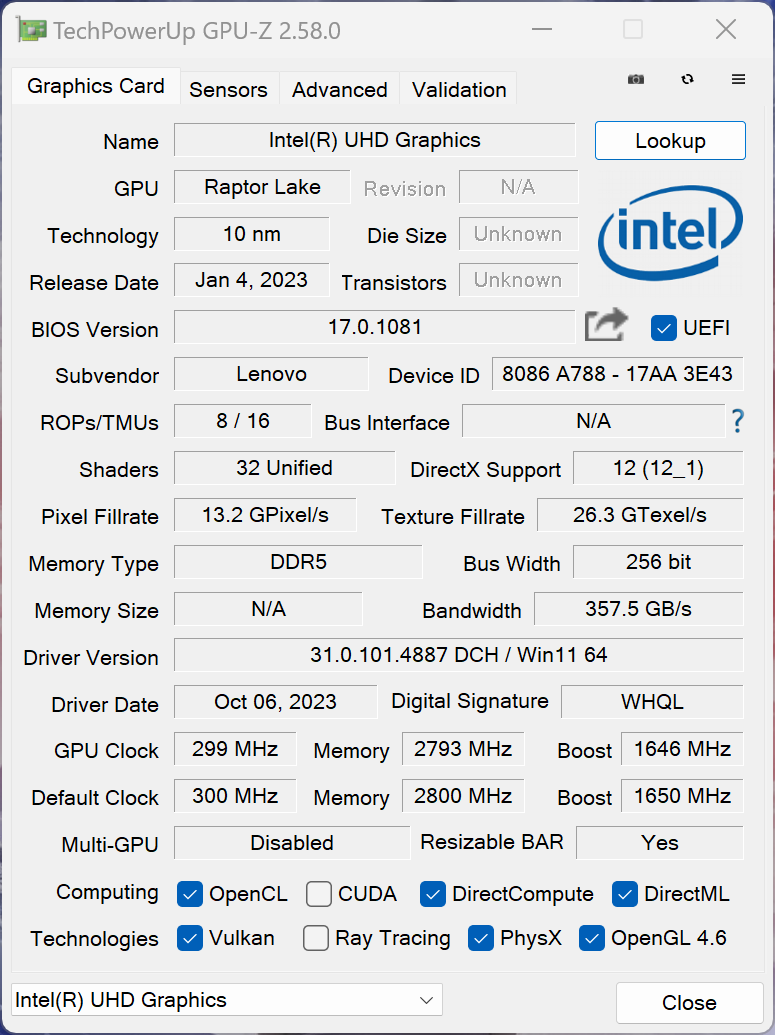
显卡 -GeForce RTX 4070 笔记本电脑
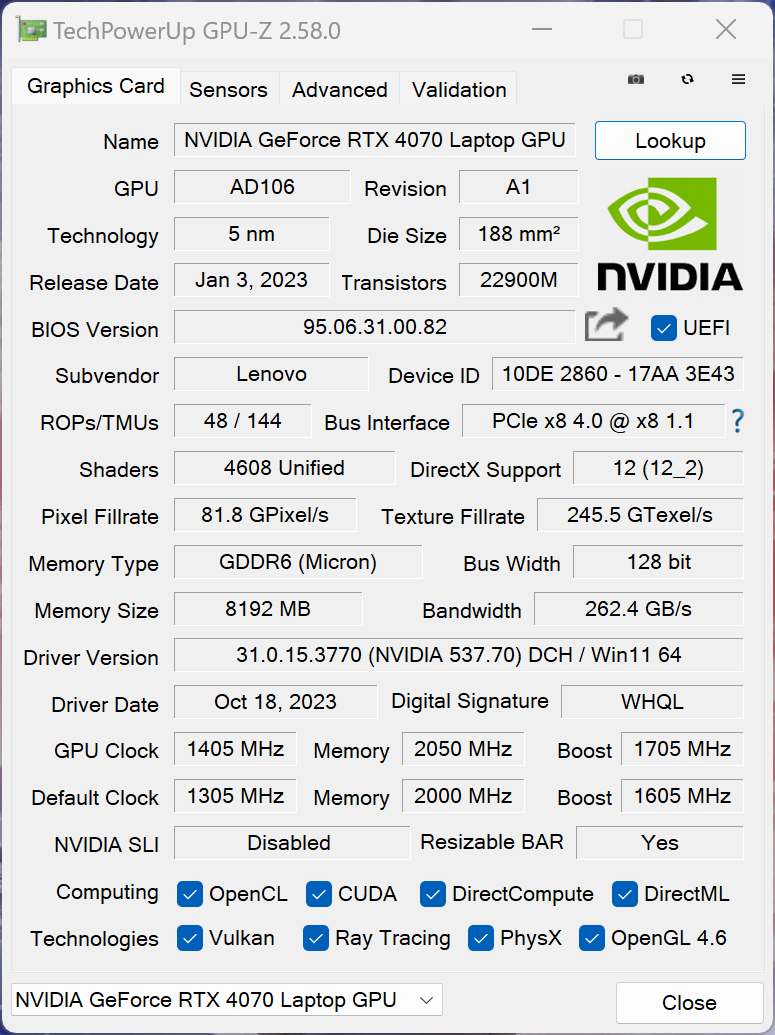
我们的评测设备配备了 RTX 4070 笔记本电脑虽然我们实际使用的是 115 瓦版本。此外,在性能模式下,GPU 还略微超频。在合成基准测试中,配备 140 瓦版本的Legion 7 16 稍微落后于竞争对手。不过,正如我们即将看到的那样,这与游戏基准无关,因为 RTX 4070 笔记本电脑无论如何都无法消耗掉 140 瓦的全部功率。Legion 支持高级 Optimus 显卡开关。
在持续负载下,GPU 保持完全稳定,在电池模式下,功耗限制在 50 瓦。这就是性能降低约 35% 的原因。其他 GPU 基准测试 在此列出.
| 3DMark 11 Performance | 35070 points | |
| 3DMark Fire Strike Score | 25692 points | |
| 3DMark Time Spy Score | 12844 points | |
Help | ||
| Blender / v3.3 Classroom OPTIX/RTX | |
| HP Omen Transcend 16-u1095ng | |
| Average NVIDIA GeForce RTX 4070 Laptop GPU (18 - 30, n=68) | |
| Schenker XMG CORE 16 (L23) | |
| Alienware m16 R2 | |
| Aorus 16X 2024 | |
| Lenovo Legion 7 16 IRX G9 | |
| Lenovo Legion Pro 5 16IRX9 | |
| Average of class Gaming (9 - 32, n=106, last 2 years) | |
| Lenovo Legion Pro 7 16IRX9H | |
| Blender / v3.3 Classroom CUDA | |
| HP Omen Transcend 16-u1095ng | |
| Average NVIDIA GeForce RTX 4070 Laptop GPU (32 - 50, n=67) | |
| Alienware m16 R2 | |
| Average of class Gaming (15 - 228, n=106, last 2 years) | |
| Schenker XMG CORE 16 (L23) | |
| Lenovo Legion Pro 5 16IRX9 | |
| Aorus 16X 2024 | |
| Lenovo Legion 7 16 IRX G9 | |
| Lenovo Legion Pro 7 16IRX9H | |
| Blender / v3.3 Classroom CPU | |
| Schenker XMG CORE 16 (L23) | |
| HP Omen Transcend 16-u1095ng | |
| Alienware m16 R2 | |
| Average NVIDIA GeForce RTX 4070 Laptop GPU (158 - 440, n=67) | |
| Average of class Gaming (122 - 565, n=102, last 2 years) | |
| Aorus 16X 2024 | |
| Lenovo Legion 7 16 IRX G9 | |
| Lenovo Legion Pro 5 16IRX9 | |
| Lenovo Legion Pro 7 16IRX9H | |
* ... smaller is better
游戏性能
Legion 7 16 的游戏性能非常出色,可以 QHD 分辨率和最高细节流畅播放所有现代游戏。即使在原始分辨率下,性能也应该足够,如果需要,还可以激活 DLSS 升频。在游戏测试对比中,评测设备的得分略高于合成测试,即使在较长时间的游戏过程中,性能也能保持完全稳定。其他游戏基准测试可在 这里.
| The Witcher 3 - 1920x1080 Ultra Graphics & Postprocessing (HBAO+) | |
| Average of class Gaming (104.7 - 240, n=7, last 2 years) | |
| Lenovo Legion Pro 7 16IRX9H | |
| Lenovo Legion Pro 5 16IRX9 | |
| Aorus 16X 2024 | |
| Alienware m16 R2 | |
| Schenker XMG CORE 16 (L23) | |
| HP Omen Transcend 16-u1095ng | |
| Lenovo Legion 7 16 IRX G9 | |
| GTA V - 1920x1080 Highest AA:4xMSAA + FX AF:16x | |
| Lenovo Legion Pro 7 16IRX9H | |
| Average of class Gaming (48.3 - 186.9, n=94, last 2 years) | |
| Lenovo Legion Pro 5 16IRX9 | |
| Lenovo Legion 7 16 IRX G9 | |
| Schenker XMG CORE 16 (L23) | |
| HP Omen Transcend 16-u1095ng | |
| Aorus 16X 2024 | |
| Final Fantasy XV Benchmark - 1920x1080 High Quality | |
| Lenovo Legion Pro 7 16IRX9H | |
| Average of class Gaming (41 - 215, n=95, last 2 years) | |
| Lenovo Legion Pro 5 16IRX9 | |
| Schenker XMG CORE 16 (L23) | |
| Lenovo Legion 7 16 IRX G9 | |
| Alienware m16 R2 | |
| Aorus 16X 2024 | |
| HP Omen Transcend 16-u1095ng | |
| Dota 2 Reborn - 1920x1080 ultra (3/3) best looking | |
| Lenovo Legion Pro 5 16IRX9 | |
| Lenovo Legion Pro 7 16IRX9H | |
| Aorus 16X 2024 | |
| Lenovo Legion 7 16 IRX G9 | |
| HP Omen Transcend 16-u1095ng | |
| Average of class Gaming (84.8 - 248, n=107, last 2 years) | |
| Alienware m16 R2 | |
| Schenker XMG CORE 16 (L23) | |
| Horizon Forbidden West | |
| 1920x1080 Very High Preset AA:T | |
| Lenovo Legion Pro 7 16IRX9H | |
| Average of class Gaming (14.7 - 140.3, n=12, last 2 years) | |
| Aorus 16X 2024 | |
| Lenovo Legion 7 16 IRX G9 | |
| Average NVIDIA GeForce RTX 4070 Laptop GPU (53.2 - 76.7, n=10) | |
| 2560x1440 Very High Preset AA:T | |
| Lenovo Legion Pro 7 16IRX9H | |
| Average of class Gaming (45.7 - 100.9, n=9, last 2 years) | |
| Aorus 16X 2024 | |
| Average NVIDIA GeForce RTX 4070 Laptop GPU (40.3 - 59.1, n=9) | |
| Lenovo Legion 7 16 IRX G9 | |
Witcher 3 FPS diagram
| low | med. | high | ultra | QHD | |
|---|---|---|---|---|---|
| GTA V (2015) | 182.4 | 124.1 | 94.2 | ||
| The Witcher 3 (2015) | 246 | 113.1 | 92 | ||
| Dota 2 Reborn (2015) | 230 | 205 | 193.4 | 179.5 | |
| Final Fantasy XV Benchmark (2018) | 223 | 166.8 | 119.8 | 89.1 | |
| X-Plane 11.11 (2018) | 198 | 180.6 | 138.2 | ||
| Far Cry 5 (2018) | 193 | 166 | 157 | 146 | 115 |
| Strange Brigade (2018) | 436 | 311 | 250 | 220 | 143 |
| F1 23 (2023) | 287 | 284 | 222 | 70.1 | 43.9 |
| Baldur's Gate 3 (2023) | 155.6 | 127.9 | 115.7 | 115 | 71.9 |
| Cyberpunk 2077 (2023) | 129.7 | 117.1 | 99.6 | 85.2 | 51.4 |
| Horizon Forbidden West (2024) | 107.1 | 103.4 | 73.2 | 64.4 | 49.9 |
排放 - 噪音大但冷却效果好
噪音排放
在执行简单任务时,Legion 7 16 的散热功能经常处于停用状态,即使在性能模式下也是如此。在日常情况下,您可以放心地切换到静音模式,将风扇噪音降至最低。静音模式下的最大噪音为 38.4 dB(A),在不戴耳机的情况下也仍然可以播放,但在其他两种模式下,50 和 54 dB(A) 的噪音都太大了。尽管如此,两款 Legion Pro 5和 Legion Pro 7的声音还要大一些。在负载期间,风扇也会迅速降低转速。评测设备中没有其他电子噪音。
Noise level
| Idle |
| 24.5 / 24.5 / 24.5 dB(A) |
| Load |
| 34.8 / 54.1 dB(A) |
 | ||
30 dB silent 40 dB(A) audible 50 dB(A) loud |
||
min: | ||
| Lenovo Legion 7 16 IRX G9 GeForce RTX 4070 Laptop GPU, i9-14900HX, SK Hynix HFS001TEJ9X115N | Lenovo Legion Pro 5 16IRX9 GeForce RTX 4070 Laptop GPU, i9-14900HX, Samsung PM9A1 MZVL21T0HCLR | Aorus 16X 2024 GeForce RTX 4070 Laptop GPU, i9-14900HX, Gigabyte AG450E1024-SI | HP Omen Transcend 16-u1095ng GeForce RTX 4070 Laptop GPU, i9-14900HX, Kioxia XG8 KXG80ZNV1T02 | Alienware m16 R2 GeForce RTX 4070 Laptop GPU, Ultra 7 155H, Samsung PM9A1 MZVL21T0HCLR | Schenker XMG CORE 16 (L23) GeForce RTX 4070 Laptop GPU, R7 7840HS, Samsung 990 Pro 1 TB | Lenovo Legion Pro 7 16IRX9H GeForce RTX 4080 Laptop GPU, i9-14900HX, SK Hynix HFS001TEJ9X115N | |
|---|---|---|---|---|---|---|---|
| Noise | -6% | -21% | -9% | -2% | -1% | -22% | |
| off / environment * (dB) | 24.5 | 23.9 2% | 26 -6% | 24 2% | 24.7 -1% | 23 6% | 24 2% |
| Idle Minimum * (dB) | 24.5 | 24.3 1% | 26 -6% | 29 -18% | 25.3 -3% | 23 6% | 25 -2% |
| Idle Average * (dB) | 24.5 | 24.3 1% | 32 -31% | 30 -22% | 25.3 -3% | 28.48 -16% | 30 -22% |
| Idle Maximum * (dB) | 24.5 | 28.9 -18% | 38 -55% | 31 -27% | 25.3 -3% | 28.48 -16% | 45 -84% |
| Load Average * (dB) | 34.8 | 45.8 -32% | 54 -55% | 45 -29% | 31.7 9% | 30 14% | 50 -44% |
| Witcher 3 ultra * (dB) | 54.1 | 51 6% | 50 8% | 44 19% | 53.8 1% | 54.12 -0% | 54 -0% |
| Load Maximum * (dB) | 54.1 | 56.6 -5% | 55 -2% | 47 13% | 62 -15% | 54.12 -0% | 56 -4% |
* ... smaller is better
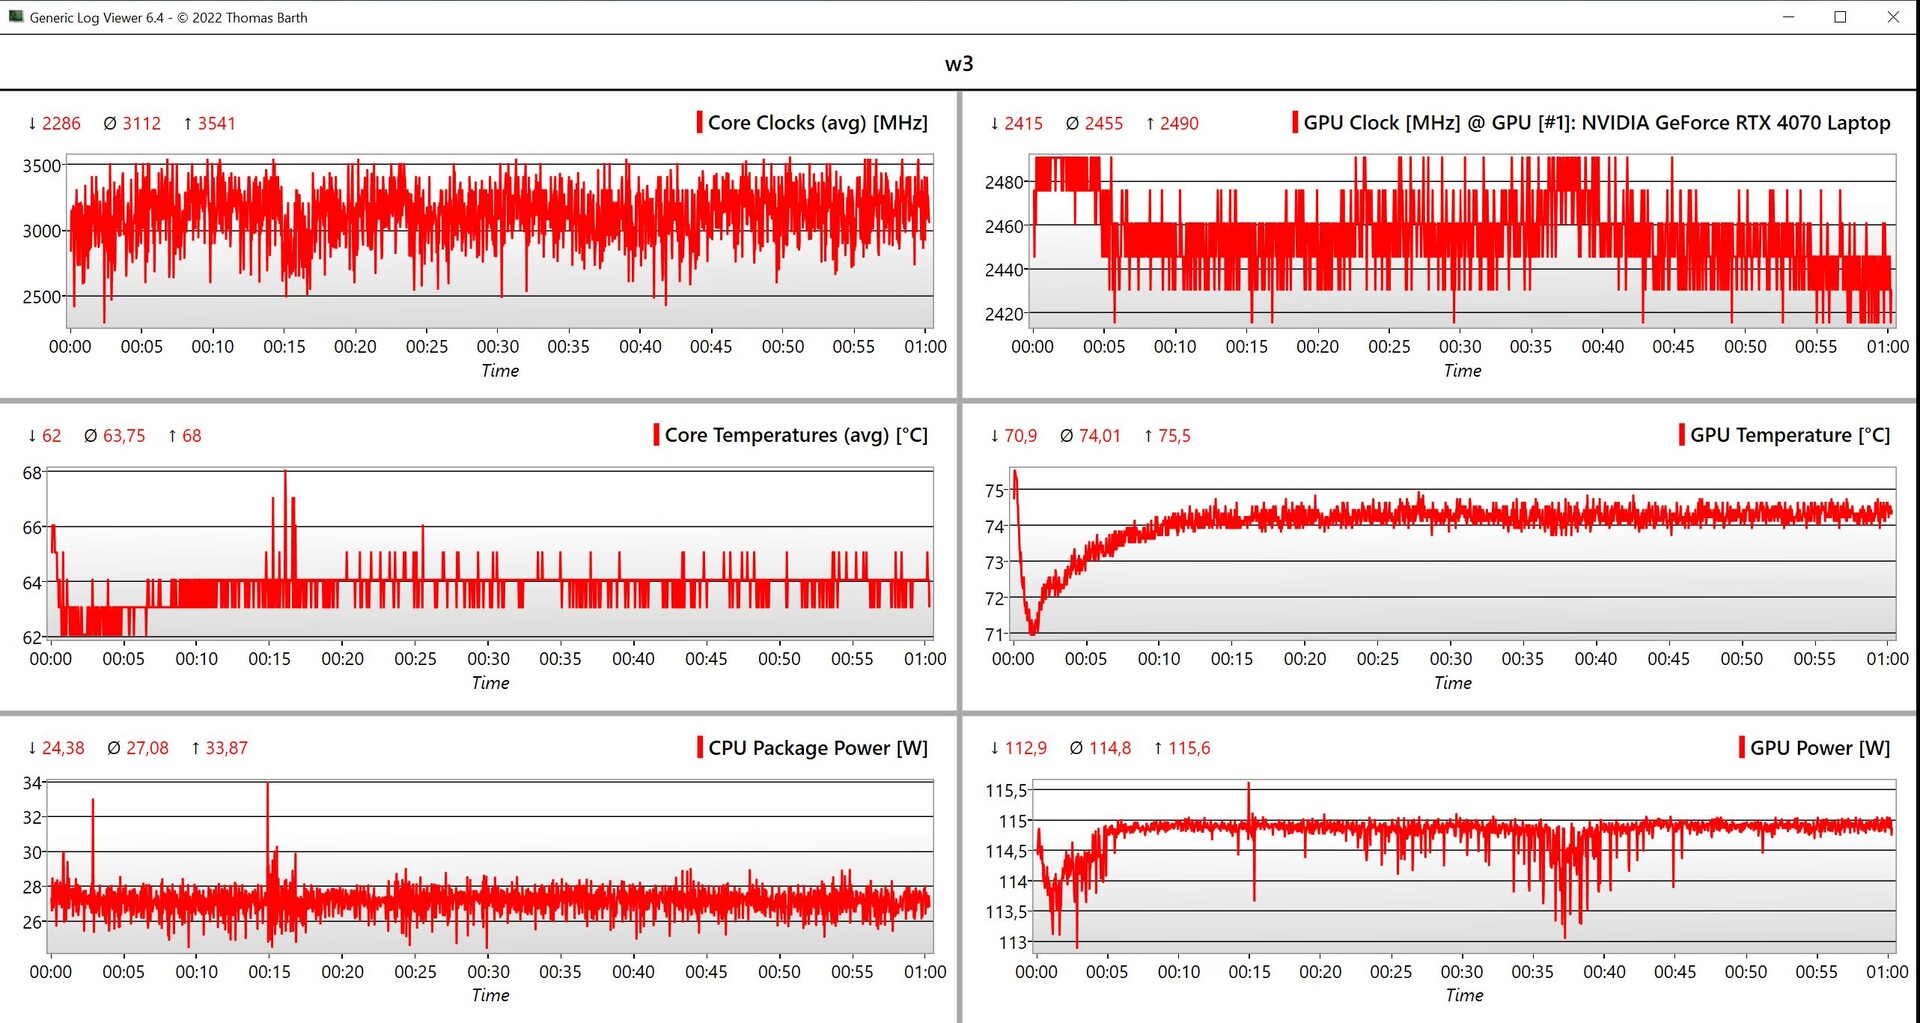
温度
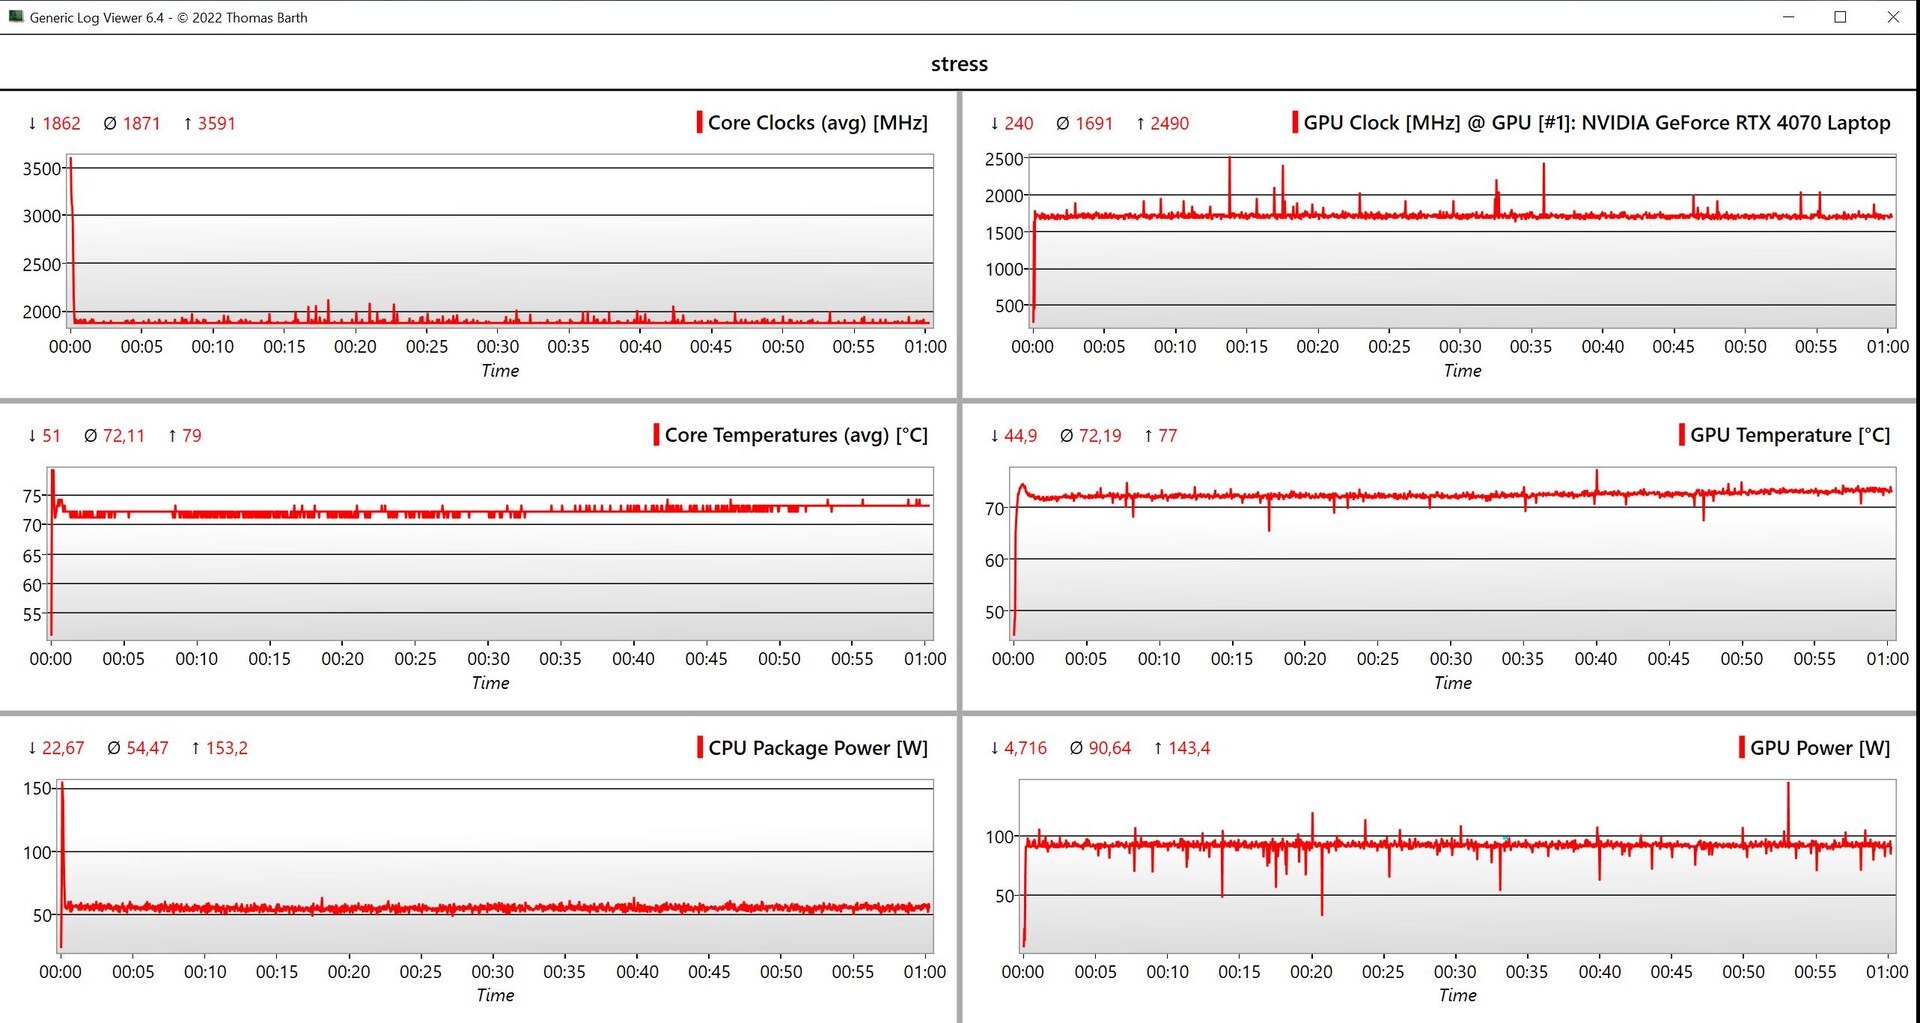
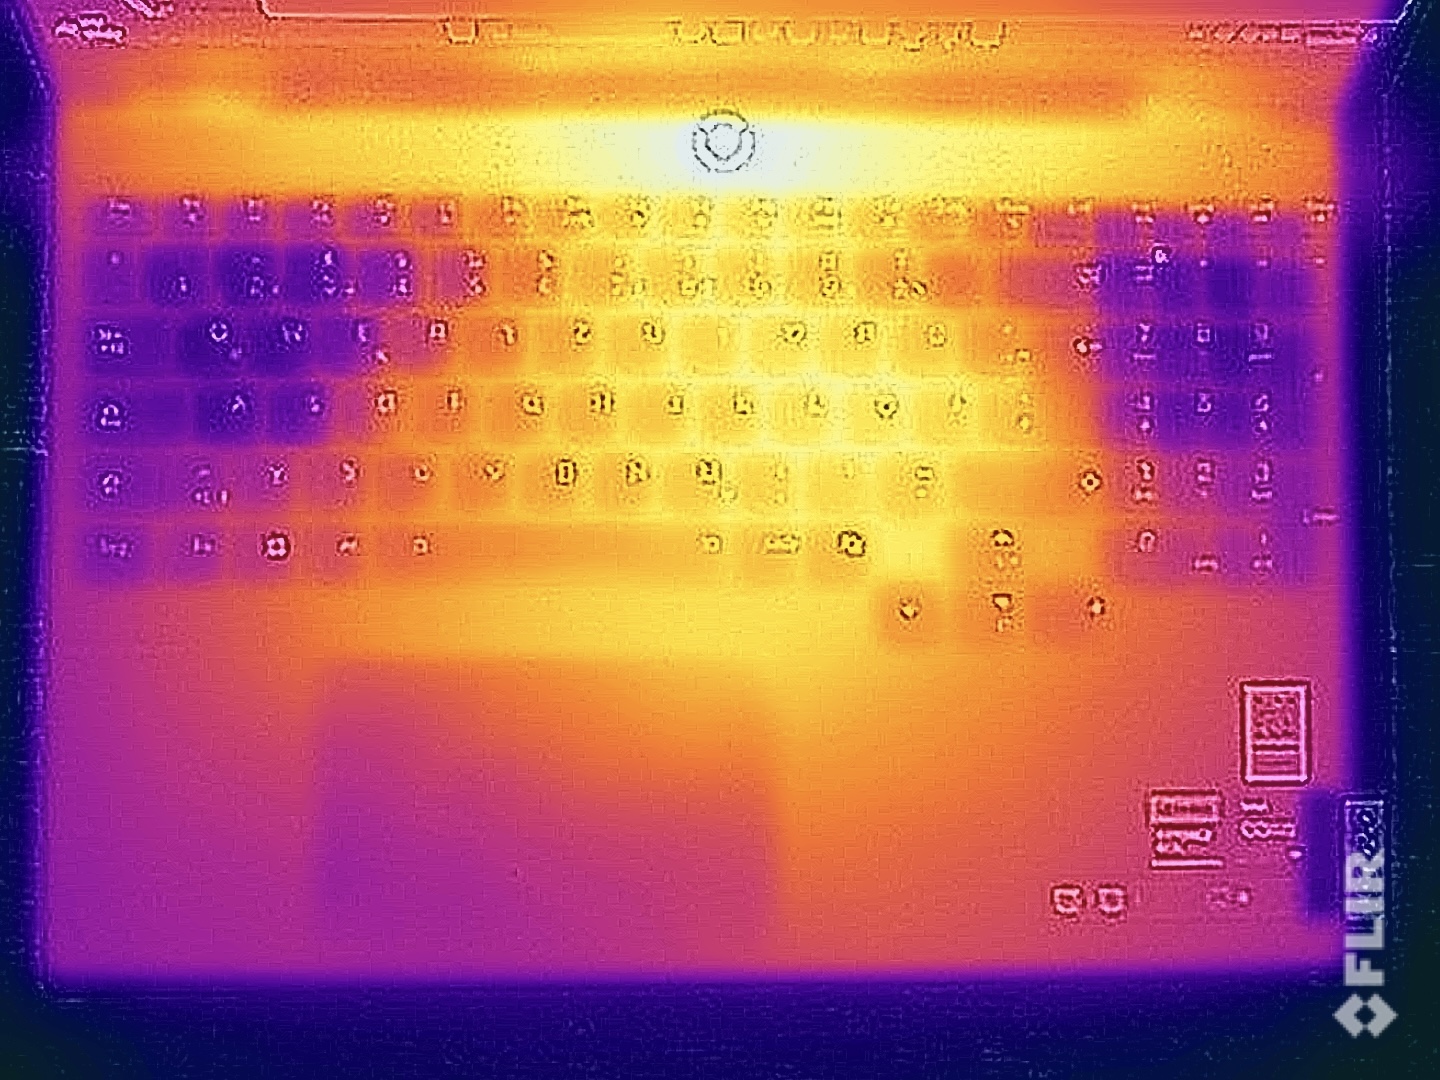
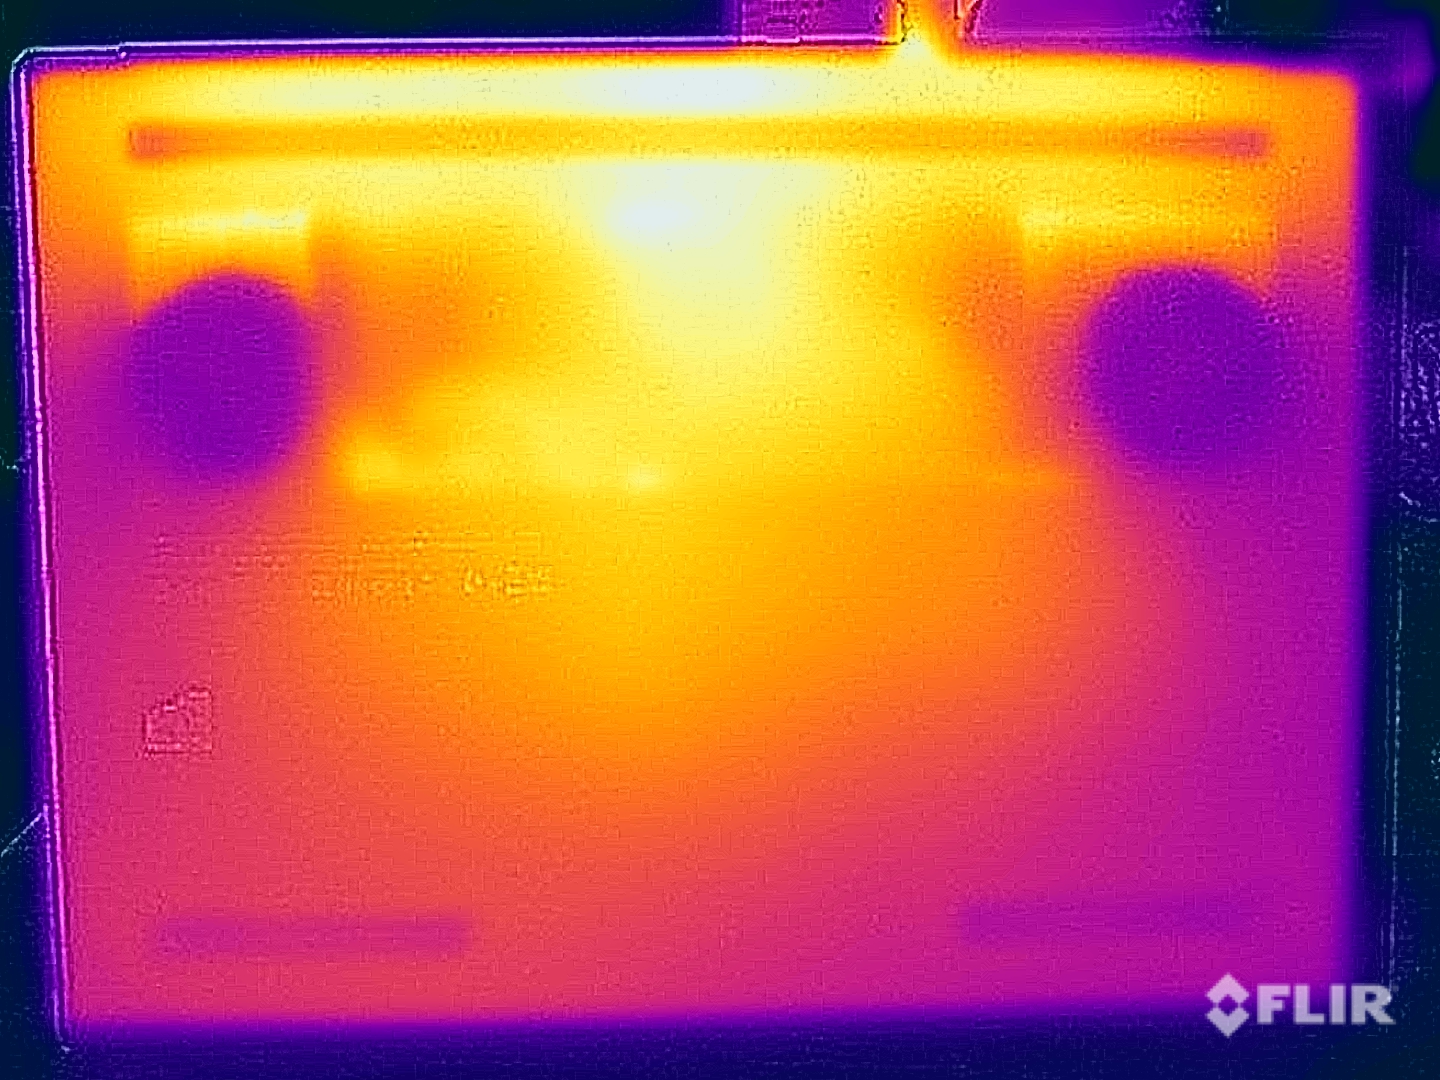
在空闲和低负载运行时,铝制机箱依然保持凉爽,甚至在游戏时也比预期的要好。在某些地方,我们测得的温度值为 42 至 43 °C,虽然在使用键盘时也会注意到这一点,但这并不会导致用户体验受限,而且,尽管Legion 7 的底座更薄,但其性能再次优于两款同类专业机型。在 CPU/GPU 综合负载压力测试中,GPU 的运行功率为 90 瓦,CPU 的运行功率约为 54 瓦。
(±) The maximum temperature on the upper side is 43.7 °C / 111 F, compared to the average of 40.4 °C / 105 F, ranging from 21.2 to 68.8 °C for the class Gaming.
(±) The bottom heats up to a maximum of 42.9 °C / 109 F, compared to the average of 43.2 °C / 110 F
(+) In idle usage, the average temperature for the upper side is 27 °C / 81 F, compared to the device average of 33.9 °C / 93 F.
(±) Playing The Witcher 3, the average temperature for the upper side is 37.2 °C / 99 F, compared to the device average of 33.9 °C / 93 F.
(±) The palmrests and touchpad can get very hot to the touch with a maximum of 38.7 °C / 101.7 F.
(-) The average temperature of the palmrest area of similar devices was 28.8 °C / 83.8 F (-9.9 °C / -17.9 F).
| Lenovo Legion 7 16 IRX G9 Intel Core i9-14900HX, NVIDIA GeForce RTX 4070 Laptop GPU | Lenovo Legion Pro 5 16IRX9 Intel Core i9-14900HX, NVIDIA GeForce RTX 4070 Laptop GPU | Aorus 16X 2024 Intel Core i9-14900HX, NVIDIA GeForce RTX 4070 Laptop GPU | HP Omen Transcend 16-u1095ng Intel Core i9-14900HX, NVIDIA GeForce RTX 4070 Laptop GPU | Alienware m16 R2 Intel Core Ultra 7 155H, NVIDIA GeForce RTX 4070 Laptop GPU | Schenker XMG CORE 16 (L23) AMD Ryzen 7 7840HS, NVIDIA GeForce RTX 4070 Laptop GPU | Lenovo Legion Pro 7 16IRX9H Intel Core i9-14900HX, NVIDIA GeForce RTX 4080 Laptop GPU | |
|---|---|---|---|---|---|---|---|
| Heat | -15% | -10% | -14% | -20% | -7% | -18% | |
| Maximum Upper Side * (°C) | 43.7 | 43.8 -0% | 41 6% | 49 -12% | 44.8 -3% | 46 -5% | 46 -5% |
| Maximum Bottom * (°C) | 42.9 | 55.4 -29% | 41 4% | 63 -47% | 48 -12% | 44 -3% | 49 -14% |
| Idle Upper Side * (°C) | 29.1 | 32.8 -13% | 37 -27% | 30 -3% | 37.2 -28% | 32 -10% | 38 -31% |
| Idle Bottom * (°C) | 30.6 | 36 -18% | 38 -24% | 29 5% | 42 -37% | 33 -8% | 37 -21% |
* ... smaller is better
发言人
这两款立体声扬声器都表现出色,但与价格更高的 Legion Pro 7 16.不过,偶尔看电影/连续剧或听背景音乐时,这些模块已经足够了。在玩游戏时,由于风扇声音较大,我们建议使用耳机。
Lenovo Legion 7 16 IRX G9 audio analysis
(+) | speakers can play relatively loud (82.1 dB)
Bass 100 - 315 Hz
(±) | reduced bass - on average 13.1% lower than median
(±) | linearity of bass is average (9.7% delta to prev. frequency)
Mids 400 - 2000 Hz
(+) | balanced mids - only 2.8% away from median
(+) | mids are linear (3.7% delta to prev. frequency)
Highs 2 - 16 kHz
(+) | balanced highs - only 4.7% away from median
(±) | linearity of highs is average (7% delta to prev. frequency)
Overall 100 - 16.000 Hz
(+) | overall sound is linear (12.6% difference to median)
Compared to same class
» 16% of all tested devices in this class were better, 4% similar, 81% worse
» The best had a delta of 6%, average was 18%, worst was 132%
Compared to all devices tested
» 11% of all tested devices were better, 3% similar, 86% worse
» The best had a delta of 4%, average was 23%, worst was 134%
Lenovo Legion Pro 7 16IRX9H audio analysis
(+) | speakers can play relatively loud (84 dB)
Bass 100 - 315 Hz
(±) | reduced bass - on average 8.9% lower than median
(±) | linearity of bass is average (7.4% delta to prev. frequency)
Mids 400 - 2000 Hz
(+) | balanced mids - only 2.8% away from median
(+) | mids are linear (4% delta to prev. frequency)
Highs 2 - 16 kHz
(+) | balanced highs - only 3% away from median
(+) | highs are linear (5% delta to prev. frequency)
Overall 100 - 16.000 Hz
(+) | overall sound is linear (8.4% difference to median)
Compared to same class
» 2% of all tested devices in this class were better, 1% similar, 97% worse
» The best had a delta of 6%, average was 18%, worst was 132%
Compared to all devices tested
» 2% of all tested devices were better, 1% similar, 97% worse
» The best had a delta of 4%, average was 23%, worst was 134%
能源管理 - 平均电池运行时间
耗电量
在功耗测量中,评测设备并没有给我们带来惊喜,在闲置状态下,我们记录到的最大功耗接近 22 瓦。在性能模式下,230 瓦的 PSU 曾一度成为限制因素,但很快就趋于稳定,功耗迅速降至 200 瓦。总而言之,230 瓦的电源适配器大小适中。不过,联想可以改进超过 1.1 瓦的待机功耗。
| Off / Standby | |
| Idle | |
| Load |
|
Key:
min: | |
| Lenovo Legion 7 16 IRX G9 i9-14900HX, GeForce RTX 4070 Laptop GPU, SK Hynix HFS001TEJ9X115N, IPS, 3200x2000, 16" | Aorus 16X 2024 i9-14900HX, GeForce RTX 4070 Laptop GPU, Gigabyte AG450E1024-SI, IPS, 2560x1600, 16" | HP Omen Transcend 16-u1095ng i9-14900HX, GeForce RTX 4070 Laptop GPU, Kioxia XG8 KXG80ZNV1T02, OLED, 2560x1600, 16" | Alienware m16 R2 Ultra 7 155H, GeForce RTX 4070 Laptop GPU, Samsung PM9A1 MZVL21T0HCLR, IPS, 2560x1600, 16" | Schenker XMG CORE 16 (L23) R7 7840HS, GeForce RTX 4070 Laptop GPU, Samsung 990 Pro 1 TB, IPS, 2560x1600, 16" | Lenovo Legion Pro 7 16IRX9H i9-14900HX, GeForce RTX 4080 Laptop GPU, SK Hynix HFS001TEJ9X115N, IPS, 2560x1600, 16" | Average NVIDIA GeForce RTX 4070 Laptop GPU | Average of class Gaming | |
|---|---|---|---|---|---|---|---|---|
| Power Consumption | -4% | 4% | 6% | 20% | -27% | 10% | 4% | |
| Idle Minimum * (Watt) | 15.4 | 13 16% | 10 35% | 8.1 47% | 11 29% | 16 -4% | 13.2 ? 14% | 13 ? 16% |
| Idle Average * (Watt) | 21.2 | 18 15% | 18 15% | 13 39% | 15.2 28% | 21 1% | 18.2 ? 14% | 19 ? 10% |
| Idle Maximum * (Watt) | 21.9 | 35 -60% | 32 -46% | 40.3 -84% | 16 27% | 36 -64% | 24.6 ? -12% | 24.6 ? -12% |
| Load Average * (Watt) | 128.5 | 138 -7% | 128 -0% | 79 39% | 64 50% | 132 -3% | 97 ? 25% | 110.7 ? 14% |
| Witcher 3 ultra * (Watt) | 188.4 | 172.6 8% | 148.4 21% | 188.1 -0% | 179 5% | 267 -42% | ||
| Load Maximum * (Watt) | 239.1 | 222 7% | 242 -1% | 254.9 -7% | 280 -17% | 360 -51% | 221 ? 8% | 259 ? -8% |
* ... smaller is better
Power consumption Witcher 3 / stress test
Power consumption with an external monitor
电池寿命
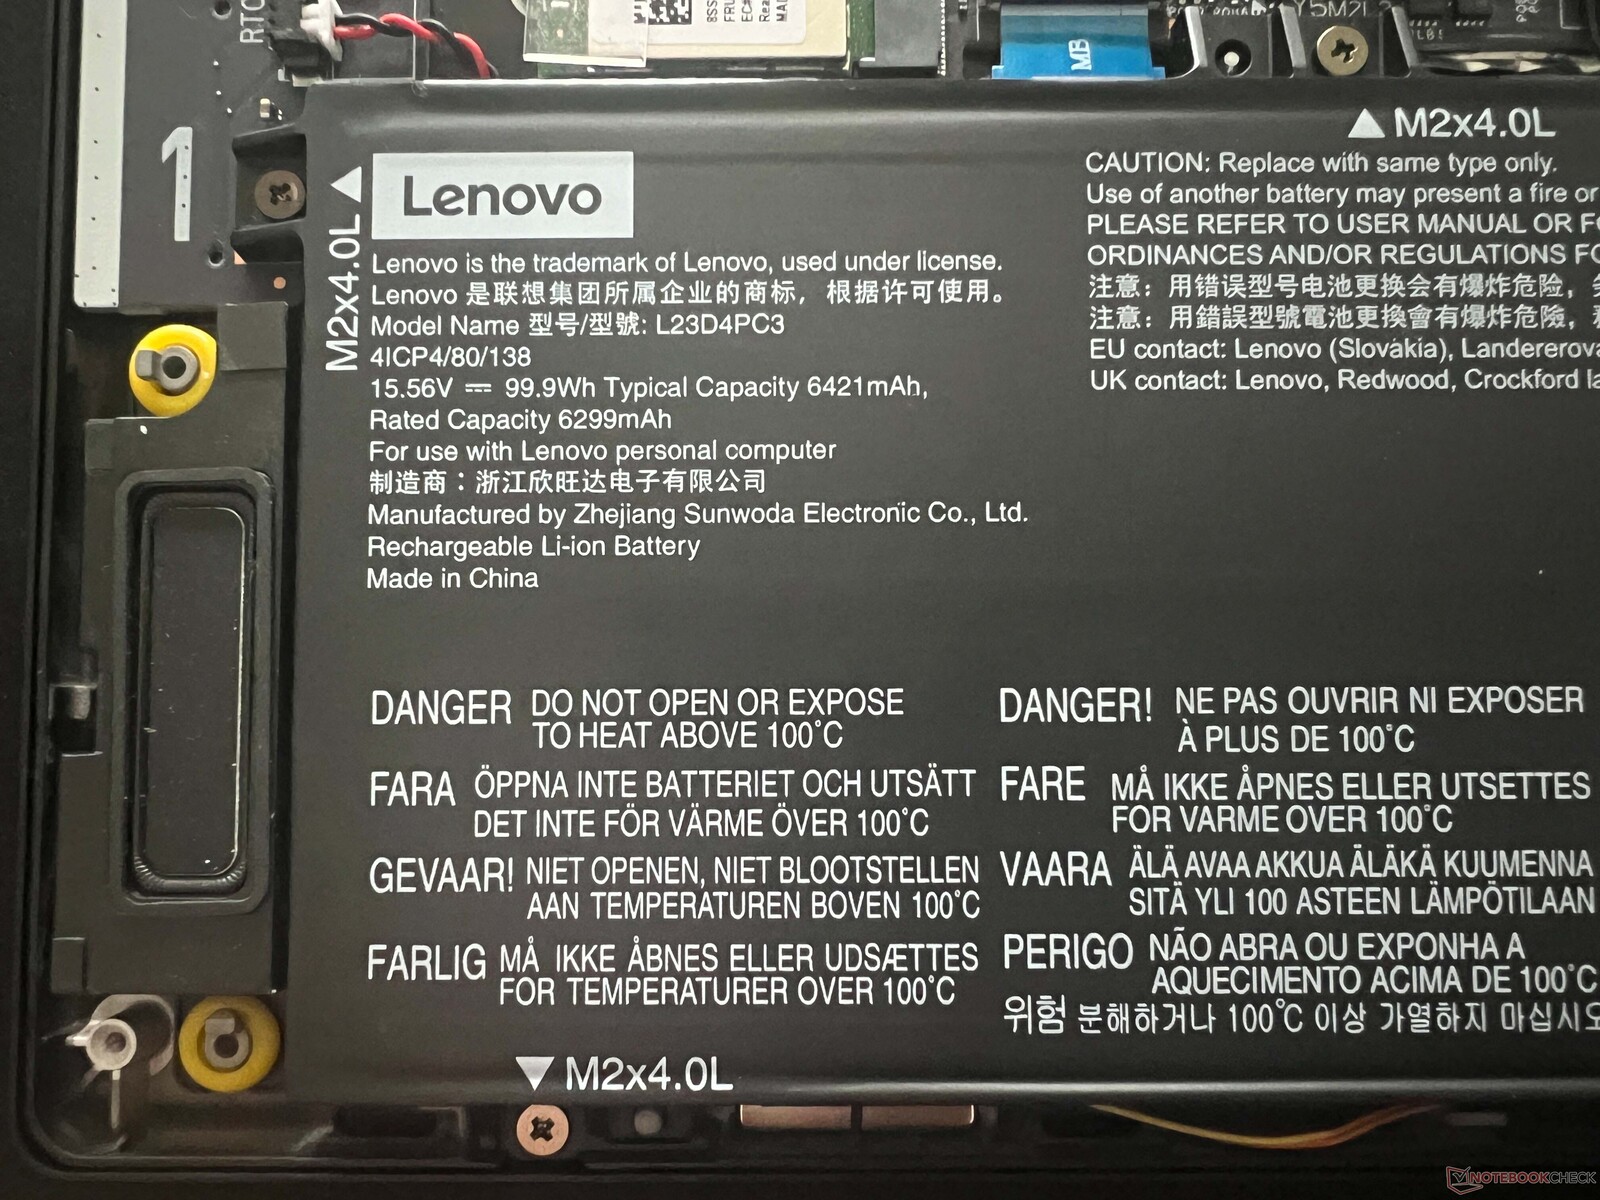
联想在其Legion 7 16 中安装了 99.9 Wh 的电池,总体而言,运行时间可以说相当平均。在 150 cd/m²(占评测设备最大亮度的 63%)和 60 Hz 下,我们的 Wi-Fi 测试持续了 7 个多小时(165 Hz 下约 6.5 小时),在全亮度和 60 Hz 下约 5.5 小时(165 Hz 下约 5 小时)。在 150 cd/m² 的视频测试中,我们记录的时间略高于 10 小时,在负载情况下,最糟糕的情况是 50 分钟后熄灯。
Legion 提供两种充电模式,使用普通模式,一个完整的充电周期需要 97 分钟(约 64 分钟后达到 80%)。使用快速模式则需要 79 分钟(34 分钟后即可充满 80%)。
| Lenovo Legion 7 16 IRX G9 i9-14900HX, GeForce RTX 4070 Laptop GPU, 99.9 Wh | Lenovo Legion Pro 5 16IRX9 i9-14900HX, GeForce RTX 4070 Laptop GPU, 80 Wh | Aorus 16X 2024 i9-14900HX, GeForce RTX 4070 Laptop GPU, 99 Wh | HP Omen Transcend 16-u1095ng i9-14900HX, GeForce RTX 4070 Laptop GPU, 97 Wh | Alienware m16 R2 Ultra 7 155H, GeForce RTX 4070 Laptop GPU, 90 Wh | Schenker XMG CORE 16 (L23) R7 7840HS, GeForce RTX 4070 Laptop GPU, 99 Wh | Lenovo Legion Pro 7 16IRX9H i9-14900HX, GeForce RTX 4080 Laptop GPU, 99.9 Wh | Average of class Gaming | |
|---|---|---|---|---|---|---|---|---|
| Battery runtime | 3% | 37% | -32% | 19% | 72% | -14% | 23% | |
| H.264 (h) | 10.3 | 9 -13% | 10.2 -1% | 8.32 ? -19% | ||||
| WiFi v1.3 (h) | 7.2 | 4.8 -33% | 8 11% | 4.9 -32% | 8.1 13% | 8.4 17% | 6.2 -14% | 7.11 ? -1% |
| Load (h) | 0.8 | 1.1 38% | 1.7 113% | 1 25% | 2.4 200% | 1.502 ? 88% | ||
| Reader / Idle (h) | 6.7 | 12.6 | 12.6 | 8.27 ? |
Pros
Cons
评价:低调而高性能的游戏笔记本电脑

联想新推出的Legion 7i 16 G9 是一款比较轻薄的游戏笔记本电脑,在测试中没有暴露出任何明显的弱点。与更昂贵的 Legion Pro 7在长时间的 CPU 性能和配备的 GPU 方面(Legion 7 的最高性能为 RTX 4070 笔记本电脑),你不得不接受其局限性,但与 Pro 相比,铝制机箱仍然更凉爽,而且总体而言,散热工作做得非常好。风扇仍然是个问题,因为在使用任何一种快速能量模式进行游戏时,你都需要一个耳机。不过,这也适用于竞争对手,使用静音模式时,可以在牺牲部分性能的情况下获得可承受的音量。
此外,与Legion Pro 相比,更薄的机身更不引人注目。任何追求丰富照明选项的人都会感到失望,但另一方面,这也使Legion 7 16 适合其他目标群体。唯一令人讨厌的是表面的指纹敏感问题。除了缺少以太网端口外,所有重要的接口都在机上,输入设备也没有问题。
新款联想Legion 7i 16 G9 是一款抢眼的游戏笔记本电脑,性能出众,功能齐全。高分辨率的 IPS 显示屏也适用于查看和编辑图像,而且没有实现 PWM。
总体而言,可选的 IPS 显示屏及其 3,200 x 2,000 像素的分辨率做得不错,尽管主观图像印象和响应时间无法与 OLED 面板相提并论。好的一面是没有 PWM,也没有恼人的反光。同样,由于该平台及其 HX 处理器需要过多的电量,电池运行时间也只能算一般。
Legion 7 16 在与同类产品的对比中也表现出色。特别是,如果你想要比 RTX 4070 笔记本电脑更快的 GPU,Legion Pro 7 是合适的。在功率相当的情况下 Legion Pro 5相比之下,Pro 5 显得更加笨重,而且屏幕效果也较差。惠普 HP Omen Transcend配备了 240 Hz OLED 屏幕,但性能稍差,价格较高。
价格和供应情况
Legion 7i 16 G9 可直接从联想购买,价格约为 2099 美元。
Lenovo Legion 7 16 IRX G9
- 04/13/2024 v7 (old)
Andreas Osthoff
Transparency
The selection of devices to be reviewed is made by our editorial team. The test sample was provided to the author as a loan by the manufacturer or retailer for the purpose of this review. The lender had no influence on this review, nor did the manufacturer receive a copy of this review before publication. There was no obligation to publish this review. As an independent media company, Notebookcheck is not subjected to the authority of manufacturers, retailers or publishers.
This is how Notebookcheck is testing
Every year, Notebookcheck independently reviews hundreds of laptops and smartphones using standardized procedures to ensure that all results are comparable. We have continuously developed our test methods for around 20 years and set industry standards in the process. In our test labs, high-quality measuring equipment is utilized by experienced technicians and editors. These tests involve a multi-stage validation process. Our complex rating system is based on hundreds of well-founded measurements and benchmarks, which maintains objectivity. Further information on our test methods can be found here.
Price comparison

