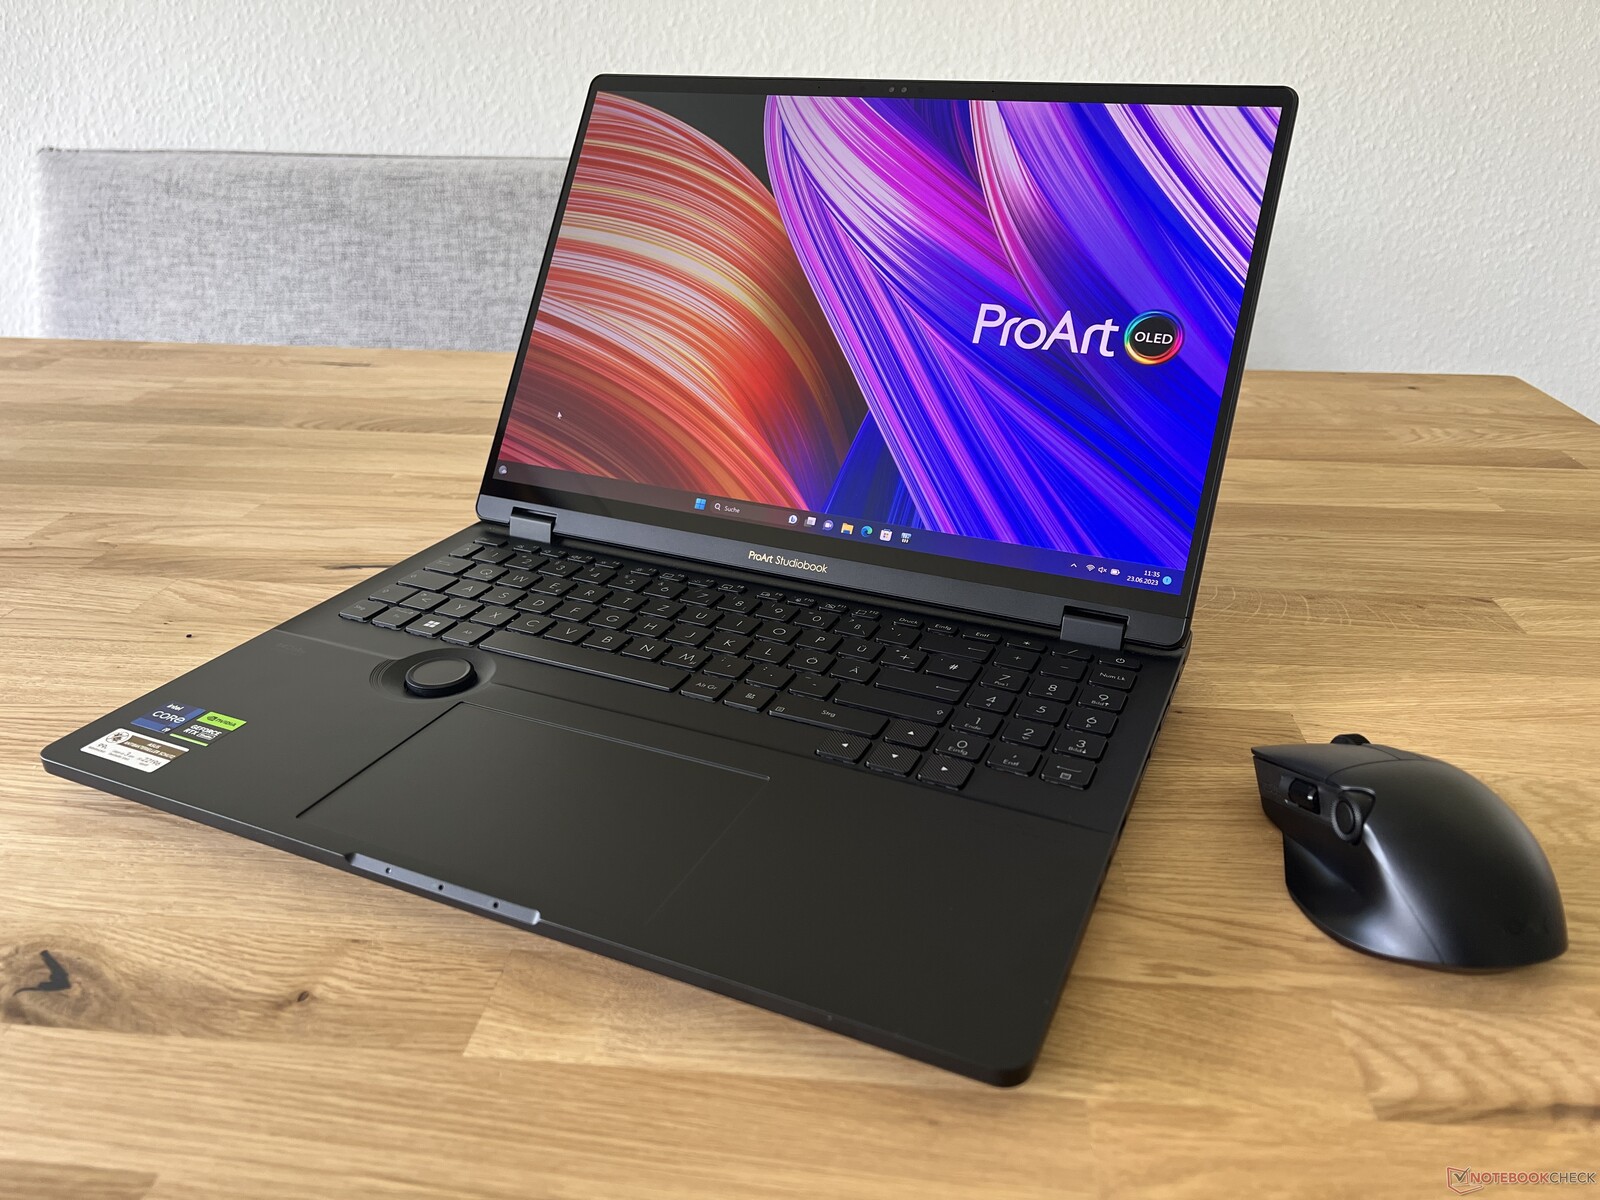
华硕ProArt Studiobook 16 OLED回顾:具有极端CPU性能的多媒体笔记本电脑
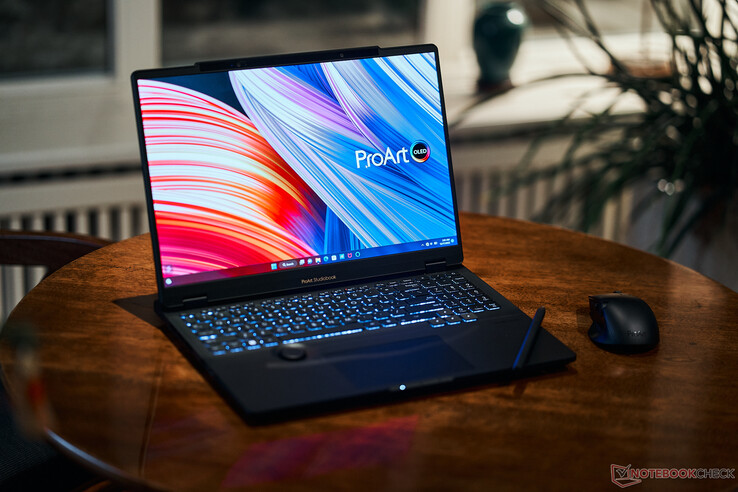
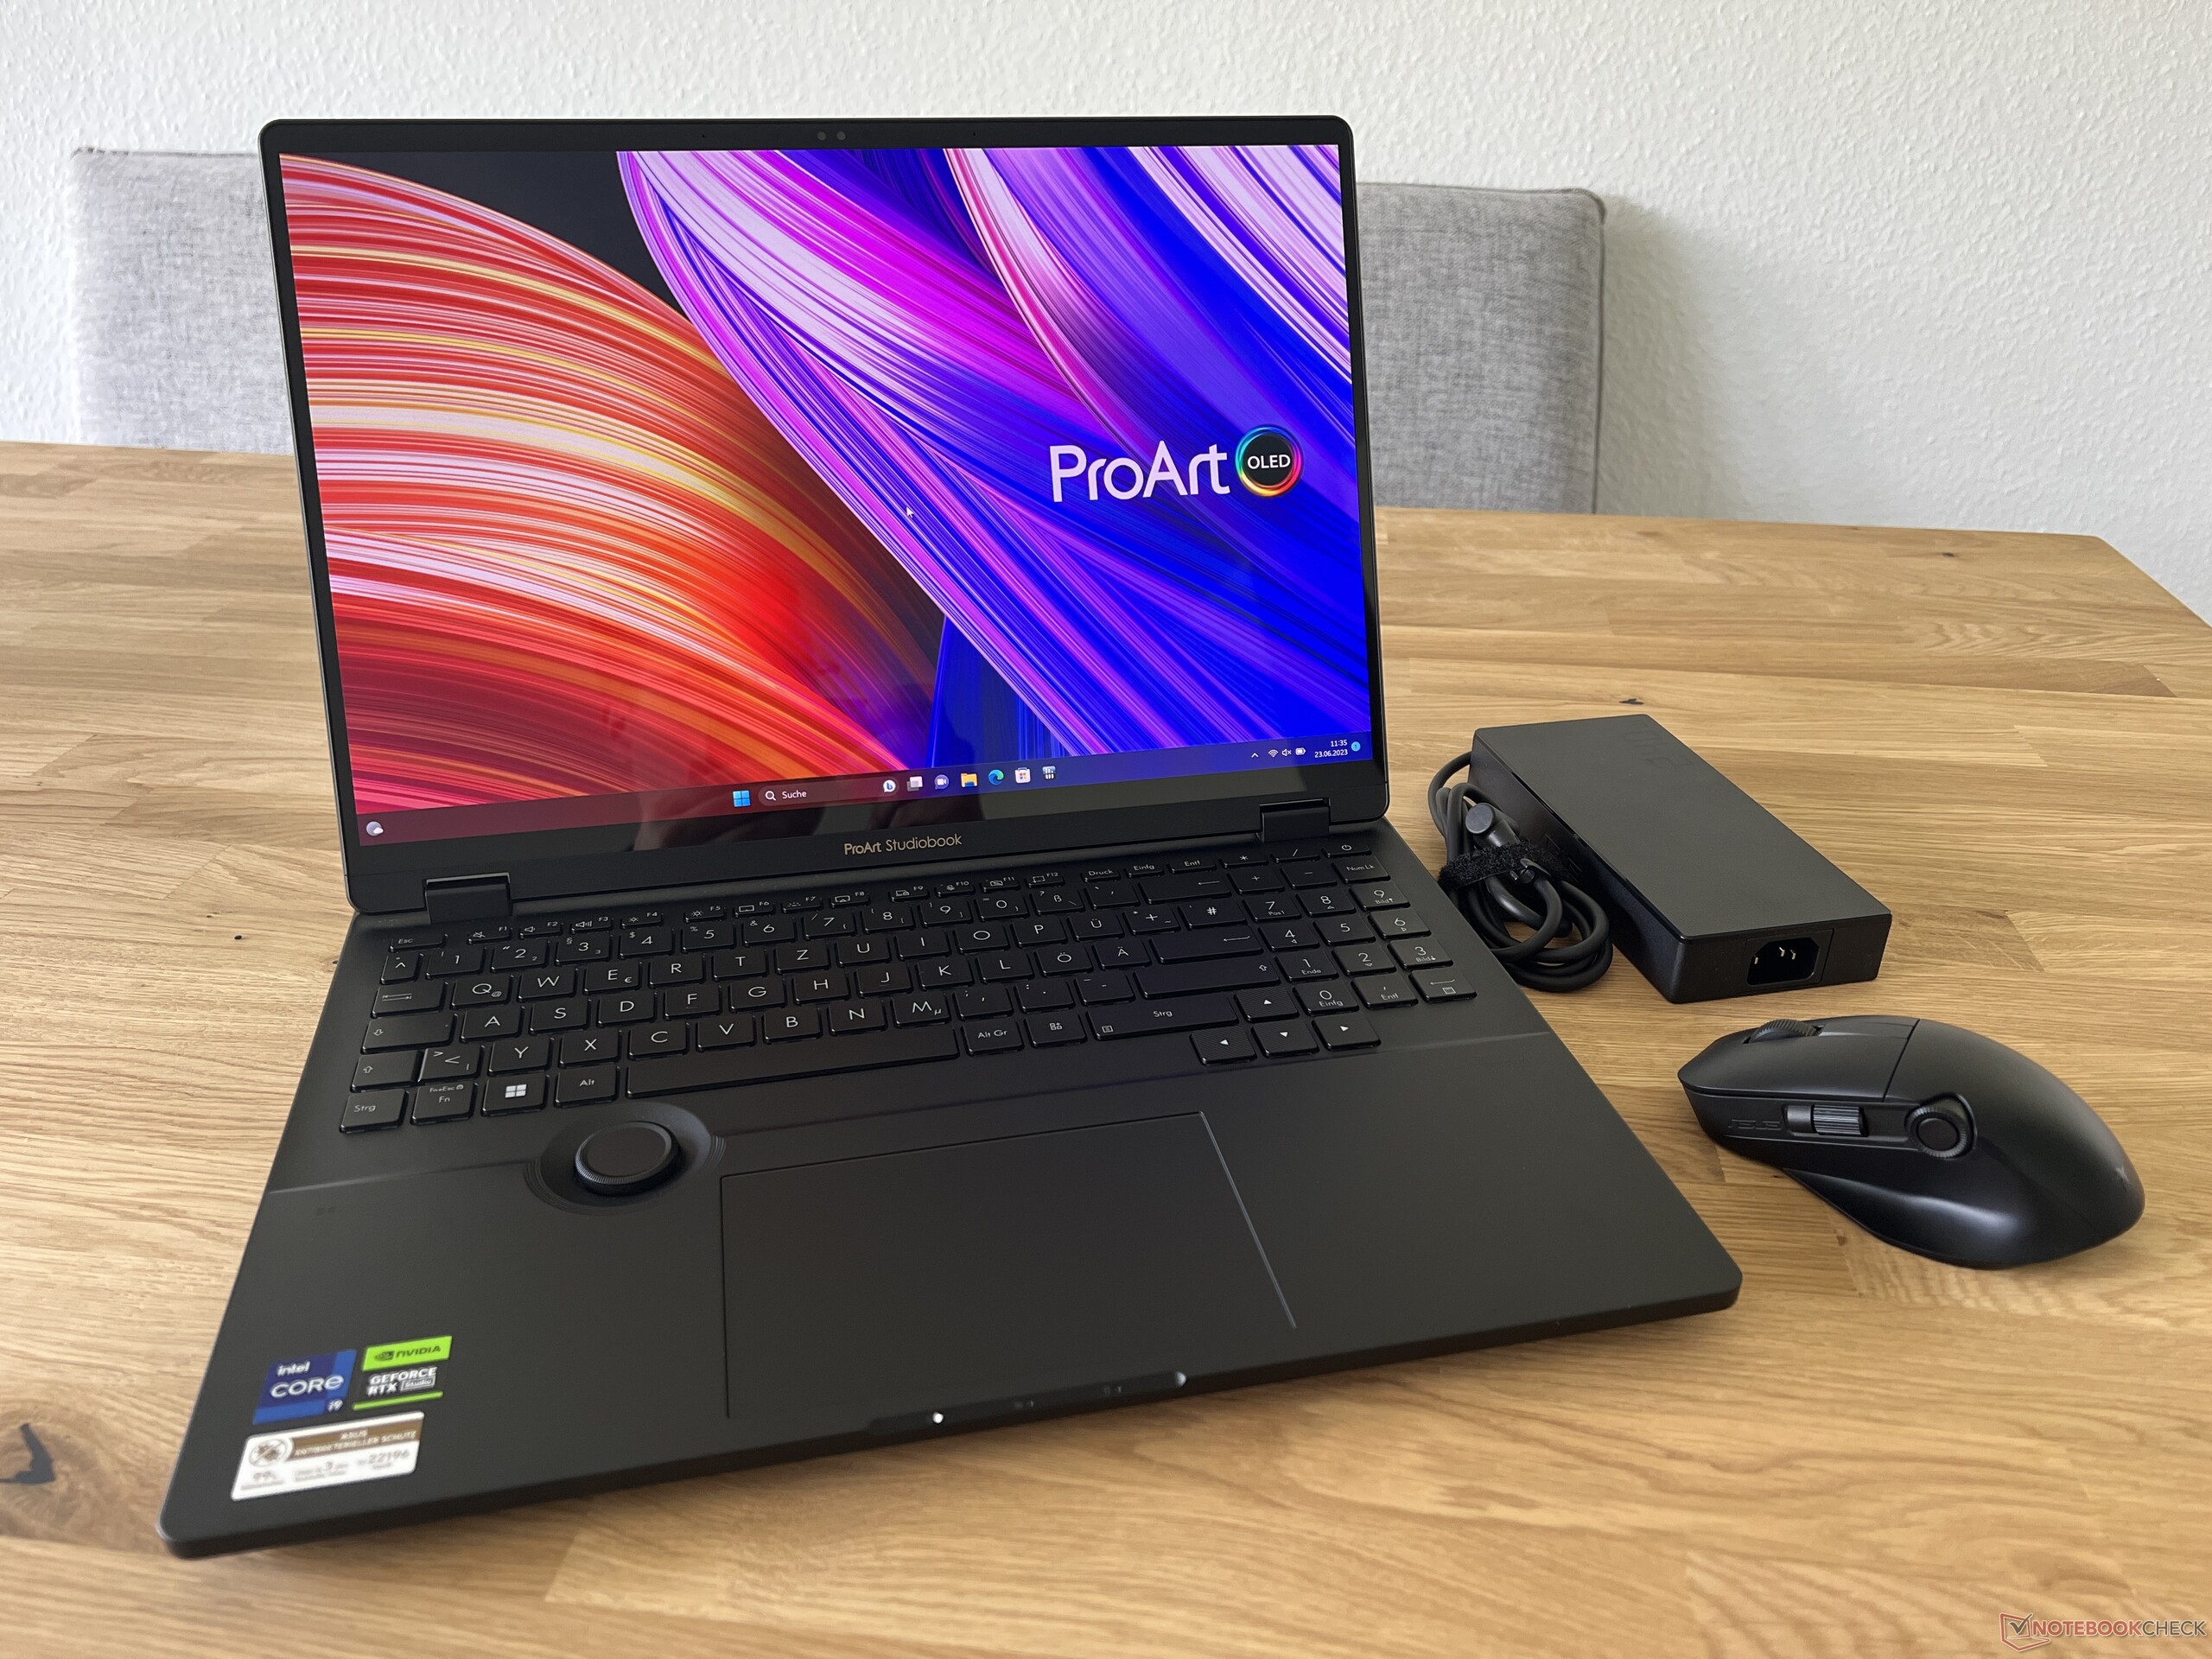
华硕的ProArt Studiobook 16主要针对创意用户,并在DialPad中提供了一个额外的输入功能。目前Studiobook 16 OLED 2023采用英特尔最快的移动处理器,即酷睿i9-13980HX,并结合新的 GeForce RTX 4070笔记本电脑。显示屏也发生了变化,因为4K OLED已经被换成了120赫兹的3K触摸屏模型。我们的测试设备是高端型号,配备64GB内存和4TB PCIe SSD,售价3999欧元(4380美元)。另外,还有一个RTX 4070笔记本电脑的变体,32GB内存和2TB固态硬盘,价格为3499欧元(3800美元),或一个 RTX 4060 笔记本电脑32GB内存和1TB固态硬盘,价格为2999欧元(3300美元)。
潜在的竞争对手比较
Rating | Date | Model | Weight | Height | Size | Resolution | Price |
|---|---|---|---|---|---|---|---|
| 86.1 % v7 (old) | 06 / 2023 | Asus ProArt Studiobook 16 OLED H7604 i9-13980HX, GeForce RTX 4070 Laptop GPU | 2.4 kg | 23.9 mm | 16.00" | 3200x2000 | |
| 86.2 % v7 (old) | 03 / 2023 | Gigabyte AERO 16 OLED BSF i9-13900H, GeForce RTX 4070 Laptop GPU | 2.1 kg | 18 mm | 16.00" | 3840x2400 | |
| 89.4 % v7 (old) | 04 / 2023 | Samsung Galaxy Book3 Ultra 16 i7-13700H, GeForce RTX 4050 Laptop GPU | 1.8 kg | 16.5 mm | 16.00" | 2880x1800 | |
| 89.2 % v7 (old) | 04 / 2023 | MSI Stealth 17 Studio A13VH-014 i9-13900H, GeForce RTX 4080 Laptop GPU | 3 kg | 21.3 mm | 17.30" | 3840x2160 | |
| 93.7 % v7 (old) | 03 / 2023 | Apple MacBook Pro 16 2023 M2 Max M2 Max, M2 Max 38-Core GPU | 2.2 kg | 16.8 mm | 16.20" | 3456x2234 | |
| 88 % v7 (old) | 04 / 2023 | Asus Zephyrus Duo 16 GX650PY-NM006W R9 7945HX, GeForce RTX 4090 Laptop GPU | 2.7 kg | 29.7 mm | 16.00" | 2560x1600 |
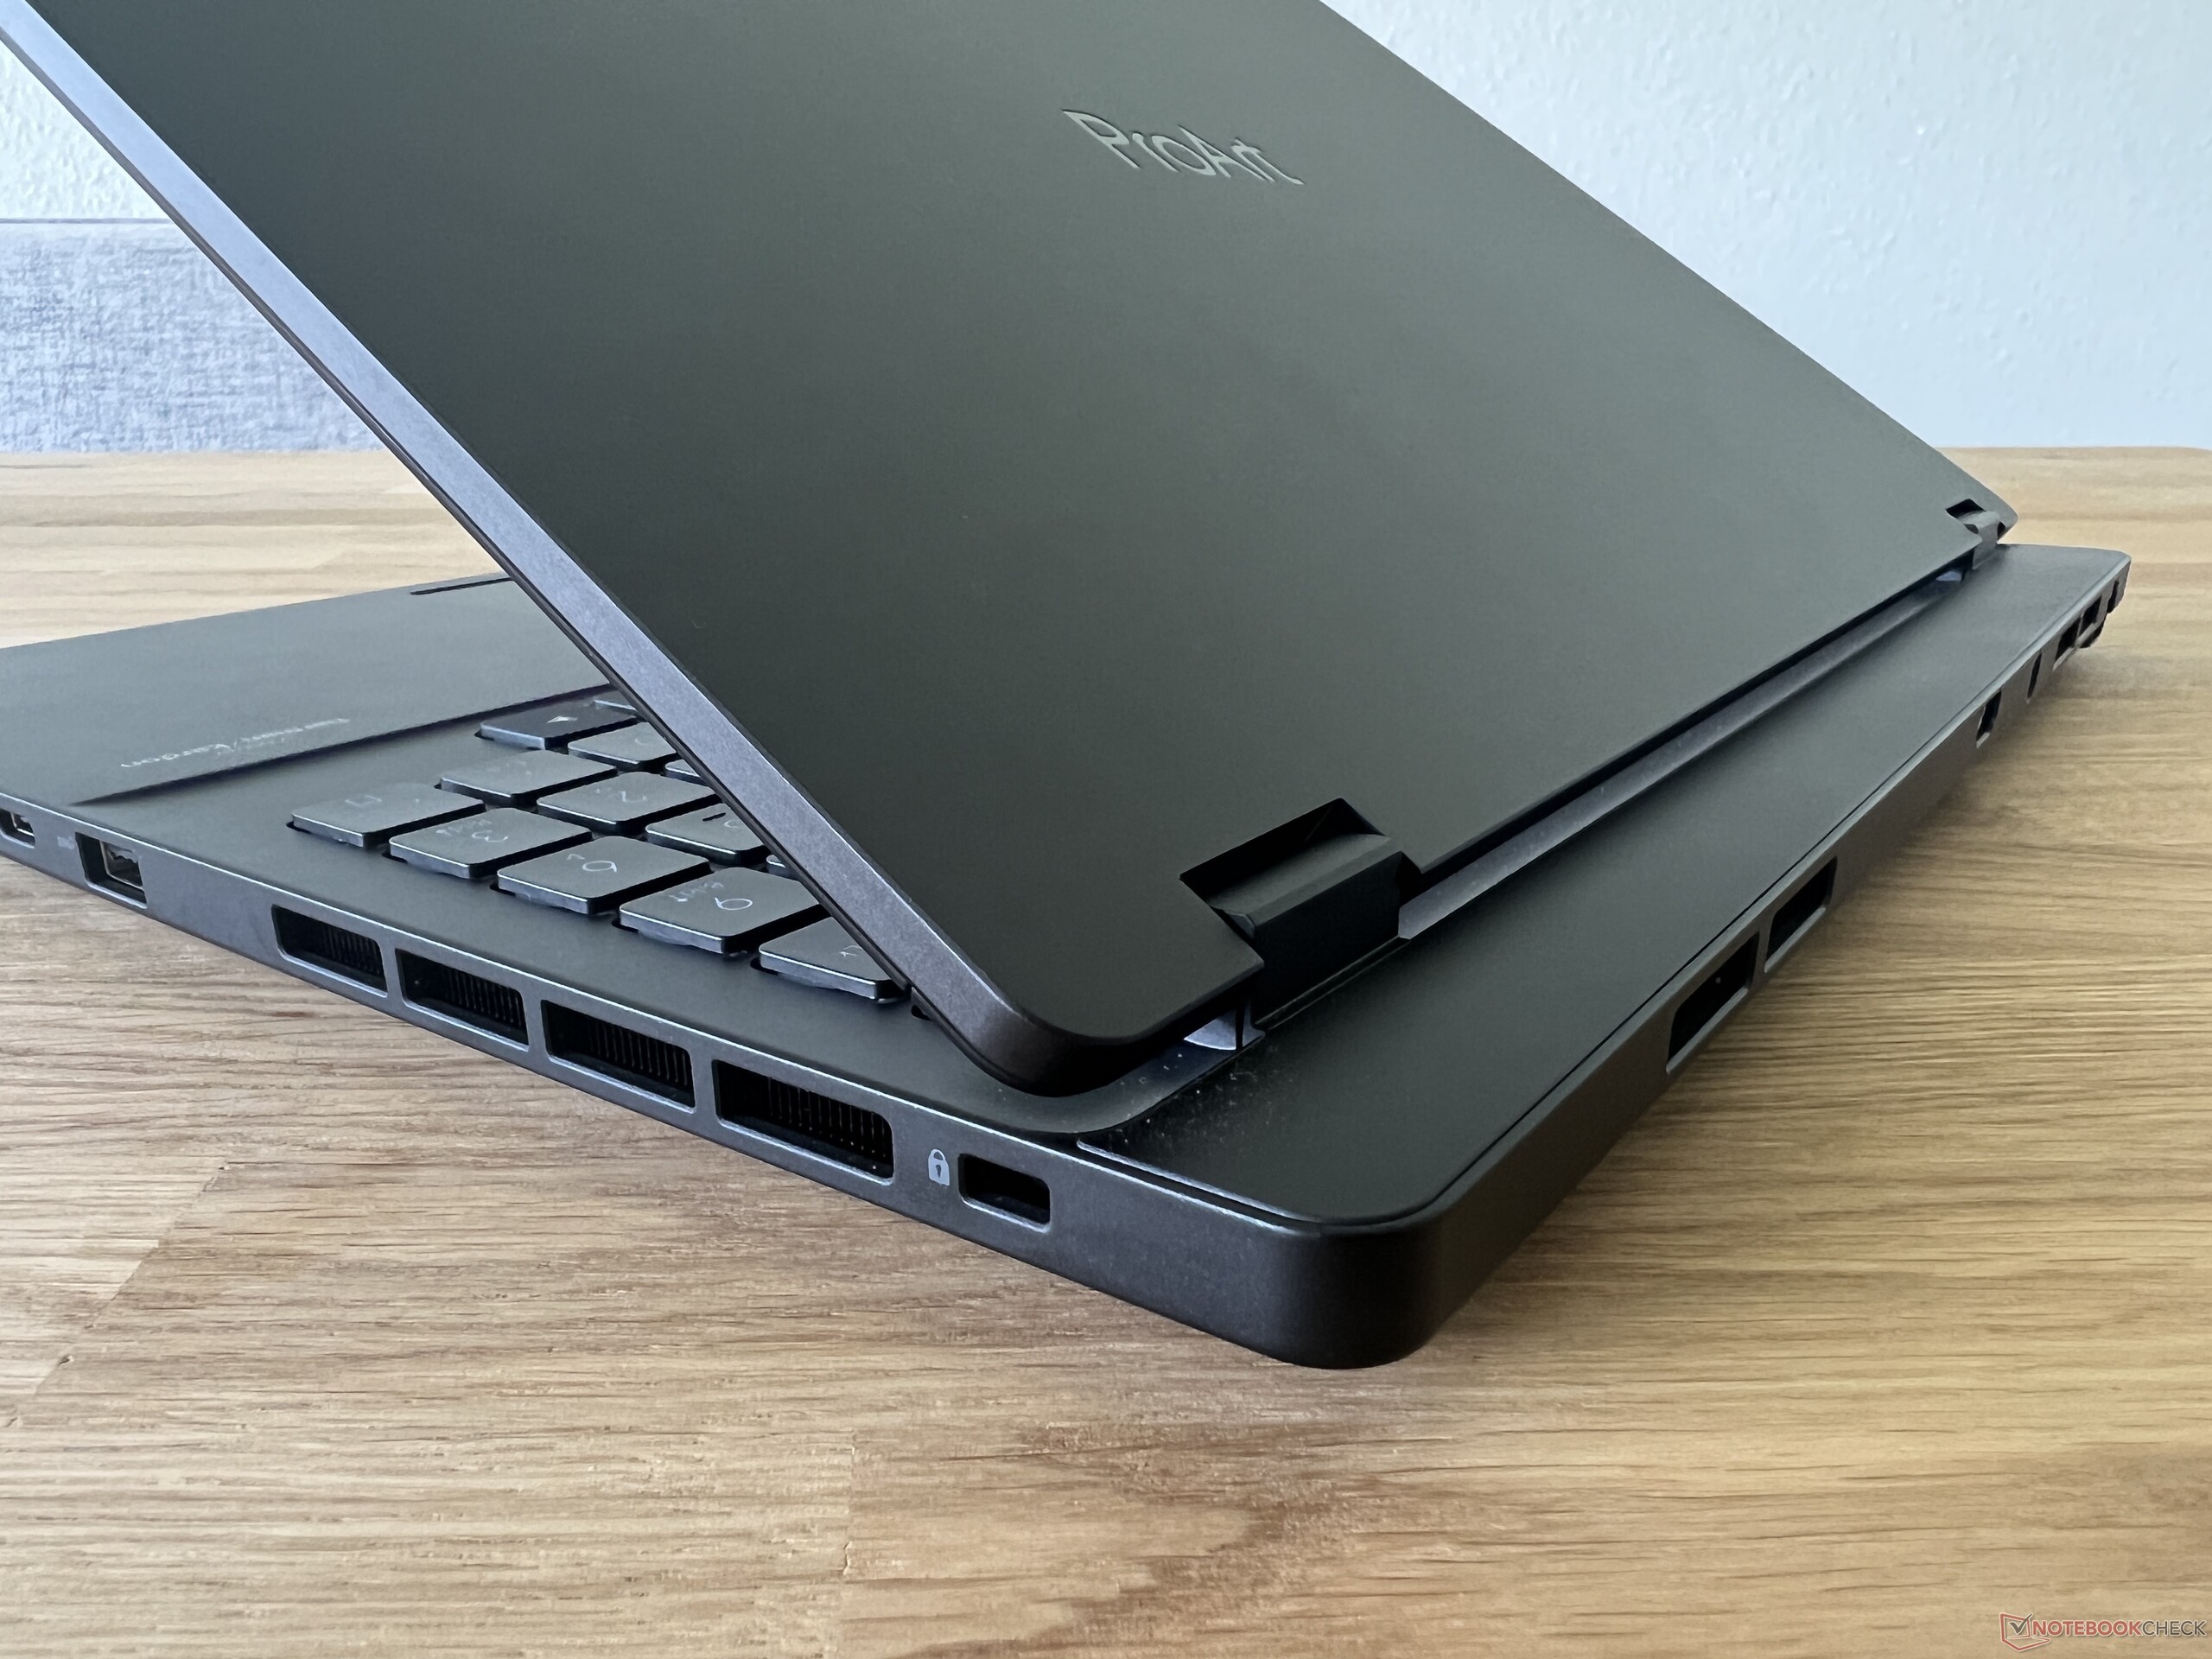
案例--ProArt被限制住了
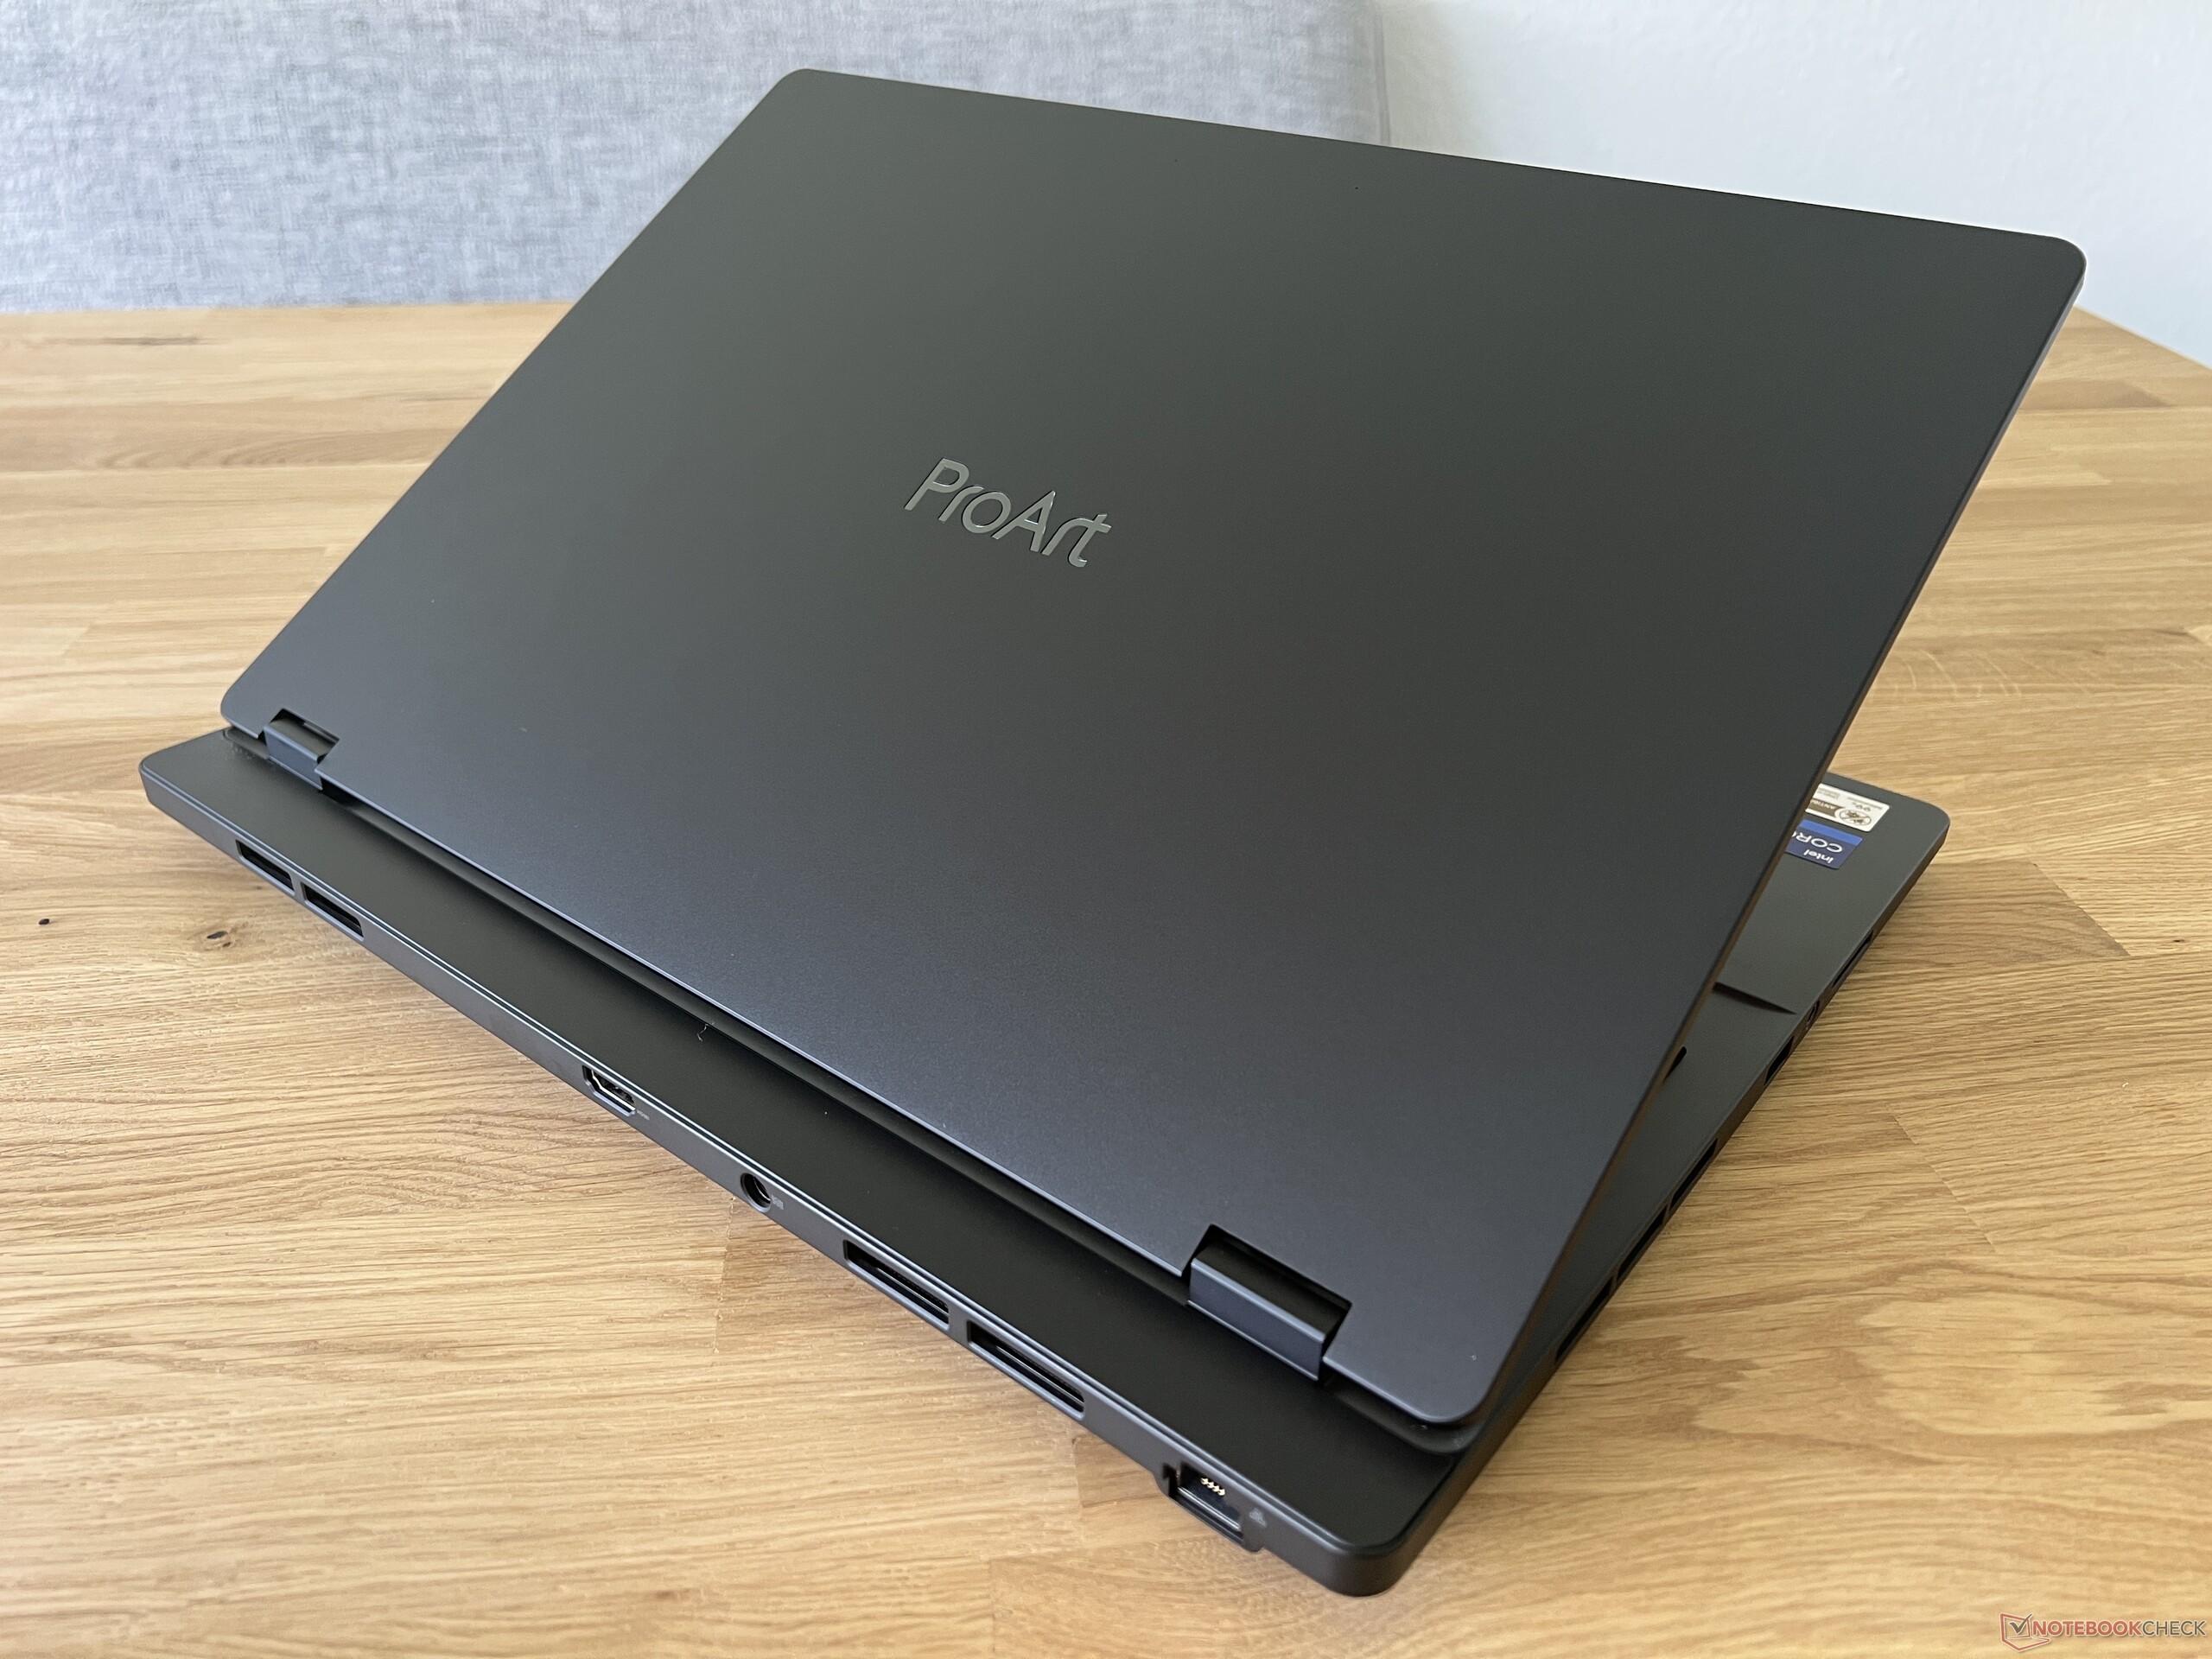
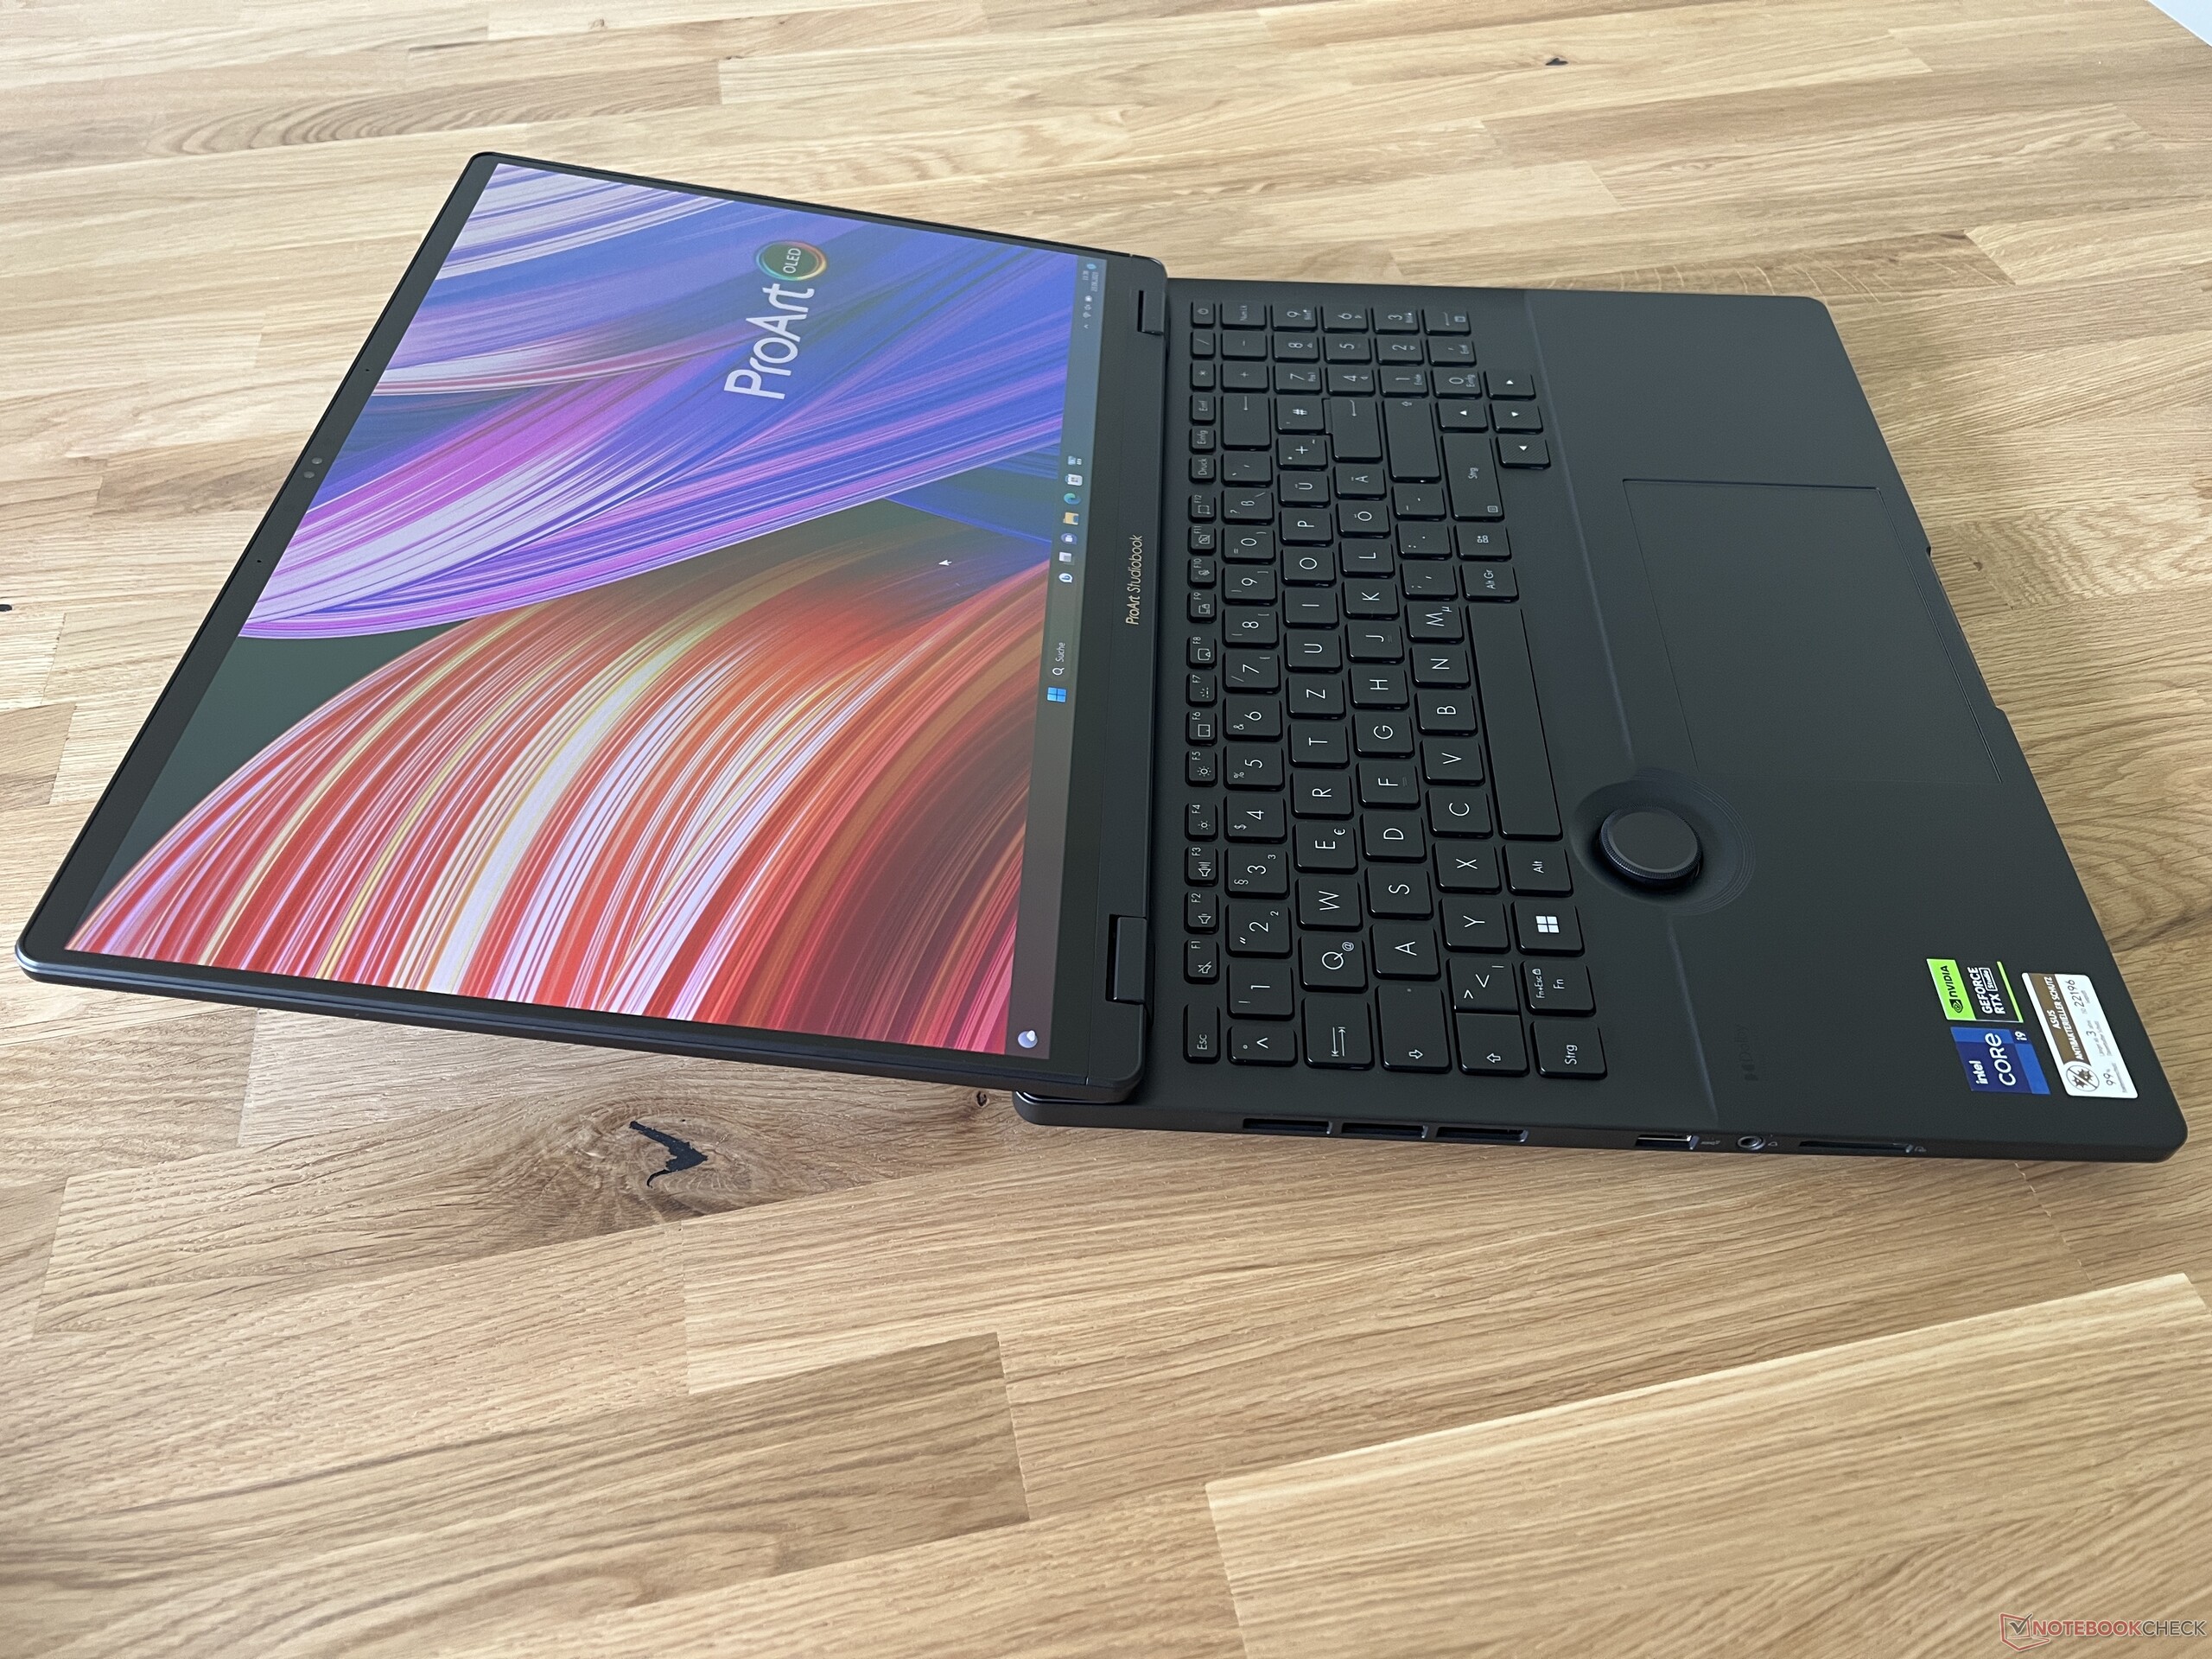
华硕在ProArt Studiobook 16上使用了黑色塑料,感觉相当优质。唯一的问题是光滑的表面,非常容易沾染指纹。总的来说,设计非常克制,除了盖子上的ProArt标志外,没有其他视觉上的强调。当你打开盖子时,键盘下面的大型拨号盘立即吸引了你的目光。盖子略微位于基本单元的前面,但这也使得最大的打开角度几乎达到180度。
底座和盖子的稳定性都很好。在扭转压力下不会发出吱吱嘎嘎的声音,也不会有任何凹陷。铰链调整得很好:它们有效地防止了摇晃,并将屏幕牢牢地固定住。只有在非常小的角度(小于20度),盖子才会因为重量而自行关闭。
Studiobook的重量不到2.5公斤,并不轻,而且由于其尺寸,也不是特别便携。这款笔记本仍然适合放在大型背包里,但作为一个16英寸的笔记本,自然会占用很多空间。它也是对比组中最大的16英寸设备,也不比17英寸设备小多少。这款笔记本的厚度也相当大,约为2.5厘米,仅次于Zephyrus Duo的第二个屏幕。对于240瓦的电源,你必须考虑到额外的740克的运输费用。
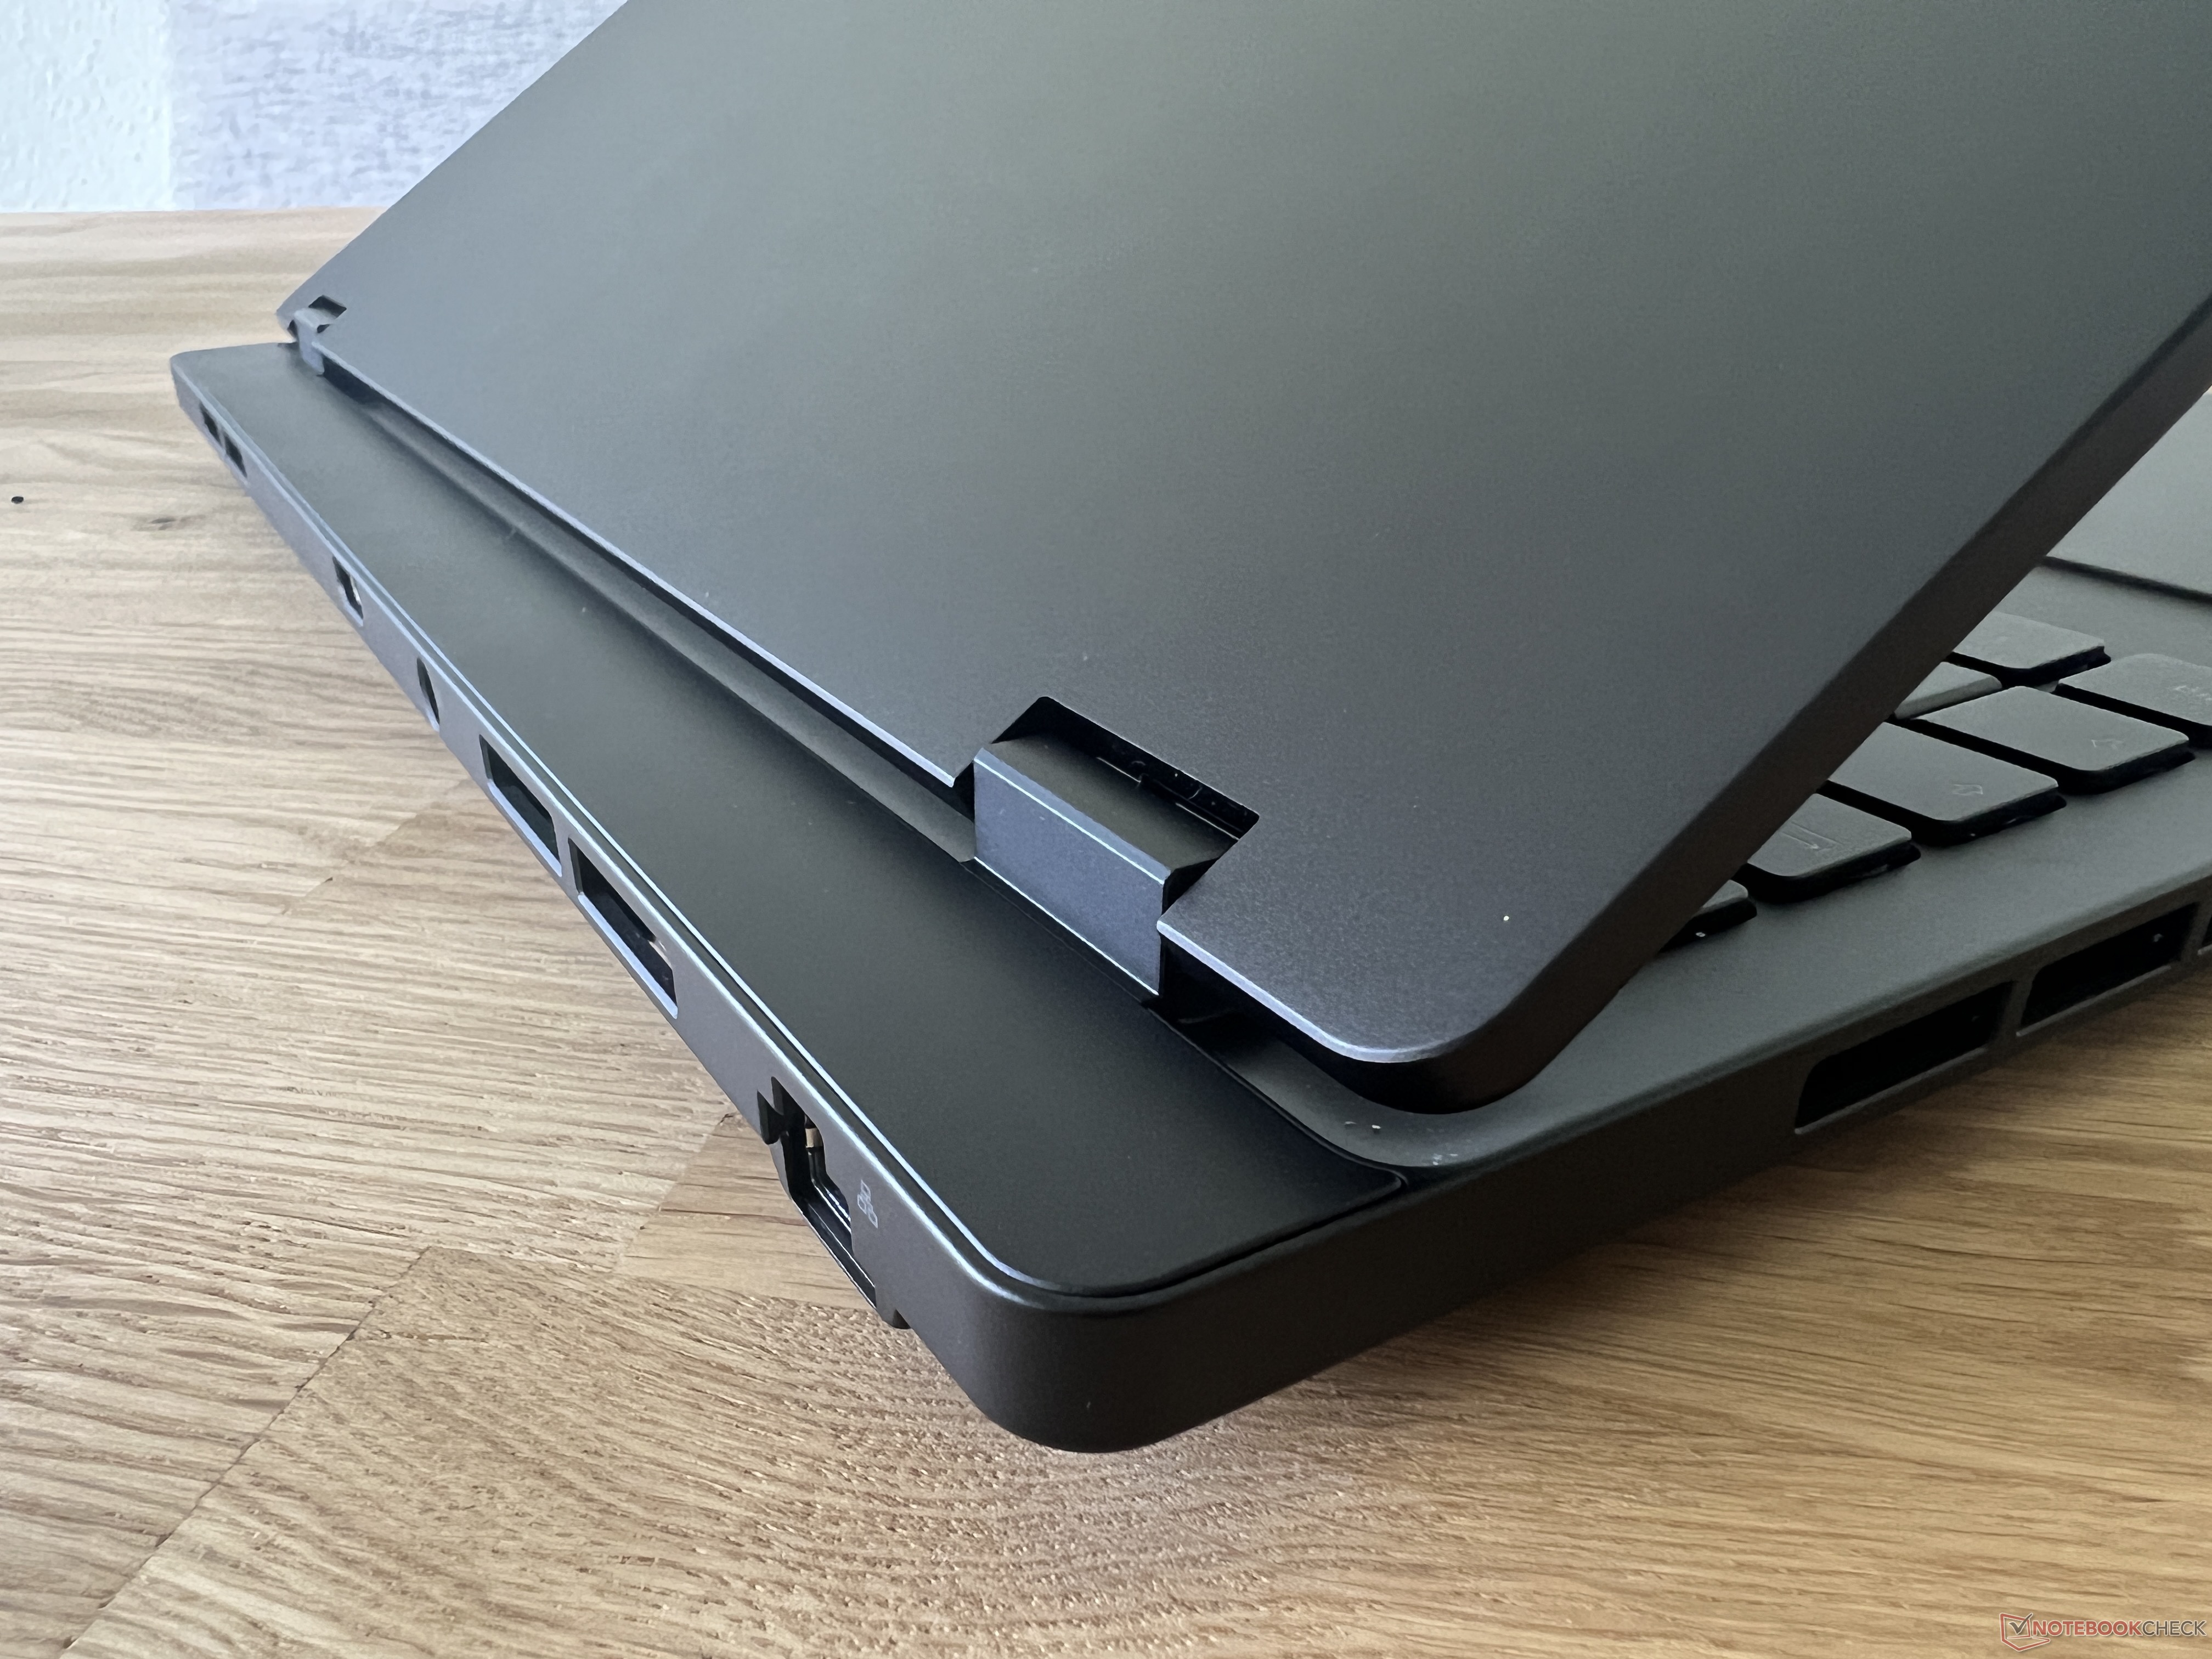
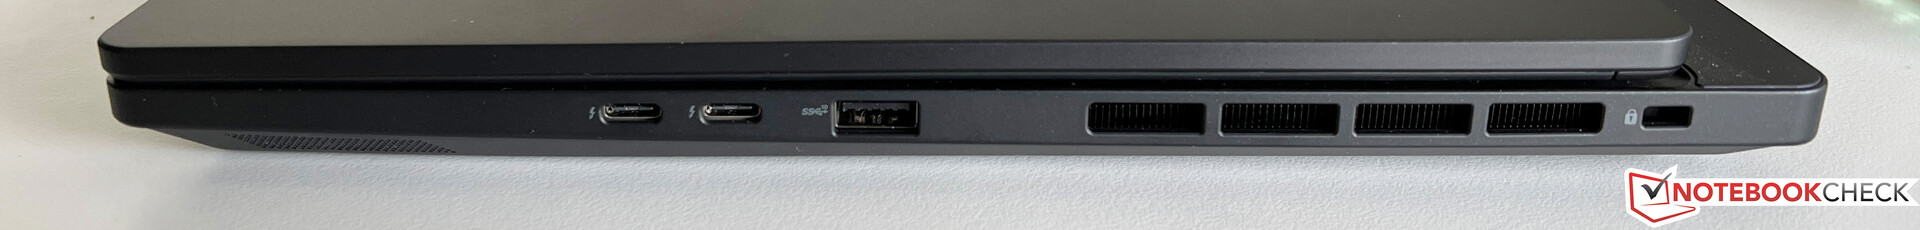
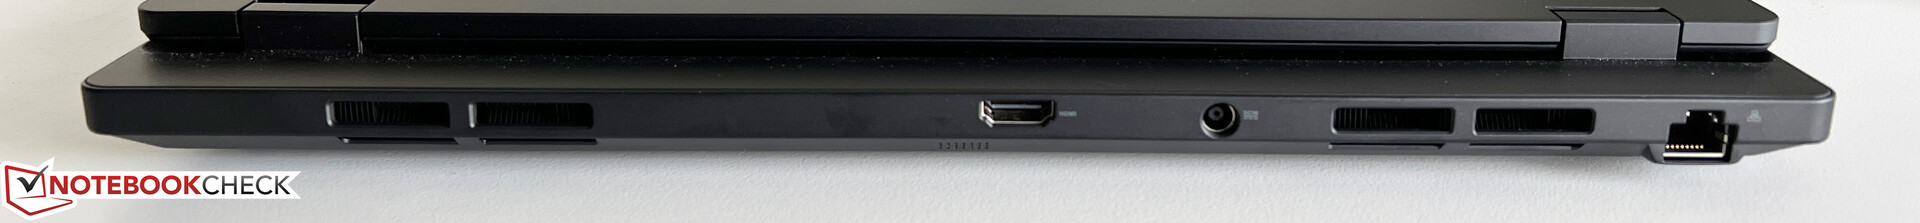
设备 - Thunderbolt 4和HDMI 2.1
端口分布在两侧的前面区域和后面。大多数USB端口都在右前方,当完全占用时,会变得很拥挤。另一方面,华硕将电源插孔、以太网端口和HDMI输出放在了背面,在那里它们不会碍事。
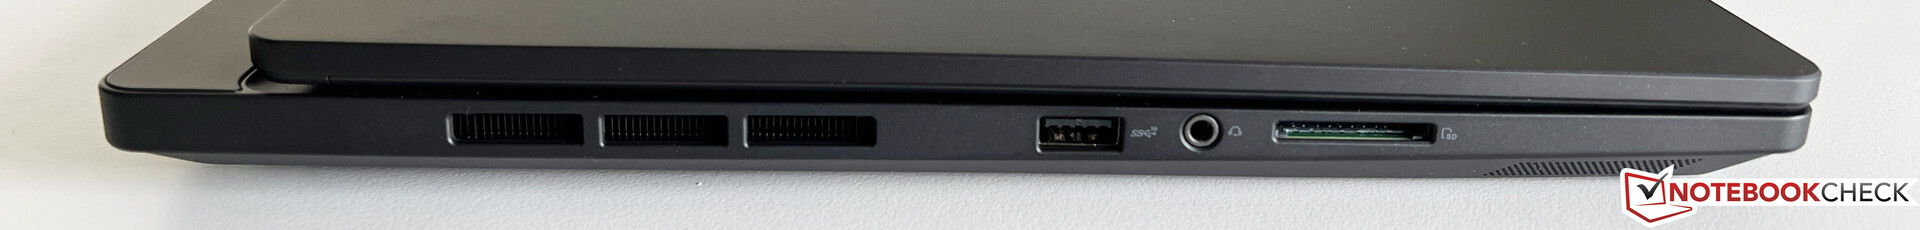
SD卡阅读器
左边是成熟的SD卡读卡器,通过我们的参考卡(Angelbird AV Pro V60),它只能达到平均的传输速率。正如比赛所显示的那样,这里还有很多可能。
| SD Card Reader | |
| average JPG Copy Test (av. of 3 runs) | |
| Apple MacBook Pro 16 2023 M2 Max (Angelbird AV Pro V60) | |
| Asus Zephyrus Duo 16 GX650PY-NM006W (Angelbird AV Pro V60) | |
| Gigabyte AERO 16 OLED BSF | |
| Average of class Multimedia (23 - 531, n=37, last 2 years) | |
| Samsung Galaxy Book3 Ultra 16 (AV PRO microSD 128 GB V60) | |
| Asus ProArt Studiobook 16 OLED H7604 (Angelibird AV Pro V60) | |
| MSI Stealth 17 Studio A13VH-014 | |
| maximum AS SSD Seq Read Test (1GB) | |
| Asus Zephyrus Duo 16 GX650PY-NM006W (Angelbird AV Pro V60) | |
| Apple MacBook Pro 16 2023 M2 Max (Angelbird AV Pro V60) | |
| Average of class Multimedia (37.3 - 1455, n=36, last 2 years) | |
| Gigabyte AERO 16 OLED BSF | |
| Asus ProArt Studiobook 16 OLED H7604 (Angelibird AV Pro V60) | |
| Samsung Galaxy Book3 Ultra 16 (AV PRO microSD 128 GB V60) | |
| MSI Stealth 17 Studio A13VH-014 | |
沟通
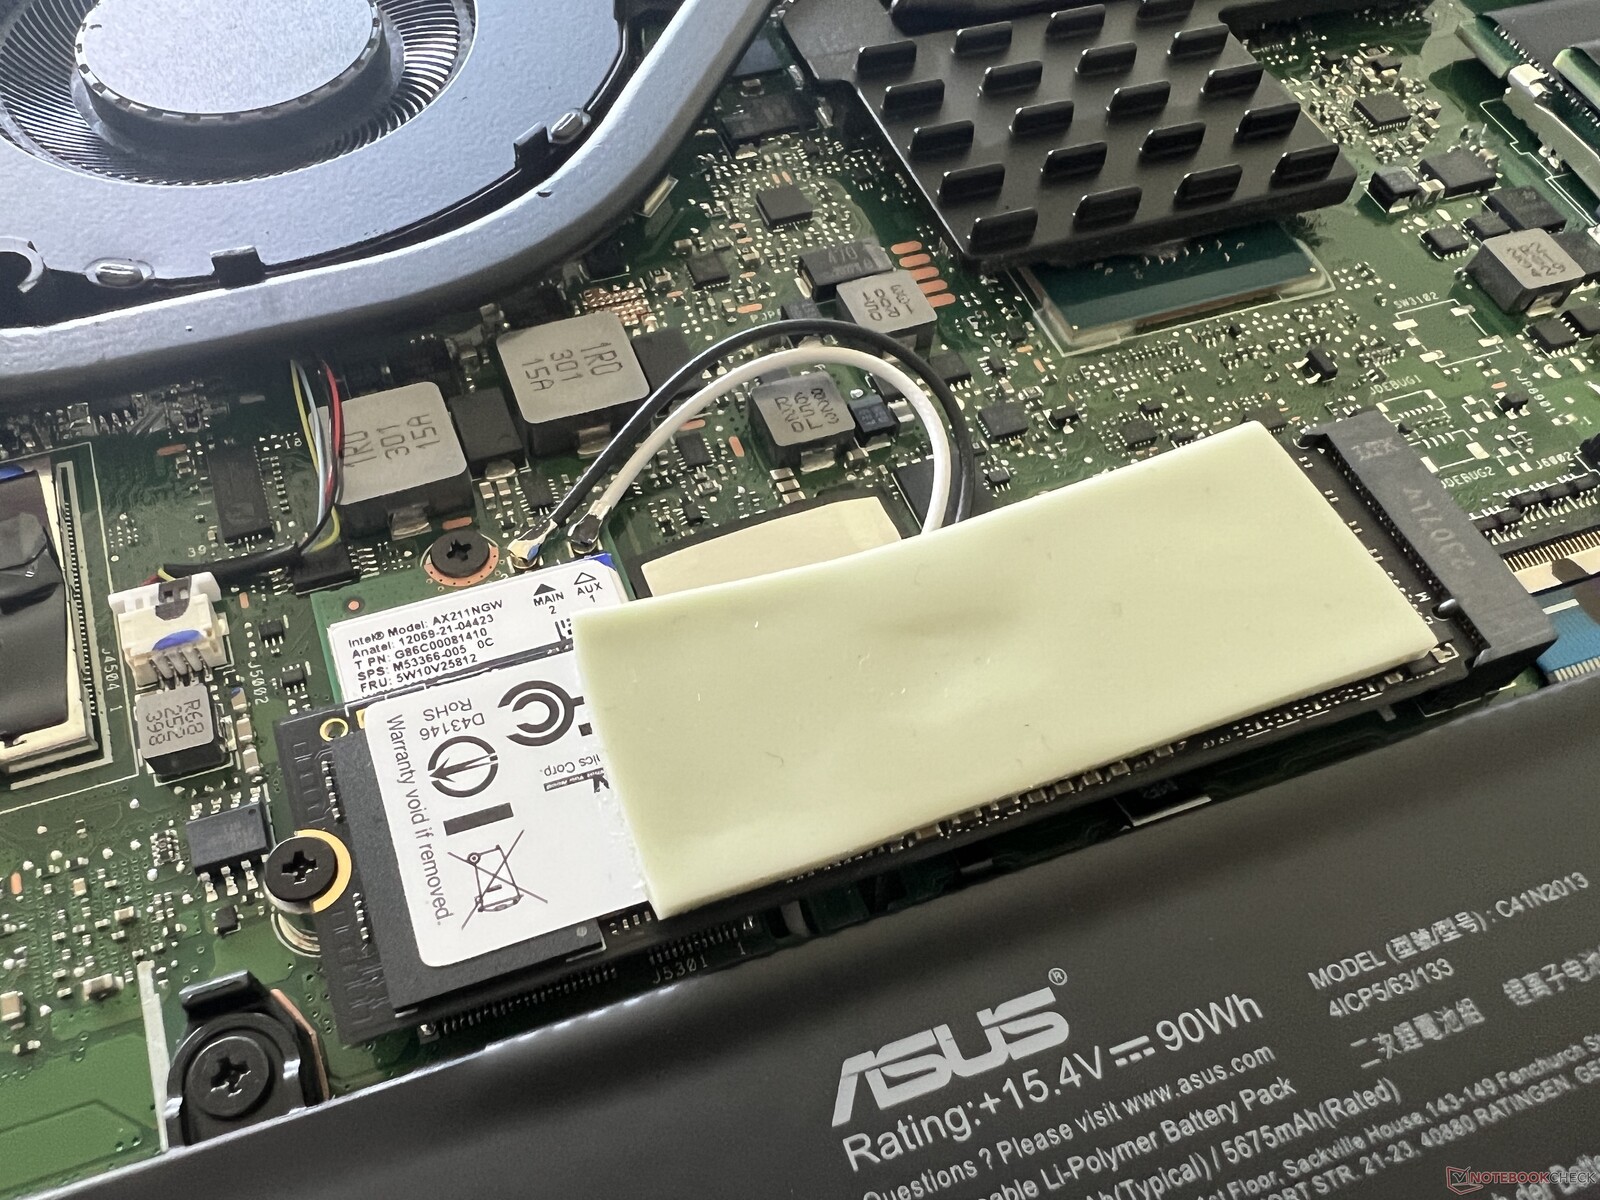
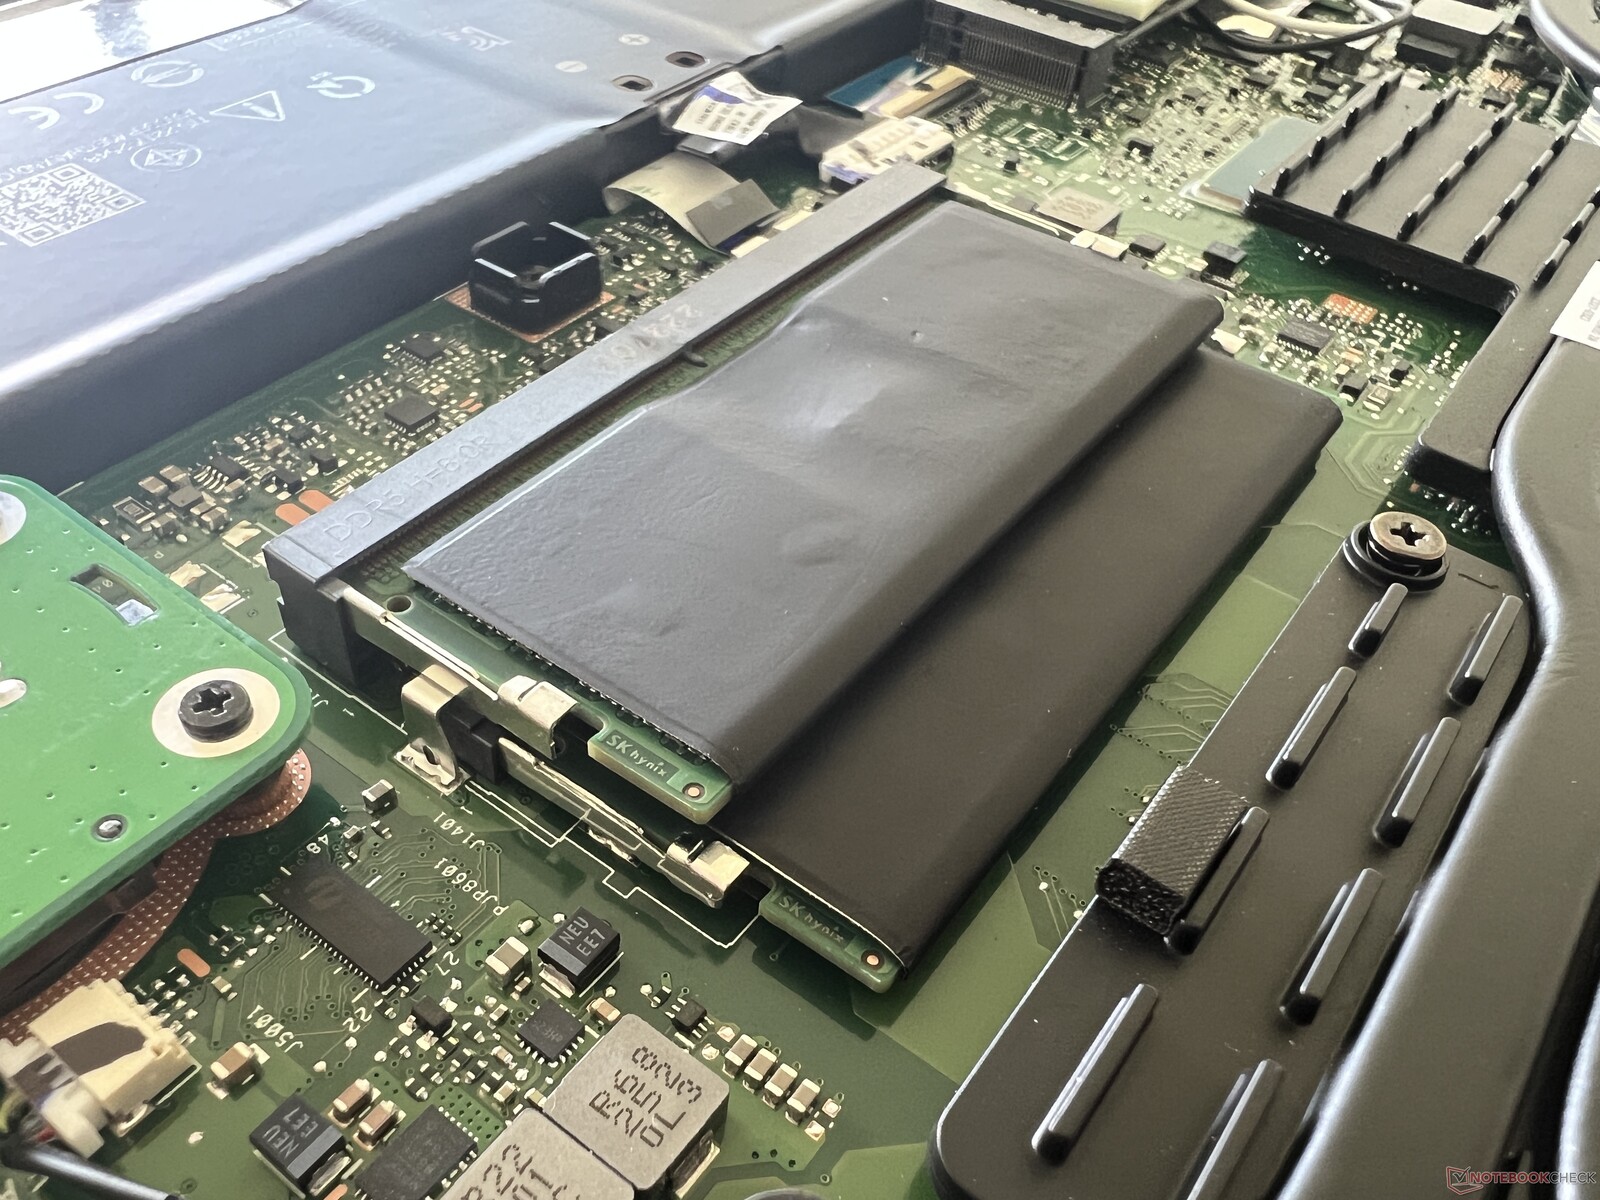
华硕安装了英特尔的现代AX211 WLAN模块,它位于主固态硬盘的下方,可以被替换。与我们的华硕参考路由器相配合,传输速率非常高而且稳定。我们在审查期间没有遇到任何WLAN稳定性问题。背面还有一个用于有线网络的2.5Gbit/s以太网端口。
| Networking | |
| Asus ProArt Studiobook 16 OLED H7604 | |
| iperf3 transmit AXE11000 | |
| iperf3 receive AXE11000 | |
| Gigabyte AERO 16 OLED BSF | |
| iperf3 transmit AXE11000 6GHz | |
| iperf3 receive AXE11000 6GHz | |
| Samsung Galaxy Book3 Ultra 16 | |
| iperf3 transmit AXE11000 | |
| iperf3 receive AXE11000 | |
| MSI Stealth 17 Studio A13VH-014 | |
| iperf3 transmit AXE11000 | |
| iperf3 receive AXE11000 | |
| iperf3 transmit AXE11000 6GHz | |
| iperf3 receive AXE11000 6GHz | |
| Apple MacBook Pro 16 2023 M2 Max | |
| iperf3 transmit AXE11000 6GHz | |
| iperf3 receive AXE11000 6GHz | |
| Asus Zephyrus Duo 16 GX650PY-NM006W | |
| iperf3 transmit AXE11000 6GHz | |
| iperf3 receive AXE11000 6GHz | |
网络摄像头
在良好的照明条件下,1080p网络摄像头可以拍摄出体面的照片,但它们也有些失真。还安装了一个红外模块,它支持通过Windows Hello进行面部识别。


辅料
我们的测试设备配备了华硕笔2.0以及无线ProArt鼠标MD300,其零售价为180美元。与笔记本本身一样,鼠标的侧面也安装了一个小的DialPad。你是否能有意义地使用它,取决于所使用的软件。你必须安装ArmoryCrate来调整鼠标的设置,而且你不能在ProArt Creator Hub中这样做,这有点令人恼火。在测试中,鼠标工作得很好,点击非常精确,但也很响。例如,罗技鼠标的静音按钮要安静得多。
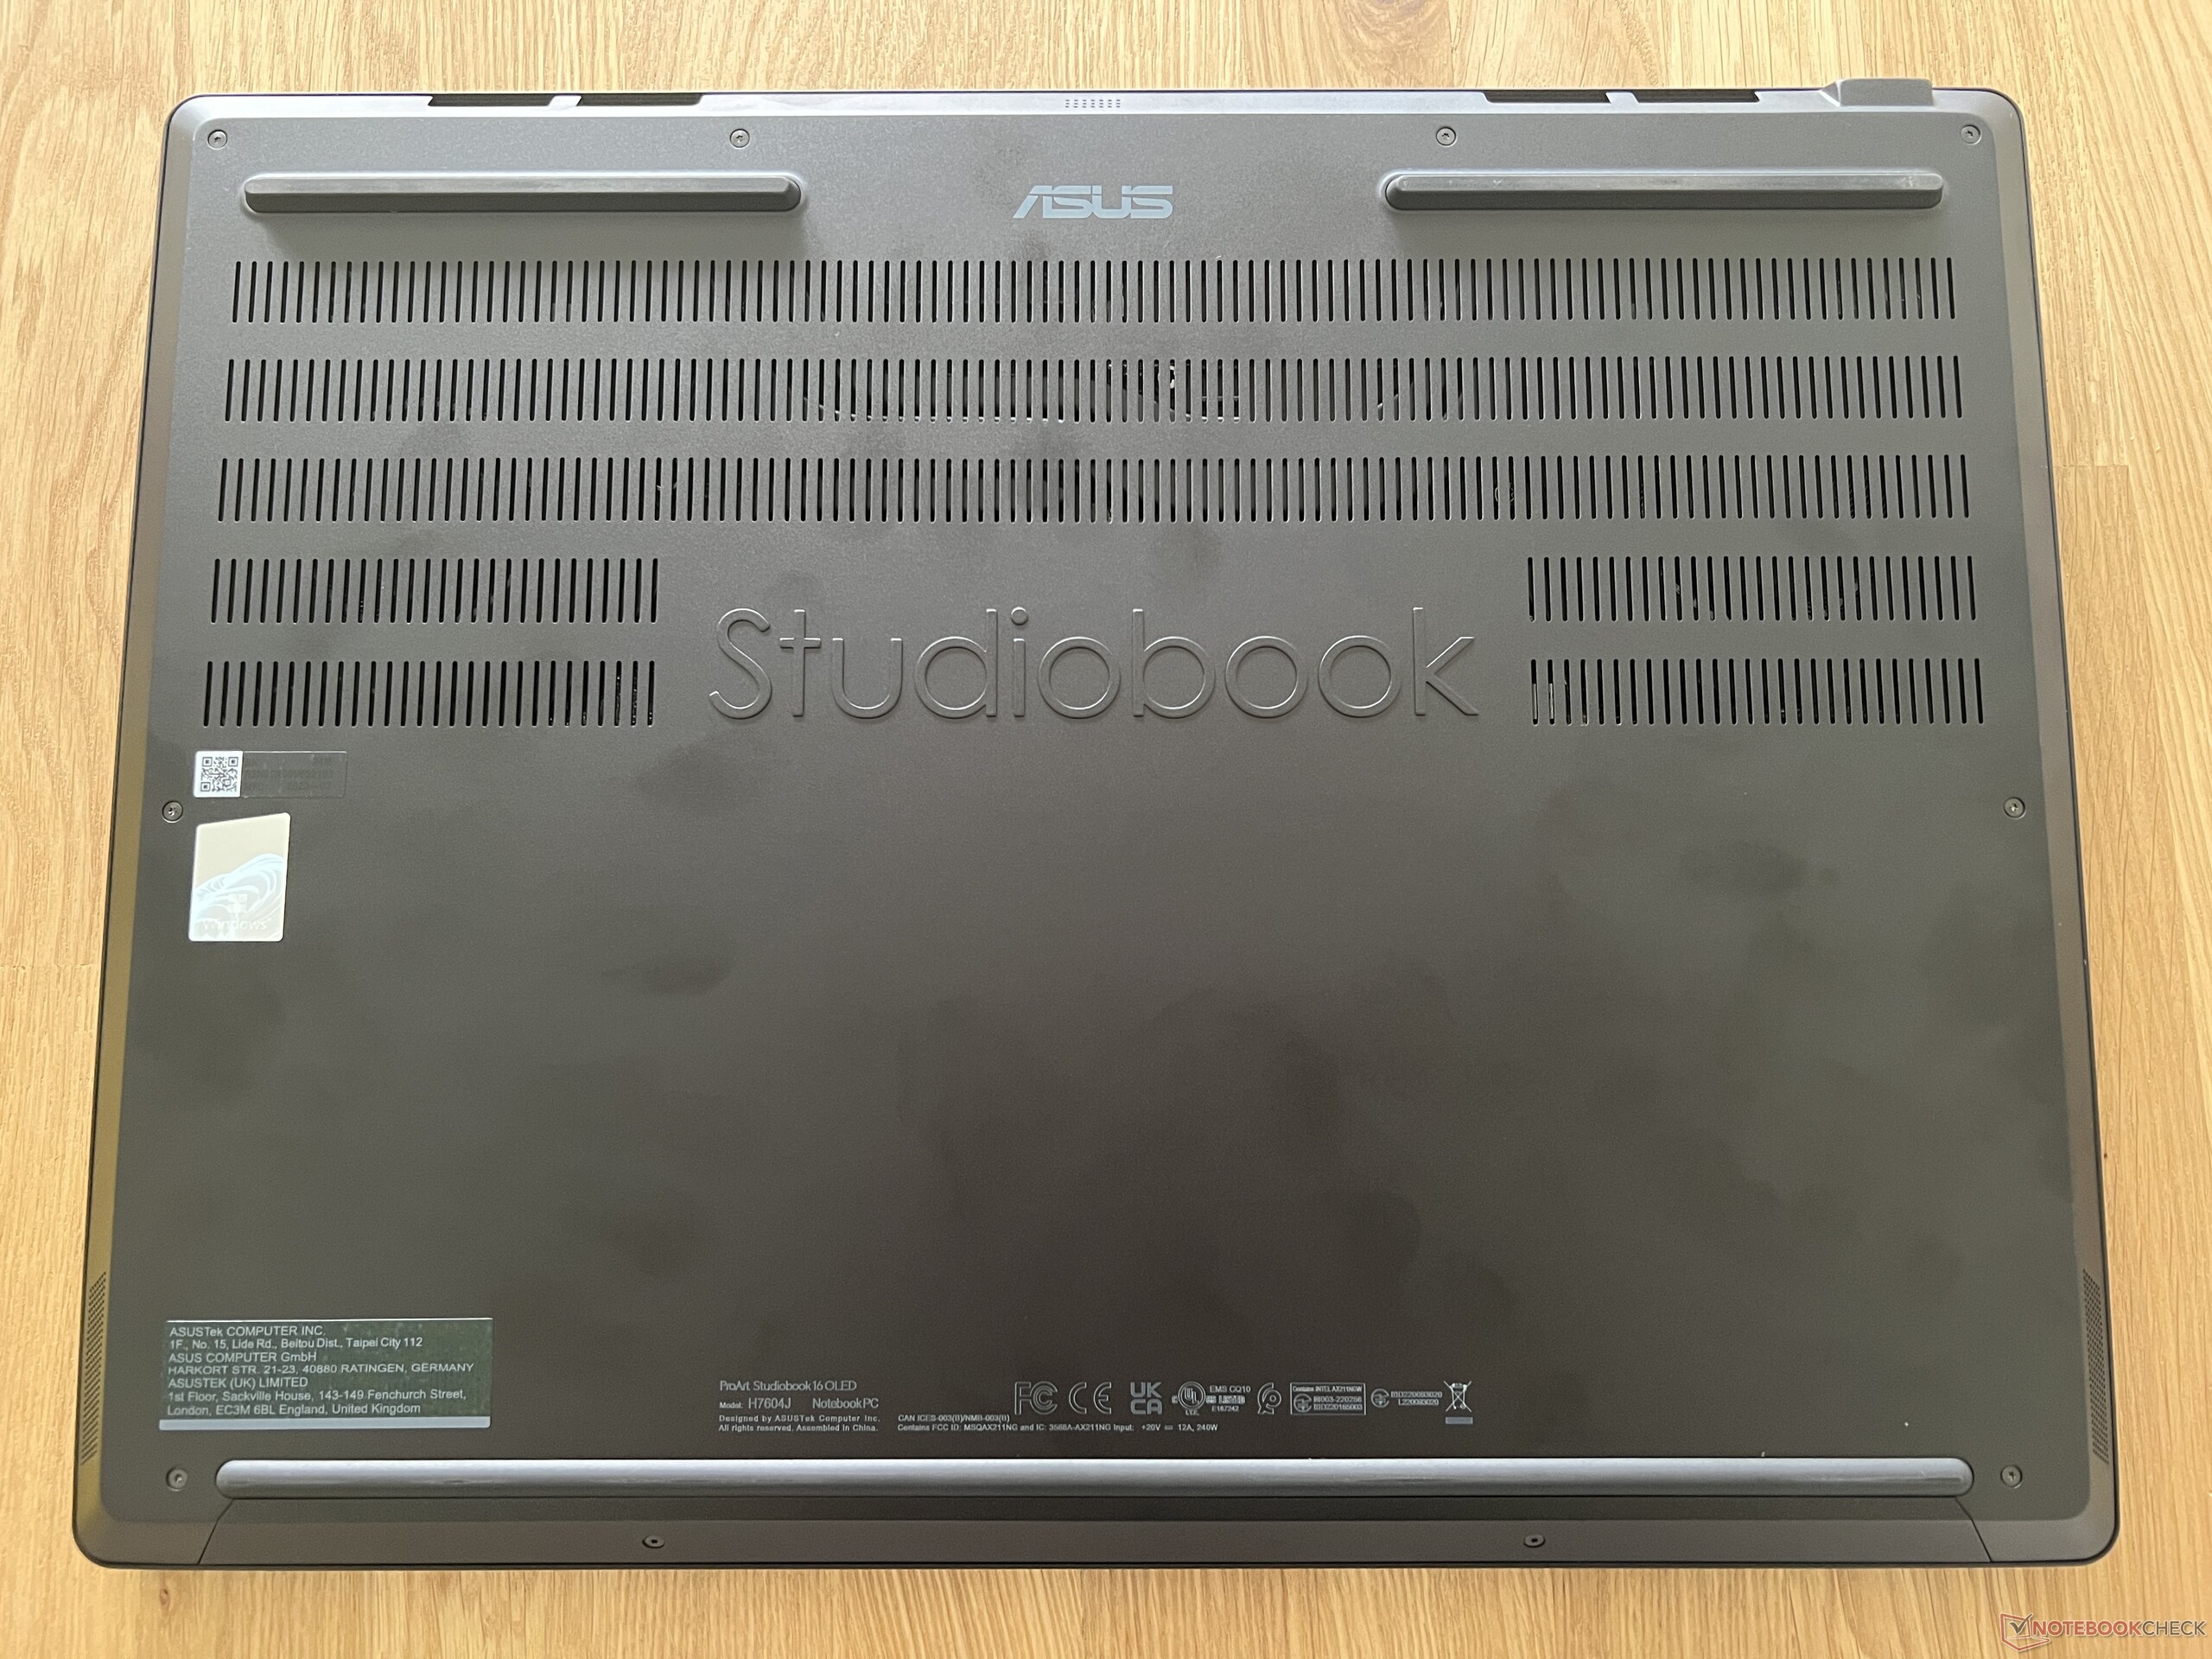
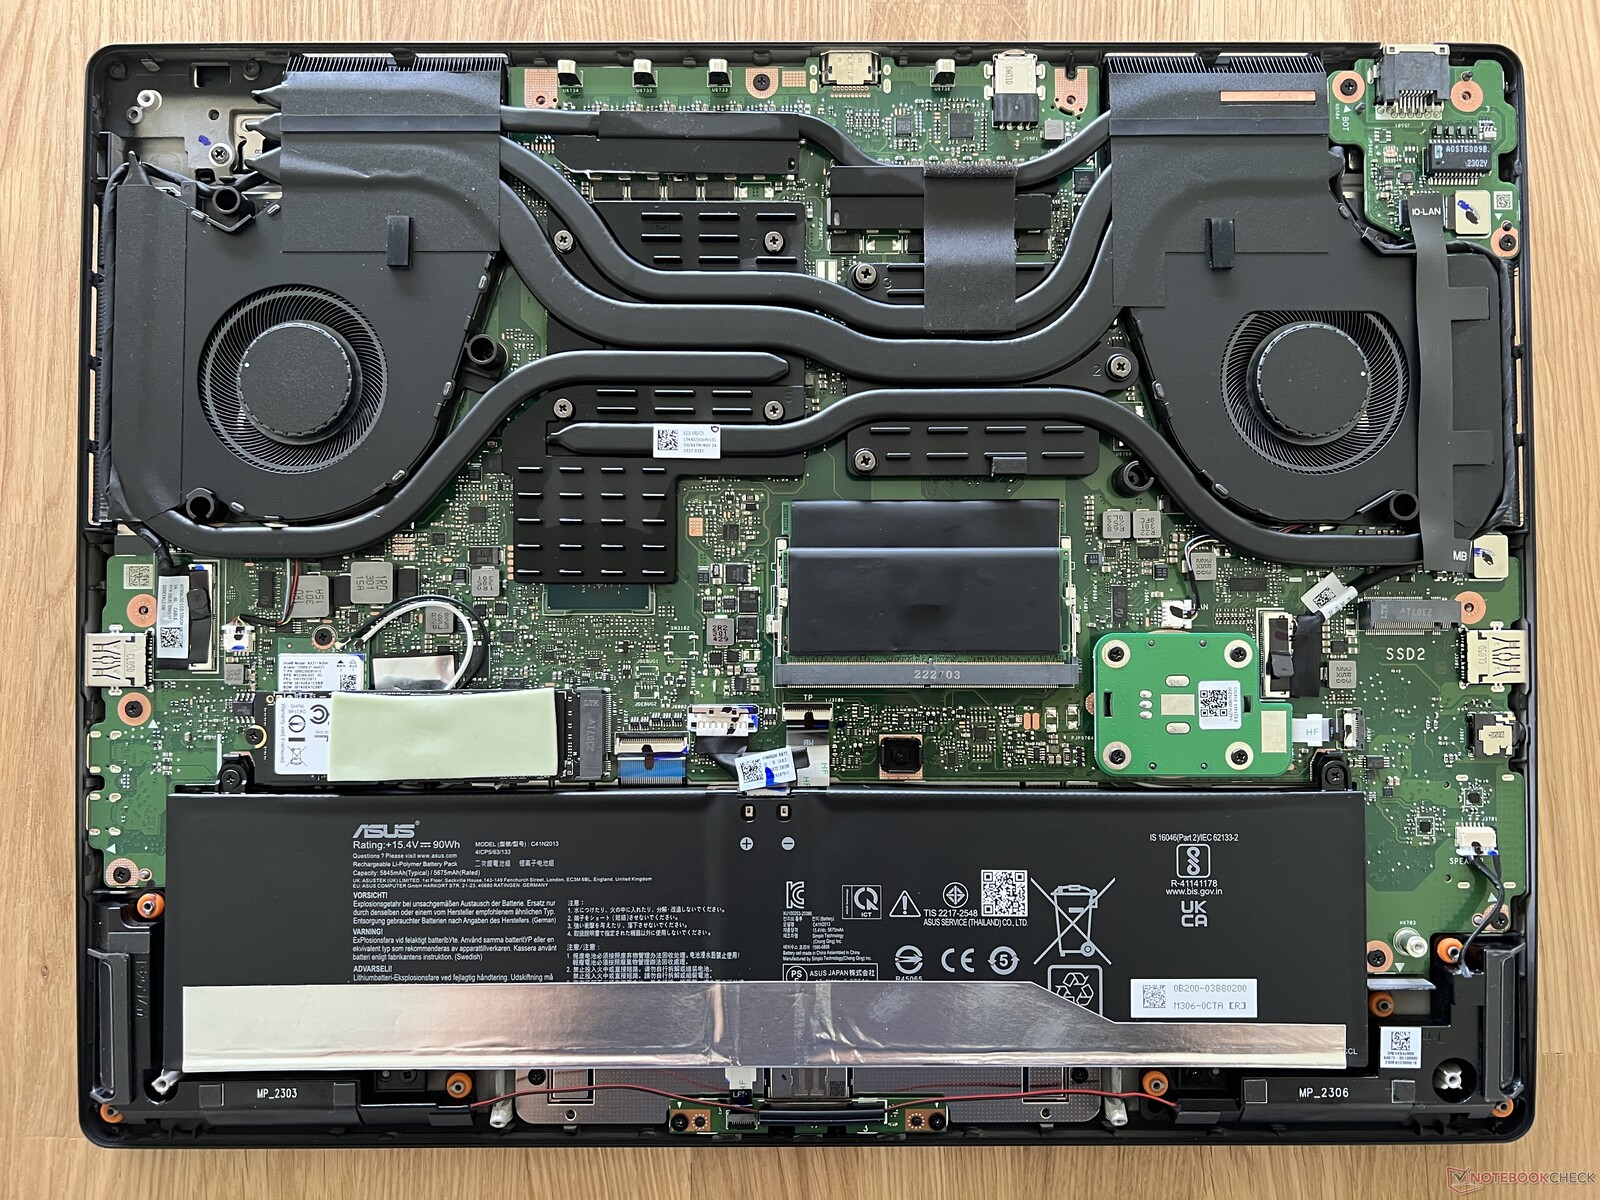
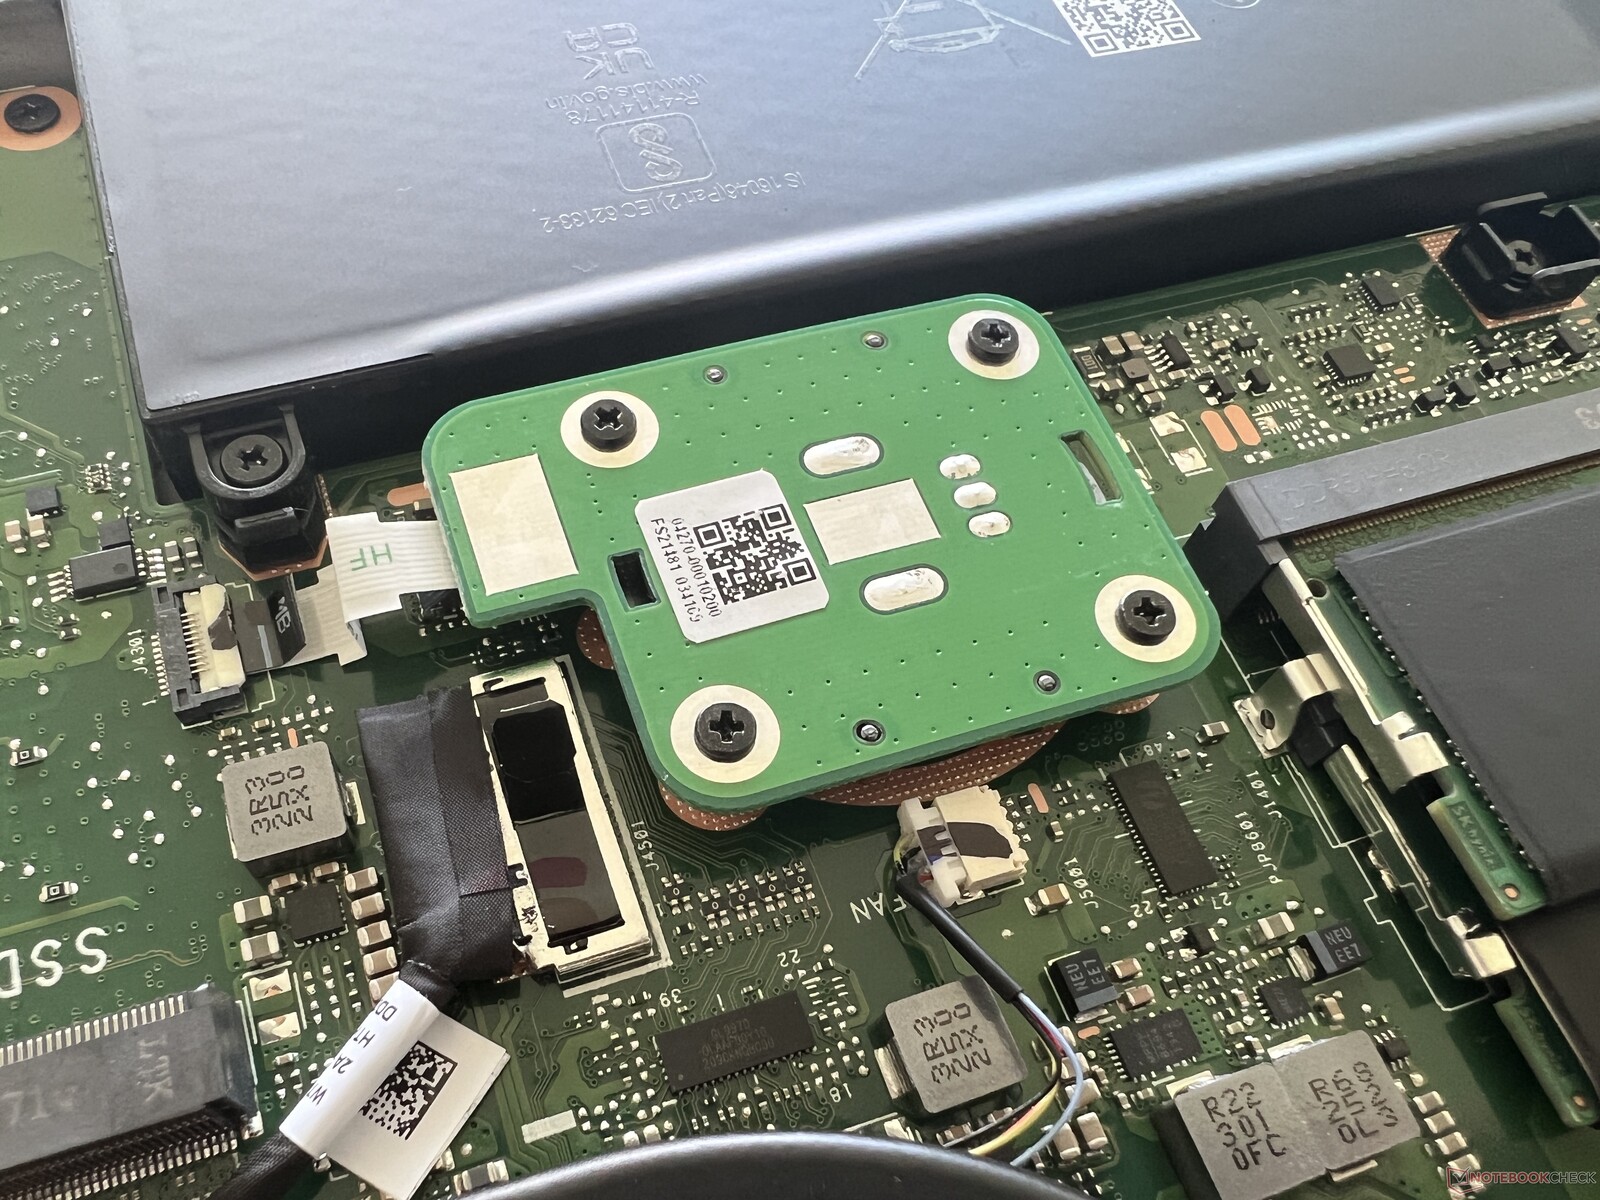
维护
底部机箱盖是用10颗Torx螺丝(T5)固定的,在卸下这些螺丝后仍然非常紧。撬开盖子的最简单方法是在后部的风扇出口处。在内部,大型冷却系统占主导地位,维护选项也非常好,从WLAN模块(主固态硬盘下方)、两个SO DIMM插槽到两个用于固态硬盘的M.2 2280插槽。这里还引人注目的是额外的DialPad占用了多少空间
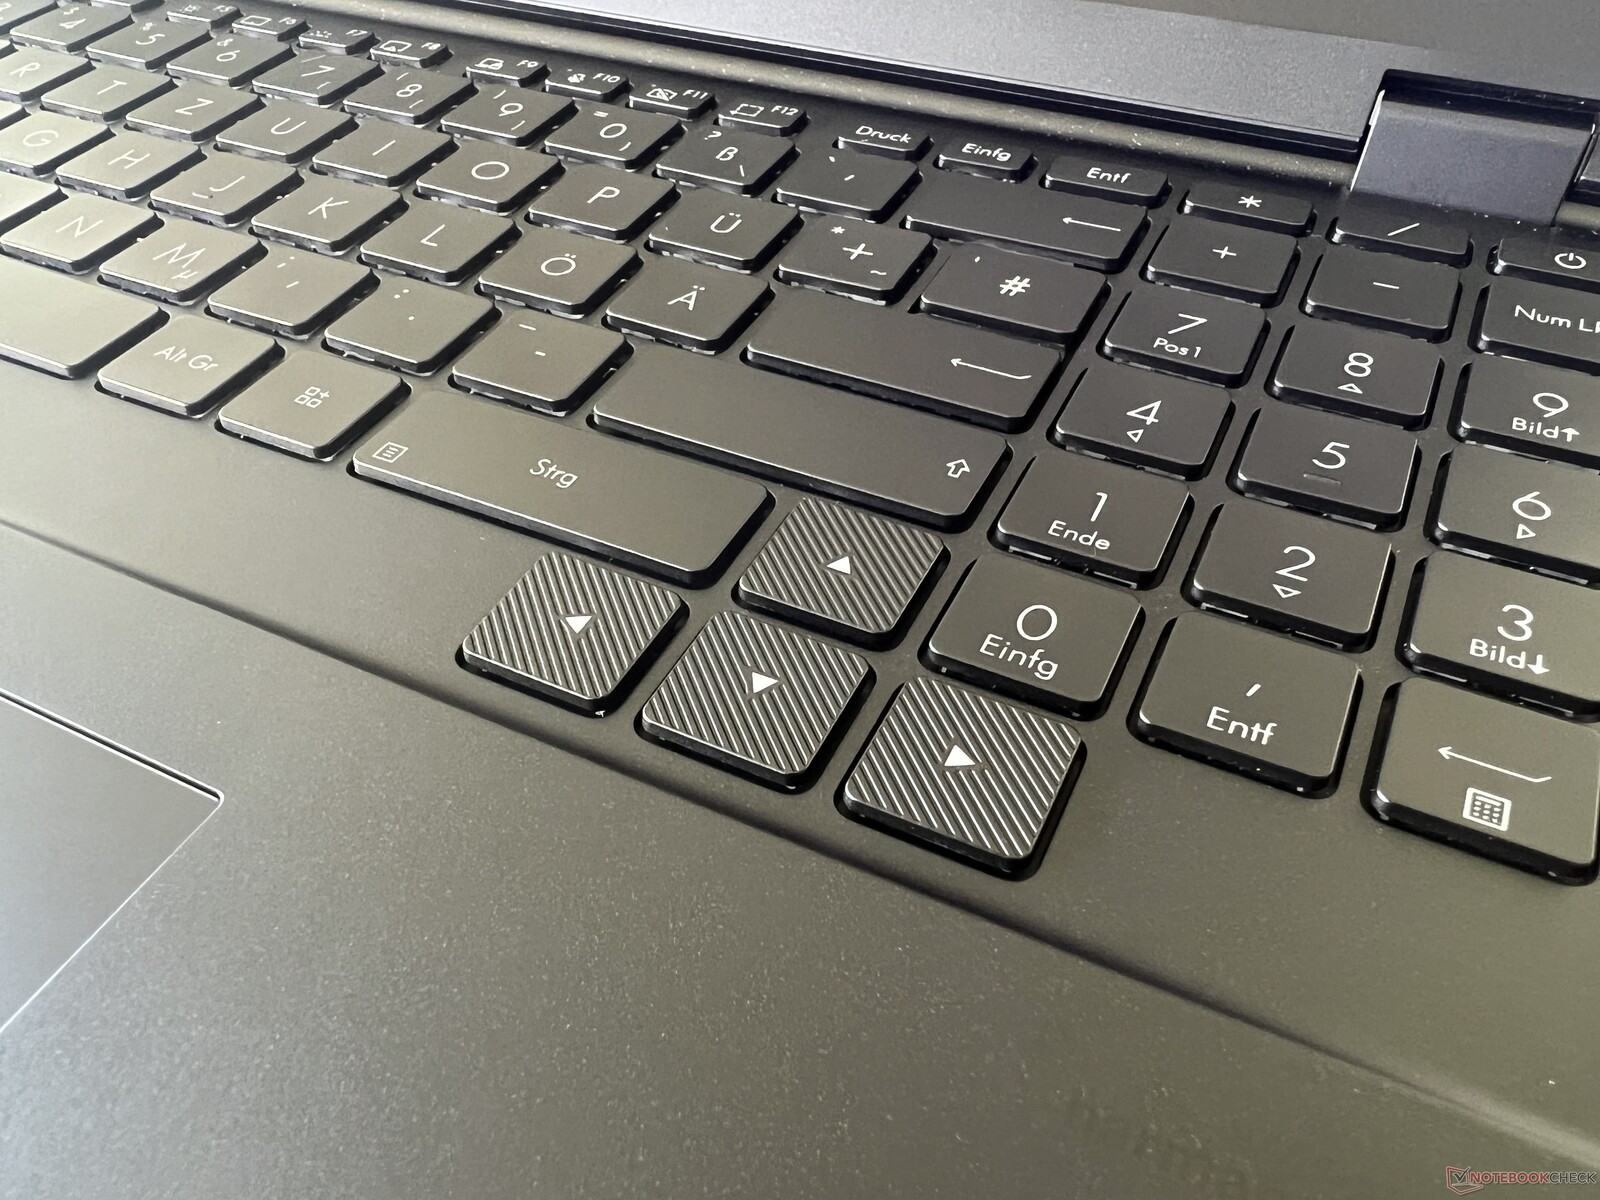
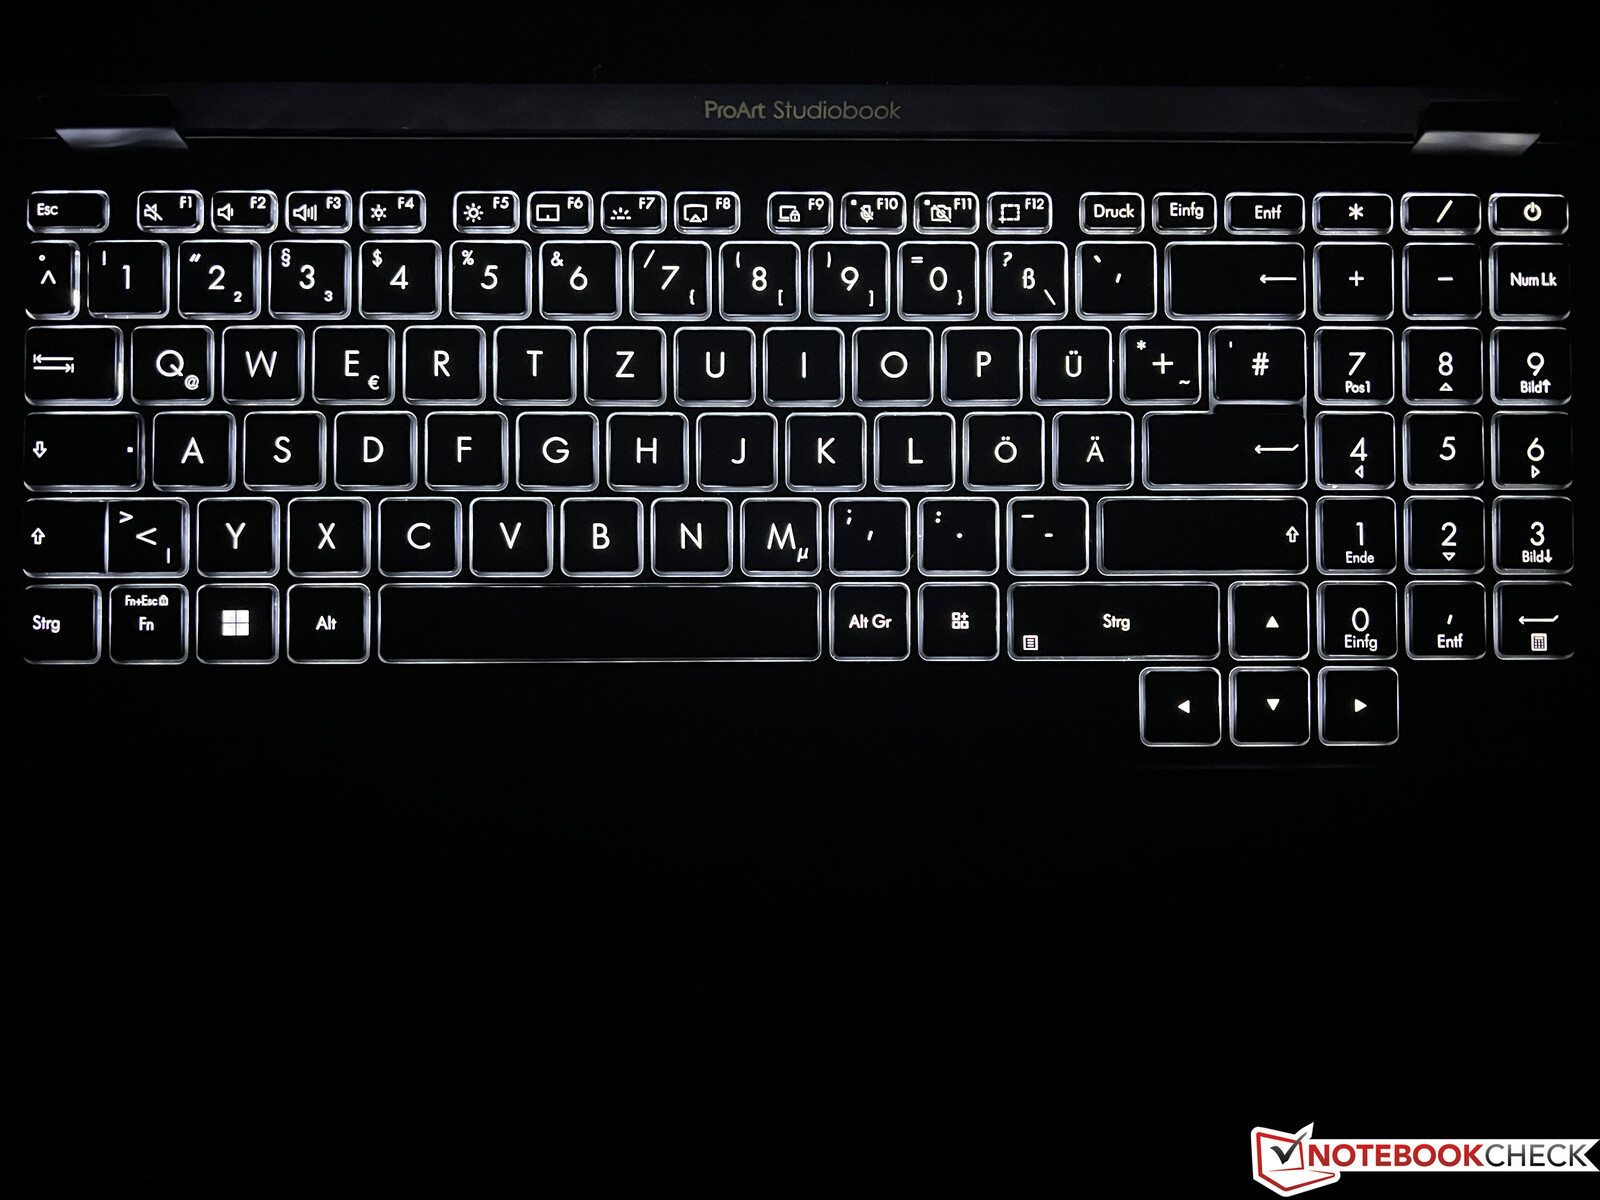
输入设备 - 拨号键盘和数字键盘
键盘
键盘的行程为1.4毫米,有一个专用的小键盘。打字的感觉很好,但按键不是最安静的,尤其是空格键的声音很大。这种布局也需要一点时间来适应,因为方向键很大,但被向下移动了。单排的回车键也不完美。有一个三段式的白色照明,但它不是通过传感器自动激活的。
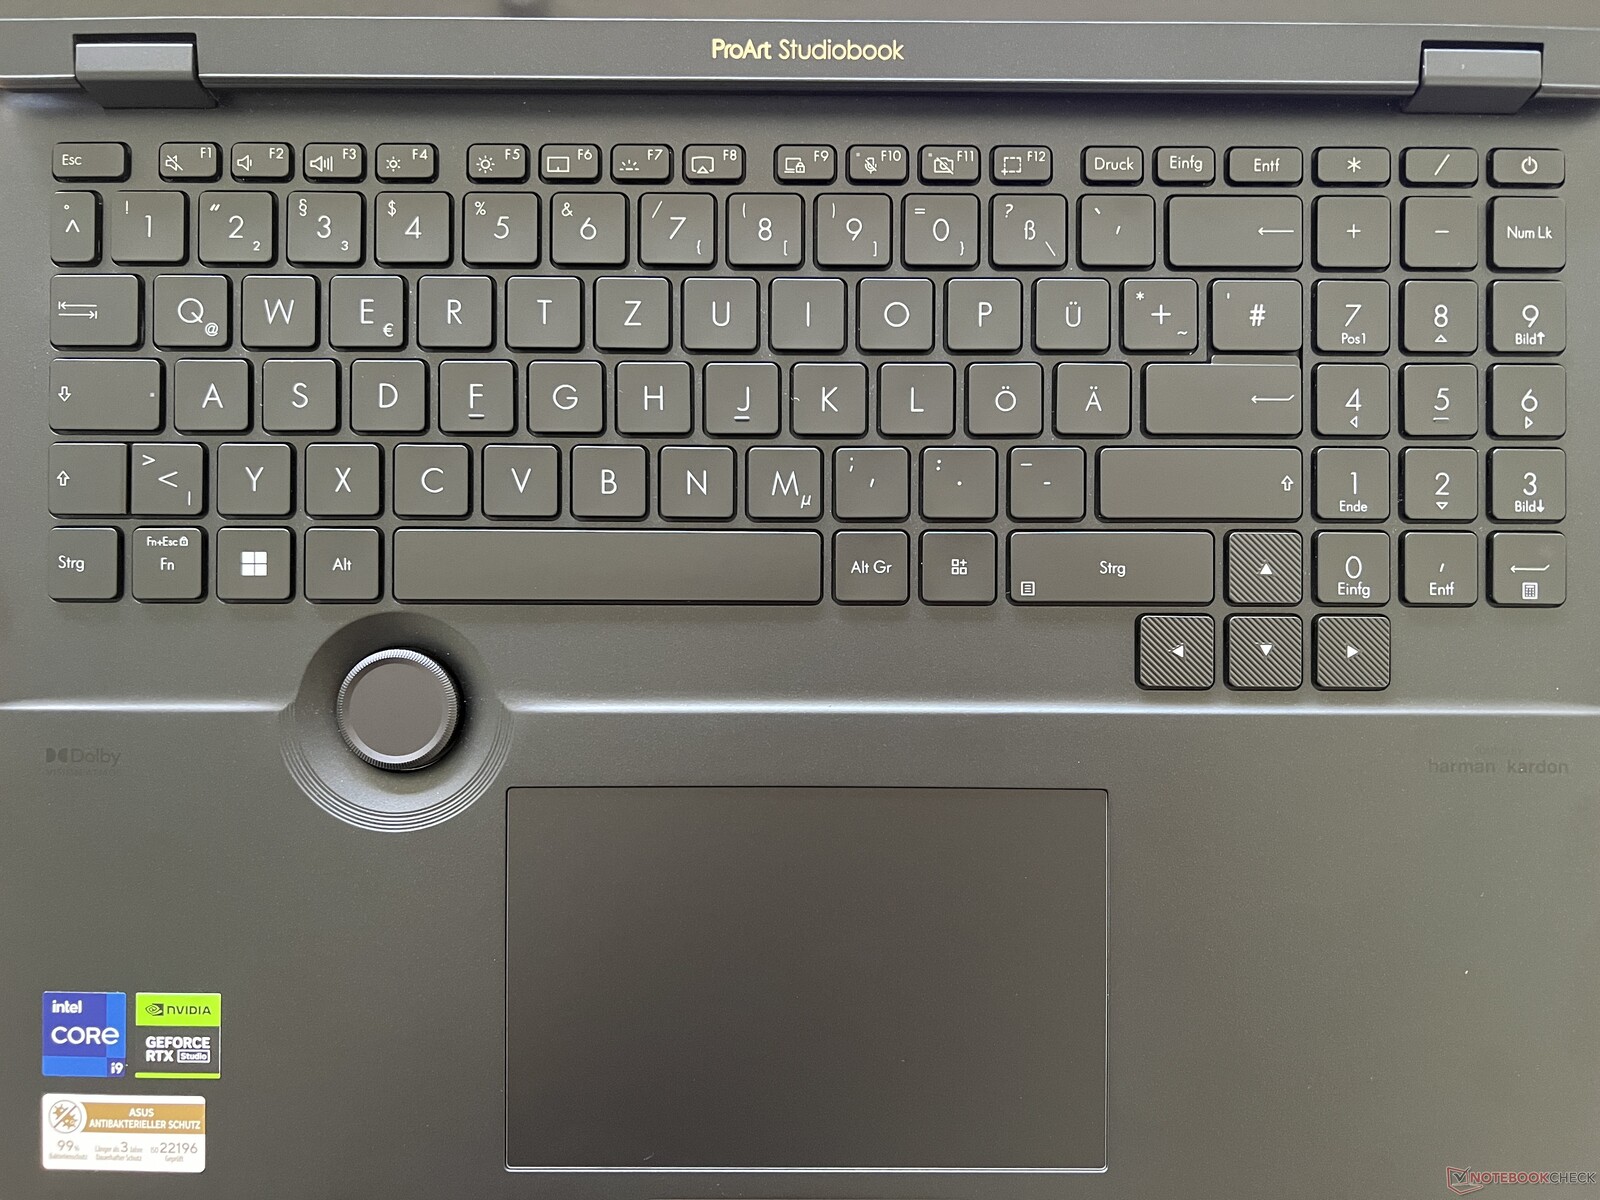
触摸板
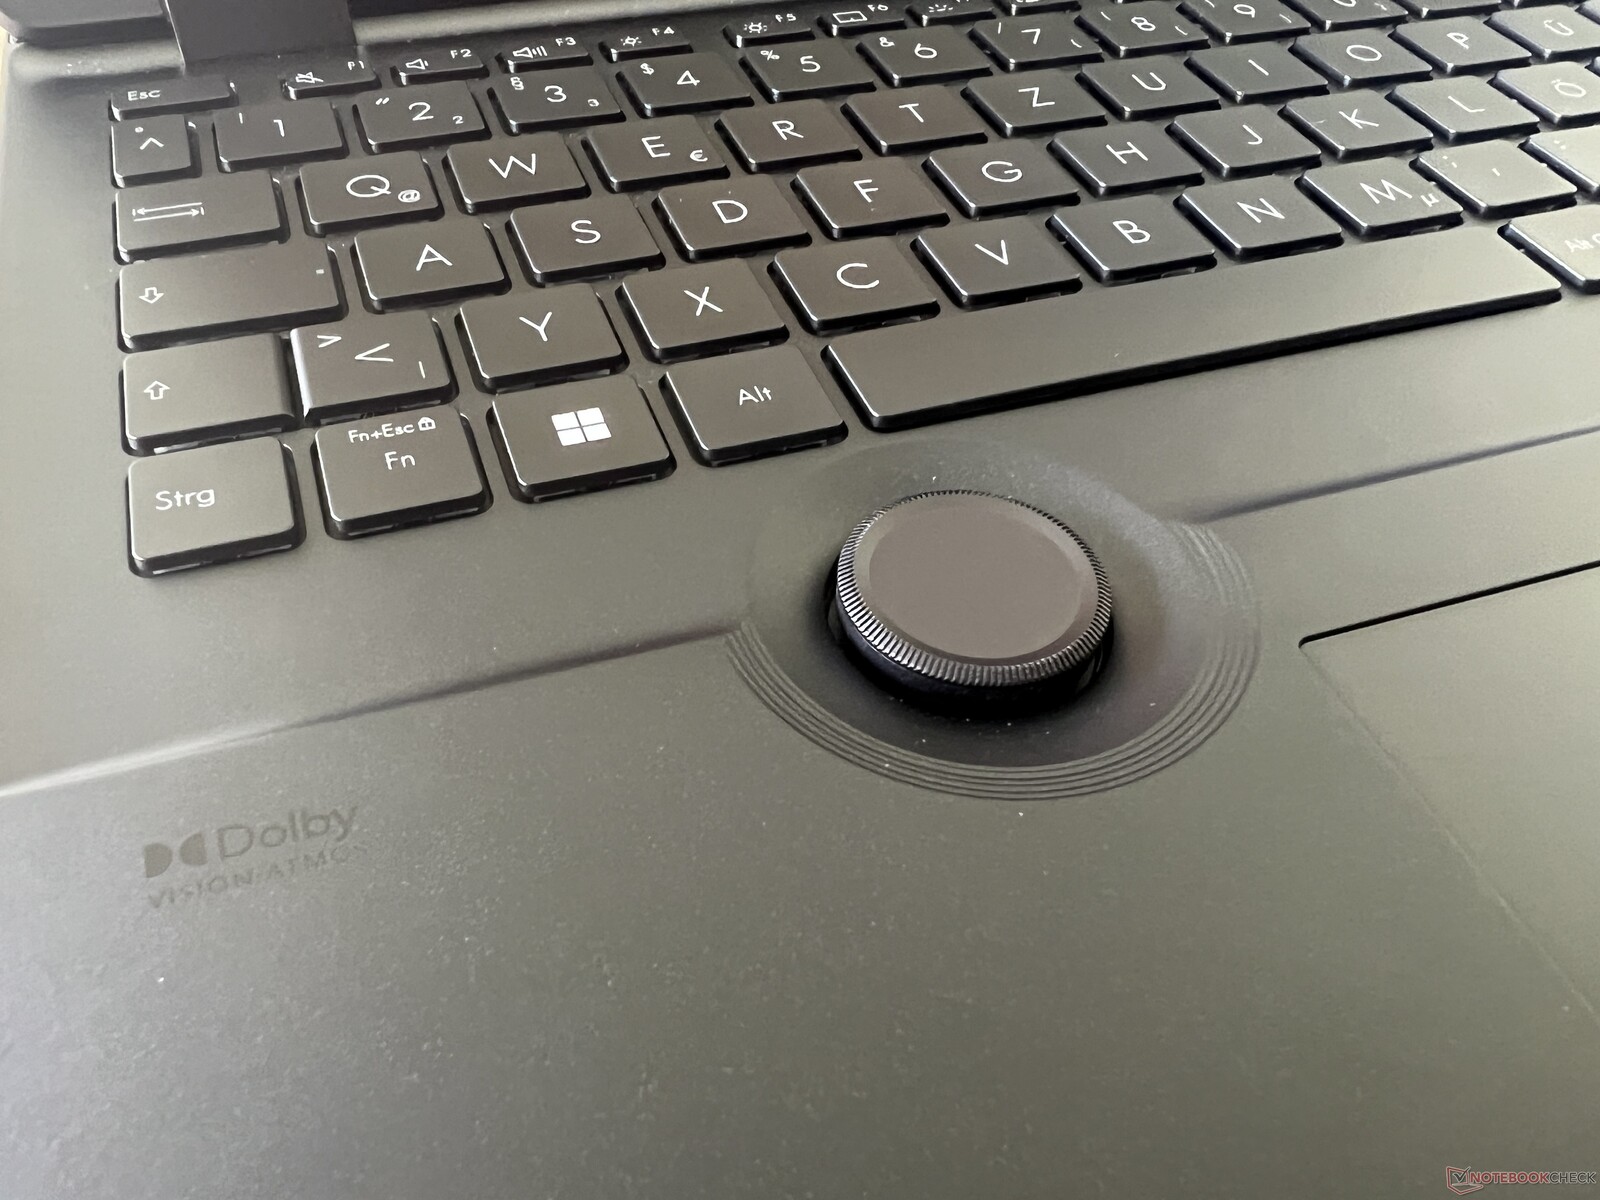
大型触摸板工作性能优异,可以随处点击,其特点是丰富而安静的点击声。特别之处在于DialPad,一个位于触摸板和键盘之间的大型旋转按钮。与Adobe应用程序的实施效果很好,但鼠标和键的组合通常更快。在正常的桌面使用中,亮度和音量也可以通过DialPad进行调整,但通过正常的特殊键或F键进行调整会快得多。
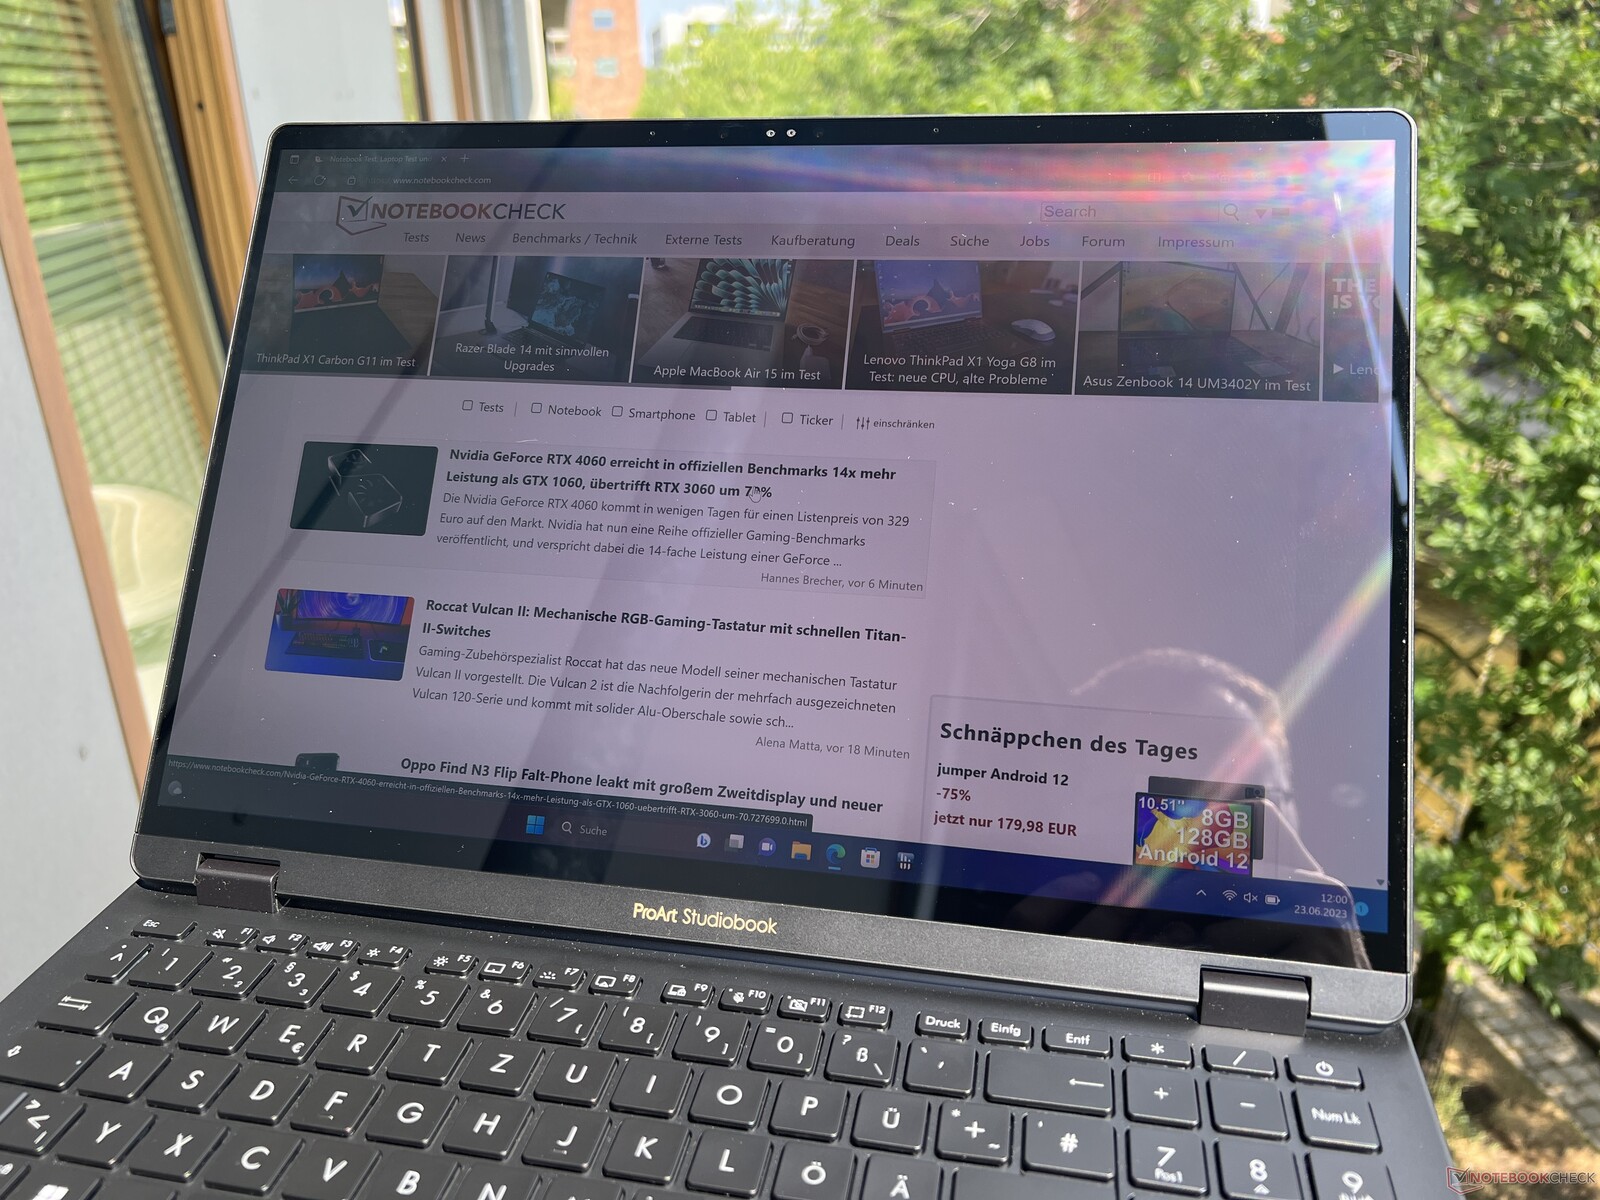
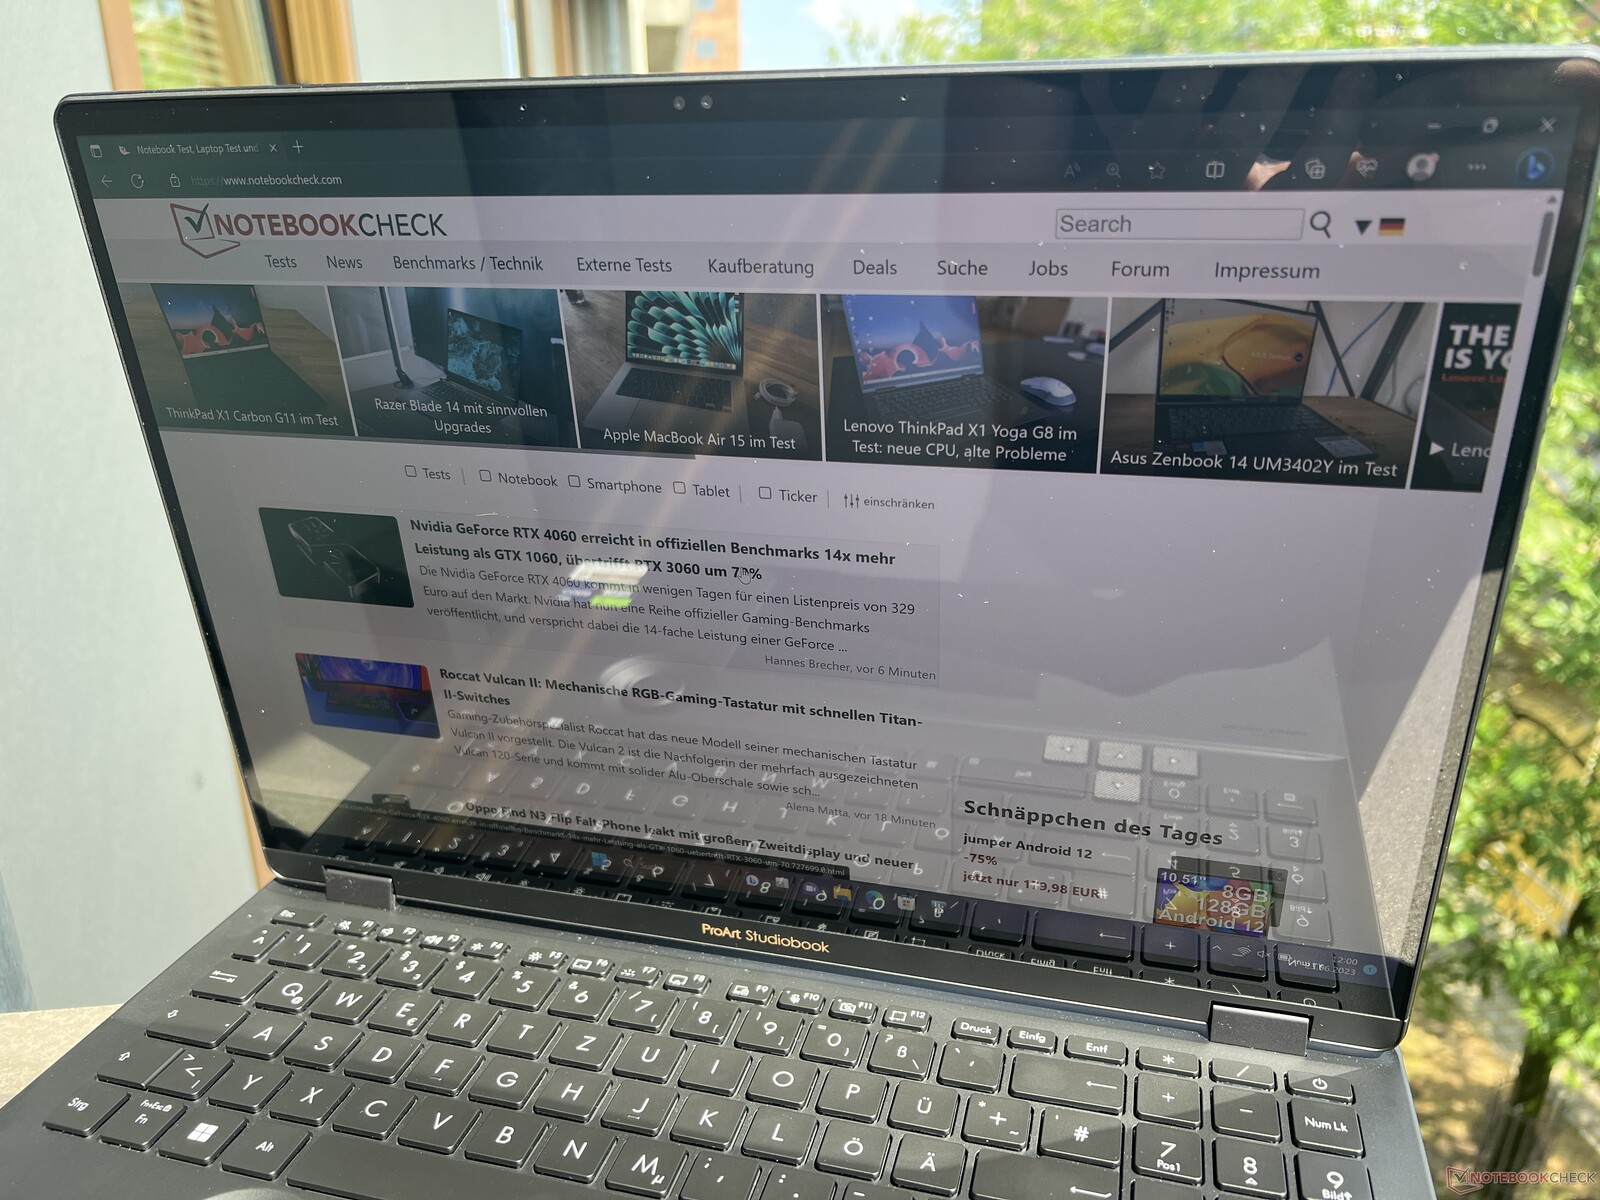
显示 - 120赫兹的OLED面板
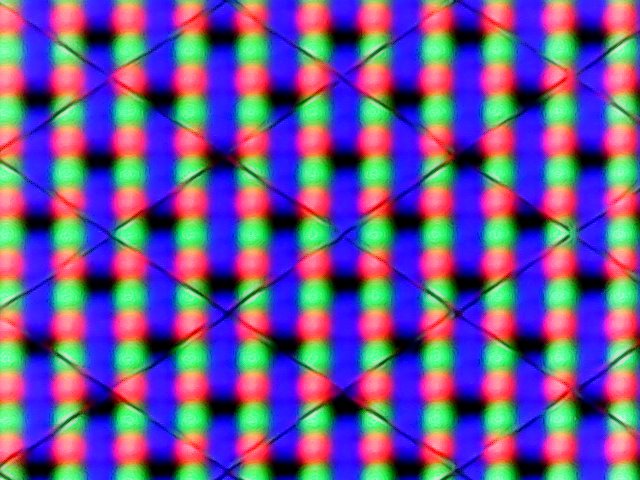
华硕目前完全致力于OLED屏幕,Studiobook也不例外。与前代产品的4K OLED显示屏相比,这里使用的是3,200 x 2,000像素的OLED触摸屏,频率更高,为120 Hz。主观的图像质量非常好,但就像最近评测的ZenBook Pro 14一样,仔细观察时,明亮的区域显得有点颗粒感,这是由于触摸层的原因。亮度不能根据环境光线自动调整。
我们确定正常SDR模式下的平均亮度为350cd/m²,但由于OLED面板的黑值极低,对比度非常高。在HDR模式下,在一个小的图像部分,最高几乎是580cd/m²,在一个几乎完全白色的图像中,大约是480cd/m²。然而,HDR模式必须先在Windows设置中手动启用,之后就不能再使用颜色配置文件了。OLED面板上没有光晕。
| |||||||||||||||||||||||||
Brightness Distribution: 95 %
Center on Battery: 346 cd/m²
Contrast: 17450:1 (Black: 0.02 cd/m²)
ΔE ColorChecker Calman: 2.1 | ∀{0.5-29.43 Ø4.71}
calibrated: 2.1
ΔE Greyscale Calman: 1.2 | ∀{0.09-98 Ø4.96}
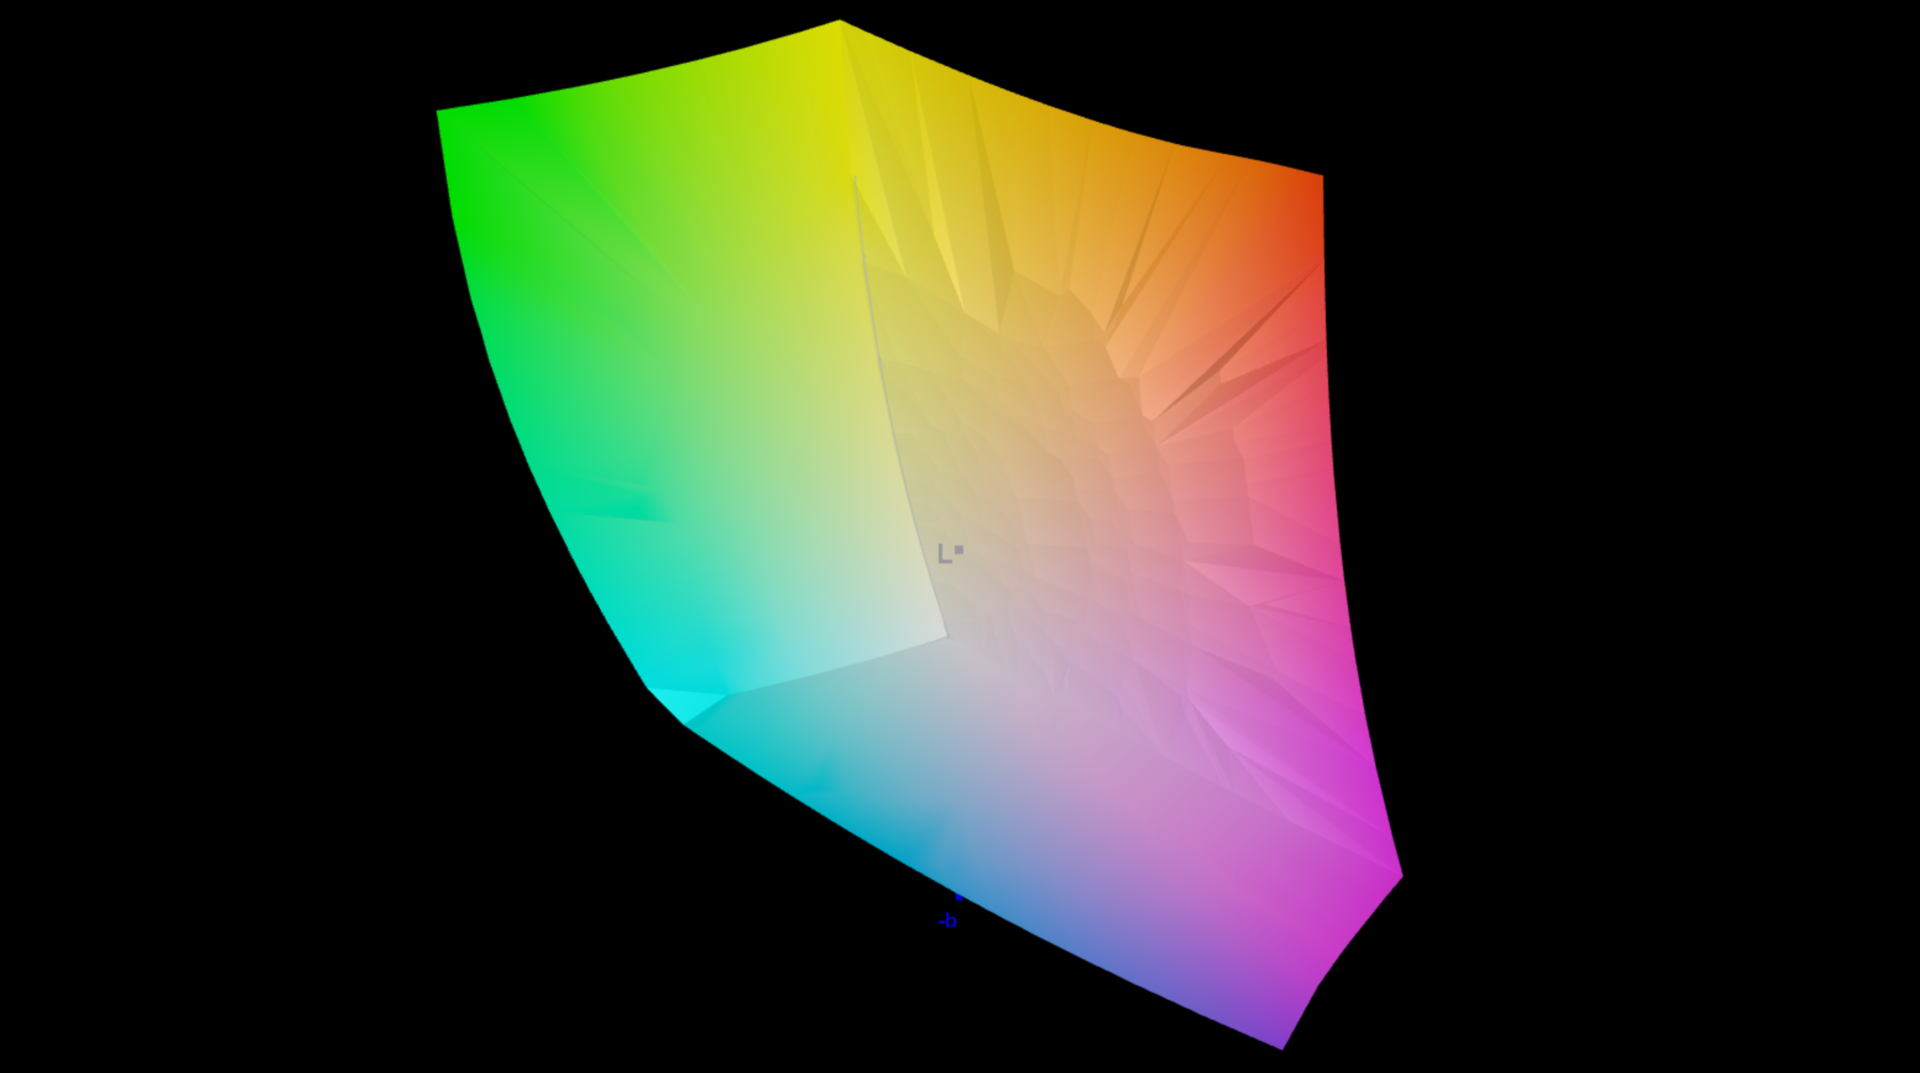
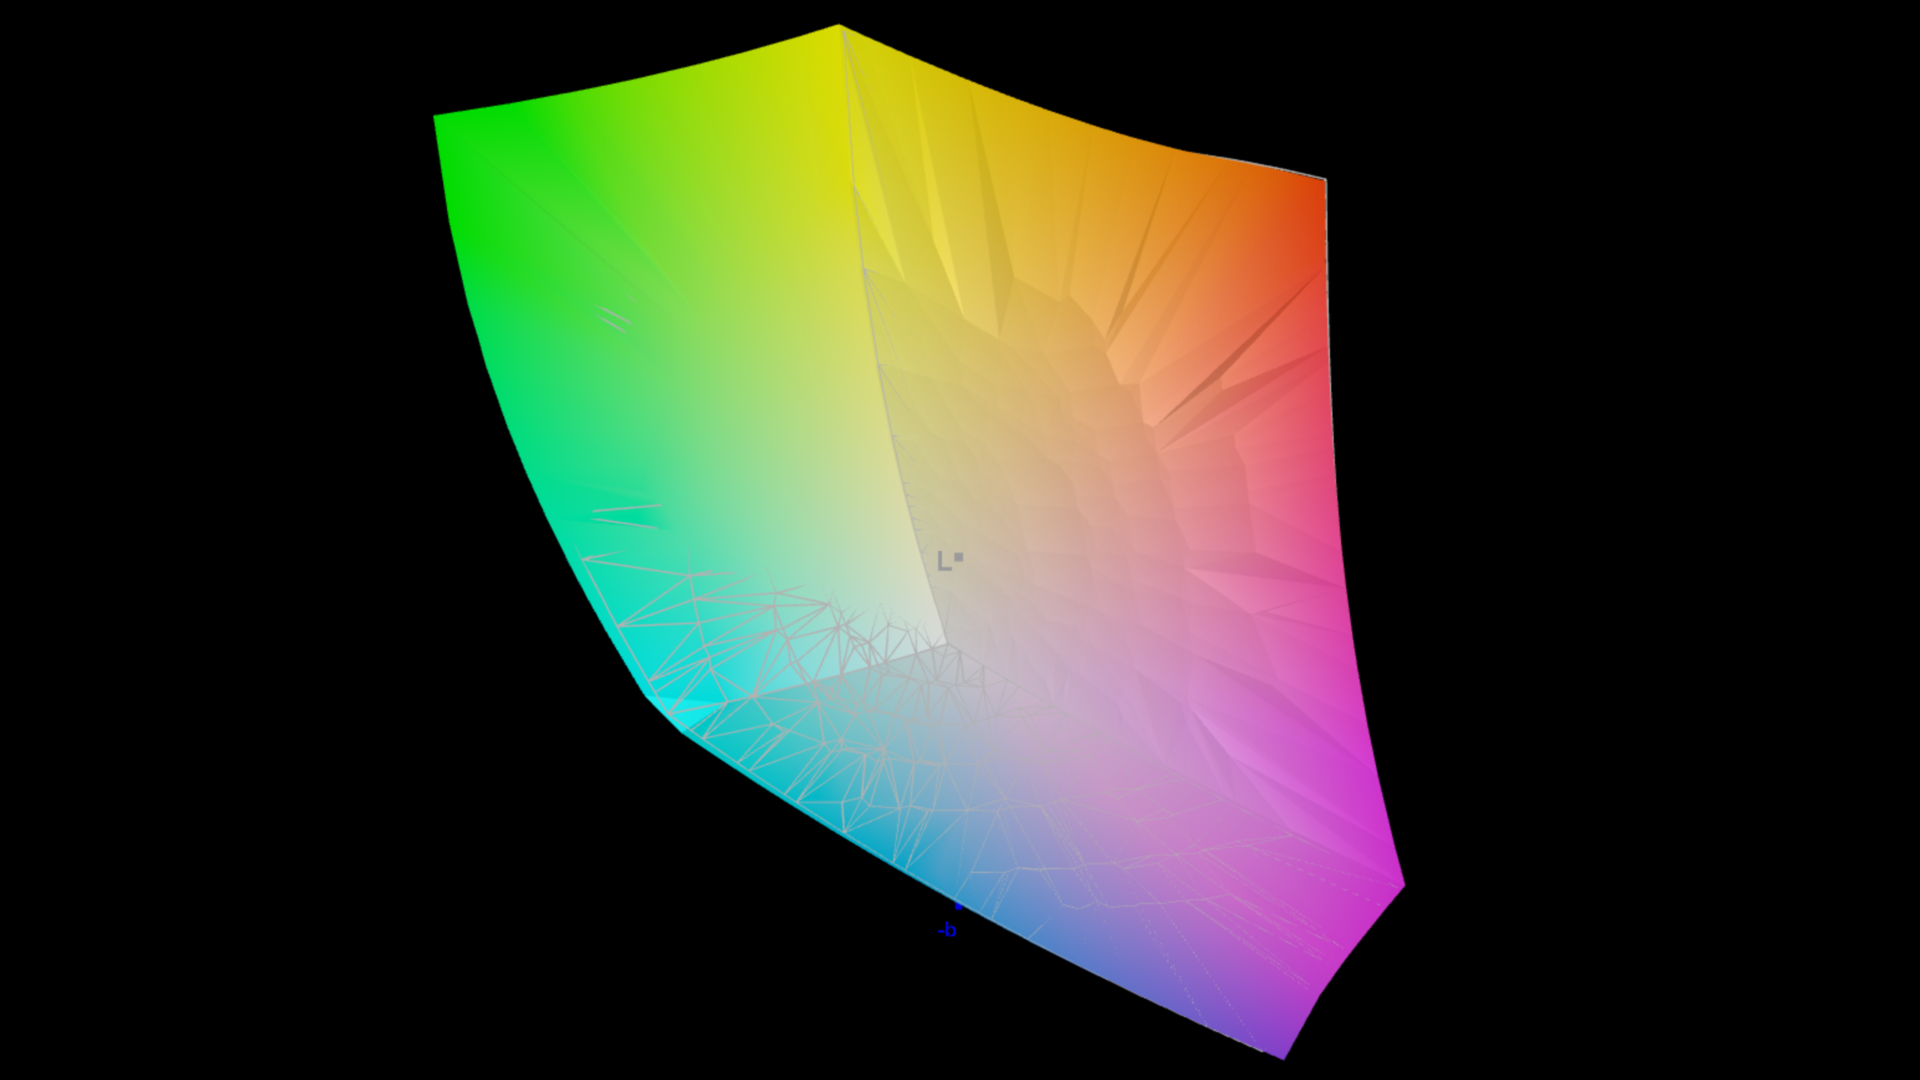
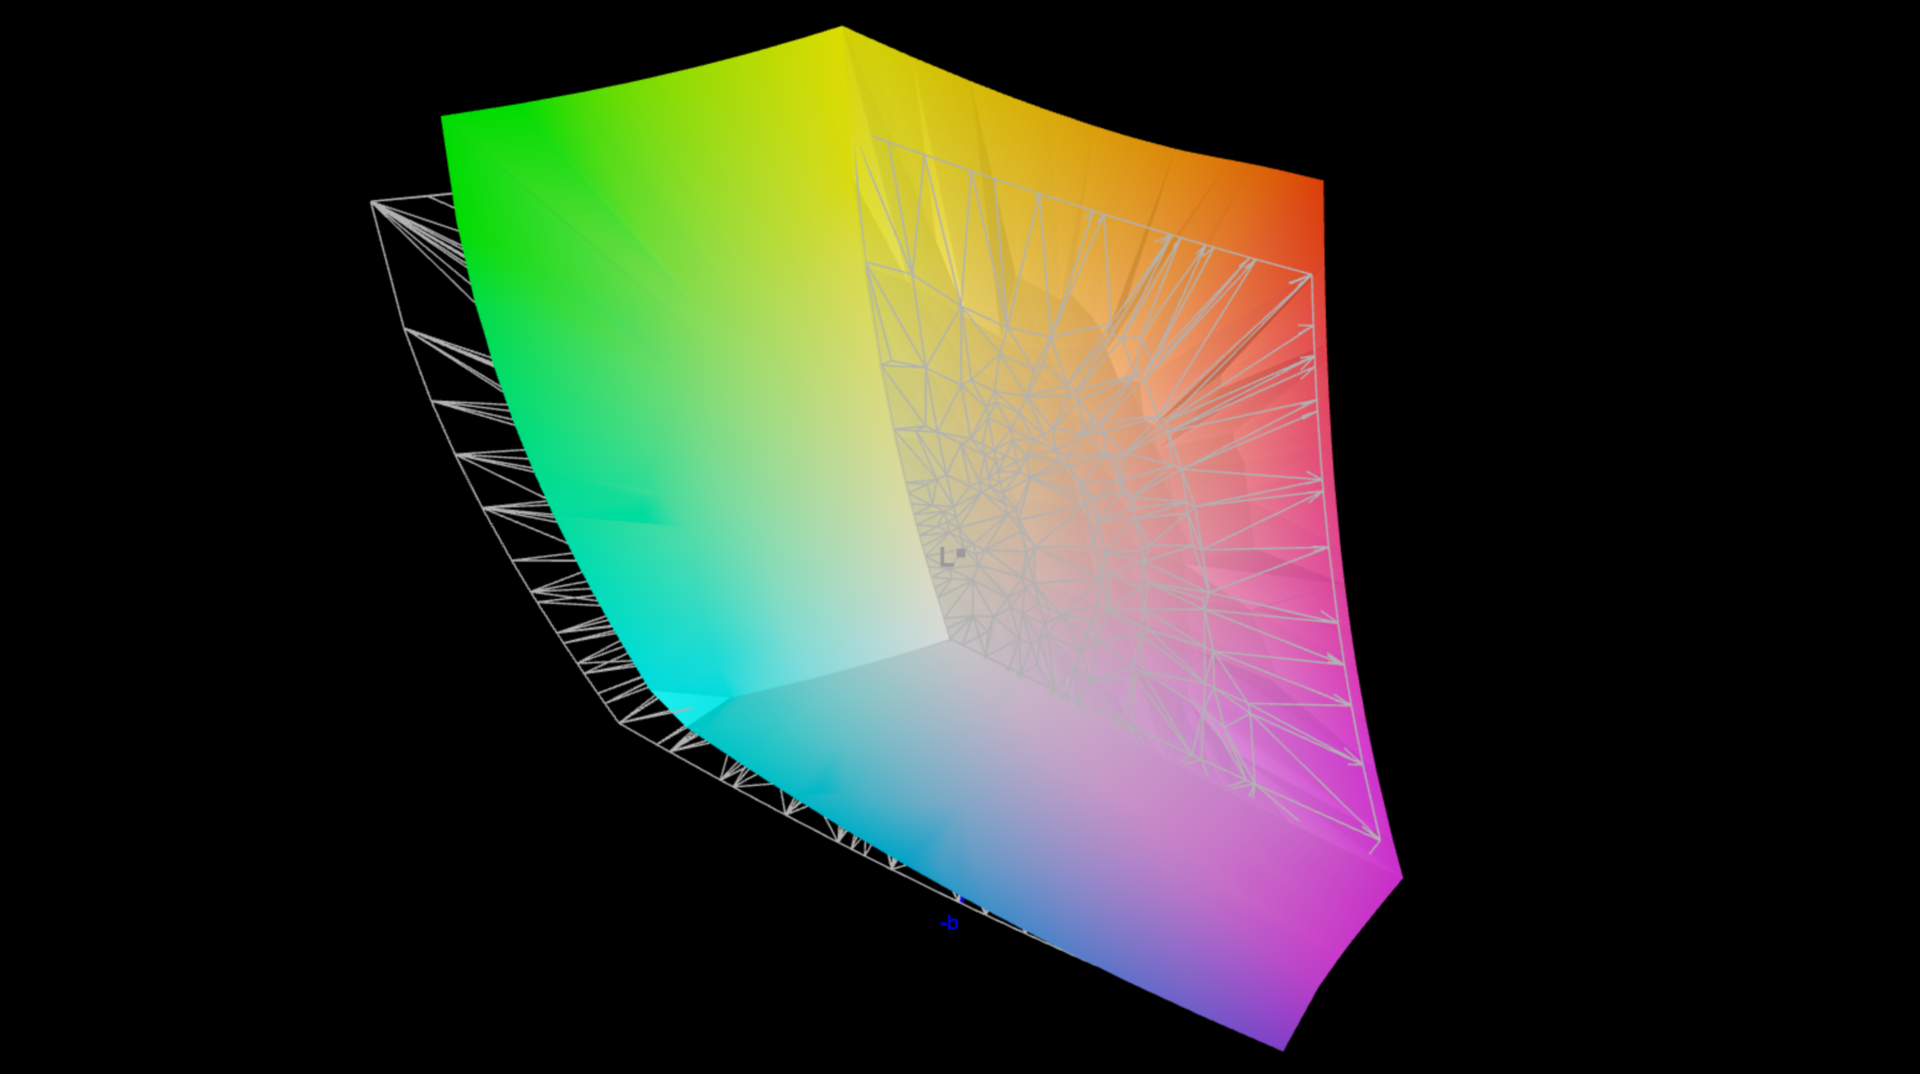
89.4% AdobeRGB 1998 (Argyll 3D)
100% sRGB (Argyll 3D)
99.6% Display P3 (Argyll 3D)
Gamma: 2.19
CCT: 6545 K
| Asus ProArt Studiobook 16 OLED H7604 ATNA60BX01-1, OLED, 3200x2000, 16" | Gigabyte AERO 16 OLED BSF Samsung SDC4191 (ATNA60YV09-0, OLED, 3840x2400, 16" | Samsung Galaxy Book3 Ultra 16 Samsung ATNA60CL03-0, AMOLED, 2880x1800, 16" | MSI Stealth 17 Studio A13VH-014 AUO41A2 B173ZAN06.C, Mini LED, 3840x2160, 17.3" | Apple MacBook Pro 16 2023 M2 Max Mini-LED, 3456x2234, 16.2" | Asus Zephyrus Duo 16 GX650PY-NM006W NE160QDM-NM4, MiniLED, 2560x1600, 16" | |
|---|---|---|---|---|---|---|
| Display | 3% | 3% | -1% | -1% | 1% | |
| Display P3 Coverage (%) | 99.6 | 99.9 0% | 99.9 0% | 92 -8% | 99 -1% | 99.4 0% |
| sRGB Coverage (%) | 100 | 100 0% | 100 0% | 99.1 -1% | 100 0% | 100 0% |
| AdobeRGB 1998 Coverage (%) | 89.4 | 96.4 8% | 96.3 8% | 94.07 5% | 88.5 -1% | 90.8 2% |
| Response Times | -195% | 18% | -3871% | -9710% | -2391% | |
| Response Time Grey 50% / Grey 80% * (ms) | 0.59 ? | 2 ? -239% | 0.49 ? 17% | 46.4 ? -7764% | 80.5 ? -13544% | 15.2 ? -2476% |
| Response Time Black / White * (ms) | 0.79 ? | 1.98 ? -151% | 0.65 ? 18% | 0.62 ? 22% | 47.2 ? -5875% | 19 ? -2305% |
| PWM Frequency (Hz) | 240 ? | 60 | 240 ? | 2400 | 14880 ? | 12000 ? |
| Screen | -9% | -15% | -12% | 370% | -15% | |
| Brightness middle (cd/m²) | 349 | 389.97 12% | 400 15% | 397.29 14% | 504 44% | 712 104% |
| Brightness (cd/m²) | 350 | 395 13% | 399 14% | 392 12% | 487 39% | 703 101% |
| Brightness Distribution (%) | 95 | 97 2% | 93 -2% | 93 -2% | 94 -1% | 95 0% |
| Black Level * (cd/m²) | 0.02 | 0.03 -50% | 0.03 -50% | 0.02 -0% | 0.001 95% | 0.07 -250% |
| Contrast (:1) | 17450 | 12999 -26% | 13333 -24% | 19865 14% | 504000 2788% | 10171 -42% |
| Colorchecker dE 2000 * | 2.1 | 2 5% | 2.3 -10% | 2.52 -20% | 1.5 29% | 1.7 19% |
| Colorchecker dE 2000 max. * | 5.5 | 4.1 25% | 4.15 25% | 3.91 29% | 3.3 40% | 4 27% |
| Colorchecker dE 2000 calibrated * | 2.1 | 1.68 20% | 1.66 21% | 2.52 -20% | 1.2 43% | |
| Greyscale dE 2000 * | 1.2 | 2.23 -86% | 2.7 -125% | 2.78 -132% | 2.1 -75% | 2.8 -133% |
| Gamma | 2.19 100% | 2.41 91% | 2.266 97% | 2.63 84% | 2.25 98% | 2.21 100% |
| CCT | 6545 99% | 6323 103% | 7047 92% | 6412 101% | 6882 94% | 6978 93% |
| Total Average (Program / Settings) | -67% /
-33% | 2% /
-7% | -1295% /
-561% | -3114% /
-1266% | -802% /
-351% |
* ... smaller is better
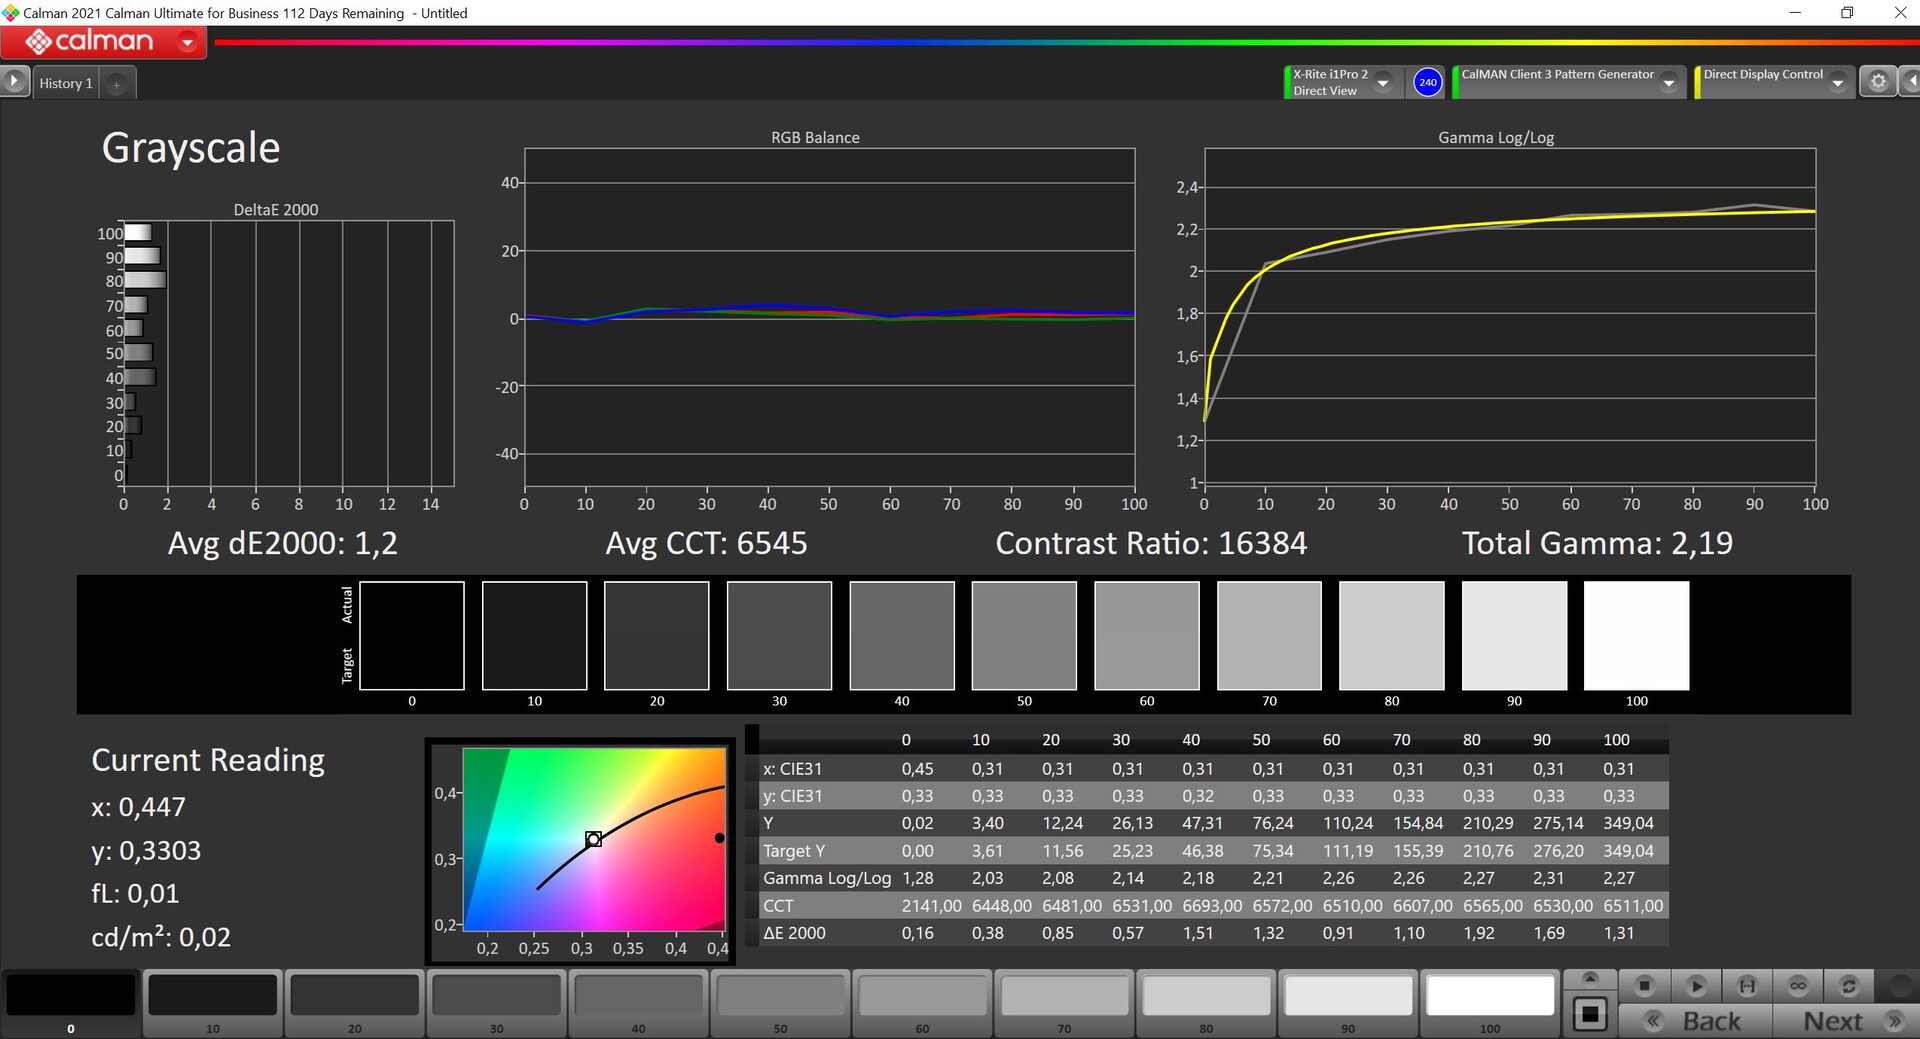
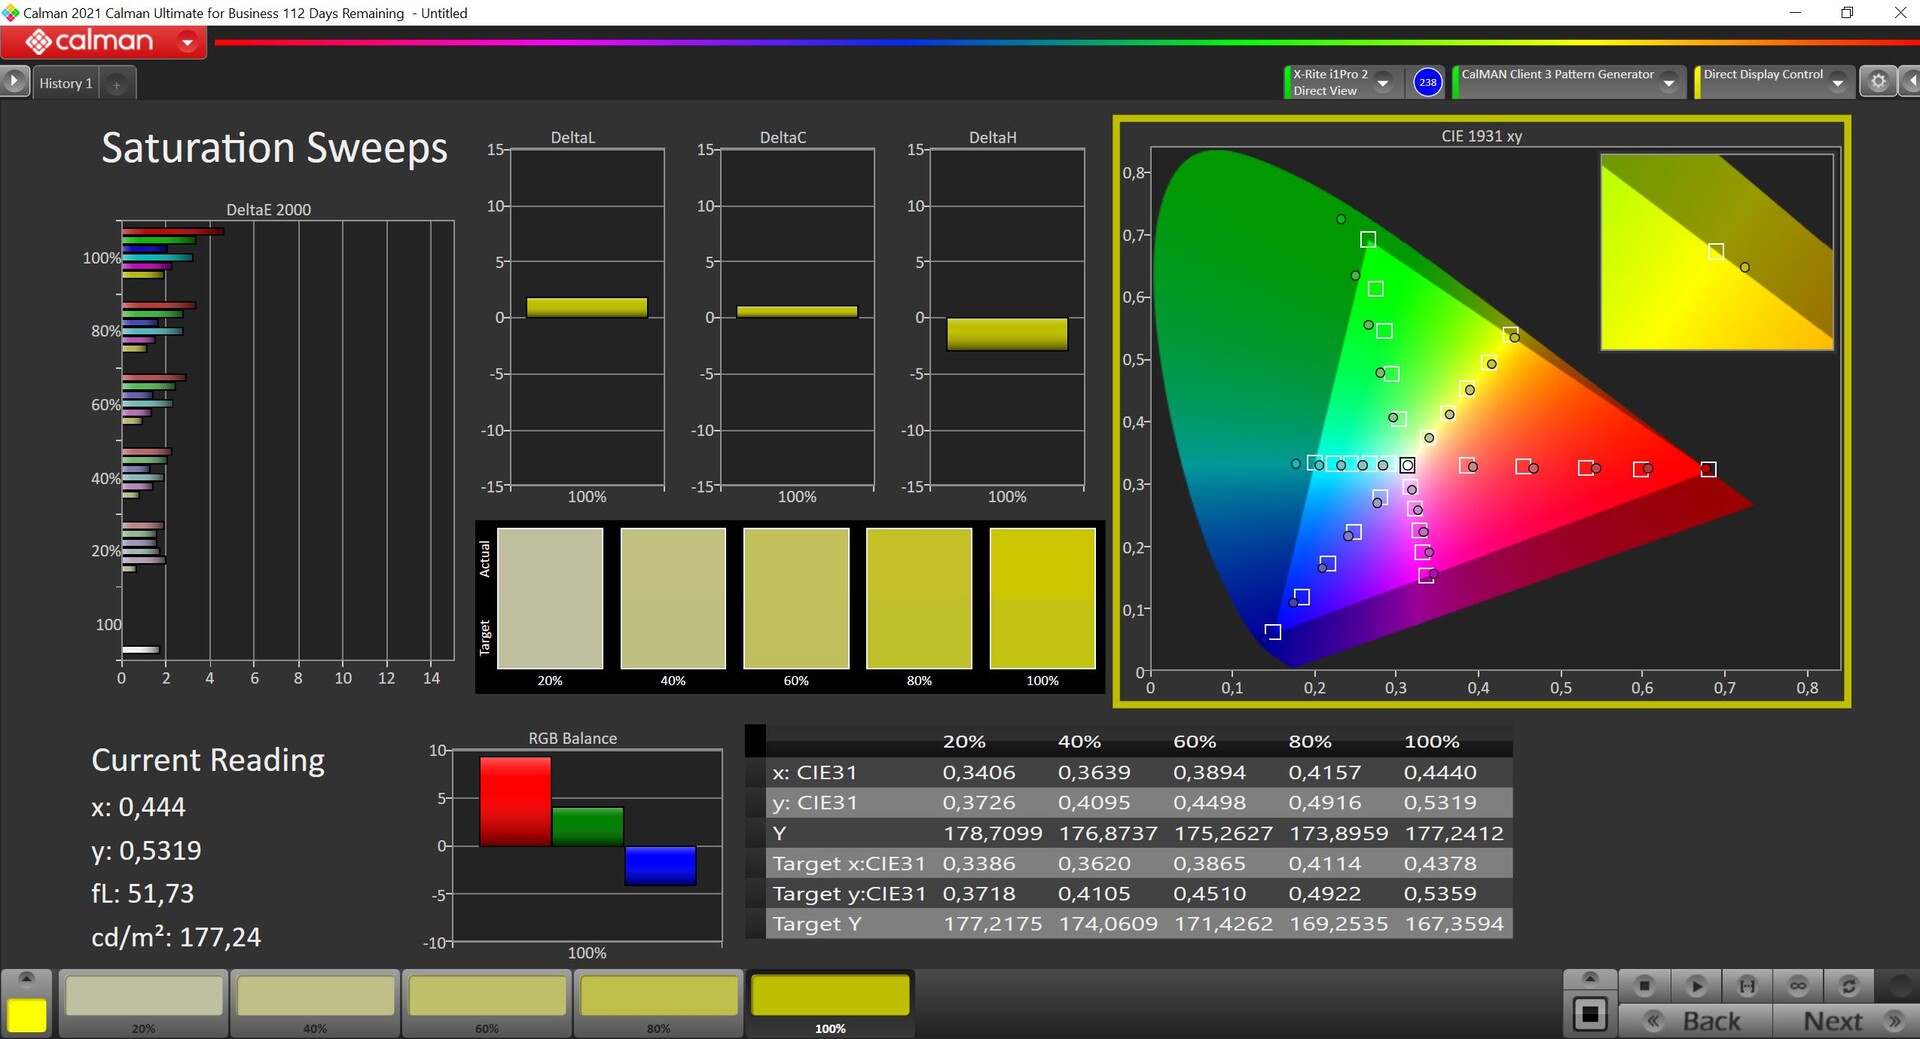
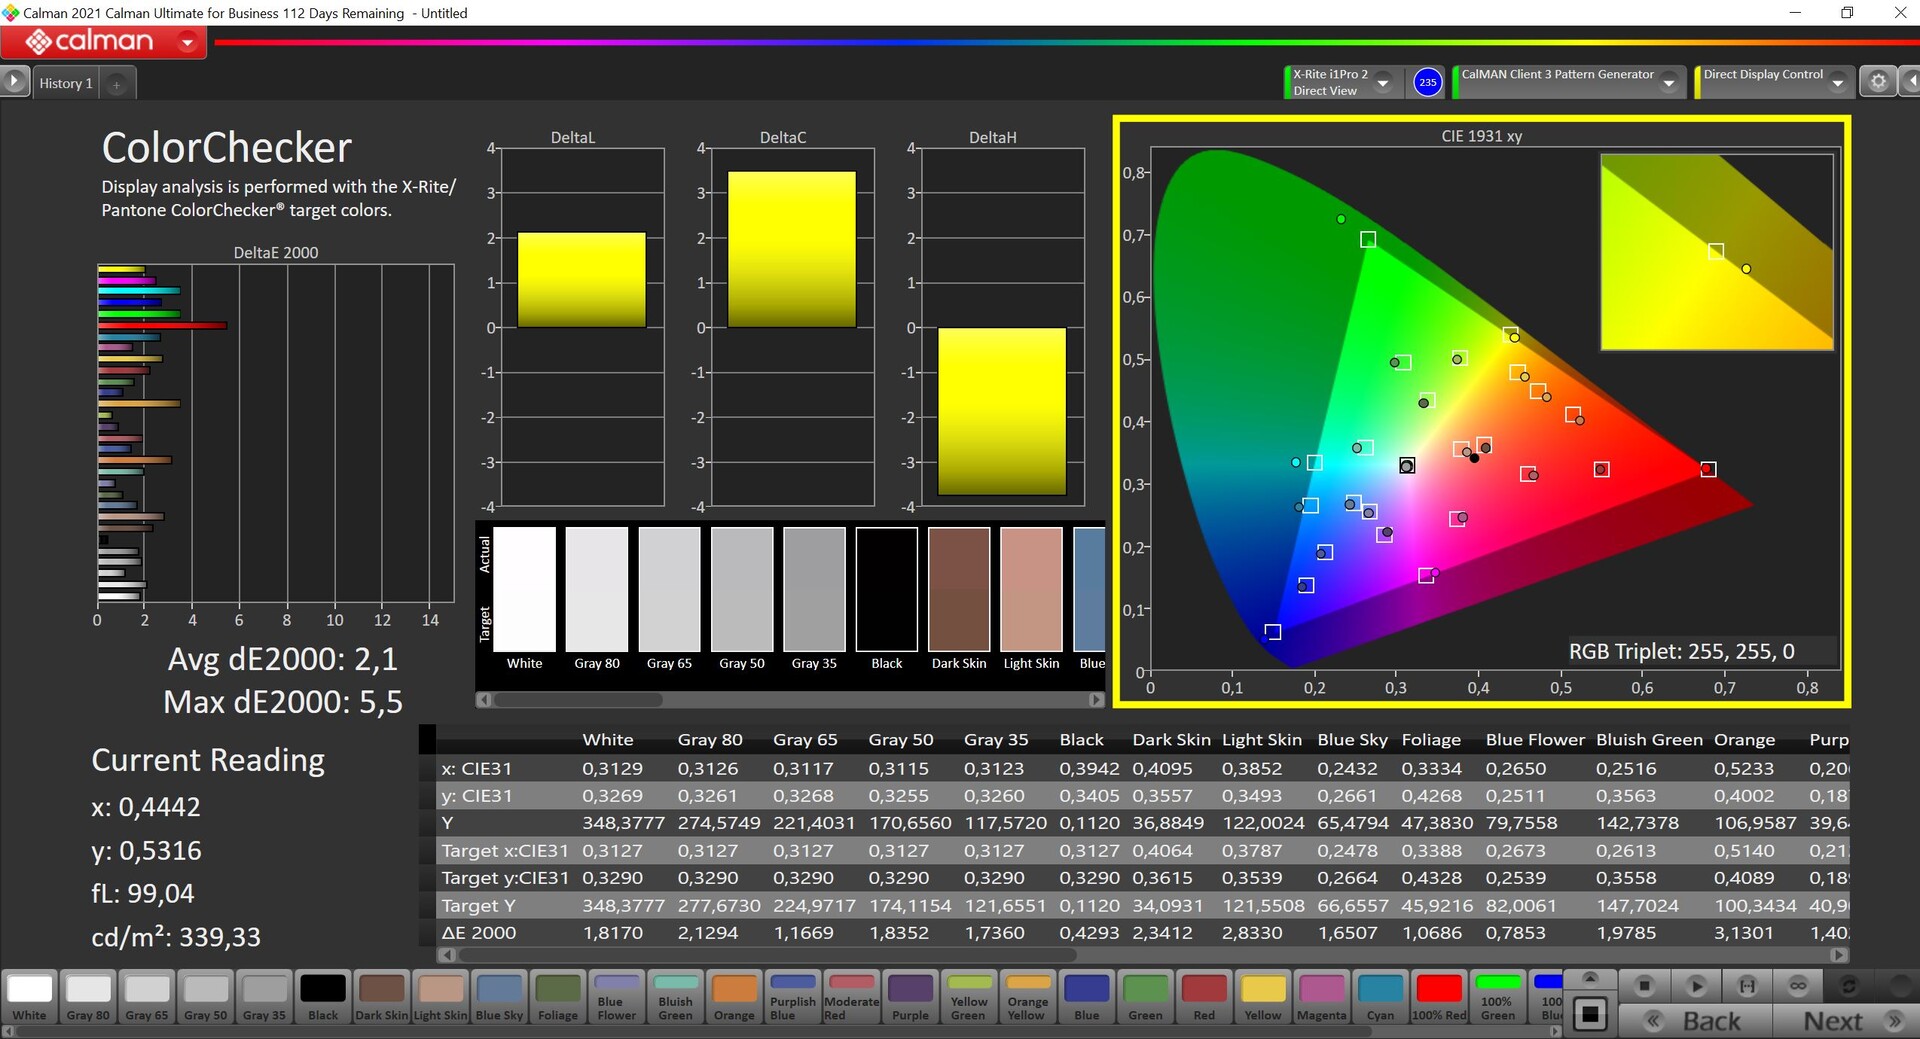
像往常一样,MyAsus软件中有几个颜色配置文件,其中 "本地 "是默认预设的。在这里,颜色有些过饱和,这应该会在实践中产生一个更强大的图像。最准确的配置文件是DisplayP3,我们也用专业的CalMAN软件(X-Rite i1 Pro 2)进行了测量。基本上,结果已经非常好,在偏色或色温方面没有任何问题,尽管一些个别颜色超过了3的重要偏差。我们无法用自己的校准来纠正这一点,这就是为什么我们在这种特殊情况下不提供配置文件供下载。P3色彩空间是完全覆盖的。
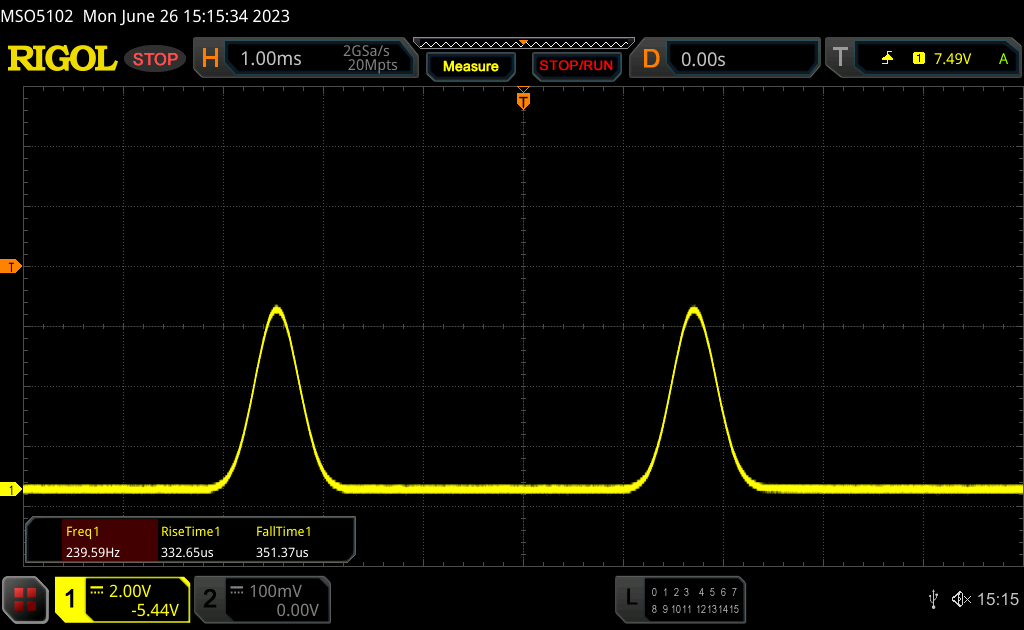
Display Response Times
| ↔ Response Time Black to White | ||
|---|---|---|
| 0.79 ms ... rise ↗ and fall ↘ combined | ↗ 0.34 ms rise | 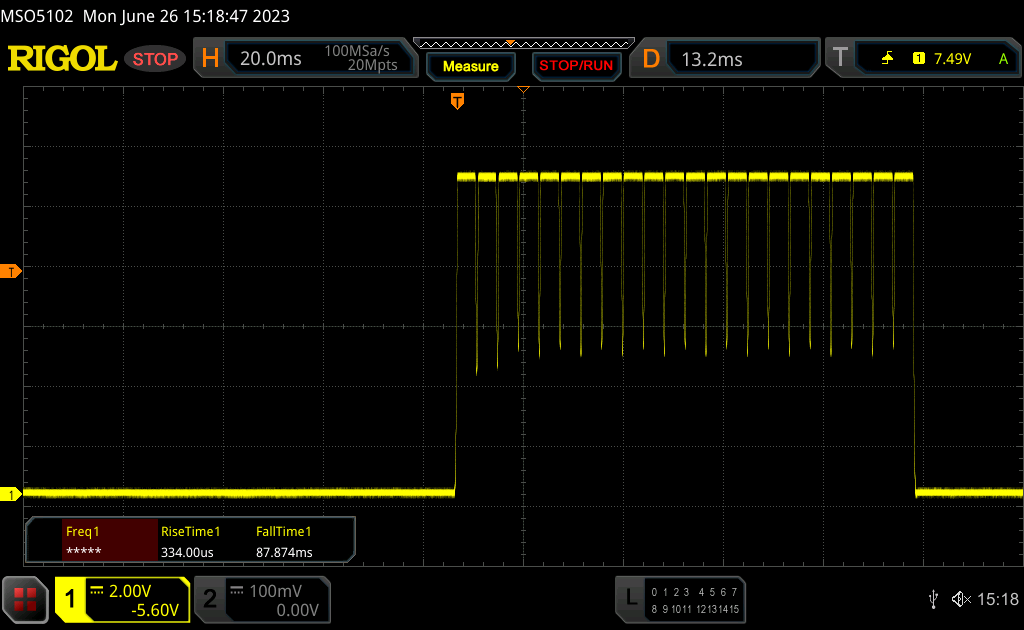 |
| ↘ 0.45 ms fall | ||
| The screen shows very fast response rates in our tests and should be very well suited for fast-paced gaming. In comparison, all tested devices range from 0.1 (minimum) to 240 (maximum) ms. » 2 % of all devices are better. This means that the measured response time is better than the average of all tested devices (19.8 ms). | ||
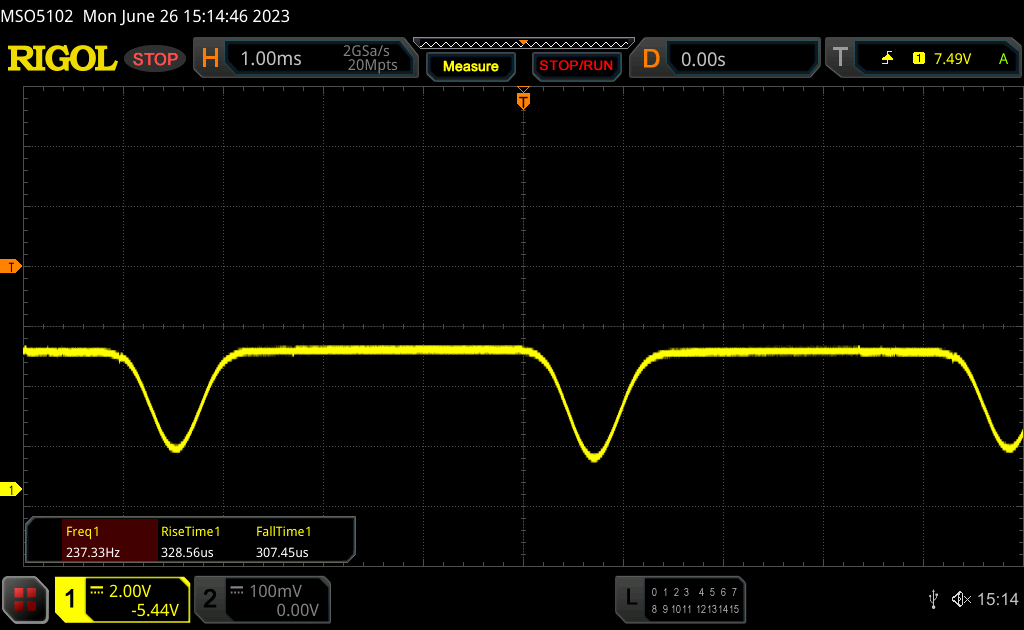
| ↔ Response Time 50% Grey to 80% Grey | ||
| 0.59 ms ... rise ↗ and fall ↘ combined | ↗ 0.29 ms rise | 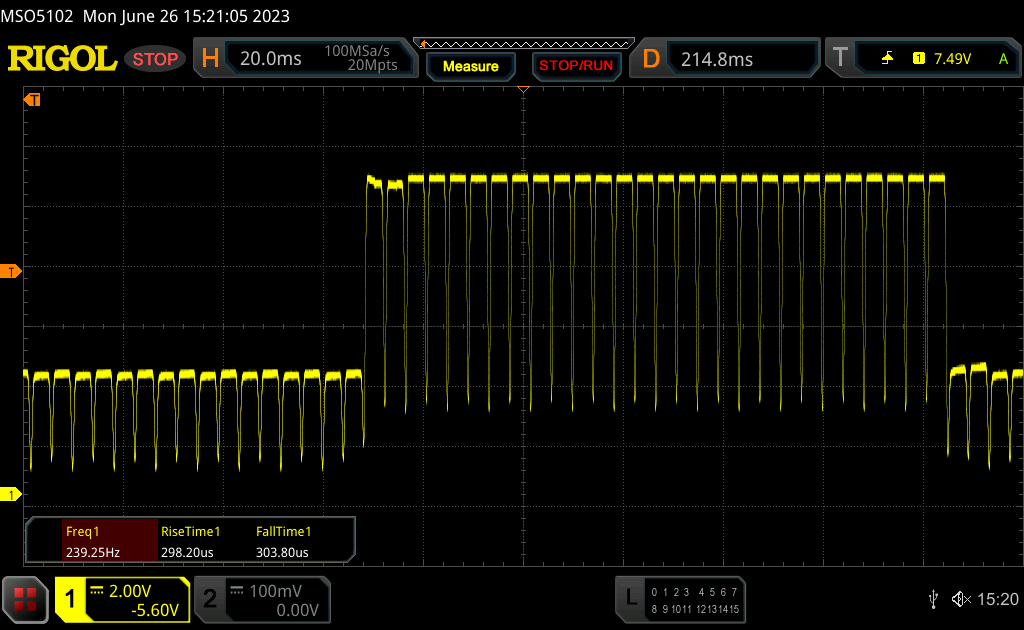 |
| ↘ 0.3 ms fall | ||
| The screen shows very fast response rates in our tests and should be very well suited for fast-paced gaming. In comparison, all tested devices range from 0.165 (minimum) to 636 (maximum) ms. » 1 % of all devices are better. This means that the measured response time is better than the average of all tested devices (31 ms). | ||
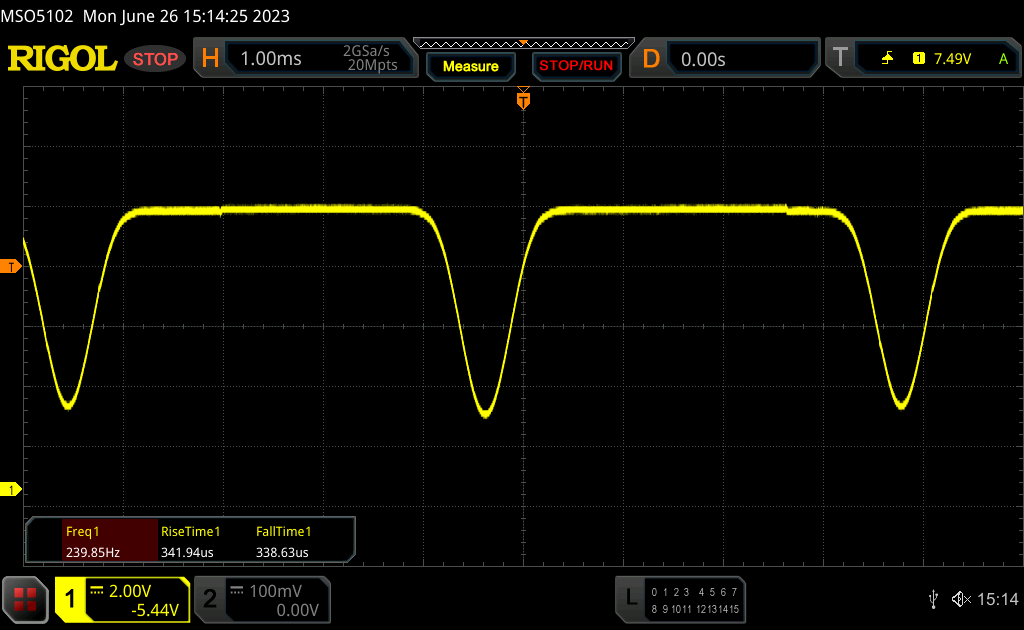
Screen Flickering / PWM (Pulse-Width Modulation)
| Screen flickering / PWM detected | 240 Hz | ≤ 100 % brightness setting | 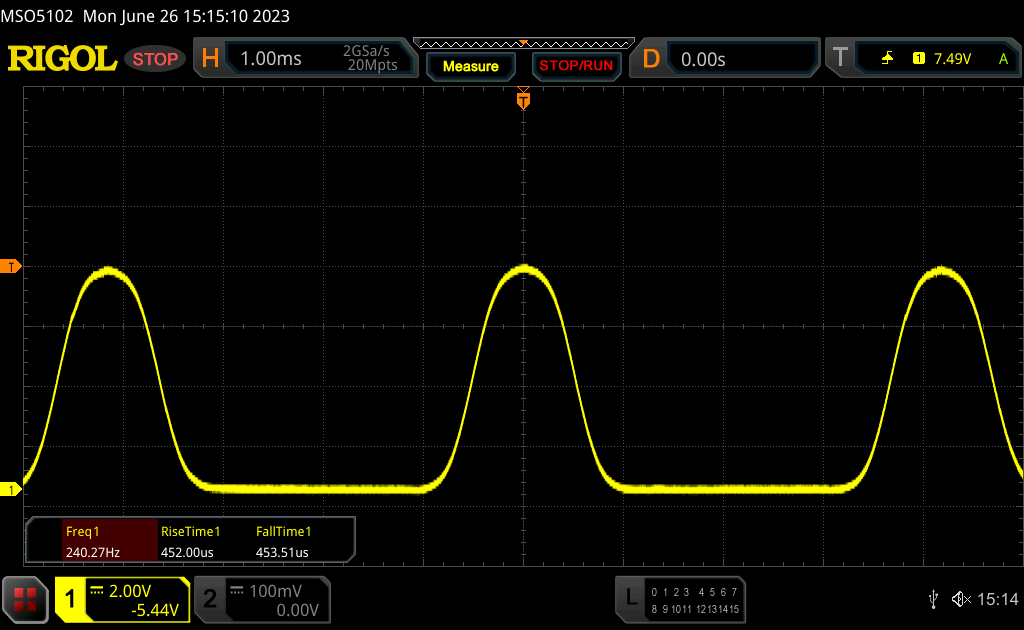 |
The display backlight flickers at 240 Hz (worst case, e.g., utilizing PWM) Flickering detected at a brightness setting of 100 % and below. There should be no flickering or PWM above this brightness setting. The frequency of 240 Hz is relatively low, so sensitive users will likely notice flickering and experience eyestrain at the stated brightness setting and below. In comparison: 52 % of all tested devices do not use PWM to dim the display. If PWM was detected, an average of 7757 (minimum: 5 - maximum: 343500) Hz was measured. | |||
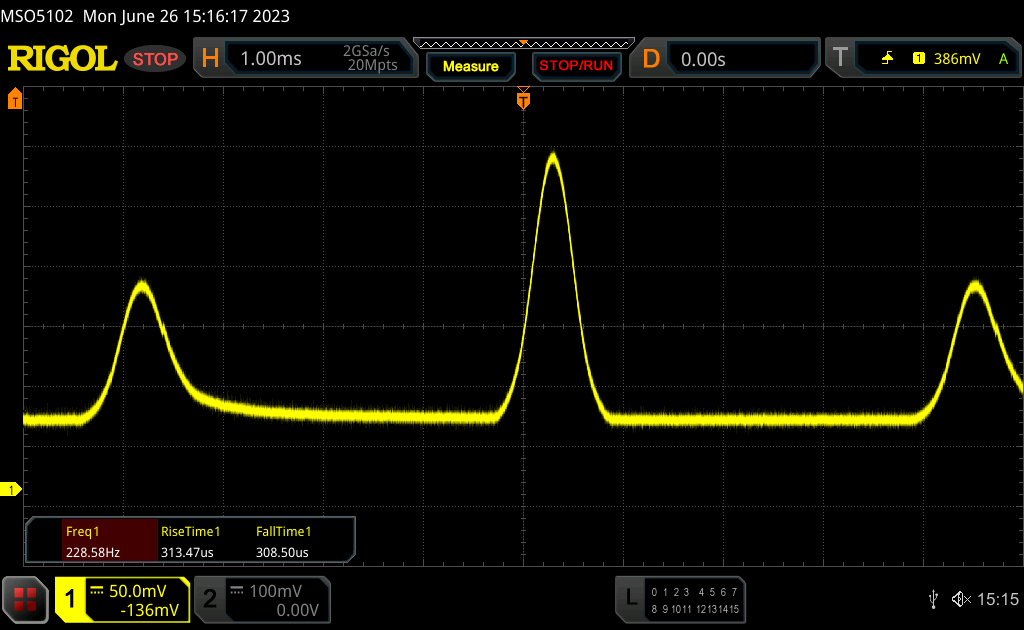
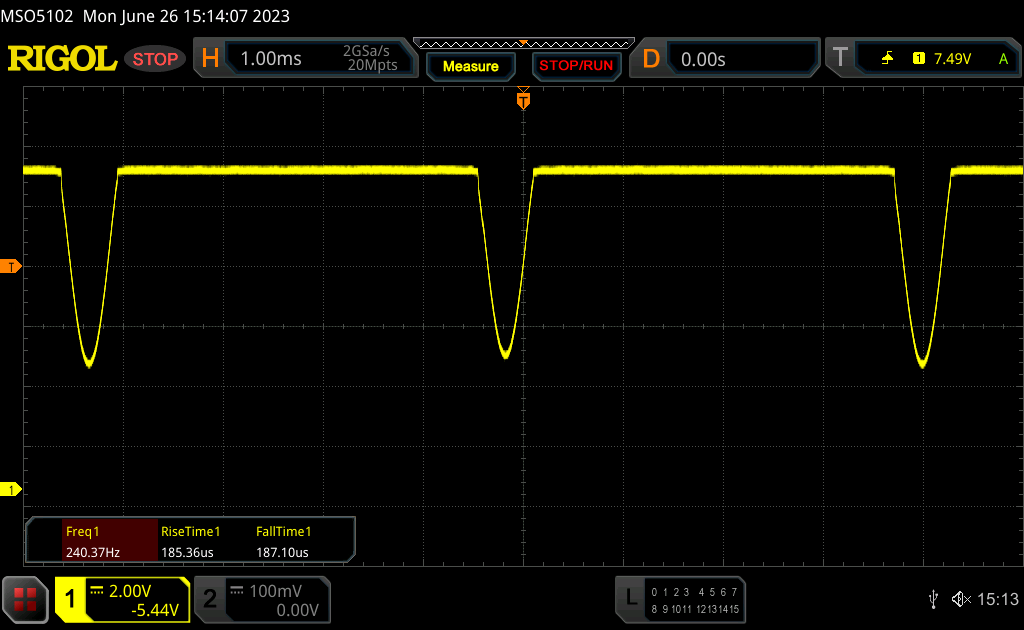
直流调光是在100到60%的亮度范围内使用的,而低于这个范围的经典PWM闪烁频率为240Hz。一旦亮度下降到60%以下,就会出现一个警告,即直流调光不再可用。作为一种选择,所谓的无闪烁OLED调光在MyAsus软件中可用,我们在对Zenbook S 13 OLED的评论中对其进行了研究。的确,这是一个有用的补充,但一直要通过软件也是很麻烦的。
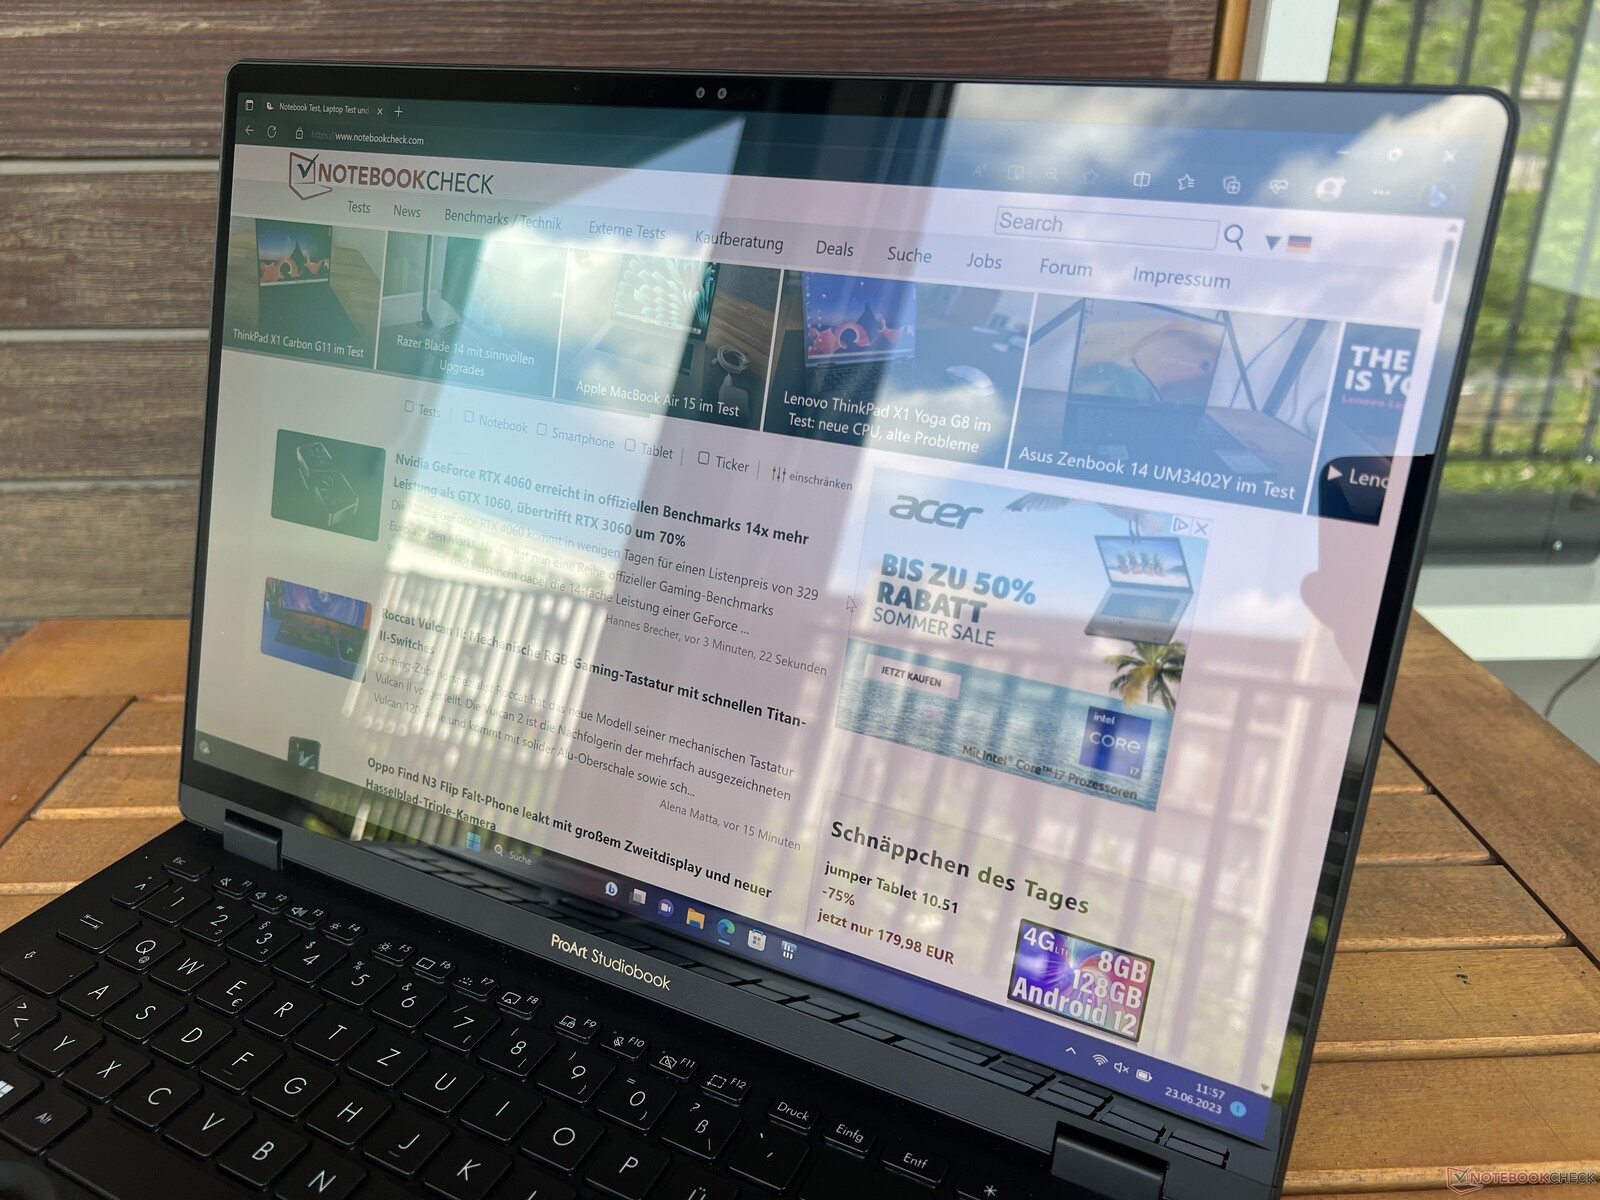
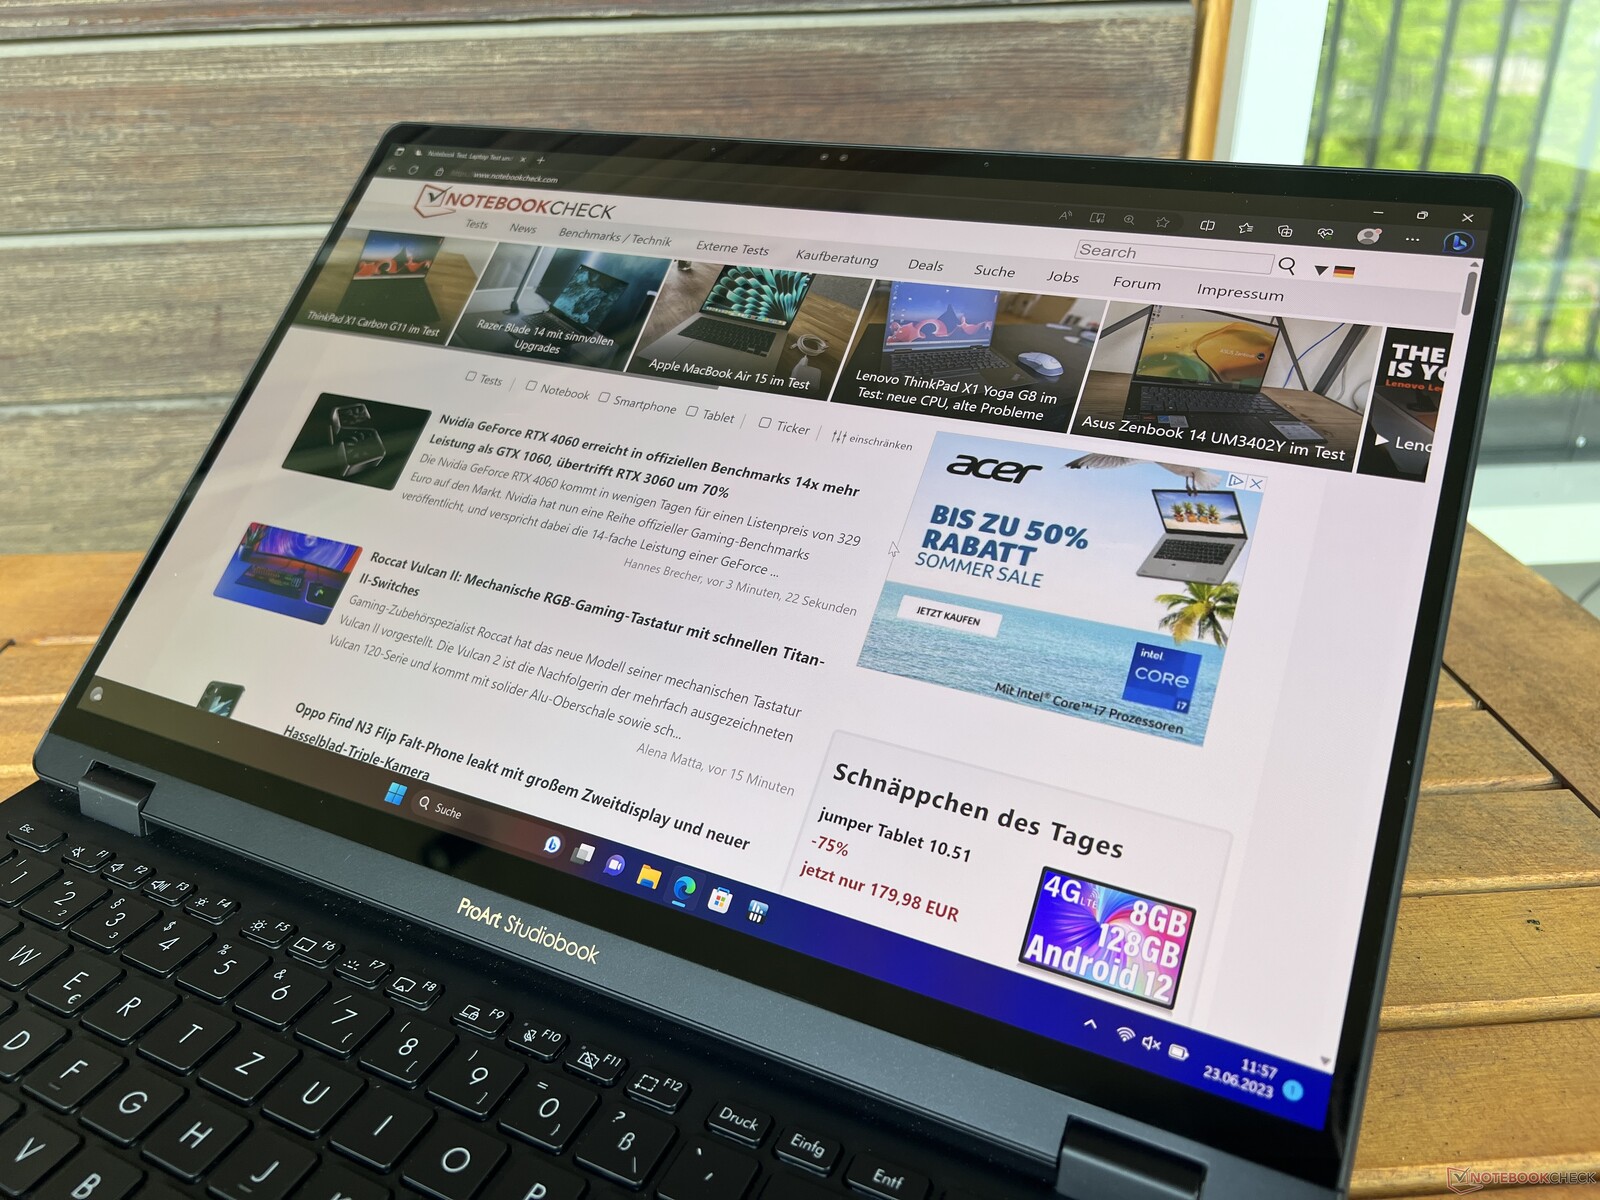
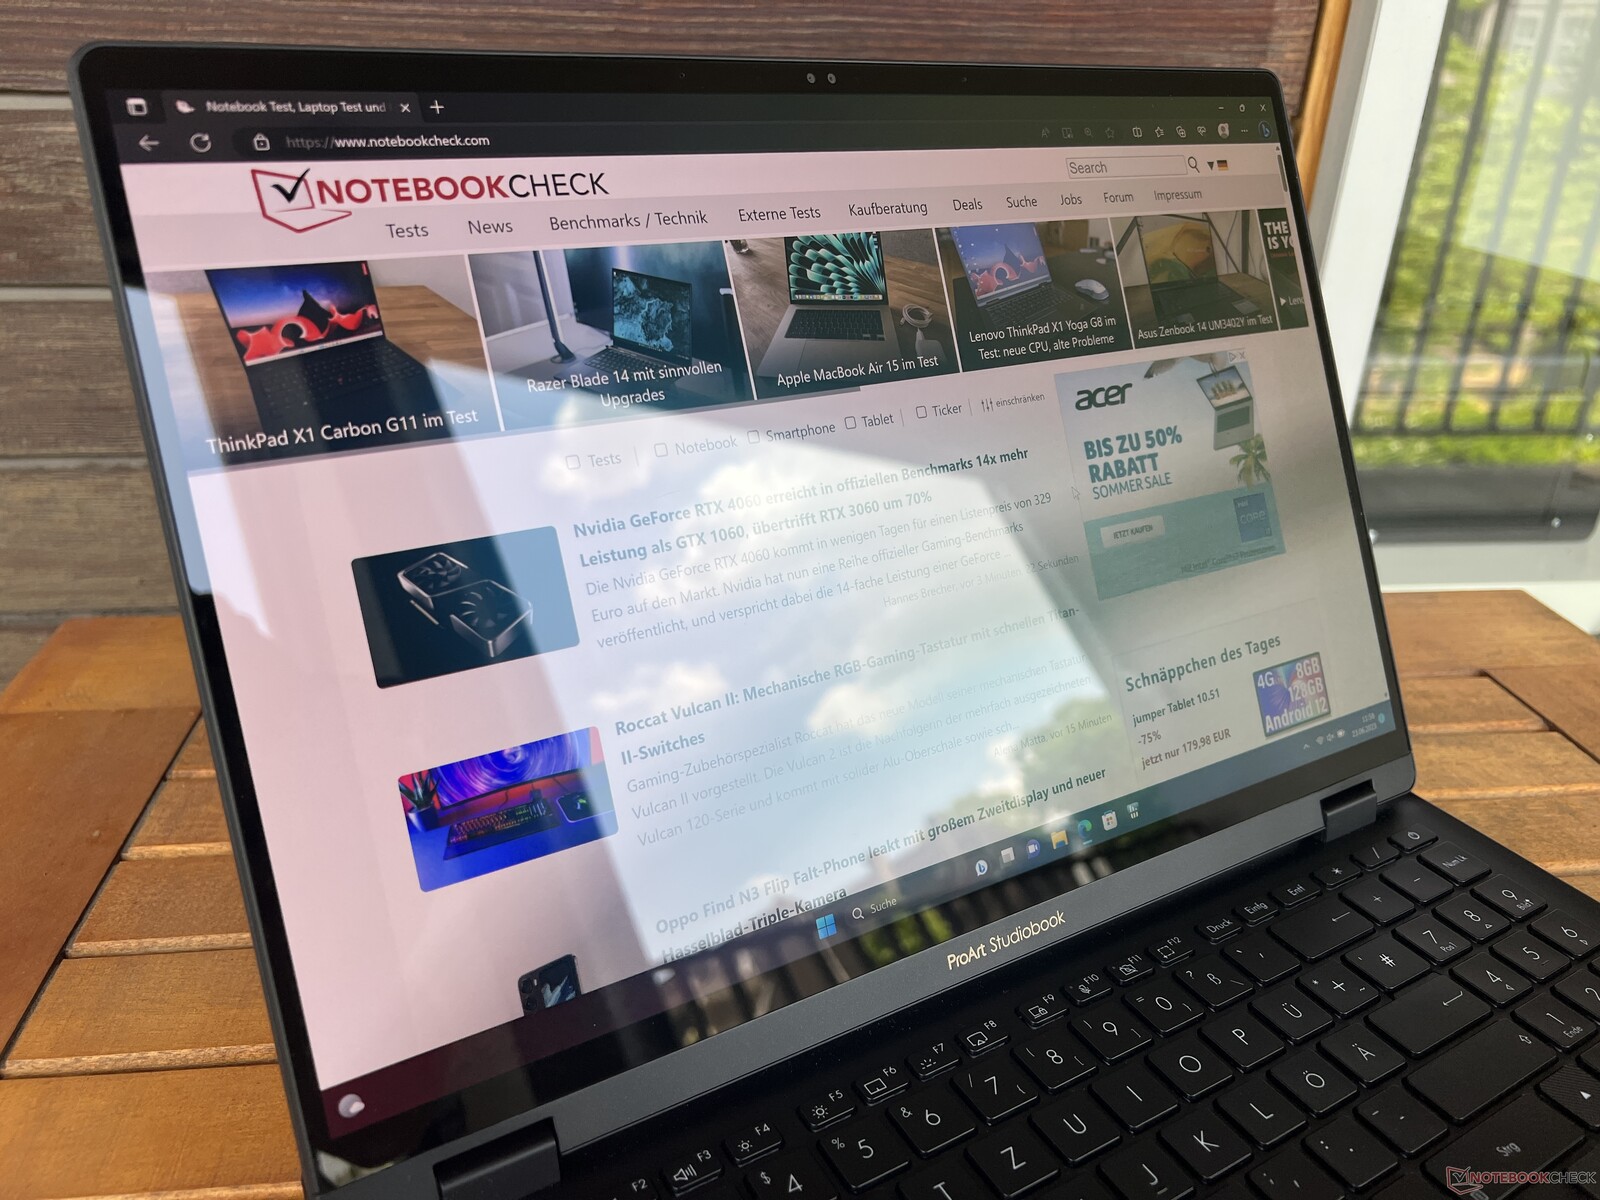
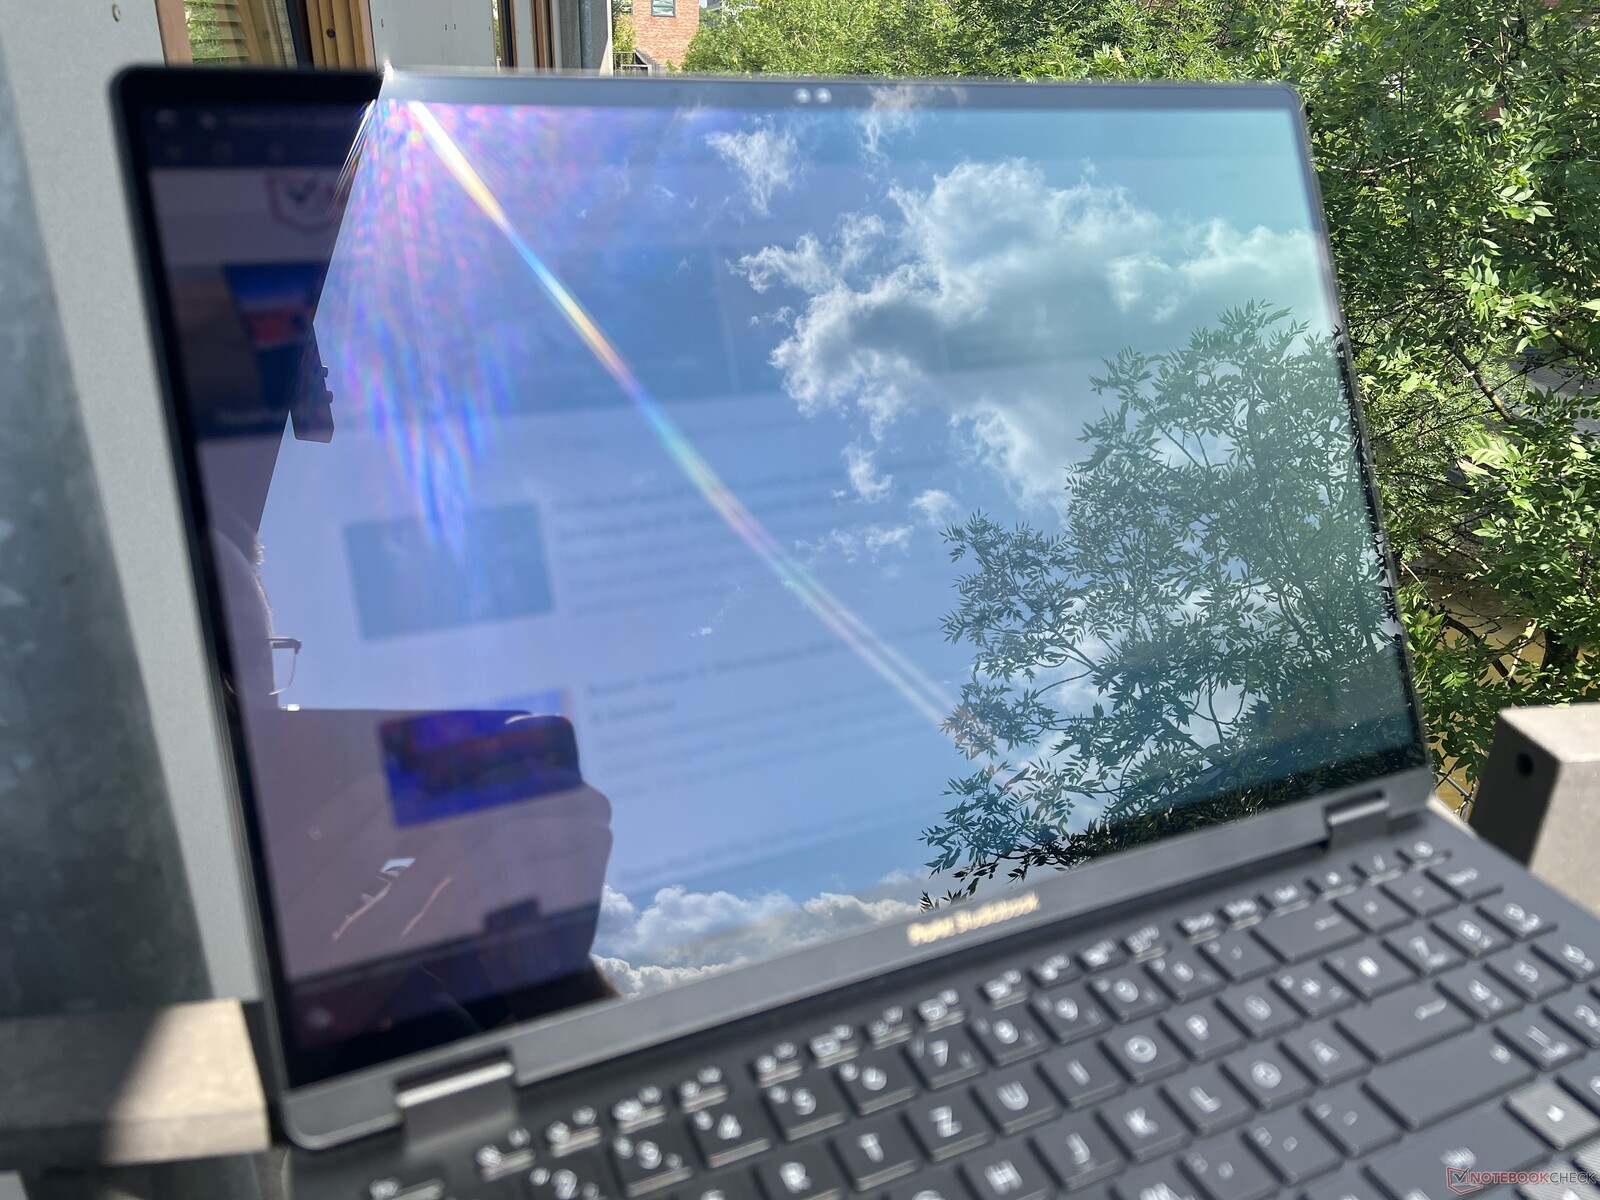
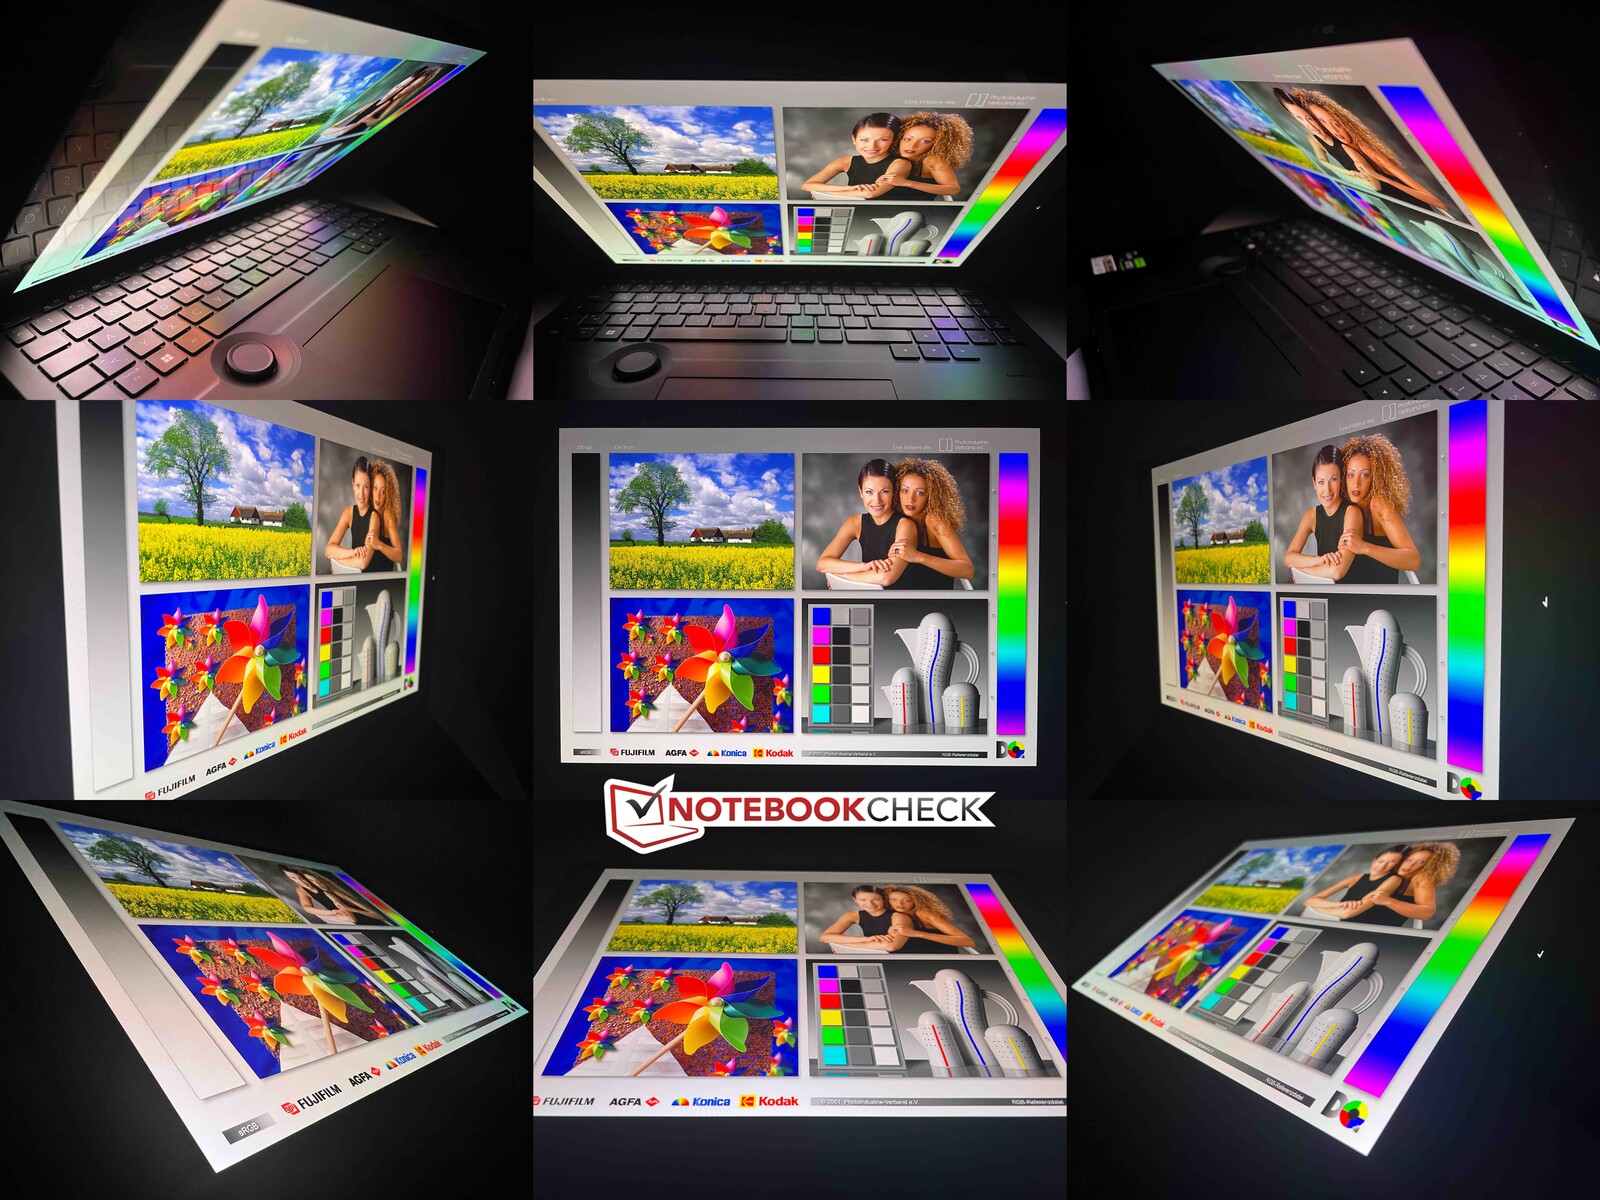
触摸屏在户外有很强的反射性,所以无论在室内还是室外,你都应该避免来自窗户或光源的反射。这并不容易,尤其是在阳光普照的时候。视角的稳定性总体上是非常好的。只有在非常极端的角度才会出现典型的OLED蓝色偏光。
性能 - 猛禽湖-HX & Ada Lovelace
测试条件
在预装的ProArt Creator Hub中提供了各种能源配置文件,我们在下面的表格中列出了这些配置文件。我们主要在性能 模式下进行了测量和基准测试,但我们也在某些部分看了其他两种模式的效果。
| 能源概况 | CPU负载 | GPU负载 | 压力测试 | 最大风扇容量 |
|---|---|---|---|---|
| 标准 | 157/80瓦 | 90瓦 | CPU:30瓦 GPU:80瓦 |
47.6 dB(A) |
| 性能 | 170/130 瓦 | 130 瓦 | CPU:55瓦 GPU:105瓦 |
56.7 dB(A) |
| 全速 | 170/130 瓦 | 130 瓦 | CPU:64 瓦 95 瓦 |
58.9 dB(A) |
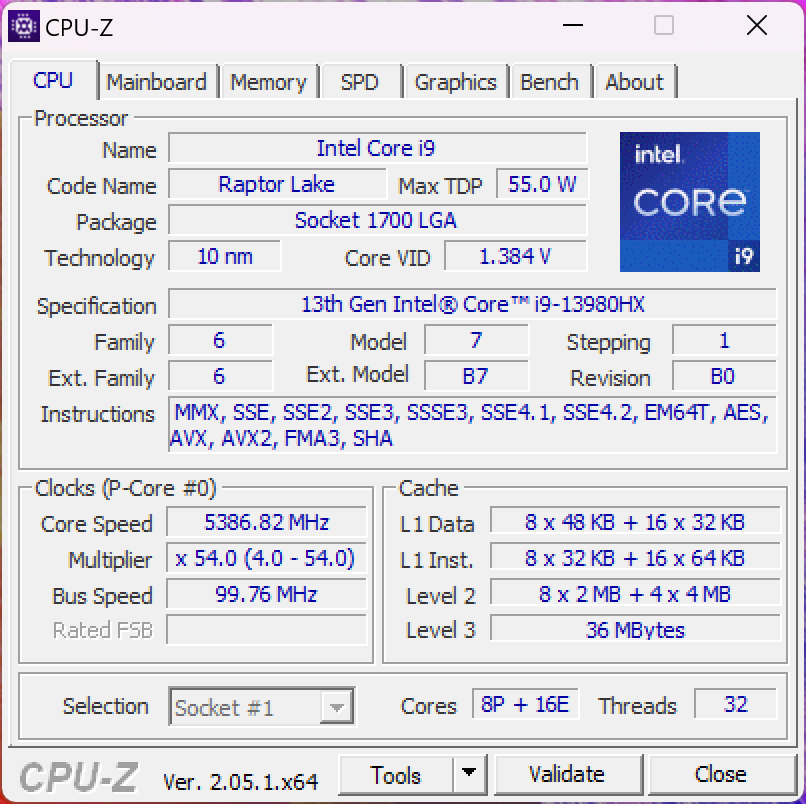
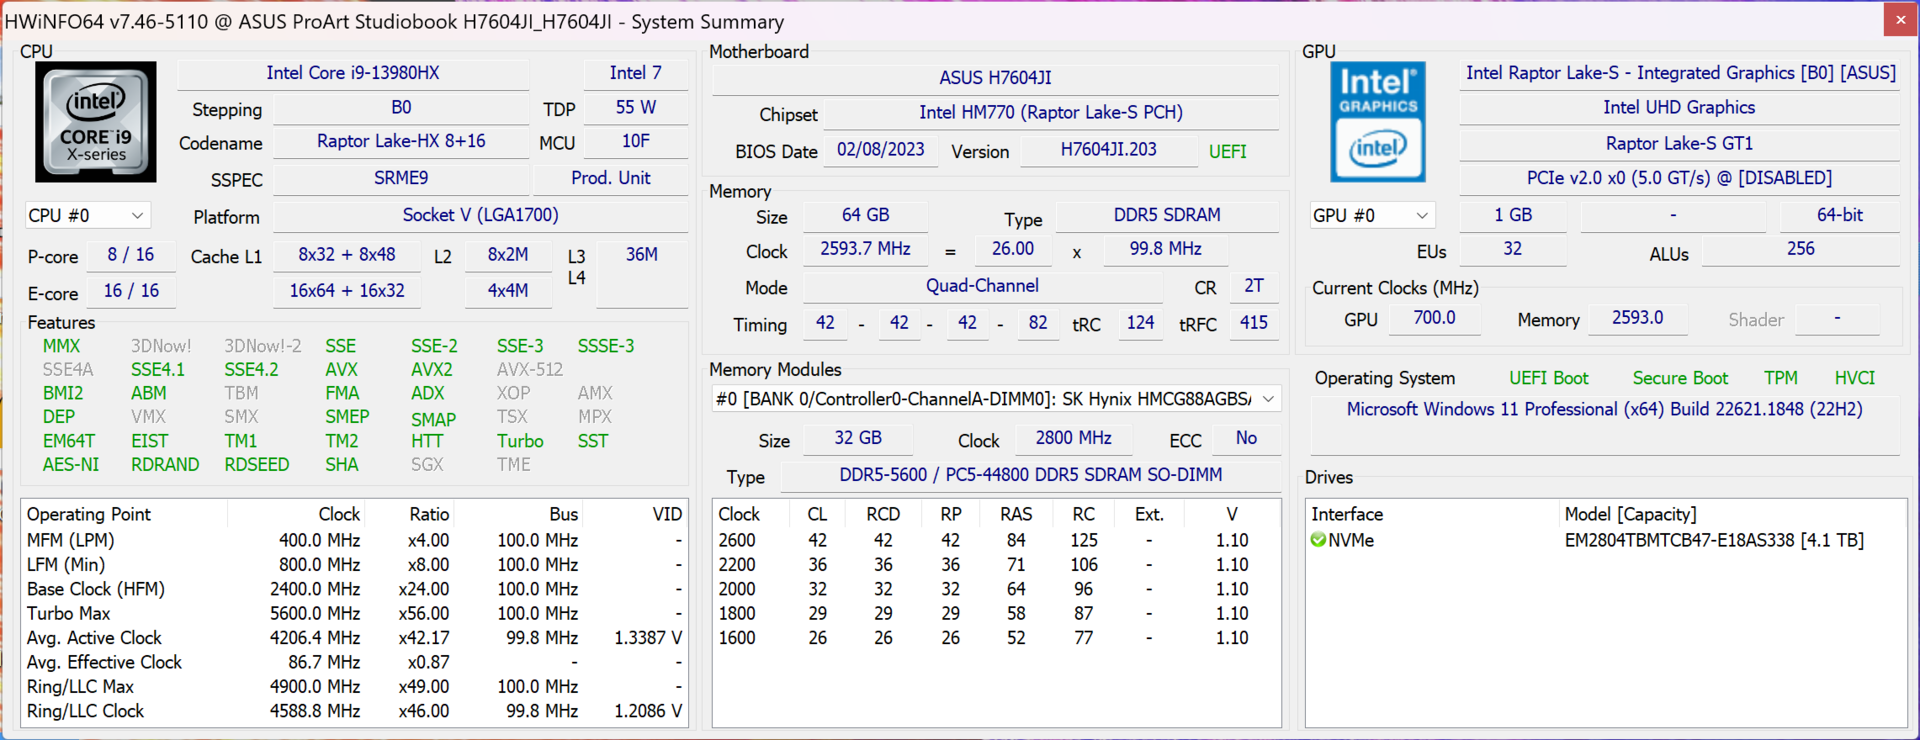
处理器 - Core i9-13980HX
英特尔目前用于笔记本的猛禽湖系列的高端型号,Core i9-13980HX ,被用作处理器。这提供了8个快速性能核心和16个效率核心,这就是为什么该芯片能够同时处理总共32个线程。在Studiobook中,该处理器的功耗高达约170瓦,在持续负载几分钟后达到130瓦的水平。在大型游戏笔记本中,CPU的运行速度稍快,但与使用普通英特尔CPU的对比组或Apple M2 Max相比,Studiobook有很大的优势。在单核性能方面,酷睿i9也领先于新的AMD Ryzen 9 7945HX ,但后者在多核测试中提供了更多的性能,同时也更有效地工作。
在远离插座的地方,笔记本电脑的性能能力没有什么可看的,因为CPU在这里只被允许消耗微薄的34/26瓦特。在CB R23多重测试中,它的得分只有11,576分,相当于63%的赤字。因此,StudioBook的电池电量比MacBook Pro 16与其 M2 Max在电池电量方面没有性能下降。更多的CPU基准测试可在 我们的技术部分.
Cinebench R15 Multi Sustained Load
Cinebench R23: Multi Core | Single Core
Cinebench R20: CPU (Multi Core) | CPU (Single Core)
Cinebench R15: CPU Multi 64Bit | CPU Single 64Bit
Blender: v2.79 BMW27 CPU
7-Zip 18.03: 7z b 4 | 7z b 4 -mmt1
Geekbench 5.5: Multi-Core | Single-Core
HWBOT x265 Benchmark v2.2: 4k Preset
LibreOffice : 20 Documents To PDF
R Benchmark 2.5: Overall mean
| CPU Performance rating | |
| Asus Zephyrus Duo 16 GX650PY-NM006W | |
| Asus ProArt Studiobook 16 OLED H7604 | |
| Average Intel Core i9-13980HX | |
| Apple MacBook Pro 16 2023 M2 Max -6! | |
| MSI Stealth 17 Studio A13VH-014 | |
| Gigabyte AERO 16 OLED BSF | |
| Average of class Multimedia | |
| Samsung Galaxy Book3 Ultra 16 | |
| Cinebench R23 / Multi Core | |
| Asus Zephyrus Duo 16 GX650PY-NM006W | |
| Asus ProArt Studiobook 16 OLED H7604 | |
| Average Intel Core i9-13980HX (28301 - 33052, n=11) | |
| MSI Stealth 17 Studio A13VH-014 | |
| Gigabyte AERO 16 OLED BSF | |
| Average of class Multimedia (4861 - 33362, n=74, last 2 years) | |
| Samsung Galaxy Book3 Ultra 16 | |
| Apple MacBook Pro 16 2023 M2 Max | |
| Cinebench R23 / Single Core | |
| Asus ProArt Studiobook 16 OLED H7604 | |
| Average Intel Core i9-13980HX (1825 - 2169, n=9) | |
| Average of class Multimedia (1128 - 2459, n=66, last 2 years) | |
| Asus Zephyrus Duo 16 GX650PY-NM006W | |
| Gigabyte AERO 16 OLED BSF | |
| MSI Stealth 17 Studio A13VH-014 | |
| Samsung Galaxy Book3 Ultra 16 | |
| Apple MacBook Pro 16 2023 M2 Max | |
| Cinebench R20 / CPU (Multi Core) | |
| Asus Zephyrus Duo 16 GX650PY-NM006W | |
| Asus ProArt Studiobook 16 OLED H7604 | |
| Average Intel Core i9-13980HX (10353 - 12437, n=10) | |
| MSI Stealth 17 Studio A13VH-014 | |
| Gigabyte AERO 16 OLED BSF | |
| Average of class Multimedia (1887 - 12912, n=57, last 2 years) | |
| Samsung Galaxy Book3 Ultra 16 | |
| Apple MacBook Pro 16 2023 M2 Max | |
| Cinebench R20 / CPU (Single Core) | |
| Asus ProArt Studiobook 16 OLED H7604 | |
| Average Intel Core i9-13980HX (717 - 825, n=10) | |
| Asus Zephyrus Duo 16 GX650PY-NM006W | |
| Average of class Multimedia (425 - 853, n=57, last 2 years) | |
| MSI Stealth 17 Studio A13VH-014 | |
| Samsung Galaxy Book3 Ultra 16 | |
| Gigabyte AERO 16 OLED BSF | |
| Apple MacBook Pro 16 2023 M2 Max | |
| Cinebench R15 / CPU Multi 64Bit | |
| Asus Zephyrus Duo 16 GX650PY-NM006W | |
| Average Intel Core i9-13980HX (4358 - 5172, n=11) | |
| Asus ProArt Studiobook 16 OLED H7604 | |
| MSI Stealth 17 Studio A13VH-014 | |
| Gigabyte AERO 16 OLED BSF | |
| Average of class Multimedia (856 - 5224, n=61, last 2 years) | |
| Samsung Galaxy Book3 Ultra 16 | |
| Apple MacBook Pro 16 2023 M2 Max | |
| Cinebench R15 / CPU Single 64Bit | |
| Asus ProArt Studiobook 16 OLED H7604 | |
| Asus Zephyrus Duo 16 GX650PY-NM006W | |
| Average Intel Core i9-13980HX (289 - 312, n=11) | |
| MSI Stealth 17 Studio A13VH-014 | |
| Average of class Multimedia (184.8 - 326, n=59, last 2 years) | |
| Samsung Galaxy Book3 Ultra 16 | |
| Gigabyte AERO 16 OLED BSF | |
| Apple MacBook Pro 16 2023 M2 Max | |
| Blender / v2.79 BMW27 CPU | |
| Average of class Multimedia (100 - 557, n=58, last 2 years) | |
| Samsung Galaxy Book3 Ultra 16 | |
| Gigabyte AERO 16 OLED BSF | |
| MSI Stealth 17 Studio A13VH-014 | |
| Average Intel Core i9-13980HX (97 - 136, n=10) | |
| Asus ProArt Studiobook 16 OLED H7604 | |
| Asus Zephyrus Duo 16 GX650PY-NM006W | |
| 7-Zip 18.03 / 7z b 4 | |
| Asus Zephyrus Duo 16 GX650PY-NM006W | |
| Asus ProArt Studiobook 16 OLED H7604 | |
| Average Intel Core i9-13980HX (104616 - 129804, n=10) | |
| MSI Stealth 17 Studio A13VH-014 | |
| Gigabyte AERO 16 OLED BSF | |
| Samsung Galaxy Book3 Ultra 16 | |
| Average of class Multimedia (26062 - 130368, n=55, last 2 years) | |
| 7-Zip 18.03 / 7z b 4 -mmt1 | |
| Asus Zephyrus Duo 16 GX650PY-NM006W | |
| Asus ProArt Studiobook 16 OLED H7604 | |
| Average Intel Core i9-13980HX (6230 - 7163, n=10) | |
| MSI Stealth 17 Studio A13VH-014 | |
| Average of class Multimedia (3666 - 7545, n=56, last 2 years) | |
| Gigabyte AERO 16 OLED BSF | |
| Samsung Galaxy Book3 Ultra 16 | |
| Geekbench 5.5 / Multi-Core | |
| Average Intel Core i9-13980HX (18475 - 22200, n=10) | |
| Asus ProArt Studiobook 16 OLED H7604 | |
| Asus Zephyrus Duo 16 GX650PY-NM006W | |
| Apple MacBook Pro 16 2023 M2 Max | |
| Gigabyte AERO 16 OLED BSF | |
| MSI Stealth 17 Studio A13VH-014 | |
| Average of class Multimedia (4652 - 20422, n=56, last 2 years) | |
| Samsung Galaxy Book3 Ultra 16 | |
| Geekbench 5.5 / Single-Core | |
| Asus ProArt Studiobook 16 OLED H7604 | |
| Asus Zephyrus Duo 16 GX650PY-NM006W | |
| Average Intel Core i9-13980HX (1796 - 2139, n=10) | |
| MSI Stealth 17 Studio A13VH-014 | |
| Apple MacBook Pro 16 2023 M2 Max | |
| Average of class Multimedia (805 - 2974, n=56, last 2 years) | |
| Gigabyte AERO 16 OLED BSF | |
| Samsung Galaxy Book3 Ultra 16 | |
| HWBOT x265 Benchmark v2.2 / 4k Preset | |
| Asus Zephyrus Duo 16 GX650PY-NM006W | |
| Average Intel Core i9-13980HX (27 - 33.4, n=9) | |
| Asus ProArt Studiobook 16 OLED H7604 | |
| MSI Stealth 17 Studio A13VH-014 | |
| Gigabyte AERO 16 OLED BSF | |
| Average of class Multimedia (5.26 - 36.1, n=56, last 2 years) | |
| Samsung Galaxy Book3 Ultra 16 | |
| LibreOffice / 20 Documents To PDF | |
| Asus Zephyrus Duo 16 GX650PY-NM006W | |
| Gigabyte AERO 16 OLED BSF | |
| MSI Stealth 17 Studio A13VH-014 | |
| Average of class Multimedia (23.9 - 146.7, n=57, last 2 years) | |
| Samsung Galaxy Book3 Ultra 16 | |
| Asus ProArt Studiobook 16 OLED H7604 | |
| Average Intel Core i9-13980HX (35 - 51.4, n=10) | |
| R Benchmark 2.5 / Overall mean | |
| Gigabyte AERO 16 OLED BSF | |
| Samsung Galaxy Book3 Ultra 16 | |
| Average of class Multimedia (0.3604 - 0.947, n=56, last 2 years) | |
| MSI Stealth 17 Studio A13VH-014 | |
| Asus Zephyrus Duo 16 GX650PY-NM006W | |
| Average Intel Core i9-13980HX (0.3793 - 0.4462, n=10) | |
| Asus ProArt Studiobook 16 OLED H7604 | |
* ... smaller is better
AIDA64: FP32 Ray-Trace | FPU Julia | CPU SHA3 | CPU Queen | FPU SinJulia | FPU Mandel | CPU AES | CPU ZLib | FP64 Ray-Trace | CPU PhotoWorxx
| Performance rating | |
| Asus ProArt Studiobook 16 OLED H7604 | |
| Average Intel Core i9-13980HX | |
| Gigabyte AERO 16 OLED BSF | |
| MSI Stealth 17 Studio A13VH-014 | |
| Average of class Multimedia | |
| Samsung Galaxy Book3 Ultra 16 | |
| AIDA64 / FP32 Ray-Trace | |
| Asus ProArt Studiobook 16 OLED H7604 | |
| Average Intel Core i9-13980HX (21332 - 29553, n=9) | |
| MSI Stealth 17 Studio A13VH-014 | |
| Gigabyte AERO 16 OLED BSF | |
| Average of class Multimedia (2214 - 50388, n=53, last 2 years) | |
| Samsung Galaxy Book3 Ultra 16 | |
| AIDA64 / FPU Julia | |
| Asus ProArt Studiobook 16 OLED H7604 | |
| Average Intel Core i9-13980HX (108001 - 148168, n=9) | |
| MSI Stealth 17 Studio A13VH-014 | |
| Gigabyte AERO 16 OLED BSF | |
| Average of class Multimedia (12867 - 201874, n=54, last 2 years) | |
| Samsung Galaxy Book3 Ultra 16 | |
| AIDA64 / CPU SHA3 | |
| Asus ProArt Studiobook 16 OLED H7604 | |
| Average Intel Core i9-13980HX (5264 - 7142, n=9) | |
| MSI Stealth 17 Studio A13VH-014 | |
| Gigabyte AERO 16 OLED BSF | |
| Average of class Multimedia (626 - 8623, n=54, last 2 years) | |
| Samsung Galaxy Book3 Ultra 16 | |
| AIDA64 / CPU Queen | |
| Average Intel Core i9-13980HX (126758 - 143409, n=9) | |
| Asus ProArt Studiobook 16 OLED H7604 | |
| Samsung Galaxy Book3 Ultra 16 | |
| MSI Stealth 17 Studio A13VH-014 | |
| Gigabyte AERO 16 OLED BSF | |
| Average of class Multimedia (13483 - 181505, n=41, last 2 years) | |
| AIDA64 / FPU SinJulia | |
| Average Intel Core i9-13980HX (13785 - 17117, n=9) | |
| Asus ProArt Studiobook 16 OLED H7604 | |
| MSI Stealth 17 Studio A13VH-014 | |
| Gigabyte AERO 16 OLED BSF | |
| Samsung Galaxy Book3 Ultra 16 | |
| Average of class Multimedia (886 - 28794, n=54, last 2 years) | |
| AIDA64 / FPU Mandel | |
| Asus ProArt Studiobook 16 OLED H7604 | |
| Average Intel Core i9-13980HX (53398 - 73758, n=9) | |
| MSI Stealth 17 Studio A13VH-014 | |
| Gigabyte AERO 16 OLED BSF | |
| Average of class Multimedia (6395 - 105740, n=53, last 2 years) | |
| Samsung Galaxy Book3 Ultra 16 | |
| AIDA64 / CPU AES | |
| Gigabyte AERO 16 OLED BSF | |
| Asus ProArt Studiobook 16 OLED H7604 | |
| Average Intel Core i9-13980HX (105169 - 136520, n=9) | |
| MSI Stealth 17 Studio A13VH-014 | |
| Samsung Galaxy Book3 Ultra 16 | |
| Average of class Multimedia (8171 - 126790, n=54, last 2 years) | |
| AIDA64 / CPU ZLib | |
| Asus ProArt Studiobook 16 OLED H7604 | |
| Average Intel Core i9-13980HX (1513 - 2039, n=9) | |
| MSI Stealth 17 Studio A13VH-014 | |
| Gigabyte AERO 16 OLED BSF | |
| Samsung Galaxy Book3 Ultra 16 | |
| Average of class Multimedia (143.8 - 2022, n=54, last 2 years) | |
| AIDA64 / FP64 Ray-Trace | |
| Average Intel Core i9-13980HX (11431 - 16325, n=9) | |
| Asus ProArt Studiobook 16 OLED H7604 | |
| MSI Stealth 17 Studio A13VH-014 | |
| Gigabyte AERO 16 OLED BSF | |
| Average of class Multimedia (1014 - 26875, n=54, last 2 years) | |
| Samsung Galaxy Book3 Ultra 16 | |
| AIDA64 / CPU PhotoWorxx | |
| MSI Stealth 17 Studio A13VH-014 | |
| Average of class Multimedia (8187 - 88154, n=54, last 2 years) | |
| Asus ProArt Studiobook 16 OLED H7604 | |
| Samsung Galaxy Book3 Ultra 16 | |
| Average Intel Core i9-13980HX (37069 - 52949, n=9) | |
| Gigabyte AERO 16 OLED BSF | |
系统性能
无论是在合成基准还是在实践中,系统性能都非常好。在测试中也没有遇到任何问题。
CrossMark: Overall | Productivity | Creativity | Responsiveness
| PCMark 10 / Score | |
| Asus Zephyrus Duo 16 GX650PY-NM006W | |
| Gigabyte AERO 16 OLED BSF | |
| Average of class Multimedia (4325 - 10386, n=52, last 2 years) | |
| Asus ProArt Studiobook 16 OLED H7604 | |
| Average Intel Core i9-13980HX, NVIDIA GeForce RTX 4070 Laptop GPU (n=1) | |
| MSI Stealth 17 Studio A13VH-014 | |
| Samsung Galaxy Book3 Ultra 16 | |
| PCMark 10 / Essentials | |
| Asus Zephyrus Duo 16 GX650PY-NM006W | |
| Gigabyte AERO 16 OLED BSF | |
| Asus ProArt Studiobook 16 OLED H7604 | |
| Average Intel Core i9-13980HX, NVIDIA GeForce RTX 4070 Laptop GPU (n=1) | |
| Samsung Galaxy Book3 Ultra 16 | |
| Average of class Multimedia (8025 - 11664, n=51, last 2 years) | |
| MSI Stealth 17 Studio A13VH-014 | |
| PCMark 10 / Productivity | |
| Asus Zephyrus Duo 16 GX650PY-NM006W | |
| Average of class Multimedia (7323 - 18233, n=51, last 2 years) | |
| MSI Stealth 17 Studio A13VH-014 | |
| Asus ProArt Studiobook 16 OLED H7604 | |
| Average Intel Core i9-13980HX, NVIDIA GeForce RTX 4070 Laptop GPU (n=1) | |
| Gigabyte AERO 16 OLED BSF | |
| Samsung Galaxy Book3 Ultra 16 | |
| PCMark 10 / Digital Content Creation | |
| Asus Zephyrus Duo 16 GX650PY-NM006W | |
| Gigabyte AERO 16 OLED BSF | |
| MSI Stealth 17 Studio A13VH-014 | |
| Asus ProArt Studiobook 16 OLED H7604 | |
| Average Intel Core i9-13980HX, NVIDIA GeForce RTX 4070 Laptop GPU (n=1) | |
| Average of class Multimedia (3651 - 16240, n=51, last 2 years) | |
| Samsung Galaxy Book3 Ultra 16 | |
| CrossMark / Overall | |
| Asus ProArt Studiobook 16 OLED H7604 | |
| Average Intel Core i9-13980HX, NVIDIA GeForce RTX 4070 Laptop GPU (n=1) | |
| Asus Zephyrus Duo 16 GX650PY-NM006W | |
| Apple MacBook Pro 16 2023 M2 Max | |
| Gigabyte AERO 16 OLED BSF | |
| Average of class Multimedia (866 - 2728, n=60, last 2 years) | |
| MSI Stealth 17 Studio A13VH-014 | |
| Samsung Galaxy Book3 Ultra 16 | |
| CrossMark / Productivity | |
| Asus ProArt Studiobook 16 OLED H7604 | |
| Average Intel Core i9-13980HX, NVIDIA GeForce RTX 4070 Laptop GPU (n=1) | |
| Asus Zephyrus Duo 16 GX650PY-NM006W | |
| Gigabyte AERO 16 OLED BSF | |
| Average of class Multimedia (931 - 2489, n=60, last 2 years) | |
| MSI Stealth 17 Studio A13VH-014 | |
| Apple MacBook Pro 16 2023 M2 Max | |
| Samsung Galaxy Book3 Ultra 16 | |
| CrossMark / Creativity | |
| Apple MacBook Pro 16 2023 M2 Max | |
| Asus ProArt Studiobook 16 OLED H7604 | |
| Average Intel Core i9-13980HX, NVIDIA GeForce RTX 4070 Laptop GPU (n=1) | |
| Asus Zephyrus Duo 16 GX650PY-NM006W | |
| Average of class Multimedia (907 - 3465, n=60, last 2 years) | |
| Gigabyte AERO 16 OLED BSF | |
| MSI Stealth 17 Studio A13VH-014 | |
| Samsung Galaxy Book3 Ultra 16 | |
| CrossMark / Responsiveness | |
| Gigabyte AERO 16 OLED BSF | |
| Asus ProArt Studiobook 16 OLED H7604 | |
| Average Intel Core i9-13980HX, NVIDIA GeForce RTX 4070 Laptop GPU (n=1) | |
| Asus Zephyrus Duo 16 GX650PY-NM006W | |
| MSI Stealth 17 Studio A13VH-014 | |
| Average of class Multimedia (605 - 2024, n=60, last 2 years) | |
| Samsung Galaxy Book3 Ultra 16 | |
| Apple MacBook Pro 16 2023 M2 Max | |
| PCMark 10 Score | 7491 points | |
Help | ||
| AIDA64 / Memory Copy | |
| Average of class Multimedia (11299 - 132135, n=54, last 2 years) | |
| Asus ProArt Studiobook 16 OLED H7604 | |
| MSI Stealth 17 Studio A13VH-014 | |
| Samsung Galaxy Book3 Ultra 16 | |
| Average Intel Core i9-13980HX (62189 - 80776, n=9) | |
| Gigabyte AERO 16 OLED BSF | |
| AIDA64 / Memory Read | |
| Average of class Multimedia (11624 - 174586, n=54, last 2 years) | |
| Asus ProArt Studiobook 16 OLED H7604 | |
| Average Intel Core i9-13980HX (62624 - 89096, n=9) | |
| MSI Stealth 17 Studio A13VH-014 | |
| Samsung Galaxy Book3 Ultra 16 | |
| Gigabyte AERO 16 OLED BSF | |
| AIDA64 / Memory Write | |
| Samsung Galaxy Book3 Ultra 16 | |
| Average of class Multimedia (11755 - 134998, n=54, last 2 years) | |
| MSI Stealth 17 Studio A13VH-014 | |
| Asus ProArt Studiobook 16 OLED H7604 | |
| Average Intel Core i9-13980HX (59912 - 79917, n=9) | |
| Gigabyte AERO 16 OLED BSF | |
| AIDA64 / Memory Latency | |
| Average of class Multimedia (7 - 535, n=53, last 2 years) | |
| Samsung Galaxy Book3 Ultra 16 | |
| Gigabyte AERO 16 OLED BSF | |
| MSI Stealth 17 Studio A13VH-014 | |
| Average Intel Core i9-13980HX (79.4 - 93.2, n=9) | |
| Asus ProArt Studiobook 16 OLED H7604 | |
* ... smaller is better
DPC延时
Studiobook不是特别适合于实时音频应用。在我们的标准化延迟测试中,目前的BIOS版本下出现了高延迟。
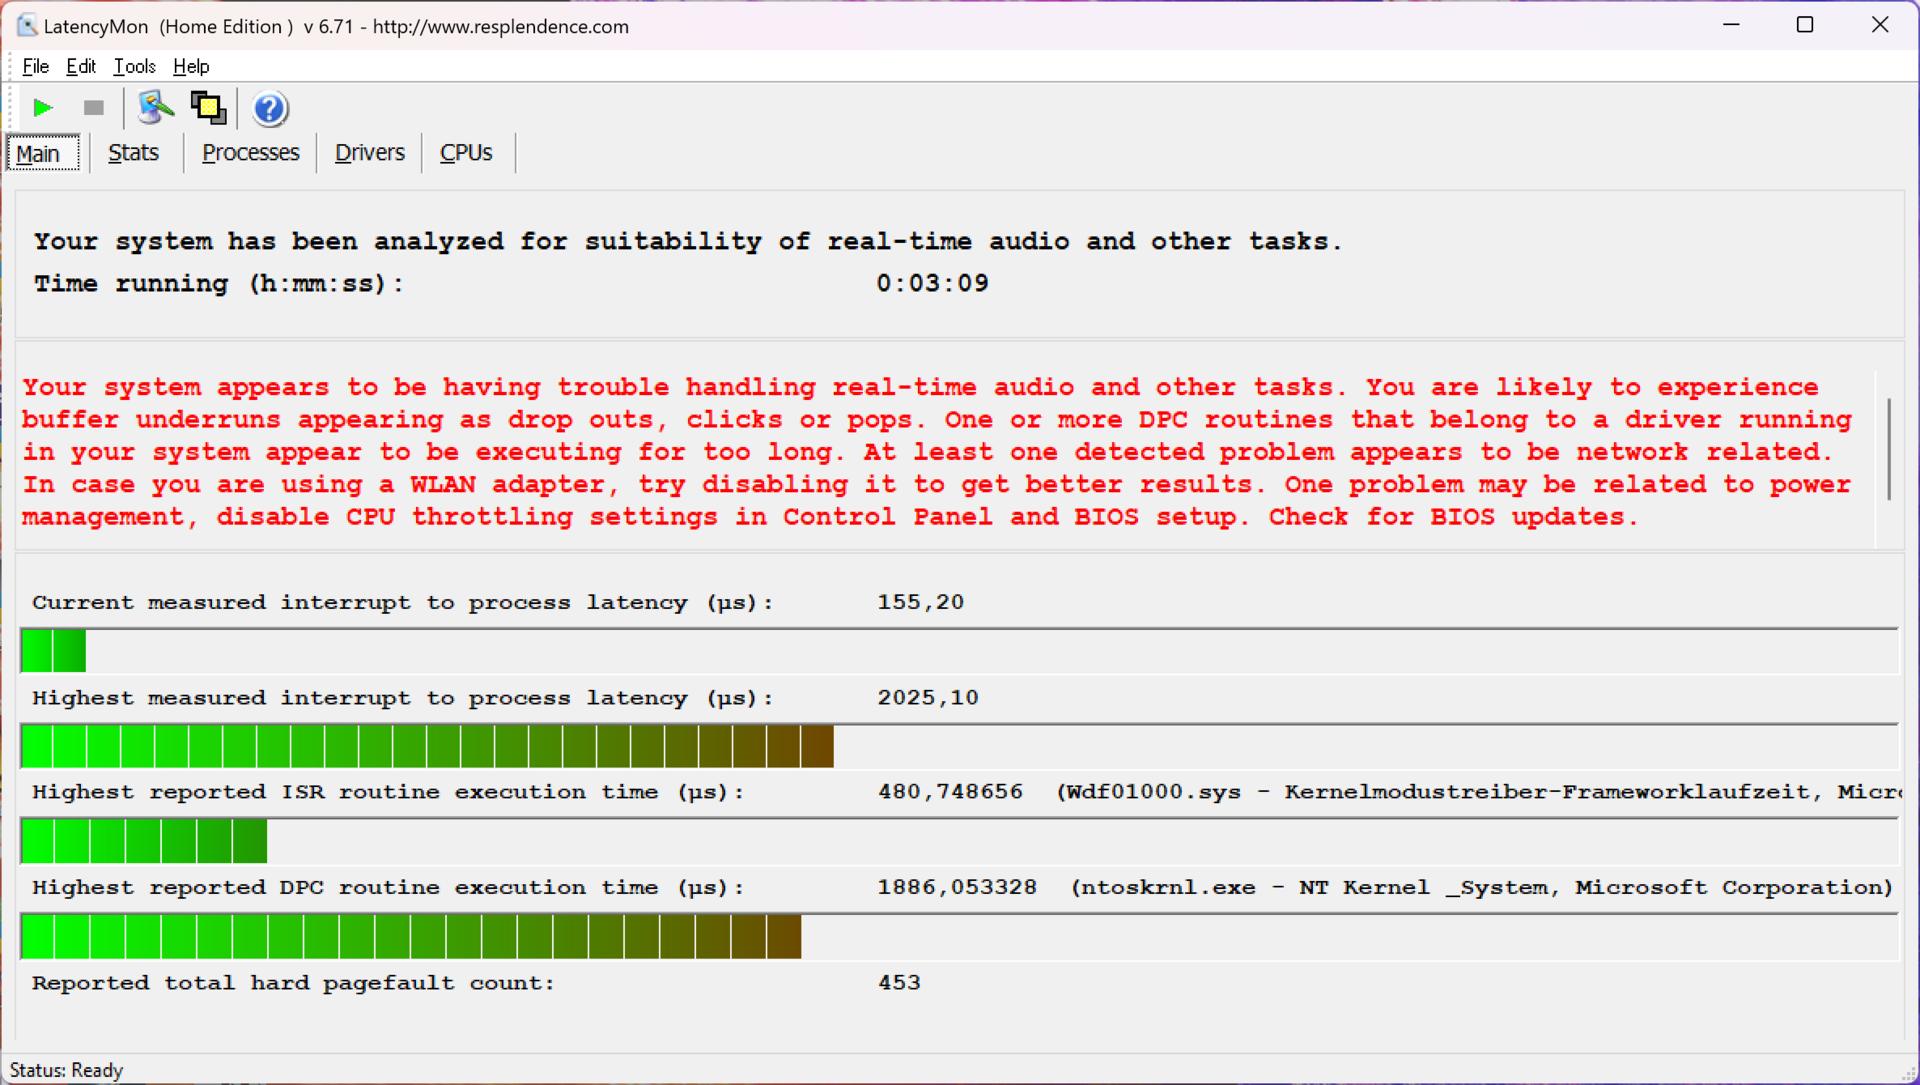
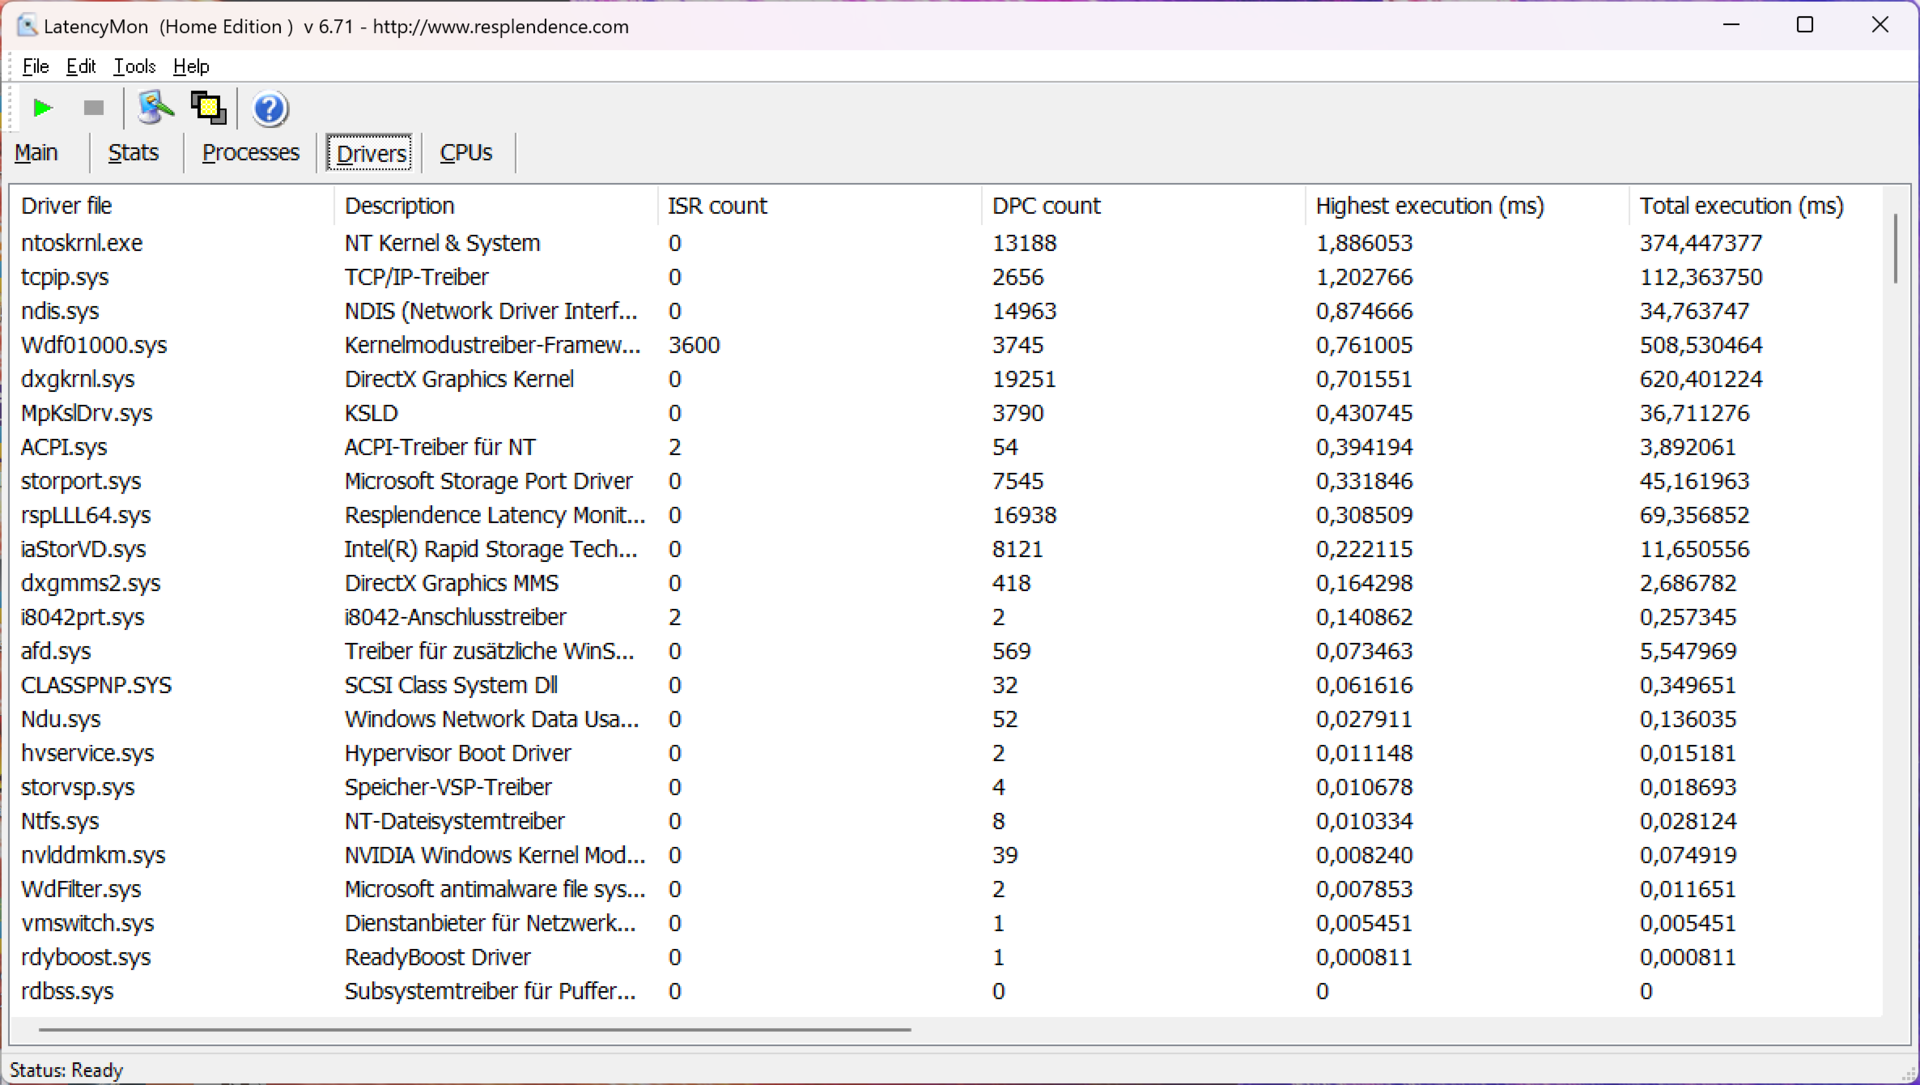
| DPC Latencies / LatencyMon - interrupt to process latency (max), Web, Youtube, Prime95 | |
| Asus Zephyrus Duo 16 GX650PY-NM006W | |
| Samsung Galaxy Book3 Ultra 16 | |
| MSI Stealth 17 Studio A13VH-014 | |
| Asus ProArt Studiobook 16 OLED H7604 | |
| Gigabyte AERO 16 OLED BSF | |
* ... smaller is better
存储设备
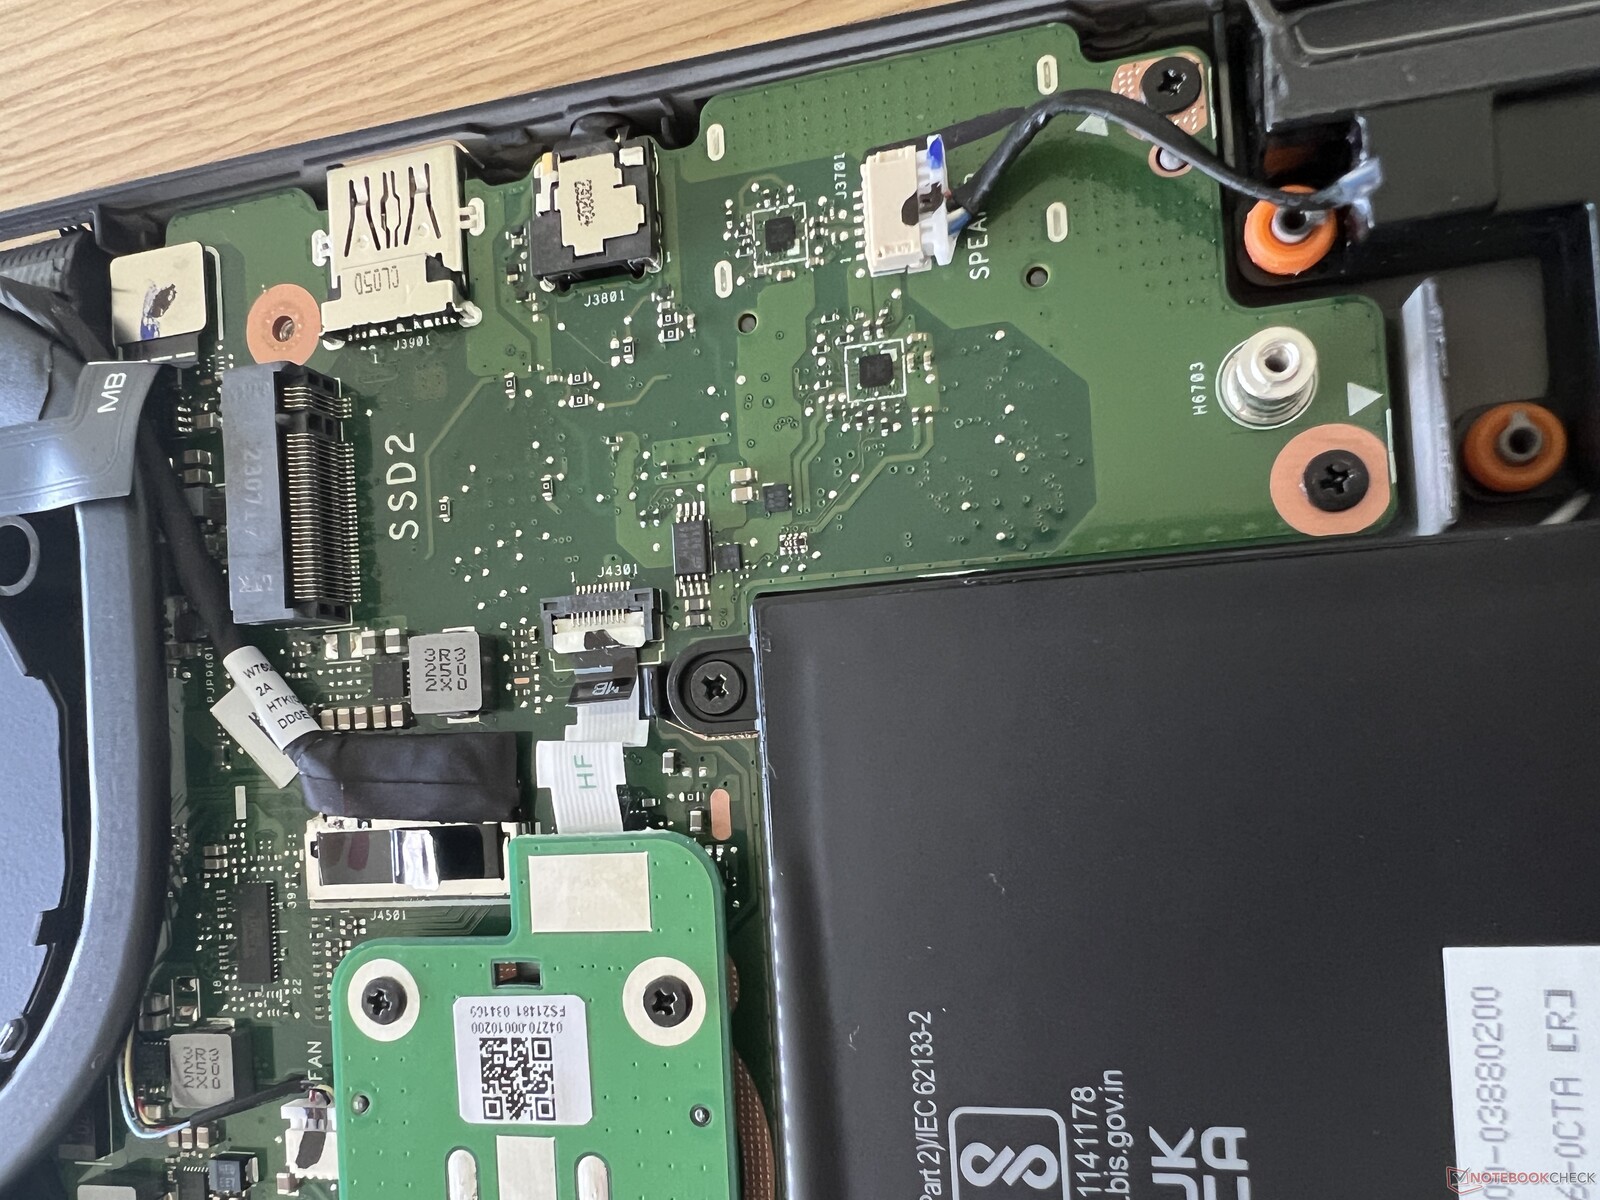
在我们的测试设备中使用了Phison的快速PCIe 4.0 SSD,它提供了4TB的巨大存储容量。其中,3.63TB在第一次启动后仍然可用。该驱动器的速度非常快,传输率超过7GB/s,最重要的是,即使在永久负载下,性能也可以持续保持。这决不是标准。此外,Studiobook 16还提供另一个M.2 2280插槽,它也是通过快速的PCIe 4.0接口连接的。更多的SSD基准测试被列在这里.

* ... smaller is better
Sustained Read Performance: DiskSpd Read Loop, Queue Depth 8
图形
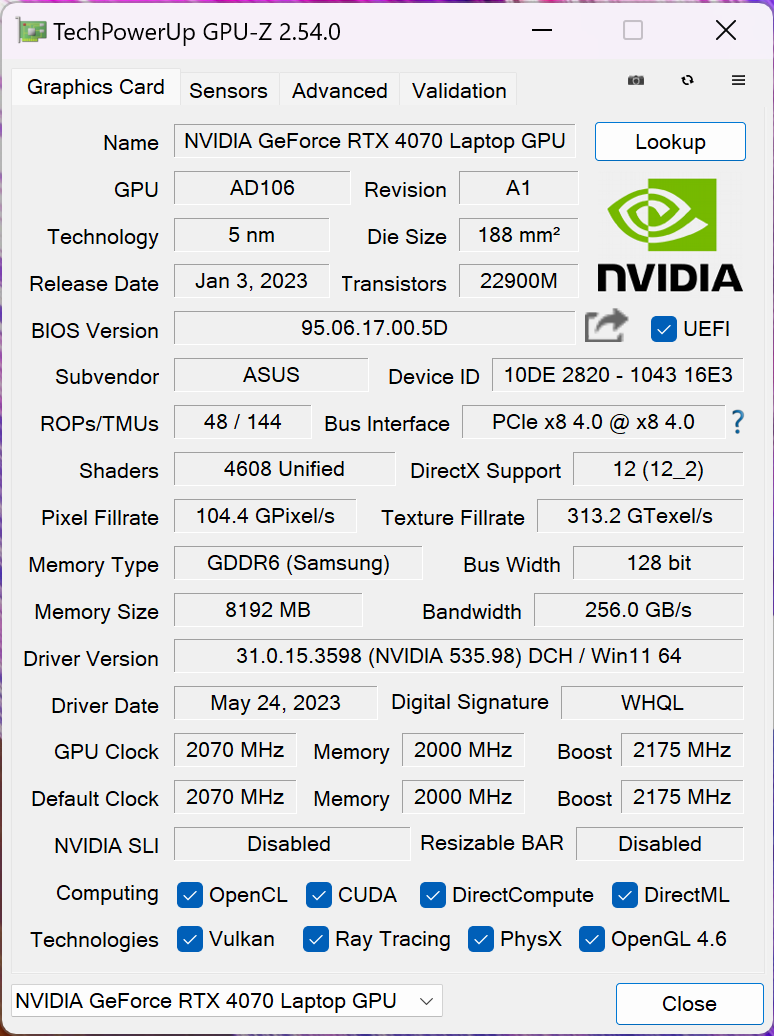
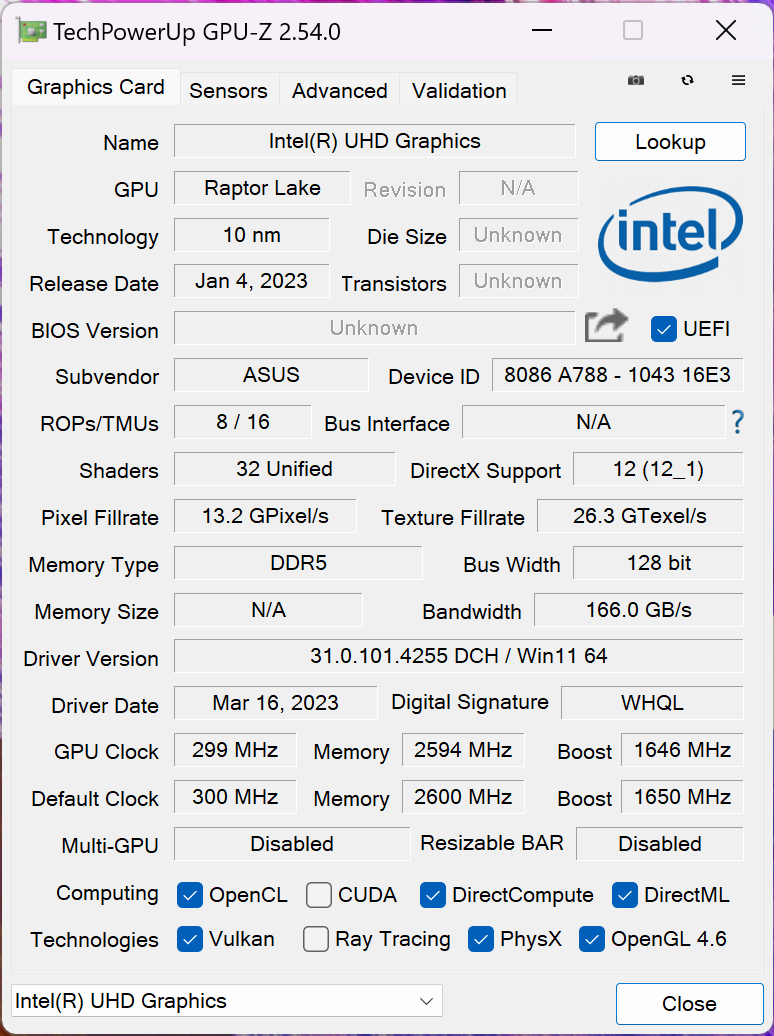
除了处理器的集成GPU (UHD Graphics),还安装了快速的NvidiaGeForce RTX 4070 笔记本电脑。图形切换是通过Optimus完成的,但没有高级Optimus或MUX开关。由于最大TGP为130瓦,这是最快的4070笔记本电脑型号之一,但这个数字有点误导。正如我们在对新的移动GPU的第一次审查中所看到的,在FurMark等合成测试中可以达到这个数值,但游戏被限制在105-110瓦左右,因为GPU在这里达到最大时钟。
在基准测试中,RTX 4070处于预期水平,落后于RTX 4080 Laptop和 4090笔记本电脑与旧的 Studiobook 16与它的RTX 3070 Ti、7-15%的领先优势并不是很大,所以在这里升级并不值得。GPU性能在永久负载下保持稳定,但在电池模式下的性能要低40%左右(最大TGP 40瓦)。更多的GPU基准测试可以在这里找到https://www.notebookcheck.net/Mobile-Graphics-Cards-Benchmark-List.844.0.html.
| 3DMark 11 Performance | 35000 points | |
| 3DMark Fire Strike Score | 25949 points | |
| 3DMark Time Spy Score | 12384 points | |
Help | ||
| Blender / v3.3 Classroom OPTIX/RTX | |
| Average of class Multimedia (12 - 105, n=22, last 2 years) | |
| Samsung Galaxy Book3 Ultra 16 | |
| Asus ProArt StudioBook 16 H7600ZW | |
| Schenker XMG Pro 15 (E23) | |
| Asus ProArt Studiobook 16 OLED H7604 | |
| Average NVIDIA GeForce RTX 4070 Laptop GPU (18 - 30, n=68) | |
| Gigabyte AERO 16 OLED BSF | |
| MSI Stealth 17 Studio A13VH-014 | |
| Asus Zephyrus Duo 16 GX650PY-NM006W | |
| Blender / v3.3 Classroom CUDA | |
| Average of class Multimedia (20 - 186, n=22, last 2 years) | |
| Samsung Galaxy Book3 Ultra 16 | |
| Asus ProArt StudioBook 16 H7600ZW | |
| Schenker XMG Pro 15 (E23) | |
| Asus ProArt Studiobook 16 OLED H7604 | |
| Average NVIDIA GeForce RTX 4070 Laptop GPU (32 - 50, n=67) | |
| Gigabyte AERO 16 OLED BSF | |
| MSI Stealth 17 Studio A13VH-014 | |
| Asus Zephyrus Duo 16 GX650PY-NM006W | |
| Blender / v3.3 Classroom METAL | |
| Apple MacBook Pro 16 2023 M2 Max | |
| Average of class Multimedia (17.8 - 68, n=5, last 2 years) | |
| Blender / v3.3 Classroom CPU | |
| Average of class Multimedia (134.5 - 1042, n=62, last 2 years) | |
| Samsung Galaxy Book3 Ultra 16 | |
| Apple MacBook Pro 16 2023 M2 Max | |
| Gigabyte AERO 16 OLED BSF | |
| Average NVIDIA GeForce RTX 4070 Laptop GPU (158 - 440, n=67) | |
| Asus ProArt StudioBook 16 H7600ZW | |
| MSI Stealth 17 Studio A13VH-014 | |
| Schenker XMG Pro 15 (E23) | |
| Asus ProArt Studiobook 16 OLED H7604 | |
| Asus Zephyrus Duo 16 GX650PY-NM006W | |
* ... smaller is better
游戏性能
Studiobook 16的游戏性能非常好,即使是现代作品也可以在QHD分辨率下播放,没有问题。只有光线追踪通常需要升频才能流畅地播放。这里的一个很好的例子是《赛博朋克2077》,在光线追踪超预设下只能达到26FPS,但在DLSS(包括帧生成)下,这就变成了84FPS。当然,速度的提高会因题目的不同而不同,赛博朋克是DLSS的一个旗舰题目。在较长的会议期间,游戏性能保持稳定,但与旧的工作室本相比,其总体优势是 RTX 3070 Ti的整体优势是最小的。
Witcher 3 FPS Chart
| low | med. | high | ultra | QHD | |
|---|---|---|---|---|---|
| GTA V (2015) | 183.4 | 179 | 123 | 94.5 | |
| The Witcher 3 (2015) | 249 | 107.1 | |||
| Dota 2 Reborn (2015) | 215 | 192.8 | 184.4 | 171.6 | |
| Final Fantasy XV Benchmark (2018) | 162.4 | 114.7 | 85.2 | ||
| X-Plane 11.11 (2018) | 181.6 | 164.3 | 131.1 | ||
| Far Cry 5 (2018) | 187 | 162 | 154 | 145 | 117 |
| Strange Brigade (2018) | 315 | 162.1 | 150.6 | 142.7 | 95.3 |
| Shadow of the Tomb Raider (2018) | 153 | 103 | |||
| F1 2021 (2021) | 441 | 336 | 264 | 149.8 | 110.9 |
| Cyberpunk 2077 1.6 (2022) | 129 | 113 | 96 | 87 | 54 |
| F1 22 (2022) | 138.5 | 133.8 | 111.2 | 59.4 | 42.4 |
| Call of Duty Modern Warfare 2 2022 (2022) | 102 | 72 |
排放 - 大声点,大声点,学习书
噪声
这两个风扇在日常工作中通常保持安静,但一旦CPU或GPU受到压力,就会迅速变大。我们在下面的表格中列出了数值,但我们一般建议在游戏时使用耳机或耳麦。你可以跳过这里的全速 模式,因为它只会变得更响,而且没有性能优势。没有检测到其他电子噪音,如线圈啸叫等
| 能源概况 | 3DMark 06 | Witcher 3 | Cyberpoint 2077 | 压力测试 |
|---|---|---|---|---|
| 默认 | 43.6dB(A) | 43.6dB(A) | 47.6dB(A) | 47.6dB(A) |
| 性能 | 43.6dB(A) | 43.6dB(A) | 47.6dB(A) | 47.6dB(A) |
| 全速 | 58.9dB(A) | 58.9dB(A) | 58.9dB(A) | 58.9dB(A) |
Noise level
| Idle |
| 24.5 / 24.5 / 24.5 dB(A) |
| Load |
| 47.6 / 56.7 dB(A) |
 | ||
30 dB silent 40 dB(A) audible 50 dB(A) loud |
||
min: | ||
| Asus ProArt Studiobook 16 OLED H7604 GeForce RTX 4070 Laptop GPU, i9-13980HX, Phison EM2804TBMTCB47 | Gigabyte AERO 16 OLED BSF GeForce RTX 4070 Laptop GPU, i9-13900H, Gigabyte AG470S1TB-SI B10 | Samsung Galaxy Book3 Ultra 16 GeForce RTX 4050 Laptop GPU, i7-13700H, Samsung PM9A1 MZVL2512HCJQ | MSI Stealth 17 Studio A13VH-014 GeForce RTX 4080 Laptop GPU, i9-13900H, Samsung PM9A1 MZVL22T0HBLB | Apple MacBook Pro 16 2023 M2 Max M2 Max 38-Core GPU, M2 Max, Apple SSD AP2048Z | Asus Zephyrus Duo 16 GX650PY-NM006W GeForce RTX 4090 Laptop GPU, R9 7945HX, SK hynix PC801 HFS002TEJ9X101N | |
|---|---|---|---|---|---|---|
| Noise | -3% | 6% | 9% | 13% | -9% | |
| off / environment * (dB) | 24.5 | 23 6% | 25 -2% | 24 2% | 23.9 2% | 23.9 2% |
| Idle Minimum * (dB) | 24.5 | 23 6% | 26 -6% | 24 2% | 23.9 2% | 23.9 2% |
| Idle Average * (dB) | 24.5 | 23 6% | 27 -10% | 24 2% | 23.9 2% | 32.9 -34% |
| Idle Maximum * (dB) | 24.5 | 33.64 -37% | 28 -14% | 24 2% | 23.9 2% | 36.5 -49% |
| Load Average * (dB) | 47.6 | 51.49 -8% | 40 16% | 34.49 28% | 36.6 23% | 42.9 10% |
| Witcher 3 ultra * (dB) | 55.9 | 55.27 1% | 39 30% | 48.29 14% | 35.1 37% | 51.2 8% |
| Load Maximum * (dB) | 56.7 | 55.24 3% | 41 28% | 49.66 12% | 43.2 24% | 56 1% |
* ... smaller is better
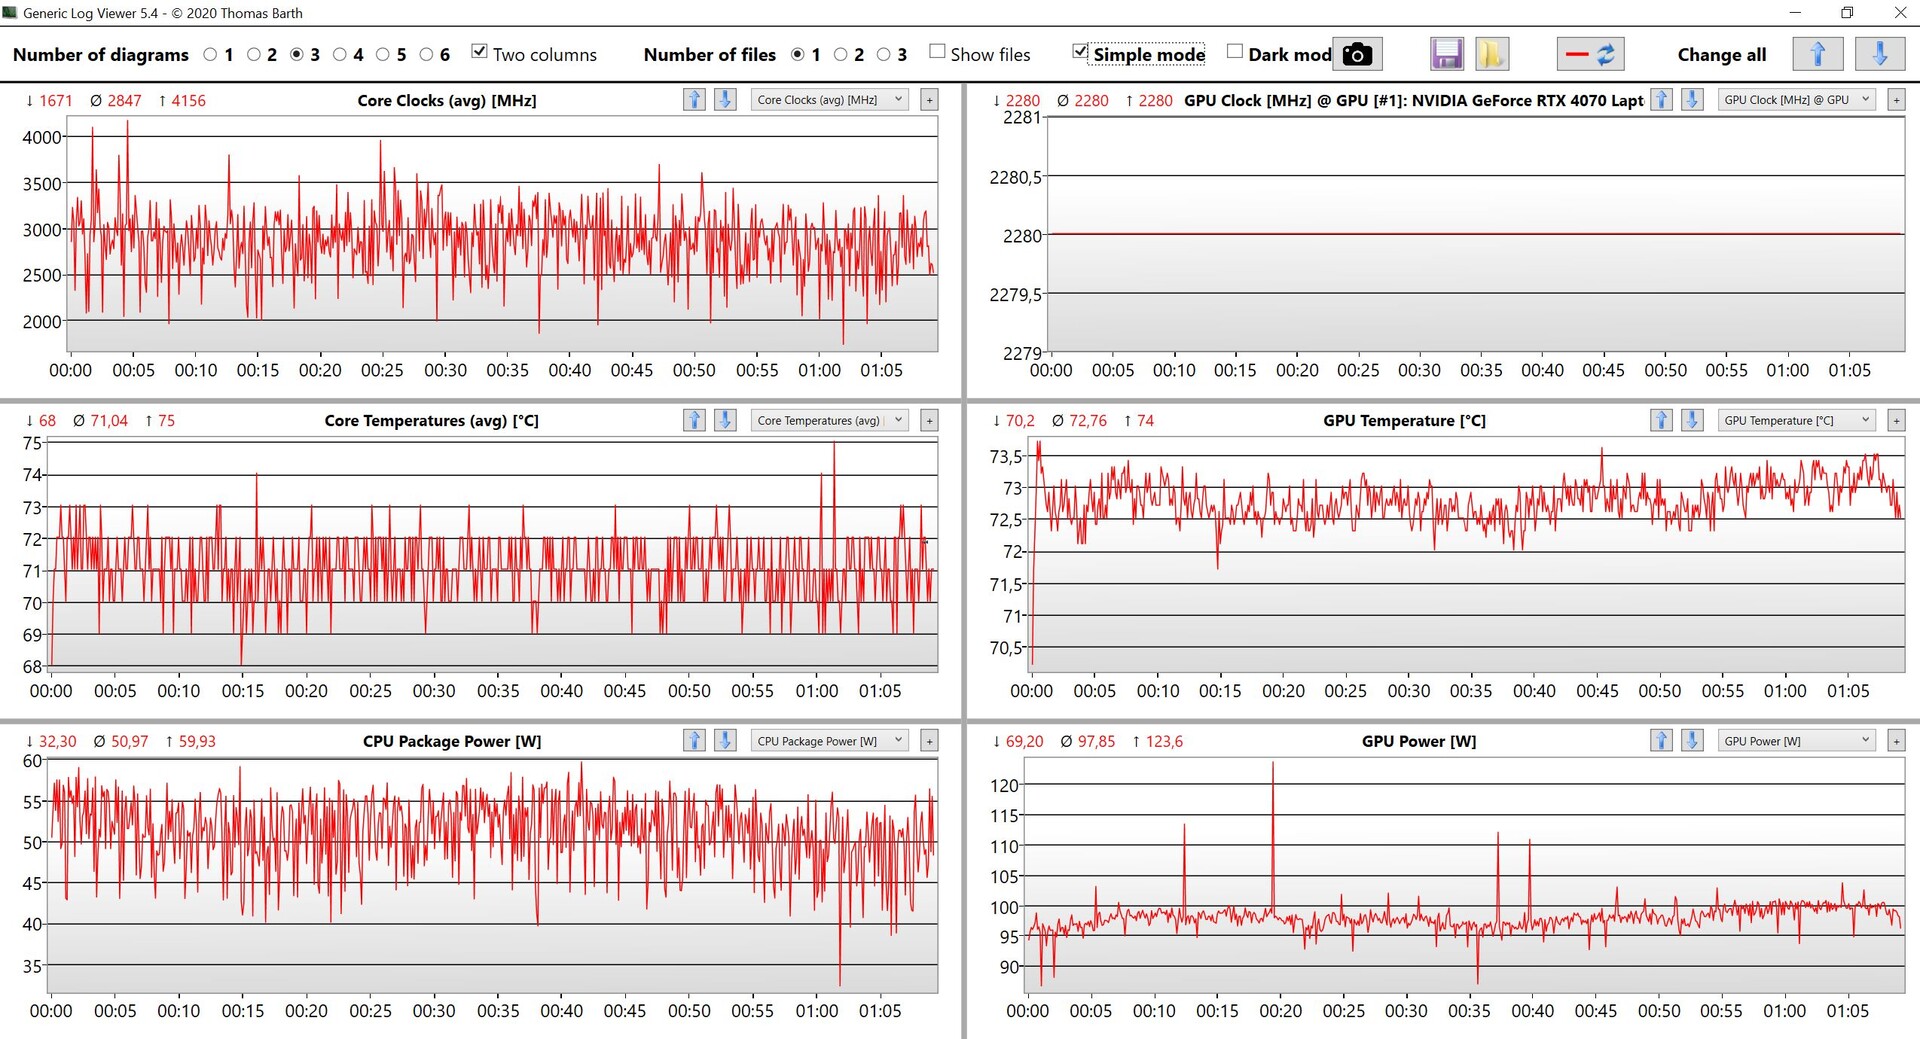
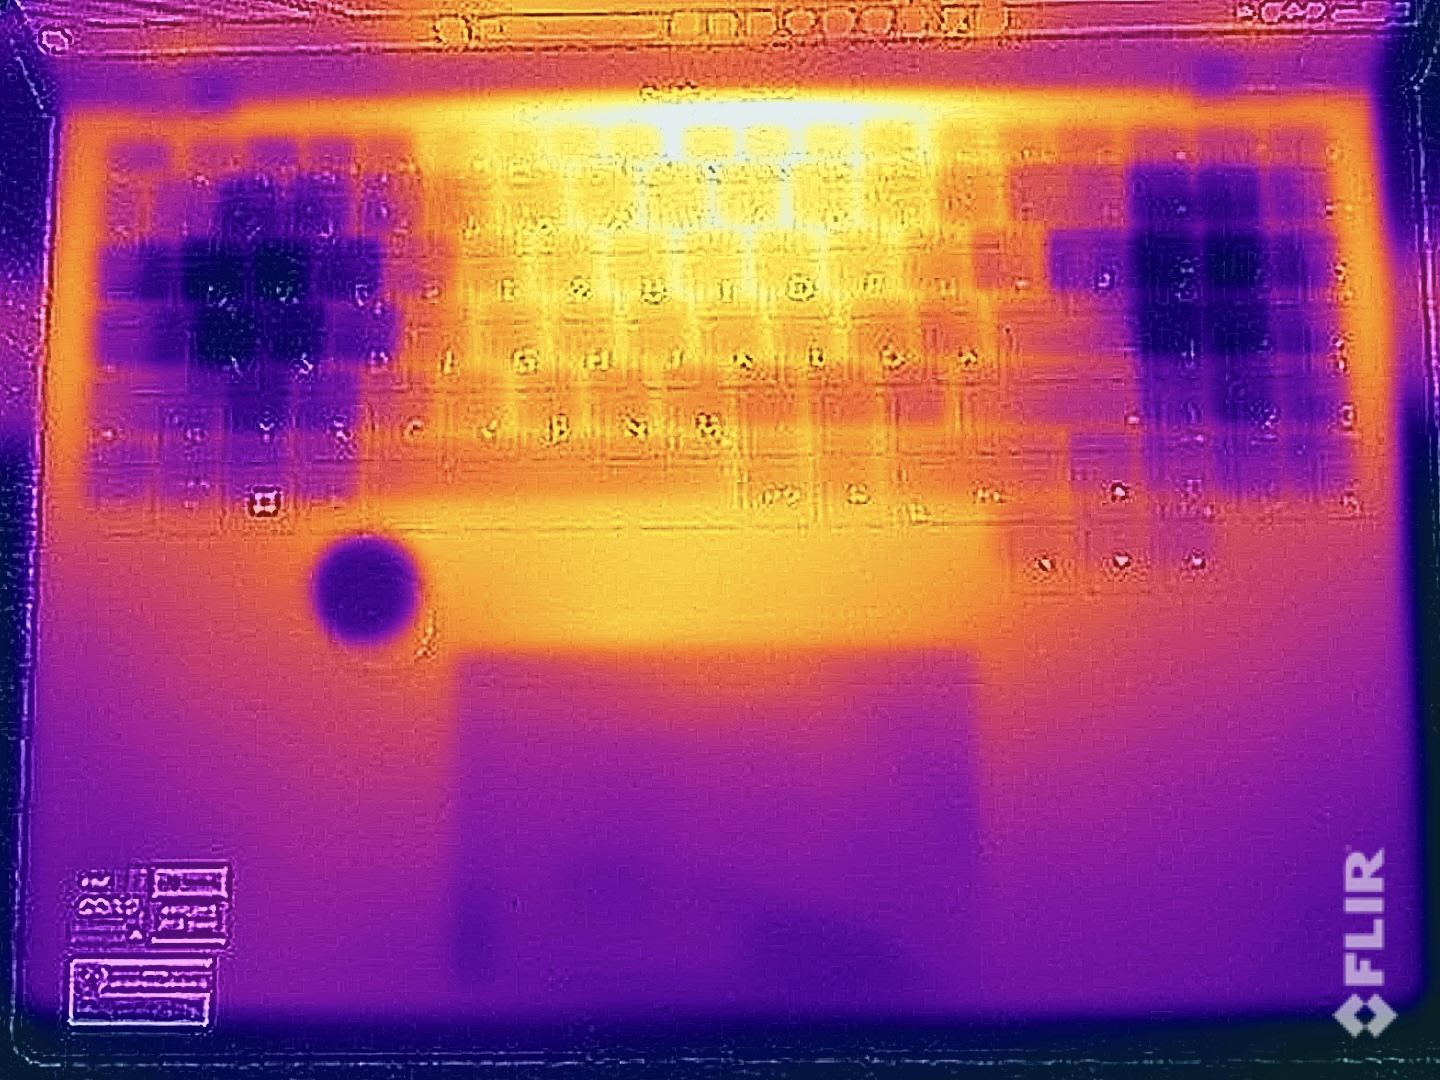
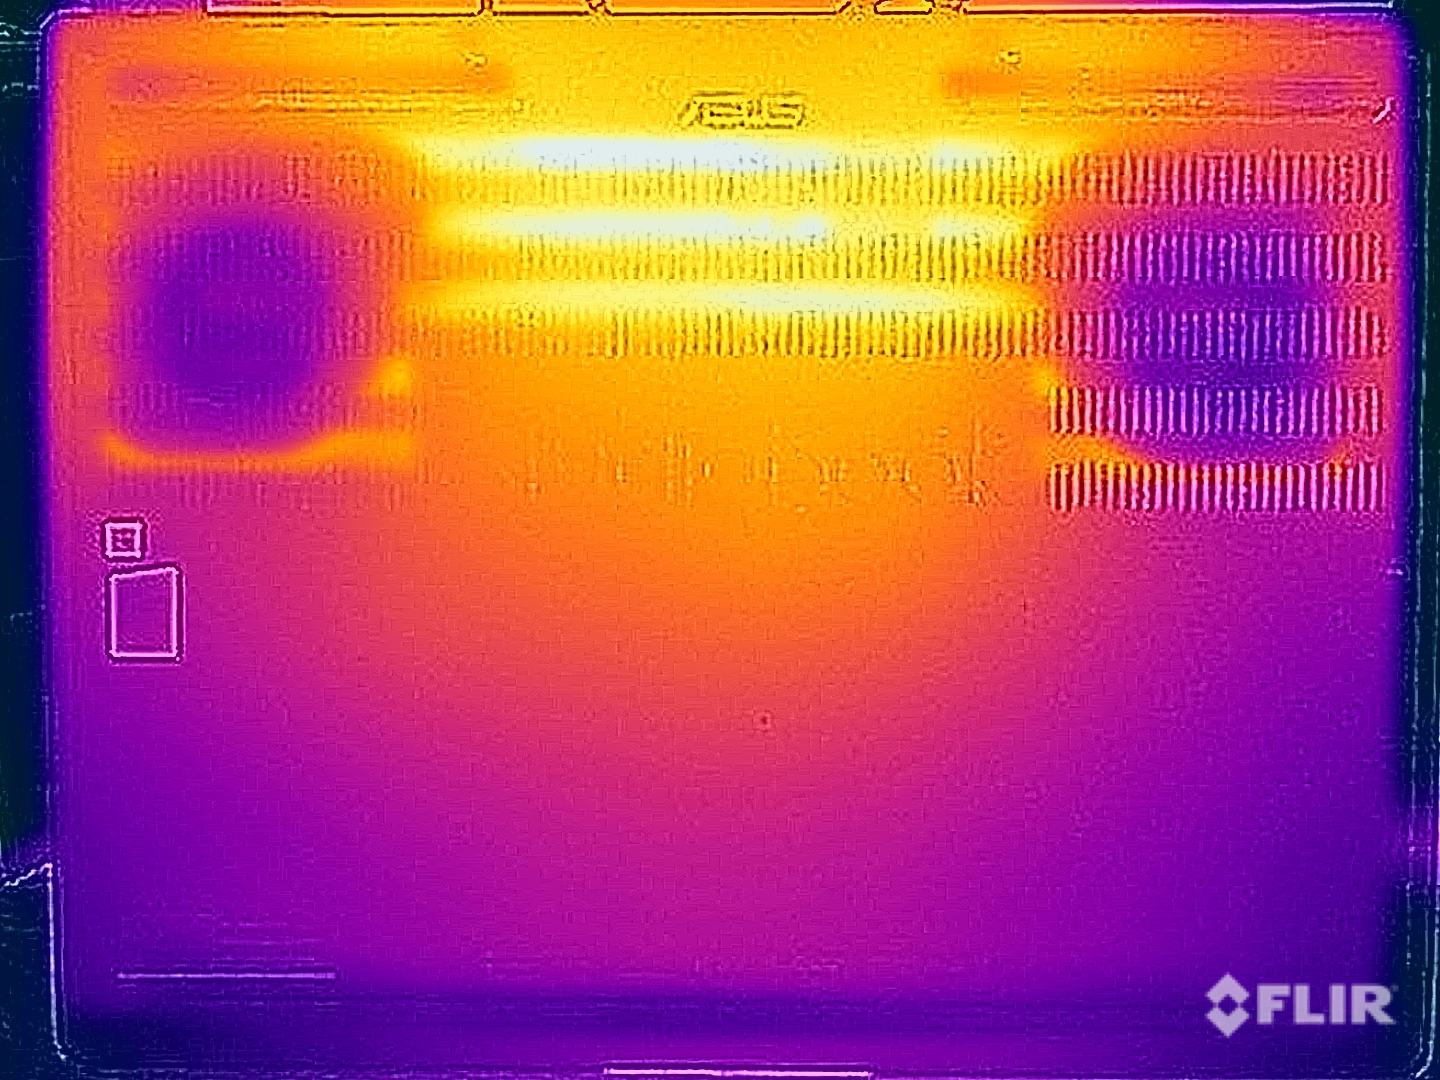
温度
表面温度总体上没有问题,但笔记本电脑的强大组件很快就能感觉到,即使在空闲状态下也是如此。由于这里的风扇没有运行,我们测得的温度超过了30℃。在负载情况下,基本单元的上侧仍然相当舒适,最高温度为45℃,打字时没有任何限制。底部一侧的中心温度最高达到48℃以下,这就是为什么理论上你可以把设备放在腿上(但考虑到其尺寸,这不太可能)。
在压力测试中,这两个组件很快趋于平缓,据此,显卡被系统优先考虑,以大约105瓦的功率工作,而处理器仍然是~55瓦的功率。在压力测试后没有直接出现性能下降。
(±) The maximum temperature on the upper side is 44.1 °C / 111 F, compared to the average of 36.8 °C / 98 F, ranging from 21 to 71 °C for the class Multimedia.
(-) The bottom heats up to a maximum of 48 °C / 118 F, compared to the average of 39.1 °C / 102 F
(+) In idle usage, the average temperature for the upper side is 31 °C / 88 F, compared to the device average of 31.3 °C / 88 F.
(±) Playing The Witcher 3, the average temperature for the upper side is 34.9 °C / 95 F, compared to the device average of 31.3 °C / 88 F.
(+) The palmrests and touchpad are reaching skin temperature as a maximum (32.3 °C / 90.1 F) and are therefore not hot.
(-) The average temperature of the palmrest area of similar devices was 28.7 °C / 83.7 F (-3.6 °C / -6.4 F).
| Asus ProArt Studiobook 16 OLED H7604 Intel Core i9-13980HX, NVIDIA GeForce RTX 4070 Laptop GPU | Gigabyte AERO 16 OLED BSF Intel Core i9-13900H, NVIDIA GeForce RTX 4070 Laptop GPU | Samsung Galaxy Book3 Ultra 16 Intel Core i7-13700H, NVIDIA GeForce RTX 4050 Laptop GPU | MSI Stealth 17 Studio A13VH-014 Intel Core i9-13900H, NVIDIA GeForce RTX 4080 Laptop GPU | Apple MacBook Pro 16 2023 M2 Max Apple M2 Max, Apple M2 Max 38-Core GPU | Asus Zephyrus Duo 16 GX650PY-NM006W AMD Ryzen 9 7945HX, NVIDIA GeForce RTX 4090 Laptop GPU | |
|---|---|---|---|---|---|---|
| Heat | 18% | 18% | -1% | 20% | 7% | |
| Maximum Upper Side * (°C) | 44.1 | 41 7% | 41 7% | 47 -7% | 44.2 -0% | 44.2 -0% |
| Maximum Bottom * (°C) | 48 | 47 2% | 44 8% | 54 -13% | 42.9 11% | 46.8 2% |
| Idle Upper Side * (°C) | 32.7 | 23 30% | 23 30% | 30 8% | 22.4 31% | 29.2 11% |
| Idle Bottom * (°C) | 34.9 | 23 34% | 26 26% | 32 8% | 22.3 36% | 30.2 13% |
* ... smaller is better
发言人
音响系统由四个扬声器组成,提供良好的音质。虽然还不足以与 MacBook Pro 16,因为它仍然缺乏一点压力,但总体上还是令人满意的。对于视频和一些背景音乐来说,性能是足够的,反正在游戏过程中,由于风扇很大,你从扬声器中听不到什么。
Asus ProArt Studiobook 16 OLED H7604 audio analysis
(+) | speakers can play relatively loud (84 dB)
Bass 100 - 315 Hz
(±) | reduced bass - on average 14.1% lower than median
(±) | linearity of bass is average (9.5% delta to prev. frequency)
Mids 400 - 2000 Hz
(+) | balanced mids - only 1.9% away from median
(+) | mids are linear (3.8% delta to prev. frequency)
Highs 2 - 16 kHz
(+) | balanced highs - only 4.2% away from median
(+) | highs are linear (3.9% delta to prev. frequency)
Overall 100 - 16.000 Hz
(+) | overall sound is linear (11.2% difference to median)
Compared to same class
» 17% of all tested devices in this class were better, 4% similar, 80% worse
» The best had a delta of 5%, average was 17%, worst was 45%
Compared to all devices tested
» 7% of all tested devices were better, 2% similar, 91% worse
» The best had a delta of 4%, average was 23%, worst was 134%
Apple MacBook Pro 16 2023 M2 Max audio analysis
(+) | speakers can play relatively loud (86.1 dB)
Bass 100 - 315 Hz
(+) | good bass - only 3.9% away from median
(+) | bass is linear (5.7% delta to prev. frequency)
Mids 400 - 2000 Hz
(+) | balanced mids - only 1.2% away from median
(+) | mids are linear (1.5% delta to prev. frequency)
Highs 2 - 16 kHz
(+) | balanced highs - only 2.5% away from median
(+) | highs are linear (1.7% delta to prev. frequency)
Overall 100 - 16.000 Hz
(+) | overall sound is linear (4.9% difference to median)
Compared to same class
» 0% of all tested devices in this class were better, 0% similar, 99% worse
» The best had a delta of 5%, average was 17%, worst was 45%
Compared to all devices tested
» 0% of all tested devices were better, 0% similar, 100% worse
» The best had a delta of 4%, average was 23%, worst was 134%
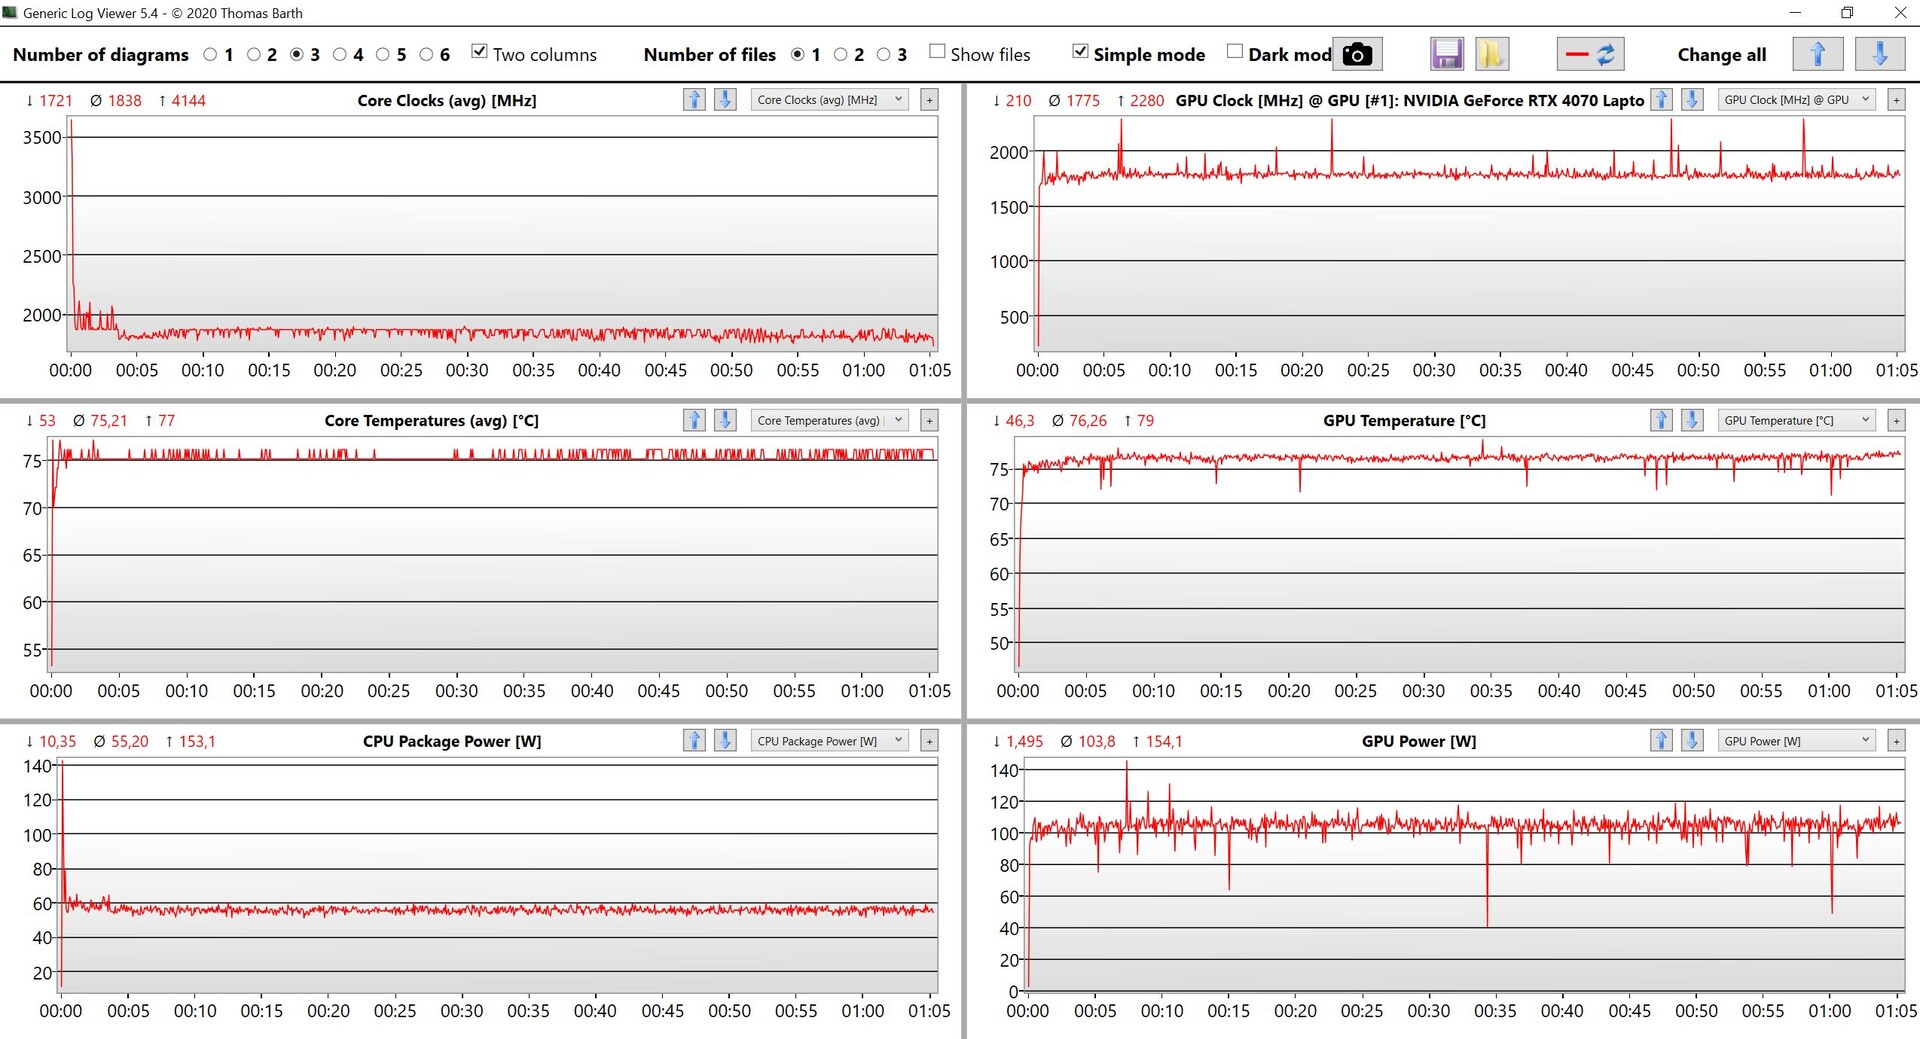
电源管理 - 电池寿命短的StudioBook
消耗功率
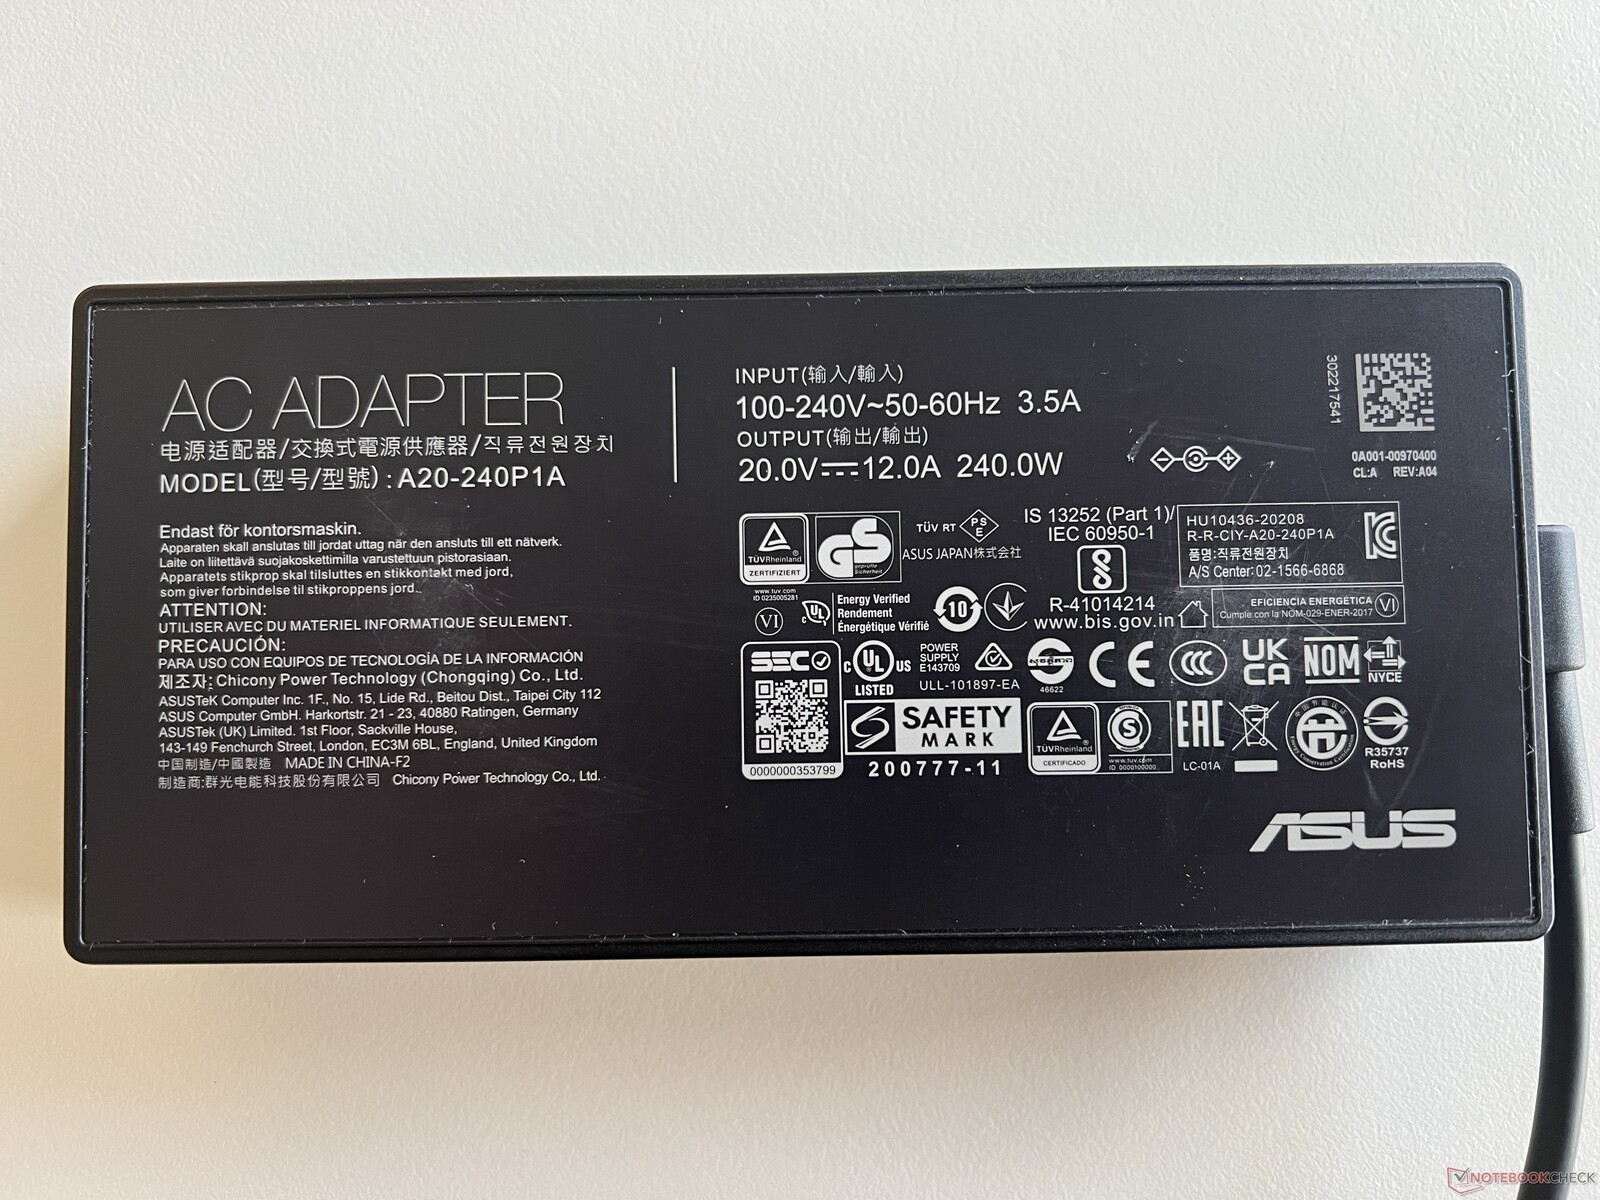
由于大型OLED面板和HX处理器的单独使用,Studiobook 16的效率不是特别好。我们测量了空闲时的功率为12-21瓦,这取决于亮度,尽管在HDR模式下偶尔会达到36瓦。在负载情况下,没有任何惊喜:在游戏过程中上升到200瓦左右,在压力测试中最初的247瓦之后,平息在210瓦左右。因此,附带的240瓦电源的尺寸是足够的。
| Off / Standby | |
| Idle | |
| Load |
|
Key:
min: | |
| Asus ProArt Studiobook 16 OLED H7604 i9-13980HX, GeForce RTX 4070 Laptop GPU, Phison EM2804TBMTCB47, OLED, 3200x2000, 16" | Gigabyte AERO 16 OLED BSF i9-13900H, GeForce RTX 4070 Laptop GPU, Gigabyte AG470S1TB-SI B10, OLED, 3840x2400, 16" | Samsung Galaxy Book3 Ultra 16 i7-13700H, GeForce RTX 4050 Laptop GPU, Samsung PM9A1 MZVL2512HCJQ, AMOLED, 2880x1800, 16" | MSI Stealth 17 Studio A13VH-014 i9-13900H, GeForce RTX 4080 Laptop GPU, Samsung PM9A1 MZVL22T0HBLB, Mini LED, 3840x2160, 17.3" | Apple MacBook Pro 16 2023 M2 Max M2 Max, M2 Max 38-Core GPU, Apple SSD AP2048Z, Mini-LED, 3456x2234, 16.2" | Asus Zephyrus Duo 16 GX650PY-NM006W R9 7945HX, GeForce RTX 4090 Laptop GPU, SK hynix PC801 HFS002TEJ9X101N, MiniLED, 2560x1600, 16" | Average NVIDIA GeForce RTX 4070 Laptop GPU | Average of class Multimedia | |
|---|---|---|---|---|---|---|---|---|
| Power Consumption | 18% | 61% | 10% | 34% | -35% | 4% | 49% | |
| Idle Minimum * (Watt) | 12.8 | 11.8 8% | 3 77% | 13.9 -9% | 5.2 59% | 19.2 -50% | 13.2 ? -3% | 5.66 ? 56% |
| Idle Average * (Watt) | 19.9 | 16.1 19% | 5 75% | 20 -1% | 16.5 17% | 29.7 -49% | 18.2 ? 9% | 10.2 ? 49% |
| Idle Maximum * (Watt) | 20.3 | 17 16% | 11 46% | 20.6 -1% | 16.8 17% | 30.8 -52% | 24.6 ? -21% | 12.5 ? 38% |
| Load Average * (Watt) | 131.4 | 100.6 23% | 72 45% | 77 41% | 113 14% | 126 4% | 97 ? 26% | 65.2 ? 50% |
| Witcher 3 ultra * (Watt) | 196.5 | 158 20% | 69.7 65% | 162 18% | 92 53% | 258 -31% | ||
| Load Maximum * (Watt) | 246.8 | 192 22% | 108 56% | 216 12% | 145 41% | 330 -34% | 221 ? 10% | 113.5 ? 54% |
* ... smaller is better
Power consumption Witcher 3 / Stress test
Power consumption with an external monitor
电池寿命
从消耗率来看,尽管有90Wh的电池,但电池寿命不是特别好,这一点也不奇怪。默认情况下,一旦你拔掉插头,笔记本就会切换到60Hz模式。尽管如此,我们在150cd/m²的WLAN测试中只记录了5.5小时(120Hz:5小时),在全亮度下大约4.5小时(120Hz:~3.5小时)。视频测试仅运行了不到6小时。全亮度下的HDR视频在~2:40小时后耗尽了电池,尽管性能降低,但在负载下约为1小时。
| Asus ProArt Studiobook 16 OLED H7604 i9-13980HX, GeForce RTX 4070 Laptop GPU, 90 Wh | Gigabyte AERO 16 OLED BSF i9-13900H, GeForce RTX 4070 Laptop GPU, 88 Wh | Samsung Galaxy Book3 Ultra 16 i7-13700H, GeForce RTX 4050 Laptop GPU, 76 Wh | MSI Stealth 17 Studio A13VH-014 i9-13900H, GeForce RTX 4080 Laptop GPU, 99 Wh | Apple MacBook Pro 16 2023 M2 Max M2 Max, M2 Max 38-Core GPU, 99.6 Wh | Asus Zephyrus Duo 16 GX650PY-NM006W R9 7945HX, GeForce RTX 4090 Laptop GPU, 90 Wh | Average of class Multimedia | |
|---|---|---|---|---|---|---|---|
| Battery runtime | 49% | 86% | 13% | 125% | -25% | 118% | |
| H.264 (h) | 6 | 7.4 23% | 13.4 123% | 5.6 -7% | 18.7 212% | 3.8 -37% | 17.1 ? 185% |
| WiFi v1.3 (h) | 5.6 | 7.5 34% | 9.6 71% | 5.6 0% | 14.8 164% | 4 -29% | 12.2 ? 118% |
| Load (h) | 1.1 | 2.1 91% | 1.8 64% | 1.6 45% | 1.1 0% | 1 -9% | 1.664 ? 51% |
| Witcher 3 ultra (h) | 2.6 |
Pros
Cons
结论 - Studiobook 16在细节方面存在弱点
新的2023 ProArt Studiobook 16 OLED提供了很多性能,总体来说是一款适合创意用户的笔记本电脑,尽管在细节上有一些弱点。首先是 酷睿i9-13980HX作为英特尔最快的移动处理器,提供了大量的CPU能力,但仍然落后于 AMD Ryzen 9 7945HX在多核性能和效率方面仍然落后。相比之下 酷睿i9-12900H另一方面,它提供了相当多的性能。然而,这并不适用于显卡,因为 RTX 4070 笔记本电脑只比 RTX 3070 Ti,所以在这里升级并不真正值得。其他批评点包括传统的冷却方式,特别是风扇的噪音,因为设备很快就会变得很吵。至少温度保持在限制范围内。
OLED显示屏已经从60赫兹的4K面板变为120赫兹的触摸屏,分辨率略低。从根本上说,画质非常好,但像华硕的其他OLED触摸屏一样,明亮的地方出现轻微的颗粒感。还有轻微的颜色偏差,我们无法通过自己的校准来纠正。OLED屏幕也对电池寿命产生了负面影响。针对PWM闪烁的软件功能很好,但每次都必须通过软件进行调整,这很麻烦。
功率大,但风扇也很吵:ProArt Studiobook 16无疑是一个快速的设备,DialPad可能为创意用户增加价值。然而,120赫兹的OLED并不完全令人信服。
除了触摸屏,Studiobook 16再次提供了额外的DialPad,它与Adobe应用程序配合得特别好,在这里也能提供附加价值。HDR功能仍然有限,但这是由于Windows的原因。HDR必须手动激活,然后颜色配置文件不再可用。此外,在最大亮度方面,迷你LED面板有优势。虽然 MacBook Pro 16提供的CPU性能明显较低(至少在主电源操作中),但它仍然是创意用户的一个非常好的选择,并在日常使用中提供明显更长的电池寿命。ROG Zephyrus 16提供的性能甚至更多。 ROG Zephyrus Duo 16它被列为游戏机,但由于有第二个显示屏,对内容创作者来说也很有趣。
价格和可用性
华硕ProArt Studiobook 16 OLED(英特尔酷睿i9-13980HX处理器,Nvidia Geforce RTX 4070 GPU,32GB DDR5 SO-DIMM内存,1TB SSD)的一个变体通过美国亚马逊出售,价格为2499,99美元。
价格截至29.06.23,可能会有变化。
Asus ProArt Studiobook 16 OLED H7604
- 06/27/2023 v7 (old)
Andreas Osthoff
Transparency
The selection of devices to be reviewed is made by our editorial team. The test sample was provided to the author as a loan by the manufacturer or retailer for the purpose of this review. The lender had no influence on this review, nor did the manufacturer receive a copy of this review before publication. There was no obligation to publish this review. As an independent media company, Notebookcheck is not subjected to the authority of manufacturers, retailers or publishers.
This is how Notebookcheck is testing
Every year, Notebookcheck independently reviews hundreds of laptops and smartphones using standardized procedures to ensure that all results are comparable. We have continuously developed our test methods for around 20 years and set industry standards in the process. In our test labs, high-quality measuring equipment is utilized by experienced technicians and editors. These tests involve a multi-stage validation process. Our complex rating system is based on hundreds of well-founded measurements and benchmarks, which maintains objectivity. Further information on our test methods can be found here.
Price comparison

