联想Legion Slim 7i 16 8代笔记本电脑评论:比Razer Blade 16更薄

联想Legion Slim 7i Gen 8取代了去年的 Legion 瘦身7i第7代采用较新的第13代Raptor Lake-H CPU,Nvidia Ada Lovelace GPU,并修改了机箱设计。它补充了更厚、更强大的 Legion Pro 7系列.
我们的评测单位是一个更高端的配置,配备酷睿i9-13900H,140WGeForce RTX 4070 GPU,以及2560 x 1600 240 Hz IPS显示屏,零售价约1600美元。其他SKU有较小的Core i7-13700H,RTX 4060,或更高分辨率的3200 x 2000 165 Hz显示屏,起价约为1500美元。
Legion Slim 7i G8的竞争者包括其他轻薄的16英寸游戏笔记本电脑,如 Razer Blade 16, HP Omen 16, 华硕ROG Zephyrus M16,或 外星人x16 R1.
更多联想评论:
潜在的竞争对手比较
Rating | Date | Model | Weight | Height | Size | Resolution | Price |
|---|---|---|---|---|---|---|---|
| 90 % v7 (old) | 07 / 2023 | Lenovo Legion Slim 7i 16 Gen 8 i9-13900H, GeForce RTX 4070 Laptop GPU | 2.1 kg | 19.9 mm | 16.00" | 2560x1600 | |
| 87.4 % v7 (old) | 07 / 2023 | HP Omen 16-wf000 i7-13700HX, GeForce RTX 4080 Laptop GPU | 2.4 kg | 23.6 mm | 16.10" | 2560x1440 | |
| 88.4 % v7 (old) | 06 / 2023 | Alienware x16 R1 i9-13900HK, GeForce RTX 4080 Laptop GPU | 2.6 kg | 18.57 mm | 16.00" | 2560x1600 | |
| 88.8 % v7 (old) | 06 / 2023 | Lenovo Legion Pro 7 RTX4090 i9-13900HX, GeForce RTX 4090 Laptop GPU | 2.7 kg | 26 mm | 16.00" | 2560x1600 | |
| 88.4 % v7 (old) | 03 / 2023 | Asus ROG Strix G16 G614JZ i9-13980HX, GeForce RTX 4080 Laptop GPU | 2.4 kg | 30.4 mm | 16.00" | 2560x1600 | |
| 91.2 % v7 (old) | 02 / 2023 | Razer Blade 16 Early 2023 i9-13950HX, GeForce RTX 4080 Laptop GPU | 2.4 kg | 21.99 mm | 16.00" | 2560x1600 |
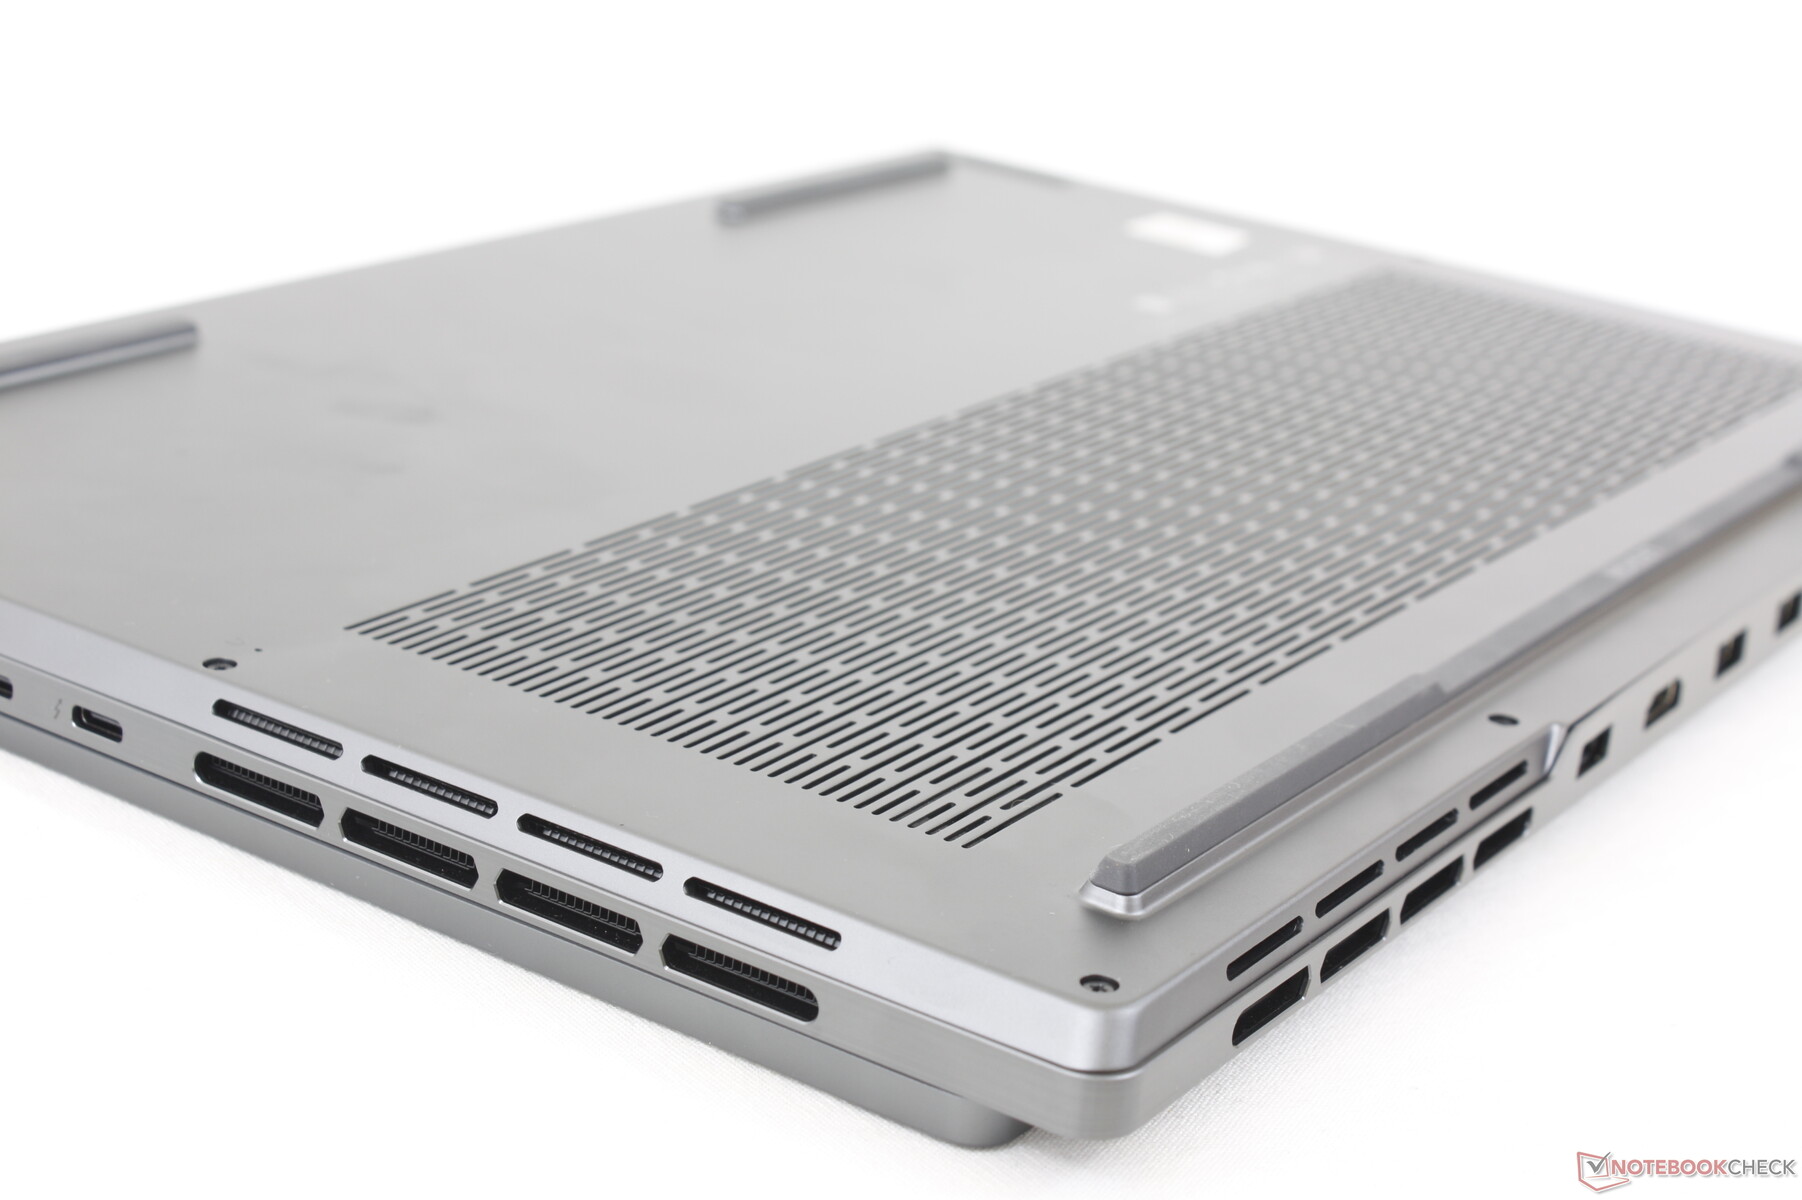
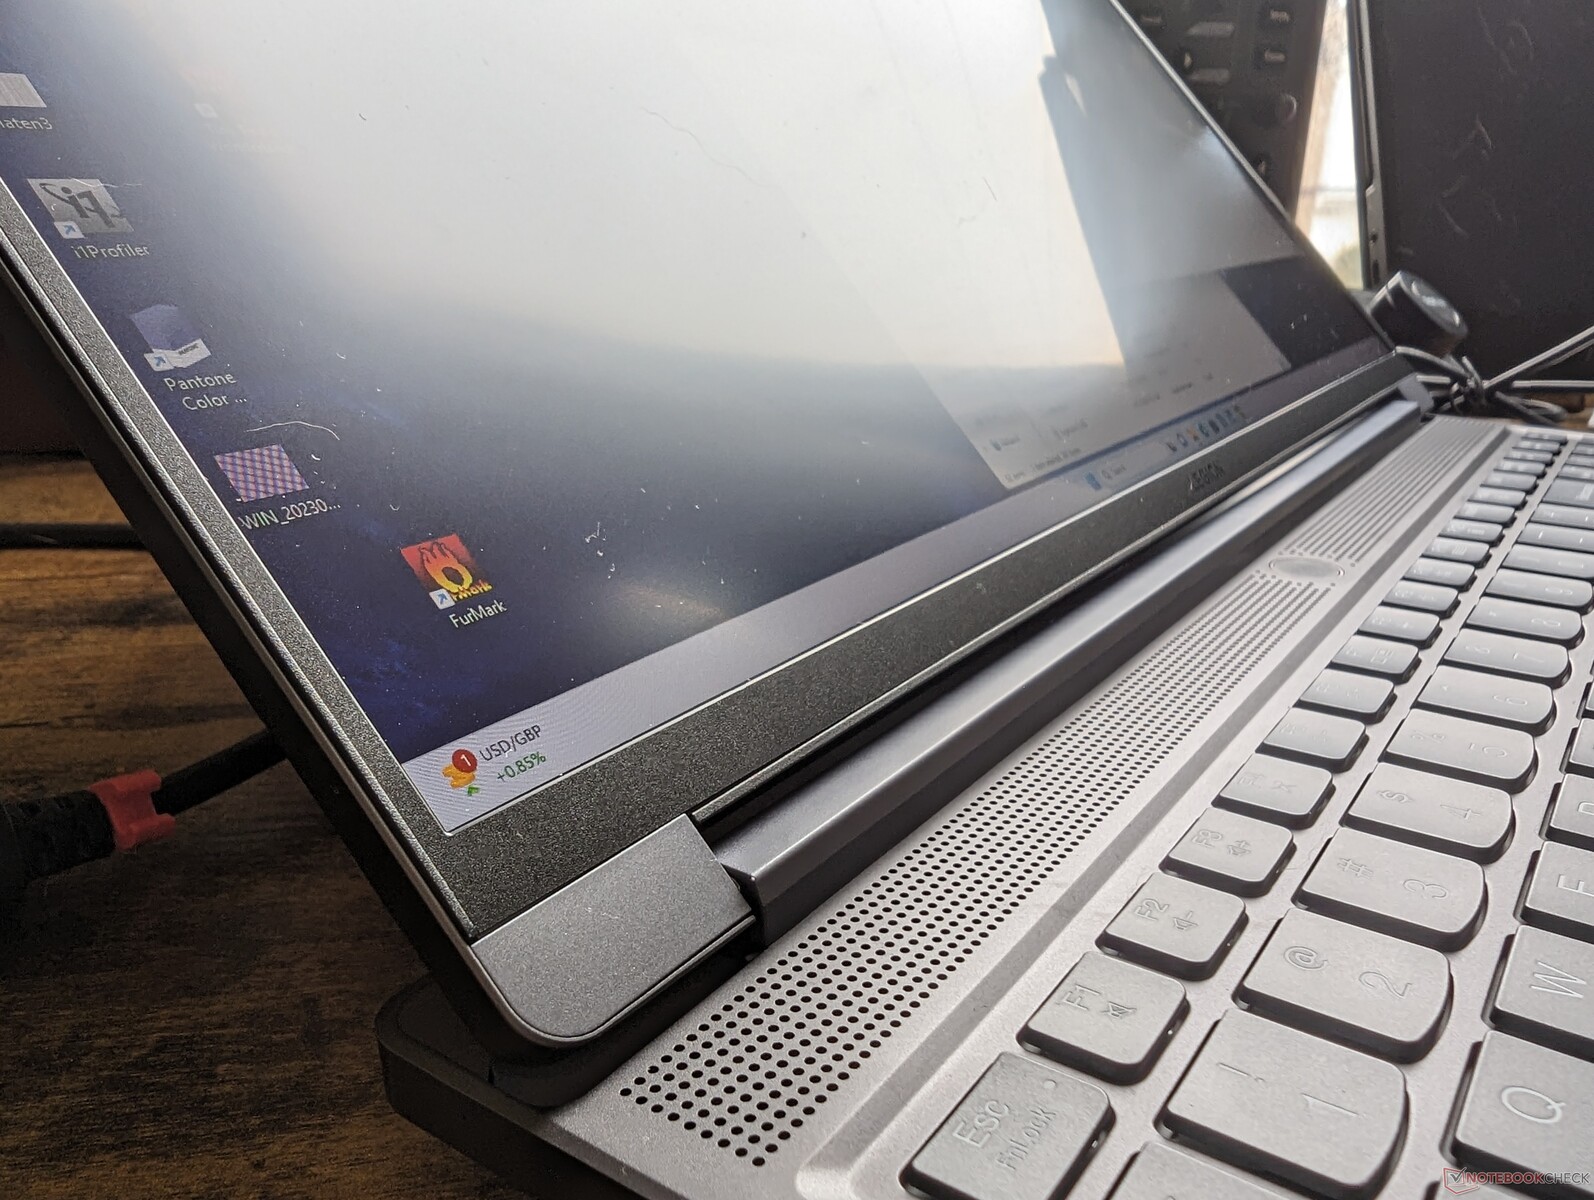
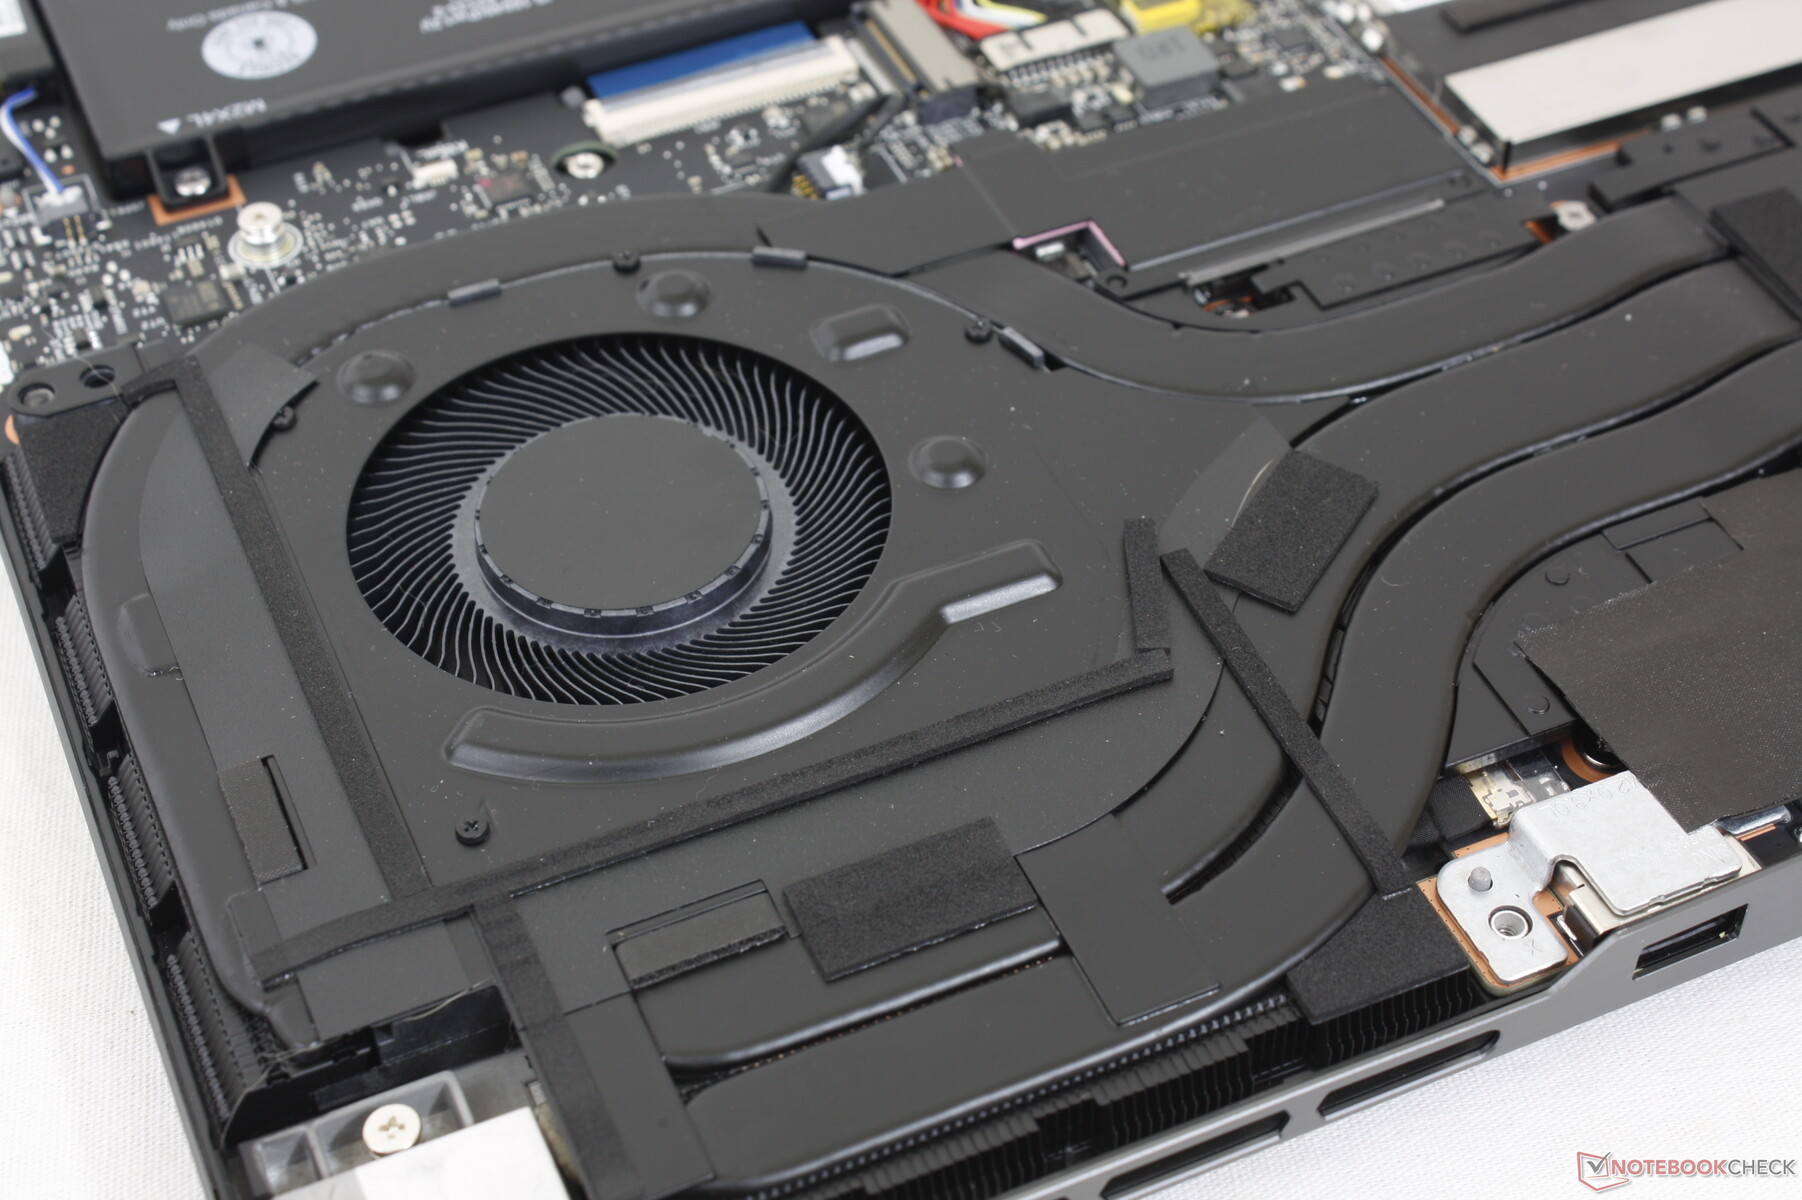
案例 - 现在有了更多的通风栅栏
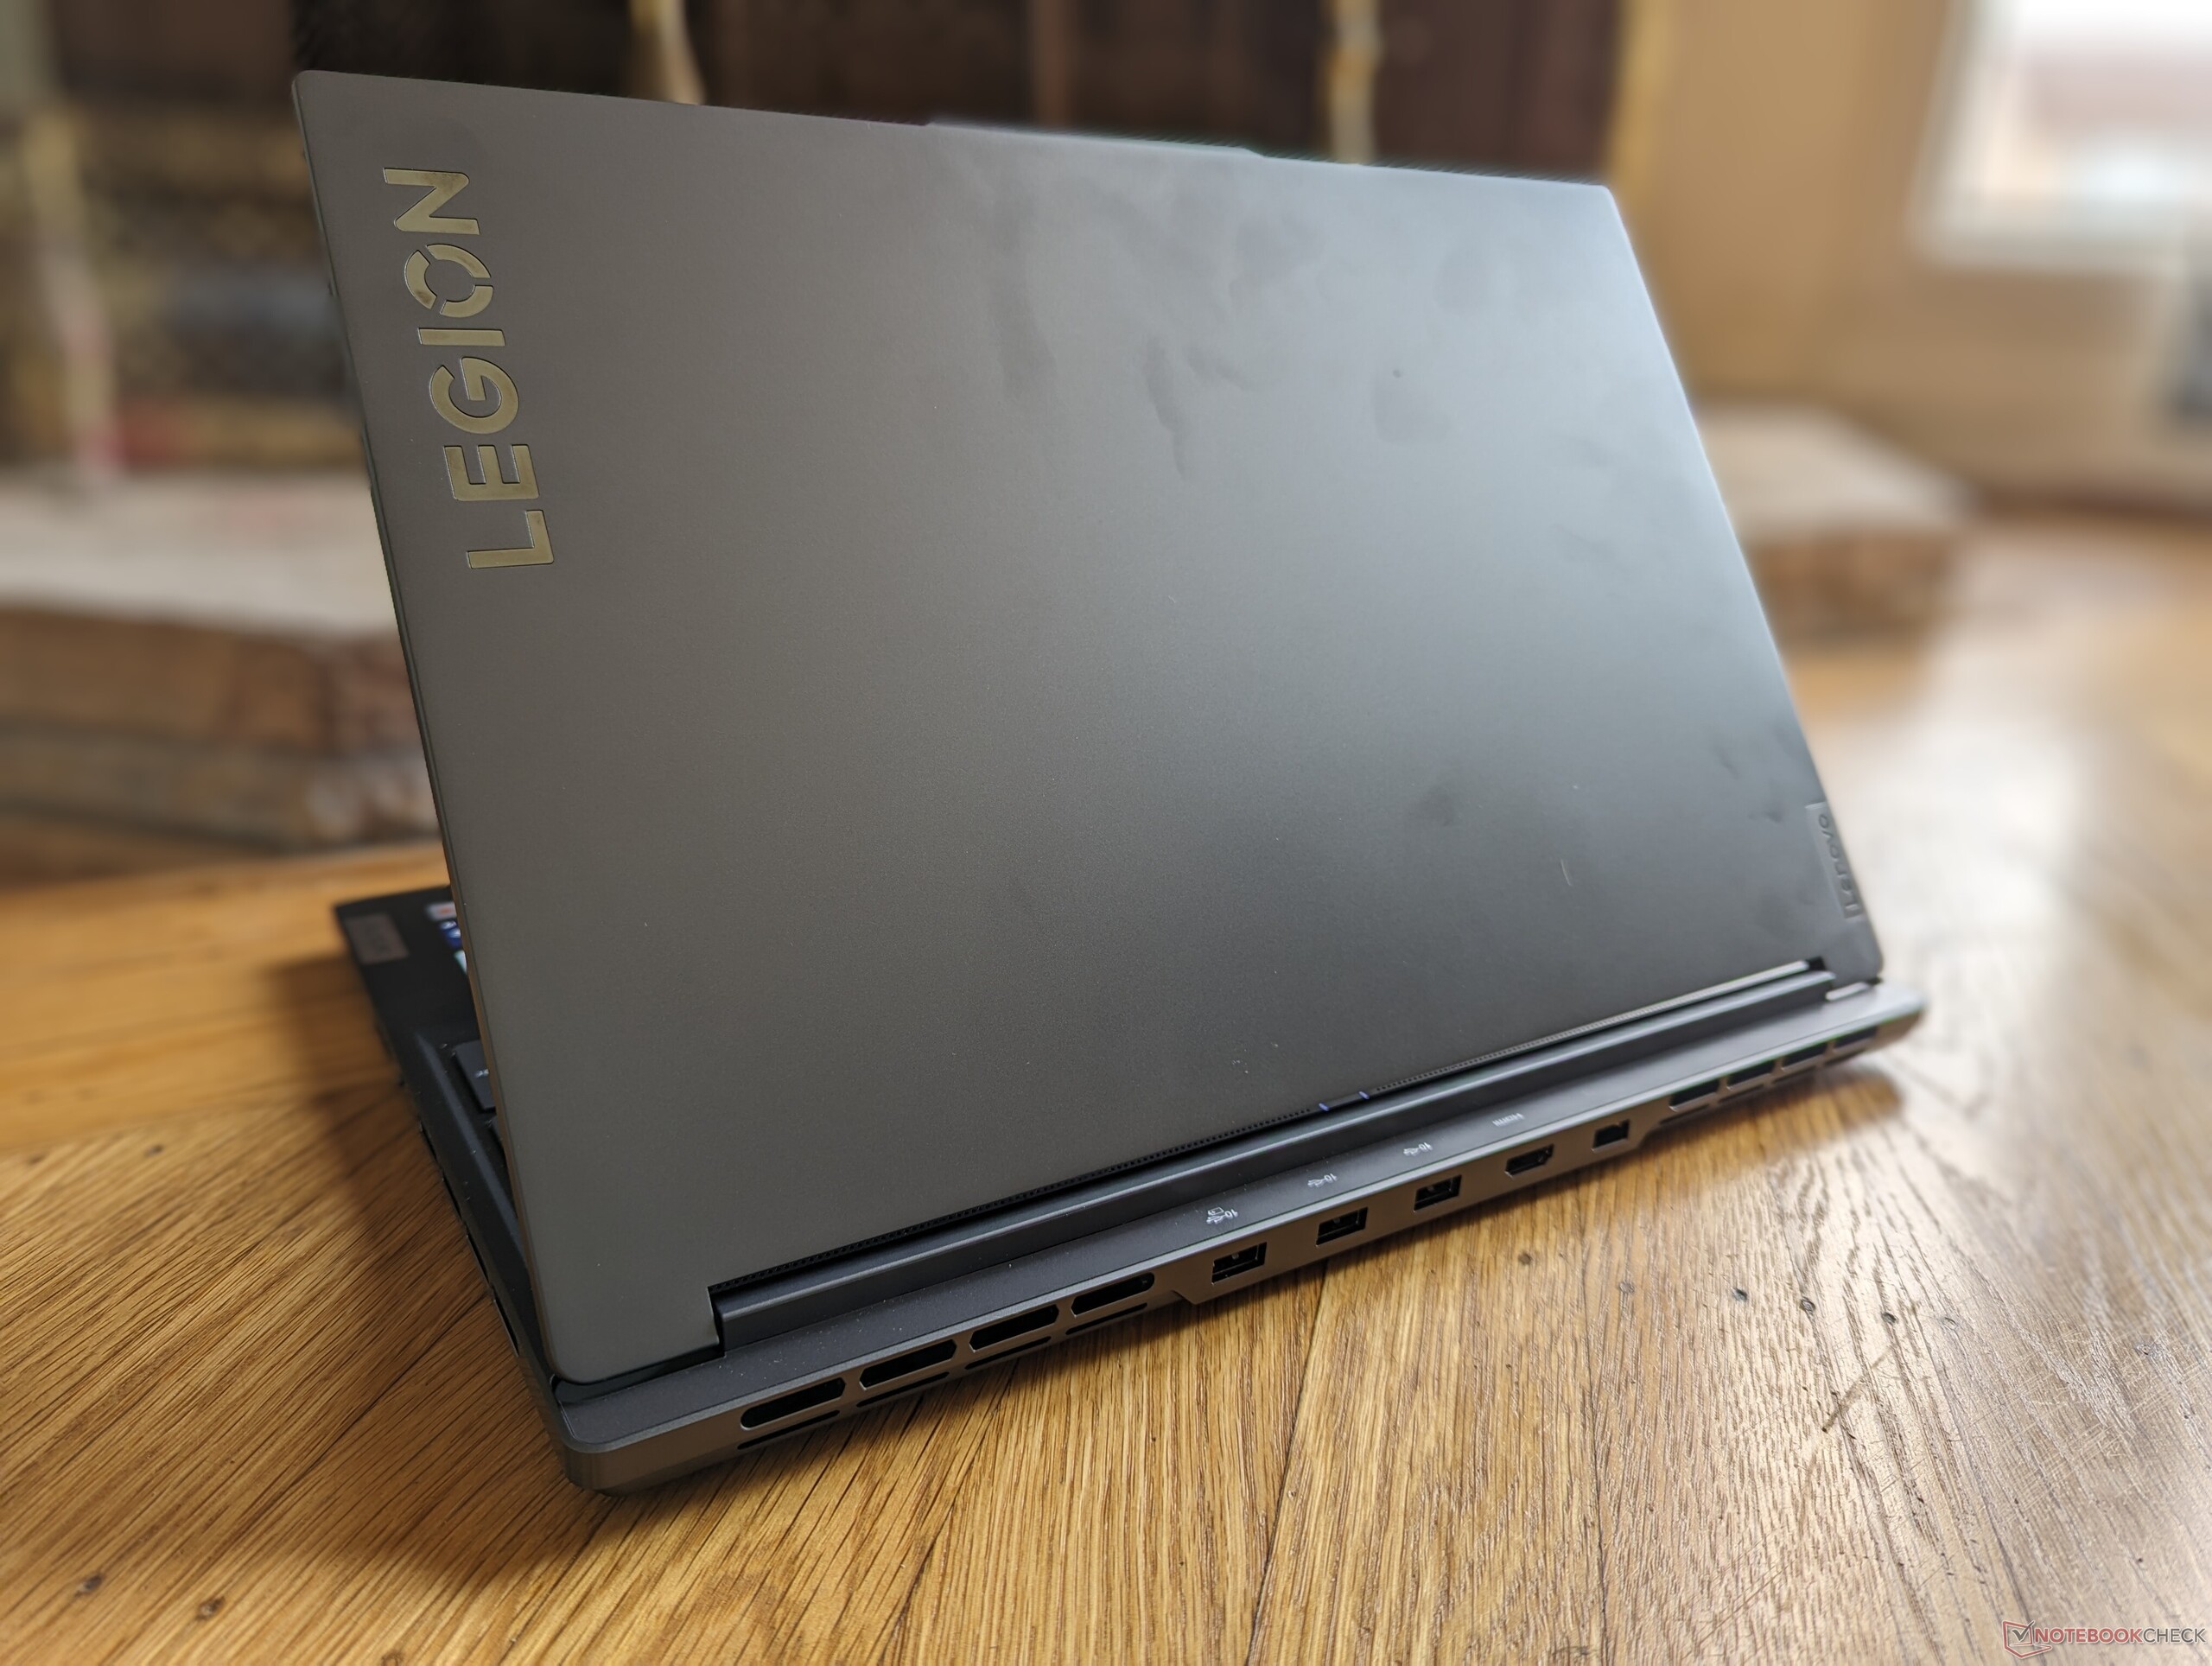
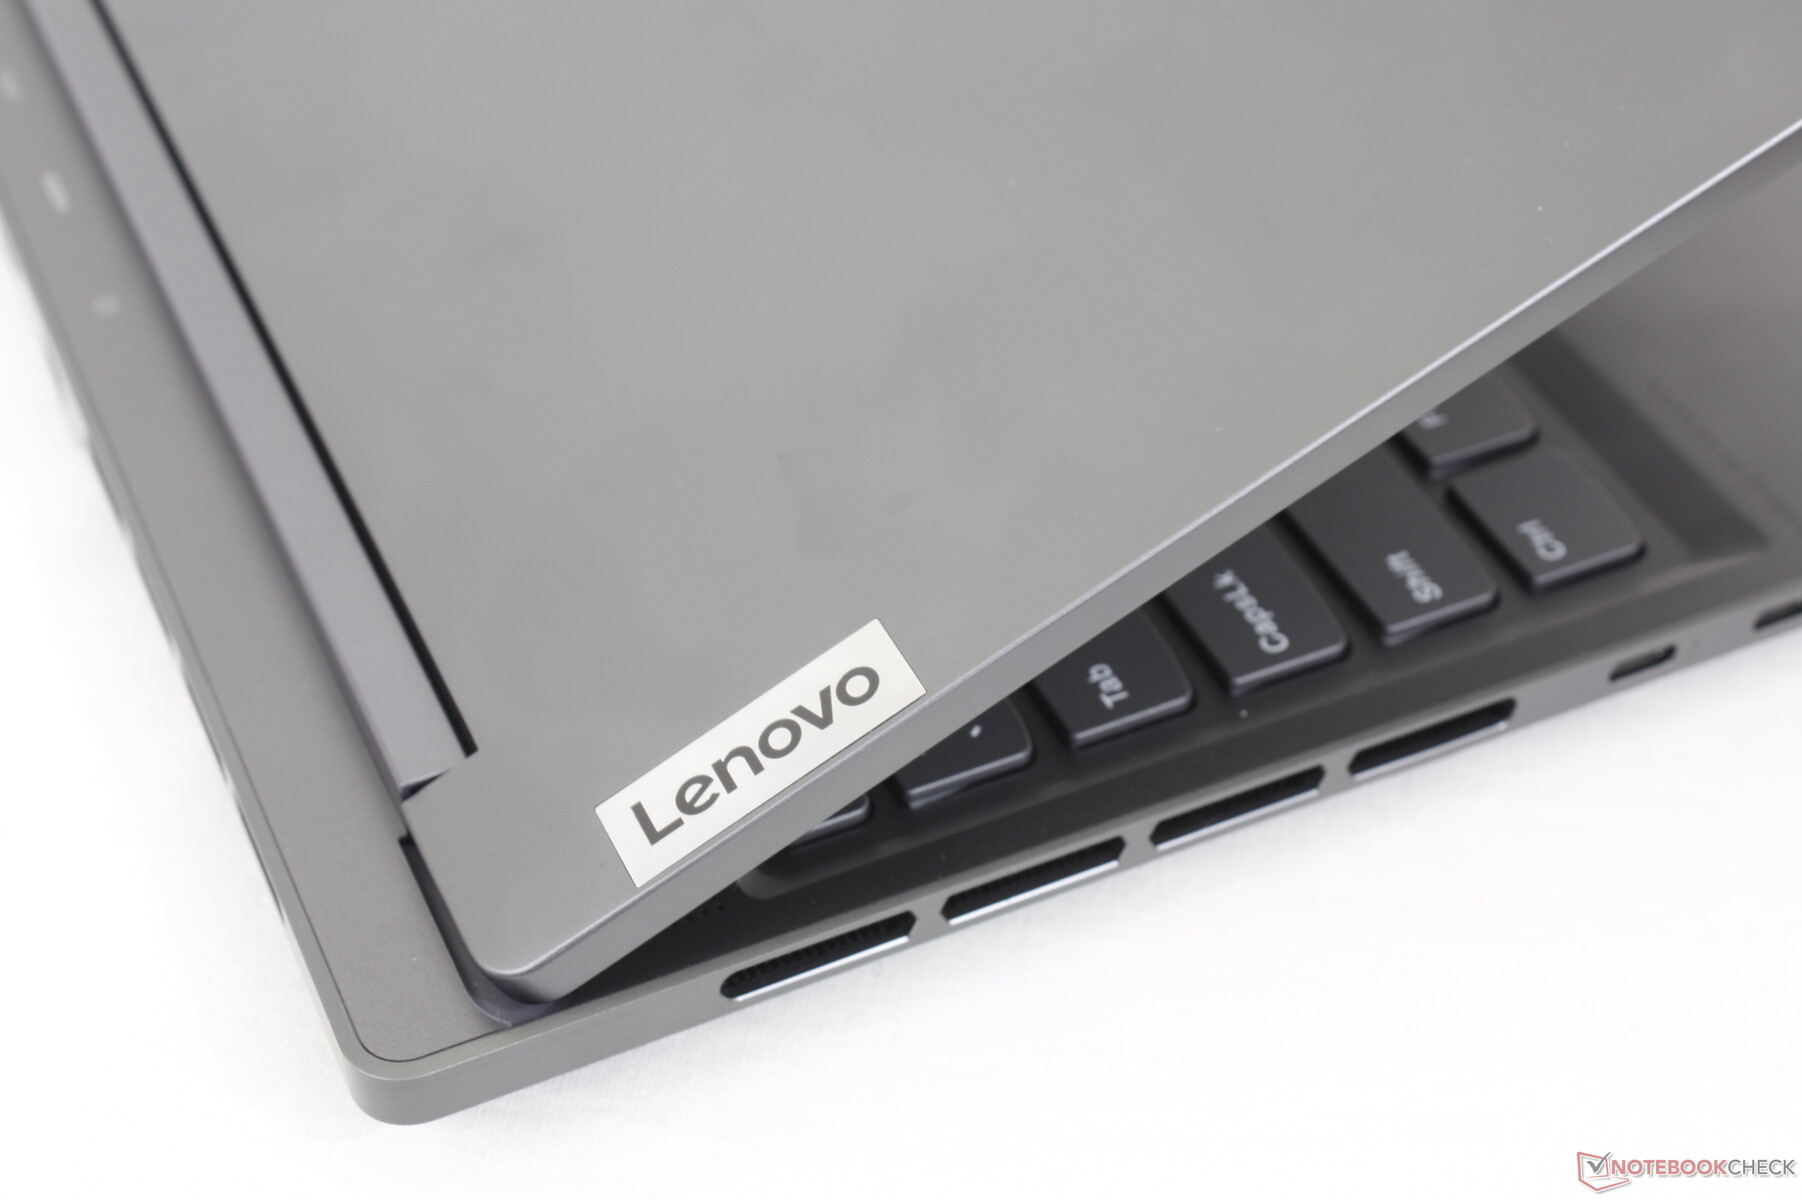
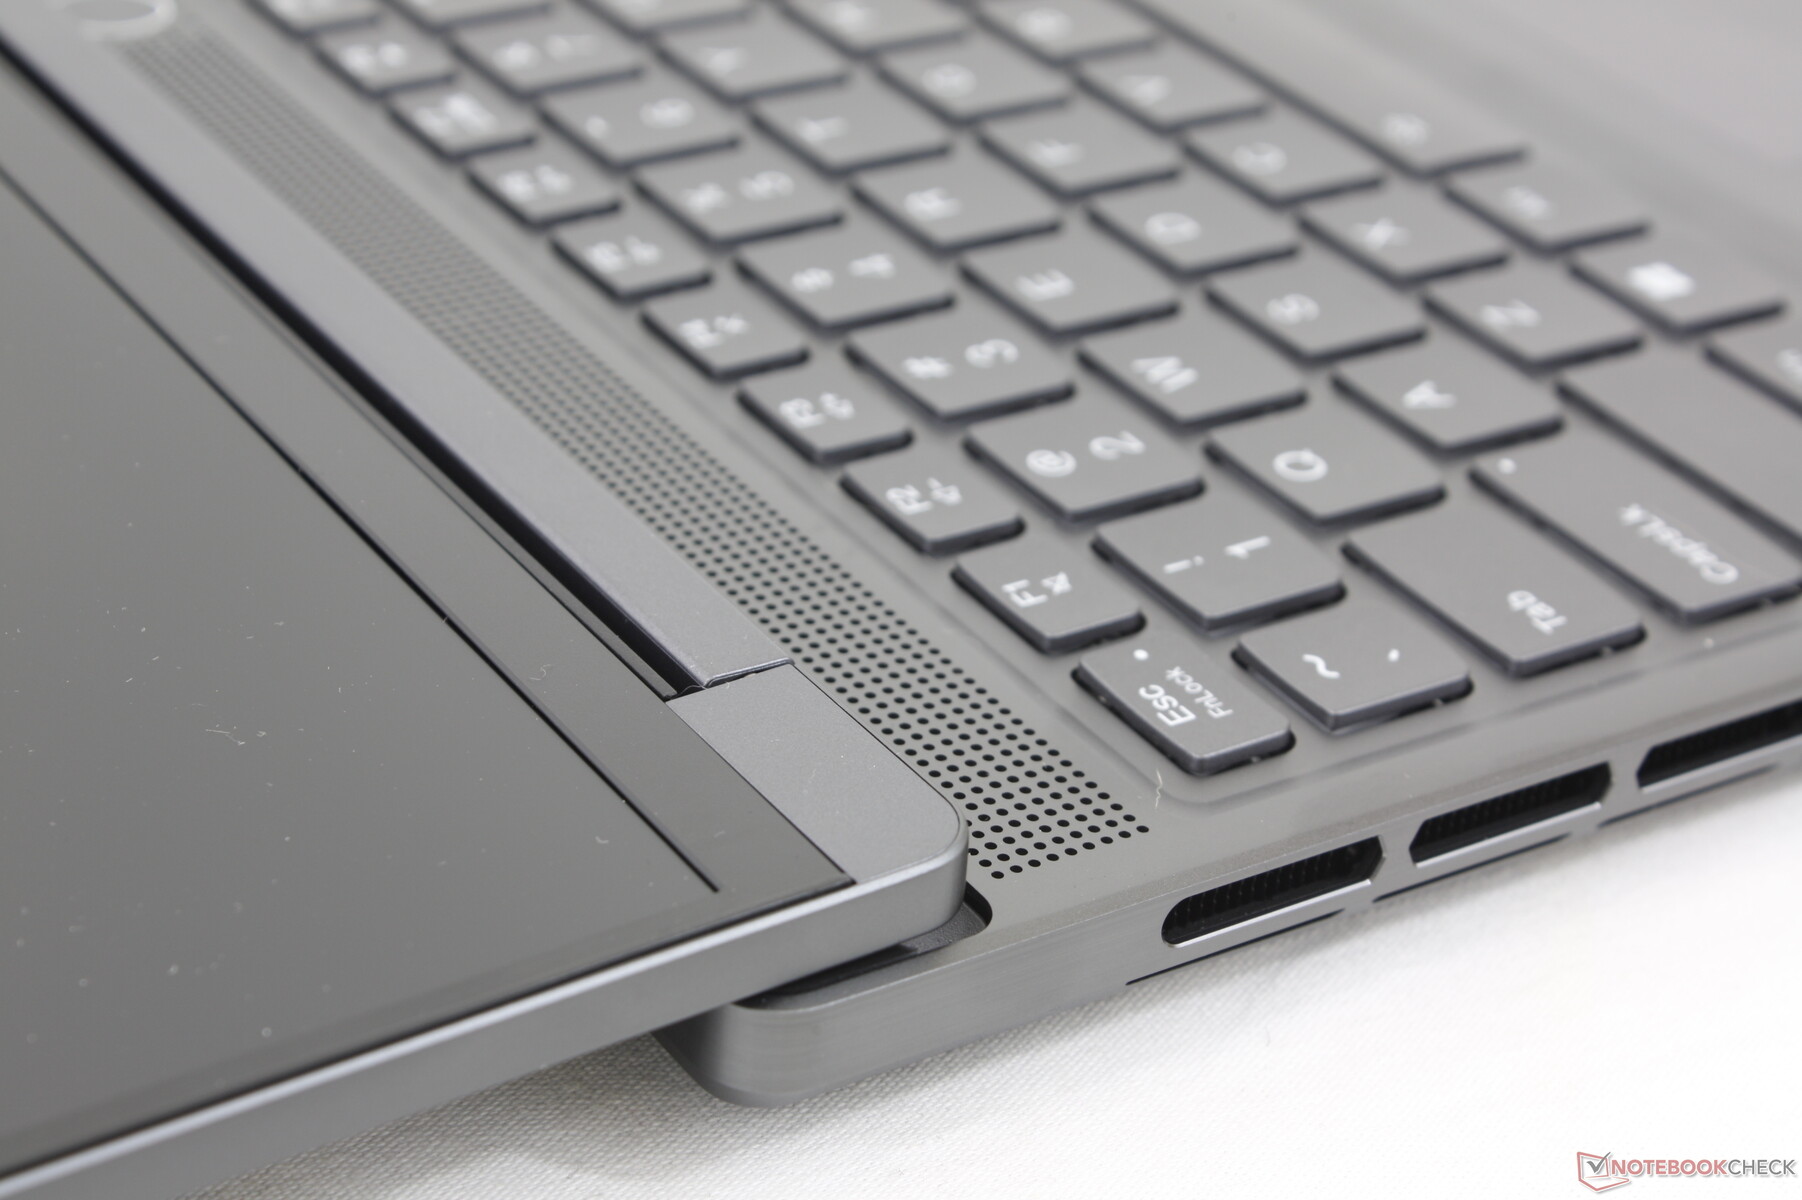
从正面看,该机箱可能与去年的Legion Slim 7i 16 G7相似,但大部分外部变化是沿着背部和底部两侧。例如,后部边缘现在是平的,看起来更干净,而这次的通风格栅明显更大,以改善散热。
底座材料在其他方面与其他Legion 7机型上看到的灰铝表面和感觉一样。尽管外形很薄,但底座仍然很坚硬,盖子也相对牢固。小铰链并不像华硕ROG Strix G16上的大铰链那样牢固。 华硕ROG Strix G16但它们允许一个完整的180度的开放,这在游戏笔记本上是不常见的。
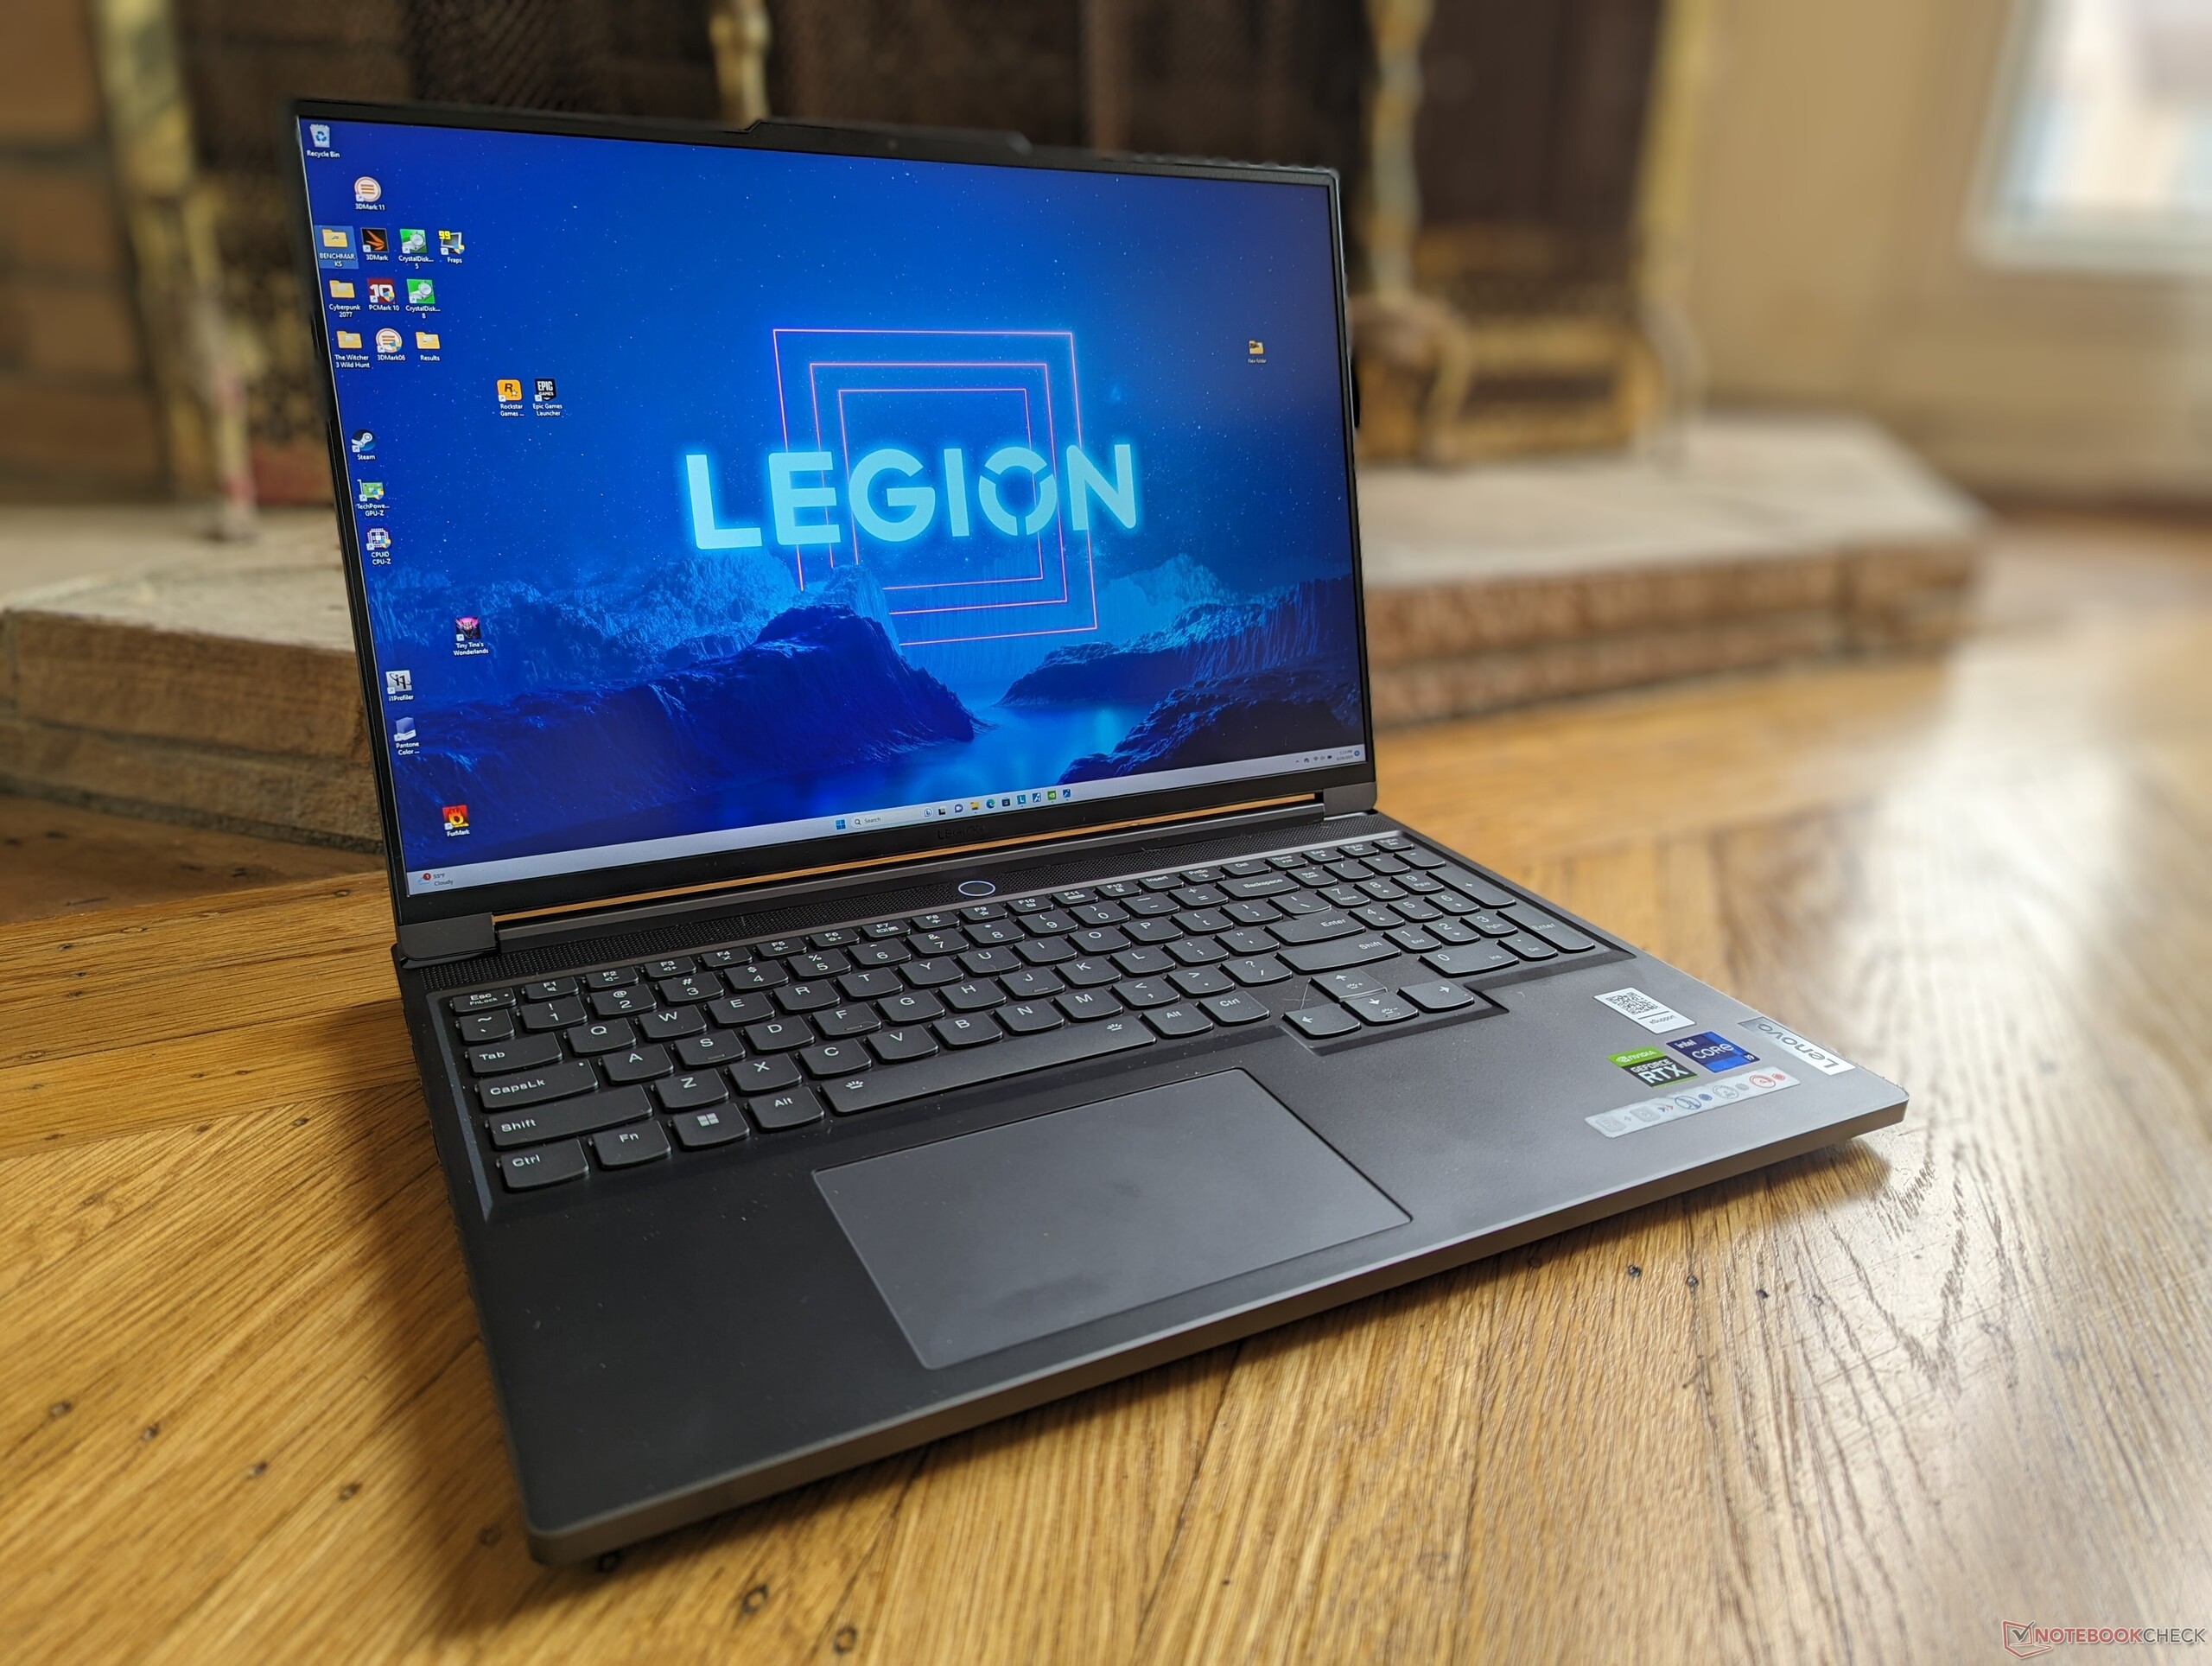
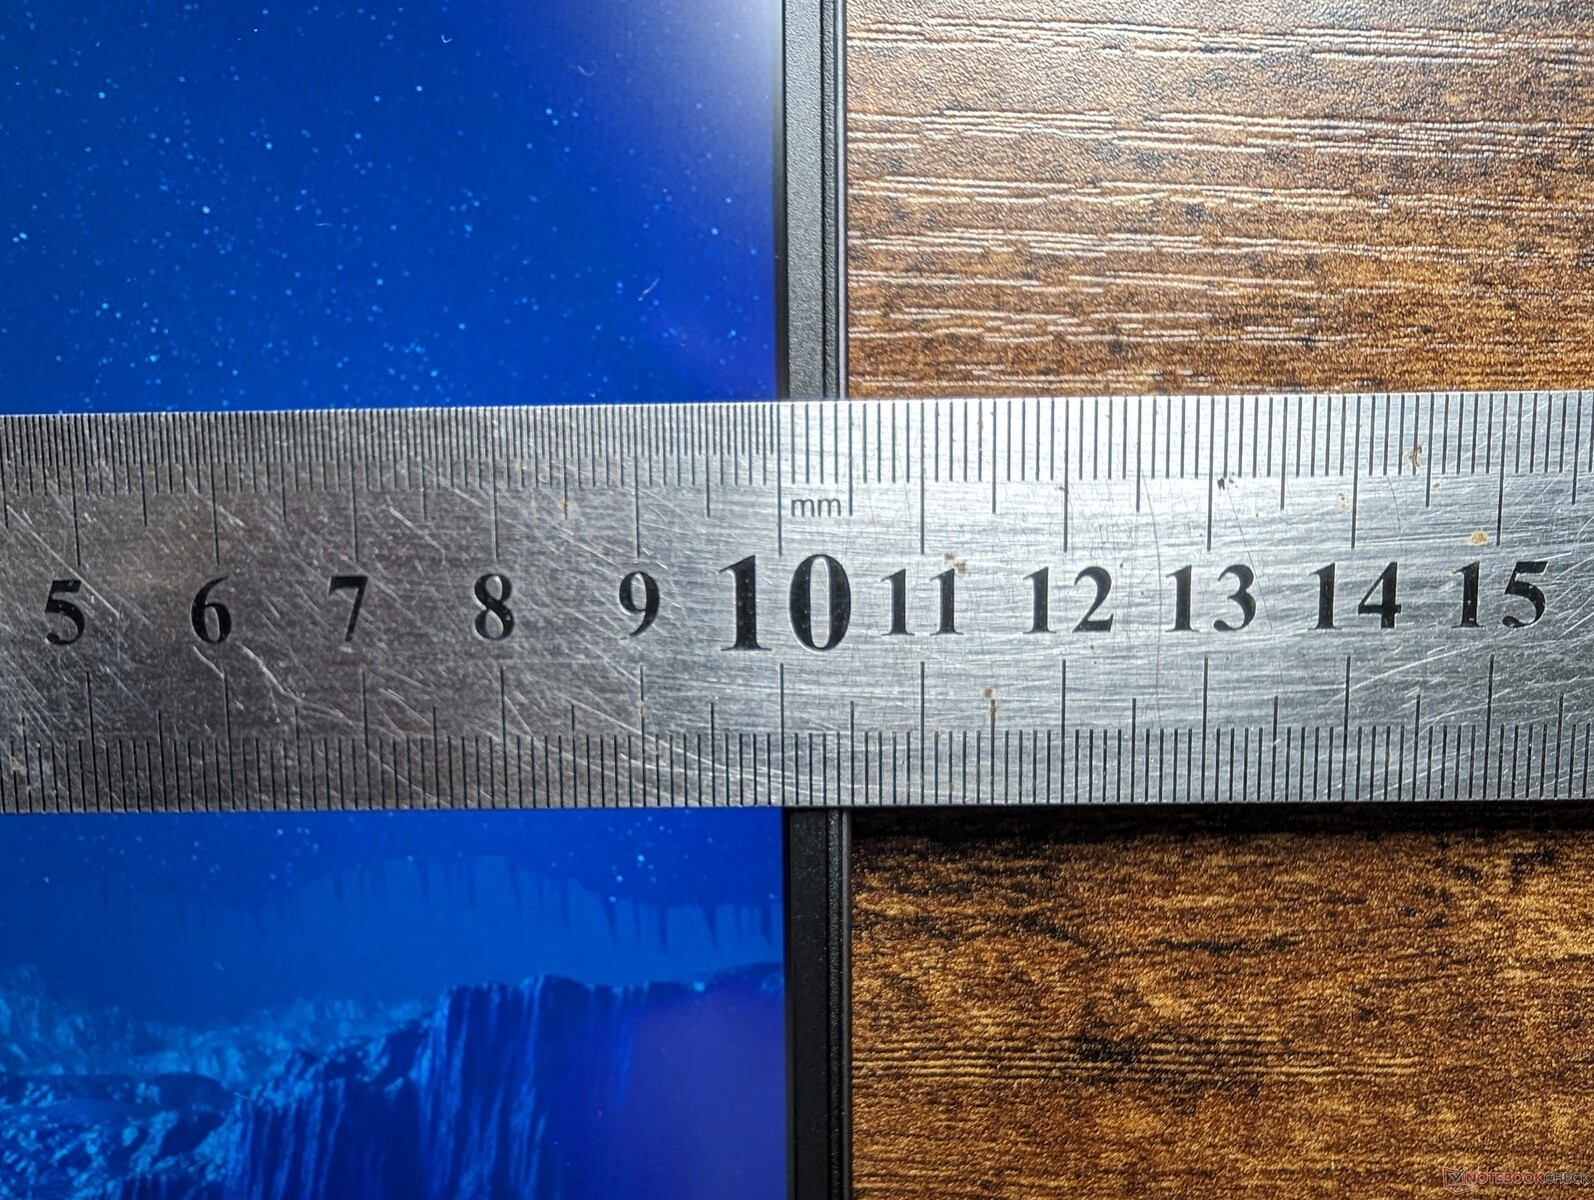
联想将其称为Legion Slim 7不是没有道理的。与Legion Pro 7相比,我们的超薄版明显轻了600克,明显薄了6毫米以上。事实上,Legion Slim 7是最薄和最轻的16英寸游戏笔记本电脑之一,仅次于稍薄和更轻的 微星GS66.
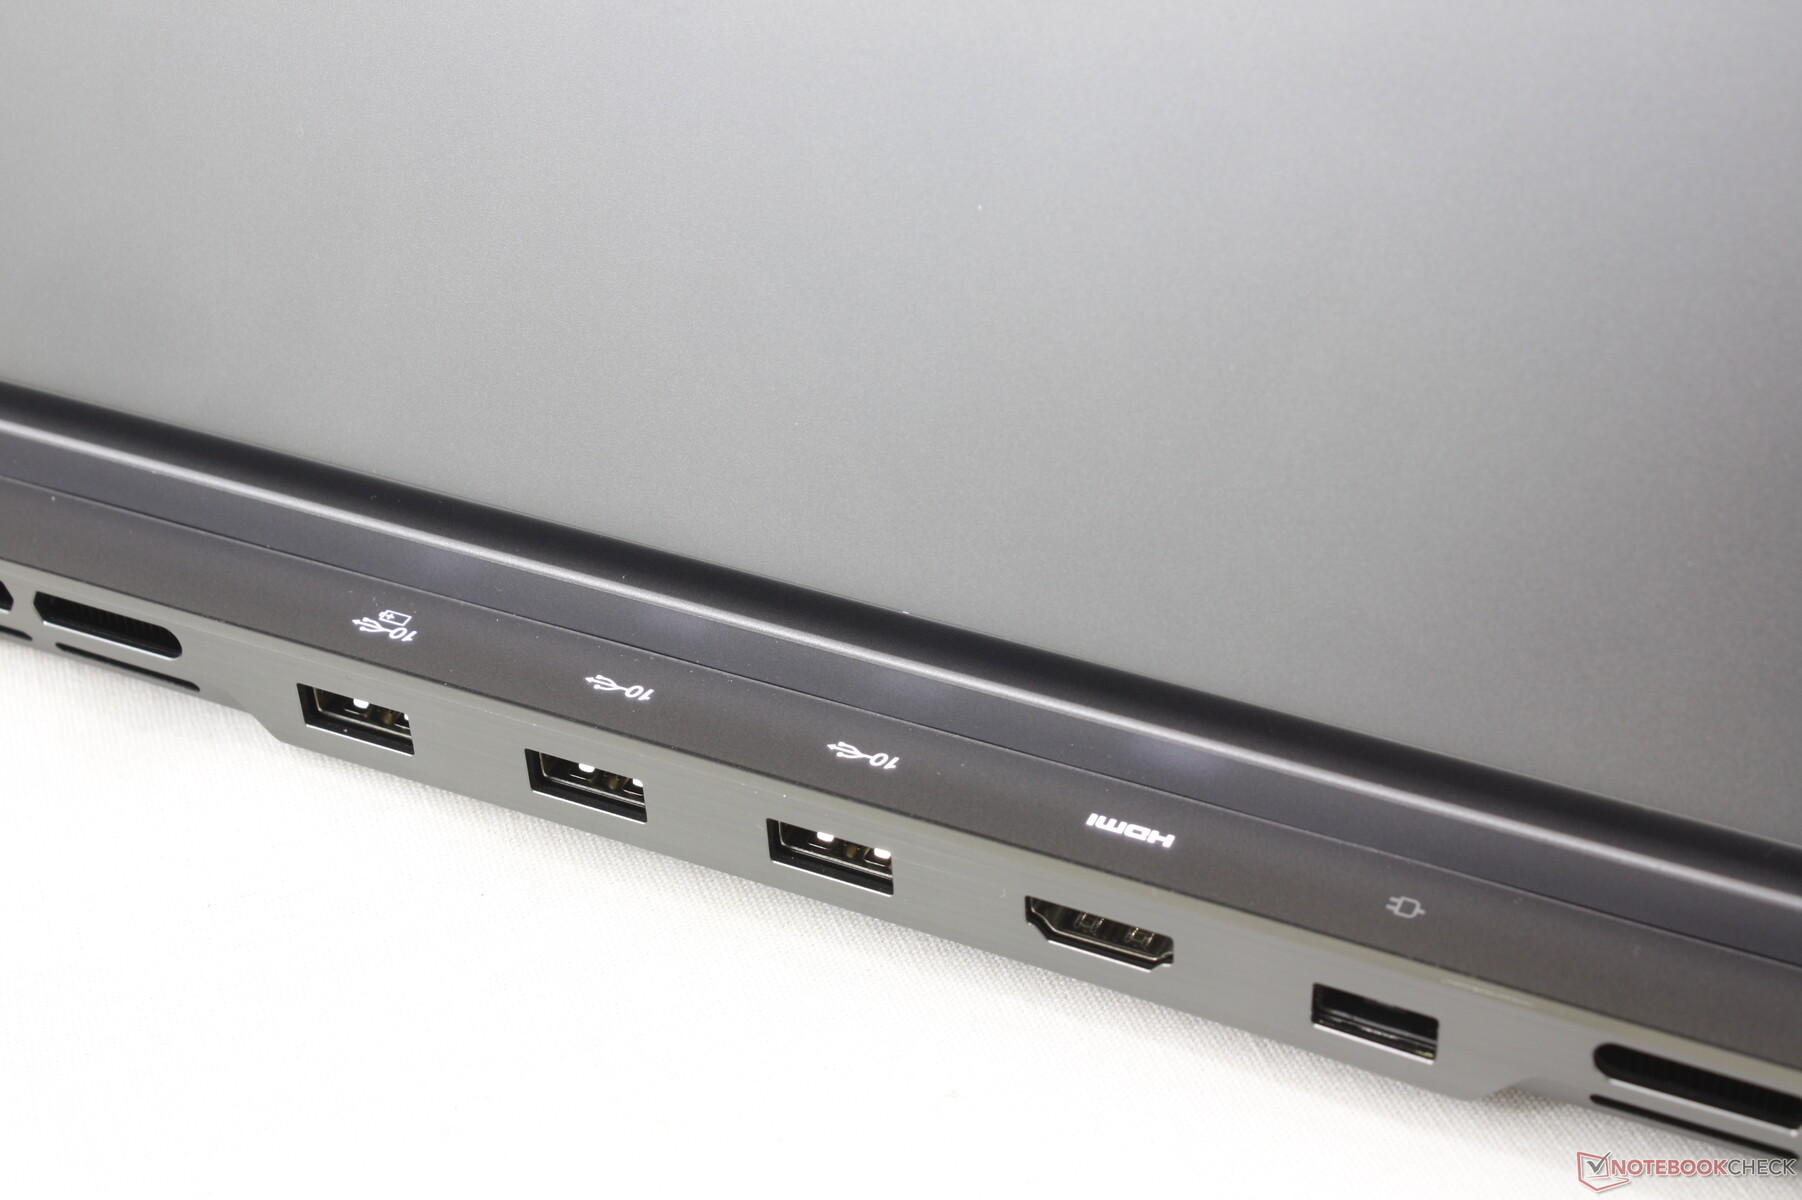
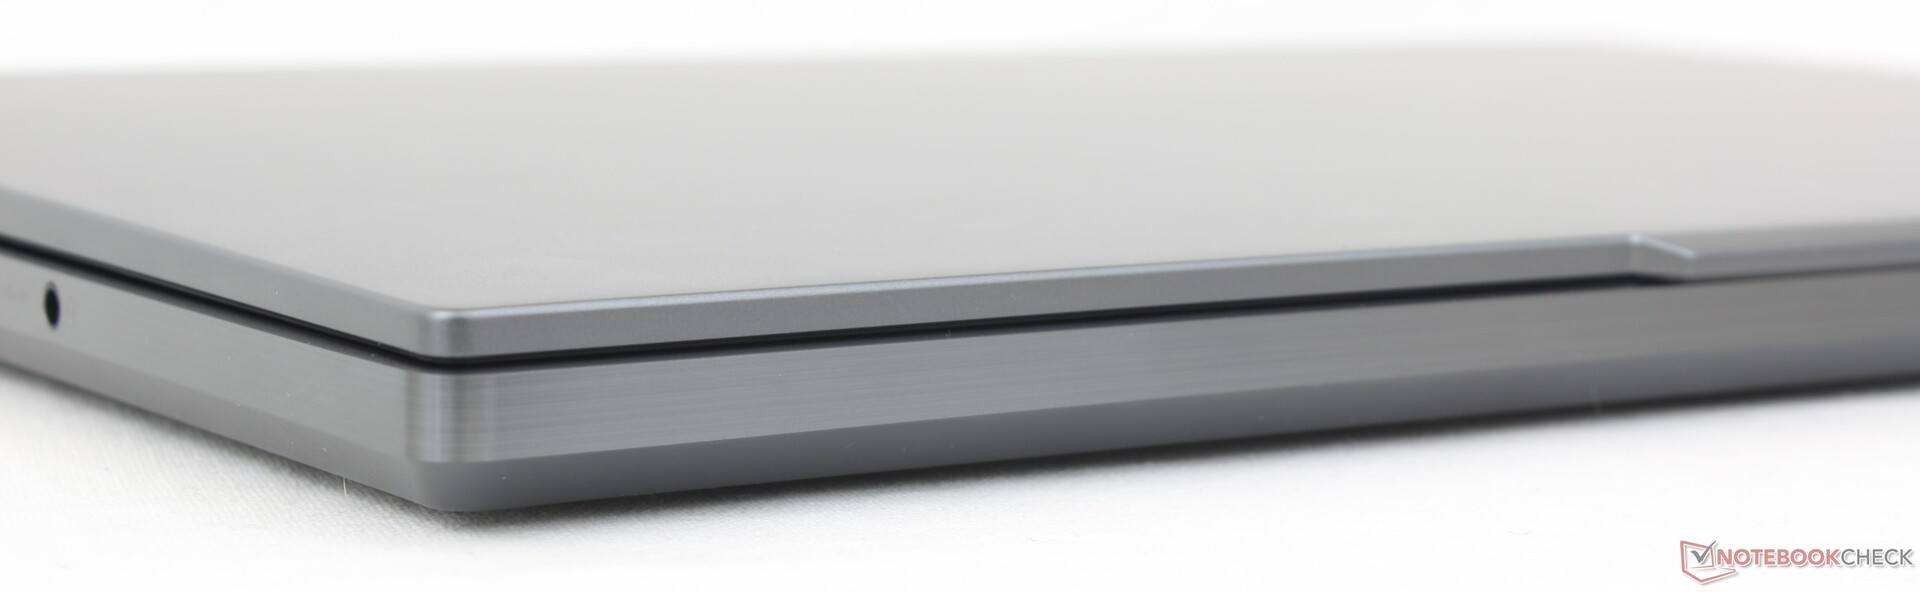
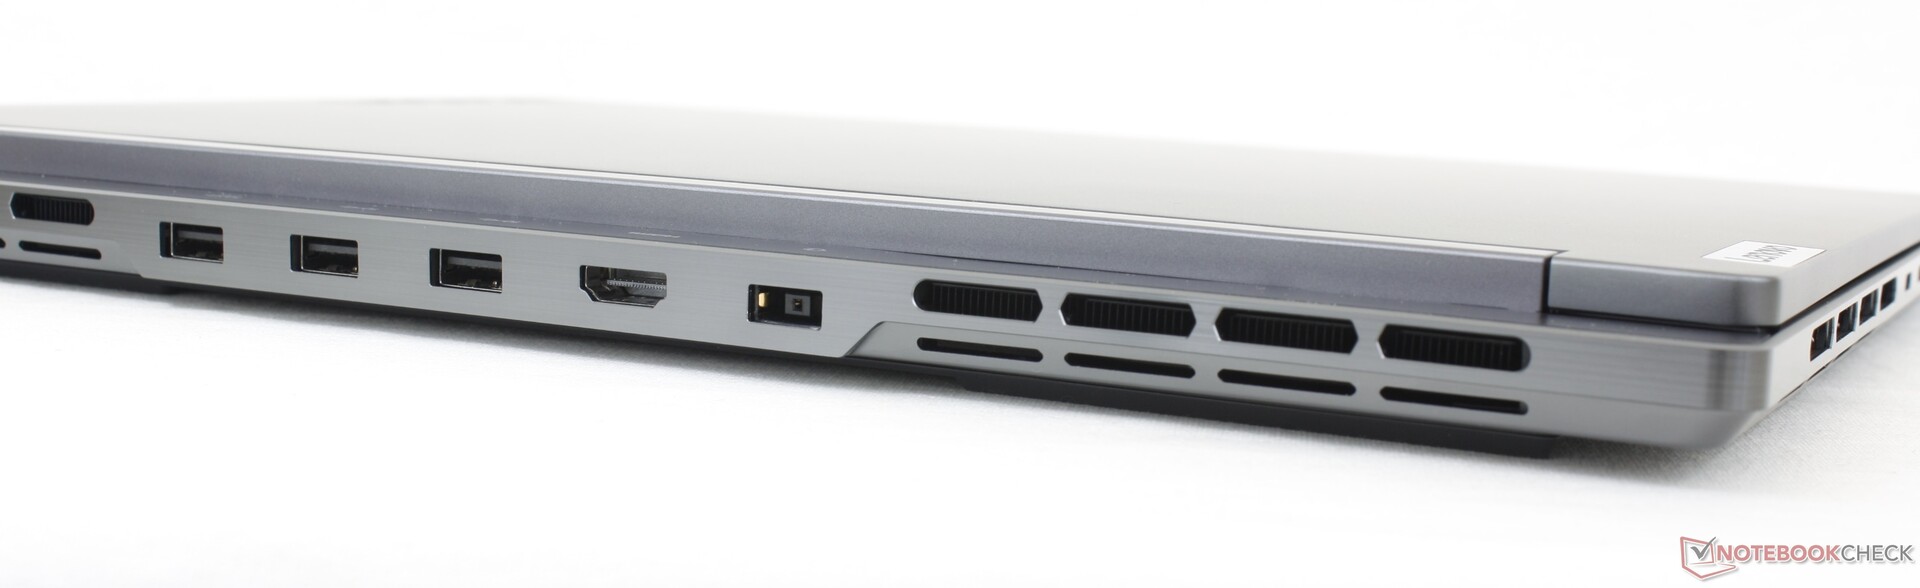
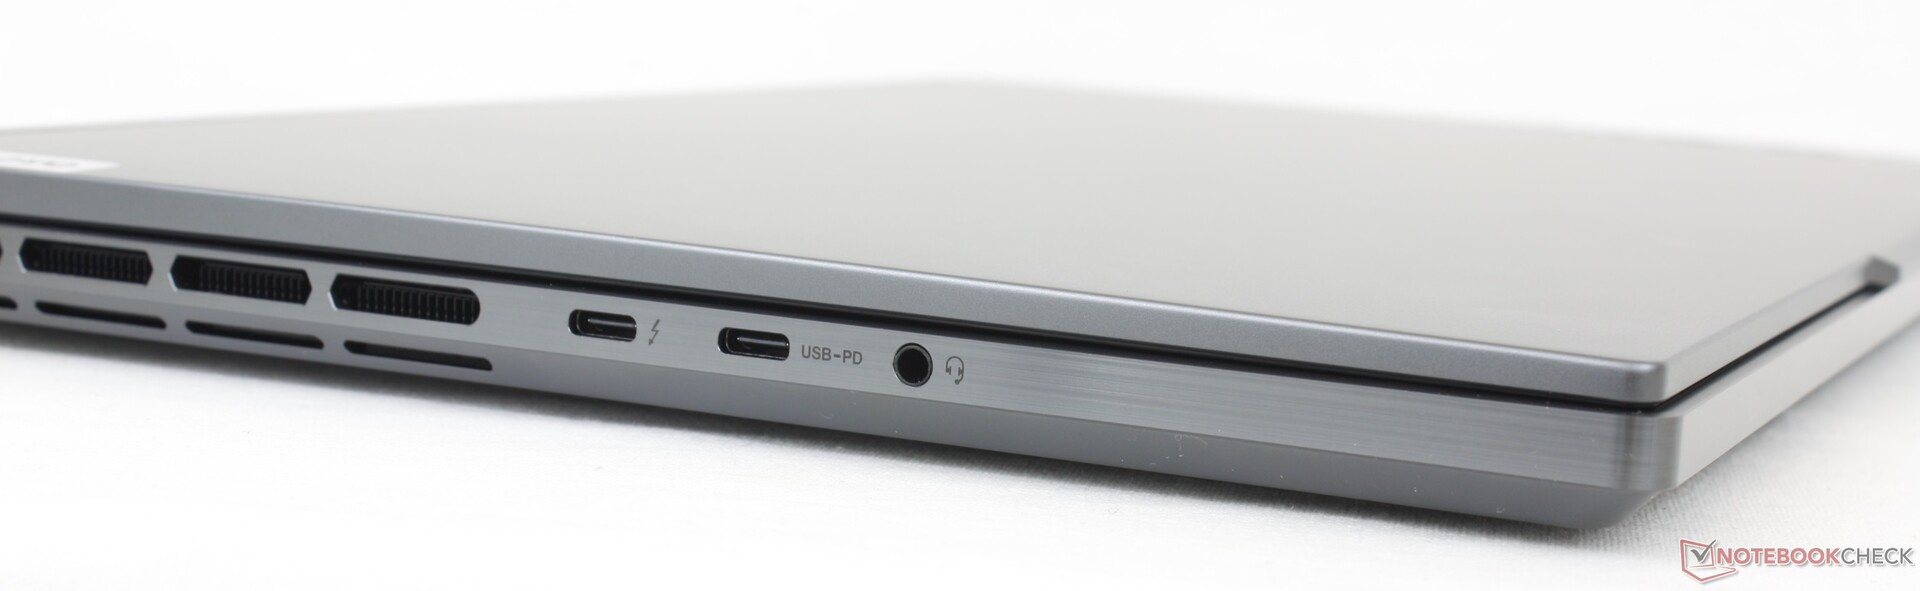
连接性 - 支持Thunderbolt 4
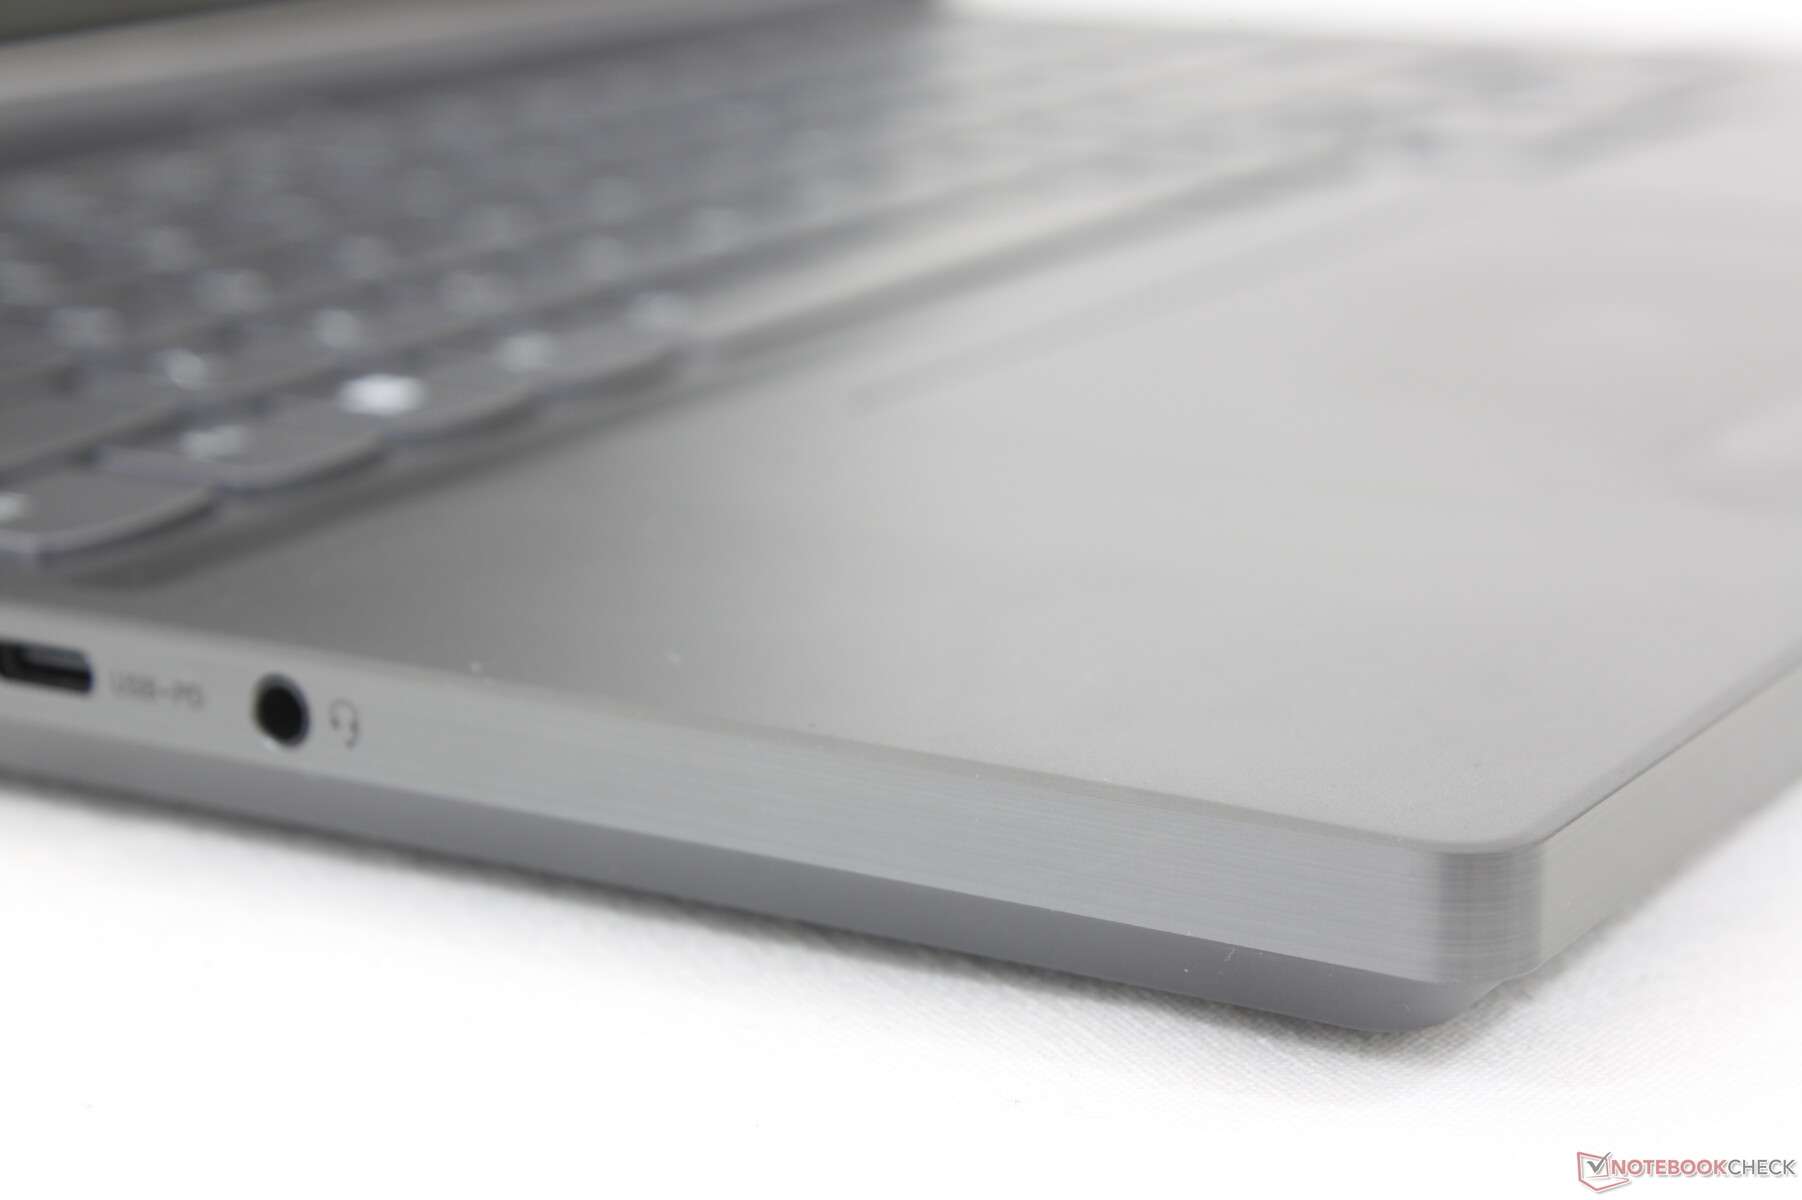
端口的选择是多样的,大多数都是沿着后部边缘,与Alienware系列很相似。然而,与Alienware不同的是,联想的两个USB-C端口是沿着左边的边缘,以便于使用。
请注意,两个USB-C端口中只有一个支持Thunderbolt 4。如果某些配件不能在一个端口上工作,那么一定要尝试另一个。例如,我们的Lepow外部显示器可以在USB-C 3.2端口上使用,但不能在USB-C Thunderbolt端口上使用。
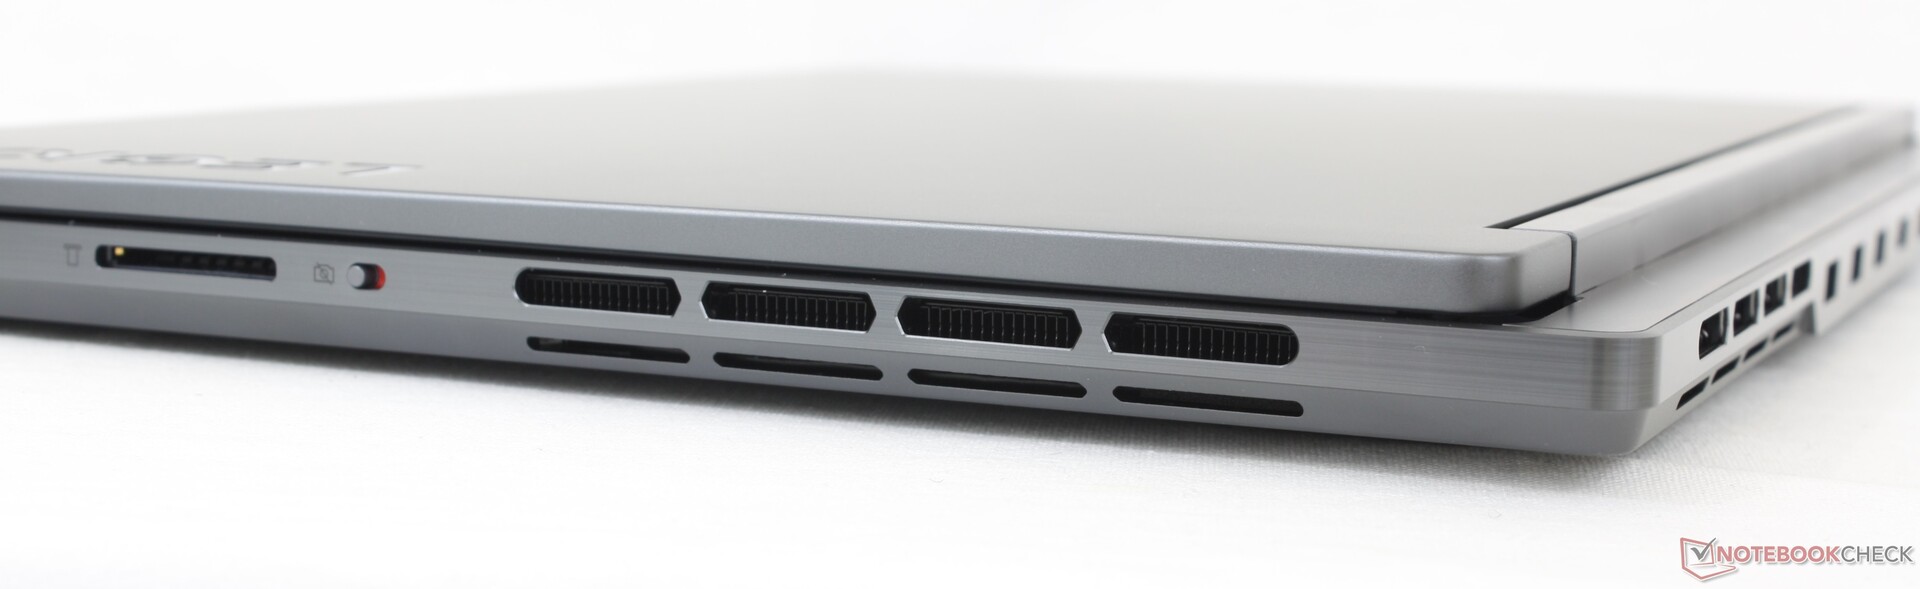
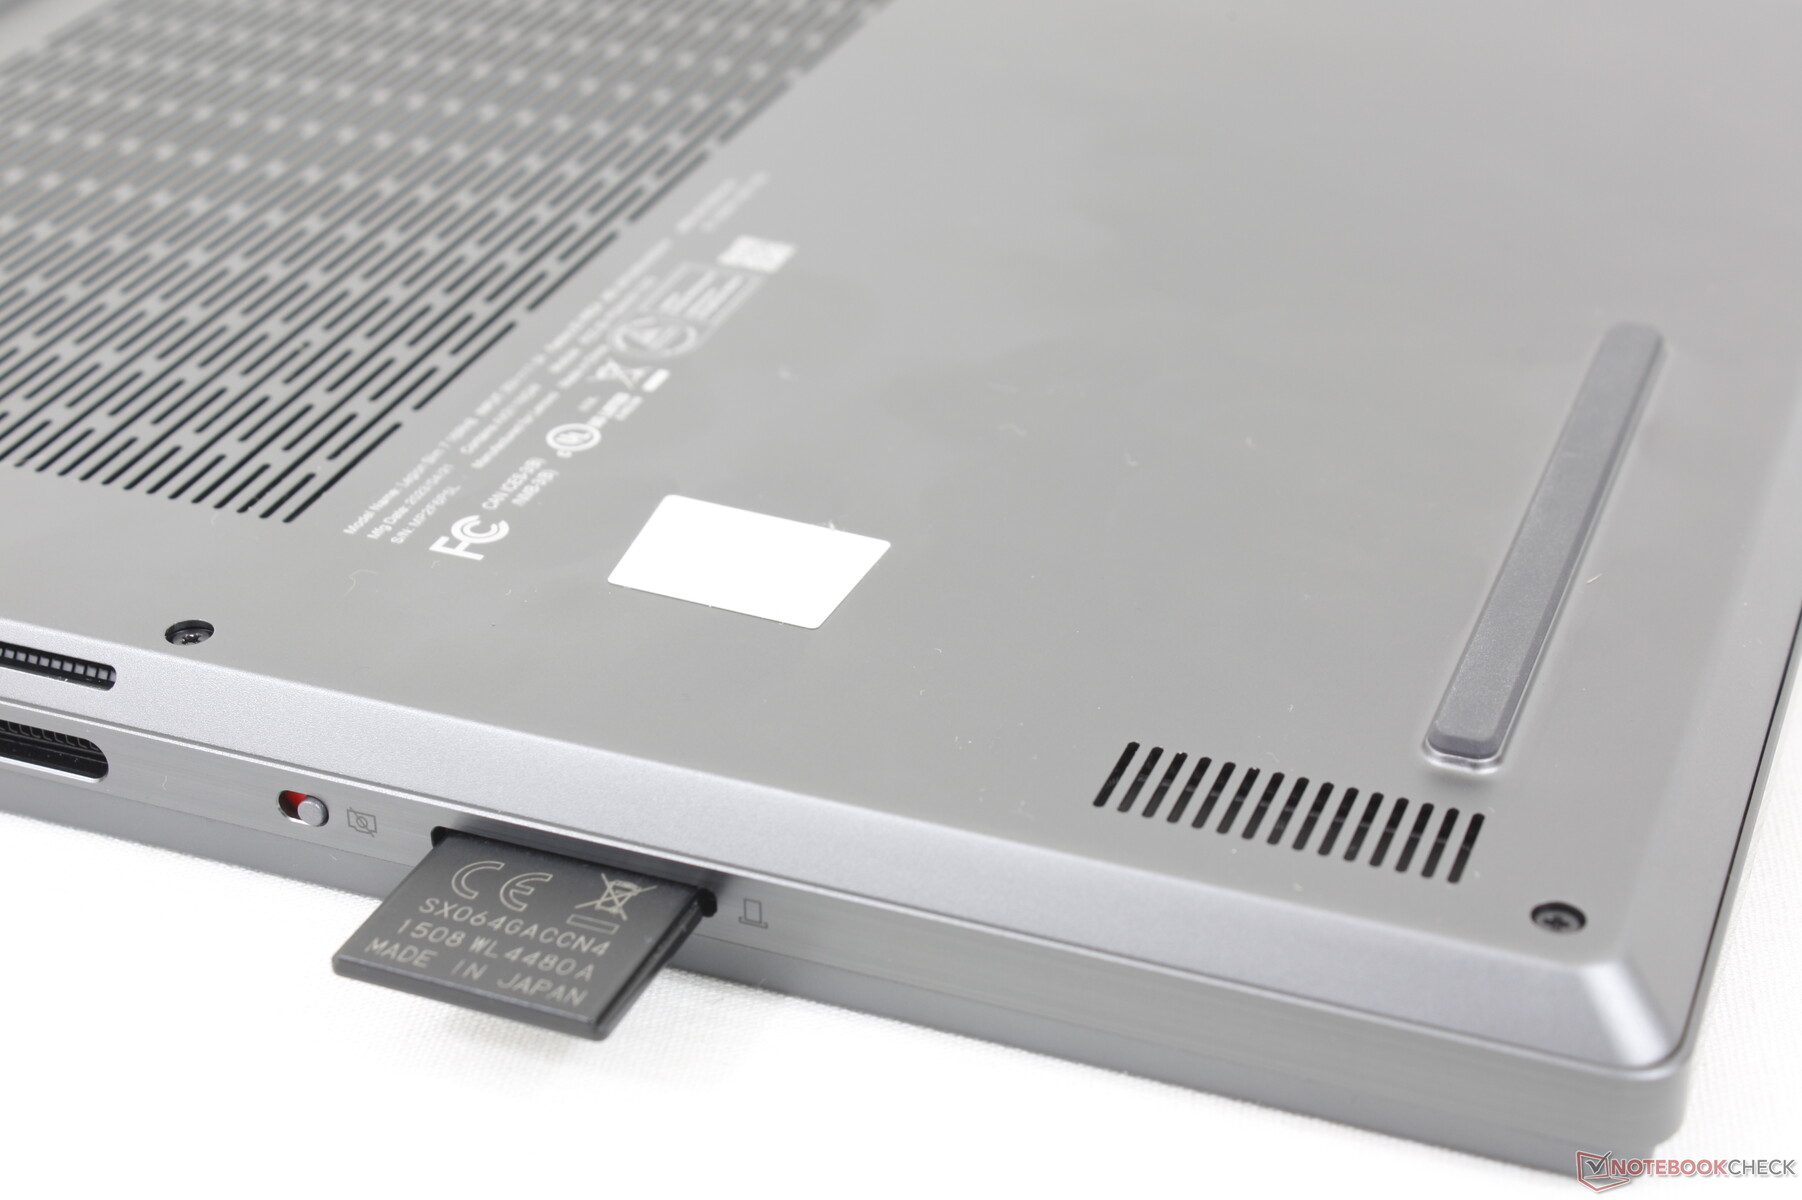
SD卡阅读器
使用我们的UHS-II测试卡,通过SD卡读卡器的传输速率平均为80MB/s左右,这大约是读卡器的一半速度。 叶片16.
| SD Card Reader | |
| average JPG Copy Test (av. of 3 runs) | |
| Razer Blade 16 Early 2023 (AV PRO microSD 128 GB V60) | |
| Lenovo Legion Slim 7i 16 Gen 8 (Toshiba Exceria Pro SDXC 64 GB UHS-II) | |
| Alienware x16 R1 (AV PRO microSD 128 GB V60) | |
| maximum AS SSD Seq Read Test (1GB) | |
| Alienware x16 R1 (AV PRO microSD 128 GB V60) | |
| Razer Blade 16 Early 2023 (AV PRO microSD 128 GB V60) | |
| Lenovo Legion Slim 7i 16 Gen 8 (Toshiba Exceria Pro SDXC 64 GB UHS-II) | |
沟通
英特尔AX211是Wi-Fi 6E和蓝牙5.3连接的标准配置。当与我们的6GHz华硕AXE11000网络配对时,性能稳定而可靠。
| Networking | |
| iperf3 transmit AXE11000 | |
| Lenovo Legion Pro 7 RTX4090 | |
| Asus ROG Strix G16 G614JZ | |
| Razer Blade 16 Early 2023 | |
| Lenovo Legion Slim 7i 16 Gen 8 | |
| HP Omen 16-wf000 | |
| Alienware x16 R1 | |
| iperf3 receive AXE11000 | |
| Lenovo Legion Pro 7 RTX4090 | |
| Asus ROG Strix G16 G614JZ | |
| Razer Blade 16 Early 2023 | |
| Alienware x16 R1 | |
| HP Omen 16-wf000 | |
| Lenovo Legion Slim 7i 16 Gen 8 | |
| iperf3 transmit AXE11000 6GHz | |
| Lenovo Legion Slim 7i 16 Gen 8 | |
| Razer Blade 16 Early 2023 | |
| HP Omen 16-wf000 | |
| Alienware x16 R1 | |
| iperf3 receive AXE11000 6GHz | |
| Lenovo Legion Slim 7i 16 Gen 8 | |
| Razer Blade 16 Early 2023 | |
| HP Omen 16-wf000 | |
| Alienware x16 R1 | |
网络摄像头
200万像素的网络摄像头仍然与去年的型号相同。没有红外支持,但网络摄像头杀毒开关是标准配置。


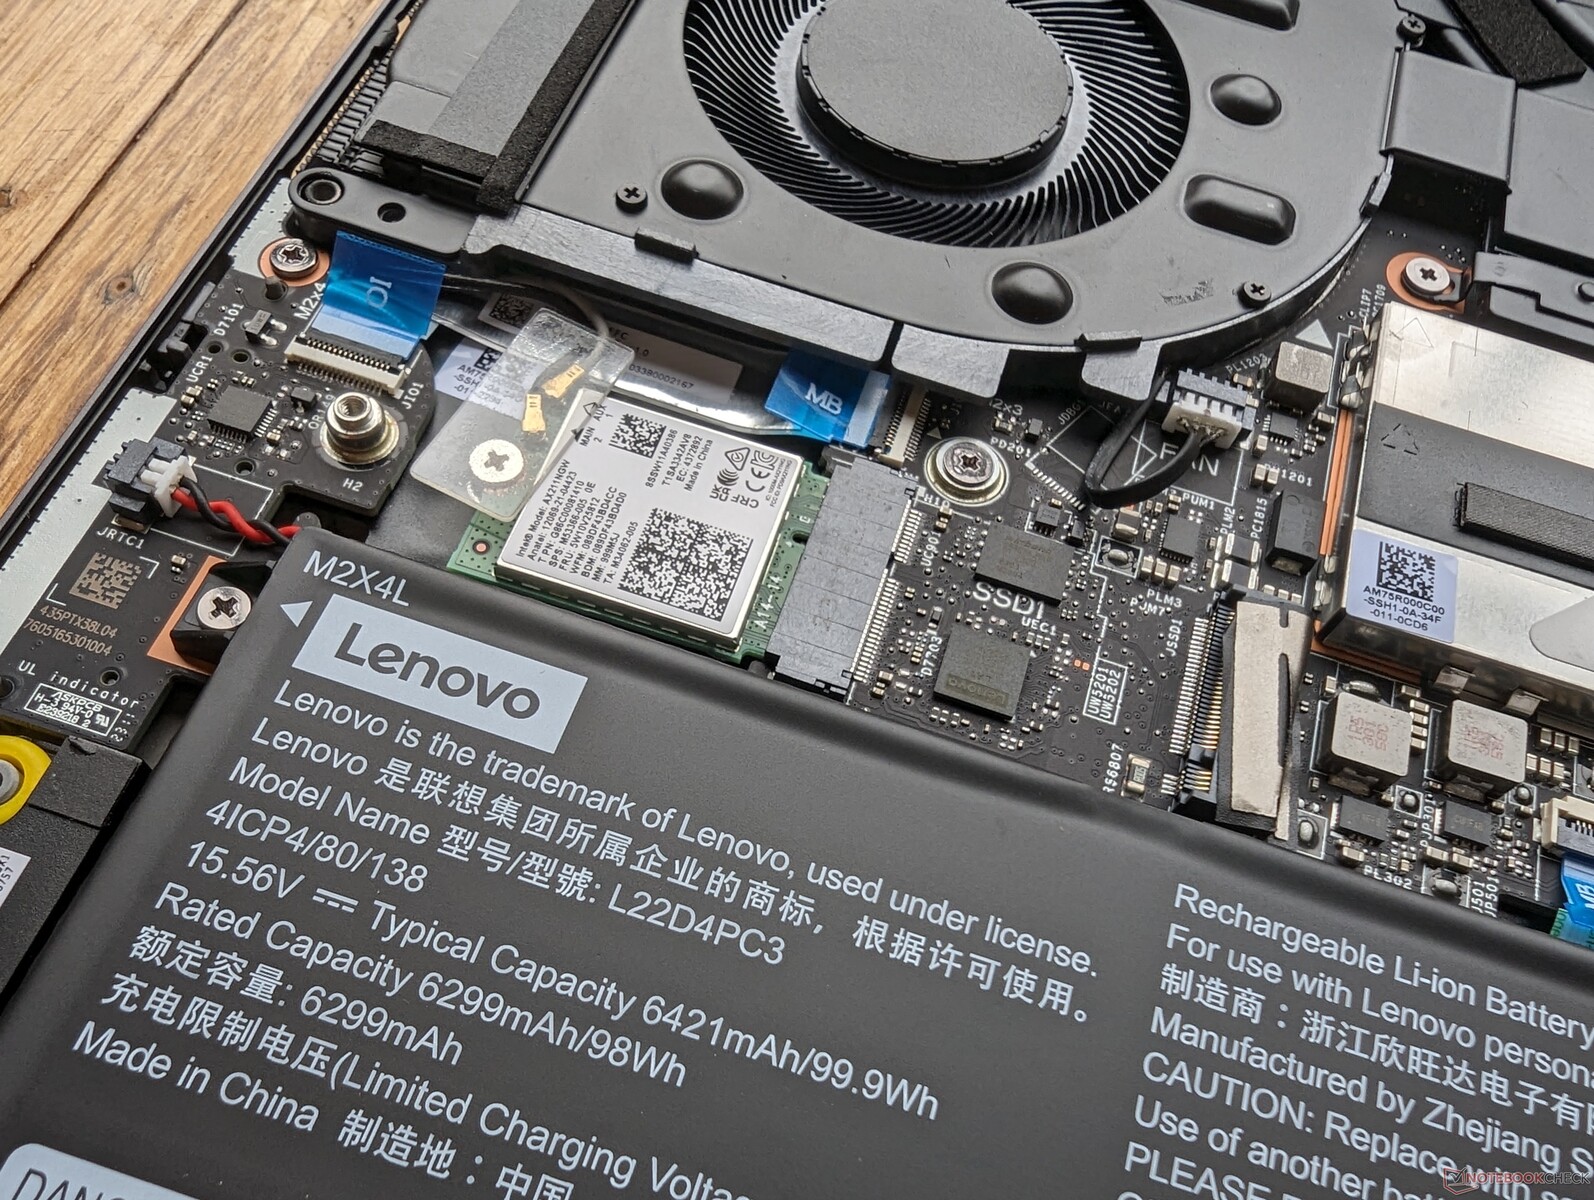
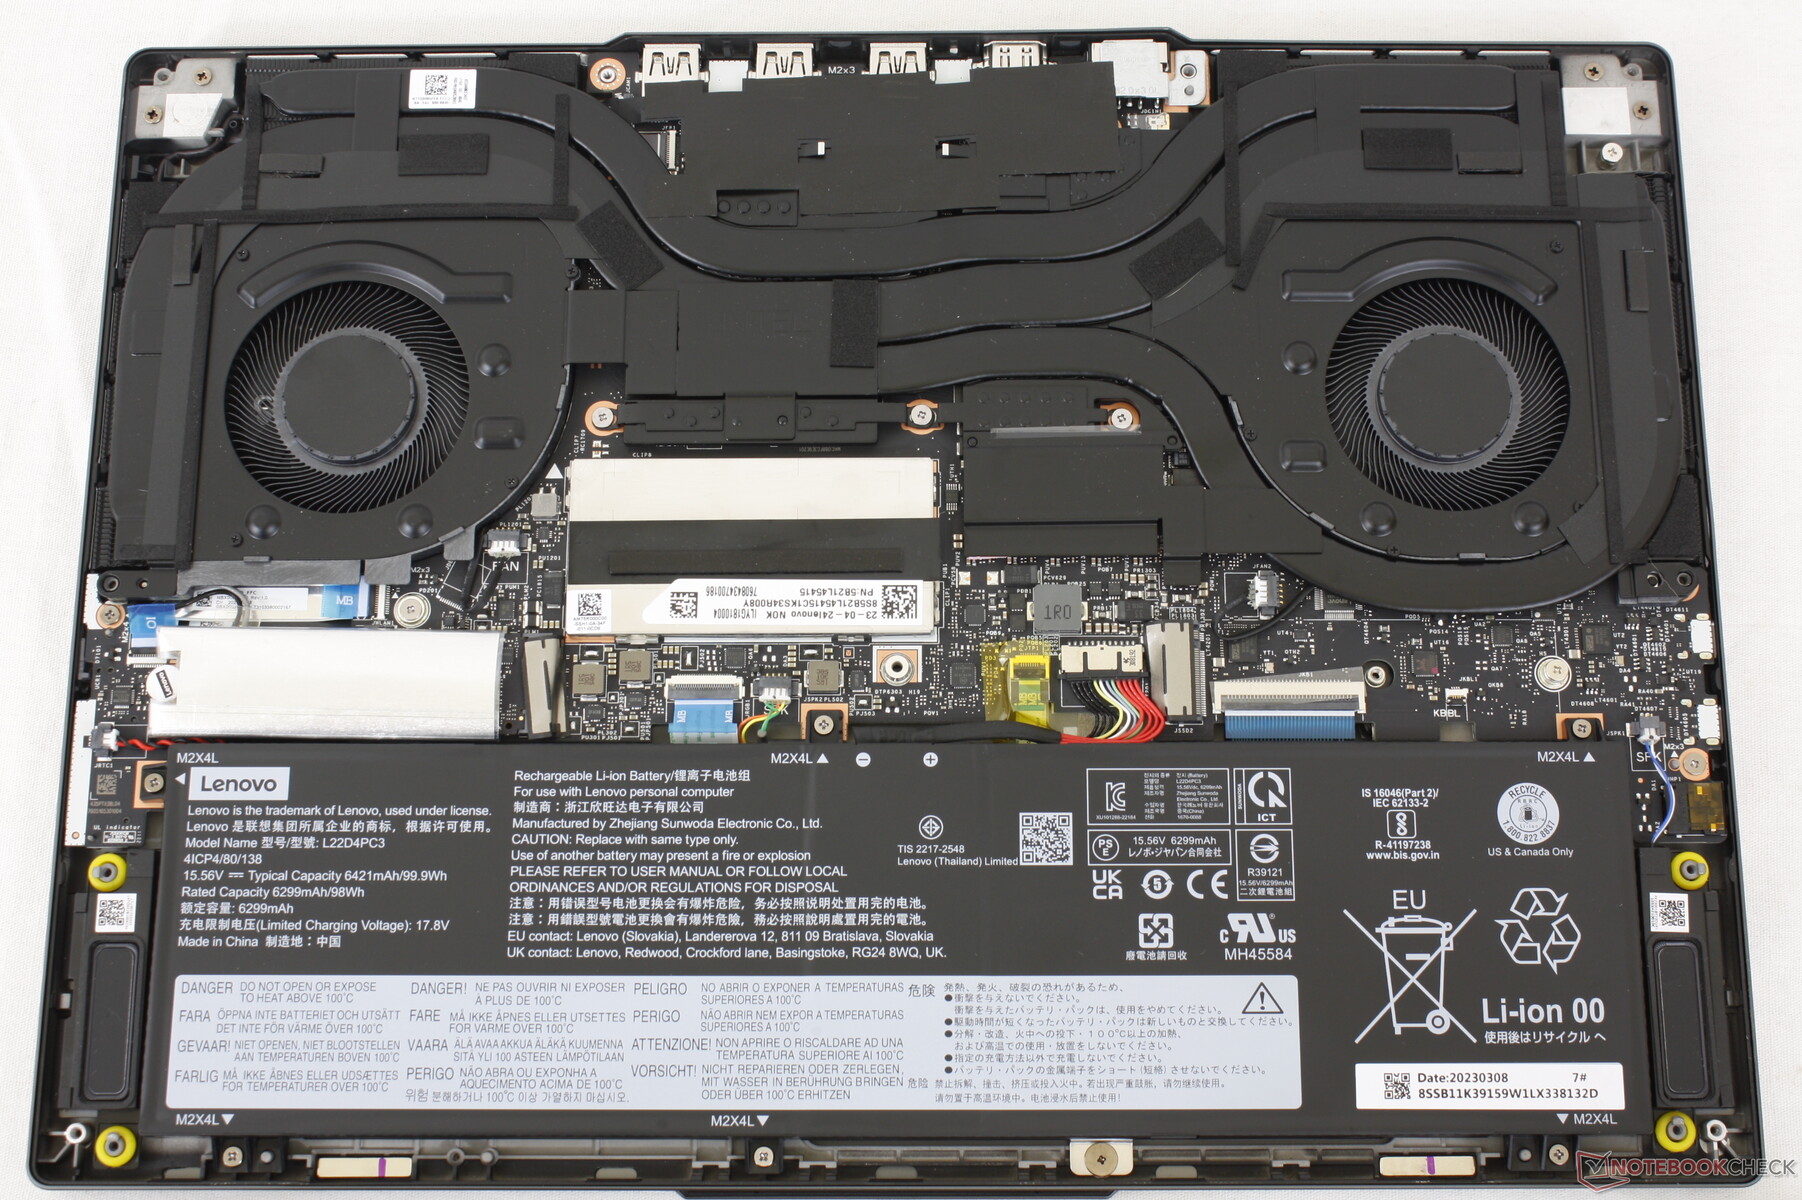
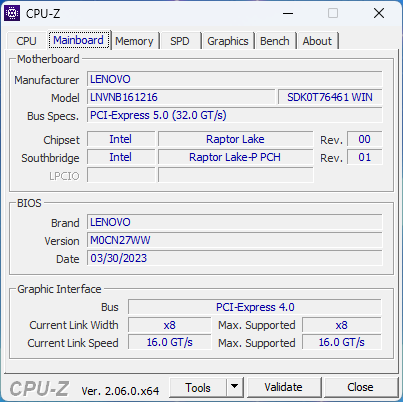
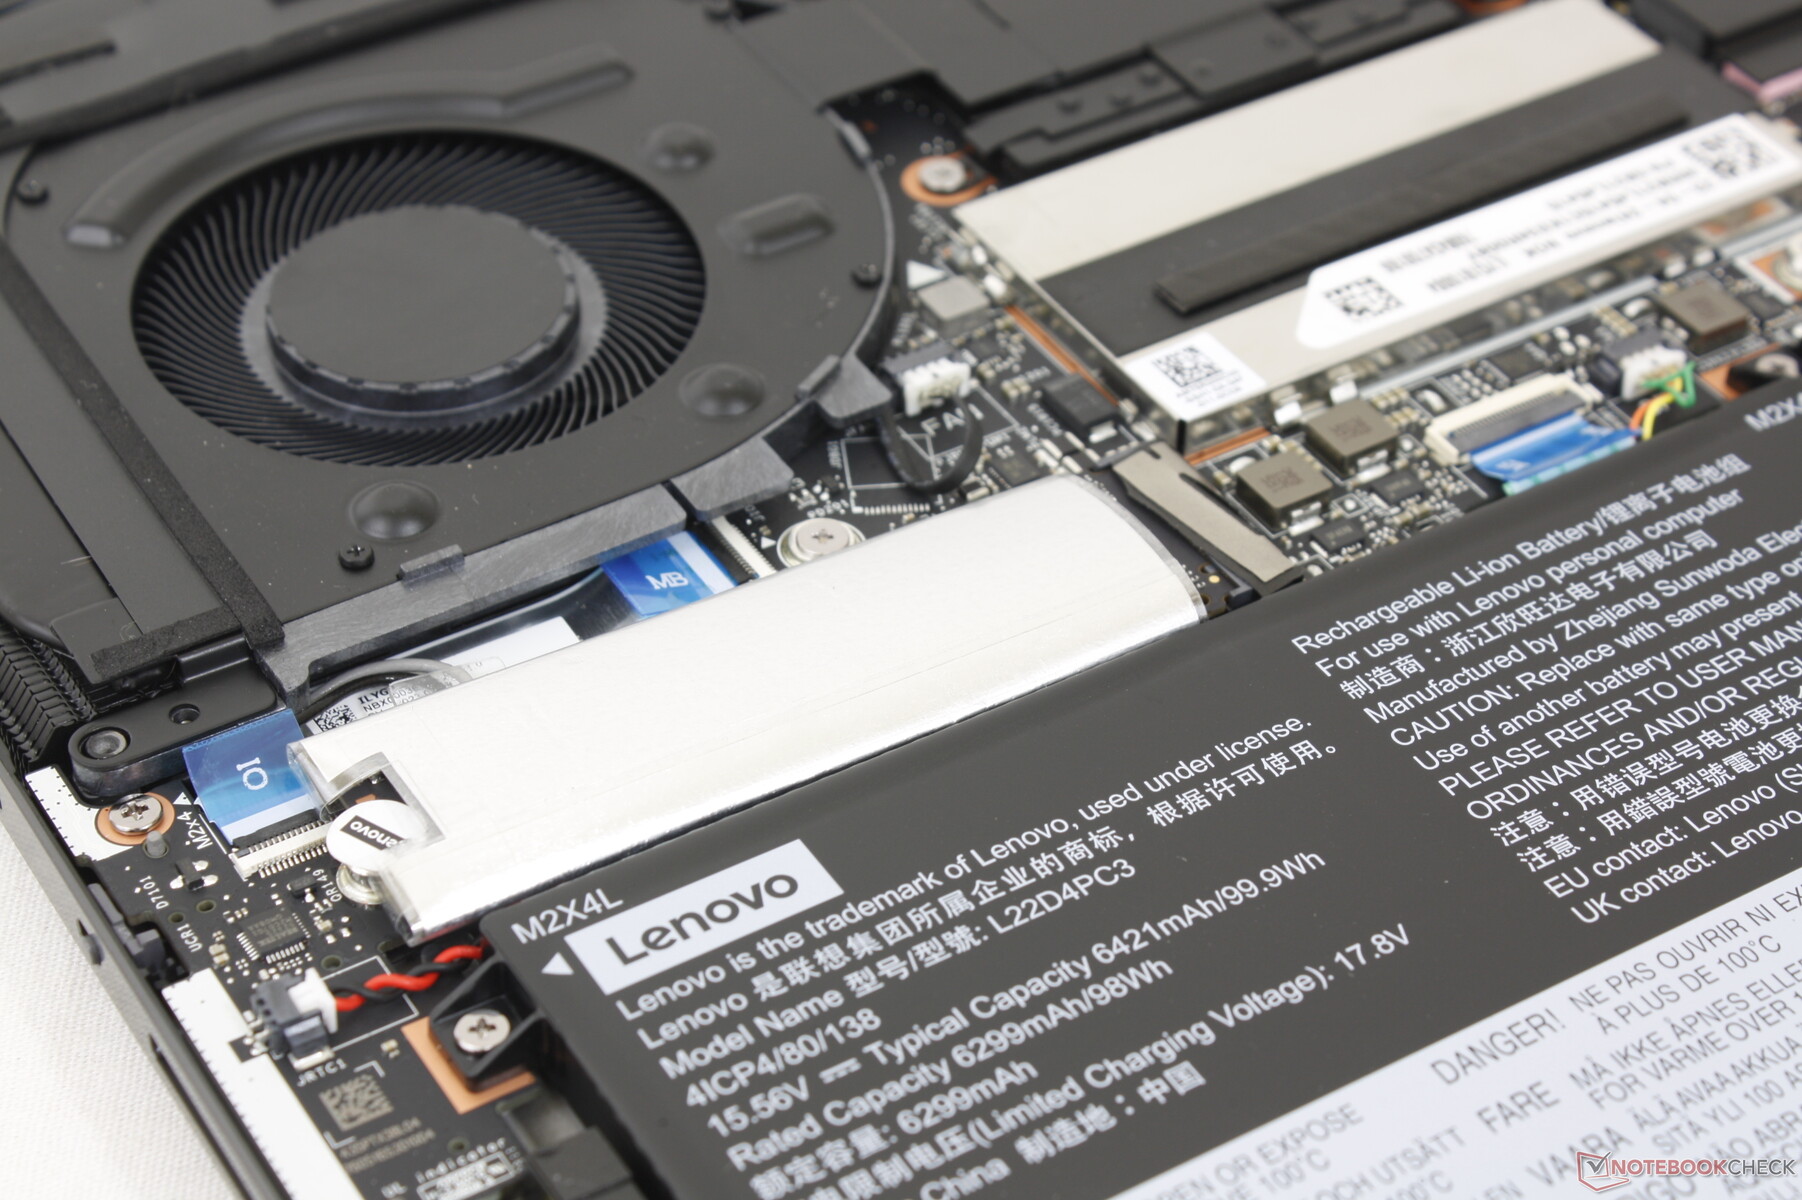
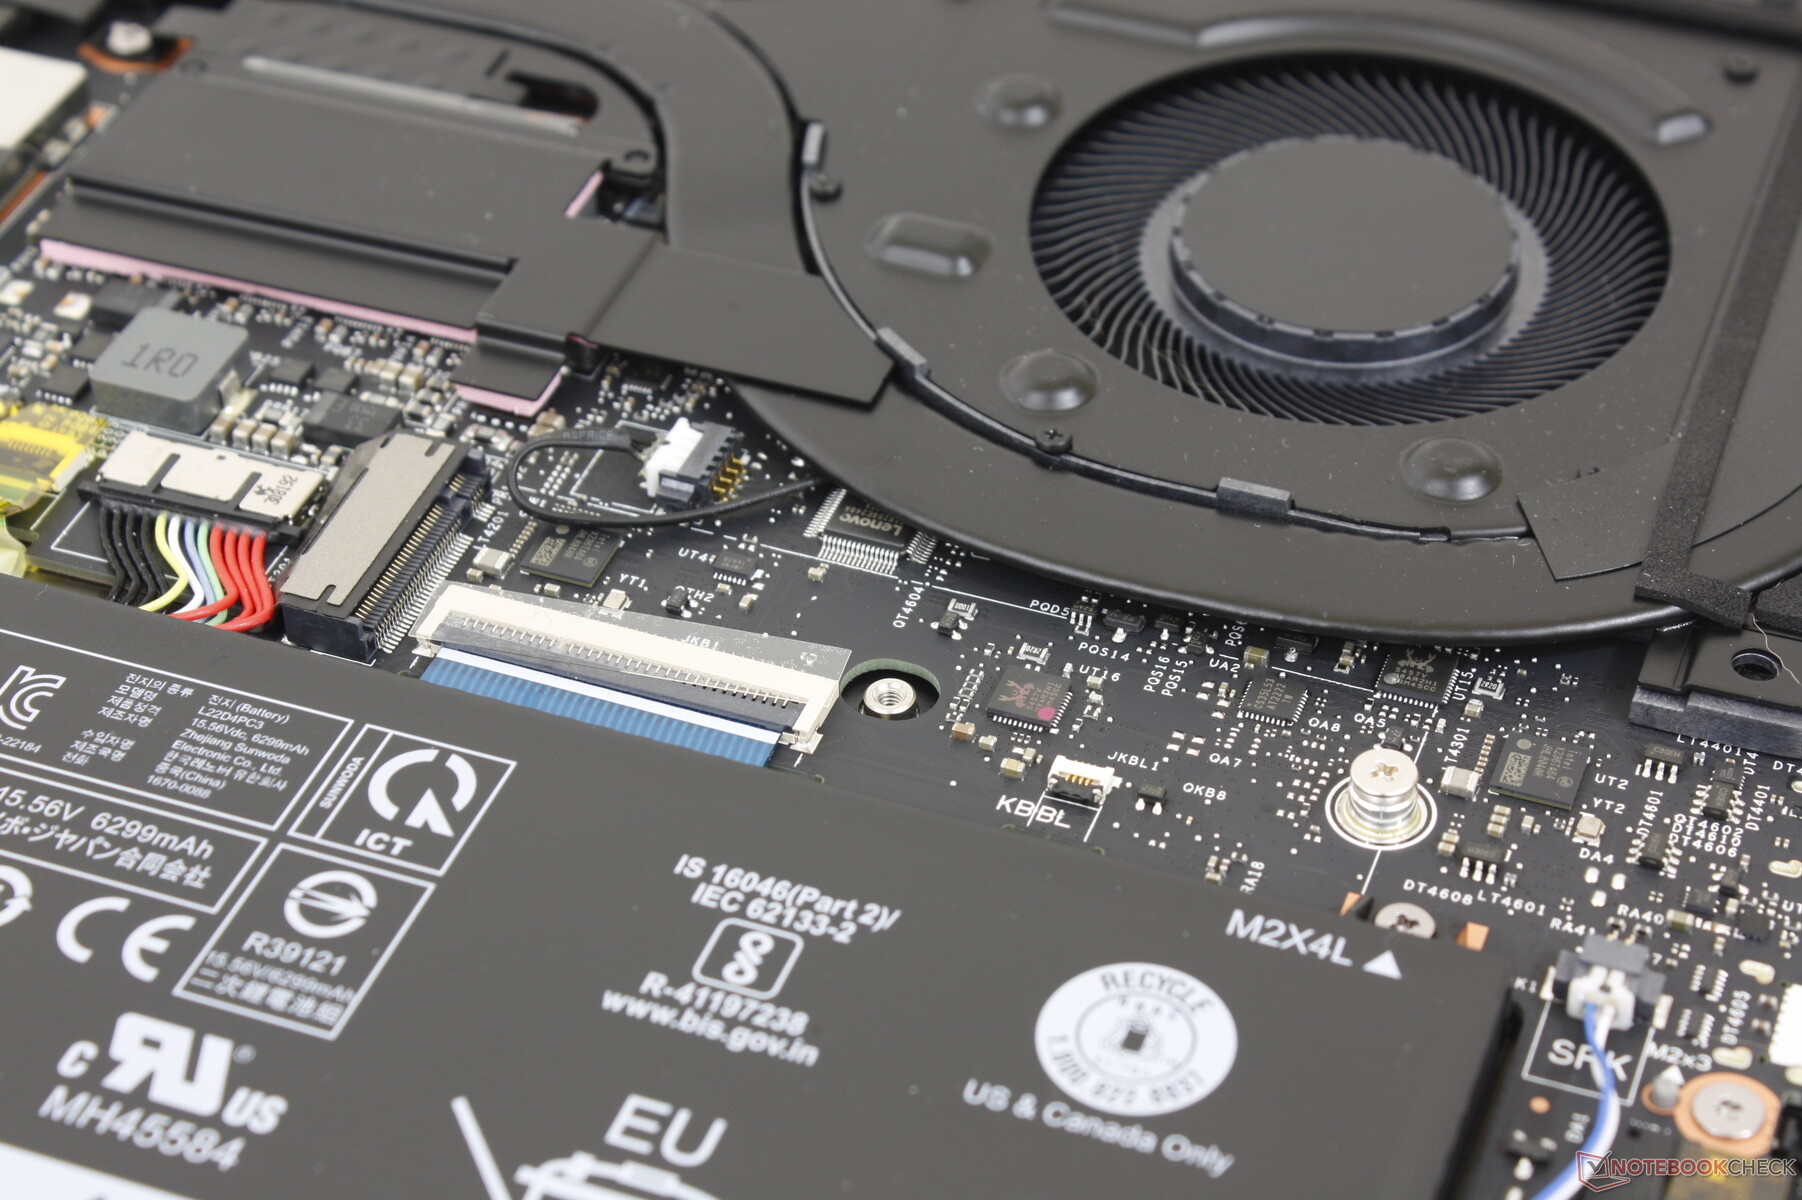
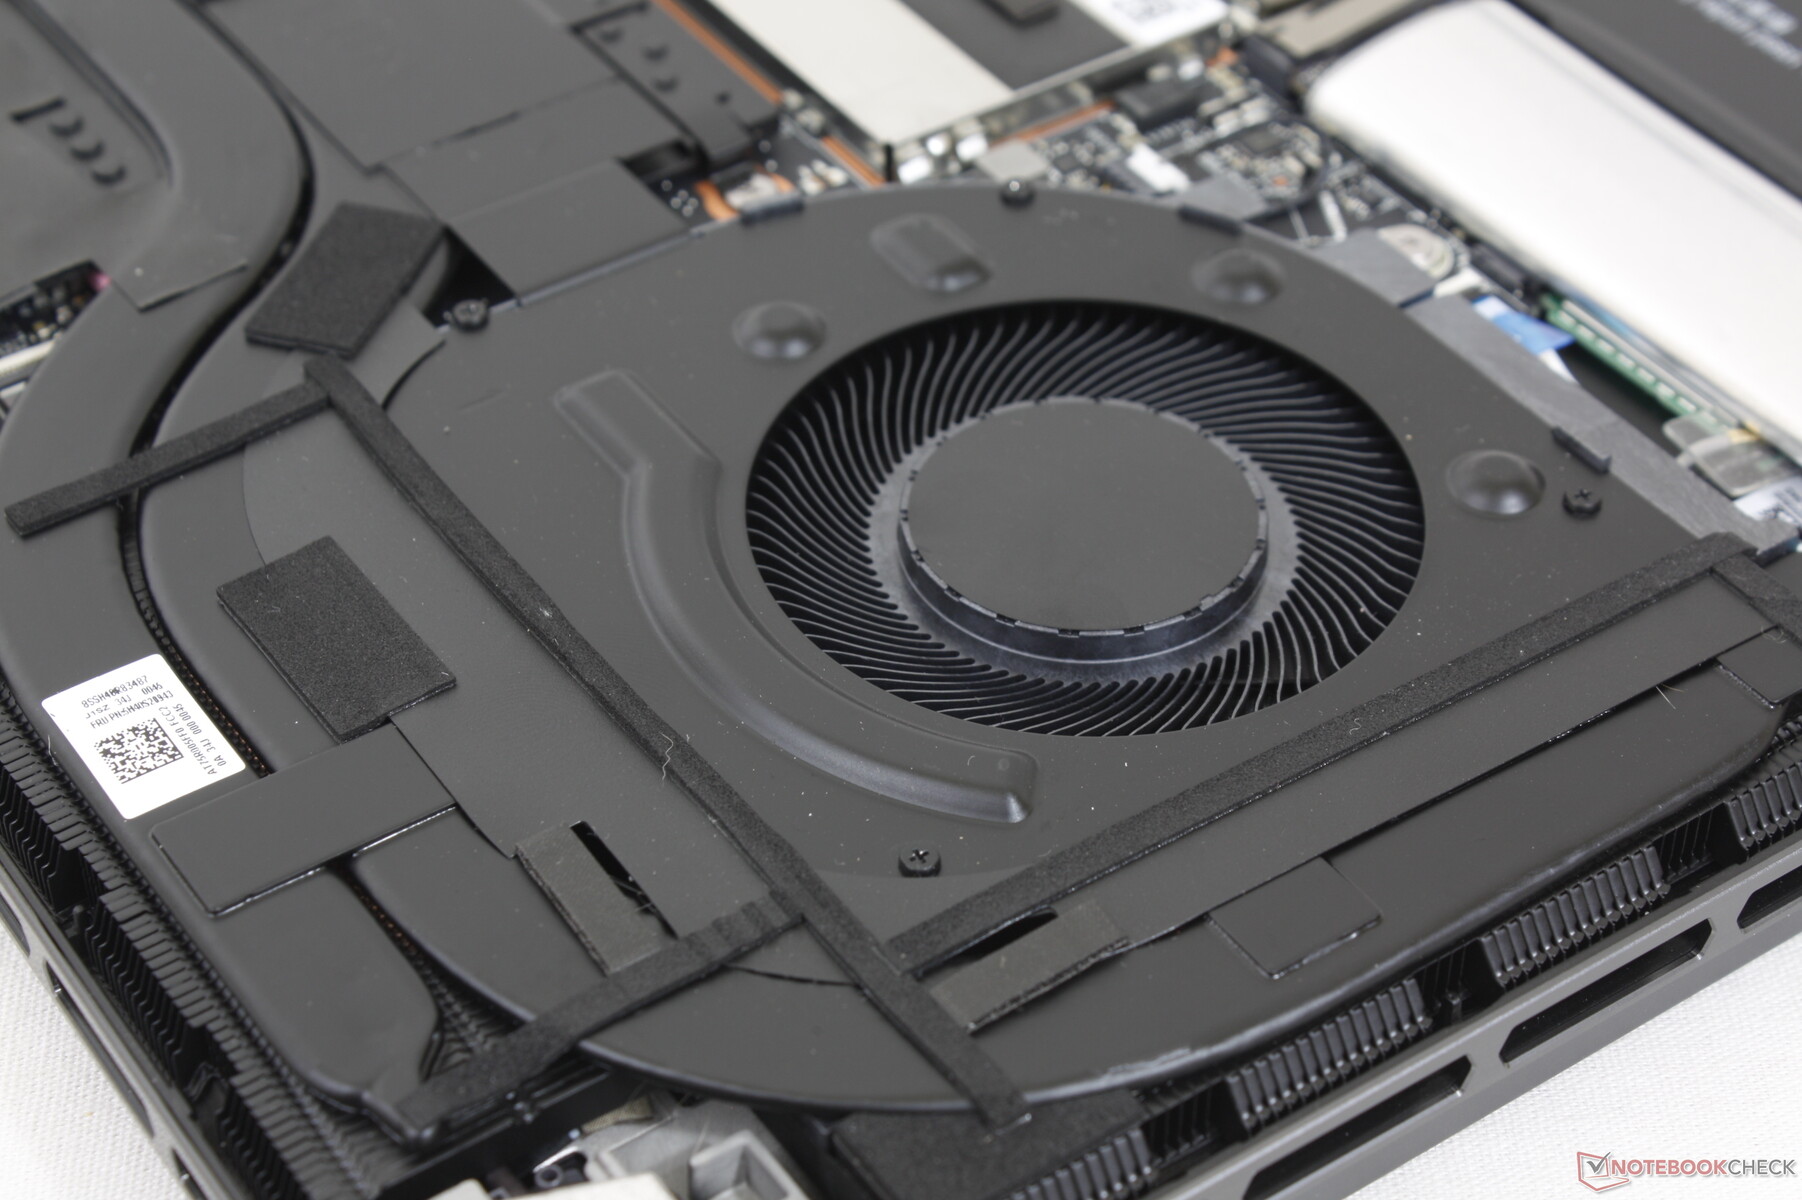
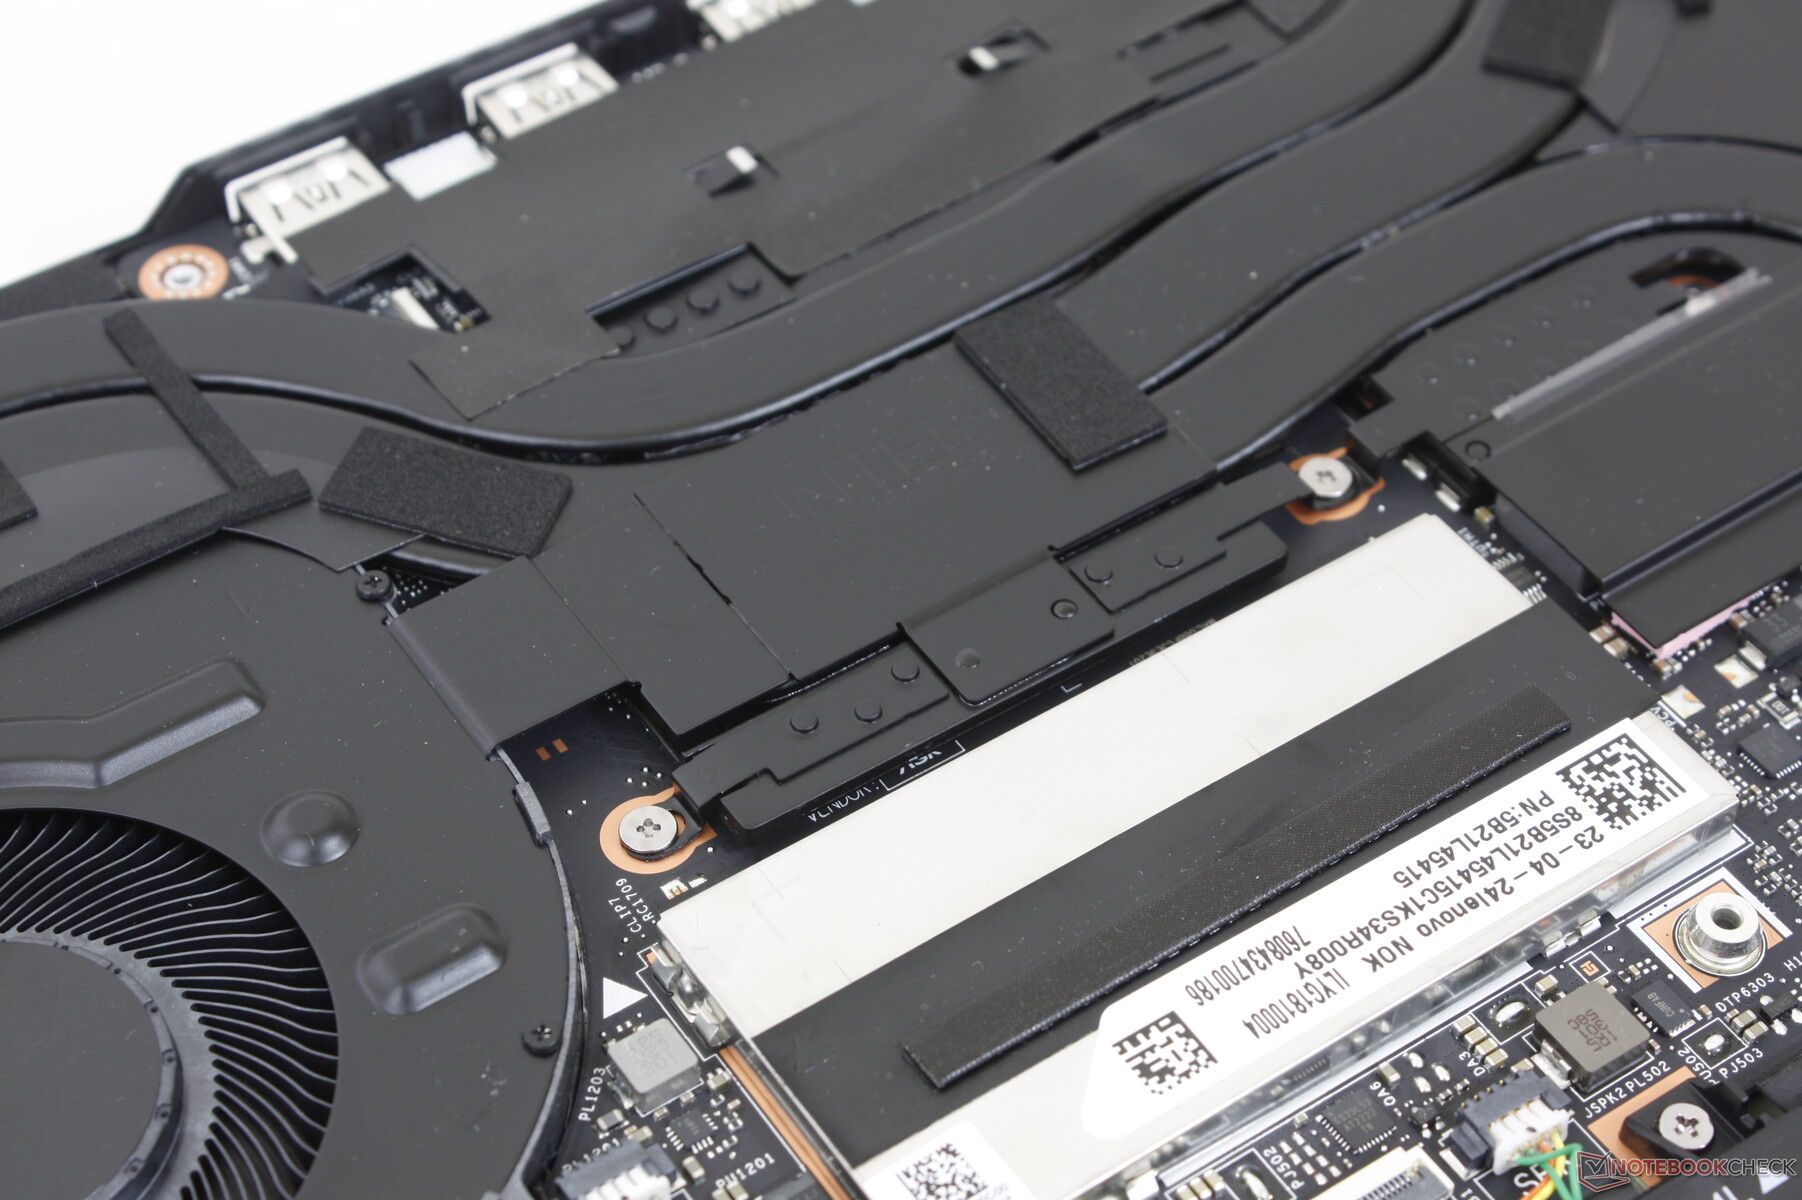
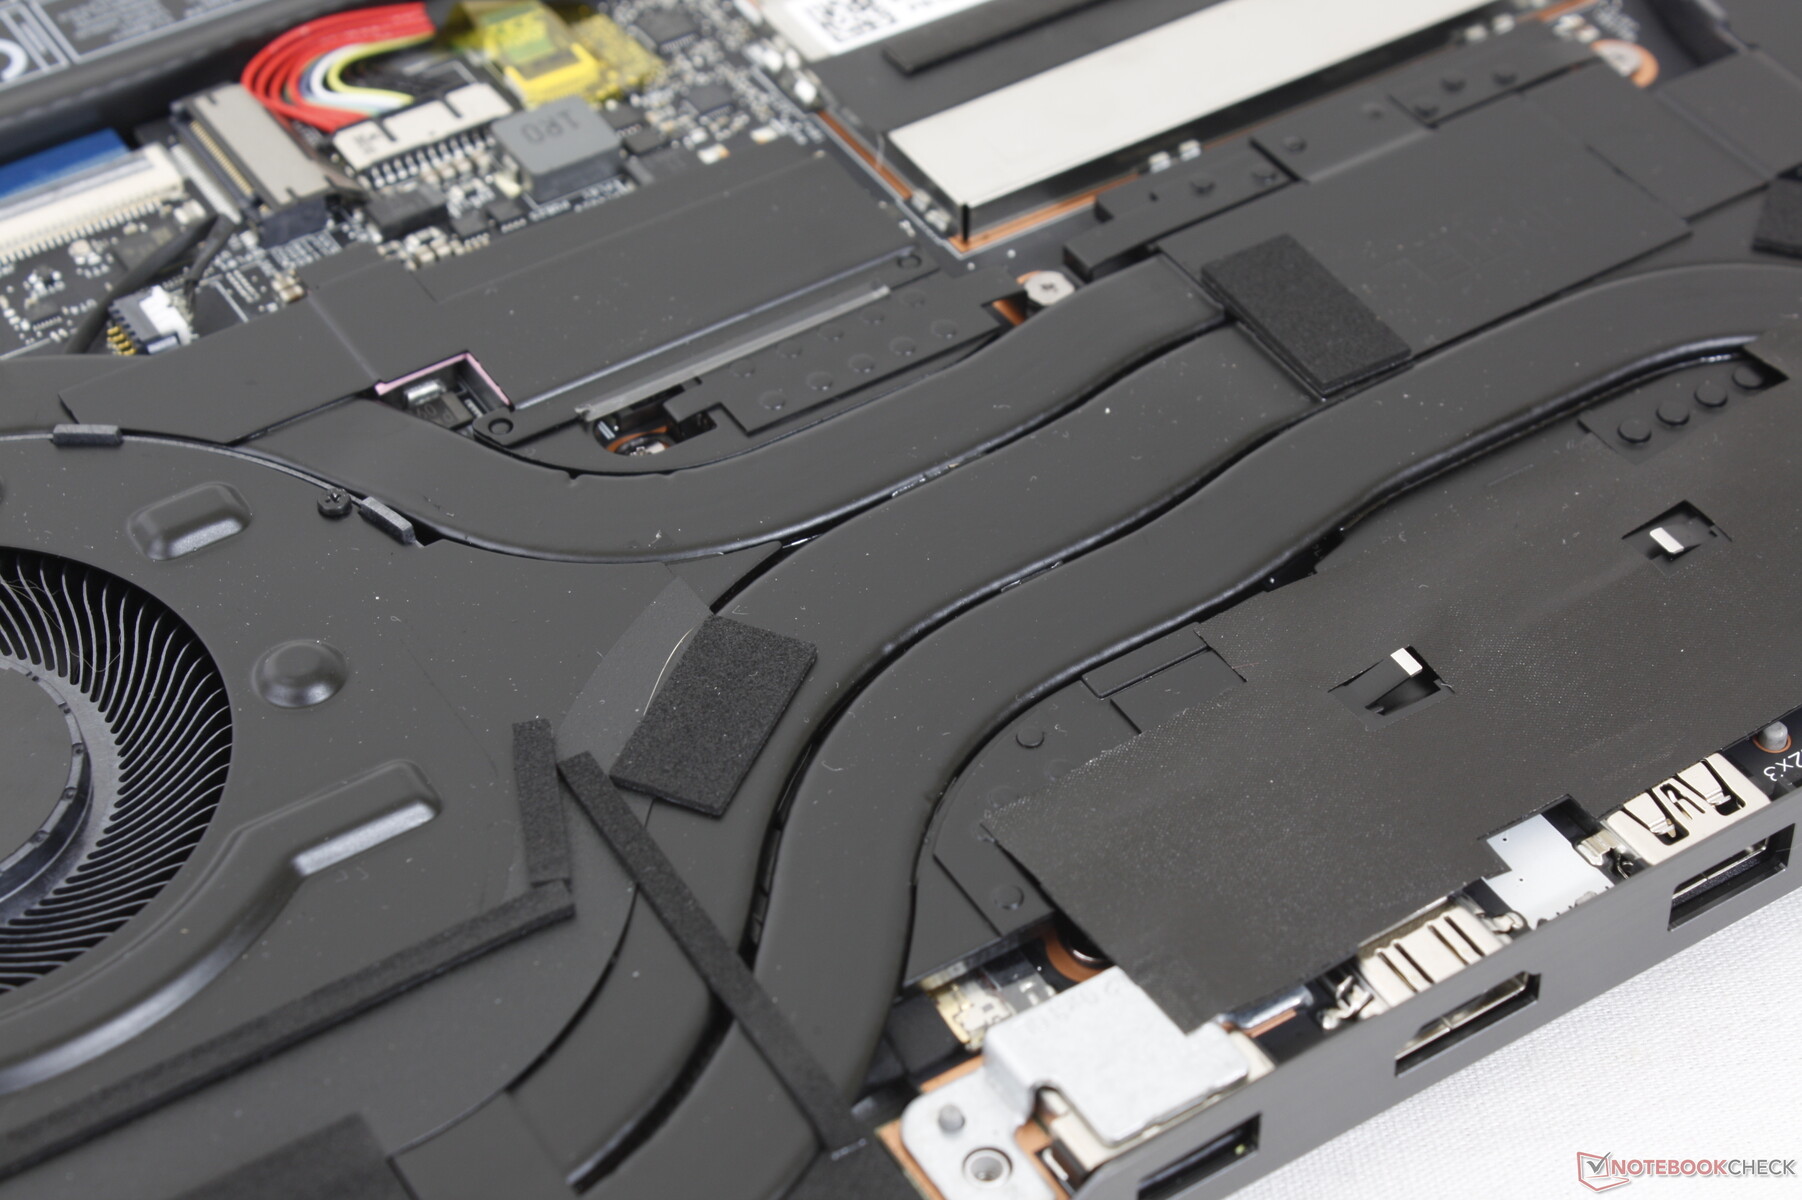
维护
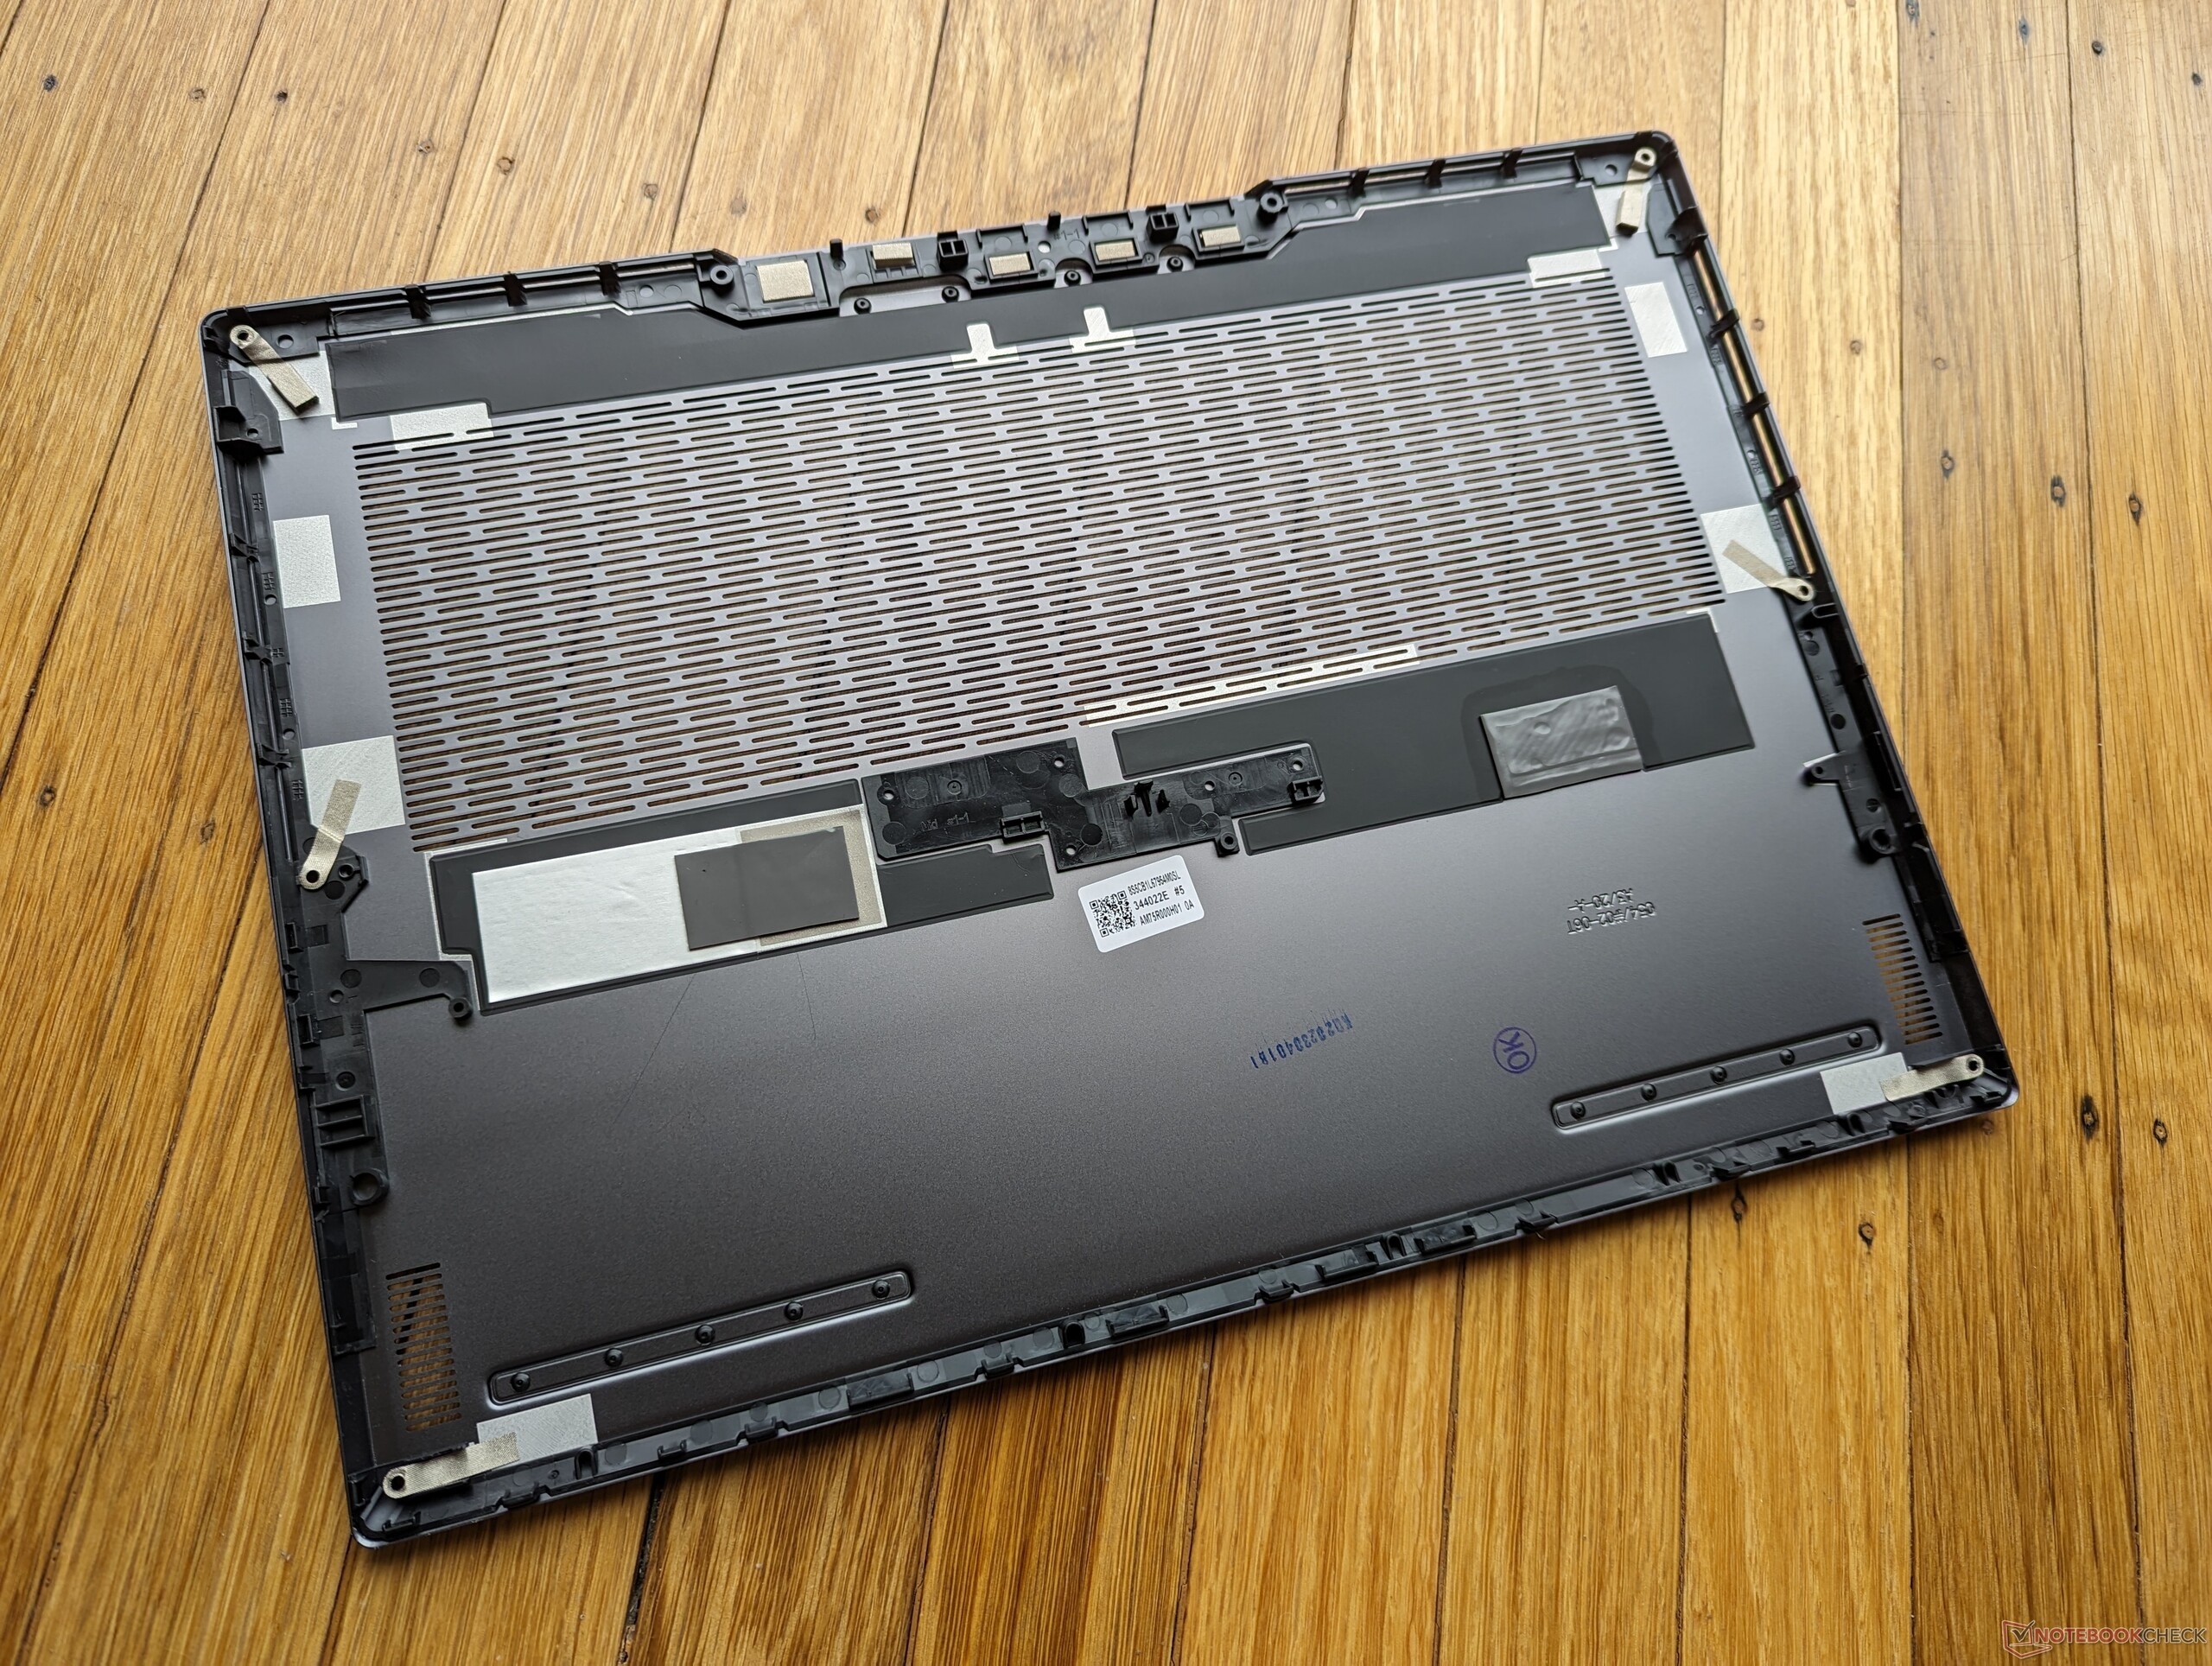
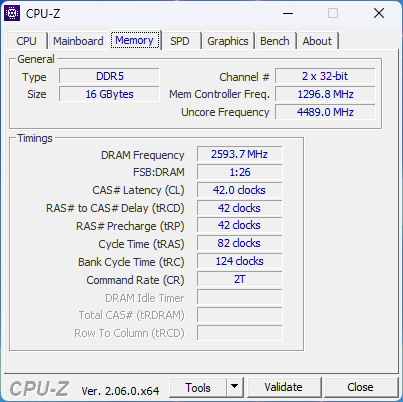
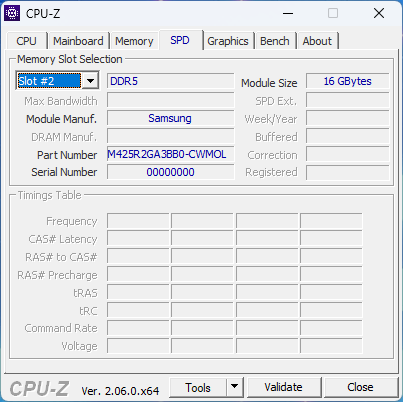
底部面板由八个十字螺丝固定,便于拆卸。用户可以直接接触到两个M.2 2280 PCIe4插槽、WLAN模块和电池。内存包括16GB焊接的DDR5-5200,以及靠近中心的铝制屏蔽层下面的一个可扩展的SODIMM插槽。
配件和保修
除了交流电适配器和文件外,盒子里没有其他额外的东西。如果在美国购买,则适用标准的一年有限制造商保修。
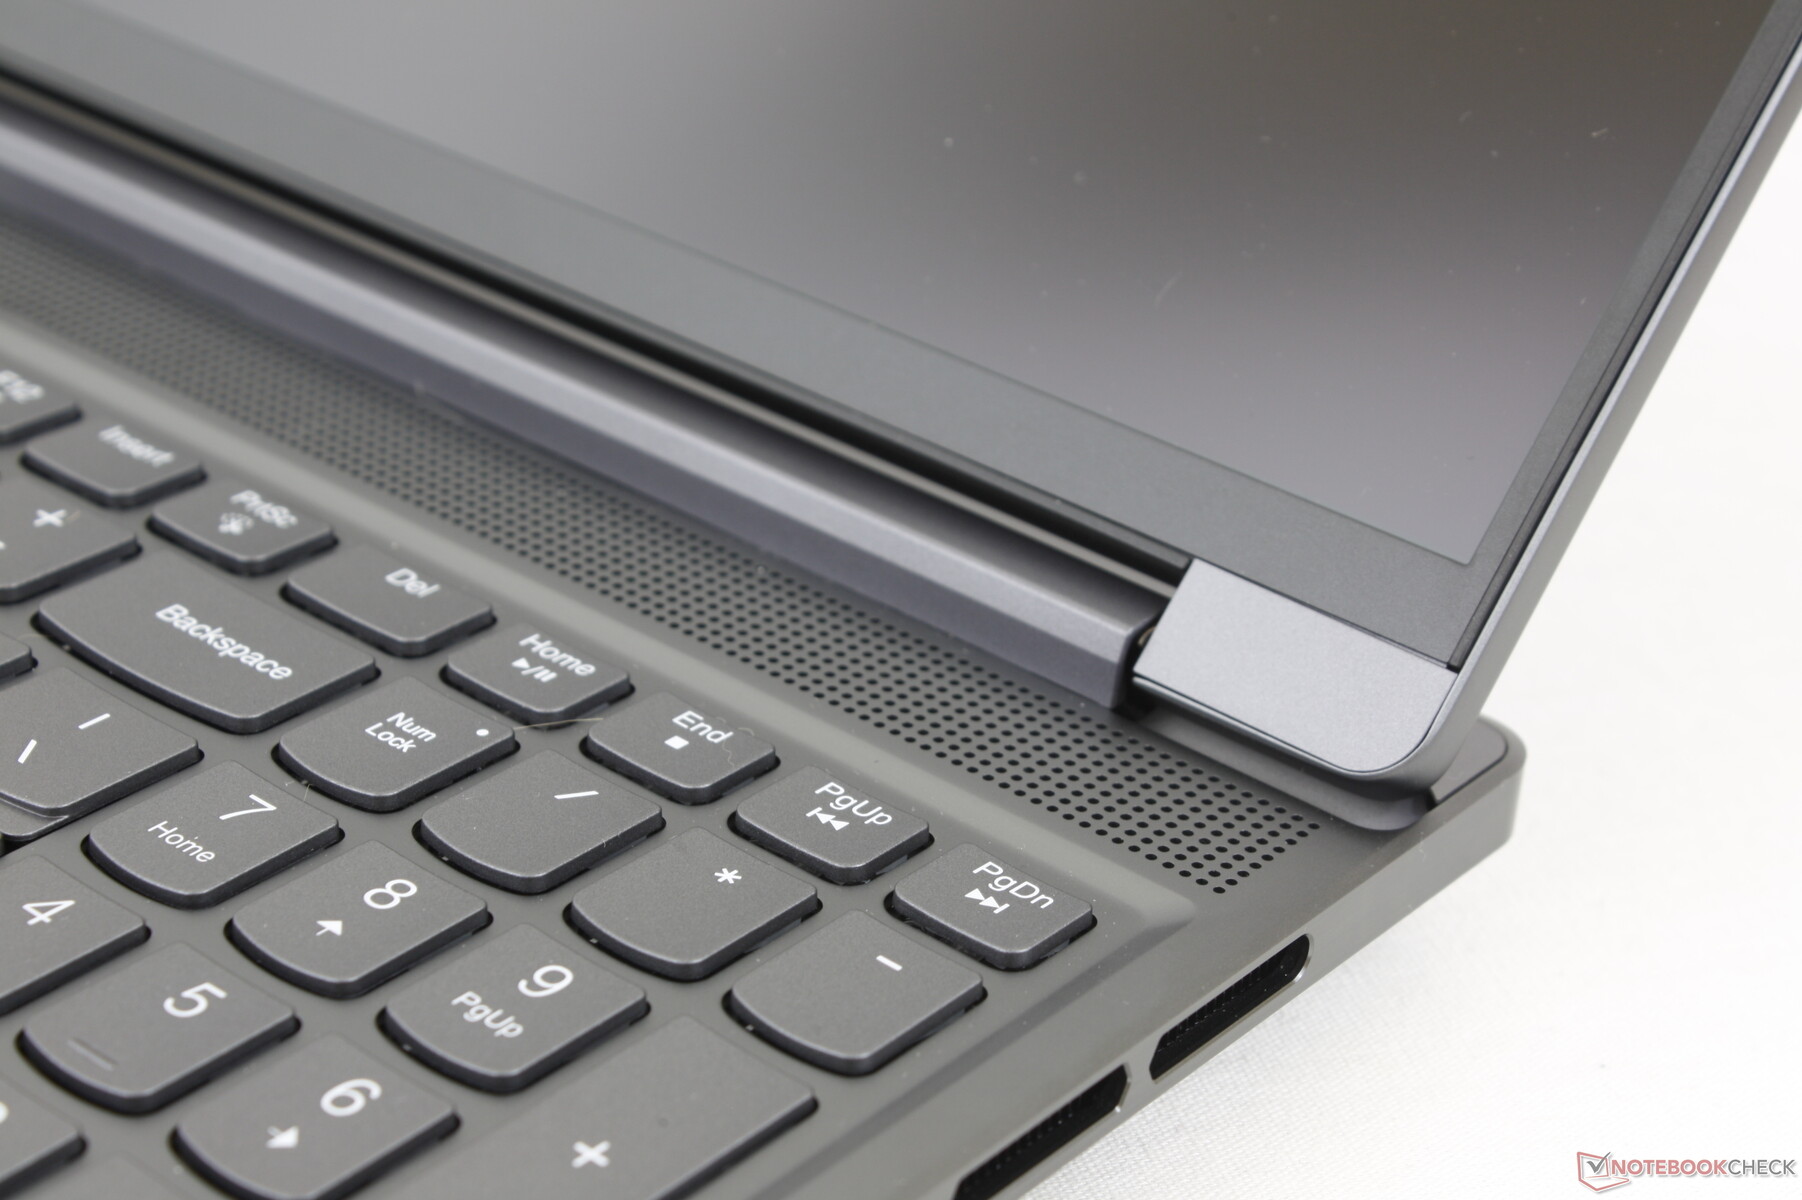
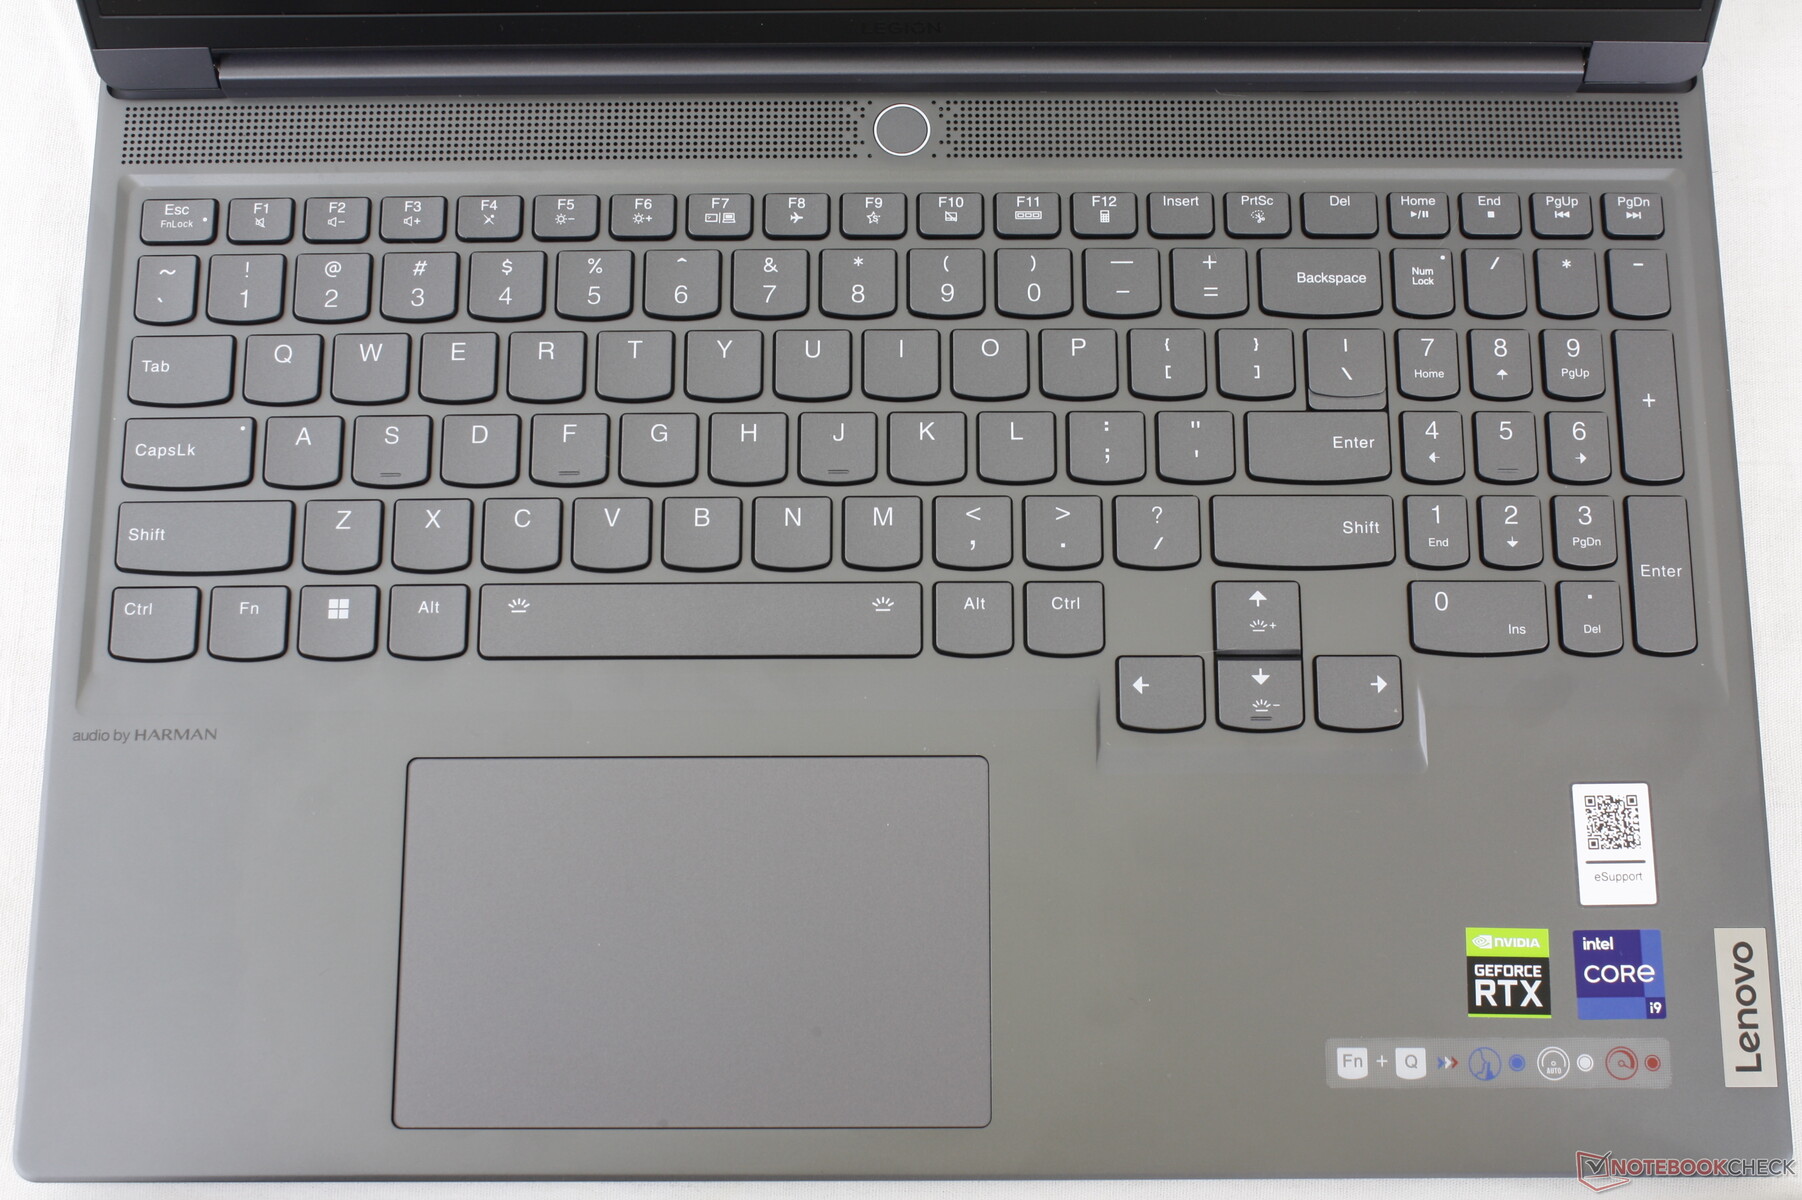
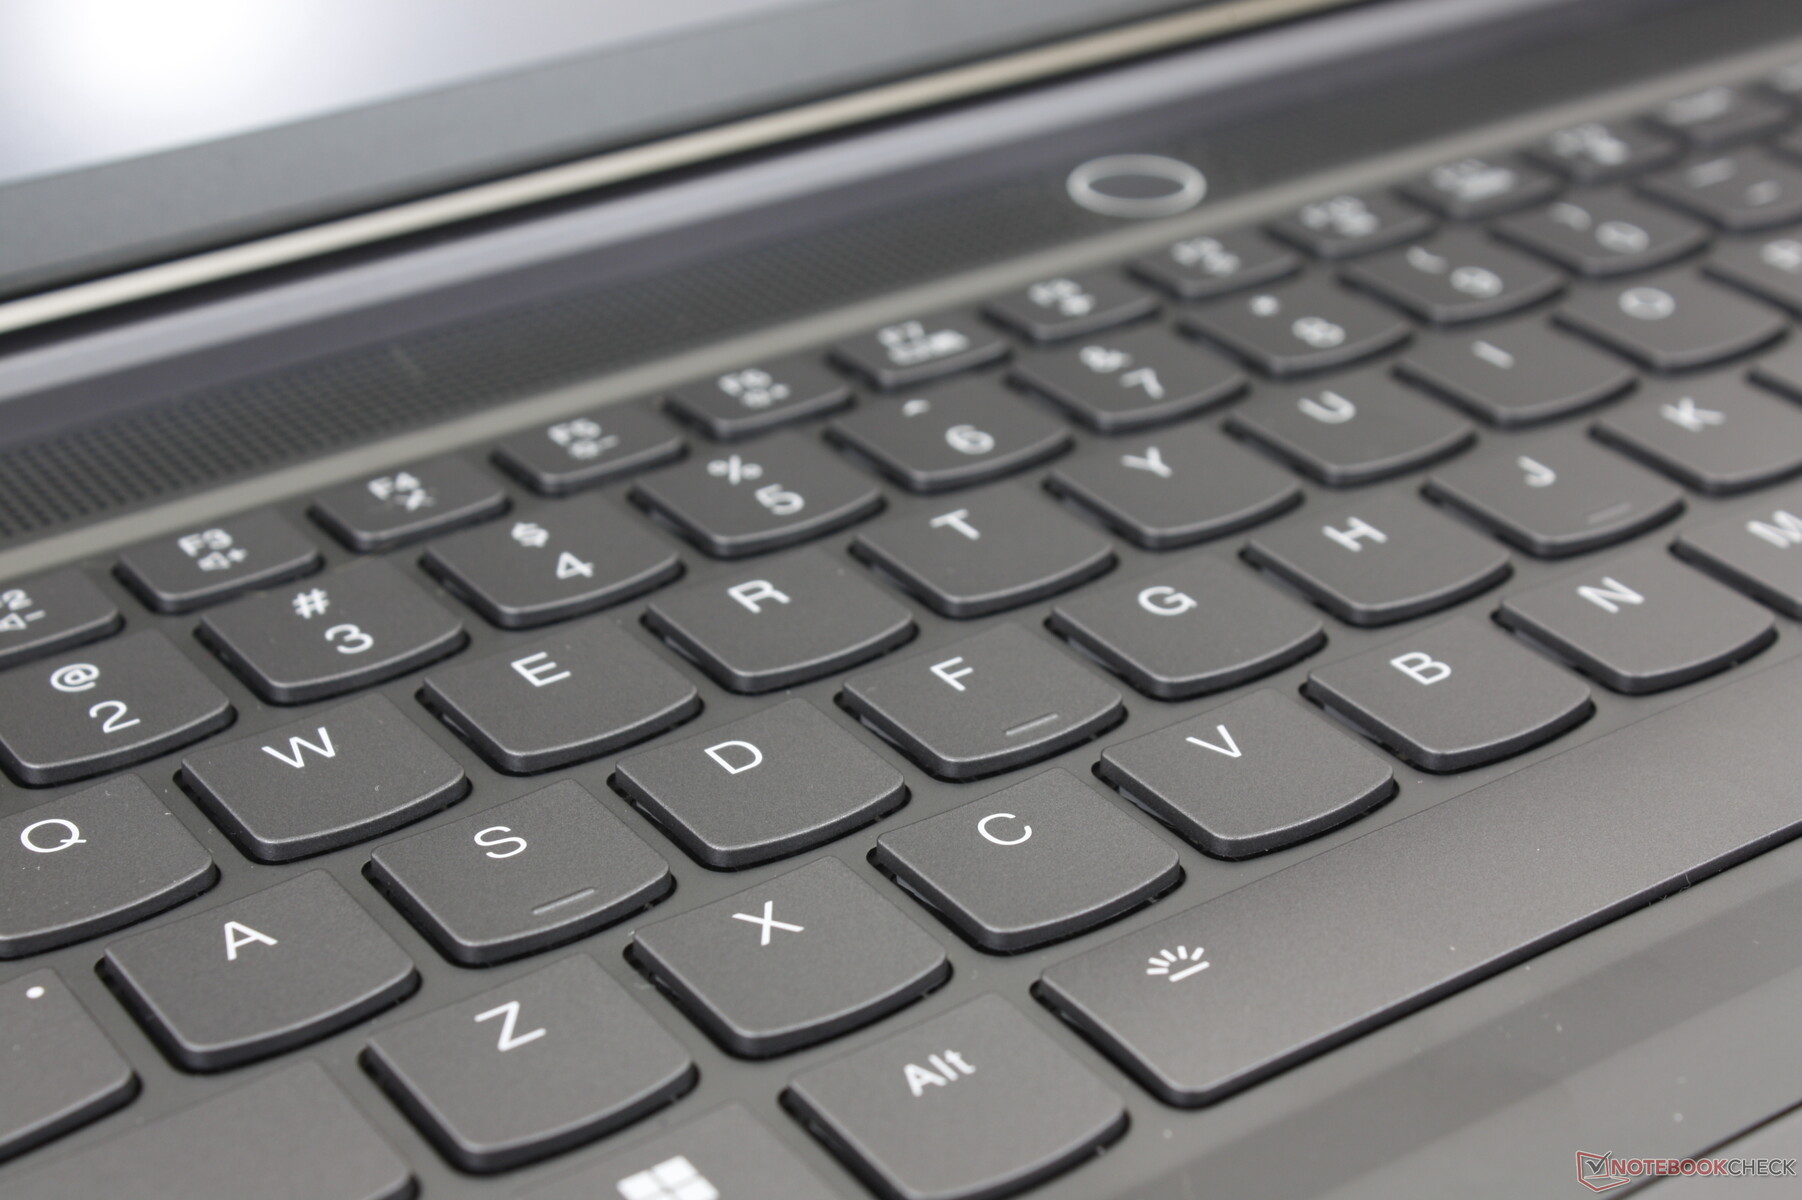
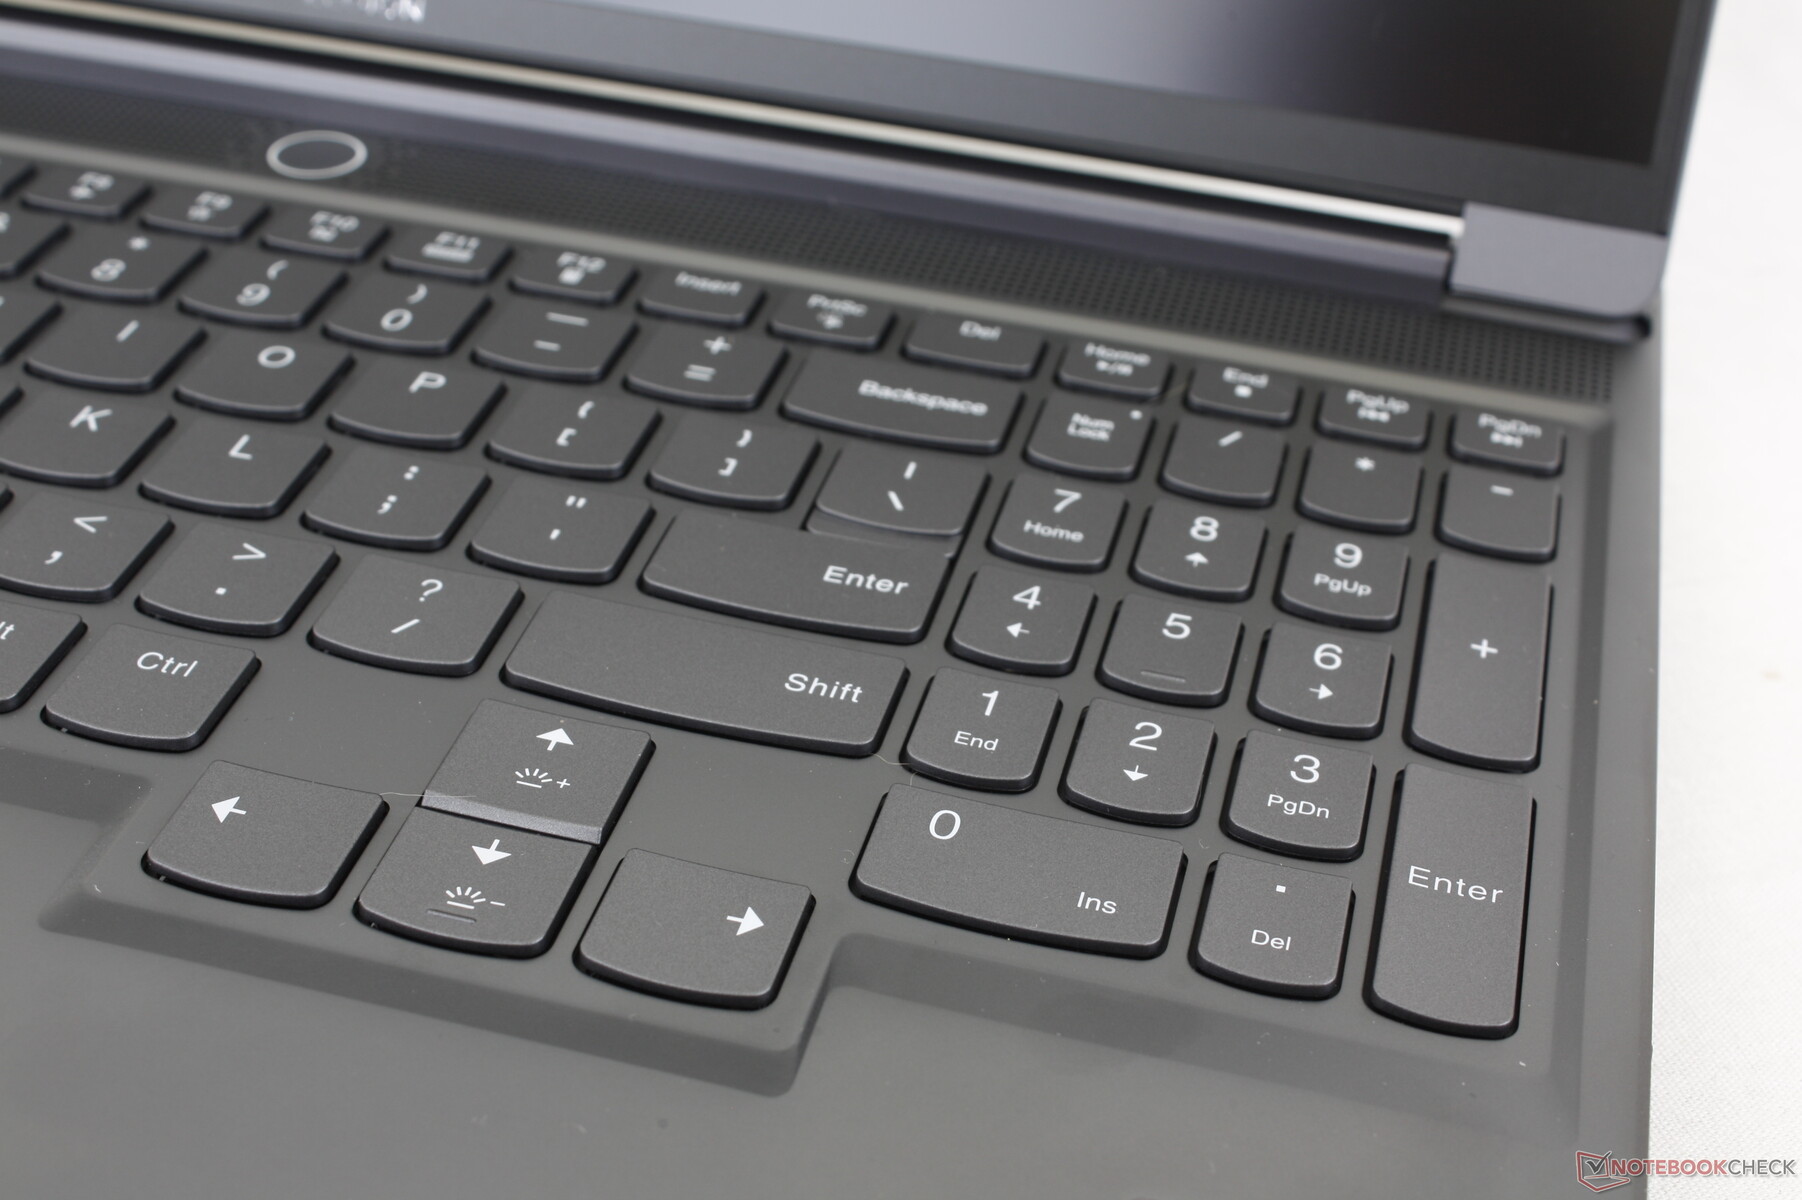
输入设备 - 宽敞,带有每键RGB照明
与去年相比,键盘和点击板没有变化。 Legion Slim 7i G7因此,用户界面体验保持不变。这不一定是件坏事,因为1.5毫米的键程和坚实的反馈与Blade 16的较浅的键相比,打字时仍然更舒适。我们也很欣赏大的方向键,因为这些同样的键在其他游戏笔记本上往往是令人沮丧的小,如 华硕ROG Strix系列或 MSI Pulse系列.
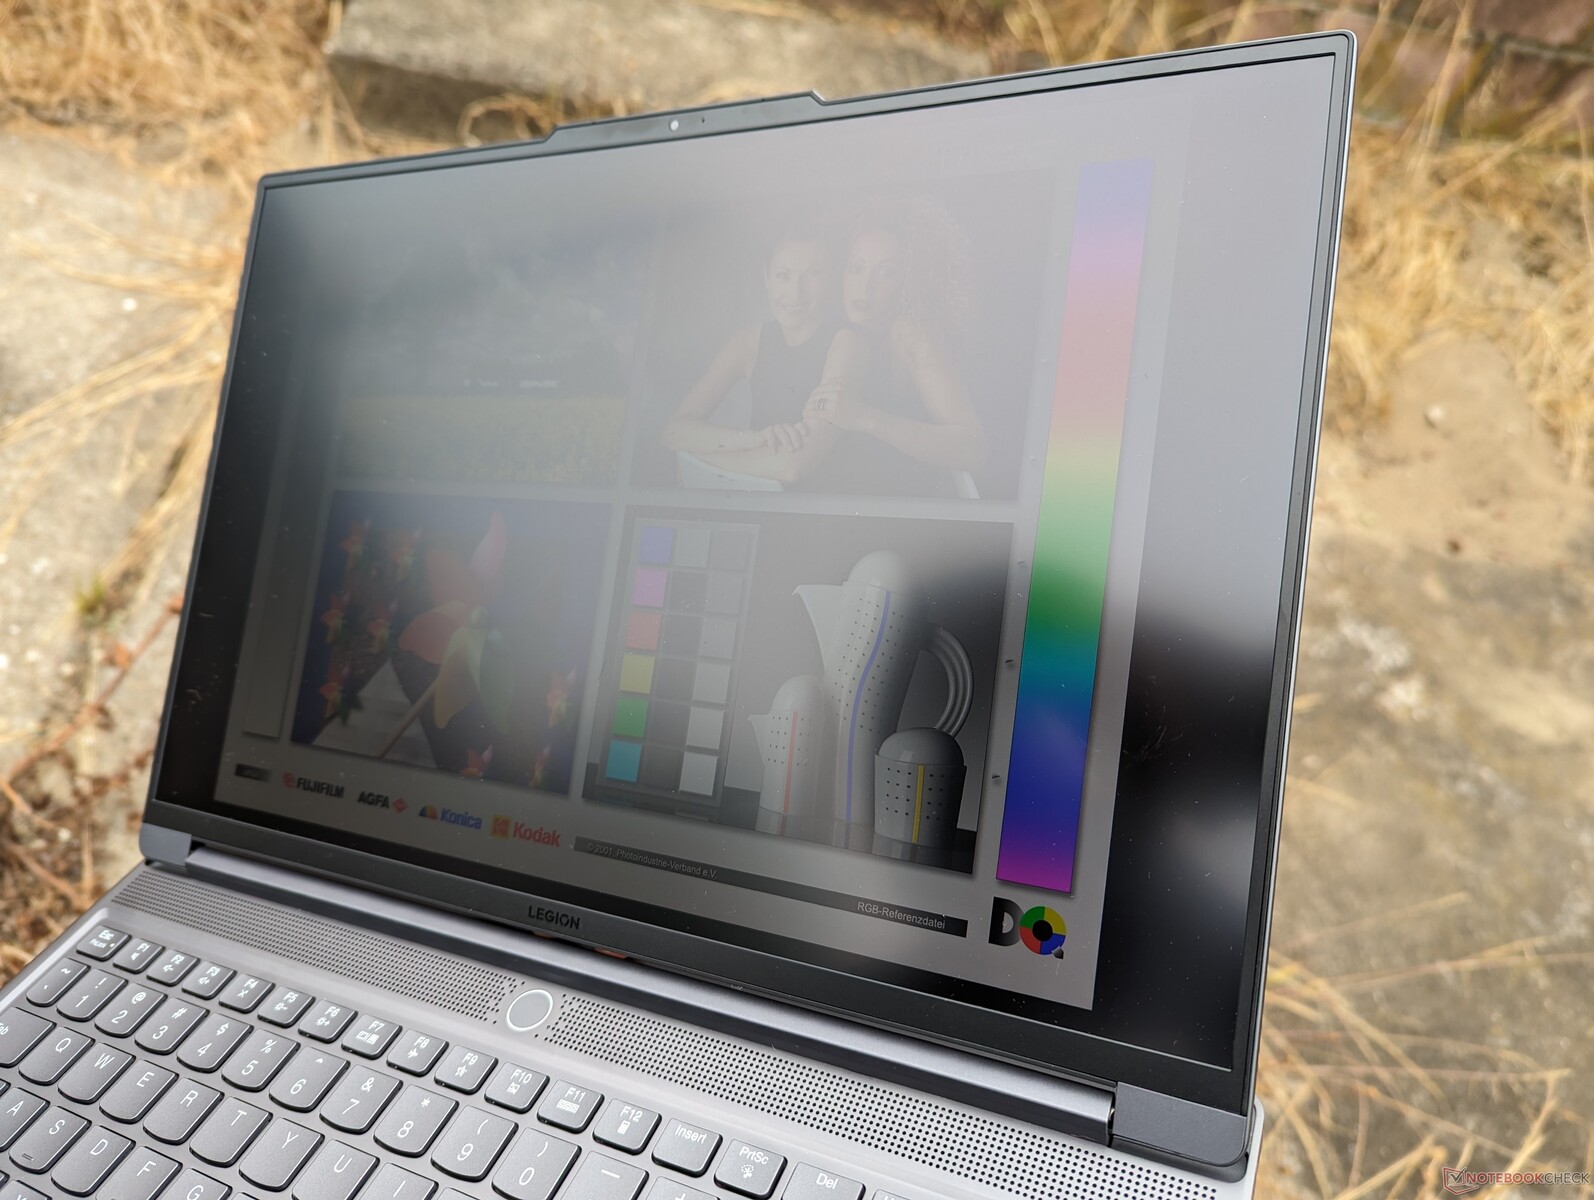
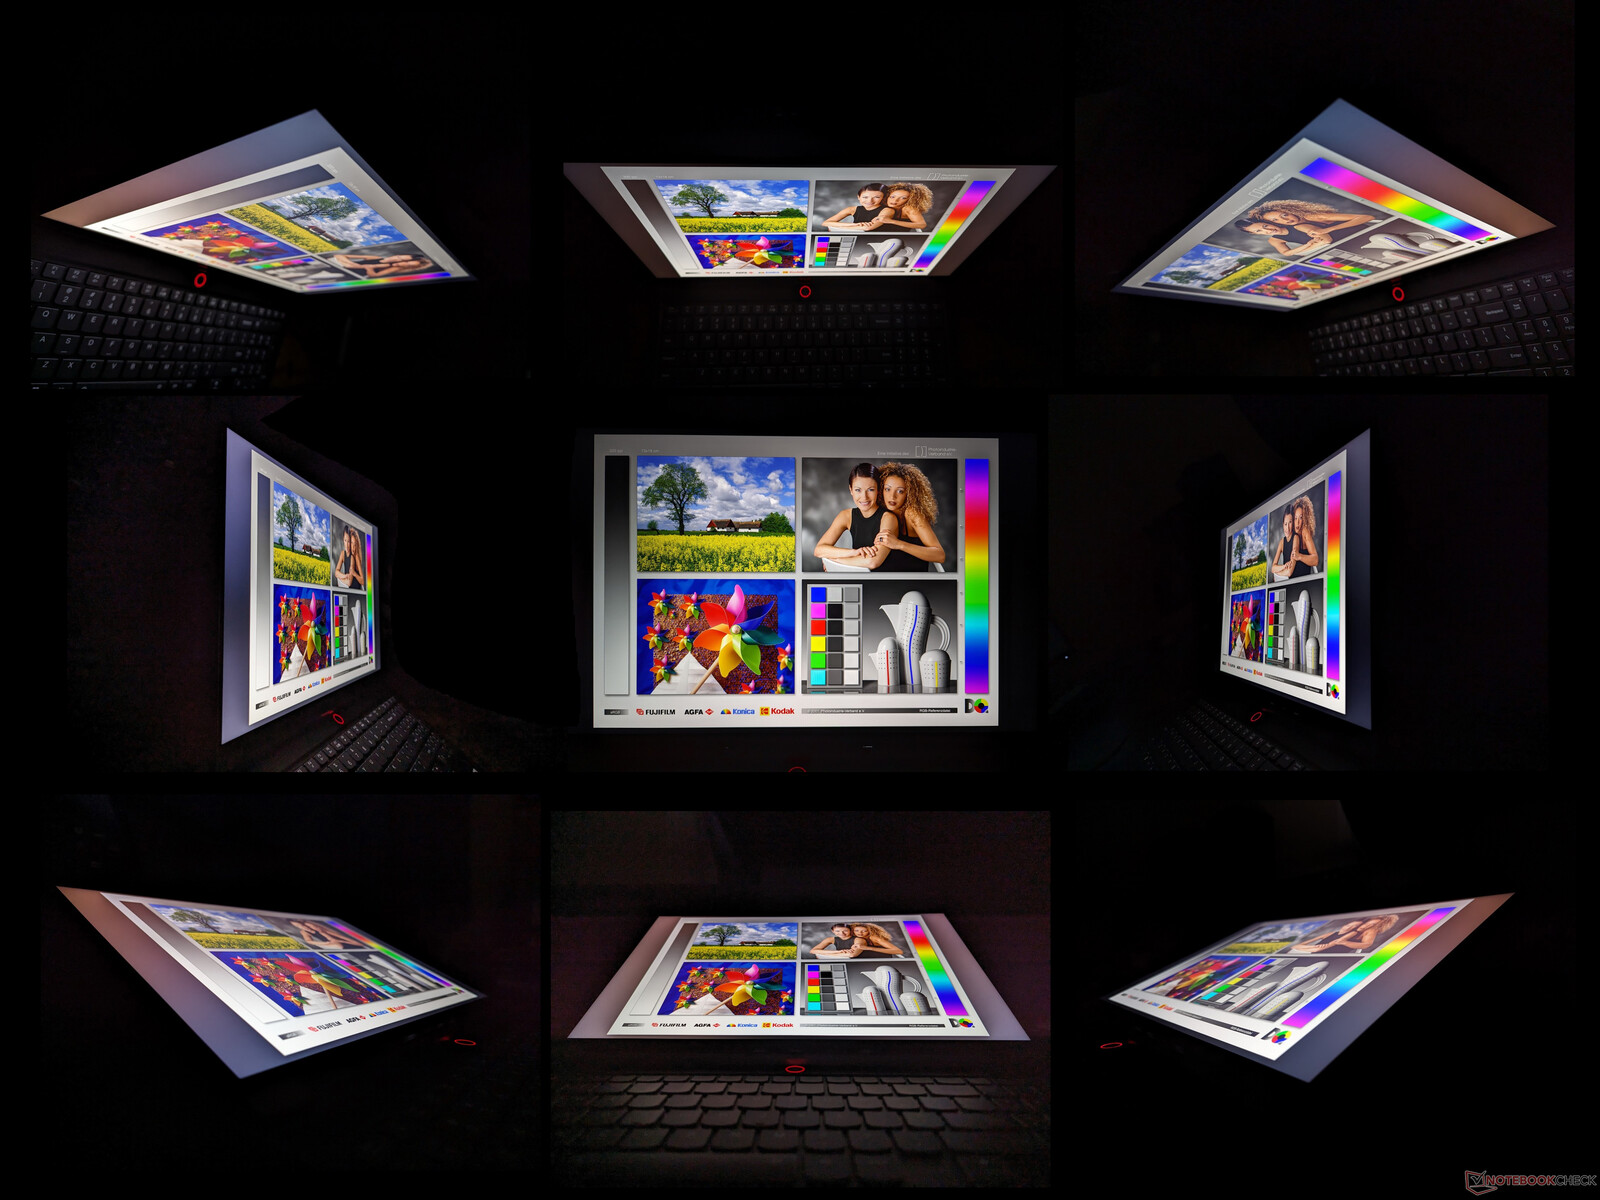
显示器 - 与Legion Pro 7相同
有以下两种面板选择,都支持G-Sync:
- 2560 x 1600, 240 Hz, 5 ms响应时间, 100% sRGB, 500 nits, Pantone认证
- 3000 x 2000,165 Hz,3毫秒响应时间,100% DCI-P3,430尼特,Pantone认证
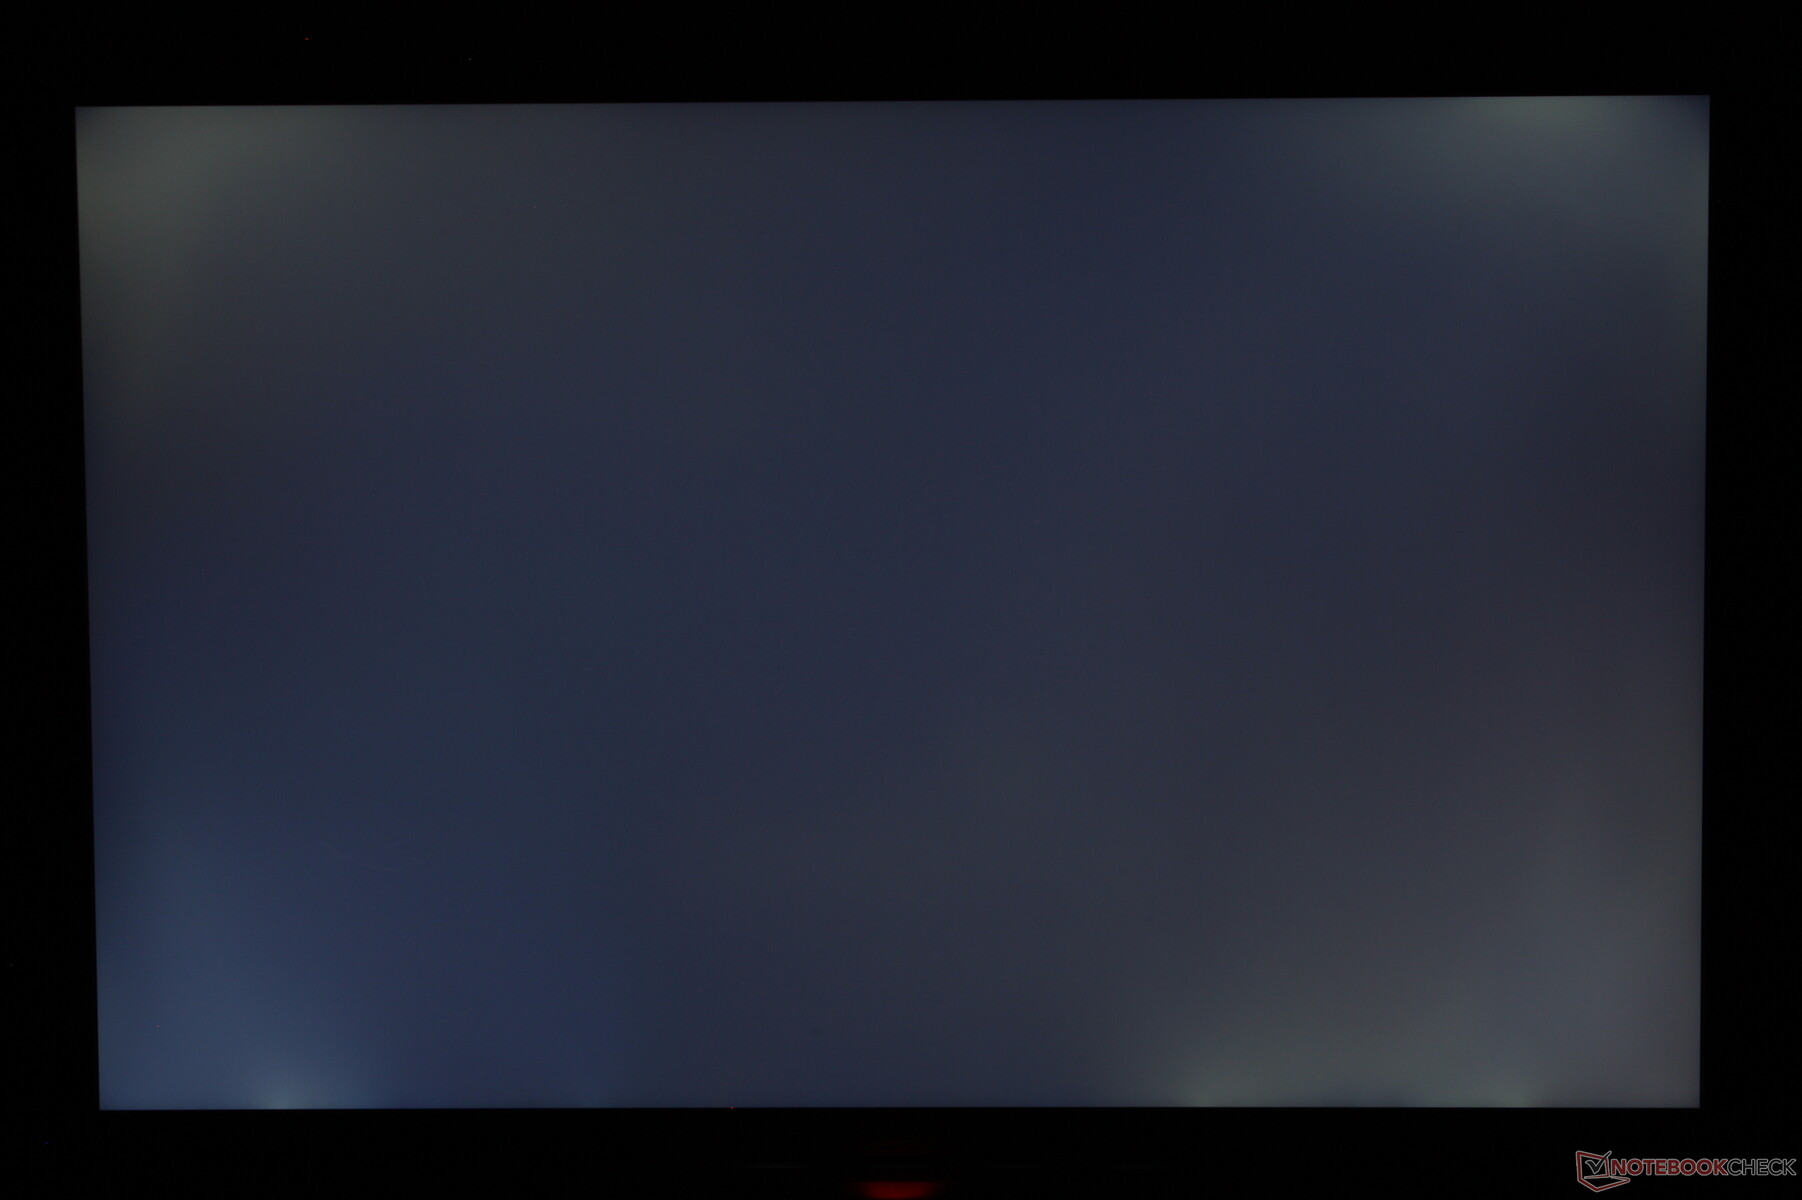
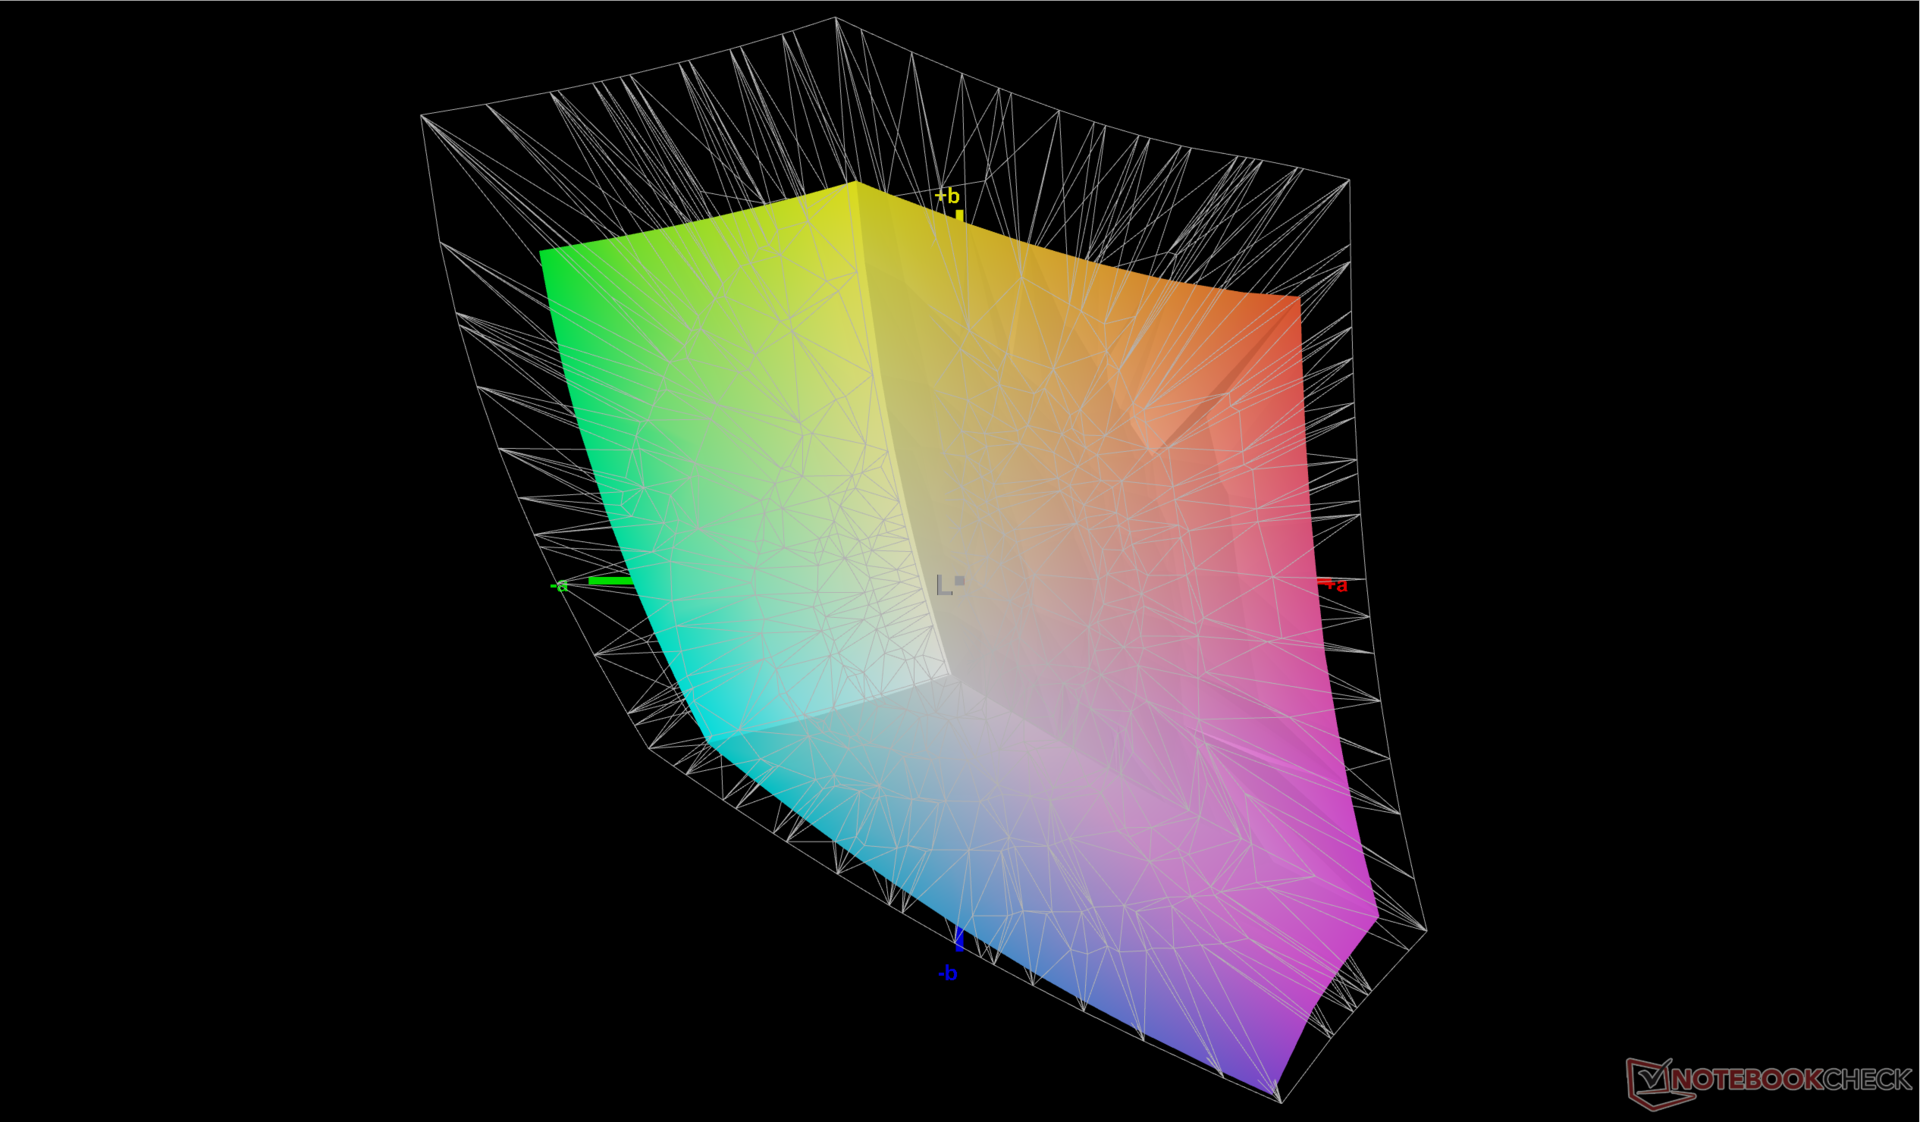
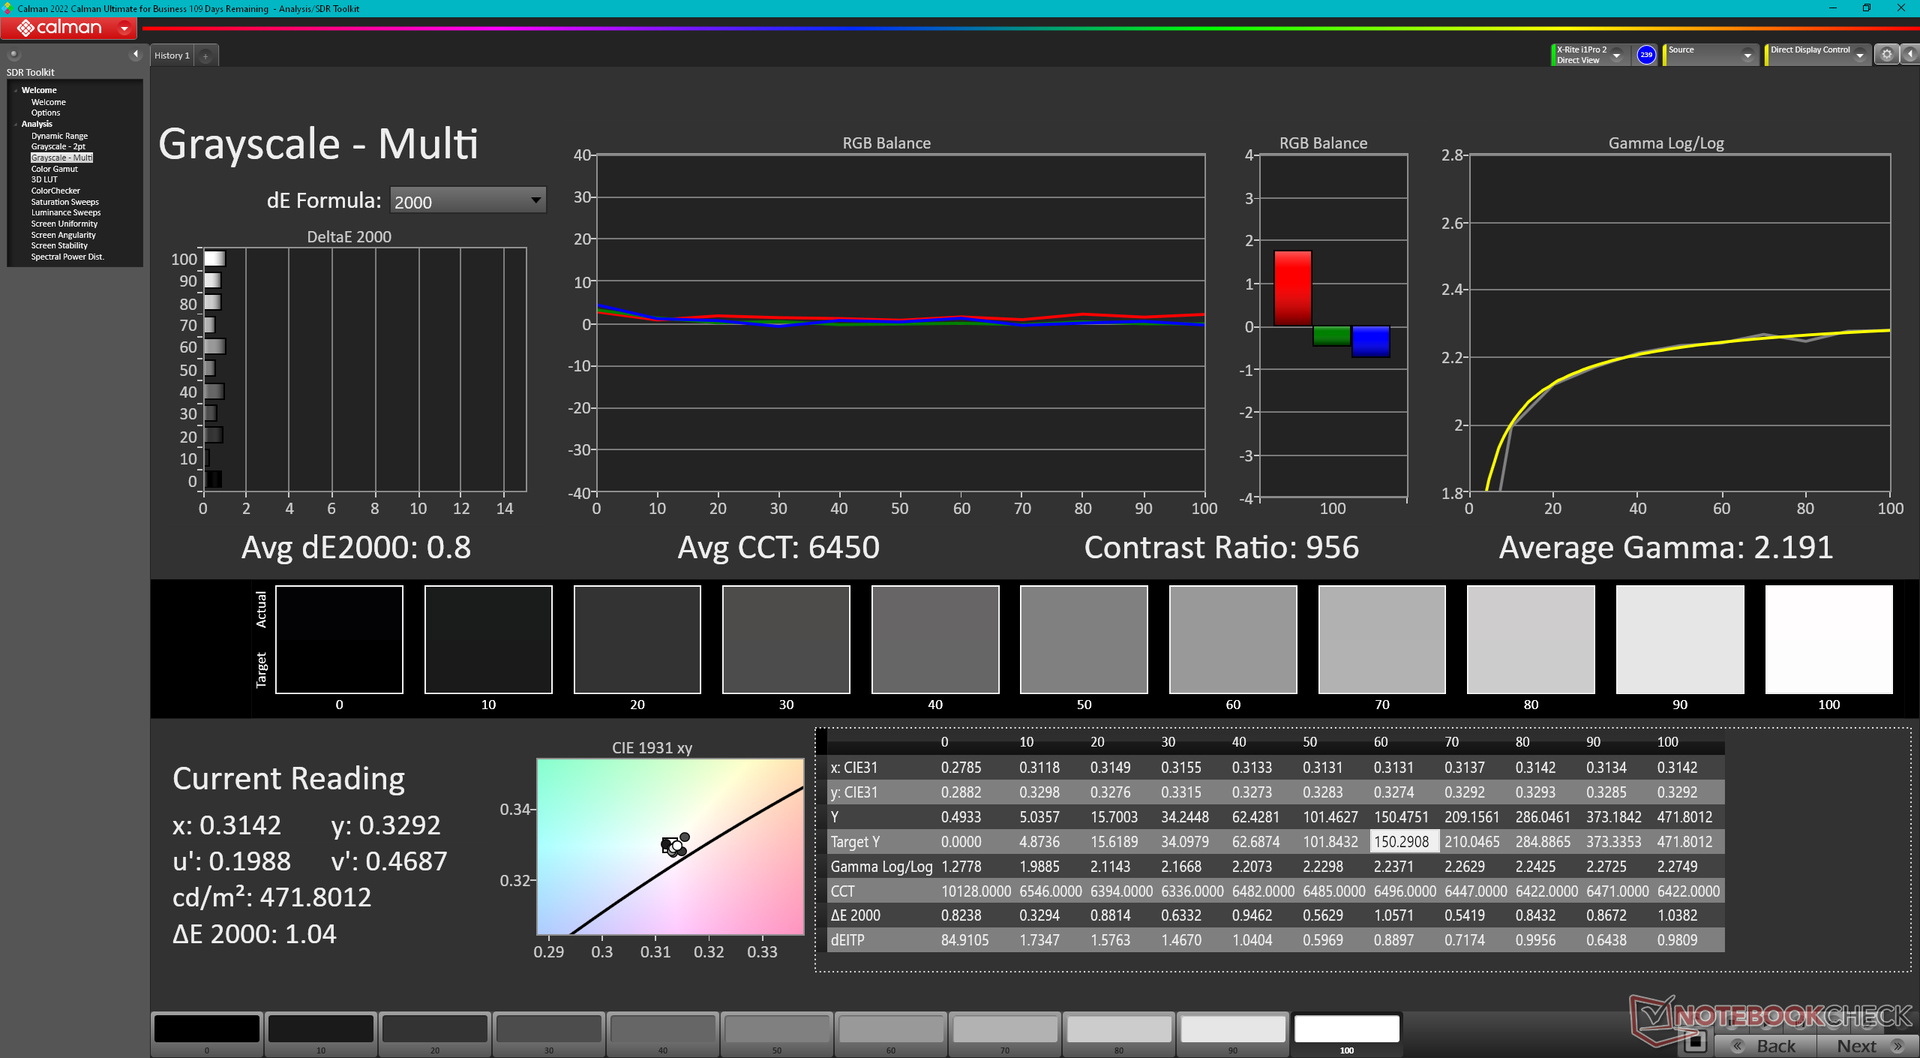
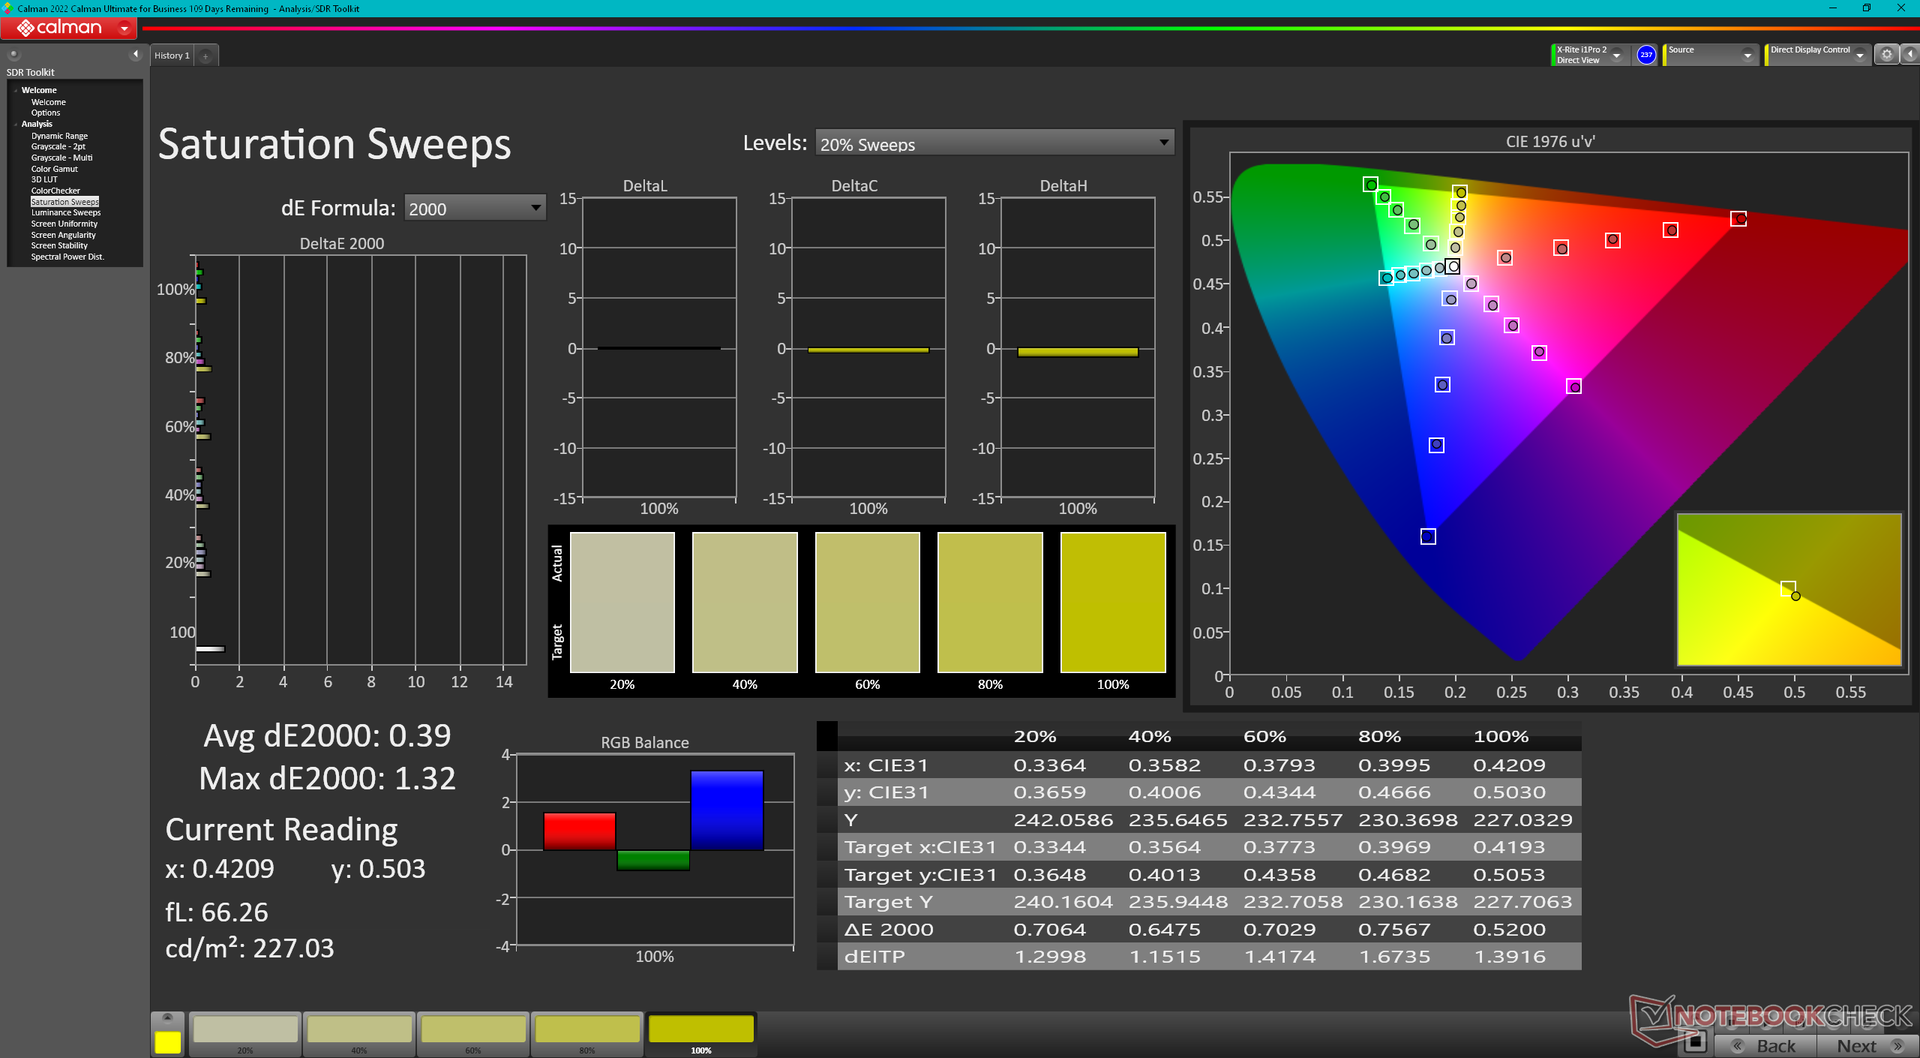
我们的1600p配置配备了完全相同的MNG007DA2-3 IPS面板,在更大和更昂贵的Legion 较大和较昂贵的Pro 7两种型号之间有相同的观看体验。这是一个适合游戏和业余图形编辑的高端面板,尽管它是基本选项。然而,正如下面的截图所示,背光渗漏比我们希望的更明显。

| |||||||||||||||||||||||||
Brightness Distribution: 86 %
Center on Battery: 474.6 cd/m²
Contrast: 1217:1 (Black: 0.39 cd/m²)
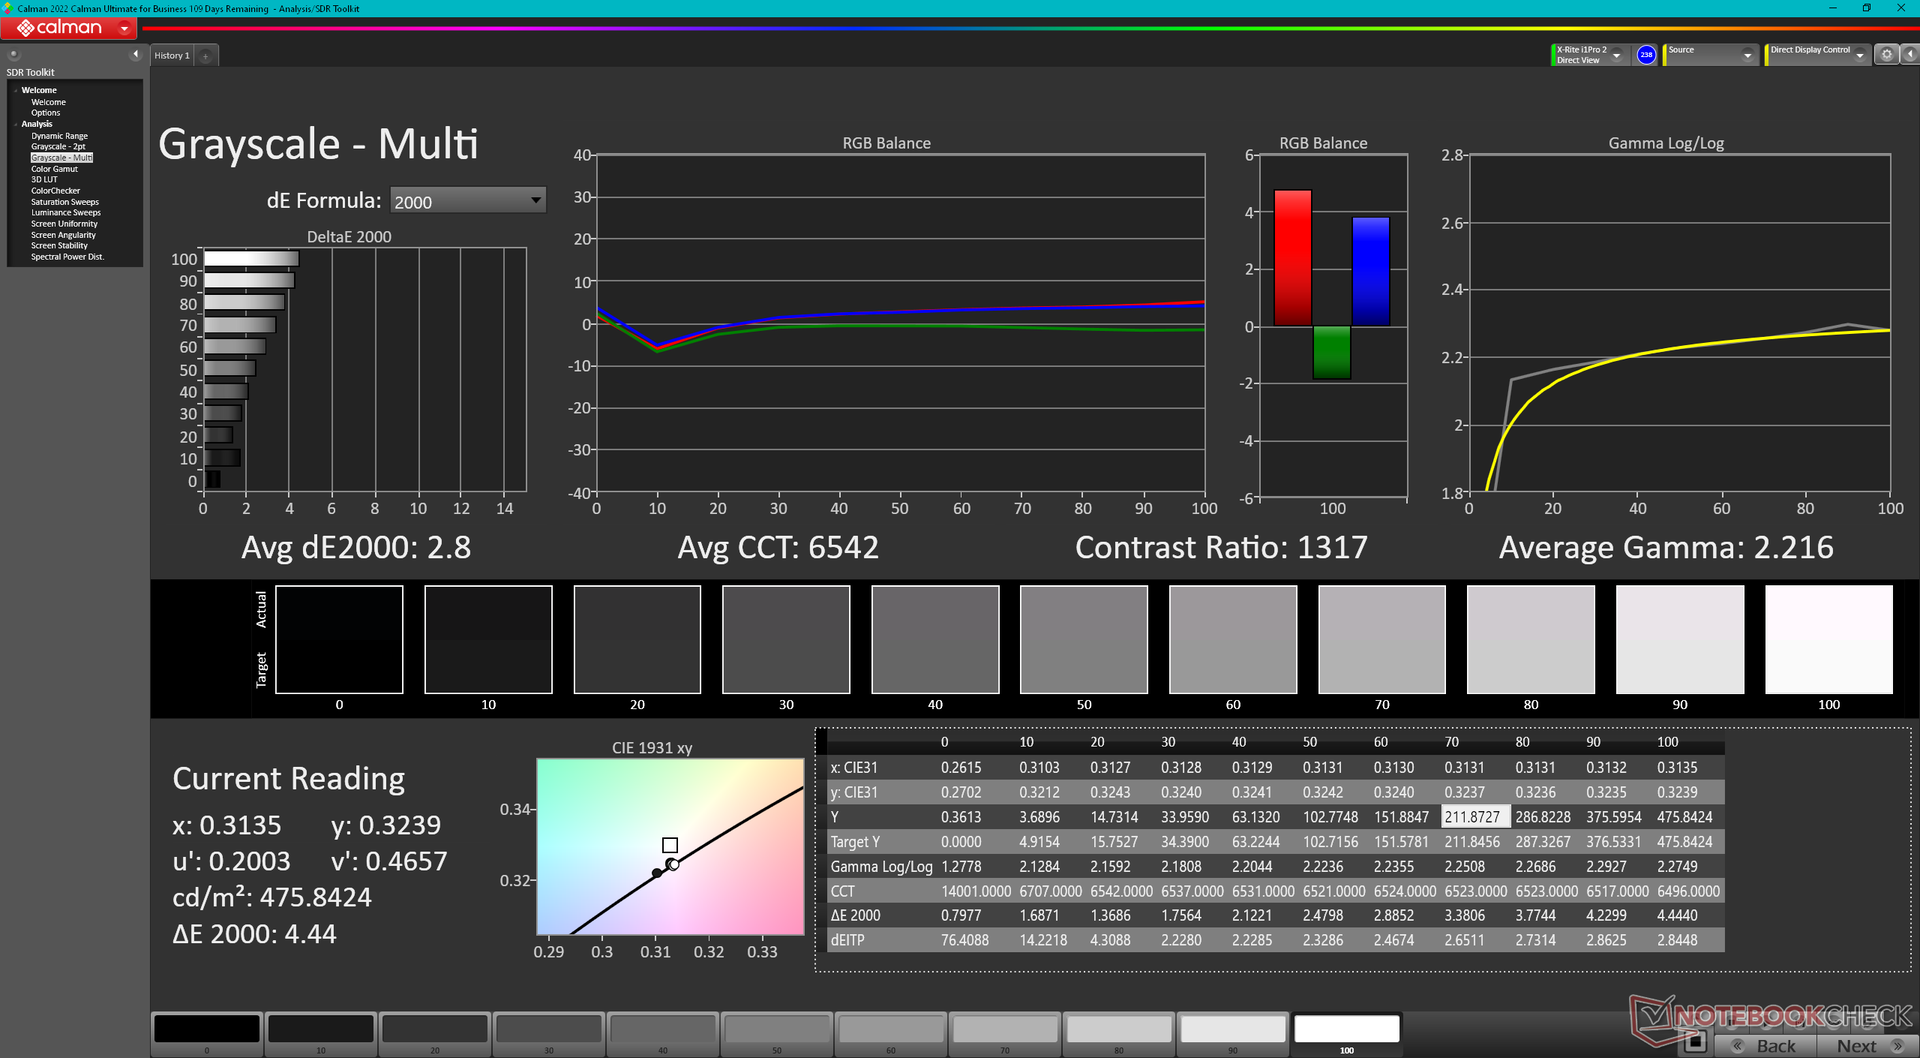
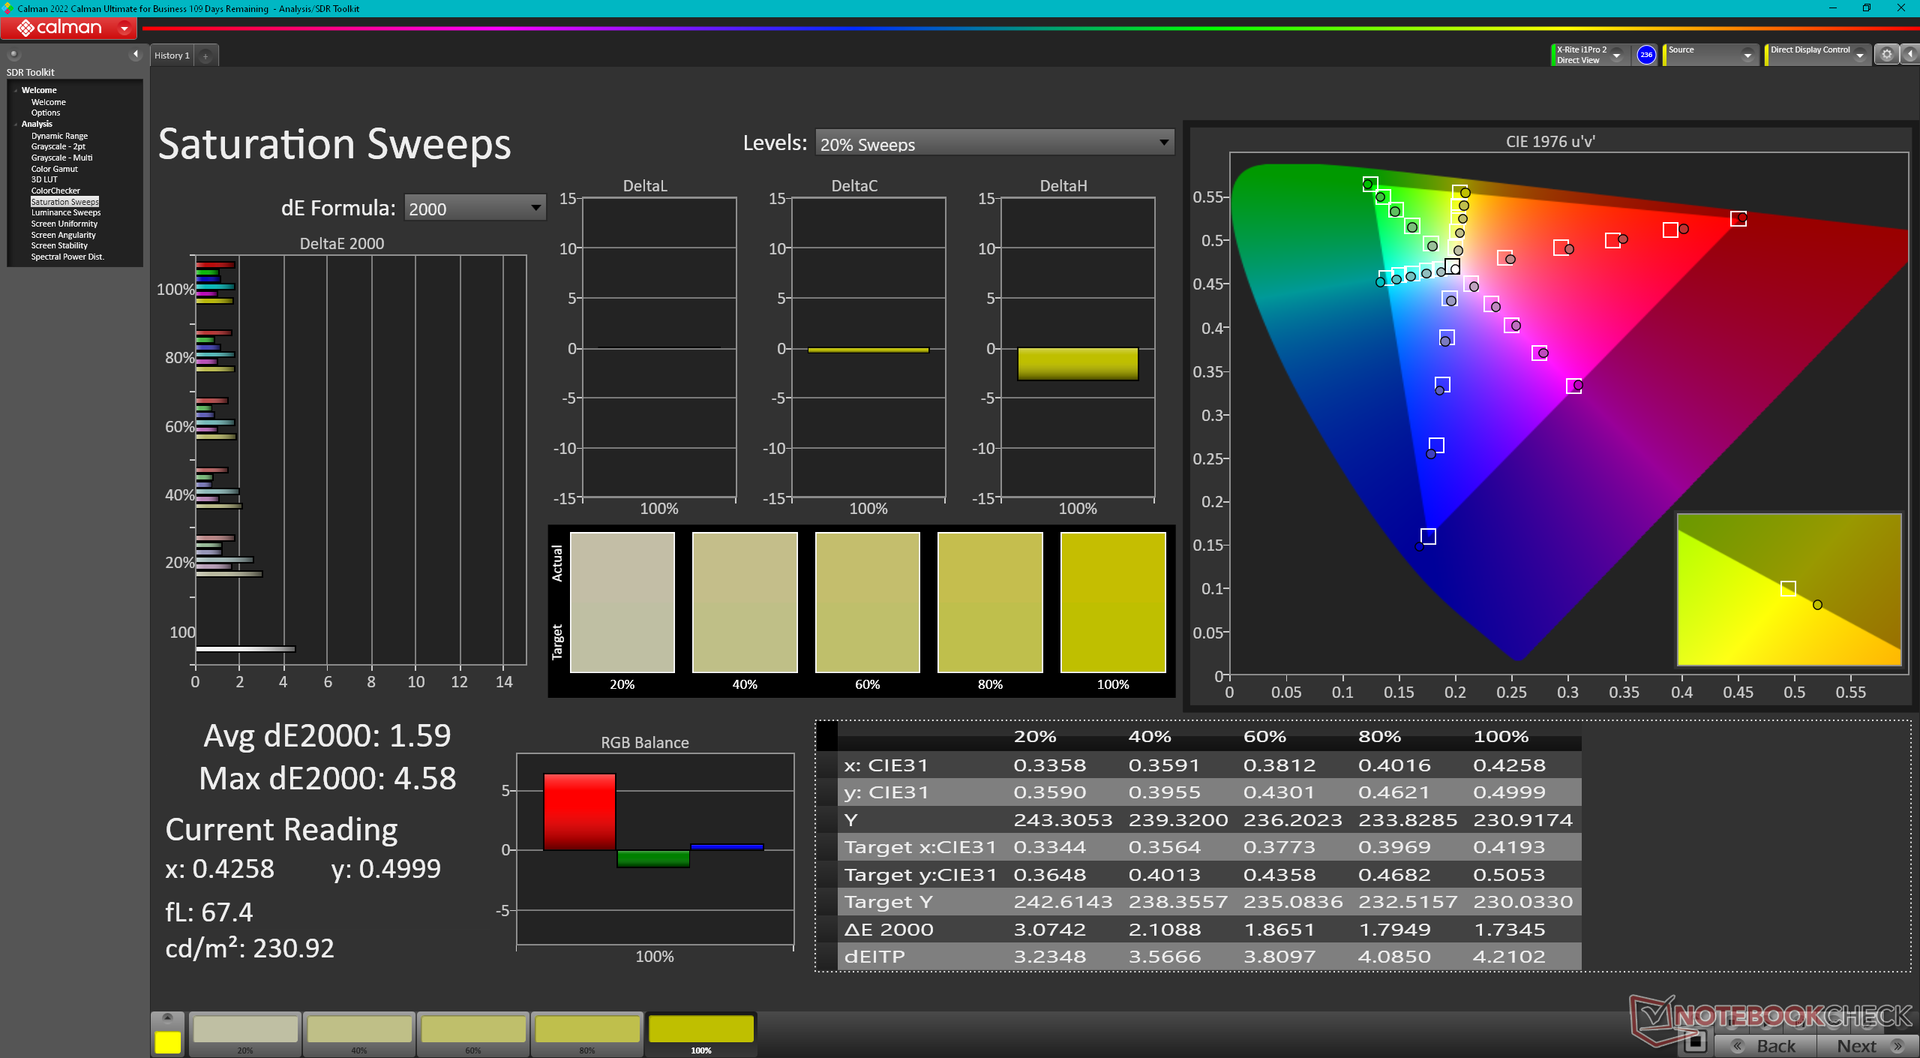
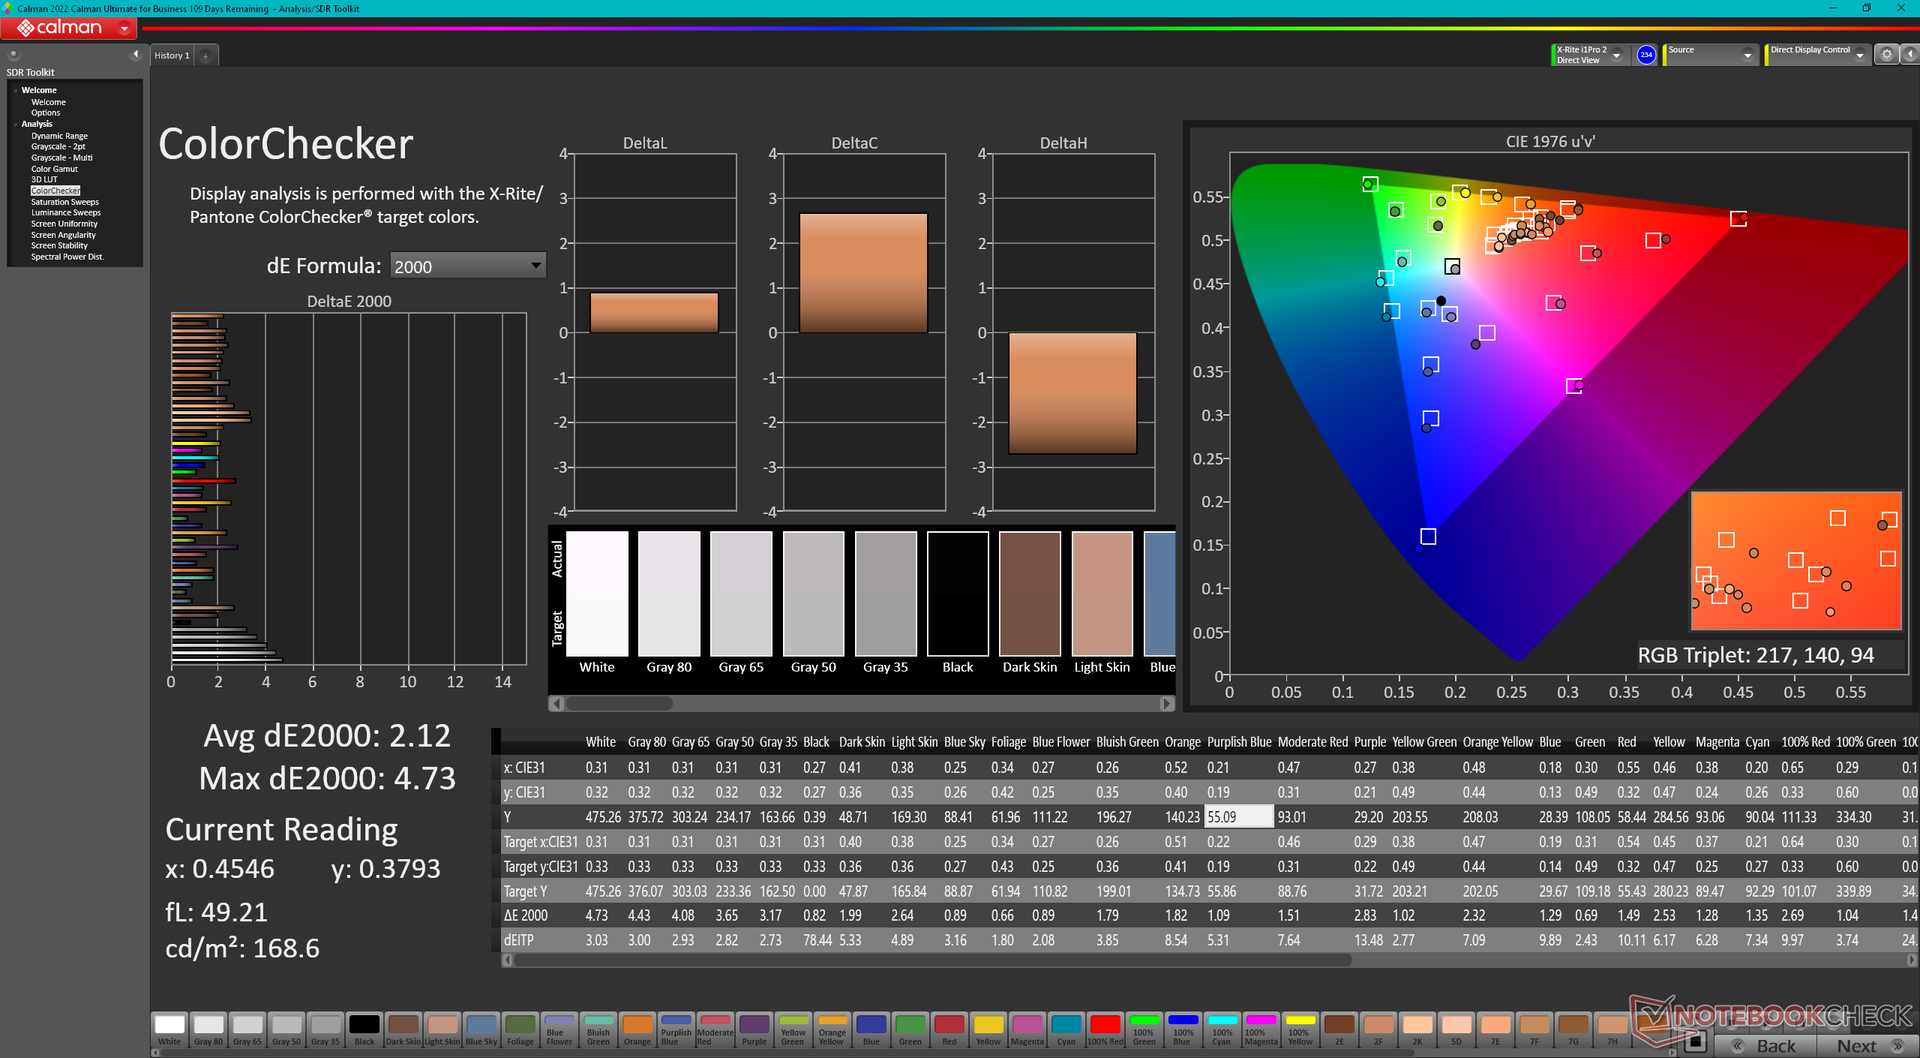
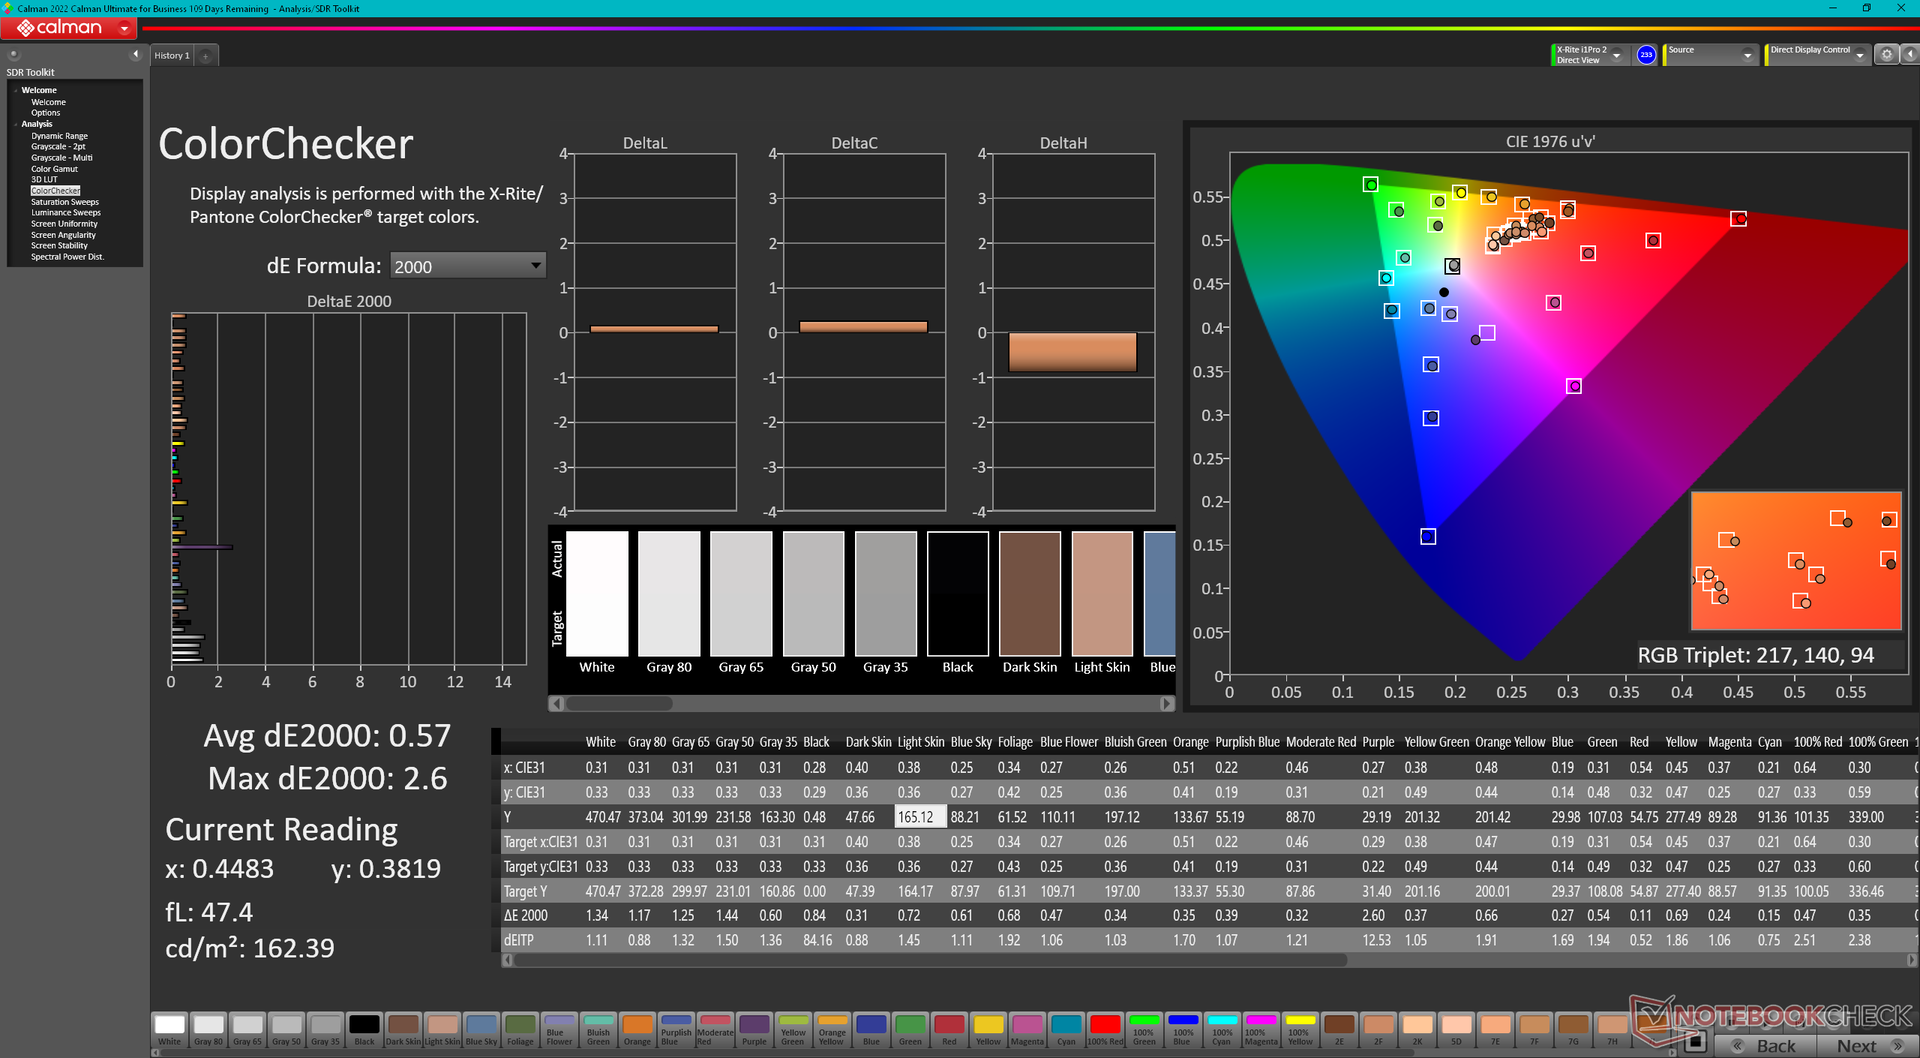
ΔE ColorChecker Calman: 2.12 | ∀{0.5-29.43 Ø4.71}
calibrated: 0.57
ΔE Greyscale Calman: 2.8 | ∀{0.09-98 Ø4.96}
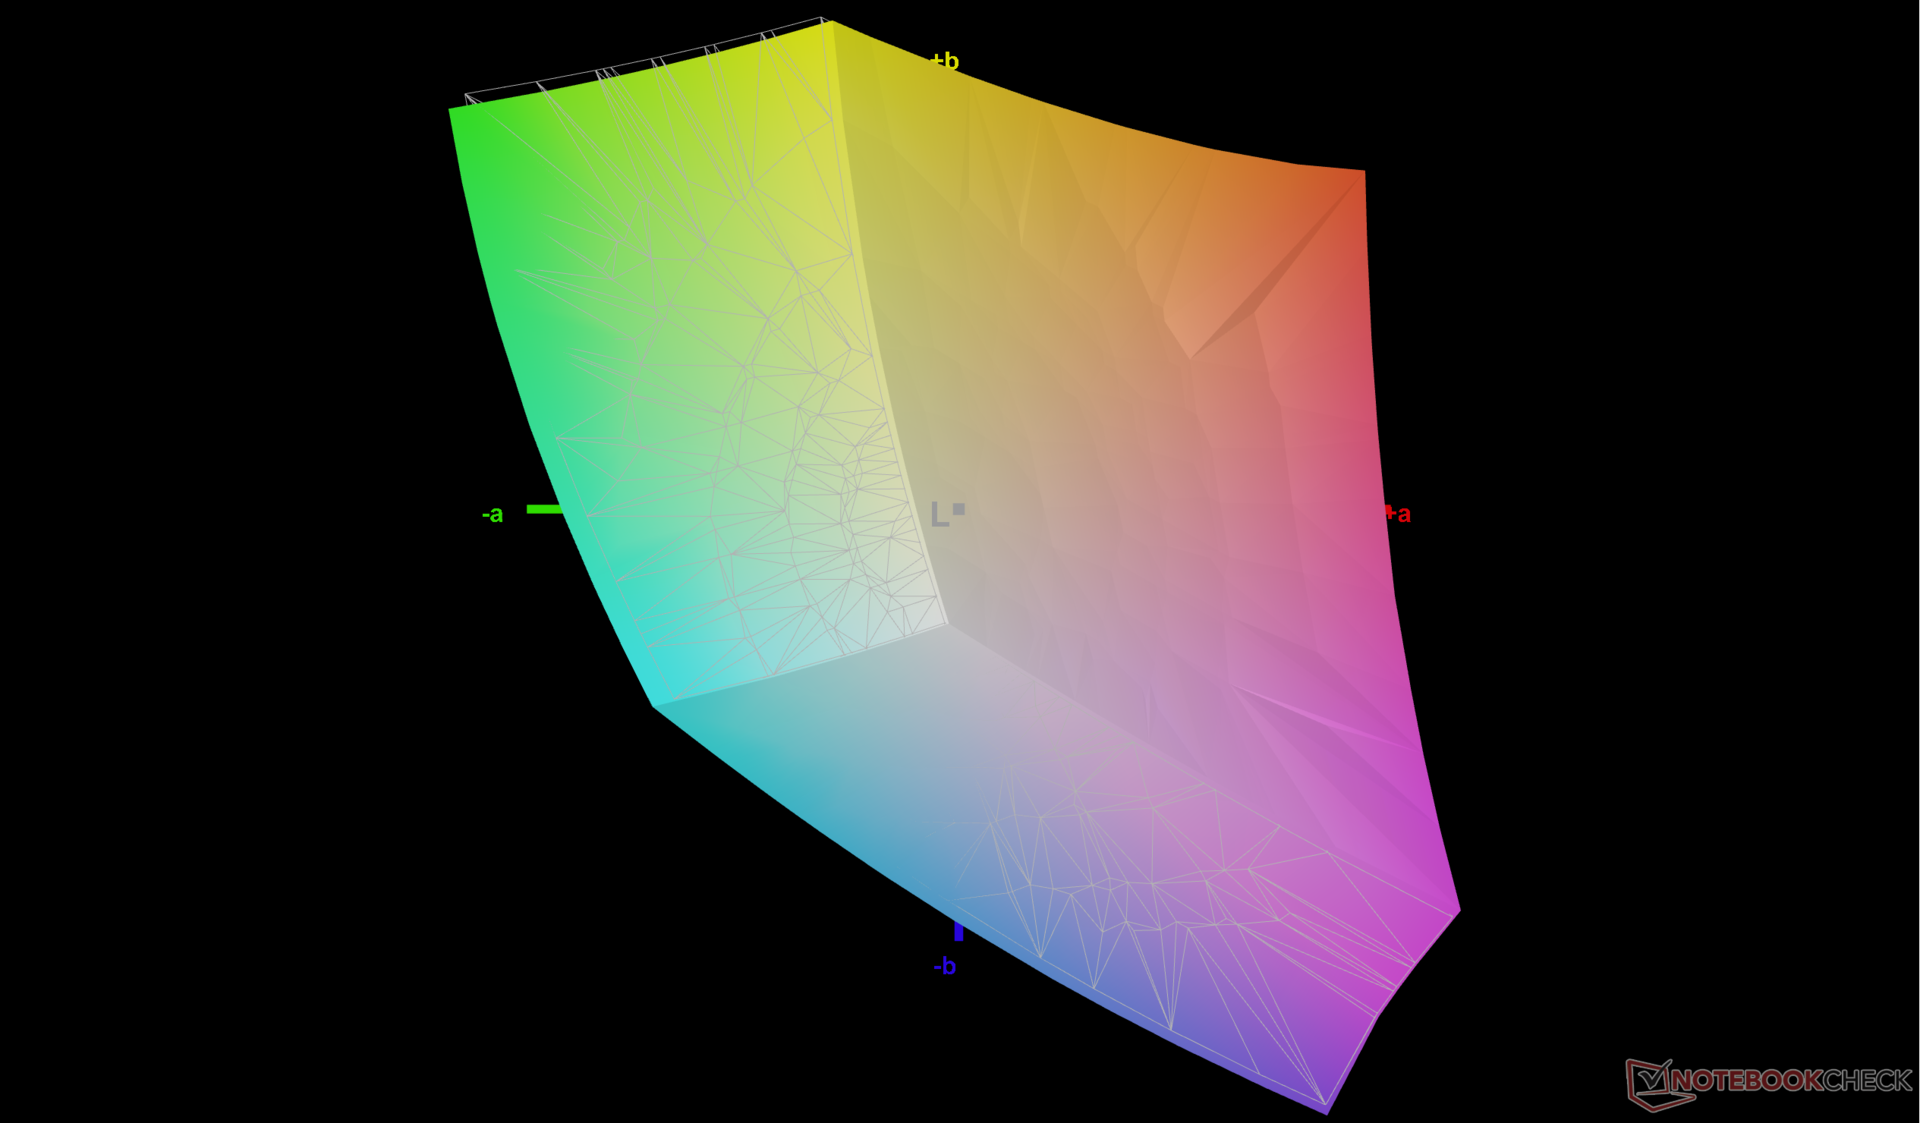
72.5% AdobeRGB 1998 (Argyll 3D)
99.4% sRGB (Argyll 3D)
70.4% Display P3 (Argyll 3D)
Gamma: 2.22
CCT: 6542 K
| Lenovo Legion Slim 7i 16 Gen 8 CSOT T3 MNG007DA2-3, IPS, 2560x1600, 16" | HP Omen 16-wf000 BOE0B7D, IPS, 2560x1440, 16.1" | Alienware x16 R1 BOE NE16NZ4, IPS, 2560x1600, 16" | Lenovo Legion Pro 7 RTX4090 MNG007DA2-3 (CSO1628), IPS, 2560x1600, 16" | Asus ROG Strix G16 G614JZ TL160ADMP03-0, IPS, 2560x1600, 16" | Razer Blade 16 Early 2023 CSOT T3 MNG007DA4-1, IPS, 2560x1600, 16" | |
|---|---|---|---|---|---|---|
| Display | -1% | 21% | -1% | 19% | 22% | |
| Display P3 Coverage (%) | 70.4 | 69 -2% | 99.2 41% | 69.5 -1% | 97 38% | 98.5 40% |
| sRGB Coverage (%) | 99.4 | 99.2 0% | 100 1% | 99.8 0% | 99.9 1% | 100 1% |
| AdobeRGB 1998 Coverage (%) | 72.5 | 71.2 -2% | 88.6 22% | 71.6 -1% | 84.9 17% | 89.7 24% |
| Response Times | 27% | 21% | 29% | 42% | 5% | |
| Response Time Grey 50% / Grey 80% * (ms) | 12 ? | 4.6 ? 62% | 5.1 ? 57% | 10.9 ? 9% | 5.1 ? 57% | 6.6 ? 45% |
| Response Time Black / White * (ms) | 8.9 ? | 9.7 ? -9% | 10.3 ? -16% | 4.6 ? 48% | 6.6 ? 26% | 12 ? -35% |
| PWM Frequency (Hz) | ||||||
| Screen | -5% | -11% | -5% | -4% | -12% | |
| Brightness middle (cd/m²) | 474.6 | 310.9 -34% | 302.2 -36% | 491 3% | 470 -1% | 456.8 -4% |
| Brightness (cd/m²) | 445 | 296 -33% | 285 -36% | 472 6% | 459 3% | 437 -2% |
| Brightness Distribution (%) | 86 | 91 6% | 89 3% | 91 6% | 93 8% | 83 -3% |
| Black Level * (cd/m²) | 0.39 | 0.35 10% | 0.26 33% | 0.4 -3% | 0.42 -8% | 0.35 10% |
| Contrast (:1) | 1217 | 888 -27% | 1162 -5% | 1228 1% | 1119 -8% | 1305 7% |
| Colorchecker dE 2000 * | 2.12 | 2.18 -3% | 1.63 23% | 1.6 25% | 1.86 12% | 3.7 -75% |
| Colorchecker dE 2000 max. * | 4.73 | 3.58 24% | 4.13 13% | 5.15 -9% | 3.87 18% | 6.42 -36% |
| Colorchecker dE 2000 calibrated * | 0.57 | 0.52 9% | 1.17 -105% | 0.97 -70% | 0.93 -63% | 0.66 -16% |
| Greyscale dE 2000 * | 2.8 | 2.8 -0% | 2.5 11% | 3 -7% | 2.7 4% | 2.6 7% |
| Gamma | 2.22 99% | 2.18 101% | 2.23 99% | 2.211 100% | 2.246 98% | 2.3 96% |
| CCT | 6542 99% | 6002 108% | 6590 99% | 6979 93% | 6711 97% | 6108 106% |
| Total Average (Program / Settings) | 7% /
0% | 10% /
0% | 8% /
1% | 19% /
7% | 5% /
-3% |
* ... smaller is better
这款显示器经过预先校准,其平均灰度和色彩deltaE值分别为2.8和2.12。用X-Rite色度计对其进行校准,将进一步提高这些平均值,分别为0.8和0.57。因此,最终用户校准并不是完全必要的,但我们经过校准的ICM配置文件还是可以在上面免费提供给感兴趣的用户。
Display Response Times
| ↔ Response Time Black to White | ||
|---|---|---|
| 8.9 ms ... rise ↗ and fall ↘ combined | ↗ 5.1 ms rise | 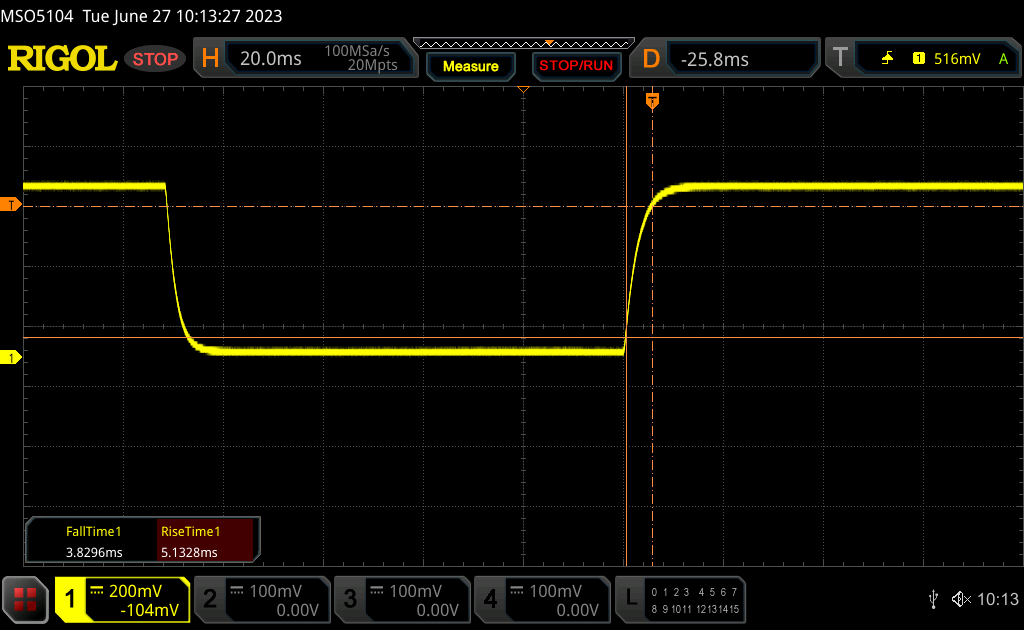 |
| ↘ 3.8 ms fall | ||
| The screen shows fast response rates in our tests and should be suited for gaming. In comparison, all tested devices range from 0.1 (minimum) to 240 (maximum) ms. » 25 % of all devices are better. This means that the measured response time is better than the average of all tested devices (19.8 ms). | ||
| ↔ Response Time 50% Grey to 80% Grey | ||
| 12 ms ... rise ↗ and fall ↘ combined | ↗ 6 ms rise | 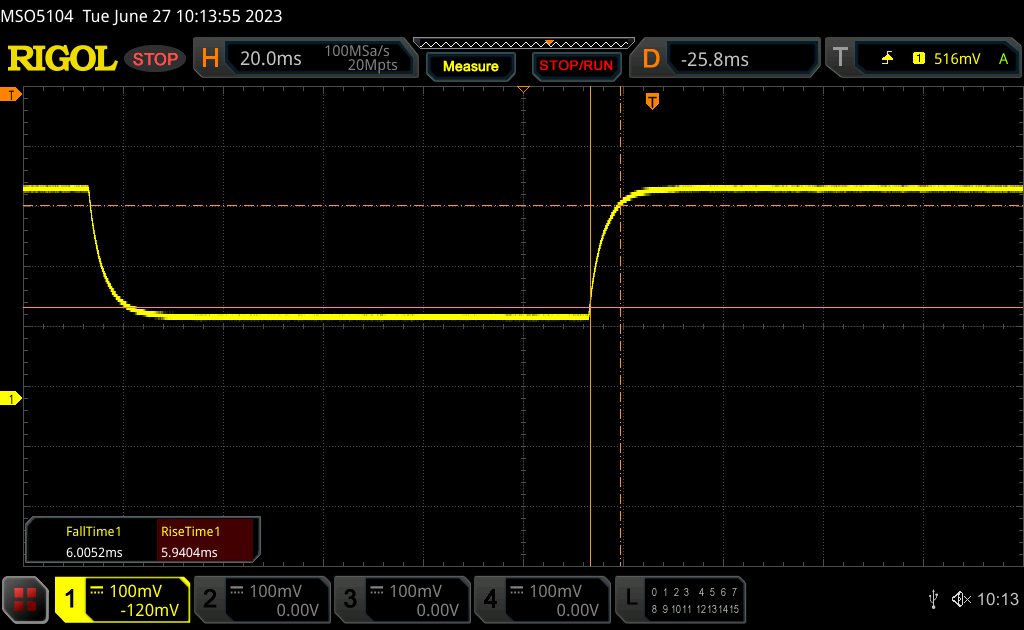 |
| ↘ 6 ms fall | ||
| The screen shows good response rates in our tests, but may be too slow for competitive gamers. In comparison, all tested devices range from 0.165 (minimum) to 636 (maximum) ms. » 25 % of all devices are better. This means that the measured response time is better than the average of all tested devices (30.9 ms). | ||
Screen Flickering / PWM (Pulse-Width Modulation)
| Screen flickering / PWM not detected | 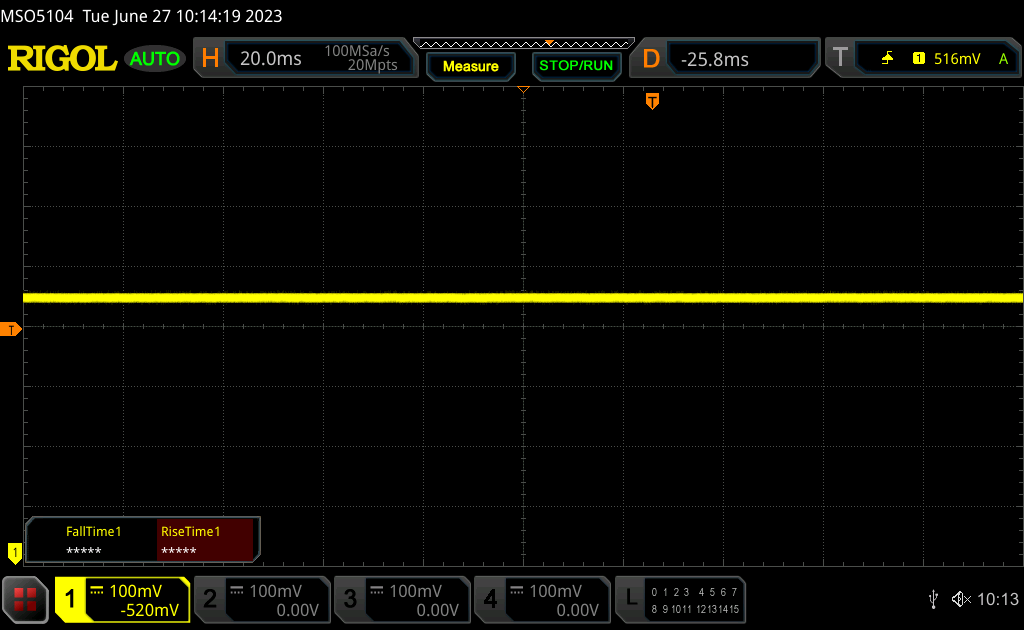 | ||
In comparison: 52 % of all tested devices do not use PWM to dim the display. If PWM was detected, an average of 7744 (minimum: 5 - maximum: 343500) Hz was measured. | |||
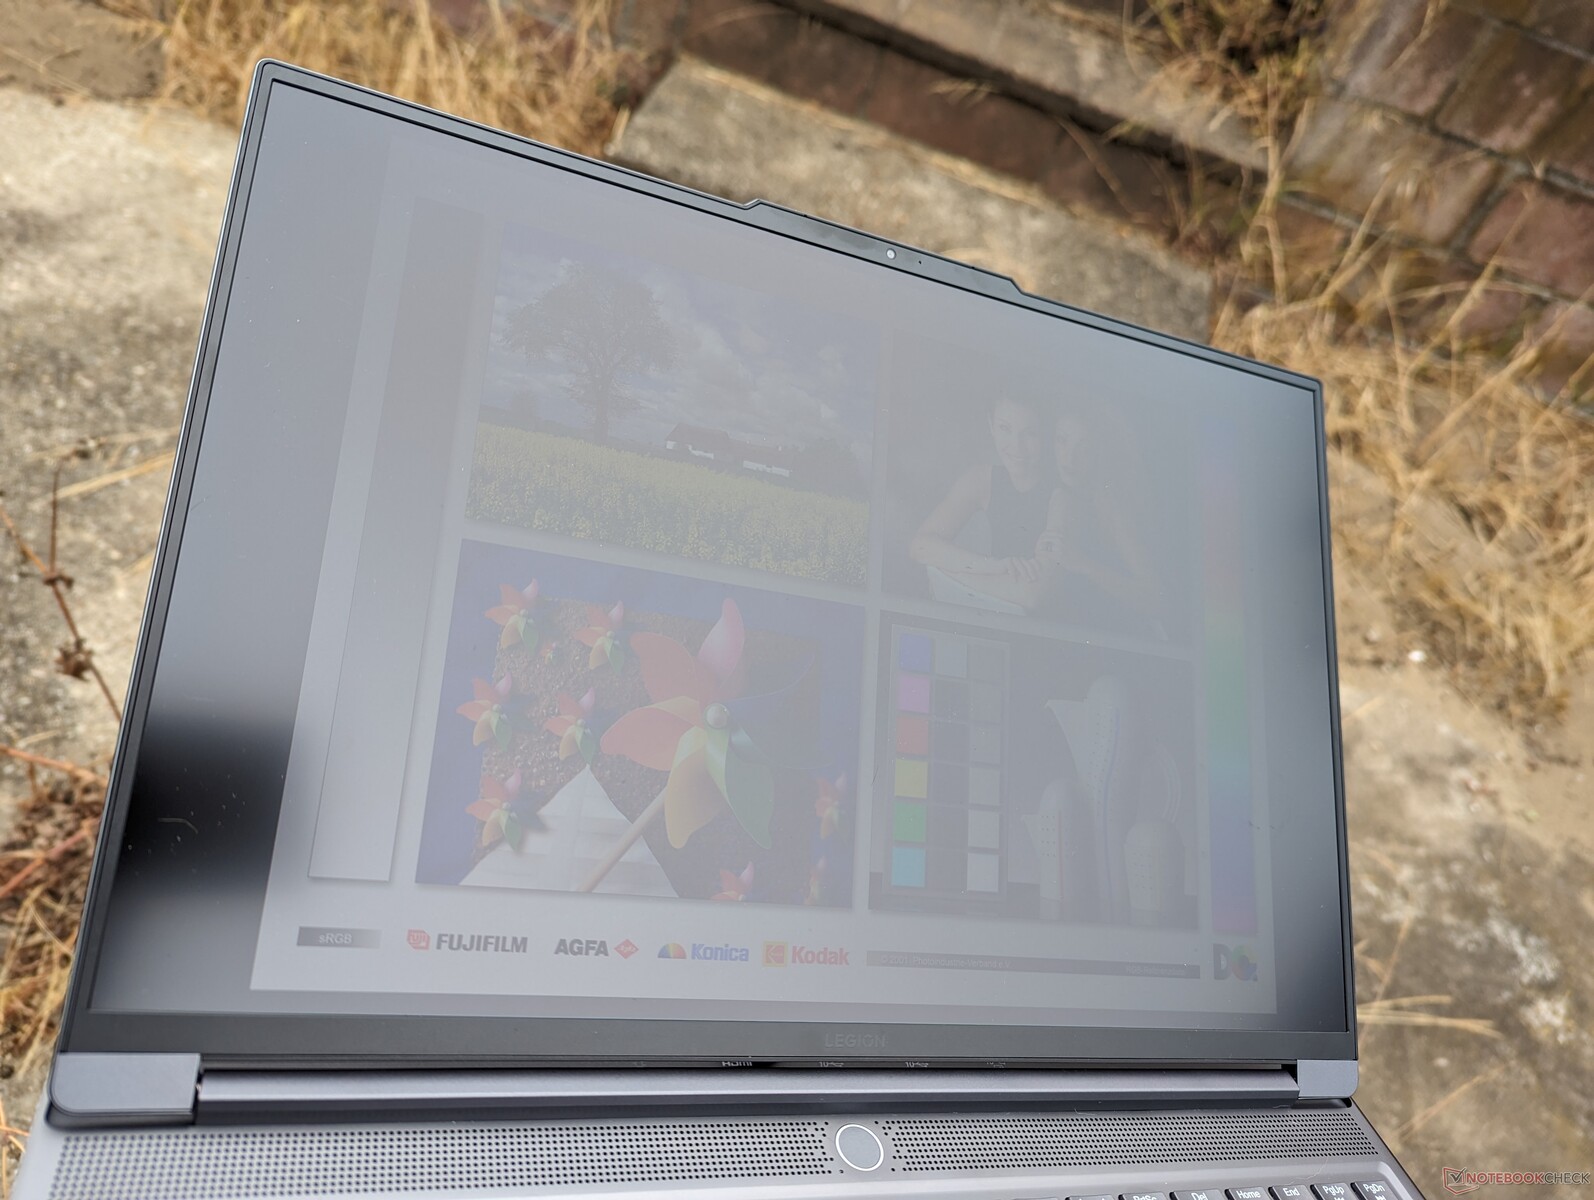
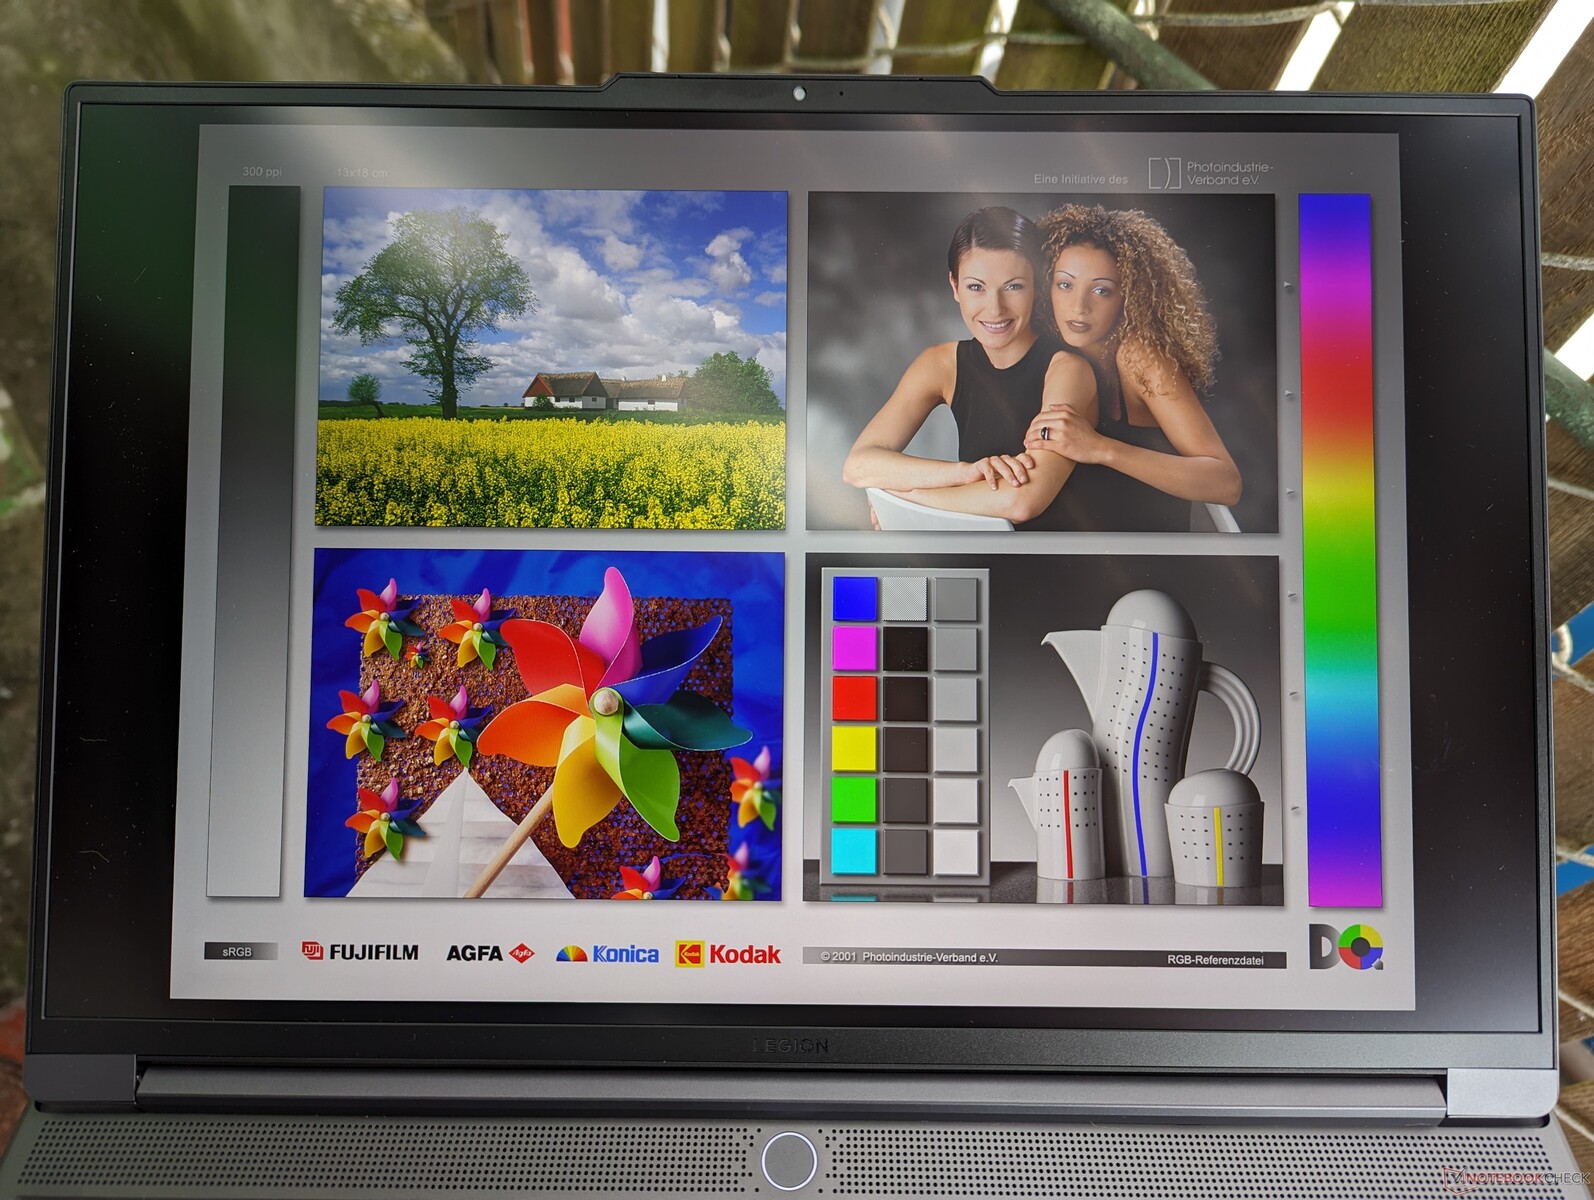
显示屏的亮度明显高于奥曼16或 亮度比Alienware x16 R1在户外更容易阅读。事实上,它的最大亮度设置只比MacBook Pro 16上暗了大约10%。 MacBook Pro 16.
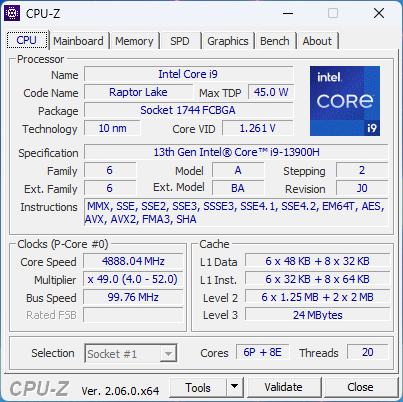
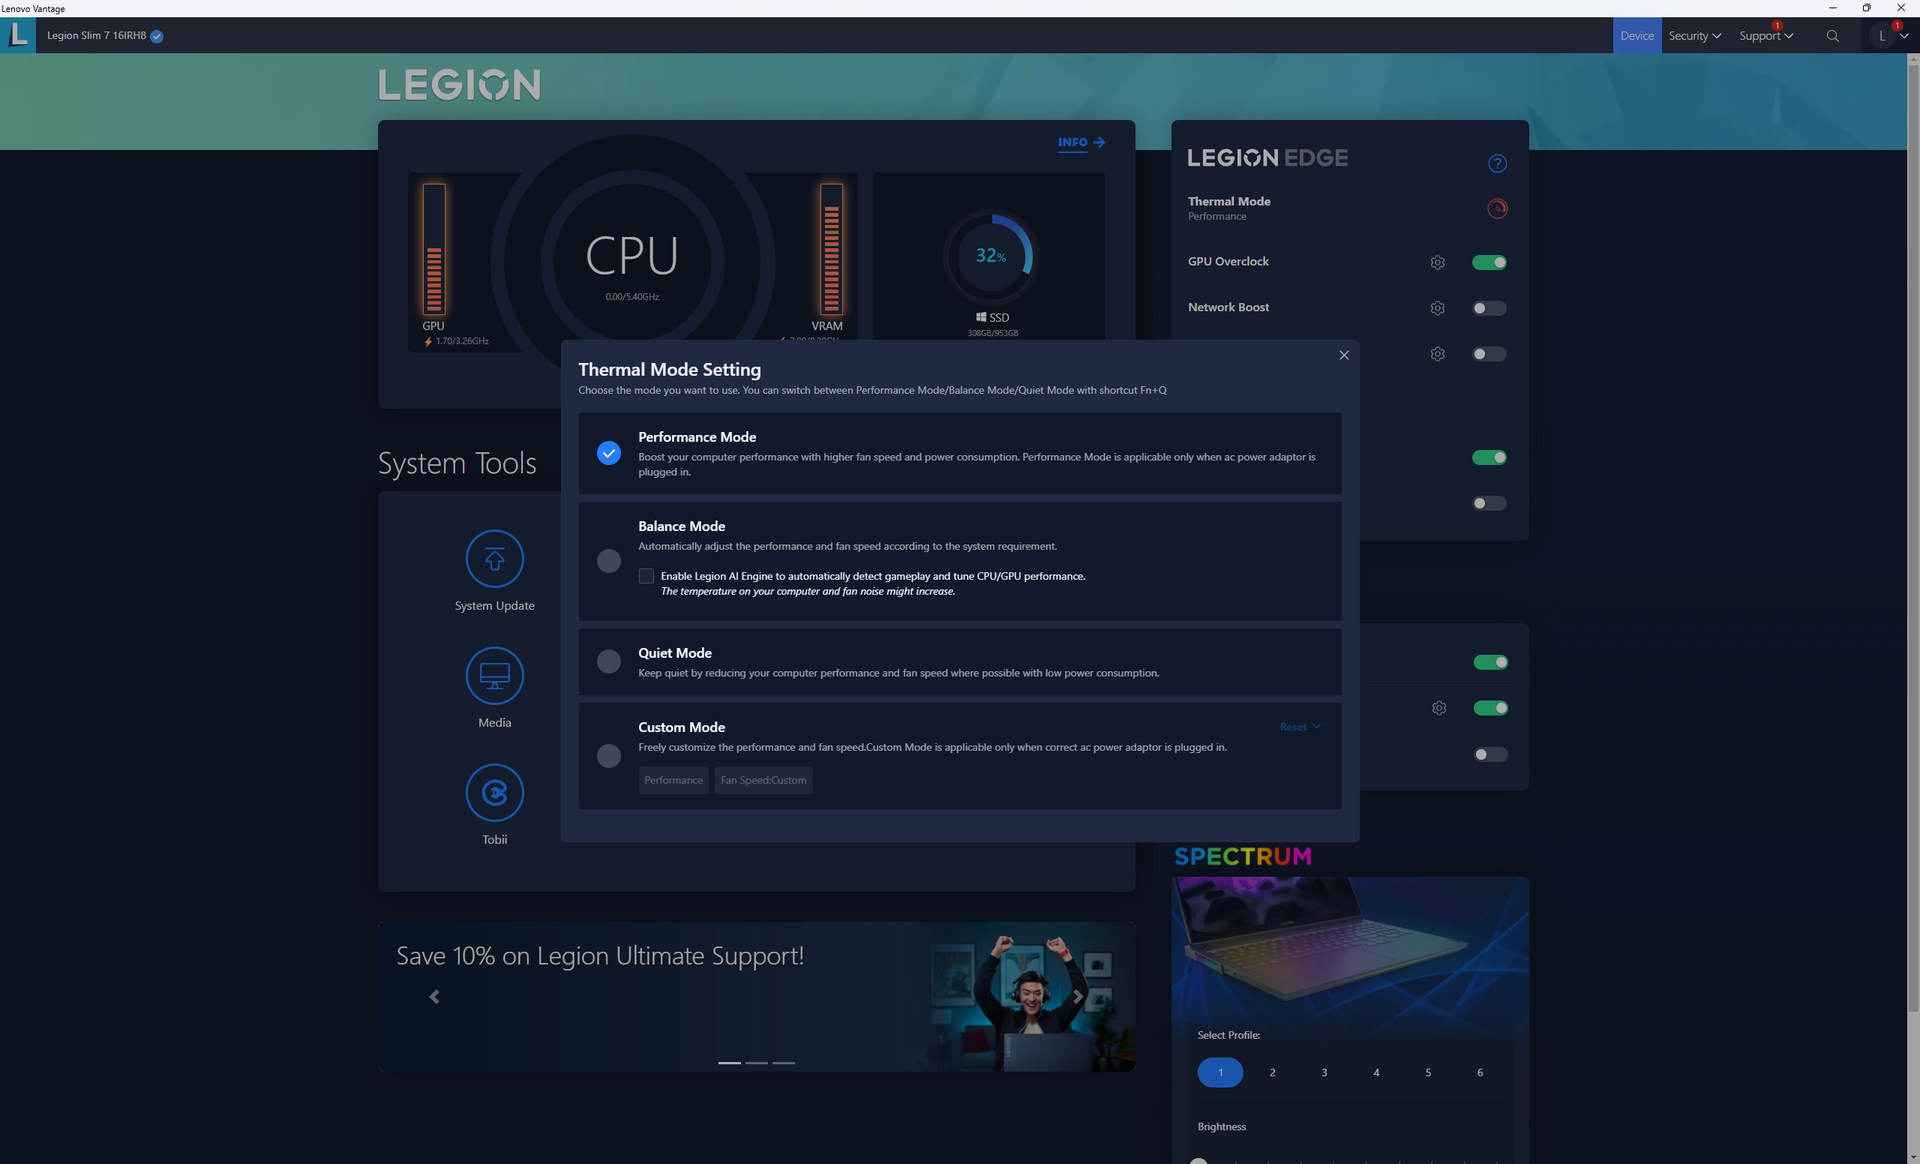
性能 - 第13代酷睿i9
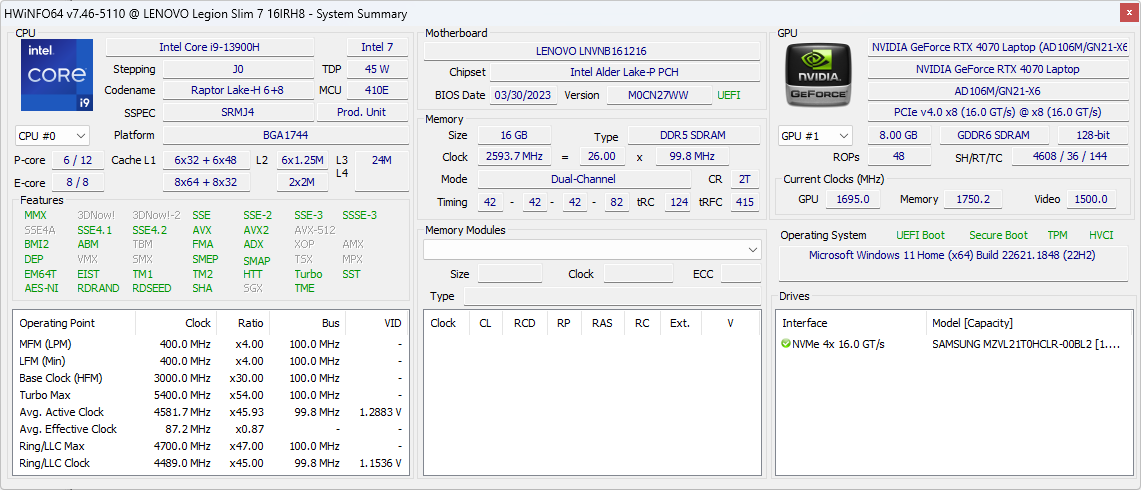
测试条件
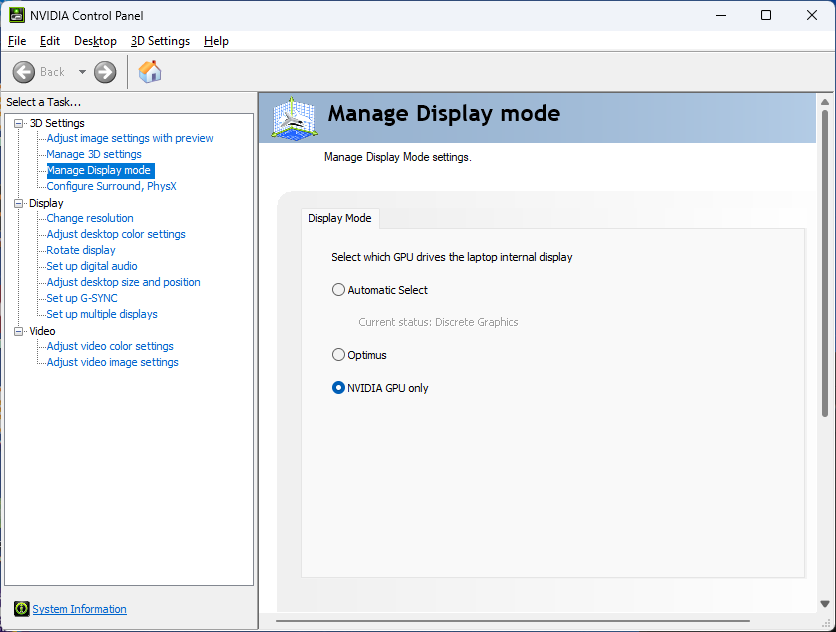
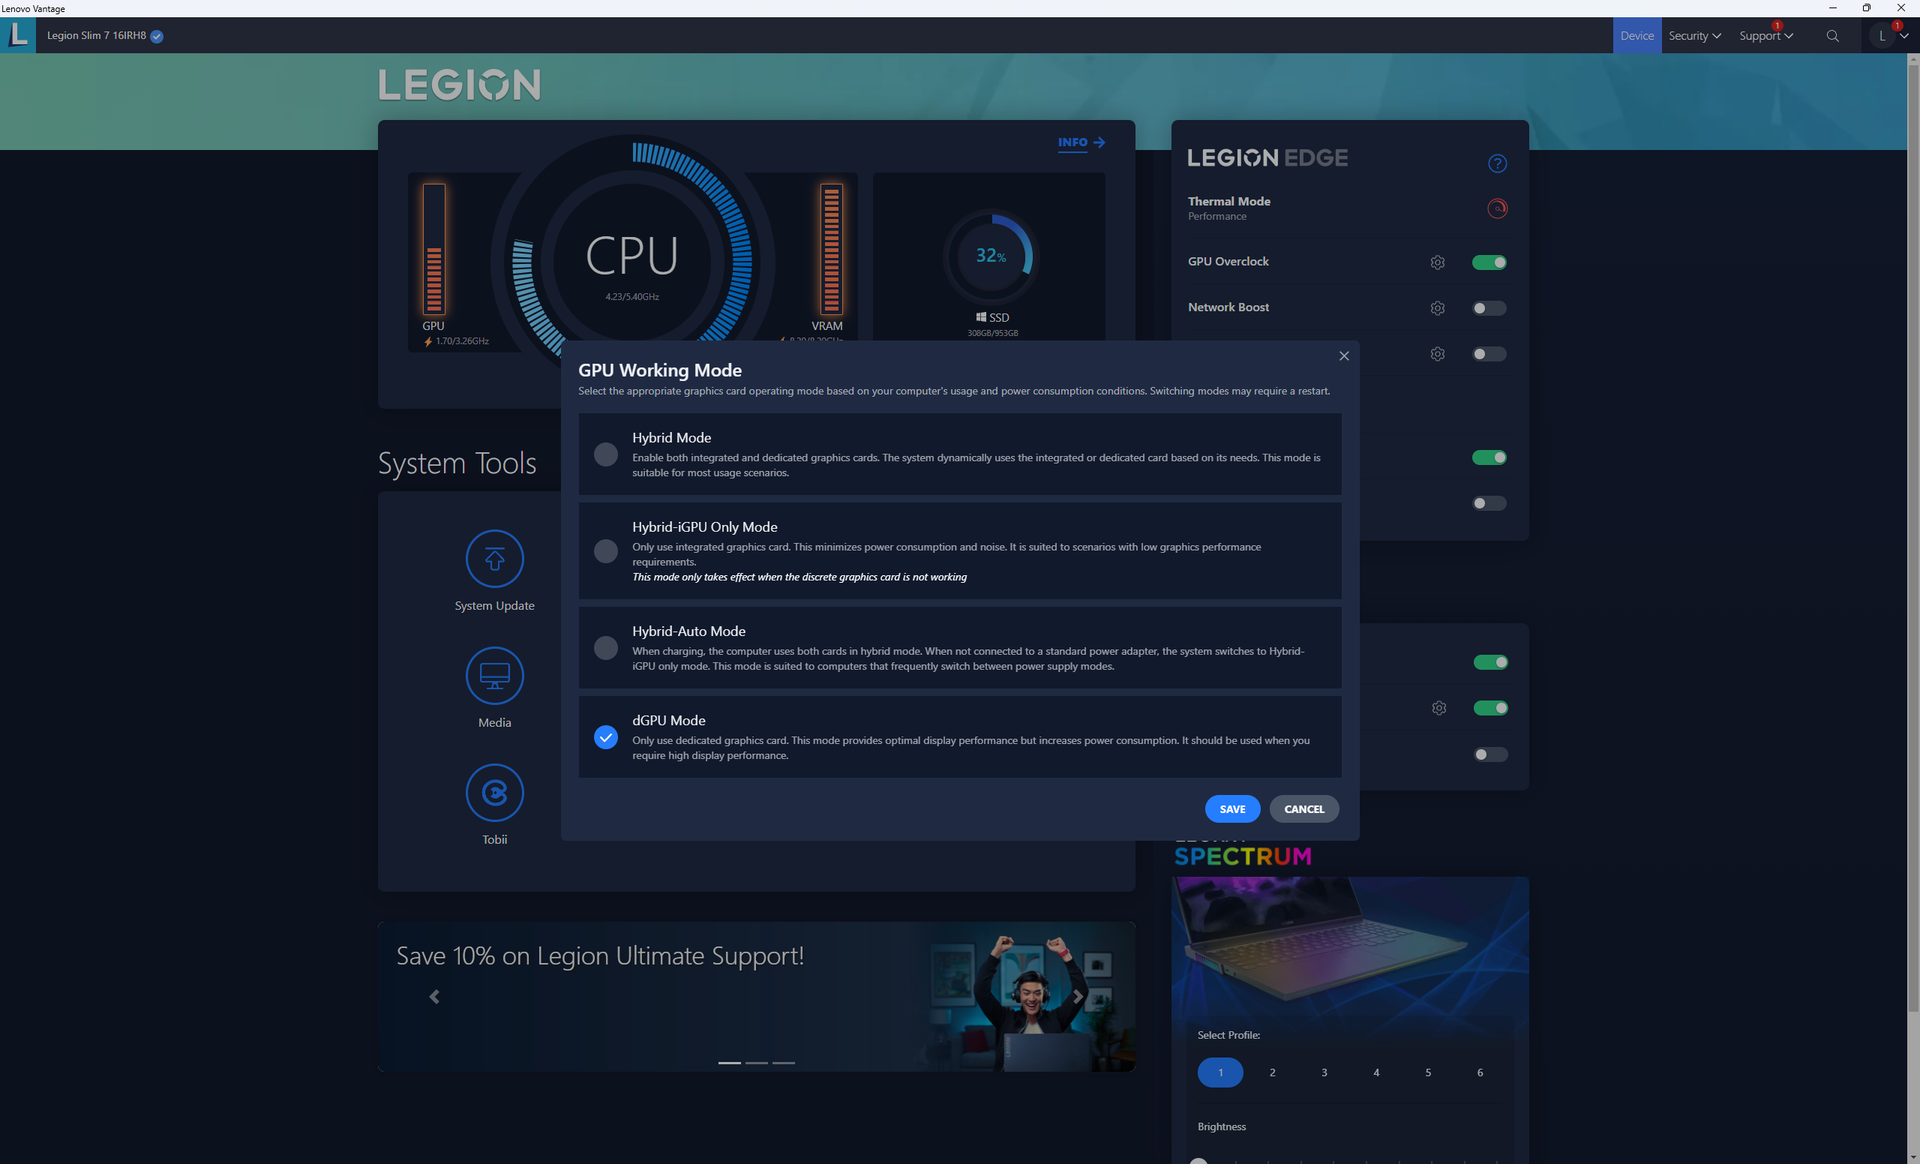
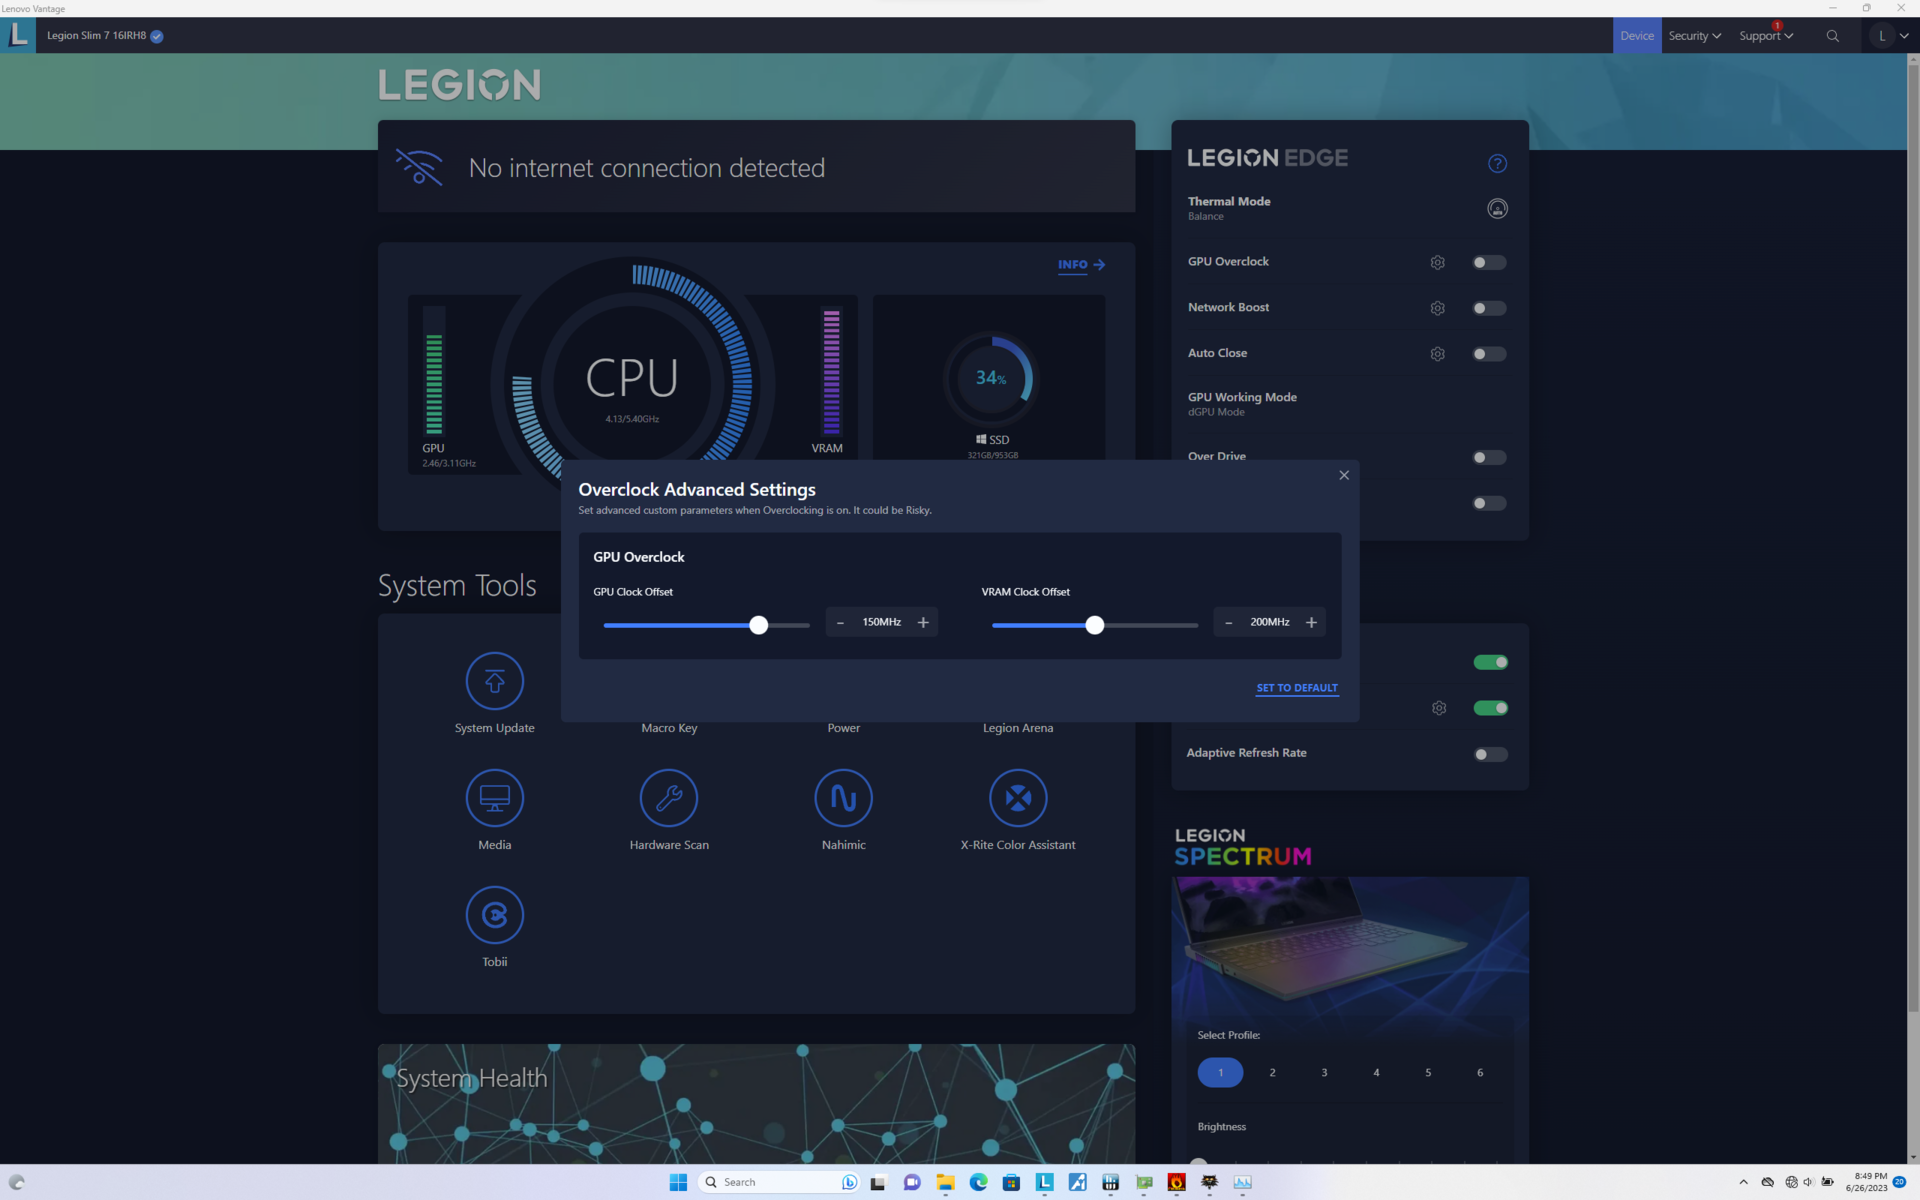
在运行下面的基准测试之前,我们将设备设置为dGPU模式和性能模式,并激活了GPU超频和超速功能。 联想Vantage是调整性能、更新、保修、RGB和其他功能的控制中心。
支持高级优化或MUX。
需要注意的是,我们的设备有一个未被占用的SODIMM插槽,因此它只运行在16GB的单通道焊接内存上。因此,AIDA64内存基准测试结果要比大多数其他游戏笔记本电脑低得多。
处理器
猛禽湖-H 酷睿i9-13900H在多线程性能方面比Alder Lake-H有25%的可观提升。 酷睿i9-12900H.最值得注意的是,它的性能基本上与更昂贵的酷睿i7-13700HX和 酷睿i9-13900HK.如果你发现自己在这三款第13代CPU之间做出选择,那么Core i9-13900H将是性价比最高的选择。
降级到基本 酷睿i7-13700H配置,预计将使处理器性能下降约20%至25%。
Cinebench R15 Multi Loop
Cinebench R20: CPU (Multi Core) | CPU (Single Core)
Cinebench R23: Multi Core | Single Core
Cinebench R15: CPU Multi 64Bit | CPU Single 64Bit
Blender: v2.79 BMW27 CPU
7-Zip 18.03: 7z b 4 | 7z b 4 -mmt1
Geekbench 5.5: Multi-Core | Single-Core
HWBOT x265 Benchmark v2.2: 4k Preset
LibreOffice : 20 Documents To PDF
R Benchmark 2.5: Overall mean
* ... smaller is better
AIDA64: FP32 Ray-Trace | FPU Julia | CPU SHA3 | CPU Queen | FPU SinJulia | FPU Mandel | CPU AES | CPU ZLib | FP64 Ray-Trace | CPU PhotoWorxx
| Performance rating | |
| Lenovo Legion Pro 7 RTX4090 | |
| Asus ROG Strix G16 G614JZ | |
| Razer Blade 16 Early 2023 | |
| Alienware x16 R1 | |
| HP Omen 16-wf000 | |
| Lenovo Legion Slim 7i 16 Gen 8 | |
| Average Intel Core i9-13900H | |
| AIDA64 / FP32 Ray-Trace | |
| Asus ROG Strix G16 G614JZ | |
| Lenovo Legion Pro 7 RTX4090 | |
| Razer Blade 16 Early 2023 | |
| Razer Blade 16 Early 2023 | |
| Razer Blade 16 Early 2023 | |
| HP Omen 16-wf000 | |
| Alienware x16 R1 | |
| Lenovo Legion Slim 7i 16 Gen 8 | |
| Average Intel Core i9-13900H (6788 - 19557, n=25) | |
| AIDA64 / CPU Queen | |
| Asus ROG Strix G16 G614JZ | |
| Lenovo Legion Pro 7 RTX4090 | |
| Razer Blade 16 Early 2023 | |
| Razer Blade 16 Early 2023 | |
| Lenovo Legion Slim 7i 16 Gen 8 | |
| Alienware x16 R1 | |
| Average Intel Core i9-13900H (65121 - 120936, n=25) | |
| HP Omen 16-wf000 | |
| AIDA64 / FPU SinJulia | |
| Asus ROG Strix G16 G614JZ | |
| Razer Blade 16 Early 2023 | |
| Razer Blade 16 Early 2023 | |
| Razer Blade 16 Early 2023 | |
| Lenovo Legion Pro 7 RTX4090 | |
| HP Omen 16-wf000 | |
| Alienware x16 R1 | |
| Lenovo Legion Slim 7i 16 Gen 8 | |
| Average Intel Core i9-13900H (6108 - 11631, n=25) | |
| AIDA64 / FP64 Ray-Trace | |
| Asus ROG Strix G16 G614JZ | |
| Lenovo Legion Pro 7 RTX4090 | |
| Razer Blade 16 Early 2023 | |
| Razer Blade 16 Early 2023 | |
| Razer Blade 16 Early 2023 | |
| HP Omen 16-wf000 | |
| Alienware x16 R1 | |
| Lenovo Legion Slim 7i 16 Gen 8 | |
| Average Intel Core i9-13900H (3655 - 10716, n=25) | |
| AIDA64 / CPU PhotoWorxx | |
| Razer Blade 16 Early 2023 | |
| Razer Blade 16 Early 2023 | |
| Razer Blade 16 Early 2023 | |
| Lenovo Legion Pro 7 RTX4090 | |
| Alienware x16 R1 | |
| HP Omen 16-wf000 | |
| Average Intel Core i9-13900H (10871 - 50488, n=25) | |
| Asus ROG Strix G16 G614JZ | |
| Lenovo Legion Slim 7i 16 Gen 8 | |
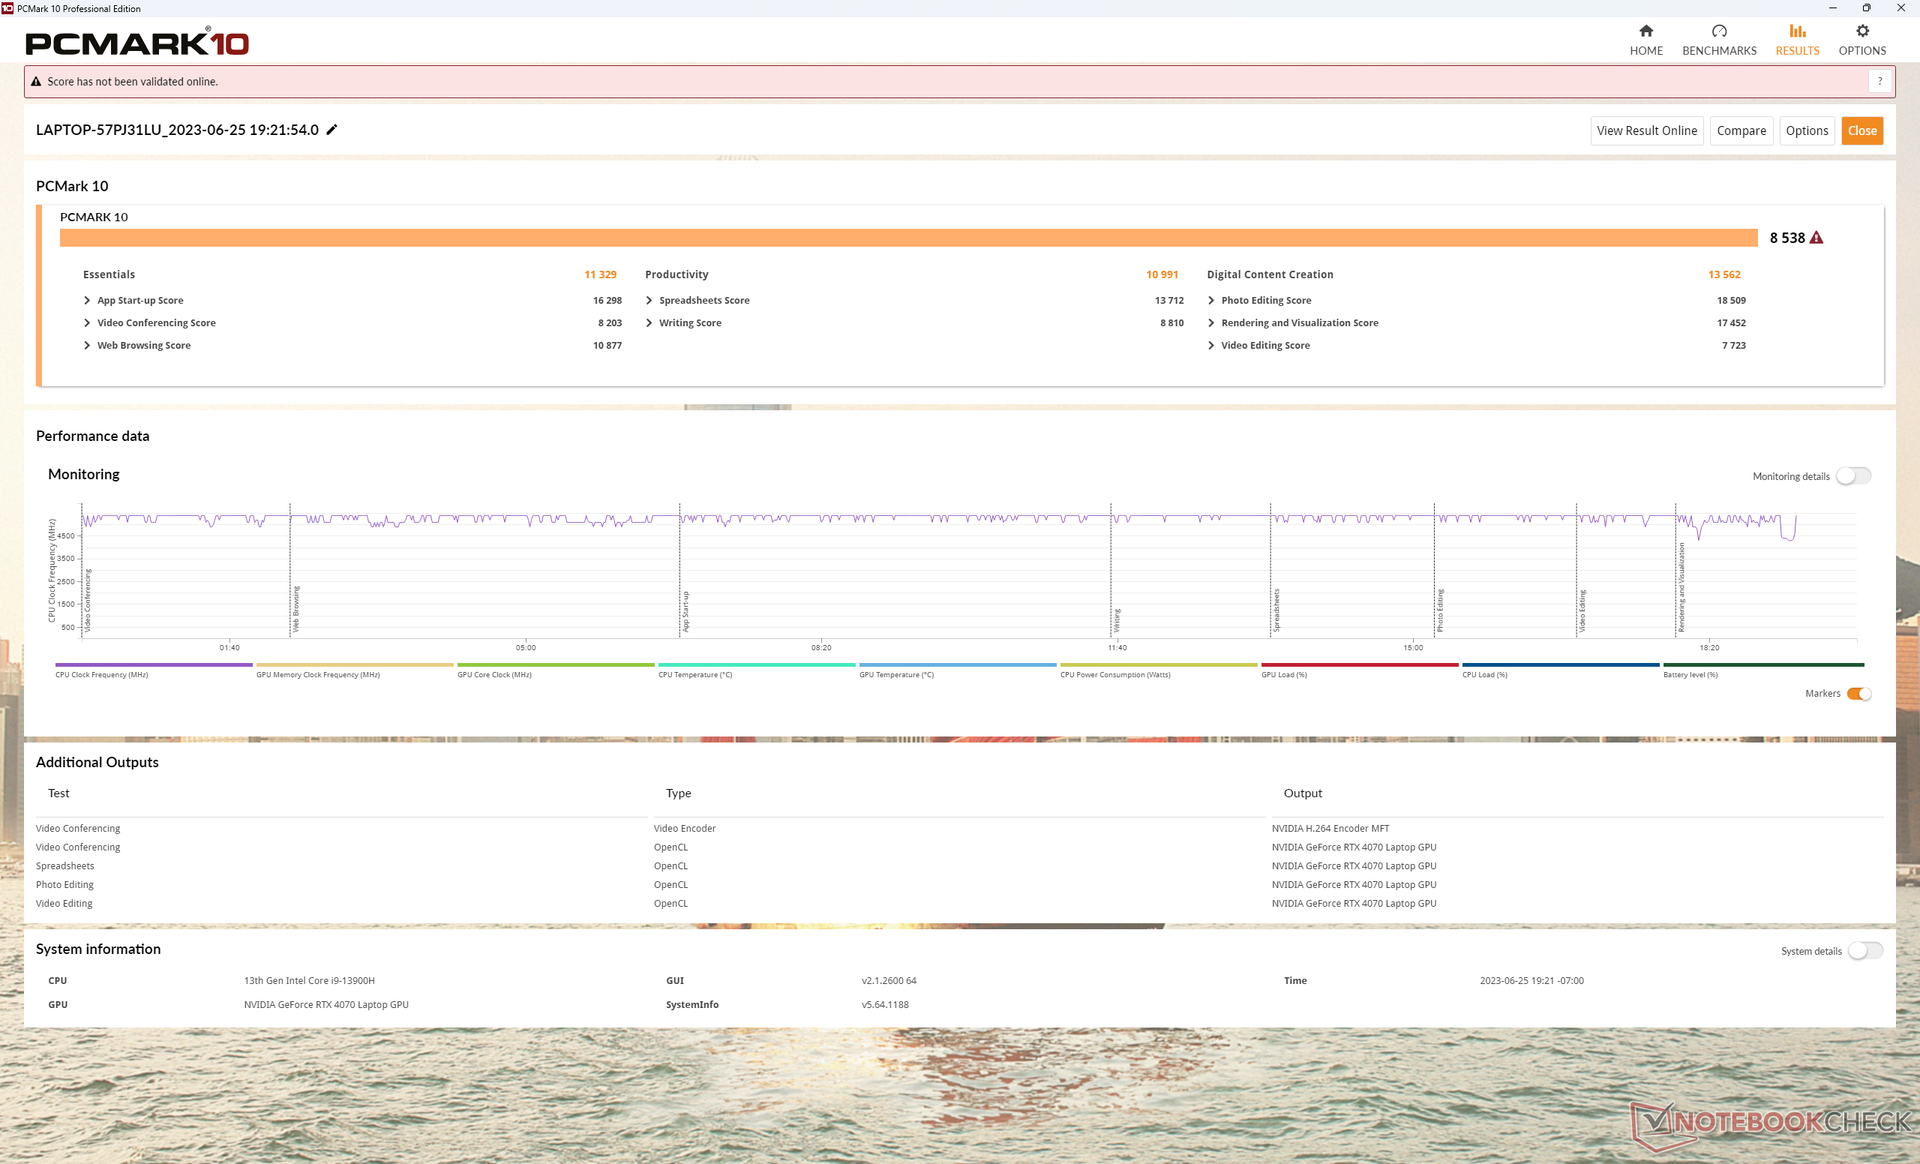
系统性能
PCMark的结果很好,与其他高端游戏笔记本的结果相当。然而,我们遇到了从睡眠中唤醒的问题,笔记本电脑经常需要长达10秒钟的时间才能正确打开屏幕,而其他笔记本电脑最多只需要几秒钟。
CrossMark: Overall | Productivity | Creativity | Responsiveness
| PCMark 10 / Score | |
| Lenovo Legion Slim 7i 16 Gen 8 | |
| Alienware x16 R1 | |
| Lenovo Legion Pro 7 RTX4090 | |
| Razer Blade 16 Early 2023 | |
| HP Omen 16-wf000 | |
| Average Intel Core i9-13900H, NVIDIA GeForce RTX 4070 Laptop GPU (5855 - 8538, n=8) | |
| Asus ROG Strix G16 G614JZ | |
| PCMark 10 / Essentials | |
| Asus ROG Strix G16 G614JZ | |
| Lenovo Legion Slim 7i 16 Gen 8 | |
| Alienware x16 R1 | |
| Lenovo Legion Pro 7 RTX4090 | |
| Razer Blade 16 Early 2023 | |
| Average Intel Core i9-13900H, NVIDIA GeForce RTX 4070 Laptop GPU (8835 - 11940, n=8) | |
| HP Omen 16-wf000 | |
| PCMark 10 / Productivity | |
| Lenovo Legion Slim 7i 16 Gen 8 | |
| Alienware x16 R1 | |
| Average Intel Core i9-13900H, NVIDIA GeForce RTX 4070 Laptop GPU (7967 - 10991, n=8) | |
| HP Omen 16-wf000 | |
| Lenovo Legion Pro 7 RTX4090 | |
| Razer Blade 16 Early 2023 | |
| Asus ROG Strix G16 G614JZ | |
| PCMark 10 / Digital Content Creation | |
| Lenovo Legion Pro 7 RTX4090 | |
| Razer Blade 16 Early 2023 | |
| Alienware x16 R1 | |
| Lenovo Legion Slim 7i 16 Gen 8 | |
| HP Omen 16-wf000 | |
| Average Intel Core i9-13900H, NVIDIA GeForce RTX 4070 Laptop GPU (7738 - 13575, n=8) | |
| Asus ROG Strix G16 G614JZ | |
| CrossMark / Overall | |
| Asus ROG Strix G16 G614JZ | |
| Lenovo Legion Slim 7i 16 Gen 8 | |
| Alienware x16 R1 | |
| Average Intel Core i9-13900H, NVIDIA GeForce RTX 4070 Laptop GPU (1104 - 1974, n=7) | |
| HP Omen 16-wf000 | |
| Razer Blade 16 Early 2023 | |
| CrossMark / Productivity | |
| Asus ROG Strix G16 G614JZ | |
| Lenovo Legion Slim 7i 16 Gen 8 | |
| Alienware x16 R1 | |
| Average Intel Core i9-13900H, NVIDIA GeForce RTX 4070 Laptop GPU (1058 - 1914, n=7) | |
| HP Omen 16-wf000 | |
| Razer Blade 16 Early 2023 | |
| CrossMark / Creativity | |
| Asus ROG Strix G16 G614JZ | |
| Lenovo Legion Slim 7i 16 Gen 8 | |
| Alienware x16 R1 | |
| Average Intel Core i9-13900H, NVIDIA GeForce RTX 4070 Laptop GPU (1178 - 2254, n=7) | |
| HP Omen 16-wf000 | |
| Razer Blade 16 Early 2023 | |
| CrossMark / Responsiveness | |
| Asus ROG Strix G16 G614JZ | |
| Alienware x16 R1 | |
| Lenovo Legion Slim 7i 16 Gen 8 | |
| Average Intel Core i9-13900H, NVIDIA GeForce RTX 4070 Laptop GPU (1037 - 1952, n=7) | |
| HP Omen 16-wf000 | |
| Razer Blade 16 Early 2023 | |
| PCMark 10 Score | 8538 points | |
Help | ||
| AIDA64 / Memory Copy | |
| Razer Blade 16 Early 2023 | |
| Razer Blade 16 Early 2023 | |
| Razer Blade 16 Early 2023 | |
| Lenovo Legion Pro 7 RTX4090 | |
| Alienware x16 R1 | |
| HP Omen 16-wf000 | |
| Asus ROG Strix G16 G614JZ | |
| Average Intel Core i9-13900H (37448 - 74486, n=25) | |
| Lenovo Legion Slim 7i 16 Gen 8 | |
| AIDA64 / Memory Read | |
| Lenovo Legion Pro 7 RTX4090 | |
| Razer Blade 16 Early 2023 | |
| Razer Blade 16 Early 2023 | |
| Razer Blade 16 Early 2023 | |
| Asus ROG Strix G16 G614JZ | |
| Alienware x16 R1 | |
| HP Omen 16-wf000 | |
| Average Intel Core i9-13900H (41599 - 75433, n=25) | |
| Lenovo Legion Slim 7i 16 Gen 8 | |
| AIDA64 / Memory Write | |
| Alienware x16 R1 | |
| Razer Blade 16 Early 2023 | |
| Razer Blade 16 Early 2023 | |
| Razer Blade 16 Early 2023 | |
| Lenovo Legion Pro 7 RTX4090 | |
| HP Omen 16-wf000 | |
| Average Intel Core i9-13900H (36152 - 88505, n=25) | |
| Asus ROG Strix G16 G614JZ | |
| Lenovo Legion Slim 7i 16 Gen 8 | |
| AIDA64 / Memory Latency | |
| Alienware x16 R1 | |
| Razer Blade 16 Early 2023 | |
| Razer Blade 16 Early 2023 | |
| Razer Blade 16 Early 2023 | |
| Average Intel Core i9-13900H (75.8 - 102.3, n=25) | |
| Asus ROG Strix G16 G614JZ | |
| HP Omen 16-wf000 | |
| Lenovo Legion Pro 7 RTX4090 | |
| Lenovo Legion Slim 7i 16 Gen 8 | |
* ... smaller is better
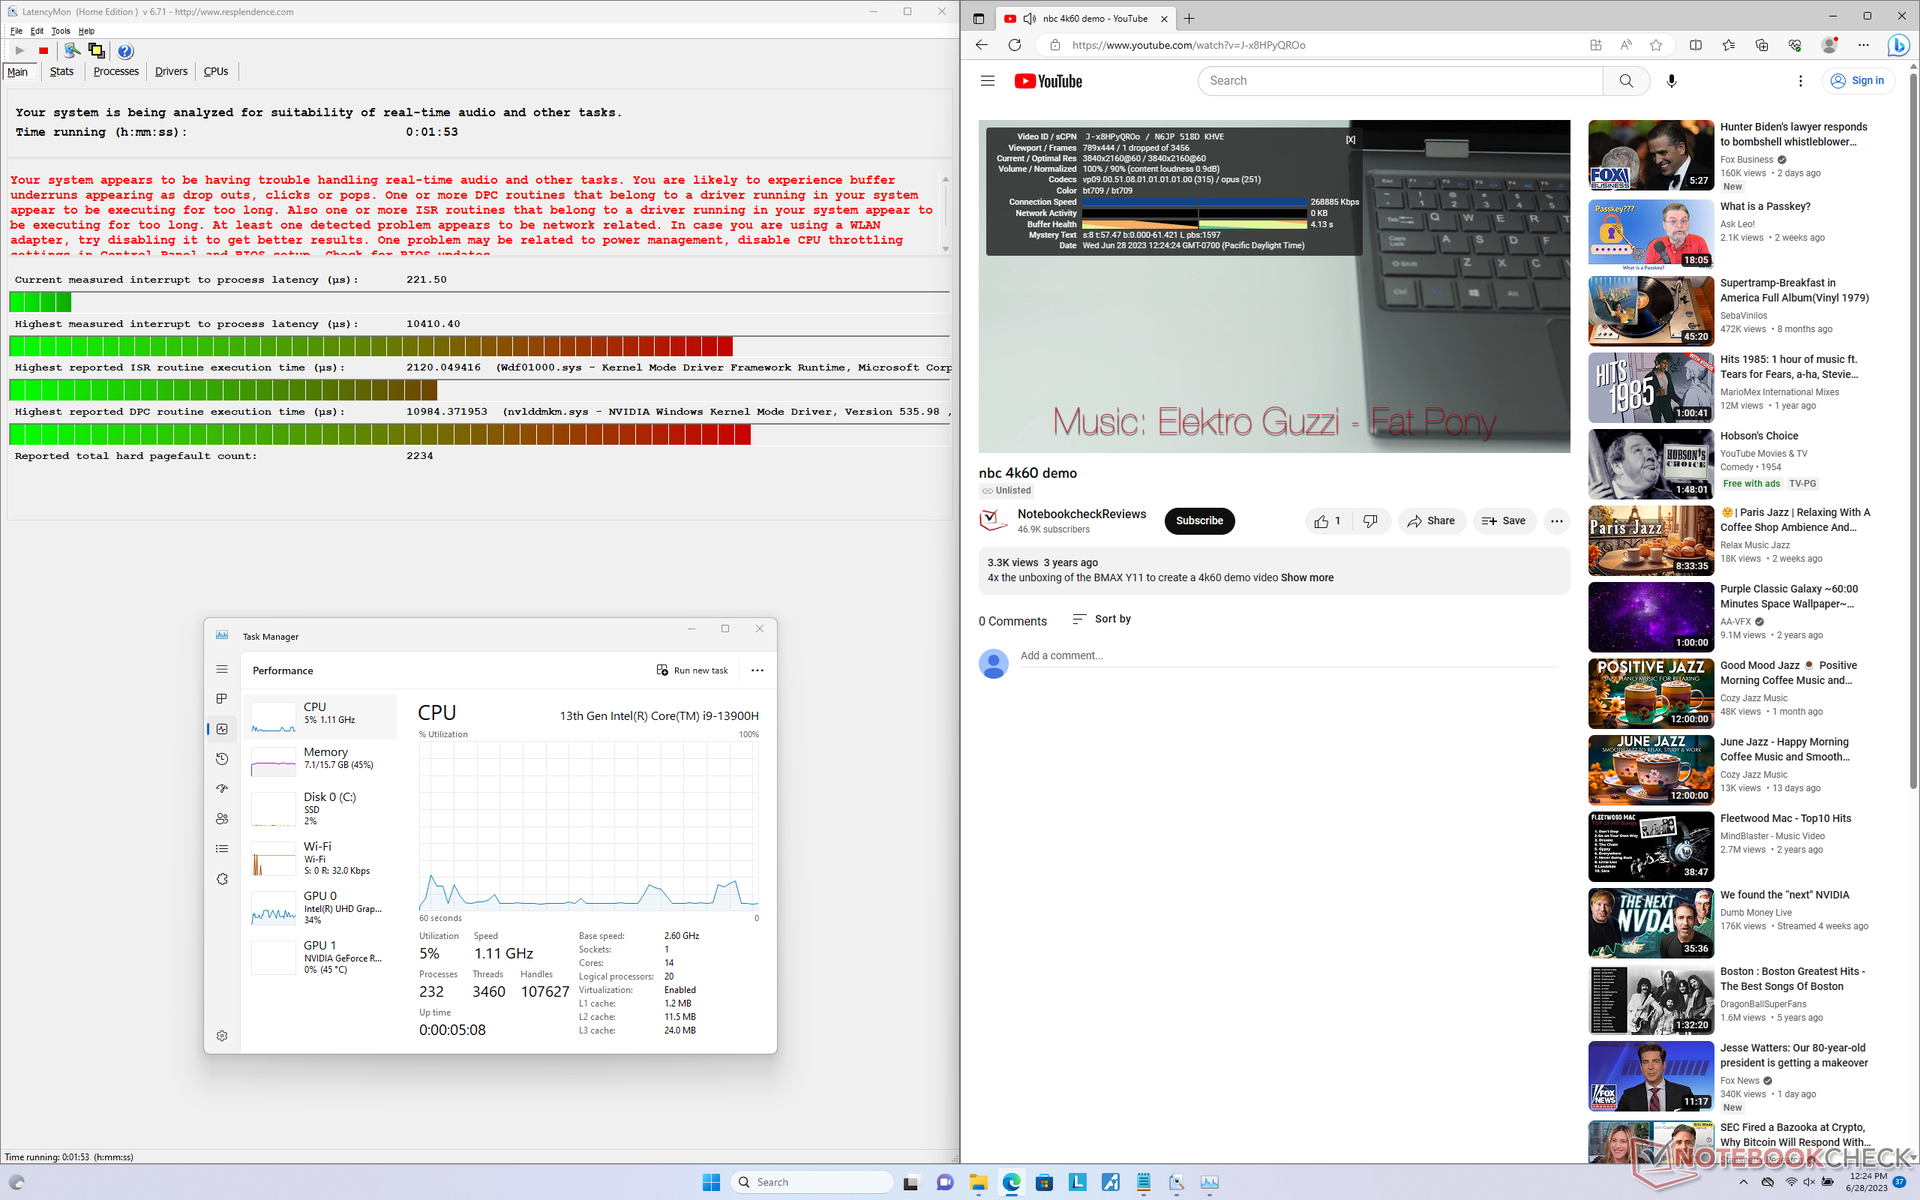
DPC延时
LatencyMon显示了与Nvidia NVLDDMKM驱动有关的DPC问题,与我们在Pro 7上观察到的情况很相似。 Legion Pro 7即使经过几次重试。在我们的测试视频中,以60 FPS播放4K视频几乎是完美的,只有一个丢帧。

| DPC Latencies / LatencyMon - interrupt to process latency (max), Web, Youtube, Prime95 | |
| Lenovo Legion Pro 7 RTX4090 | |
| Lenovo Legion Slim 7i 16 Gen 8 | |
| HP Omen 16-wf000 | |
| Asus ROG Strix G16 G614JZ | |
| Razer Blade 16 Early 2023 | |
| Alienware x16 R1 | |
* ... smaller is better
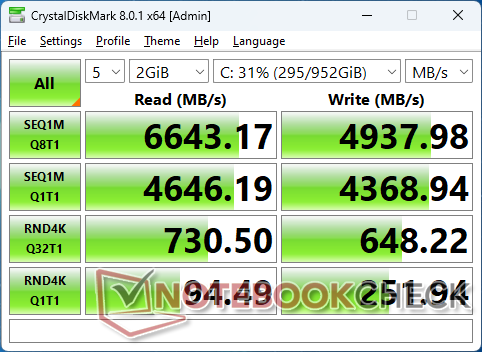
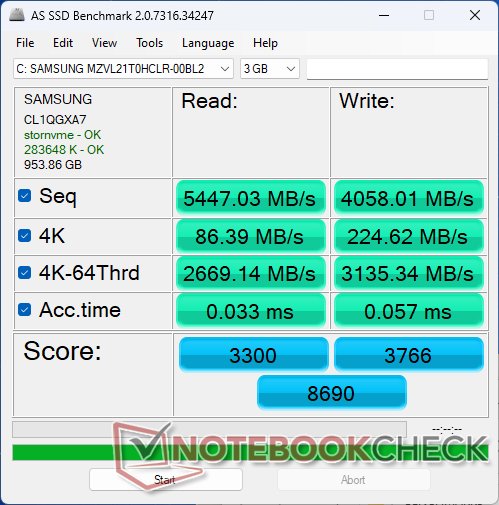
存储设备 - 多达两个M.2固态硬盘
我们的设备配备了一个1TB三星PM9A1这是一个最快的基于消费者的PCIe4 x4驱动器。不幸的是,在压力下,传输率会从6700MB/s节流到低至3300MB/s,正如我们下面的表格所示,表明散热不良。这款Razer Blade 14配备了完全相同的三星固态硬盘,它不会表现出这样的问题。

| Drive Performance rating - Percent | |
| Alienware x16 R1 | |
| Lenovo Legion Slim 7i 16 Gen 8 | |
| Lenovo Legion Pro 7 RTX4090 | |
| HP Omen 16-wf000 | |
| Razer Blade 16 Early 2023 | |
| Asus ROG Strix G16 G614JZ | |
* ... smaller is better
Disk Throttling: DiskSpd Read Loop, Queue Depth 8
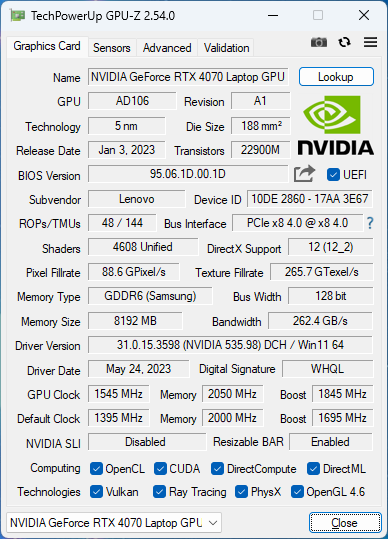
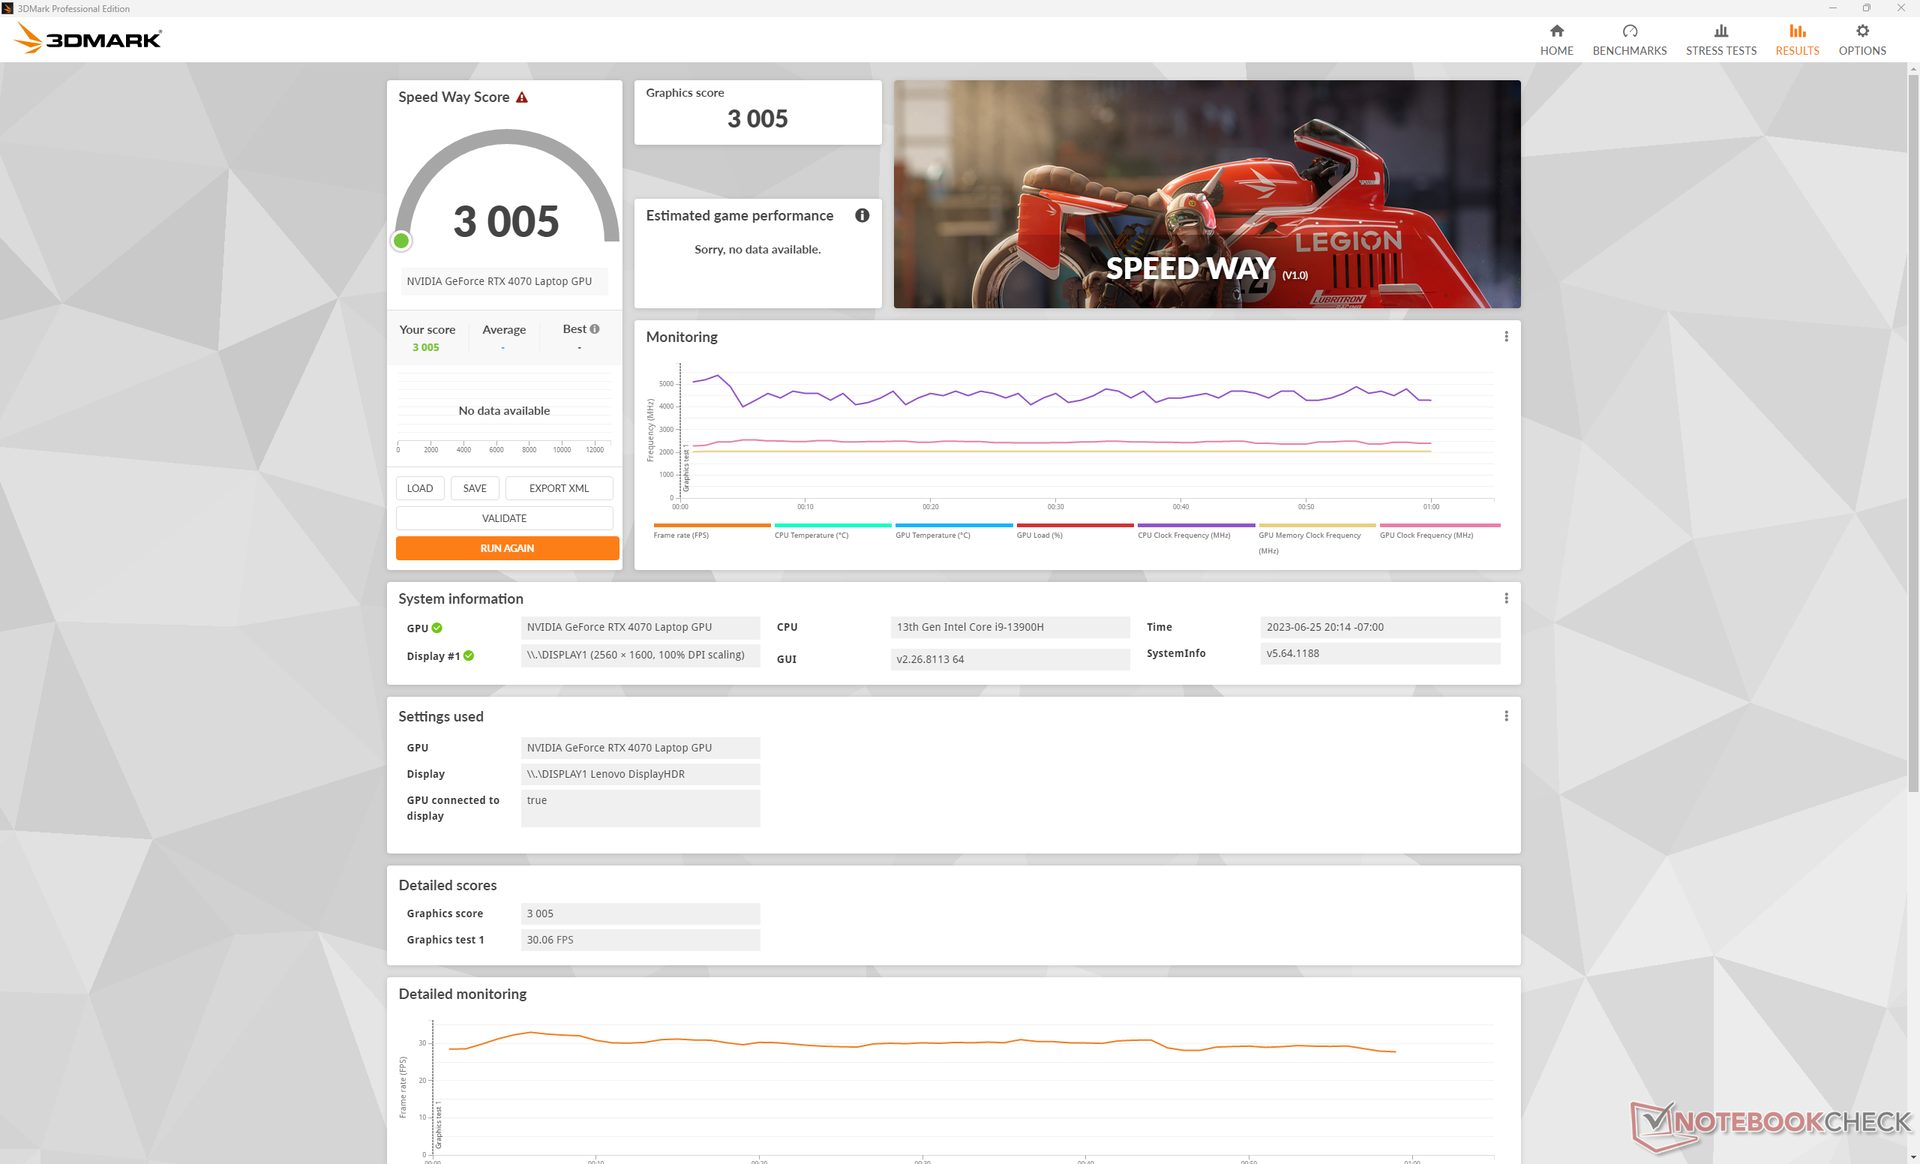
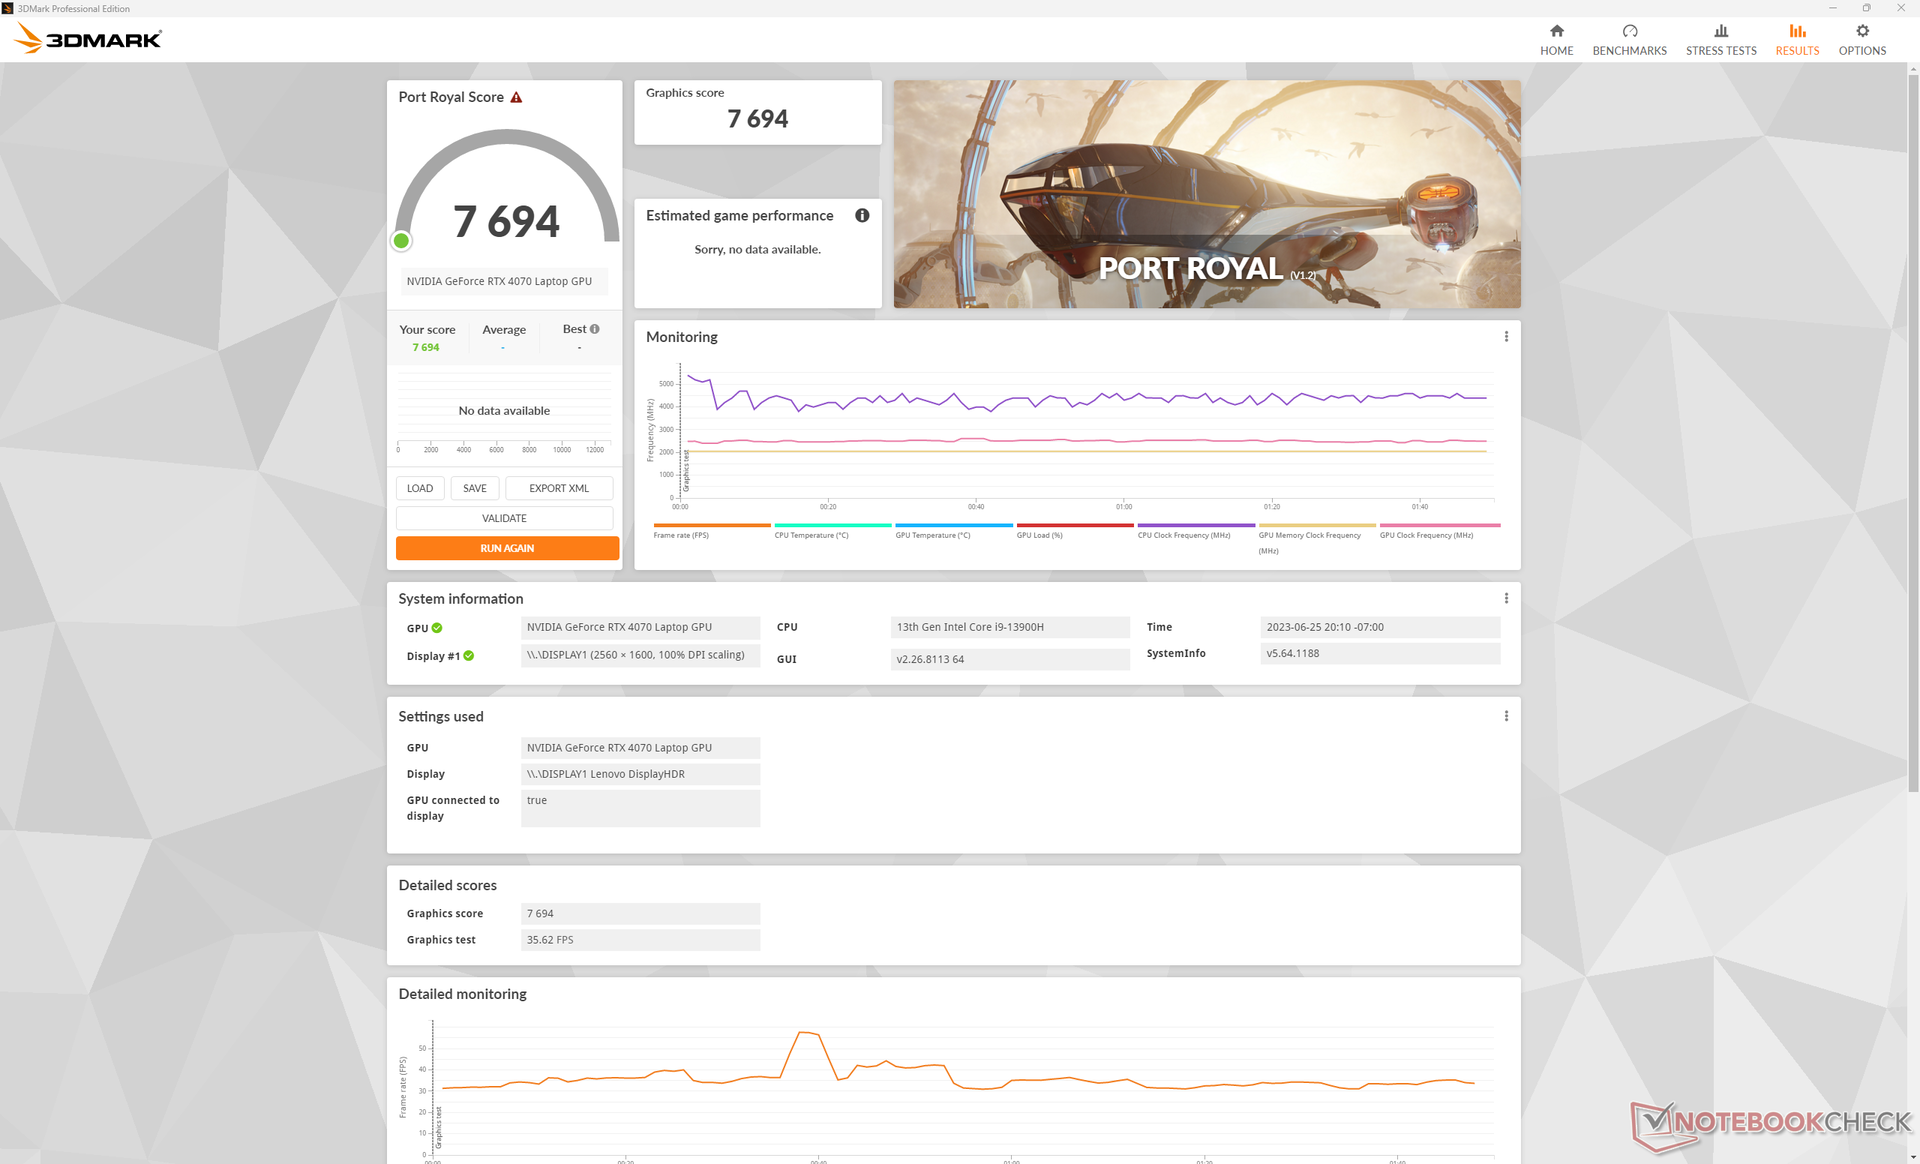
GPU性能 - 140 W RTX图形
原始图形性能比我们数据库中的普通笔记本电脑快约5%至10%,具有相同的 移动RTX 4070GPU。因此,整体性能大致与去年的 移动RTX 3080 Ti.
如果禁用超频功能,GPU性能会下降5%。如果在平衡模式下,CPU和GPU性能将分别下降约10%和15%,如下表所示。一些用户可能更喜欢平衡模式下更安静的风扇,即使这意味着更慢的性能。
降级到 RTX 4060根据我们在RTX 4070配置上的经验,预计对GPU性能的影响约为10%至15%。 Legion Pro 5 16.
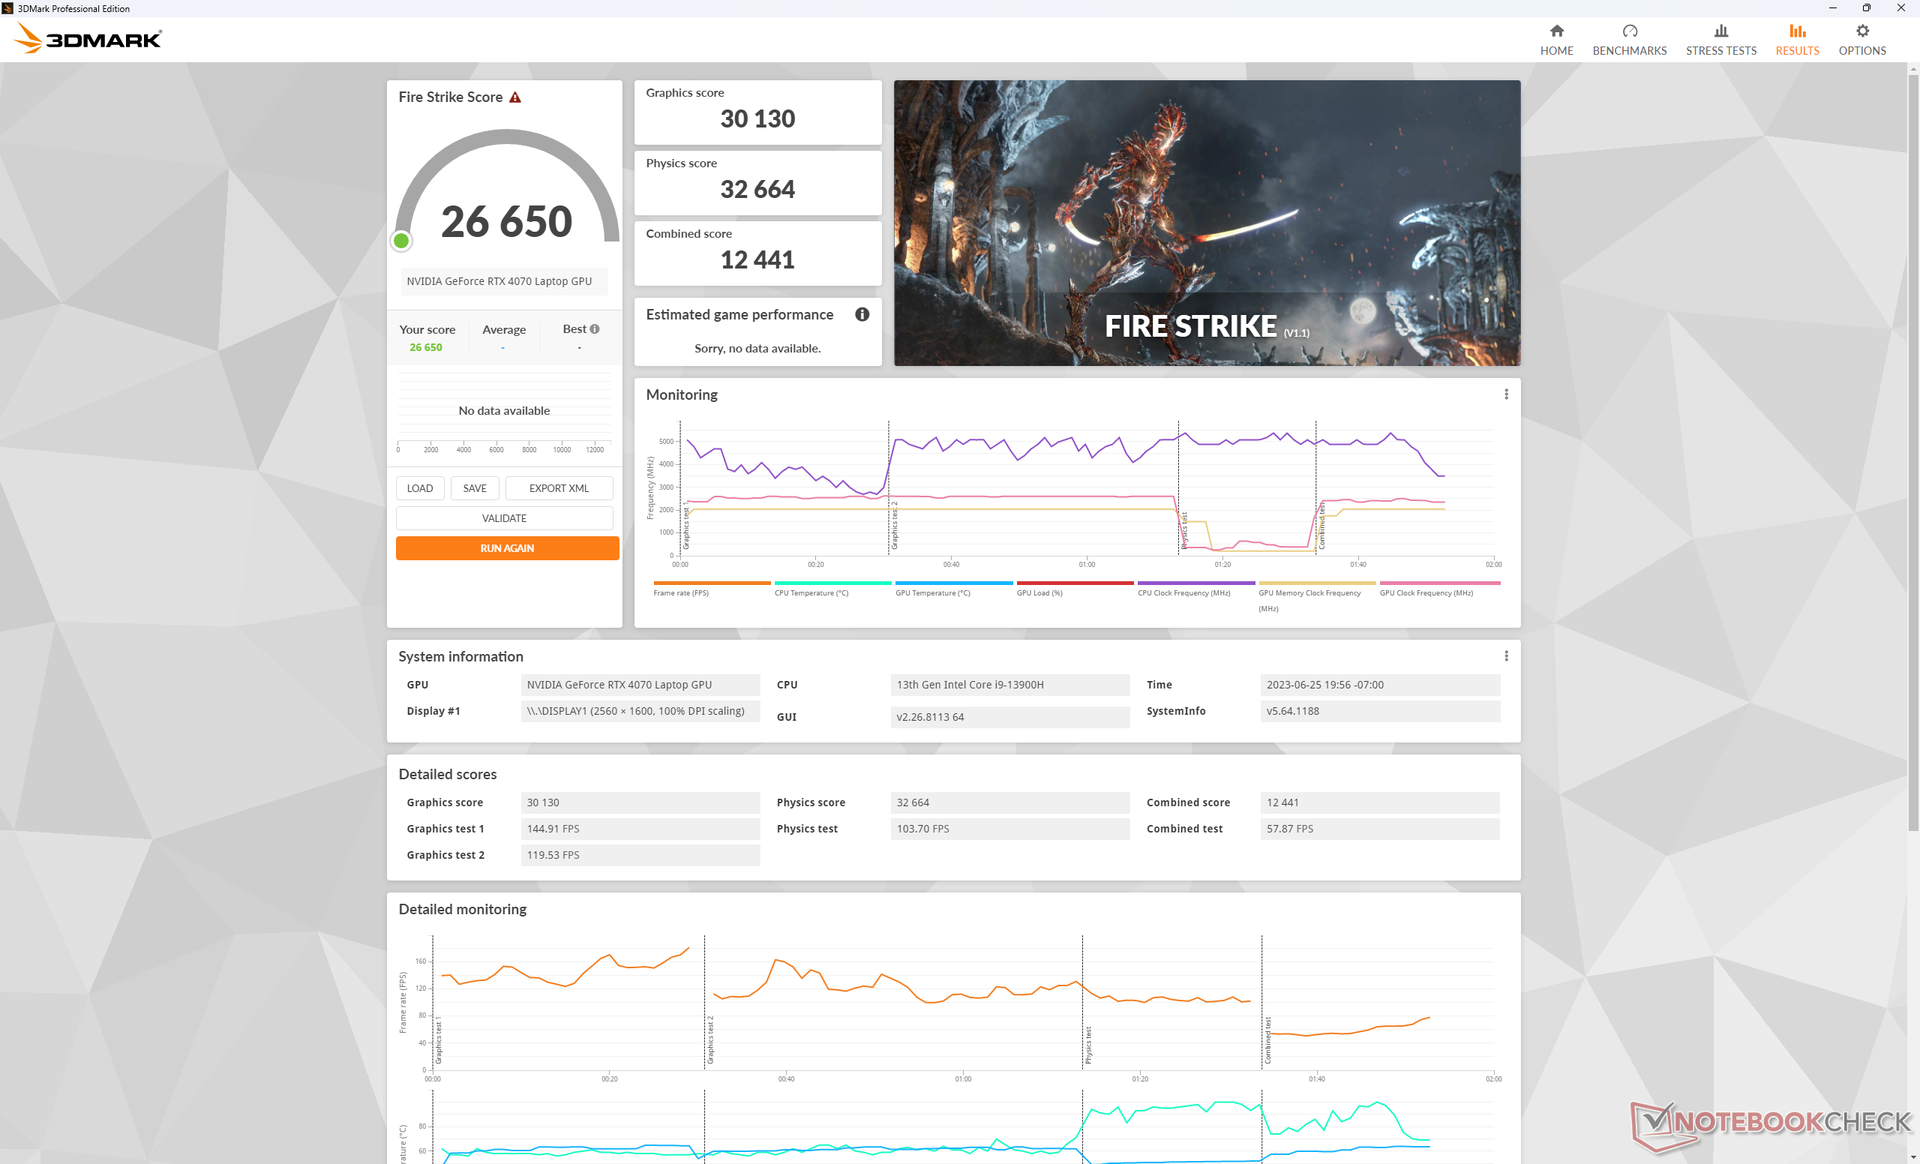
| 电源配置文件设置 | Fire Strike 物理得分 | Fire Strike GPU得分 | Fire Strike 综合得分 |
| 性能+GPU超频开启+超速开启 | 32664 | 30130 | 12441 |
| 性能+GPU超频开+超速关 | 32439 | 30153 | 13360 |
| 性能+GPU超频关闭+超速关闭 | 32550 | 28629 (-5%) | 12319 |
| 平衡性 | 27499 (-16%) | 27708 (-8%) | 11295 (-9%) |
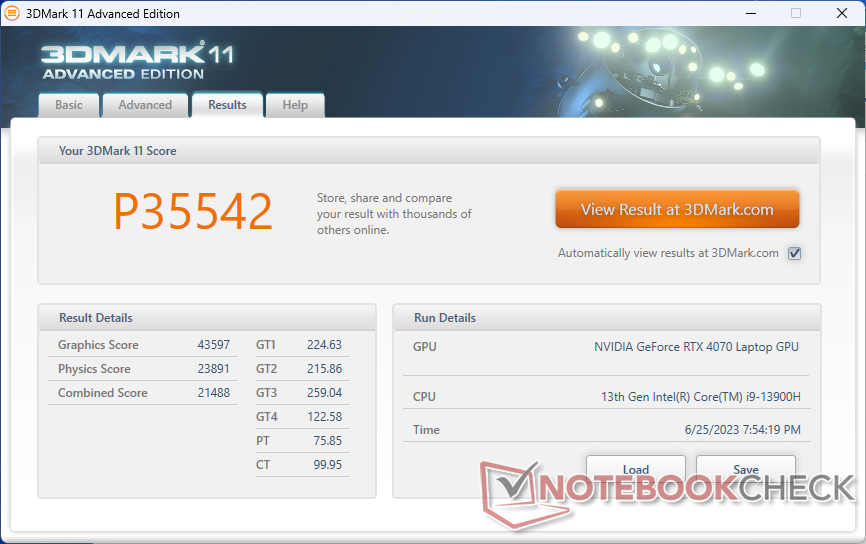
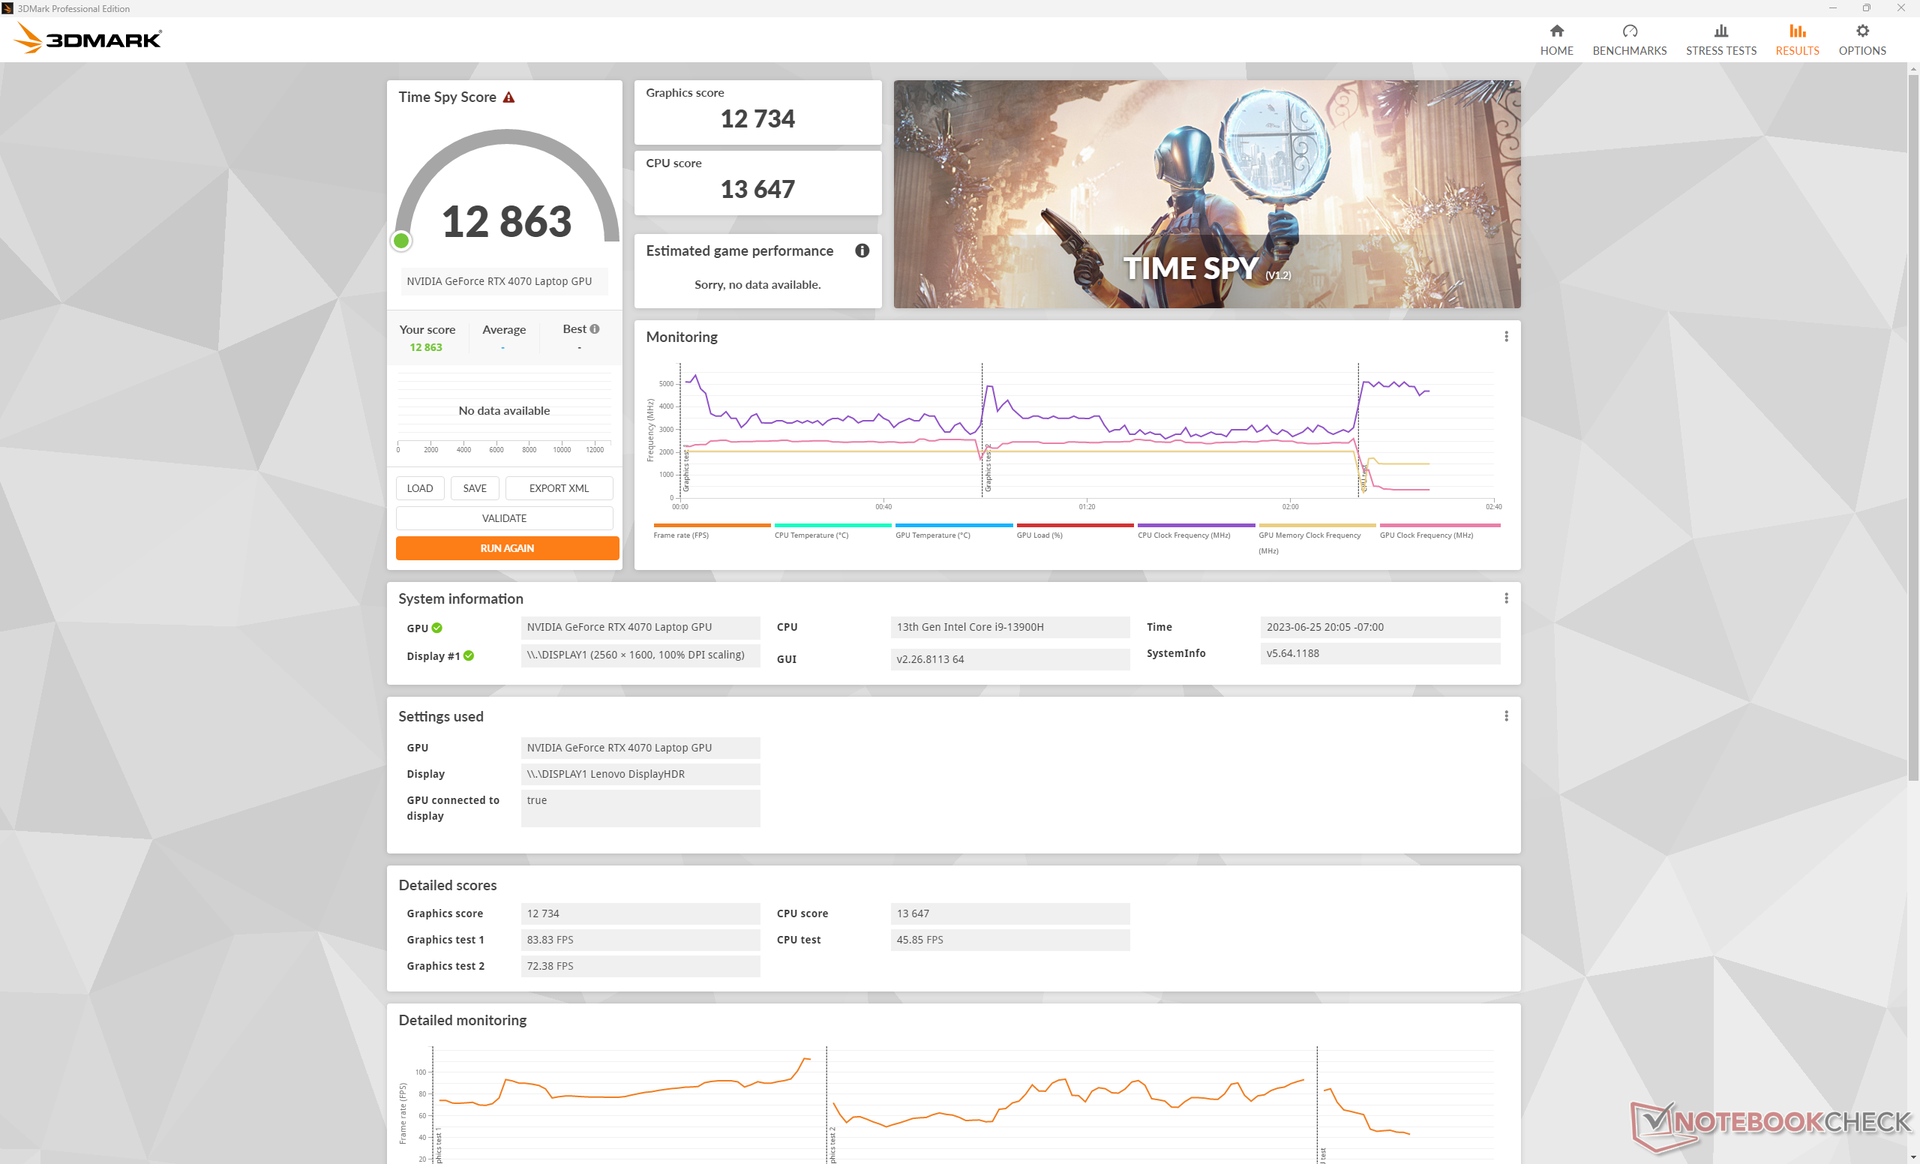
| 3DMark 11 Performance | 35542 points | |
| 3DMark Fire Strike Score | 26650 points | |
| 3DMark Time Spy Score | 12863 points | |
Help | ||
* ... smaller is better
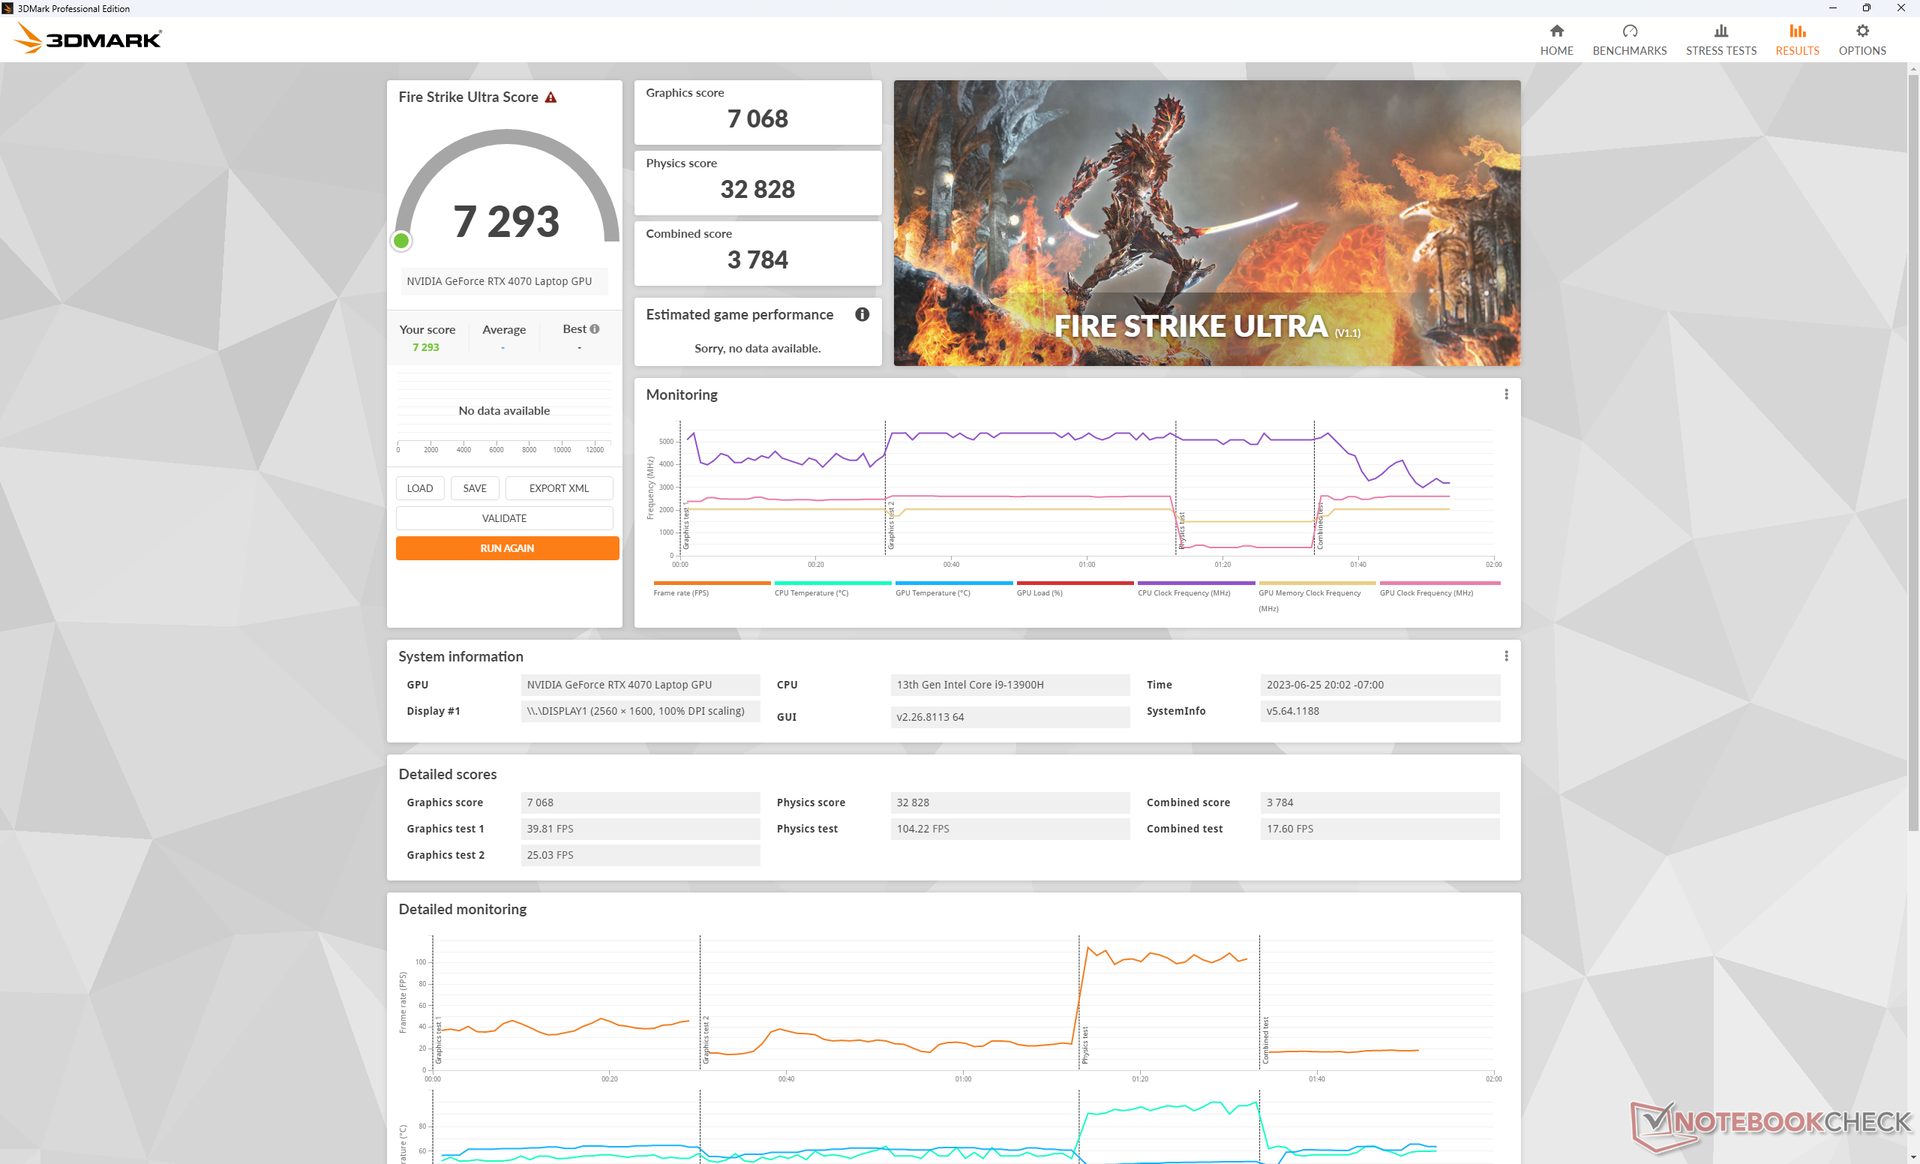
游戏性能
移动版RTX 4070在1440p/1600p和高设置下的60FPS方面表现良好,而更快的桌面版RTX 4070 Ti则在1440p/1600p和60FPS方面表现良好。 桌面RTX 4070 Ti则可以达到Ultra或最高设置。例如,用我们的联想在最大的1440p设置下运行Returnal ,几乎无法达到50FPS的水平。
当RTX 4070开始感到动力不足时,DLSS变得更加重要。例如,在4K Ultra设置下运行《赛博朋克2077》,在没有DLSS的情况下,平均只有23 FPS,而在启用DLSS2后,则有38 FPS的可玩性。
Witcher 3 FPS Chart
| low | med. | high | ultra | QHD | 4K | |
|---|---|---|---|---|---|---|
| GTA V (2015) | 184 | 180.3 | 175 | 115.2 | 94.3 | 98.7 |
| The Witcher 3 (2015) | 459.3 | 356.8 | 225.9 | 117.9 | 70 | |
| Dota 2 Reborn (2015) | 203 | 183.2 | 175.8 | 165.3 | 141.3 | |
| Final Fantasy XV Benchmark (2018) | 213 | 168.8 | 122.7 | 91.4 | 51.5 | |
| X-Plane 11.11 (2018) | 182.9 | 158.7 | 122.4 | 105.7 | ||
| Strange Brigade (2018) | 483 | 316 | 259 | 228 | 149.2 | 75.7 |
| Cyberpunk 2077 1.6 (2022) | 138.3 | 141.9 | 106.1 | 91 | 54.4 | 23.1 |
| Tiny Tina's Wonderlands (2022) | 244.3 | 204.8 | 143.7 | 113.9 | 78.1 | 37 |
| F1 22 (2022) | 258 | 261 | 219 | 81.5 | 46.2 | 25.9 |
| Returnal (2023) | 83 | 81 | 76 | 61 | 52 | 27 |
排放
系统噪音
内部风扇始终处于活动状态,其音量略低于26 dB(A),而安静的背景为23 dB(A)。在大多数办公室和会议环境中,这并不响亮,不会让人分心,即使在引入3DMark 06这样的高负荷时,它们也能出色地保持较长时间的安静。
在性能模式下的游戏会引起54.4 dB(A)的稳定风扇噪音,这与Alienware x16 R1相似,但比Blade 16的噪音大。降至平衡模式后,如上文所述,风扇噪音明显降低到48.9 dB(A),从而换取了一些性能。
Noise level
| Idle |
| 23.6 / 23.6 / 25.7 dB(A) |
| Load |
| 27.6 / 54.4 dB(A) |
 | ||
30 dB silent 40 dB(A) audible 50 dB(A) loud |
||
min: | ||
| Lenovo Legion Slim 7i 16 Gen 8 GeForce RTX 4070 Laptop GPU, i9-13900H, Samsung PM9A1 MZVL21T0HCLR | HP Omen 16-wf000 GeForce RTX 4080 Laptop GPU, i7-13700HX, SK hynix PC801 HFS002TEJ9X101N | Alienware x16 R1 GeForce RTX 4080 Laptop GPU, i9-13900HK, SK hynix PC801 HFS001TEJ9X101N | Lenovo Legion Pro 7 RTX4090 GeForce RTX 4090 Laptop GPU, i9-13900HX, Samsung PM9A1 MZVL21T0HCLR | Asus ROG Strix G16 G614JZ GeForce RTX 4080 Laptop GPU, i9-13980HX, WD PC SN560 SDDPNQE-1T00 | Razer Blade 16 Early 2023 GeForce RTX 4080 Laptop GPU, i9-13950HX, SSSTC CA6-8D1024 | |
|---|---|---|---|---|---|---|
| Noise | -15% | -6% | -25% | -17% | -2% | |
| off / environment * (dB) | 22.8 | 23 -1% | 22.7 -0% | 25 -10% | 25 -10% | 23 -1% |
| Idle Minimum * (dB) | 23.6 | 29.6 -25% | 23.1 2% | 28 -19% | 26 -10% | 23 3% |
| Idle Average * (dB) | 23.6 | 29.8 -26% | 25.8 -9% | 30 -27% | 28 -19% | 23 3% |
| Idle Maximum * (dB) | 25.7 | 30.4 -18% | 25.8 -0% | 38 -48% | 30 -17% | 23.6 8% |
| Load Average * (dB) | 27.6 | 33.8 -22% | 39.3 -42% | 48 -74% | 48 -74% | 39 -41% |
| Witcher 3 ultra * (dB) | 54.4 | 57 -5% | 49.9 8% | 53 3% | 49 10% | 51.6 5% |
| Load Maximum * (dB) | 54.4 | 58.3 -7% | 54.8 -1% | 55 -1% | 52 4% | 51.3 6% |
* ... smaller is better
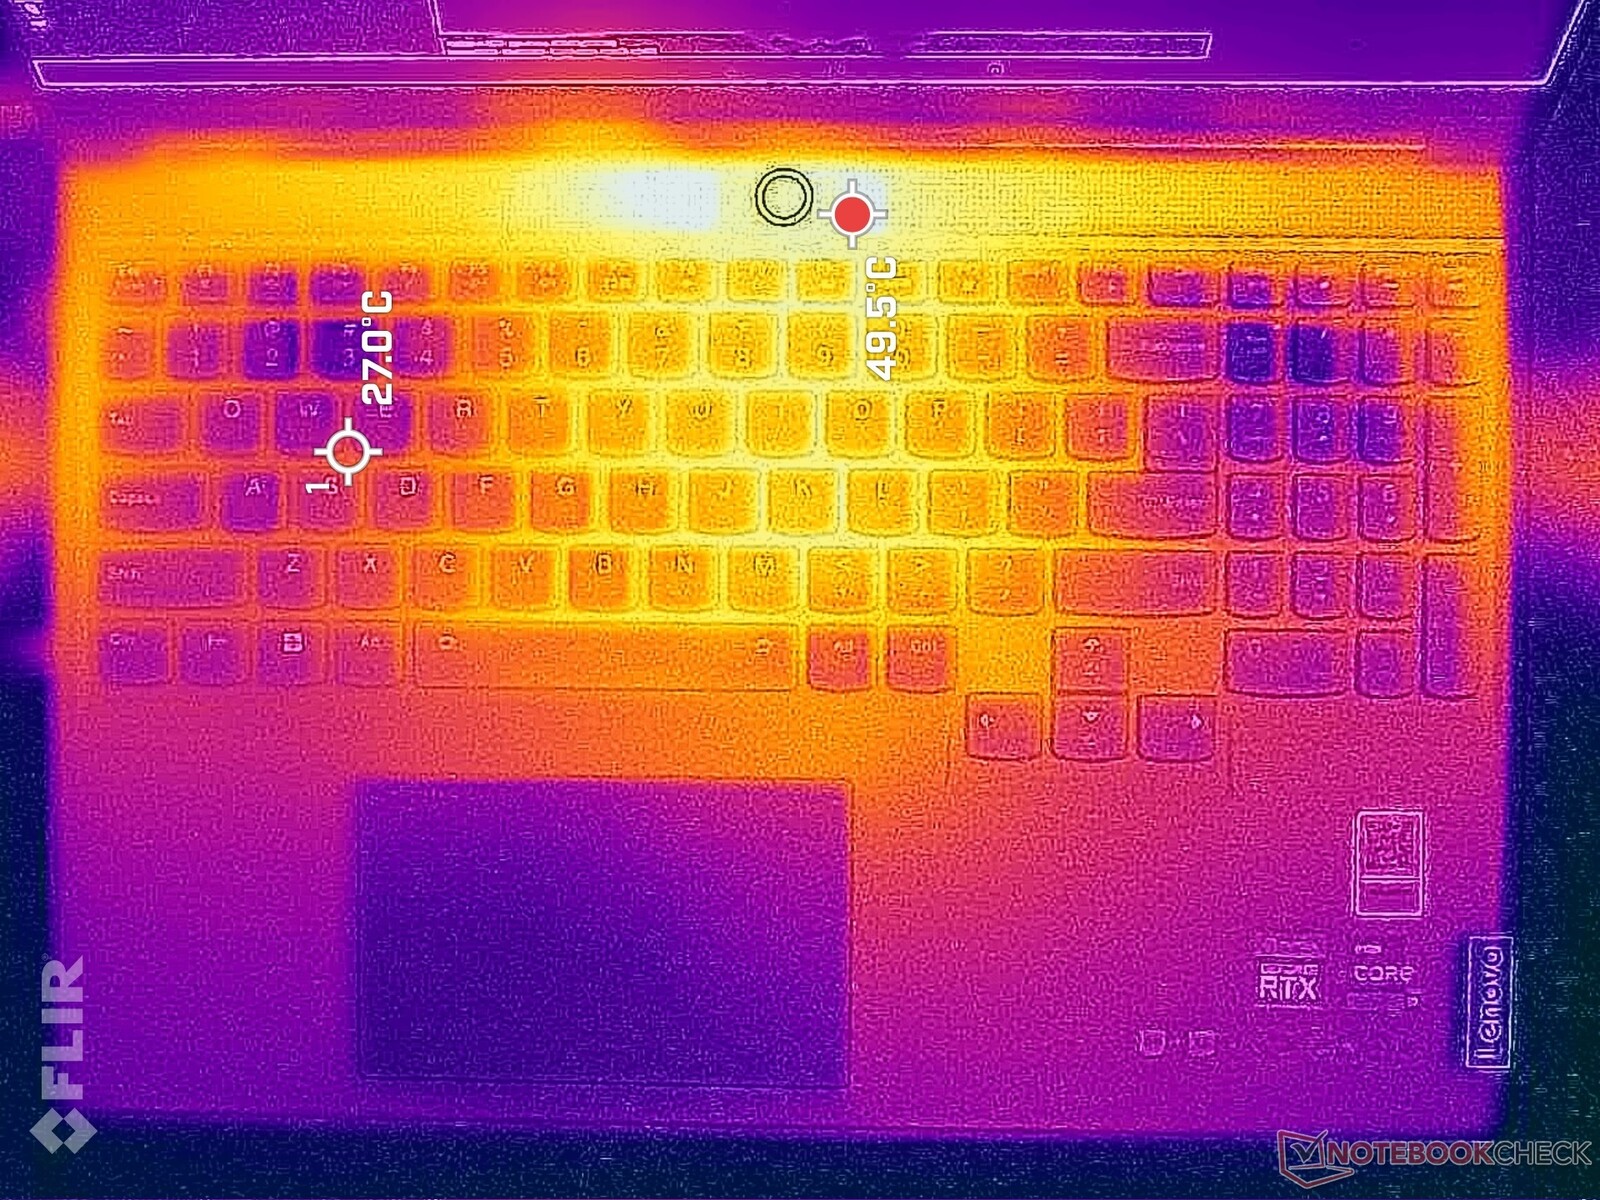
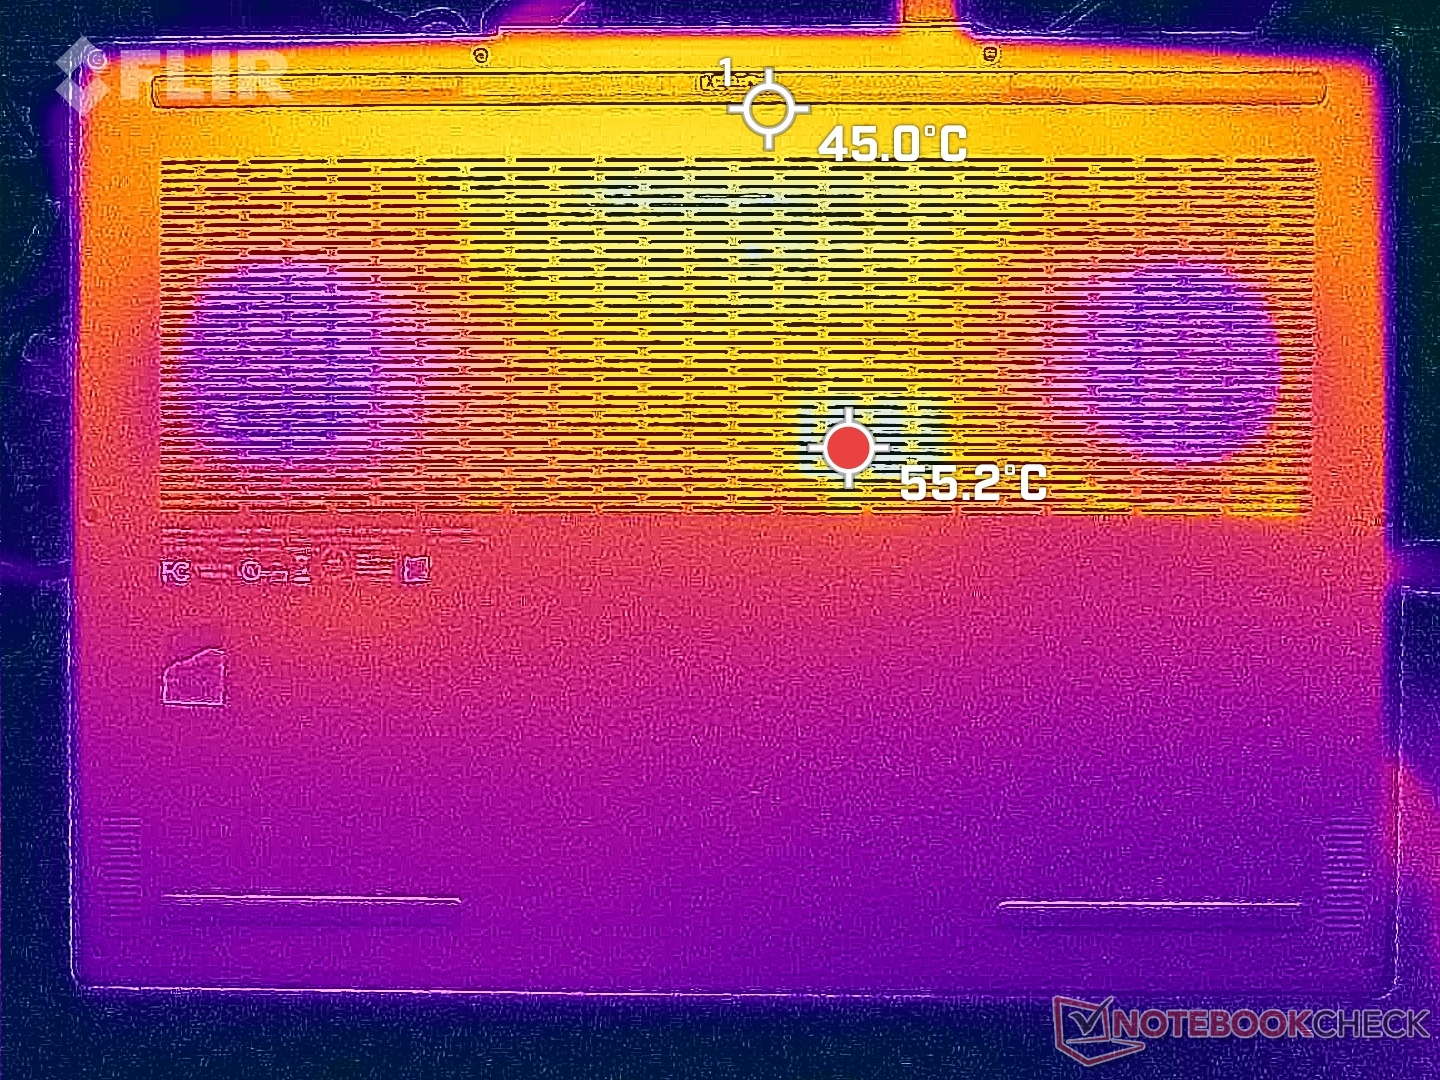
温度
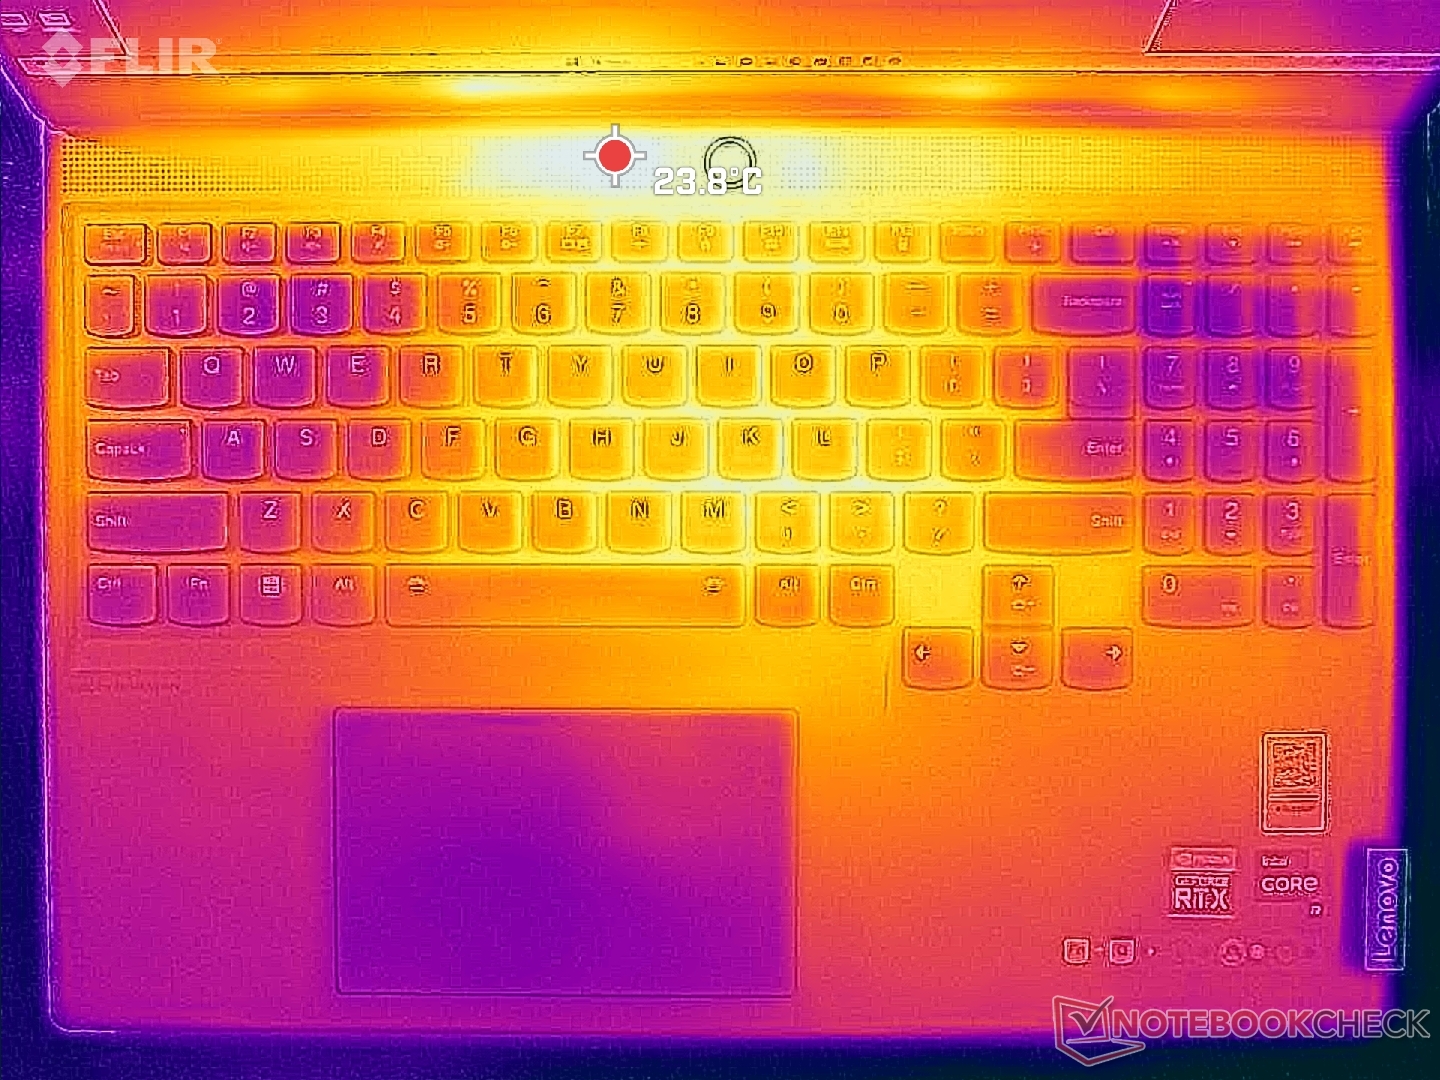
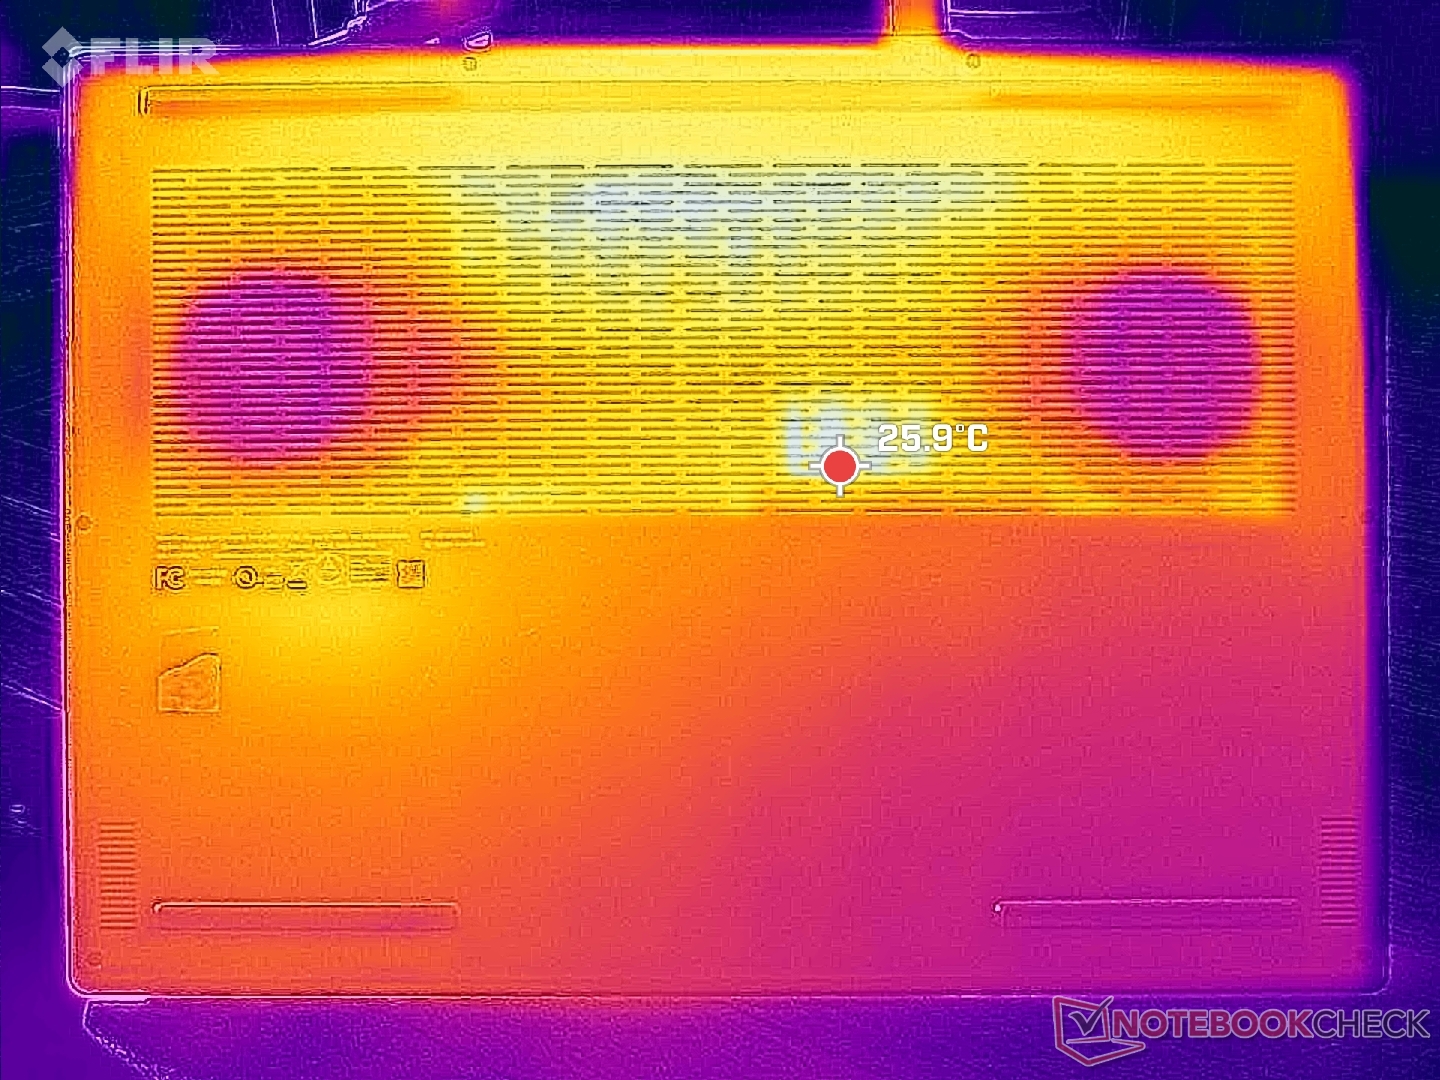
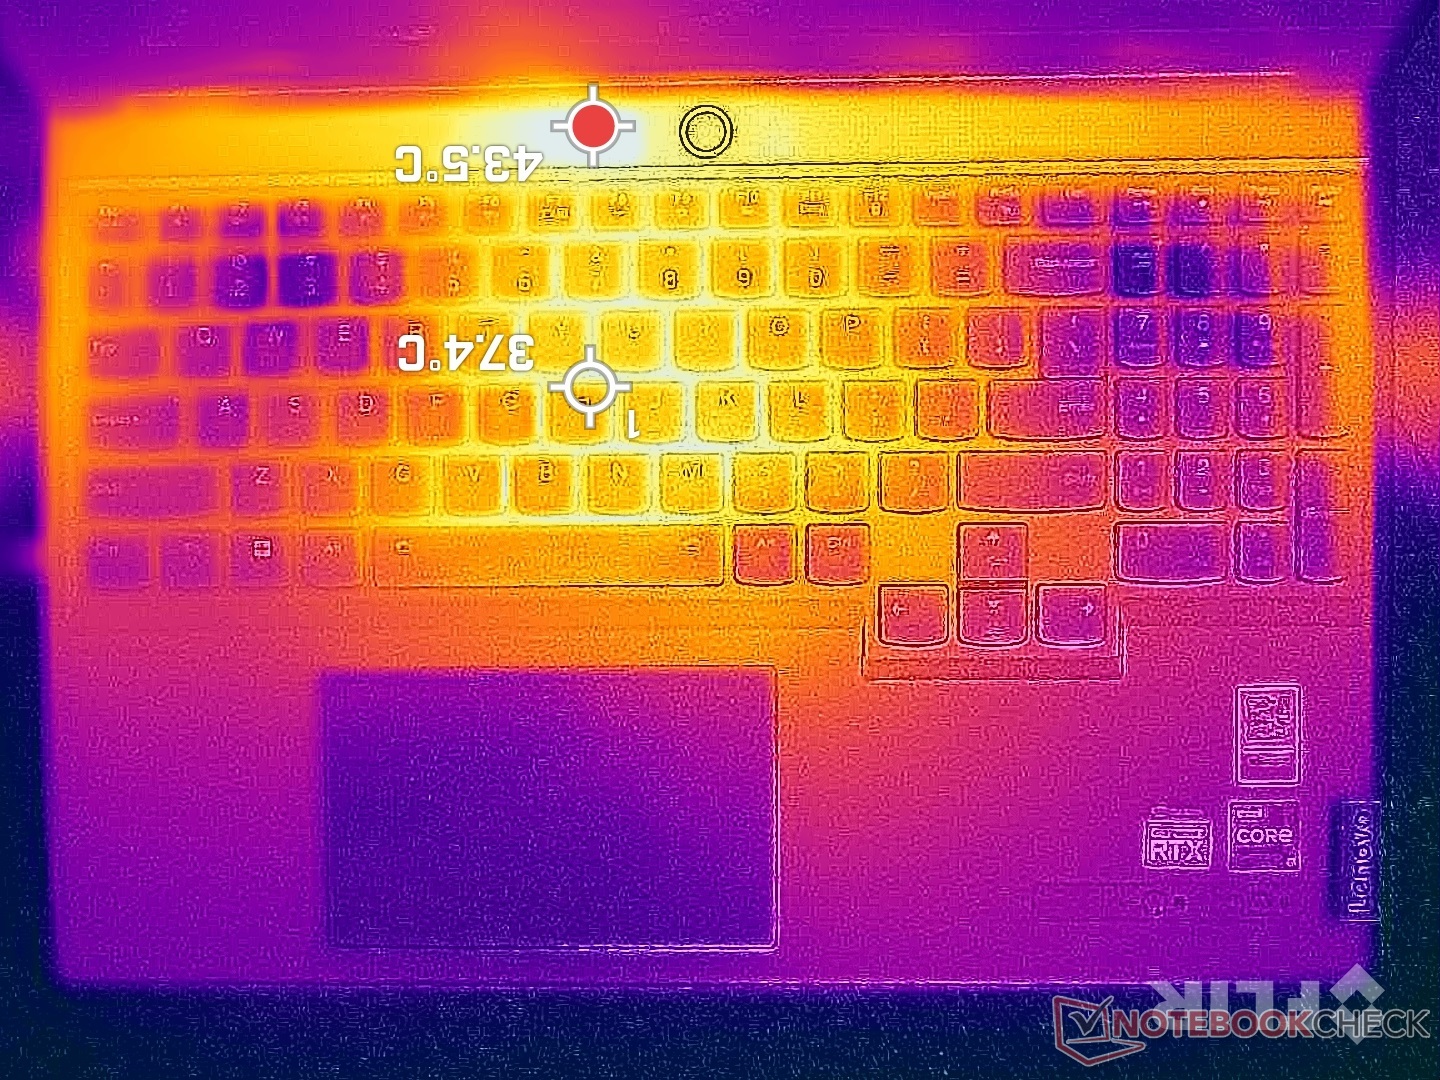
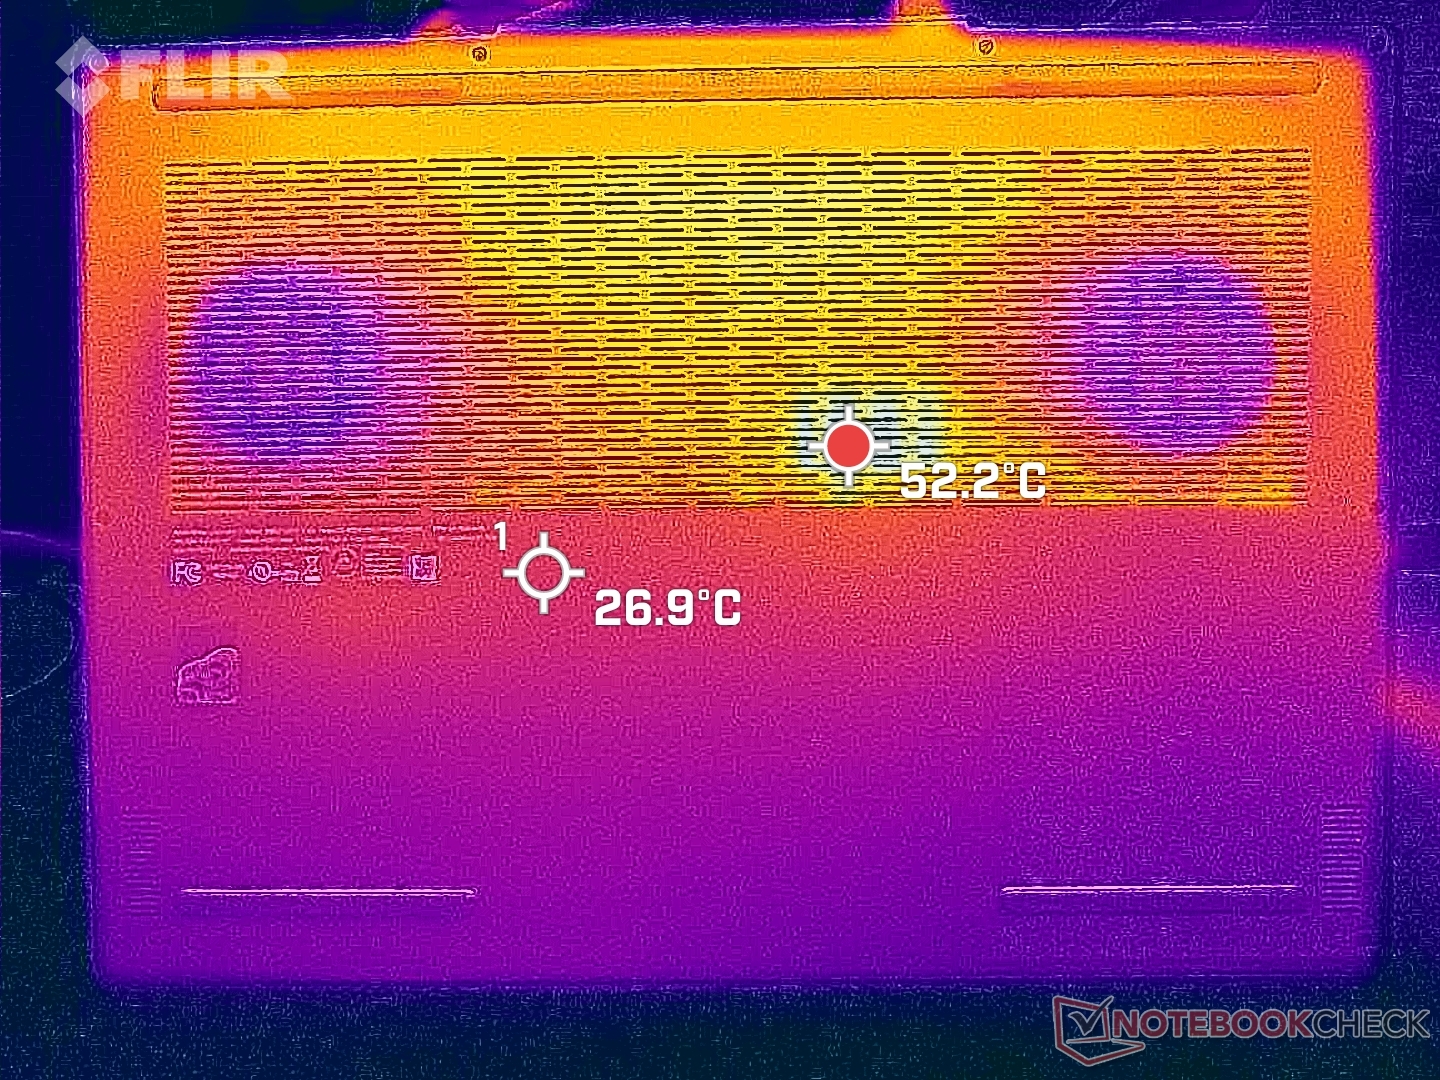
表面温度的热点可以达到43 C至50 C,类似于 遇到游戏等高要求负载时,Alienware x16 R1在运行游戏等高要求的负载时。幸运的是,如下面的温度图所示,热点在最靠近后部边缘和第一排键盘按键的上方,手指和皮肤不太可能接触到那里。相比之下,掌托和WASD键仍然较凉。
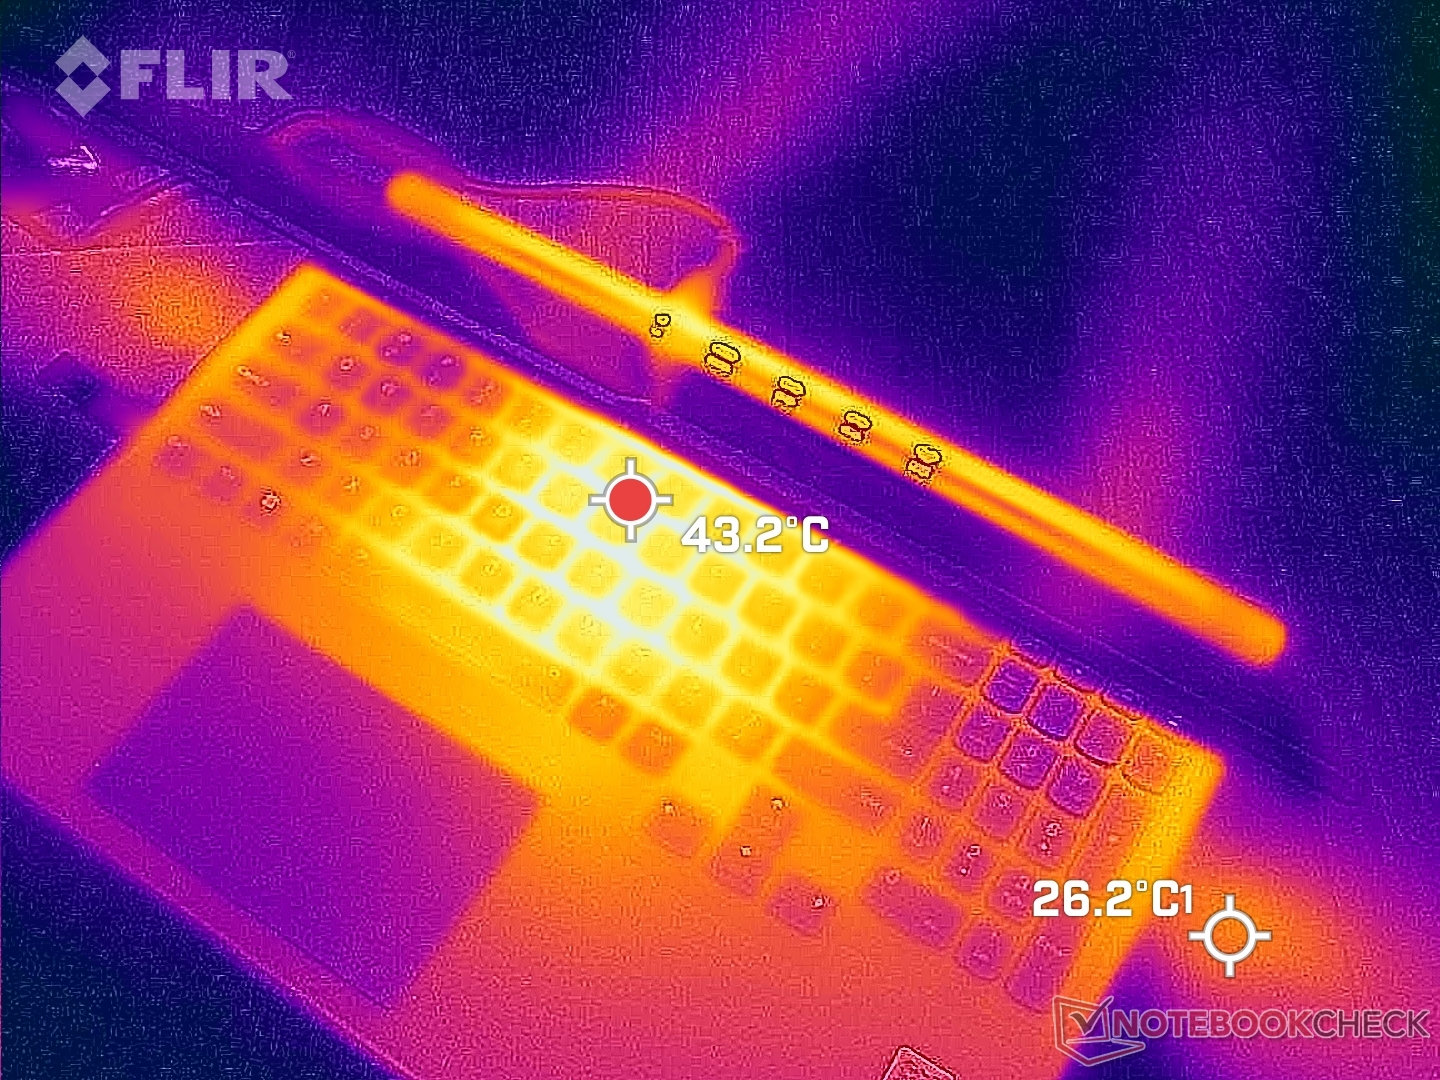
(-) The maximum temperature on the upper side is 49.8 °C / 122 F, compared to the average of 40.4 °C / 105 F, ranging from 21.2 to 68.8 °C for the class Gaming.
(-) The bottom heats up to a maximum of 48.8 °C / 120 F, compared to the average of 43.2 °C / 110 F
(+) In idle usage, the average temperature for the upper side is 26 °C / 79 F, compared to the device average of 33.9 °C / 93 F.
(±) Playing The Witcher 3, the average temperature for the upper side is 35.1 °C / 95 F, compared to the device average of 33.9 °C / 93 F.
(+) The palmrests and touchpad are cooler than skin temperature with a maximum of 29.4 °C / 84.9 F and are therefore cool to the touch.
(±) The average temperature of the palmrest area of similar devices was 28.8 °C / 83.8 F (-0.6 °C / -1.1 F).
| Lenovo Legion Slim 7i 16 Gen 8 Intel Core i9-13900H, NVIDIA GeForce RTX 4070 Laptop GPU | HP Omen 16-wf000 Intel Core i7-13700HX, NVIDIA GeForce RTX 4080 Laptop GPU | Alienware x16 R1 Intel Core i9-13900HK, NVIDIA GeForce RTX 4080 Laptop GPU | Lenovo Legion Pro 7 RTX4090 Intel Core i9-13900HX, NVIDIA GeForce RTX 4090 Laptop GPU | Asus ROG Strix G16 G614JZ Intel Core i9-13980HX, NVIDIA GeForce RTX 4080 Laptop GPU | Razer Blade 16 Early 2023 Intel Core i9-13950HX, NVIDIA GeForce RTX 4080 Laptop GPU | |
|---|---|---|---|---|---|---|
| Heat | 4% | -9% | -13% | -8% | 7% | |
| Maximum Upper Side * (°C) | 49.8 | 45 10% | 47.2 5% | 53 -6% | 54 -8% | 40 20% |
| Maximum Bottom * (°C) | 48.8 | 48.8 -0% | 47.8 2% | 59 -21% | 55 -13% | 37.6 23% |
| Idle Upper Side * (°C) | 29.4 | 29.2 1% | 36.8 -25% | 34 -16% | 29 1% | 32.4 -10% |
| Idle Bottom * (°C) | 30 | 28.8 4% | 35.8 -19% | 32 -7% | 33 -10% | 31.4 -5% |
* ... smaller is better
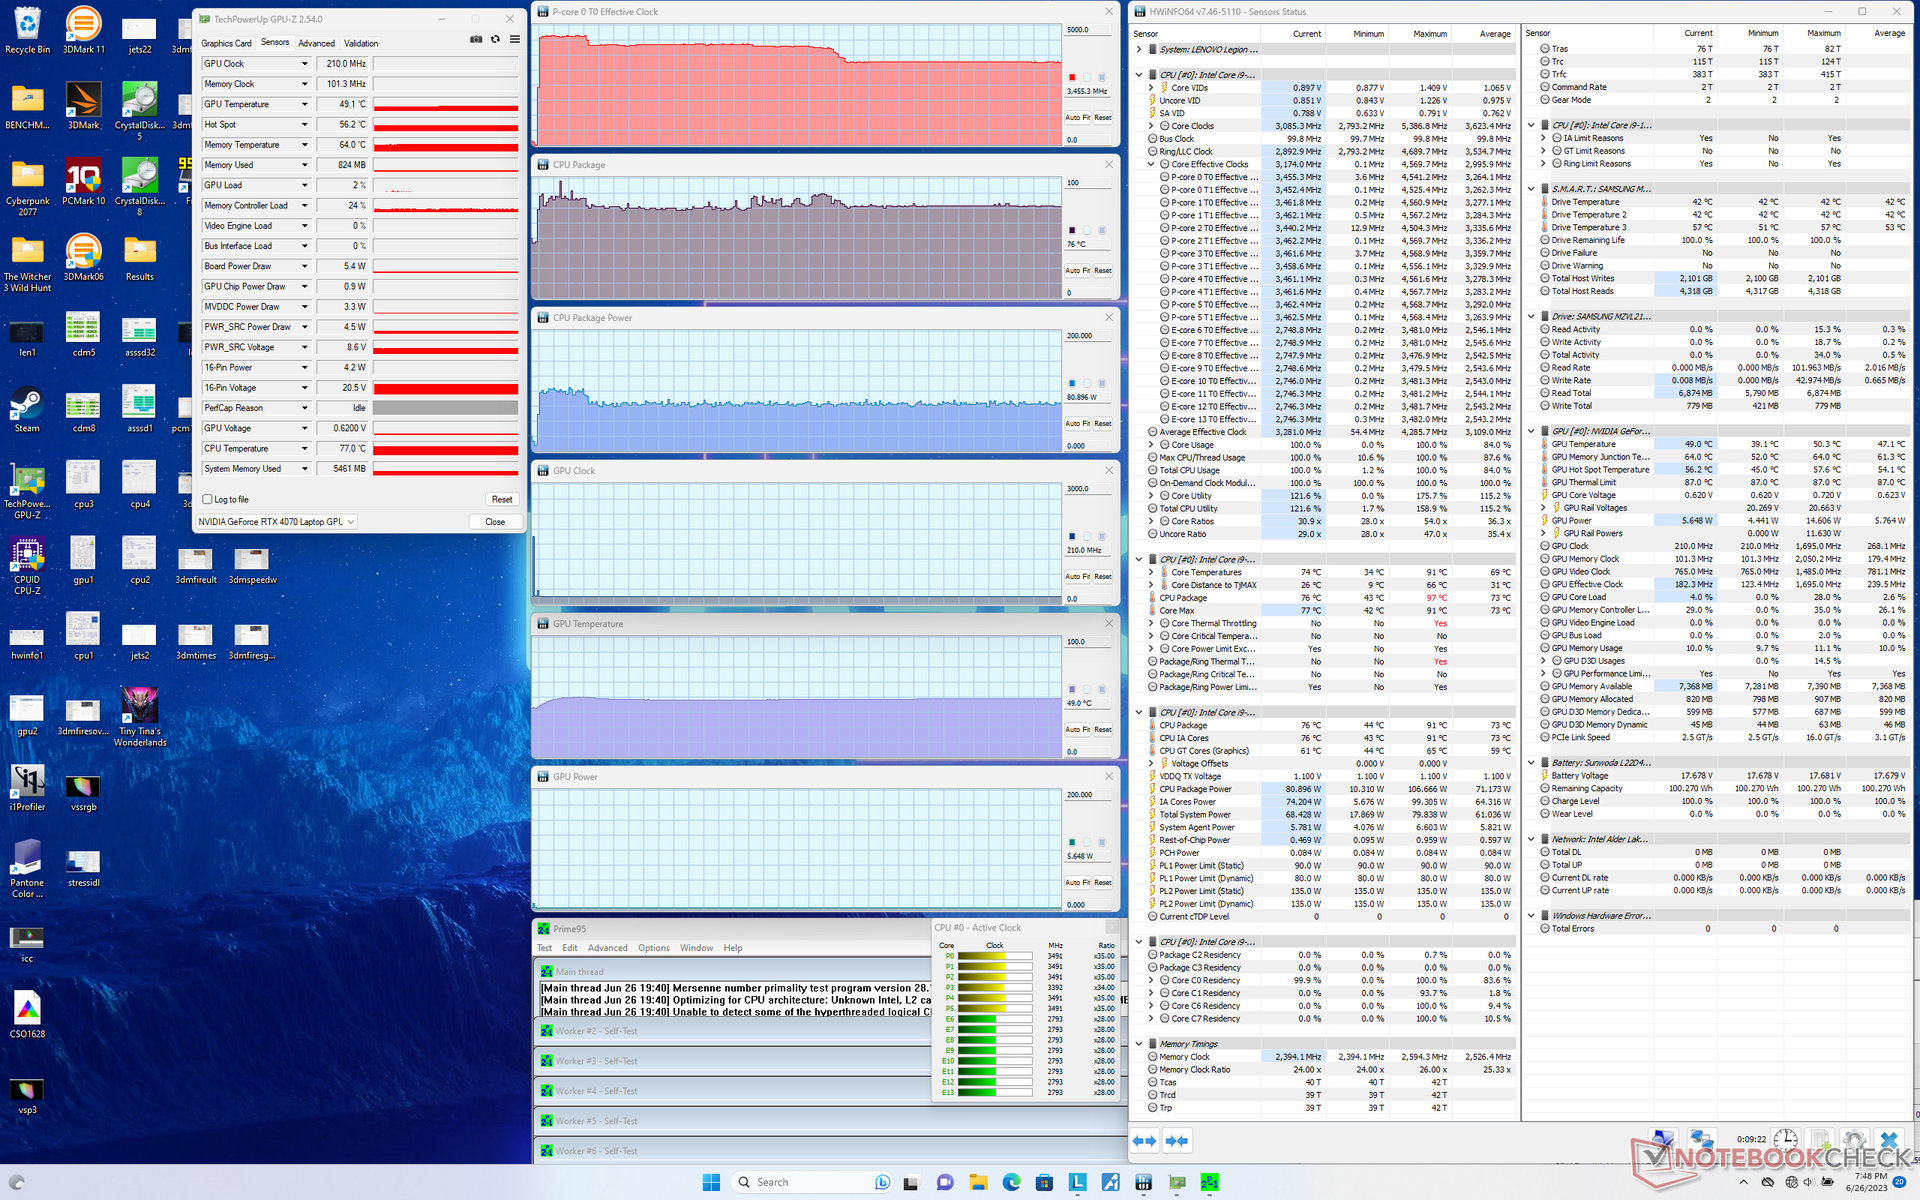
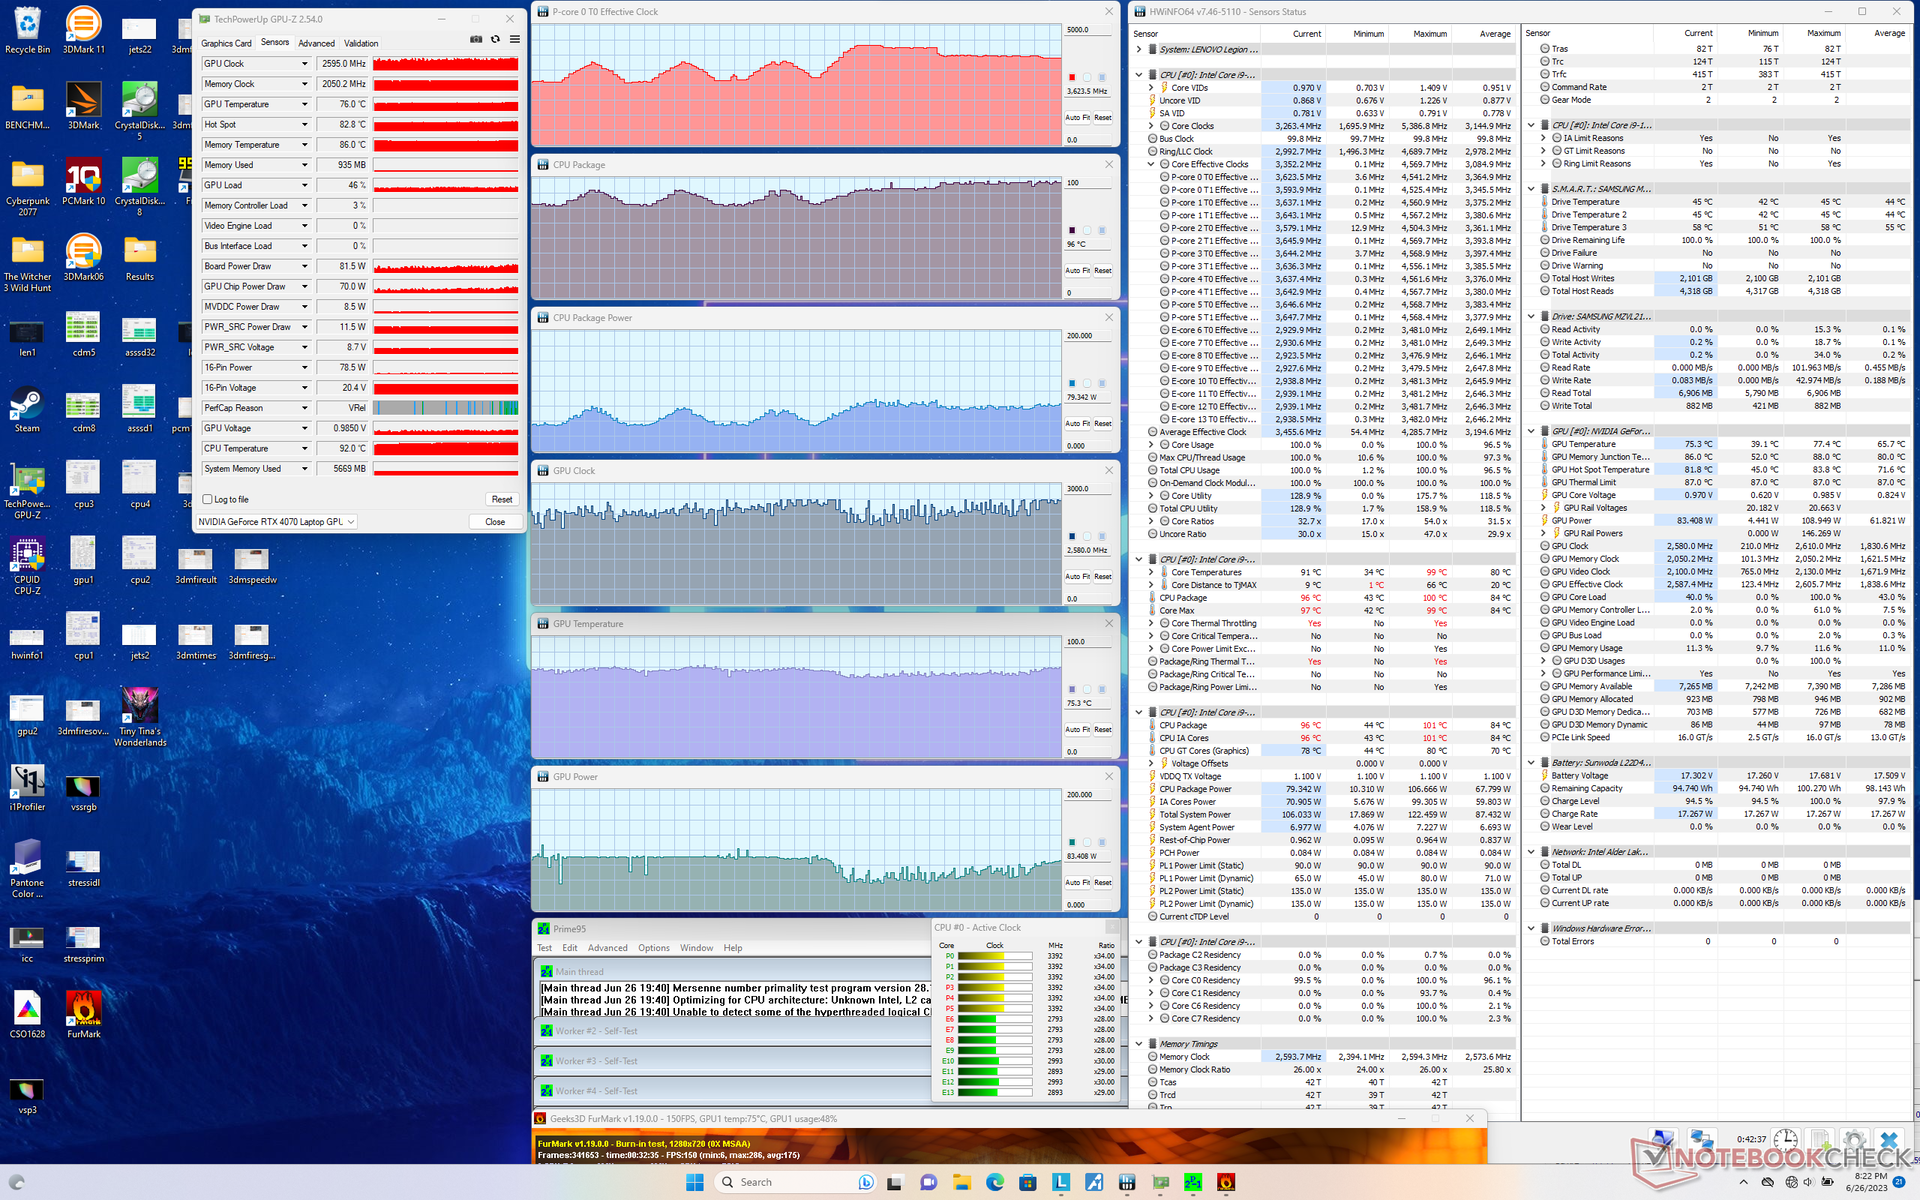
压力测试
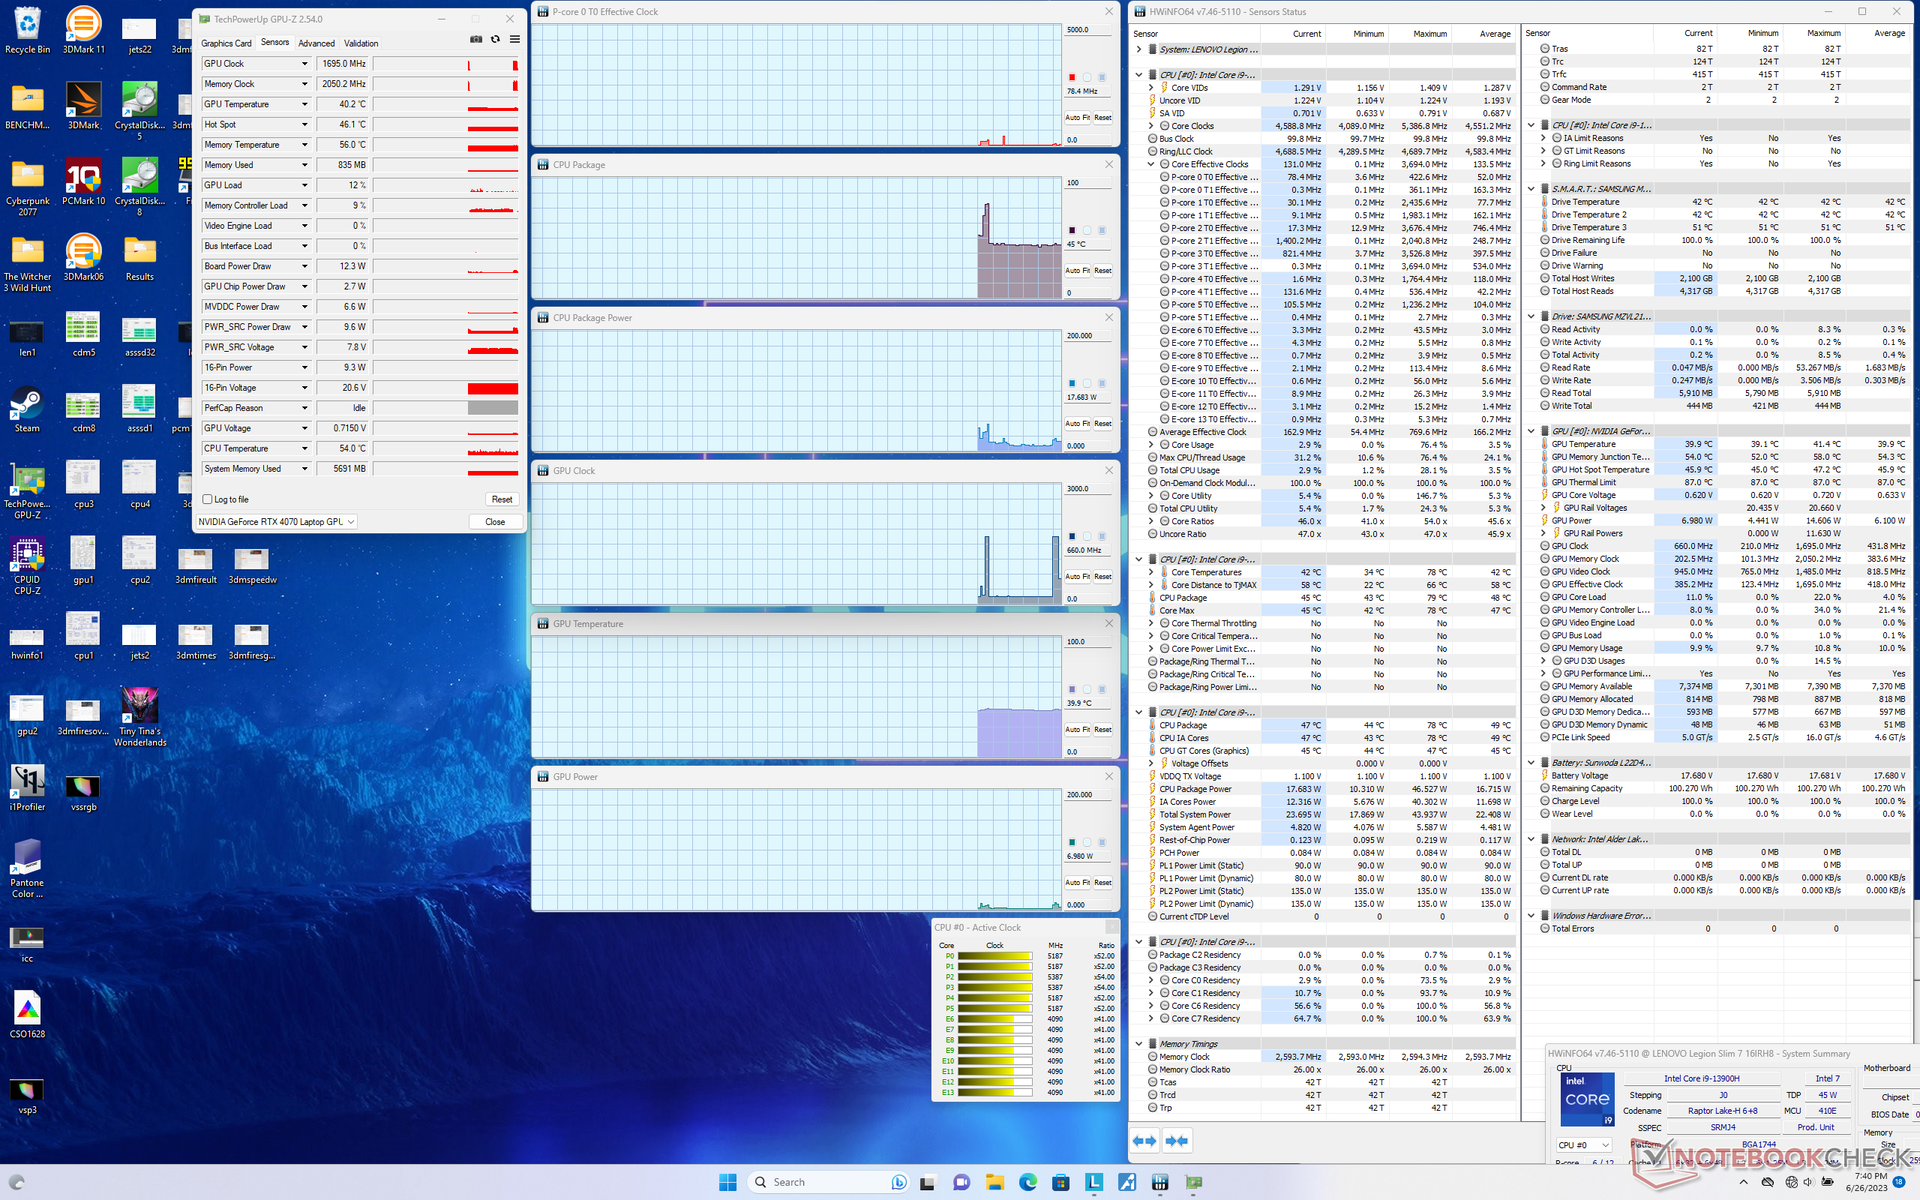
运行Prime95时,CPU的时钟频率、温度和电路板的功耗将分别飙升至4.5 GHz、87 C和100 W,持续约一分钟左右。然后,CPU将最终稳定在3.5 GHz和80 W,以保持76 C的合理核心温度。 刀片16上重复这一相同的测试,配备更快的酷睿i9-13950HX将导致更高的核心温度为82℃。
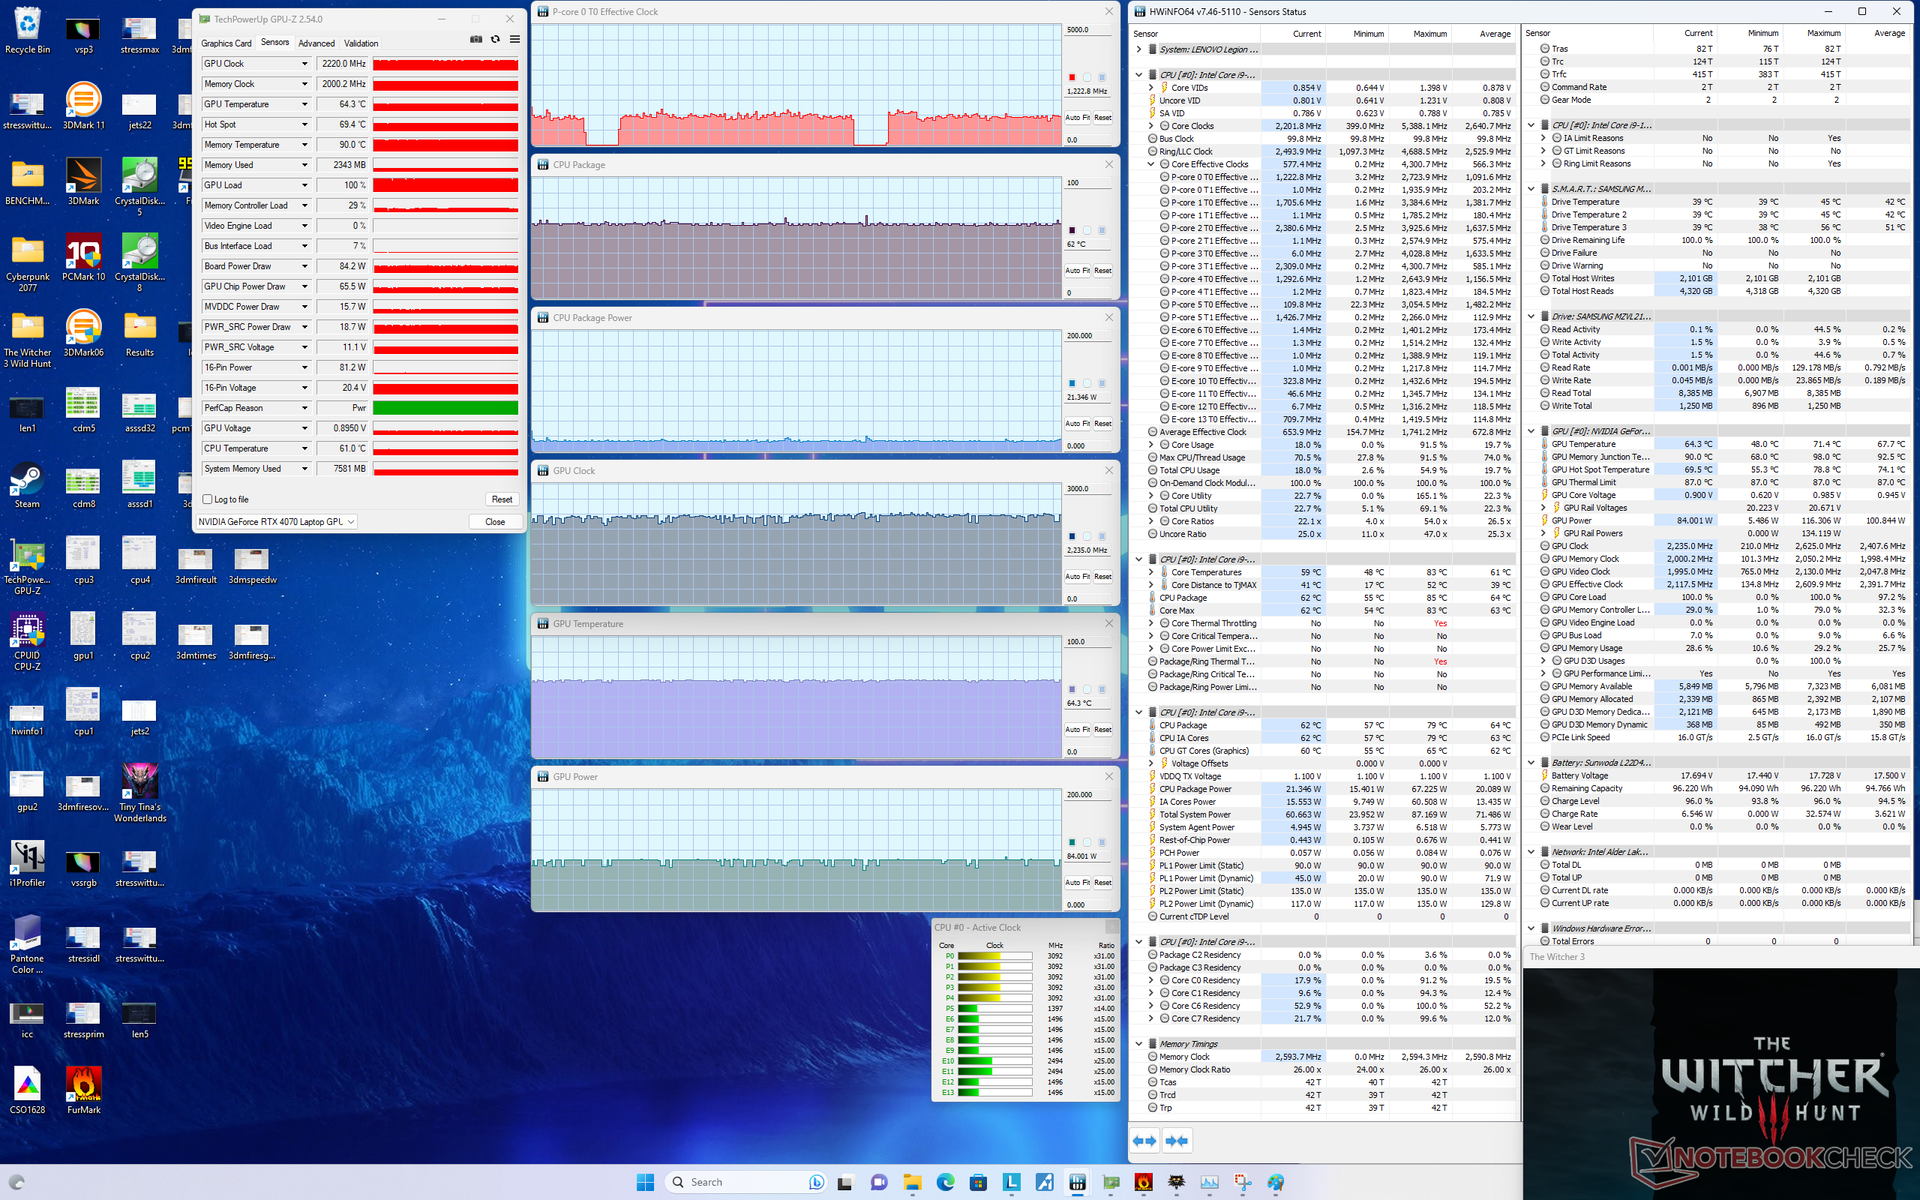
Nvidia GPU将分别稳定在2580 MHz、114 W和71 C,当设置为性能模式并同时激活Overdrive和GPU Overclock时。GPU的纸面目标是140瓦,但我们在运行《赛博朋克2077》时也只能达到123瓦。如果在平衡模式下游戏,主板功耗和核心温度将分别降至84瓦和64摄氏度。对于轻薄型游戏笔记本来说,核心温度偏低;例如,Alienware x16 R1的CPU和GPU温度在运行同样的游戏时将高达80至95℃。
使用电池电源运行限制了性能,因为性能电源配置文件变成了灰色。Fire Strike ,物理和图形得分分别只有25602分和21049分,而使用电源时则为32664分和30130分。
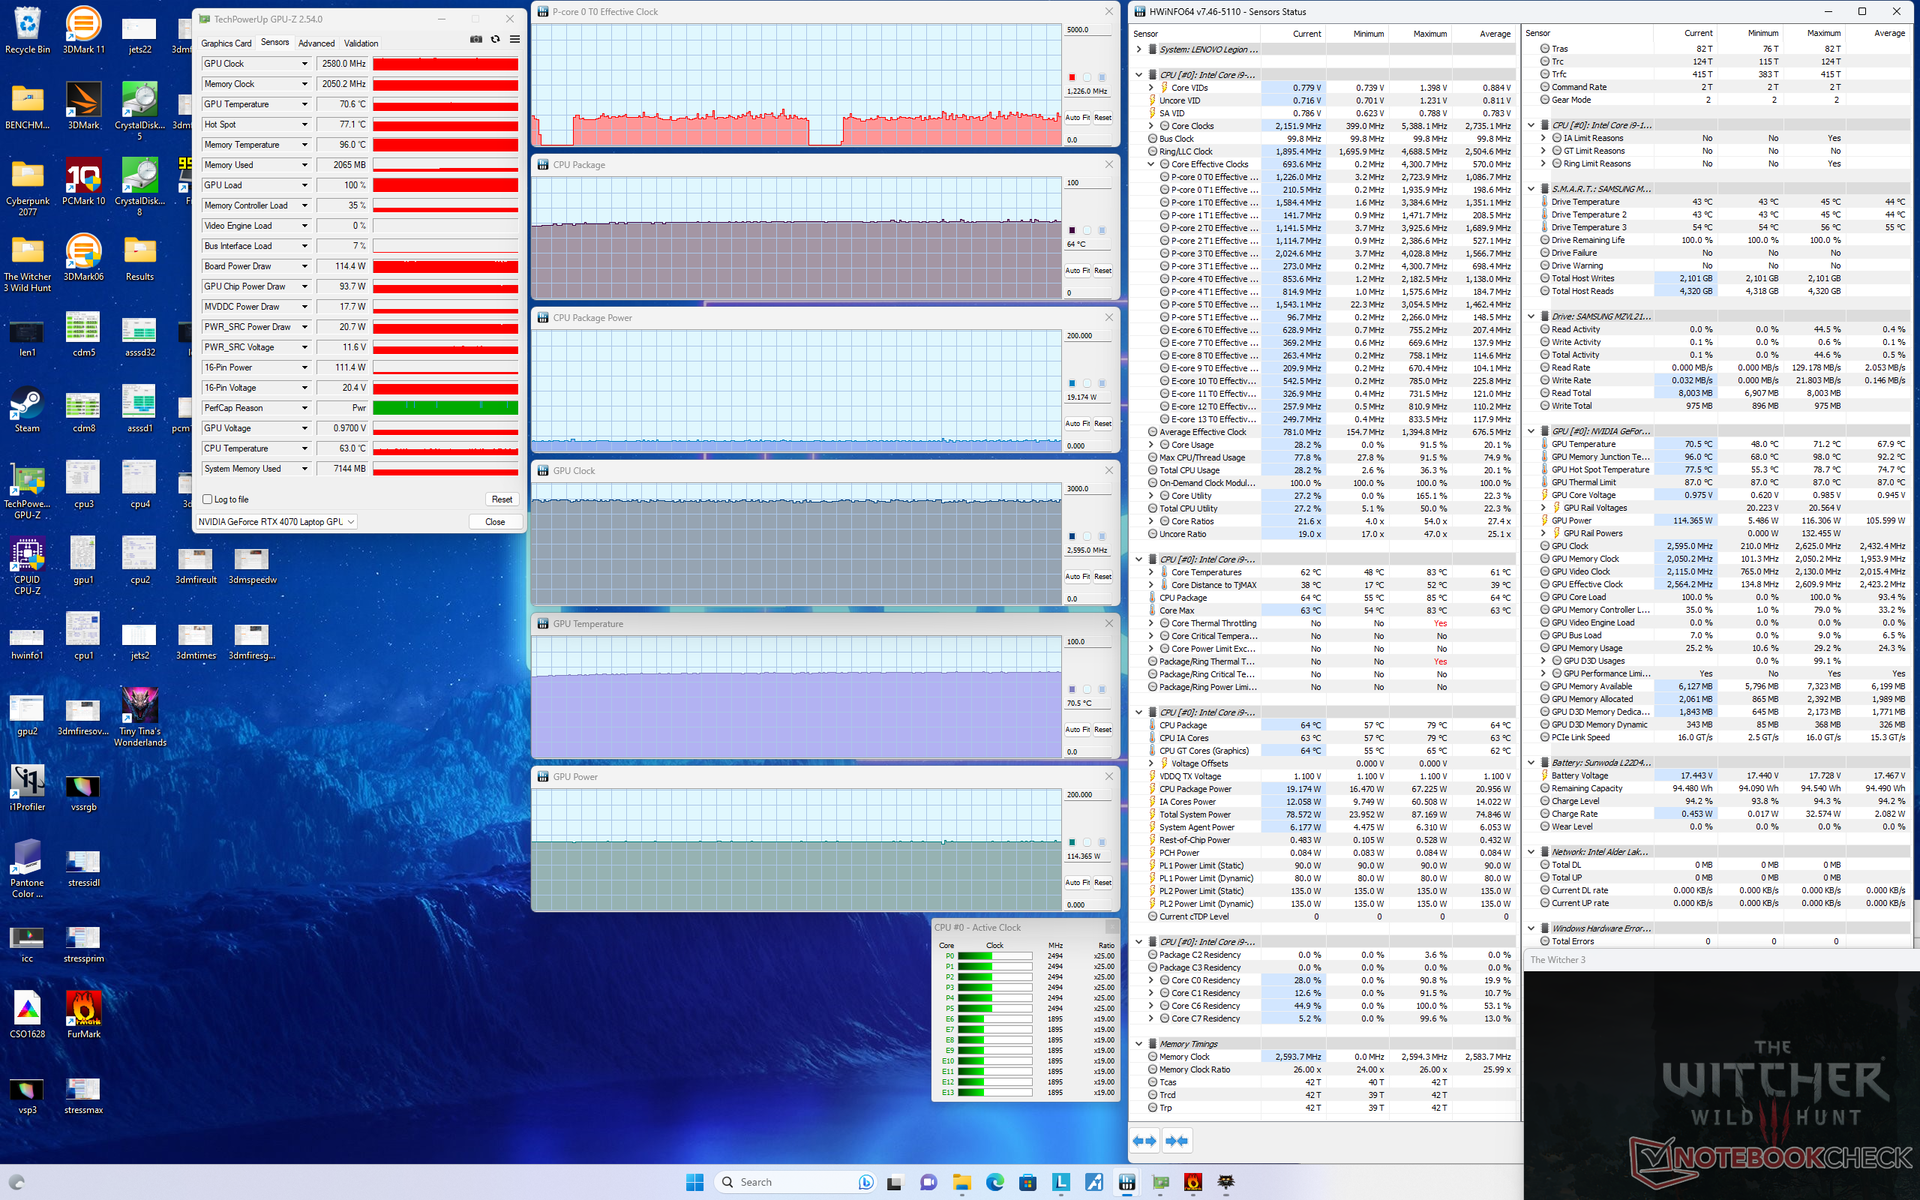
| CPU时钟(GHz) | GPU时钟(MHz) | CPU平均温度(°C) | GPU平均温度(°C) | |
| 系统空闲 | -- | -- | 45 | 40 |
| Prime95压力 | 3.5 | -- | 76 | 49 |
| Prime95 + FurMark 压力 | 2.6 - 3.5 | 1920 - 2610 | 77 - 90 | 75 |
| Witcher 3 压力(平衡模式) | ~1.2 | 2220 | 62 | 64 |
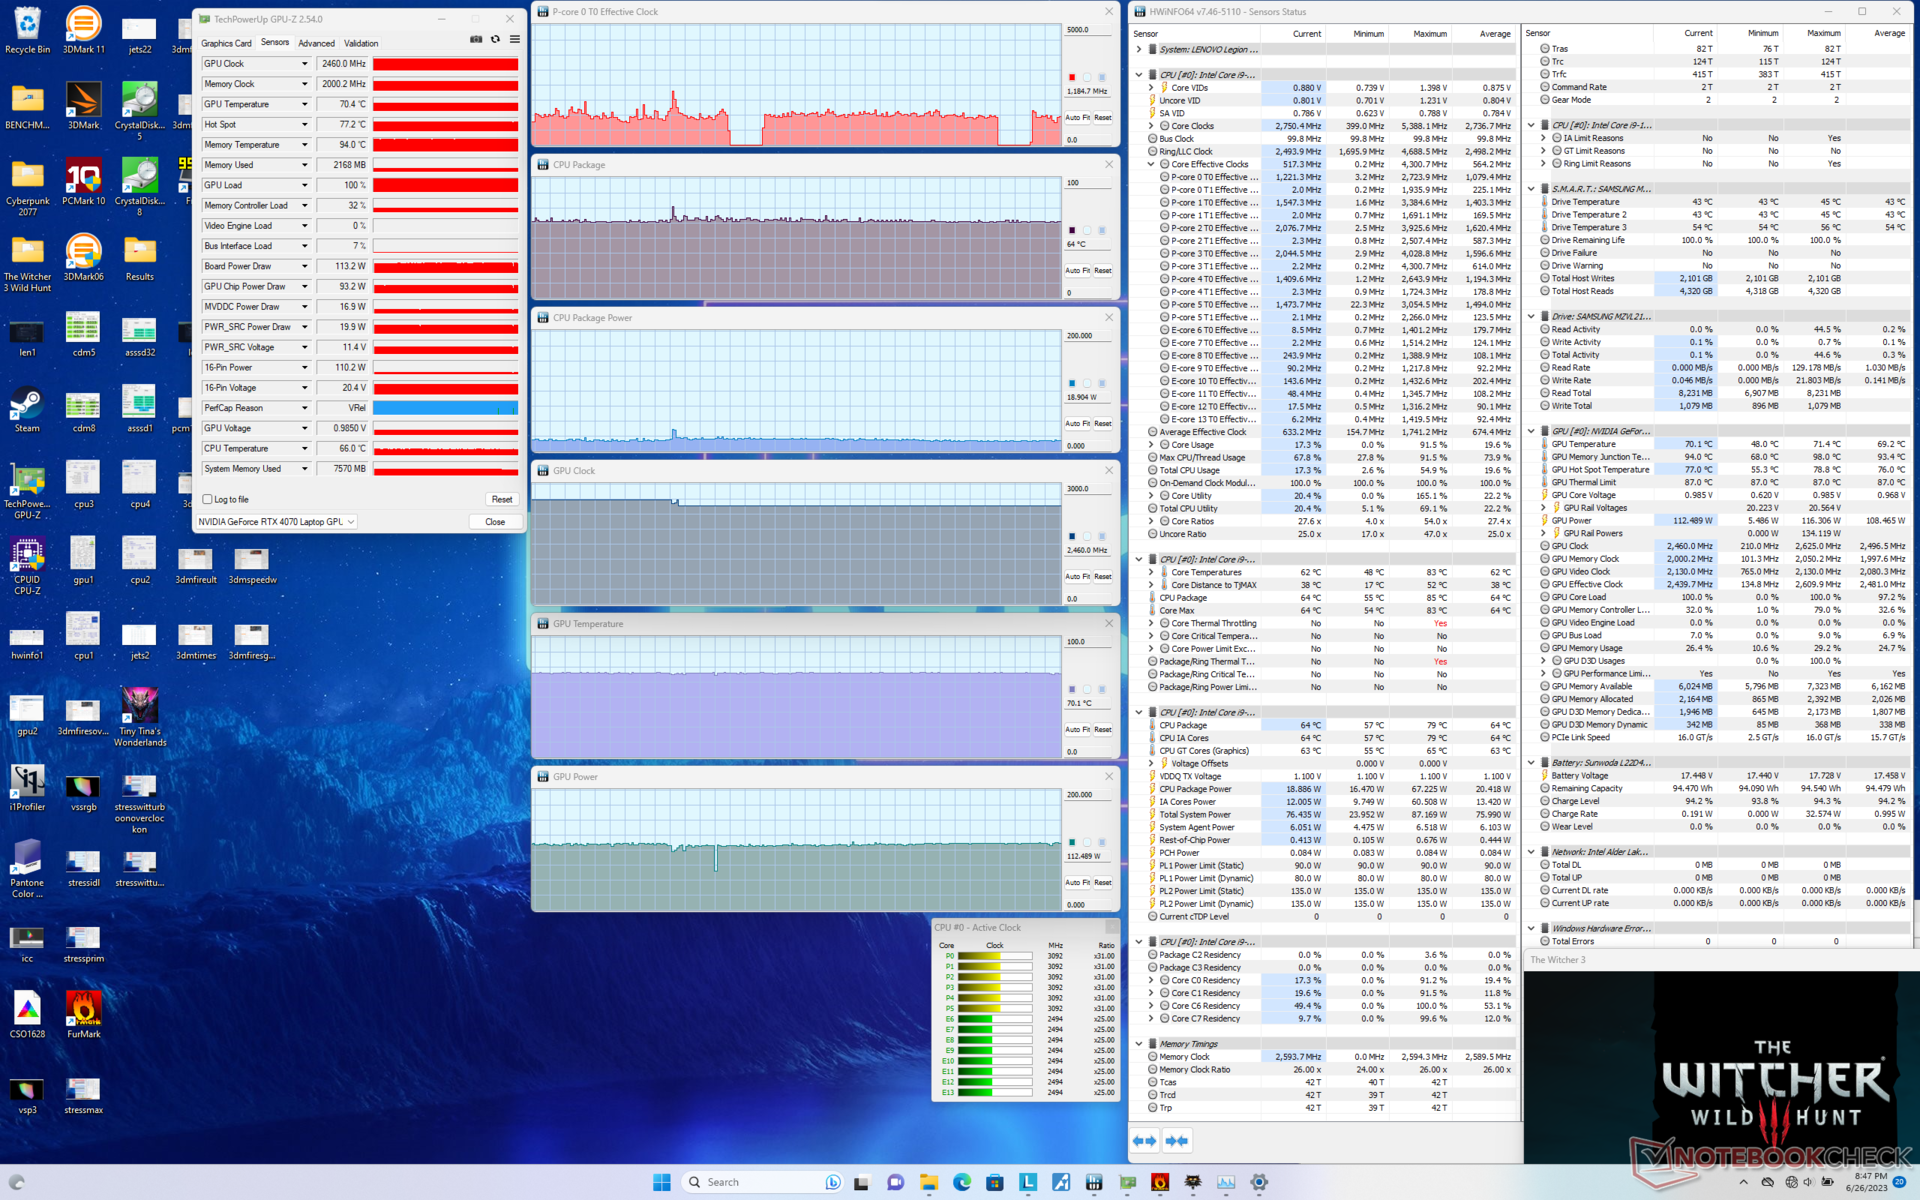
| Witcher 3 压力(性能/关闭GPU超频+关闭超速) | ~1.2 | 2460 | 64 | 70 |
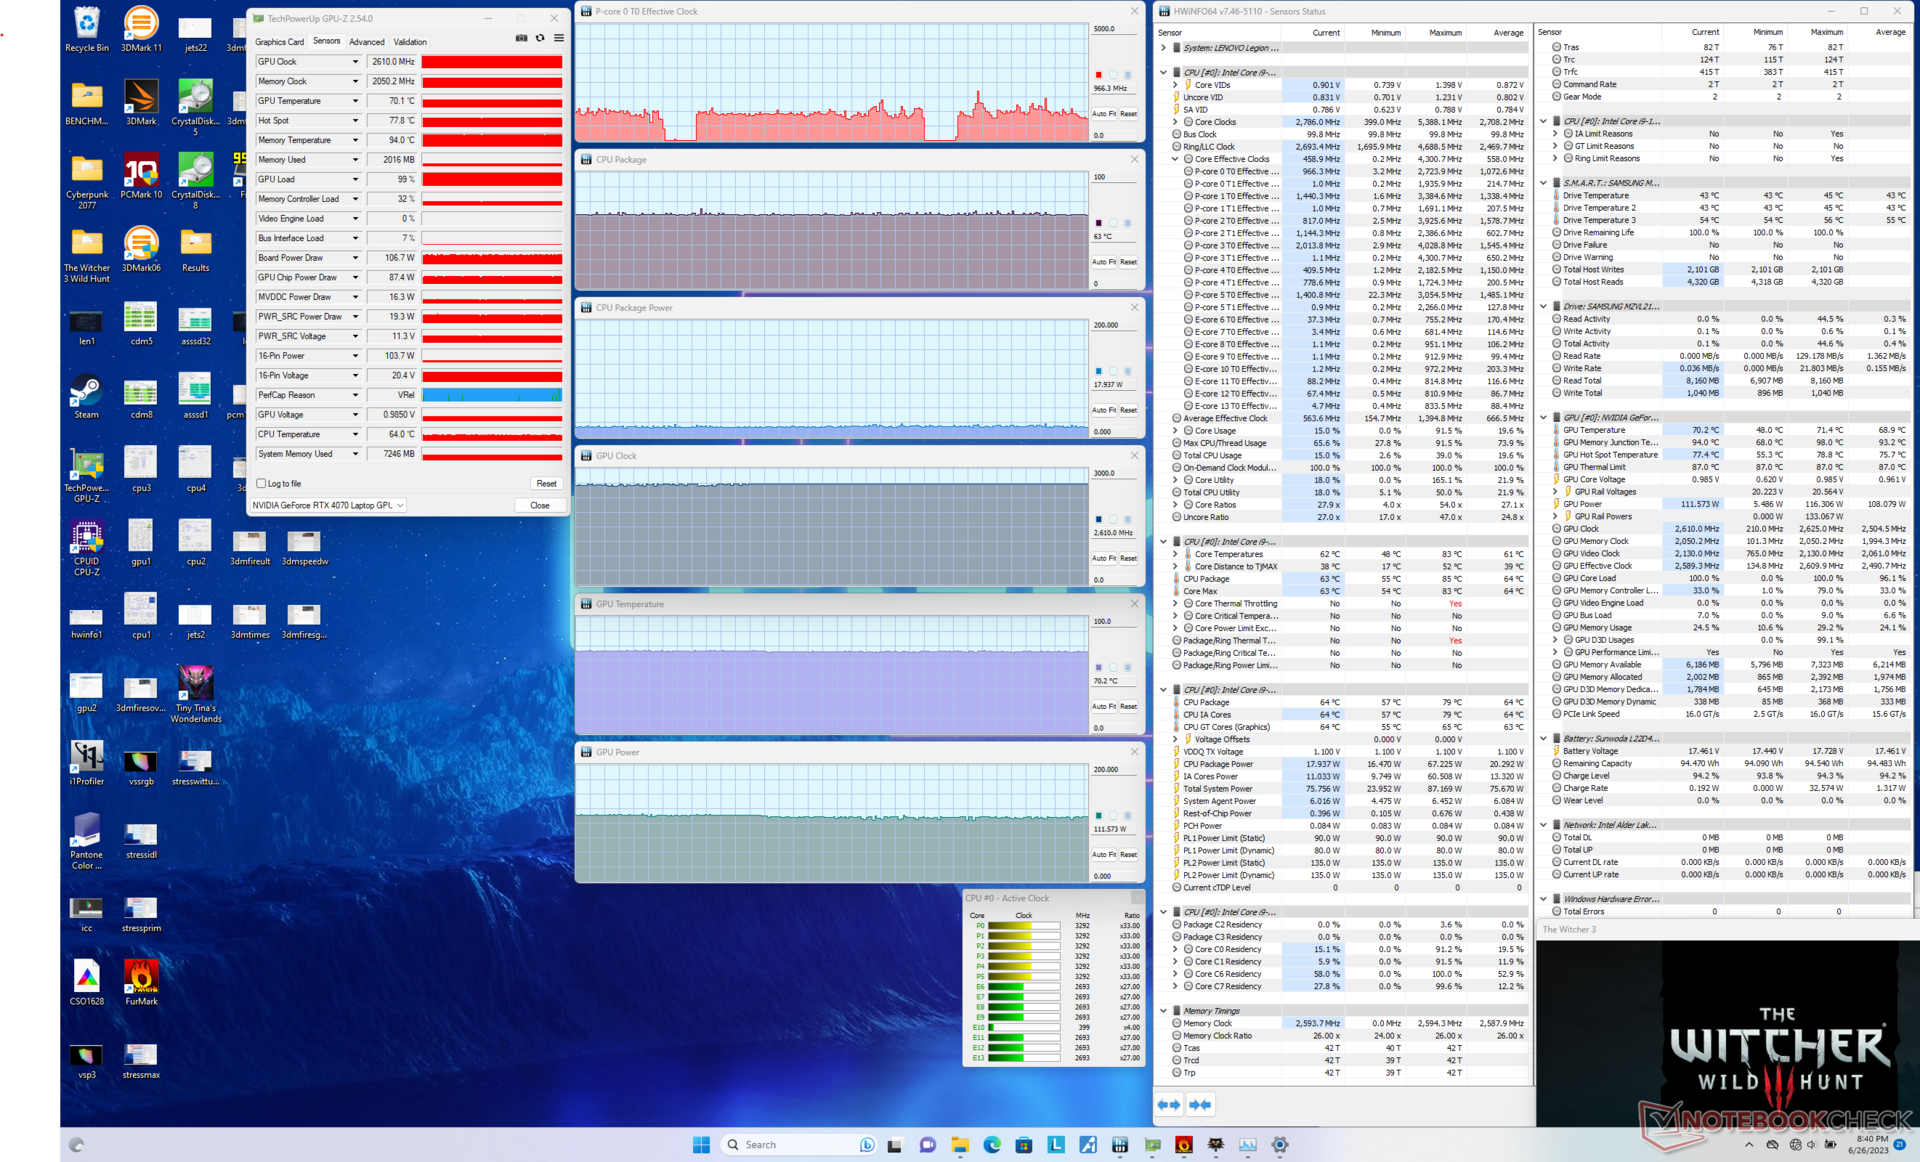
| Witcher 3 压力(性能/GPU超频开启+超速关闭) | ~1.2 | 2610 | 63 | 70 |
| Witcher 3 压力(性能/GPU超频开启+超速开启) | ~1.2 | 2580 | 64 | 71 |
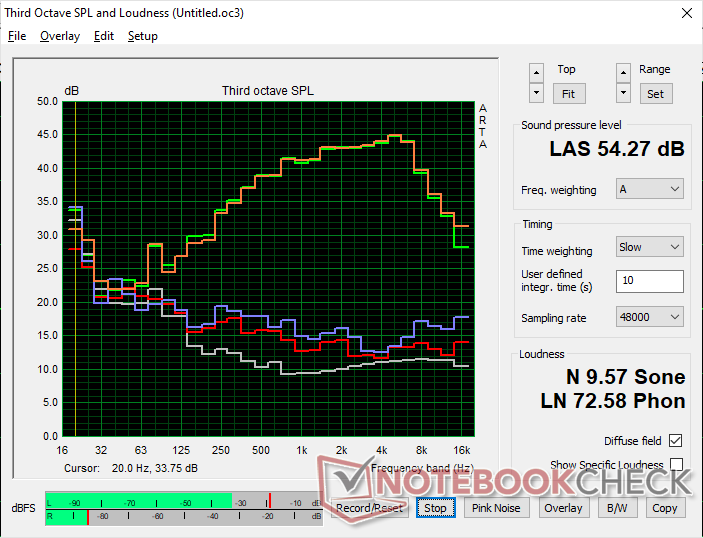
发言人
扬声器的最大音量约为85 dB(A),与大多数其他游戏笔记本电脑的音量差不多。在音频质量或低音再现方面也没有什么特别之处。在平衡模式下进行游戏时,扬声器的表现更好,因为风扇没有那么响。
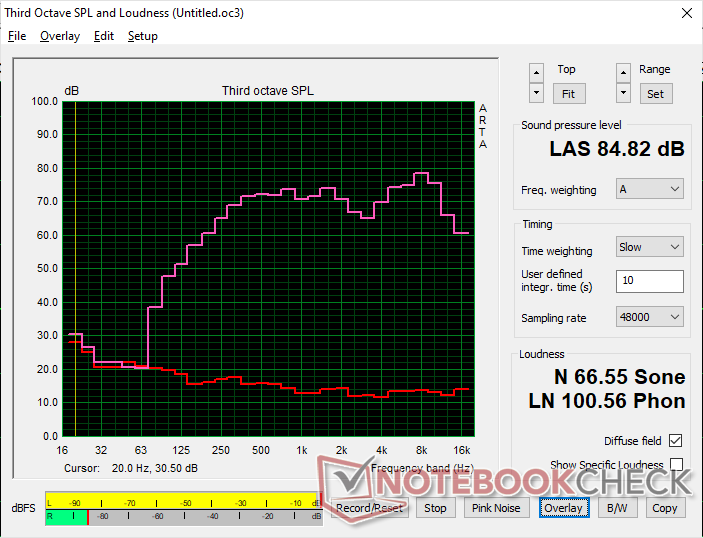
Lenovo Legion Slim 7i 16 Gen 8 audio analysis
(+) | speakers can play relatively loud (84.8 dB)
Bass 100 - 315 Hz
(±) | reduced bass - on average 12.1% lower than median
(±) | linearity of bass is average (9% delta to prev. frequency)
Mids 400 - 2000 Hz
(+) | balanced mids - only 1.4% away from median
(+) | mids are linear (3.3% delta to prev. frequency)
Highs 2 - 16 kHz
(+) | balanced highs - only 4.4% away from median
(+) | highs are linear (5.6% delta to prev. frequency)
Overall 100 - 16.000 Hz
(+) | overall sound is linear (10.5% difference to median)
Compared to same class
» 6% of all tested devices in this class were better, 2% similar, 92% worse
» The best had a delta of 6%, average was 18%, worst was 132%
Compared to all devices tested
» 5% of all tested devices were better, 1% similar, 93% worse
» The best had a delta of 4%, average was 23%, worst was 134%
Apple MacBook Pro 16 2021 M1 Pro audio analysis
(+) | speakers can play relatively loud (84.7 dB)
Bass 100 - 315 Hz
(+) | good bass - only 3.8% away from median
(+) | bass is linear (5.2% delta to prev. frequency)
Mids 400 - 2000 Hz
(+) | balanced mids - only 1.3% away from median
(+) | mids are linear (2.1% delta to prev. frequency)
Highs 2 - 16 kHz
(+) | balanced highs - only 1.9% away from median
(+) | highs are linear (2.7% delta to prev. frequency)
Overall 100 - 16.000 Hz
(+) | overall sound is linear (4.6% difference to median)
Compared to same class
» 0% of all tested devices in this class were better, 0% similar, 100% worse
» The best had a delta of 5%, average was 17%, worst was 45%
Compared to all devices tested
» 0% of all tested devices were better, 0% similar, 100% worse
» The best had a delta of 4%, average was 23%, worst was 134%
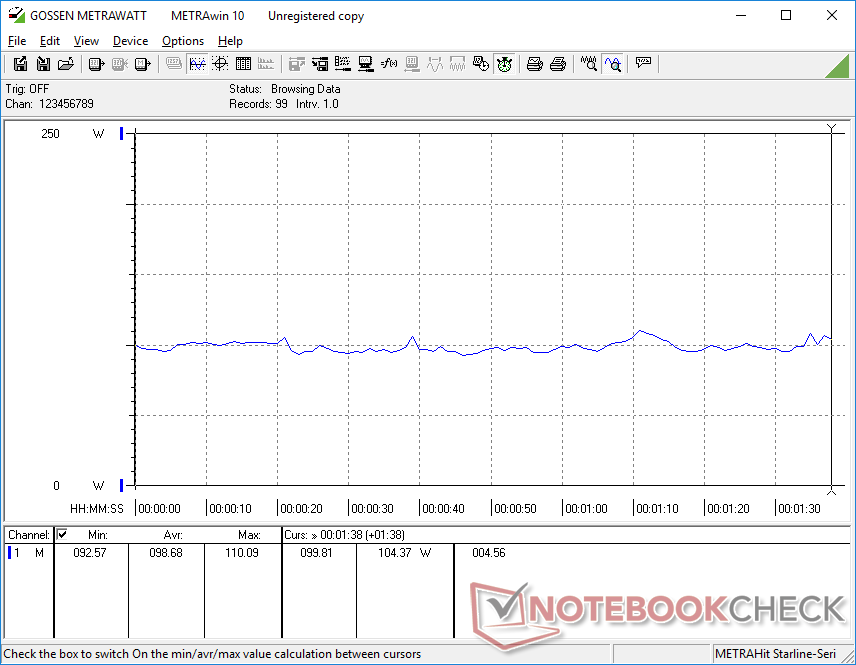
能源管理
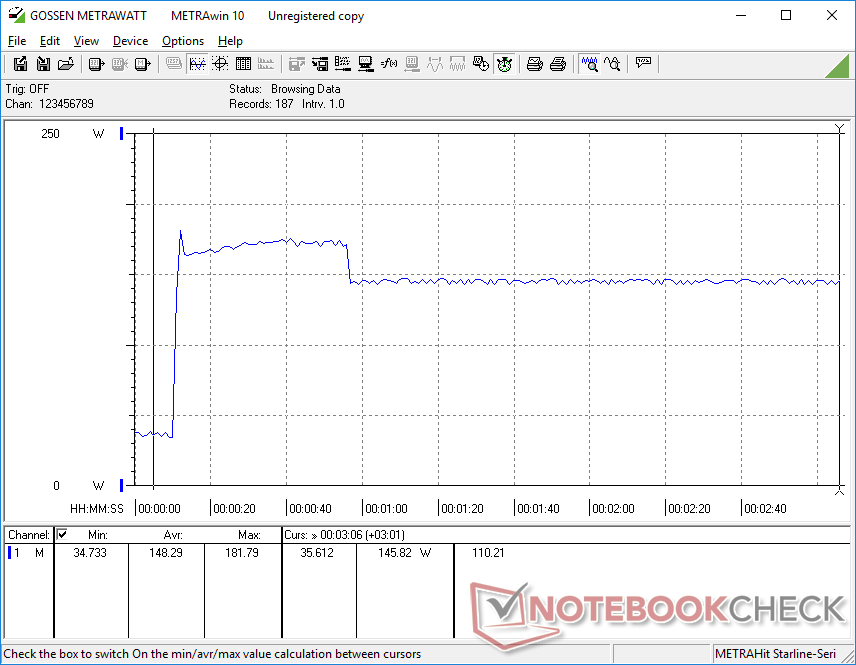
功率消耗 - 高空闲率
在桌面上闲置时的功耗相对较高,为22瓦,即使是在省电模式和最低亮度设置下。如下表所示,这似乎是采用第13代酷睿-H处理器的游戏笔记本电脑的一个共同特征,这可能是造成电池运行时间平平的原因。相比之下,由AMD Zen 4驱动的 Legion Pro 5 16在类似条件下可低至8瓦。
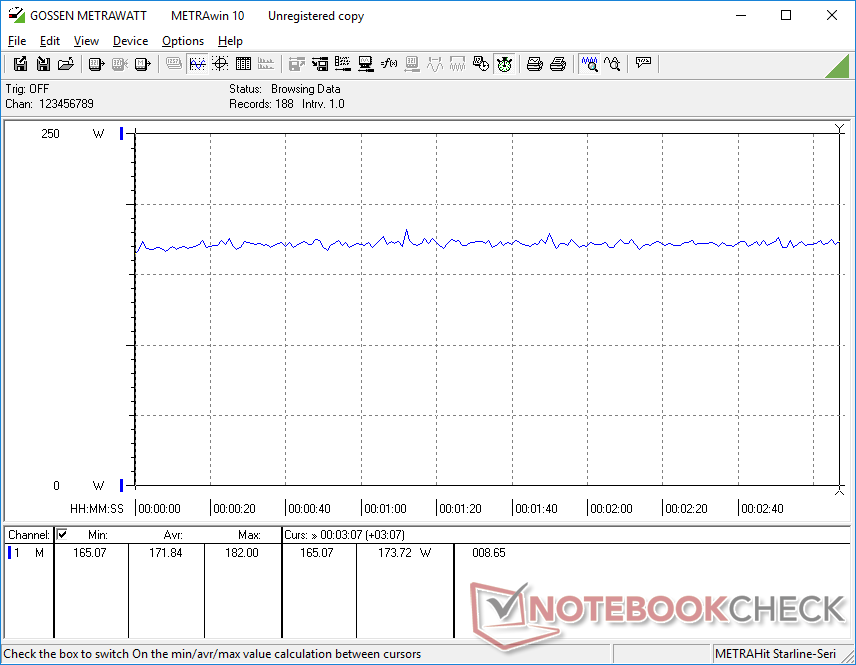
游戏消耗约172瓦,这与旧的 Zephyrus M16由Core i9-12900H和RTX 3070 Ti驱动。因此,我们的Legion Slim 7能够提供大约15%的快速图形性能,而不需要消耗更多的电力,以获得比老式安培动力游戏笔记本更高的每瓦性能。
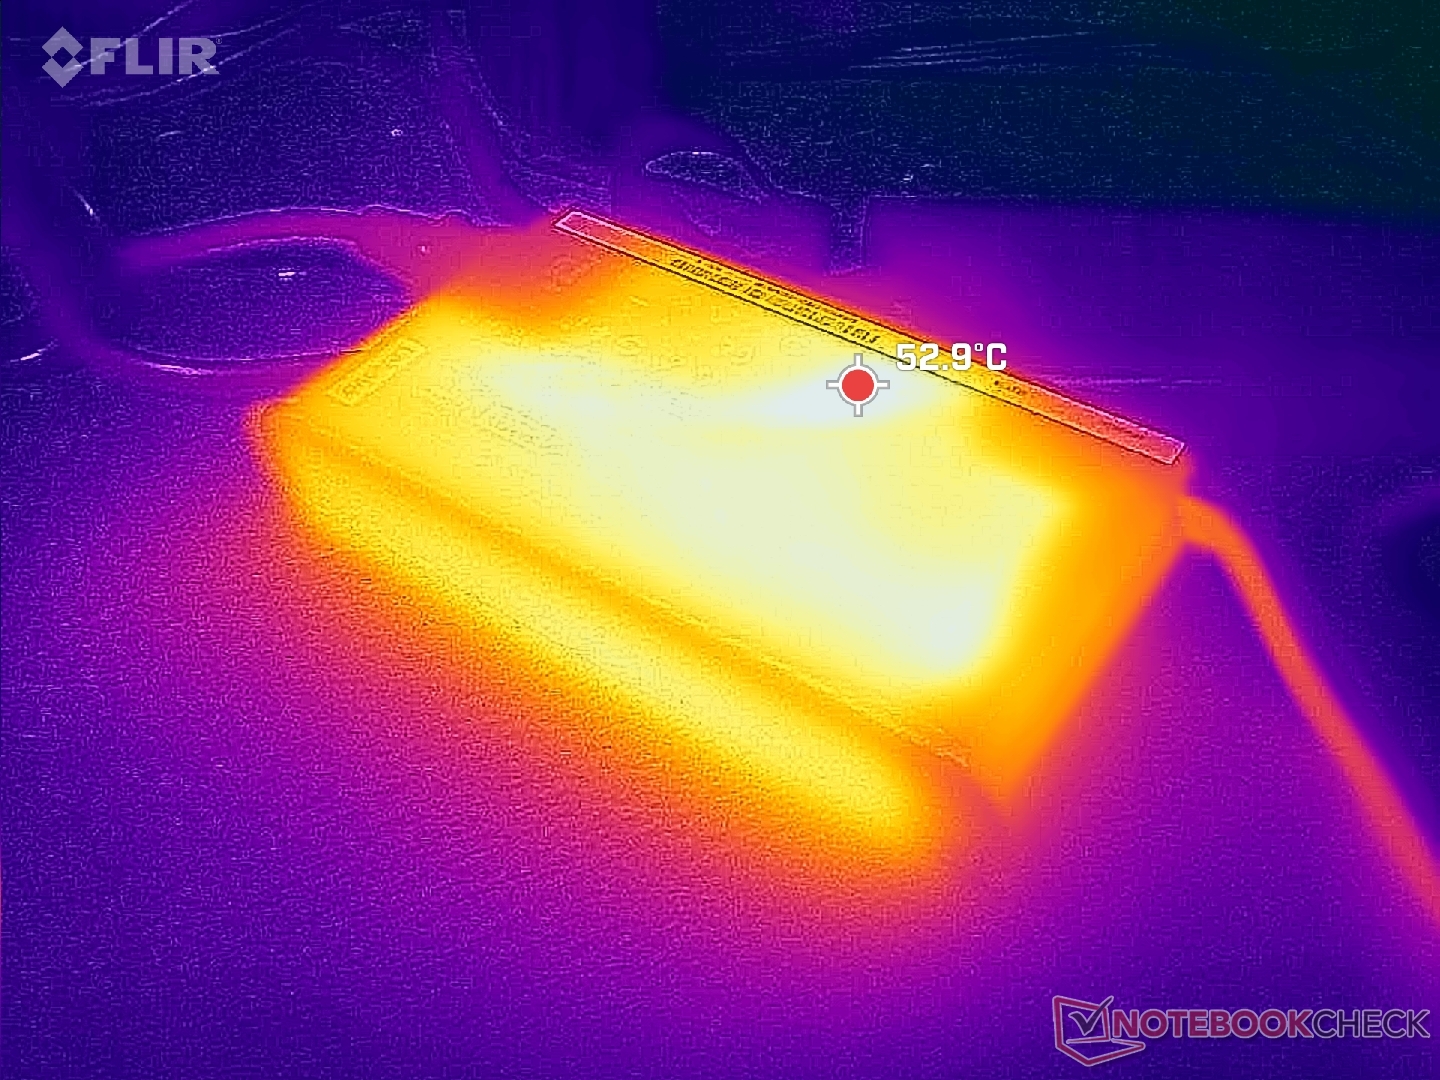
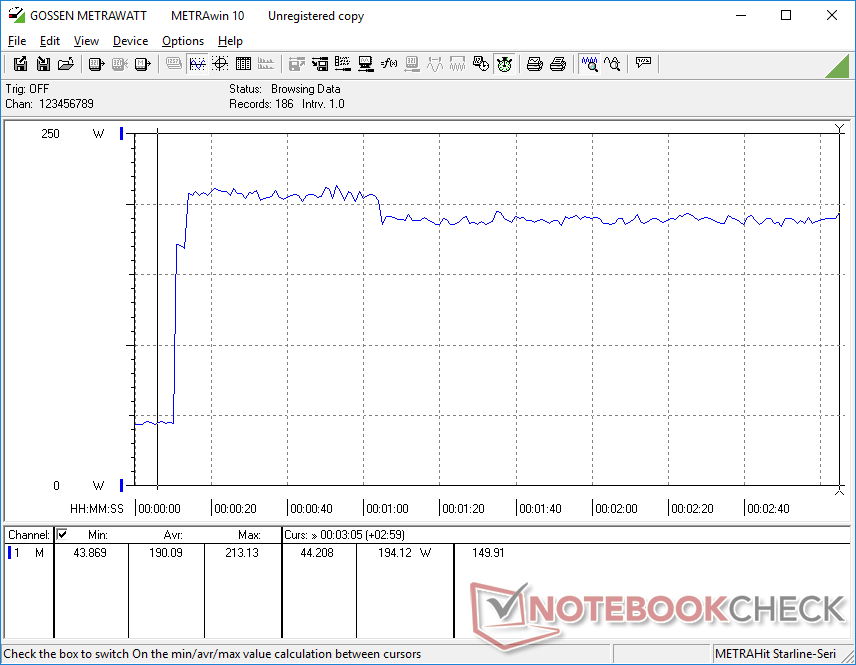
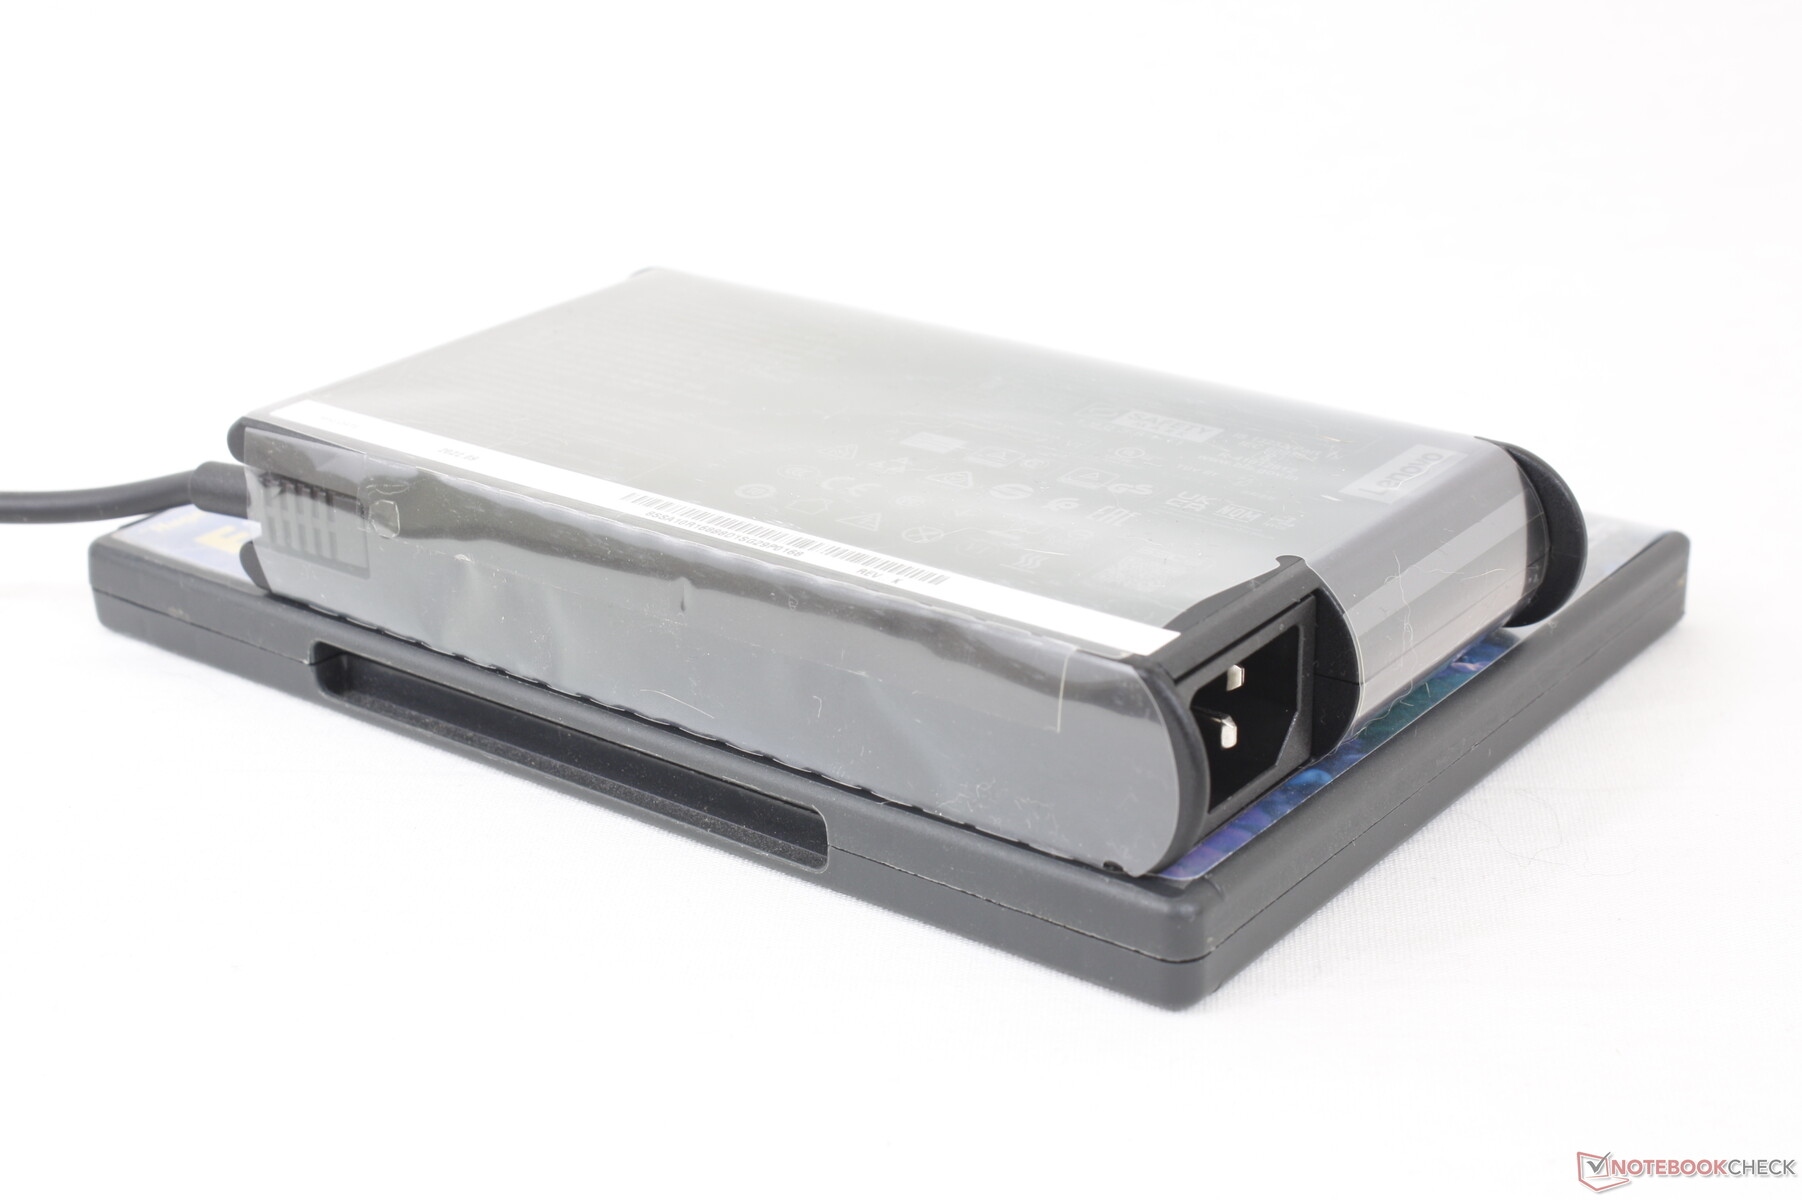
我们能够测量到中等尺寸(约16.9 x 8.8 x 2.6厘米)的230瓦交流适配器的峰值消耗为213瓦。更大的Legion Pro 7包括一个更高的330 W适配器,它配备了更强大的Core i9-13900HX和RTX 4080。
| Off / Standby | |
| Idle | |
| Load |
|
Key:
min: | |
| Lenovo Legion Slim 7i 16 Gen 8 i9-13900H, GeForce RTX 4070 Laptop GPU, Samsung PM9A1 MZVL21T0HCLR, IPS, 2560x1600, 16" | Acer Predator Helios 16 PH16-71-731Q i7-13700HX, GeForce RTX 4060 Laptop GPU, Micron 3400 1TB MTFDKBA1T0TFH, IPS-LED, 2560x1600, 16" | HP Omen 16-wf000 i7-13700HX, GeForce RTX 4080 Laptop GPU, SK hynix PC801 HFS002TEJ9X101N, IPS, 2560x1440, 16.1" | Lenovo Legion Pro 7 RTX4090 i9-13900HX, GeForce RTX 4090 Laptop GPU, Samsung PM9A1 MZVL21T0HCLR, IPS, 2560x1600, 16" | Alienware x16 R1 i9-13900HK, GeForce RTX 4080 Laptop GPU, SK hynix PC801 HFS001TEJ9X101N, IPS, 2560x1600, 16" | Lenovo Legion Pro 5 16ARX8 R7 7745HX, GeForce RTX 4070 Laptop GPU, Samsung PM9A1 MZVL21T0HCLR, IPS, 2560x1600, 16" | |
|---|---|---|---|---|---|---|
| Power Consumption | 11% | -8% | -20% | -25% | 15% | |
| Idle Minimum * (Watt) | 22 | 15.9 28% | 21.8 1% | 20 9% | 25.2 -15% | 8.1 63% |
| Idle Average * (Watt) | 29 | 20.5 29% | 26 10% | 25 14% | 29.9 -3% | 15.9 45% |
| Idle Maximum * (Watt) | 39.5 | 20.9 47% | 36 9% | 35 11% | 49.8 -26% | 37.2 6% |
| Load Average * (Watt) | 98.7 | 106 -7% | 115.5 -17% | 136 -38% | 105.4 -7% | 90.9 8% |
| Witcher 3 ultra * (Watt) | 171.8 | 175 -2% | 214 -25% | 282 -64% | 263 -53% | 189.6 -10% |
| Load Maximum * (Watt) | 213.2 | 276 -29% | 269.7 -27% | 320 -50% | 313.8 -47% | 263.5 -24% |
* ... smaller is better
Power Consumption Witcher 3 / Stresstest
Power Consumption external Monitor
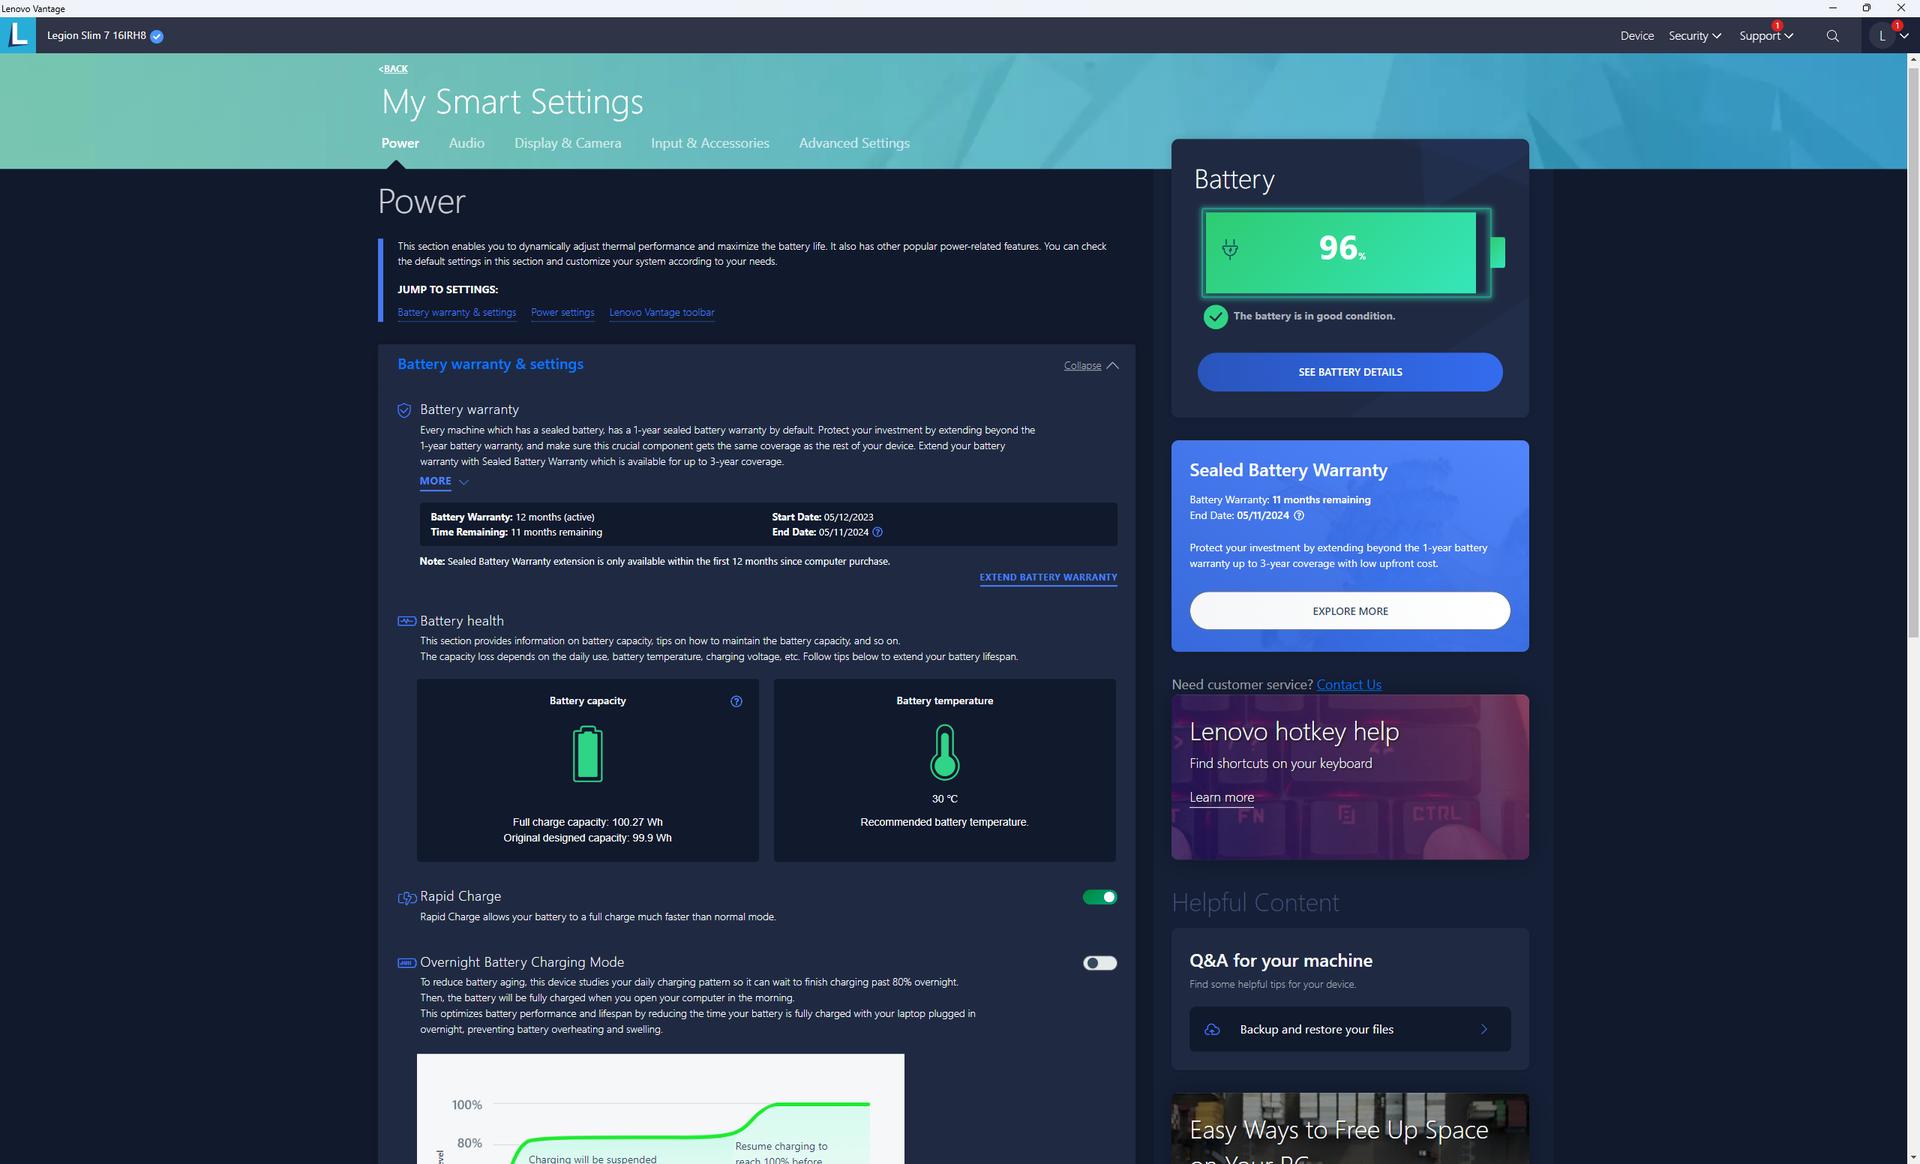
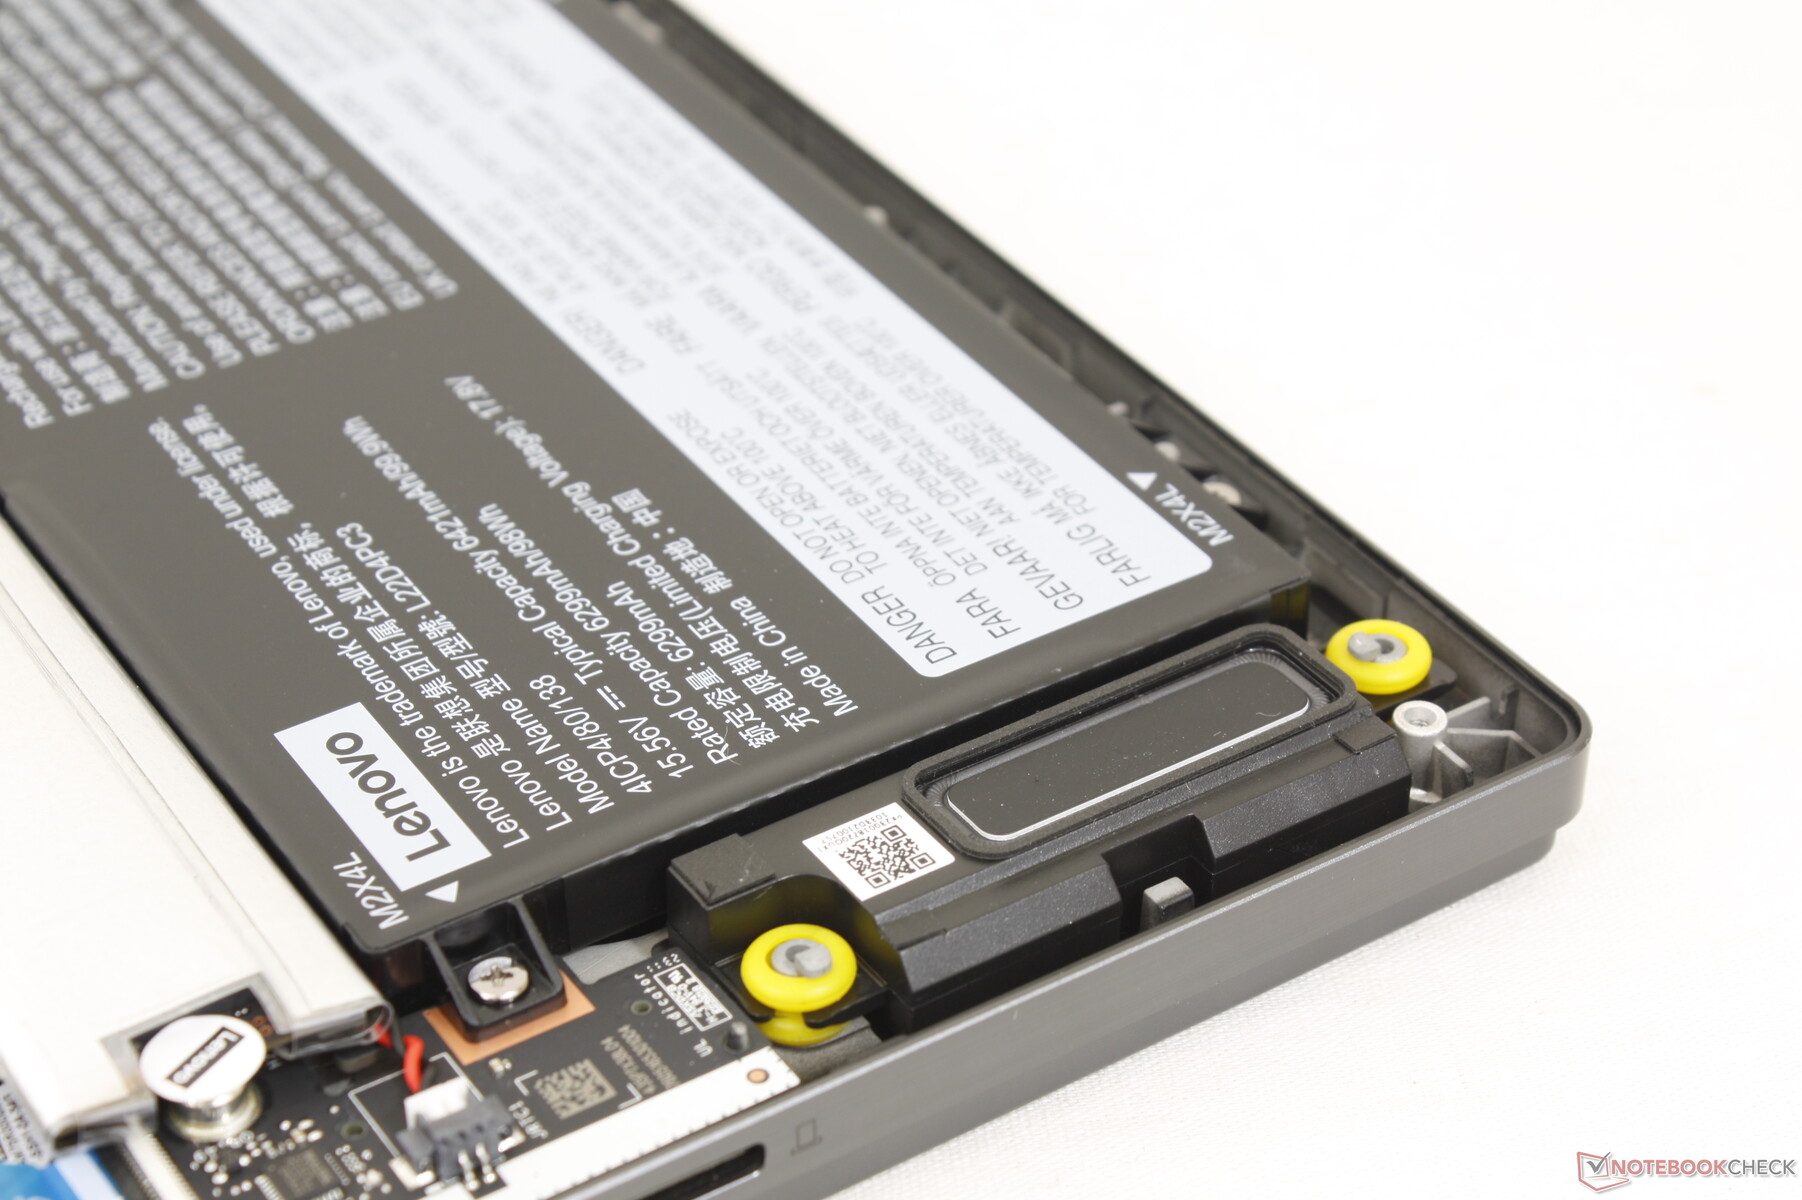
电池寿命
电池容量竟然和Legion Pro 7 17一样大,尽管我们的Slim 7i设计的外形更薄。尽管如此,电池寿命仍然是平均水平,在真实世界的浏览使用中仅低于4.5小时。大多数其他采用13代英特尔CPU的游戏笔记本电脑将返回类似或更短的运行时间,包括 Omen 16或Alienware x16 R1。
在启用快速充电功能的情况下,从空电到满电只需要70分钟,而其他大多数游戏笔记本的充电时间为90分钟或更长。该系统还可以通过USB-C充电,功率高达140W。
| Lenovo Legion Slim 7i 16 Gen 8 i9-13900H, GeForce RTX 4070 Laptop GPU, 99.9 Wh | HP Omen 16-wf000 i7-13700HX, GeForce RTX 4080 Laptop GPU, 83 Wh | Alienware x16 R1 i9-13900HK, GeForce RTX 4080 Laptop GPU, 90 Wh | Lenovo Legion Pro 7 RTX4090 i9-13900HX, GeForce RTX 4090 Laptop GPU, 99.9 Wh | Asus ROG Strix G16 G614JZ i9-13980HX, GeForce RTX 4080 Laptop GPU, 90 Wh | Razer Blade 16 Early 2023 i9-13950HX, GeForce RTX 4080 Laptop GPU, 95.2 Wh | |
|---|---|---|---|---|---|---|
| Battery runtime | 15% | -7% | 16% | 71% | 57% | |
| Reader / Idle (h) | 5.1 | 5.5 8% | 7.3 43% | 8.9 75% | ||
| WiFi v1.3 (h) | 4.4 | 5.1 16% | 2.5 -43% | 5.1 16% | 9.7 120% | 6.1 39% |
| Load (h) | 0.9 | 1.1 22% | 0.7 -22% | 1.1 22% | 1.4 56% |
Pros
Cons
结论--几乎在每个方面都令人信服
Legion Slim 7i 16 Gen 8是Legion 家族中最平衡的游戏笔记本电脑之一。它不仅比16英寸尺寸类别中的大多数产品更薄、更轻,而且在涉及到端口选项、宽敞的每键RGB键盘、为游戏玩家和内容创作者提供的可敬的显示选项,甚至电池容量和SD读卡器时,也没有削减任何角落。考虑到其轻薄的外形,该型号检查出了很多盒子。
联想Legion Slim 7i 16 G8为更薄的尺寸和更轻的重量牺牲了一些性能选项,但该机型在性能和便携性方面非常平衡,大多数游戏玩家可能不会介意。
当你深入了解这台机器时,一些裂缝开始显现。例如,焊接和可扩展的内存配置,在游戏笔记本上是不常见的,而固态硬盘在压力下往往会被扼杀。CPU和GPU选项分别省略了更高端的酷睿i9-13900HX和RTX 4080,这些都是更厚更重的Legion Pro 7 16上才有的。因此,想要一切和厨房的发烧友将不得不解决更大和更重的替代品,如 Legion 笔记本电脑、Alienware m16,或 Razer Blade 16这些产品都提供更快的处理器选项。
价格和可用性
Lenovo Legion Slim 7i 16 Gen 8
- 07/03/2023 v7 (old)
Allen Ngo
Transparency
The selection of devices to be reviewed is made by our editorial team. The test sample was provided to the author as a loan by the manufacturer or retailer for the purpose of this review. The lender had no influence on this review, nor did the manufacturer receive a copy of this review before publication. There was no obligation to publish this review. As an independent media company, Notebookcheck is not subjected to the authority of manufacturers, retailers or publishers.
This is how Notebookcheck is testing
Every year, Notebookcheck independently reviews hundreds of laptops and smartphones using standardized procedures to ensure that all results are comparable. We have continuously developed our test methods for around 20 years and set industry standards in the process. In our test labs, high-quality measuring equipment is utilized by experienced technicians and editors. These tests involve a multi-stage validation process. Our complex rating system is based on hundreds of well-founded measurements and benchmarks, which maintains objectivity. Further information on our test methods can be found here.
Price comparison

