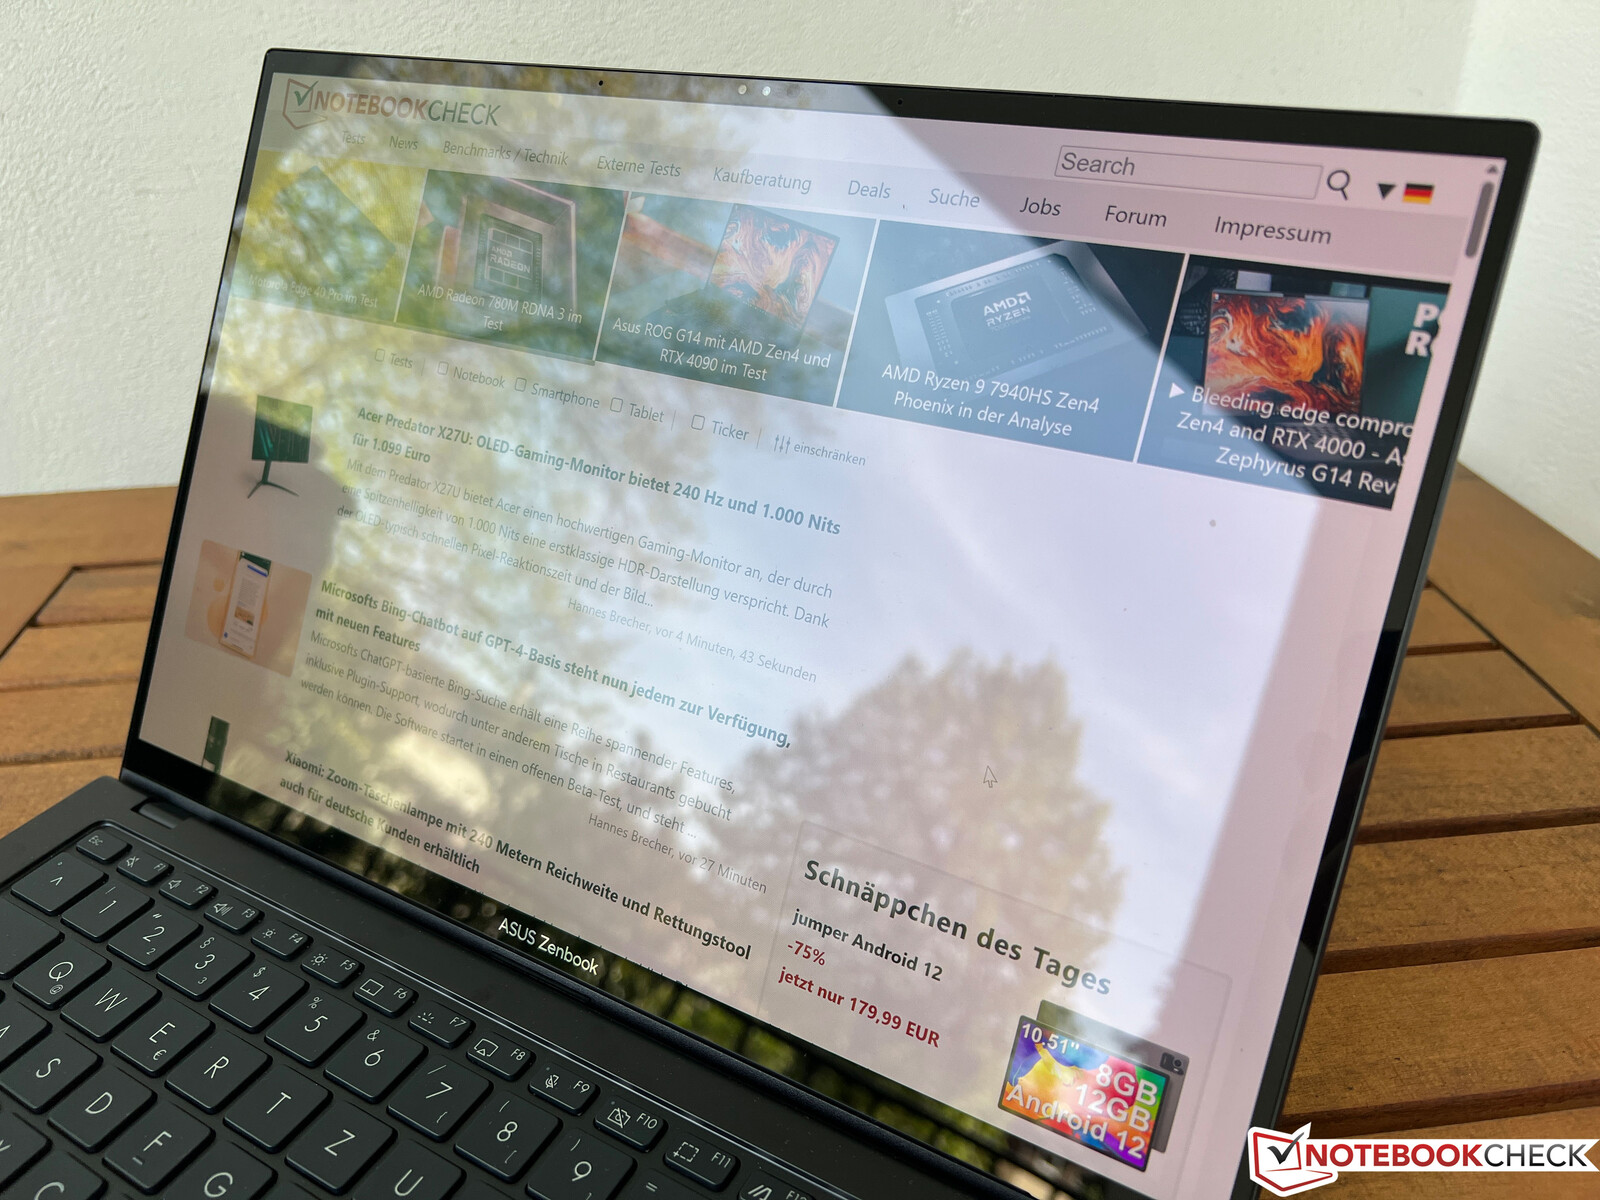
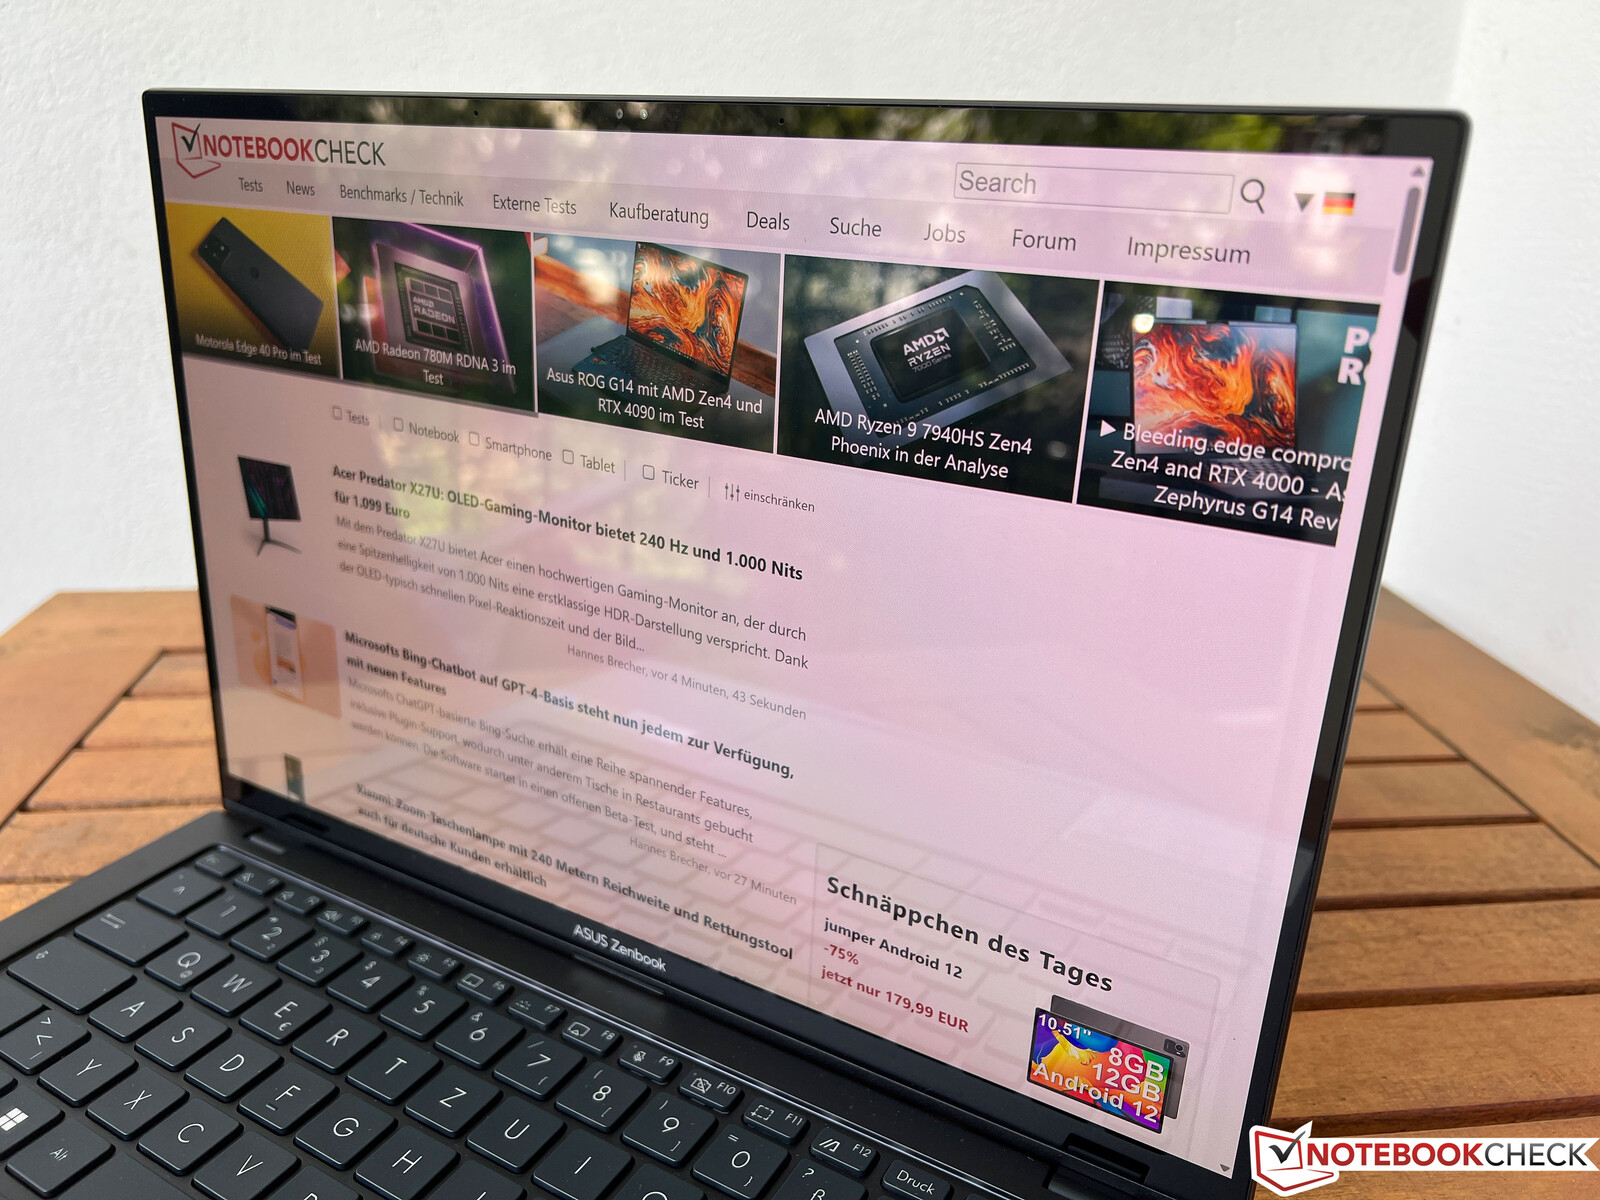
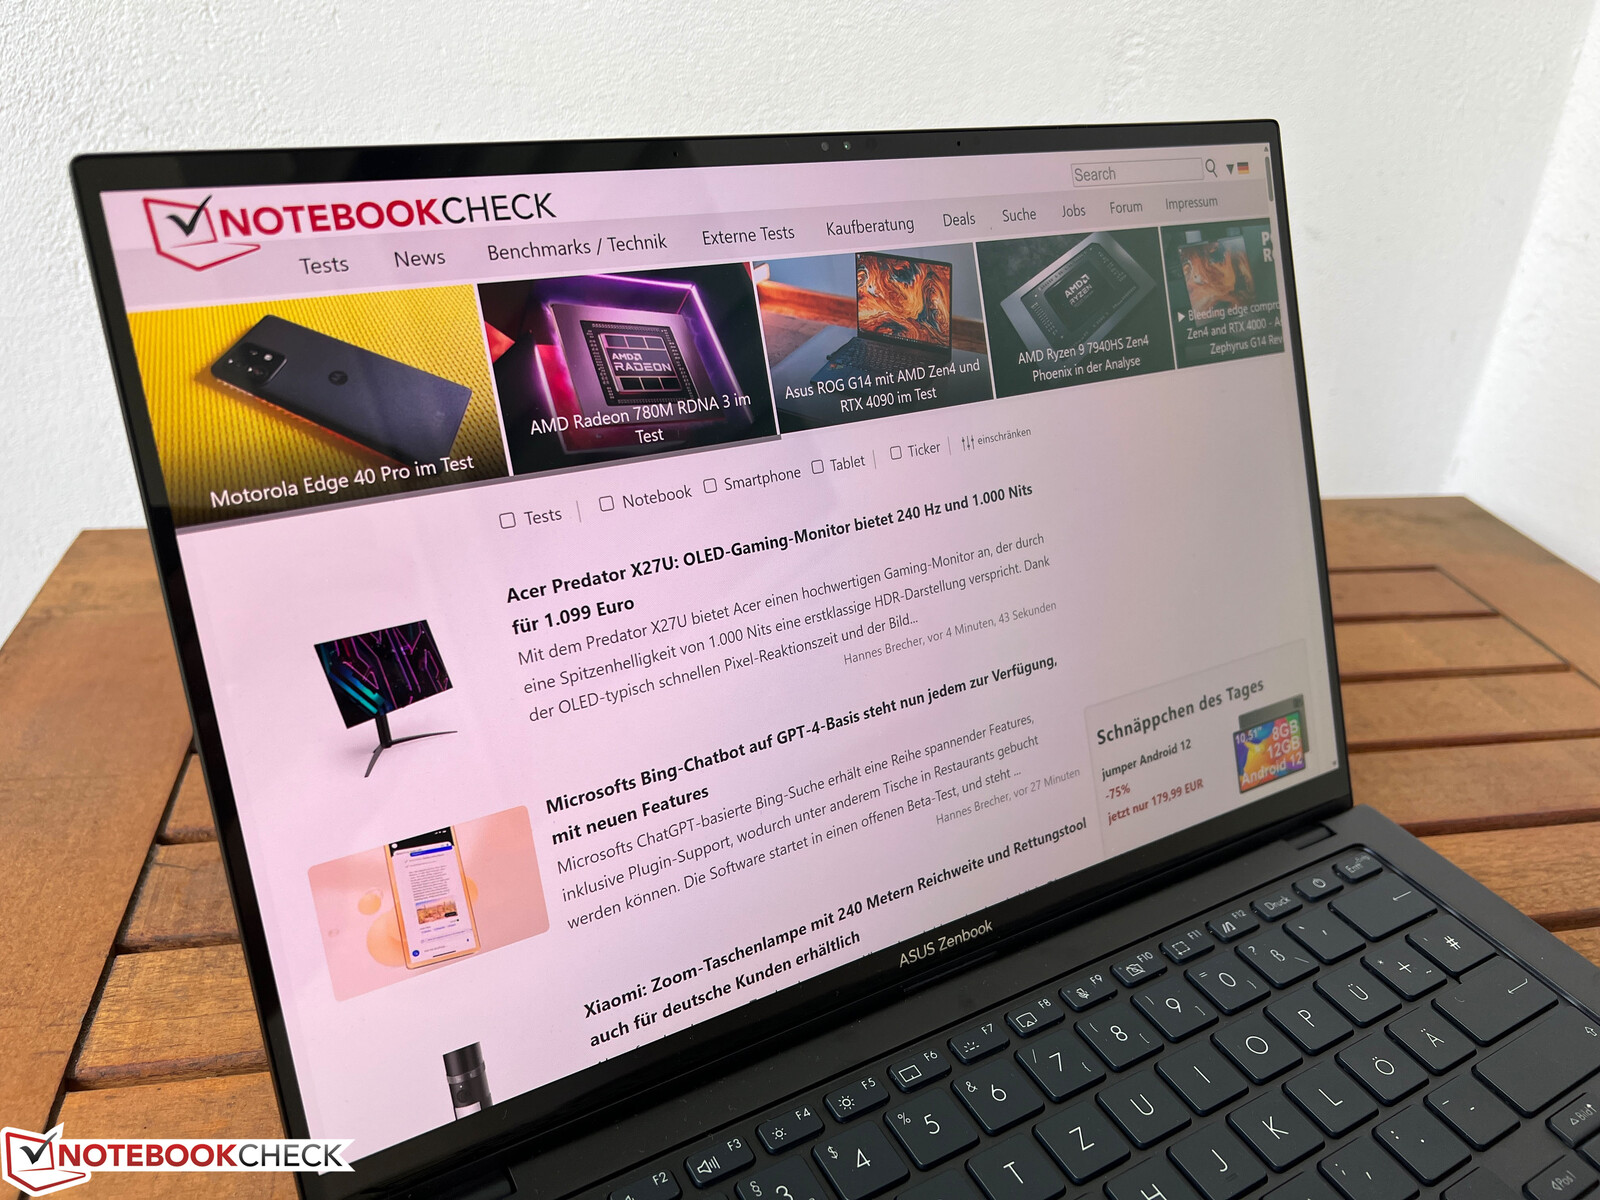
华硕Zenbook Pro 14 OLED笔记本电脑回顾:配备120赫兹OLED显示屏的MacBook Pro竞争对手
通过其新的Zenbook Pro 14,华硕为内容创作者提供了一个强大的多媒体笔记本,从而使其与Apple MacBook Pro 14直接竞争。除了目前英特尔的猛禽湖处理器,华硕还安装了Nvidia的新RTX GPU,据此我们的测试设备甚至拥有GeForce RTX 4070 LaptopGPU。一个特殊的功能是屏幕,这是一个2.8K的OLED触摸屏,120赫兹。
然而,所有这些硬件都是有代价的--我们的测试设备配备了一个酷睿i9 13900H,RTX 4070,32GB内存和2TB固态硬盘,价格高达3500欧元(约合3750美元),因此价格直接与 MacBook Pro 14(14英寸设备具有这样的性能值是罕见的,这就是为什么我们也列出一些15英寸机型作为比较设备。
潜在的竞争对手比较
Rating | Date | Model | Weight | Height | Size | Resolution | Price |
|---|---|---|---|---|---|---|---|
| 89.3 % v7 (old) | 06 / 2023 | Asus Zenbook Pro 14 OLED UX6404VI i9-13900H, GeForce RTX 4070 Laptop GPU | 1.7 kg | 17.9 mm | 14.50" | 2880x1800 | |
| 87 % v7 (old) | 06 / 2023 | Asus ZenBook Pro 14 Duo UX8402VV-P1021W i9-13900H, GeForce RTX 4060 Laptop GPU | 1.8 kg | 21 mm | 14.50" | 2880x1800 | |
| 93.9 % v7 (old) | 03 / 2023 | Apple MacBook Pro 14 2023 M2 Pro M2 Pro, M2 Pro 19-Core GPU | 1.6 kg | 15.5 mm | 14.20" | 3024x1964 | |
| 90 % v7 (old) | 05 / 2023 | Asus ROG Zephyrus G14 GA402XY R9 7940HS, GeForce RTX 4090 Laptop GPU | 1.7 kg | 20.5 mm | 14.00" | 2560x1600 | |
| 90.3 % v7 (old) | 04 / 2023 | Dell XPS 15 9530 RTX 4070 i7-13700H, GeForce RTX 4070 Laptop GPU | 1.9 kg | 18 mm | 15.60" | 3456x2160 | |
| 89.9 % v7 (old) | 03 / 2023 | Razer Blade 15 OLED (Early 2022) i9-12900H, GeForce RTX 3070 Ti Laptop GPU | 2 kg | 16.99 mm | 15.60" | 2560x1440 |
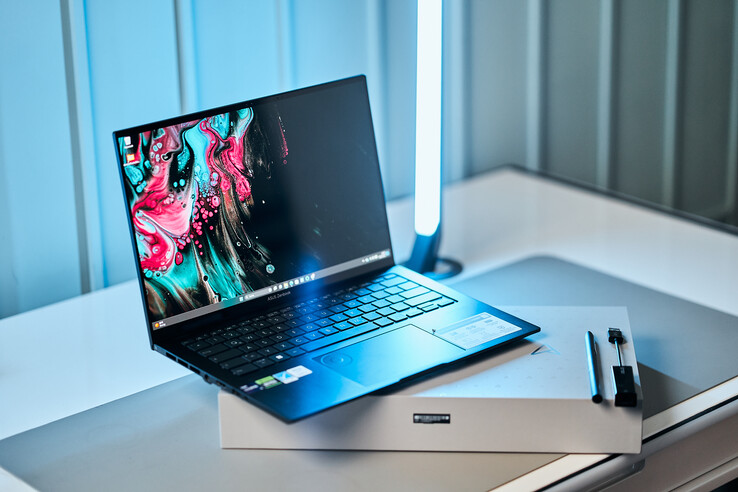
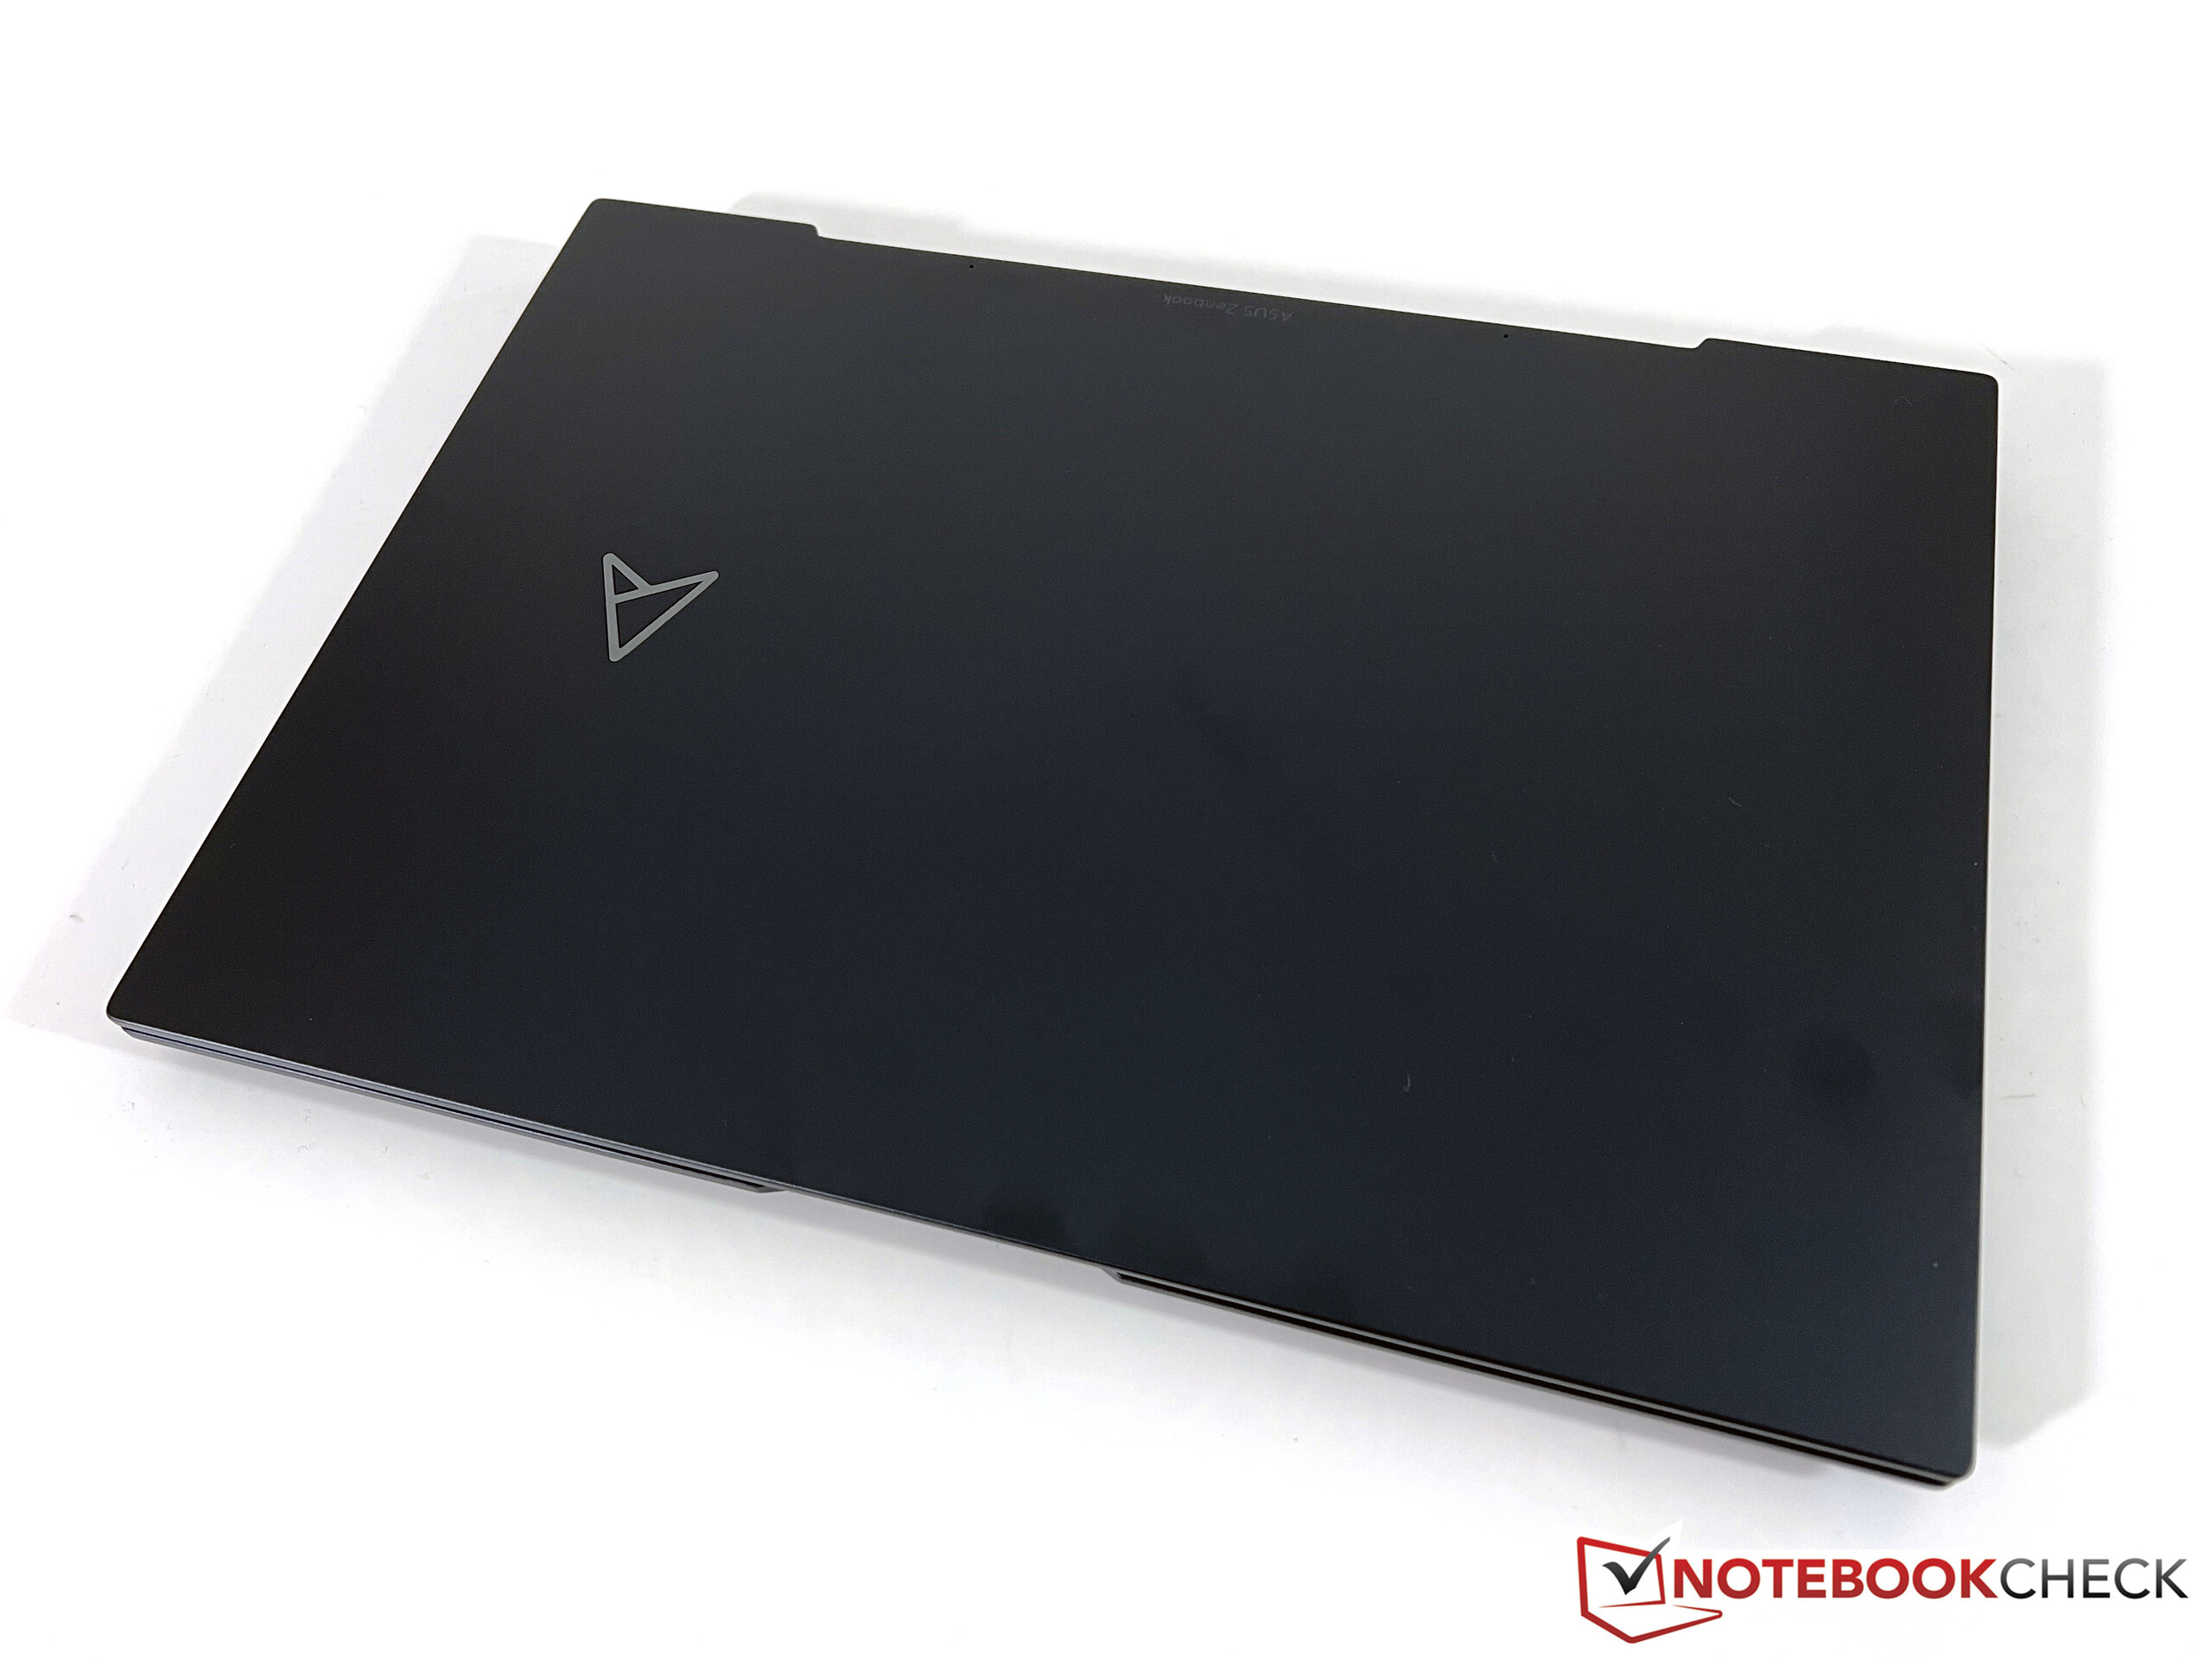
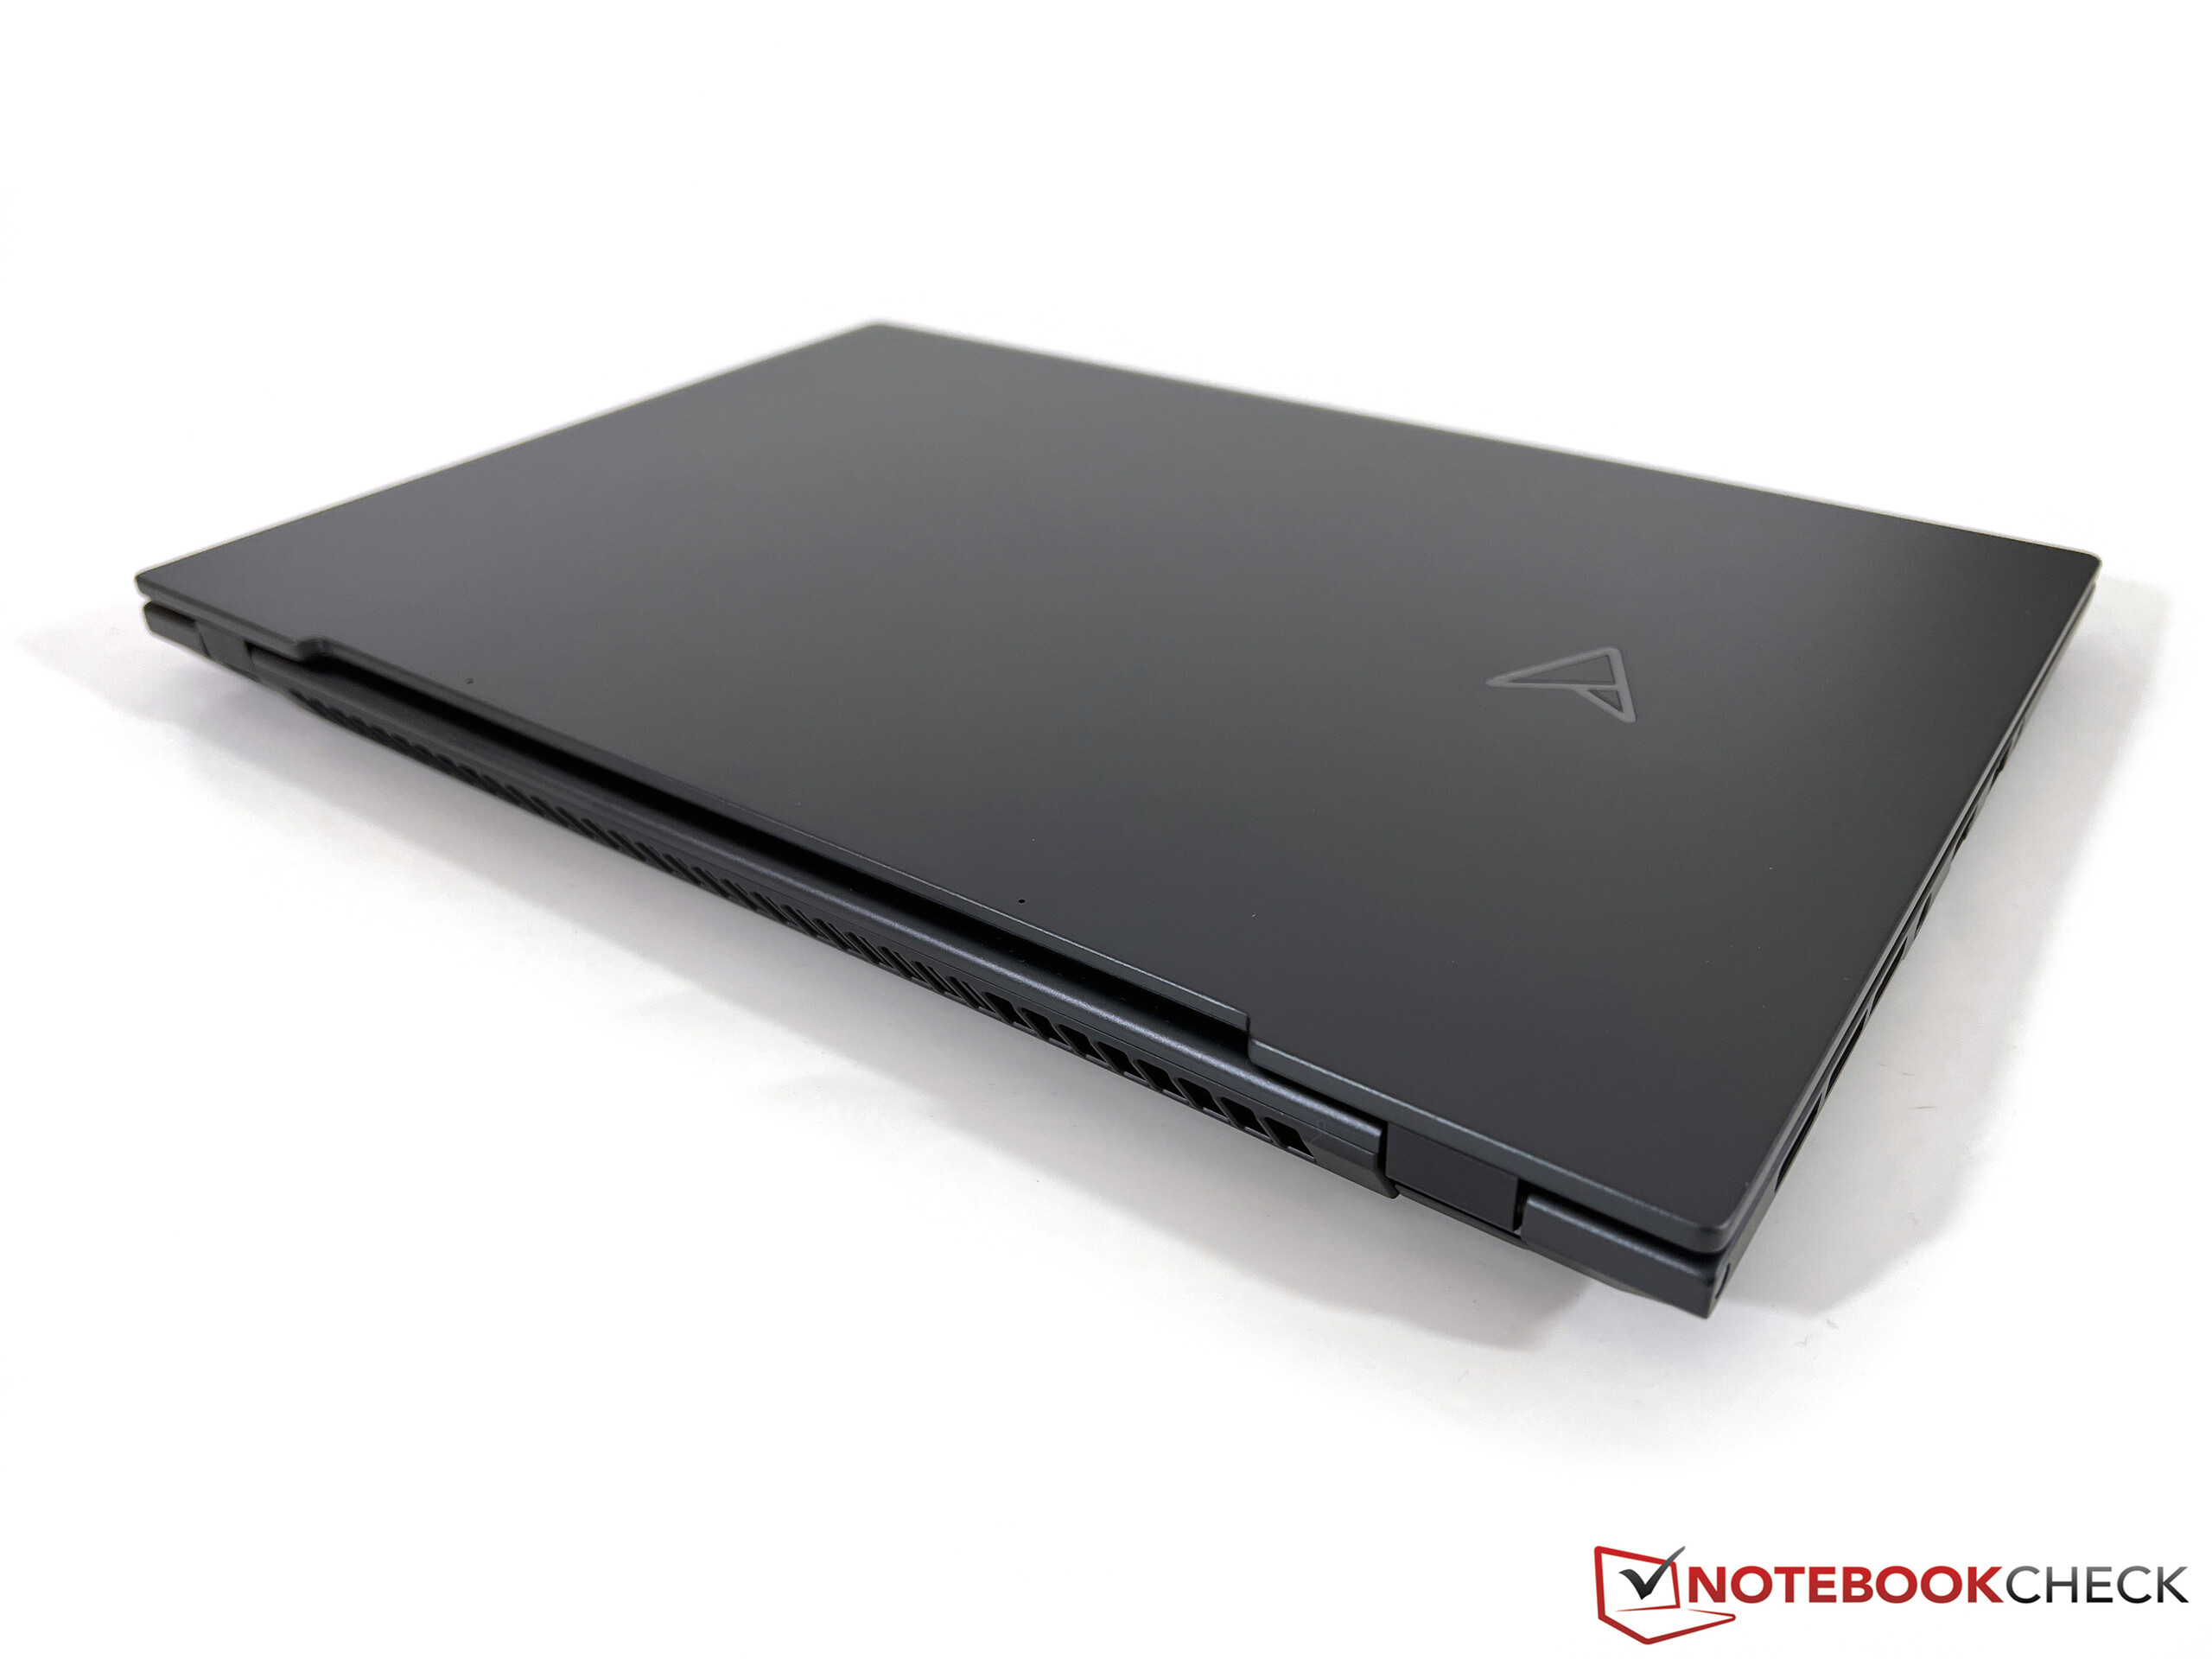
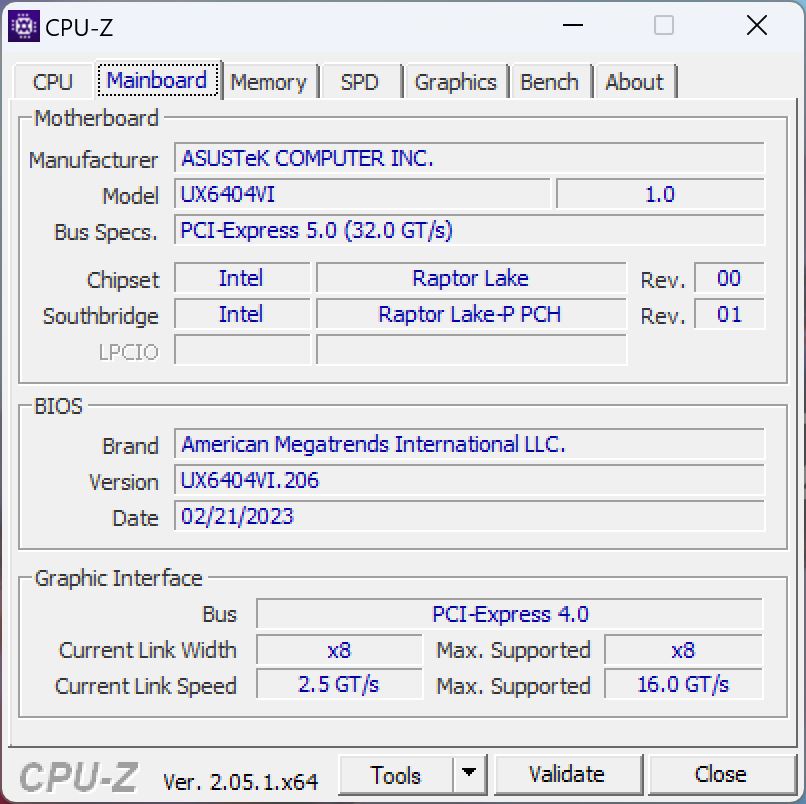
外壳--Zenbook采用坚固的金属底盘
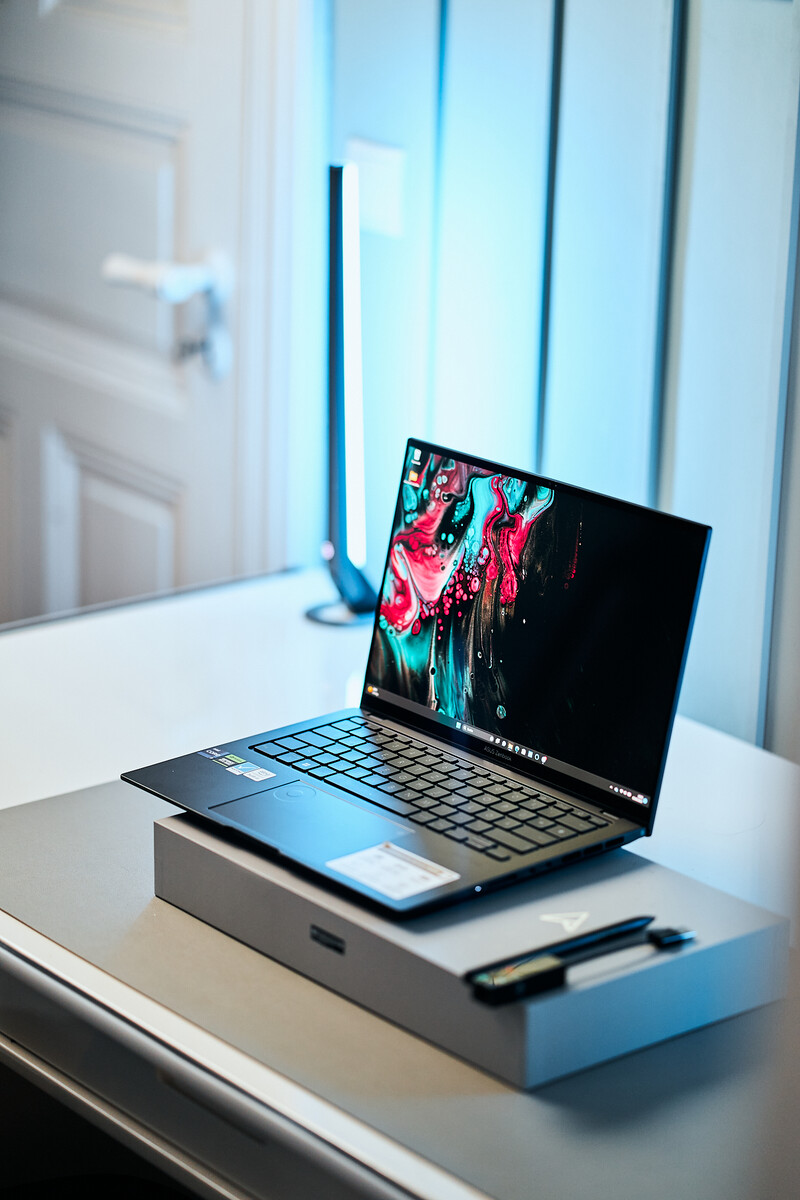
从视觉上看,新的Zenbook Pro 14看起来相当克制,只有显示屏盖上有一个小小的ProArt标志。华硕在其他方面没有添加任何其他视觉元素。表面很光滑,很快就会出现指纹污点,需要定期擦拭这些污点。这款笔记本在深色的科技黑中显得非常优雅,但掌托上的制造商贴纸却让人非常讨厌。右侧写有笔记本功能的大贴纸可以轻易撕掉,但左侧的四张小贴纸却不能。当你为它支付了3500欧元(约3750美元)时,谁想在他们的设备上贴上亚马逊Alexa的贴纸呢?
华硕使用了金属底盘,底座和显示盖都非常稳定,抗扭转。底座单元看起来也相当苗条,这是由锥形的侧面实现的。这与以下产品形成鲜明对比Apple MacBook Pro 14形成鲜明对比,例如,它的基本单元显得非常笨重,尽管它实际上比Zenbook更薄。这绝对不是一个非常薄的笔记本,但鉴于其强大的组件,这并不是一个批评点。
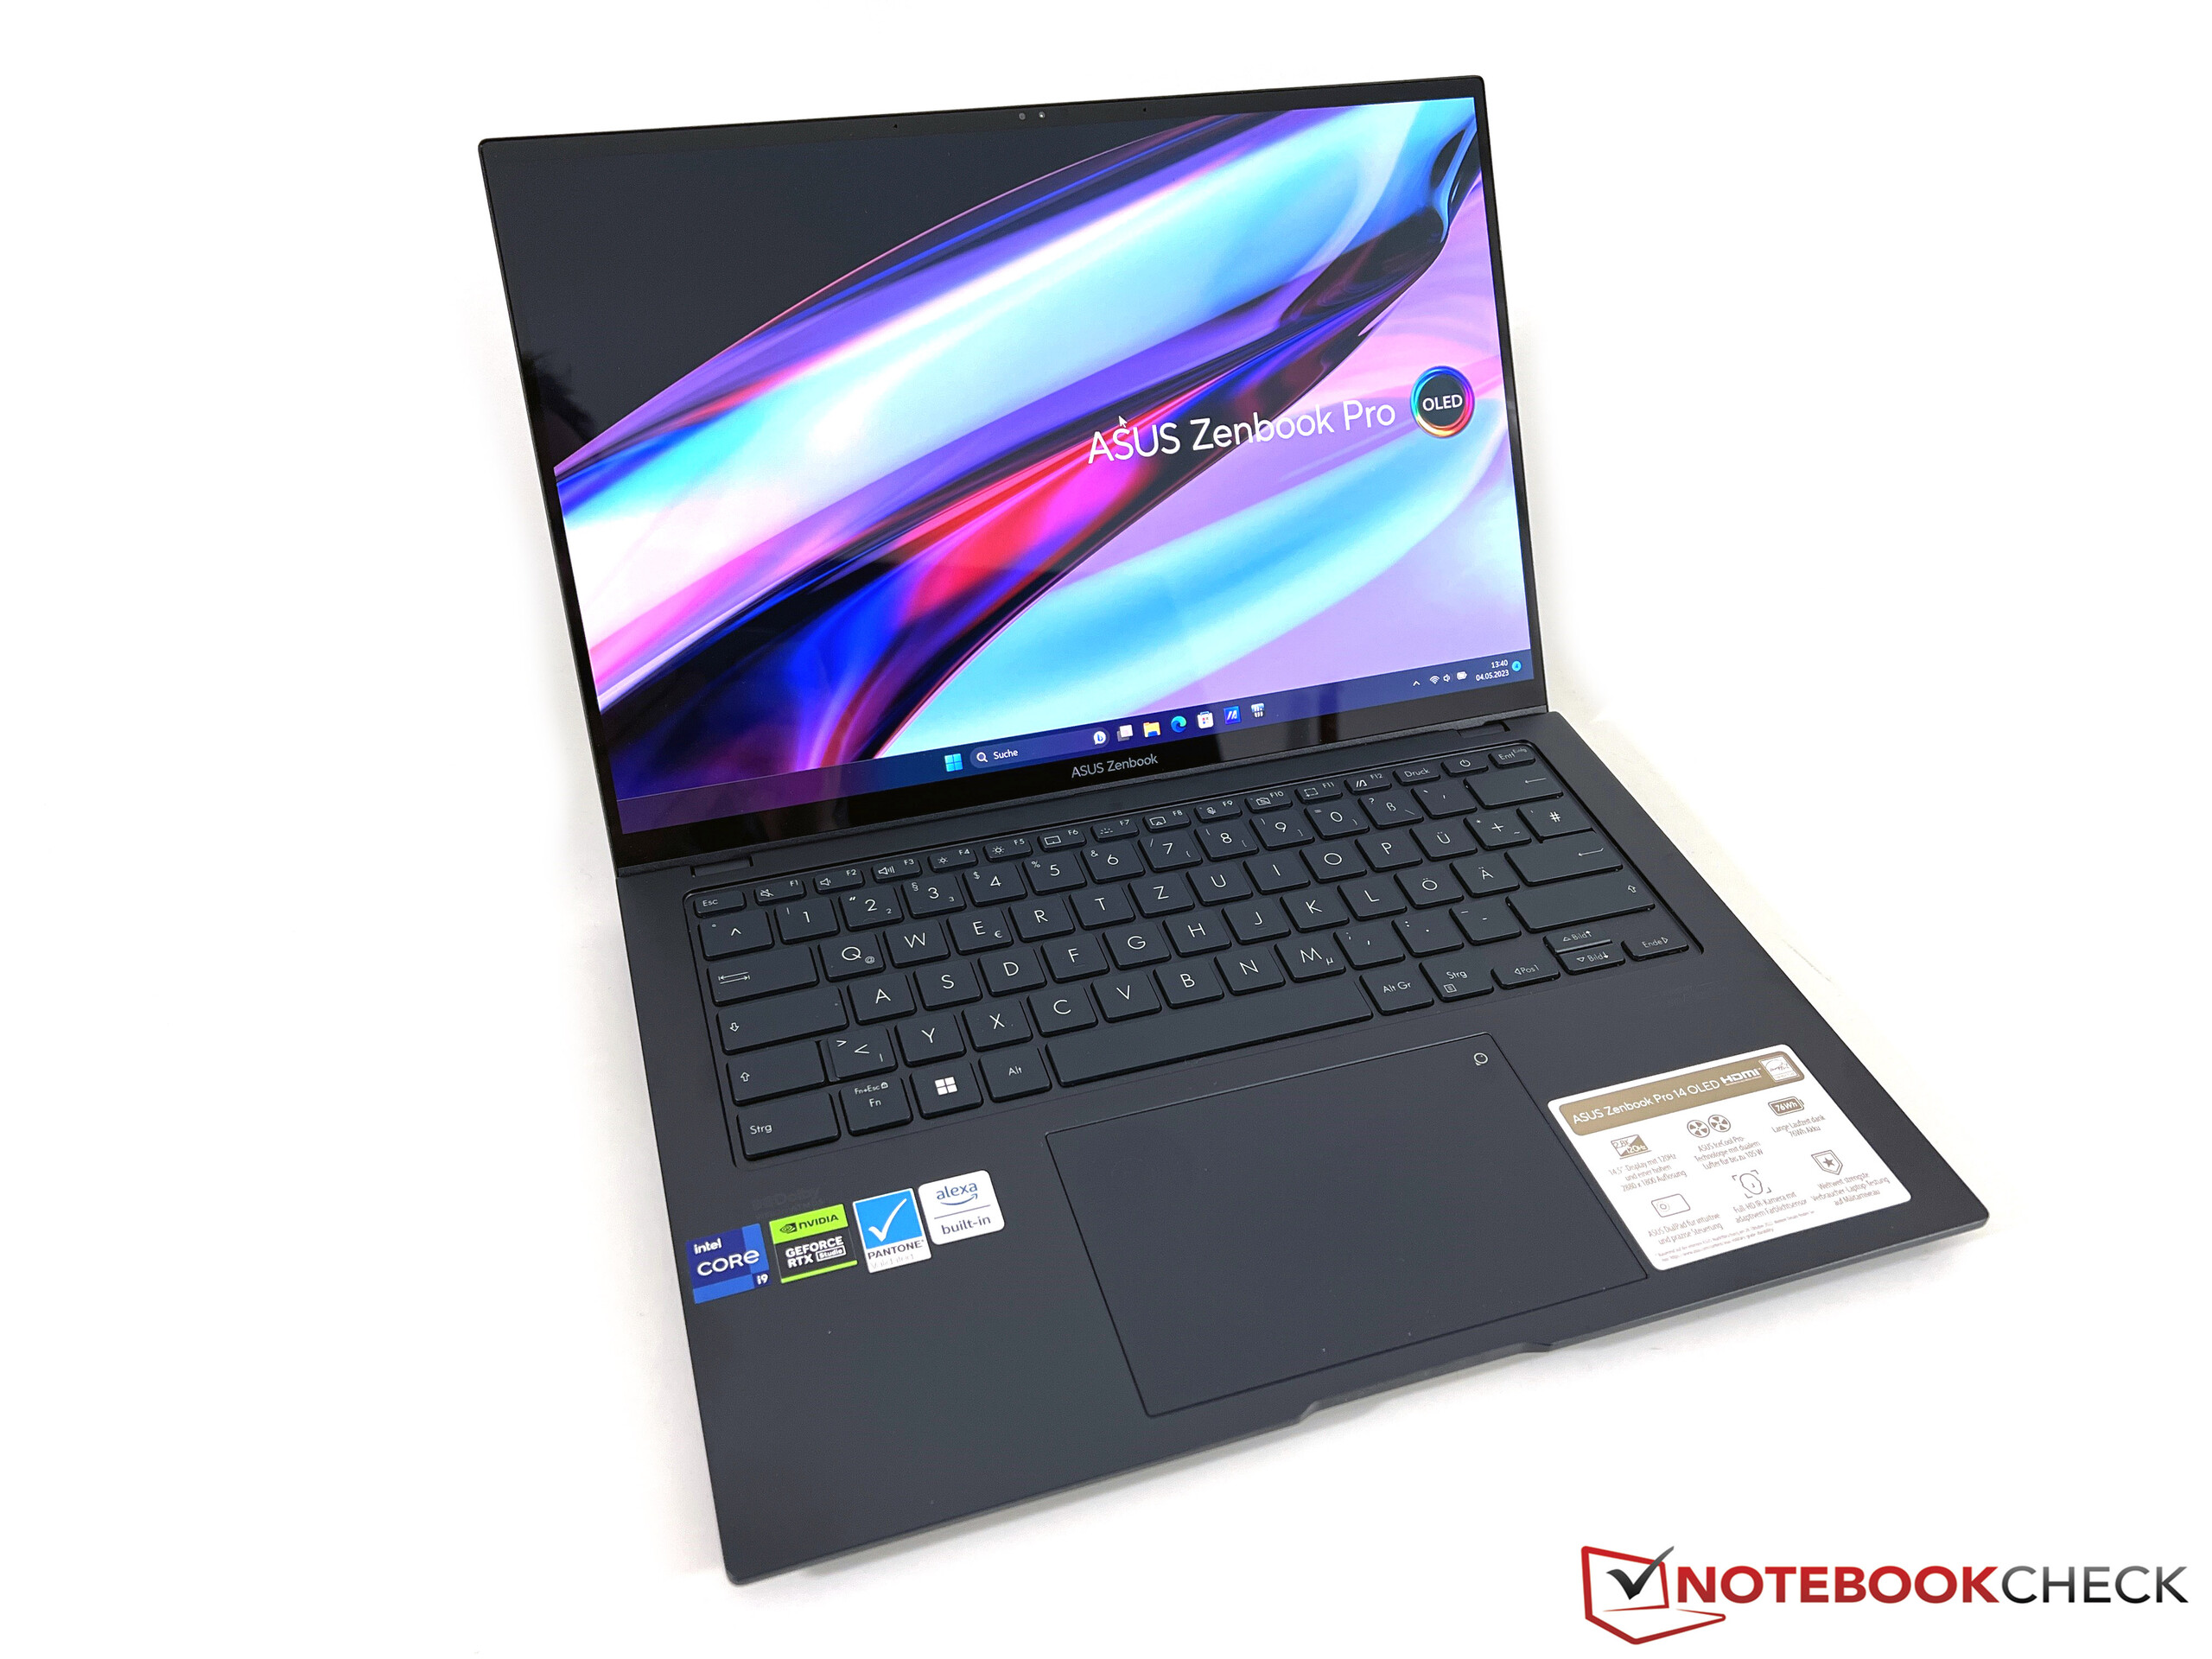
两个显示器铰链调整得很好,但不能完全防止在改变打开角度时出现某种摇晃。最大的打开角度是~135度。16:10面板的屏幕边缘非常窄,特别是在侧面,整体屏占比达到了85%。
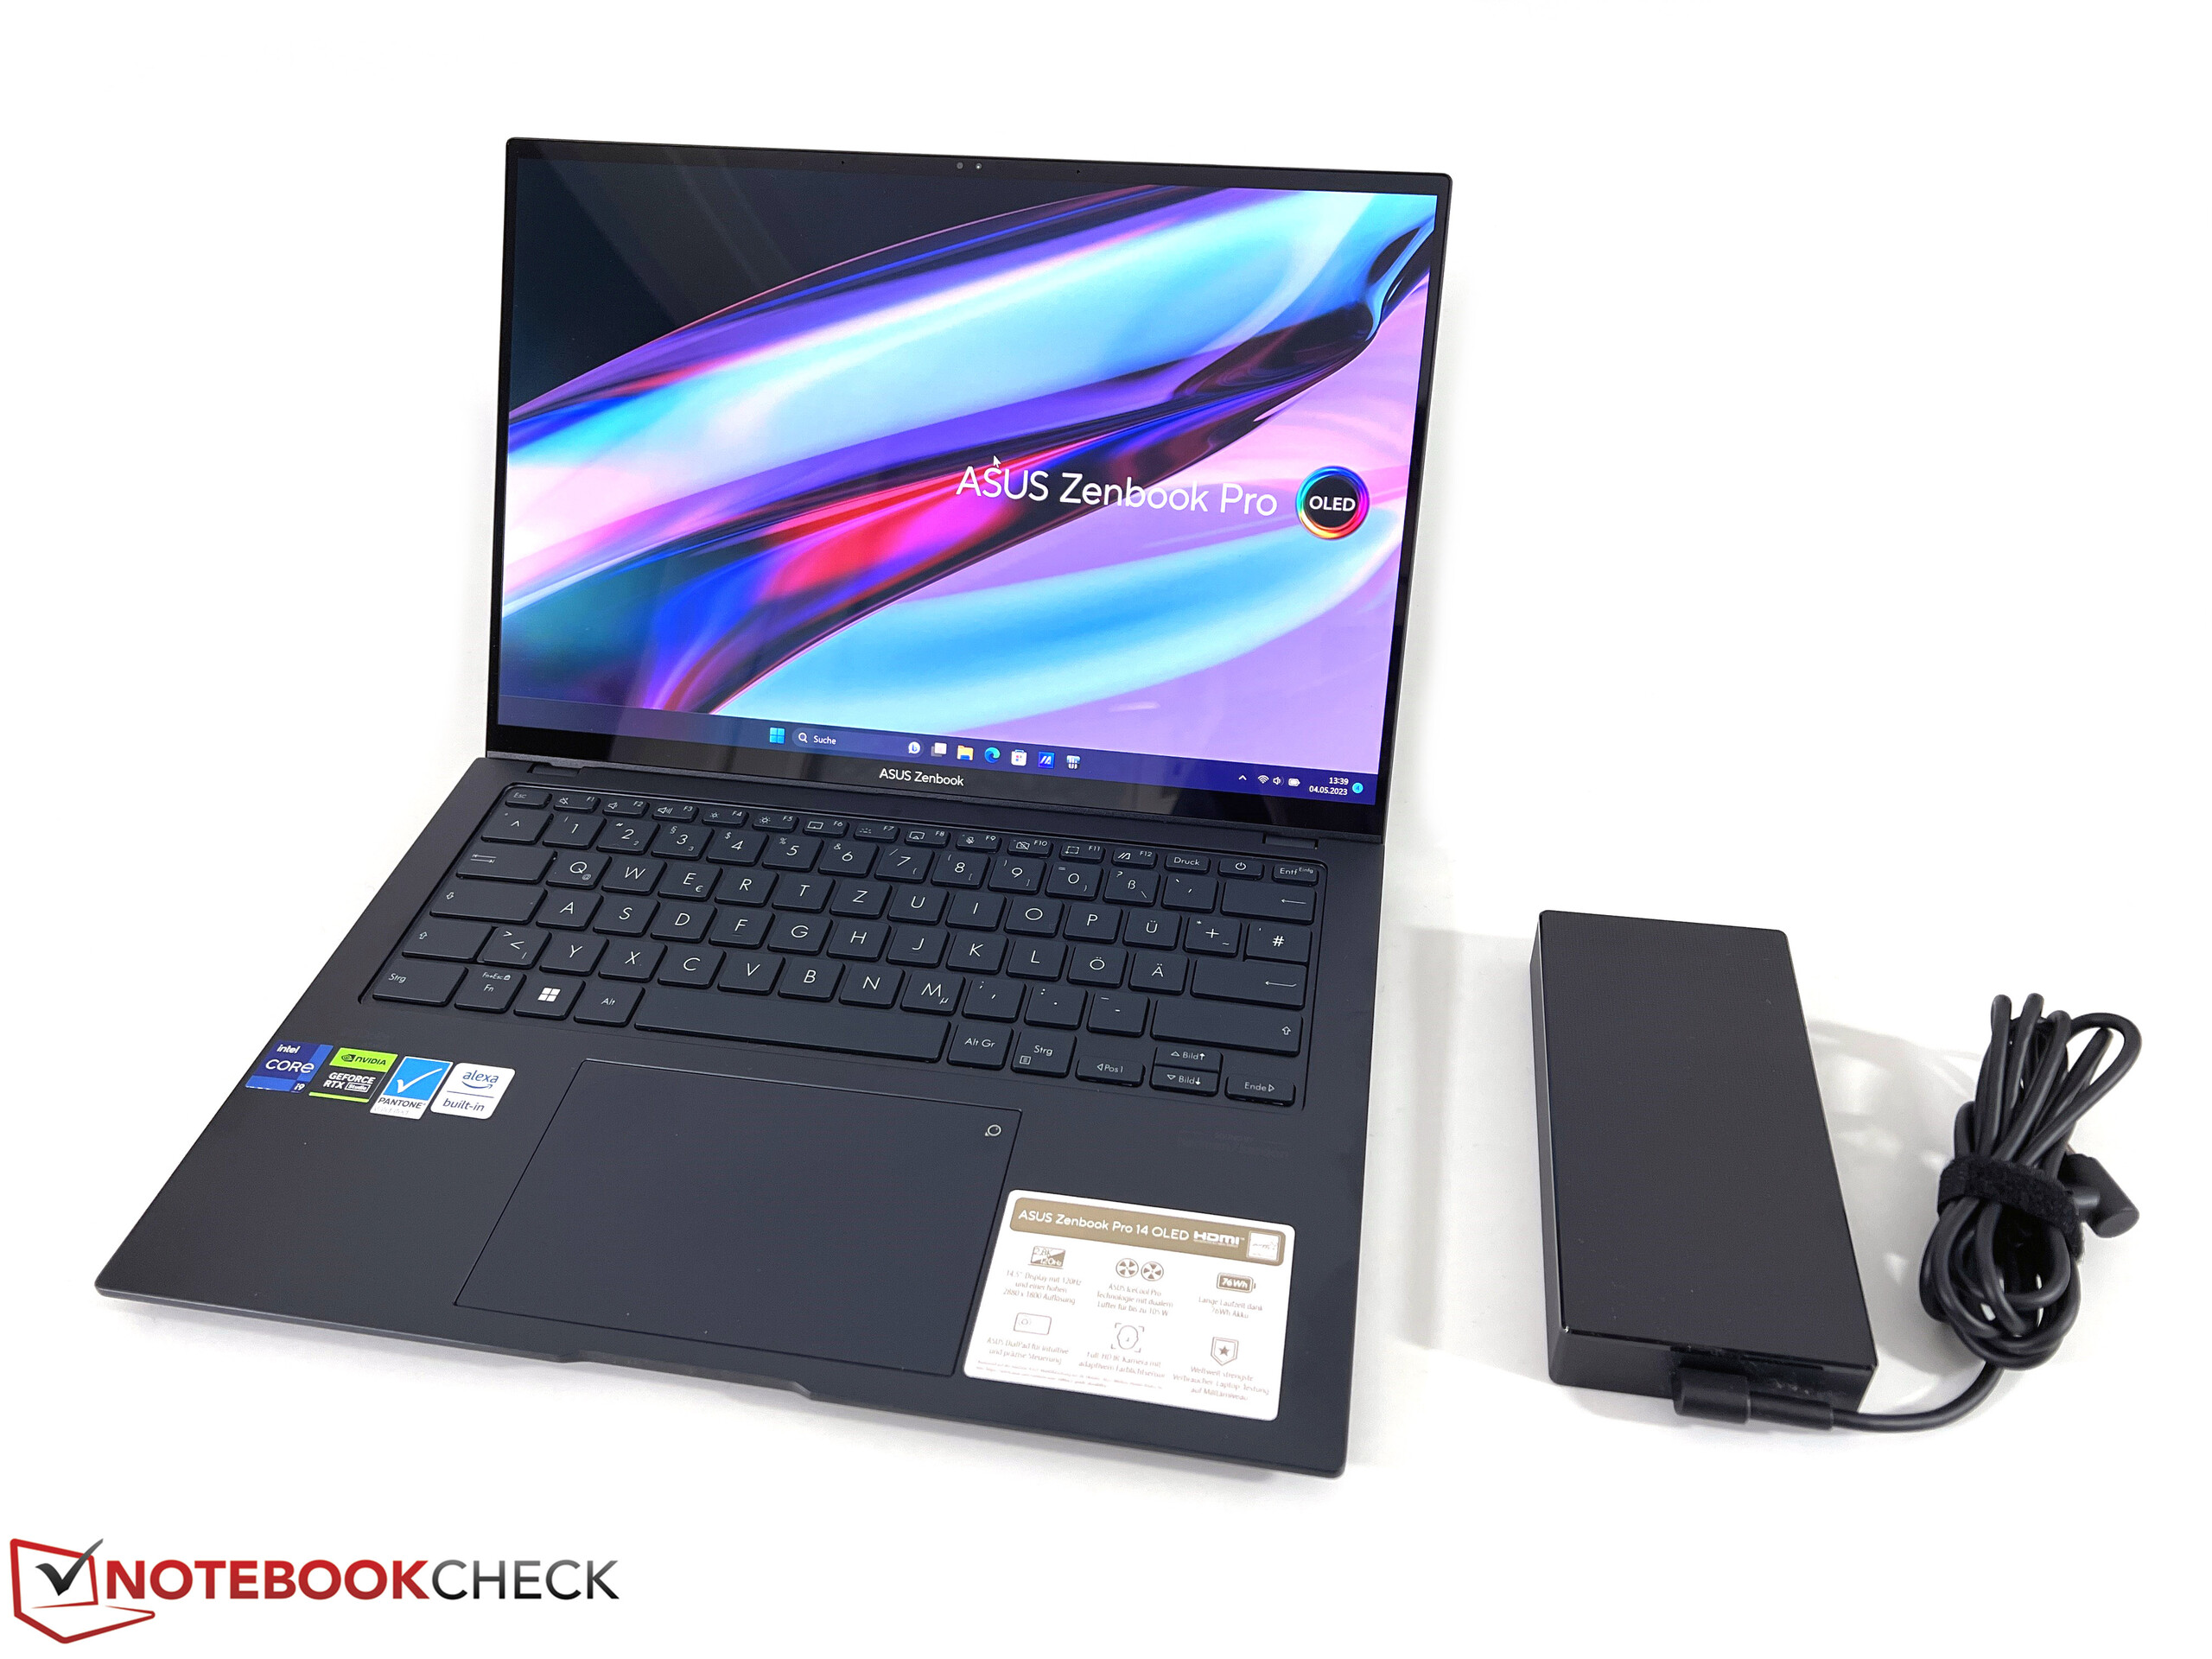
在直接比较中,尤其是MacBook Pro 14在各方面都更紧凑一些,但在重量上没有大的差别。由于高性能的硬件,在我们的比较领域中,一些15英寸的设备自然需要多一点桌面空间。附带的200瓦电源在天平上又增加了556克的重量。
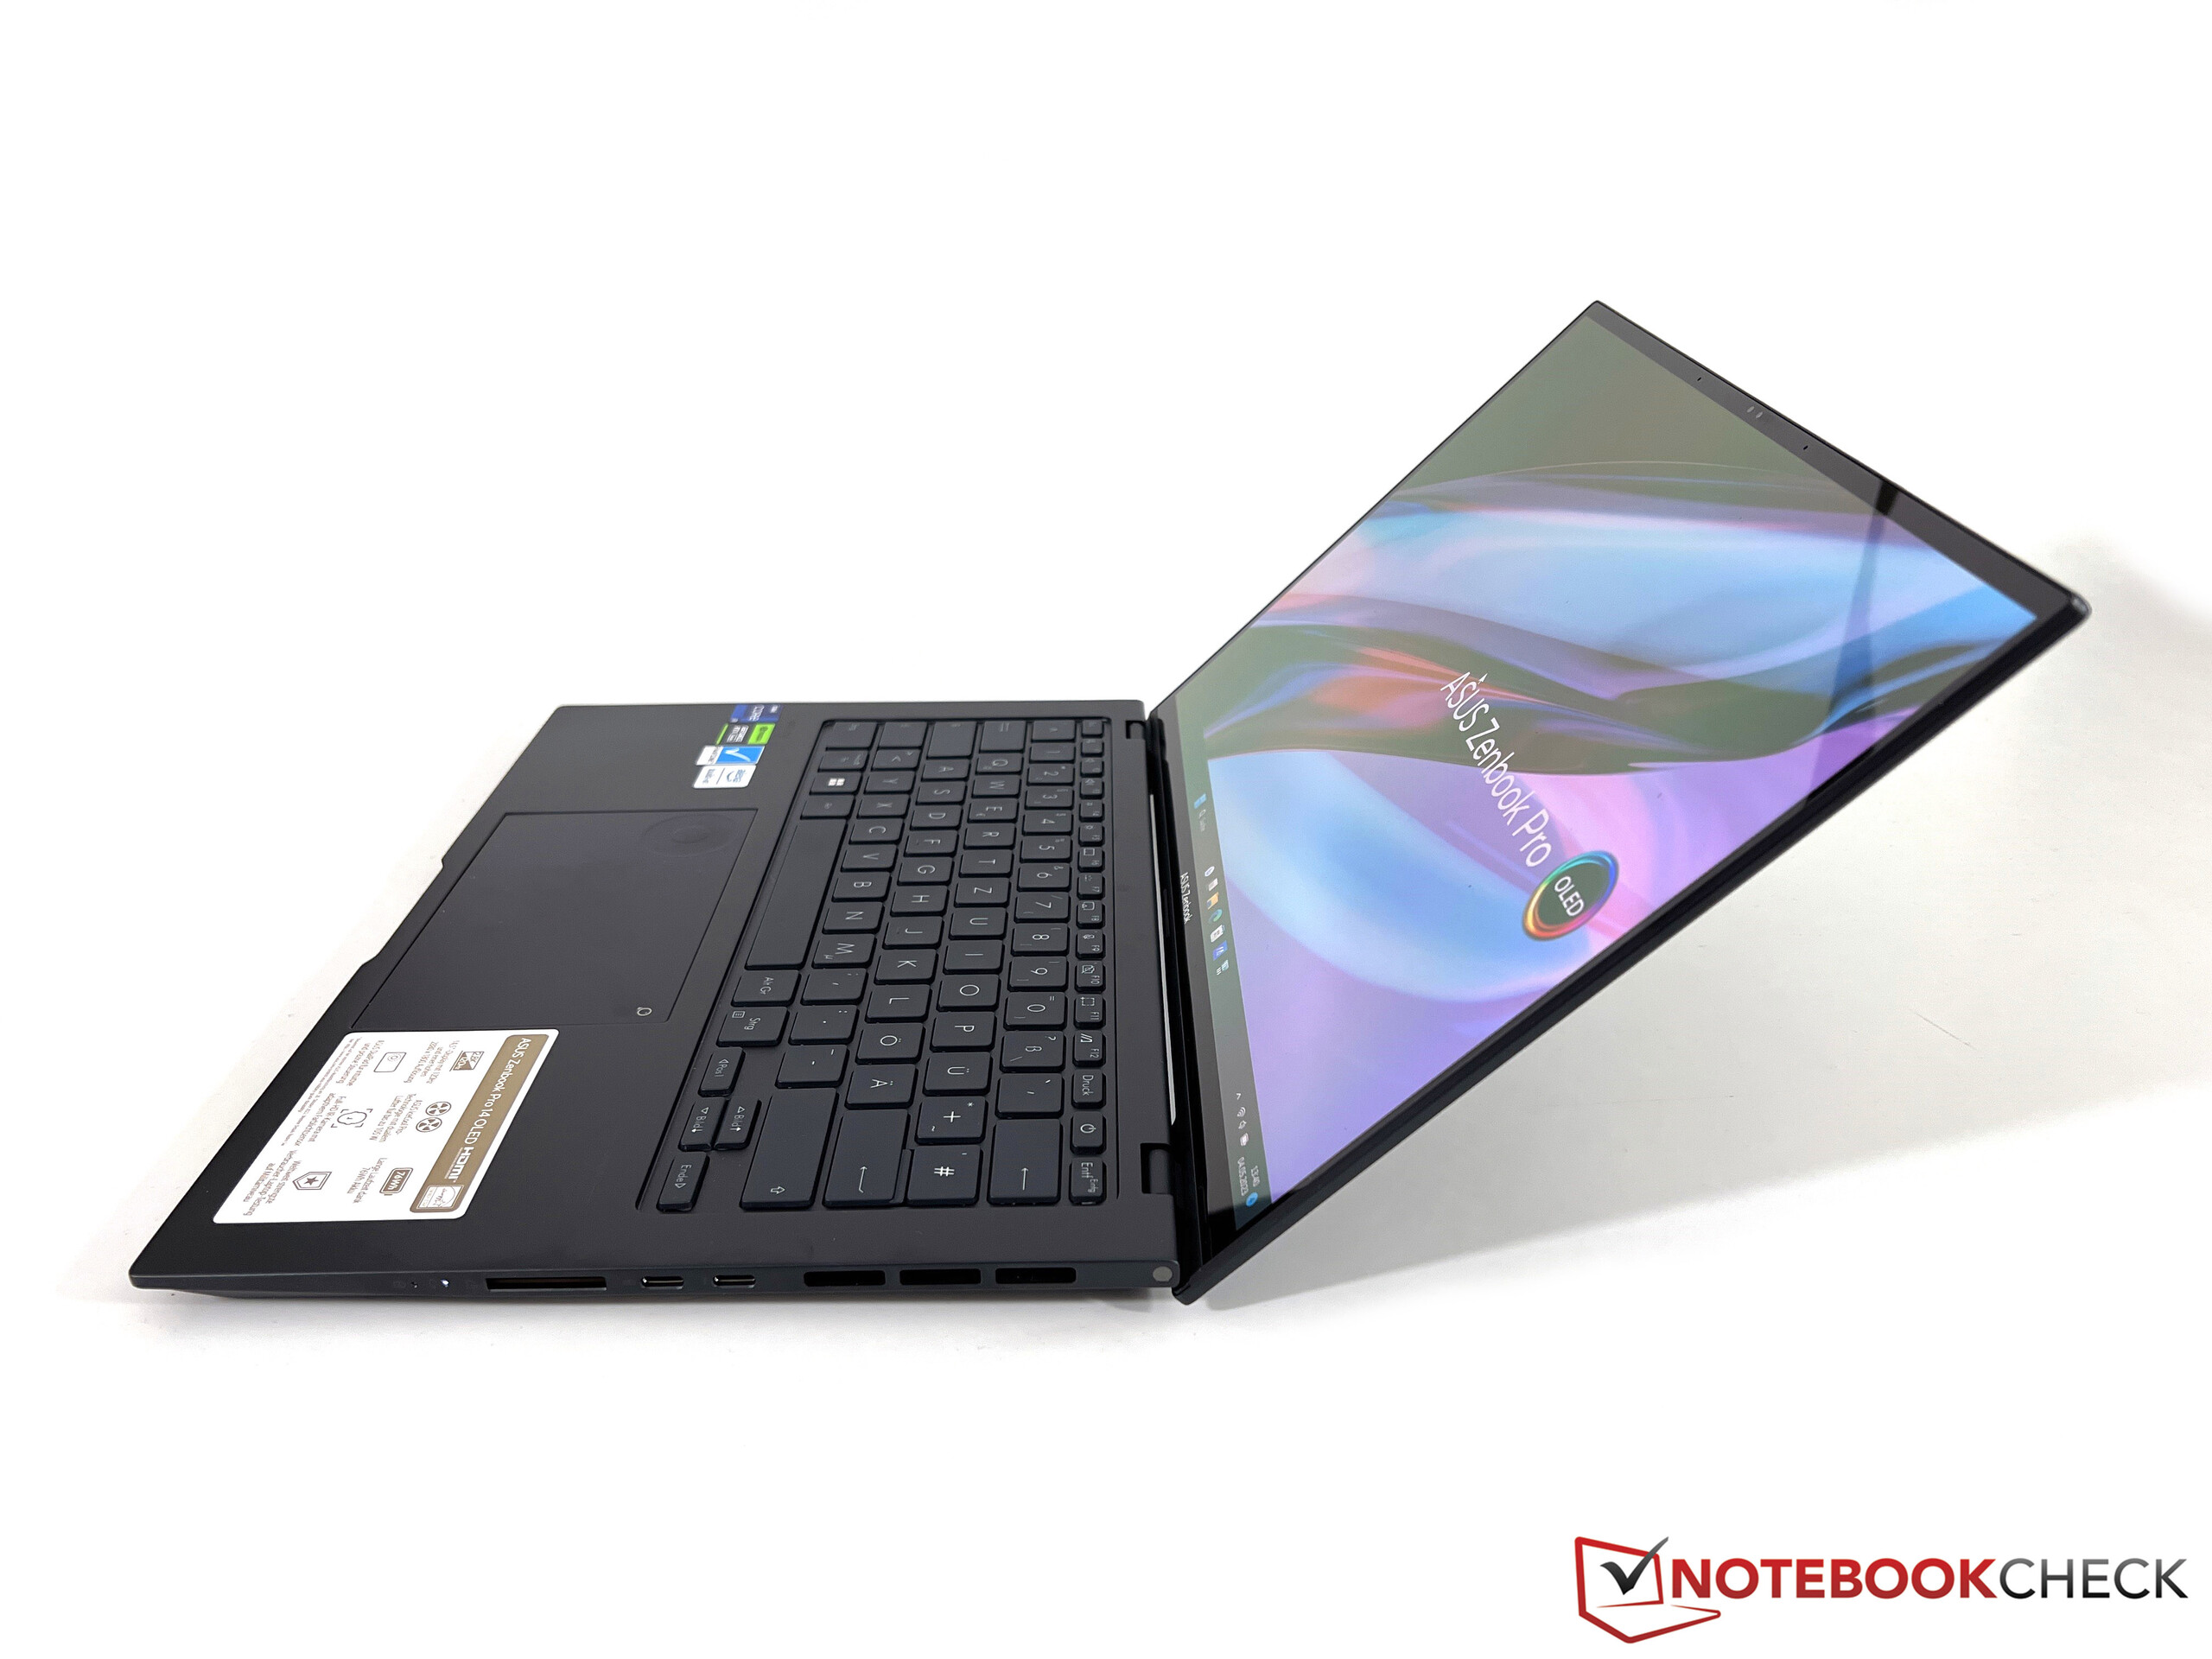
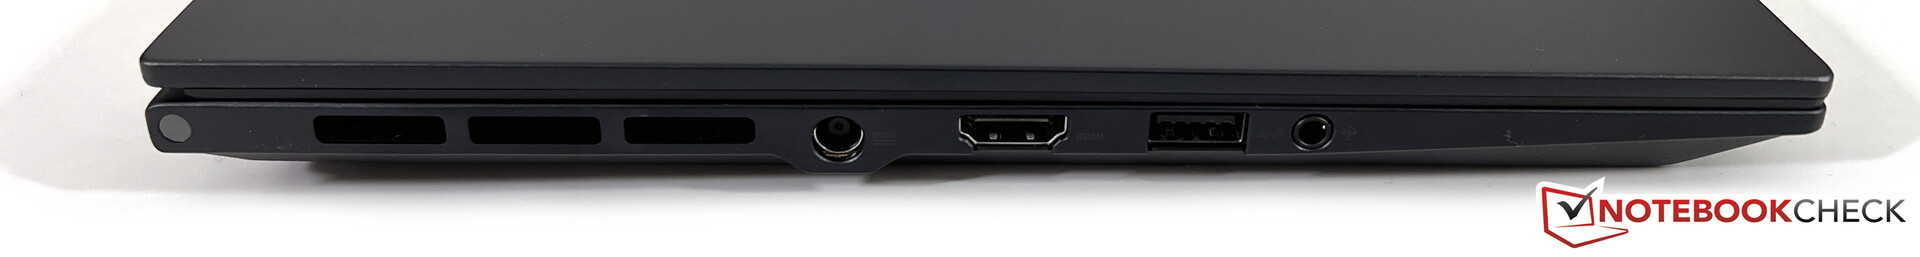
设备 - 华硕安装了所有重要的端口
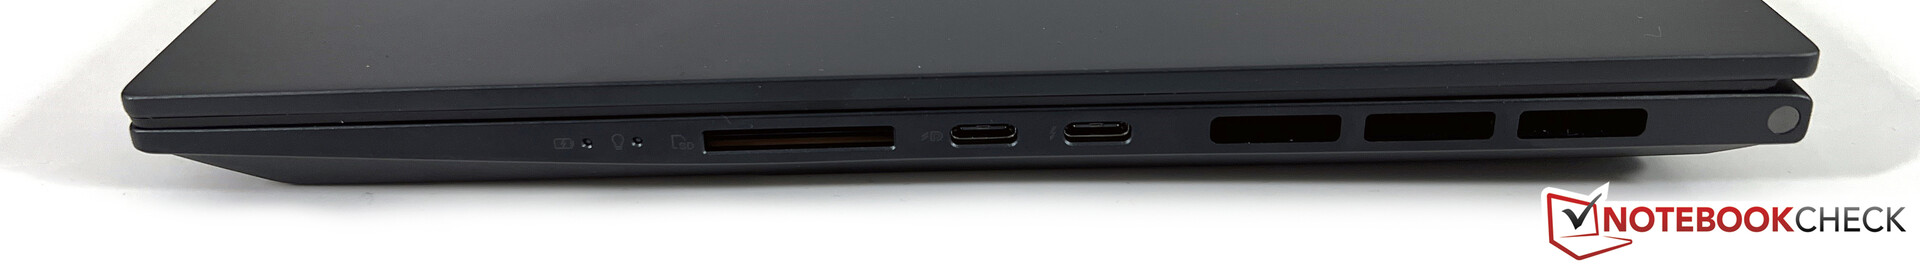
由于基站的后部区域被散热所占据,所以连接口分布在两边的中间。同时使用所有端口可能会导致工作场所显得非常拥挤。尽管如此,华硕提供了所有重要的端口,包括USB-A、USB-C和HDMI。后面的USB-C端口也支持Thunderbolt,如果你想在外部显示器上工作,也应该使用,因为这是在外部显示器上使用iGPU的唯一方法。另一个USB-C端口和HDMI输出总是使用专用的GPU,这消耗了不必要的电力,特别是在简单的任务中。
SD卡阅读器
Zenbook提供了一个成熟的SD卡读卡器,也实现了非常高的传输速率。结合我们的参考卡(Angelbird AV Pro V60),我们记录的最大传输速率超过了250 MB/s,在复制图像文件时,传输速率略高于100 MB/s。
| SD Card Reader | |
| average JPG Copy Test (av. of 3 runs) | |
| Apple MacBook Pro 14 2023 M2 Pro (AV Pro V60) | |
| Dell XPS 15 9530 RTX 4070 (Toshiba Exceria Pro SDXC 64 GB UHS-II) | |
| Asus ROG Zephyrus G14 GA402XY (Angelibrid AV Pro V60) | |
| Average of class Multimedia (23 - 531, n=37, last 2 years) | |
| Asus Zenbook Pro 14 OLED UX6404VI (Angelbird AV Pro V60) | |
| Razer Blade 15 OLED (Early 2022) (AV Pro SD microSD 128 GB V60) | |
| Asus ZenBook Pro 14 Duo UX8402VV-P1021W (AV Pro SD microSD 128 GB V60) | |
| maximum AS SSD Seq Read Test (1GB) | |
| Asus ROG Zephyrus G14 GA402XY (Angelibrid AV Pro V60) | |
| Asus Zenbook Pro 14 OLED UX6404VI (Angelbird AV Pro V60) | |
| Apple MacBook Pro 14 2023 M2 Pro (AV Pro V60) | |
| Average of class Multimedia (37.3 - 1455, n=36, last 2 years) | |
| Dell XPS 15 9530 RTX 4070 (Toshiba Exceria Pro SDXC 64 GB UHS-II) | |
| Razer Blade 15 OLED (Early 2022) (AV Pro SD microSD 128 GB V60) | |
| Asus ZenBook Pro 14 Duo UX8402VV-P1021W (AV Pro SD microSD 128 GB V60) | |
沟通
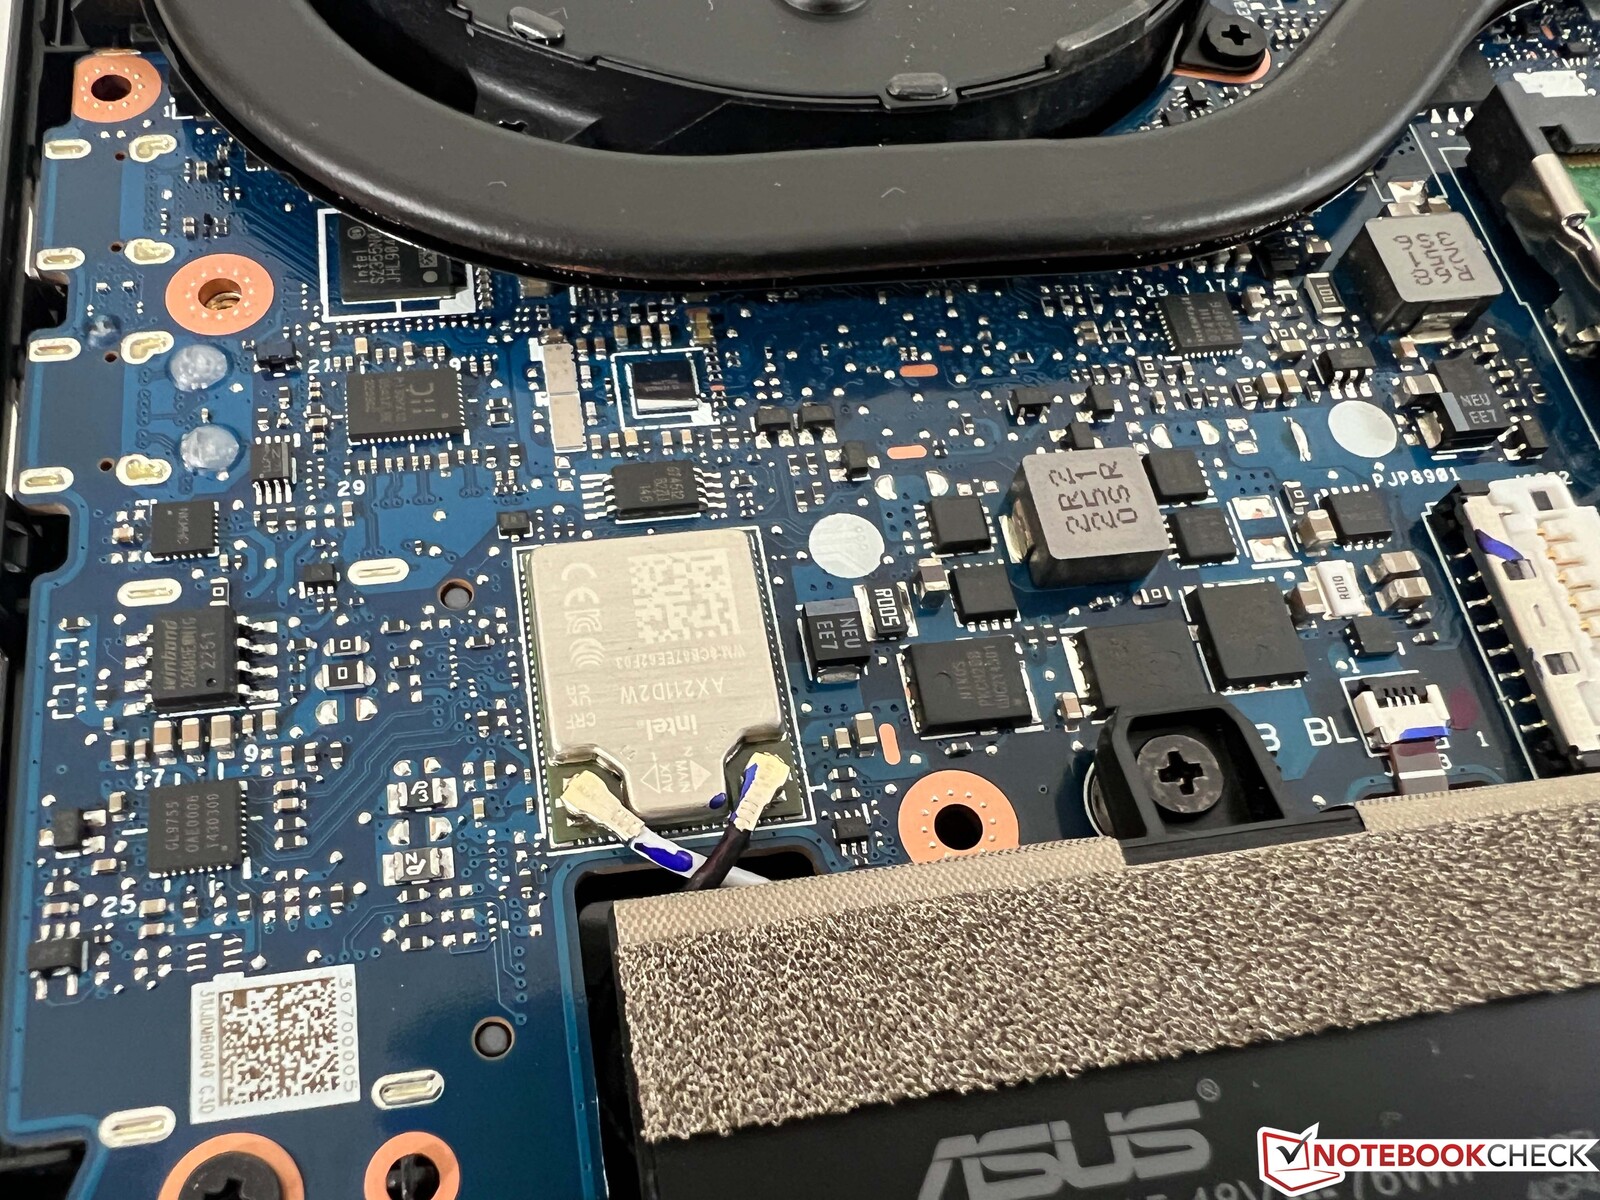
无线网络连接由英特尔的AX211模块处理,除了目前的Wi-Fi 6E标准外,它还支持蓝牙5.2。我们无法连接到华硕参考路由器的相应的6GHz网络,但在5GHz网络中的性能非常好,我们在WLAN方面没有问题。交付范围中还包括一个用于有线网络的USB以太网适配器。
| Networking | |
| Asus Zenbook Pro 14 OLED UX6404VI | |
| iperf3 transmit AXE11000 | |
| iperf3 receive AXE11000 | |
| Asus ZenBook Pro 14 Duo UX8402VV-P1021W | |
| iperf3 transmit AXE11000 | |
| iperf3 receive AXE11000 | |
| iperf3 transmit AXE11000 6GHz | |
| iperf3 receive AXE11000 6GHz | |
| Apple MacBook Pro 14 2023 M2 Pro | |
| iperf3 transmit AXE11000 6GHz | |
| iperf3 receive AXE11000 6GHz | |
| Asus ROG Zephyrus G14 GA402XY | |
| iperf3 transmit AXE11000 | |
| iperf3 receive AXE11000 | |
| Dell XPS 15 9530 RTX 4070 | |
| iperf3 transmit AXE11000 | |
| iperf3 receive AXE11000 | |
| Razer Blade 15 OLED (Early 2022) | |
| iperf3 transmit AXE11000 | |
| iperf3 receive AXE11000 | |
| iperf3 transmit AXE11000 6GHz | |
| iperf3 receive AXE11000 6GHz | |
网络摄像头
华硕在屏幕上边框为网络摄像头安装了一个1080p传感器。画面质量比旧的720p型号好一点,但你不应该期待奇迹的发生。还安装了一个红外模块,可以通过Windows Hello进行面部识别。


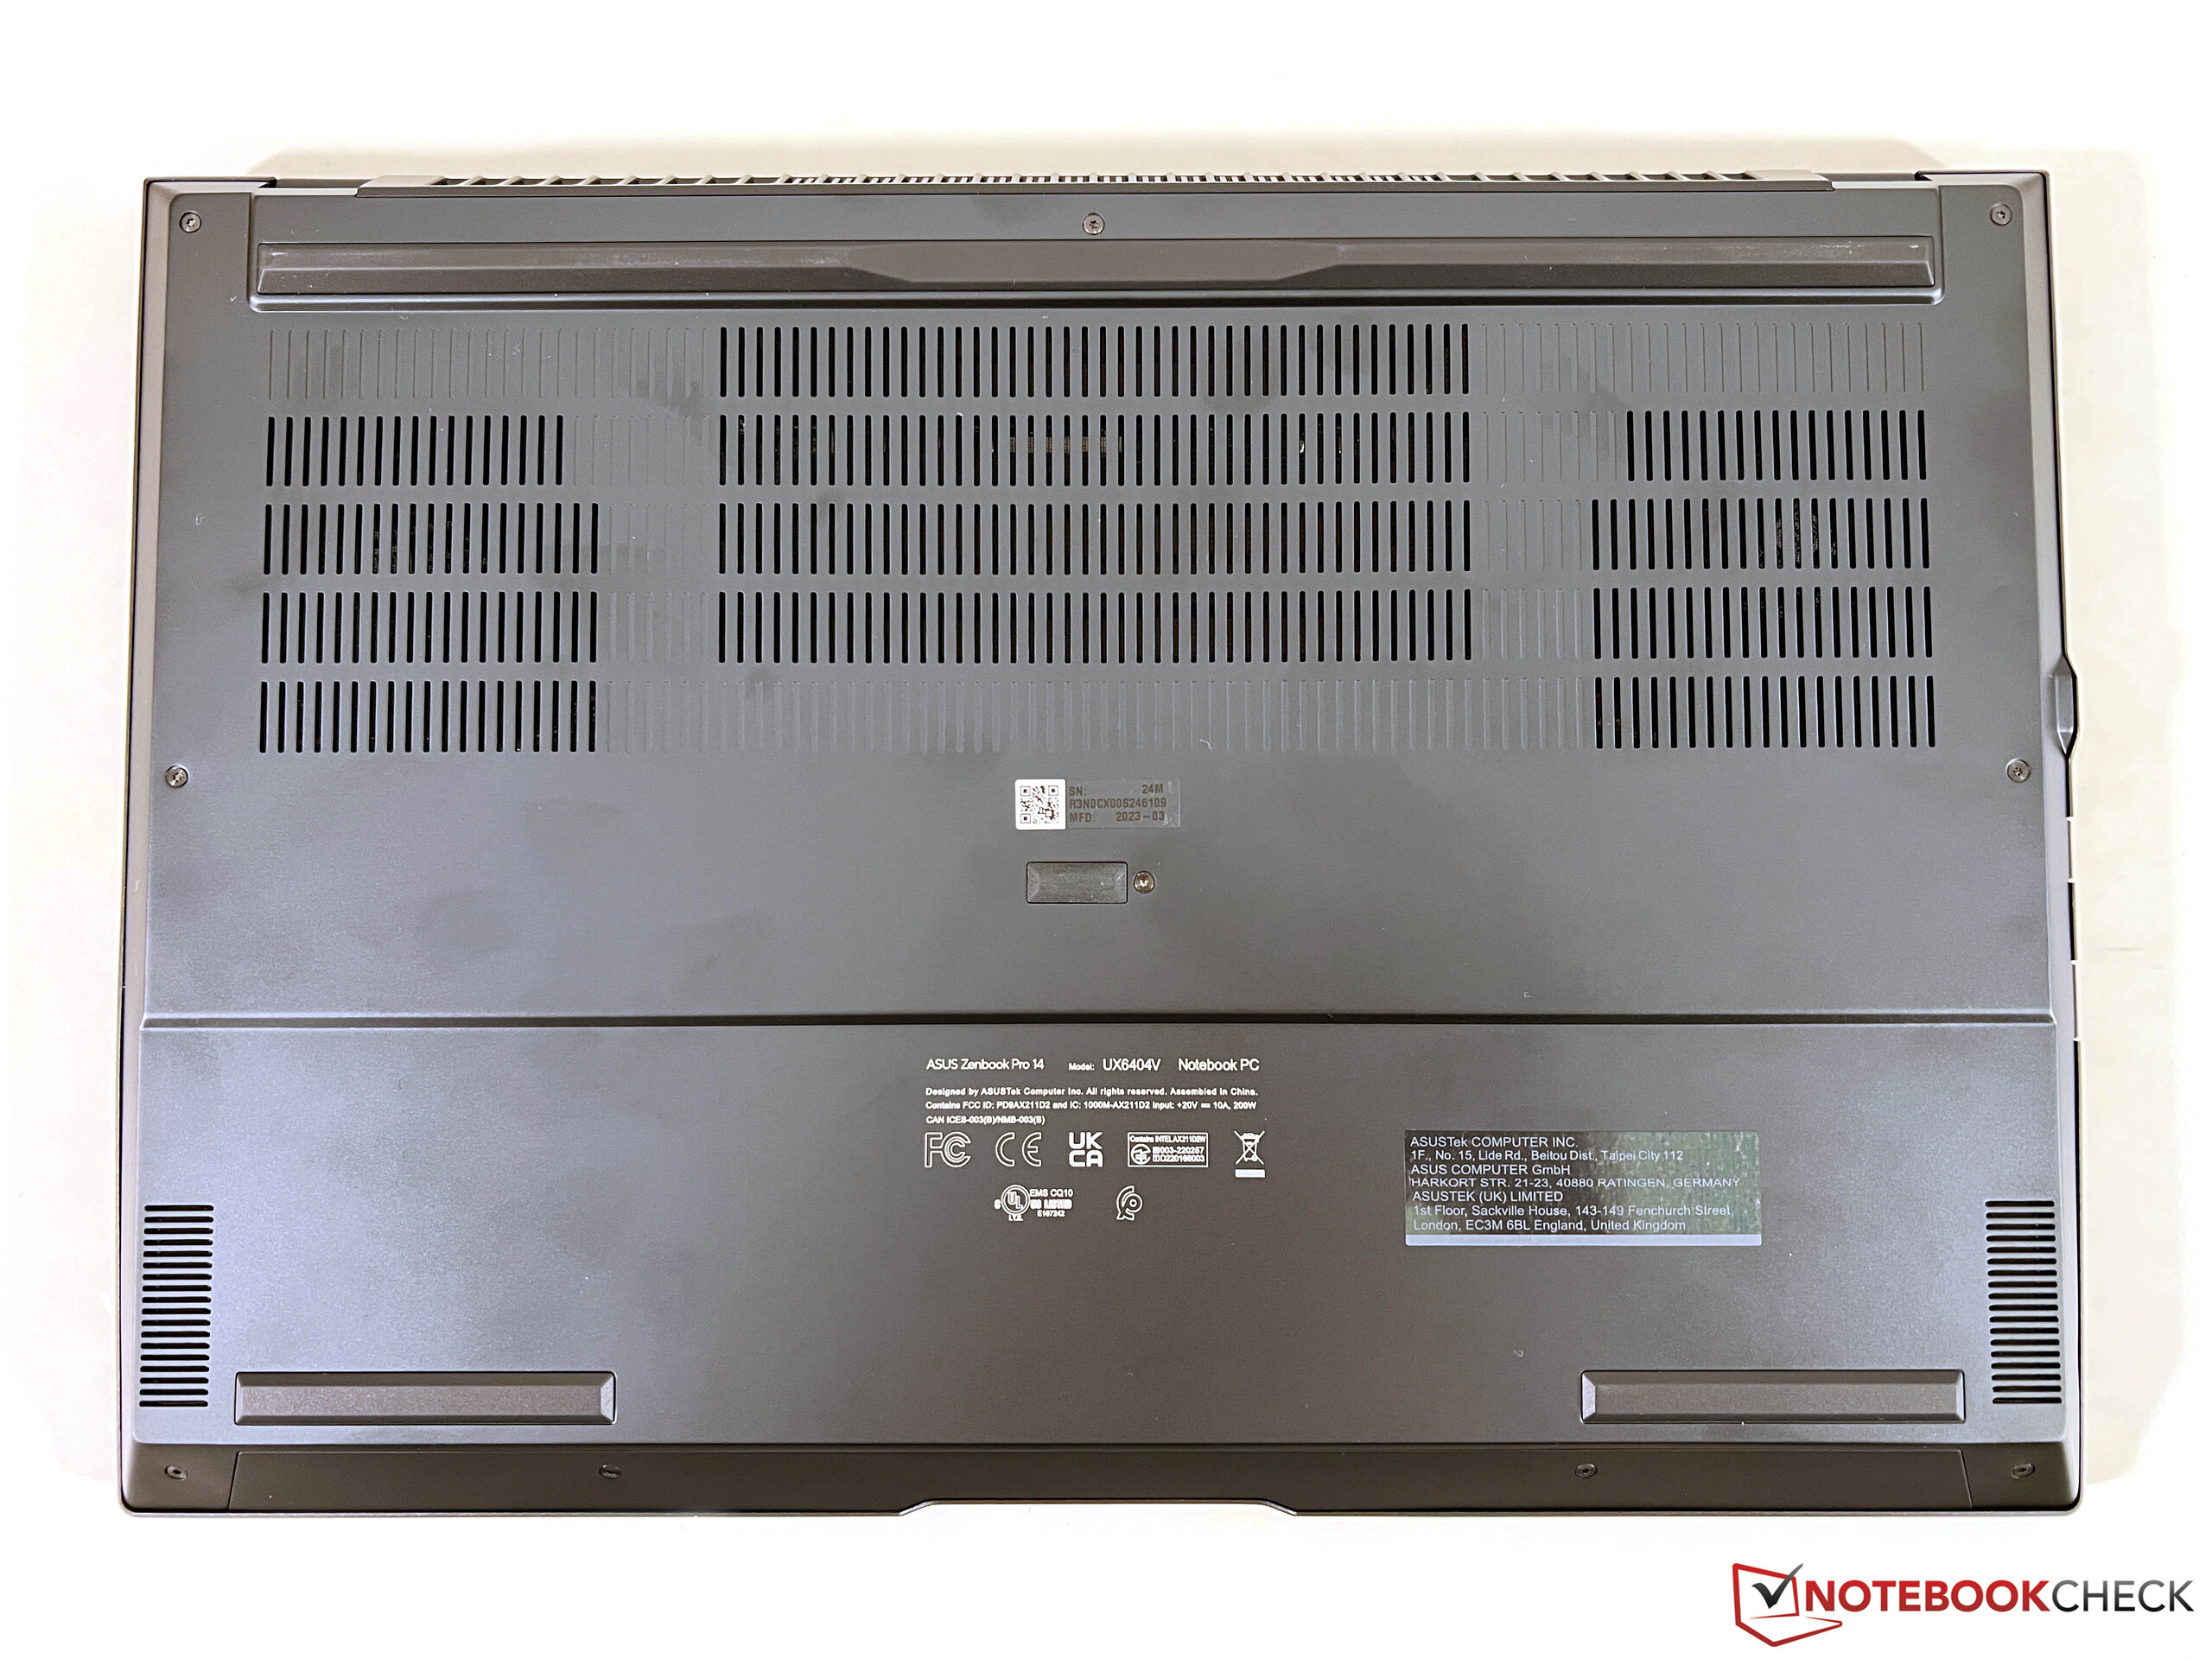
维护
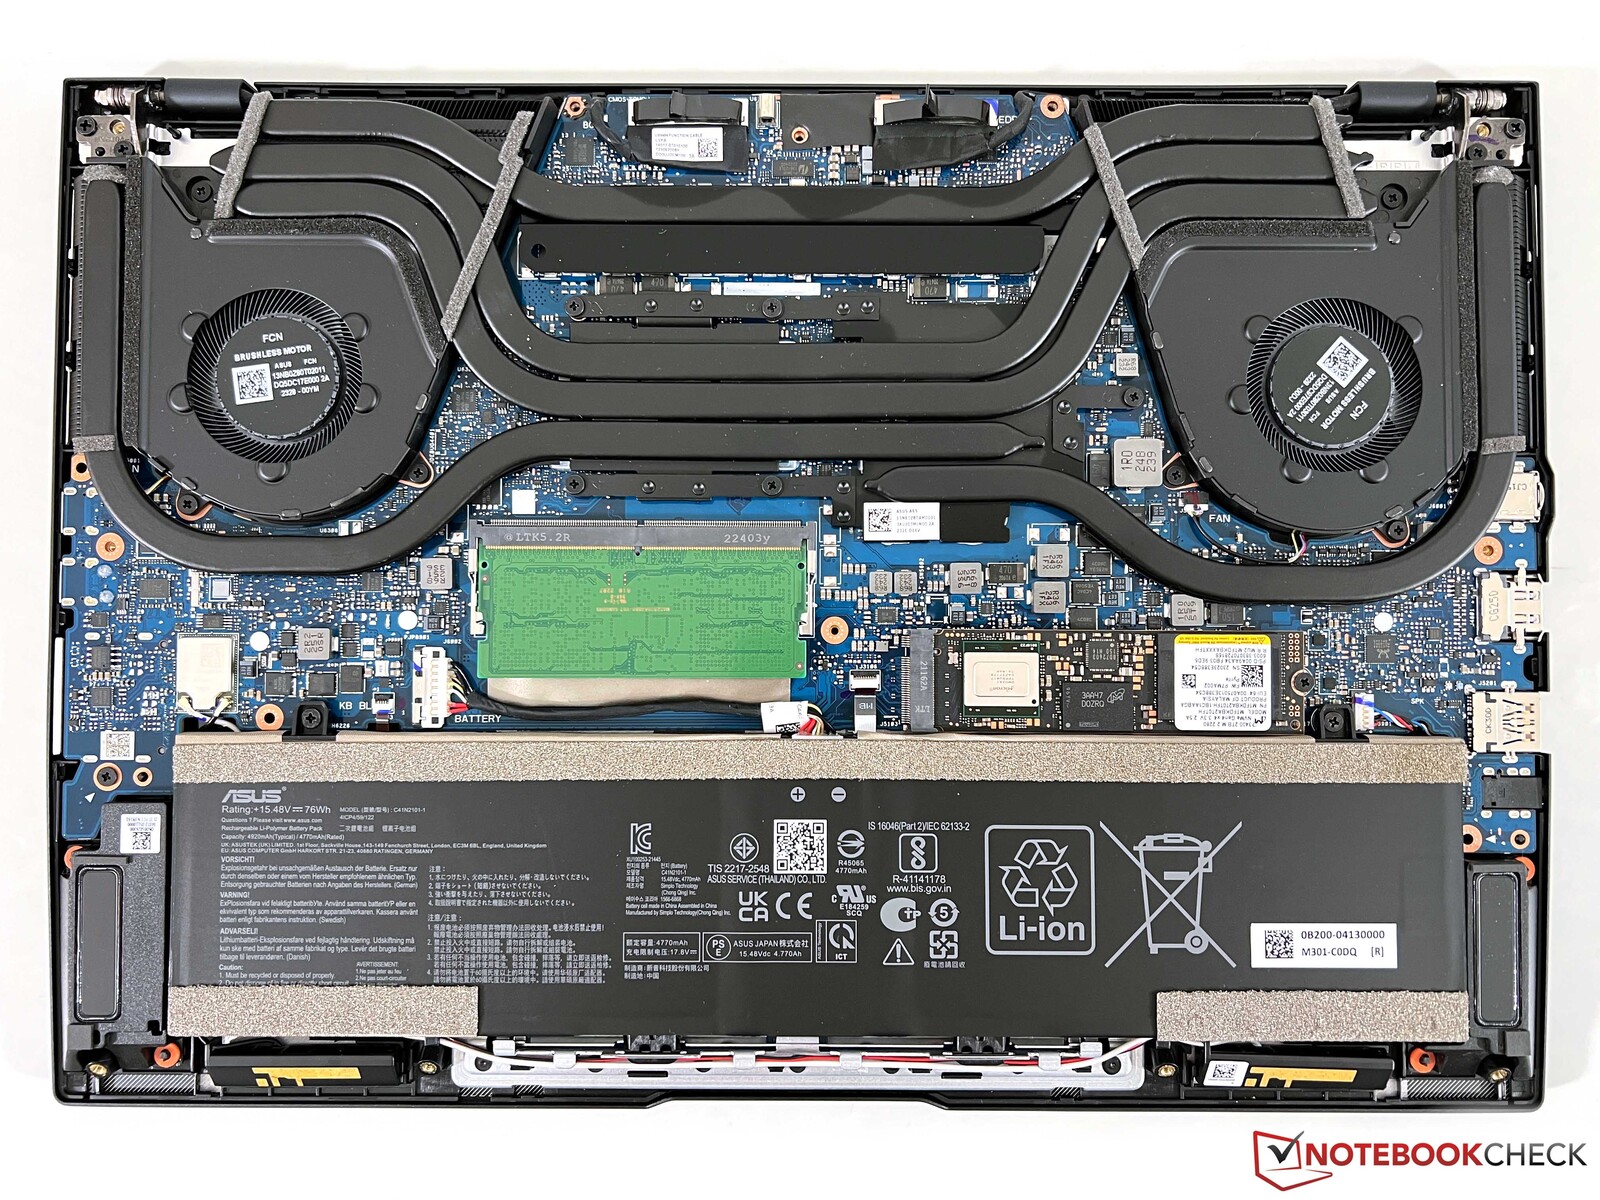
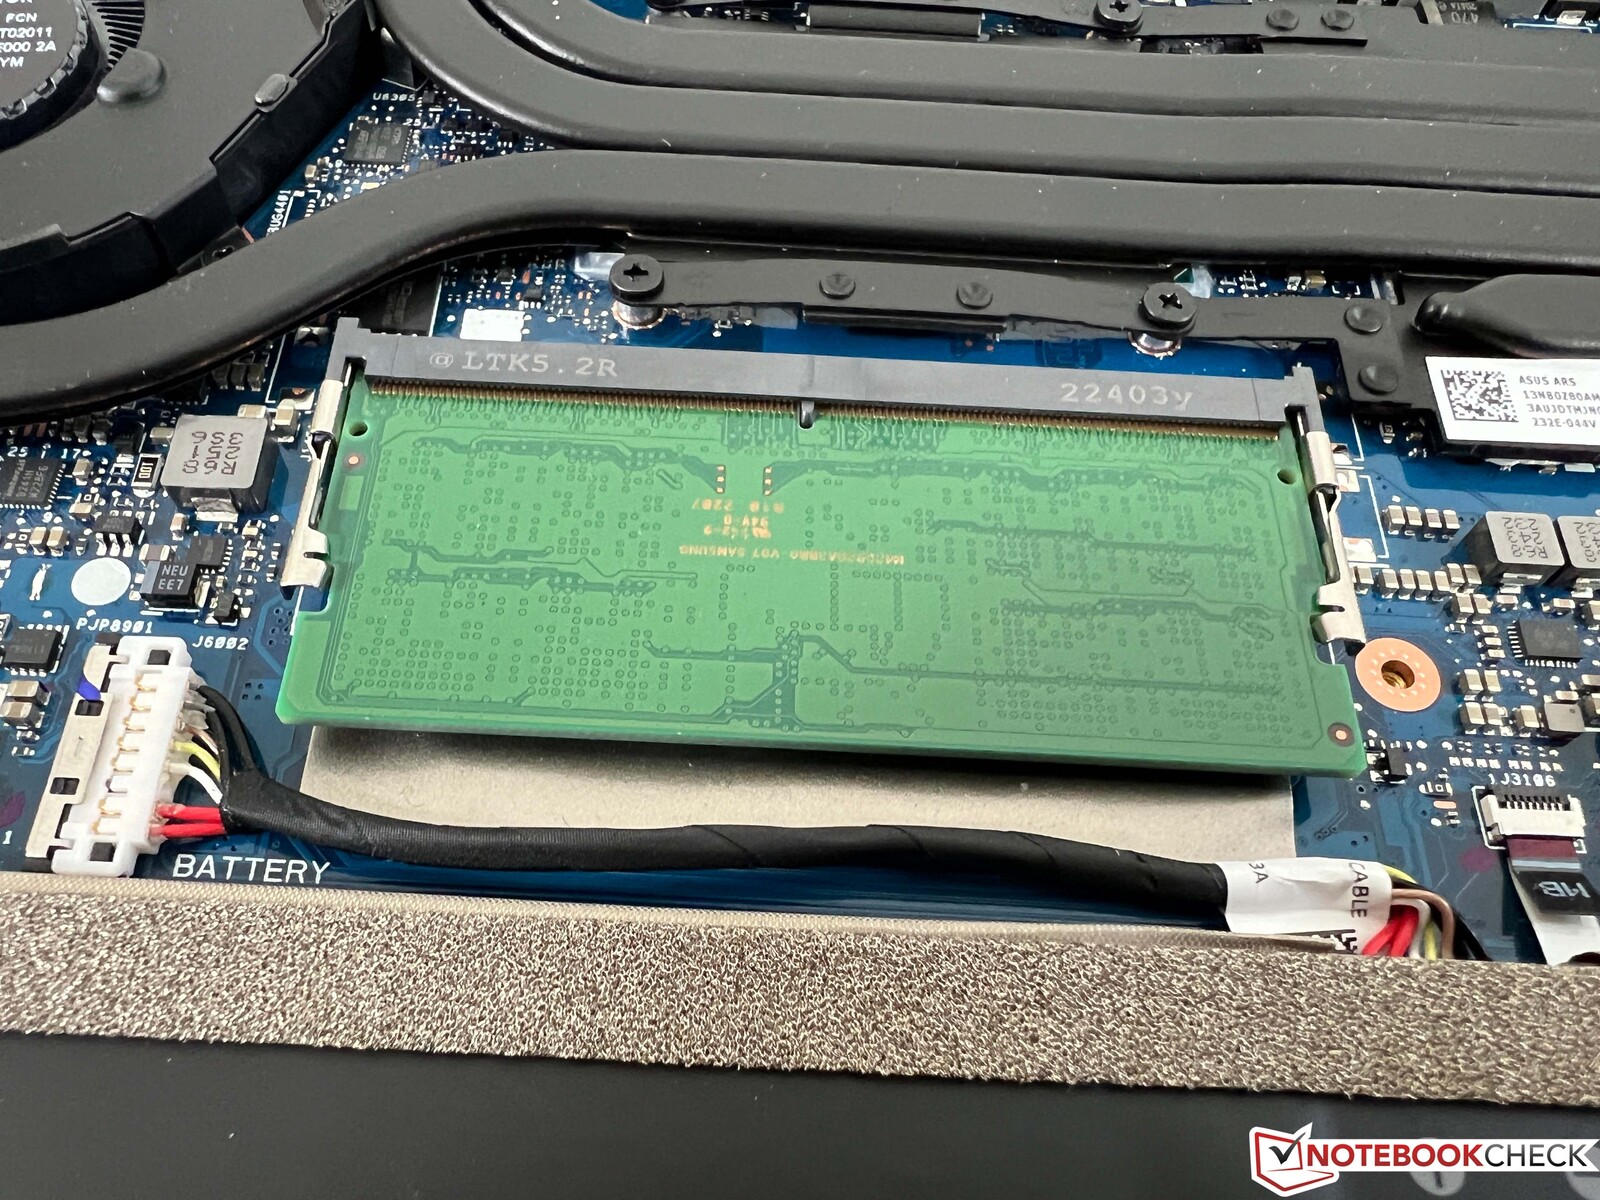
下层机箱盖是用九颗Torx螺丝(T5)固定的,可以很容易地取下。然后你可以接触到两个风扇、电池和一个用于RAM模块的SODIMM插槽。然而,WLAN模块和一个RAM模块是焊接的。
输入设备 - 带有拨号板的触摸板
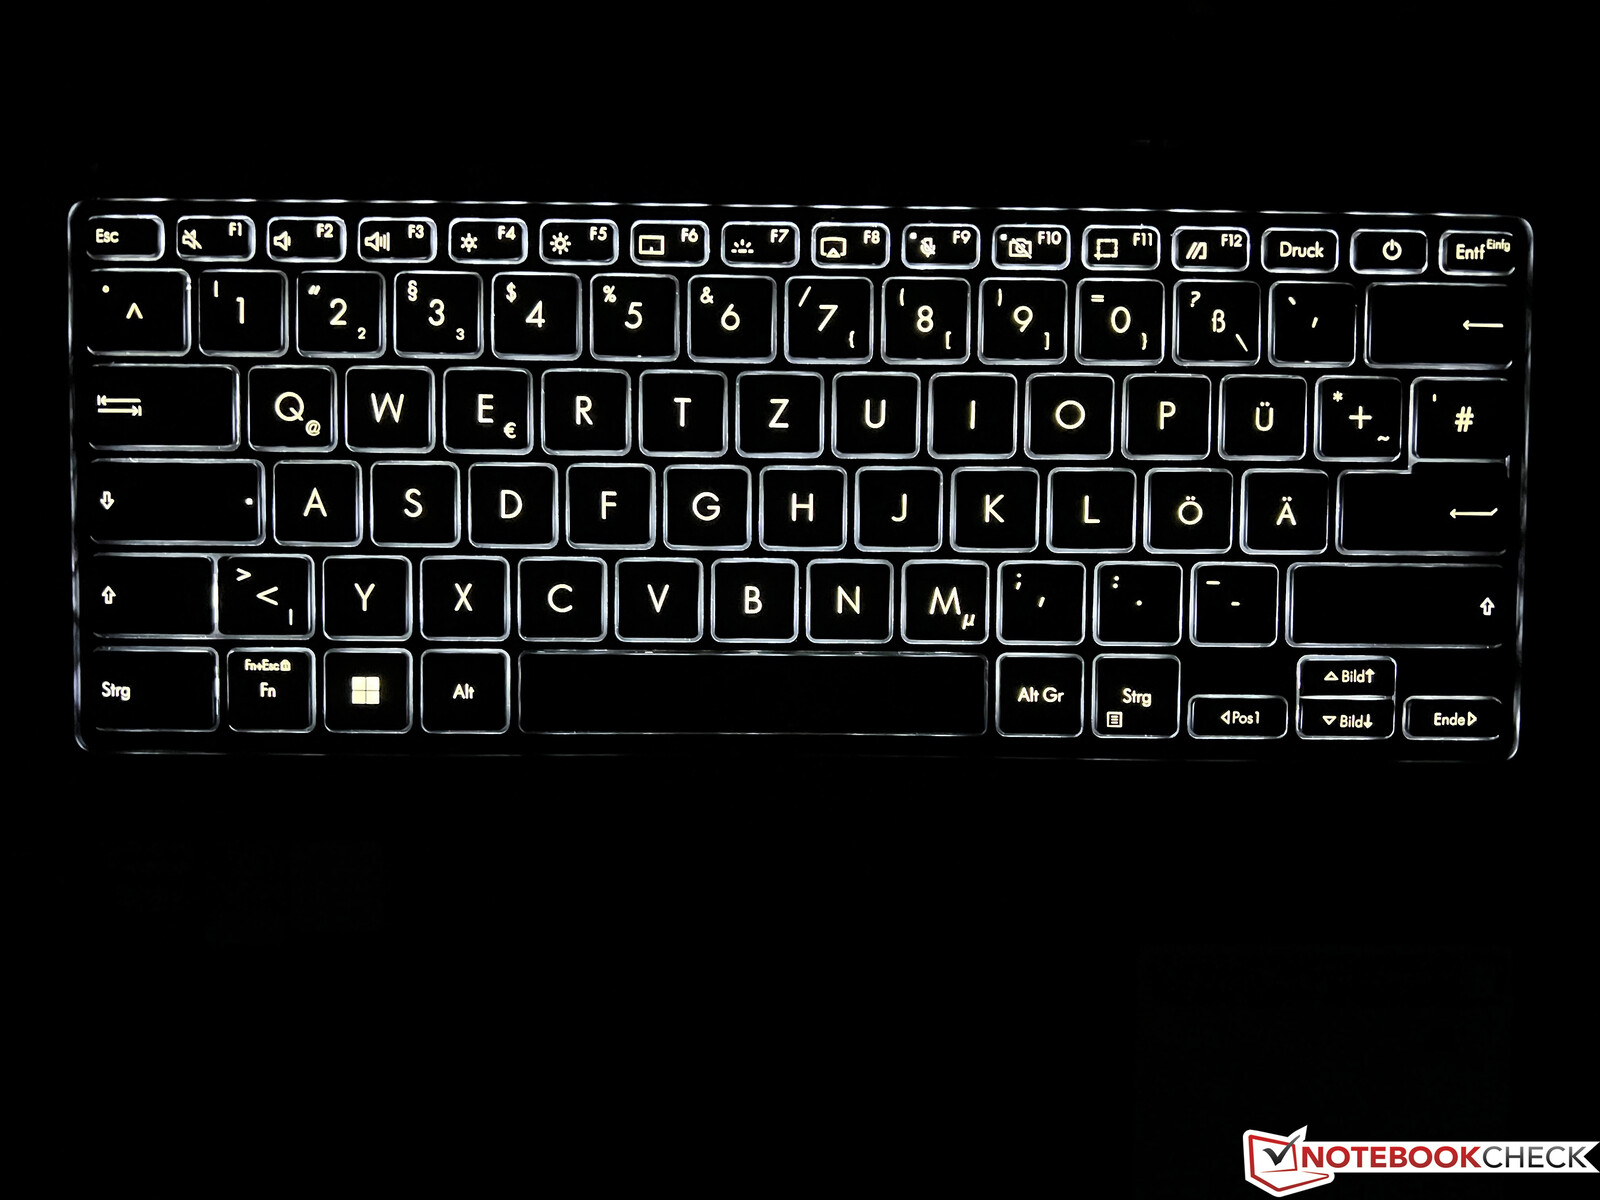
键盘
键盘的键程为1.4毫米,总体上提供平均的输入。考虑到机箱的厚度和价格,在这里可以做得更多,特别是由于按键总体上有一点响动。例如,我们更喜欢ROG Zephyrus G14的键盘(1.7毫米行程)。在布局方面,你还必须习惯于单排回车键以及小的方向键。最后,有一个三段式的白色背光,可以通过传感器激活。
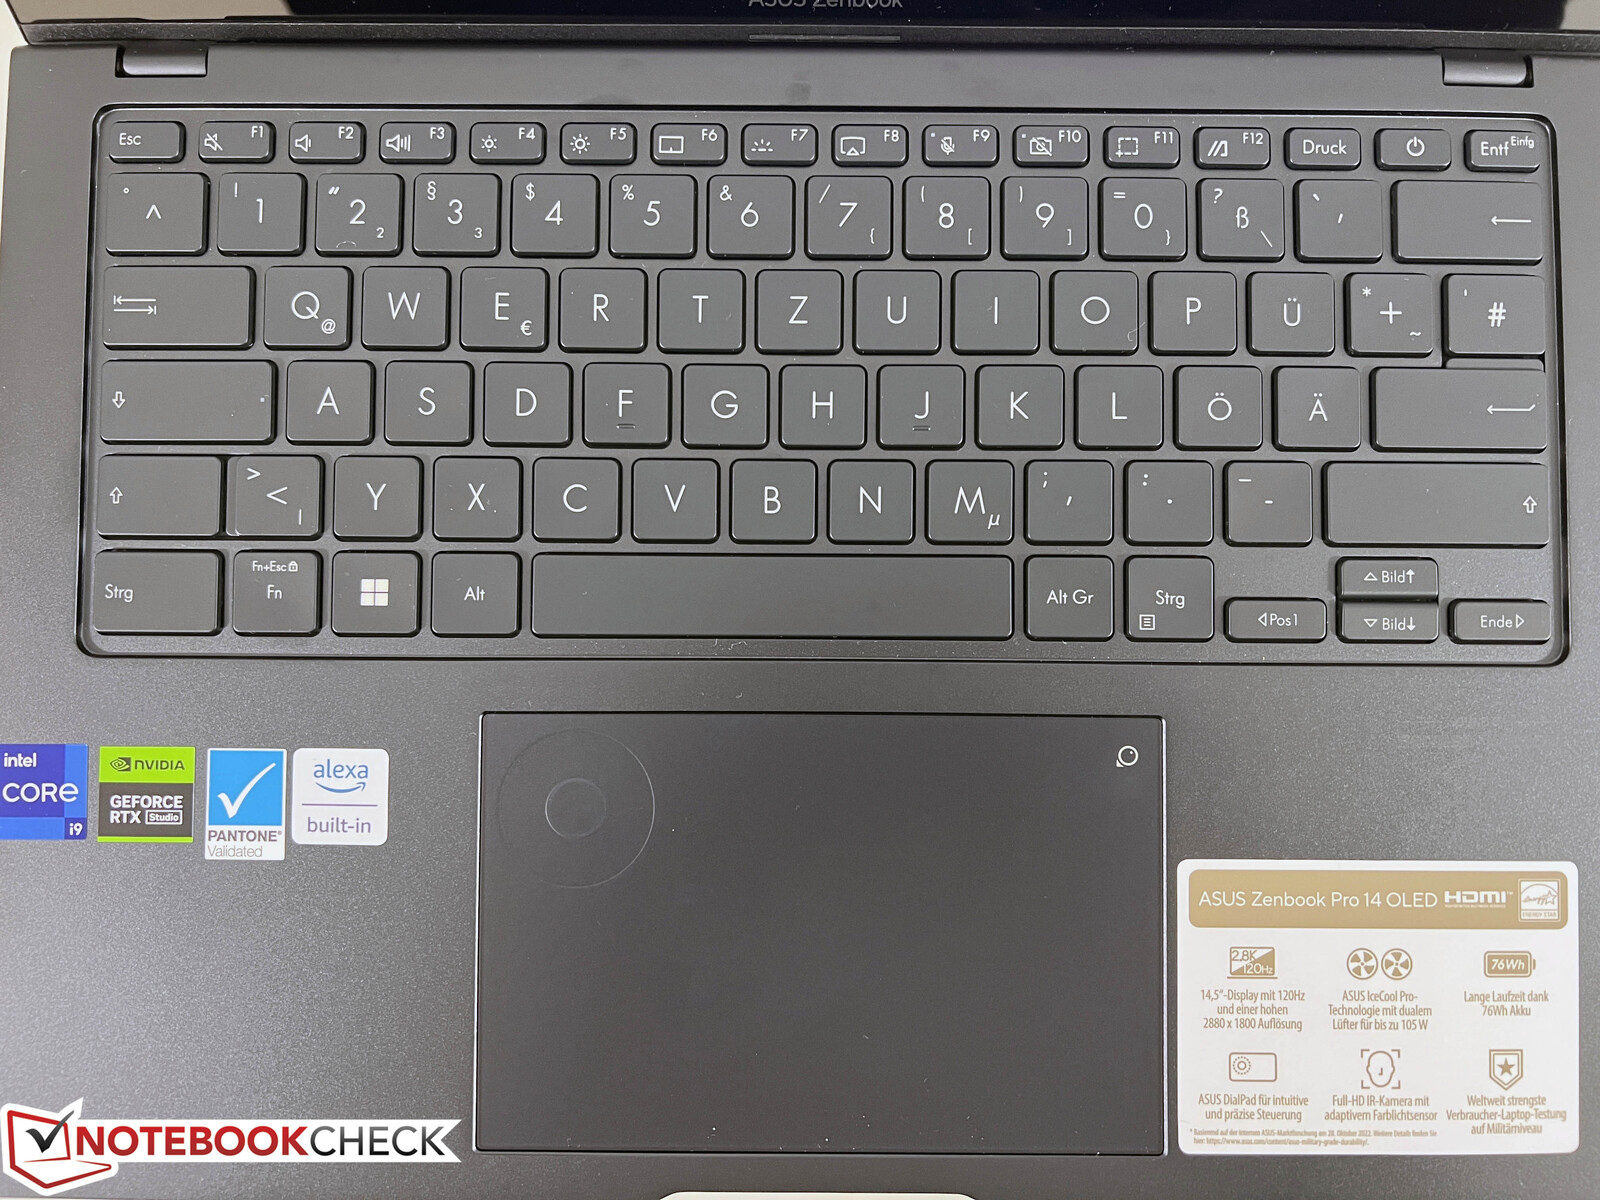
触摸板和手写笔
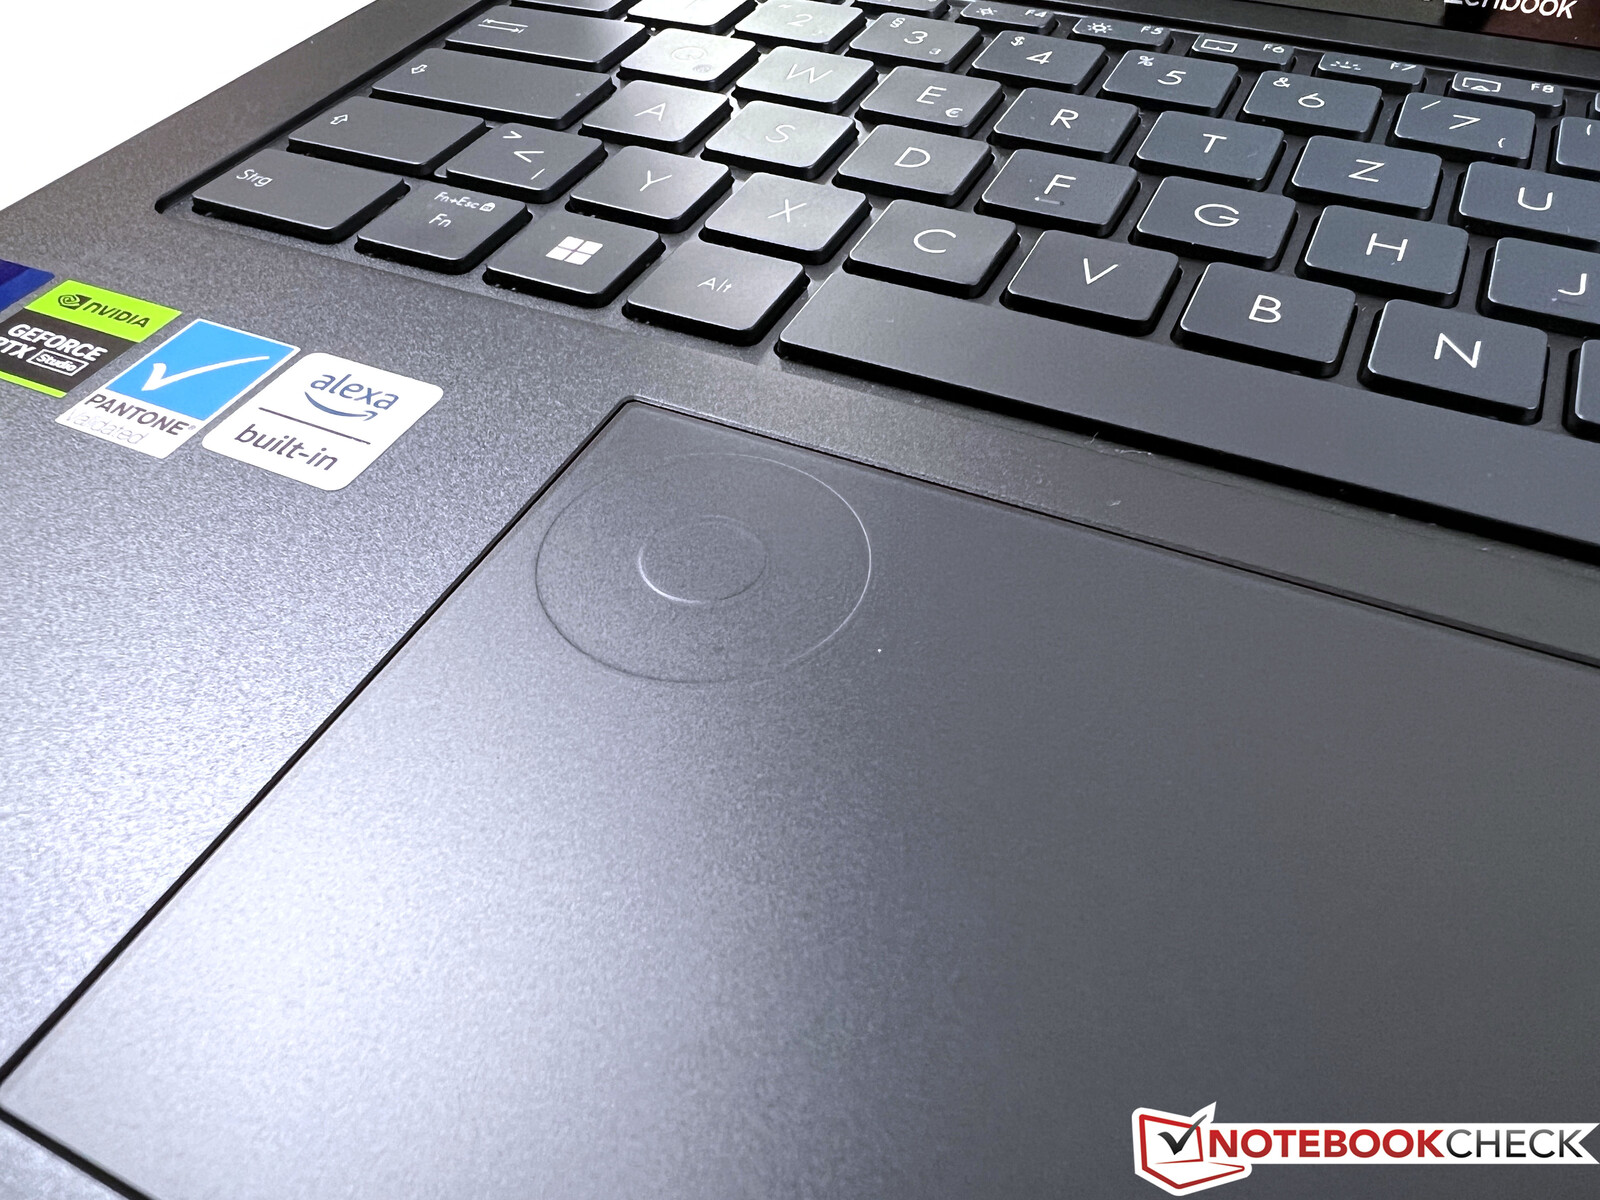
华硕为触摸板设计了一个特殊的功能,即所谓的DialPad,它被安装在左上角。这个圆环为用户提供了额外的选项,与Adobe应用程序的整合效果非常好。例如,在日常使用中,亮度和音量都可以在这里调整。这一切都运行良好,但创意应用程序中的专用特殊键和快捷键通常工作得更快。
此外,你在简单操作Pad时注意到凸起的圆环,总体来说效果不错,但咔嚓声有点大。当然,电容式触摸屏也可以作为一种选择,还包括一支主动式手写笔,这也给人留下了很好的印象,特别是在编辑图像时。
显示屏 - 120赫兹OLED触摸屏
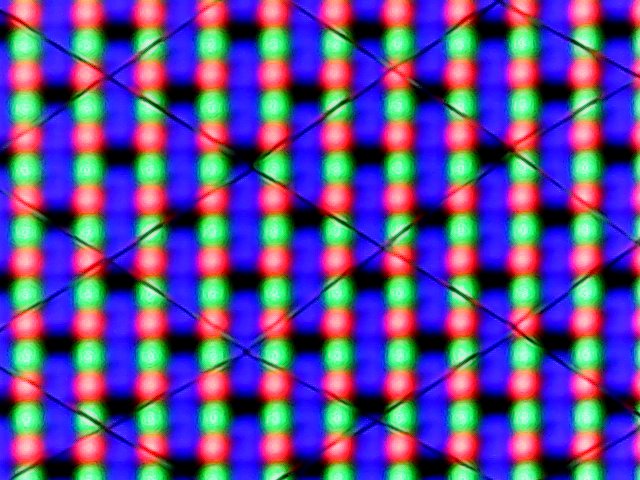
华硕为Zenbook Pro 14配备了一个高分辨率的OLED触摸屏。14.5英寸面板(16:10)的分辨率为2880x1800,主观画面印象从根本上说非常好,但由于触摸屏的原因,画质略有颗粒感。由于频率高,屏幕活动非常流畅。
在技术数据中,制造商规定亮度为400 cd/m²,或HDR内容的最大亮度为550 cd/m²。然而,在我们的测量中,该面板并没有完全达到这个标准,因为我们确定普通SDR内容(即日常事物)的平均亮度几乎为360cd/m²。对比度非常高,这是由于黑色水平较低造成的。在HDR内容方面,我们记录的最高值是584 cd/m²,其中有一个小的明亮的图像部分,而大约460 cd/m²是一个几乎完全白色的图像。
Windows的HDR设置是值得批评的,因为为了使HDR内容真正显示出来,首先必须在设置中激活HDR。然而,所有的颜色配置文件随后被完全丢弃,MyAsus软件的各种颜色配置文件不再可用。Apple'在MacBook Pro 14的迷你LED面板中,HDR的实现在这里显然更有优势,而且还能达到更高的亮度值。
| |||||||||||||||||||||||||
Brightness Distribution: 99 %
Center on Battery: 356 cd/m²
Contrast: ∞:1 (Black: 0 cd/m²)
ΔE ColorChecker Calman: 0.8 | ∀{0.5-29.43 Ø4.71}
ΔE Greyscale Calman: 0.9 | ∀{0.09-98 Ø4.96}
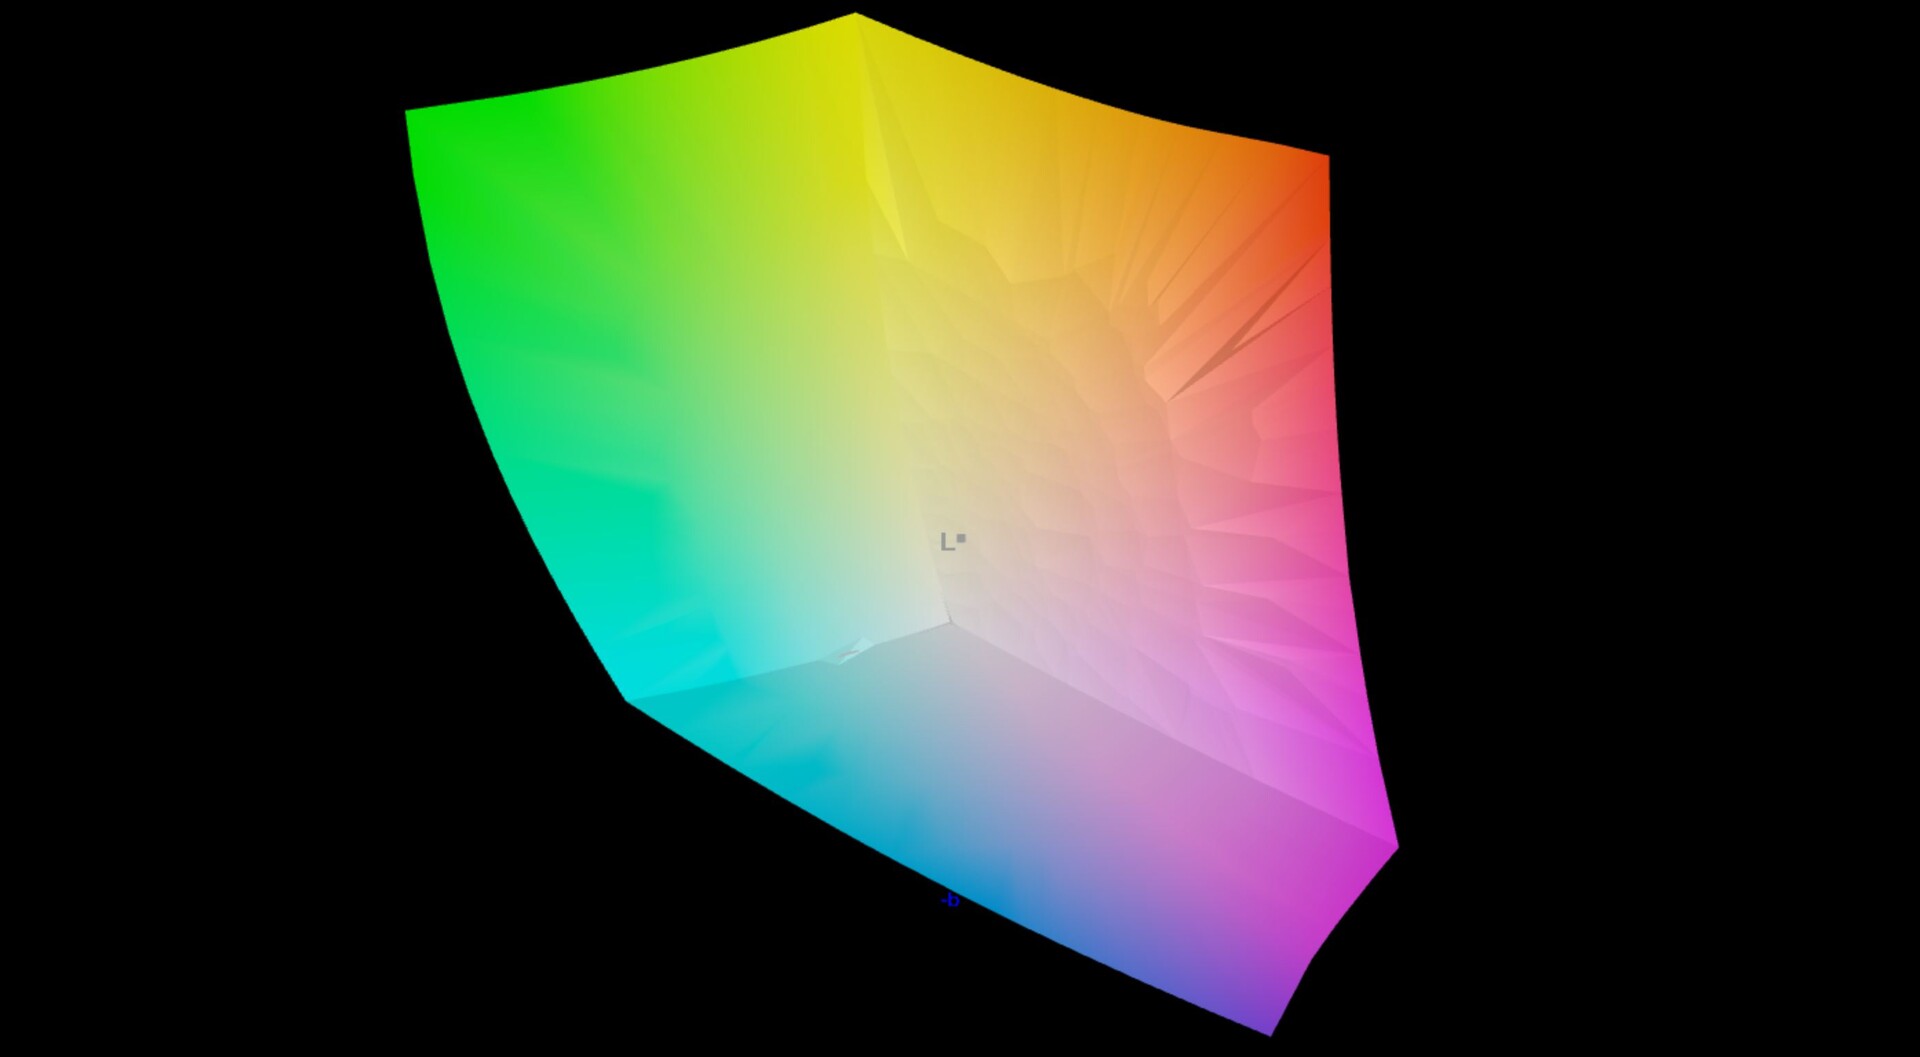
97.5% AdobeRGB 1998 (Argyll 3D)
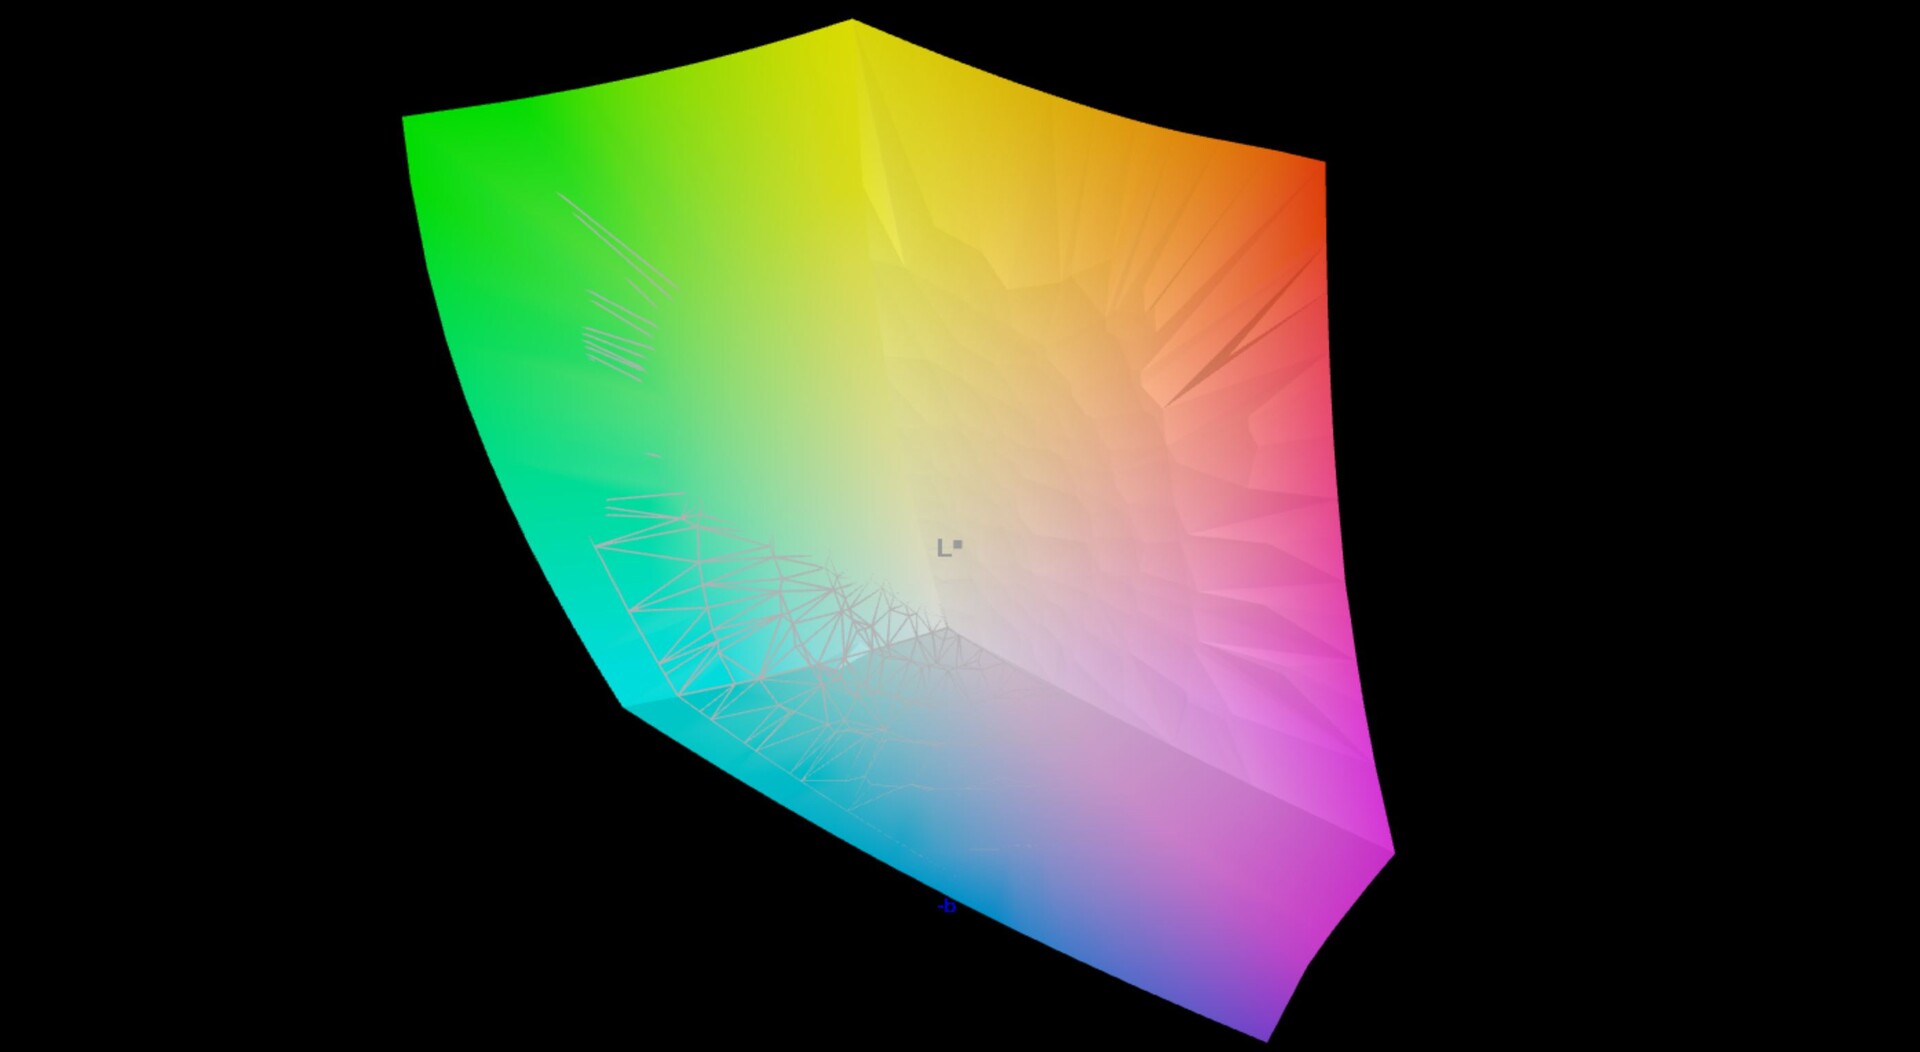
100% sRGB (Argyll 3D)
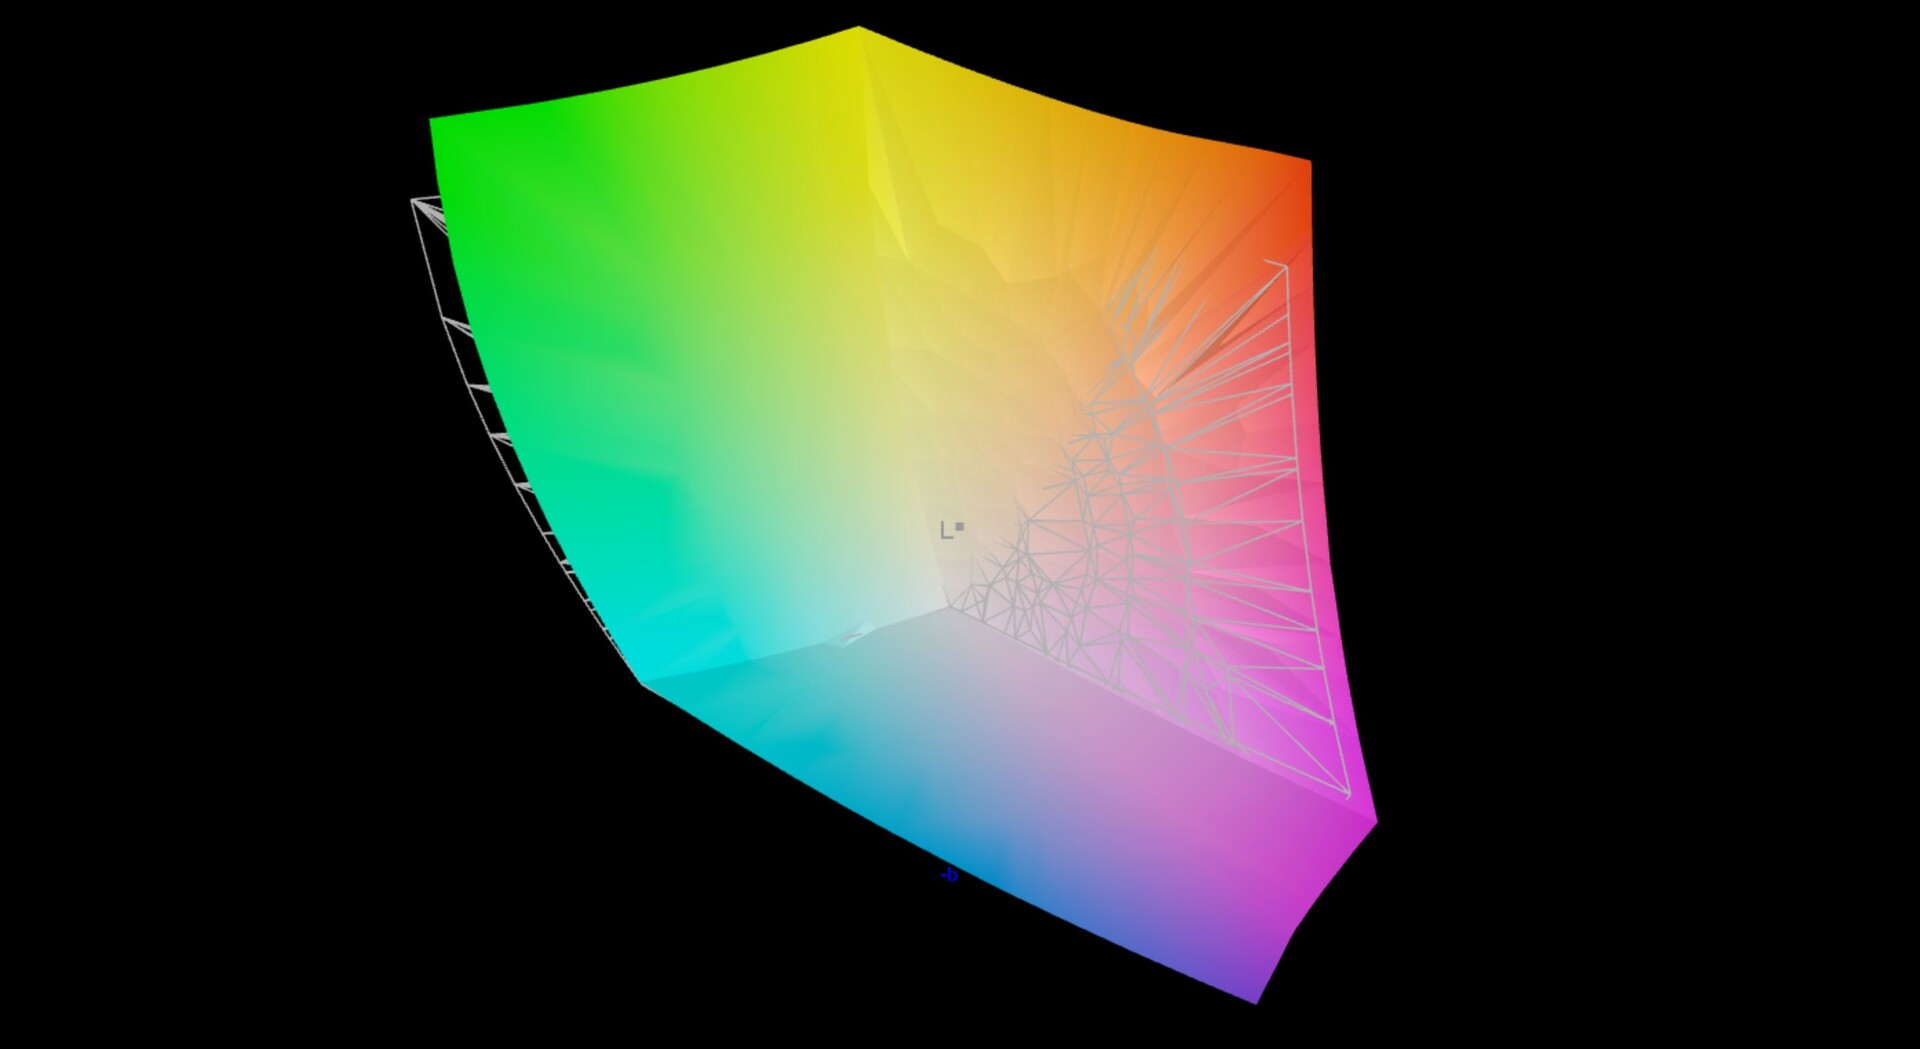
99.6% Display P3 (Argyll 3D)
Gamma: 2.19
CCT: 6590 K
| Asus Zenbook Pro 14 OLED UX6404VI SDC4190, OLED, 2880x1800, 14.5" | Asus ZenBook Pro 14 Duo UX8402VV-P1021W ATNA45AF04-0 , OLED, 2880x1800, 14.5" | Apple MacBook Pro 14 2023 M2 Pro Mini-LED, 3024x1964, 14.2" | Asus ROG Zephyrus G14 GA402XY B140QAN06.S, Mini-LED, 2560x1600, 14" | Dell XPS 15 9530 RTX 4070 Samsung 156XG01, OLED, 3456x2160, 15.6" | Razer Blade 15 OLED (Early 2022) Samsung ATNA562P02-0, OLED, 2560x1440, 15.6" | |
|---|---|---|---|---|---|---|
| Display | -1% | 0% | -1% | 0% | -2% | |
| Display P3 Coverage (%) | 99.6 | 99.91 0% | 99.2 0% | 99.6 0% | 99.8 0% | 97.6 -2% |
| sRGB Coverage (%) | 100 | 100 0% | 100 0% | 100 0% | 99.4 -1% | |
| AdobeRGB 1998 Coverage (%) | 97.5 | 95.35 -2% | 93.4 -4% | 98.4 1% | 94 -4% | |
| Response Times | -161% | -3994% | -1734% | -134% | -161% | |
| Response Time Grey 50% / Grey 80% * (ms) | 0.67 ? | 2 ? -199% | 35.2 ? -5154% | 17.2 ? -2467% | 1.68 ? -151% | 2 ? -199% |
| Response Time Black / White * (ms) | 0.9 ? | 2 ? -122% | 26.4 ? -2833% | 9.9 ? -1000% | 1.94 ? -116% | 2 ? -122% |
| PWM Frequency (Hz) | 240 | 240 | 14880 ? | 5430 | 239 | 500 ? |
| Screen | -43% | -22% | -17% | -178% | -49% | |
| Brightness middle (cd/m²) | 356 | 340 -4% | 500 40% | 535 50% | 389.5 9% | 383 8% |
| Brightness (cd/m²) | 358 | 340 -5% | 489 37% | 563 57% | 392 9% | 384 7% |
| Brightness Distribution (%) | 99 | 99 0% | 94 -5% | 91 -8% | 98 -1% | 99 0% |
| Black Level * (cd/m²) | 0.002 | 0.02 | 0.03 | |||
| Colorchecker dE 2000 * | 0.8 | 1.76 -120% | 1.2 -50% | 1 -25% | 4.95 -519% | 1.89 -136% |
| Colorchecker dE 2000 max. * | 1.6 | 3.2 -100% | 2.6 -63% | 2.8 -75% | 8.65 -441% | 3.76 -135% |
| Greyscale dE 2000 * | 0.9 | 1.16 -29% | 1.7 -89% | 1.8 -100% | 2 -122% | 1.26 -40% |
| Gamma | 2.19 100% | 2.43 91% | 2.24 98% | 2.24 98% | 2.27 97% | 2.41 91% |
| CCT | 6590 99% | 6418 101% | 6791 96% | 6337 103% | 6265 104% | 6386 102% |
| Contrast (:1) | 170000 | 25000 | 12767 | |||
| Colorchecker dE 2000 calibrated * | 1.62 | 1.53 | 2.67 | |||
| Total Average (Program / Settings) | -68% /
-53% | -1339% /
-902% | -584% /
-325% | -104% /
-121% | -71% /
-57% |
* ... smaller is better
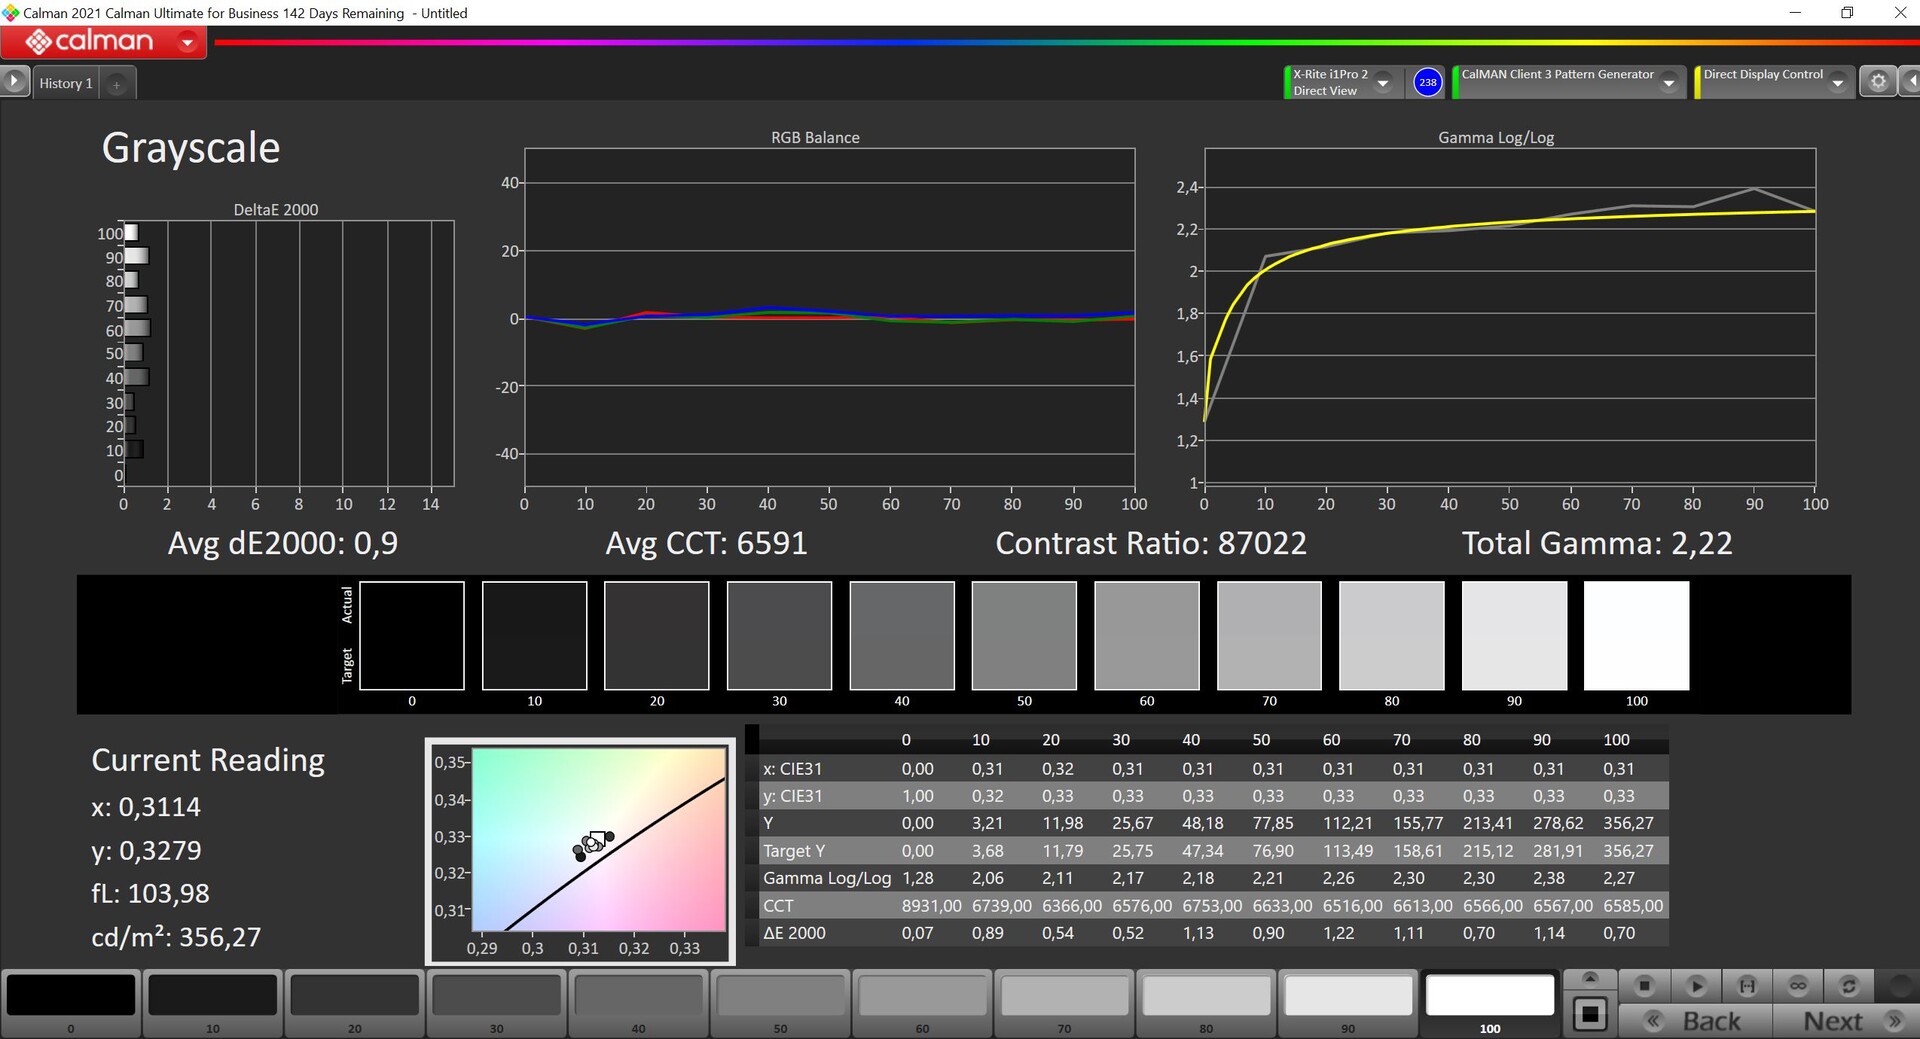
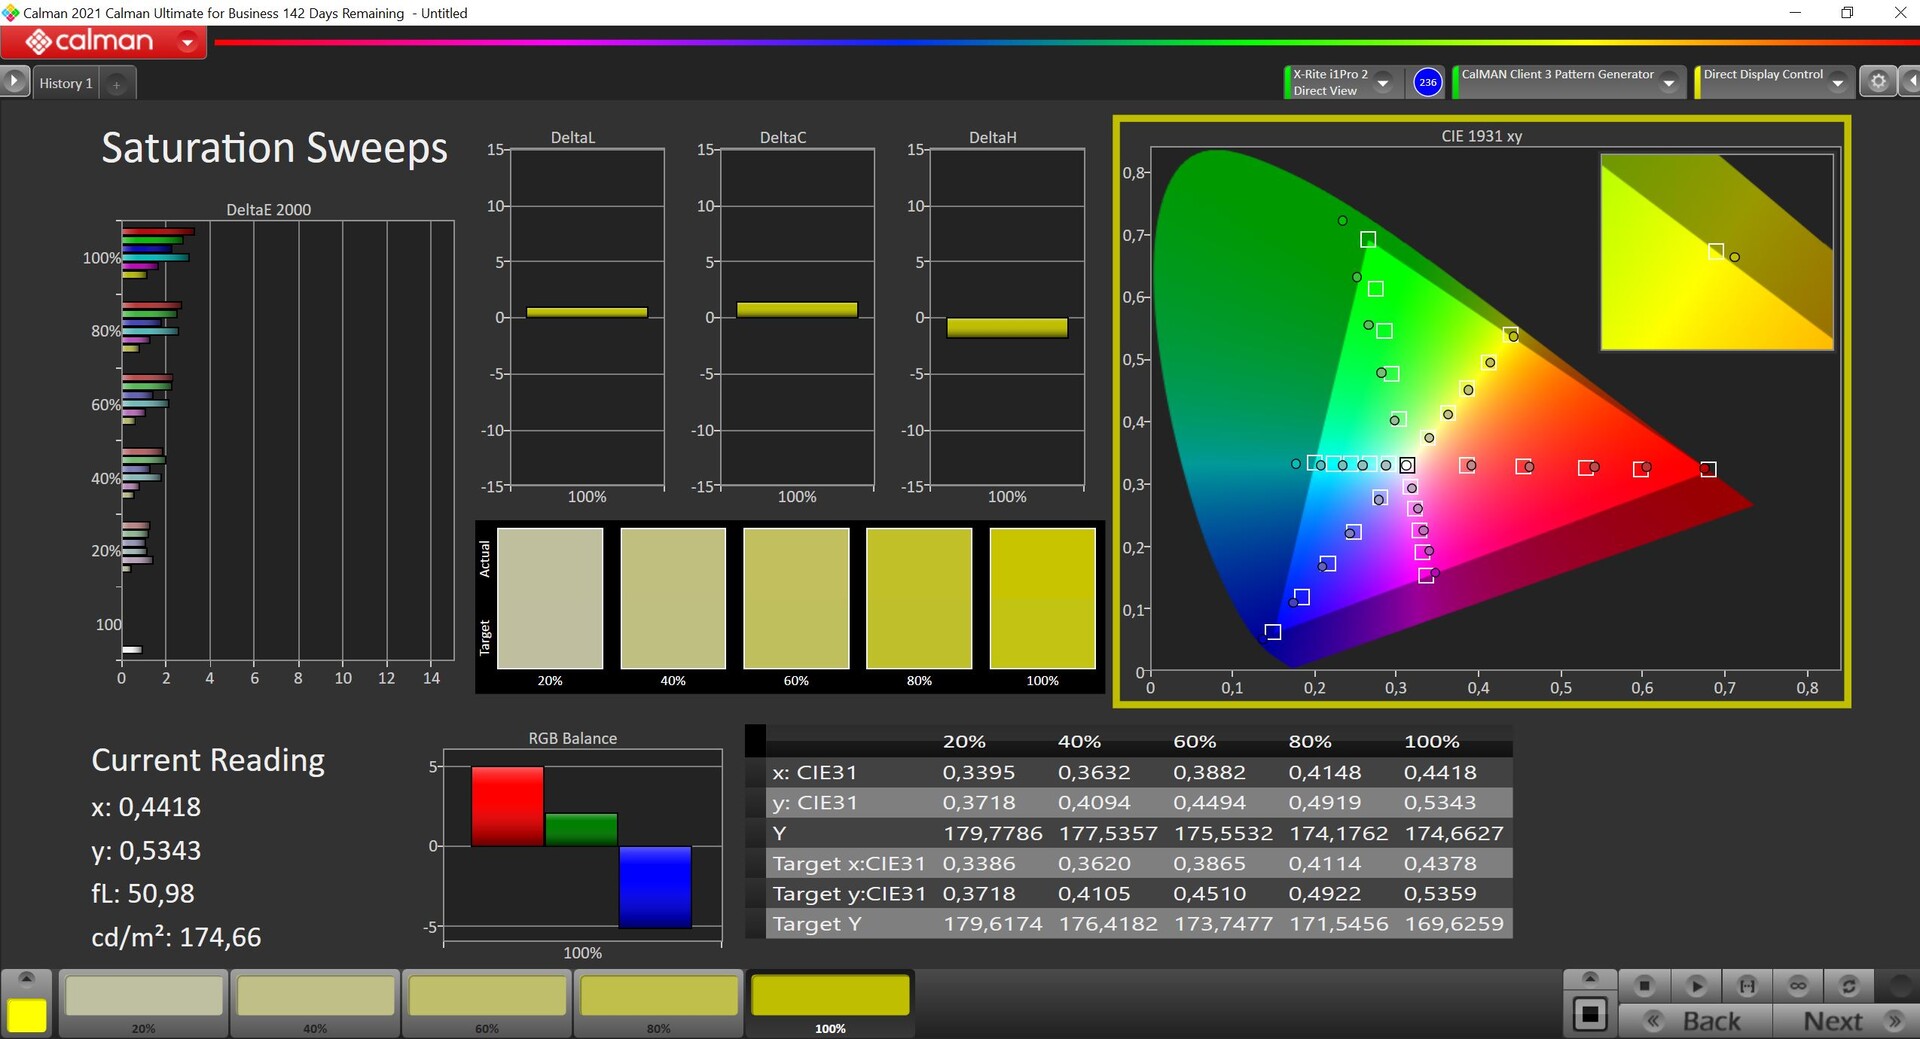
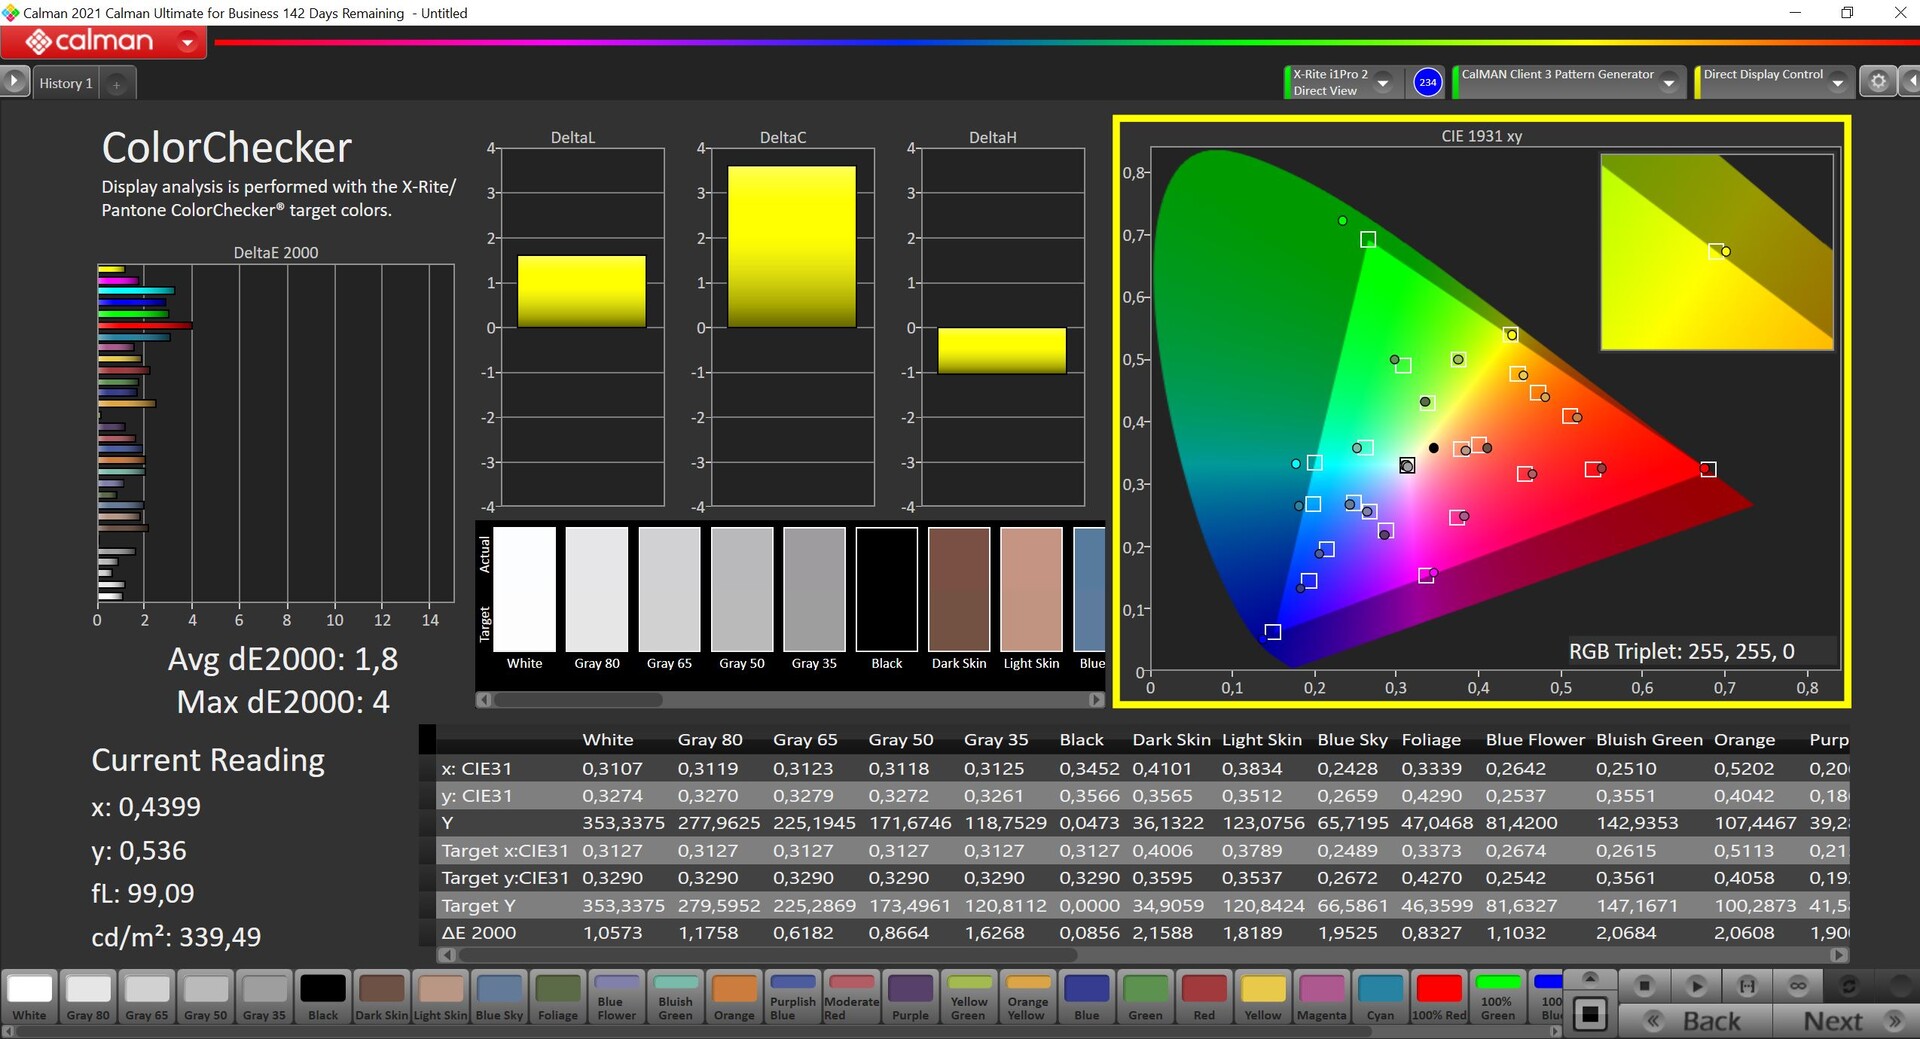

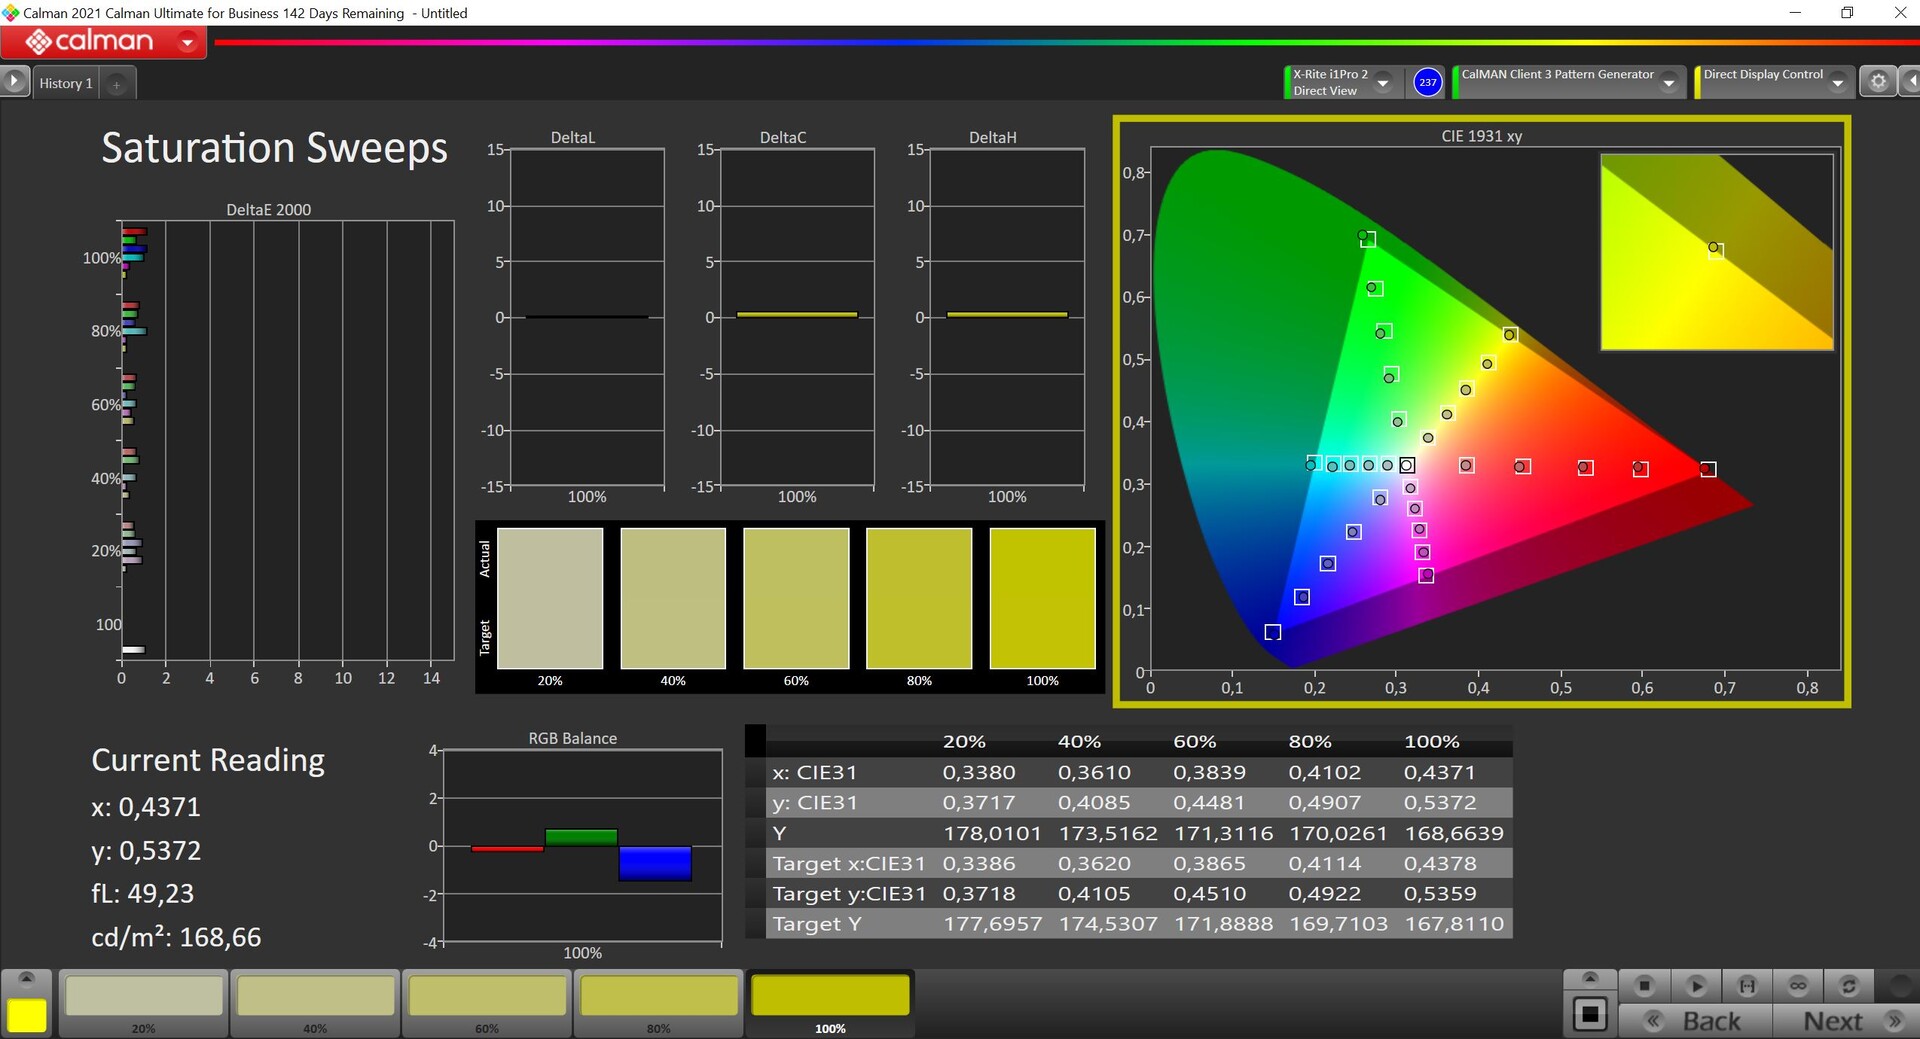
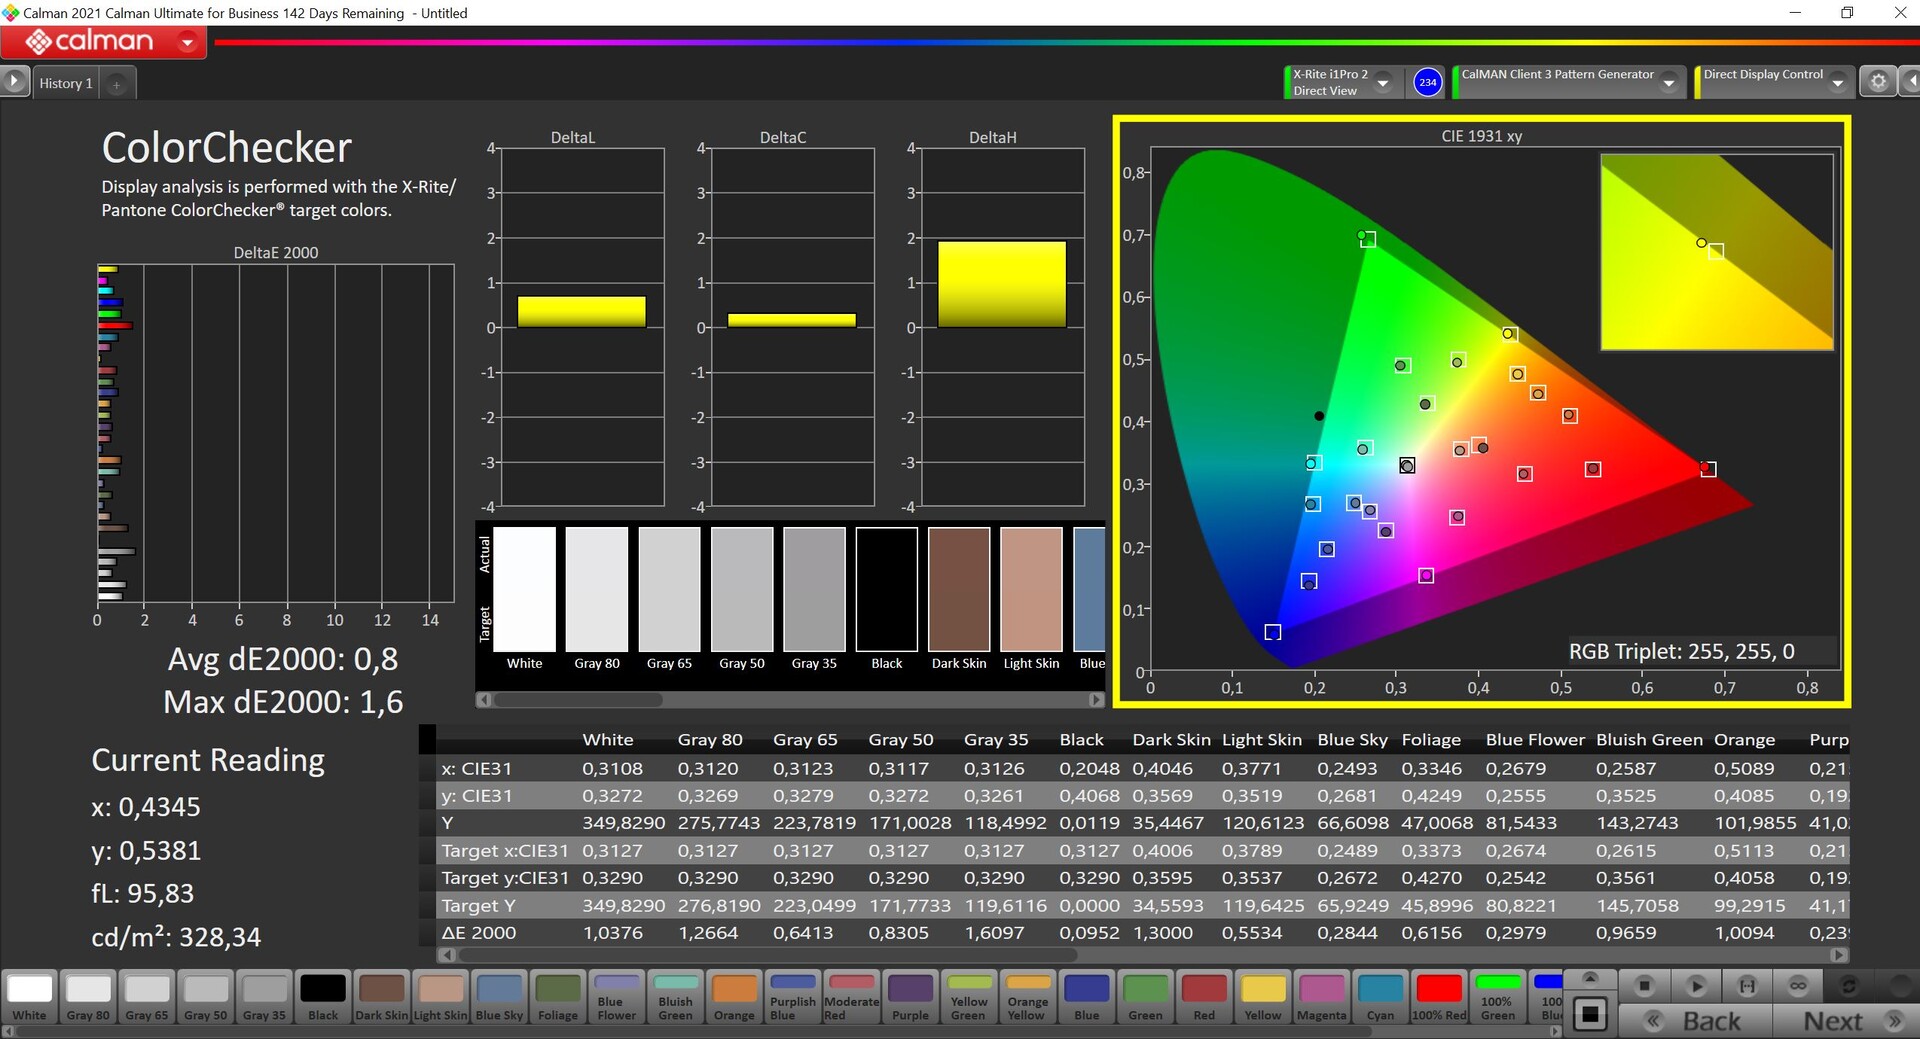
我们用专业的CalMAN软件(即X-Rite i1 Pro 2)测量了OLED面板,使用默认的Native profile以及Display P3。在Native配置文件中,颜色显得有点过饱和,这导致了更加生动的图像质量,但一些颜色超过了3的重要限制。另一方面,Display P3配置文件提供了极其准确的颜色,并允许直接进行图像/视频编辑。我们无法通过自己的校准来进一步改善显示效果,这就是为什么这里没有提供相应的配置文件供下载。我们还提供了一个sRGB配置文件。P3色彩空间已经完全覆盖。
Display Response Times
| ↔ Response Time Black to White | ||
|---|---|---|
| 0.9 ms ... rise ↗ and fall ↘ combined | ↗ 0.4 ms rise | 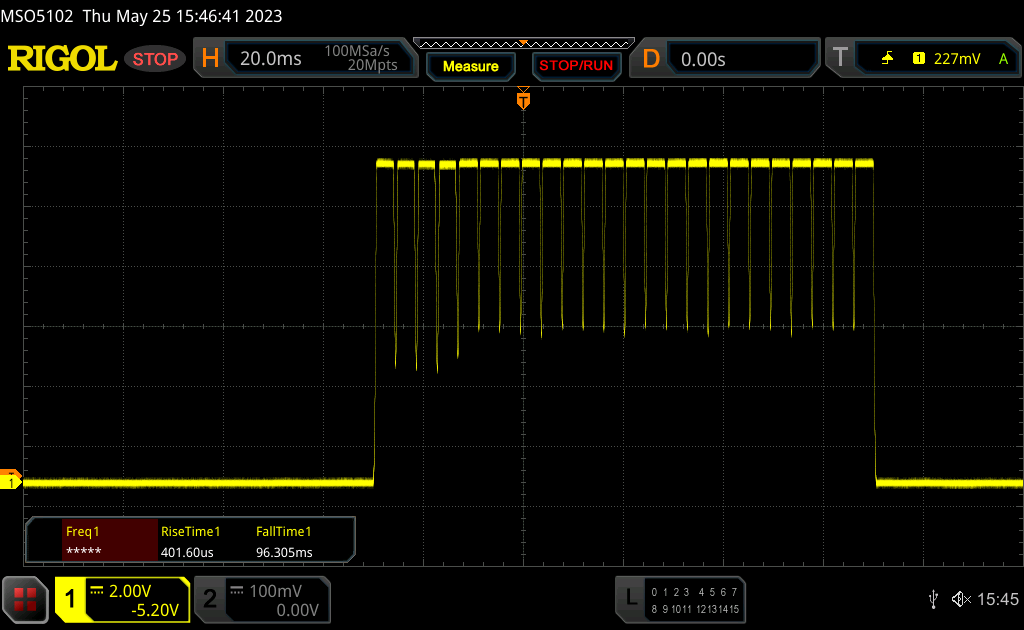 |
| ↘ 0.5 ms fall | ||
| The screen shows very fast response rates in our tests and should be very well suited for fast-paced gaming. In comparison, all tested devices range from 0.1 (minimum) to 240 (maximum) ms. » 3 % of all devices are better. This means that the measured response time is better than the average of all tested devices (19.8 ms). | ||
| ↔ Response Time 50% Grey to 80% Grey | ||
| 0.67 ms ... rise ↗ and fall ↘ combined | ↗ 0.33 ms rise | 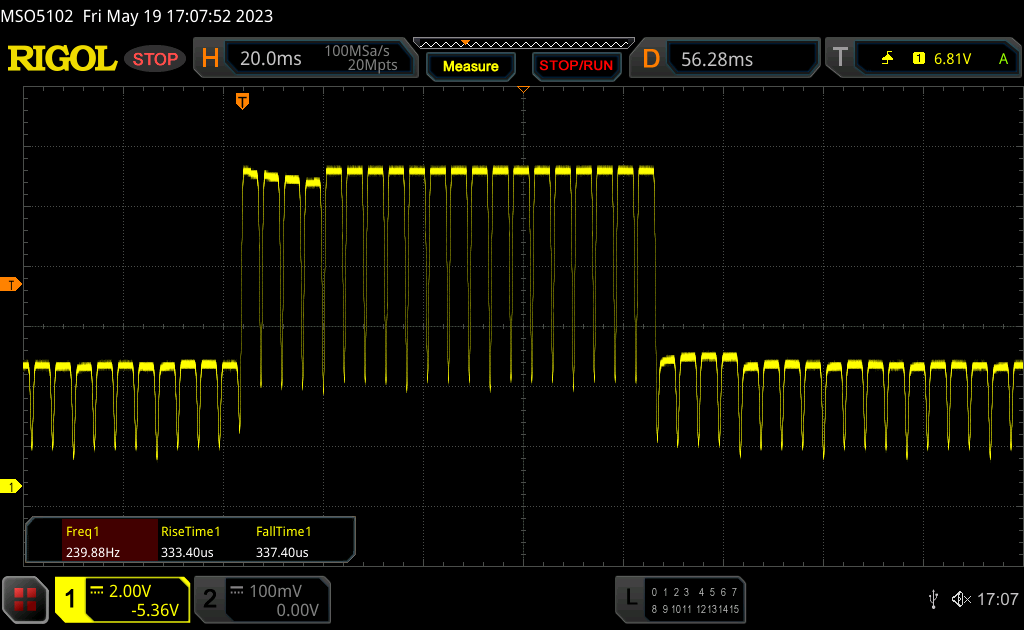 |
| ↘ 0.34 ms fall | ||
| The screen shows very fast response rates in our tests and should be very well suited for fast-paced gaming. In comparison, all tested devices range from 0.165 (minimum) to 636 (maximum) ms. » 2 % of all devices are better. This means that the measured response time is better than the average of all tested devices (31 ms). | ||
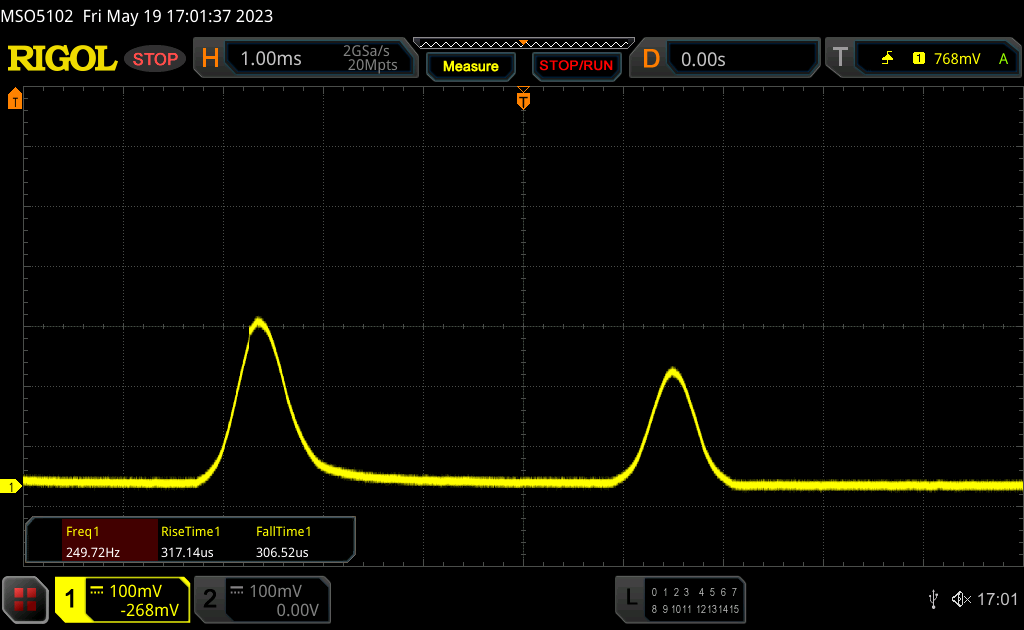
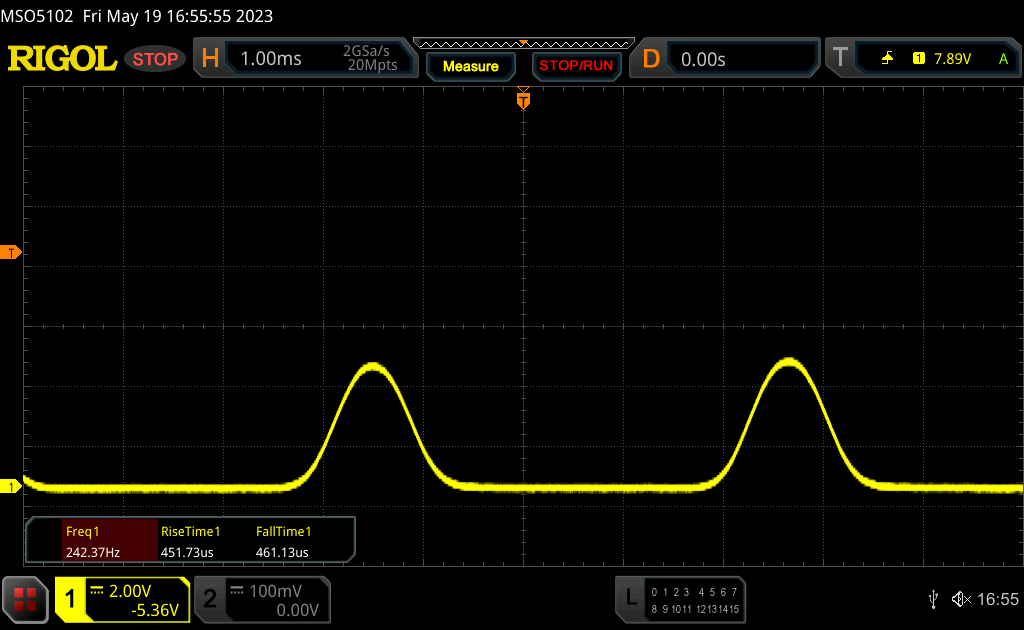
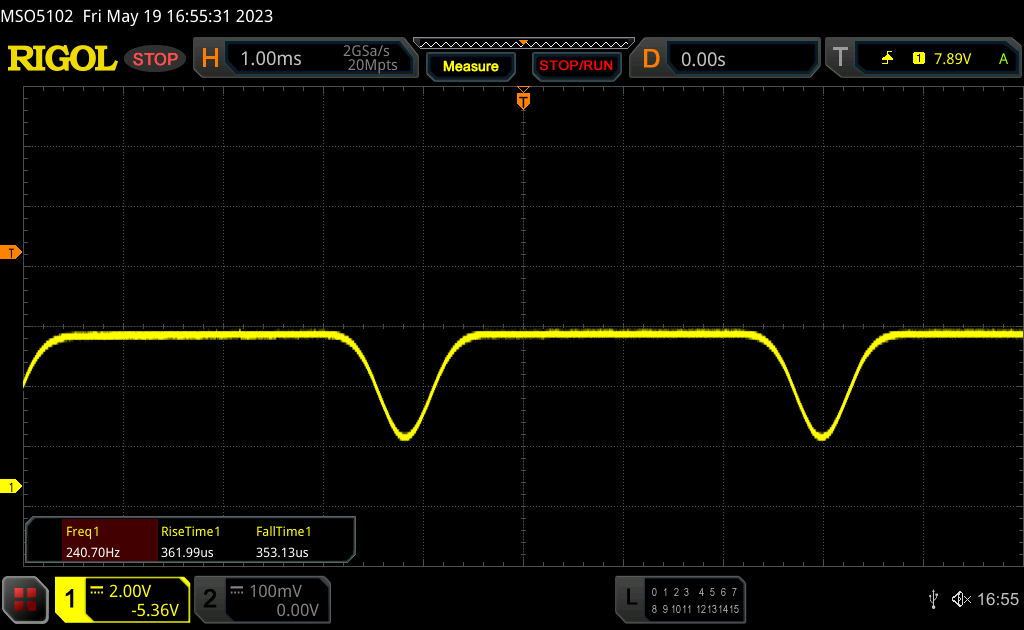
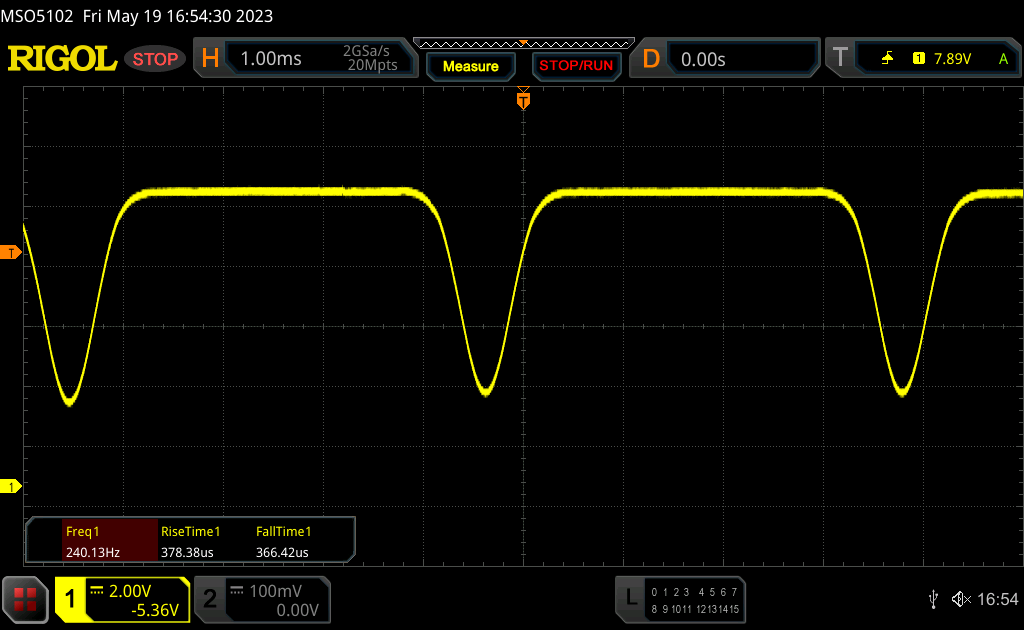
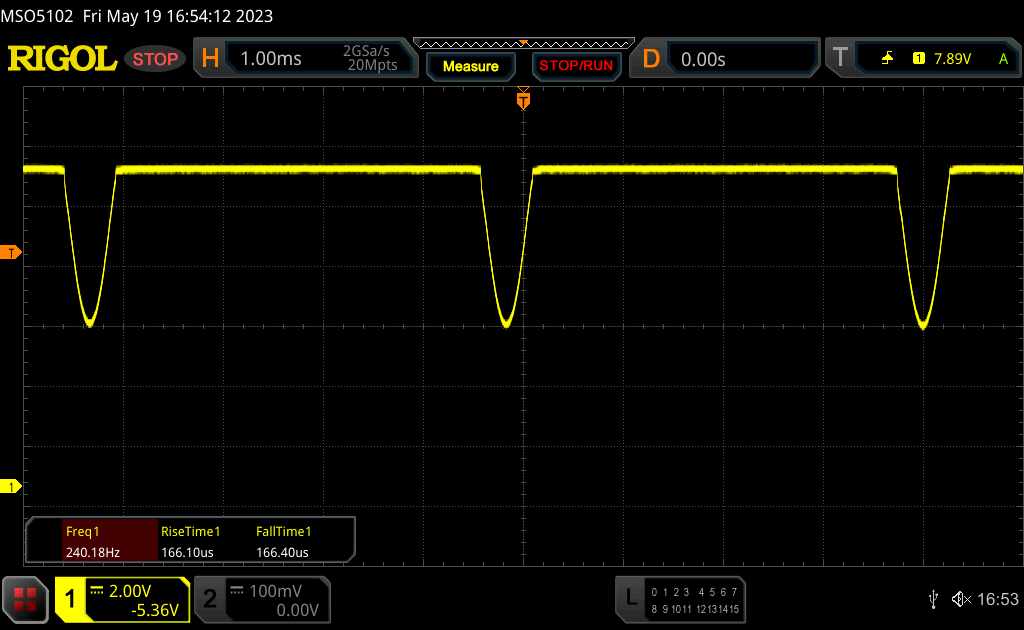
Screen Flickering / PWM (Pulse-Width Modulation)
| Screen flickering / PWM detected | 240 Hz | 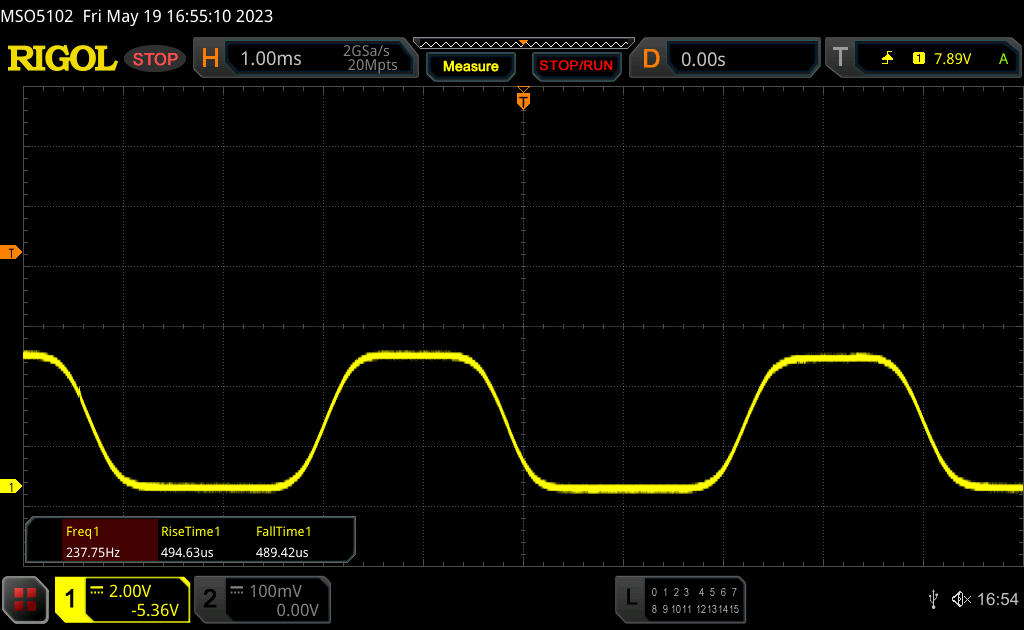 | |
The display backlight flickers at 240 Hz (worst case, e.g., utilizing PWM) . The frequency of 240 Hz is relatively low, so sensitive users will likely notice flickering and experience eyestrain at the stated brightness setting and below. In comparison: 52 % of all tested devices do not use PWM to dim the display. If PWM was detected, an average of 7757 (minimum: 5 - maximum: 343500) Hz was measured. | |||
OLED面板的响应时间非常快,但我们在所有亮度水平上都检测到了PWM闪烁。直流调光被使用到50%的亮度水平,而频率为240赫兹的经典PWM被使用到50%以下。华硕自己建议不要低于这个亮度,而是使用MyAsus软件中的无闪烁OLED调光功能。我们在评论Zenbook S 13 OLED时详细讨论了这一点。笔记本S 13 OLED中详细讨论过,这里的功能也是一样的。
在户外,高反射的触摸屏是有问题的,因为你总是要处理反射问题,即使是在阴天。视角的稳定性总体上是非常好的。只有从某些(广角)角度,你才会注意到蓝色偏光,这是OLED面板的典型特征。

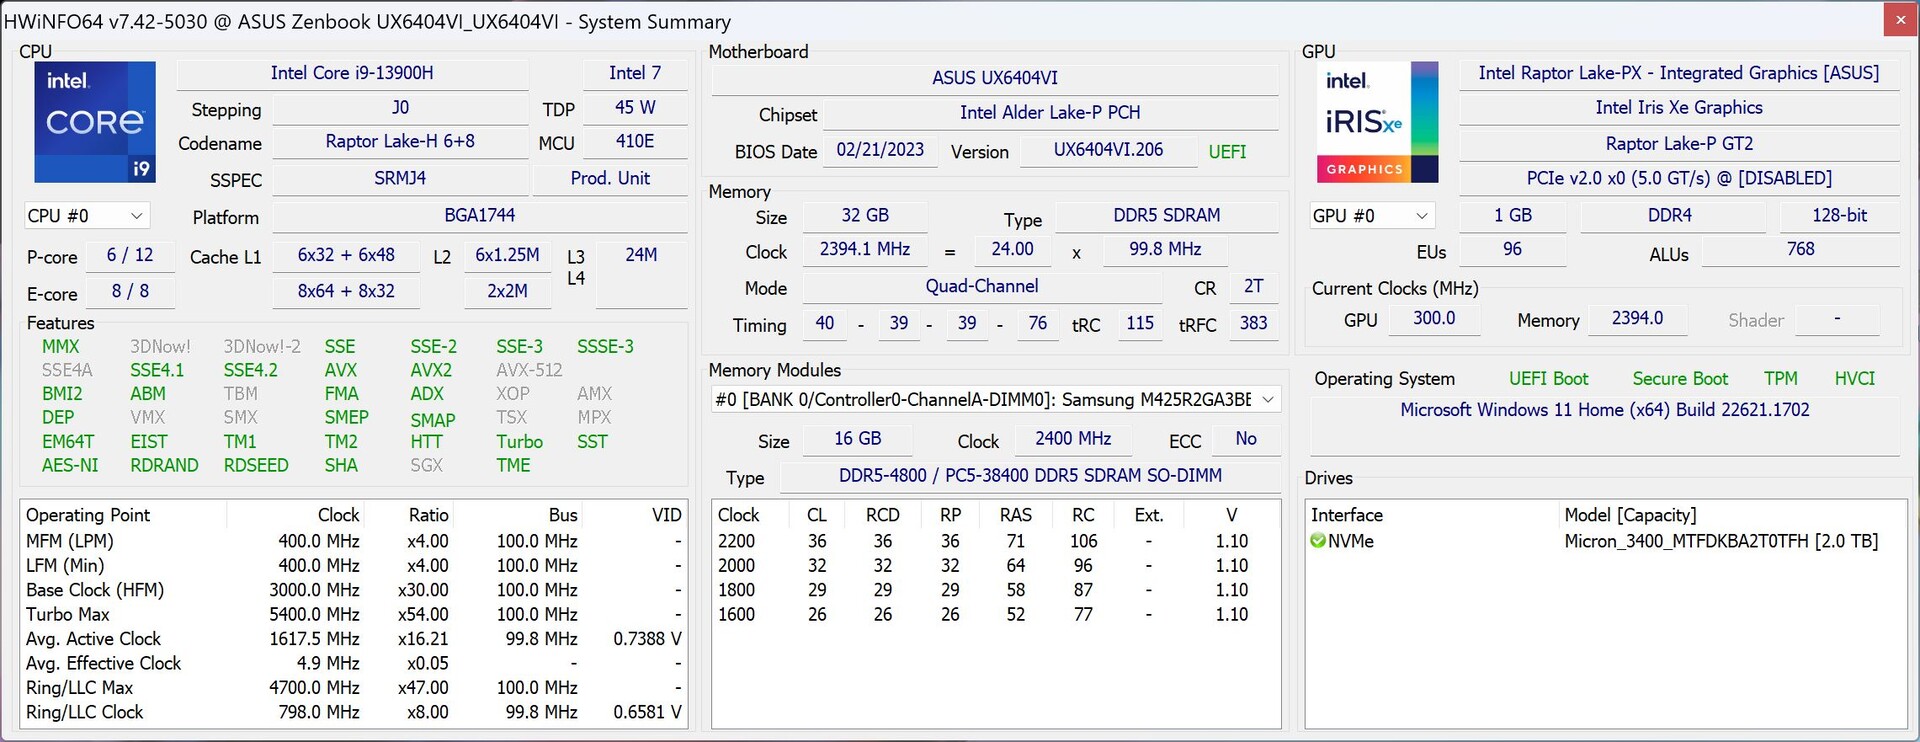
性能 - 酷睿i9和RTX 4070笔记本GPU
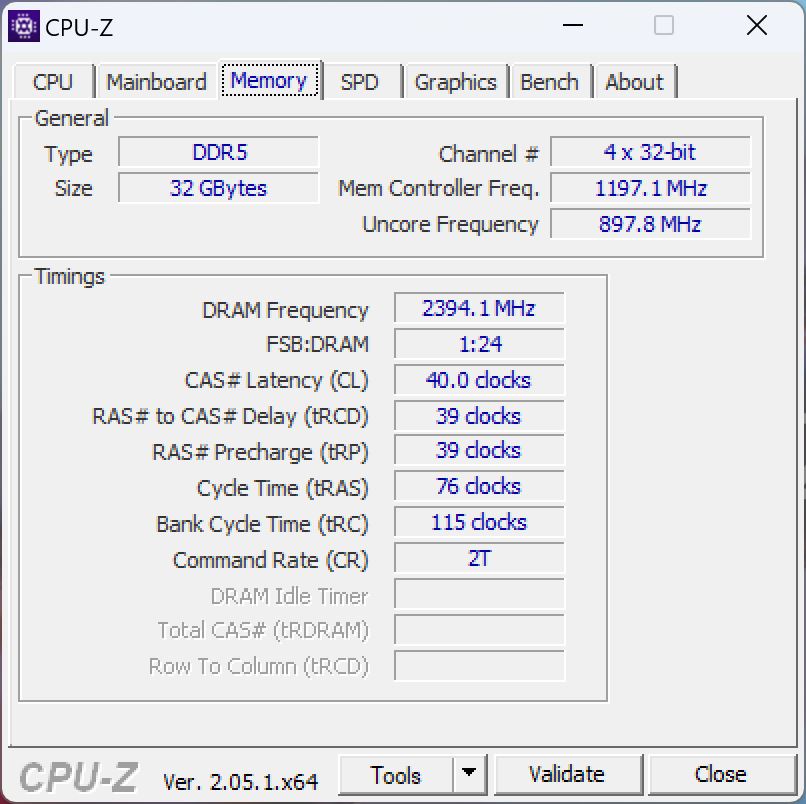
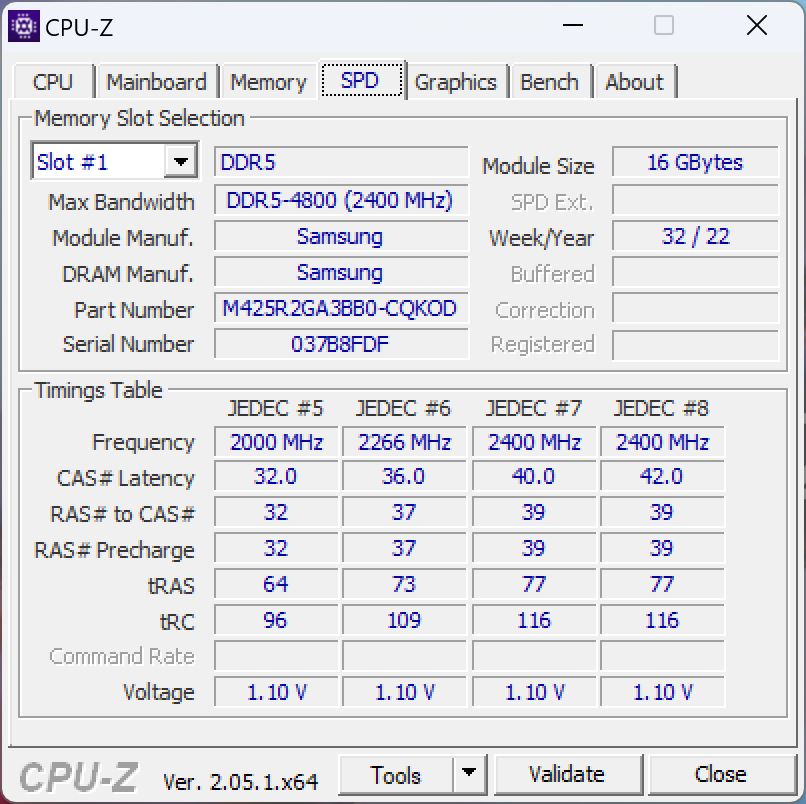
Zenbook Pro 14只配备了英特尔酷睿i9-13900H,并焊接了16GB的RAM。有一个SODIMM插槽,根据型号不同,配备了16或32GB的RAM。至于显卡,你可以选择GeForce RTX 4060 笔记本电脑和 RTX 4070 笔记本电脑、其中后者安装在我们的测试设备中。
测试条件
在MyAsus软件中,有三种不同的性能模式:Whisper、Standard 和Performance。下表显示了这些模式的TDP/TGP值。我们在下面的基准测试和测量中使用了性能 模式,因为特别是GeForce GPU的图形性能,否则会明显降低。然而,在日常生活中,你可以很容易地使用其他两种模式中的一种,没有问题。Zenbook也有一个MUX开关,可以用来完全禁用集成GPU。然而,切换需要重新启动系统。
| 模式 | CPU | GPU | 压力测试 | CB R23 Multi | Time Spy 图像 |
|---|---|---|---|---|---|
| Whisper | 45 watts | 35 watts | CPU: 25 watts GPU:35瓦 |
13.453分 | 7.252分 |
| 标准 | 120 -> 80瓦 | 45瓦 | CPU: 25瓦 GPU:35瓦 |
18.576分 | 8.218分 |
| 性能 | 120 -> 90 瓦 | 90 瓦 | CPU:30瓦 GPU:75瓦 |
19.014分 | 11.398分 |
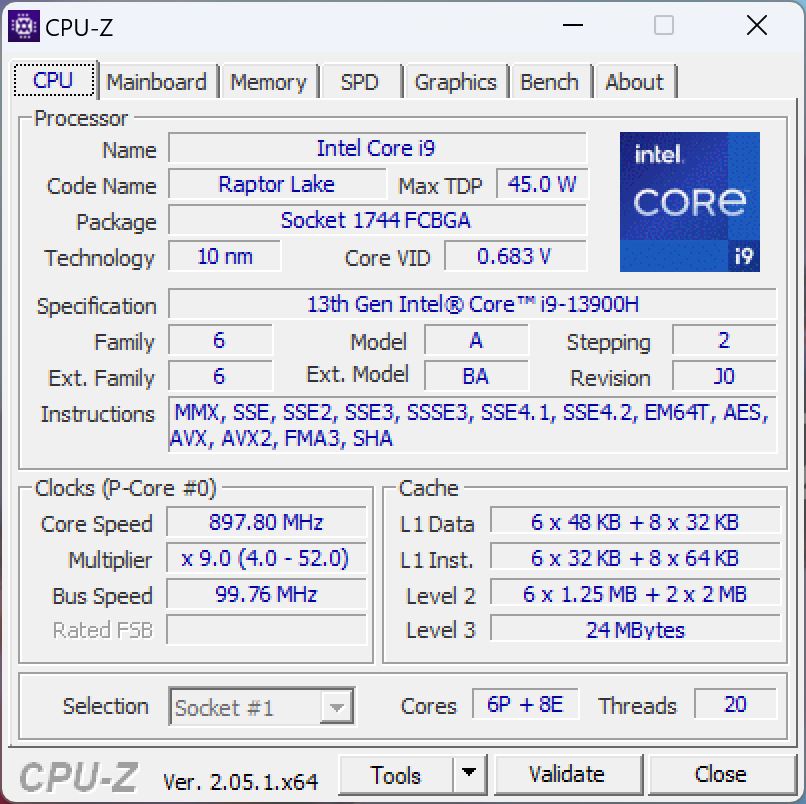
处理器 - 英特尔酷睿i9 13900H
英特尔 酷睿i9-13900H是一款高端移动处理器,拥有6个性能核心和8个效率核心,这就是为什么在任何时候都可以处理总共20个线程。然而,除了稍高的时钟频率之外,与酷睿i9-13900H没有任何区别。 酷睿i9-12900H.由于高功率限制,Zenbook Pro 14的性能非常好,尽管这里也必须说明,英特尔芯片只比新的 AMD Ryzen 9 7940HS80瓦,尽管耗电量明显更高。在我们的CB R15多循环中,i9-13900H在运行几次后下降到90瓦,在这里它也比7940HS慢。
Cinebench R15 Multi Sustained Load
另一方面,性能核心的单核性能仍然非常好:我们看到比目前的优势约为15%。AMD Ryzen 9 7940HS这里。主要竞争对手Apple MacBook Pro 14在原始CPU性能方面显然处于劣势,但34瓦的功耗也明显降低。MacBook还有一个优势,就是在电池模式下性能保持不变。然而,Zenbook的CPU在没有电源的情况下降到了微不足道的30瓦,导致多核测试中的性能损失约为45%。更多的CPU基准测试列在我们的 技术部分.
Cinebench R23: Multi Core | Single Core
Cinebench R20: CPU (Multi Core) | CPU (Single Core)
Cinebench R15: CPU Multi 64Bit | CPU Single 64Bit
Blender: v2.79 BMW27 CPU
7-Zip 18.03: 7z b 4 | 7z b 4 -mmt1
Geekbench 5.5: Multi-Core | Single-Core
HWBOT x265 Benchmark v2.2: 4k Preset
LibreOffice : 20 Documents To PDF
R Benchmark 2.5: Overall mean
| CPU Performance rating | |
| Asus Zenbook Pro 14 OLED UX6404VI | |
| Asus ROG Zephyrus G14 GA402XY | |
| Apple MacBook Pro 14 2023 M2 Pro -6! | |
| Asus ZenBook Pro 14 Duo UX8402VV-P1021W | |
| Average Intel Core i9-13900H | |
| Dell XPS 15 9530 RTX 4070 | |
| Average of class Multimedia | |
| Razer Blade 15 OLED (Early 2022) | |
| Cinebench R23 / Multi Core | |
| Asus Zenbook Pro 14 OLED UX6404VI | |
| Asus ROG Zephyrus G14 GA402XY | |
| Asus ZenBook Pro 14 Duo UX8402VV-P1021W | |
| Average Intel Core i9-13900H (11997 - 20385, n=28) | |
| Average of class Multimedia (4861 - 33362, n=74, last 2 years) | |
| Razer Blade 15 OLED (Early 2022) | |
| Dell XPS 15 9530 RTX 4070 | |
| Apple MacBook Pro 14 2023 M2 Pro | |
| Cinebench R23 / Single Core | |
| Asus Zenbook Pro 14 OLED UX6404VI | |
| Asus ZenBook Pro 14 Duo UX8402VV-P1021W | |
| Average of class Multimedia (1128 - 2459, n=66, last 2 years) | |
| Average Intel Core i9-13900H (1297 - 2054, n=26) | |
| Dell XPS 15 9530 RTX 4070 | |
| Asus ROG Zephyrus G14 GA402XY | |
| Razer Blade 15 OLED (Early 2022) | |
| Apple MacBook Pro 14 2023 M2 Pro | |
| Cinebench R20 / CPU (Multi Core) | |
| Asus Zenbook Pro 14 OLED UX6404VI | |
| Asus ROG Zephyrus G14 GA402XY | |
| Asus ZenBook Pro 14 Duo UX8402VV-P1021W | |
| Average Intel Core i9-13900H (4935 - 7716, n=25) | |
| Average of class Multimedia (1887 - 12912, n=57, last 2 years) | |
| Razer Blade 15 OLED (Early 2022) | |
| Dell XPS 15 9530 RTX 4070 | |
| Apple MacBook Pro 14 2023 M2 Pro | |
| Cinebench R20 / CPU (Single Core) | |
| Asus Zenbook Pro 14 OLED UX6404VI | |
| Asus ZenBook Pro 14 Duo UX8402VV-P1021W | |
| Average of class Multimedia (425 - 853, n=57, last 2 years) | |
| Average Intel Core i9-13900H (428 - 792, n=25) | |
| Asus ROG Zephyrus G14 GA402XY | |
| Dell XPS 15 9530 RTX 4070 | |
| Razer Blade 15 OLED (Early 2022) | |
| Apple MacBook Pro 14 2023 M2 Pro | |
| Cinebench R15 / CPU Multi 64Bit | |
| Asus Zenbook Pro 14 OLED UX6404VI | |
| Asus ROG Zephyrus G14 GA402XY | |
| Asus ZenBook Pro 14 Duo UX8402VV-P1021W | |
| Average Intel Core i9-13900H (2061 - 3100, n=26) | |
| Dell XPS 15 9530 RTX 4070 | |
| Average of class Multimedia (856 - 5224, n=61, last 2 years) | |
| Razer Blade 15 OLED (Early 2022) | |
| Apple MacBook Pro 14 2023 M2 Pro | |
| Cinebench R15 / CPU Single 64Bit | |
| Asus Zenbook Pro 14 OLED UX6404VI | |
| Asus ZenBook Pro 14 Duo UX8402VV-P1021W | |
| Asus ROG Zephyrus G14 GA402XY | |
| Average of class Multimedia (184.8 - 326, n=59, last 2 years) | |
| Dell XPS 15 9530 RTX 4070 | |
| Average Intel Core i9-13900H (211 - 297, n=26) | |
| Razer Blade 15 OLED (Early 2022) | |
| Apple MacBook Pro 14 2023 M2 Pro | |
| Blender / v2.79 BMW27 CPU | |
| Average of class Multimedia (100 - 557, n=58, last 2 years) | |
| Razer Blade 15 OLED (Early 2022) | |
| Dell XPS 15 9530 RTX 4070 | |
| Average Intel Core i9-13900H (166 - 268, n=24) | |
| Asus ZenBook Pro 14 Duo UX8402VV-P1021W | |
| Asus ROG Zephyrus G14 GA402XY | |
| Asus Zenbook Pro 14 OLED UX6404VI | |
| 7-Zip 18.03 / 7z b 4 | |
| Asus Zenbook Pro 14 OLED UX6404VI | |
| Asus ROG Zephyrus G14 GA402XY | |
| Asus ZenBook Pro 14 Duo UX8402VV-P1021W | |
| Average Intel Core i9-13900H (45045 - 79032, n=25) | |
| Razer Blade 15 OLED (Early 2022) | |
| Dell XPS 15 9530 RTX 4070 | |
| Average of class Multimedia (26062 - 130368, n=55, last 2 years) | |
| 7-Zip 18.03 / 7z b 4 -mmt1 | |
| Asus ROG Zephyrus G14 GA402XY | |
| Asus Zenbook Pro 14 OLED UX6404VI | |
| Asus ZenBook Pro 14 Duo UX8402VV-P1021W | |
| Dell XPS 15 9530 RTX 4070 | |
| Average Intel Core i9-13900H (3665 - 6600, n=25) | |
| Average of class Multimedia (3666 - 7545, n=56, last 2 years) | |
| Razer Blade 15 OLED (Early 2022) | |
| Geekbench 5.5 / Multi-Core | |
| Apple MacBook Pro 14 2023 M2 Pro | |
| Asus Zenbook Pro 14 OLED UX6404VI | |
| Dell XPS 15 9530 RTX 4070 | |
| Average of class Multimedia (4652 - 20422, n=56, last 2 years) | |
| Asus ZenBook Pro 14 Duo UX8402VV-P1021W | |
| Average Intel Core i9-13900H (9094 - 15410, n=26) | |
| Razer Blade 15 OLED (Early 2022) | |
| Asus ROG Zephyrus G14 GA402XY | |
| Geekbench 5.5 / Single-Core | |
| Asus ROG Zephyrus G14 GA402XY | |
| Asus Zenbook Pro 14 OLED UX6404VI | |
| Average of class Multimedia (805 - 2974, n=56, last 2 years) | |
| Apple MacBook Pro 14 2023 M2 Pro | |
| Asus ZenBook Pro 14 Duo UX8402VV-P1021W | |
| Dell XPS 15 9530 RTX 4070 | |
| Average Intel Core i9-13900H (1140 - 2043, n=26) | |
| Razer Blade 15 OLED (Early 2022) | |
| HWBOT x265 Benchmark v2.2 / 4k Preset | |
| Asus ROG Zephyrus G14 GA402XY | |
| Asus Zenbook Pro 14 OLED UX6404VI | |
| Average of class Multimedia (5.26 - 36.1, n=56, last 2 years) | |
| Average Intel Core i9-13900H (14.1 - 22.3, n=25) | |
| Asus ZenBook Pro 14 Duo UX8402VV-P1021W | |
| Dell XPS 15 9530 RTX 4070 | |
| Razer Blade 15 OLED (Early 2022) | |
| LibreOffice / 20 Documents To PDF | |
| Razer Blade 15 OLED (Early 2022) | |
| Average of class Multimedia (23.9 - 146.7, n=57, last 2 years) | |
| Average Intel Core i9-13900H (34.4 - 82.8, n=25) | |
| Asus Zenbook Pro 14 OLED UX6404VI | |
| Dell XPS 15 9530 RTX 4070 | |
| Asus ZenBook Pro 14 Duo UX8402VV-P1021W | |
| Asus ROG Zephyrus G14 GA402XY | |
| R Benchmark 2.5 / Overall mean | |
| Razer Blade 15 OLED (Early 2022) | |
| Average of class Multimedia (0.3604 - 0.947, n=56, last 2 years) | |
| Average Intel Core i9-13900H (0.4052 - 0.723, n=25) | |
| Asus ZenBook Pro 14 Duo UX8402VV-P1021W | |
| Dell XPS 15 9530 RTX 4070 | |
| Asus ROG Zephyrus G14 GA402XY | |
| Asus Zenbook Pro 14 OLED UX6404VI | |
* ... smaller is better
AIDA64: FP32 Ray-Trace | FPU Julia | CPU SHA3 | CPU Queen | FPU SinJulia | FPU Mandel | CPU AES | CPU ZLib | FP64 Ray-Trace | CPU PhotoWorxx
| Performance rating | |
| Asus Zenbook Pro 14 OLED UX6404VI | |
| Average of class Multimedia | |
| Average Intel Core i9-13900H | |
| Razer Blade 15 OLED (Early 2022) | |
| Asus ZenBook Pro 14 Duo UX8402VV-P1021W | |
| Dell XPS 15 9530 RTX 4070 | |
| AIDA64 / FP32 Ray-Trace | |
| Average of class Multimedia (2214 - 50388, n=53, last 2 years) | |
| Asus Zenbook Pro 14 OLED UX6404VI | |
| Average Intel Core i9-13900H (6788 - 19557, n=25) | |
| Asus ZenBook Pro 14 Duo UX8402VV-P1021W | |
| Dell XPS 15 9530 RTX 4070 | |
| Razer Blade 15 OLED (Early 2022) | |
| AIDA64 / FPU Julia | |
| Asus Zenbook Pro 14 OLED UX6404VI | |
| Average of class Multimedia (12867 - 201874, n=54, last 2 years) | |
| Average Intel Core i9-13900H (22551 - 95579, n=25) | |
| Razer Blade 15 OLED (Early 2022) | |
| Asus ZenBook Pro 14 Duo UX8402VV-P1021W | |
| Dell XPS 15 9530 RTX 4070 | |
| AIDA64 / CPU SHA3 | |
| Asus Zenbook Pro 14 OLED UX6404VI | |
| Average of class Multimedia (626 - 8623, n=54, last 2 years) | |
| Average Intel Core i9-13900H (2491 - 4270, n=25) | |
| Razer Blade 15 OLED (Early 2022) | |
| Asus ZenBook Pro 14 Duo UX8402VV-P1021W | |
| Dell XPS 15 9530 RTX 4070 | |
| AIDA64 / CPU Queen | |
| Asus Zenbook Pro 14 OLED UX6404VI | |
| Asus ZenBook Pro 14 Duo UX8402VV-P1021W | |
| Razer Blade 15 OLED (Early 2022) | |
| Average Intel Core i9-13900H (65121 - 120936, n=25) | |
| Dell XPS 15 9530 RTX 4070 | |
| Average of class Multimedia (13483 - 181505, n=41, last 2 years) | |
| AIDA64 / FPU SinJulia | |
| Asus Zenbook Pro 14 OLED UX6404VI | |
| Razer Blade 15 OLED (Early 2022) | |
| Average Intel Core i9-13900H (6108 - 11631, n=25) | |
| Asus ZenBook Pro 14 Duo UX8402VV-P1021W | |
| Average of class Multimedia (886 - 28794, n=54, last 2 years) | |
| Dell XPS 15 9530 RTX 4070 | |
| AIDA64 / FPU Mandel | |
| Average of class Multimedia (6395 - 105740, n=53, last 2 years) | |
| Asus Zenbook Pro 14 OLED UX6404VI | |
| Average Intel Core i9-13900H (11283 - 48474, n=25) | |
| Asus ZenBook Pro 14 Duo UX8402VV-P1021W | |
| Razer Blade 15 OLED (Early 2022) | |
| Dell XPS 15 9530 RTX 4070 | |
| AIDA64 / CPU AES | |
| Razer Blade 15 OLED (Early 2022) | |
| Average Intel Core i9-13900H (3691 - 149377, n=25) | |
| Asus Zenbook Pro 14 OLED UX6404VI | |
| Average of class Multimedia (8171 - 126790, n=54, last 2 years) | |
| Asus ZenBook Pro 14 Duo UX8402VV-P1021W | |
| Dell XPS 15 9530 RTX 4070 | |
| AIDA64 / CPU ZLib | |
| Asus Zenbook Pro 14 OLED UX6404VI | |
| Razer Blade 15 OLED (Early 2022) | |
| Average Intel Core i9-13900H (789 - 1254, n=25) | |
| Average of class Multimedia (143.8 - 2022, n=54, last 2 years) | |
| Dell XPS 15 9530 RTX 4070 | |
| Asus ZenBook Pro 14 Duo UX8402VV-P1021W | |
| AIDA64 / FP64 Ray-Trace | |
| Average of class Multimedia (1014 - 26875, n=54, last 2 years) | |
| Asus Zenbook Pro 14 OLED UX6404VI | |
| Average Intel Core i9-13900H (3655 - 10716, n=25) | |
| Asus ZenBook Pro 14 Duo UX8402VV-P1021W | |
| Dell XPS 15 9530 RTX 4070 | |
| Razer Blade 15 OLED (Early 2022) | |
| AIDA64 / CPU PhotoWorxx | |
| Average of class Multimedia (8187 - 88154, n=54, last 2 years) | |
| Dell XPS 15 9530 RTX 4070 | |
| Asus Zenbook Pro 14 OLED UX6404VI | |
| Asus ZenBook Pro 14 Duo UX8402VV-P1021W | |
| Average Intel Core i9-13900H (10871 - 50488, n=25) | |
| Razer Blade 15 OLED (Early 2022) | |
| Razer Blade 15 OLED (Early 2022) | |
系统性能
系统性能非常好,良好的基准测试结果和我们主观的性能印象都证实了这一点。在测试过程中,我们没有遇到Zenbook Pro的问题。
CrossMark: Overall | Productivity | Creativity | Responsiveness
| PCMark 10 / Score | |
| Asus ROG Zephyrus G14 GA402XY | |
| Average of class Multimedia (4325 - 10386, n=52, last 2 years) | |
| Average Intel Core i9-13900H, NVIDIA GeForce RTX 4070 Laptop GPU (5855 - 8538, n=8) | |
| Asus ZenBook Pro 14 Duo UX8402VV-P1021W | |
| Asus Zenbook Pro 14 OLED UX6404VI | |
| Razer Blade 15 OLED (Early 2022) | |
| Dell XPS 15 9530 RTX 4070 | |
| PCMark 10 / Essentials | |
| Dell XPS 15 9530 RTX 4070 | |
| Asus ZenBook Pro 14 Duo UX8402VV-P1021W | |
| Asus Zenbook Pro 14 OLED UX6404VI | |
| Average Intel Core i9-13900H, NVIDIA GeForce RTX 4070 Laptop GPU (8835 - 11940, n=8) | |
| Asus ROG Zephyrus G14 GA402XY | |
| Average of class Multimedia (8025 - 11664, n=51, last 2 years) | |
| Razer Blade 15 OLED (Early 2022) | |
| PCMark 10 / Productivity | |
| Average of class Multimedia (7323 - 18233, n=51, last 2 years) | |
| Asus ROG Zephyrus G14 GA402XY | |
| Razer Blade 15 OLED (Early 2022) | |
| Asus ZenBook Pro 14 Duo UX8402VV-P1021W | |
| Average Intel Core i9-13900H, NVIDIA GeForce RTX 4070 Laptop GPU (7967 - 10991, n=8) | |
| Asus Zenbook Pro 14 OLED UX6404VI | |
| Dell XPS 15 9530 RTX 4070 | |
| PCMark 10 / Digital Content Creation | |
| Asus ROG Zephyrus G14 GA402XY | |
| Average Intel Core i9-13900H, NVIDIA GeForce RTX 4070 Laptop GPU (7738 - 13575, n=8) | |
| Asus Zenbook Pro 14 OLED UX6404VI | |
| Dell XPS 15 9530 RTX 4070 | |
| Asus ZenBook Pro 14 Duo UX8402VV-P1021W | |
| Average of class Multimedia (3651 - 16240, n=51, last 2 years) | |
| Razer Blade 15 OLED (Early 2022) | |
| CrossMark / Overall | |
| Asus Zenbook Pro 14 OLED UX6404VI | |
| Dell XPS 15 9530 RTX 4070 | |
| Average of class Multimedia (866 - 2728, n=60, last 2 years) | |
| Asus ZenBook Pro 14 Duo UX8402VV-P1021W | |
| Asus ROG Zephyrus G14 GA402XY | |
| Average Intel Core i9-13900H, NVIDIA GeForce RTX 4070 Laptop GPU (1104 - 1974, n=7) | |
| Apple MacBook Pro 14 2023 M2 Pro | |
| Razer Blade 15 OLED (Early 2022) | |
| CrossMark / Productivity | |
| Asus Zenbook Pro 14 OLED UX6404VI | |
| Asus ZenBook Pro 14 Duo UX8402VV-P1021W | |
| Average of class Multimedia (931 - 2489, n=60, last 2 years) | |
| Asus ROG Zephyrus G14 GA402XY | |
| Dell XPS 15 9530 RTX 4070 | |
| Average Intel Core i9-13900H, NVIDIA GeForce RTX 4070 Laptop GPU (1058 - 1914, n=7) | |
| Razer Blade 15 OLED (Early 2022) | |
| Apple MacBook Pro 14 2023 M2 Pro | |
| CrossMark / Creativity | |
| Apple MacBook Pro 14 2023 M2 Pro | |
| Asus Zenbook Pro 14 OLED UX6404VI | |
| Average of class Multimedia (907 - 3465, n=60, last 2 years) | |
| Dell XPS 15 9530 RTX 4070 | |
| Asus ZenBook Pro 14 Duo UX8402VV-P1021W | |
| Asus ROG Zephyrus G14 GA402XY | |
| Average Intel Core i9-13900H, NVIDIA GeForce RTX 4070 Laptop GPU (1178 - 2254, n=7) | |
| Razer Blade 15 OLED (Early 2022) | |
| CrossMark / Responsiveness | |
| Average Intel Core i9-13900H, NVIDIA GeForce RTX 4070 Laptop GPU (1037 - 1952, n=7) | |
| Dell XPS 15 9530 RTX 4070 | |
| Asus Zenbook Pro 14 OLED UX6404VI | |
| Razer Blade 15 OLED (Early 2022) | |
| Asus ZenBook Pro 14 Duo UX8402VV-P1021W | |
| Average of class Multimedia (605 - 2024, n=60, last 2 years) | |
| Asus ROG Zephyrus G14 GA402XY | |
| Apple MacBook Pro 14 2023 M2 Pro | |
| PCMark 10 Score | 7534 points | |
Help | ||
| AIDA64 / Memory Copy | |
| Average of class Multimedia (11299 - 132135, n=54, last 2 years) | |
| Dell XPS 15 9530 RTX 4070 | |
| Asus Zenbook Pro 14 OLED UX6404VI | |
| Average Intel Core i9-13900H (37448 - 74486, n=25) | |
| Asus ZenBook Pro 14 Duo UX8402VV-P1021W | |
| Razer Blade 15 OLED (Early 2022) | |
| AIDA64 / Memory Read | |
| Average of class Multimedia (11624 - 174586, n=54, last 2 years) | |
| Dell XPS 15 9530 RTX 4070 | |
| Asus Zenbook Pro 14 OLED UX6404VI | |
| Average Intel Core i9-13900H (41599 - 75433, n=25) | |
| Razer Blade 15 OLED (Early 2022) | |
| Asus ZenBook Pro 14 Duo UX8402VV-P1021W | |
| AIDA64 / Memory Write | |
| Average of class Multimedia (11755 - 134998, n=54, last 2 years) | |
| Asus ZenBook Pro 14 Duo UX8402VV-P1021W | |
| Dell XPS 15 9530 RTX 4070 | |
| Average Intel Core i9-13900H (36152 - 88505, n=25) | |
| Asus Zenbook Pro 14 OLED UX6404VI | |
| Razer Blade 15 OLED (Early 2022) | |
| AIDA64 / Memory Latency | |
| Average of class Multimedia (7 - 535, n=53, last 2 years) | |
| Razer Blade 15 OLED (Early 2022) | |
| Asus ZenBook Pro 14 Duo UX8402VV-P1021W | |
| Average Intel Core i9-13900H (75.8 - 102.3, n=25) | |
| Dell XPS 15 9530 RTX 4070 | |
| Asus Zenbook Pro 14 OLED UX6404VI | |
* ... smaller is better
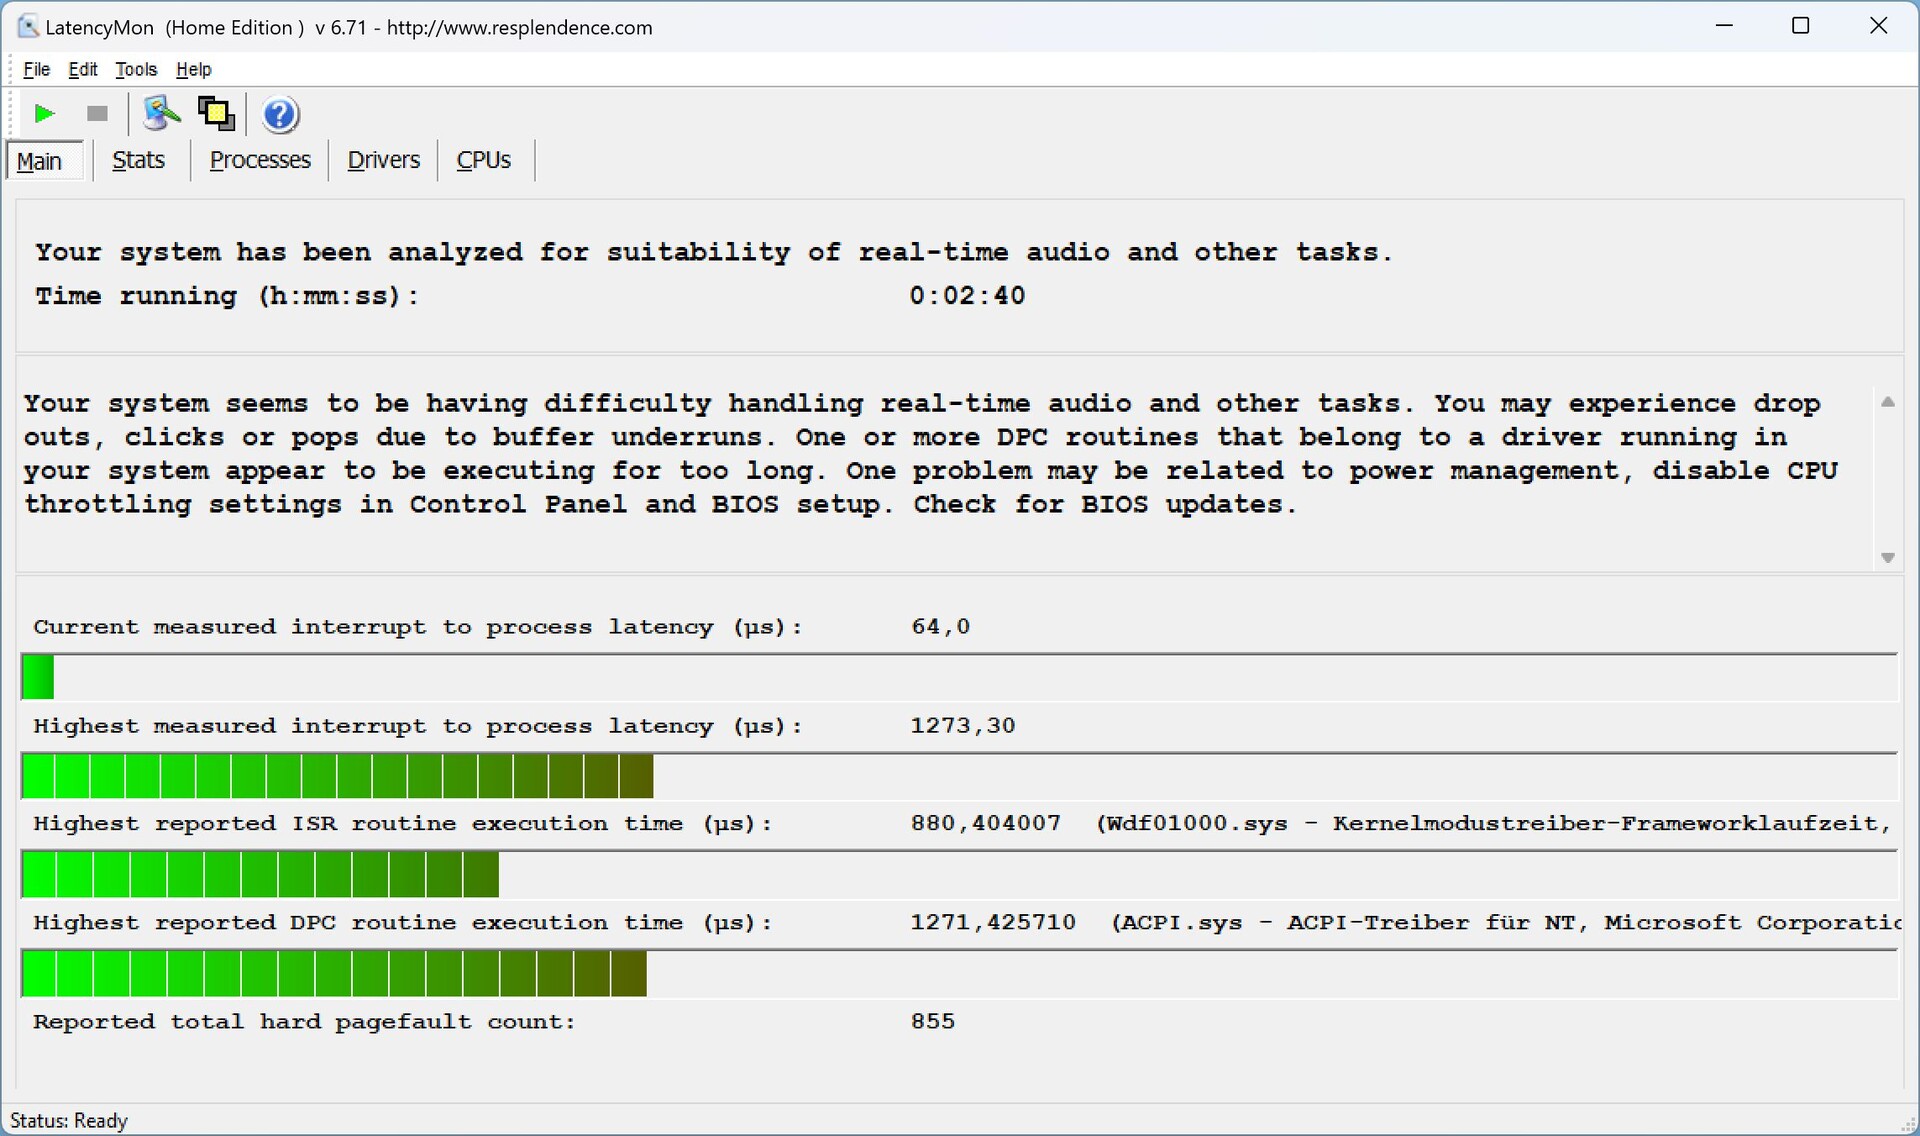
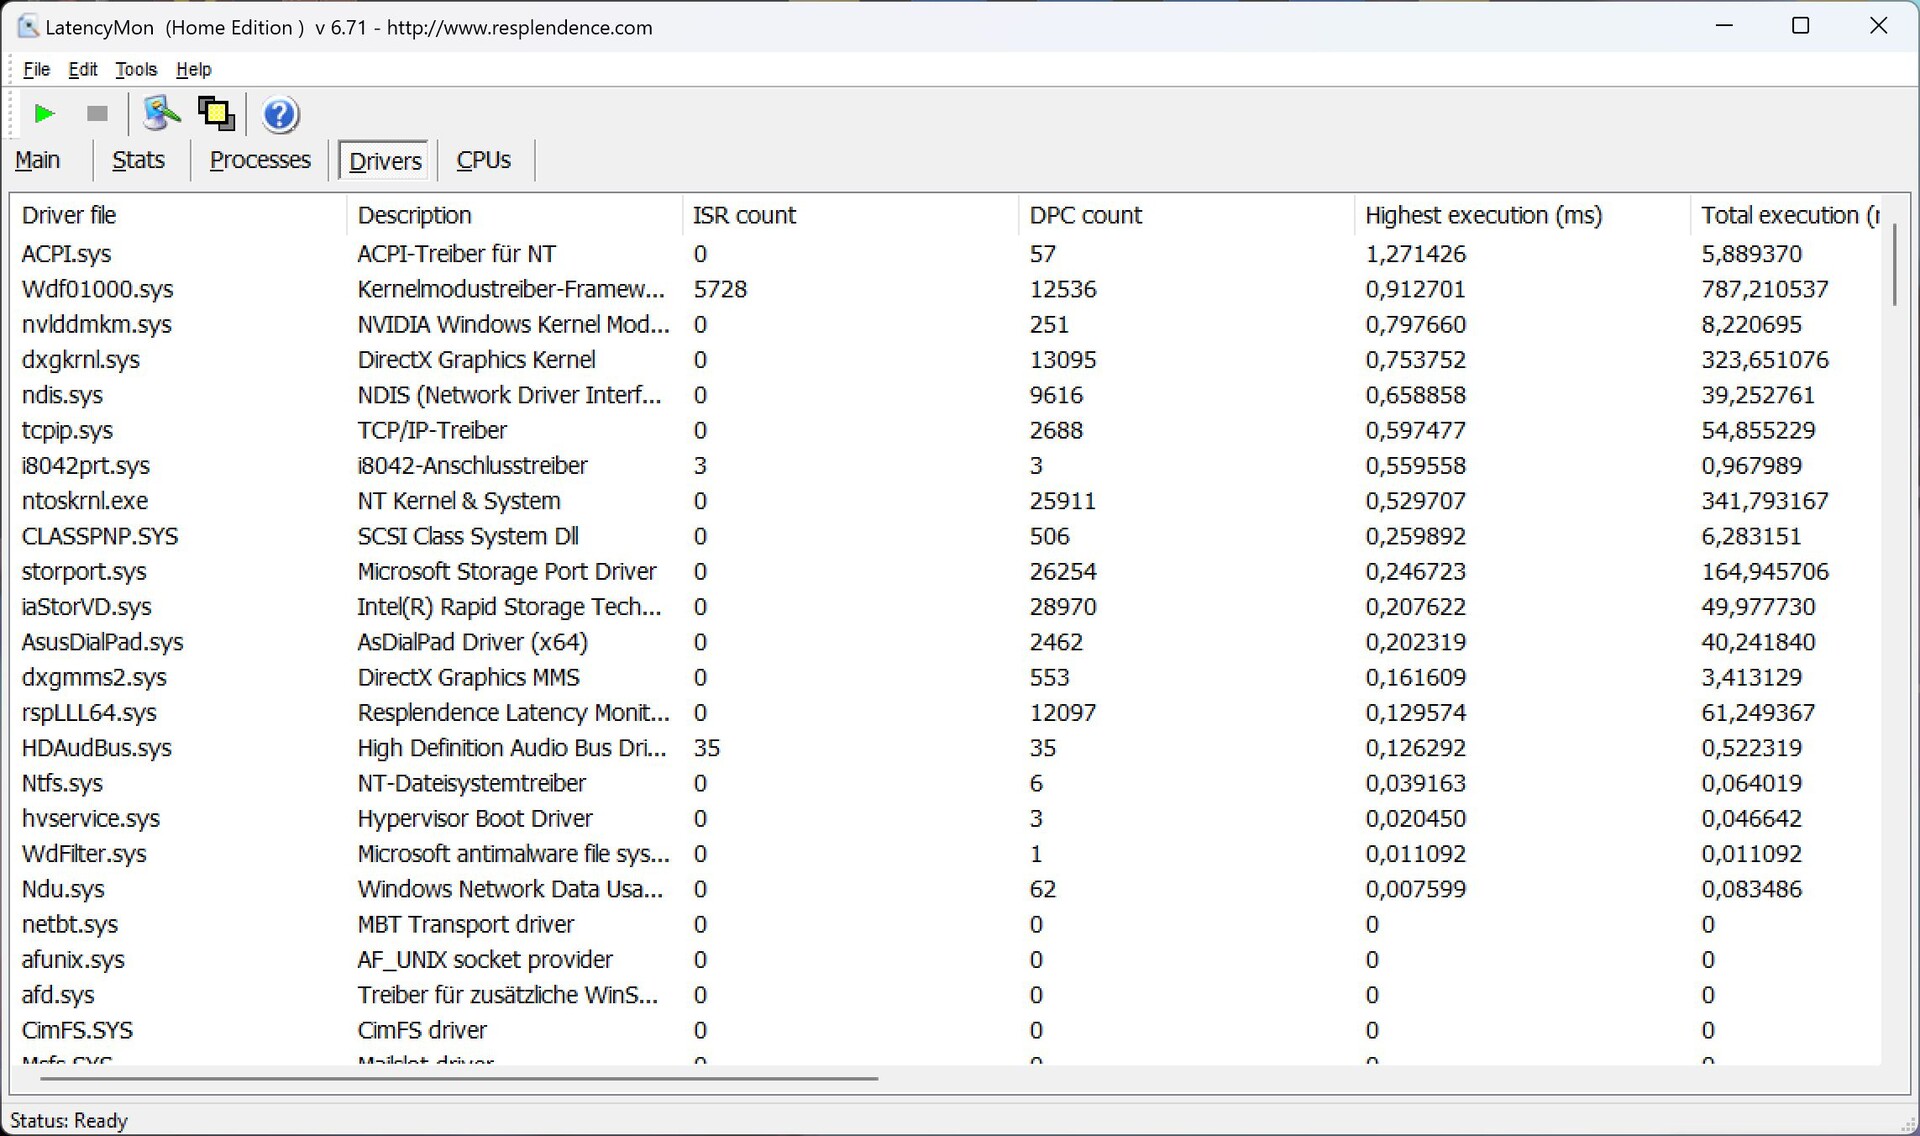
DPC延时
在我们的标准化延迟测试中(网页浏览、YouTube 4K播放、CPU负载),测试设备在目前的BIOS版本下使用实时音频应用程序时显示出轻微的限制。
| DPC Latencies / LatencyMon - interrupt to process latency (max), Web, Youtube, Prime95 | |
| Asus Zenbook Pro 14 OLED UX6404VI | |
| Dell XPS 15 9530 RTX 4070 | |
| Asus ZenBook Pro 14 Duo UX8402VV-P1021W | |
| Razer Blade 15 OLED (Early 2022) | |
| Asus ROG Zephyrus G14 GA402XY | |
* ... smaller is better
存储设备
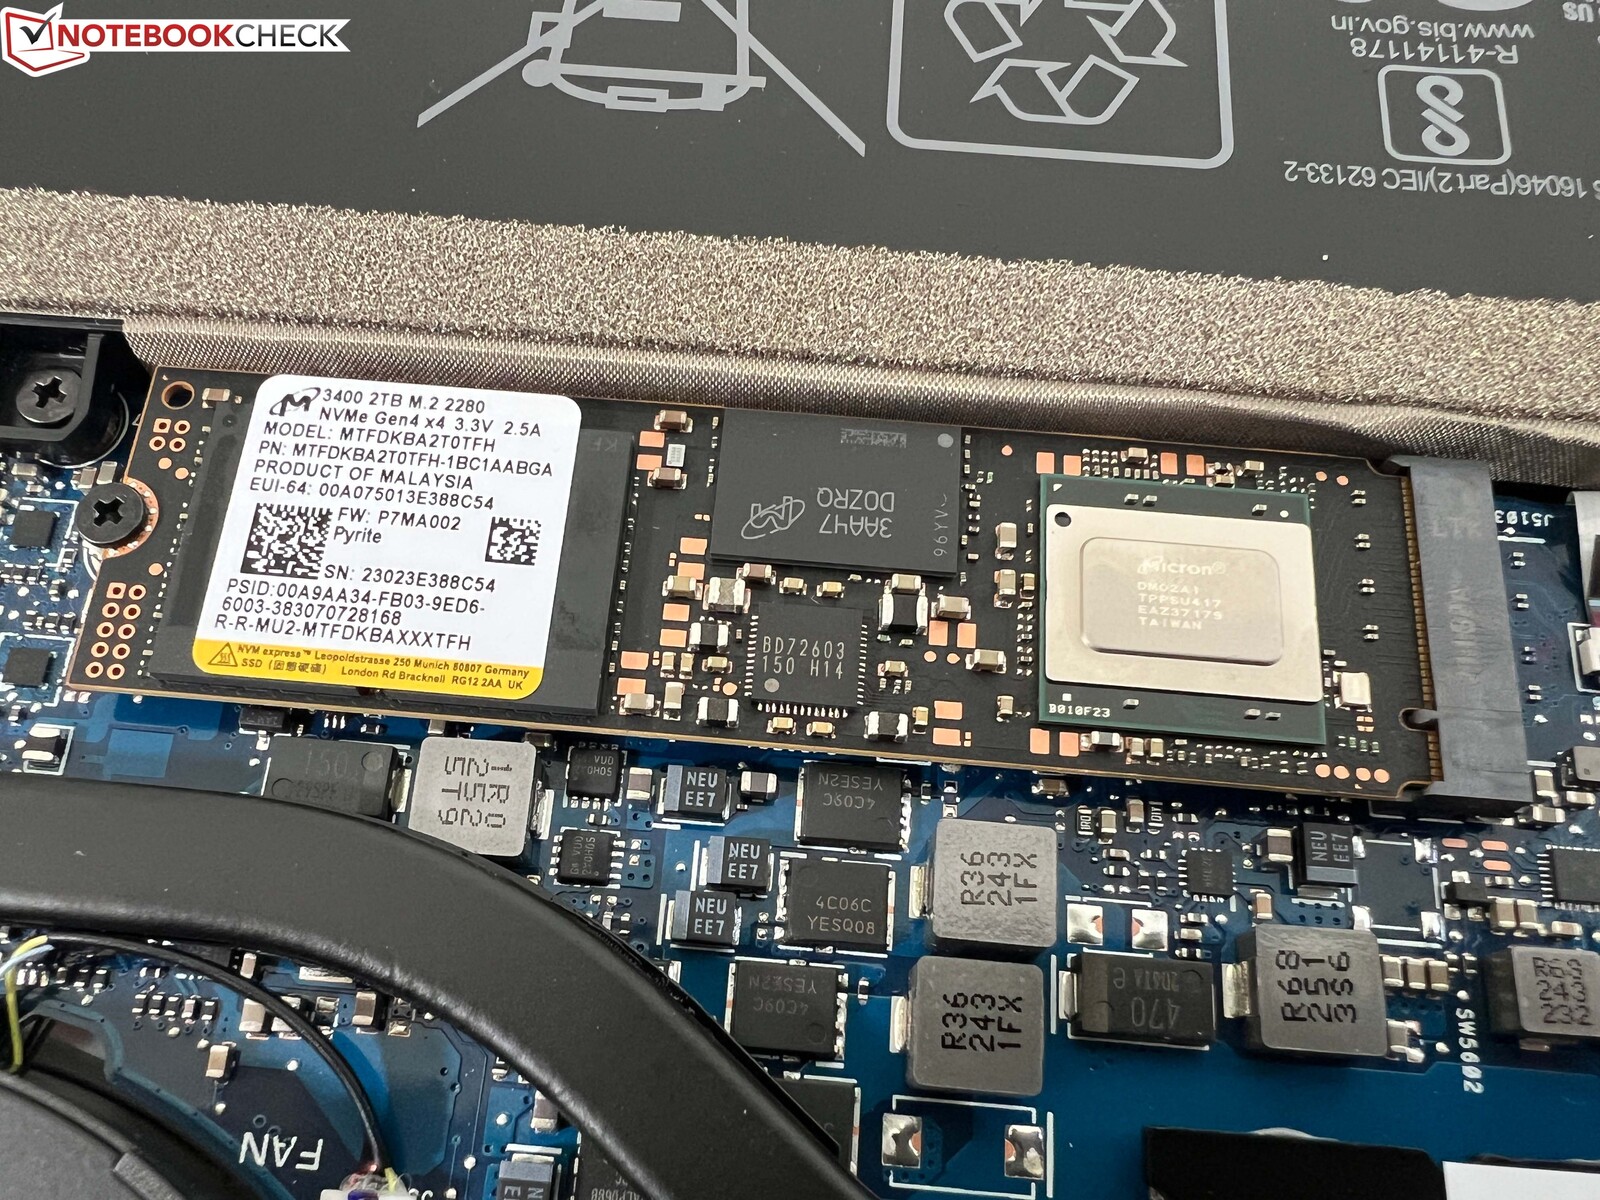
我们的测试设备配备了美光3400 NVMe固态硬盘,它提供了2TB的存储容量(其中1.79TB在首次启动后可用)。这是一款快速的PCIe 4.0固态硬盘,尽管三星和SK海力士的设备实现了略高的传输率。但这在日常使用中并不发挥主要作用;更重要的是在持续负载下性能保持稳定。更多的SSD基准测试列在 这里.

* ... smaller is better
Sustained Read Performance: DiskSpd Read Loop, Queue Depth 8
图形卡
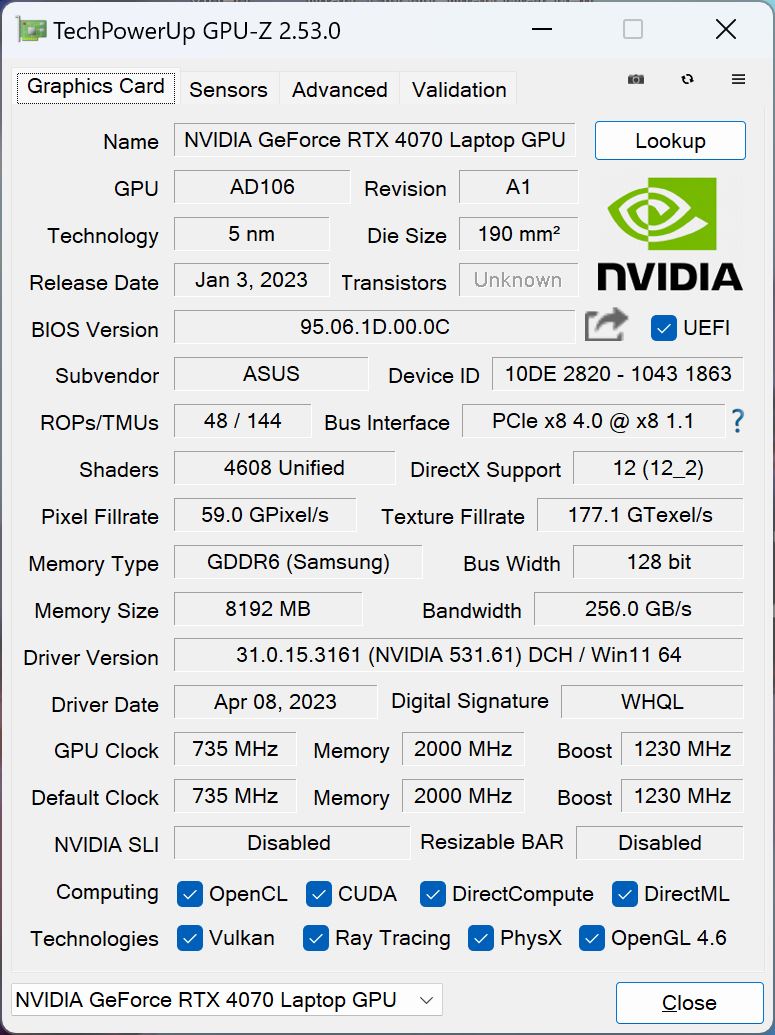
Nvidia的新GeForce RTX 4070 笔记本电脑带有8GB VRAM的CPU被用作专用显卡。根据驱动程序,我们安装了120瓦的变体,但我们只能从GPU中抽取最多95瓦(在压力测试中短暂的120瓦)。由于GPU在游戏过程中最多只消耗105-110瓦,这并不重要,整体性能非常好,尤其是考虑到14英寸的紧凑机箱。混合 模式默认是激活的,但如果需要,也可以完全停用集成GPU(这需要重新启动)。
例如,在合成基准测试中,Zenbook Pro 14也明显比新的RTX 4070笔记本电脑的50瓦变体快(60-80%)。戴尔XPS 15而且总体上也明显快于旧的 RTX 3070 Ti中的 Razer Blade 15.
GPU性能在持续负载下也完全保持稳定,因为它很容易通过Time Spy ,压力测试为99.5%。然而,在电池供电的情况下,GPU性能被限制在60瓦,这使性能降低了约23%。更多的GPU基准测试可在这里.
| 3DMark 11 Performance | 34341 points | |
| 3DMark Fire Strike Score | 25794 points | |
| 3DMark Time Spy Score | 11666 points | |
Help | ||
| Blender / v3.3 Classroom OPTIX/RTX | |
| Average of class Multimedia (12 - 105, n=22, last 2 years) | |
| Dell XPS 15 9530 RTX 4070 | |
| Asus ZenBook Pro 14 Duo UX8402VV-P1021W | |
| Razer Blade 15 OLED (Early 2022) | |
| Asus Zenbook Pro 14 OLED UX6404VI | |
| Average NVIDIA GeForce RTX 4070 Laptop GPU (18 - 30, n=68) | |
| Asus ROG Zephyrus G14 GA402XY | |
| Blender / v3.3 Classroom CUDA | |
| Average of class Multimedia (20 - 186, n=22, last 2 years) | |
| Asus ZenBook Pro 14 Duo UX8402VV-P1021W | |
| Dell XPS 15 9530 RTX 4070 | |
| Razer Blade 15 OLED (Early 2022) | |
| Asus Zenbook Pro 14 OLED UX6404VI | |
| Average NVIDIA GeForce RTX 4070 Laptop GPU (32 - 50, n=67) | |
| Asus ROG Zephyrus G14 GA402XY | |
| Blender / v3.3 Classroom METAL | |
| Apple MacBook Pro 14 2023 M2 Pro | |
| Average of class Multimedia (17.8 - 68, n=5, last 2 years) | |
* ... smaller is better
游戏性能
尽管华硕将Zenbook Pro 14宣传为创作者的笔记本电脑,但它也非常适用于游戏。它的性能 RTX 4070 笔记本电脑完全足以在QHD分辨率下进行流畅的游戏,即使在最新的游戏作品中也是如此。在较长的会议中,游戏性能也完全保持稳定。更多的GPU基准测试被列在 我们的技术部分.
| The Witcher 3 - 1920x1080 Ultra Graphics & Postprocessing (HBAO+) | |
| Asus ROG Zephyrus G14 GA402XY | |
| Asus ZenBook Pro 14 Duo UX8402VV-P1021W | |
| Asus Zenbook Pro 14 OLED UX6404VI | |
| Razer Blade 15 OLED (Early 2022) | |
| Dell XPS 15 9530 RTX 4070 | |
| Average of class Multimedia (11 - 121, n=7, last 2 years) | |
| Final Fantasy XV Benchmark - 1920x1080 High Quality | |
| Asus ROG Zephyrus G14 GA402XY | |
| Asus Zenbook Pro 14 OLED UX6404VI | |
| Razer Blade 15 OLED (Early 2022) | |
| Asus ZenBook Pro 14 Duo UX8402VV-P1021W | |
| Dell XPS 15 9530 RTX 4070 | |
| Average of class Multimedia (7.61 - 144.4, n=57, last 2 years) | |
| Dota 2 Reborn - 1920x1080 ultra (3/3) best looking | |
| Asus Zenbook Pro 14 OLED UX6404VI | |
| Asus ZenBook Pro 14 Duo UX8402VV-P1021W | |
| Dell XPS 15 9530 RTX 4070 | |
| Asus ROG Zephyrus G14 GA402XY | |
| Razer Blade 15 OLED (Early 2022) | |
| Average of class Multimedia (29 - 179.9, n=59, last 2 years) | |
Witcher 3 FPS Chart
| low | med. | high | ultra | QHD | |
|---|---|---|---|---|---|
| GTA V (2015) | 184.5 | 179.4 | 117.7 | 86.8 | |
| The Witcher 3 (2015) | 223 | 105.3 | |||
| Dota 2 Reborn (2015) | 199.2 | 182.3 | 171.5 | 162.2 | |
| Final Fantasy XV Benchmark (2018) | 121.8 | 108.3 | 79.5 | ||
| X-Plane 11.11 (2018) | 162.3 | 143.3 | 113.4 | ||
| Far Cry 5 (2018) | 119 | 118 | 116 | 95 | |
| Strange Brigade (2018) | 249 | 215 | 194 | 132 | |
| F1 2021 (2021) | 182.6 | 162.5 | 118.4 | 88.6 | |
| Cyberpunk 2077 1.6 (2022) | 130 | 104 | 89 | 82 | 61 |
| F1 22 (2022) | 242 | 182 | 71.8 | 47.1 |
排放--好的扬声器
噪声
对于日常工作(或只要你不需要GPU性能),如果可能的话,你应该使用Whisper 或Standard 模式,因为Zenbook Pro 14然后经常保持沉默。你也应该测试一下标准 模式下的游戏,因为在许多情况下,性能仍然足够,而且该设备的噪音略低于41分贝(A),相比之下,性能 模式下的噪音略低于49分贝(A),更令人愉快。没有发现其他电子噪音,如线圈啸叫。
Noise level
| Idle |
| 23.3 / 23.3 / 23.3 dB(A) |
| Load |
| 39.3 / 48.8 dB(A) |
 | ||
30 dB silent 40 dB(A) audible 50 dB(A) loud |
||
min: | ||
| Asus Zenbook Pro 14 OLED UX6404VI GeForce RTX 4070 Laptop GPU, i9-13900H, Micron 3400 2TB MTFDKBA2T0TFH | Asus ZenBook Pro 14 Duo UX8402VV-P1021W GeForce RTX 4060 Laptop GPU, i9-13900H, Samsung PM9A1 MZVL22T0HBLB | Apple MacBook Pro 14 2023 M2 Pro M2 Pro 19-Core GPU, M2 Pro, Apple SSD AP2048Z | Asus ROG Zephyrus G14 GA402XY GeForce RTX 4090 Laptop GPU, R9 7940HS, Samsung PM9A1 MZVL21T0HCLR | Dell XPS 15 9530 RTX 4070 GeForce RTX 4070 Laptop GPU, i7-13700H, SK hynix PC801 HFS001TEJ9X101N | Razer Blade 15 OLED (Early 2022) GeForce RTX 3070 Ti Laptop GPU, i9-12900H, Samsung PM9A1 MZVL21T0HCLR | |
|---|---|---|---|---|---|---|
| Noise | -23% | 6% | -12% | 8% | -10% | |
| off / environment * (dB) | 23.3 | 25.2 -8% | 23.9 -3% | 23.3 -0% | 23.1 1% | 26 -12% |
| Idle Minimum * (dB) | 23.3 | 25.2 -8% | 23.9 -3% | 23.6 -1% | 23.1 1% | 28 -20% |
| Idle Average * (dB) | 23.3 | 25.2 -8% | 23.9 -3% | 23.6 -1% | 23.1 1% | 28 -20% |
| Idle Maximum * (dB) | 23.3 | 32.5 -39% | 23.9 -3% | 33 -42% | 24.2 -4% | 28 -20% |
| Load Average * (dB) | 39.3 | 59.7 -52% | 26 34% | 49.5 -26% | 27.1 31% | 38.5 2% |
| Witcher 3 ultra * (dB) | 48.8 | 52.2 -7% | 40.1 18% | |||
| Load Maximum * (dB) | 48.8 | 60.9 -25% | 43.2 11% | 52.2 -7% | 44.6 9% | 43.9 10% |
* ... smaller is better
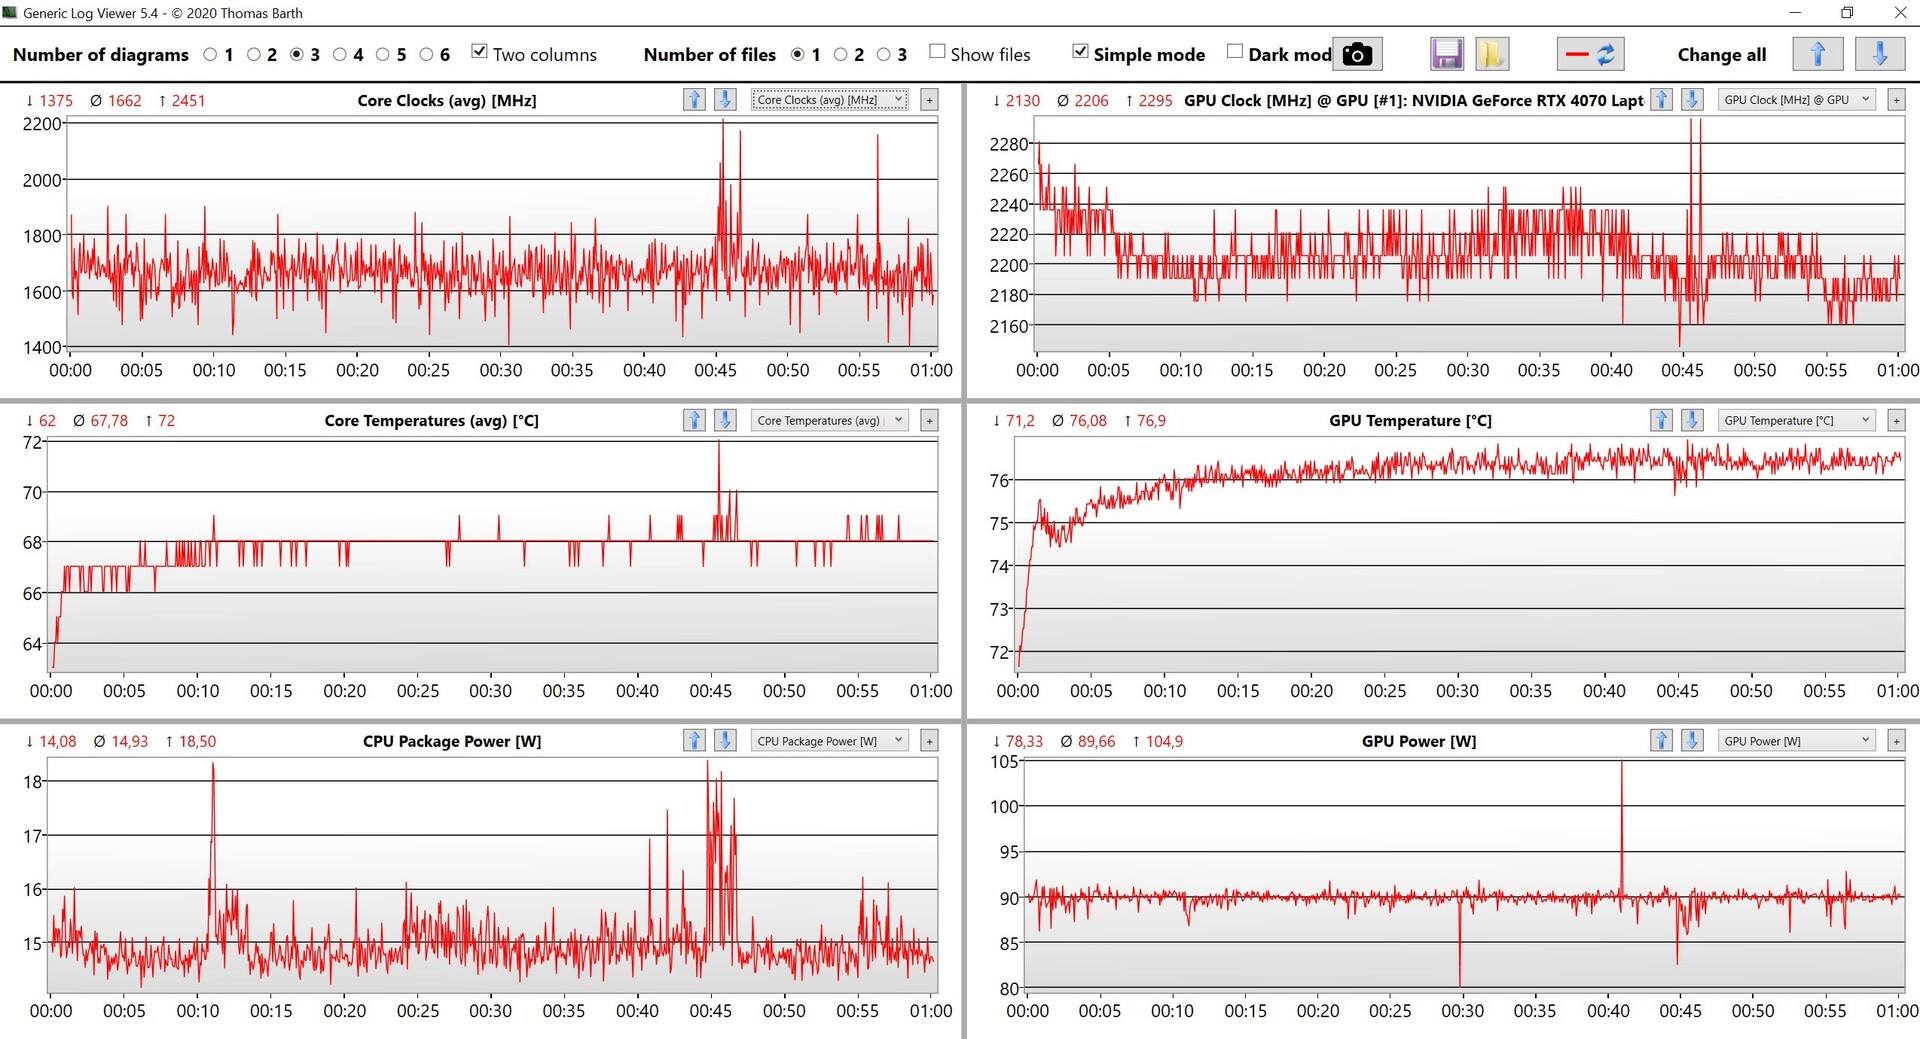
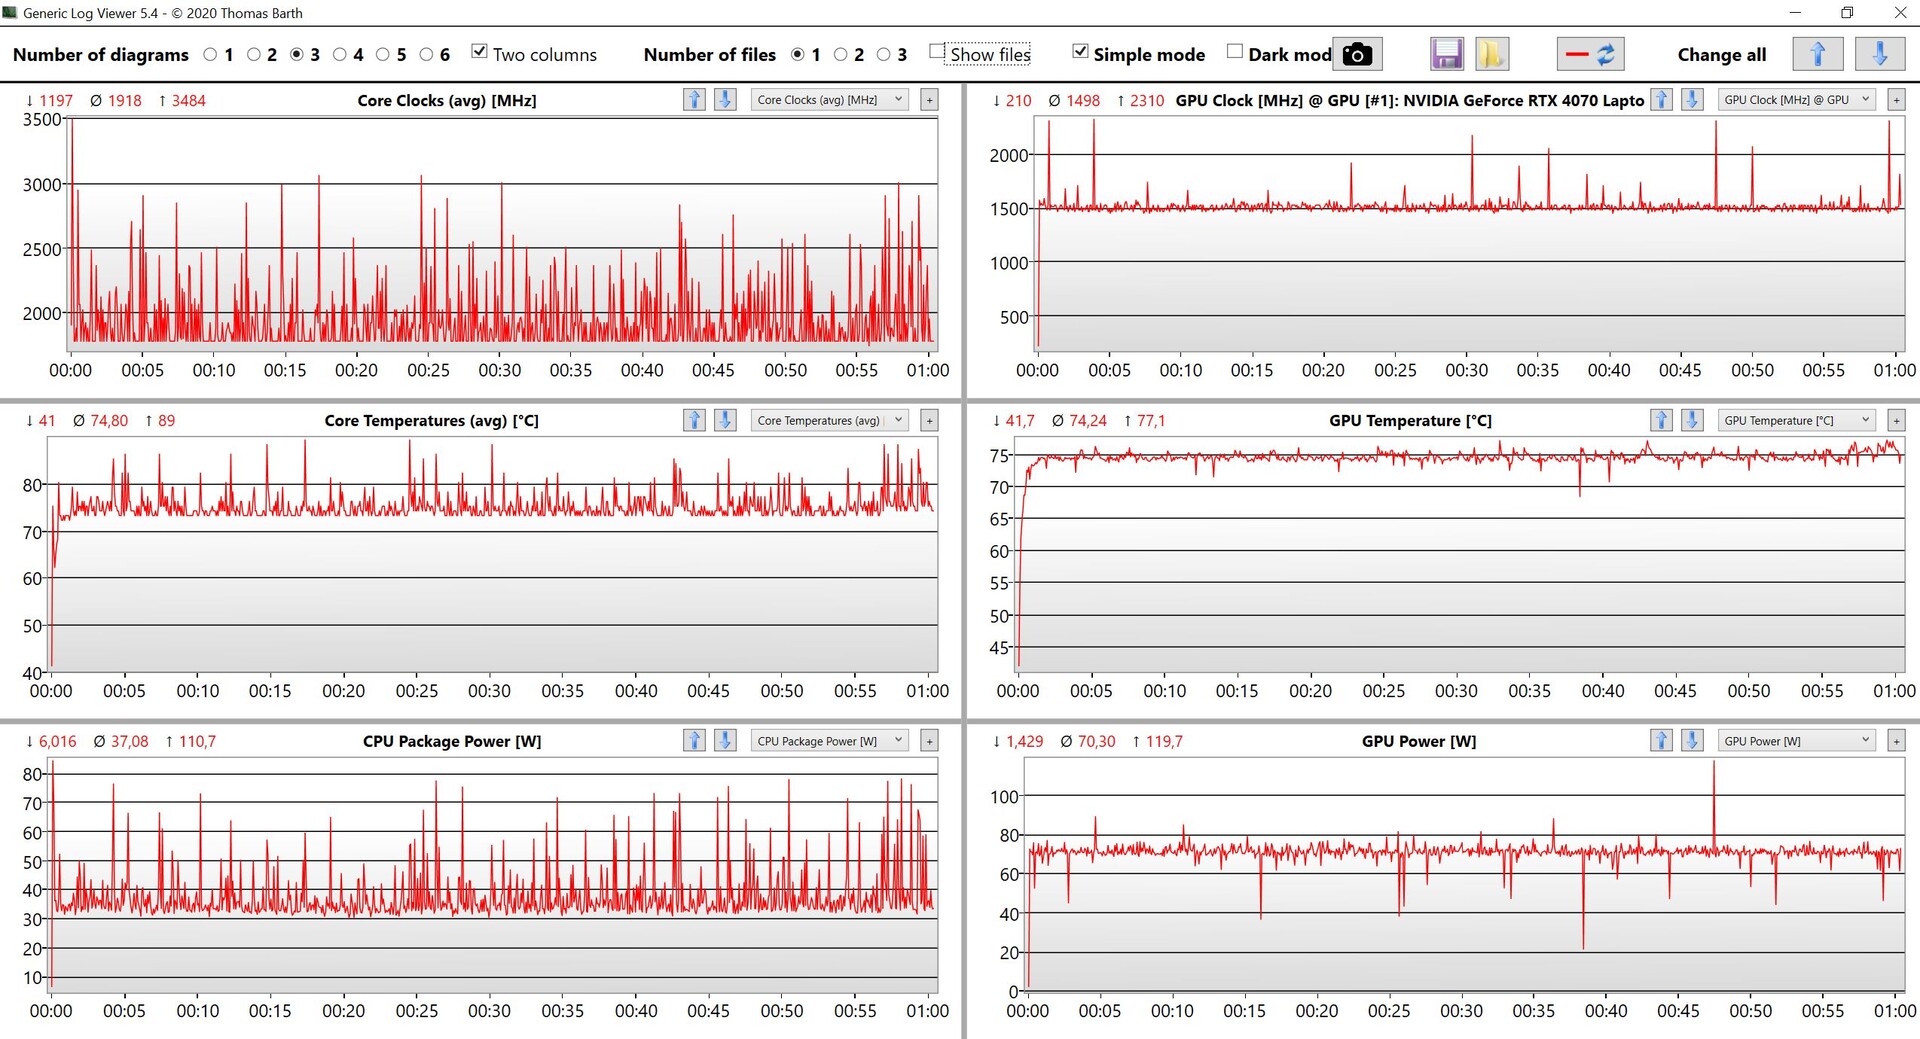
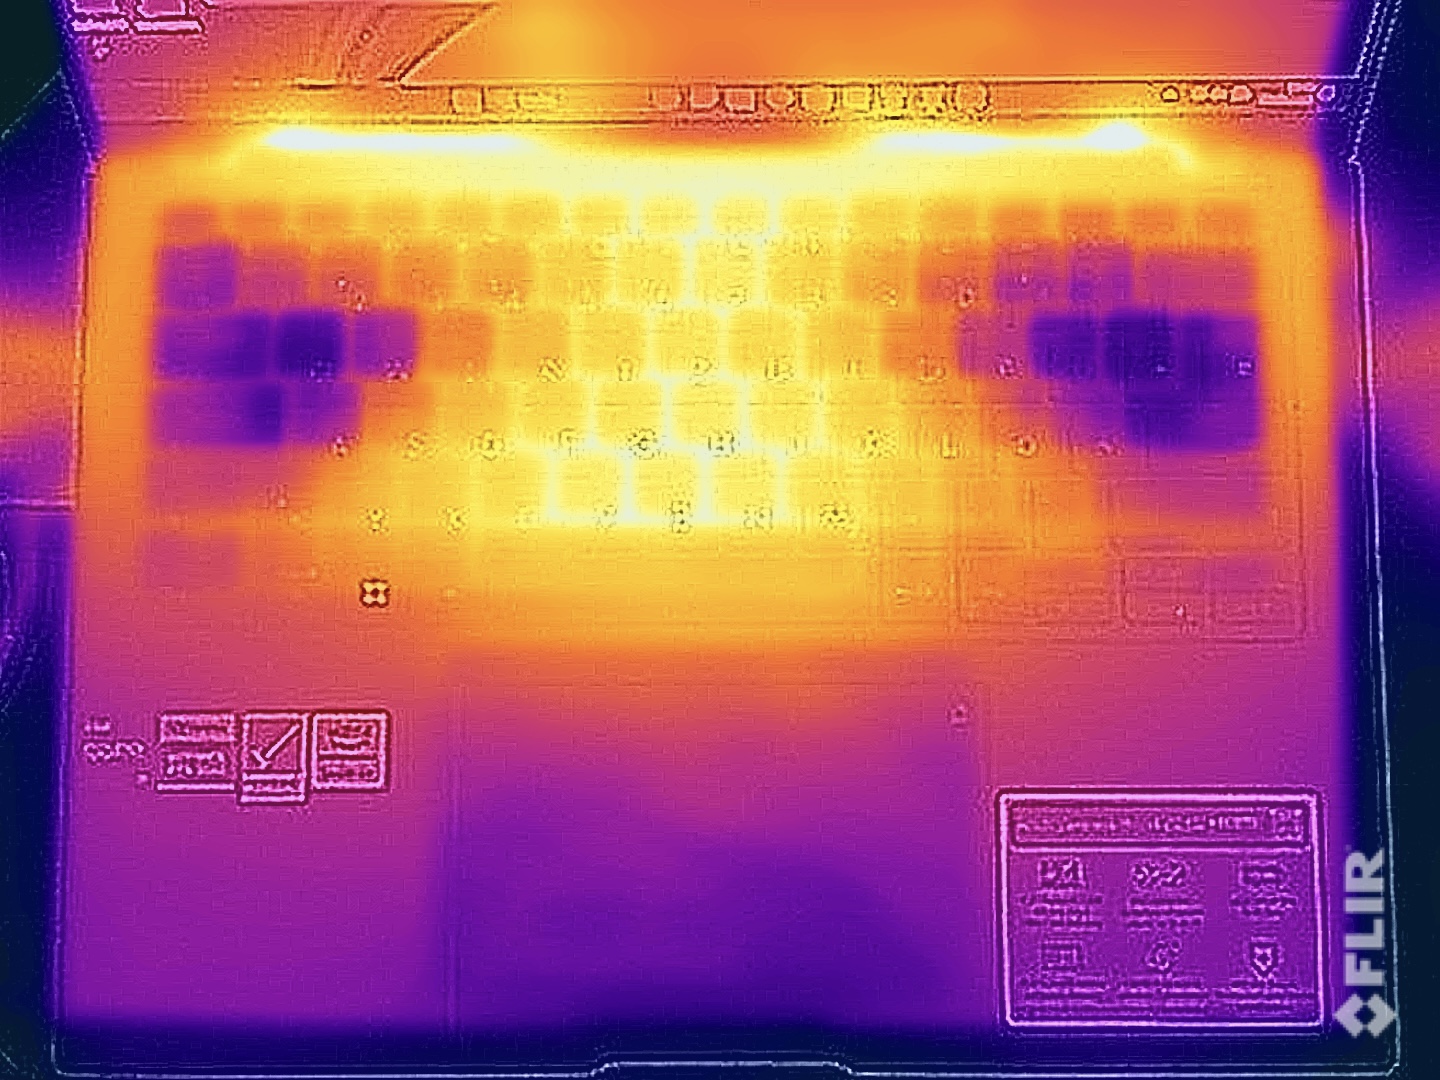
温度
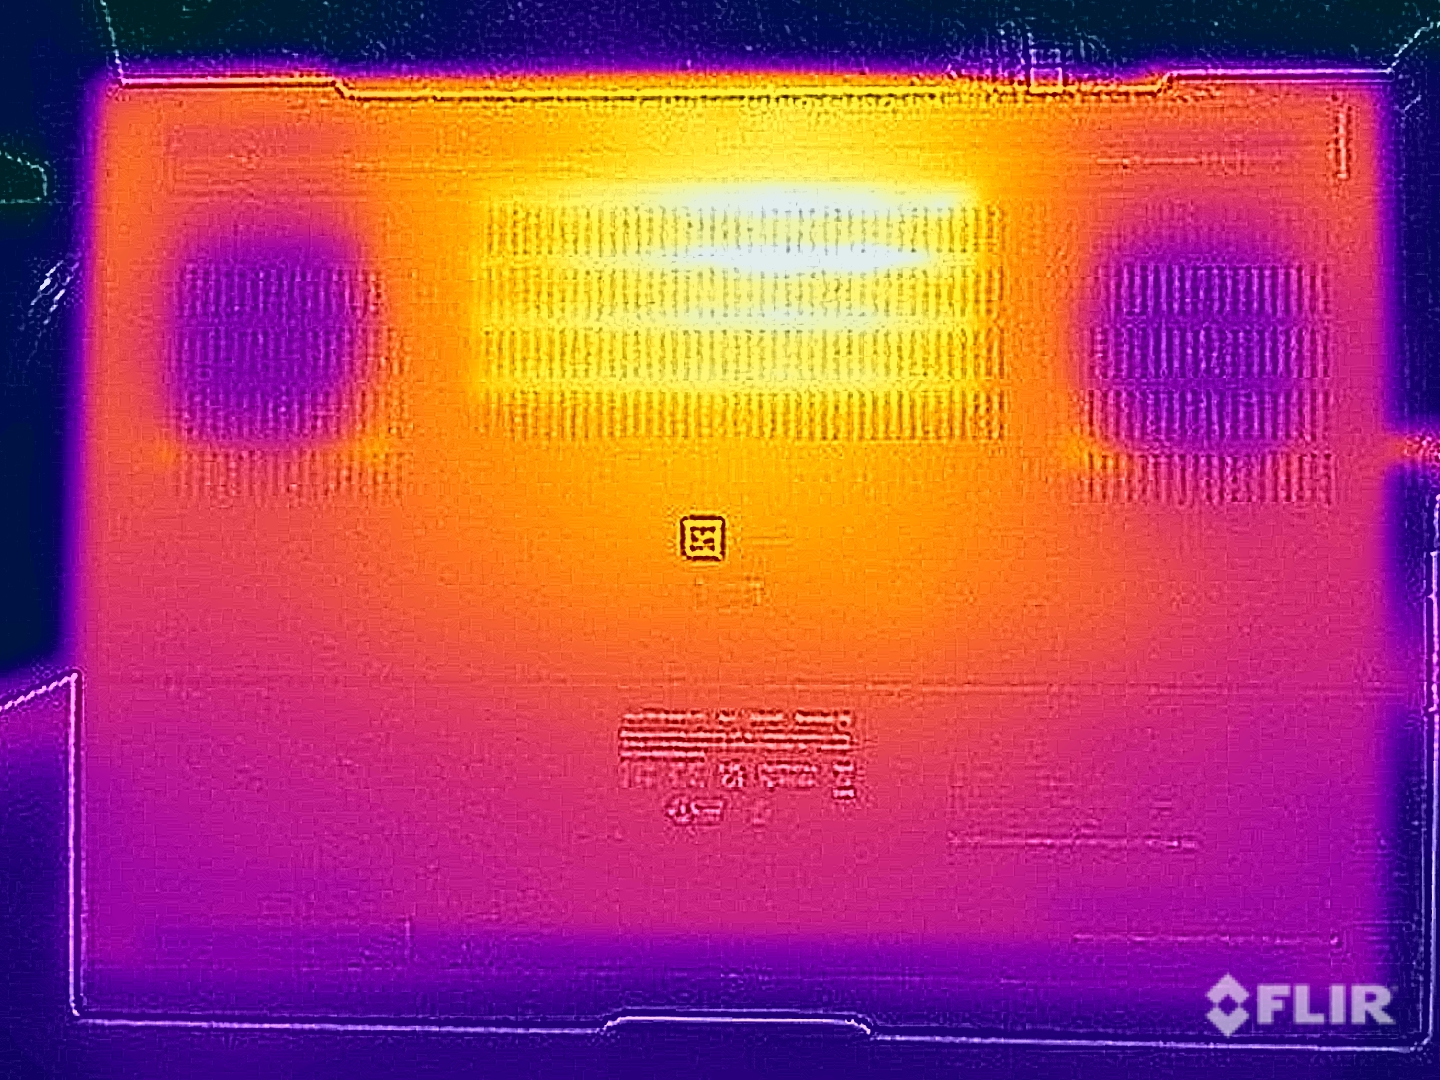
风扇在空转或轻度任务时经常被停用,但机箱在某些地方确实有点热,大约30℃。尽管如此,华硕还是很好地控制了负载下的温度,因为在压力测试和游戏过程中,键盘区域的最高温度为42℃,保持无害。在底部,有一个热点,在后部中心区域达到最高51℃,所以你应该避免在这里直接接触皮肤。
在压力测试中,显卡的功率大约为75瓦,并保持在这个数值。处理器就比较不稳定了,通常在35瓦左右,并不断有短时的向上峰值。
(±) The maximum temperature on the upper side is 40.6 °C / 105 F, compared to the average of 36.8 °C / 98 F, ranging from 21 to 71 °C for the class Multimedia.
(-) The bottom heats up to a maximum of 49.5 °C / 121 F, compared to the average of 39.1 °C / 102 F
(+) In idle usage, the average temperature for the upper side is 27.1 °C / 81 F, compared to the device average of 31.3 °C / 88 F.
(±) Playing The Witcher 3, the average temperature for the upper side is 36.3 °C / 97 F, compared to the device average of 31.3 °C / 88 F.
(+) The palmrests and touchpad are cooler than skin temperature with a maximum of 30.5 °C / 86.9 F and are therefore cool to the touch.
(±) The average temperature of the palmrest area of similar devices was 28.7 °C / 83.7 F (-1.8 °C / -3.2 F).
| Asus Zenbook Pro 14 OLED UX6404VI Intel Core i9-13900H, NVIDIA GeForce RTX 4070 Laptop GPU | Asus ZenBook Pro 14 Duo UX8402VV-P1021W Intel Core i9-13900H, NVIDIA GeForce RTX 4060 Laptop GPU | Apple MacBook Pro 14 2023 M2 Pro Apple M2 Pro, Apple M2 Pro 19-Core GPU | Asus ROG Zephyrus G14 GA402XY AMD Ryzen 9 7940HS, NVIDIA GeForce RTX 4090 Laptop GPU | Dell XPS 15 9530 RTX 4070 Intel Core i7-13700H, NVIDIA GeForce RTX 4070 Laptop GPU | Razer Blade 15 OLED (Early 2022) Intel Core i9-12900H, NVIDIA GeForce RTX 3070 Ti Laptop GPU | |
|---|---|---|---|---|---|---|
| Heat | -1% | 14% | 2% | -7% | -13% | |
| Maximum Upper Side * (°C) | 40.6 | 37.1 9% | 46.9 -16% | 47 -16% | 45.6 -12% | 49.5 -22% |
| Maximum Bottom * (°C) | 49.5 | 49.4 -0% | 41.7 16% | 46.5 6% | 42 15% | 47.5 4% |
| Idle Upper Side * (°C) | 28.2 | 30 -6% | 21.4 24% | 25.9 8% | 34.4 -22% | 33.4 -18% |
| Idle Bottom * (°C) | 30.6 | 32.4 -6% | 21.4 30% | 28 8% | 33.2 -8% | 35 -14% |
* ... smaller is better
发言人
扬声器总体上提供了良好的音质。只有低音可以再强一点。虽然对于偶尔的视频和一些音乐来说绝对足够了,但由于风扇的原因,你最好使用耳机进行游戏。
Asus Zenbook Pro 14 OLED UX6404VI audio analysis
(±) | speaker loudness is average but good (78.9 dB)
Bass 100 - 315 Hz
(±) | reduced bass - on average 10.7% lower than median
(±) | linearity of bass is average (9.4% delta to prev. frequency)
Mids 400 - 2000 Hz
(+) | balanced mids - only 1.2% away from median
(+) | mids are linear (4.1% delta to prev. frequency)
Highs 2 - 16 kHz
(+) | balanced highs - only 4.3% away from median
(+) | highs are linear (4.8% delta to prev. frequency)
Overall 100 - 16.000 Hz
(+) | overall sound is linear (11.4% difference to median)
Compared to same class
» 18% of all tested devices in this class were better, 4% similar, 78% worse
» The best had a delta of 5%, average was 17%, worst was 45%
Compared to all devices tested
» 7% of all tested devices were better, 2% similar, 90% worse
» The best had a delta of 4%, average was 23%, worst was 134%
Apple MacBook Pro 14 2023 M2 Pro audio analysis
(+) | speakers can play relatively loud (84.3 dB)
Bass 100 - 315 Hz
(+) | good bass - only 3.8% away from median
(+) | bass is linear (6.9% delta to prev. frequency)
Mids 400 - 2000 Hz
(+) | balanced mids - only 2.1% away from median
(+) | mids are linear (2.2% delta to prev. frequency)
Highs 2 - 16 kHz
(+) | balanced highs - only 2.7% away from median
(+) | highs are linear (4.8% delta to prev. frequency)
Overall 100 - 16.000 Hz
(+) | overall sound is linear (6% difference to median)
Compared to same class
» 3% of all tested devices in this class were better, 0% similar, 97% worse
» The best had a delta of 5%, average was 17%, worst was 45%
Compared to all devices tested
» 0% of all tested devices were better, 0% similar, 100% worse
» The best had a delta of 4%, average was 23%, worst was 134%
能源管理--120Hz的OLED会消耗大量的电力
消耗功率
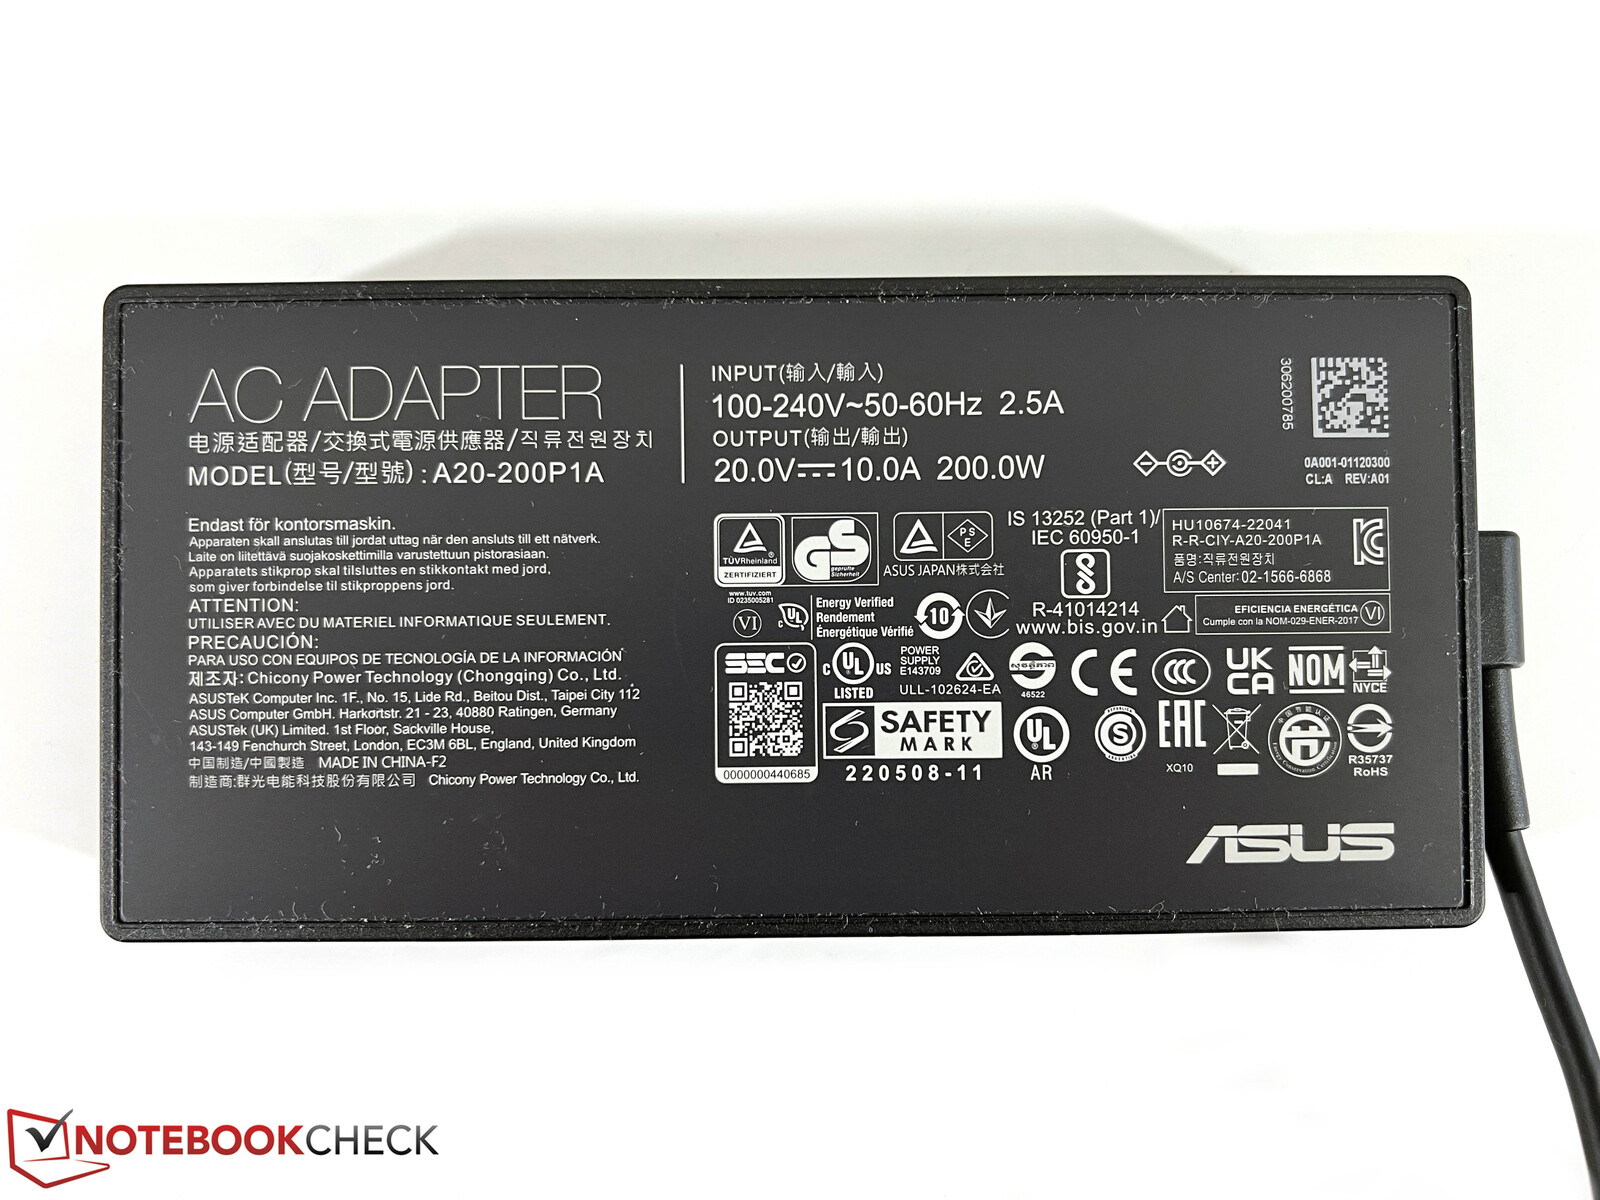
OLED屏幕的功耗主要取决于显示的内容。我们测量了在黑暗的标准背景下,空闲时的最大功率略低于12瓦,但在有明亮的图片时,这个功率会进一步增加。一旦你观看HDR内容,消耗率会增加到28瓦。在压力测试中,我们登记的功率短时间内高达208瓦,但这很快就平息在~140瓦(也适用于游戏)。总体而言,200瓦的电源是足够的。
| Off / Standby | |
| Idle | |
| Load |
|
Key:
min: | |
| Asus Zenbook Pro 14 OLED UX6404VI i9-13900H, GeForce RTX 4070 Laptop GPU, Micron 3400 2TB MTFDKBA2T0TFH, OLED, 2880x1800, 14.5" | Asus ZenBook Pro 14 Duo UX8402VV-P1021W i9-13900H, GeForce RTX 4060 Laptop GPU, Samsung PM9A1 MZVL22T0HBLB, OLED, 2880x1800, 14.5" | Apple MacBook Pro 14 2023 M2 Pro M2 Pro, M2 Pro 19-Core GPU, Apple SSD AP2048Z, Mini-LED, 3024x1964, 14.2" | Asus ROG Zephyrus G14 GA402XY R9 7940HS, GeForce RTX 4090 Laptop GPU, Samsung PM9A1 MZVL21T0HCLR, Mini-LED, 2560x1600, 14" | Dell XPS 15 9530 RTX 4070 i7-13700H, GeForce RTX 4070 Laptop GPU, SK hynix PC801 HFS001TEJ9X101N, OLED, 3456x2160, 15.6" | Razer Blade 15 OLED (Early 2022) i9-12900H, GeForce RTX 3070 Ti Laptop GPU, Samsung PM9A1 MZVL21T0HCLR, OLED, 2560x1440, 15.6" | Average NVIDIA GeForce RTX 4070 Laptop GPU | Average of class Multimedia | |
|---|---|---|---|---|---|---|---|---|
| Power Consumption | 2% | 35% | -17% | -44% | -134% | -53% | 20% | |
| Idle Minimum * (Watt) | 7.5 | 8.5 -13% | 2.4 68% | 9.4 -25% | 20 -167% | 31.6 -321% | 13.2 ? -76% | 5.66 ? 25% |
| Idle Average * (Watt) | 11.1 | 8.8 21% | 11.3 -2% | 14.2 -28% | 20.7 -86% | 33.3 -200% | 18.2 ? -64% | 10.2 ? 8% |
| Idle Maximum * (Watt) | 11.6 | 16.5 -42% | 11.5 1% | 14.5 -25% | 22.4 -93% | 38.6 -233% | 24.6 ? -112% | 12.5 ? -8% |
| Load Average * (Watt) | 91.9 | 102 -11% | 59.6 35% | 79 14% | 77.1 16% | 149 -62% | 97 ? -6% | 65.2 ? 29% |
| Witcher 3 ultra * (Watt) | 132.2 | 101.2 23% | 55.9 58% | 172 -30% | 95.4 28% | 149.6 -13% | ||
| Load Maximum * (Watt) | 208 | 140 33% | 100 52% | 220.8 -6% | 133.4 36% | 160 23% | 221 ? -6% | 113.5 ? 45% |
* ... smaller is better
Power consumption Witcher 3 / Stress test
Power consumption with an external monitor
电池寿命
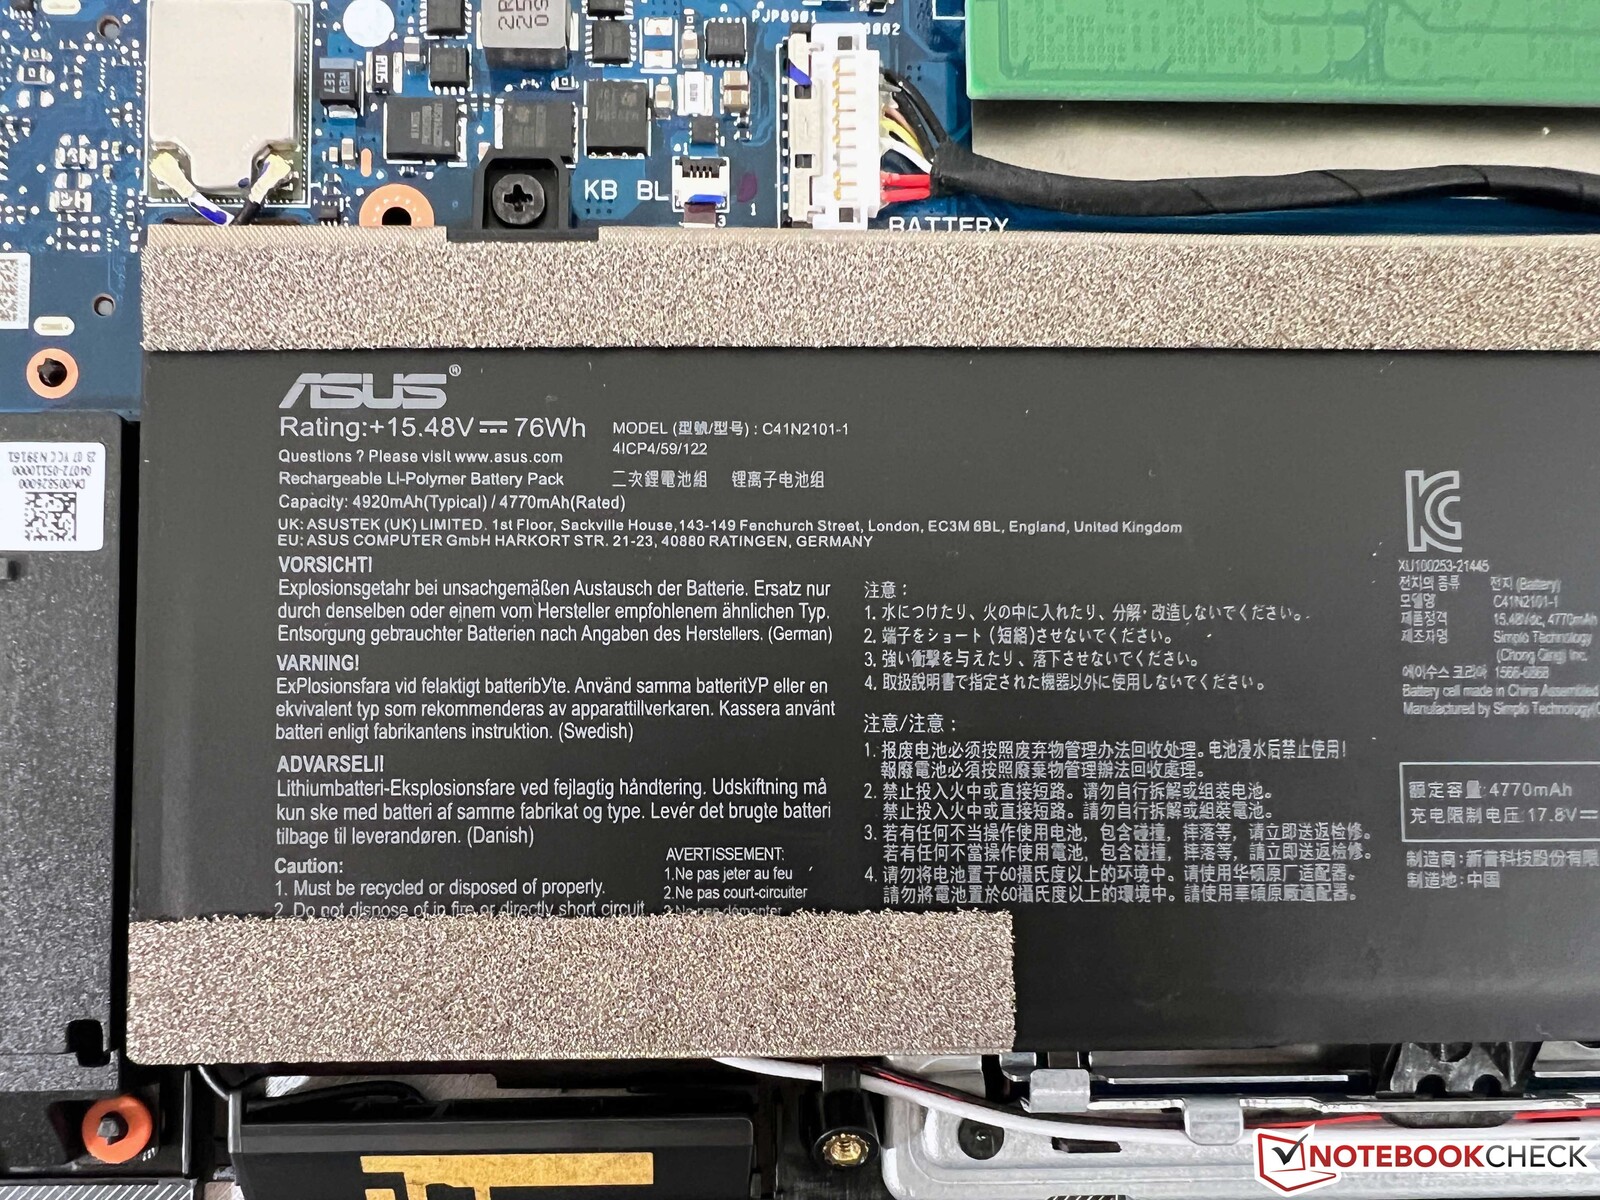
76Wh的电池只能提供平均的电池运行时间,因为OLED屏幕需要大量的电力。我们在60赫兹下进行了测试(对于120赫兹,你可以减去大约半小时)。视频播放在150cd/m²(相当于测试设备中最大SDR亮度的73%)下运行了8.5小时,但在WLAN测试中只有7.5小时,或者在全亮度下只有不到6小时。一段最大亮度的HDR YouTube视频在3.5小时内耗尽了电池。MacBook Pro 14在各方面的持续时间要长得多。
当设备开机时,充满电大约需要105分钟;不到半小时就可以使用50%的容量。
| Asus Zenbook Pro 14 OLED UX6404VI i9-13900H, GeForce RTX 4070 Laptop GPU, 76 Wh | Apple MacBook Pro 14 2023 M2 Pro M2 Pro, M2 Pro 19-Core GPU, 70 Wh | Asus ROG Zephyrus G14 GA402XY R9 7940HS, GeForce RTX 4090 Laptop GPU, 76 Wh | Dell XPS 15 9530 RTX 4070 i7-13700H, GeForce RTX 4070 Laptop GPU, 86 Wh | Razer Blade 15 OLED (Early 2022) i9-12900H, GeForce RTX 3070 Ti Laptop GPU, 80 Wh | Average of class Multimedia | |
|---|---|---|---|---|---|---|
| Battery runtime | 59% | -5% | 28% | 13% | 76% | |
| H.264 (h) | 8.5 | 15.3 80% | 7.2 -15% | 5.9 -31% | 17.1 ? 101% | |
| WiFi v1.3 (h) | 7.6 | 13.5 78% | 7.5 -1% | 8 5% | 4.6 -39% | 12.2 ? 61% |
| Load (h) | 1 | 1.2 20% | 1 0% | 1.5 50% | 2.1 110% | 1.664 ? 66% |
Pros
Cons
结论 - Zenbook Pro 14提供了很多性能,但必须做出一些妥协
华硕新的Zenbook Pro 14是一款强大的14英寸设备,面向创意用户,因此与Apple MacBook Pro 14直接竞争。因此,制造商安装了英特尔和Nvidia的最新组件:无论是 酷睿i9-13900H和 GeForce RTX 4070 笔记本电脑为这样一个紧凑的设备提供了大量的性能。Zenbook的性能也明显高于大型多媒体笔记本电脑,如新的 XPS 15 von Dell来自戴尔。
采用了一块120赫兹的OLED屏幕作为显示屏。主观的图像质量总体上非常好,但由于触摸屏的原因,明亮的地方会出现轻微的颗粒感。此外,PMW是从50%及以下的亮度开始使用的。与其他华硕OLED笔记本电脑一样,有一个软件功能允许OLED在没有PWM的情况下变暗,但用户每次都必须通过软件激活。各种颜色配置文件非常好;尤其是Display P3非常准确,不需要后续校准。然而,颜色配置文件在HDR模式下是不可用的,HDR功能在Apple MacBook Pro中简直好用得多,其迷你LED面板也能实现明显的高亮度值。
重点是性能:由于英特尔酷睿i9-13900H和NvidiaGeForce RTX 4070 Laptop GPU,新的Zenbook Pro是一个非常快的14英寸笔记本。然而,OLED屏幕的画质颗粒度很小,在电池寿命方面也必须做出妥协。
该设备明显比许多其他14英寸笔记本电脑更笨重,但组件的冷却效果足够好,而且有足够的端口。由于采用了锥形的基本单元,制造商还很好地隐藏了外壳的厚度。然而,为了充分发挥GeForce RTX 4070的性能,用户需要激活性能 模式,在该模式下,风扇的声音明显变大。
键盘也只是平均水平,考虑到高昂的购买价格,这有点让人失望。触摸板左上方的额外DialPad也更像是一个噱头。Adobe应用程序的实施效果非常好,但最终,快捷键和组合键的效果更快。默认情况下,屏幕亮度和音量也可以用DialPad来调整,但这也可以通过专用的特殊键来更快地工作。另一个缺点是电池寿命(尤其是在激活120赫兹的情况下),更不用说价格了,在我们的案例中,价格高达 3,500欧元(约合3,750.00美元)。
一个大的竞争者当然是 Apple MacBook Pro 14在原始CPU和GPU性能方面有劣势,但总体上是更好的笔记本电脑。此外,如果你还想用笔记本来玩当前的游戏,那么MacBook并不是一个理想的选择。另一个有趣的竞争者来自华硕本身:虽然 ROG Zephyrus G14主要是一台游戏机,但它也同样可以用于创作目的(也可使用RTX 4070笔记本GPU)。哑光迷你LED或IPS面板(取决于配置)甚至赋予了OLED屏幕的一些优势。
价格和可用性
华硕Zenbook Pro 14 OLED的全球供应似乎有限。这款笔记本电脑在华硕的estore上售价为1799.99美元,但目前已经断货。
价格和供应情况截至12.06.2023,可能会有变化。
Asus Zenbook Pro 14 OLED UX6404VI
- 06/09/2023 v7 (old)
Andreas Osthoff
Transparency
The selection of devices to be reviewed is made by our editorial team. The test sample was provided to the author as a loan by the manufacturer or retailer for the purpose of this review. The lender had no influence on this review, nor did the manufacturer receive a copy of this review before publication. There was no obligation to publish this review. As an independent media company, Notebookcheck is not subjected to the authority of manufacturers, retailers or publishers.
This is how Notebookcheck is testing
Every year, Notebookcheck independently reviews hundreds of laptops and smartphones using standardized procedures to ensure that all results are comparable. We have continuously developed our test methods for around 20 years and set industry standards in the process. In our test labs, high-quality measuring equipment is utilized by experienced technicians and editors. These tests involve a multi-stage validation process. Our complex rating system is based on hundreds of well-founded measurements and benchmarks, which maintains objectivity. Further information on our test methods can be found here.
Price comparison

