Intel Core i9-13980HX
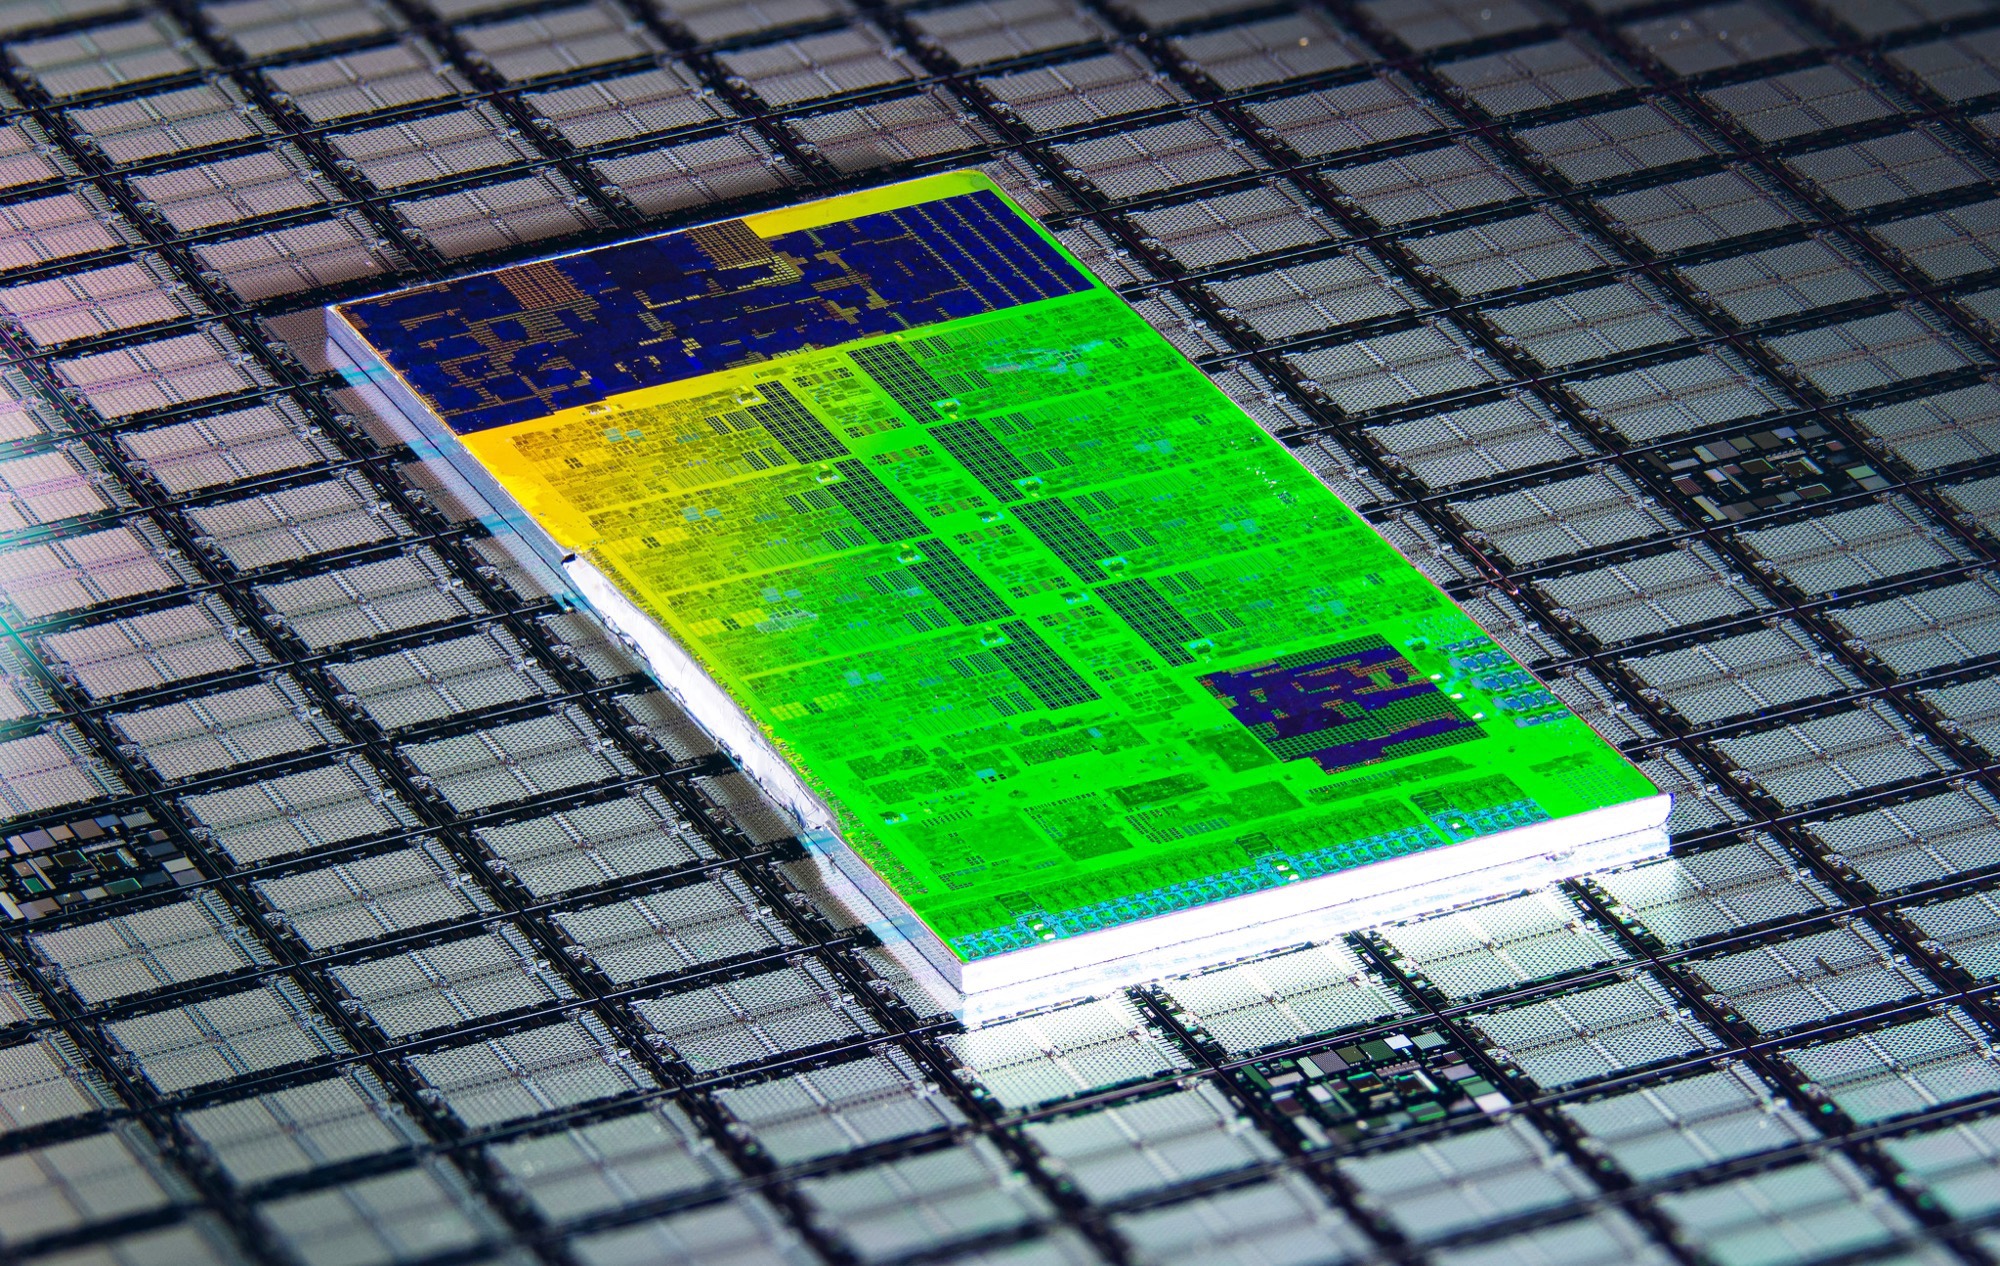
英特尔酷睿 i9-13980HX是 Raptor Lake-HX 系列中的一款快速高端移动处理器。它于 2023 年初发布,基于台式机 酷睿 i9-13000K的基础上,增加了 24 个内核和 32 个线程。八个快速的 Raptor Cove 性能内核(P-cores)配备超线程技术,主频在 2.2 GHz(基本)到 5.6 GHz(单核 Turbo)之间。16 个 Gracemont 内核体积更小、速度更慢,并针对效率进行了优化。它们的主频介于 1.6 GHz(基本)和 4 GHz(Turbo)之间。
与 Alder Lake 相比,Raptor Lake 改进了 P 核心(Raptor Cove 微架构),缓存更大,E 核心(与 Gracemont 微架构相同)更多。此外,该芯片还支持更快的 DDR5 内存(13980HX 最高可达 5600 MHz)。
性能
我们数据库中 13980HX 的平均性能与 酷睿 i9-13950HX和 Ryzen 9 7845HX的多线程基准测试成绩相同。
得益于其出色的散热解决方案和 143 W 的 CPU 长期功耗限制,Alienware m18 R1 的功耗仅为 2.5 W。 m18 R1是我们所知的最快的 13980HX 系统之一。截至 2023 年 8 月,与我们数据库中采用相同芯片的最慢系统相比,它在 CPU 负载工作负载方面至少快 10%。
CPU 仍采用进一步改进的 10nm FinFET 工艺(英特尔 7)生产,从而实现了更高的时钟速度。基本功耗为 55 瓦,最大功耗为 157 瓦。涡轮功率
Series | Intel Raptor Lake-HX |
Codename | Raptor Lake-HX |
Series: Raptor Lake-HX Raptor Lake-HX |
Clock Rate | 1600 - 5600 MHz |
Level 2 Cache | 32 MB |
Level 3 Cache | 36 MB |
Number of Cores / Threads | 24 / 32 8 x 5.6 GHz Intel Raptor Cove P-Core 16 x 4.0 GHz Intel Gracemont E-Core |
Power Consumption (TDP = Thermal Design Power) | 55 Watt |
Manufacturing Technology | 10 nm |
Die Size | 257 mm2 |
Max. Temperature | 100 °C |
Socket | BGA1964 |
Features | DDR4-3200/DDR5-5600 RAM, PCIe 5, Thr. Dir., DL Boost, GNA, MMX, SSE, SSE2, SSE3, SSSE3, SSE4.1, SSE4.2, AVX, AVX2, BMI2, ABM, FMA, ADX, SMEP, SMAP, EIST, TM1, TM2, Hyper-Threading, Turbo, SST, AES-NI, RDRAND, RDSEED, SHA |
GPU | Intel UHD Graphics 770 ( - 1650 MHz) |
64 Bit | 64 Bit support |
Architecture | x86 |
Announcement Date | 01/04/2023 |
Product Link (external) | ark.intel.com |
Benchmarks
Performance Rating - CB R15 + R20 + 7-Zip + X265 + Blender + 3DM11 CPU
54.5 pt (76%)
...
max:
Cinebench R23 - Cinebench R23 Multi Core
min: 28301 avg: 30428 median: 30273 (28%) max: 33052 Points
CPU TDP ? | TDP 65 W | TDP 80 W | TDP 125 W | TDP 130 W | TDP 143 W | TDP 157 W | TDP 170 W |
---|
94% | 87% | 89% | 92% | 93% | 100% | 89% | 97% |
...
...
max:
Cinebench R23 - Cinebench R23 Single Core
min: 1825 avg: 2081 median: 2110 (90%) max: 2169 Points
CPU TDP ? | TDP 65 W | TDP 80 W | TDP 125 W | TDP 130 W | TDP 143 W | TDP 170 W |
---|
98% | 97% | 85% | 99% | 99% | 98% | 100% |
...
...
max:
Cinebench R20 - Cinebench R20 CPU (Single Core)
min: 717 avg: 790 median: 807 (90%) max: 825 Points
CPU TDP ? | TDP 65 W | TDP 80 W | TDP 125 W | TDP 130 W | TDP 143 W | TDP 157 W | TDP 170 W |
---|
98% | 97% | 87% | 88% | 99% | 98% | 94% | 100% |
...
...
max:
Cinebench R20 - Cinebench R20 CPU (Multi Core)
min: 10353 avg: 11583 median: 11510 (28%) max: 12437 Points
CPU TDP ? | TDP 65 W | TDP 80 W | TDP 125 W | TDP 130 W | TDP 143 W | TDP 157 W | TDP 170 W |
---|
95% | 83% | 91% | 90% | 94% | 100% | 90% | 97% |
...
max:
Cinebench R15 - Cinebench R15 CPU Multi 64 Bit
min: 4358 avg: 4724 median: 4717 (30%) max: 5172 Points
CPU TDP ? | TDP 65 W | TDP 80 W | TDP 125 W | TDP 130 W | TDP 143 W | TDP 157 W | TDP 170 W |
---|
98% | 87% | 94% | 92% | 94% | 100% | 91% | 96% |
...
max:
Asus ROG Strix Scar 18 2023 G834JY-N6005W: Ø4253 (4165.8-4357.77)
Asus Vivobook Pro 16X K6604JV-MX016W Höchste Leistung: Ø4345 (3864.36-4543.91)
Lenovo Legion 9 16IRX8: Ø4416 (4337.45-4565.69)
Asus ProArt Studiobook 16 OLED H7604: Ø4477 (4374.45-4604.05)
Asus Vivobook Pro 16X K6604JV-MX016W: Ø3763 (3529.2-4703.12)
Asus ROG Strix G16 G614JZ turbo: Ø4416 (1123.72-4730.93)
Asus ROG Strix G16 G614JZ turbo: Ø4509 (4425.76-4764.17)
Asus ROG Strix Scar 18 2023 G834JY-N6005W: Ø4735 (4684.94-4780.69)
Alienware m18 R1: Ø4934 (4579.8-4989.4)
MSI Titan GT77 HX 13VI: Ø4987 (4917.63-5171.97)
Cinebench R15 - Cinebench R15 CPU Single 64 Bit
min: 289 avg: 303.6 median: 304.5 (92%) max: 312 Points
CPU TDP ? | TDP 65 W | TDP 80 W | TDP 125 W | TDP 130 W | TDP 143 W | TDP 157 W | TDP 170 W |
---|
98% | 98% | 93% | 97% | 97% | 97% | 94% | 100% |
...
max:
Cinebench R11.5 - Cinebench R11.5 CPU Multi 64 Bit
55.8 Points (73%)
...
max:
Cinebench R11.5 - Cinebench R11.5 CPU Single 64 Bit
3.7 Points (93%)
...
max:
Cinebench R10 - Cinebench R10 Rend. Single (32bit)
11940 points (72%)
...
max:
Cinebench R10 - Cinebench R10 Rend. Multi (32bit)
85088 points (62%)
...
max:
Cinebench R10 - Cinebench R10 Rend. Multi (64bit)
125983 Points (87%)
...
max:
Cinebench R10 - Cinebench R10 Rend. Single (64bit)
17400 Points (21%)
...
...
max:
wPrime 2.10 - wPrime 2.0 1024m *
183.5 s (2%)
...
Intel Core i5-11500B
Intel Core i7-9750H
Intel Xeon E-2176M
Intel Core i7-8809G
Intel Core i7-11390H
Intel Core i7-8705G
...
VIA C3-M C3-M-1200
wPrime 2.10 - wPrime 2.0 32m *
3 s (1%)
...
Transmeta Crusoe TM-5800
11438 points (18%)
...
...
max:
7-Zip 18.03 - 7-Zip 18.03 Multli Thread 4 runs
min: 104616 avg: 118958 median: 119244 (68%) max: 129804 MIPS
CPU TDP ? | TDP 65 W | TDP 80 W | TDP 125 W | TDP 130 W | TDP 143 W | TDP 157 W | TDP 170 W |
---|
94% | 89% | 81% | 91% | 90% | 100% | 86% | 95% |
...
...
max:
7-Zip 18.03 - 7-Zip 18.03 Single Thread 4 runs
min: 6889 avg: 6991 median: 6972 (83%) max: 7163 MIPS
CPU TDP ? | TDP 65 W | TDP 80 W | TDP 125 W | TDP 130 W | TDP 143 W | TDP 157 W | TDP 170 W |
---|
98% | 99% | 98% | 98% | 99% | 97% | 88% | 100% |
...
max:
X264 HD Benchmark 4.0 - x264 Pass 2
198.1 fps (69%)
...
max:
X264 HD Benchmark 4.0 - x264 Pass 1
374 fps (86%)
...
max:
HWBOT x265 Benchmark v2.2 - HWBOT x265 4k Preset
min: 27 avg: 31.1 median: 31.6 (56%) max: 33.4 fps
CPU TDP ? | TDP 65 W | TDP 80 W | TDP 125 W | TDP 130 W | TDP 143 W | TDP 170 W |
---|
97% | 88% | 81% | 95% | 90% | 99% | 100% |
...
max:
Asus Vivobook Pro 16X K6604JV-MX016W: Ø23.9 (0.19-27)
Asus ROG Strix Scar 18 2023 G834JY-N6005W: Ø26.1 (0.32-29.2)
Asus ROG Strix G16 G614JZ: Ø25.5 (0.2-29.4)
Asus ProArt Studiobook 16 OLED H7604: Ø27 (0.32-30.2)
MSI Raider GE78 HX 13VI: Ø31.8 (1.45-42.5)
Lenovo Legion 9 16IRX8: Ø30.1 (0.79-33.6)
Alienware m18 R1: Ø28.3 (0.25-32.9)
Asus ROG Strix Scar 18 2023 G834JY-N6005W: Ø33.5 (1.87-45.3)
MSI Titan GT77 HX 13VI: Ø31.7 (0.68-33.6)
TrueCrypt - TrueCrypt Serpent
2.5 GB/s (0%)
...
...
max:
TrueCrypt - TrueCrypt Twofish
4.9 GB/s (84%)
...
max:
TrueCrypt - TrueCrypt AES
18.4 GB/s (48%)
...
max:
Blender - Blender 3.3 Classroom CPU *
min: 170 avg: 194.7 median: 190 (2%) max: 249 Seconds
CPU TDP ? | TDP 65 W | TDP 80 W | TDP 125 W | TDP 130 W | TDP 143 W | TDP 170 W |
---|
101% | 101% | 100% | 101% | 101% | 101% | 101% |
...
...
Intel Celeron J4125
Blender - Blender 2.79 BMW27 CPU *
min: 97 avg: 108.4 median: 106 (1%) max: 136 Seconds
CPU TDP ? | TDP 65 W | TDP 80 W | TDP 125 W | TDP 130 W | TDP 143 W | TDP 157 W | TDP 170 W |
---|
100% | 100% | 100% | 100% | 100% | 100% | 100% | 100% |
...
AMD E1-2100
R Benchmark 2.5 - R Benchmark 2.5 *
min: 0.3793 avg: 0.4 median: 0.4 (8%) max: 0.4041 sec
CPU TDP ? | TDP 65 W | TDP 80 W | TDP 125 W | TDP 130 W | TDP 143 W | TDP 157 W | TDP 170 W |
---|
101% | 101% | 101% | 102% | 101% | 101% | 100% | 102% |
...
AMD E1-2100
3DMark 06 - CPU - 3DMark 06 - CPU
19734 Points (42%)
...
max:
Super Pi mod 1.5 XS 1M - Super Pi mod 1.5 XS 1M *
7.4 s (2%)
...
Intel Core i5-11500B
AMD Ryzen 7 7735H
...
VIA C3-M C3-M-1200
Super Pi mod 1.5 XS 2M - Super Pi mod 1.5 XS 2M *
15.5 s (1%)
...
Intel Core i7-11390H
Intel Core i5-1230U
...
Intel Celeron Dual-Core T1400
Super Pi Mod 1.5 XS 32M - Super Pi mod 1.5 XS 32M *
345.8 s (2%)
Intel Core i7-11390H
Intel Core i5-1230U
...
VIA C3-M C3-M-1200
3DMark 11 - 3DM11 Performance Physics
min: 12665 avg: 23608 median: 25051 (68%) max: 27094 Points
CPU TDP ? | TDP 65 W | TDP 80 W | TDP 125 W | TDP 130 W | TDP 143 W | TDP 170 W |
---|
89% | 84% | 47% | 88% | 95% | 100% | 98% |
...
...
max:
3DMark - 3DMark Ice Storm Physics
min: 91195 avg: 94076 median: 94075.5 (76%) max: 96956 Points
CPU TDP 130 W | TDP 170 W |
---|
100% | 94% |
...
max:
3DMark - 3DMark Ice Storm Extreme Physics
91414 Points (74%)
...
max:
3DMark - 3DMark Ice Storm Unlimited Physics
94552 Points (80%)
...
AMD Ryzen 9 5900HS
max:
3DMark - 3DMark Cloud Gate Physics
min: 15674 avg: 20652 median: 21142 (53%) max: 24650 Points
CPU TDP 65 W | TDP 80 W | TDP 130 W | TDP 170 W |
---|
74% | 64% | 100% | 98% |
...
...
max:
3DMark - 3DMark Fire Strike Standard Physics
min: 19708 avg: 37344 median: 40175 (72%) max: 41644 Points
CPU TDP ? | TDP 65 W | TDP 80 W | TDP 125 W | TDP 130 W | TDP 143 W | TDP 170 W |
---|
93% | 87% | 47% | 93% | 98% | 100% | 99% |
...
max:
3DMark - 3DMark Time Spy CPU
min: 14503 avg: 16587 median: 17026 (72%) max: 18234 Points
CPU TDP ? | TDP 65 W | TDP 80 W | TDP 125 W | TDP 130 W | TDP 143 W | TDP 170 W |
---|
100% | 82% | 84% | 100% | 95% | 99% | 90% |
...
...
max:
Geekbench 6.2 - Geekbench 6.2 Single-Core
min: 2802 avg: 2882 median: 2881.5 (87%) max: 2961 points
CPU TDP ? | TDP 125 W |
---|
95% | 100% |
...
Geekbench 6.2 - Geekbench 6.2 Multi-Core
min: 17472 avg: 17564 median: 17564 (69%) max: 17656 points
CPU TDP ? | TDP 125 W |
---|
100% | 99% |
...
max:
Geekbench 5.5 - Geekbench 5.1 - 5.4 64 Bit Single-Core
min: 1986 avg: 2079 median: 2099 (89%) max: 2139 points
CPU TDP ? | TDP 65 W | TDP 80 W | TDP 125 W | TDP 130 W | TDP 143 W | TDP 157 W | TDP 170 W |
---|
97% | 99% | 94% | 100% | 98% | 97% | 84% | 98% |
...
Geekbench 5.5 - Geekbench 5.1 - 5.4 64 Bit Multi-Core
min: 18475 avg: 20205 median: 20329 (36%) max: 22200 points
CPU TDP ? | TDP 65 W | TDP 80 W | TDP 125 W | TDP 130 W | TDP 143 W | TDP 157 W | TDP 170 W |
---|
93% | 85% | 83% | 93% | 89% | 100% | 86% | 94% |
...
max:
Geekbench 5.0 - Geekbench 5.0 64 Bit Single-Core
1987 points (9%)
...
max:
Geekbench 5.0 - Geekbench 5.0 64 Bit Multi-Core
22107 points (70%)
...
max:
AMD Ryzen Threadripper PRO 3995WX
Mozilla Kraken 1.1 - Kraken 1.1 Total Score *
min: 446 avg: 459.9 median: 451 (1%) max: 515 ms
CPU TDP ? | TDP 65 W | TDP 80 W | TDP 125 W | TDP 130 W | TDP 143 W | TDP 170 W |
---|
100% | 100% | 100% | 100% | 100% | 100% | 100% |
...
Apple M2
Apple M1
...
AMD A4-1250
max:
Apple S7
Octane V2 - Octane V2 Total Score
min: 96184 avg: 102620 median: 102620 (92%) max: 109055 Points
CPU TDP 80 W | TDP 130 W |
---|
88% | 100% |
...
...
WebXPRT 4 - WebXPRT 4 Score
min: 254 avg: 298.6 median: 306 (88%) max: 318 Points
CPU TDP ? | TDP 80 W | TDP 125 W | TDP 130 W | TDP 143 W | TDP 170 W |
---|
94% | 80% | 96% | 96% | 96% | 100% |
...
max:
WebXPRT 3 - WebXPRT 3 Score
min: 277 avg: 330.2 median: 337 (70%) max: 349 Points
CPU TDP ? | TDP 65 W | TDP 80 W | TDP 125 W | TDP 130 W | TDP 143 W | TDP 170 W |
---|
94% | 98% | 79% | 100% | 97% | 97% | 97% |
...
...
CrossMark - CrossMark Overall
min: 1935 avg: 2079 median: 2080 (80%) max: 2182 Points
CPU TDP 65 W | TDP 80 W | TDP 125 W | TDP 130 W | TDP 143 W | TDP 170 W |
---|
93% | 94% | 89% | 99% | 100% | 96% |
...
max:
Power Consumption - Prime95 Power Consumption - external Monitor *
min: 157.3 avg: 197.5 median: 191.9 (33%) max: 262 Watt
CPU TDP 65 W | TDP 80 W | TDP 125 W | TDP 130 W | TDP 143 W |
---|
123% | 129% | 116% | 127% | 100% |
...
max:
AMD Ryzen Threadripper PRO 3975WX
Asus ROG Strix G16 G614JZ: Ø157.3 (143.6-190.8)
Asus Vivobook Pro 16X K6604JV-MX016W: Ø170.9 (44.2-234)
Asus ROG Strix Scar 18 2023 G834JY-N6005W: Ø188.8 (171.7-199.7)
Asus ProArt Studiobook 16 OLED H7604: Ø195 (94.6-239)
Lenovo Legion 9 16IRX8: Ø211 (195.9-228)
Alienware m18 R1: Ø262 (239-295)
Power Consumption - Cinebench R15 Multi Power Consumption - external Monitor *
min: 172.2 avg: 222.5 median: 225 (41%) max: 291 Watt
CPU TDP 65 W | TDP 80 W | TDP 125 W | TDP 130 W | TDP 143 W | TDP 170 W |
---|
146% | 132% | 116% | 135% | 100% | 122% |
...
...
max:
Asus ROG Strix Scar 18 2023 G834JY-N6005W: Ø172.2 (128.1-186)
Asus ROG Strix G16 G614JZ: Ø175.1 (169.3-176.9)
Asus Vivobook Pro 16X K6604JV-MX016W: Ø210 (115.7-230)
Asus ProArt Studiobook 16 OLED H7604: Ø225 (212-230)
Asus ROG Strix Scar 18 2023 G834JY-N6005W: Ø235 (162.8-253)
Lenovo Legion 9 16IRX8: Ø249 (237-257)
Alienware m18 R1: Ø291 (287-295)
Power Consumption - Geekbench 5.5 Power Consumption 150cd *
230 Watt (100%)
Apple M1
Apple M2
Intel Core i3-1115G4
Asus ROG Strix Scar 18 2023 G834JY-N6005W: Ø230 (139.1-255)
Power Consumption - Idle Power Consumption - external Monitor *
min: 19.8 avg: 25.3 median: 23.2 (15%) max: 32.3 Watt
CPU TDP 65 W | TDP 80 W | TDP 125 W | TDP 130 W | TDP 143 W | TDP 170 W |
---|
103% | 110% | 100% | 110% | 108% | 101% |
...
...
max:
Asus ROG Strix G16 G614JZ: Ø19.8 (17.1-25.4)
Asus Vivobook Pro 16X K6604JV-MX016W: Ø20.2 (12.3-38.9)
Asus ProArt Studiobook 16 OLED H7604: Ø21.3 (12.6-35.5)
Alienware m18 R1: Ø23.2 (17.2-48.7)
Asus ROG Strix Scar 18 2023 G834JY-N6005W: Ø28.7 (21.5-39.7)
Asus ROG Strix Scar 18 2023 G834JY-N6005W: Ø31.4 (26-57.7)
Lenovo Legion 9 16IRX8: Ø32.3 (21.8-57.2)
Power Consumption - Idle Power Consumption 150cd 1min *
min: 15.2 avg: 25.2 median: 24.9 (28%) max: 37.8 Watt
CPU TDP 65 W | TDP 80 W | TDP 125 W | TDP 130 W | TDP 143 W | TDP 170 W |
---|
121% | 143% | 101% | 139% | 125% | 100% |
...
max:
Asus Vivobook Pro 16X K6604JV-MX016W: Ø15.2 (4.02-27.7)
Asus ROG Strix G16 G614JZ: Ø16.4 (10.8-68.1)
Asus ProArt Studiobook 16 OLED H7604: Ø18.4 (12.9-25.5)
Alienware m18 R1: Ø24.9 (23.1-32.8)
Asus ROG Strix Scar 18 2023 G834JY-N6005W: Ø26.6 (20.6-45.4)
Lenovo Legion 9 16IRX8: Ø37.2 (33.2-58.1)
Asus ROG Strix Scar 18 2023 G834JY-N6005W: Ø37.8 (29.1-89.3)
Power Consumption - Cinebench R15 Multi Power Efficiency - external Monitor
min: 18.3 avg: 21.1 median: 20.4 (15%) max: 25.3 Points per Watt
CPU TDP 65 W | TDP 125 W | TDP 130 W | TDP 170 W |
---|
100% | 72% | 81% | 80% |
...
...
- Range of benchmark values for this graphics card
- Average benchmark values for this graphics card
* Smaller numbers mean a higher performance
v1.26
log 25. 14:41:00
#0 no ids found in url (should be separated by "_") +0s ... 0s
#1 not redirecting to Ajax server +0s ... 0s
#2 did not recreate cache, as it is less than 5 days old! Created at Thu, 25 Apr 2024 05:38:32 +0200 +0.001s ... 0.001s
#3 no comparison url found in template nbc.compare_page_2 needed +0.016s ... 0.017s
#4 no comparison url found in template nbc.compare_page_2 needed +0s ... 0.018s
#5 no comparison url found in template nbc.compare_page_2 needed +0s ... 0.018s
#6 no comparison url found in template nbc.compare_page_2 needed +0s ... 0.018s
#7 no comparison url found in template nbc.compare_page_2 needed +0s ... 0.019s
#8 no comparison url found in template nbc.compare_page_2 needed +0s ... 0.019s
#9 no comparison url found in template nbc.compare_page_2 needed +0s ... 0.019s
#10 no comparison url found in template nbc.compare_page_2 needed +0s ... 0.02s
#11 composed specs +0.001s ... 0.021s
#12 did output specs +0s ... 0.021s
#13 getting avg benchmarks for device 14665 +0.02s ... 0.041s
#14 got single benchmarks 14665 +0.046s ... 0.087s
#15 got avg benchmarks for devices +0s ... 0.087s
#16 min, max, avg, median took s +1.098s ... 1.184s
#17 no comparison url found in template nbc.compare_page_2 needed +0s ... 1.185s
#18 return log +0s ... 1.185s
Reviews for the Intel Core i9-13980HX processor
Legion 9i Gen 8 16IRX8 评测:联想最具雄心的游戏笔记本电脑
在推出了Legion 5 和Legion 7 两款产品之后,联想终于准备通过Legion 9i 16 G8 重新审视其旗舰产品Legion 9 系列。当你甚至无法选择比酷睿 i9-13980HX 更慢的处理器时,你就知道事情变得严重了。...
Intel Core i9-13980HX | NVIDIA GeForce RTX 4090 Laptop GPU | 16.00" | 2.6 kg
华硕 Vivobook Pro 16X 评测:配备出色处理器的创意笔记本
得益于出色的英特尔酷睿 i9 处理器、性能不俗的 RTX 4060 和 OLED 显示屏,VivoBook Pro 16X 在图像和视频编辑方面的优势毋庸置疑。硬件,尤其是输入设备,也非常适合创作者笔记本。不过,在其他方面也有所节省。...
Intel Core i9-13980HX | NVIDIA GeForce RTX 4060 Laptop GPU | 16.00" | 2.1 kg
华硕ProArt Studiobook 16 OLED回顾:具有极端CPU性能的多媒体笔记本电脑
华硕在ProArt Studiobook 16 OLED中为创意用户提供了一台强大的机器。英特尔的酷睿i9-13980HX和GeForce RTX 4070笔记本电脑照顾到了性能相关的事项,但新的120赫兹OLED面板并不完全令人信服。...
Intel Core i9-13980HX | NVIDIA GeForce RTX 4070 Laptop GPU | 16.00" | 2.4 kg
Alienware m18 R1笔记本电脑评测:比微星泰坦GT77更大、更重
戴尔正在恢复其18英寸的Alienware笔记本电脑,几乎拥有我们在阳光下能想到的所有功能:4块M.2固态硬盘,480赫兹刷新率,175瓦GPU,液态金属冷却,蒸气室冷却,高级优化,甚至还有可选的CherryMX机械按键。然而,Alienware m18 R1几乎有9磅重,是近期记忆中最重的笔记本电脑之一。...
Intel Core i9-13980HX | NVIDIA GeForce RTX 4090 Laptop GPU | 18.00" | 3.9 kg
华硕ROG Strix G16 G614JZ笔记本电脑回顾。为RTX 4080清除舞台
ROG Strix G16是我们在2023年仍未成熟的情况下评测的第三款Strix。根据最近的经验,选择缩减到16英寸的模型是一个好的选择。我们看到,4080完全适合RTX 4090和RTX 4070之间。在ROG Strix G16中,GeForce 显卡终于能够展示其能力。 ...
Intel Core i9-13980HX | NVIDIA GeForce RTX 4080 Laptop GPU | 16.00" | 2.4 kgAsus ROG Strix Scar 18 2023 G834JY-N6005W: NVIDIA GeForce RTX 4090 Laptop GPU, 18.00", 3.1 kg
Review » 华硕ROG Strix Scar 18 2023 G834JY评测--配备RTX 4090的游戏笔记本
MSI Vector 16 HX A13VHG: NVIDIA GeForce RTX 4080 Laptop GPU, 15.60", 2.7 kg
External Review » MSI Vector 16 HX A13VHG
Asus ProArt Studiobook 16 OLED W7604: NVIDIA RTX 3000 Ada Generation Laptop GPU, 16.00", 2.4 kg
External Review » Asus ProArt Studiobook 16 OLED W7604
MSI Vector GP78 HX 13VI: NVIDIA GeForce RTX 4090 Laptop GPU, 17.30", 3 kg
External Review » MSI Vector GP78 HX 13VI
Lenovo Legion 9 16IRX8, RTX 4080: NVIDIA GeForce RTX 4080 Laptop GPU, 16.00", 2.6 kg
External Review » Lenovo Legion 9 16IRX8, RTX 4080
Asus VivoBook Pro 16X K6604JV: NVIDIA GeForce RTX 4060 Laptop GPU, 16.00", 1.9 kg
External Review » Asus VivoBook Pro 16X K6604JV
MSI Vector GP78 HX 13VH: NVIDIA GeForce RTX 4080 Laptop GPU, 17.00", 3 kg
External Review » MSI Vector GP78 HX 13VH
Lenovo Legion 9 16IRX8: NVIDIA GeForce RTX 4090 Laptop GPU, 16.00", 2.6 kg
External Review » Lenovo Legion 9 16IRX8
Asus ROG Strix Scar 18 G834JZ: NVIDIA GeForce RTX 4080 Laptop GPU, 18.00", 3.1 kg
External Review » Asus ROG Strix Scar 18 G834JZ
Asus ProArt StudioBook 16 OLED H7604JI: NVIDIA GeForce RTX 4070 Laptop GPU, 16.00", 2.4 kg
External Review » Asus ProArt StudioBook 16 OLED H7604JI
Asus VivoBook Pro 16 OLED K6604JI: NVIDIA GeForce RTX 4070 Laptop GPU, 16.00", 2 kg
External Review » Asus VivoBook Pro 16 OLED K6604JI
Asus ROG Strix G16 G614JZ: NVIDIA GeForce RTX 4080 Laptop GPU, 16.00", 2.4 kg
External Review » Asus ROG Strix G16 G614JZ
MSI Raider GE78 HX 13VI: NVIDIA GeForce RTX 4090 Laptop GPU, 17.00", 3.1 kg
External Review » MSI Raider GE78 HX 13VI
MSI CreatorPro X17 HX A13VM: NVIDIA RTX A5000 Laptop GPU, 17.30", 3.3 kg
External Review » MSI CreatorPro X17 HX A13VM
Asus ProArt Studiobook 16 OLED H7604: NVIDIA GeForce RTX 4070 Laptop GPU, 16.00", 2.4 kg
External Review » Asus ProArt Studiobook 16 OLED H7604
Asus ROG Strix G16 G614JV: NVIDIA GeForce RTX 4060 Laptop GPU, 16.00", 2.5 kg
External Review » Asus ROG Strix G16 G614JV
Asus ROG Strix G18 G814JI, i9-13980HX: NVIDIA GeForce RTX 4070 Laptop GPU, 18.00", 3 kg
External Review » Asus ROG Strix G18 G814JI, i9-13980HX
Asus ROG Strix G16 G614JI: NVIDIA GeForce RTX 4070 Laptop GPU, 16.00", 2.5 kg
External Review » Asus ROG Strix G16 G614JI
Asus ROG Strix Scar 16 G634JZ: NVIDIA GeForce RTX 4080 Laptop GPU, 16.00", 2.5 kg
External Review » Asus ROG Strix Scar 16 G634JZ
Alienware m18 R1: NVIDIA GeForce RTX 4090 Laptop GPU, 18.00", 3.9 kg
External Review » Alienware m18 R1
Asus ROG Strix Scar 16 G634JY-NM001W: NVIDIA GeForce RTX 4090 Laptop GPU, 16.00", 2.5 kg
External Review » Asus ROG Strix Scar 16 2023 G634JY-NM001W
MSI Titan GT77 HX 13VI-044: NVIDIA GeForce RTX 4090 Laptop GPU, 17.30", 3.3 kg
External Review » MSI Titan GT77 HX 13VI-044
Asus ROG Strix Scar 18 2023 G834JY-N6005W: NVIDIA GeForce RTX 4090 Laptop GPU, 18.00", 3.1 kg
External Review » Asus ROG Strix Scar 18 2023 G834JY-N6005W
Please share our article, every link counts!
Other CPUs of the series Raptor Lake-HX
Surrounding CPUs
Klaus Hinum (Update: 2023-11-26)