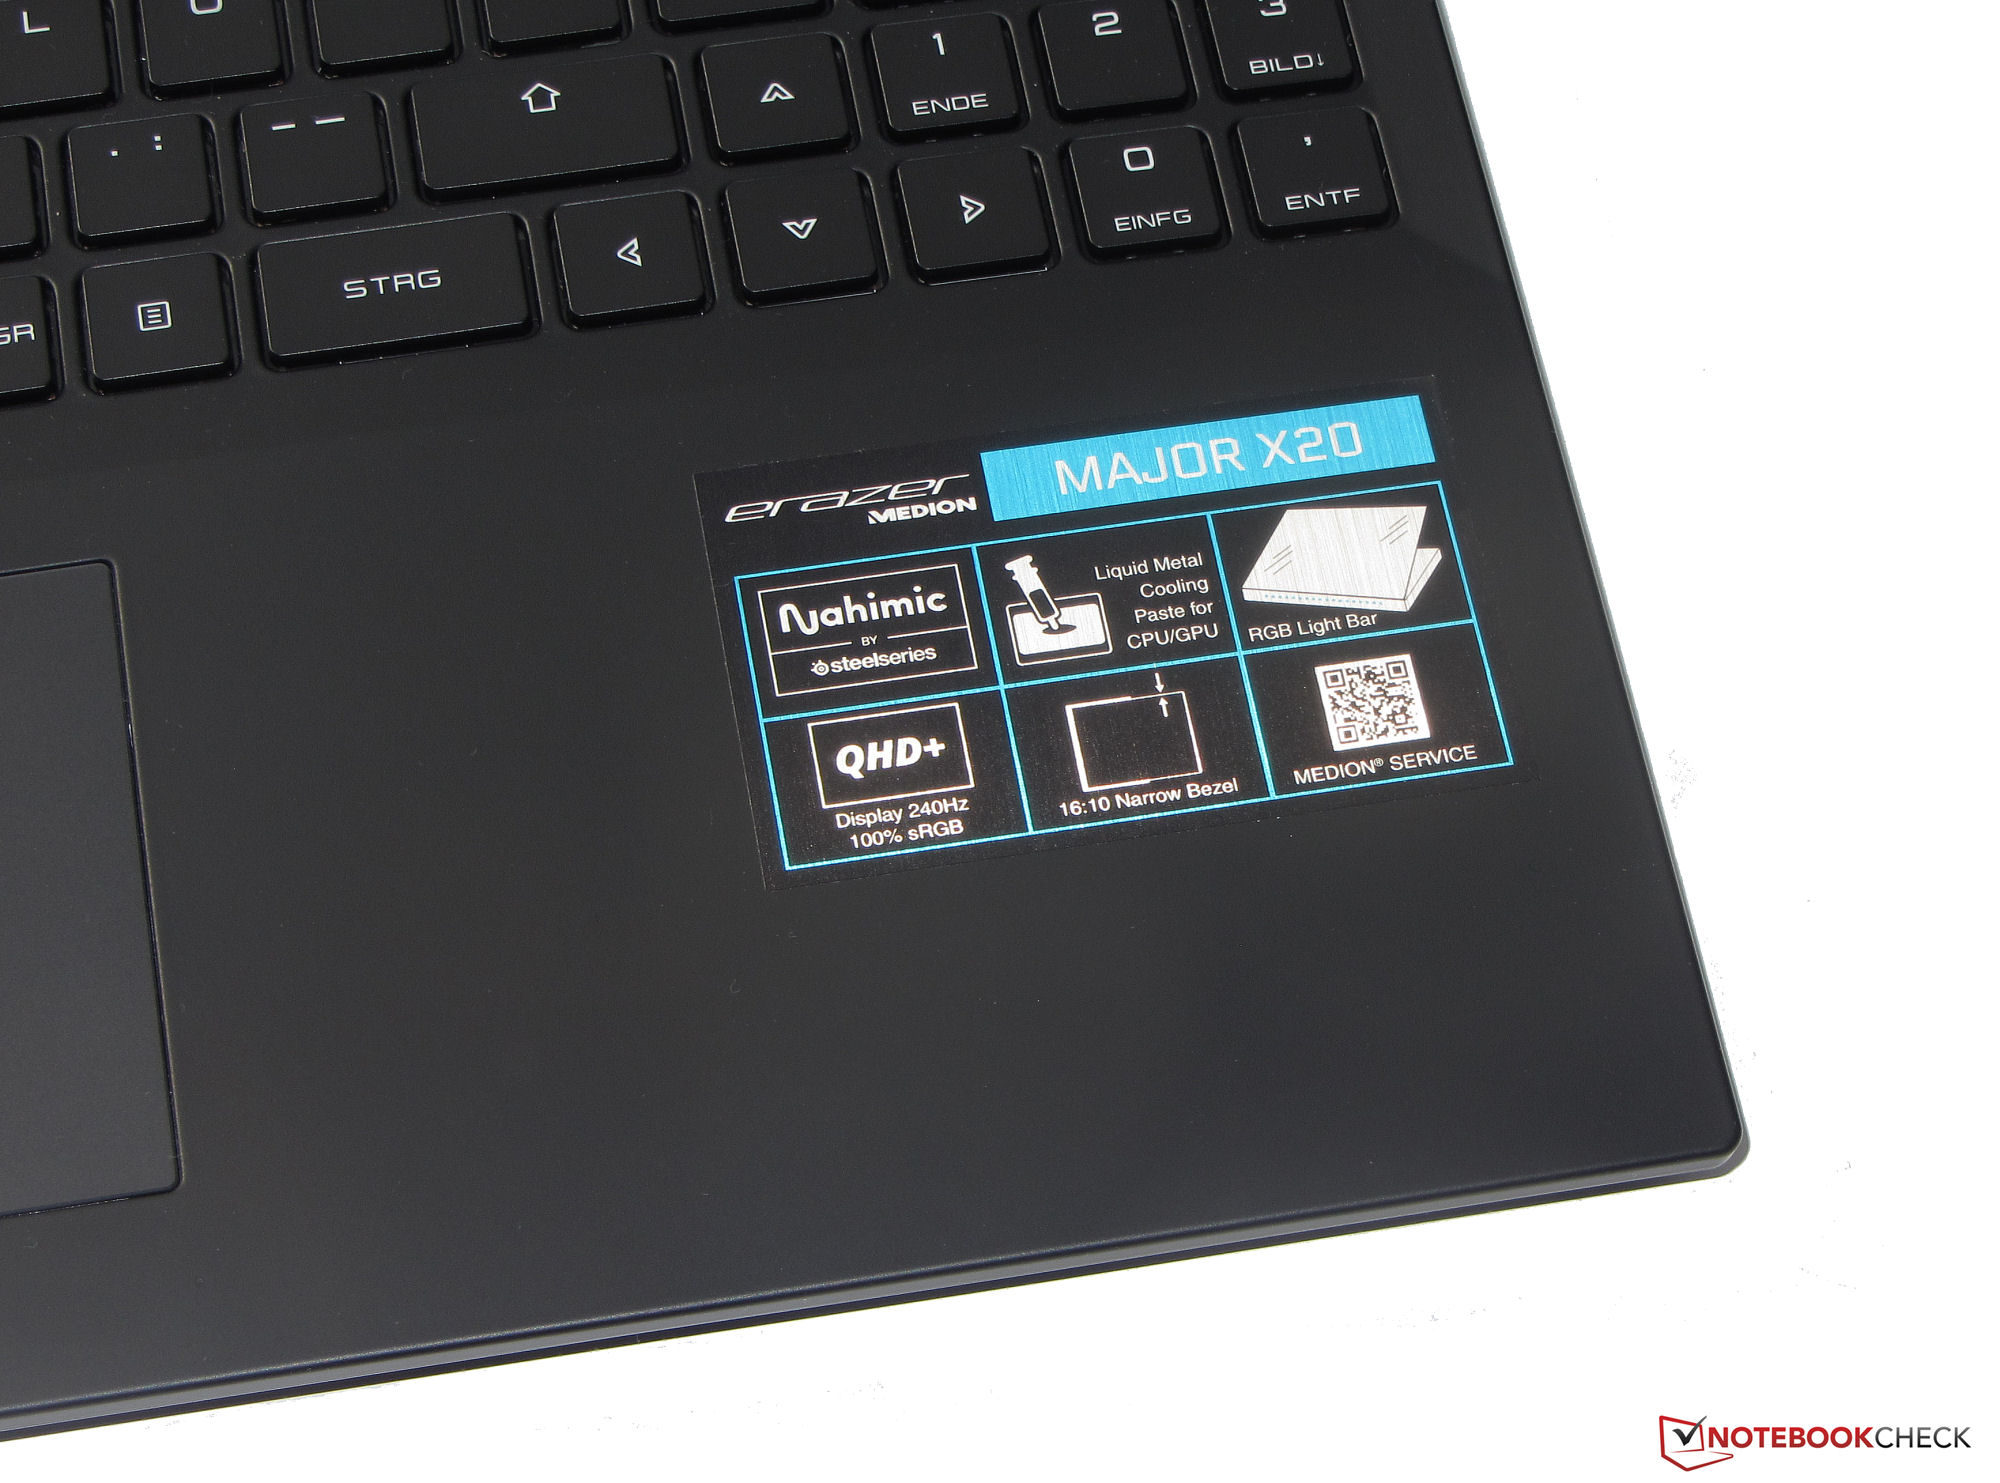
Medion Erazer Major X20回顾:配备RTX 4070和坚实硬件的游戏笔记本
Medion Erazer Major X20主要是一款游戏笔记本,但也是为其他计算密集型应用场景而生。与它的前辈相比相比,X20得到了一些有用的升级:Arc A730M。 弧形A730M图形核心已经让位给明显更强大的 GeForce RTX 4070.此外,机械键盘取代了Chiclet模型,而两个USB-C端口(USB 3.2 Gen 2)中的一个已经被移除,剩下的一个已经升级为雷电4端口。
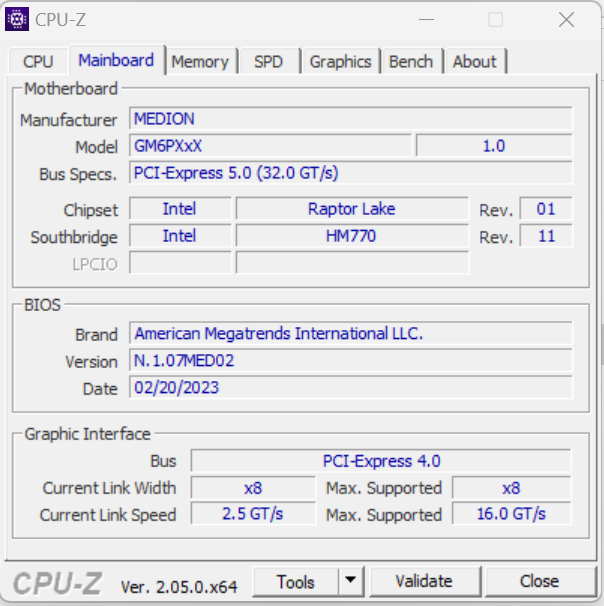
X20基于同方裸机(GM6PX7X),与XMG Neo 16的已知型号基本相似,但缺少水冷接口。竞争者包括笔记本电脑,如 Aorus 15X ASF,以及 Razer Blade 15 OLED (Early 22)和 华硕ROG Strix G17 G713PI.
潜在的竞争对手比较
Rating | Date | Model | Weight | Height | Size | Resolution | Price |
|---|---|---|---|---|---|---|---|
| 89 % v7 (old) | 04 / 2023 | Medion Erazer Major X20 i9-13900HX, GeForce RTX 4070 Laptop GPU | 2.4 kg | 29 mm | 16.00" | 2560x1600 | |
| 86.2 % v7 (old) | 04 / 2023 | Aorus 15X ASF i7-13700HX, GeForce RTX 4070 Laptop GPU | 2.3 kg | 19.7 mm | 15.60" | 2560x1440 | |
| 89.9 % v7 (old) | 03 / 2023 | Razer Blade 15 OLED (Early 2022) i9-12900H, GeForce RTX 3070 Ti Laptop GPU | 2 kg | 16.99 mm | 15.60" | 2560x1440 | |
| 88.4 % v7 (old) | 04 / 2023 | Asus ROG Strix G17 G713PI R9 7945HX, GeForce RTX 4070 Laptop GPU | 2.8 kg | 30.7 mm | 17.30" | 2560x1440 |
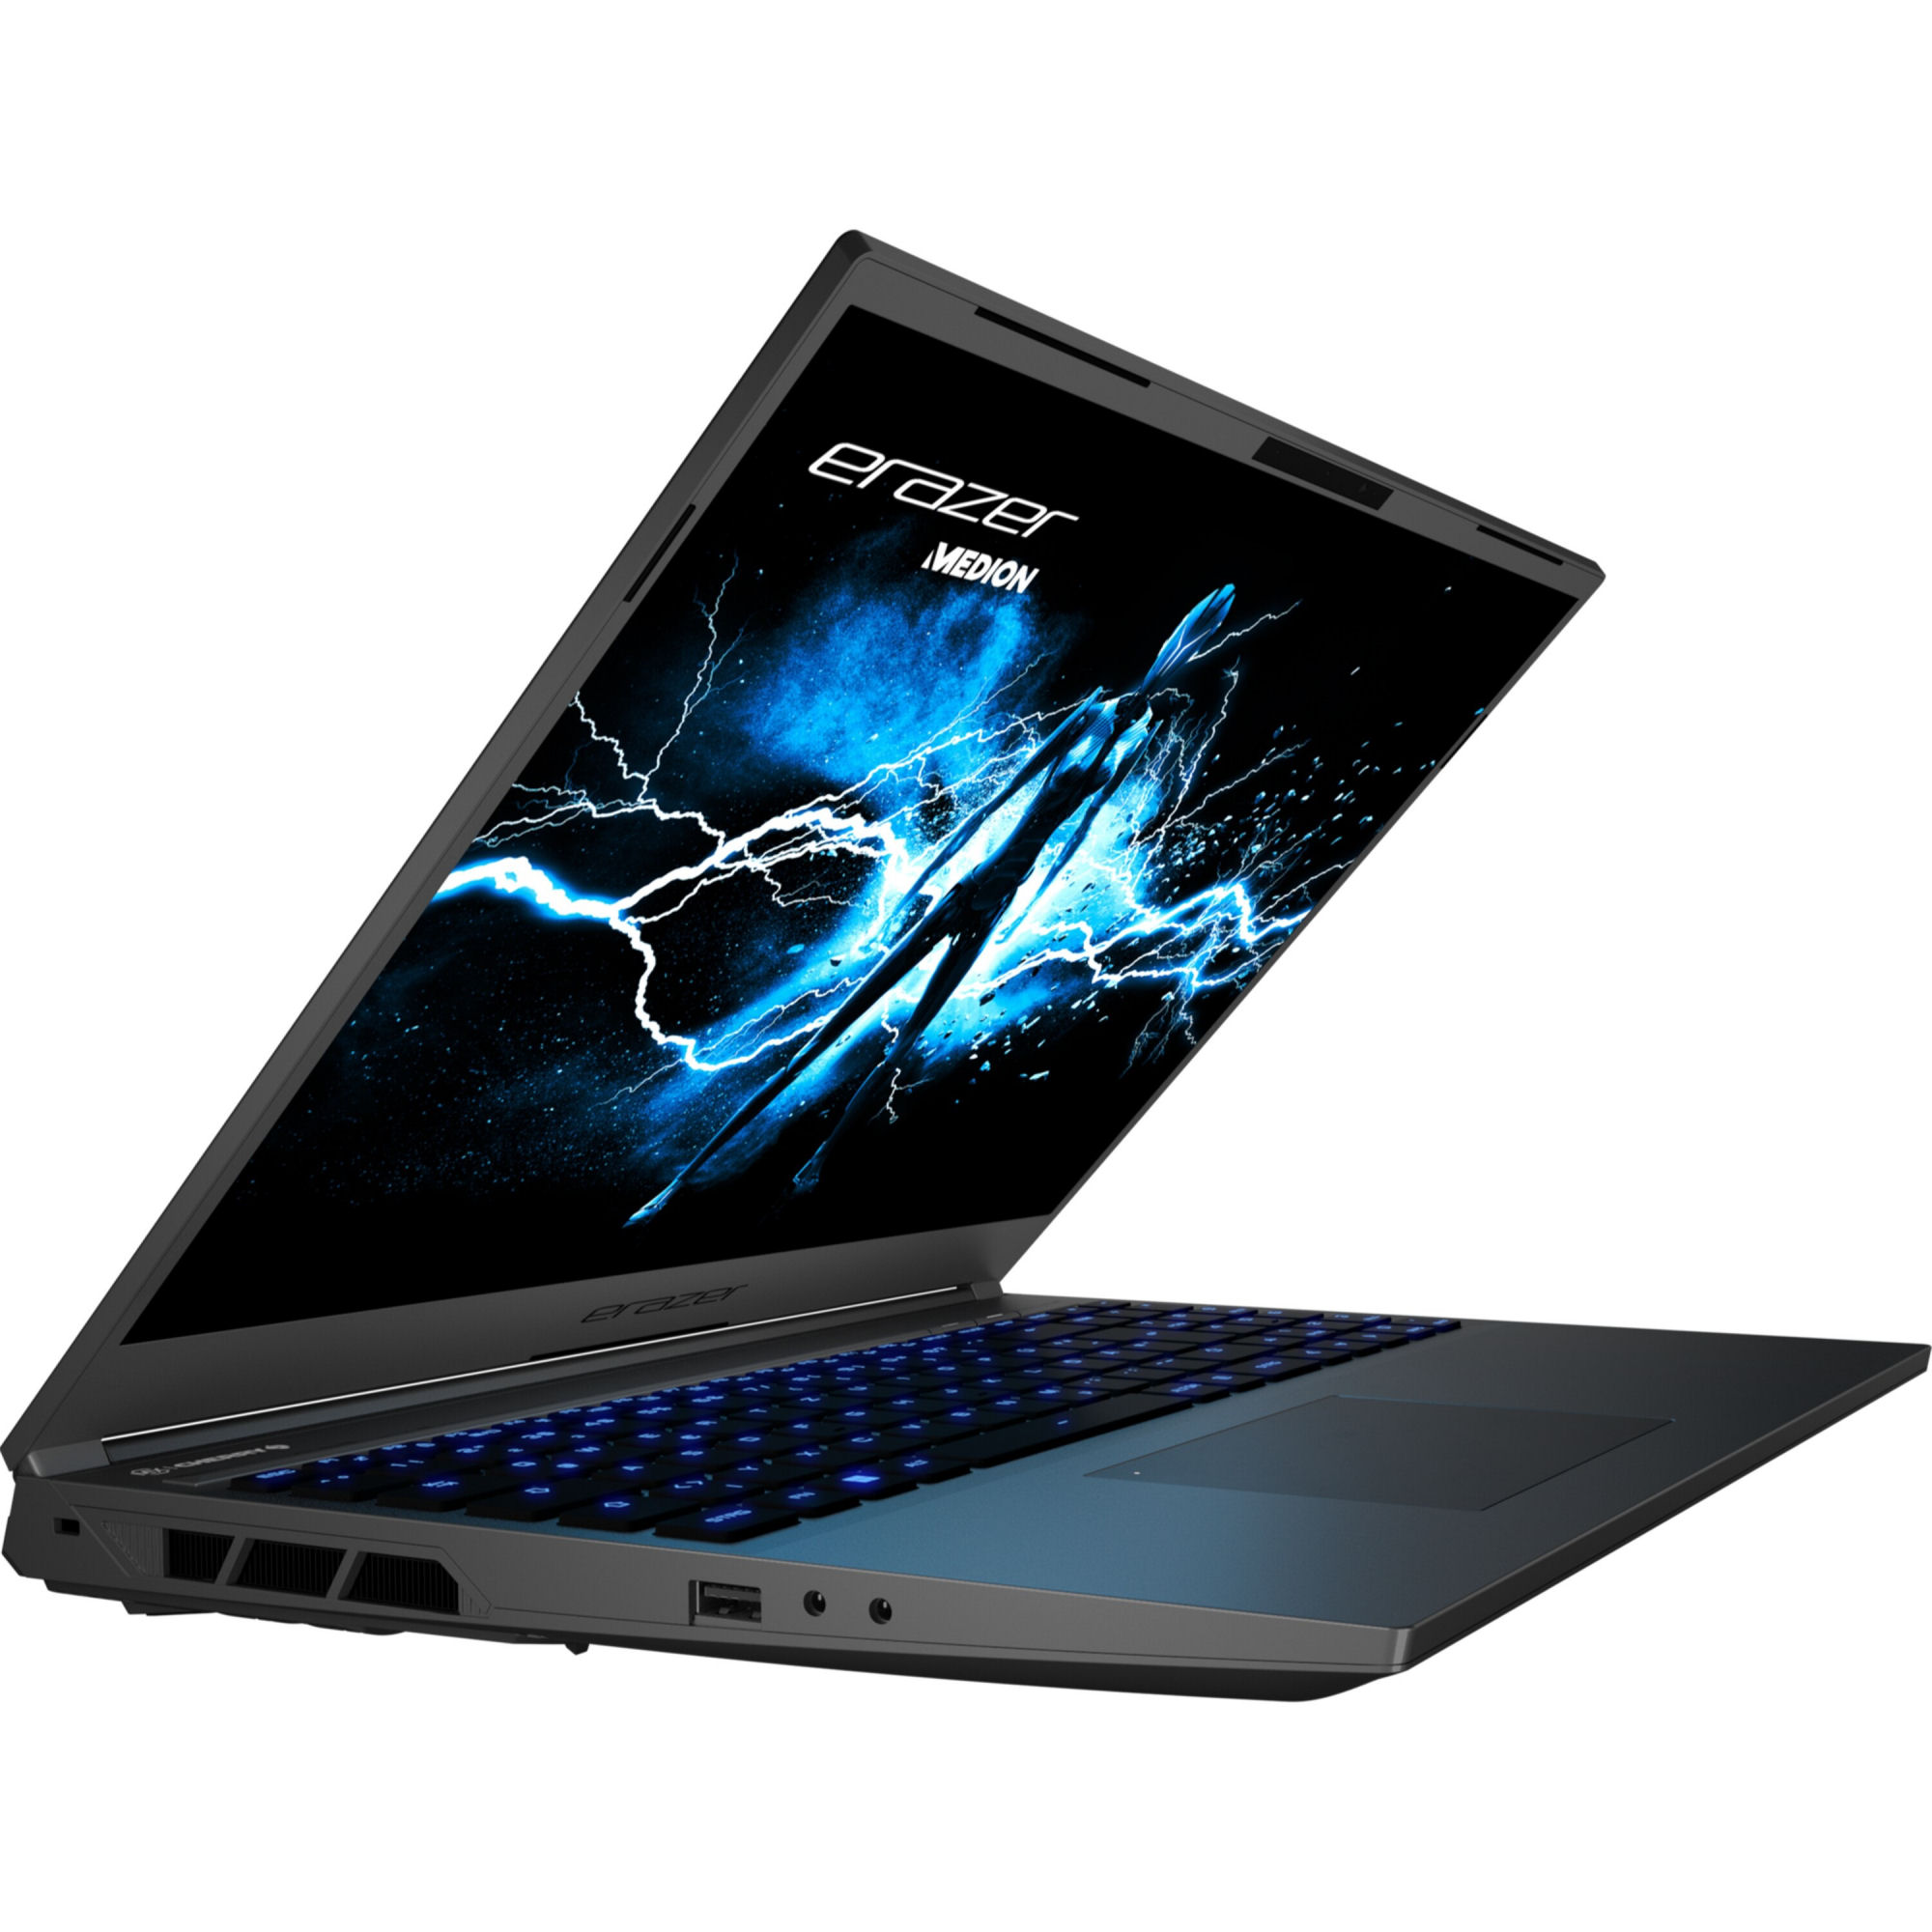
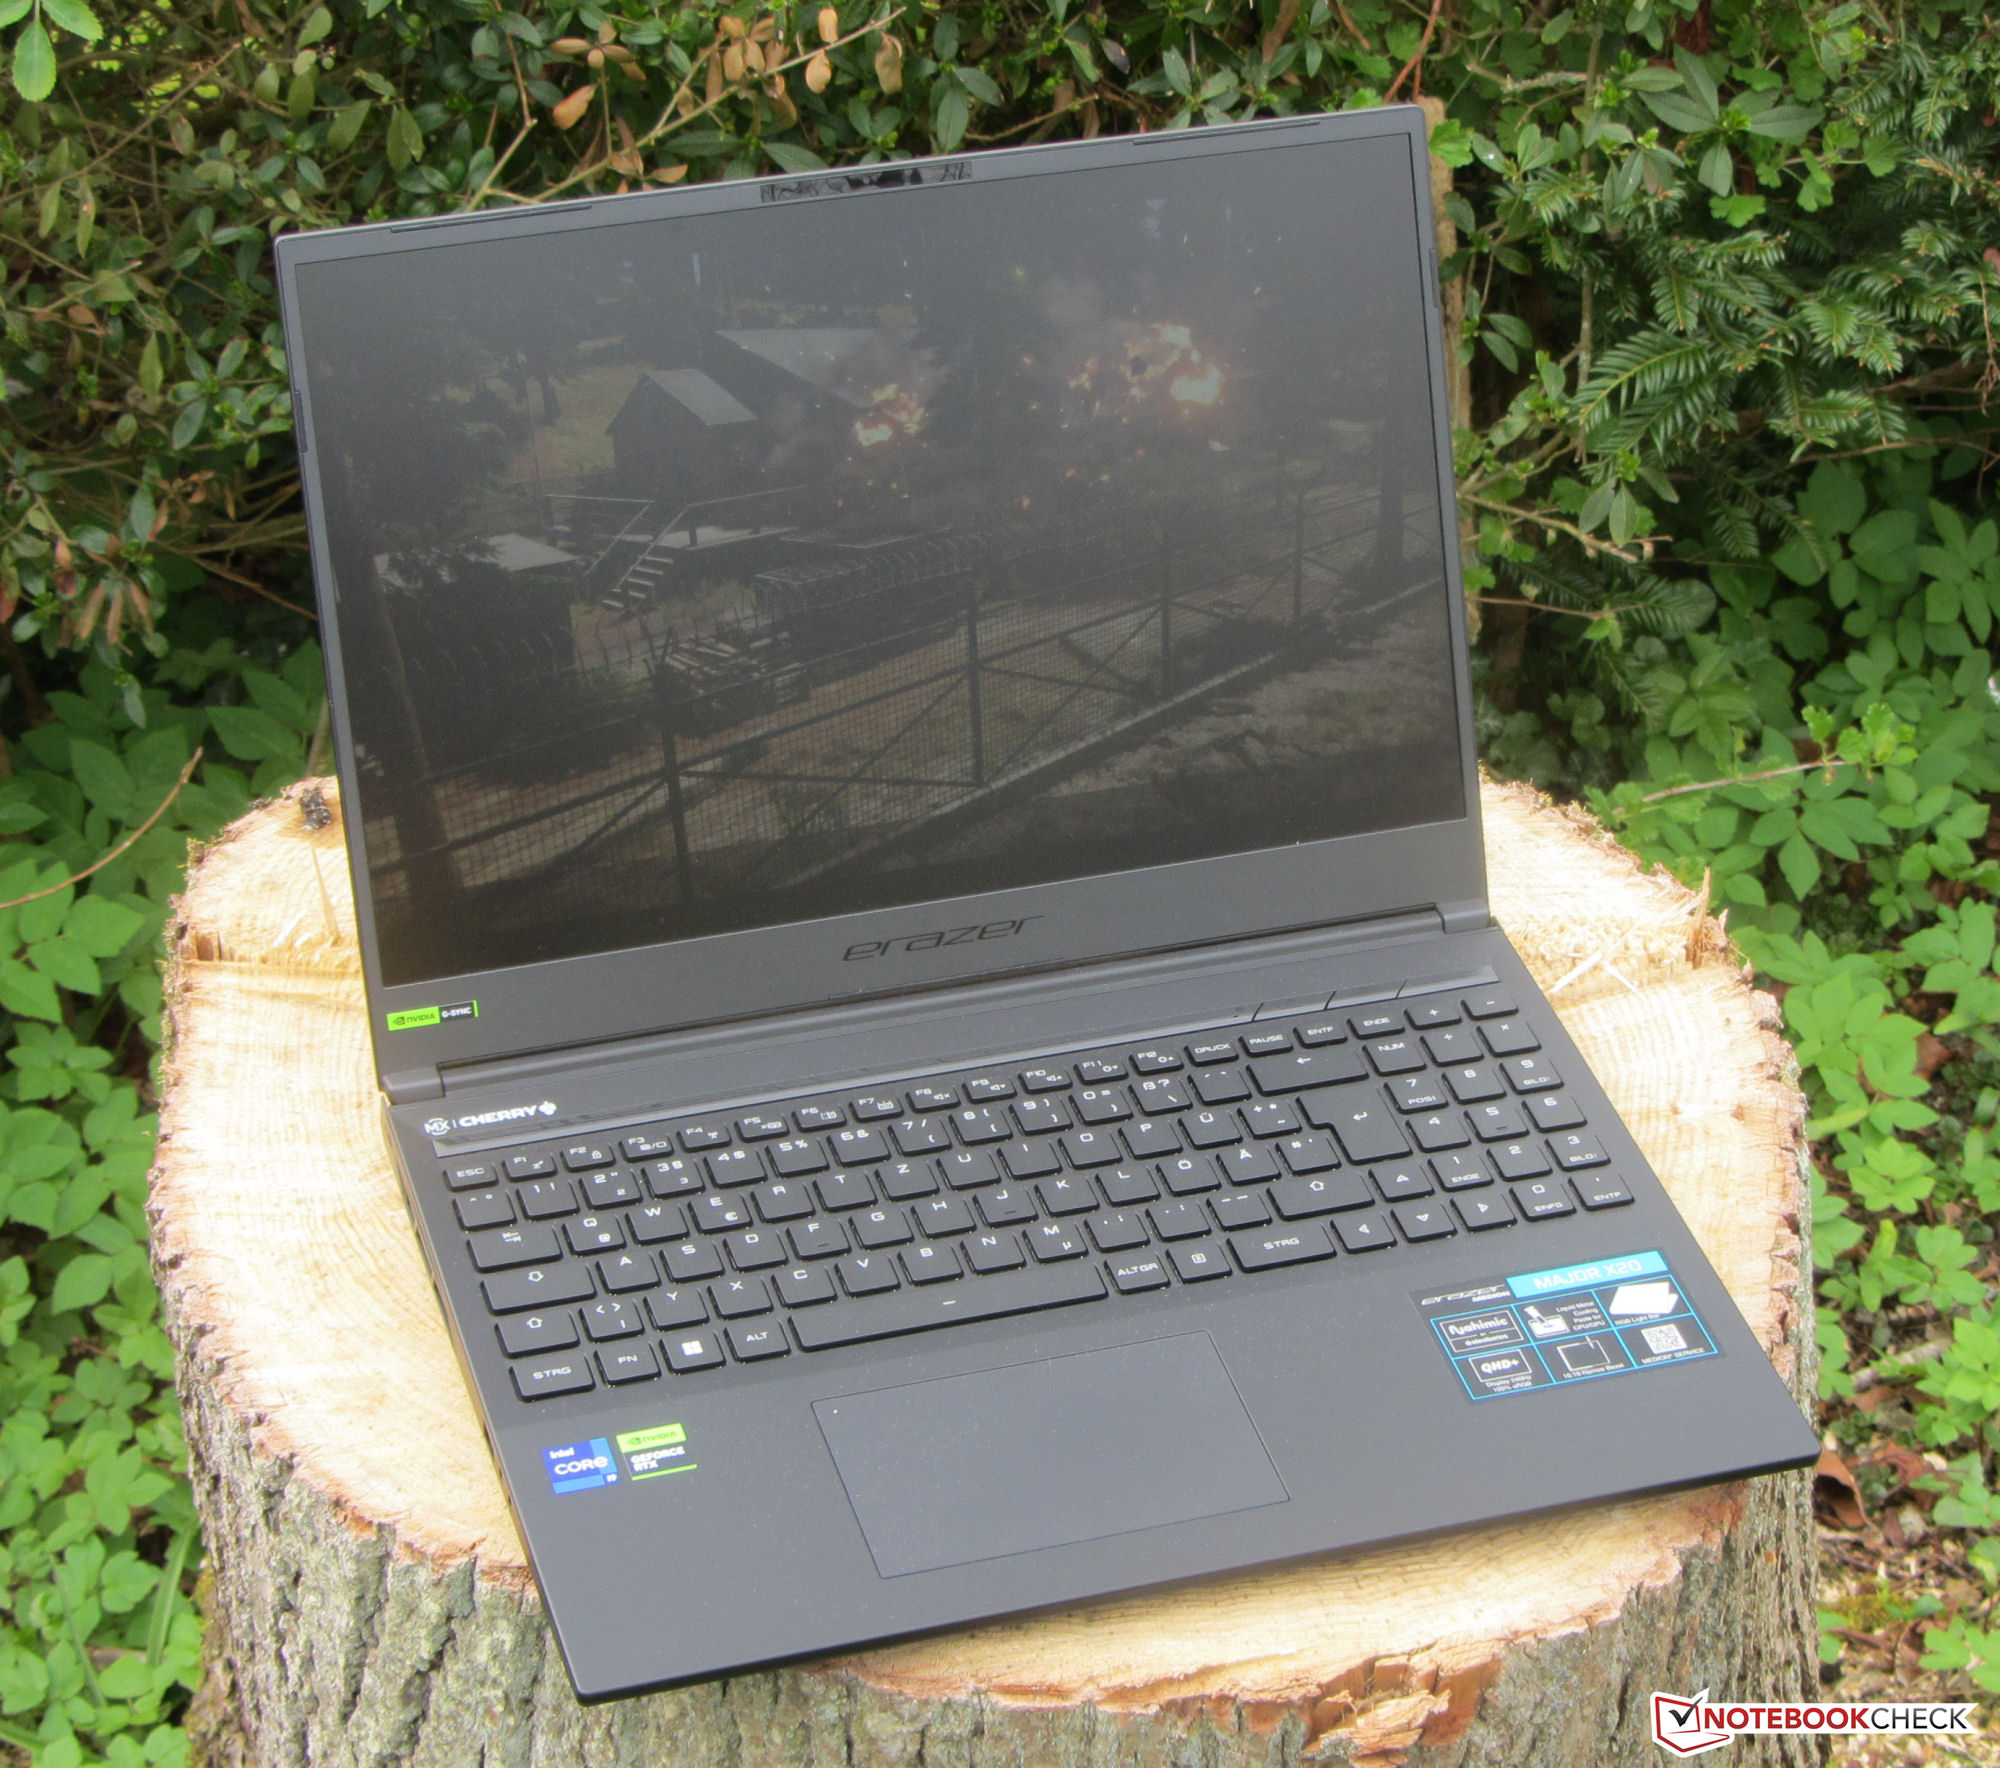
箱子--为Medion笔记本电脑提供一个隐蔽的外部。
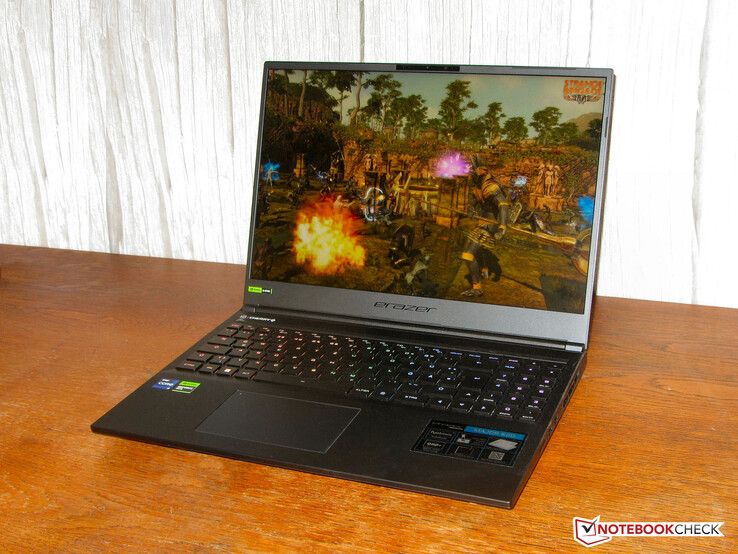
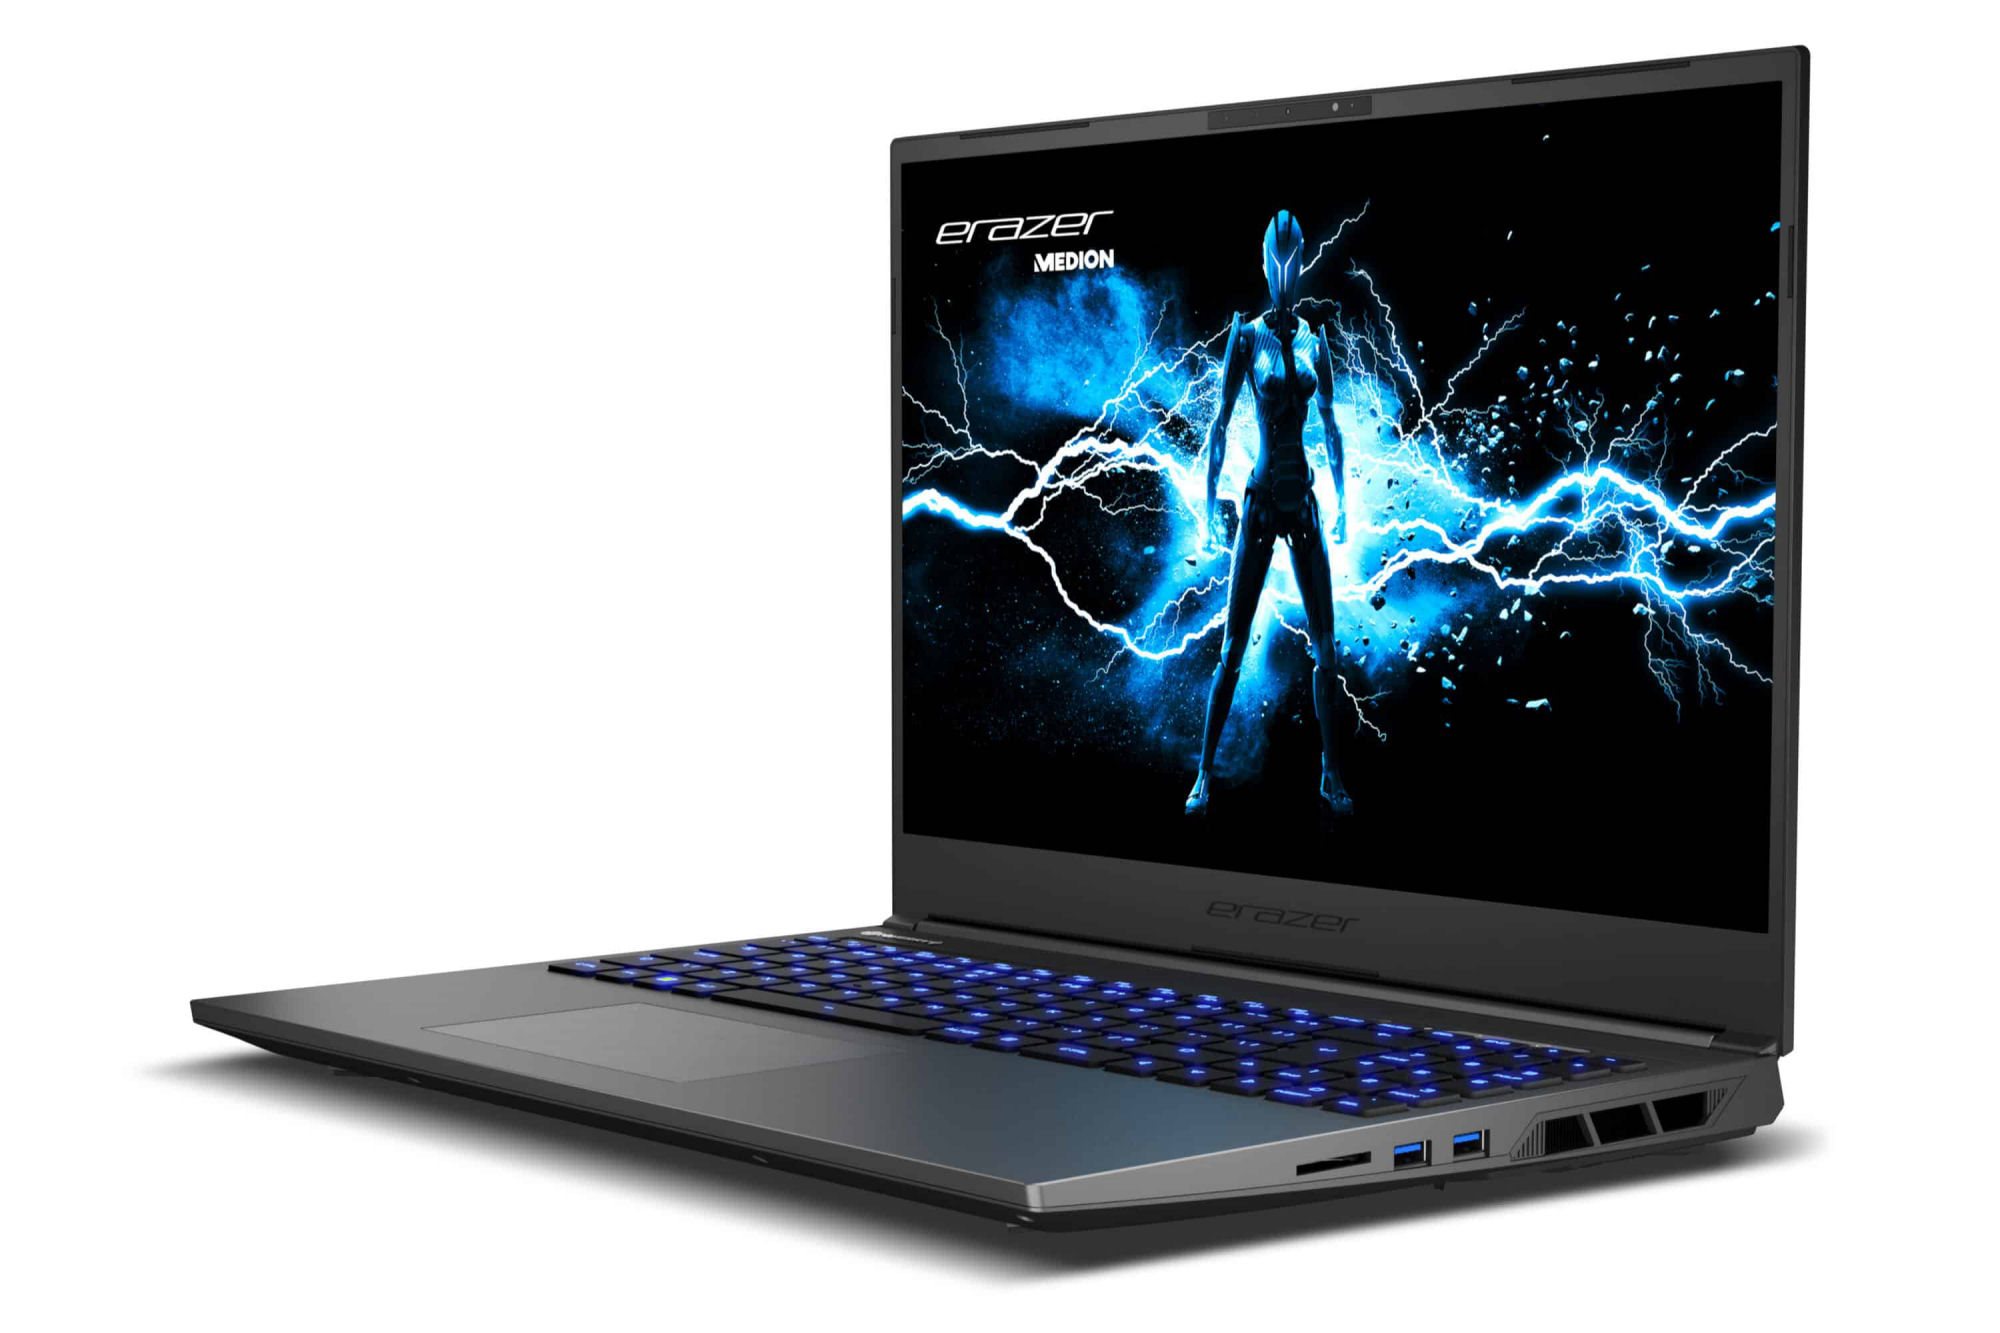
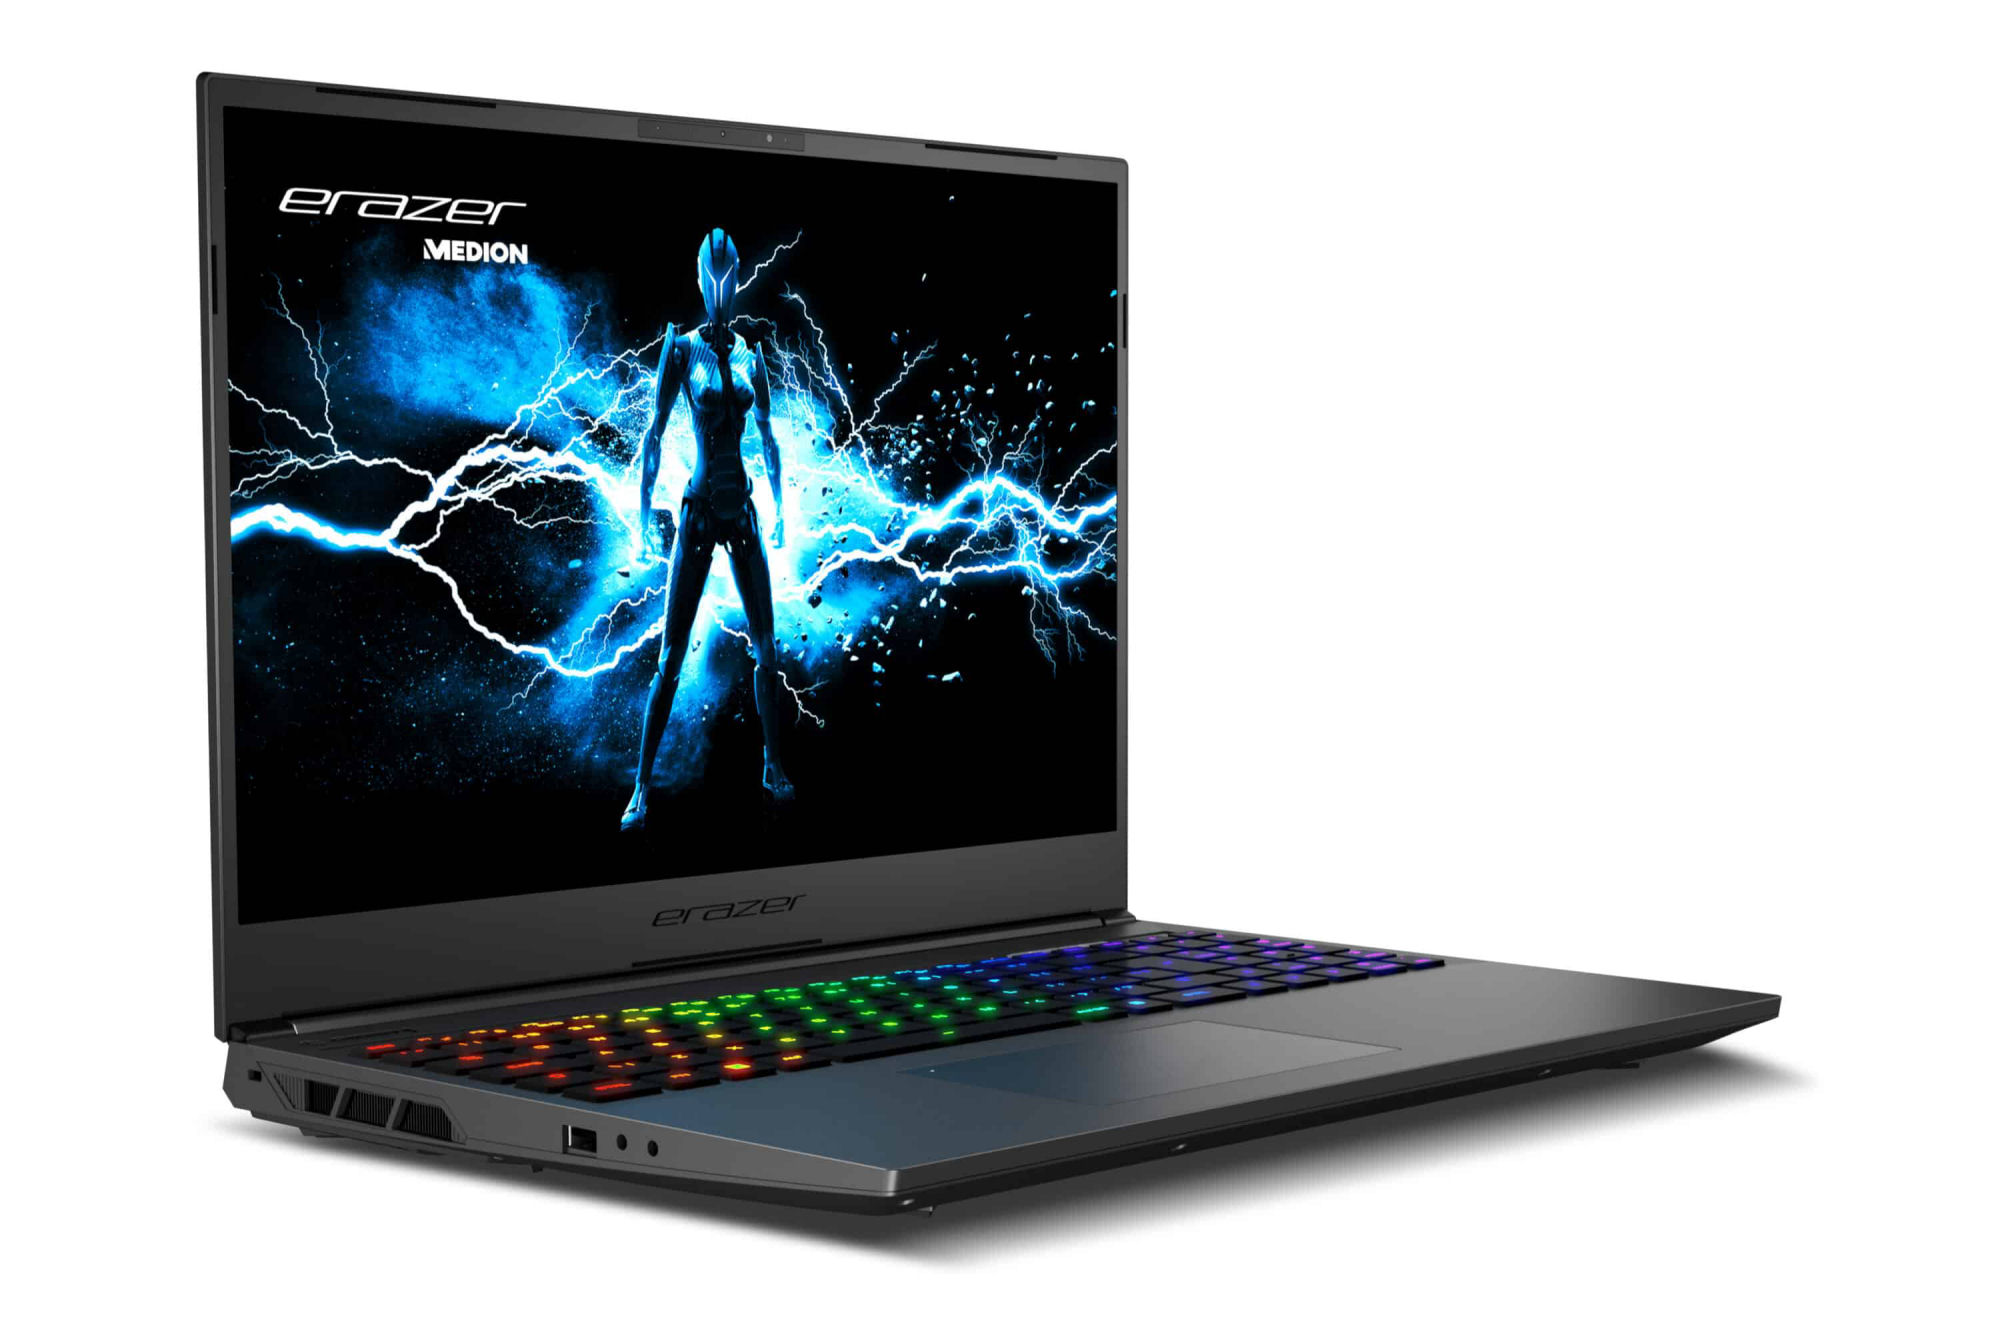
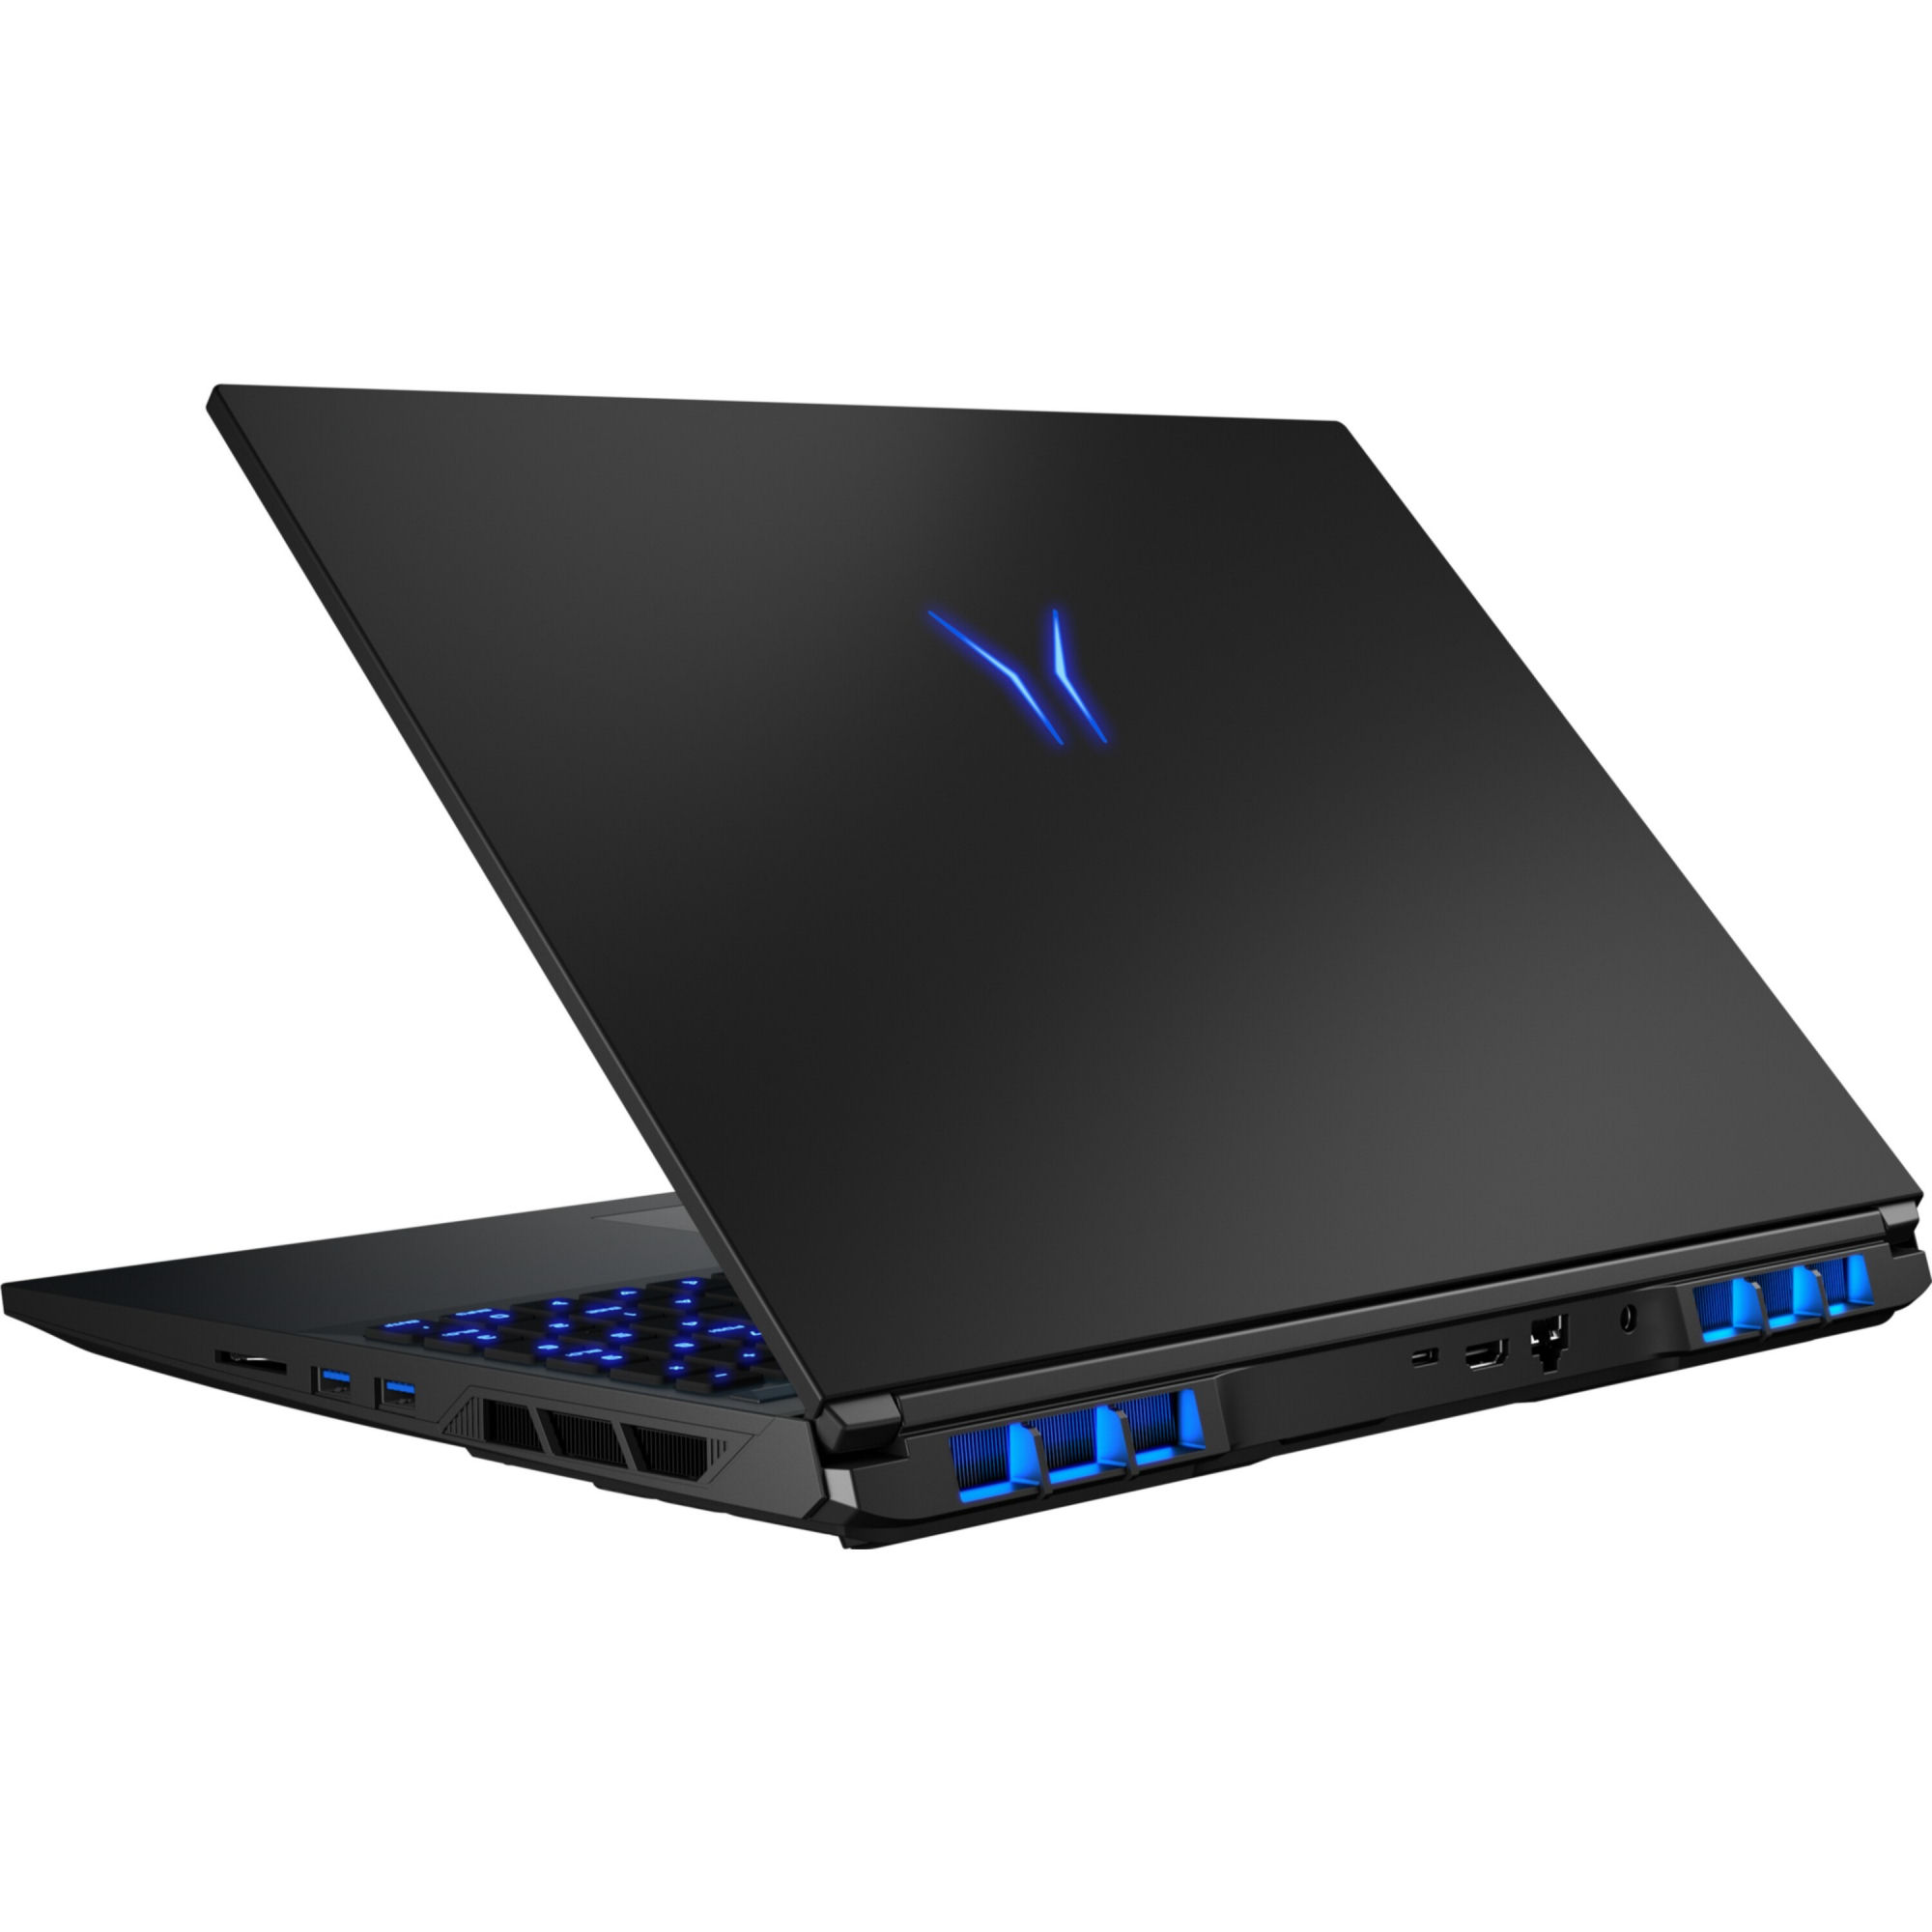
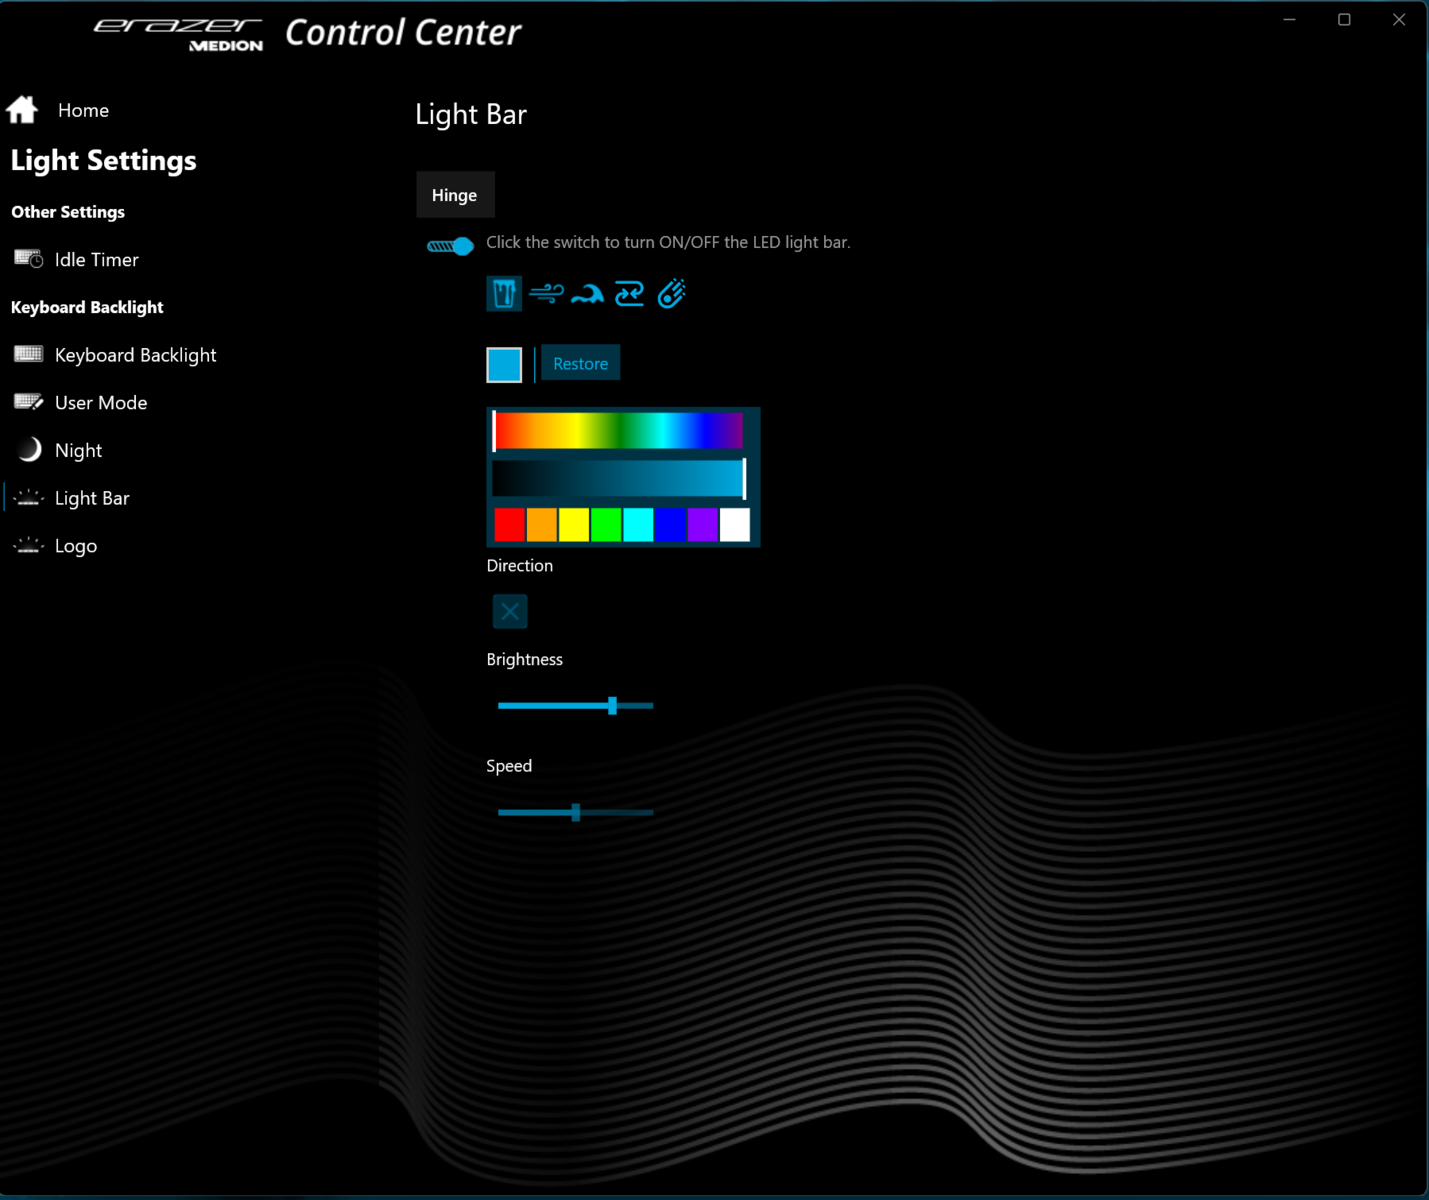
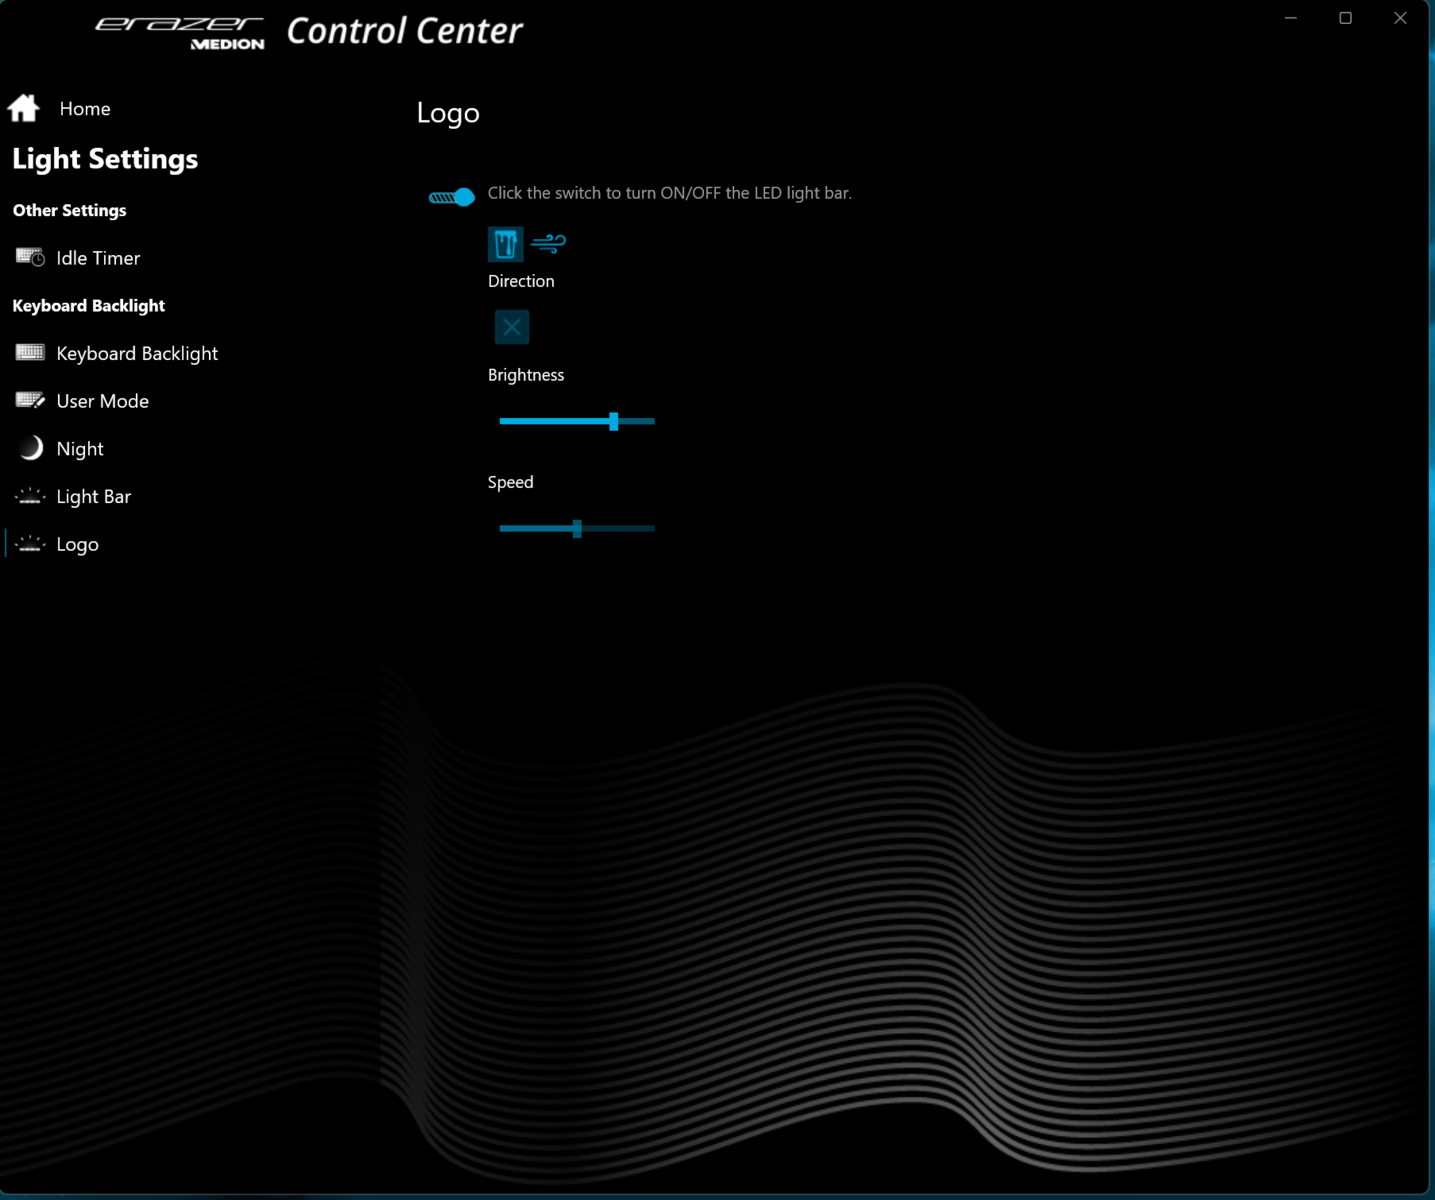
Medion采用了别致、素雅的机箱,即使在专业环境中也不显眼。哑光黑色机箱的盖子背面由铝制成,基本单元由塑料制成。一个防滑橡胶涂层覆盖在基本单元的上侧。除了按键背光(RGB)外,后部通风口内的两个可自由配置的LED灯条(RGB)和盖子上的Erazer标志的照明,使这个看起来很严肃的箱子变得轻松起来。
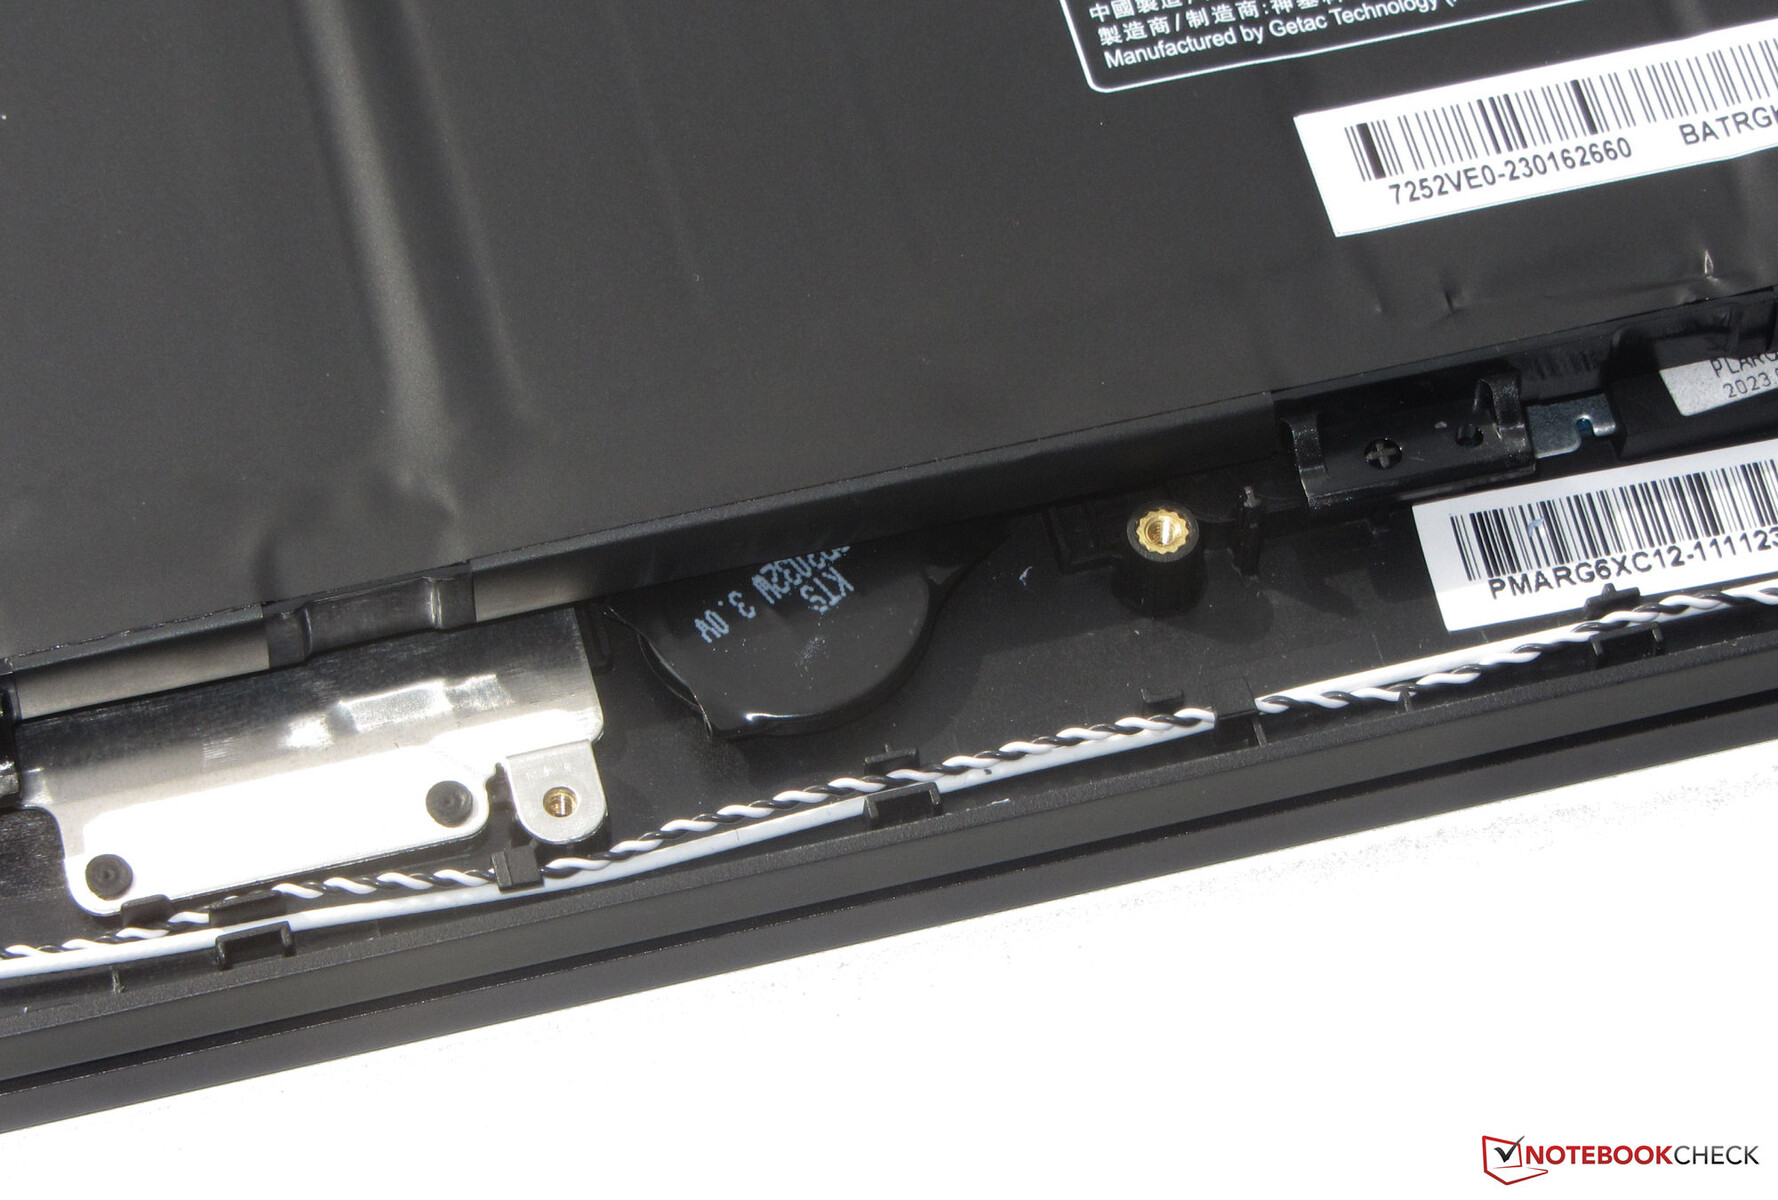
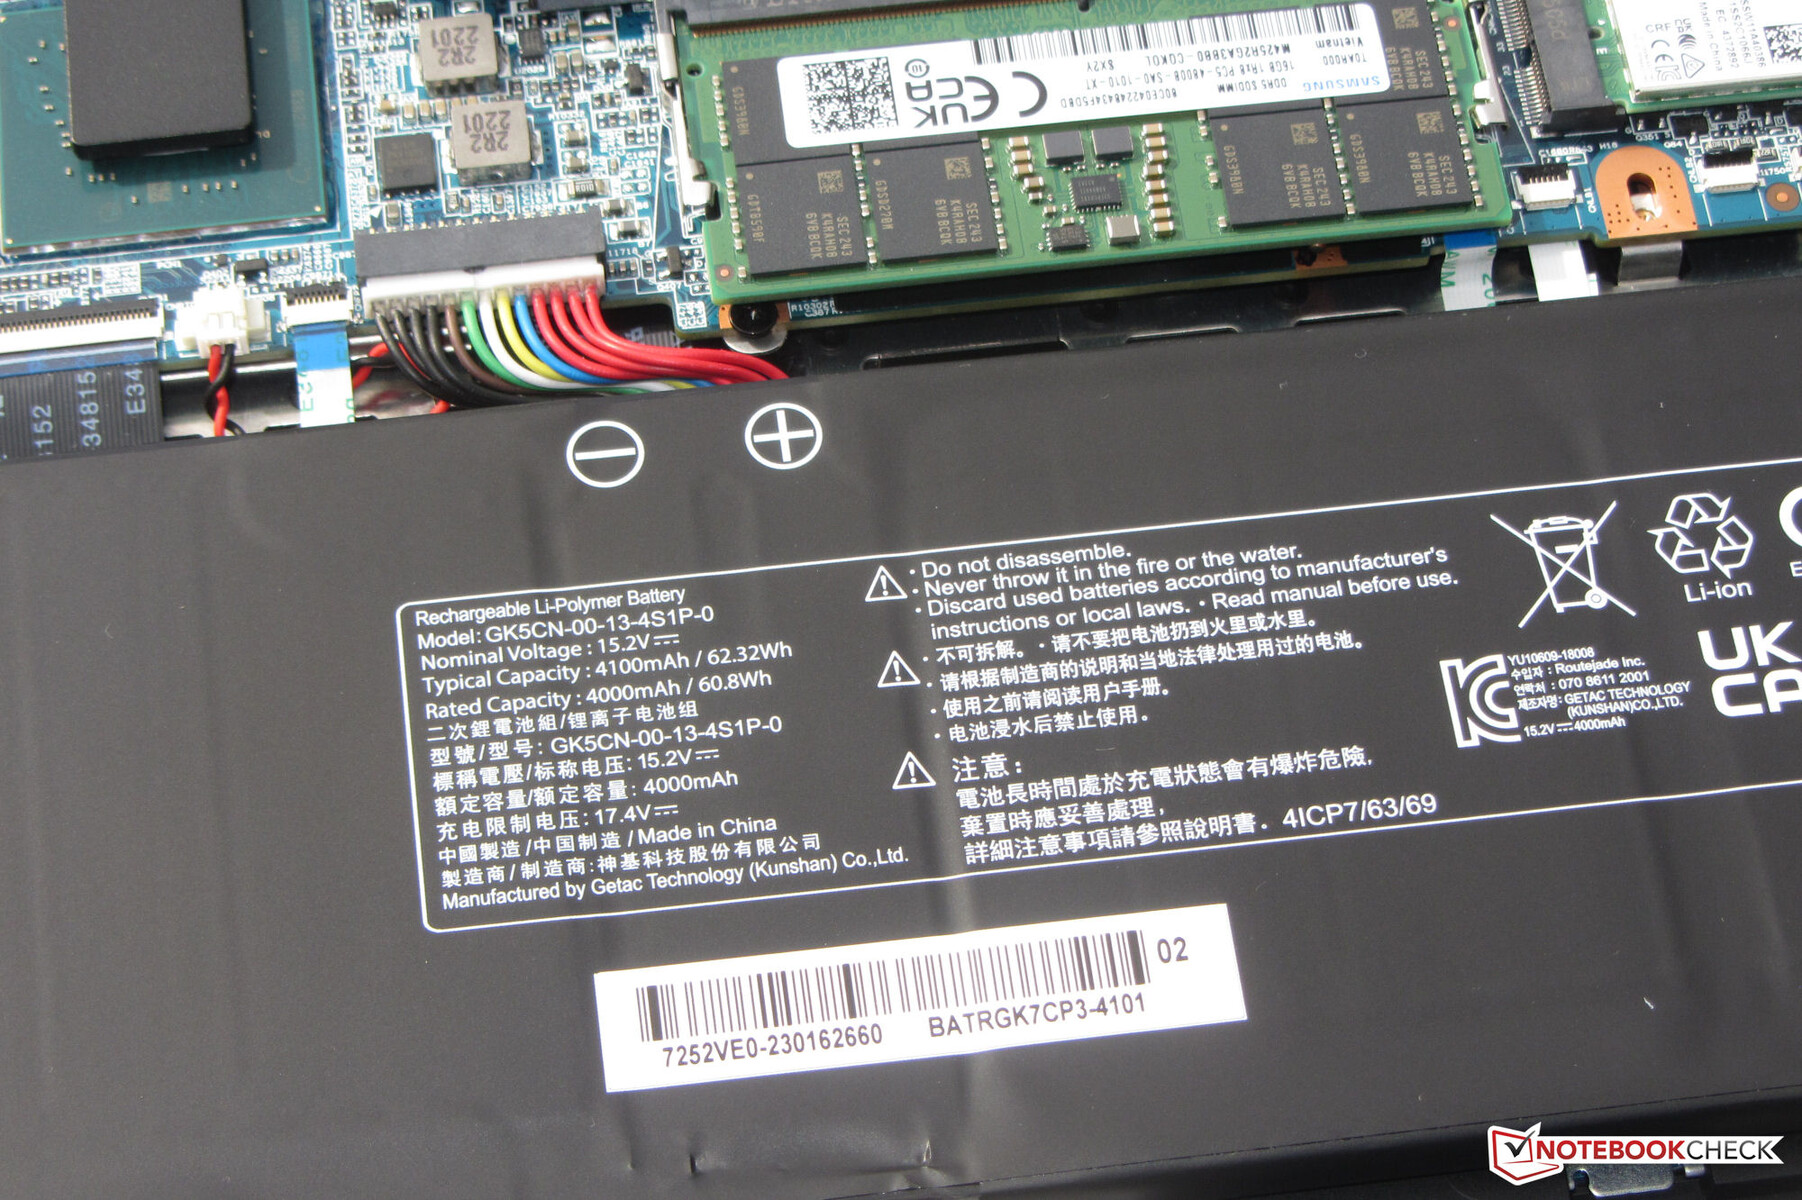
这款16英寸的机箱没有暴露出任何制造上的缺陷。缝隙尺寸均匀,没有材料突起。底座只能轻微扭转,盖子更明显,但整个设备都在合理范围内。电池(用螺丝固定,不是用胶水)和其他内部组件在拆下底壳后可以接触到。铰链使盖子牢牢固定在位置上,最大打开角度约为130度。单手打开盖子是可能的。
在比较领域,Medion笔记本电脑是具有最厚的结构的设备之一。就重量而言,它处于中间位置。
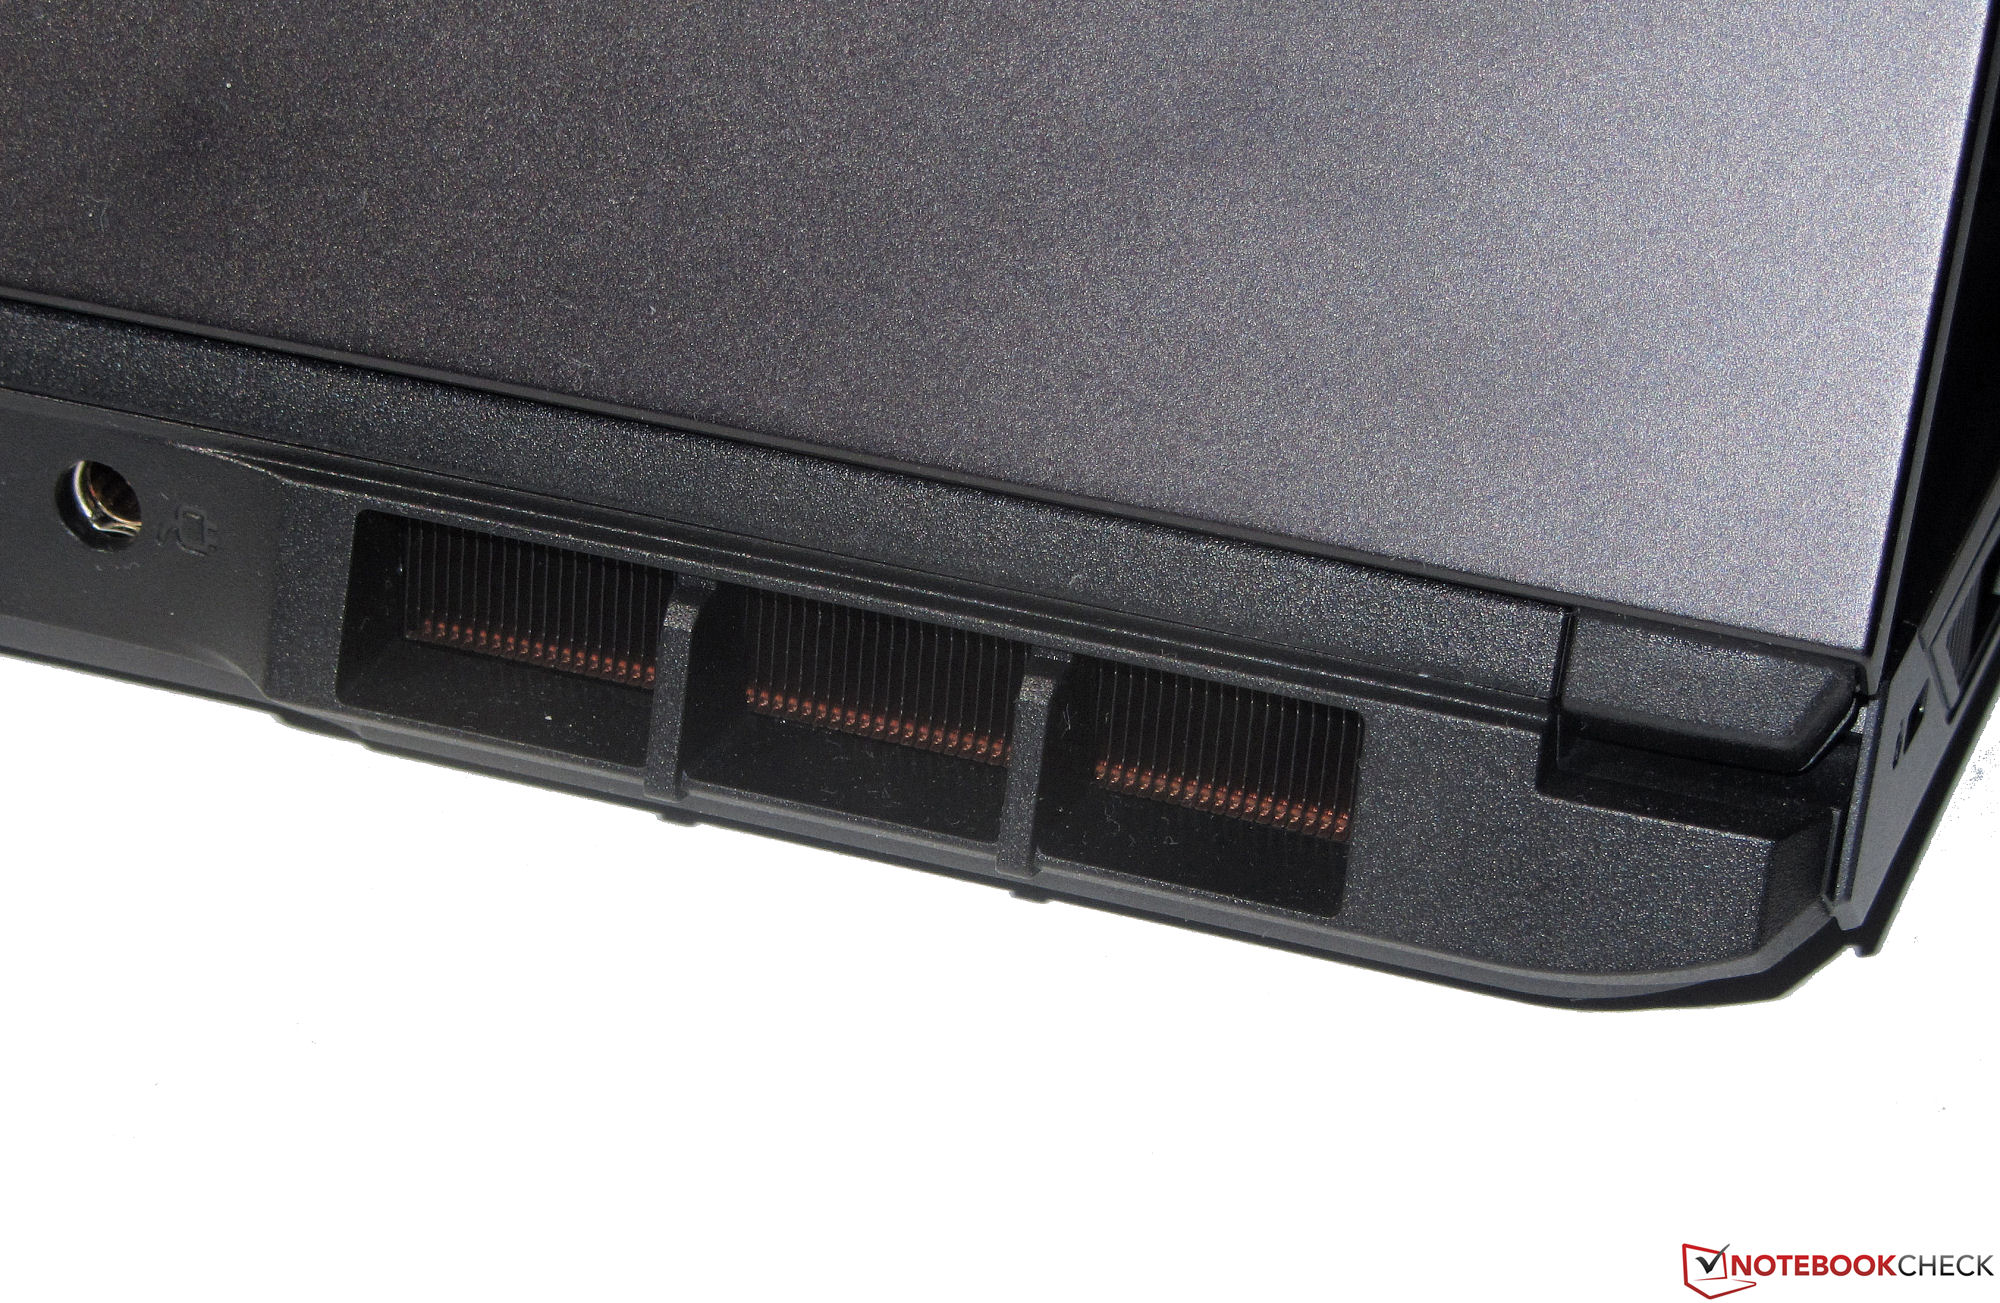
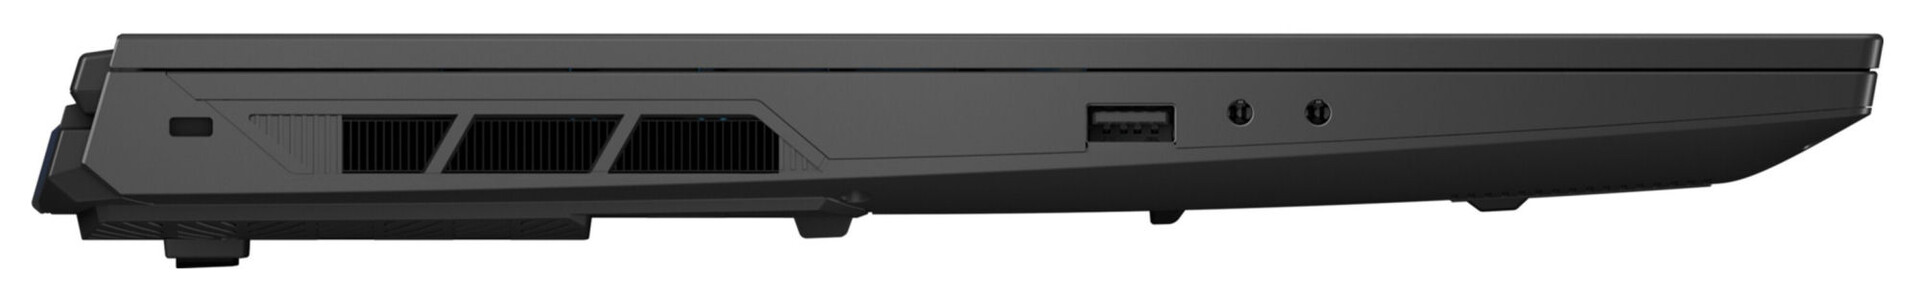
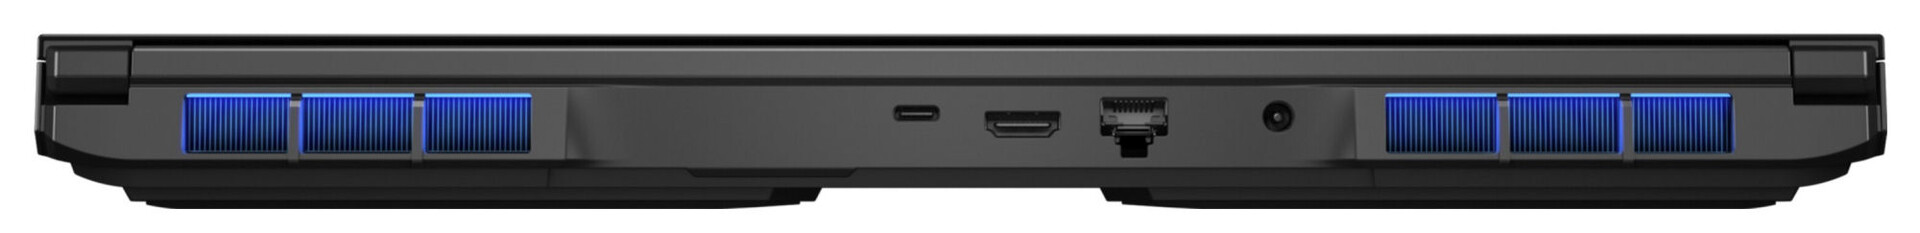
设备 - Major X20提供Thunderbolt 4
Erazer有三个USB-A端口(1个USB 3.2 Gen 1,2个USB 3.2 Gen 2)和一个USB-C端口(Thunderbolt 4)。后者输出DisplayPort信号,但不提供任何Power Delivery支持。Major X20还拥有总共两个视频输出(HDMI 2.1,DP)。进一步的连接包括一个电缆锁的插槽,两个音频插孔和一个千兆以太网端口(2.5Gbps)。
视频输出、电源插槽和网络端口都位于设备的背面。因此,相应的电缆从后面走,不会碍事。
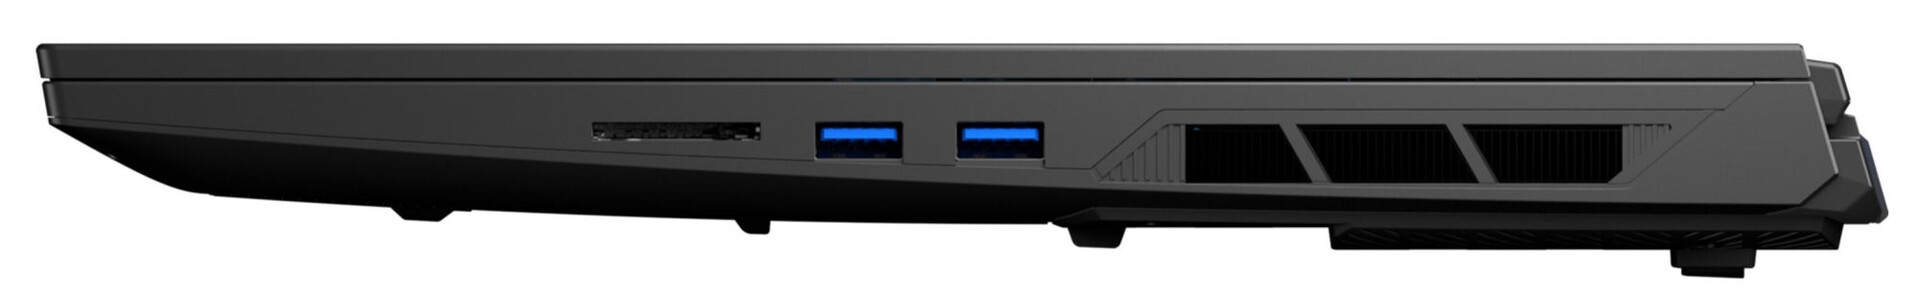
SD卡阅读器
microSD存储卡读卡器(参考卡:AV PRO microSD 128 GB V60)属于中等速度的型号,最大传输速率为78 MB/s(传输250个jpg图像文件,每个约5 MB)和88 MB/s(复制大数据块)。
| SD Card Reader | |
| average JPG Copy Test (av. of 3 runs) | |
| Average of class Gaming (20.9 - 210, n=54, last 2 years) | |
| Razer Blade 15 OLED (Early 2022) (AV Pro SD microSD 128 GB V60) | |
| Medion Erazer Major X20 (AV PRO microSD 128 GB V60) | |
| maximum AS SSD Seq Read Test (1GB) | |
| Average of class Gaming (25.5 - 261, n=51, last 2 years) | |
| Medion Erazer Major X20 (AV PRO microSD 128 GB V60) | |
| Razer Blade 15 OLED (Early 2022) (AV Pro SD microSD 128 GB V60) | |
沟通
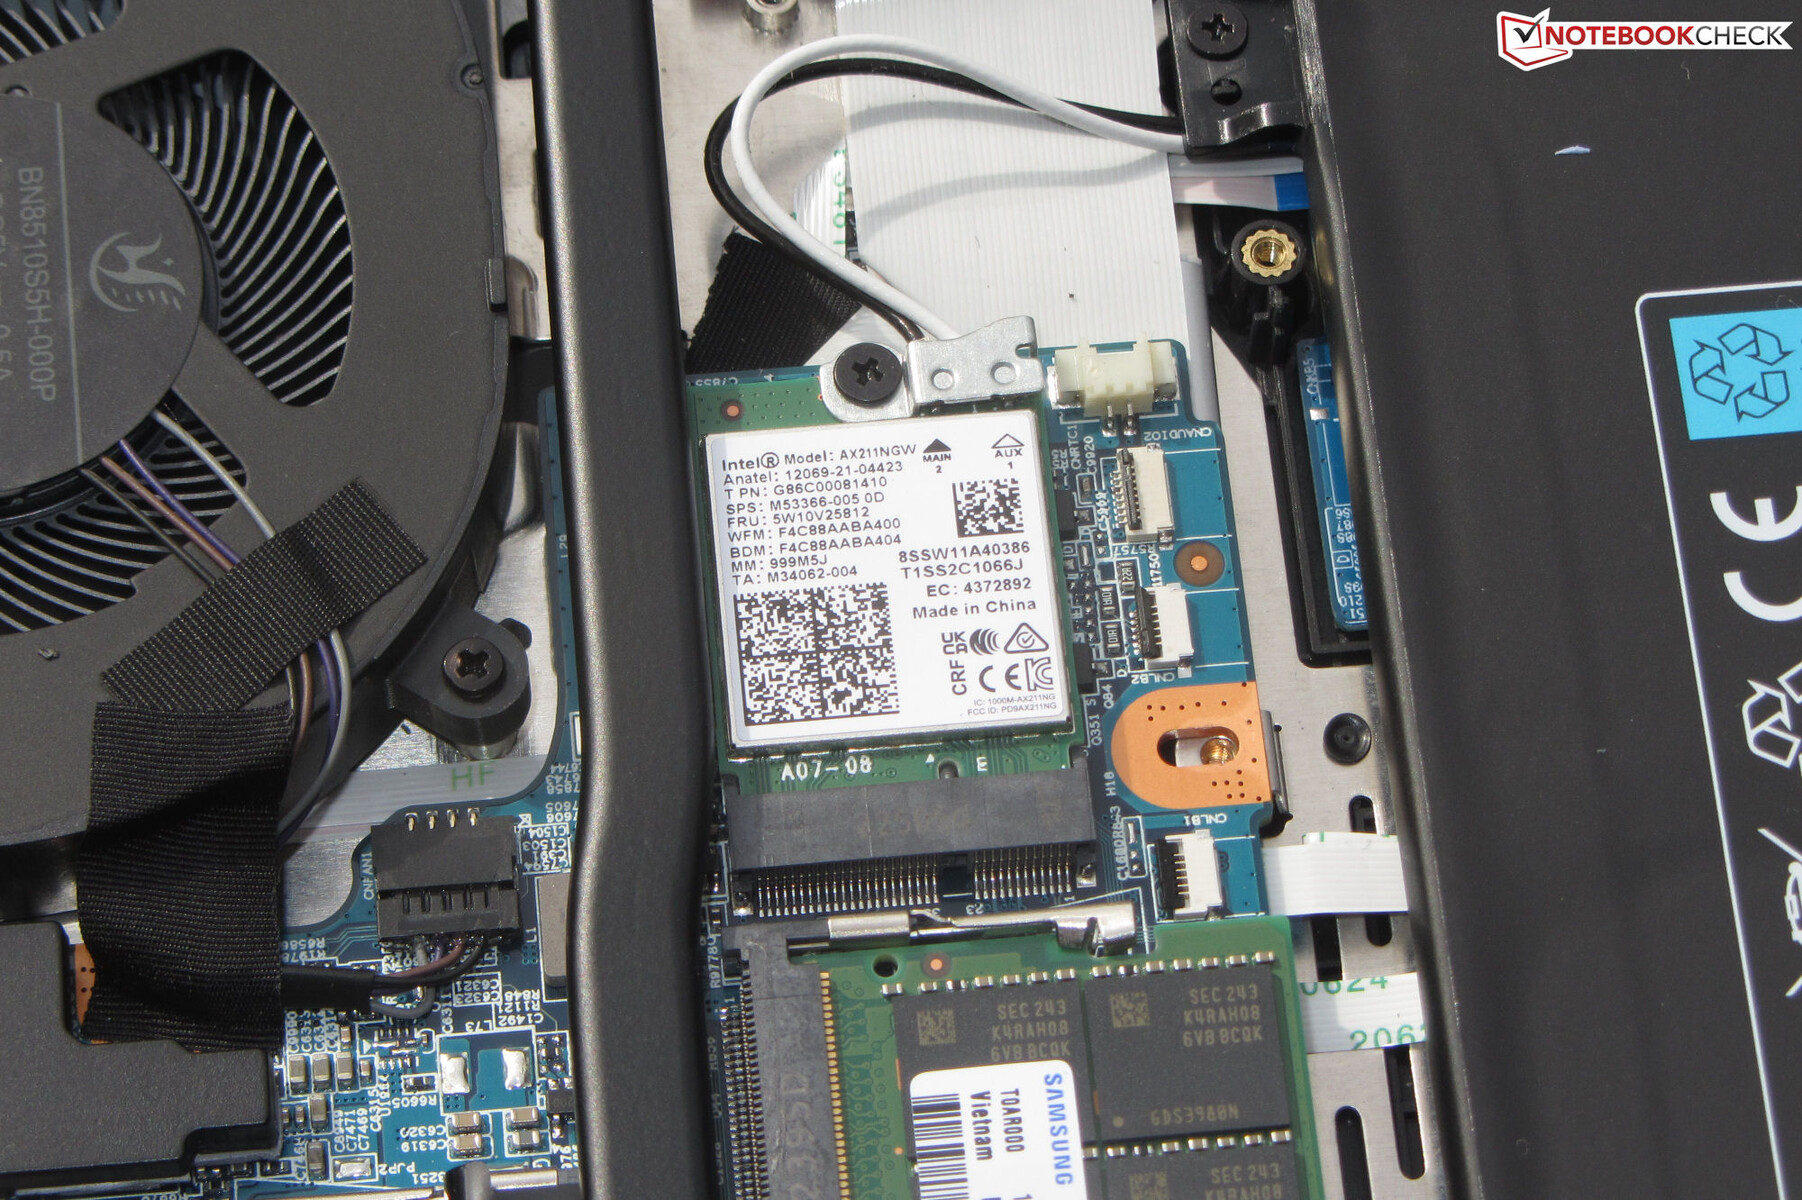
在最佳条件下(附近没有WLAN设备,笔记本电脑和服务器PC之间的距离很小),WiFi数据率非常好。X20板上有一个WiFi 6E芯片(Intel AX211)。有线连接由Realtek的芯片(RTL8125;2.5 GBit/s)处理。
网络摄像头
网络摄像头(210万像素,最大1,920 x 1,080)提供标准质量。色彩精度不足:在色彩偏差约为11的情况下,目标(DeltaE小于3)被错过。机上没有机械快门。


辅料
除了通常的文件(快速入门指南和保修信息)外,笔记本没有包含其他附件。
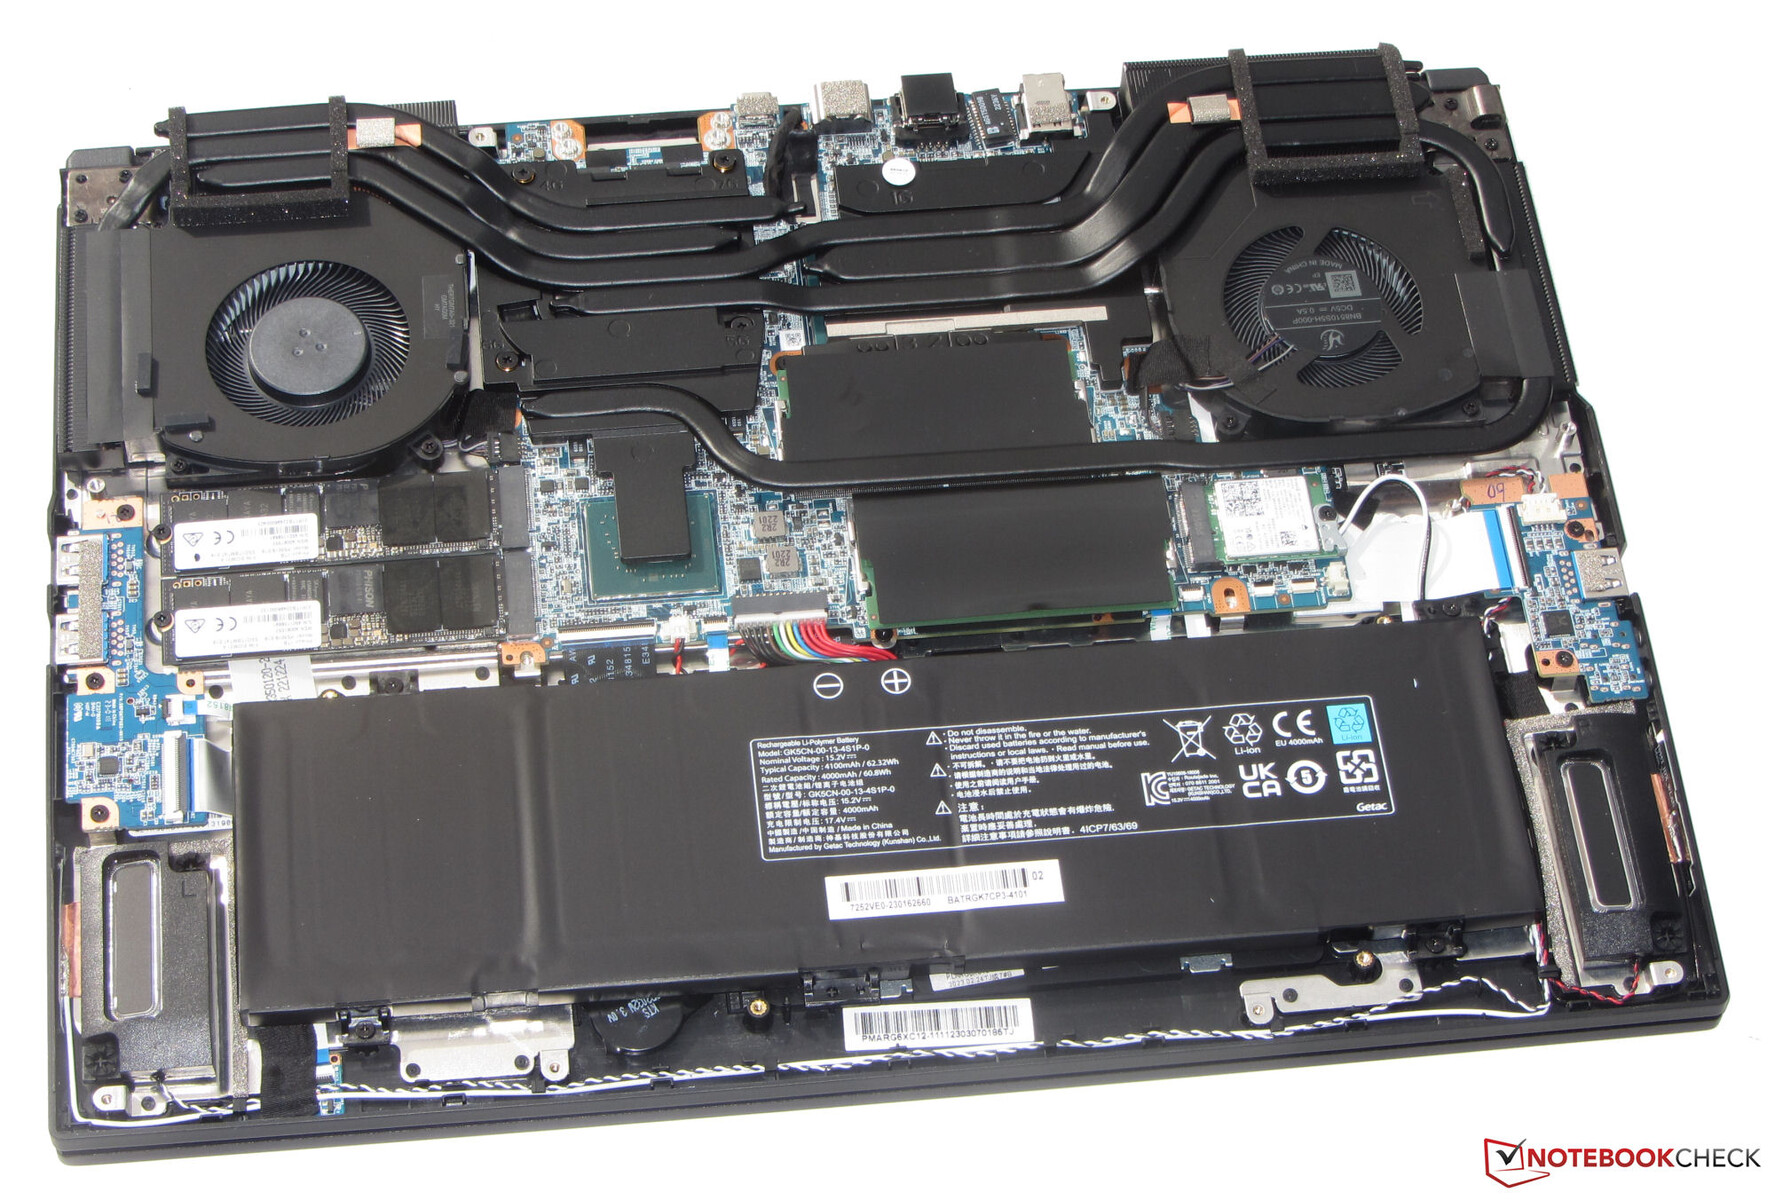
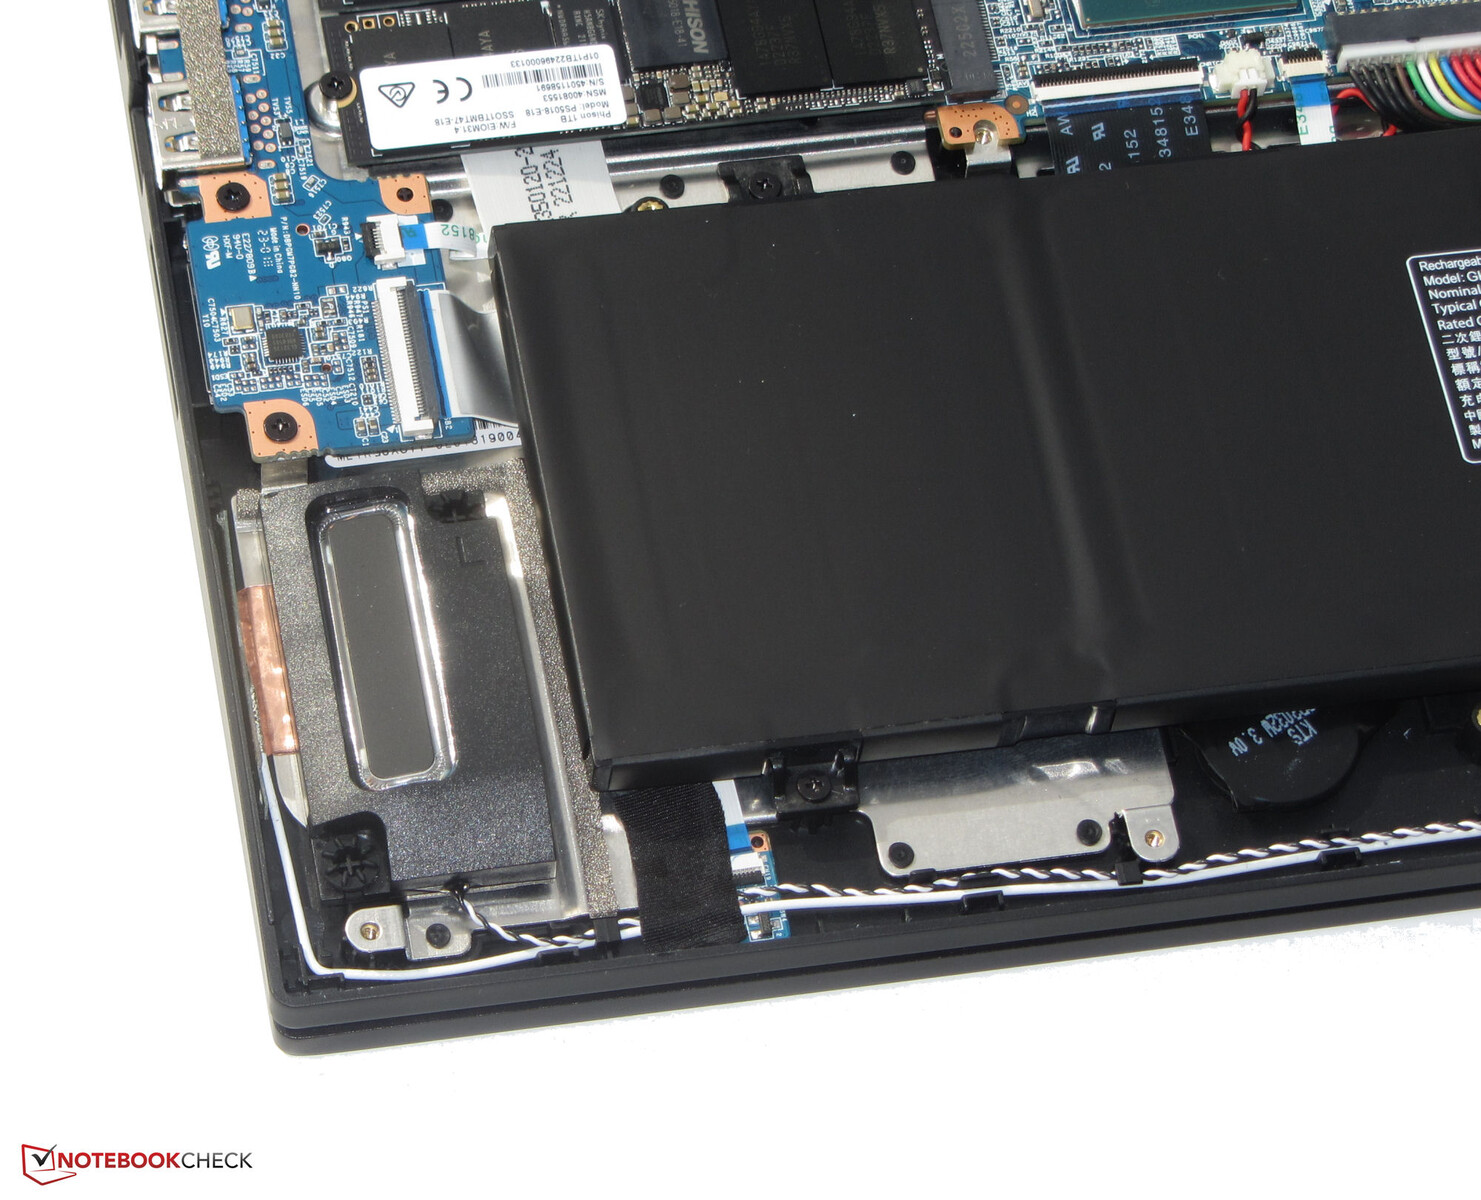
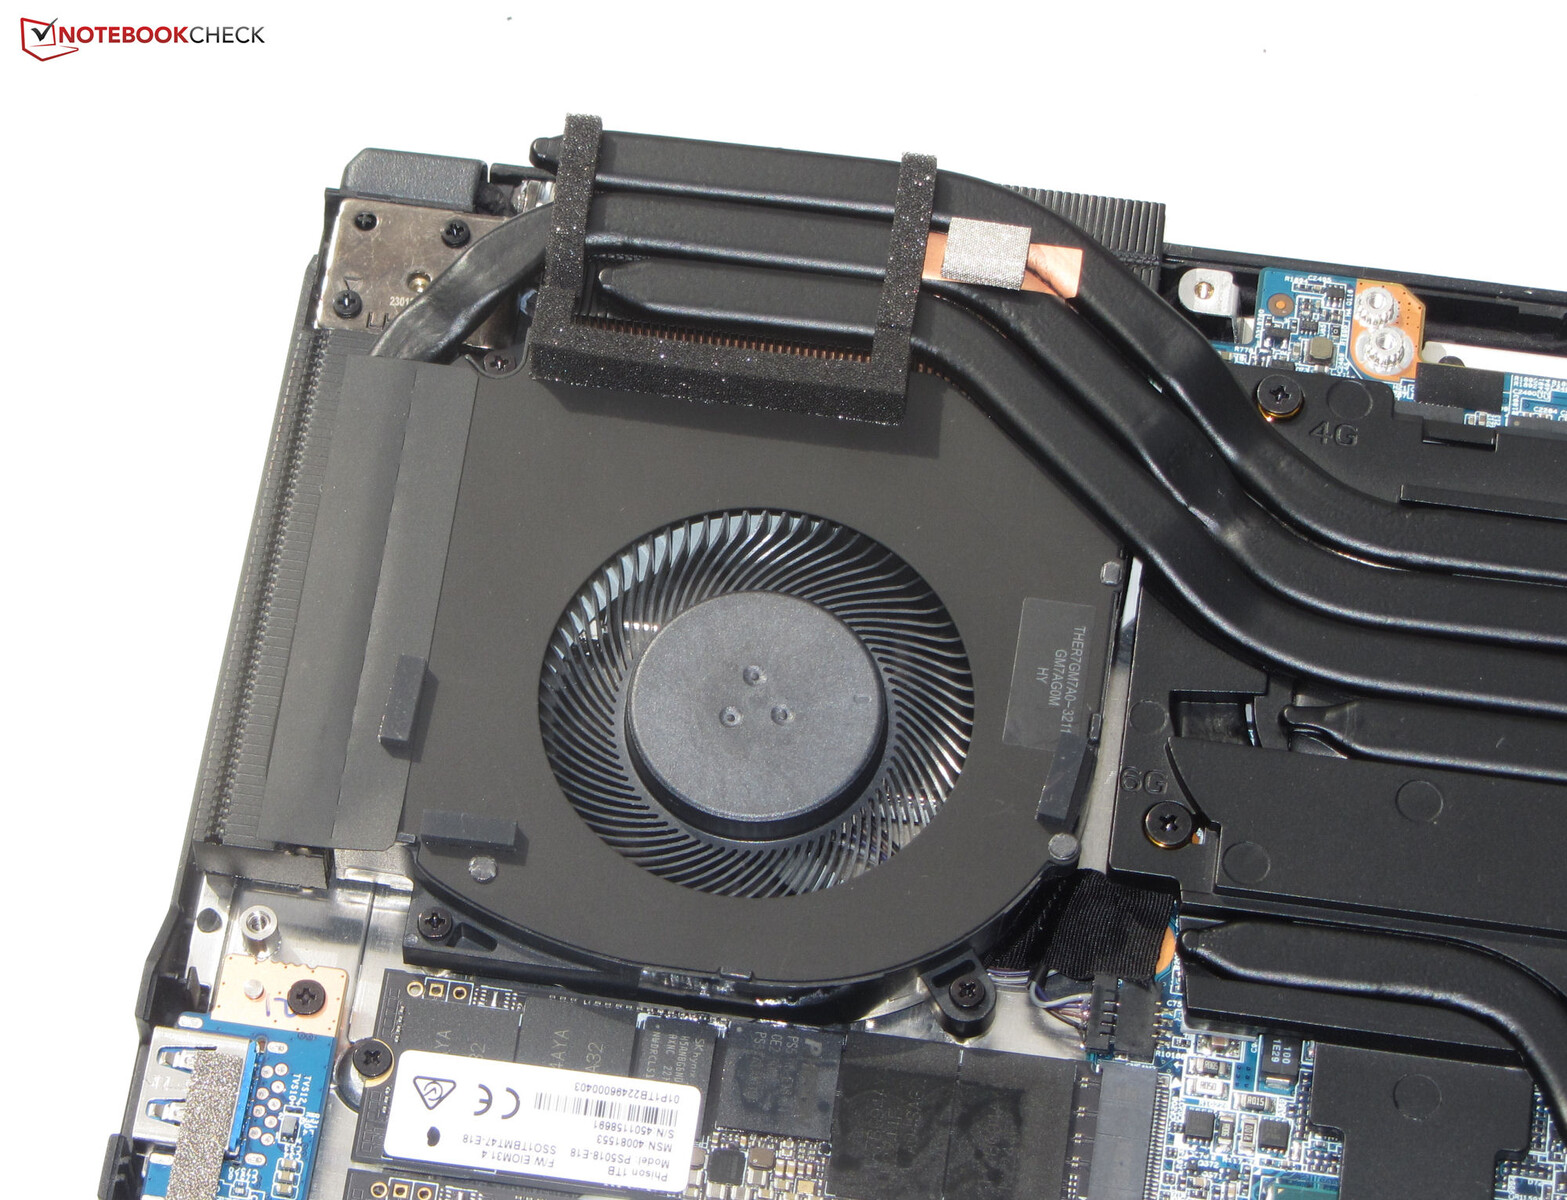
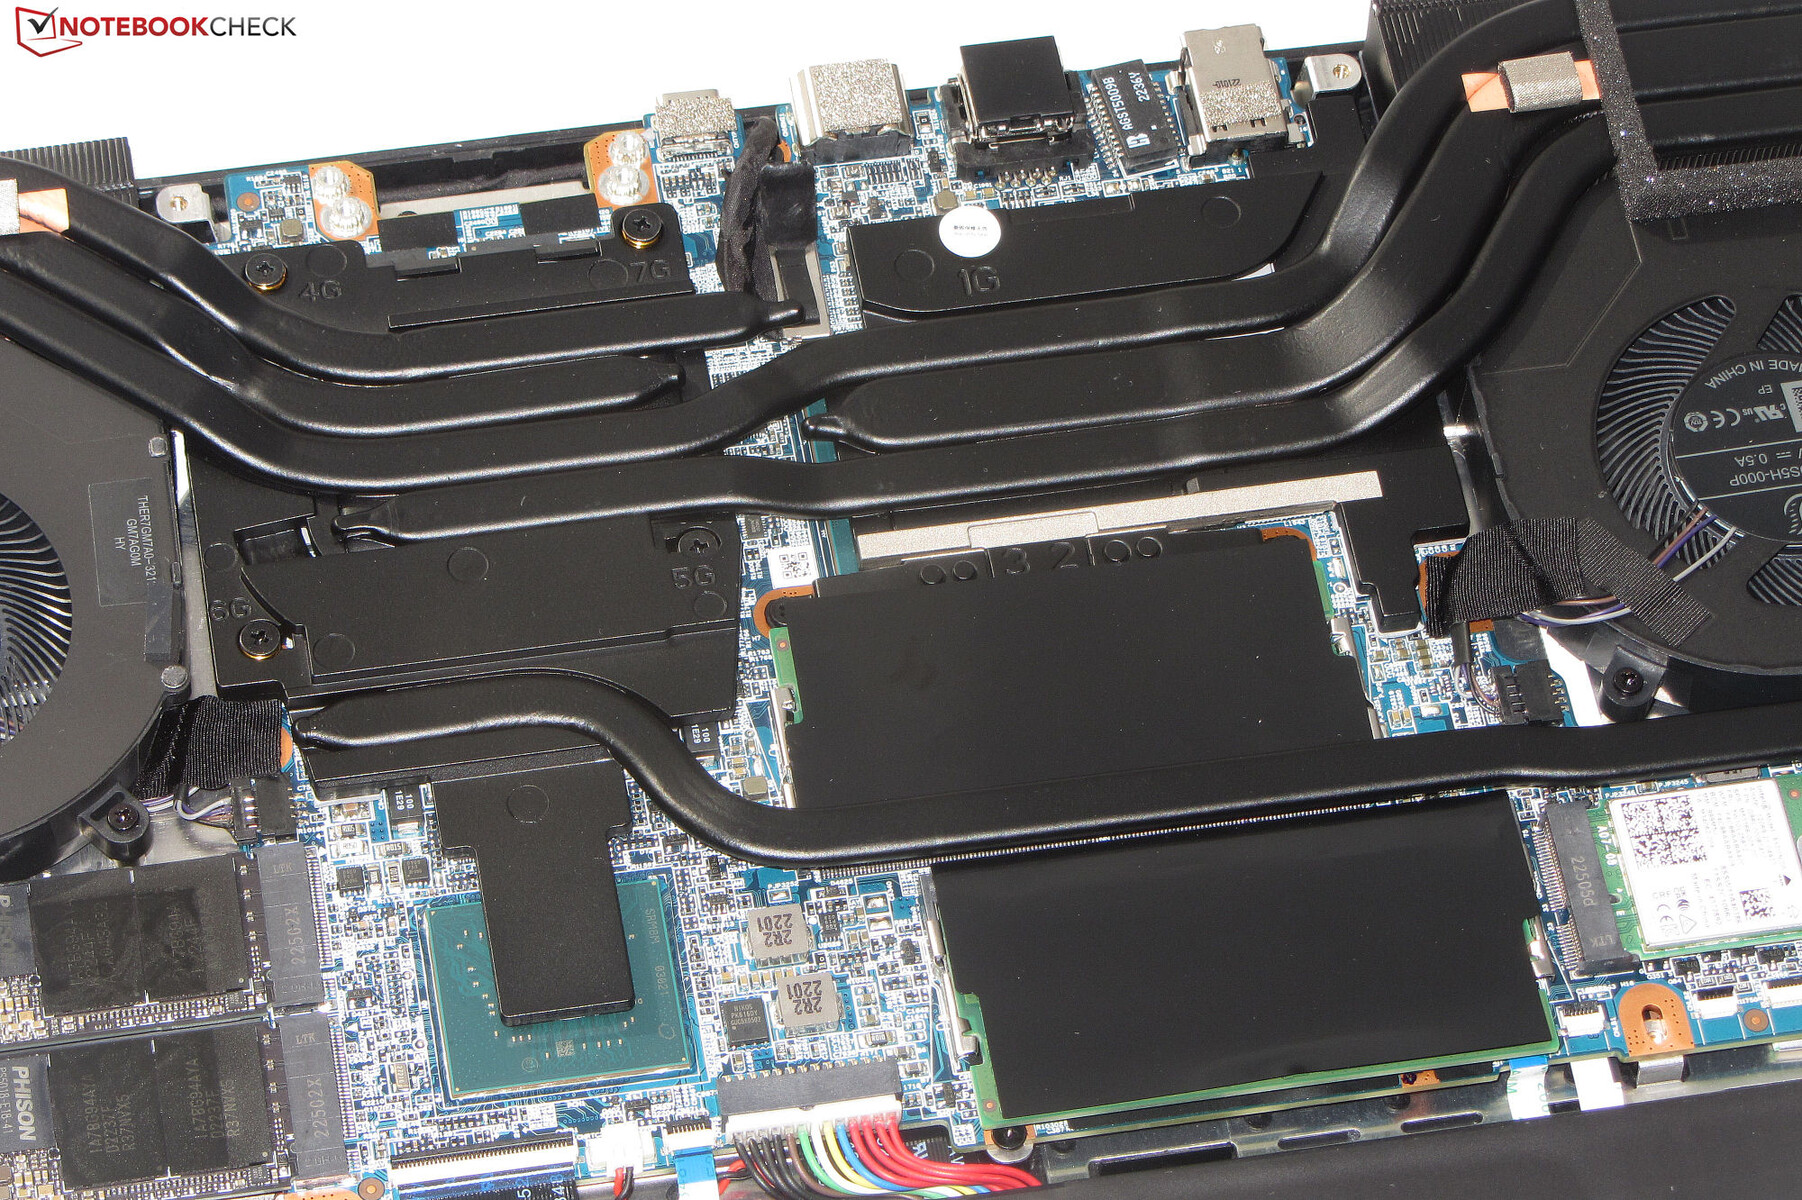
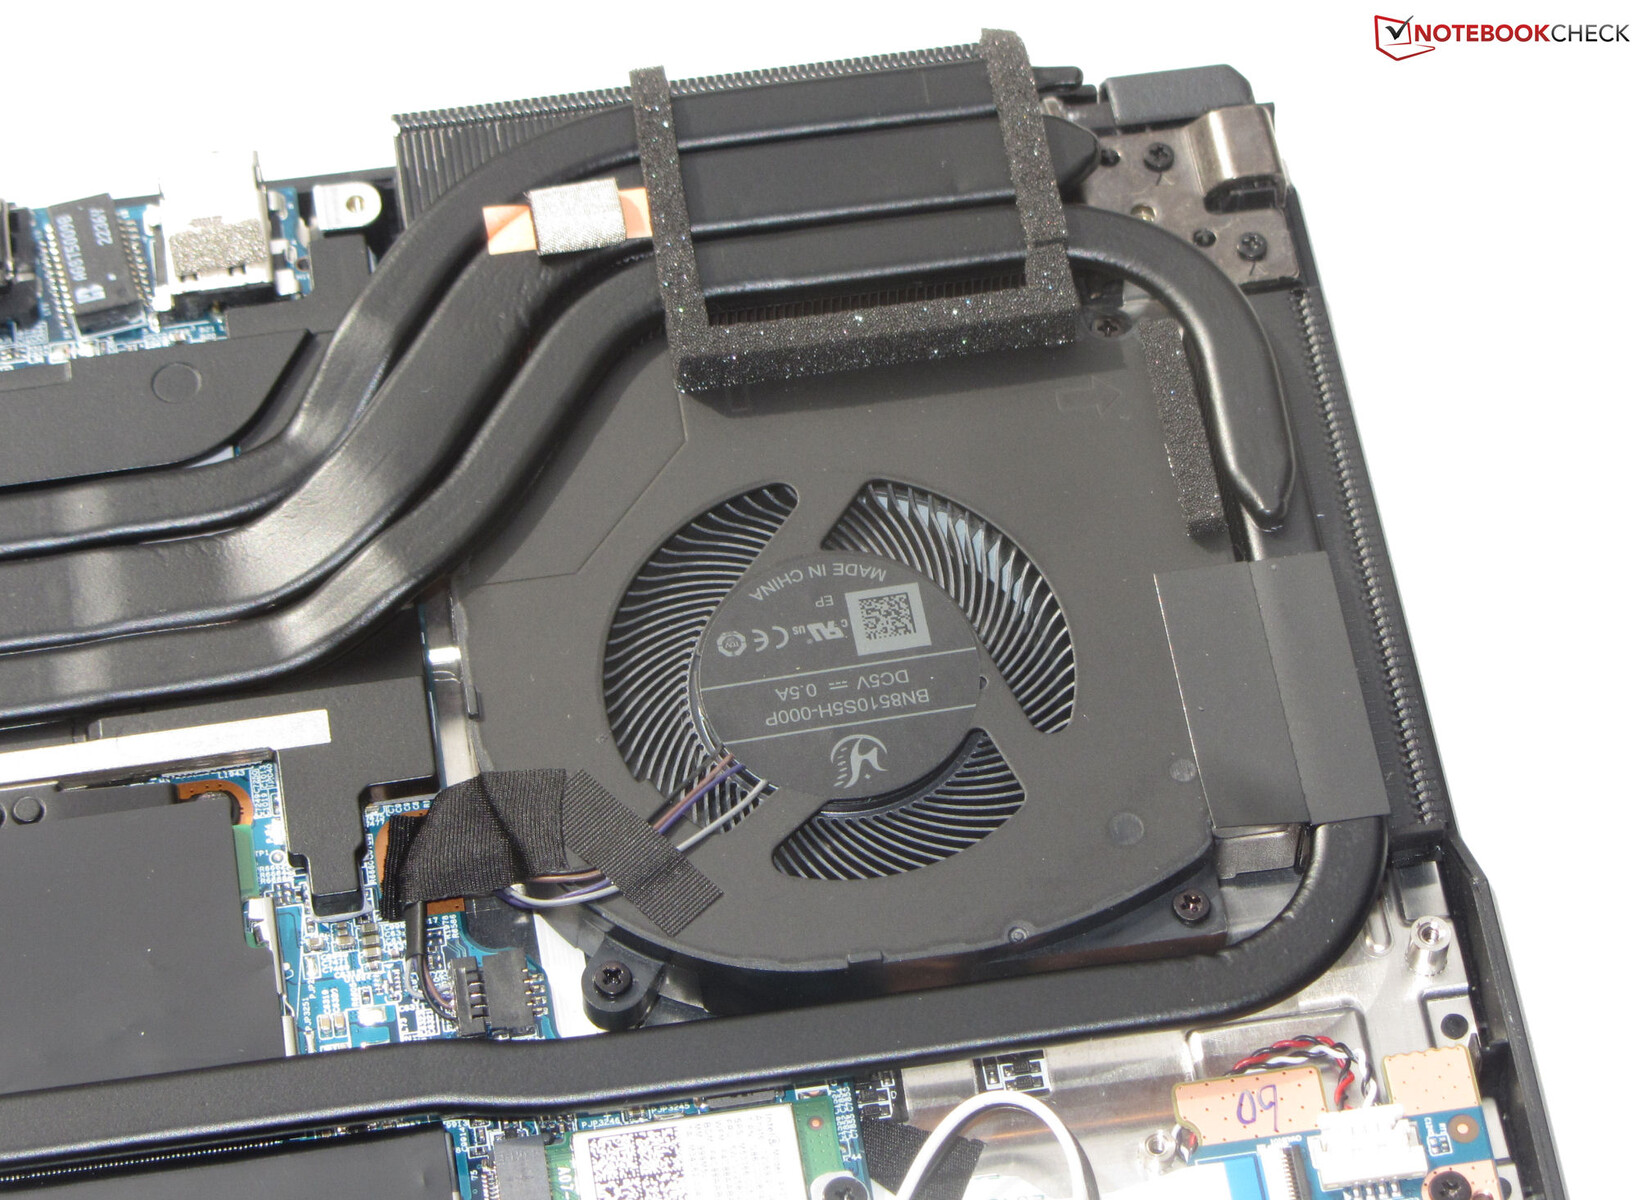
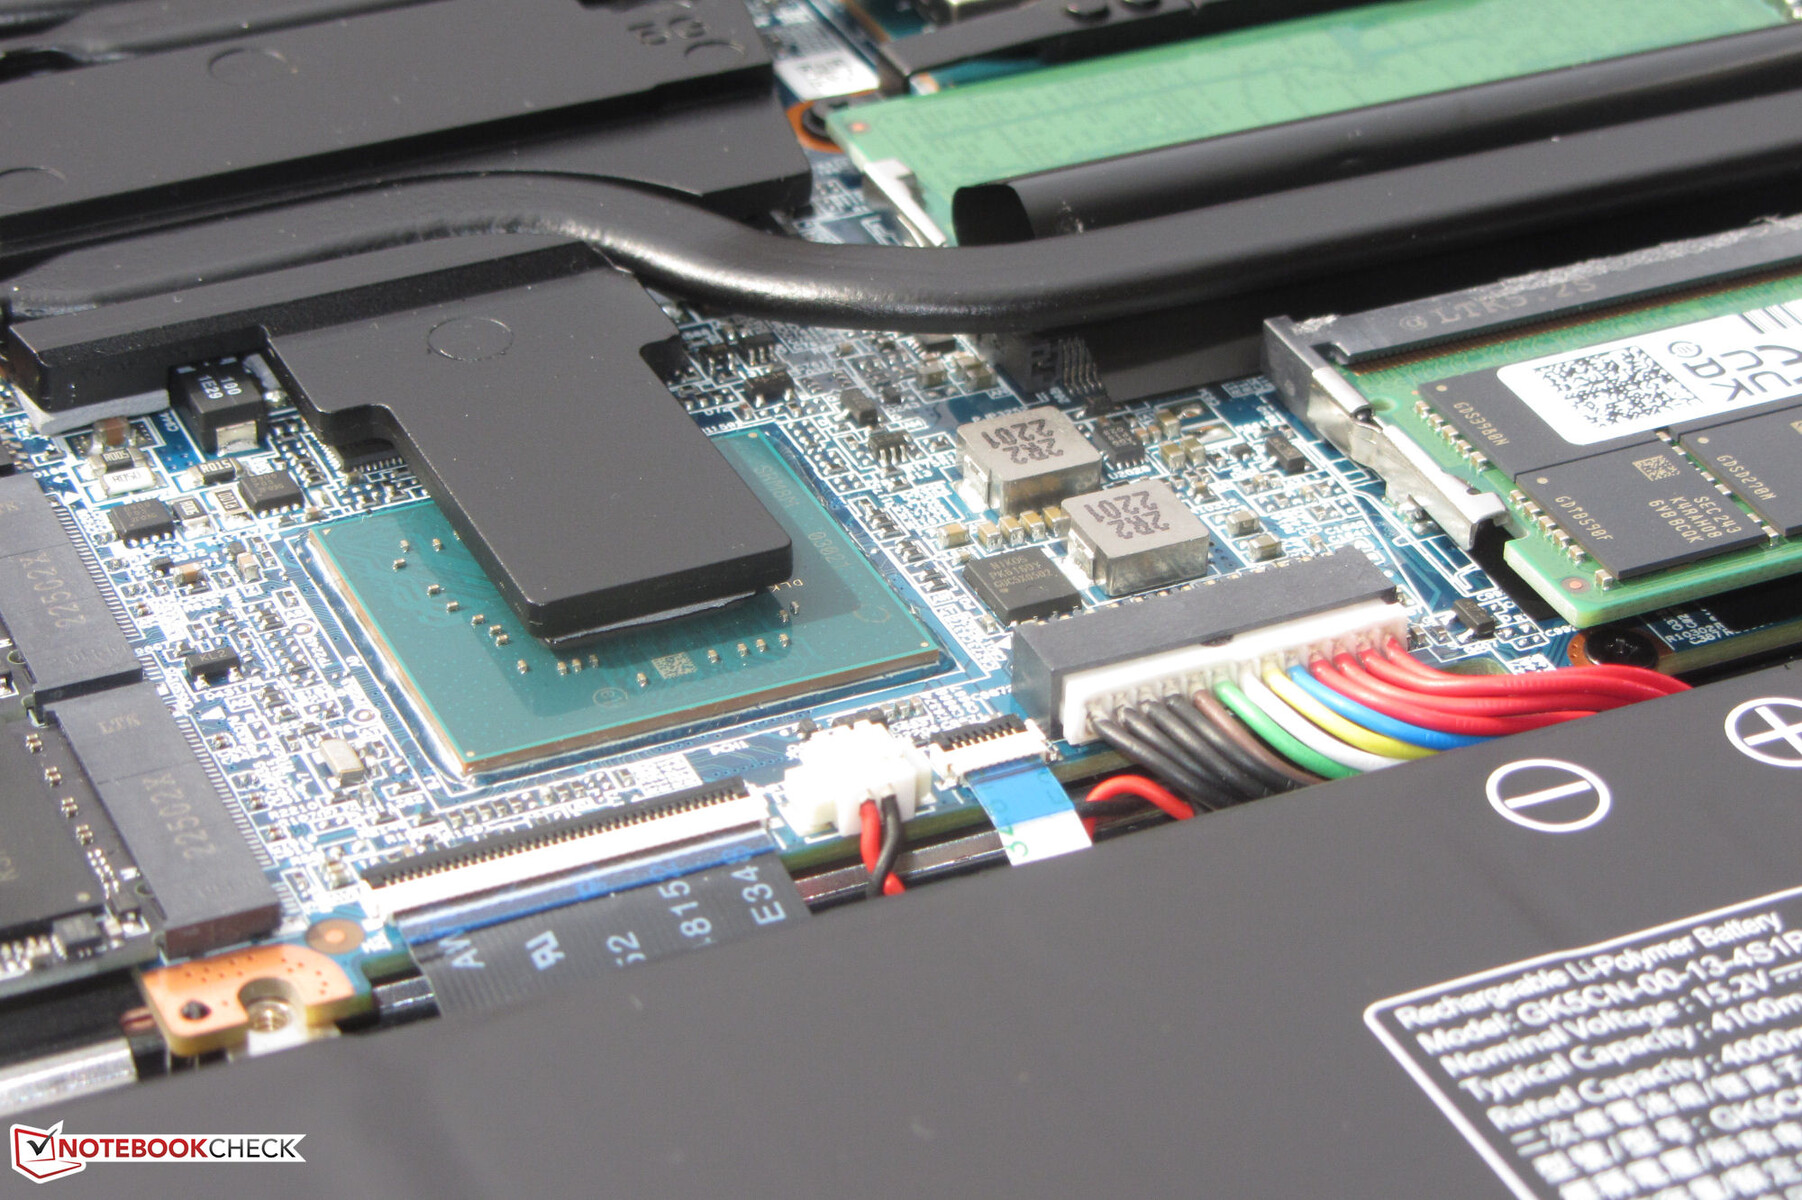
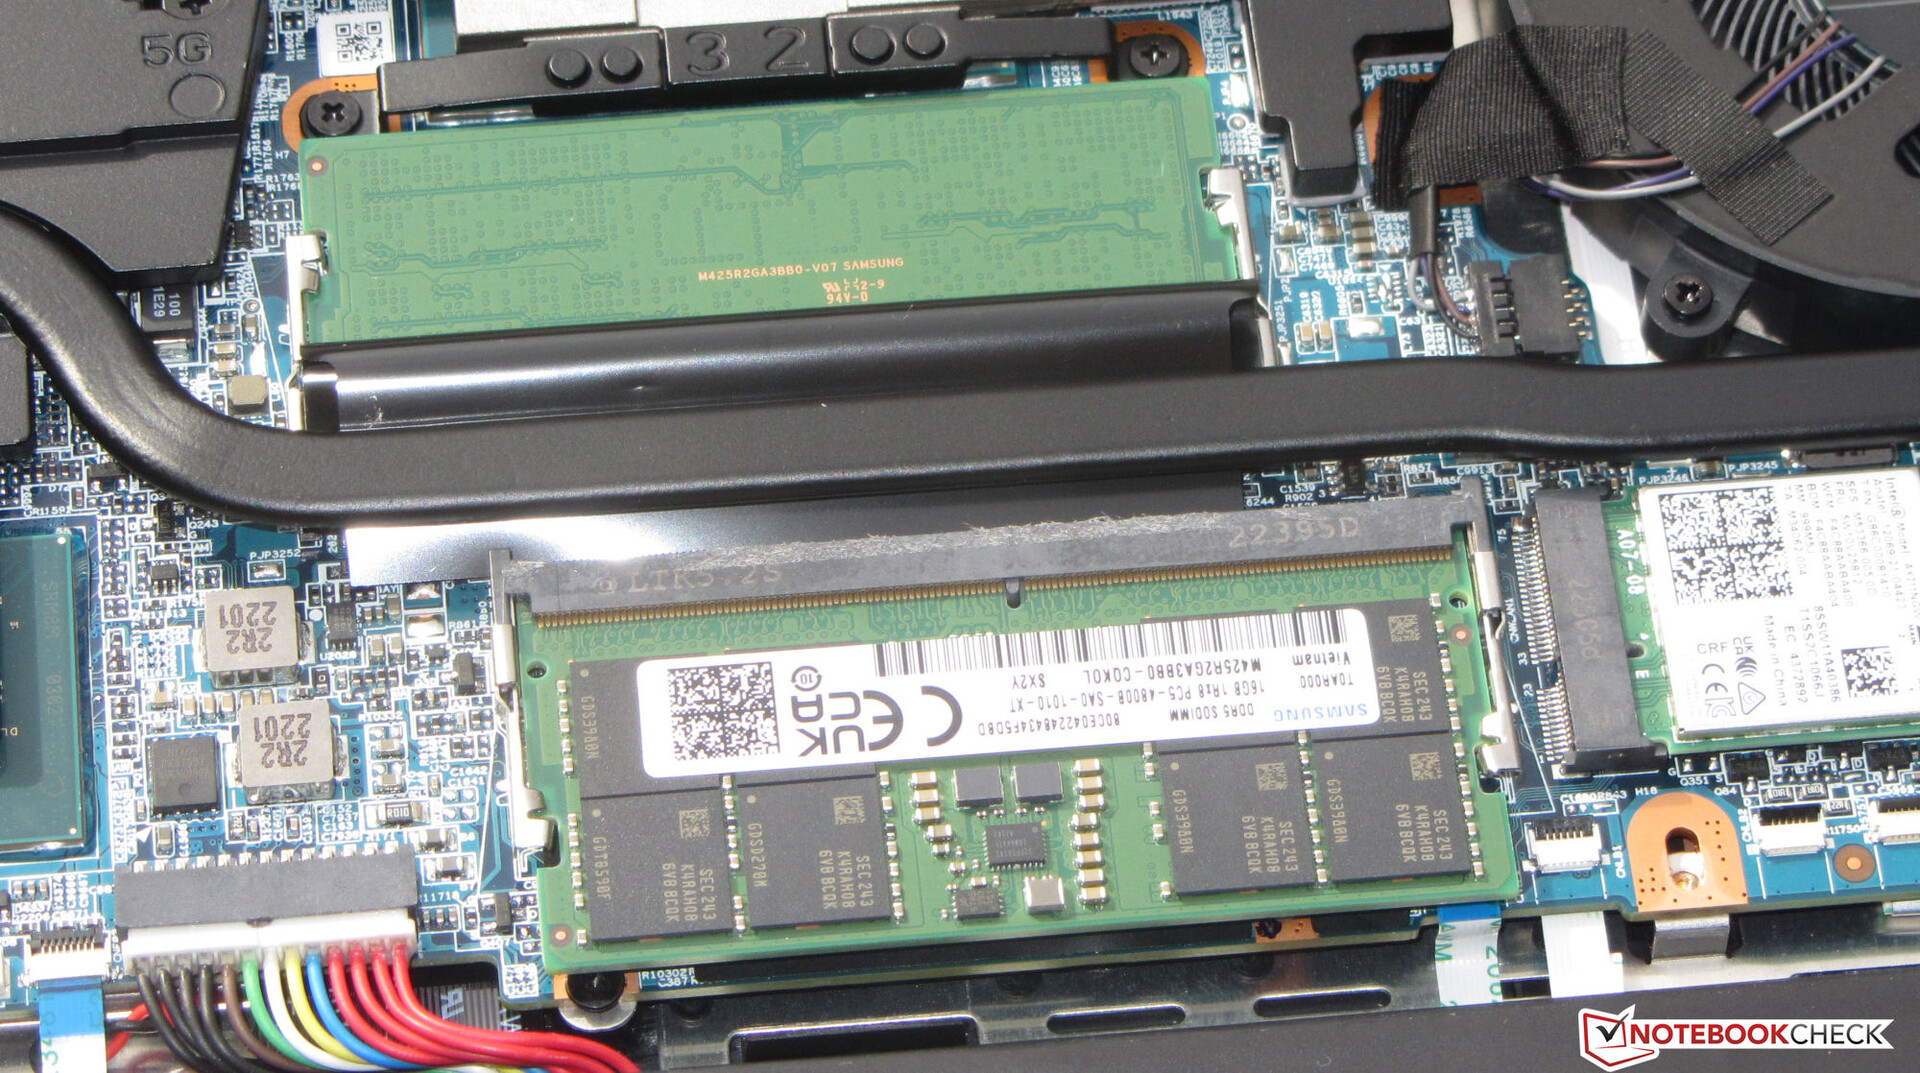
维护
在卸下设备底部的所有螺丝后,可以用平铲或关节平滑器将底壳拆开。然后你可以接触到两个内存插槽(都被占用),两个固态硬盘(PCIe 4,M.2-2280),WLAN模块,风扇,BIOS电池和笔记本电池。
担保
Medion在德国为Erazer提供两年的保修。这在其他国家可能有所不同,所以买家在购买前应仔细检查。
保修期可以延长,但必须在Medion的网上商店与笔记本一起购买。后续购买是不可能的。
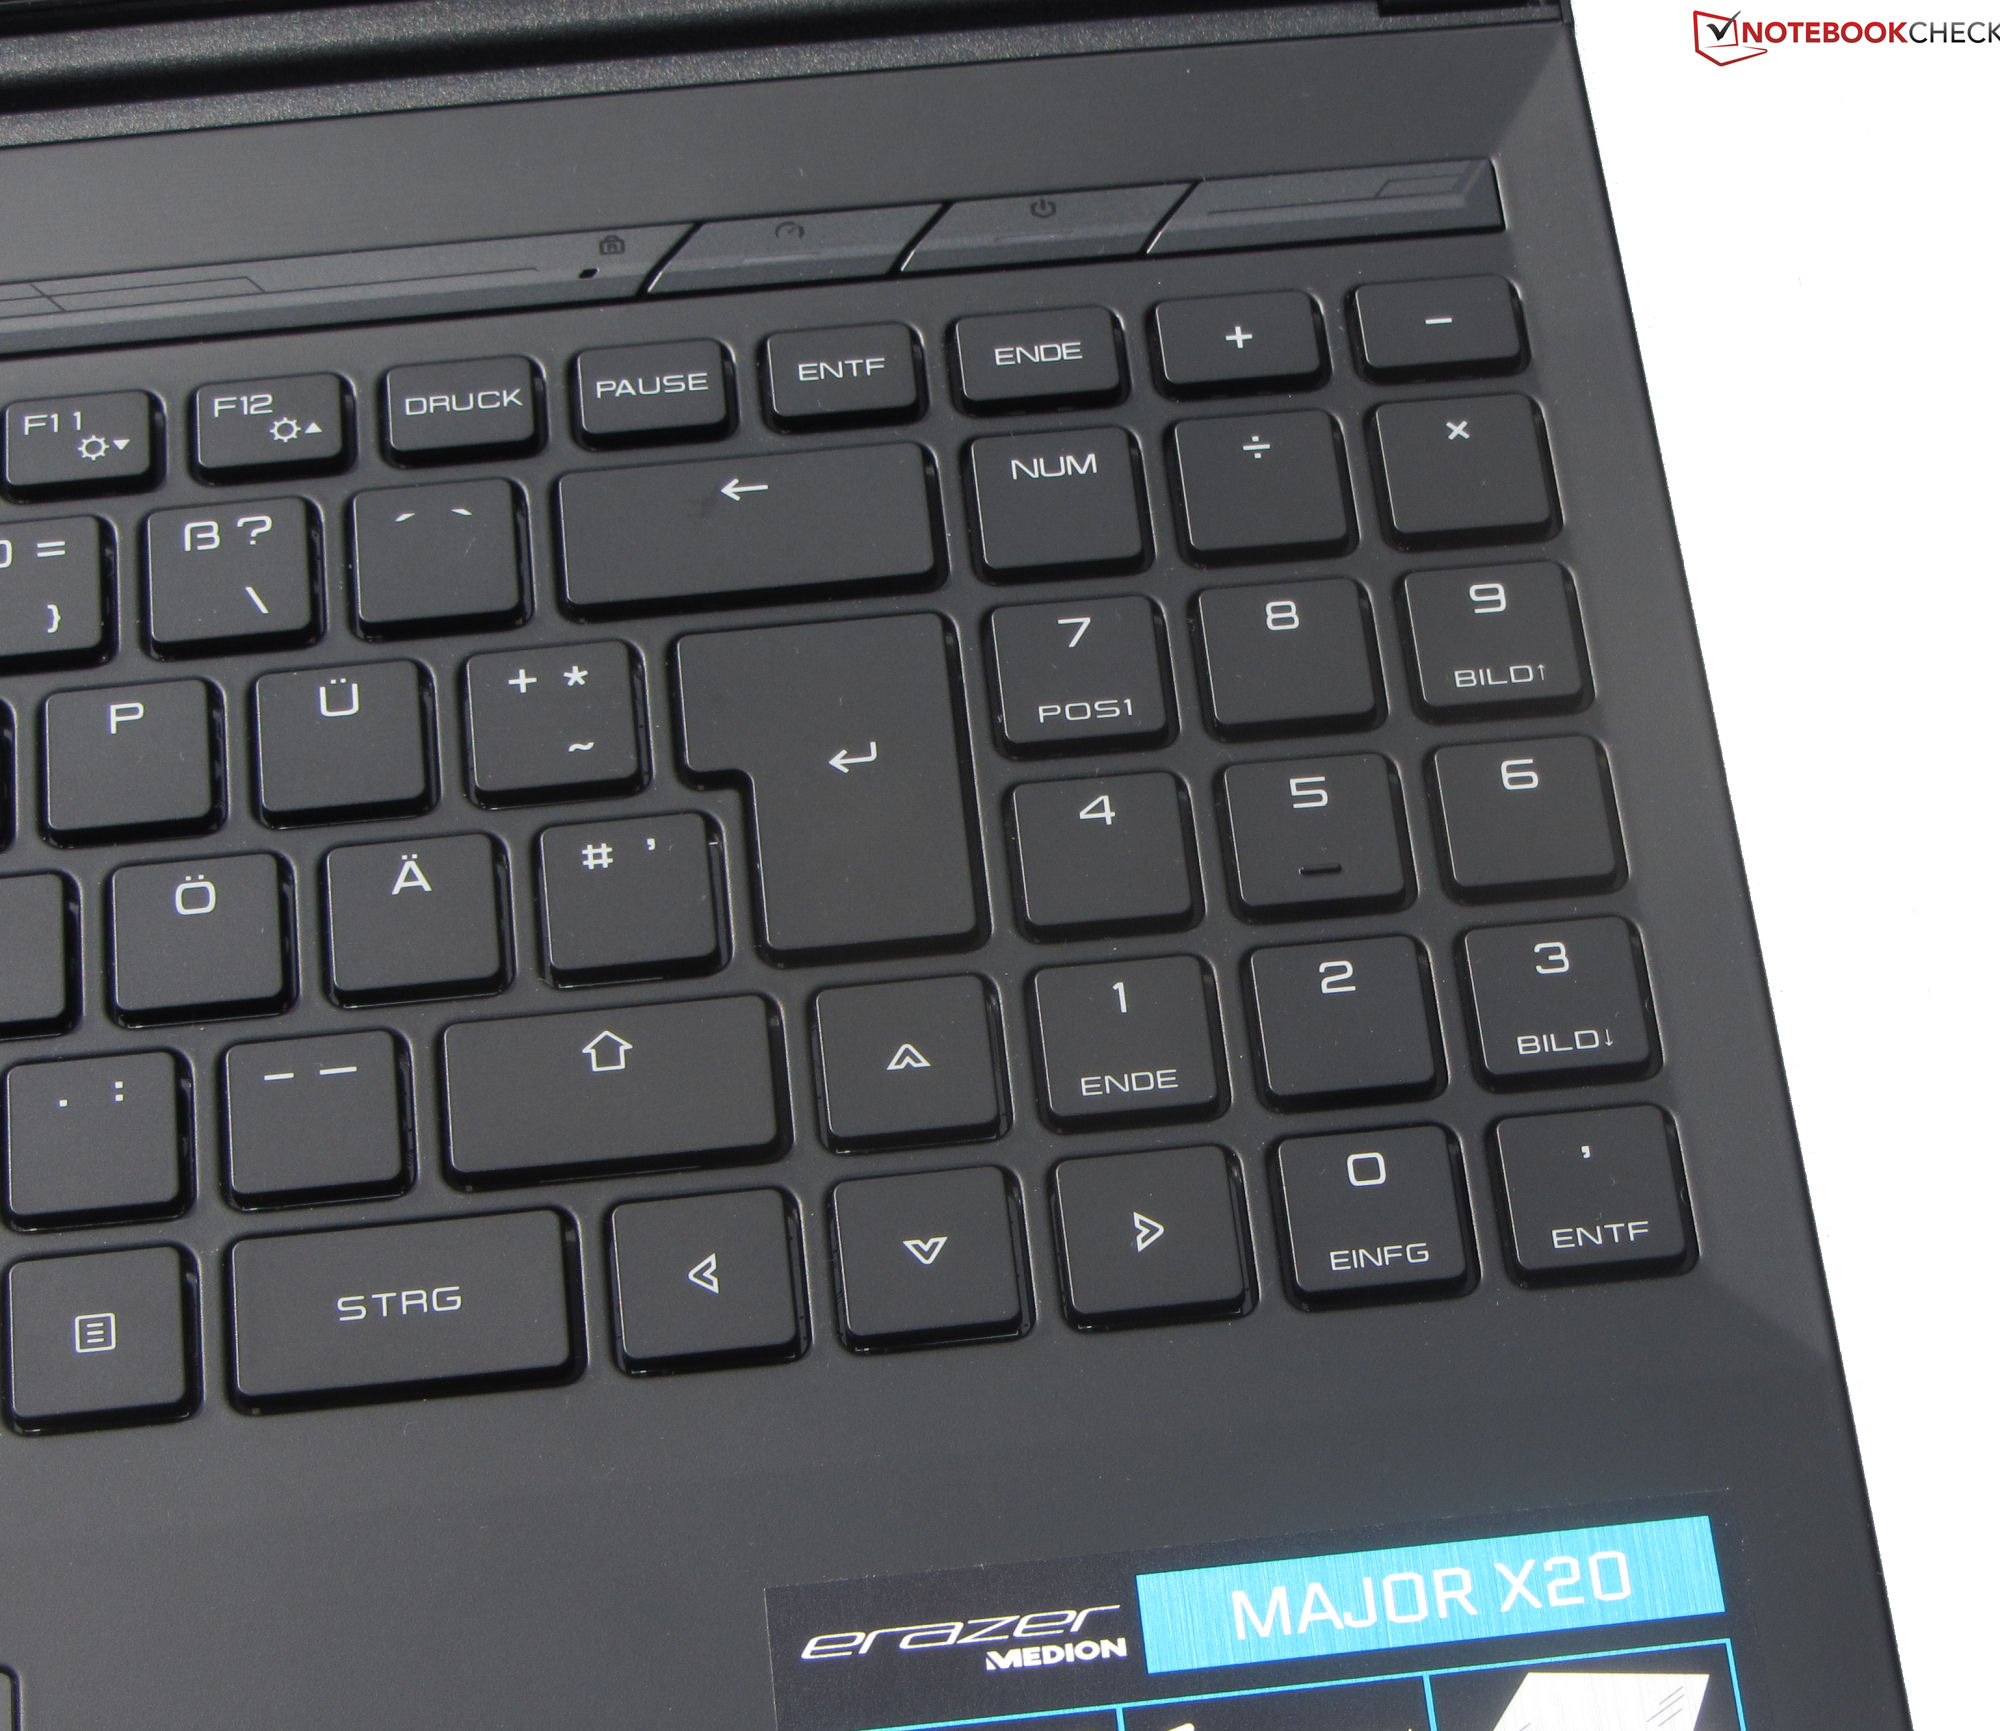
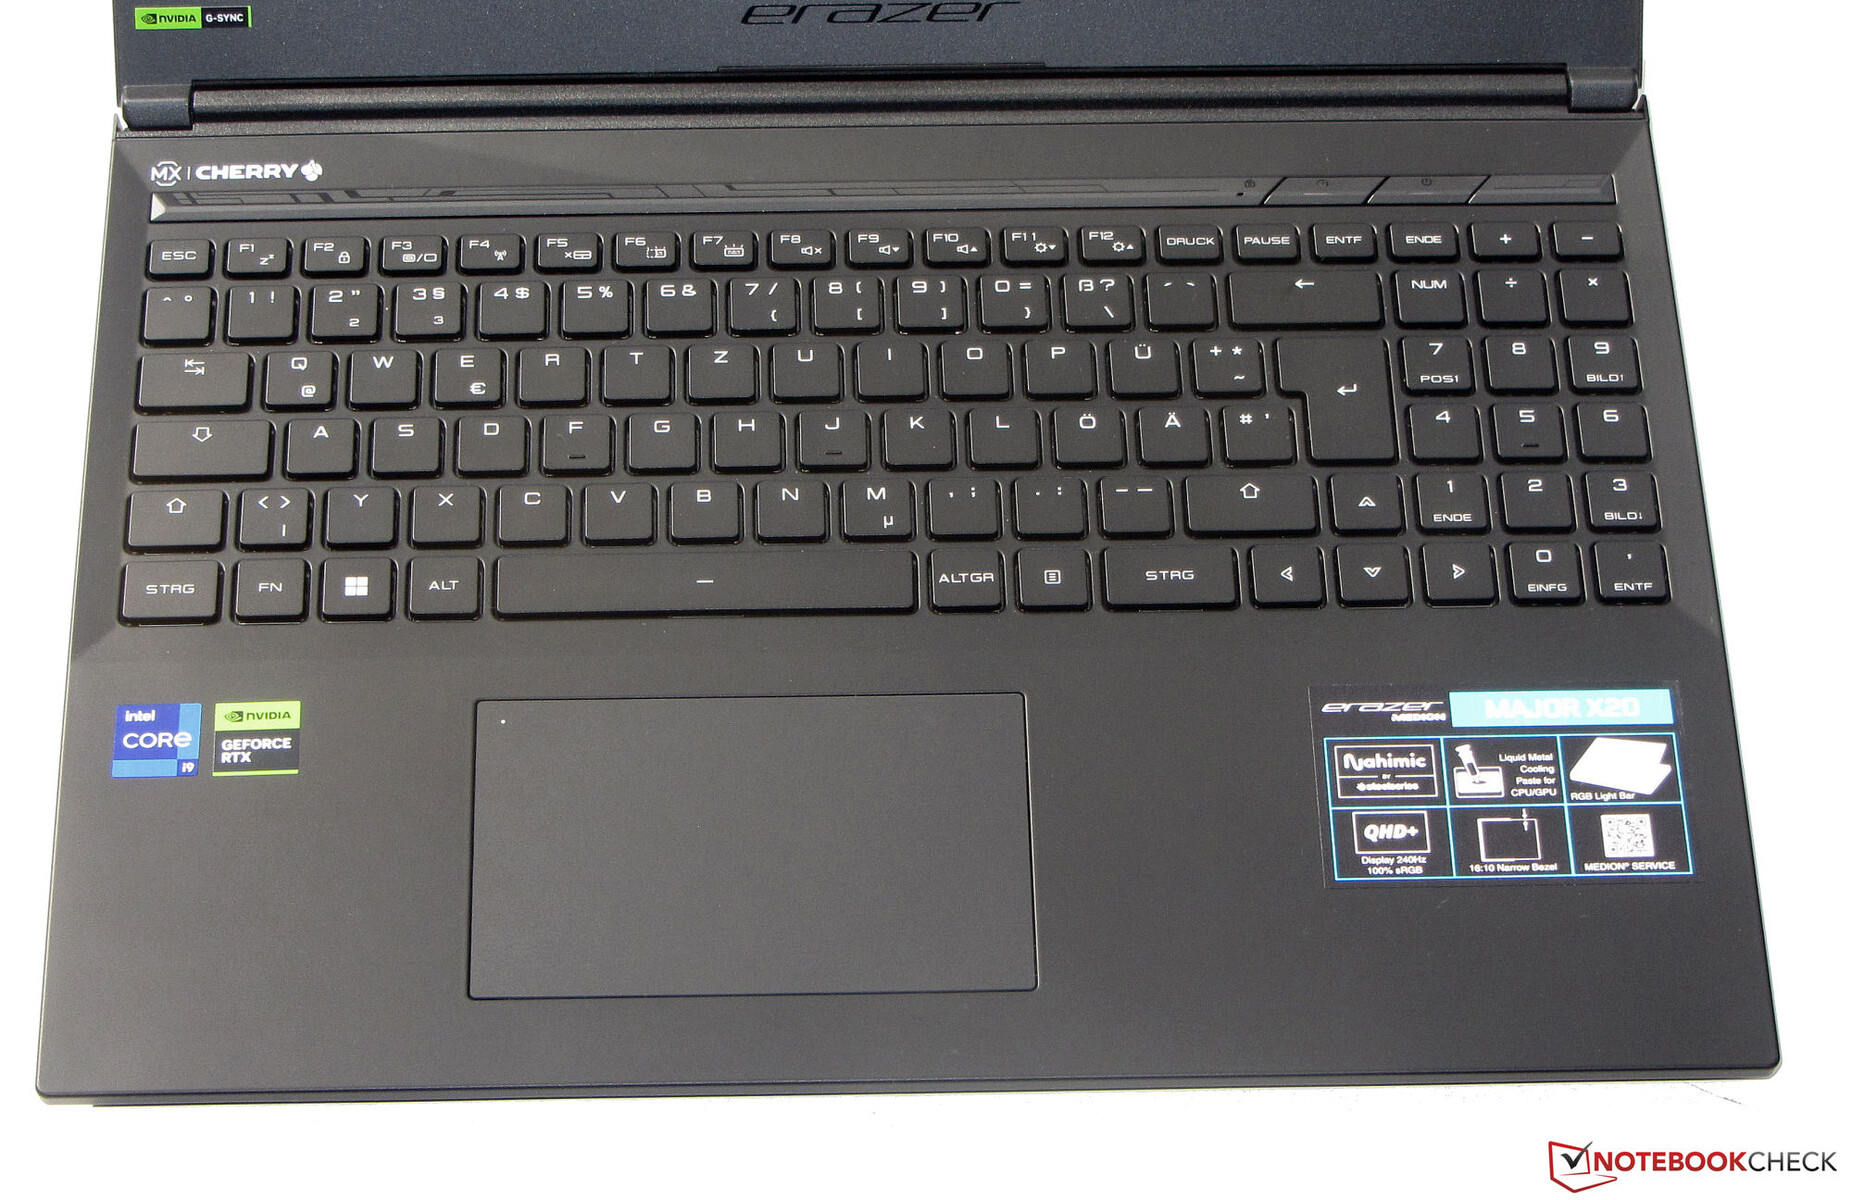
输入设备 - 带Cherry MX开关的机械键盘
键盘
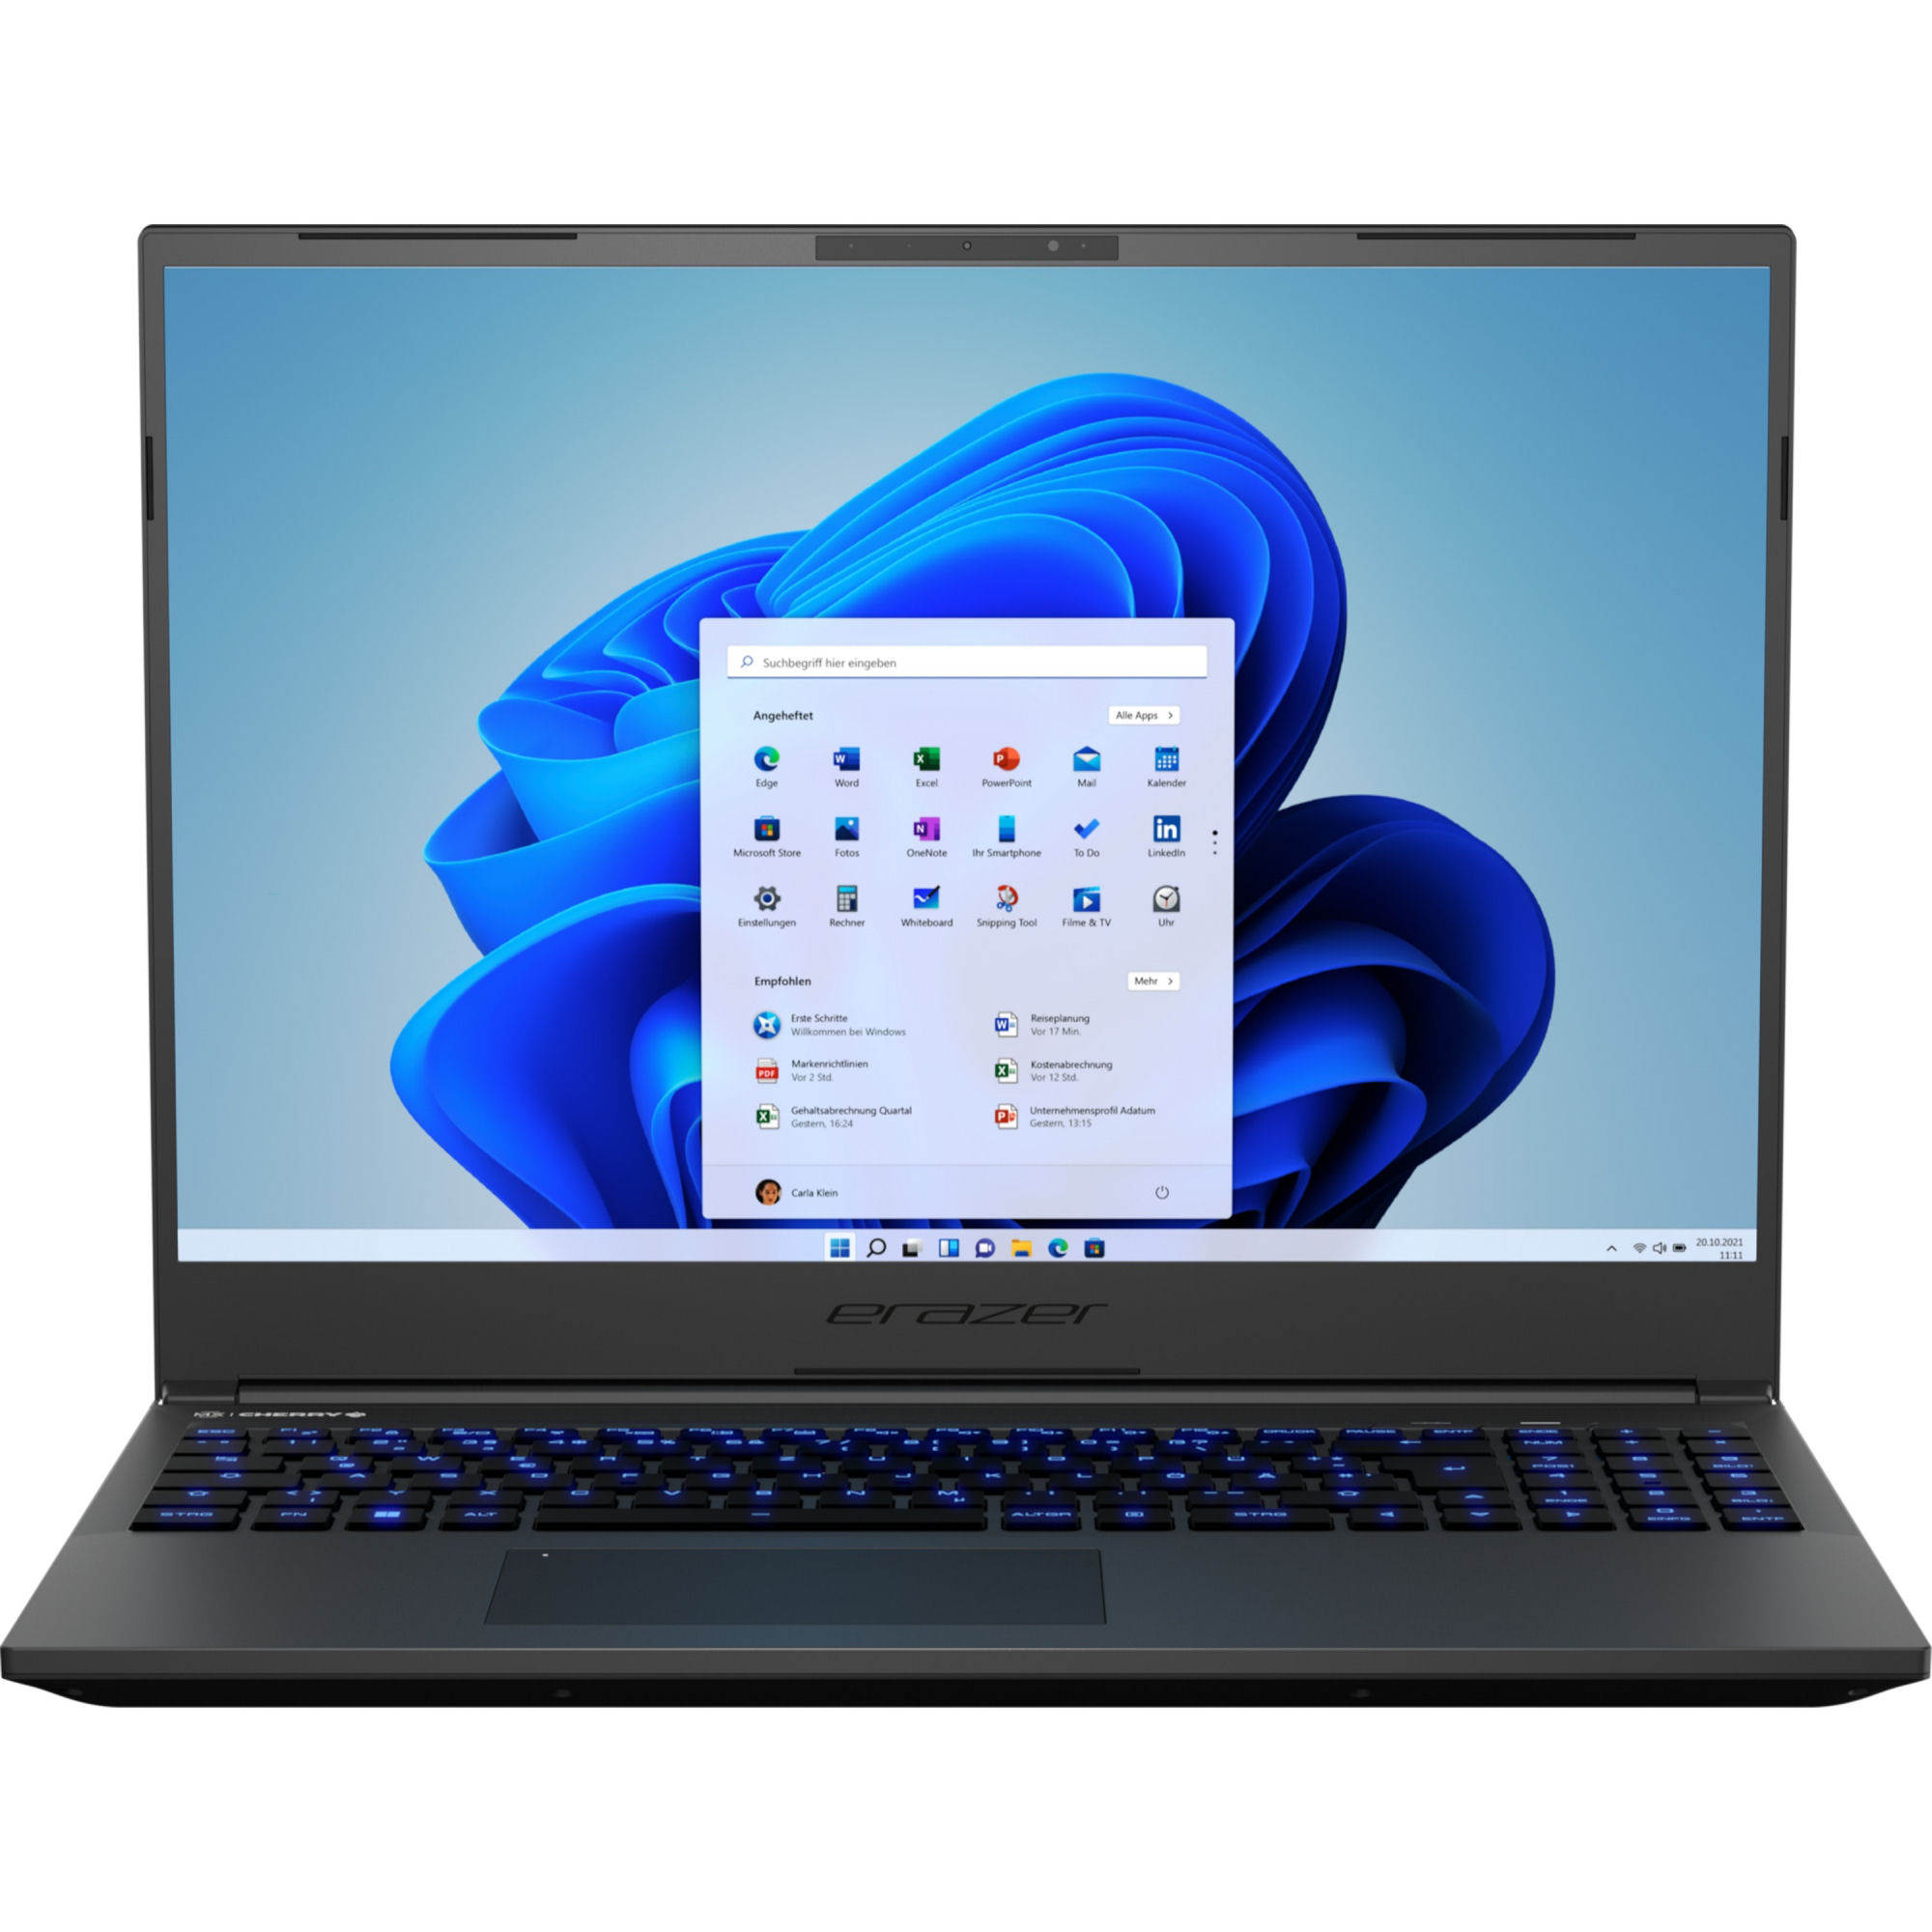
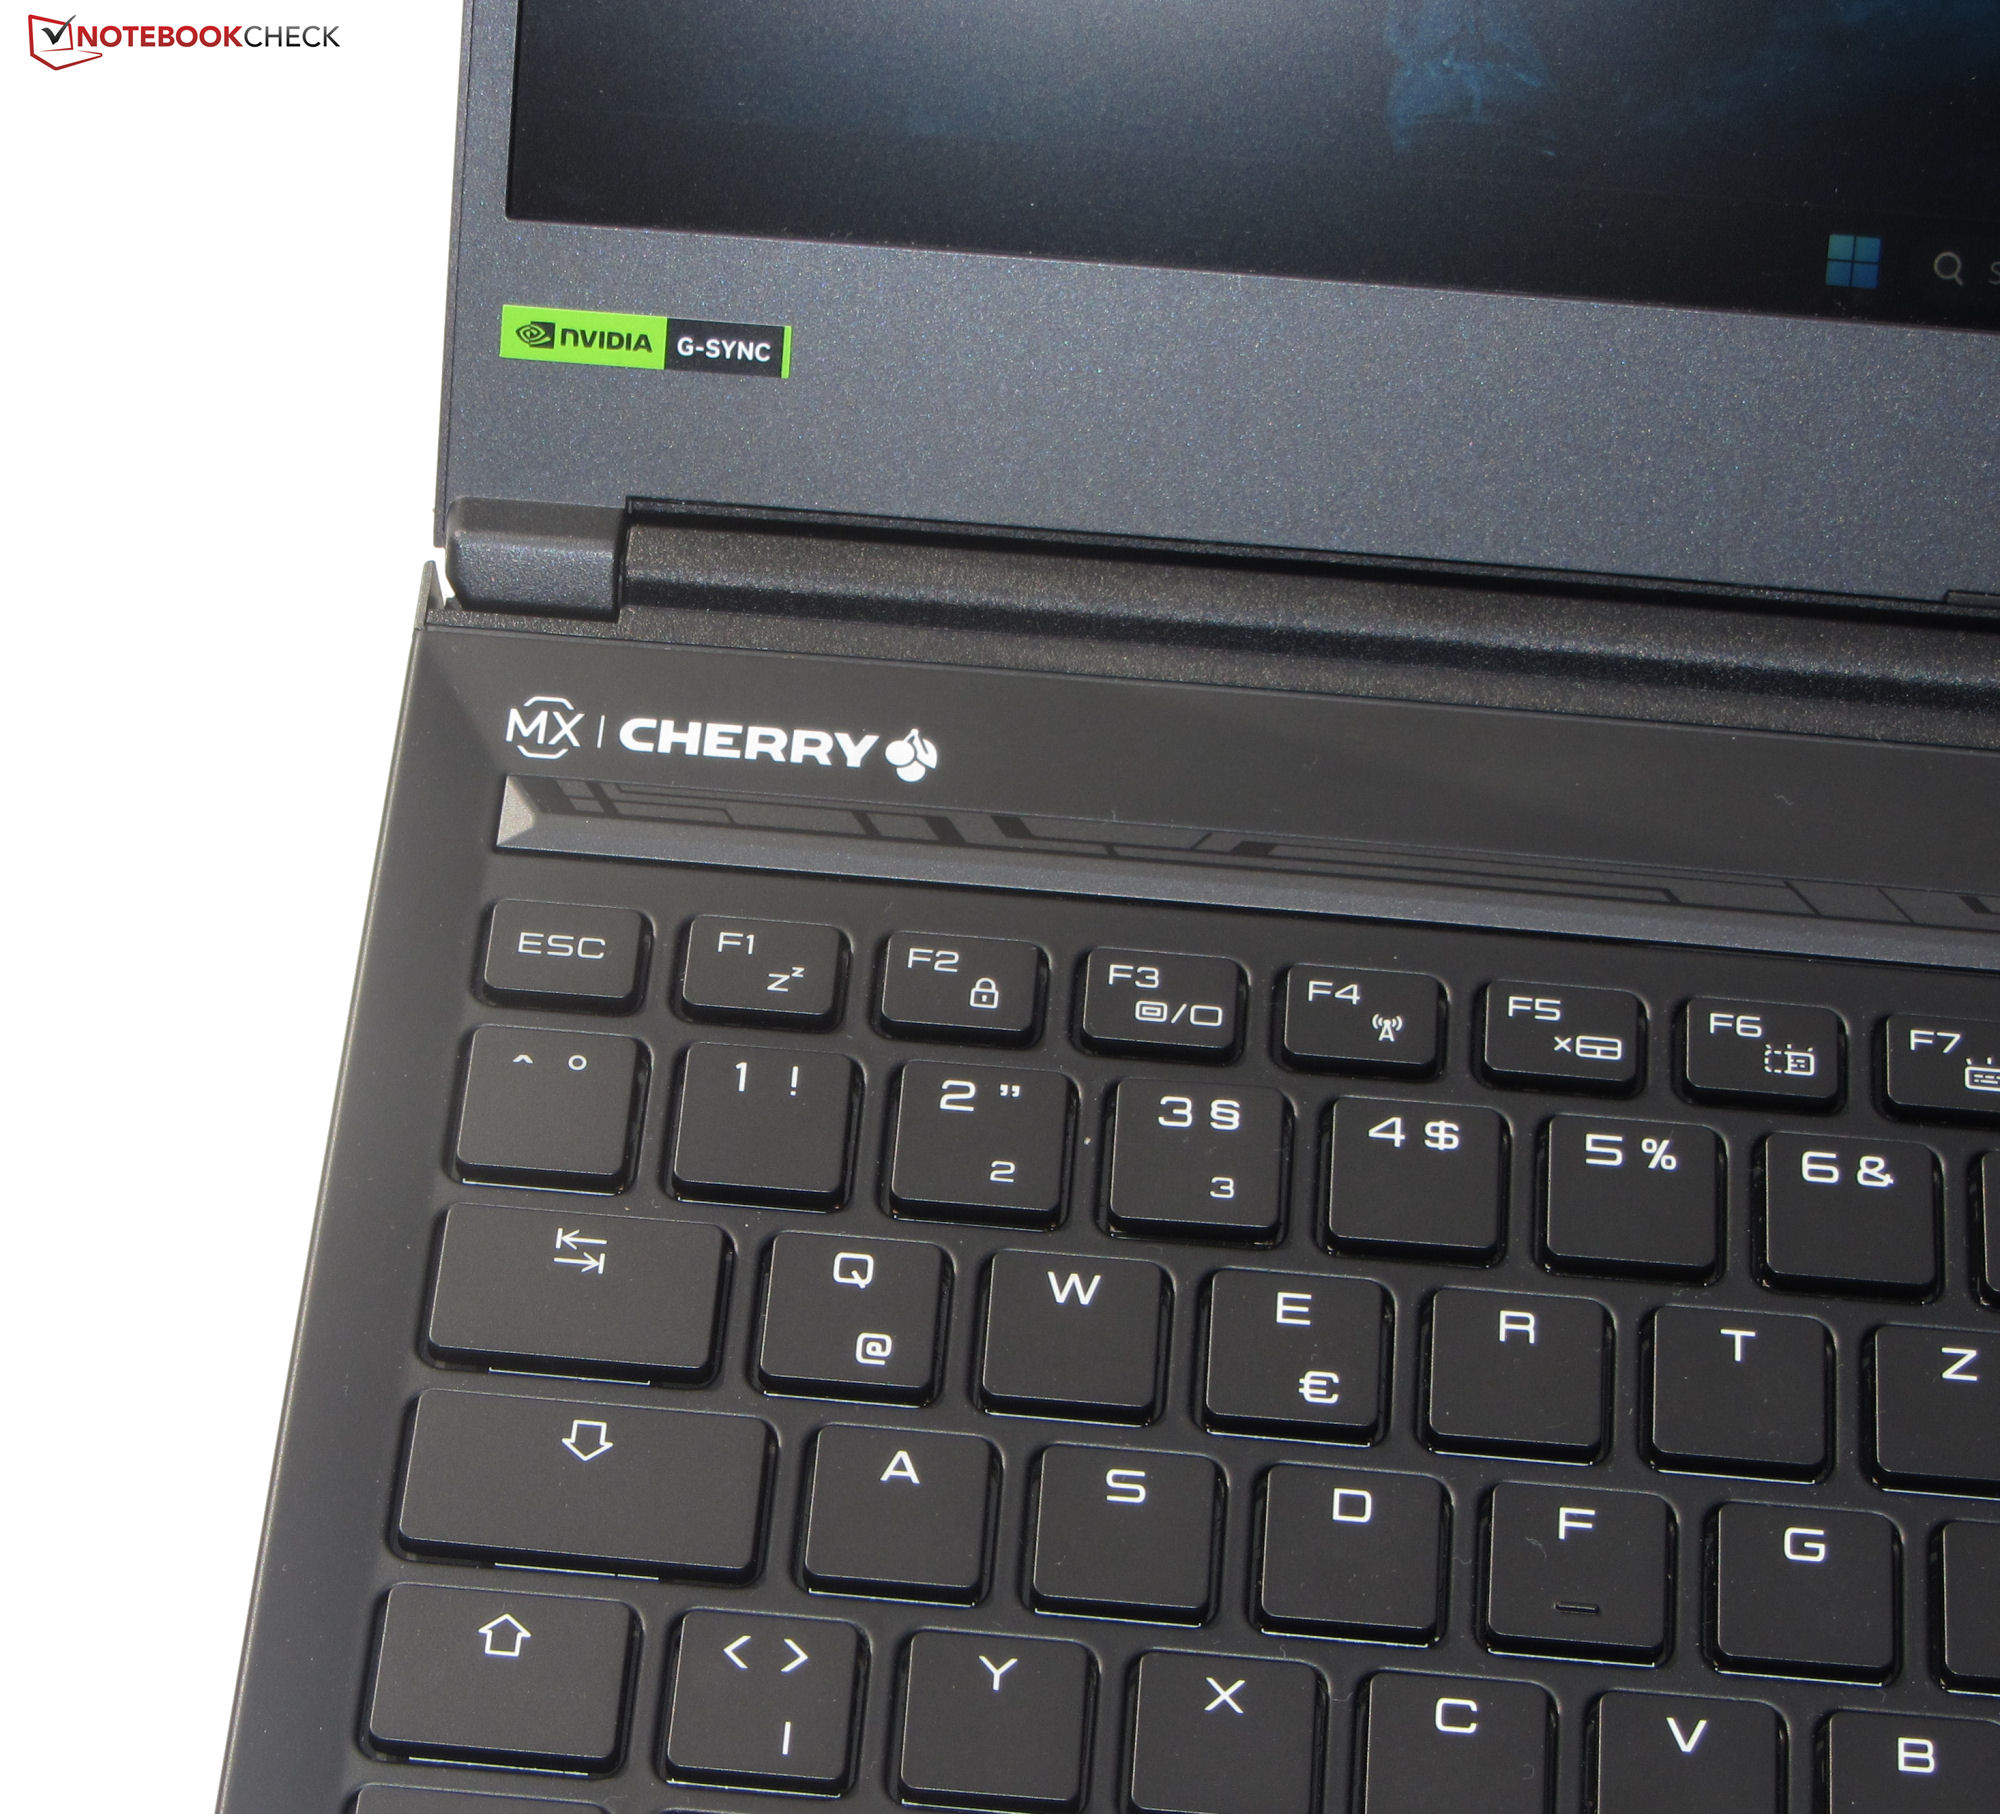
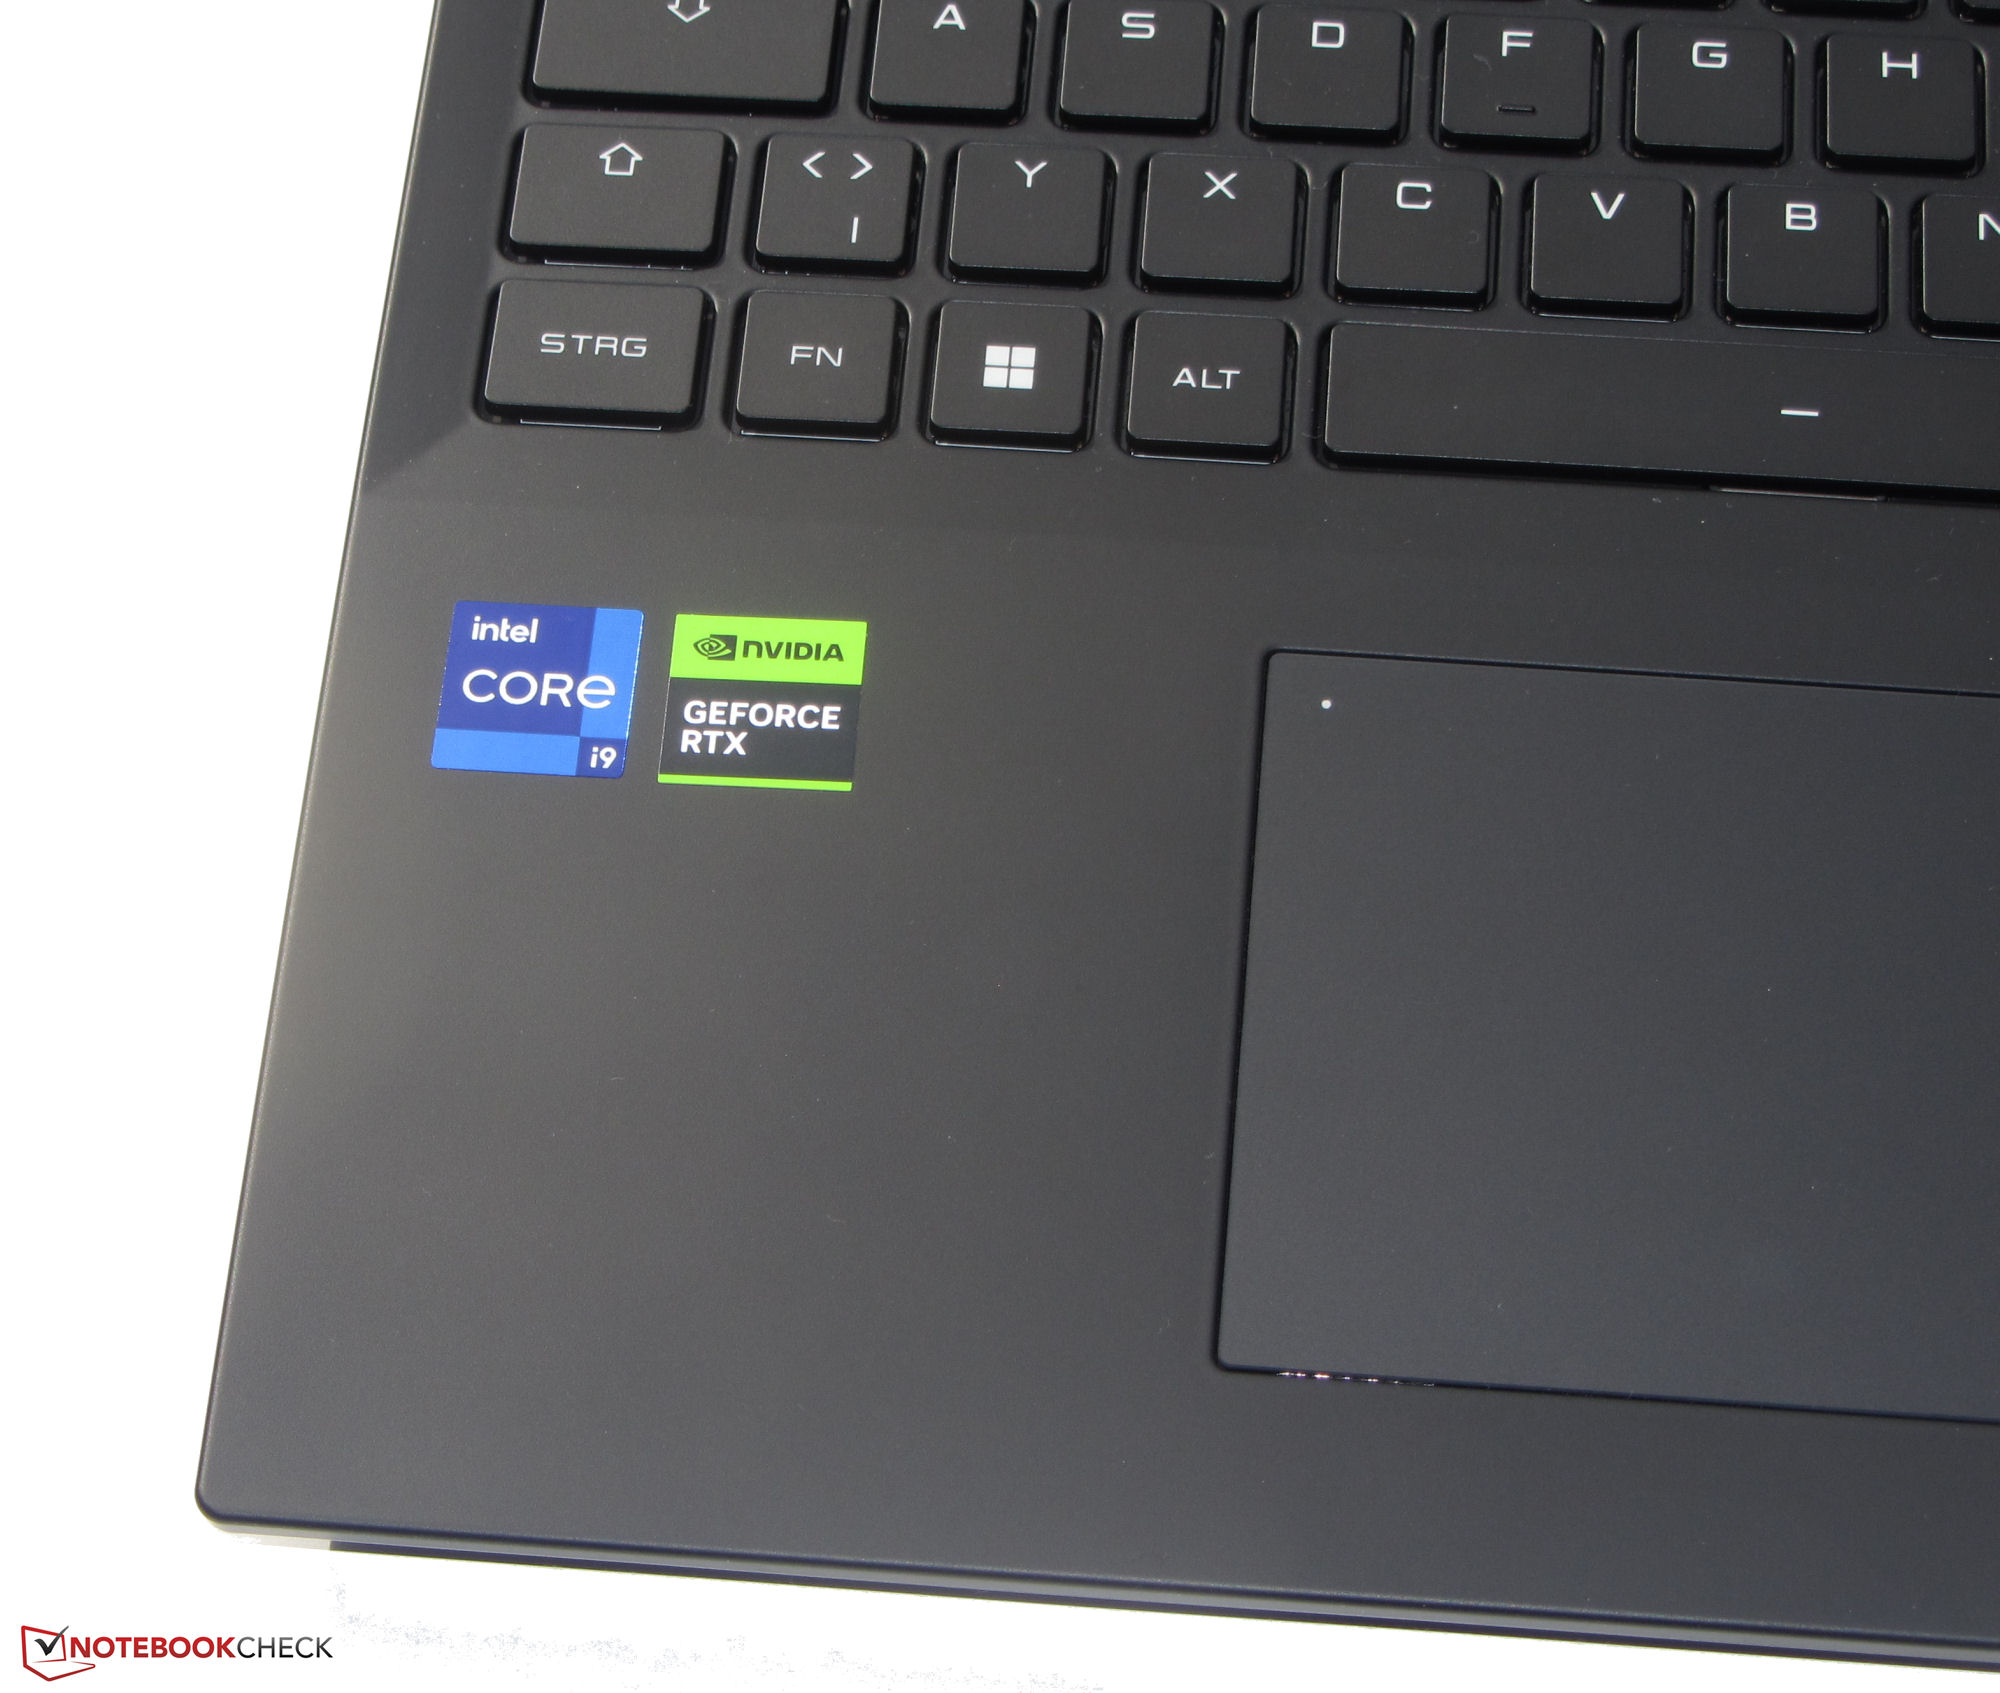
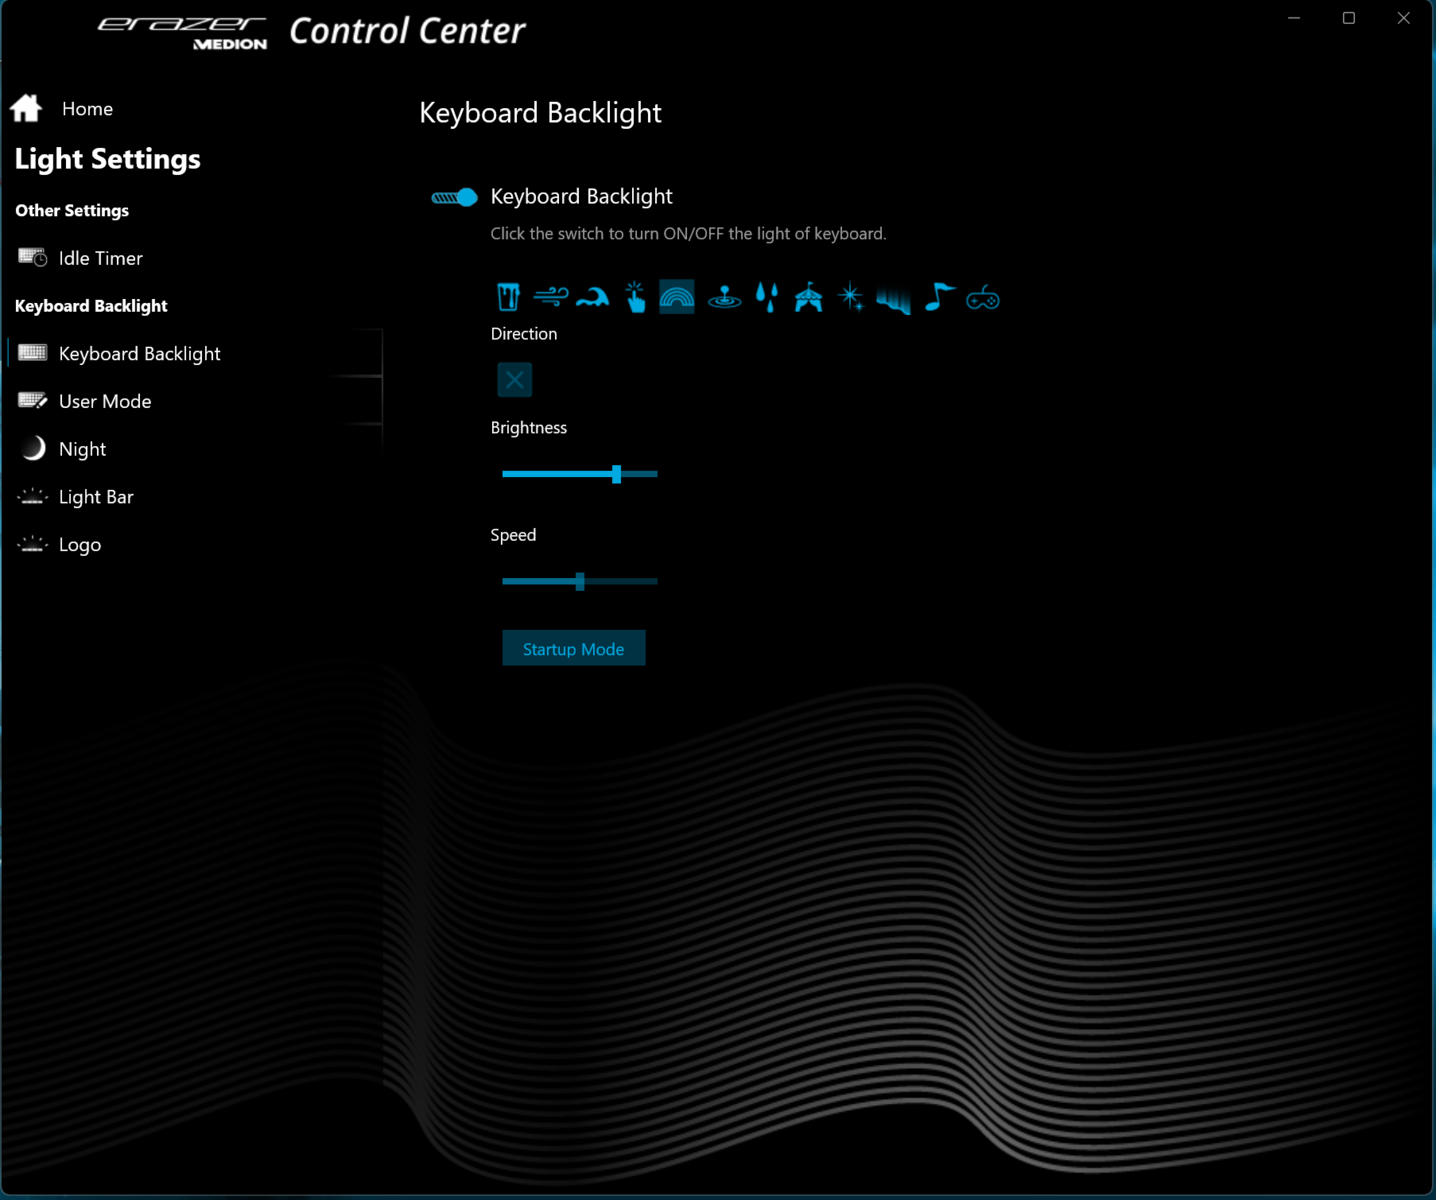
Medion在X20中安装了一个机械键盘,而不是Chiclet键盘。Cherry MX开关的行程适中,有一个清晰可闻的压力点。用户可以享受到丰富的打字感觉和精确的反馈,而且键盘在打字过程中不会屈服。两个功能键可以调节四段式独立按键照明(RGB)的亮度。总的来说,我们可以说这是一个坚实的键盘。
触摸板
一个具有多点触摸功能的点击板(约11.6 x 7.2厘米)可作为鼠标的替代品。其光滑的表面使手指容易滑动。它提供短程和清晰的压力点。用手指点一下左上角的LED,就可以打开或关闭整个垫子。
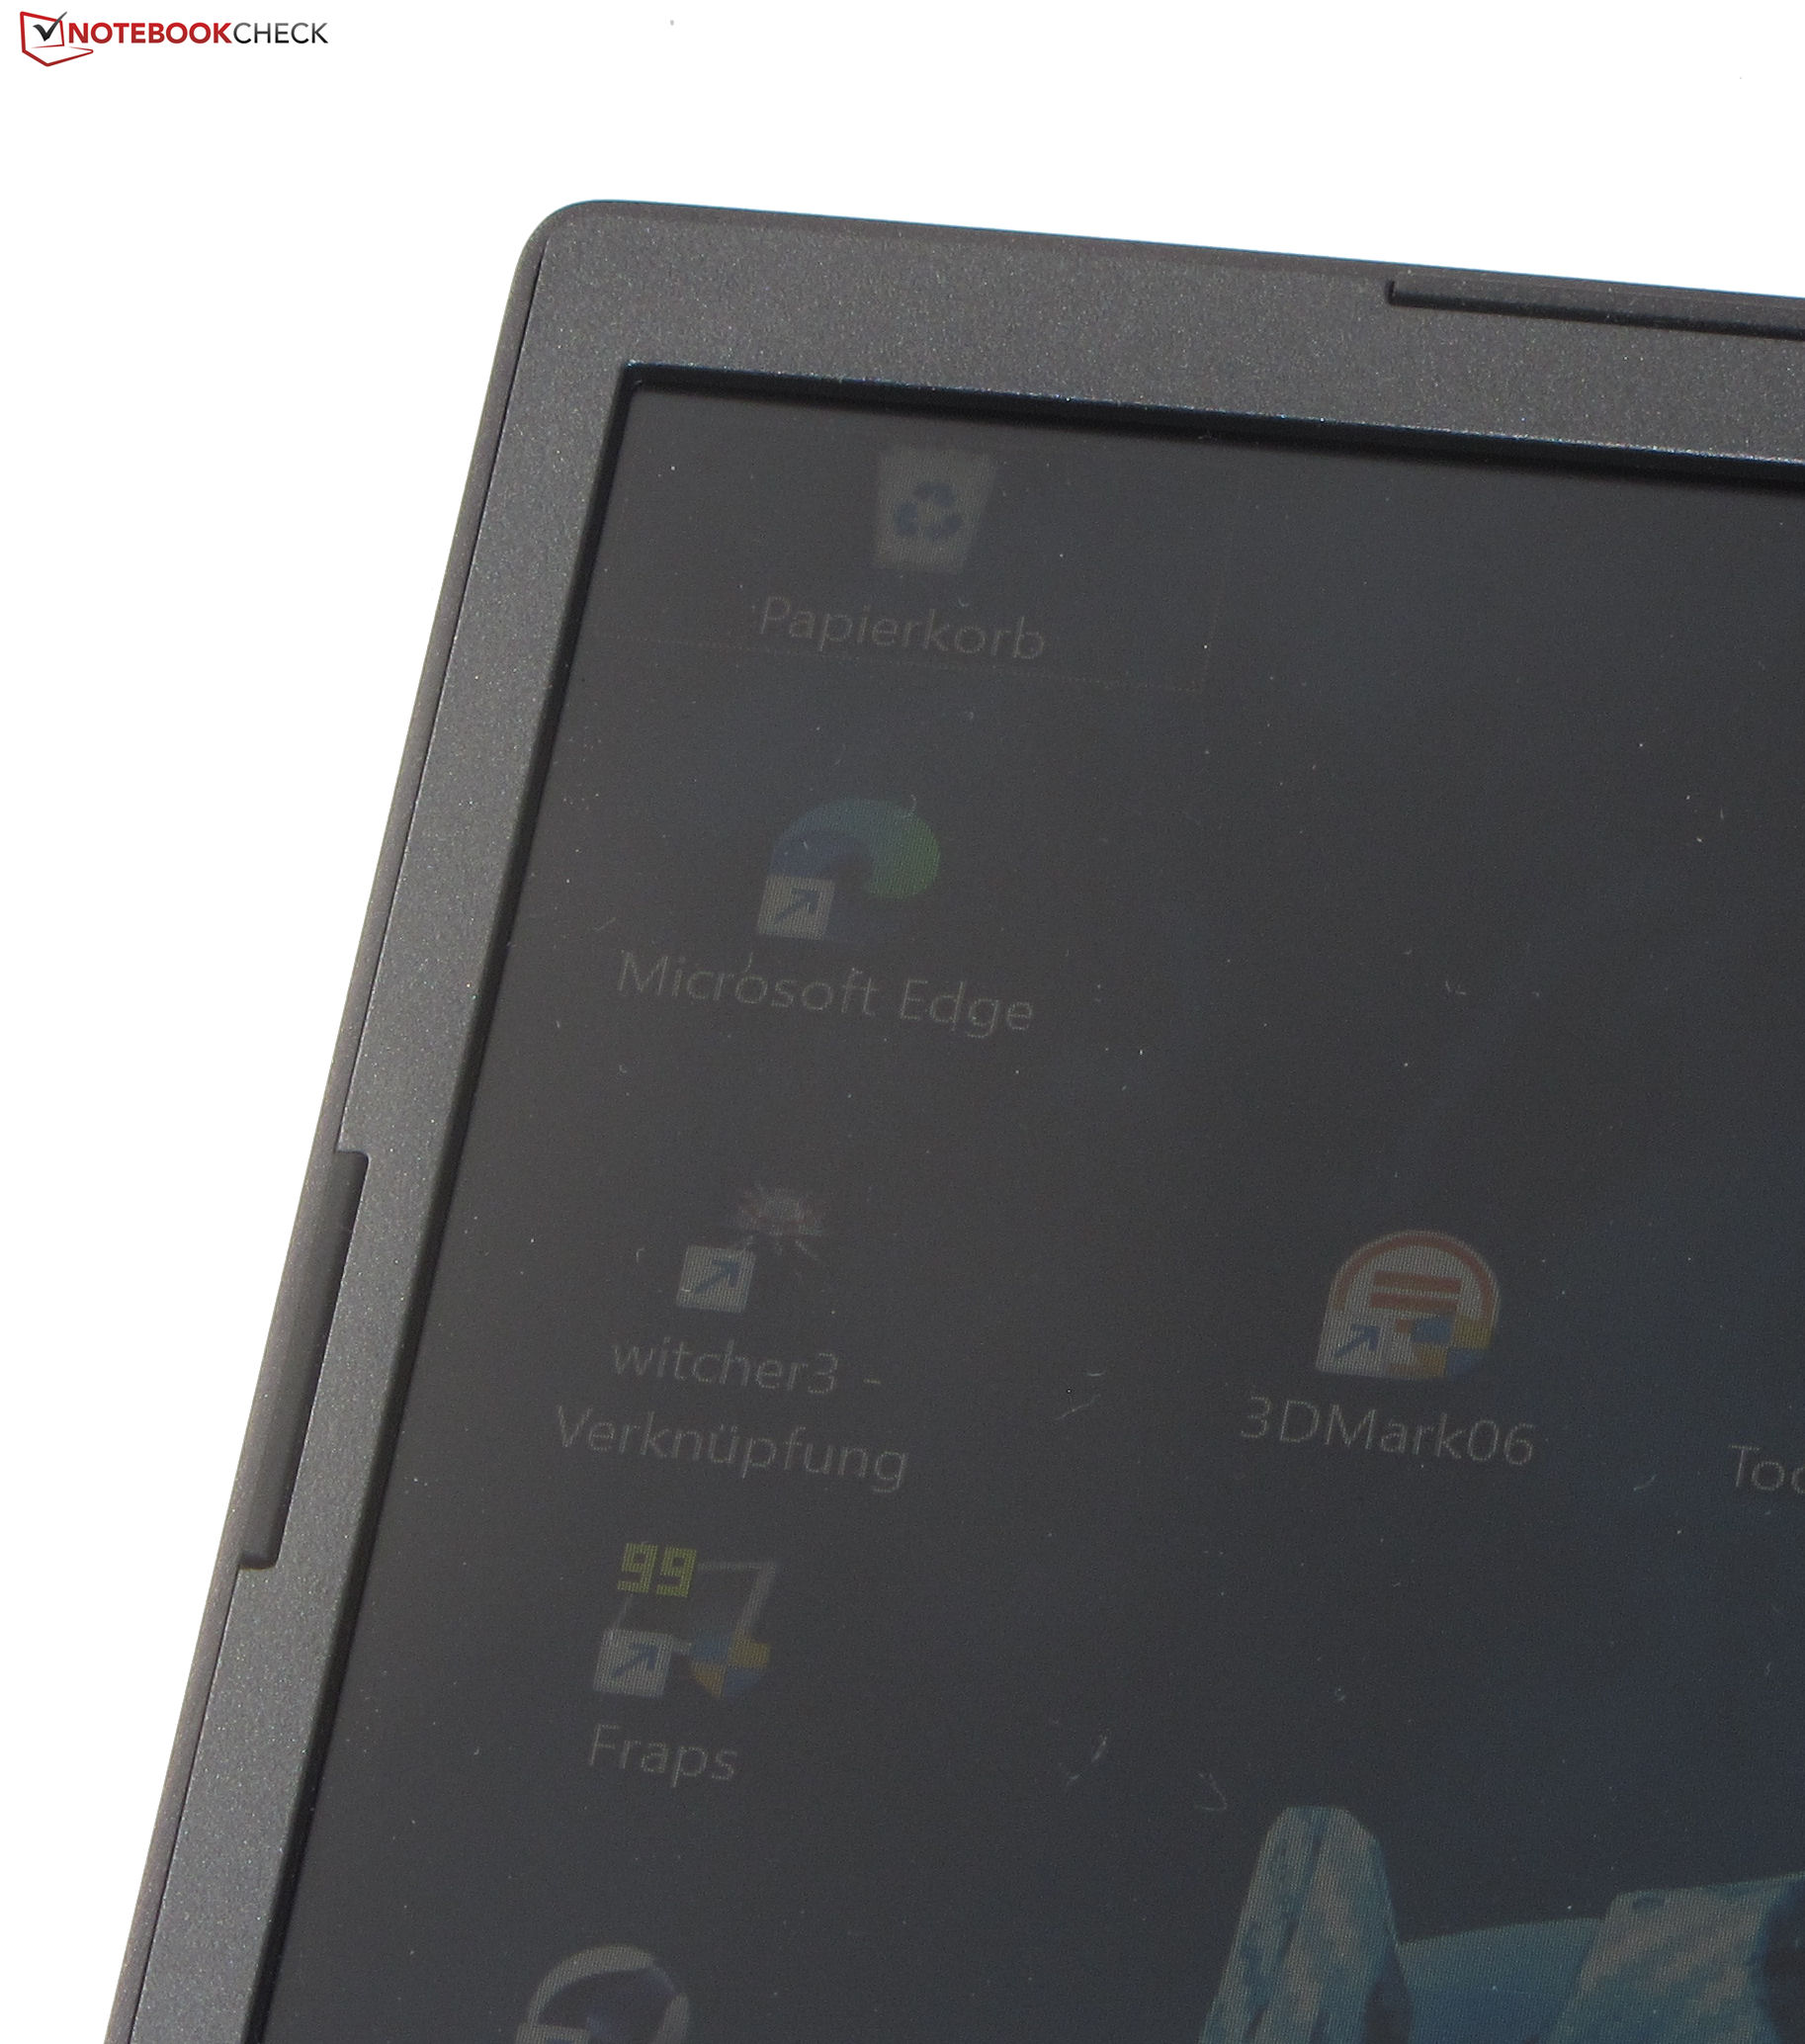
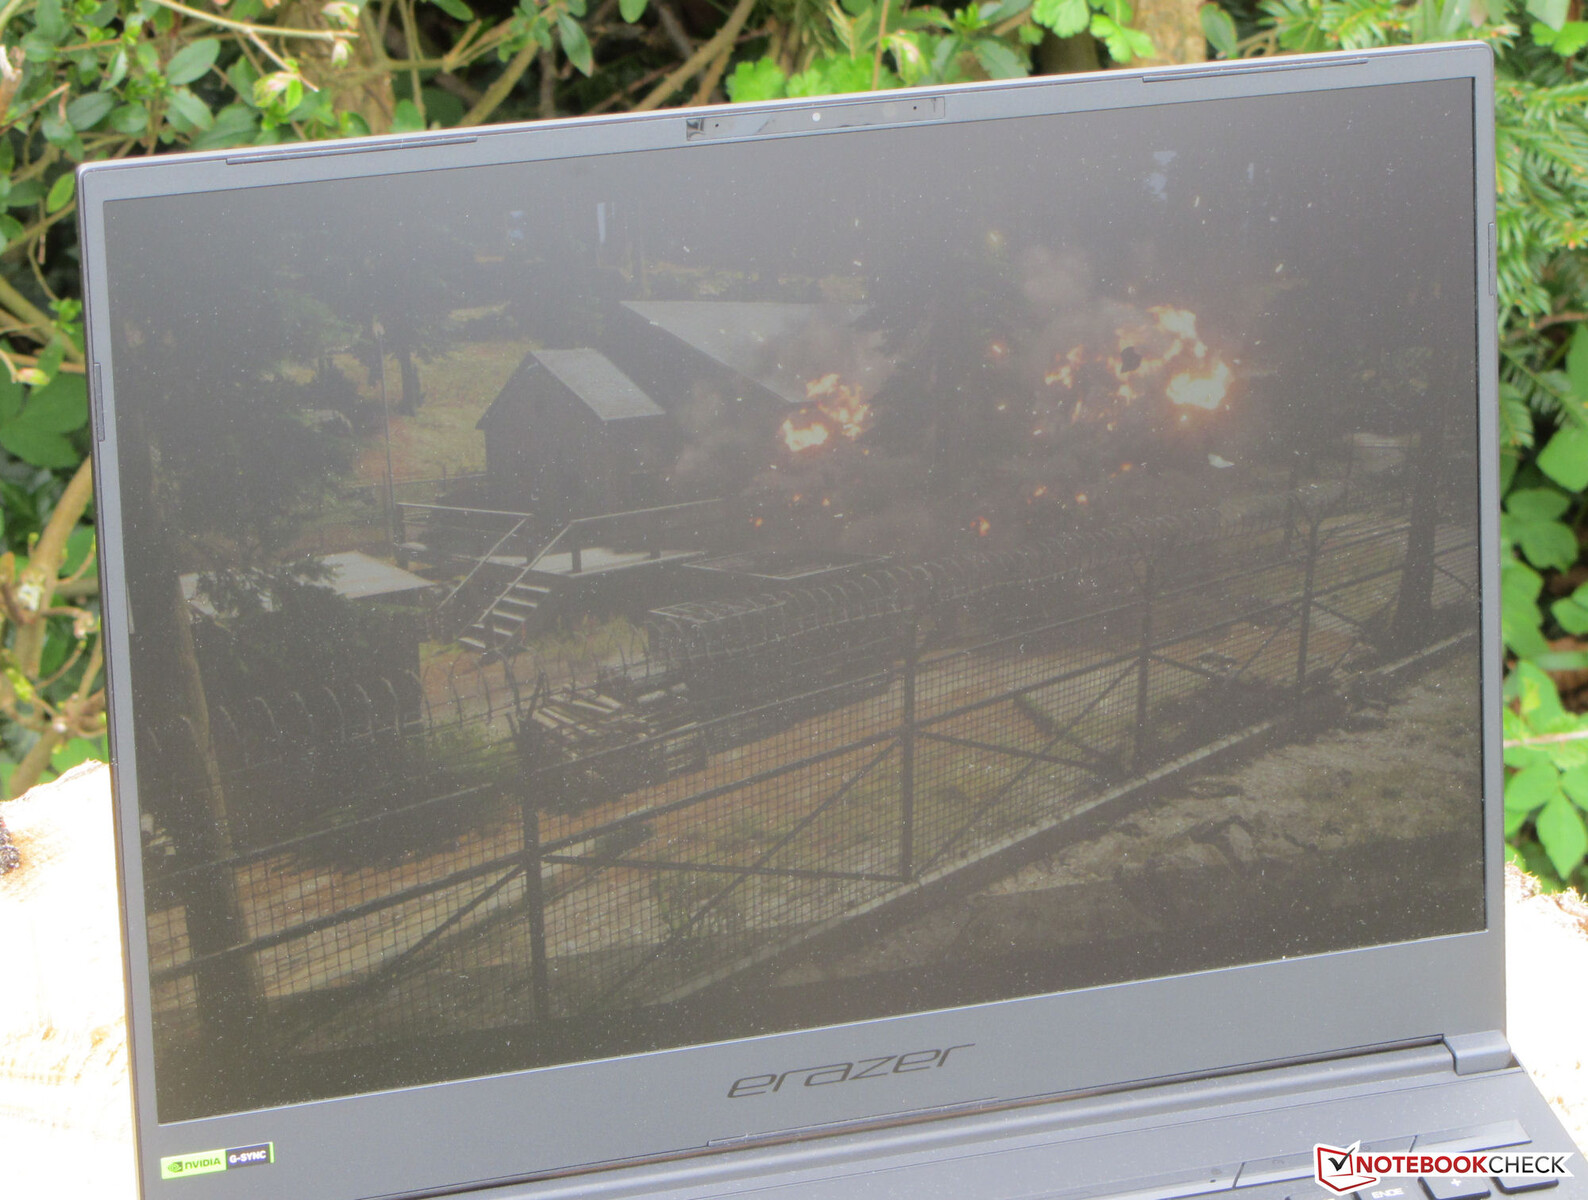
显示屏 - QHD+,16:10格式
Medion安装了一个支持G-Sync的240 Hz面板。后者可以动态地调整显示器和GPU的刷新率,以创造尽可能平滑的画质--尤其是在游戏时。
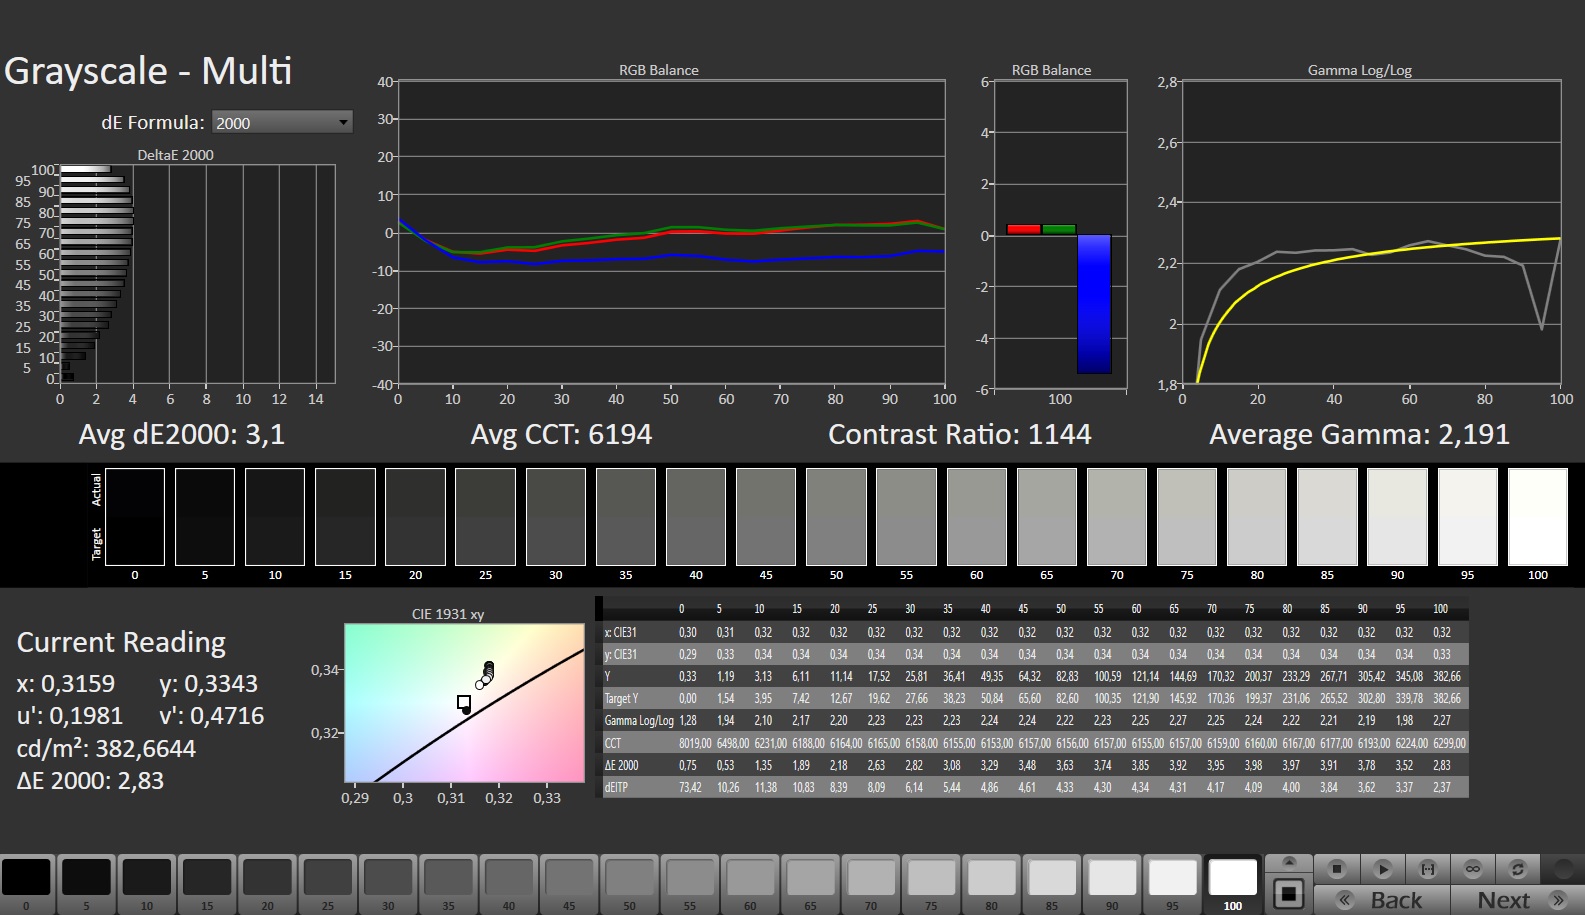
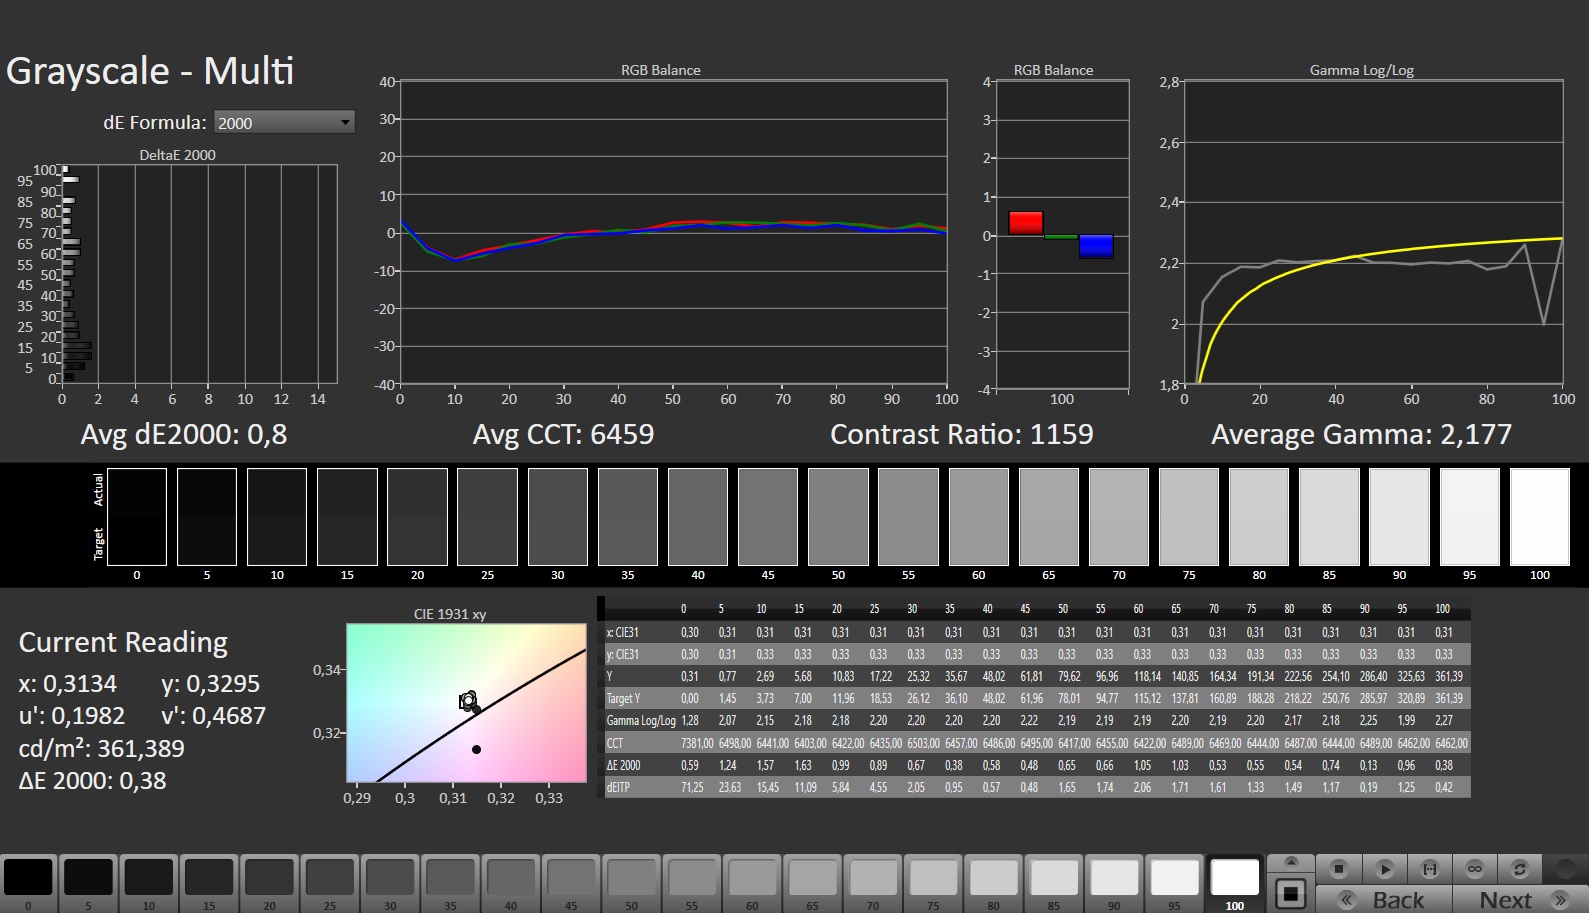
PWM闪烁在任何亮度设置下都不存在。雾面16英寸面板(2560x1600)的亮度和对比度在适合工作的16:10格式中达到了相应的目标(>300 cd/m²或1000:1)。
| |||||||||||||||||||||||||
Brightness Distribution: 92 %
Center on Battery: 374 cd/m²
Contrast: 1133:1 (Black: 0.33 cd/m²)
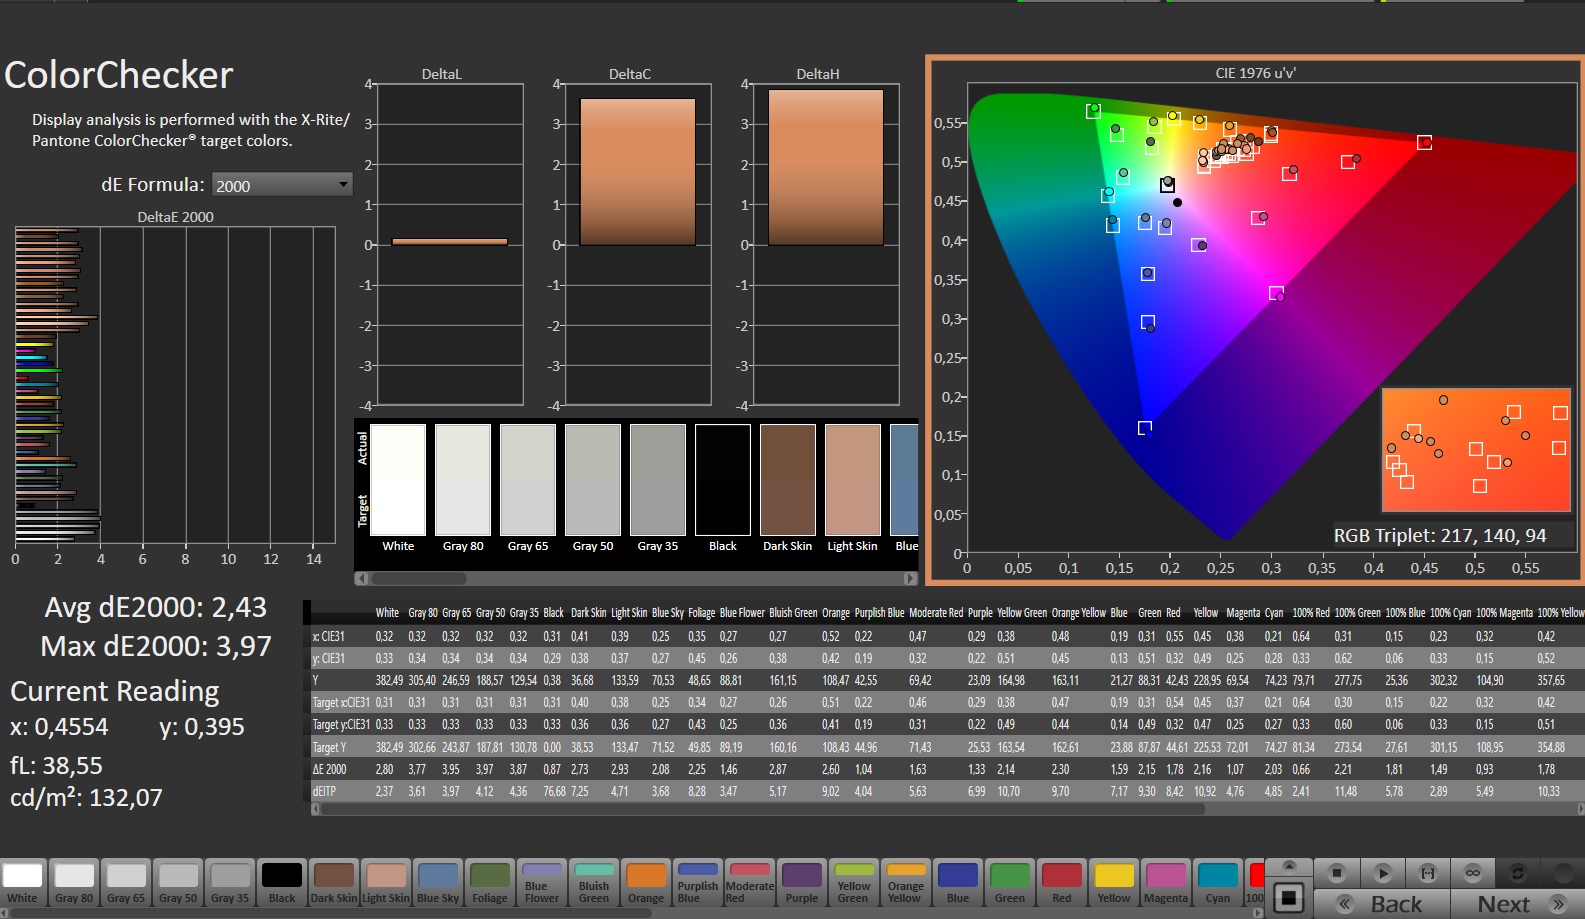
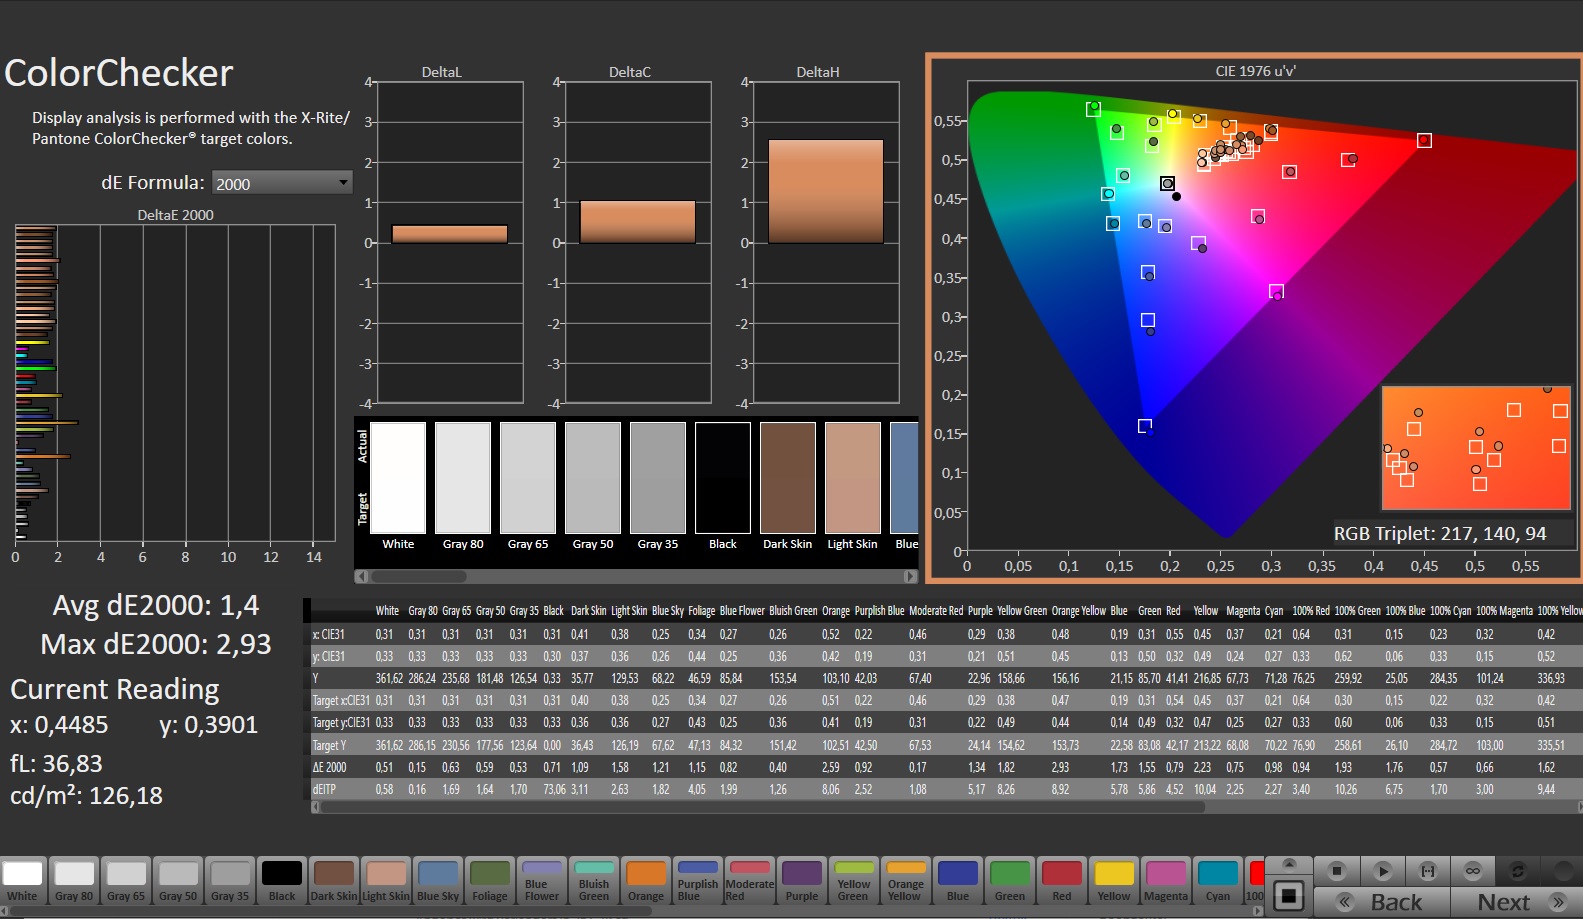
ΔE ColorChecker Calman: 2.43 | ∀{0.5-29.43 Ø4.71}
calibrated: 1.4
ΔE Greyscale Calman: 3.1 | ∀{0.09-98 Ø4.96}
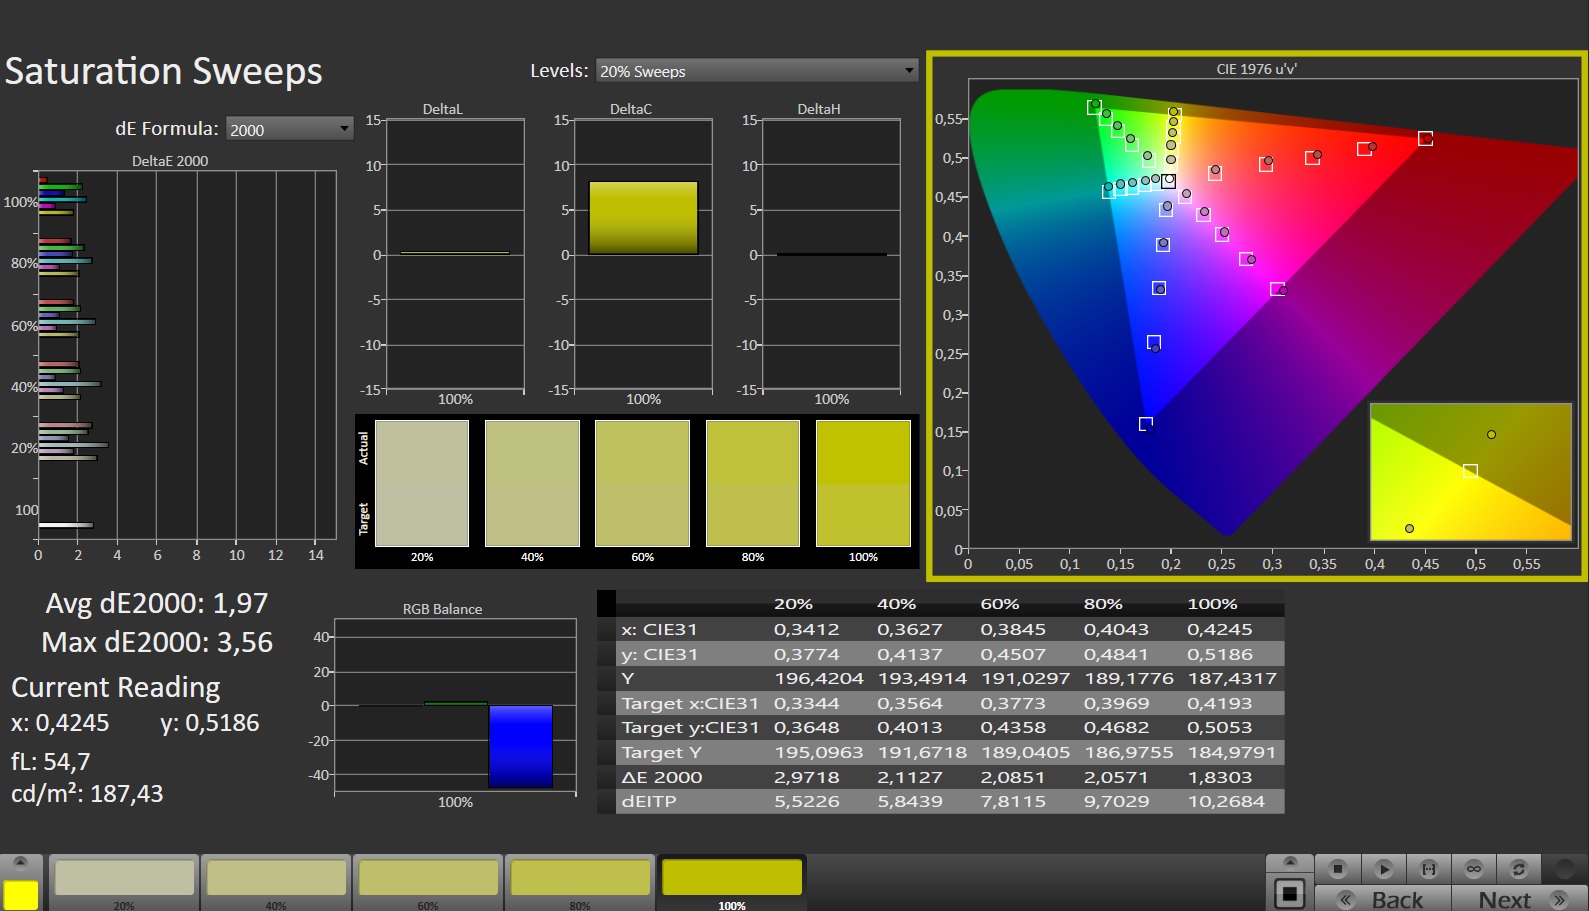
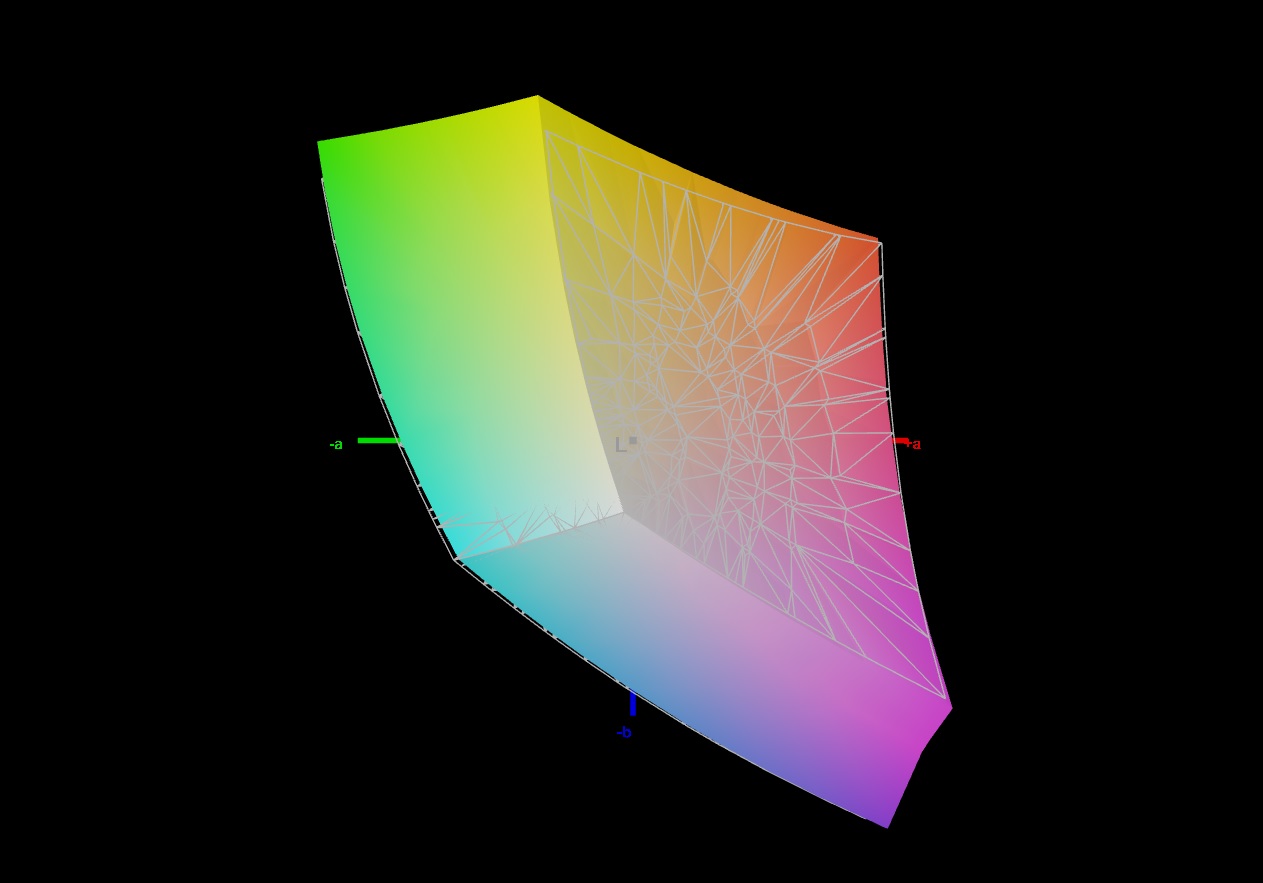
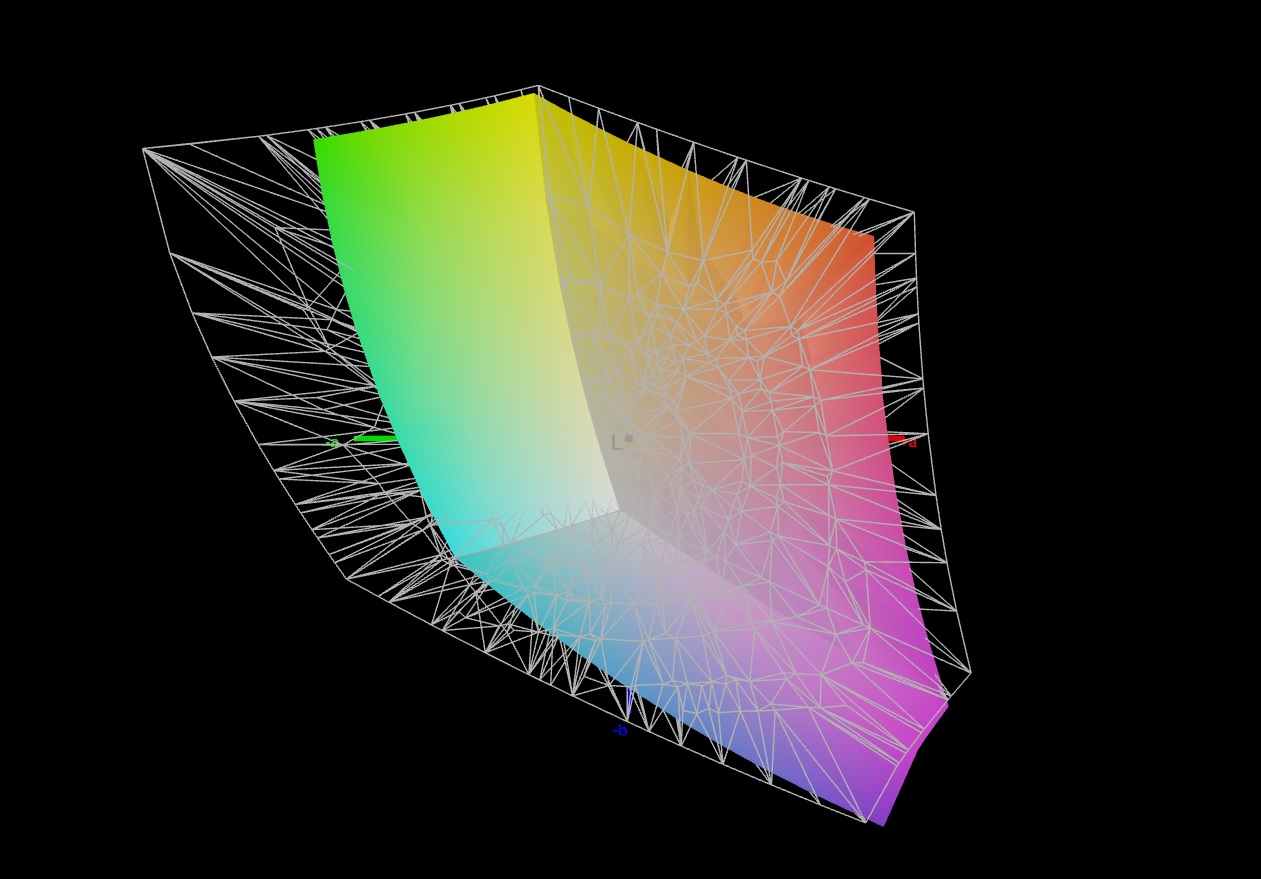
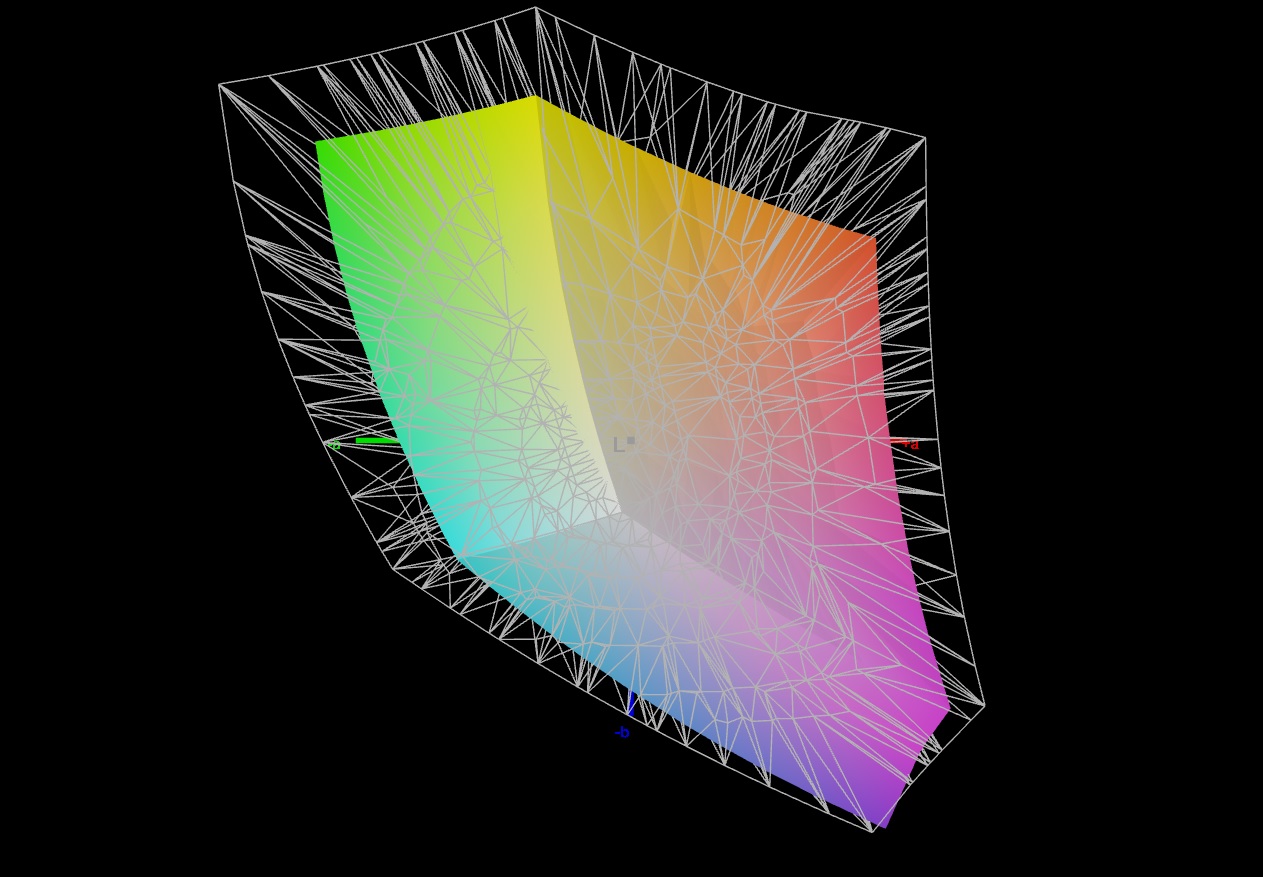
70.9% AdobeRGB 1998 (Argyll 3D)
98% sRGB (Argyll 3D)
69.4% Display P3 (Argyll 3D)
Gamma: 2.191
CCT: 6194 K
| Medion Erazer Major X20 BOE CQ NE160QDM-NZ1, IPS, 2560x1600, 16" | Aorus 15X ASF BOE CQ NE156QHM-NZ1, IPS, 2560x1440, 15.6" | Razer Blade 15 OLED (Early 2022) Samsung ATNA562P02-0, OLED, 2560x1440, 15.6" | Asus ROG Strix G17 G713PI BOE0B69, IPS, 2560x1440, 17.3" | |
|---|---|---|---|---|
| Display | -0% | 25% | 22% | |
| Display P3 Coverage (%) | 69.4 | 69.3 0% | 97.6 41% | 98.3 42% |
| sRGB Coverage (%) | 98 | 98.2 0% | 99.4 1% | 100 2% |
| AdobeRGB 1998 Coverage (%) | 70.9 | 70.5 -1% | 94 33% | 85.9 21% |
| Response Times | -12% | 79% | 21% | |
| Response Time Grey 50% / Grey 80% * (ms) | 13.1 ? | 12.4 ? 5% | 2 ? 85% | 5.3 ? 60% |
| Response Time Black / White * (ms) | 7.3 ? | 9.4 ? -29% | 2 ? 73% | 8.6 ? -18% |
| PWM Frequency (Hz) | 500 ? | |||
| Screen | 14% | 126% | 12% | |
| Brightness middle (cd/m²) | 374 | 316 -16% | 383 2% | 327 -13% |
| Brightness (cd/m²) | 357 | 301 -16% | 384 8% | 320 -10% |
| Brightness Distribution (%) | 92 | 90 -2% | 99 8% | 89 -3% |
| Black Level * (cd/m²) | 0.33 | 0.28 15% | 0.03 91% | 0.38 -15% |
| Contrast (:1) | 1133 | 1129 0% | 12767 1027% | 861 -24% |
| Colorchecker dE 2000 * | 2.43 | 1.54 37% | 1.89 22% | 1.01 58% |
| Colorchecker dE 2000 max. * | 3.97 | 2.46 38% | 3.76 5% | 4.01 -1% |
| Colorchecker dE 2000 calibrated * | 1.4 | 1.21 14% | 2.67 -91% | 0.41 71% |
| Greyscale dE 2000 * | 3.1 | 1.3 58% | 1.26 59% | 1.6 48% |
| Gamma | 2.191 100% | 2.307 95% | 2.41 91% | 2.168 101% |
| CCT | 6194 105% | 6456 101% | 6386 102% | 6659 98% |
| Total Average (Program / Settings) | 1% /
7% | 77% /
97% | 18% /
16% |
* ... smaller is better
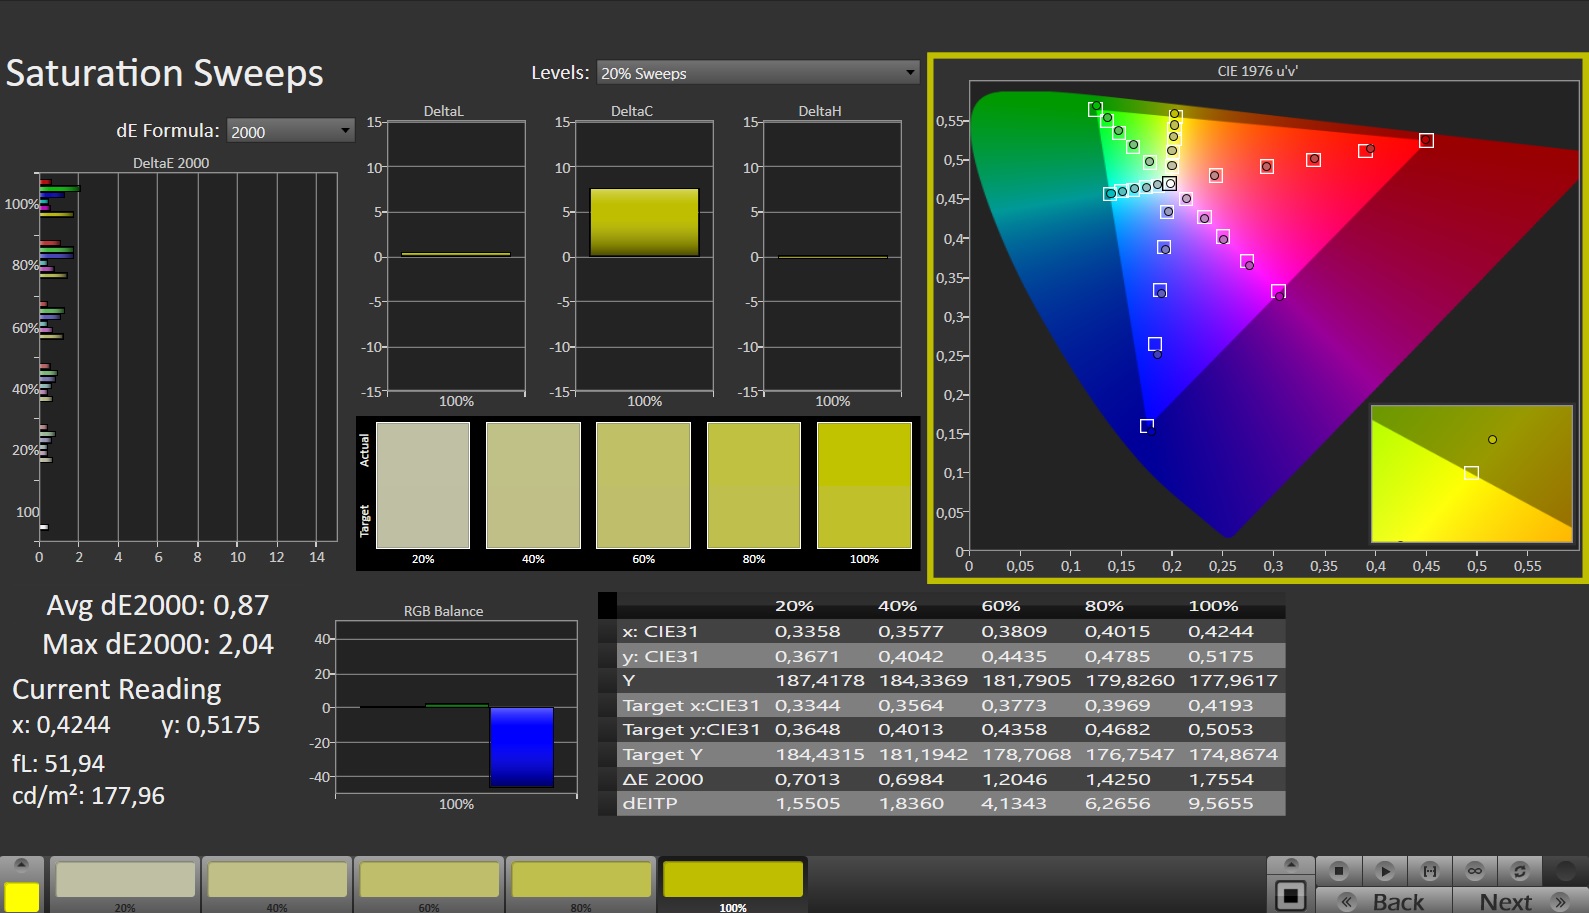
屏幕在交付状态下产生良好的色彩表现:达到目标(DeltaE<3)时,偏差约为2.4。手动校准将偏差降低到1.4,并确保更平衡的灰度。
该面板完全覆盖了sRGB色彩空间,但没有覆盖AdobeRGB和DCI-P3色彩空间。如果需要所有三种色彩空间,则没有办法绕过刀锋15的OLED屏幕。
Display Response Times
| ↔ Response Time Black to White | ||
|---|---|---|
| 7.3 ms ... rise ↗ and fall ↘ combined | ↗ 3.1 ms rise | 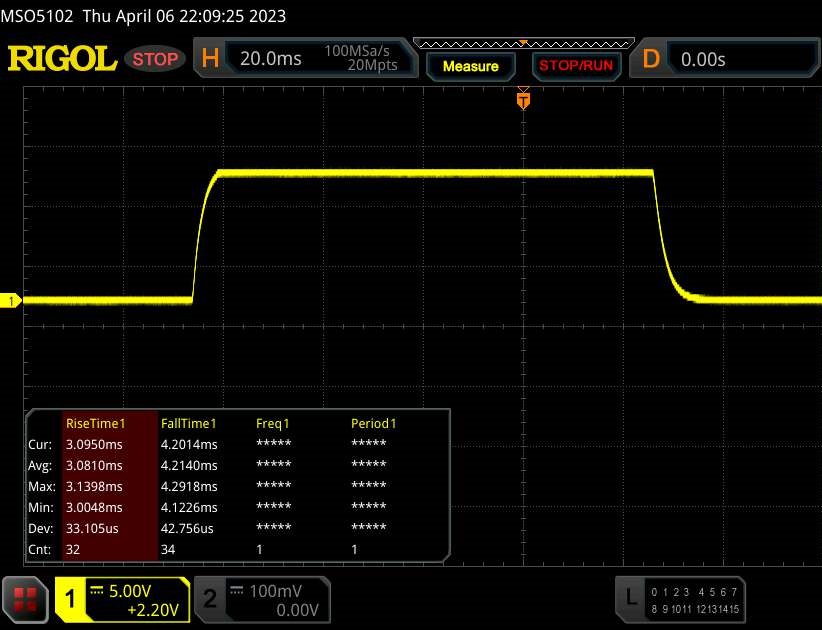 |
| ↘ 4.2 ms fall | ||
| The screen shows very fast response rates in our tests and should be very well suited for fast-paced gaming. In comparison, all tested devices range from 0.1 (minimum) to 240 (maximum) ms. » 22 % of all devices are better. This means that the measured response time is better than the average of all tested devices (19.8 ms). | ||
| ↔ Response Time 50% Grey to 80% Grey | ||
| 13.1 ms ... rise ↗ and fall ↘ combined | ↗ 6 ms rise | 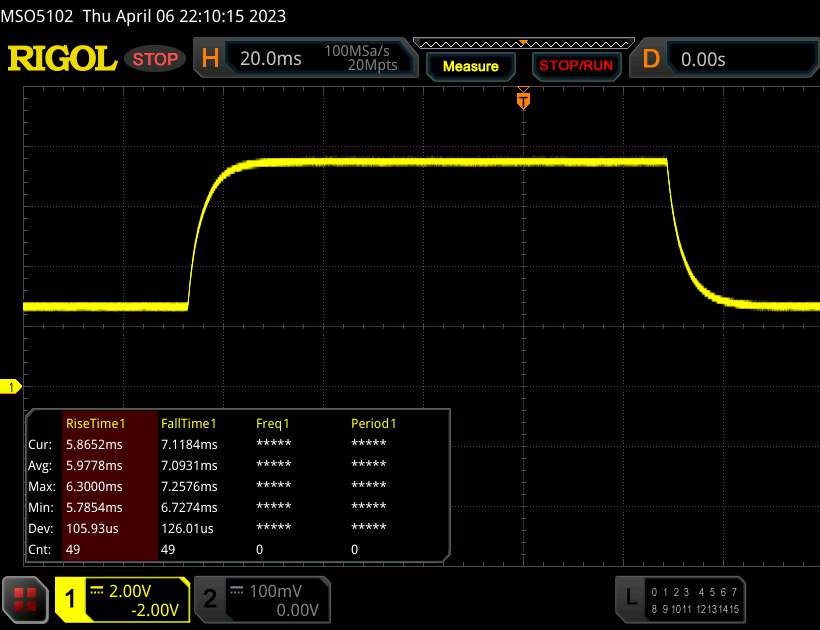 |
| ↘ 7.1 ms fall | ||
| The screen shows good response rates in our tests, but may be too slow for competitive gamers. In comparison, all tested devices range from 0.165 (minimum) to 636 (maximum) ms. » 27 % of all devices are better. This means that the measured response time is better than the average of all tested devices (31 ms). | ||
Screen Flickering / PWM (Pulse-Width Modulation)
| Screen flickering / PWM not detected |  | ||
In comparison: 52 % of all tested devices do not use PWM to dim the display. If PWM was detected, an average of 7757 (minimum: 5 - maximum: 343500) Hz was measured. | |||
视角稳定的IPS面板可以从任何位置阅读。如果阳光不太强烈,在户外阅读屏幕是可能的。

性能 - Raptor Lake和Ada Lovelace为游戏笔记本提供动力
游戏、渲染和一般所有性能要求高的应用领域都算在Erazer Major X20的应用场景中。Raptor Lake和Ada Lovelace提供了必要的计算能力。该模型的价格约为2500欧元(约合2500美元)。
测试条件
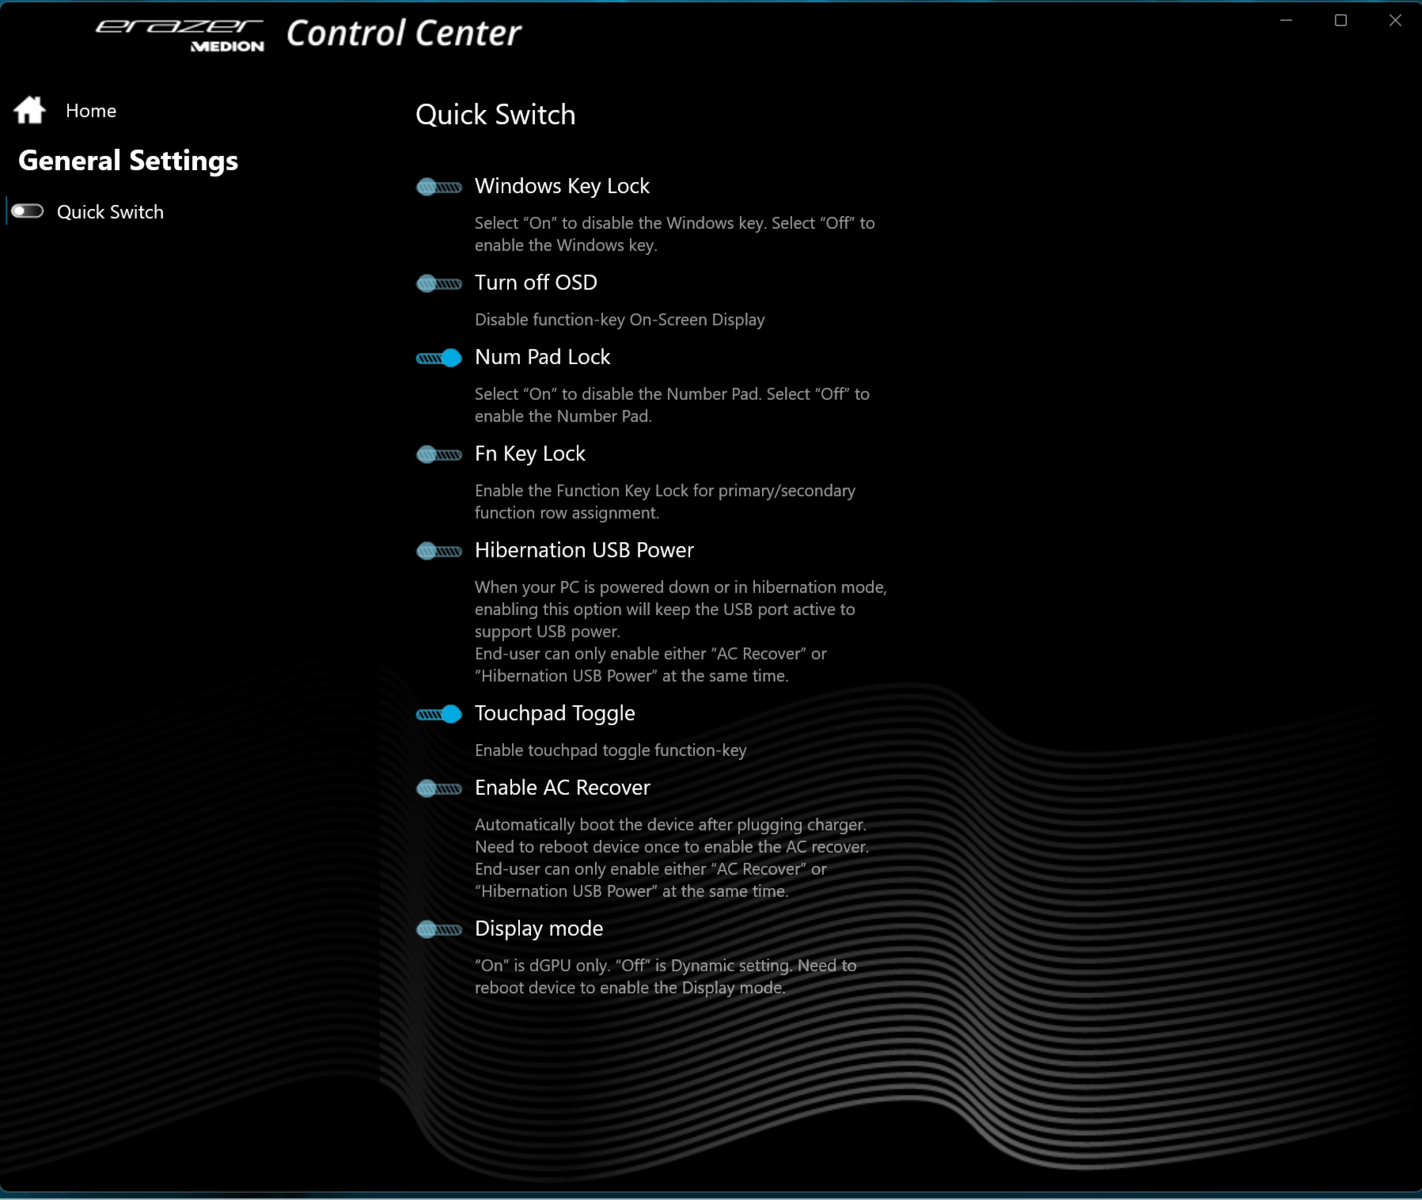
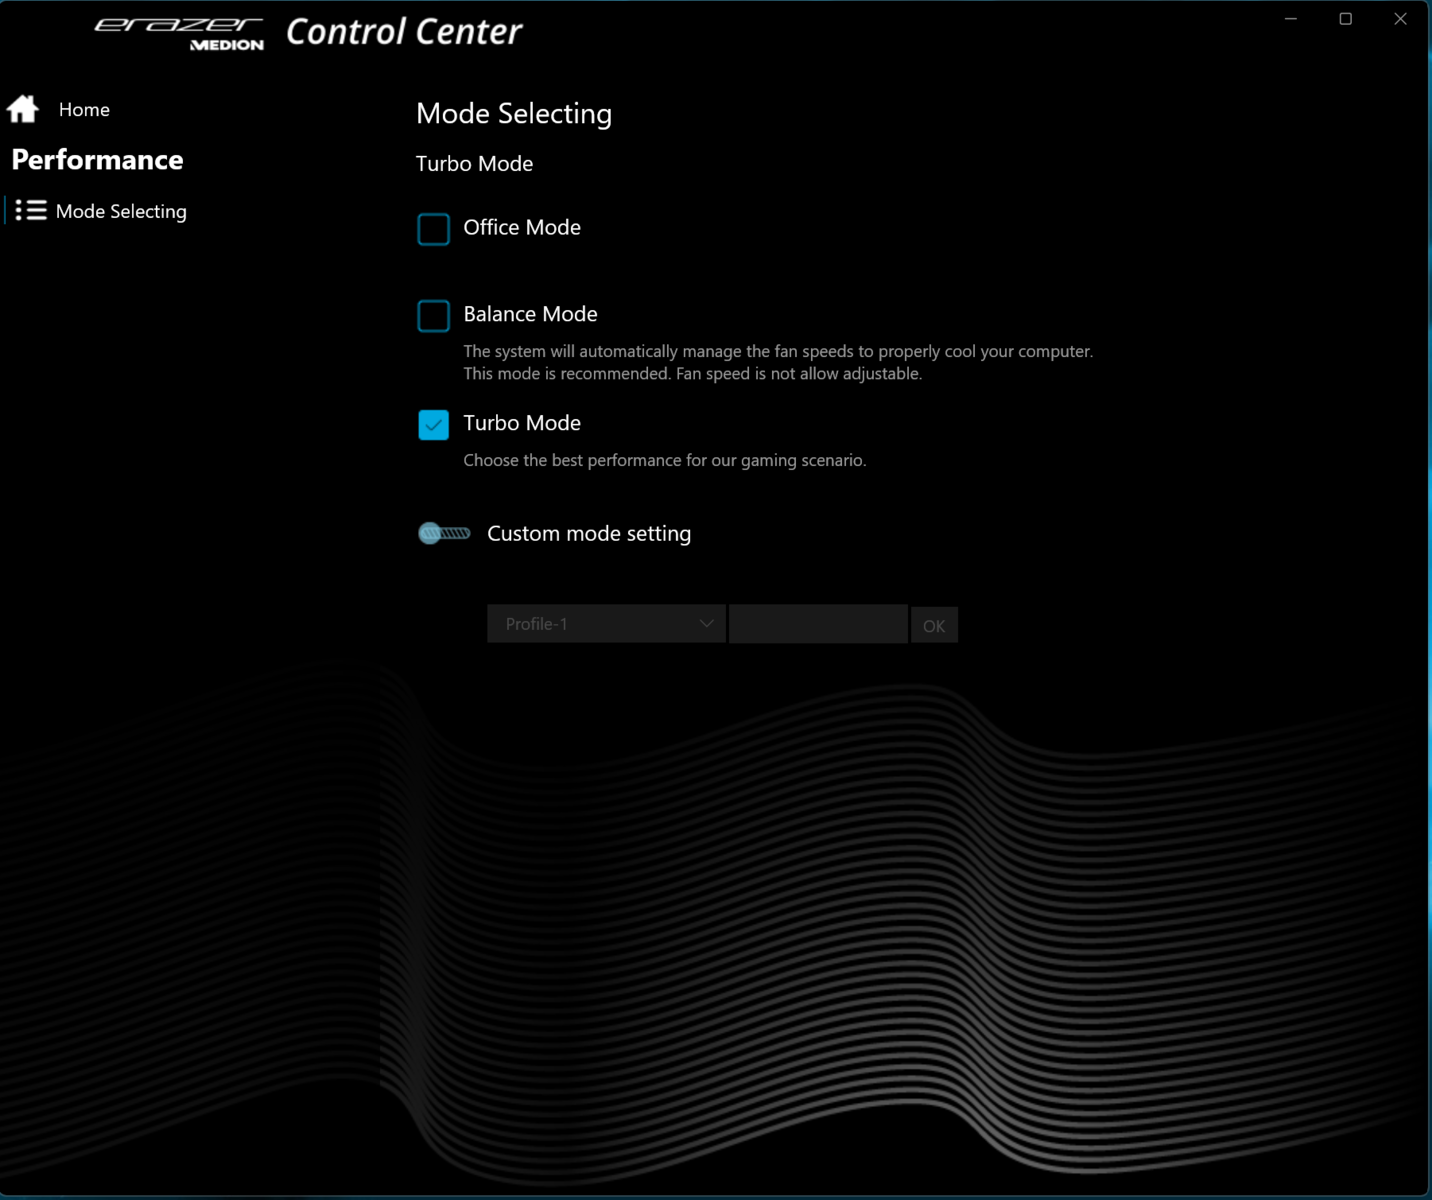
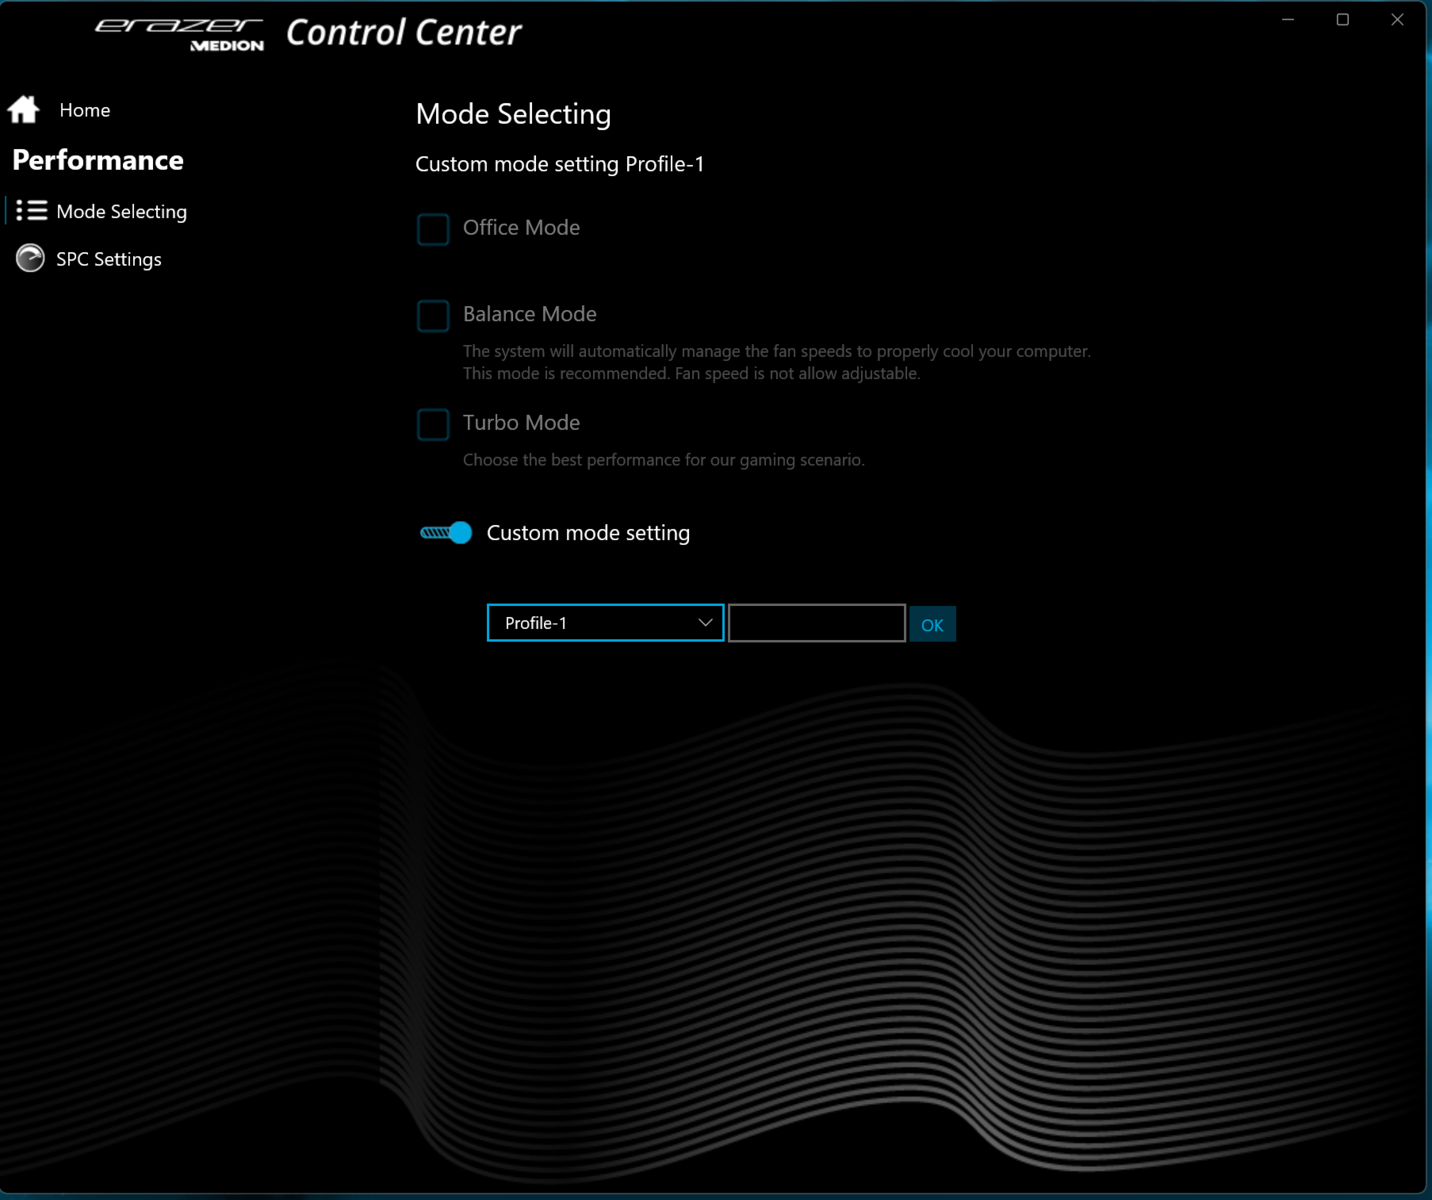
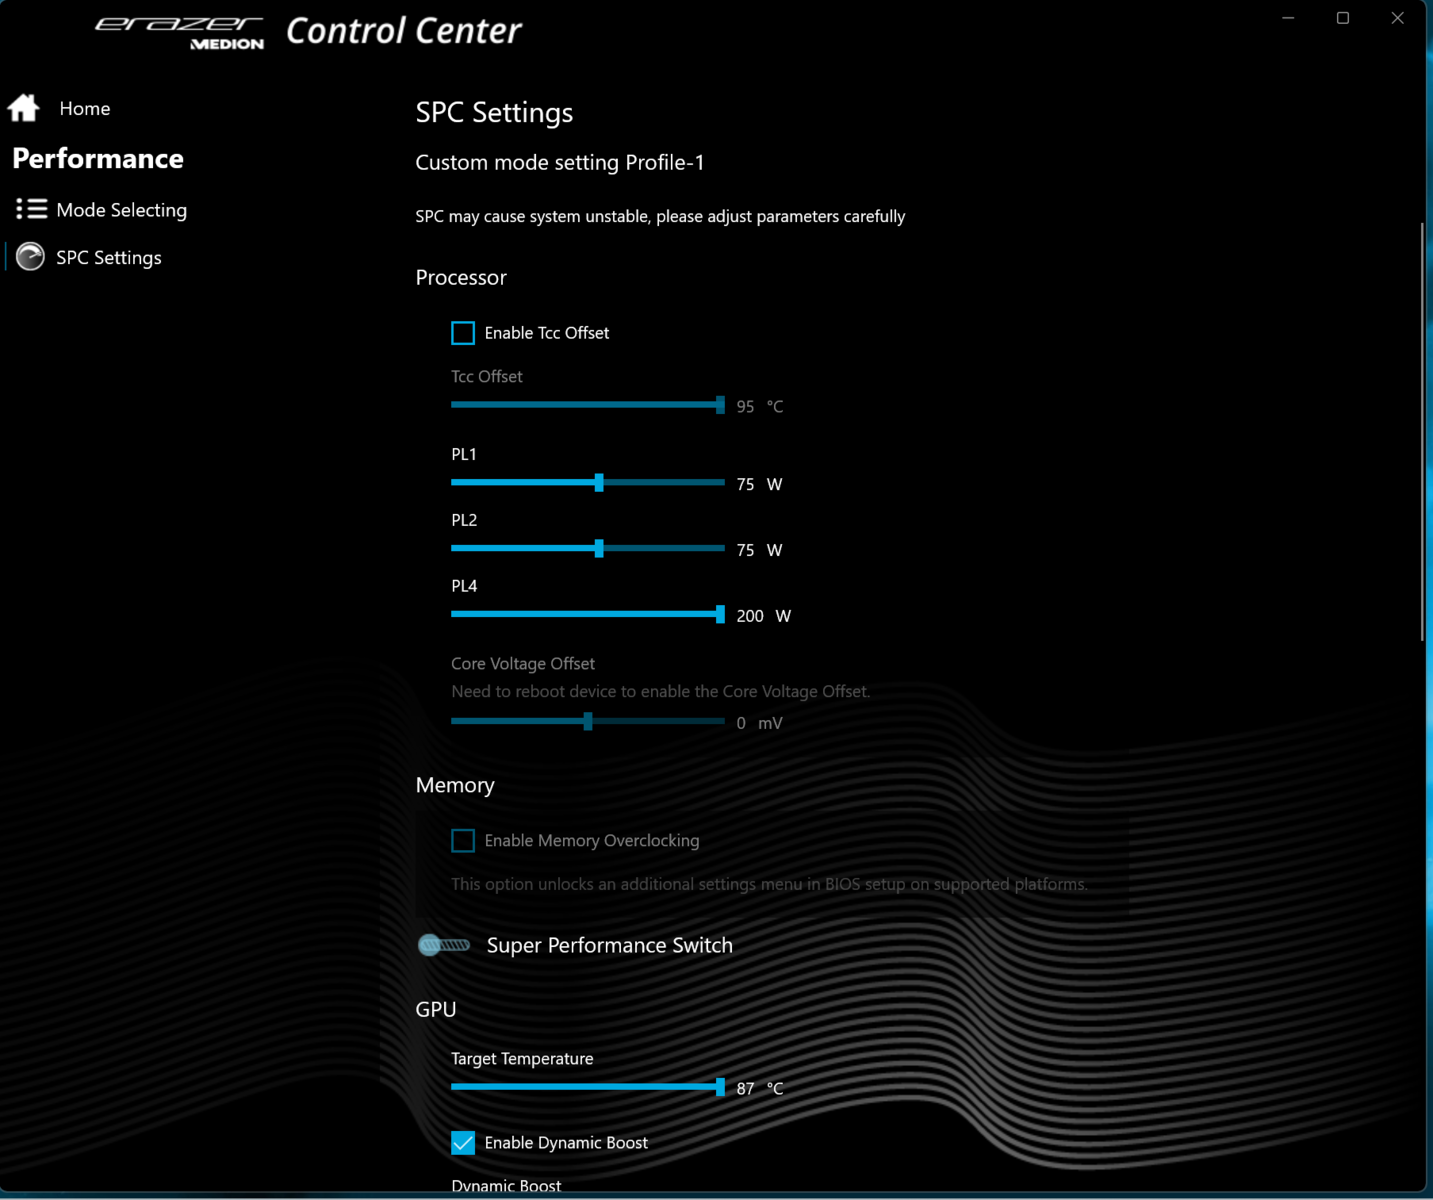
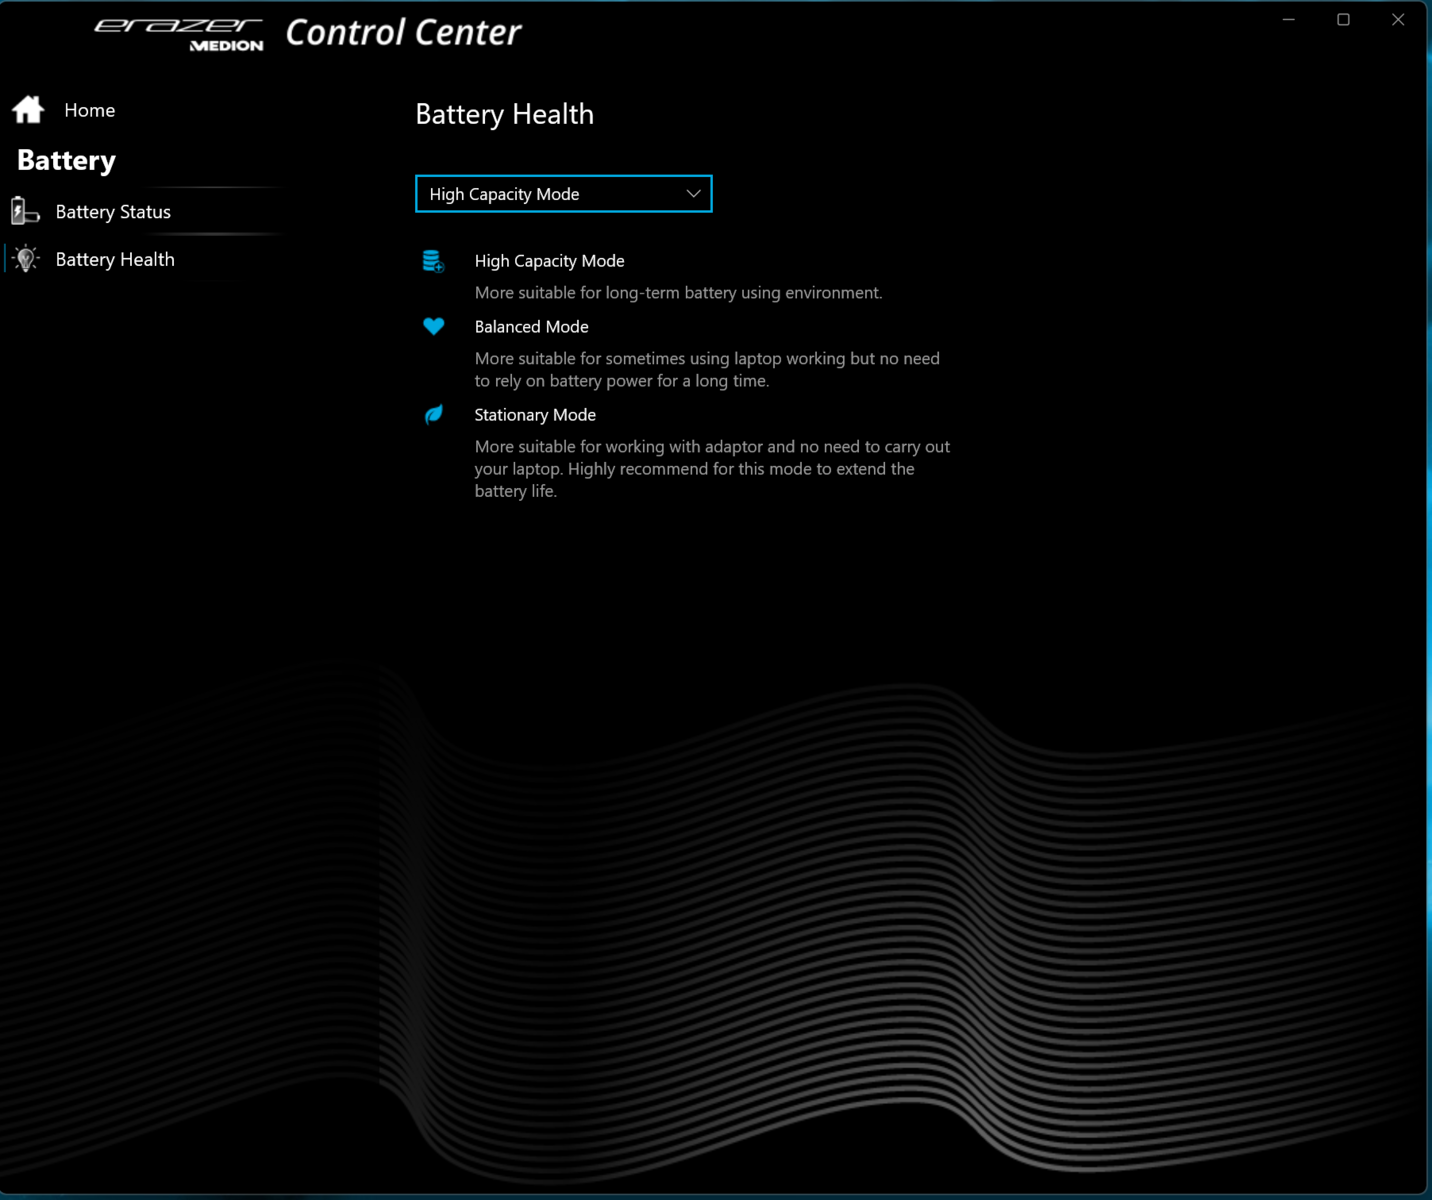
X20提供三种制造商特定的电源模式(见表),你可以通过一个单独的按钮(在电源按钮旁边)来选择。一个状态LED显示哪种模式处于活动状态。使用了 "涡轮模式"(基准测试)和 "办公模式"(电池测试)。Optimus是激活的。
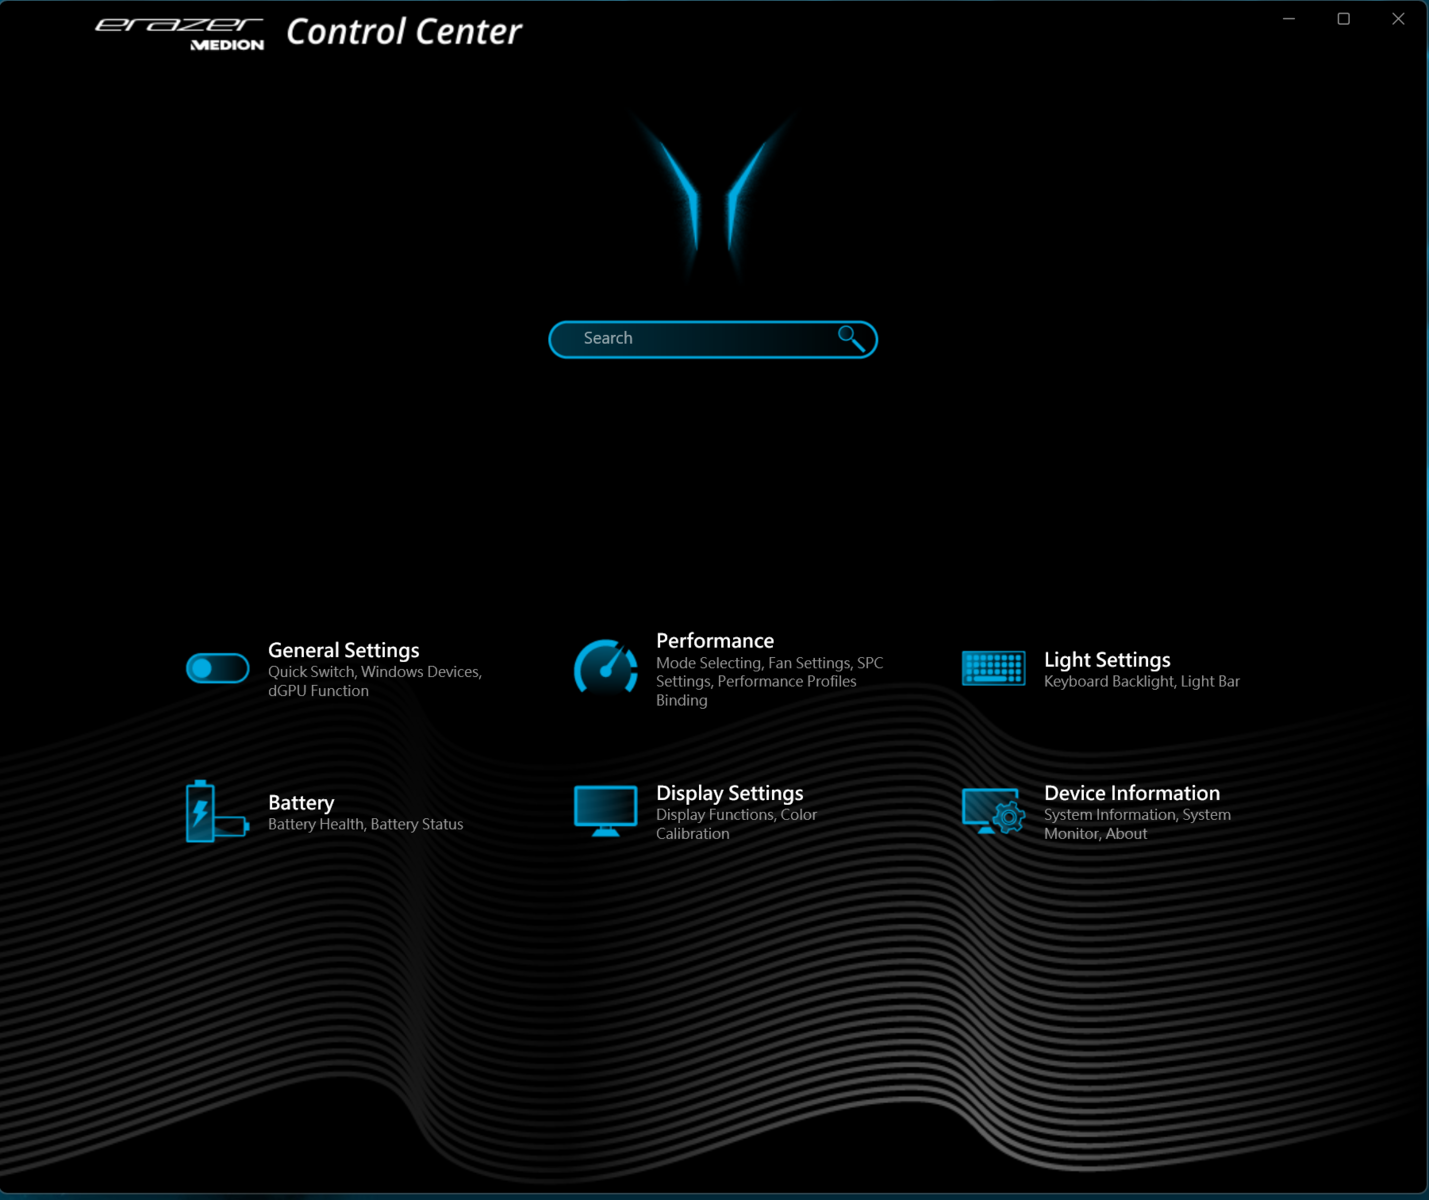
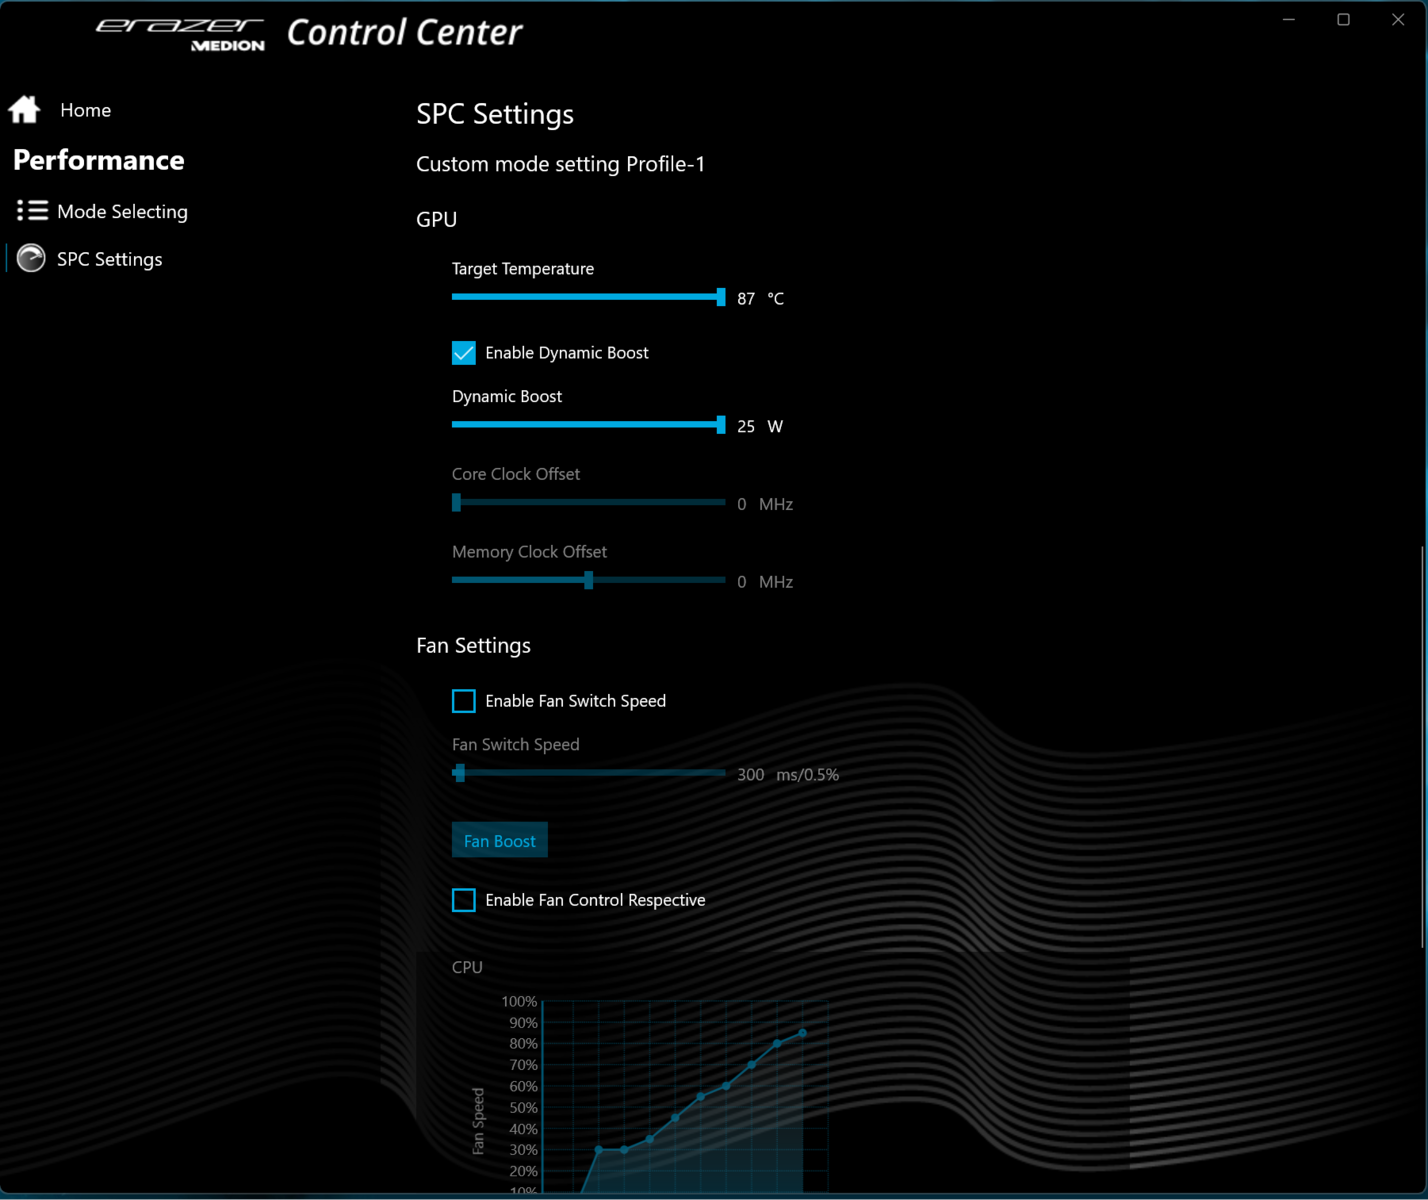
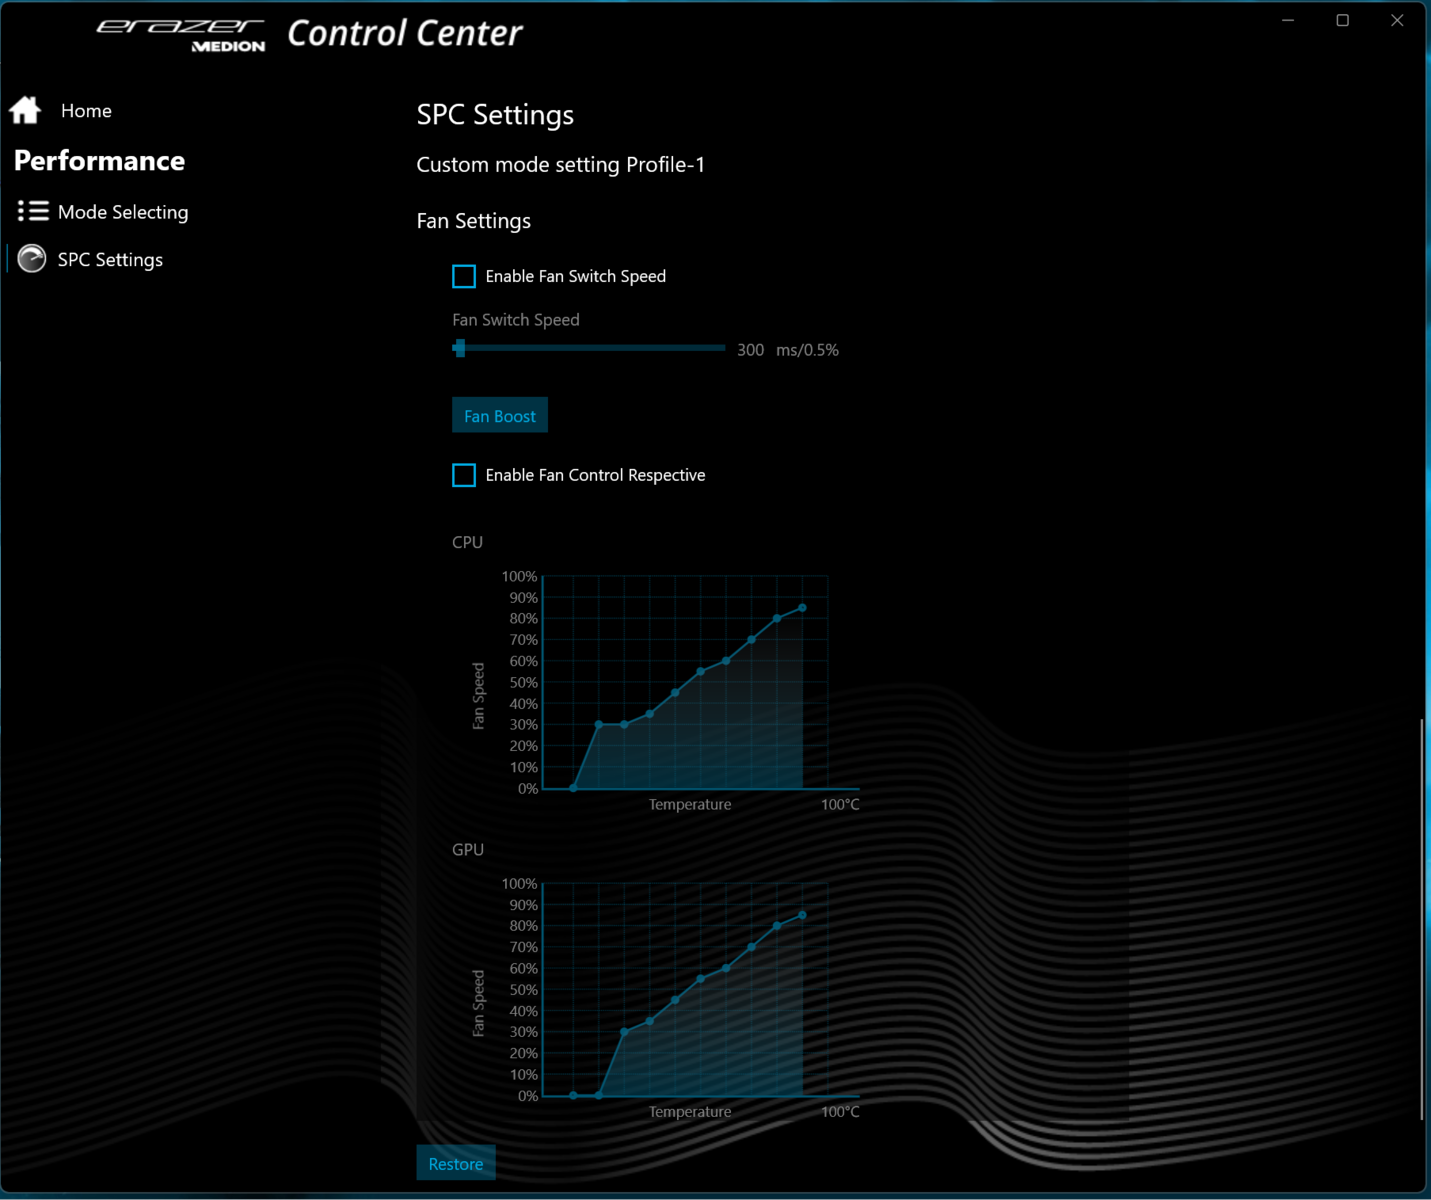
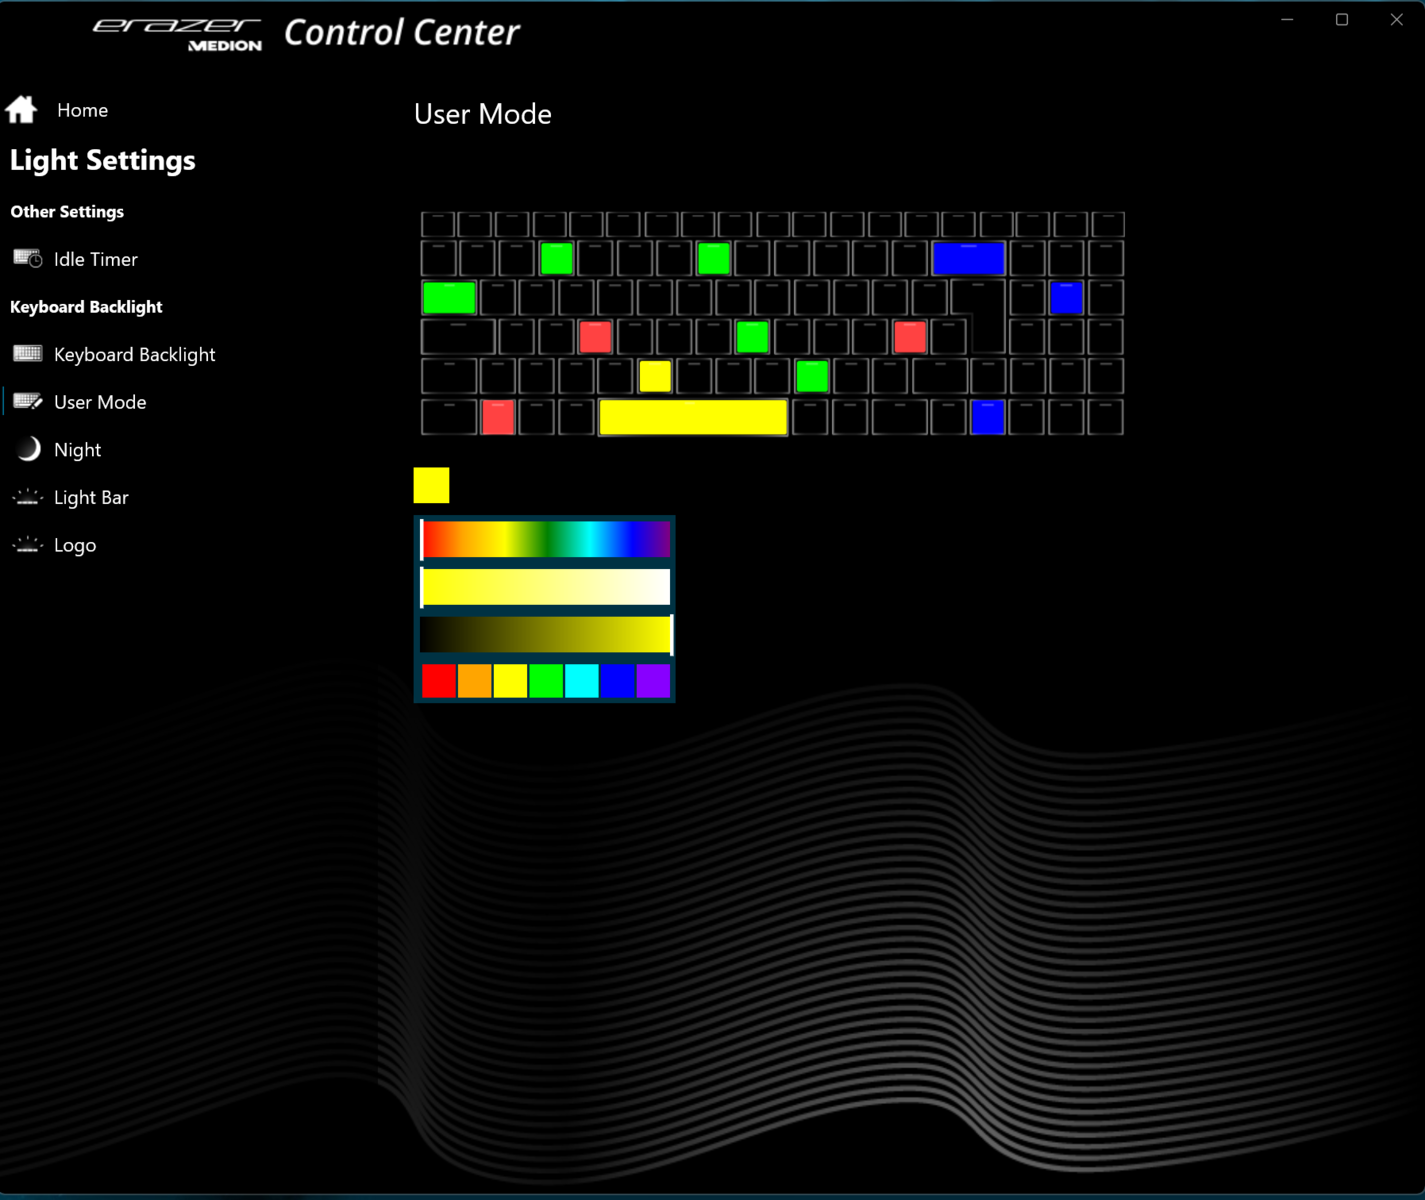
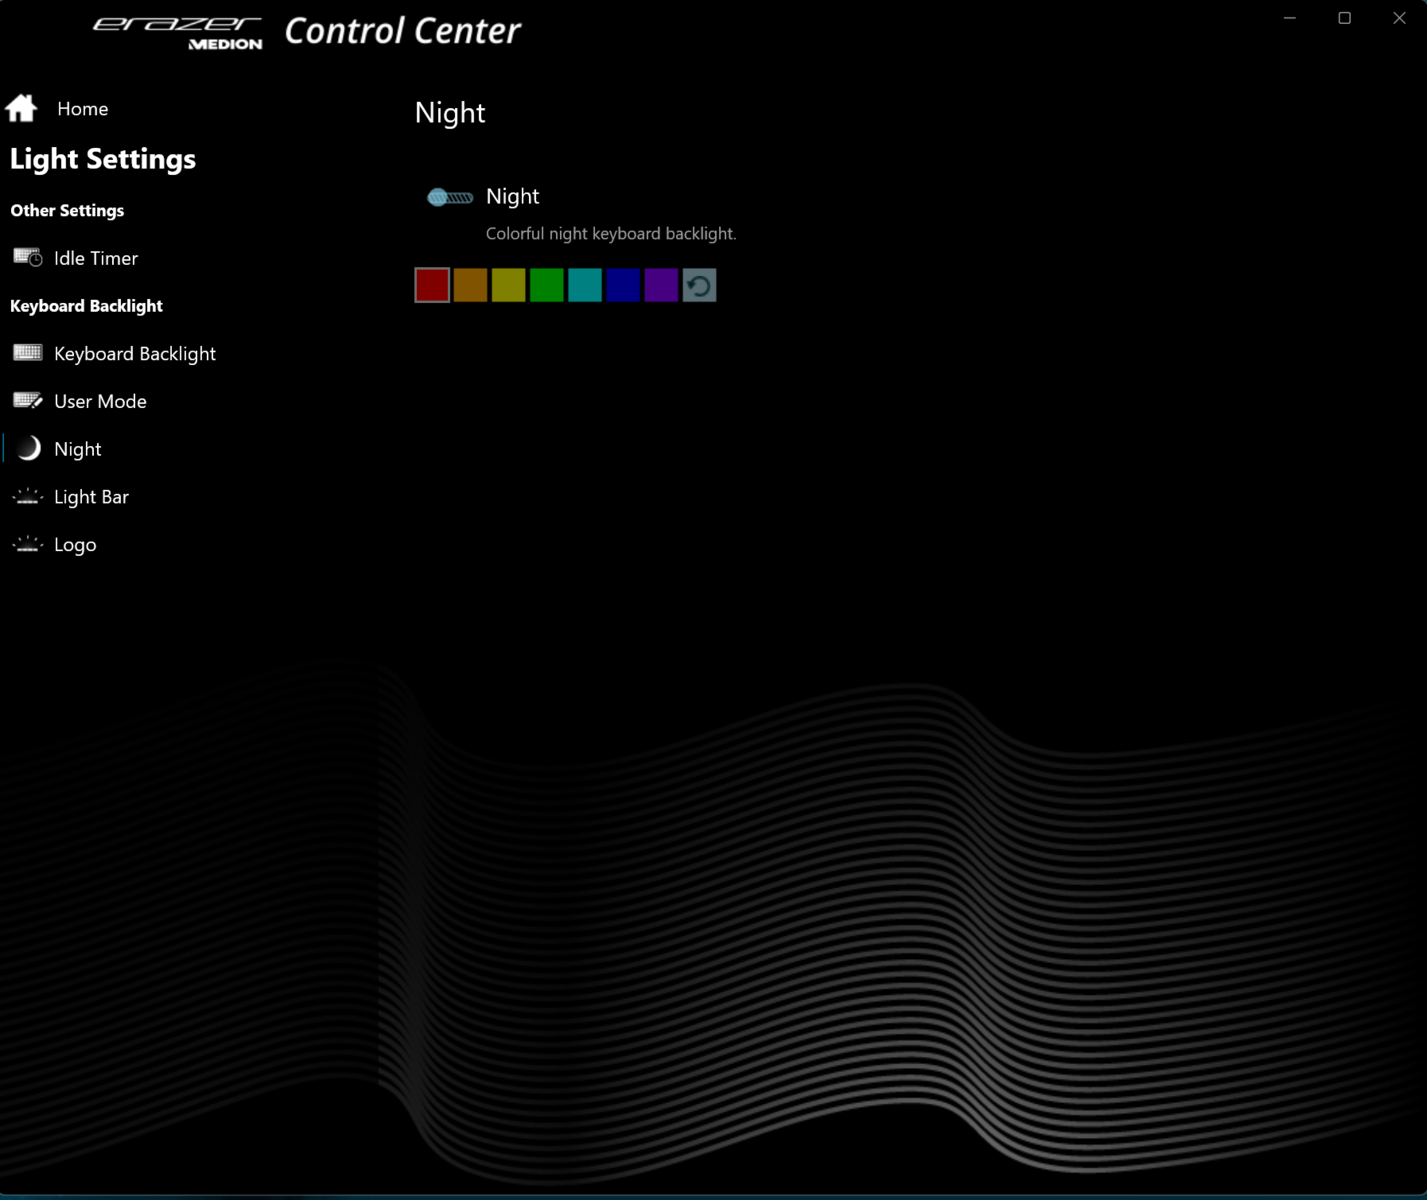
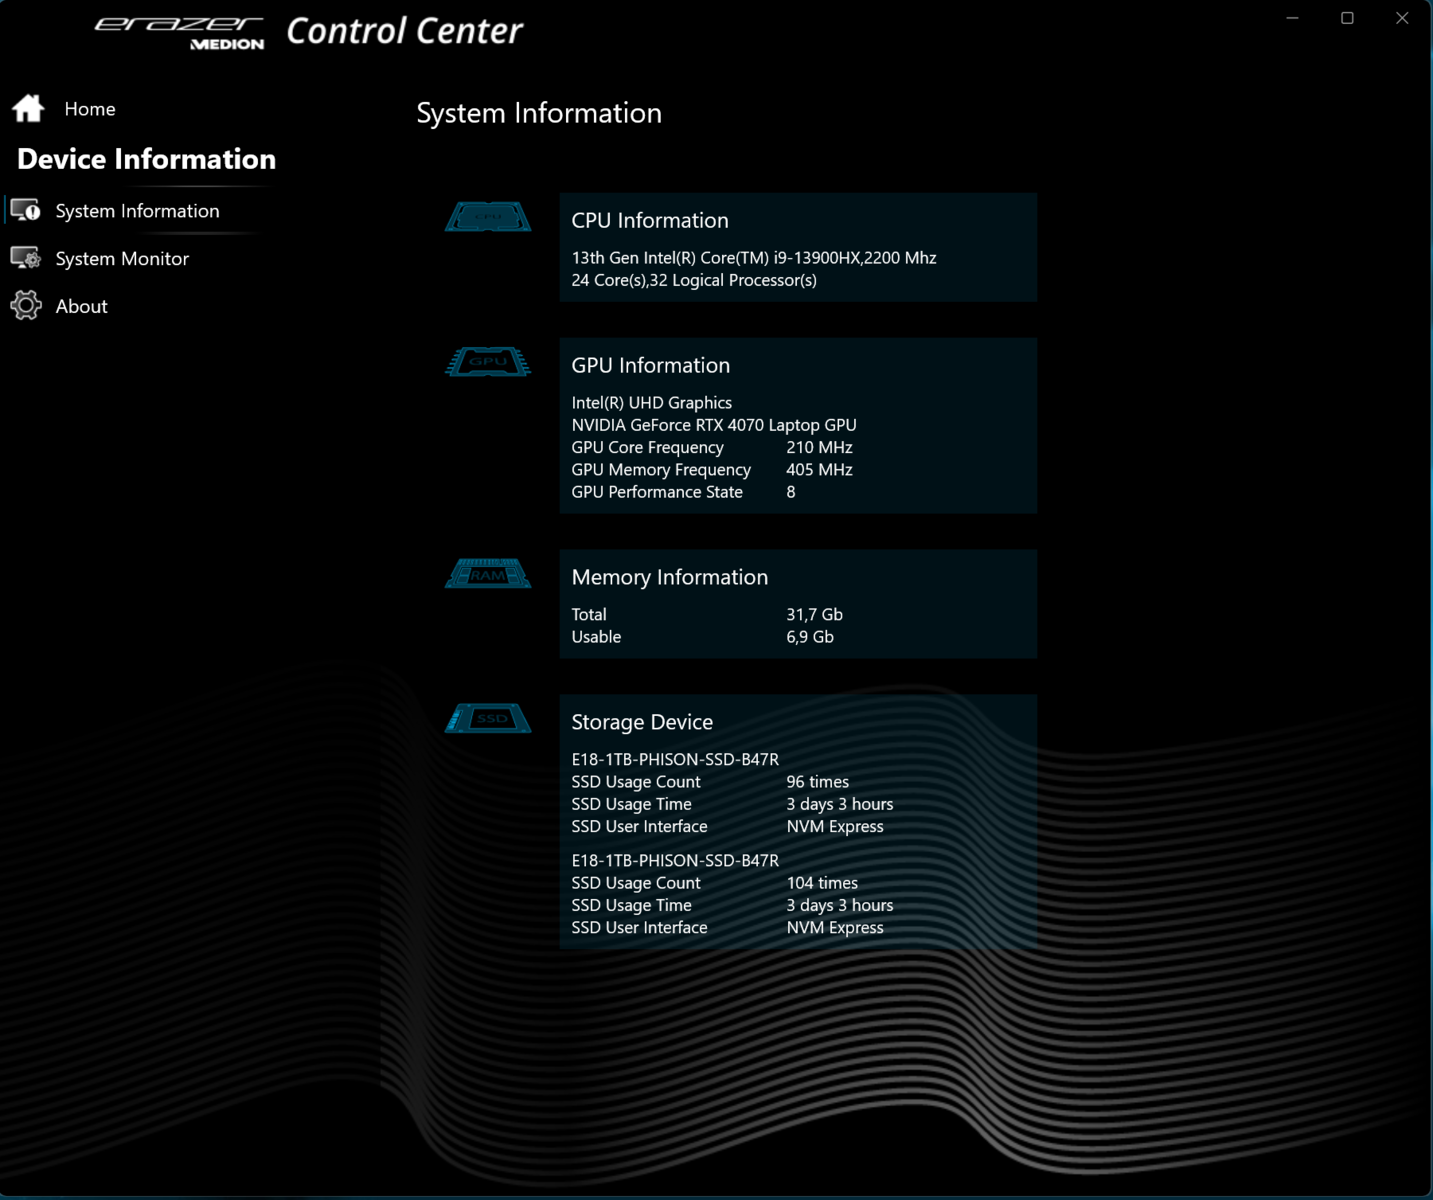
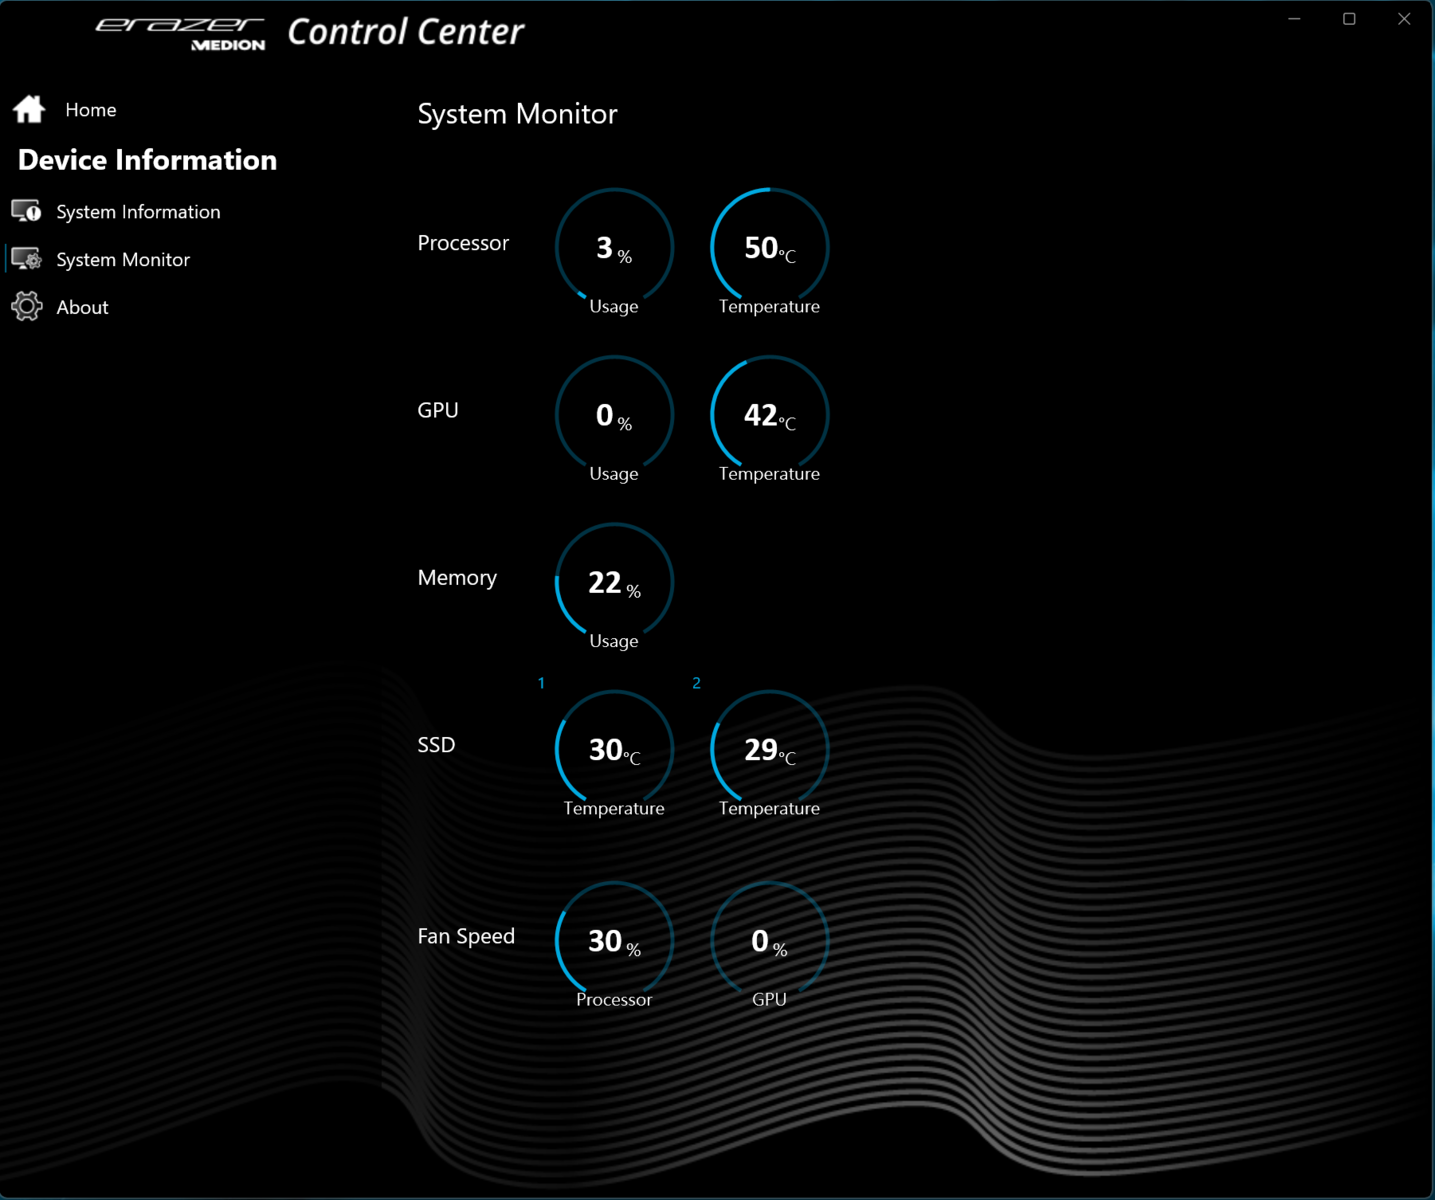
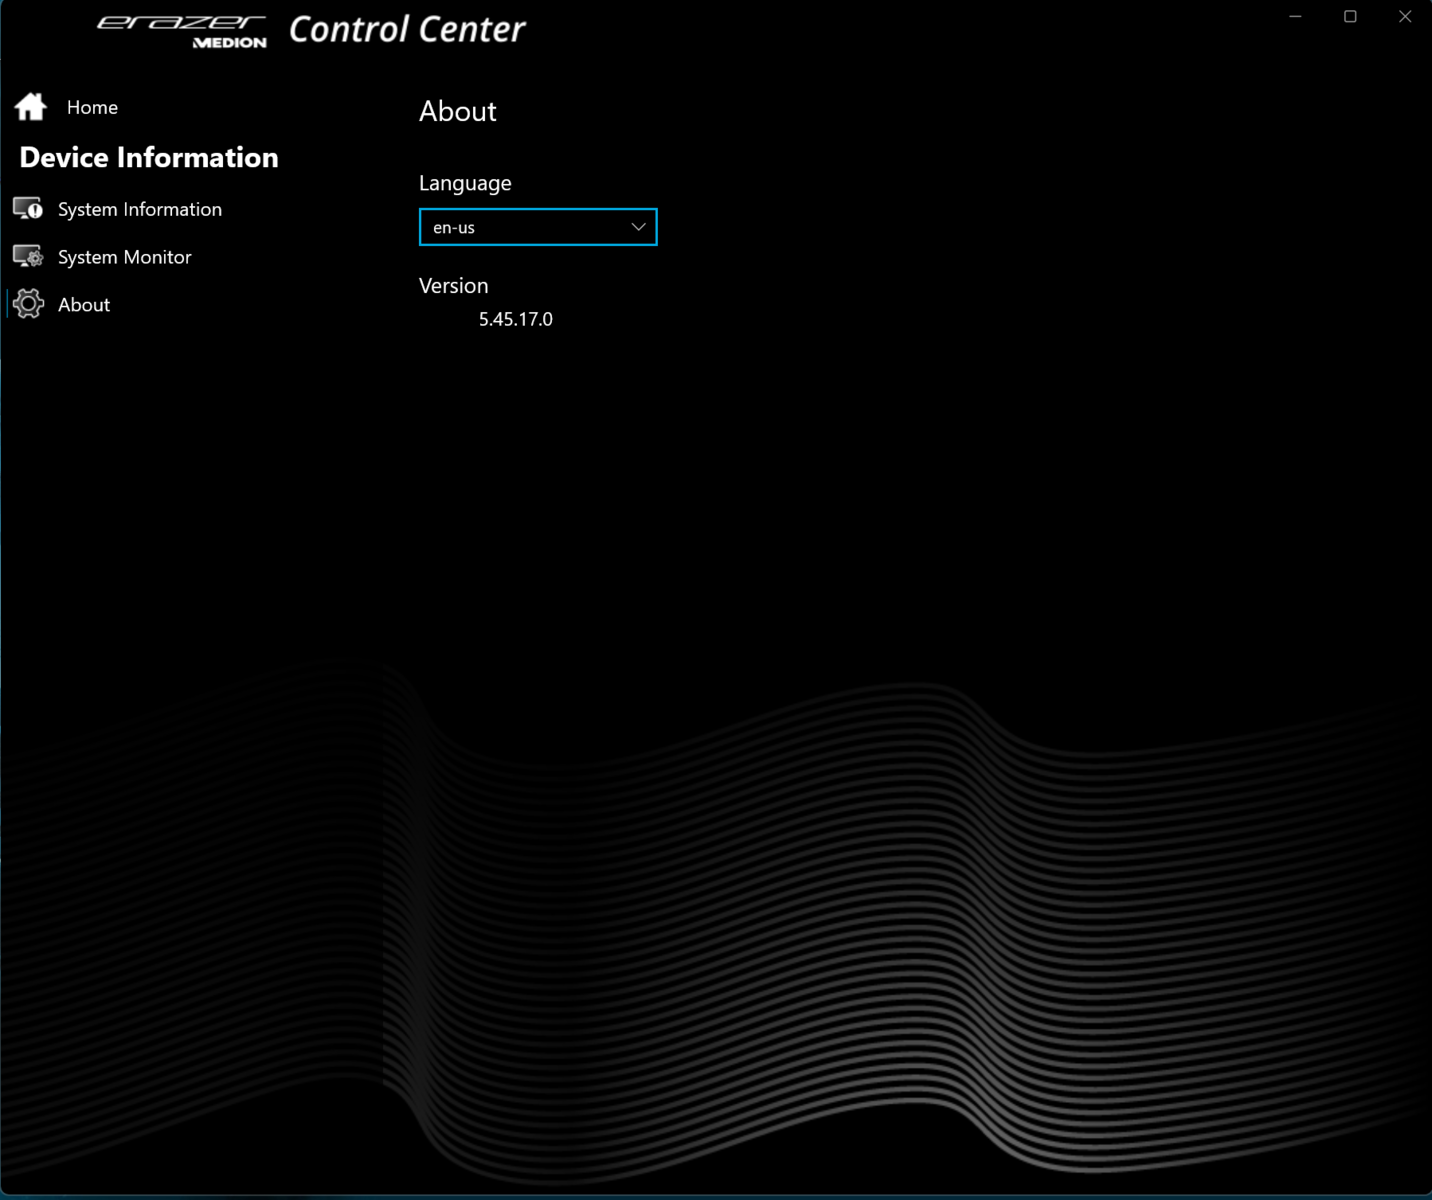
可以使用预装的控制中心软件创建个人配置文件。例如,可以调整CPU的功率限制、GPU的TGP和/或温度上限。
我们使用CC软件的英语界面,因为德语翻译部分不成功。你可以在两种语言之间切换。
| 涡轮模式 (dt: Overboost) | 平衡模式 (dt: Balanced) | 办公室模式 (dt: Balanced) | |
|---|---|---|---|
| CPU PL1 (HWInfo) | 140 watts | 140 watts | 140 watts |
| CPU PL2 (HWInfo) | 140 watts | 140 watts | 140 watts |
| 噪音 (Witcher 3) | 50-53 dB(A) | 48-51 dB(A) | 36-43 dB(A), 后来32-34 dB(A) |
| 性能 (Witcher 3) | 124 fps | 118 fps | 114-118 fps, 以后为30 fps锁定 |
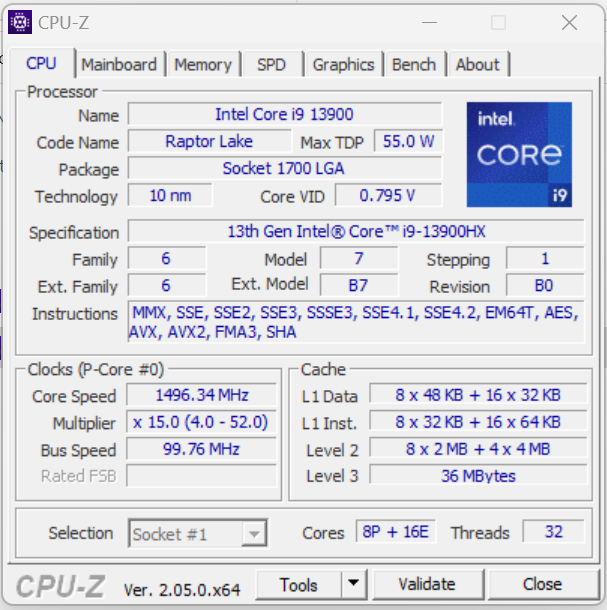
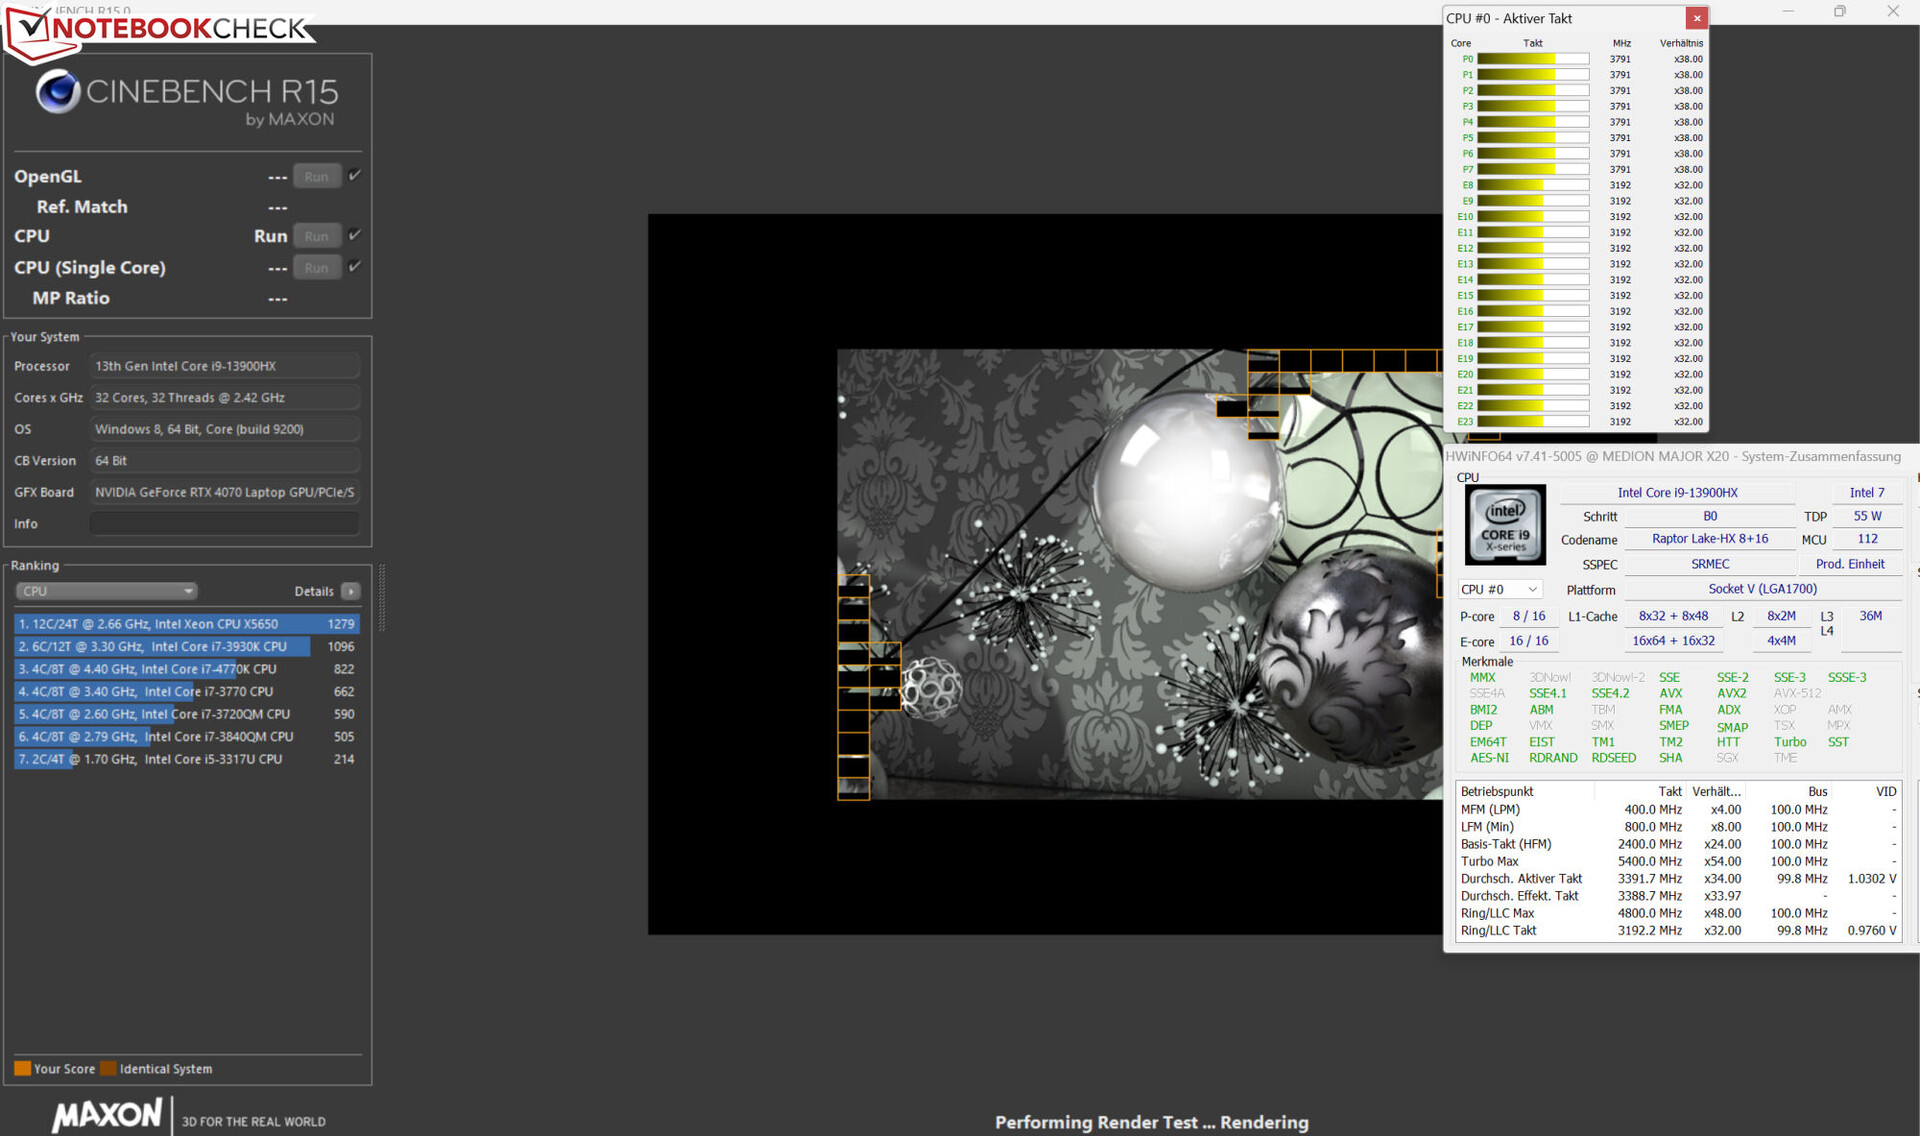
处理器
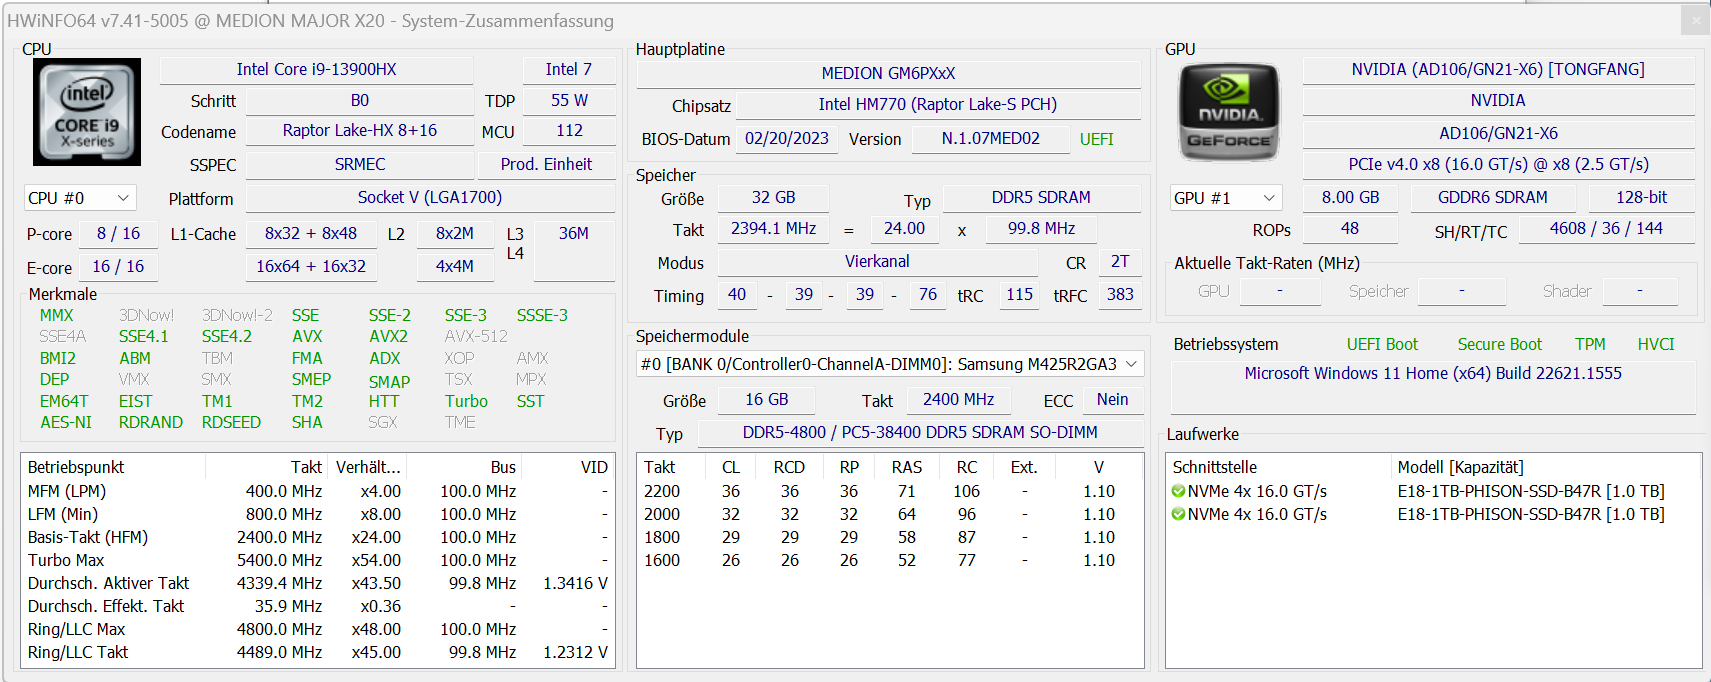
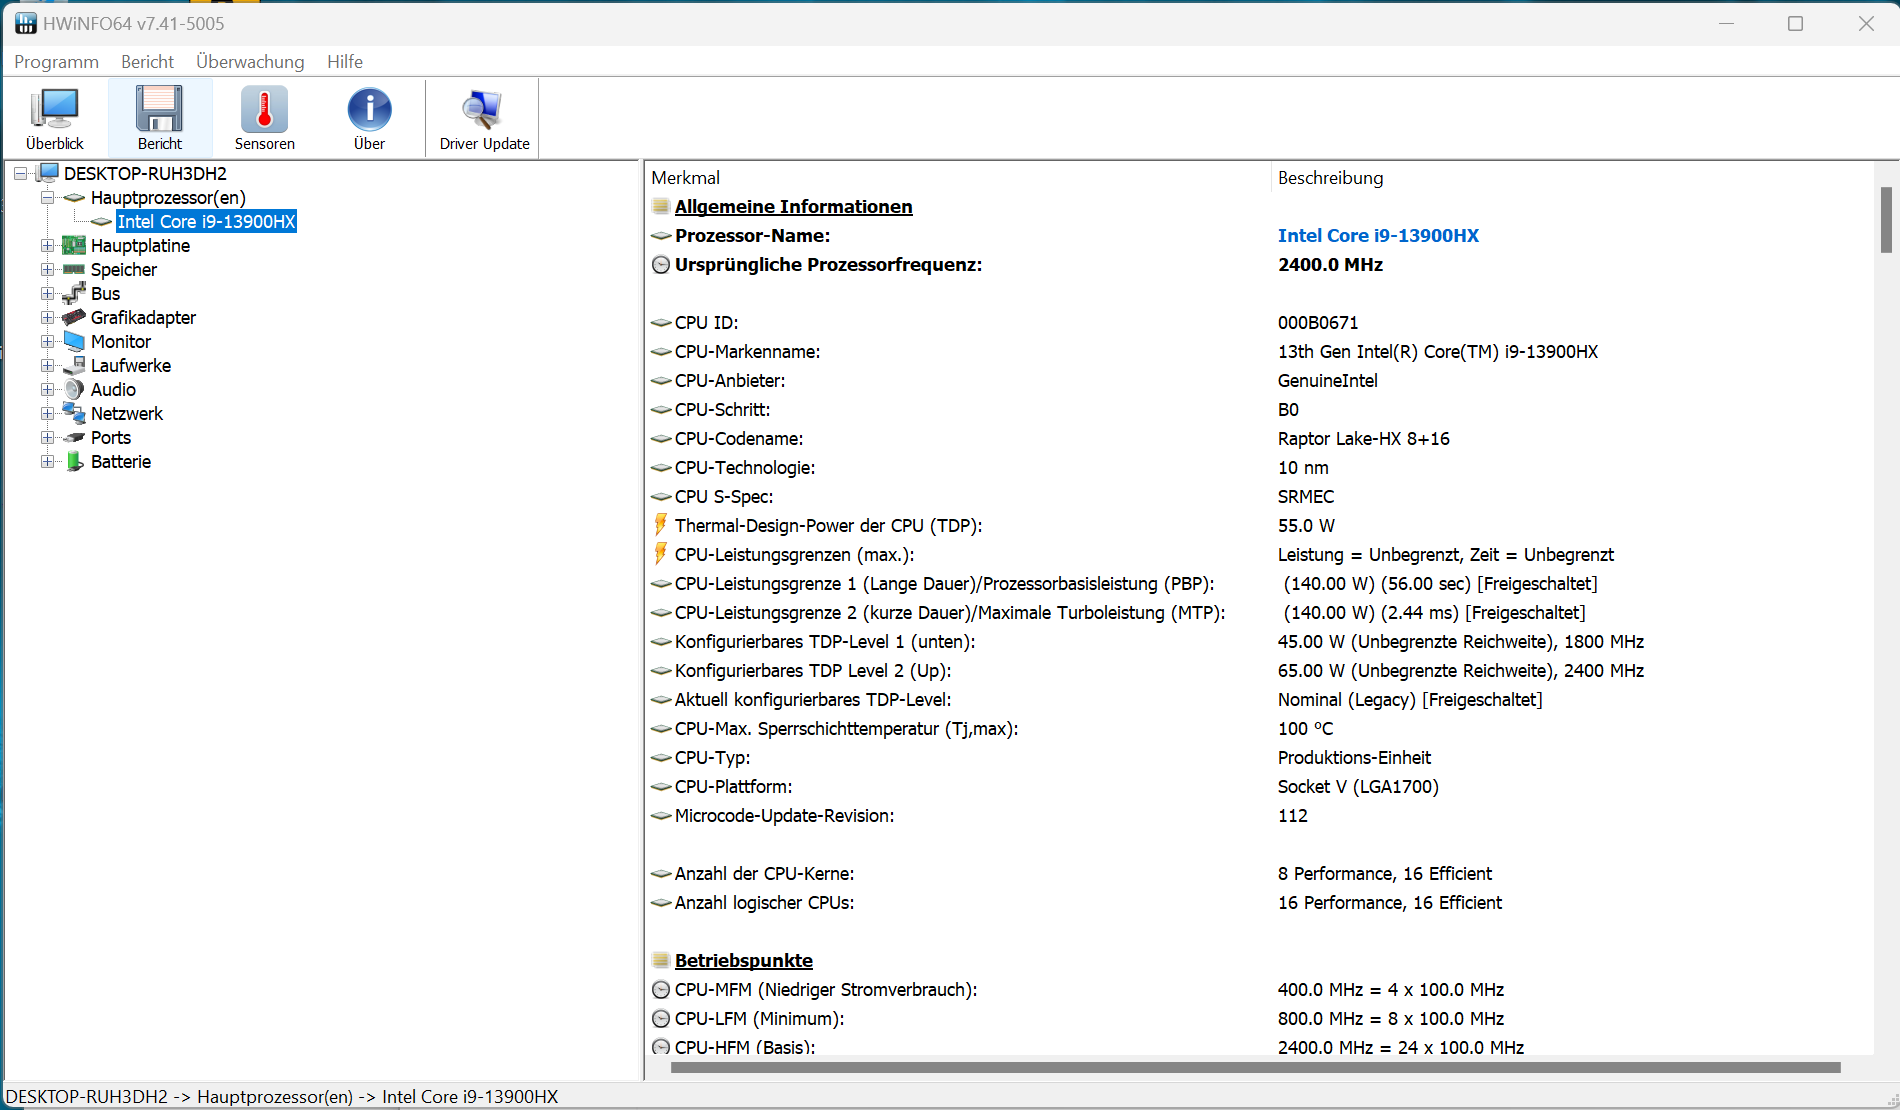
芯片 酷睿-i9-13900HX处理器(Raptor Lake)由八个性能核心(超线程,2.2至5.4 GHz)和十六个效率核心(无超线程,1.6至3.9 GHz)组成。总共有32个逻辑CPU核心。基准测试结果与CPU的平均速率持平。
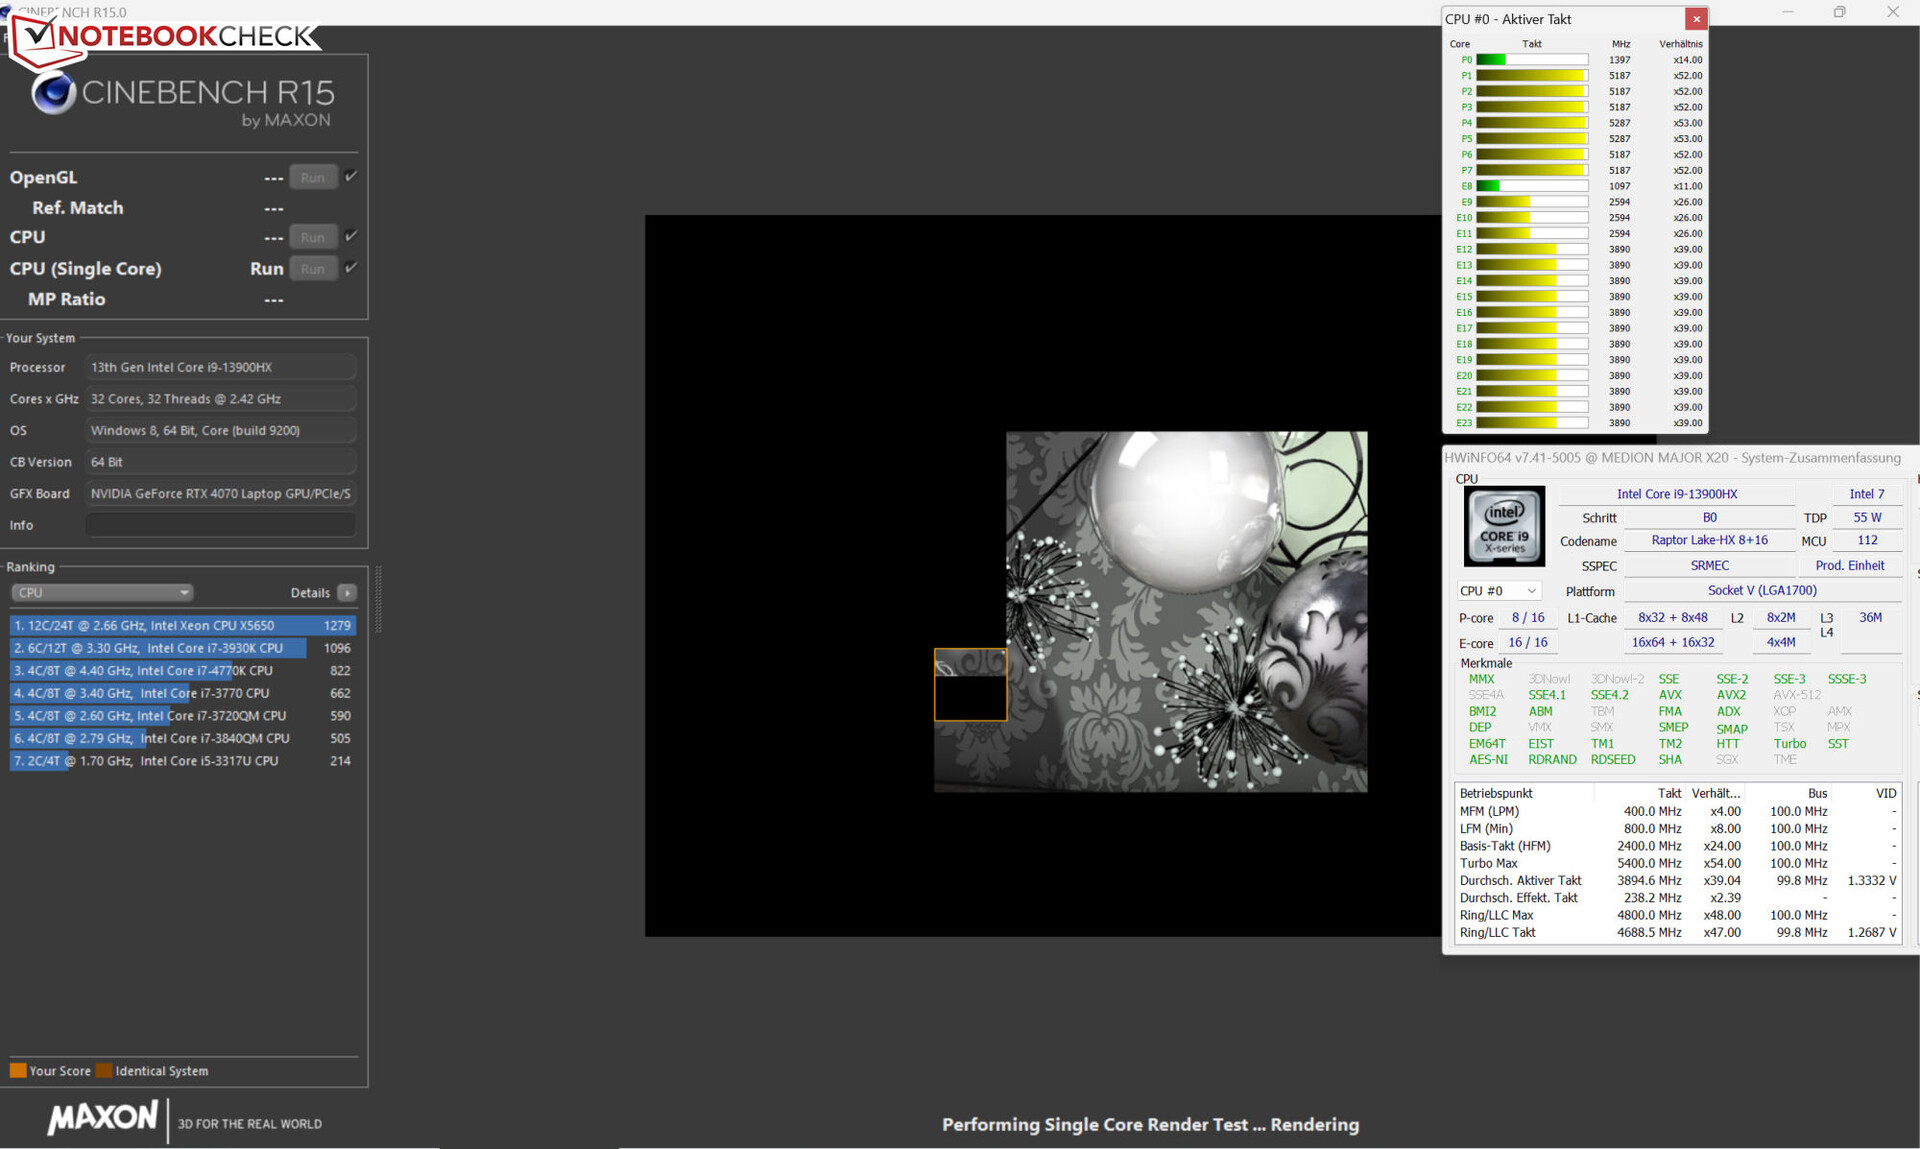
Cinebench R15基准的CPU测试是在主电源运行的高至最高时钟速率下进行的。与日常使用相关的单线程性能(222分),在电池模式下的下降幅度明显小于多线程性能(1025分)。
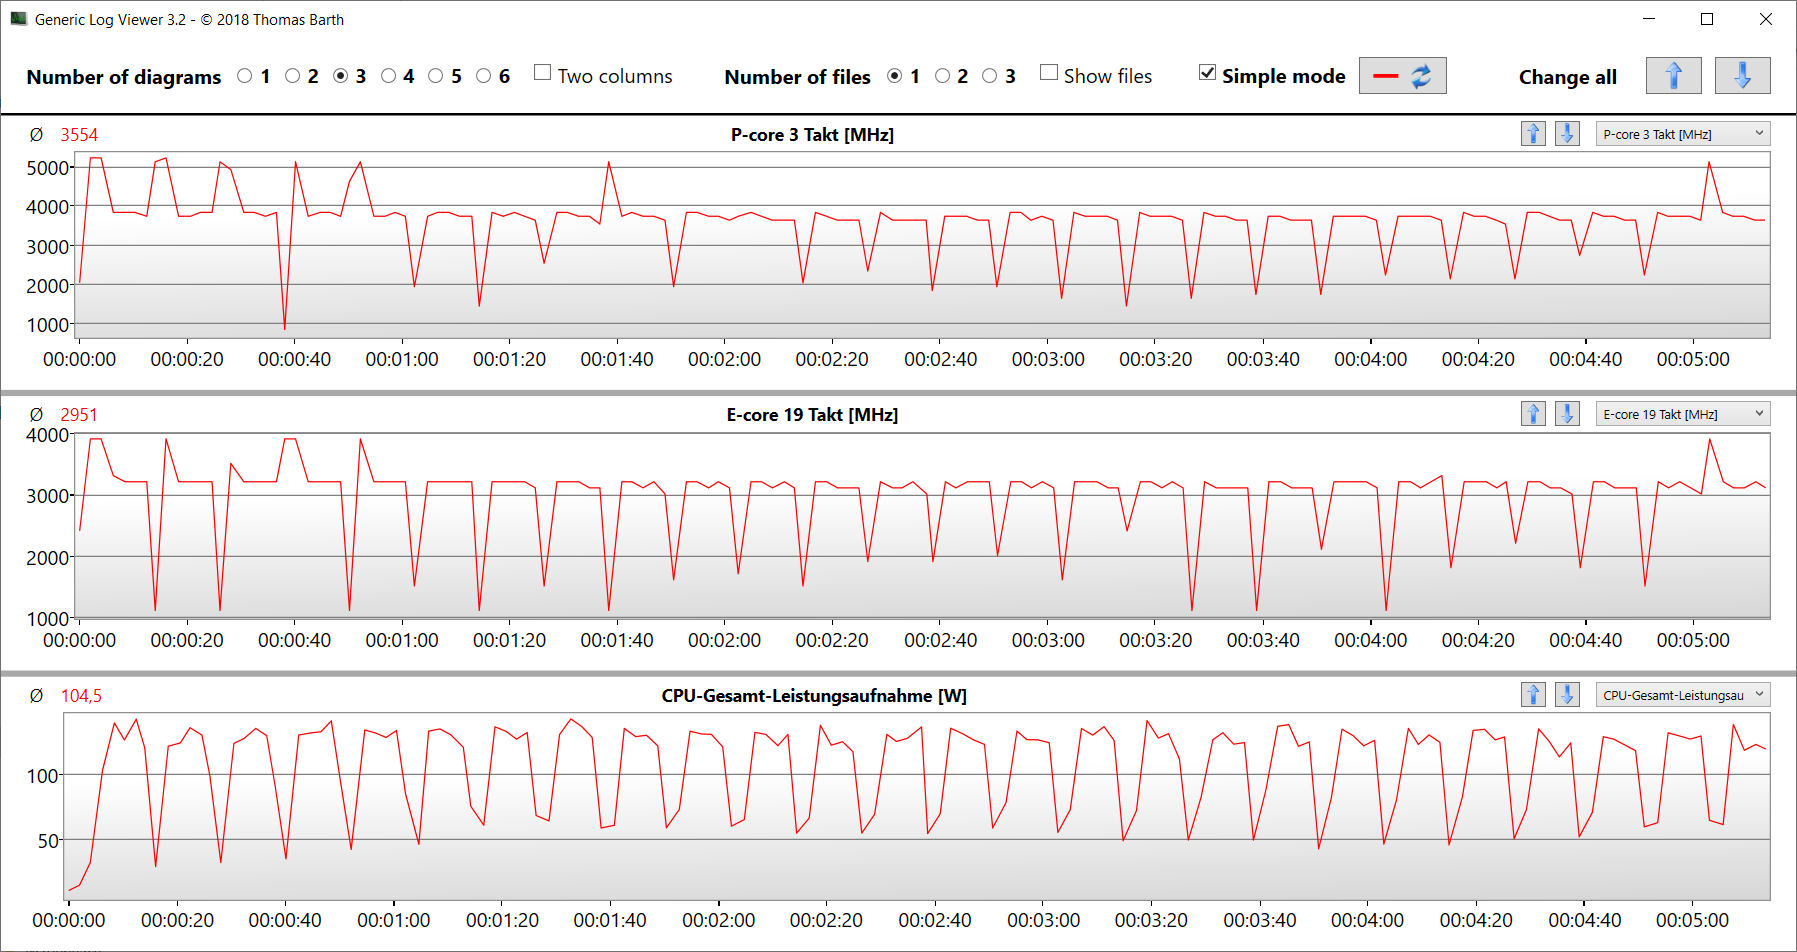
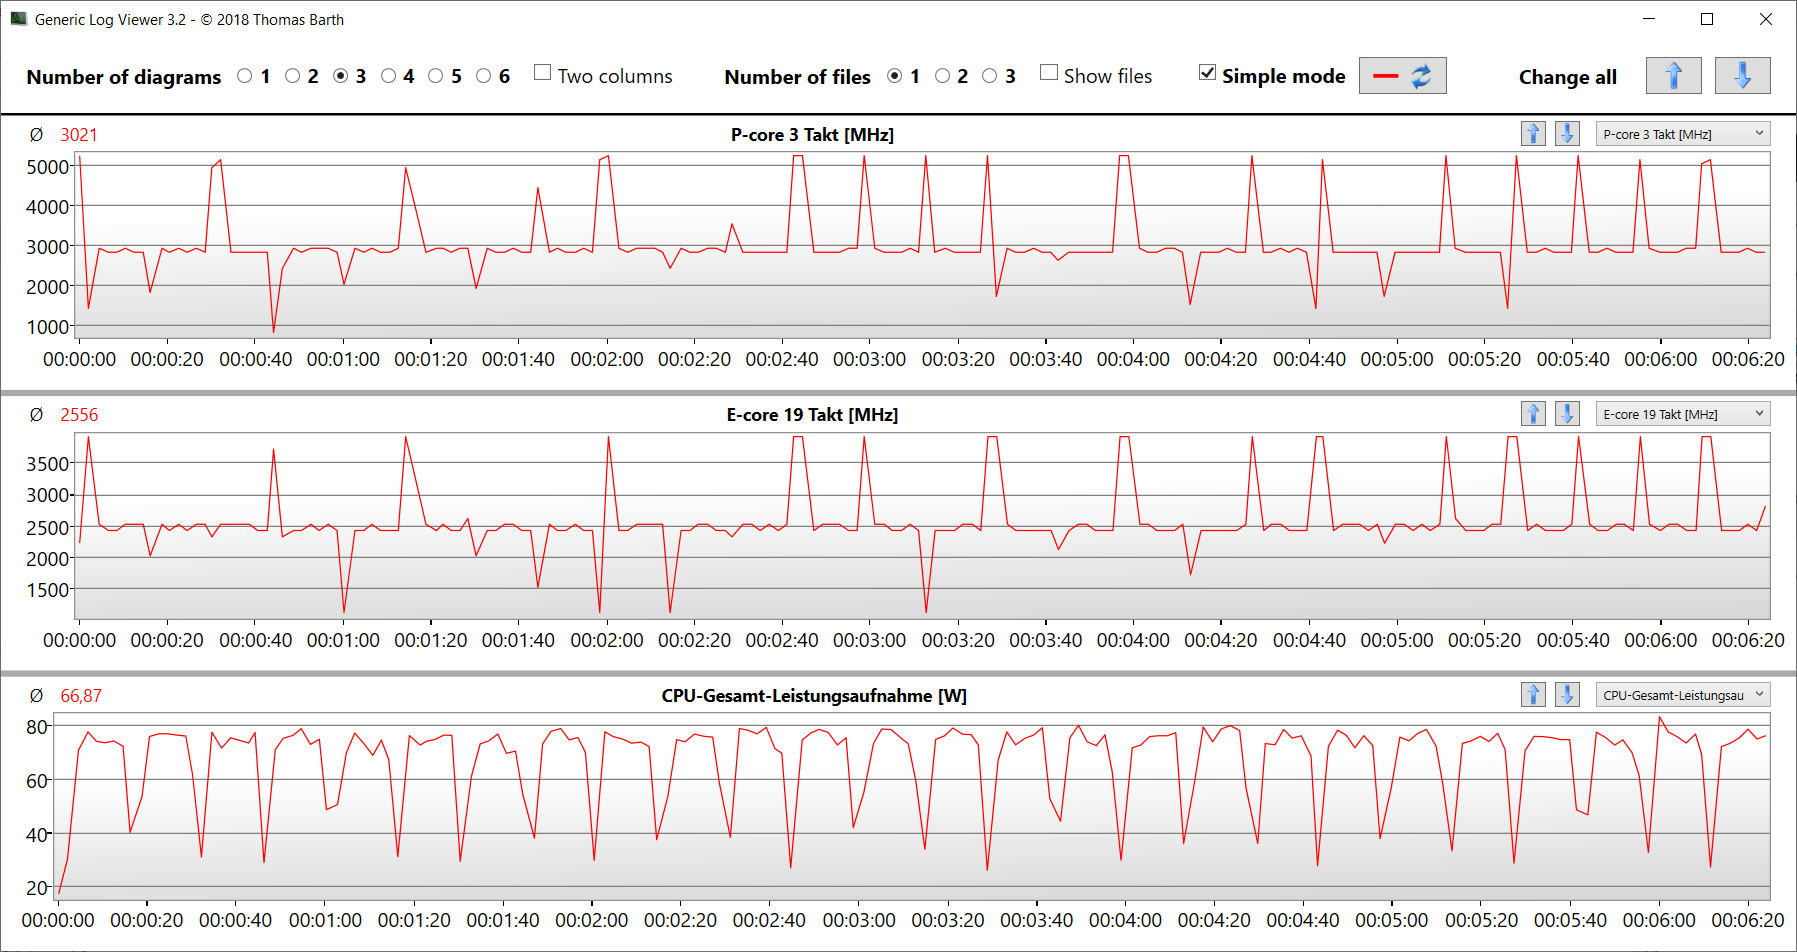
CB15循环测试显示,在主电源运行的多线程负载下,持续保持高涡轮增压时钟。在测试过程中,时钟速率只下降了很小的幅度。
Cinebench R15 Multi Sustained Load
| CPU Performance rating - Percent | |
| Asus ROG Strix G17 G713PI | |
| Average Intel Core i9-13900HX | |
| Medion Erazer Major X20 | |
| Average of class Gaming | |
| Aorus 15X ASF | |
| Razer Blade 15 OLED (Early 2022) | |
* ... smaller is better
AIDA64: FP32 Ray-Trace | FPU Julia | CPU SHA3 | CPU Queen | FPU SinJulia | FPU Mandel | CPU AES | CPU ZLib | FP64 Ray-Trace | CPU PhotoWorxx
| Performance rating | |
| Asus ROG Strix G17 G713PI | |
| Average of class Gaming | |
| Average Intel Core i9-13900HX | |
| Medion Erazer Major X20 | |
| Aorus 15X ASF | |
| Razer Blade 15 OLED (Early 2022) | |
| AIDA64 / FP32 Ray-Trace | |
| Asus ROG Strix G17 G713PI | |
| Average of class Gaming (10227 - 85542, n=105, last 2 years) | |
| Medion Erazer Major X20 | |
| Average Intel Core i9-13900HX (17589 - 27615, n=22) | |
| Aorus 15X ASF | |
| Razer Blade 15 OLED (Early 2022) | |
| AIDA64 / FPU Julia | |
| Asus ROG Strix G17 G713PI | |
| Average of class Gaming (51376 - 238426, n=105, last 2 years) | |
| Medion Erazer Major X20 | |
| Average Intel Core i9-13900HX (88686 - 137015, n=22) | |
| Aorus 15X ASF | |
| Razer Blade 15 OLED (Early 2022) | |
| AIDA64 / CPU SHA3 | |
| Asus ROG Strix G17 G713PI | |
| Average of class Gaming (2180 - 10115, n=105, last 2 years) | |
| Medion Erazer Major X20 | |
| Average Intel Core i9-13900HX (4362 - 7029, n=22) | |
| Aorus 15X ASF | |
| Razer Blade 15 OLED (Early 2022) | |
| AIDA64 / CPU Queen | |
| Asus ROG Strix G17 G713PI | |
| Medion Erazer Major X20 | |
| Average Intel Core i9-13900HX (125644 - 141385, n=22) | |
| Average of class Gaming (49785 - 173351, n=90, last 2 years) | |
| Aorus 15X ASF | |
| Razer Blade 15 OLED (Early 2022) | |
| AIDA64 / FPU SinJulia | |
| Asus ROG Strix G17 G713PI | |
| Medion Erazer Major X20 | |
| Average Intel Core i9-13900HX (12334 - 17179, n=22) | |
| Average of class Gaming (4424 - 33636, n=105, last 2 years) | |
| Aorus 15X ASF | |
| Razer Blade 15 OLED (Early 2022) | |
| AIDA64 / FPU Mandel | |
| Asus ROG Strix G17 G713PI | |
| Average of class Gaming (25115 - 128721, n=105, last 2 years) | |
| Medion Erazer Major X20 | |
| Average Intel Core i9-13900HX (43850 - 69202, n=22) | |
| Aorus 15X ASF | |
| Razer Blade 15 OLED (Early 2022) | |
| AIDA64 / CPU AES | |
| Asus ROG Strix G17 G713PI | |
| Aorus 15X ASF | |
| Average Intel Core i9-13900HX (89413 - 237881, n=22) | |
| Medion Erazer Major X20 | |
| Average of class Gaming (39258 - 247074, n=105, last 2 years) | |
| Razer Blade 15 OLED (Early 2022) | |
| AIDA64 / CPU ZLib | |
| Asus ROG Strix G17 G713PI | |
| Medion Erazer Major X20 | |
| Average Intel Core i9-13900HX (1284 - 1958, n=22) | |
| Average of class Gaming (574 - 2531, n=105, last 2 years) | |
| Aorus 15X ASF | |
| Razer Blade 15 OLED (Early 2022) | |
| AIDA64 / FP64 Ray-Trace | |
| Asus ROG Strix G17 G713PI | |
| Average of class Gaming (5509 - 45446, n=105, last 2 years) | |
| Medion Erazer Major X20 | |
| Average Intel Core i9-13900HX (9481 - 15279, n=22) | |
| Aorus 15X ASF | |
| Razer Blade 15 OLED (Early 2022) | |
| AIDA64 / CPU PhotoWorxx | |
| Average Intel Core i9-13900HX (42994 - 51994, n=22) | |
| Average of class Gaming (12271 - 89891, n=105, last 2 years) | |
| Medion Erazer Major X20 | |
| Aorus 15X ASF | |
| Razer Blade 15 OLED (Early 2022) | |
| Razer Blade 15 OLED (Early 2022) | |
| Asus ROG Strix G17 G713PI | |
系统性能
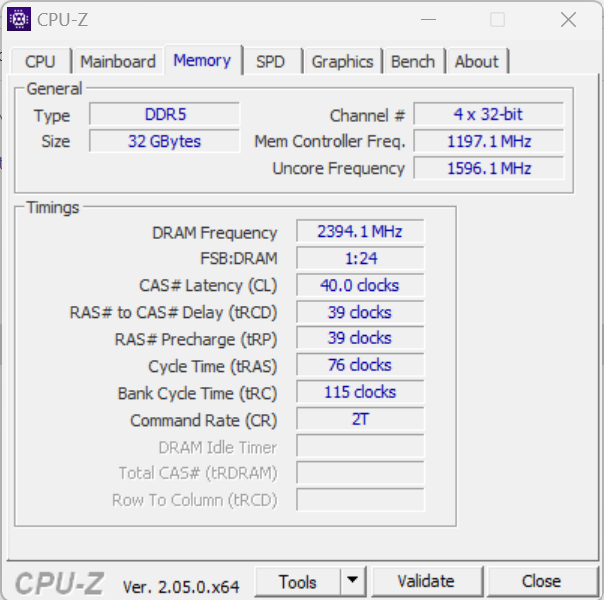
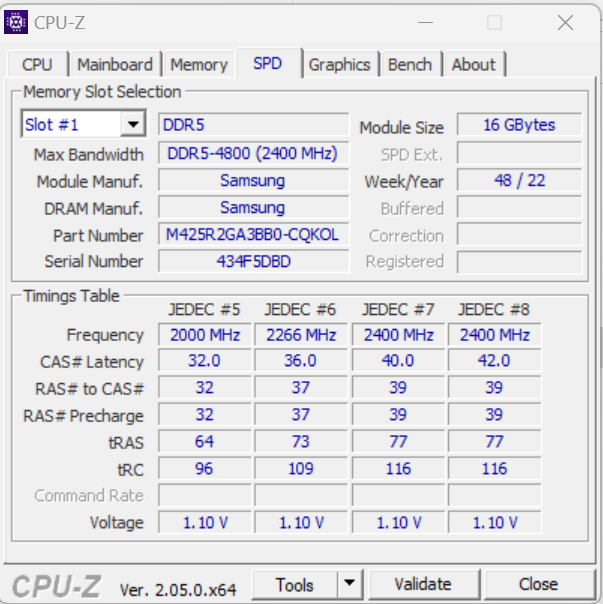
运行平稳的系统并不缺乏计算能力。笔记本电脑处理游戏、渲染和视频编辑没有问题,良好的PCMark结果证实了这一点。对于DDR5-4800内存来说,内存的传输率处于正常水平。
CrossMark: Overall | Productivity | Creativity | Responsiveness
| PCMark 10 / Score | |
| Average of class Gaming (5828 - 12414, n=93, last 2 years) | |
| Medion Erazer Major X20 | |
| Average Intel Core i9-13900HX, NVIDIA GeForce RTX 4070 Laptop GPU (6956 - 8153, n=3) | |
| Asus ROG Strix G17 G713PI | |
| Razer Blade 15 OLED (Early 2022) | |
| Aorus 15X ASF | |
| PCMark 10 / Essentials | |
| Medion Erazer Major X20 | |
| Asus ROG Strix G17 G713PI | |
| Average Intel Core i9-13900HX, NVIDIA GeForce RTX 4070 Laptop GPU (9865 - 11653, n=3) | |
| Aorus 15X ASF | |
| Average of class Gaming (8810 - 11935, n=97, last 2 years) | |
| Razer Blade 15 OLED (Early 2022) | |
| PCMark 10 / Productivity | |
| Average of class Gaming (6845 - 25323, n=95, last 2 years) | |
| Asus ROG Strix G17 G713PI | |
| Razer Blade 15 OLED (Early 2022) | |
| Medion Erazer Major X20 | |
| Average Intel Core i9-13900HX, NVIDIA GeForce RTX 4070 Laptop GPU (9470 - 9850, n=3) | |
| Aorus 15X ASF | |
| PCMark 10 / Digital Content Creation | |
| Average of class Gaming (7602 - 19954, n=95, last 2 years) | |
| Average Intel Core i9-13900HX, NVIDIA GeForce RTX 4070 Laptop GPU (9776 - 13370, n=3) | |
| Razer Blade 15 OLED (Early 2022) | |
| Medion Erazer Major X20 | |
| Aorus 15X ASF | |
| Asus ROG Strix G17 G713PI | |
| CrossMark / Overall | |
| Aorus 15X ASF | |
| Asus ROG Strix G17 G713PI | |
| Average of class Gaming (1366 - 2409, n=94, last 2 years) | |
| Average Intel Core i9-13900HX, NVIDIA GeForce RTX 4070 Laptop GPU (1842 - 2029, n=3) | |
| Medion Erazer Major X20 | |
| Razer Blade 15 OLED (Early 2022) | |
| CrossMark / Productivity | |
| Aorus 15X ASF | |
| Asus ROG Strix G17 G713PI | |
| Average of class Gaming (1386 - 2254, n=94, last 2 years) | |
| Average Intel Core i9-13900HX, NVIDIA GeForce RTX 4070 Laptop GPU (1700 - 1872, n=3) | |
| Medion Erazer Major X20 | |
| Razer Blade 15 OLED (Early 2022) | |
| CrossMark / Creativity | |
| Asus ROG Strix G17 G713PI | |
| Average of class Gaming (1343 - 2786, n=94, last 2 years) | |
| Average Intel Core i9-13900HX, NVIDIA GeForce RTX 4070 Laptop GPU (2088 - 2316, n=3) | |
| Aorus 15X ASF | |
| Medion Erazer Major X20 | |
| Razer Blade 15 OLED (Early 2022) | |
| CrossMark / Responsiveness | |
| Aorus 15X ASF | |
| Average of class Gaming (1226 - 2334, n=94, last 2 years) | |
| Asus ROG Strix G17 G713PI | |
| Average Intel Core i9-13900HX, NVIDIA GeForce RTX 4070 Laptop GPU (1557 - 1752, n=3) | |
| Medion Erazer Major X20 | |
| Razer Blade 15 OLED (Early 2022) | |
| PCMark 8 Home Score Accelerated v2 | 4889 points | |
| PCMark 8 Work Score Accelerated v2 | 6067 points | |
| PCMark 10 Score | 7575 points | |
Help | ||
| AIDA64 / Memory Copy | |
| Average Intel Core i9-13900HX (67716 - 79193, n=22) | |
| Average of class Gaming (21750 - 129946, n=105, last 2 years) | |
| Medion Erazer Major X20 | |
| Aorus 15X ASF | |
| Razer Blade 15 OLED (Early 2022) | |
| Asus ROG Strix G17 G713PI | |
| AIDA64 / Memory Read | |
| Average Intel Core i9-13900HX (73998 - 88462, n=22) | |
| Average of class Gaming (22956 - 118858, n=105, last 2 years) | |
| Medion Erazer Major X20 | |
| Aorus 15X ASF | |
| Razer Blade 15 OLED (Early 2022) | |
| Asus ROG Strix G17 G713PI | |
| AIDA64 / Memory Write | |
| Average of class Gaming (22297 - 135096, n=105, last 2 years) | |
| Average Intel Core i9-13900HX (65472 - 77045, n=22) | |
| Medion Erazer Major X20 | |
| Asus ROG Strix G17 G713PI | |
| Razer Blade 15 OLED (Early 2022) | |
| Aorus 15X ASF | |
| AIDA64 / Memory Latency | |
| Average of class Gaming (75.3 - 259, n=105, last 2 years) | |
| Razer Blade 15 OLED (Early 2022) | |
| Medion Erazer Major X20 | |
| Asus ROG Strix G17 G713PI | |
| Aorus 15X ASF | |
| Average Intel Core i9-13900HX (75.3 - 91.1, n=22) | |
* ... smaller is better
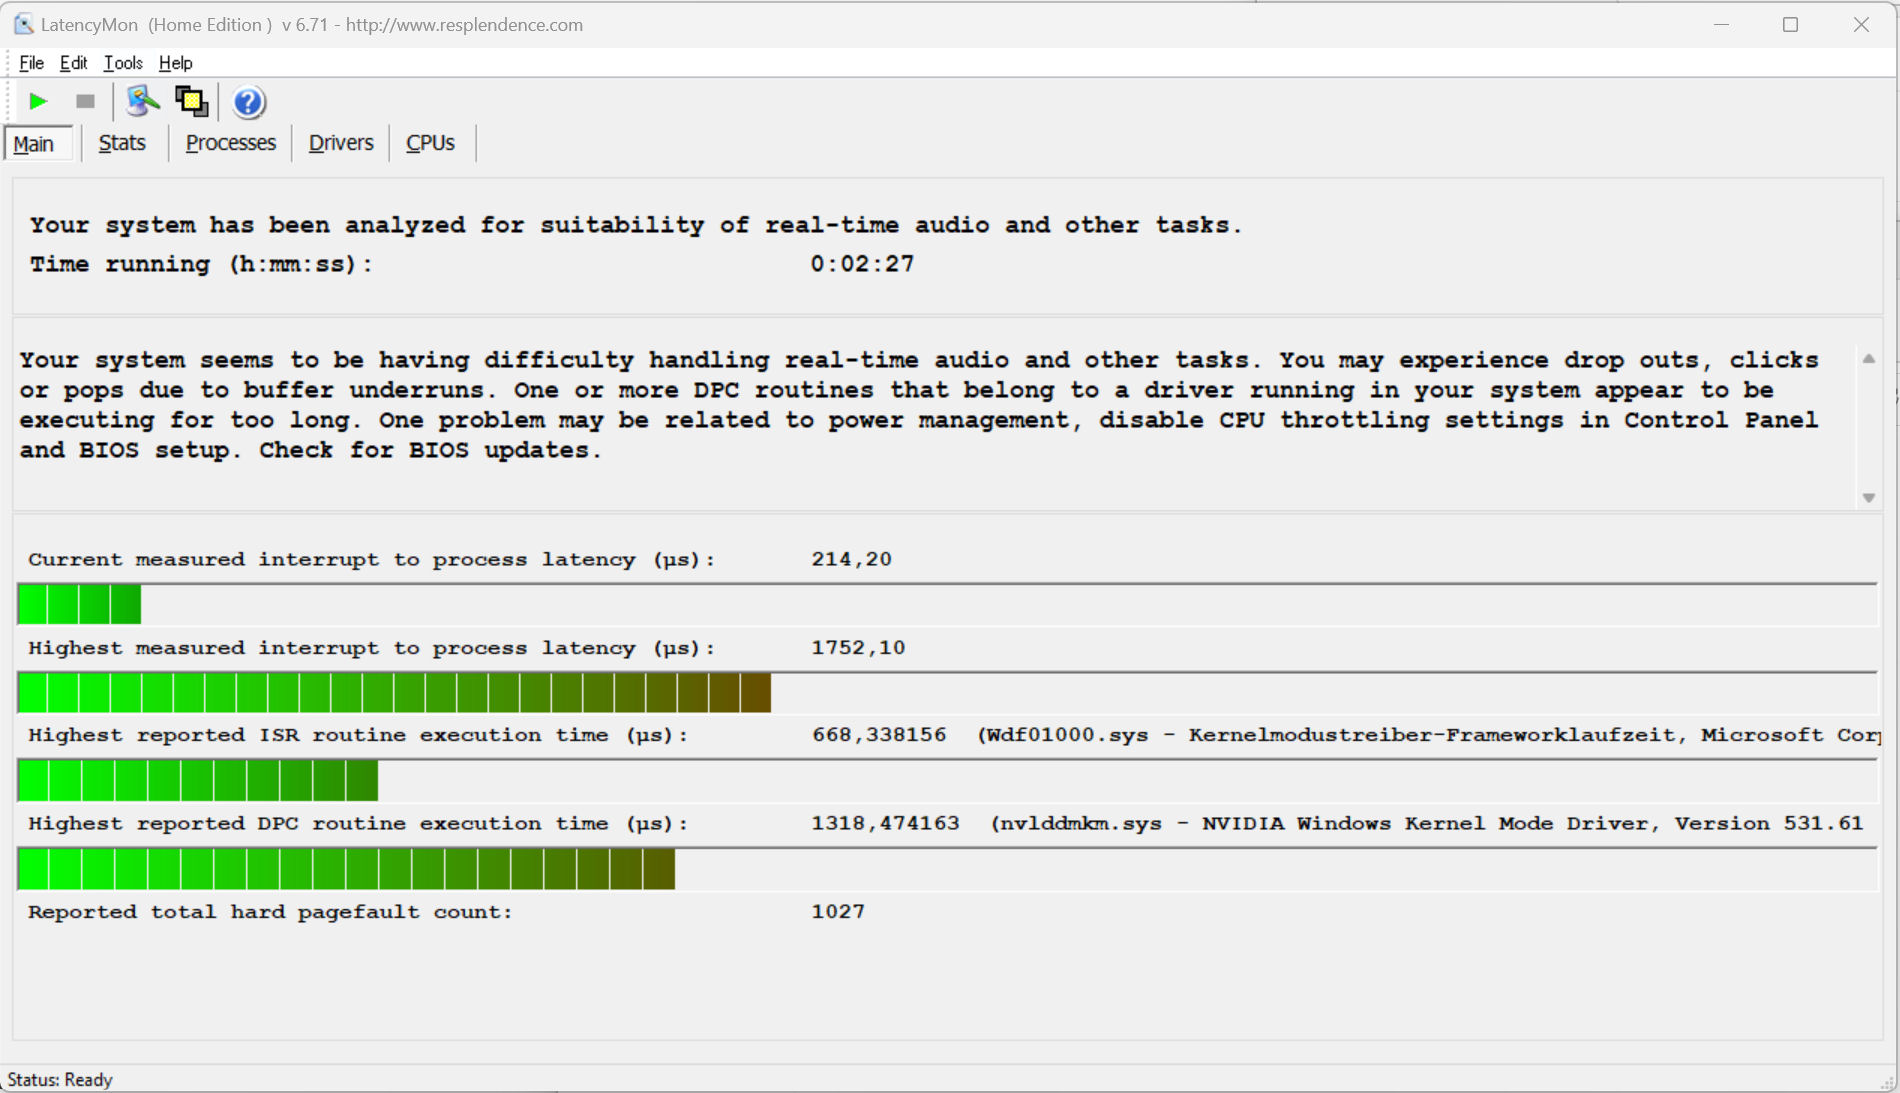
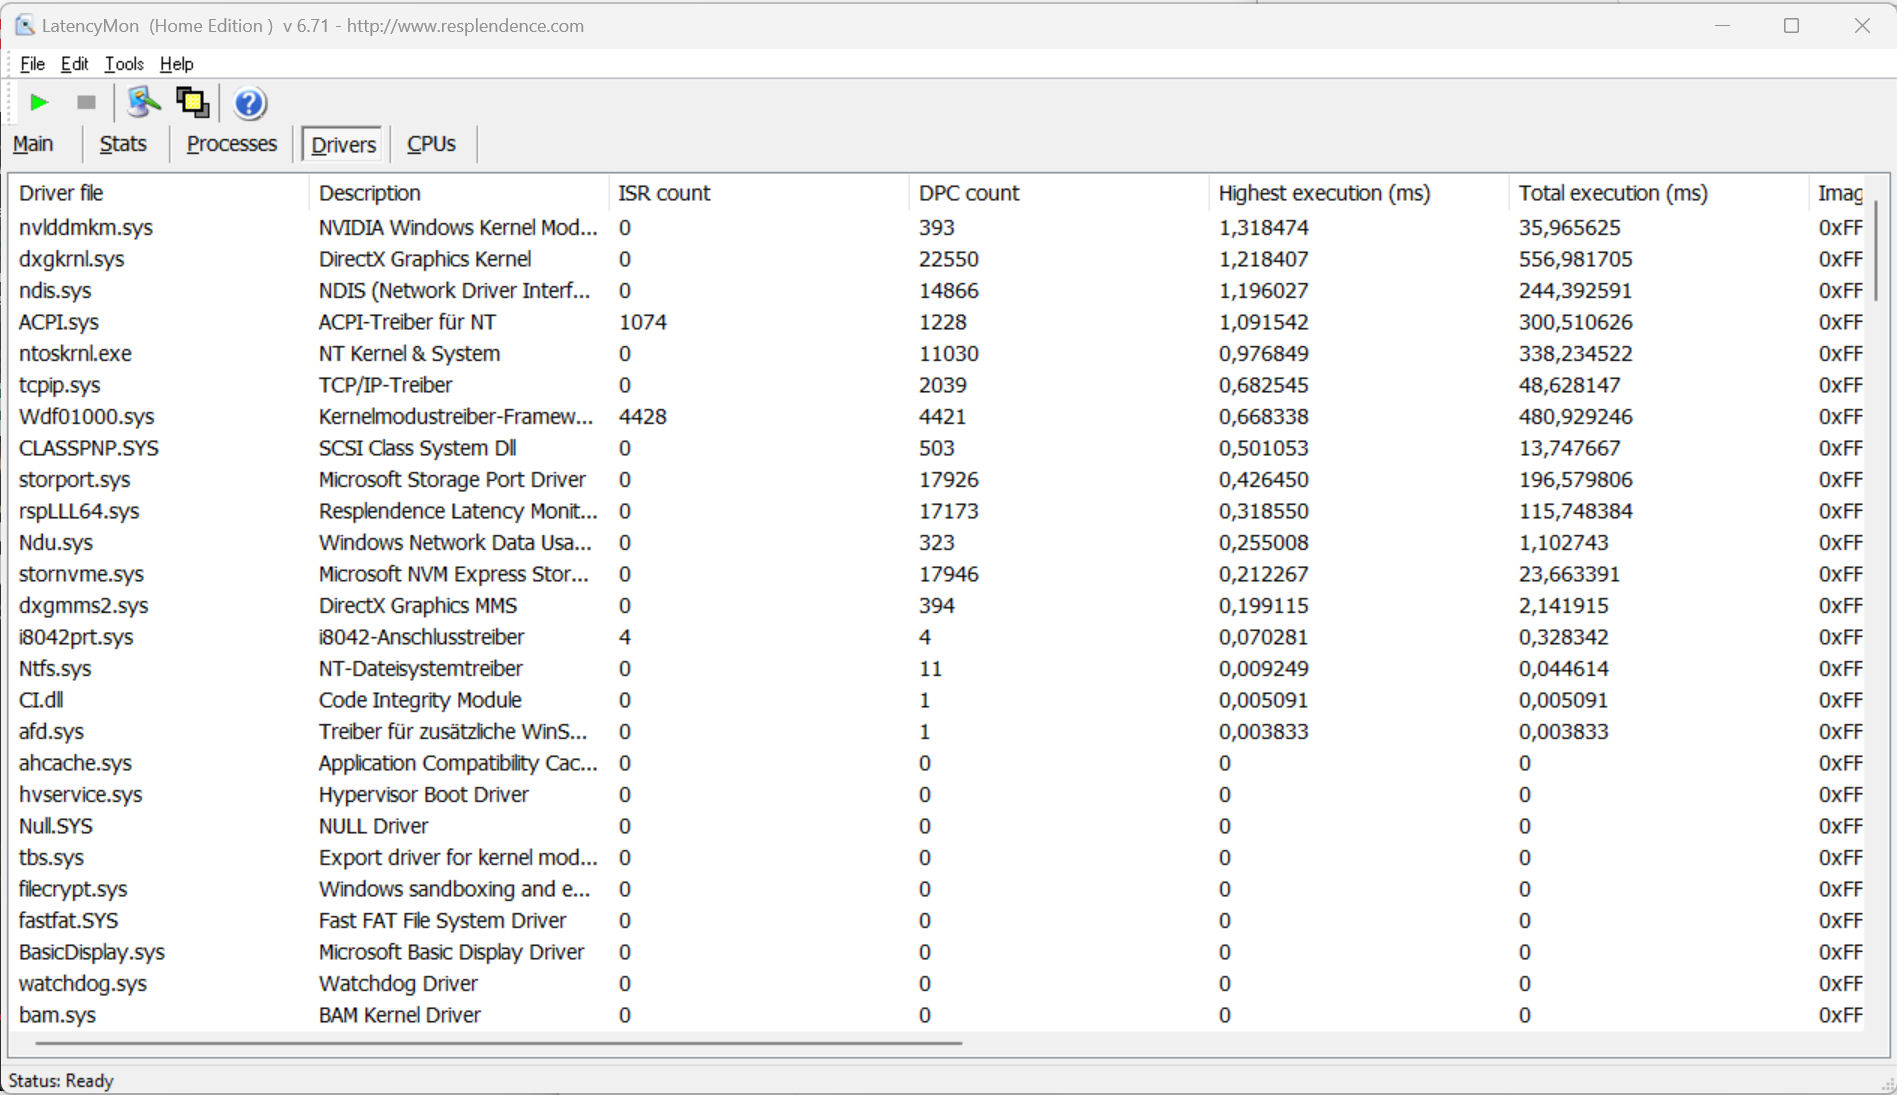
DPC延时
标准化的延迟监测测试(网络冲浪、4k视频播放、Prime95高负荷)发现了一些异常情况。该系统似乎不适合实时视频和音频编辑。未来的软件更新可能会改善这一点,或导致进一步恶化。
| DPC Latencies / LatencyMon - interrupt to process latency (max), Web, Youtube, Prime95 | |
| Aorus 15X ASF | |
| Medion Erazer Major X20 | |
| Asus ROG Strix G17 G713PI | |
| Razer Blade 15 OLED (Early 2022) | |
* ... smaller is better
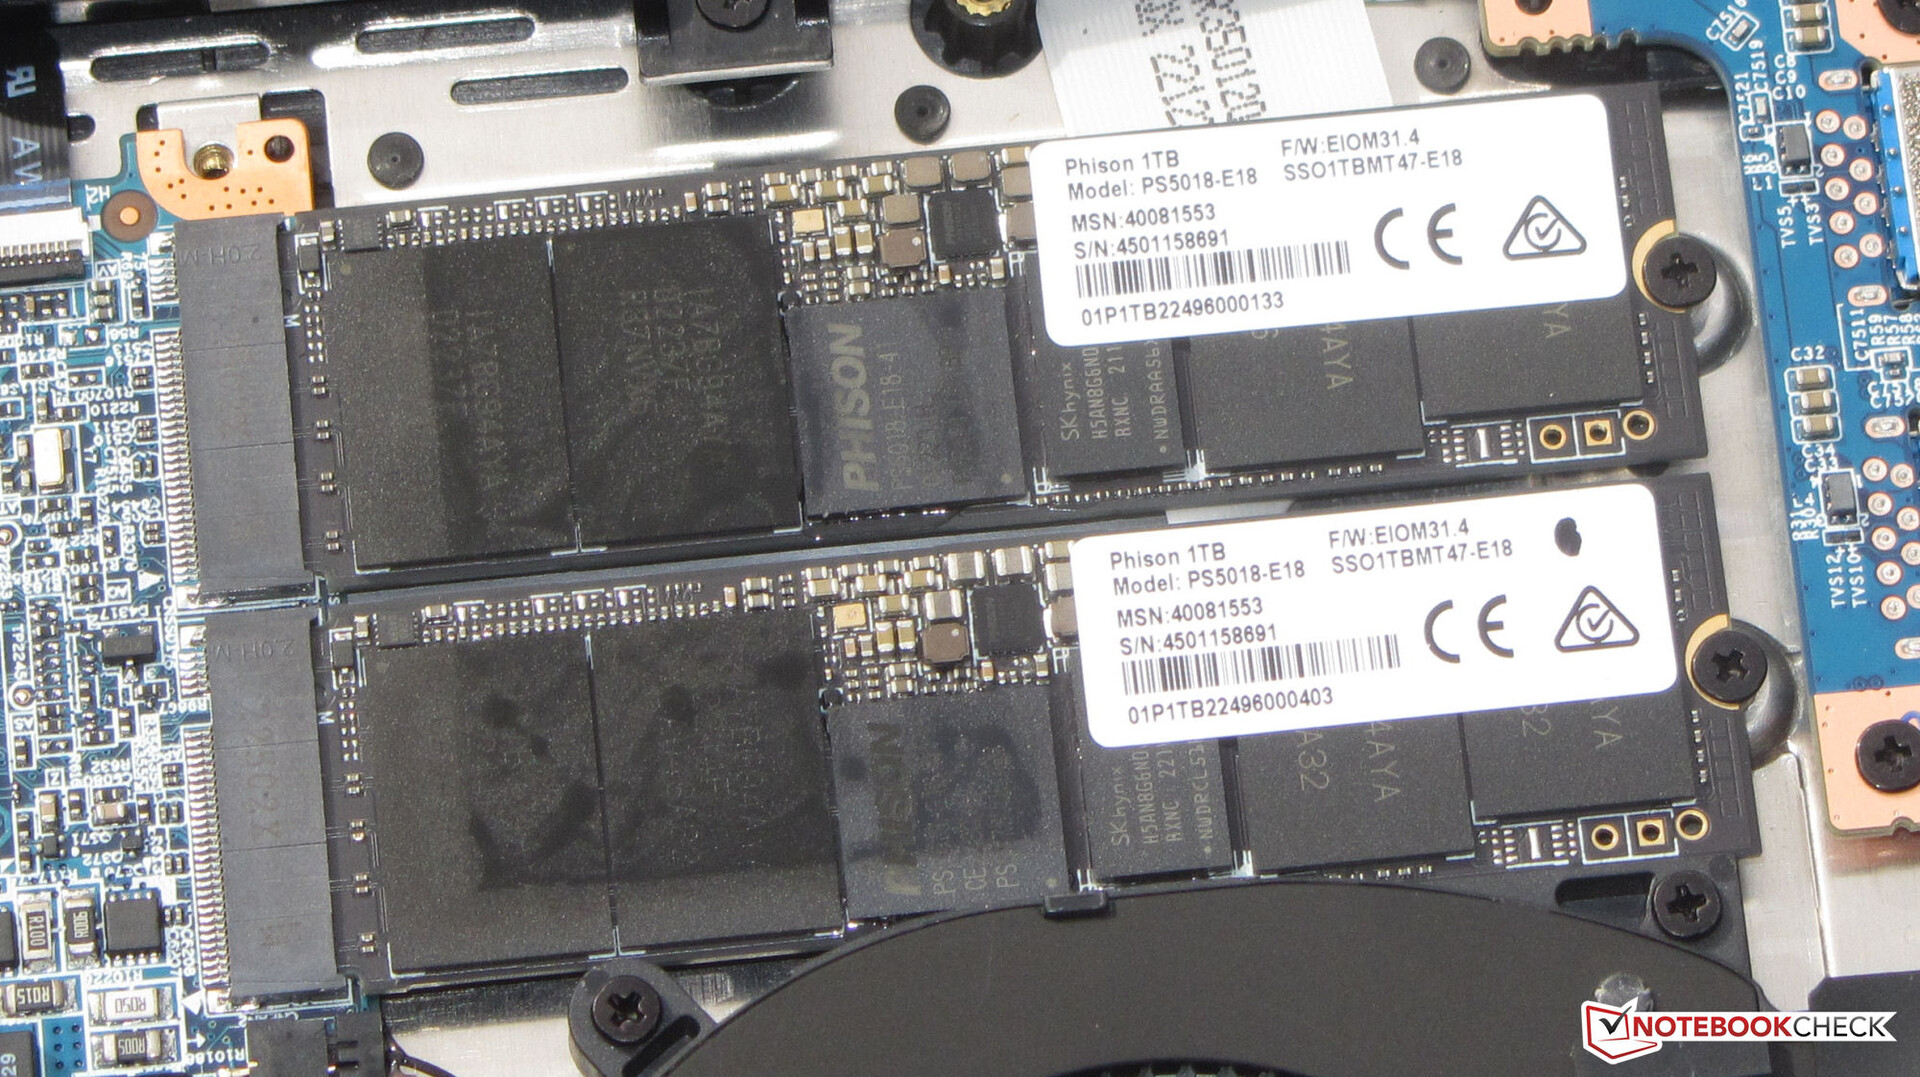
存储设备
Erazer装有两块来自Phison的1TB固态硬盘(PCIe 4,M.2-2280),总体上提供了良好的性能率。固态硬盘没有形成RAID阵列,X20也没有提供RAID支持--一个固态硬盘作为系统驱动器,另一个作为数据存储。一个积极的方面是:没有观察到热节流现象。

| Drive Performance rating - Percent | |
| Aorus 15X ASF | |
| Average Phison E18-1TB-PHISON-SSD-B47R | |
| Medion Erazer Major X20 | |
| Razer Blade 15 OLED (Early 2022) | |
| Average of class Gaming | |
| Asus ROG Strix G17 G713PI | |
* ... smaller is better
Sustained Read Performance: DiskSpd Read Loop, Queue Depth 8
图形卡
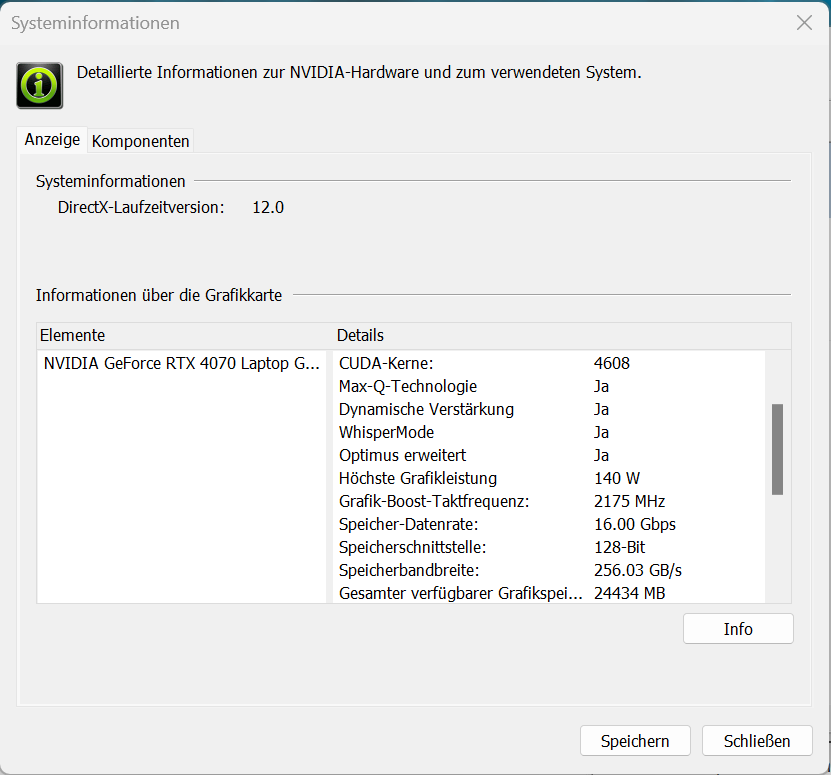
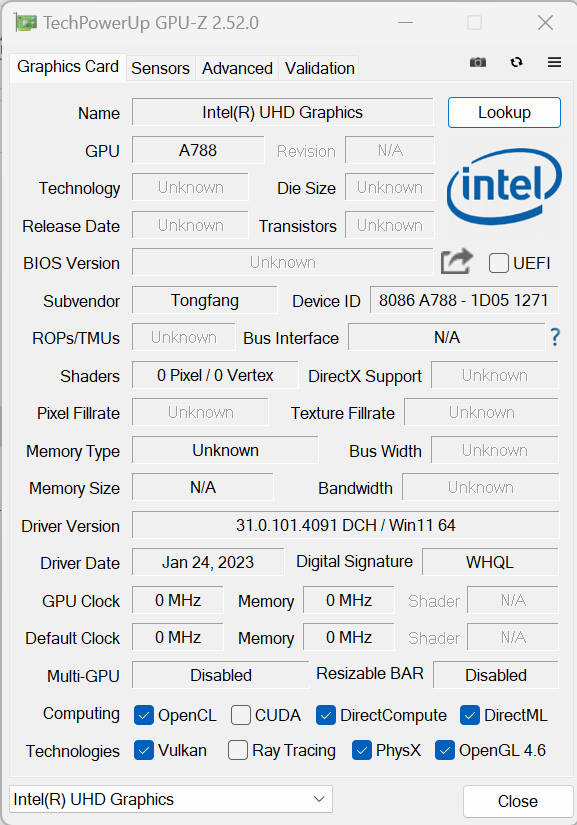
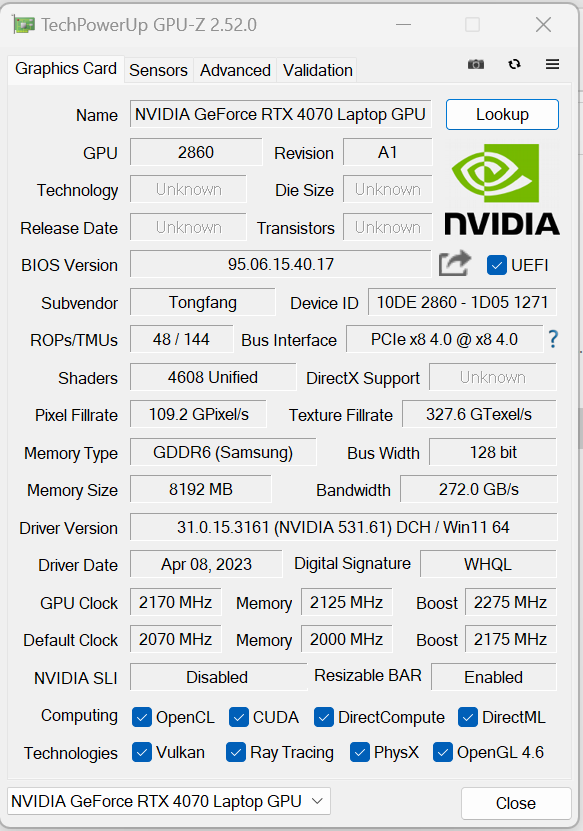
没有(更多)实验:当Medion将英特尔当时新推出的Arc GPU中的一个安装到主要的X10,而X20则配备了一个 GeForce RTX 4070笔记本卡(VRAM:8,192 GB GDDR6),来自Nvidia。这款产品的最大可能TGP为140瓦(115瓦+25瓦动态提升),根据Witcher 3 测试,这款产品没有得到充分利用。
基准测试结果高于之前RTX 4070的平均水平--与Arc A730M相比,性能有显著提高。弧形A730MdGPU模式并没有带来任何改进。在dGPU和Optimus之间切换不需要重启 - 支持高级Optimus。
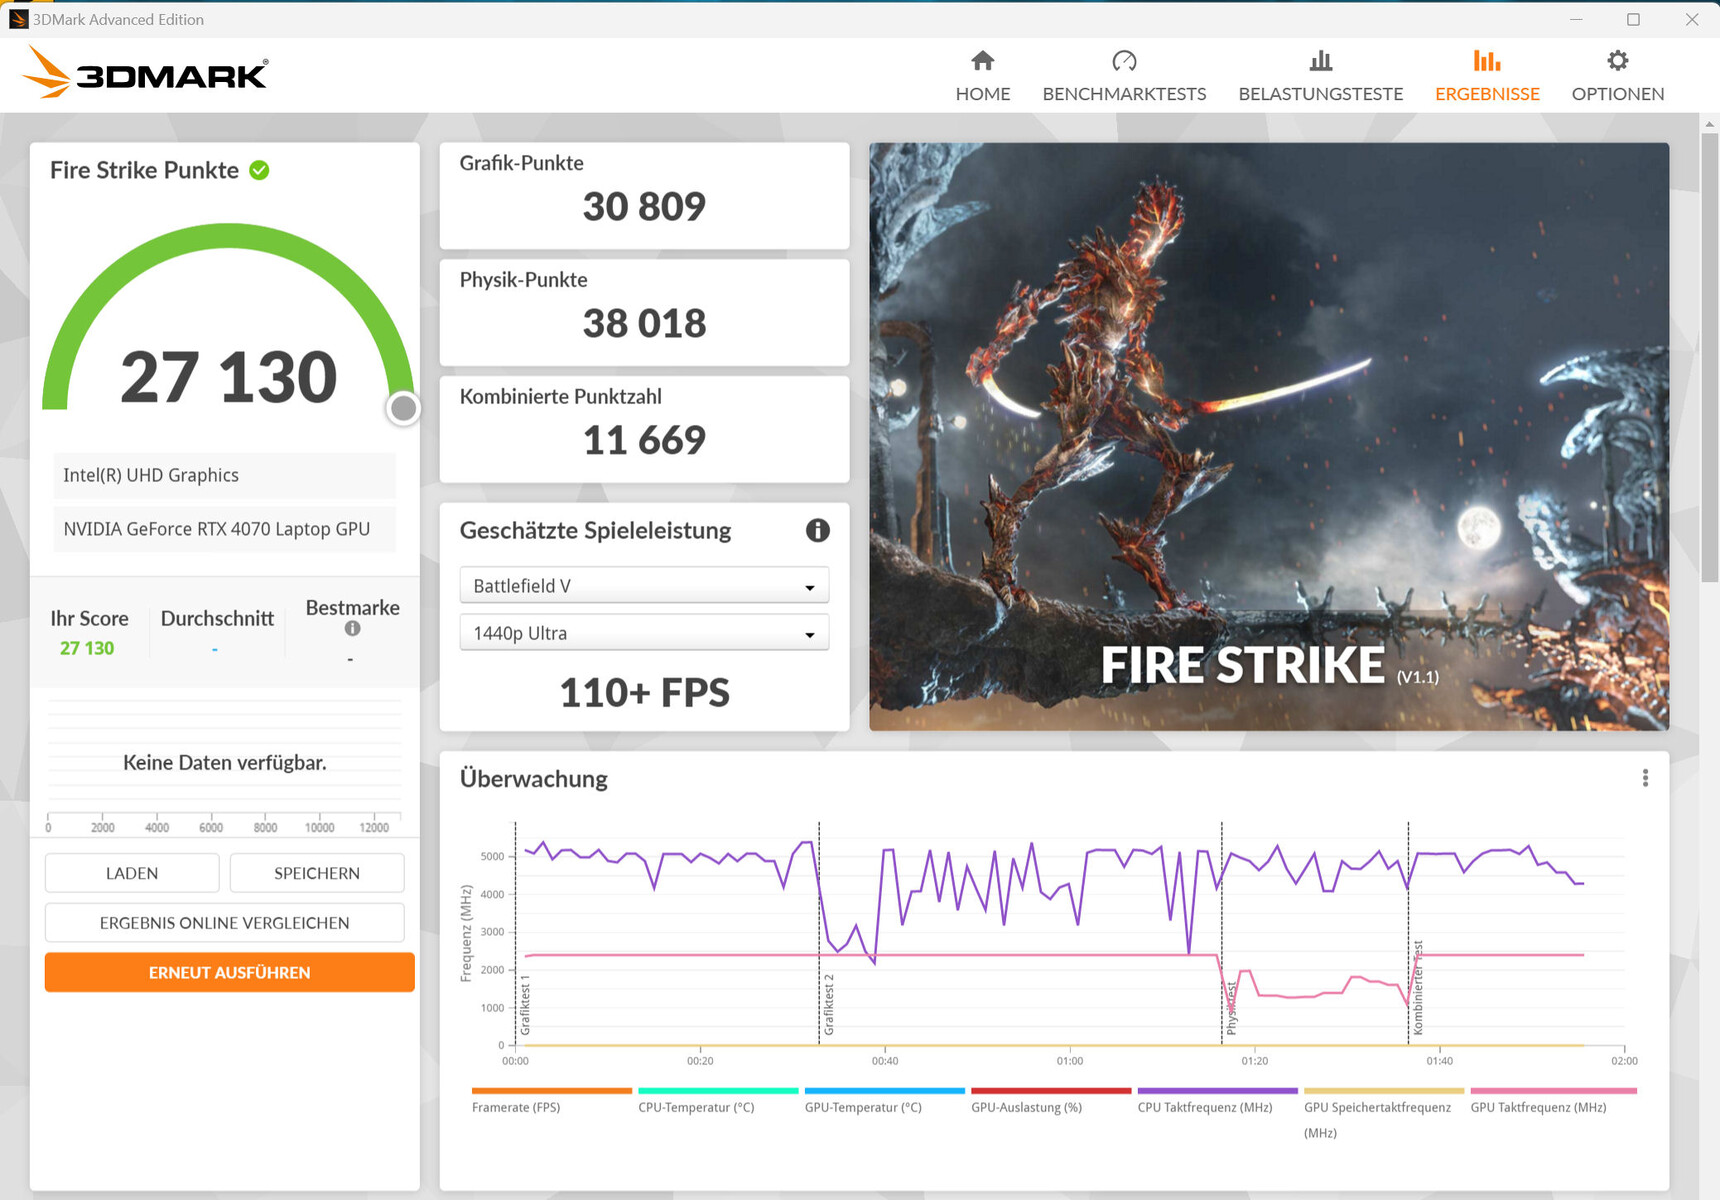

| 3DMark 06 Standard Score | 60496 points | |
| 3DMark 11 Performance | 35727 points | |
| 3DMark Cloud Gate Standard Score | 66380 points | |
| 3DMark Fire Strike Score | 27130 points | |
| 3DMark Time Spy Score | 12846 points | |
Help | ||
* ... smaller is better
游戏性能
这款笔记本允许在高至最高设置下进行QHD游戏。在使用外部显示器时,更高的分辨率是可能的--可能是降低设置。测试的标题的帧率高于确定的RTX 4070平均水平。dGPU模式可能会在小范围内增加一些游戏的帧率。
| The Witcher 3 - 1920x1080 Ultra Graphics & Postprocessing (HBAO+) | |
| Average of class Gaming (104.7 - 240, n=7, last 2 years) | |
| Medion Erazer Major X20 | |
| Asus ROG Strix G17 G713PI | |
| Aorus 15X ASF | |
| Average NVIDIA GeForce RTX 4070 Laptop GPU (69.8 - 133.7, n=57) | |
| Razer Blade 15 OLED (Early 2022) | |
| Medion Erazer Major X10 | |
| Final Fantasy XV Benchmark - 1920x1080 High Quality | |
| Average of class Gaming (41 - 215, n=95, last 2 years) | |
| Medion Erazer Major X20 | |
| Aorus 15X ASF | |
| Asus ROG Strix G17 G713PI | |
| Average NVIDIA GeForce RTX 4070 Laptop GPU (41 - 131.9, n=65) | |
| Razer Blade 15 OLED (Early 2022) | |
| Medion Erazer Major X10 | |
为了检查帧率是否在较长时间内基本保持不变,我们在全高清分辨率和最高质量设置下运行游戏 "TheWitcher 3" 约60分钟。游戏角色没有被移动。帧率的下降并没有被记录下来。
Witcher 3 FPS chart
| low | med. | high | ultra | QHD | |
|---|---|---|---|---|---|
| GTA V (2015) | 187.3 | 187.2 | 183.8 | 128 | 72.6 |
| The Witcher 3 (2015) | 545 | 391.4 | 242.3 | 127 | |
| Dota 2 Reborn (2015) | 205 | 183.3 | 169.9 | 158.8 | |
| Final Fantasy XV Benchmark (2018) | 220 | 175.2 | 121.2 | 88.4 | |
| X-Plane 11.11 (2018) | 182.3 | 155.9 | 120.8 | ||
| Far Cry 5 (2018) | 188 | 161 | 153 | 144 | 122 |
| Strange Brigade (2018) | 490 | 310 | 244 | 208 | 131.4 |
| F1 22 (2022) | 262 | 264 | 206 | 83.9 | 53.3 |
排放物 - Erazer笔记本电脑会产生大量的噪音
噪声
X20在负载下会产生很大的噪音:当 "涡轮模式 "激活时,峰值可达57 dB(A)。背景噪音是类似于嘶嘶声的东西。风扇没有发出令人讨厌的背景噪音。通过使用其他两个性能配置,可以实现整体较低的噪音水平--以牺牲计算能力为代价。
在怠速和日常使用中(办公室、互联网)的排放是令人愉快的:风扇以非常低的速度运行,并且经常处于空闲状态--在所有三个性能配置中。
| 涡轮模式 (dt: Overboost) | 平衡模式 (dt: Balanced) | 办公室模式 (dt: Balanced) | |
|---|---|---|---|
| CPU PL1 (HWInfo) | 140 watts | 140 watts | 140 watts |
| CPU PL2 (HWInfo) | 140 watts | 140 watts | 140 watts |
| 噪音 (Witcher 3) | 50-53 dB(A) | 48-51 dB(A) | 36-43 dB(A) 以后 32-34 dB(A) |
| 性能 (Witcher 3) | 124 fps | 118 fps | 114-118 fps later 30 fps Lock |
Noise level
| Idle |
| 25 / 29 / 31 dB(A) |
| Load |
| 50 / 57 dB(A) |
 | ||
30 dB silent 40 dB(A) audible 50 dB(A) loud |
||
min: | ||
| Medion Erazer Major X20 i9-13900HX, GeForce RTX 4070 Laptop GPU | Aorus 15X ASF i7-13700HX, GeForce RTX 4070 Laptop GPU | Razer Blade 15 OLED (Early 2022) i9-12900H, GeForce RTX 3070 Ti Laptop GPU | Asus ROG Strix G17 G713PI R9 7945HX, GeForce RTX 4070 Laptop GPU | |
|---|---|---|---|---|
| Noise | -5% | 7% | 5% | |
| off / environment * (dB) | 24 | 25 -4% | 26 -8% | 25 -4% |
| Idle Minimum * (dB) | 25 | 28 -12% | 28 -12% | 26 -4% |
| Idle Average * (dB) | 29 | 29 -0% | 28 3% | 29 -0% |
| Idle Maximum * (dB) | 31 | 36 -16% | 28 10% | 30 3% |
| Load Average * (dB) | 50 | 50 -0% | 38.5 23% | 46 8% |
| Witcher 3 ultra * (dB) | 53 | 54 -2% | 46 13% | |
| Load Maximum * (dB) | 57 | 58 -2% | 43.9 23% | 47 18% |
* ... smaller is better
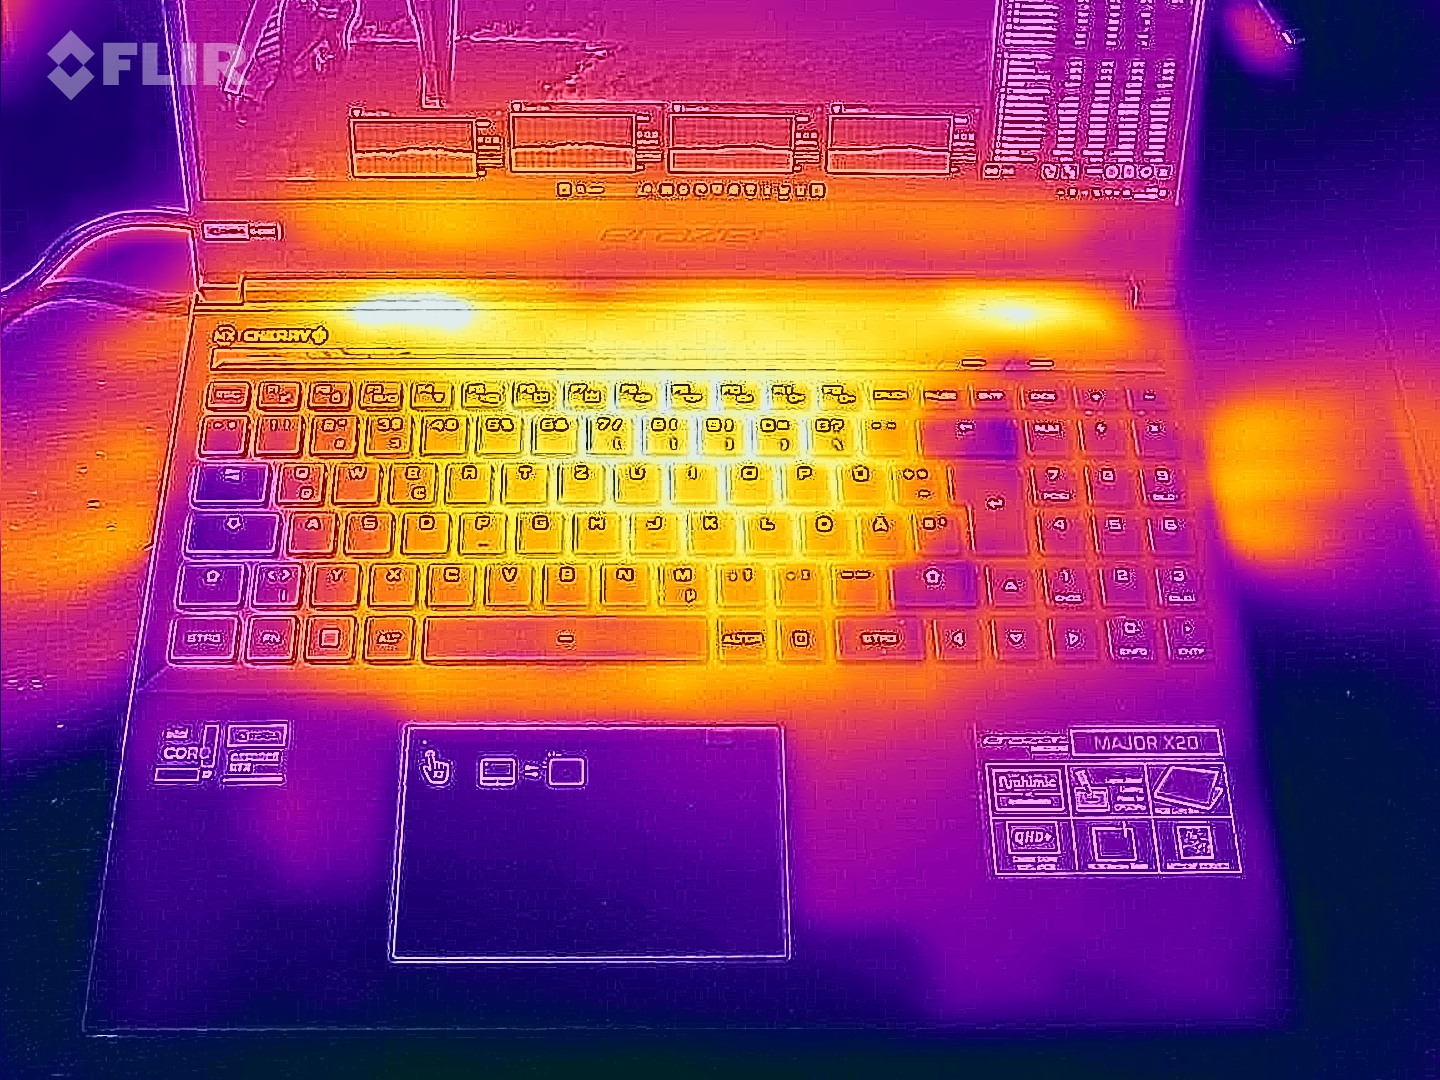
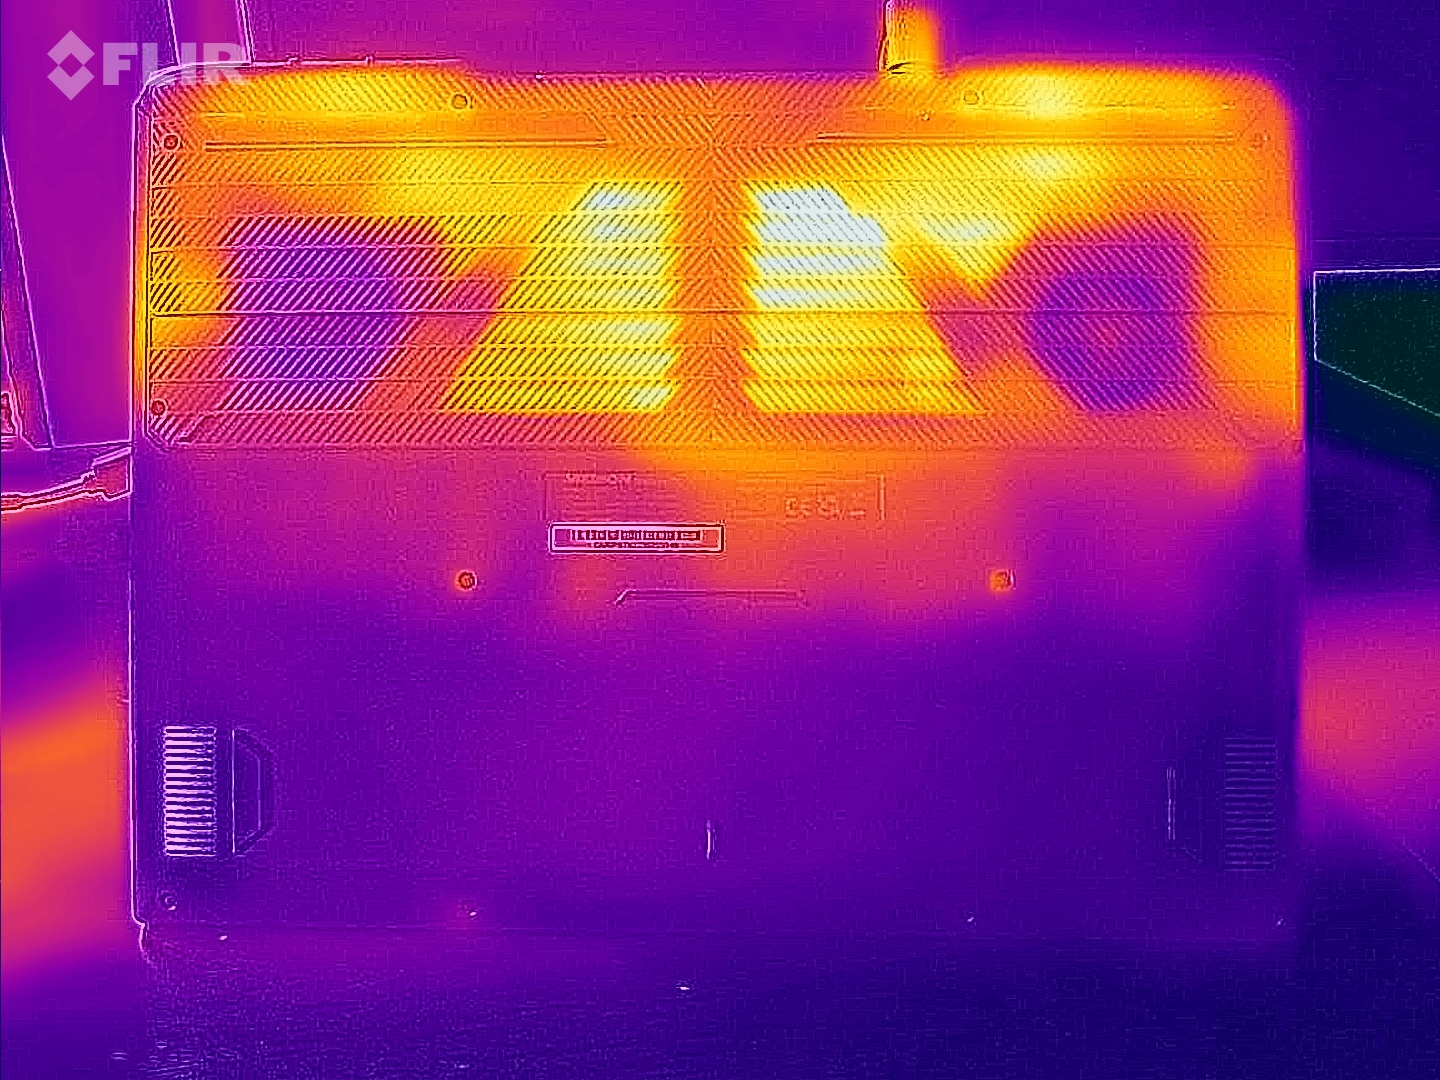
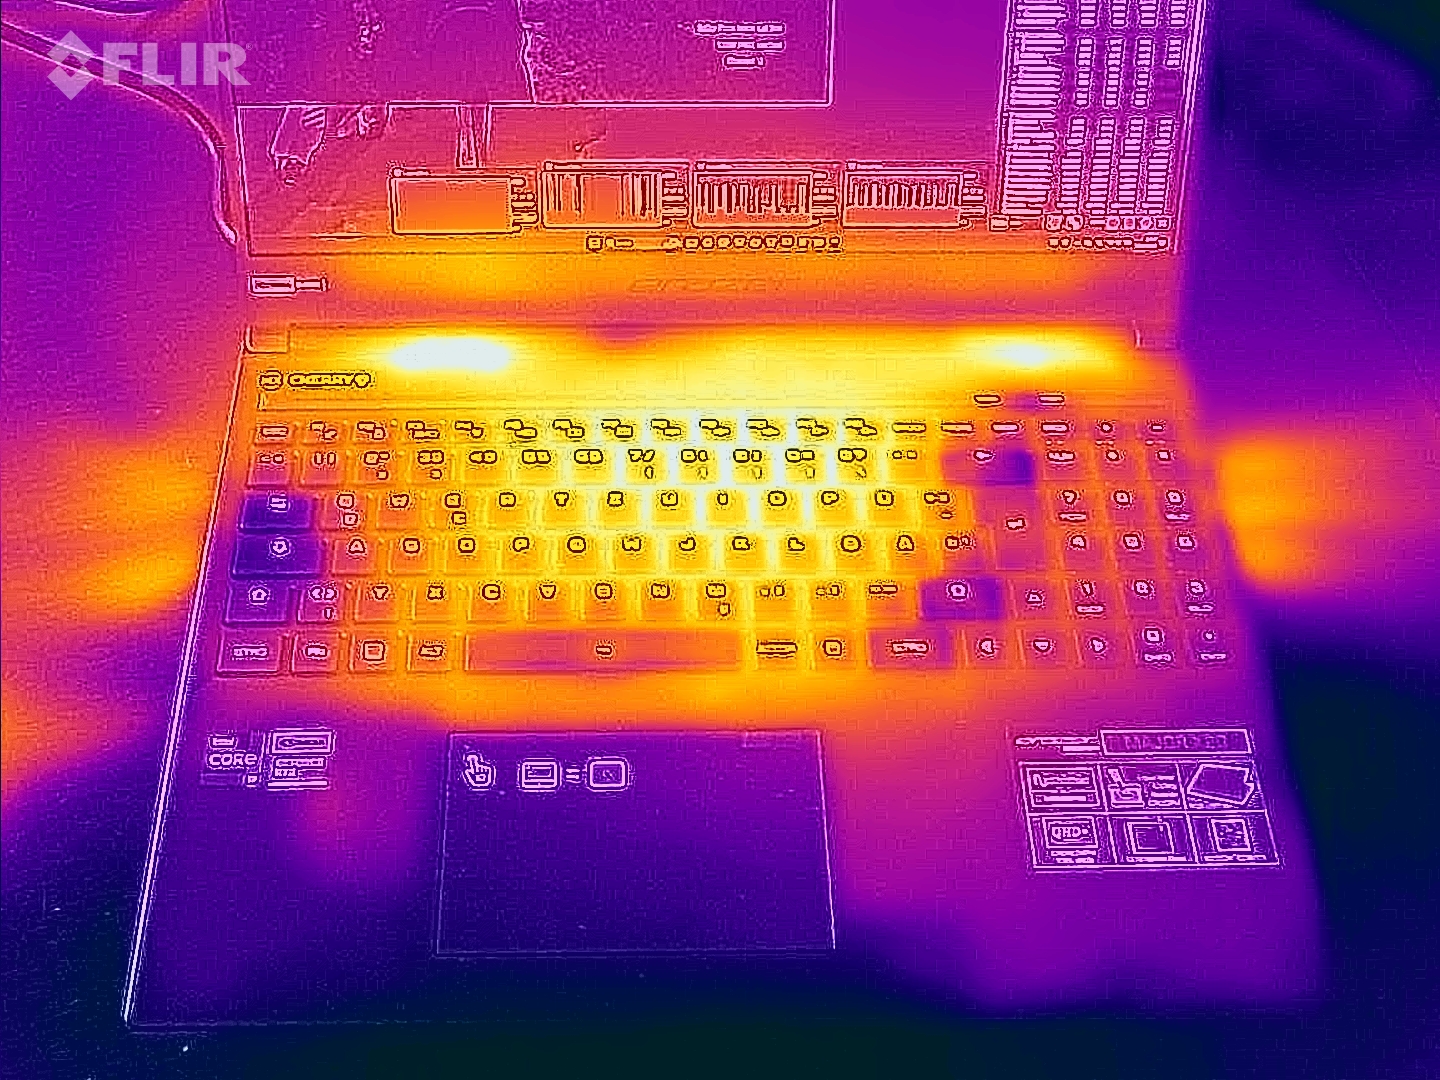
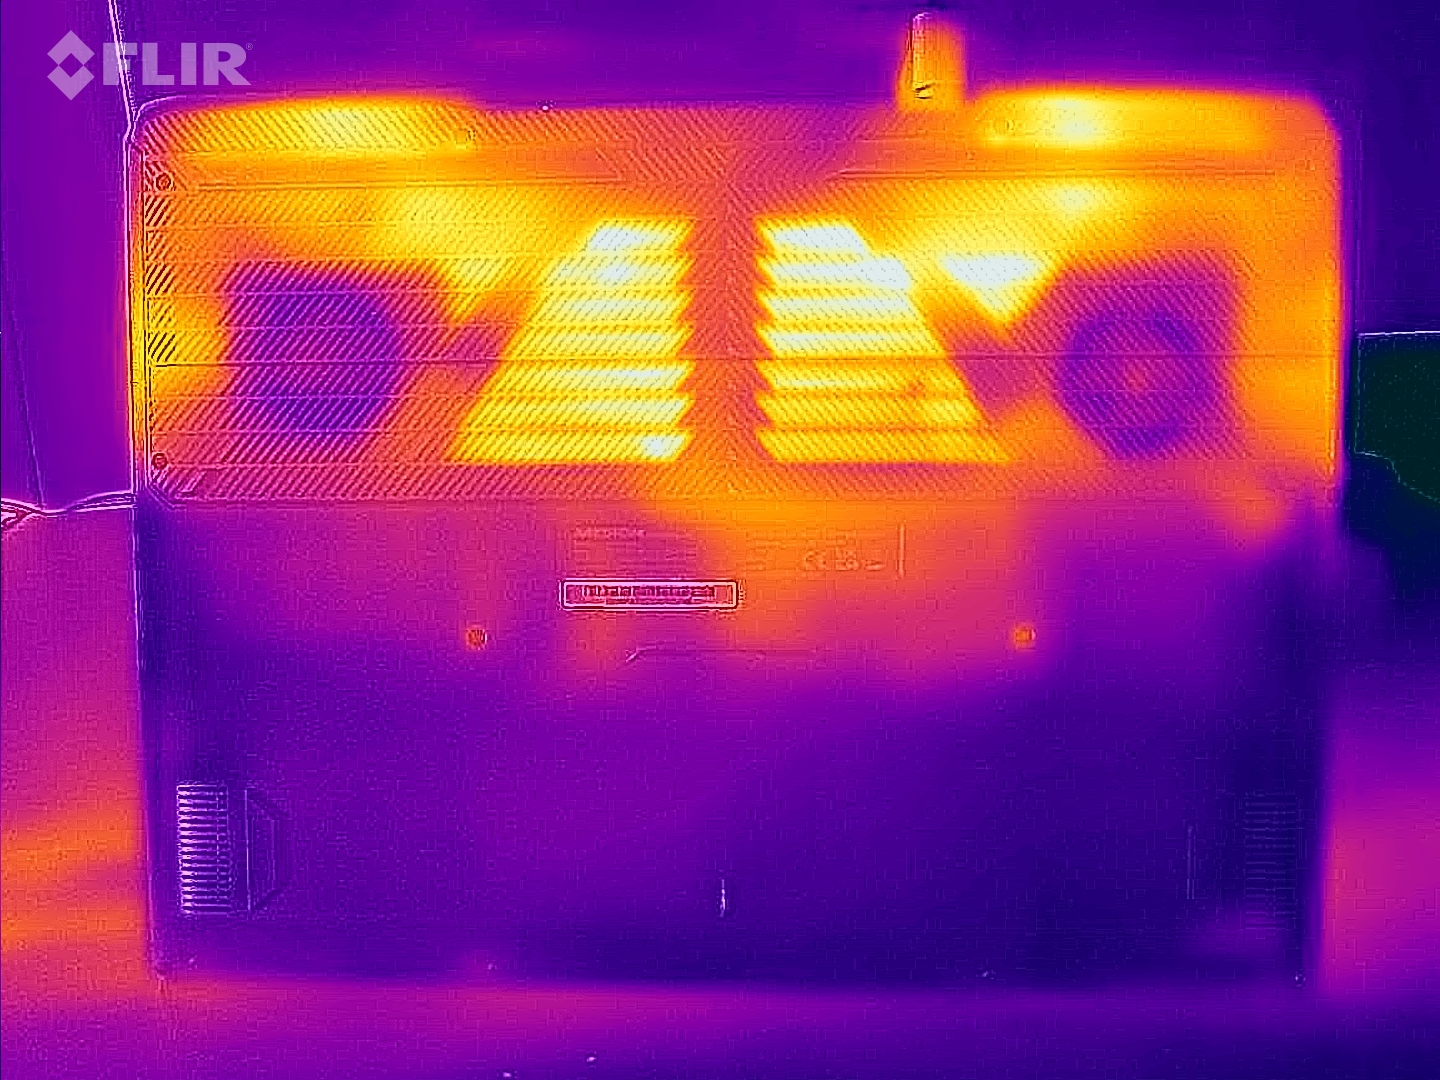
温度
在日常使用中(办公室、互联网),笔记本温度保持在绿色范围内。笔记本在负载下明显发热(压力测试,Witcher 3 测试),但不会过度。CPU的温度没有什么可担心的。
(-) The maximum temperature on the upper side is 46 °C / 115 F, compared to the average of 40.4 °C / 105 F, ranging from 21.2 to 68.8 °C for the class Gaming.
(-) The bottom heats up to a maximum of 49 °C / 120 F, compared to the average of 43.2 °C / 110 F
(±) In idle usage, the average temperature for the upper side is 32 °C / 90 F, compared to the device average of 33.9 °C / 93 F.
(±) Playing The Witcher 3, the average temperature for the upper side is 37 °C / 99 F, compared to the device average of 33.9 °C / 93 F.
(+) The palmrests and touchpad are cooler than skin temperature with a maximum of 31 °C / 87.8 F and are therefore cool to the touch.
(-) The average temperature of the palmrest area of similar devices was 28.8 °C / 83.8 F (-2.2 °C / -4 F).
| Medion Erazer Major X20 Intel Core i9-13900HX, NVIDIA GeForce RTX 4070 Laptop GPU | Aorus 15X ASF Intel Core i7-13700HX, NVIDIA GeForce RTX 4070 Laptop GPU | Razer Blade 15 OLED (Early 2022) Intel Core i9-12900H, NVIDIA GeForce RTX 3070 Ti Laptop GPU | Asus ROG Strix G17 G713PI AMD Ryzen 9 7945HX, NVIDIA GeForce RTX 4070 Laptop GPU | |
|---|---|---|---|---|
| Heat | 16% | 3% | 12% | |
| Maximum Upper Side * (°C) | 46 | 42 9% | 49.5 -8% | 42 9% |
| Maximum Bottom * (°C) | 49 | 51 -4% | 47.5 3% | 41 16% |
| Idle Upper Side * (°C) | 37 | 27 27% | 33.4 10% | 33 11% |
| Idle Bottom * (°C) | 38 | 26 32% | 35 8% | 34 11% |
* ... smaller is better
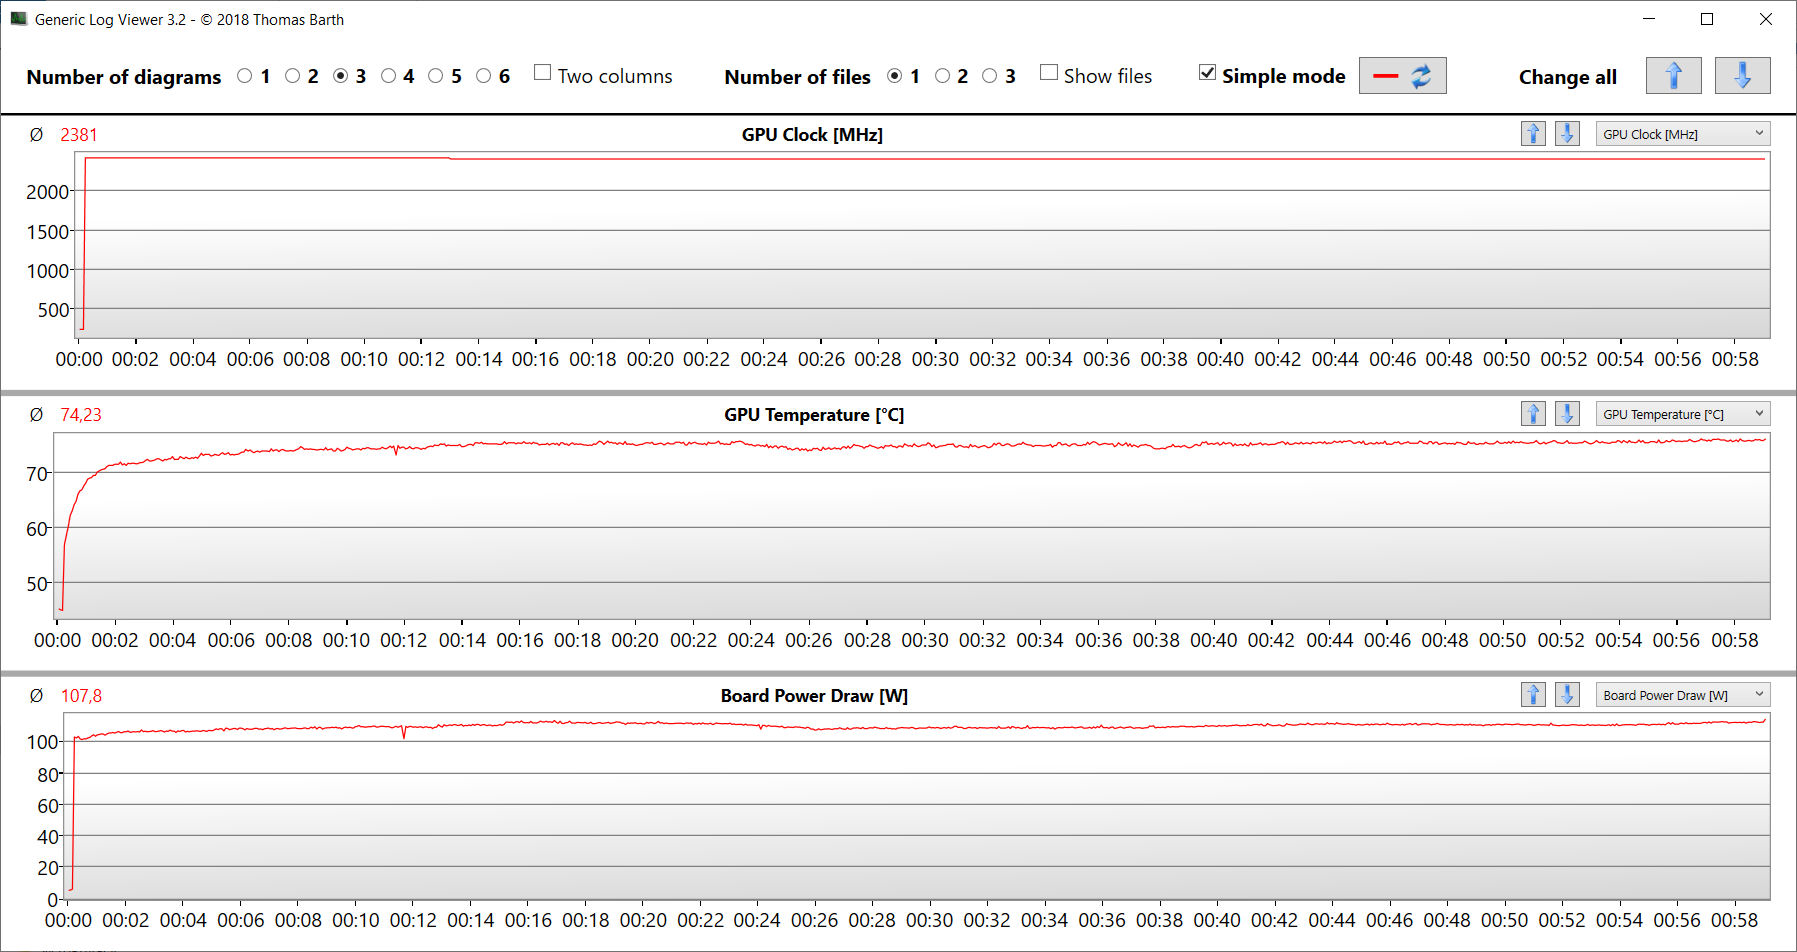
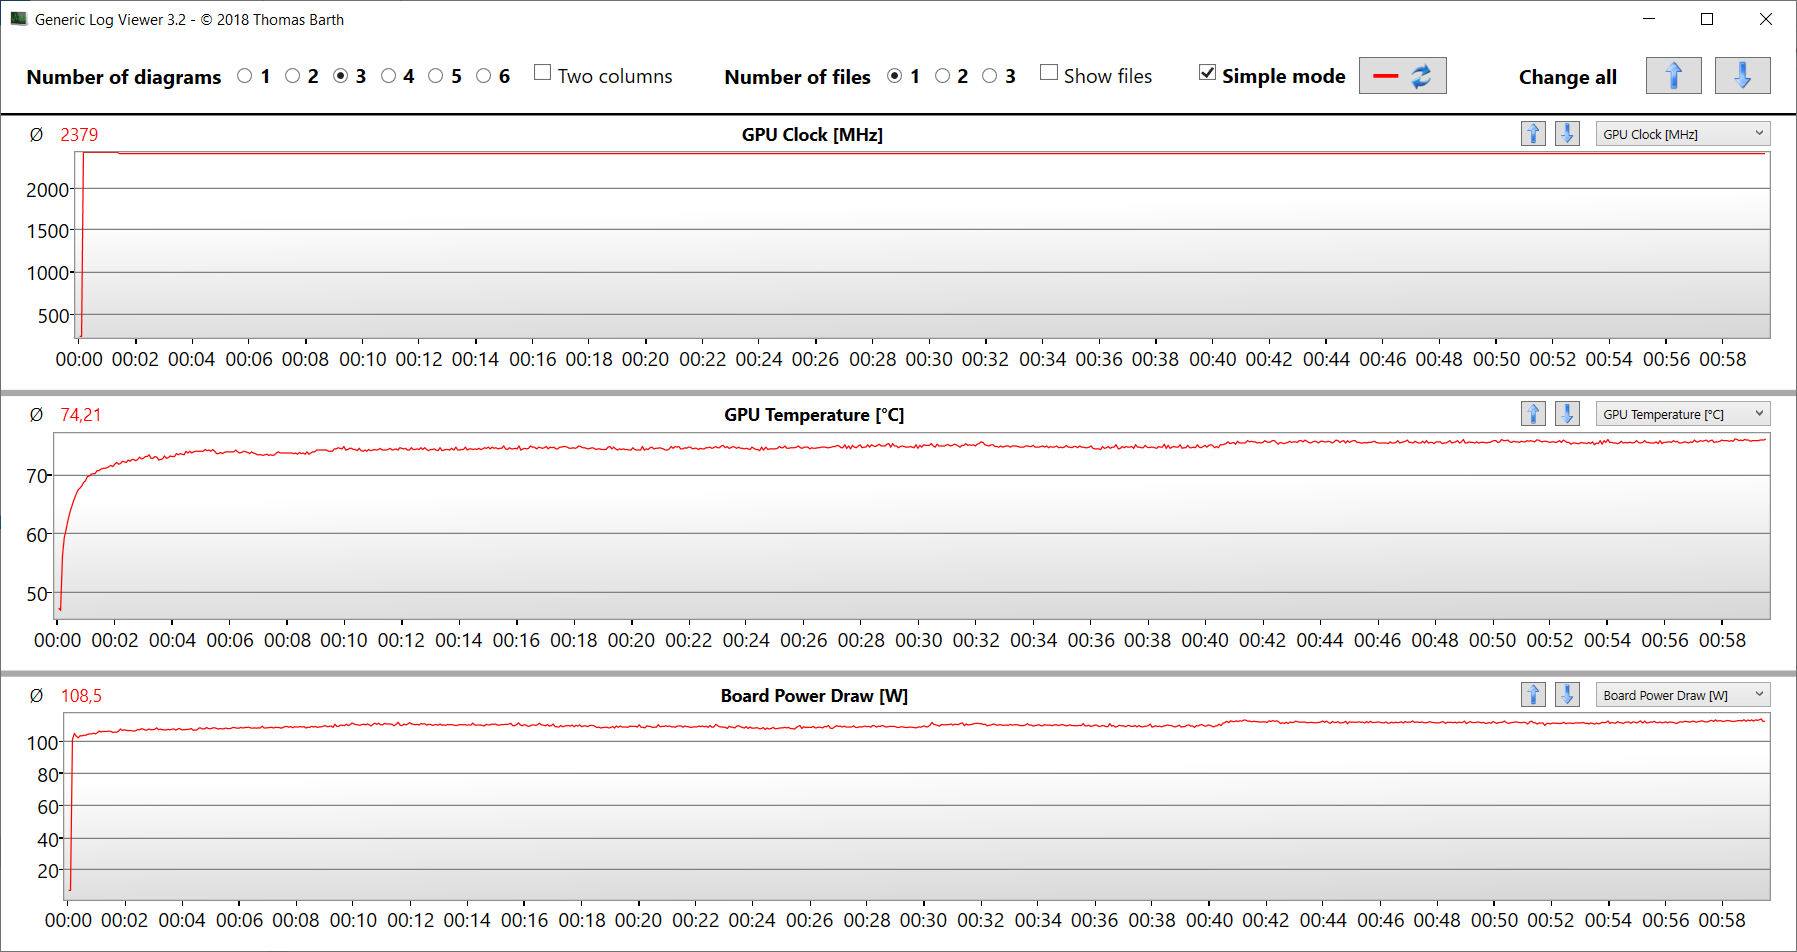
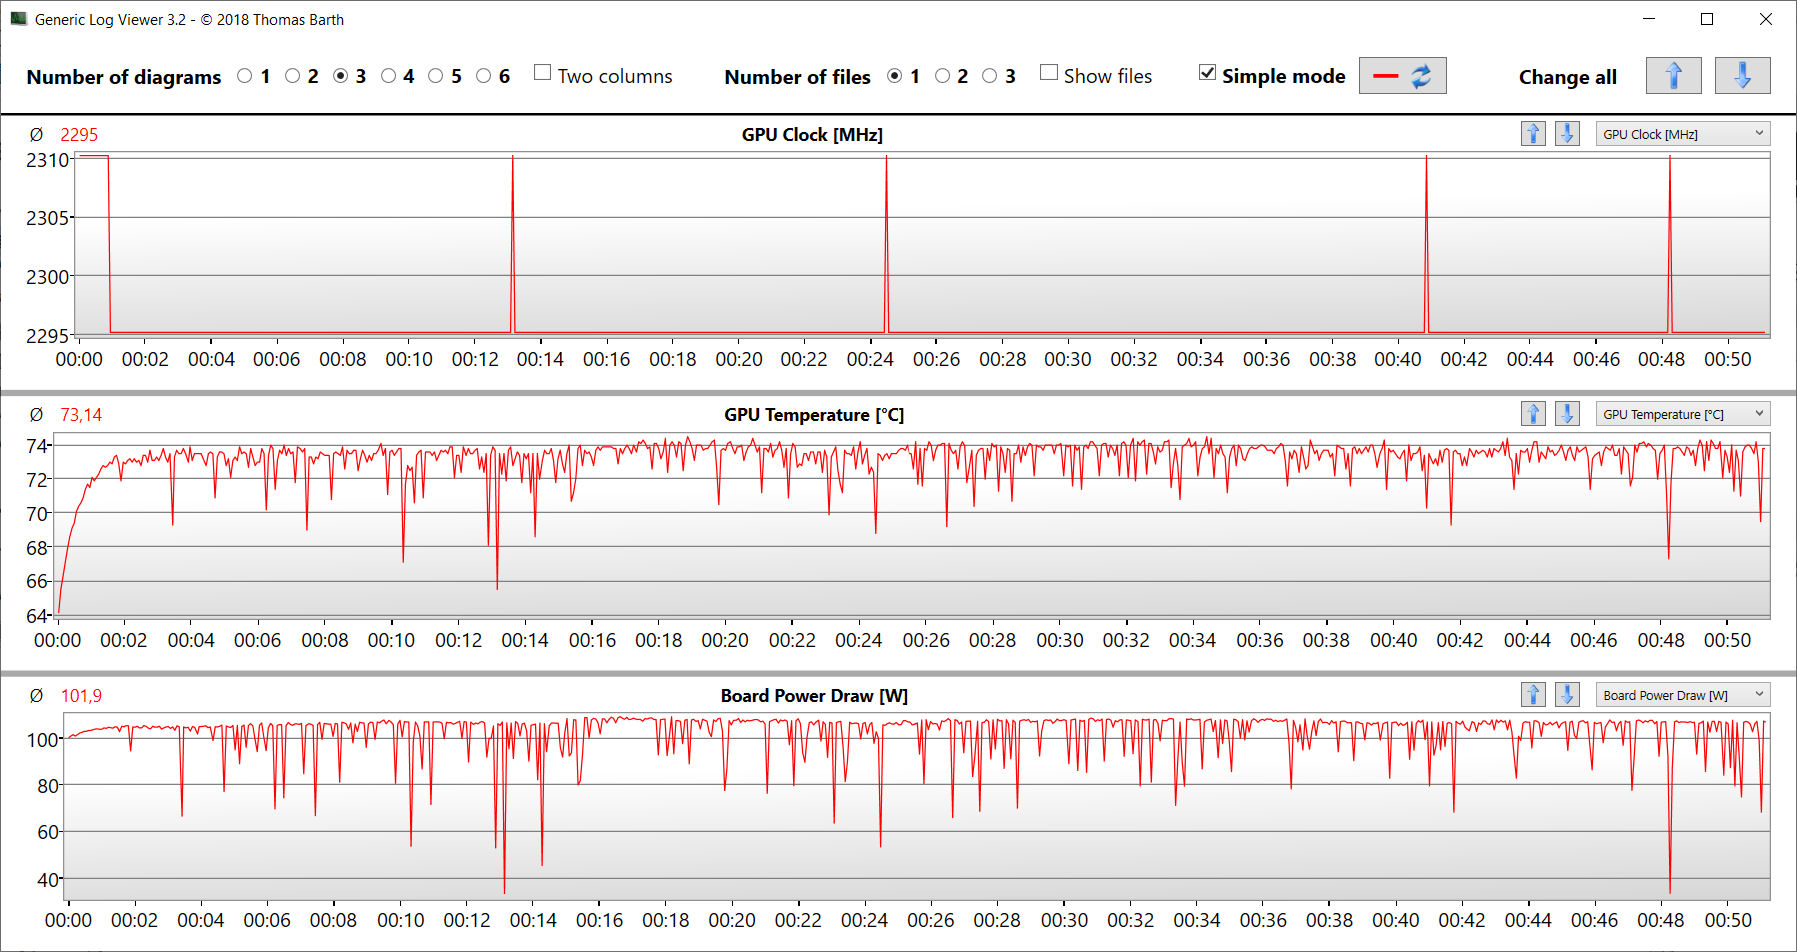
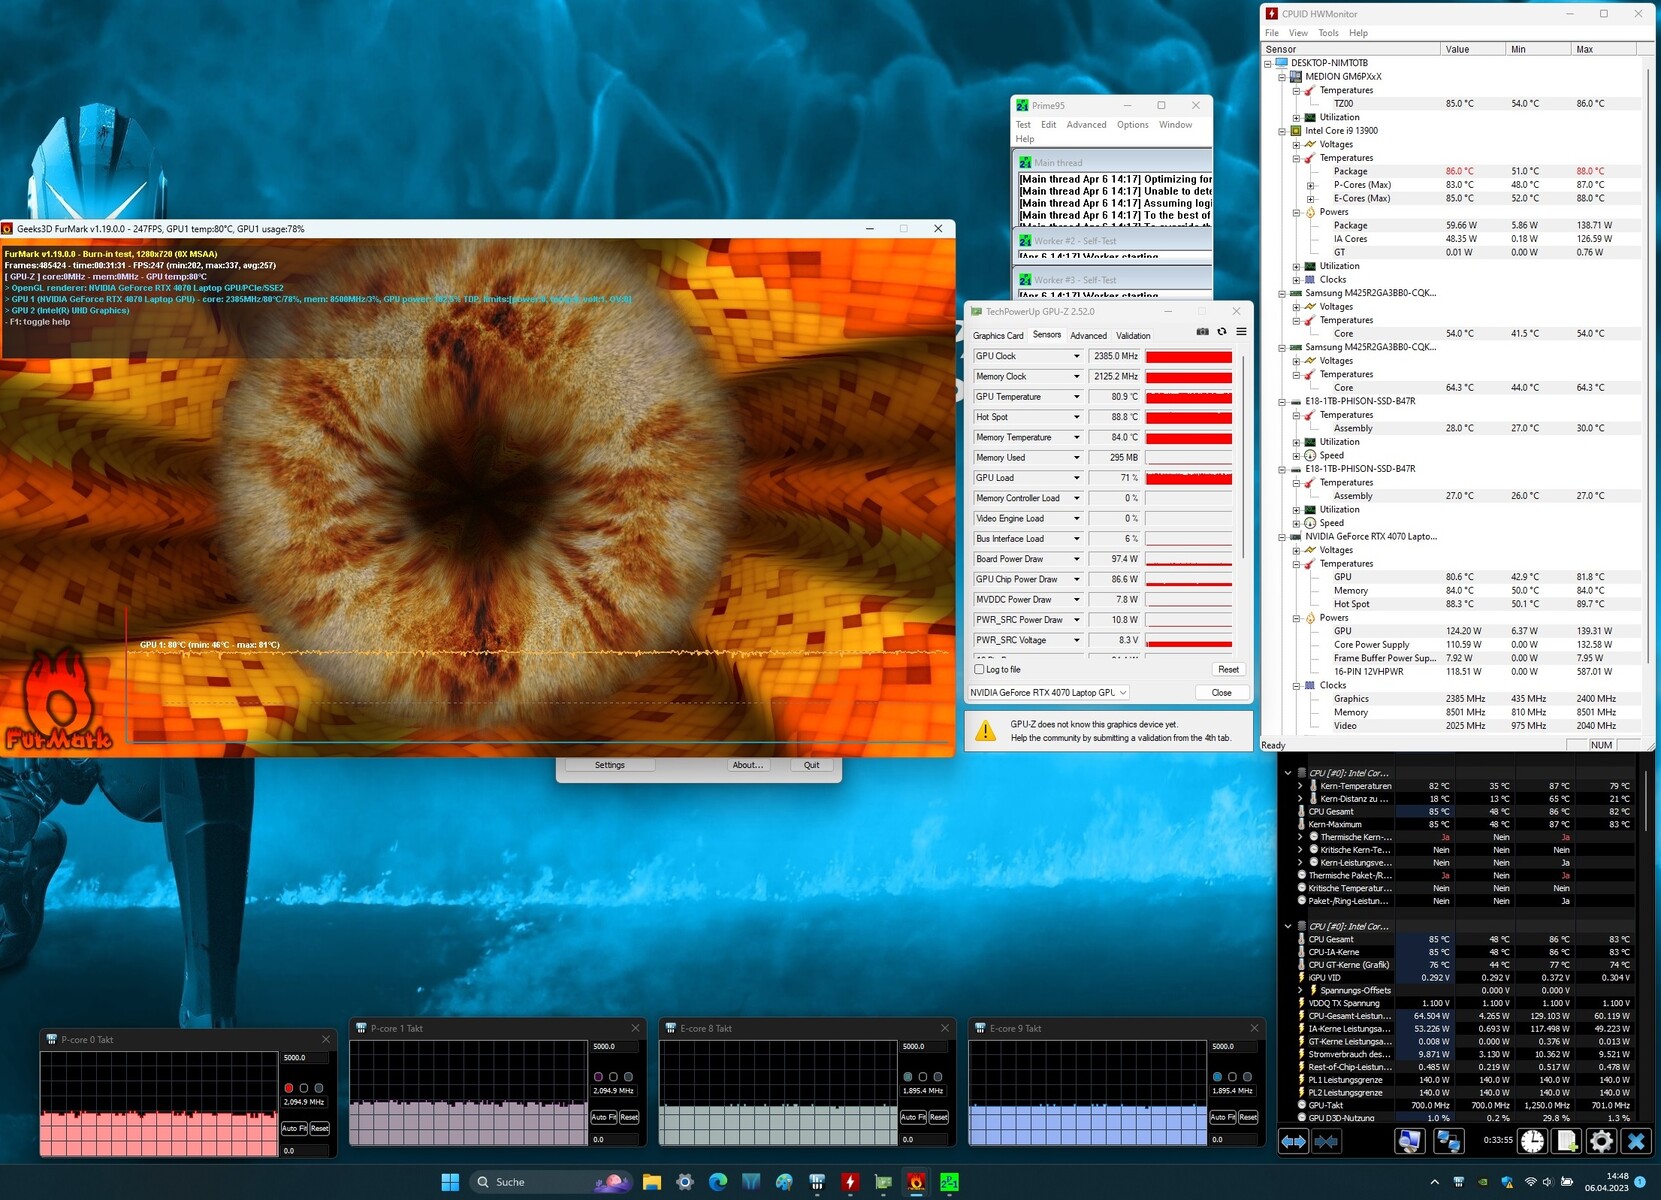
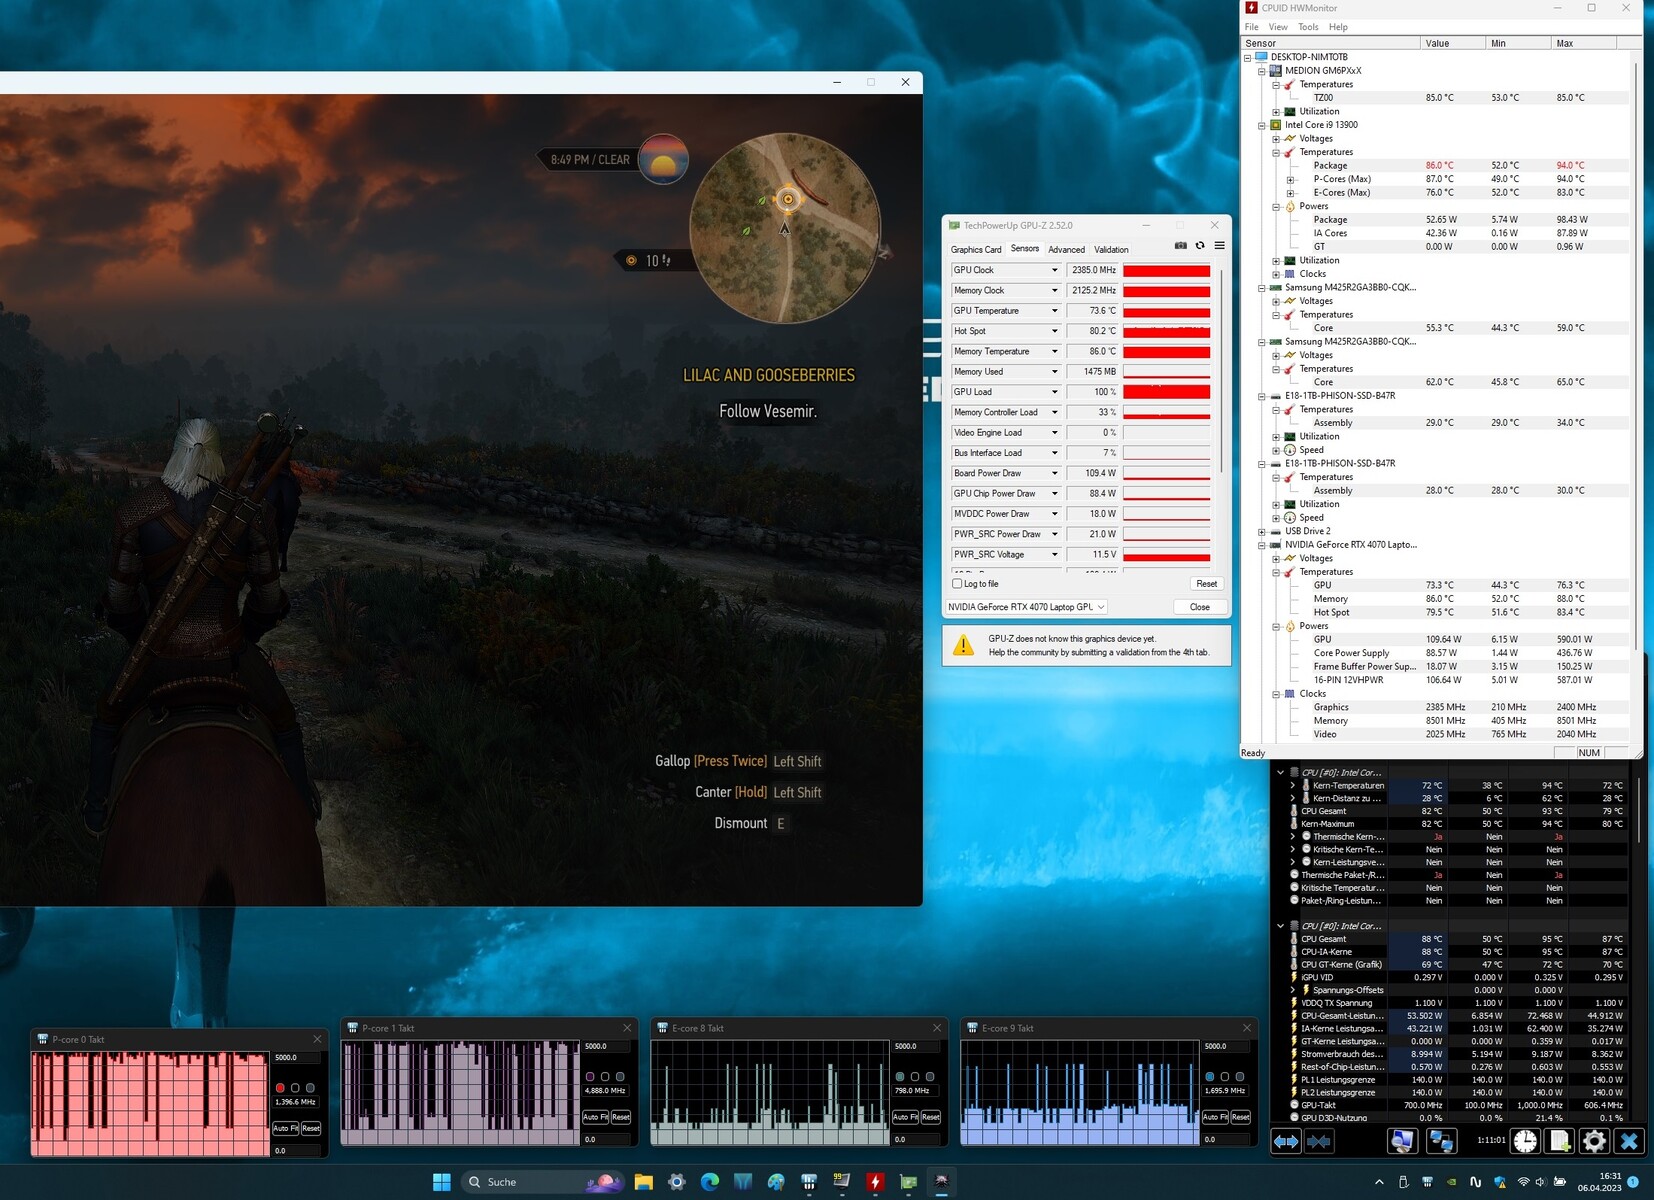
压力测试
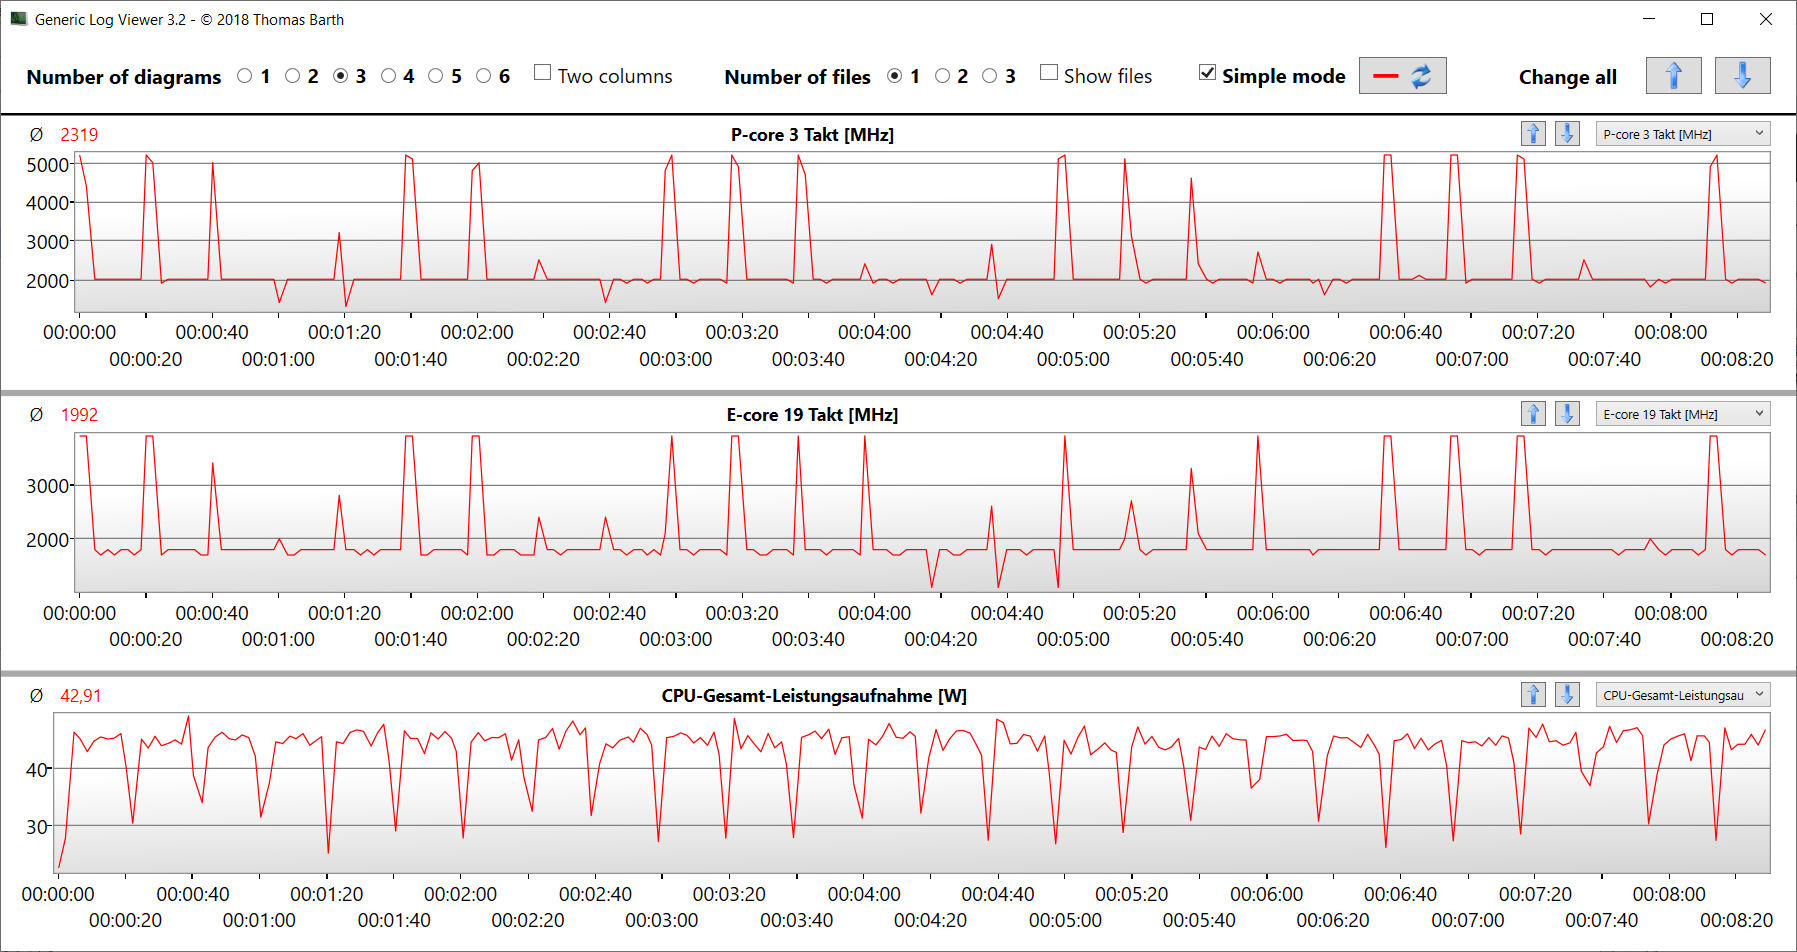
压力测试(Prime95和Furmark连续运行)代表了测试系统在全负荷下稳定性的极端情况。CPU以高时钟频率开始测试(P:4 GHz,E:3.3 GHz),而GPU以1.5至2 GHz的速度启动。在最初的5分钟内,CPU时钟逐渐下降到2至2.4 GHz(P核)和1.9至2.1 GHz(E核)。同时,GPU时钟增加到2.3至2.4GHz。
发言人
立体声扬声器产生非常体面的声音,但可以使用更多的低音。建议使用耳机或外部扬声器以获得更好的音质。
Medion Erazer Major X20 audio analysis
(+) | speakers can play relatively loud (86 dB)
Bass 100 - 315 Hz
(±) | reduced bass - on average 11.9% lower than median
(±) | linearity of bass is average (9.7% delta to prev. frequency)
Mids 400 - 2000 Hz
(+) | balanced mids - only 3.7% away from median
(+) | mids are linear (4.7% delta to prev. frequency)
Highs 2 - 16 kHz
(+) | balanced highs - only 2.3% away from median
(+) | highs are linear (3.4% delta to prev. frequency)
Overall 100 - 16.000 Hz
(+) | overall sound is linear (10.4% difference to median)
Compared to same class
» 6% of all tested devices in this class were better, 2% similar, 92% worse
» The best had a delta of 6%, average was 18%, worst was 132%
Compared to all devices tested
» 5% of all tested devices were better, 1% similar, 93% worse
» The best had a delta of 4%, average was 23%, worst was 134%
Aorus 15X ASF audio analysis
(+) | speakers can play relatively loud (83 dB)
Bass 100 - 315 Hz
(-) | nearly no bass - on average 27.3% lower than median
(-) | bass is not linear (15.1% delta to prev. frequency)
Mids 400 - 2000 Hz
(±) | higher mids - on average 5.8% higher than median
(+) | mids are linear (4.8% delta to prev. frequency)
Highs 2 - 16 kHz
(+) | balanced highs - only 3.1% away from median
(+) | highs are linear (6.3% delta to prev. frequency)
Overall 100 - 16.000 Hz
(±) | linearity of overall sound is average (20.1% difference to median)
Compared to same class
» 71% of all tested devices in this class were better, 6% similar, 23% worse
» The best had a delta of 6%, average was 18%, worst was 132%
Compared to all devices tested
» 52% of all tested devices were better, 8% similar, 40% worse
» The best had a delta of 4%, average was 23%, worst was 134%
能源管理 - Medion X20的运行时间很短
消耗功率
Medion笔记本在能源消耗方面没有显示任何异常。对于所安装的硬件来说,这些比率处于正常水平。Witcher 3 测试和压力测试以相对稳定的耗电率运行。因此,电源(330瓦)的大小是足够的。
| Off / Standby | |
| Idle | |
| Load |
|
Key:
min: | |
| Medion Erazer Major X20 i9-13900HX, GeForce RTX 4070 Laptop GPU | Aorus 15X ASF i7-13700HX, GeForce RTX 4070 Laptop GPU | Razer Blade 15 OLED (Early 2022) i9-12900H, GeForce RTX 3070 Ti Laptop GPU | Asus ROG Strix G17 G713PI R9 7945HX, GeForce RTX 4070 Laptop GPU | Average NVIDIA GeForce RTX 4070 Laptop GPU | Average of class Gaming | |
|---|---|---|---|---|---|---|
| Power Consumption | 7% | -46% | -6% | 6% | 0% | |
| Idle Minimum * (Watt) | 12 | 11 8% | 31.6 -163% | 15 -25% | 13.2 ? -10% | 13 ? -8% |
| Idle Average * (Watt) | 16 | 16 -0% | 33.3 -108% | 20 -25% | 18.2 ? -14% | 19 ? -19% |
| Idle Maximum * (Watt) | 26 | 24 8% | 38.6 -48% | 29 -12% | 24.6 ? 5% | 24.6 ? 5% |
| Load Average * (Watt) | 115 | 104 10% | 149 -30% | 121 -5% | 97 ? 16% | 110.7 ? 4% |
| Witcher 3 ultra * (Watt) | 191.6 | 185.4 3% | 149.6 22% | 179.8 6% | ||
| Load Maximum * (Watt) | 319 | 272 15% | 160 50% | 246 23% | 221 ? 31% | 259 ? 19% |
* ... smaller is better
Energieaufnahme Witcher 3 / Stresstest
Power consumption with an external monitor
电池寿命
在WLAN测试中,这台16英寸笔记本的运行时间分别为3:52小时和4:12小时(使用脚本加载网站)和视频测试(短片Big Buck Bunny,H.264编码,FHD,循环进行)。在这两项测试中,笔记本的节能功能被停用,显示亮度被设置为150cd/m²左右。在视频测试中,无线电模块也被停用了。
总体上低于平均水平的运行时间是由于游戏笔记本的电池容量低(62.3Wh)。如果使用前代产品的80Wh电池,可能会有更多的时间。 前代产品的80瓦特电池可以实现更多。.
| Medion Erazer Major X20 i9-13900HX, GeForce RTX 4070 Laptop GPU, 62.3 Wh | Aorus 15X ASF i7-13700HX, GeForce RTX 4070 Laptop GPU, 99 Wh | Razer Blade 15 OLED (Early 2022) i9-12900H, GeForce RTX 3070 Ti Laptop GPU, 80 Wh | Asus ROG Strix G17 G713PI R9 7945HX, GeForce RTX 4070 Laptop GPU, 90 Wh | Average of class Gaming | |
|---|---|---|---|---|---|
| Battery runtime | 80% | 26% | -20% | 54% | |
| Reader / Idle (h) | 5.8 | 11.3 95% | 6.7 16% | 8.27 ? 43% | |
| H.264 (h) | 4.2 | 7.9 88% | 5.9 40% | 2.8 -33% | 8.32 ? 98% |
| WiFi v1.3 (h) | 3.9 | 8.2 110% | 4.6 18% | 4.3 10% | 7.11 ? 82% |
| Load (h) | 1.6 | 2 25% | 2.1 31% | 1 -37% | 1.502 ? -6% |
| Witcher 3 ultra (h) | 1.1 |
Pros
Cons
判决:大量的设备

这款强大的笔记本能够实现QHD+游戏,但在其他方面也很出色。A 酷睿i9-13900HX和一个 GeForce RTX 4070在持续的高时钟速率下运行,两个1TB的固态硬盘确保短的加载时间和足够的存储空间。噪声和热量发展在高范围内,是这种笔记本级别的典型。
在Erazer Major X20中,Medion展示了一个装备精良的中端游戏笔记本,没有任何严重的弱点。
前一个型号的chiclet键盘已经让位给机械模型(Cherry MX开关,RGB独立按键照明)--这是一个重大的改进。不熟悉这种键盘的用户将发现一种新的打字体验。
哑光的16英寸屏幕(QHD+,IPS,240赫兹,G-Sync,sRGB)采用适合工作的16:10格式,总体上给人以良好的印象。一个Thunderbolt 4端口确保了扩展选项(外部GPU、扩展坞解决方案、显示器),但不支持Power Delivery。电池运行时间也不令人印象深刻。
这款 Aorus 15X ASF是一个替代品,其运行时间明显更好。它提供与X20相同的图形性能,但CPU功率较小。
价格和可用性
Medion Erazer Major X20的审查配置在Medion的网上商店上市,价格略低于2,500欧元,但目前已售罄。目前,该机型在德国以外地区的供应似乎有限。
Medion Erazer Major X20
- 04/20/2023 v7 (old)
Sascha Mölck
Transparency
The selection of devices to be reviewed is made by our editorial team. The test sample was provided to the author as a loan by the manufacturer or retailer for the purpose of this review. The lender had no influence on this review, nor did the manufacturer receive a copy of this review before publication. There was no obligation to publish this review. As an independent media company, Notebookcheck is not subjected to the authority of manufacturers, retailers or publishers.
This is how Notebookcheck is testing
Every year, Notebookcheck independently reviews hundreds of laptops and smartphones using standardized procedures to ensure that all results are comparable. We have continuously developed our test methods for around 20 years and set industry standards in the process. In our test labs, high-quality measuring equipment is utilized by experienced technicians and editors. These tests involve a multi-stage validation process. Our complex rating system is based on hundreds of well-founded measurements and benchmarks, which maintains objectivity. Further information on our test methods can be found here.
Price comparison

