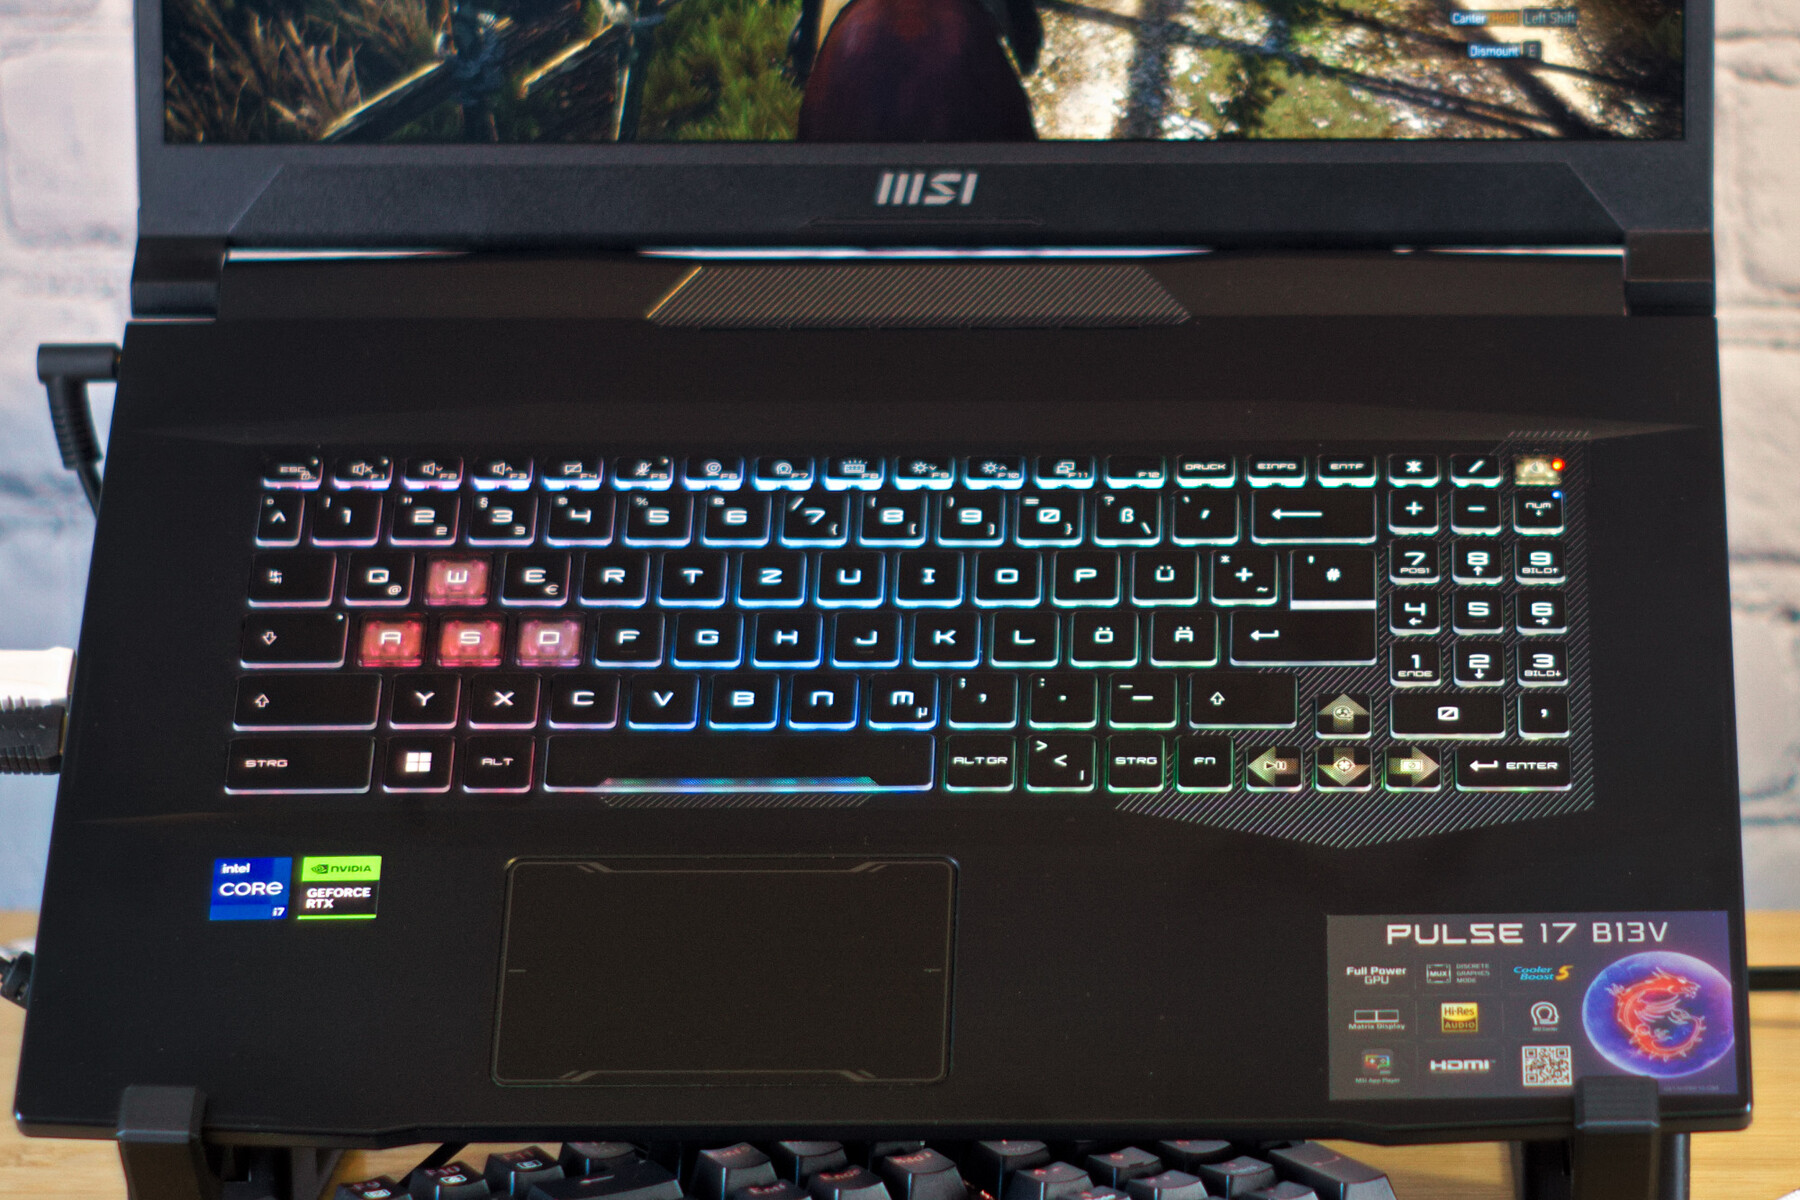
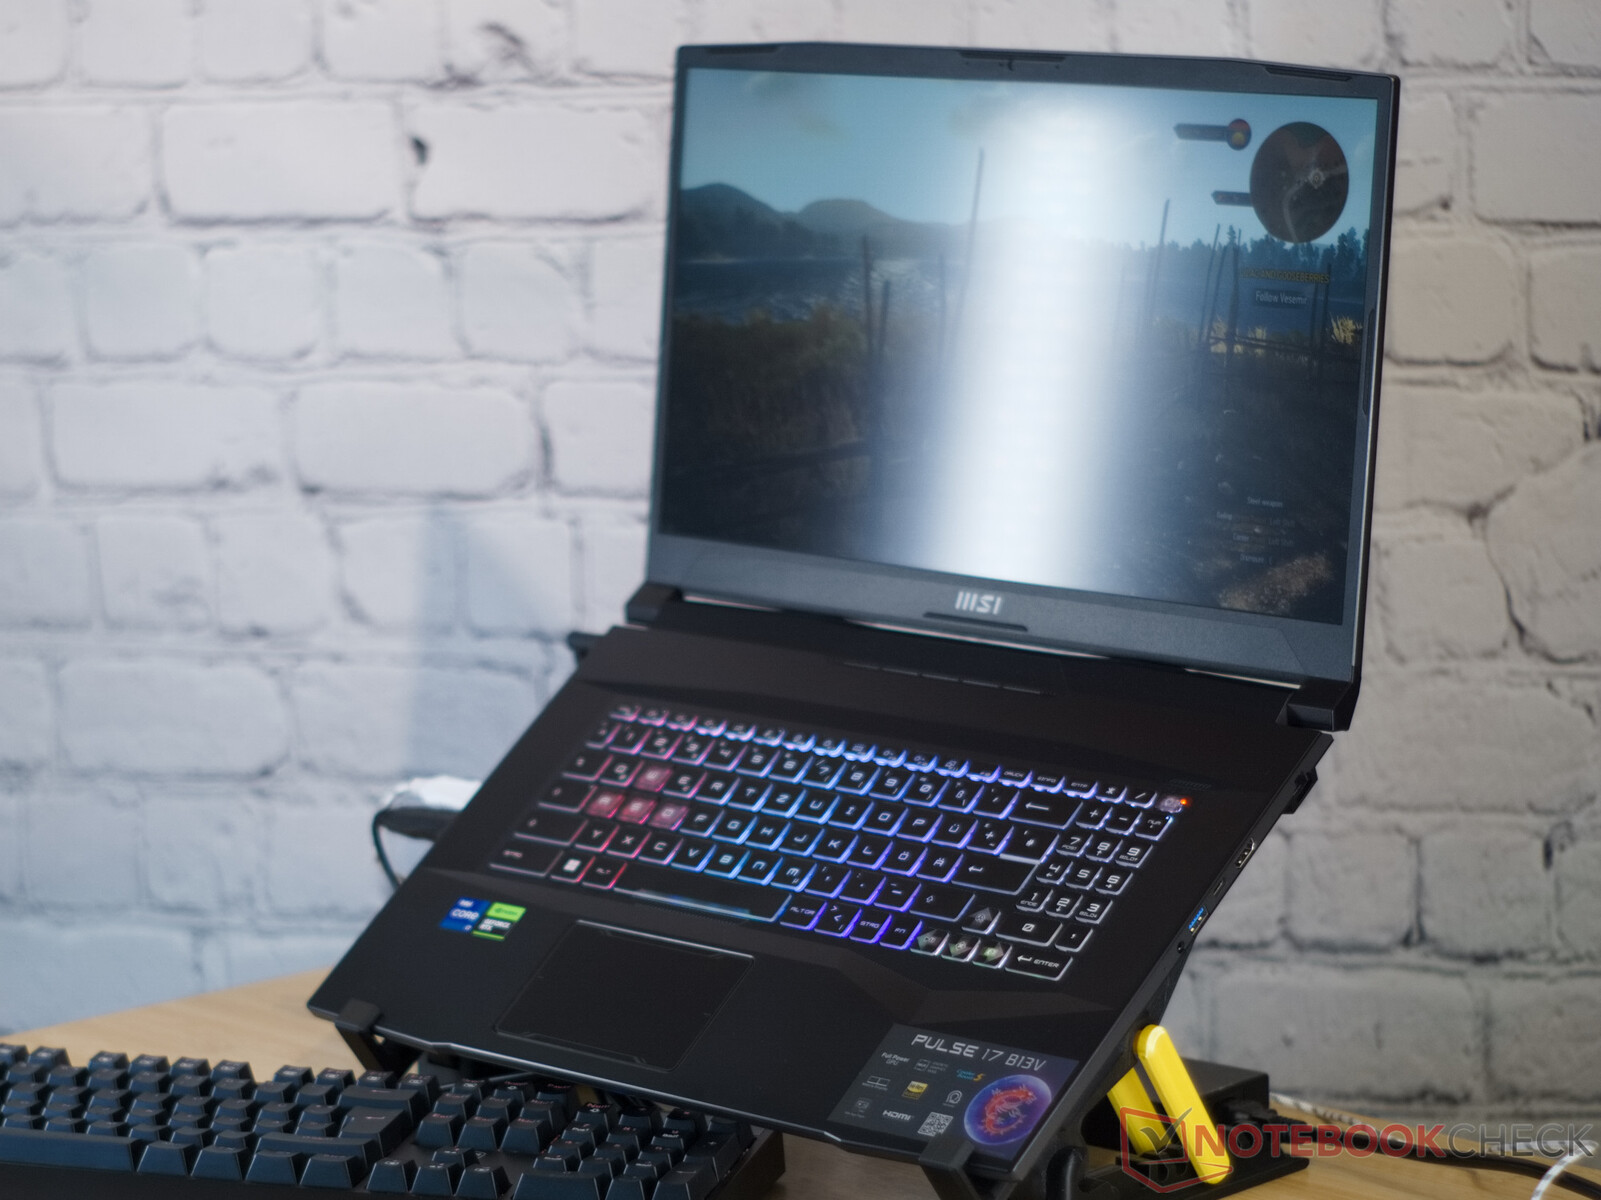
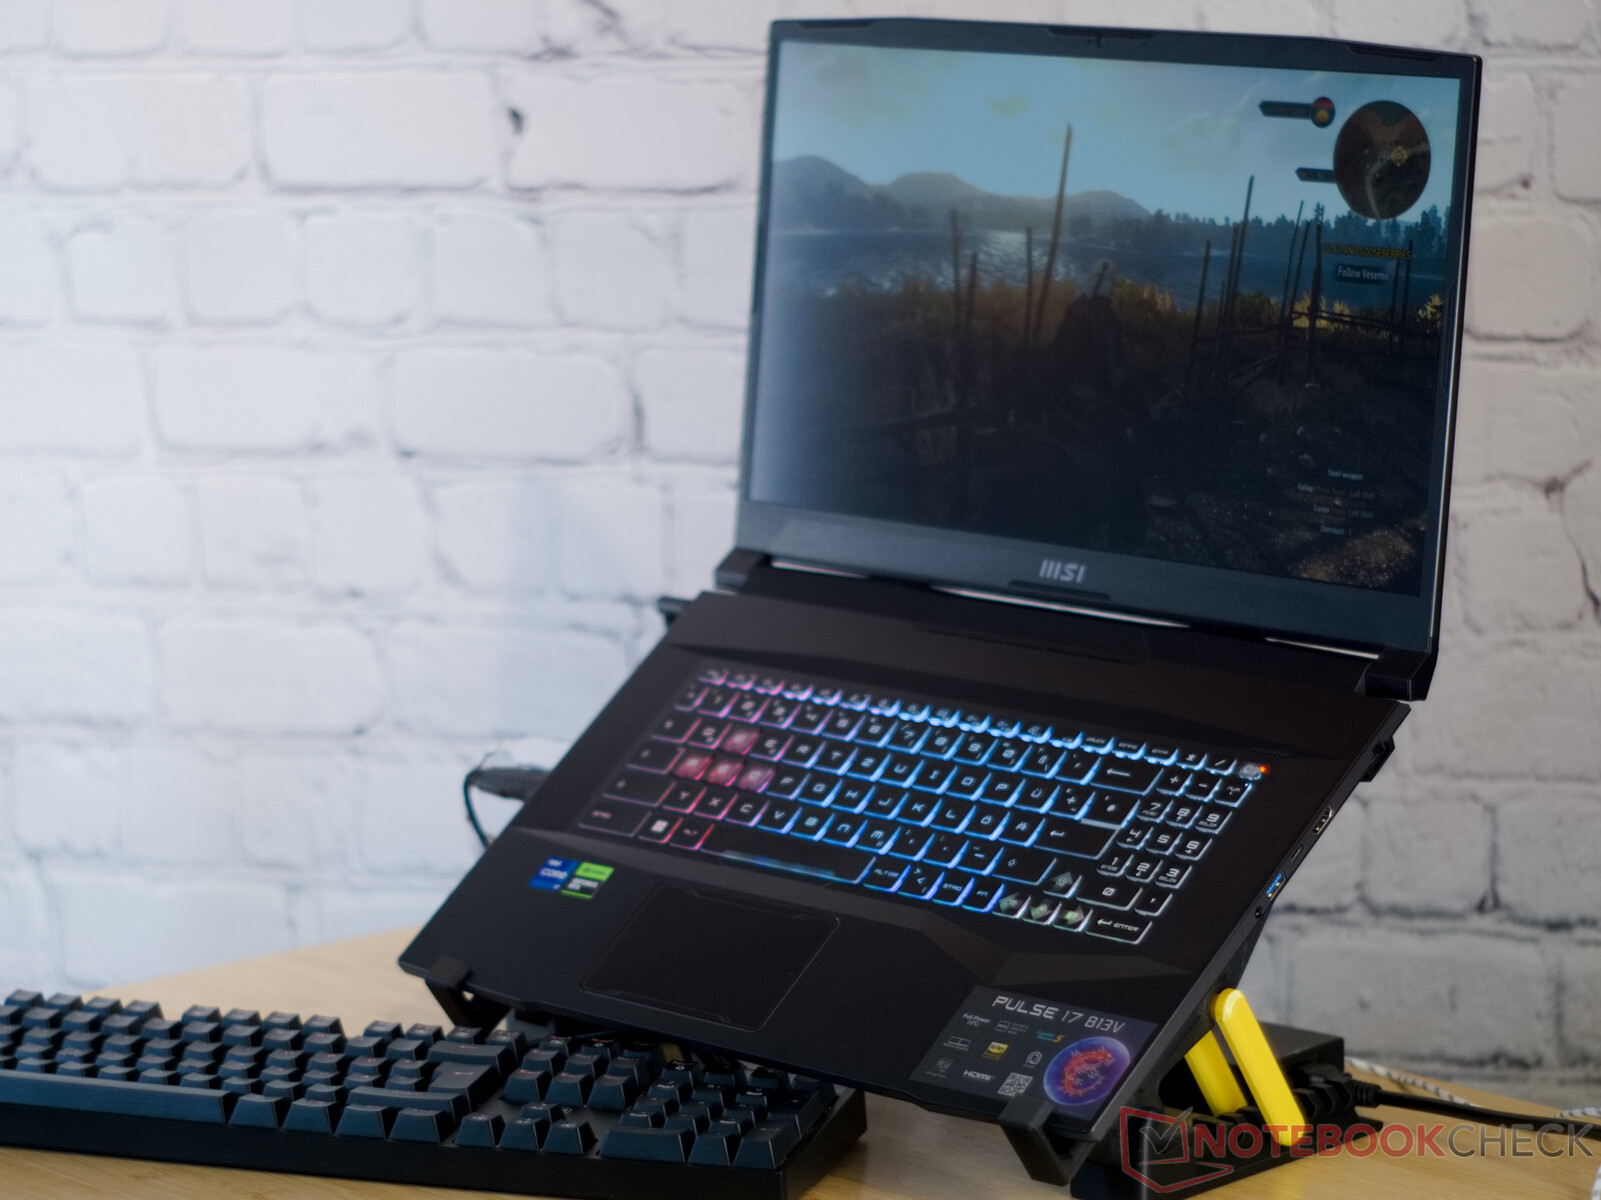
微星Pulse 17 B13V游戏笔记本评测:拥有安静的翅膀
随着微星Pulse 17的推出,"红龙 "带来了一款外观让人联想到科幻小说的游戏笔记本电脑。这种印象来自于阳极氧化铝制成的显示屏盖、许多边缘和角落,甚至是17英寸笔记本电脑底部的蜂窝状网格。但在笔记本电脑内部运行的是当前的组件,我们的测试机配备了 英特尔酷睿i7-13700H和 英伟达GeForce RTX 4070.当我们 在年初测试前代产品时的性能令人信服。但我们也注意到,Pulse GL76缺少G-Sync、MUX、Advanced Optimus和Thunderbolt支持。这款游戏笔记本的风扇噪音水平也让人有理由抱怨。
微星现在已经对这款笔记本电脑进行了大幅改良,除了新的设计、芯片代次和神秘的名称之外,还引入了许多改进。我们将这款笔记本电脑与以下几款产品进行比较 华硕ROG Strix G17 G713PI蝚霈唳祉菔微星Katana 17 B13VFK和 申克 XMG Focus 17 (E23).
潜在的竞争对手比较
Rating | Date | Model | Weight | Height | Size | Resolution | Price |
|---|---|---|---|---|---|---|---|
| 86.3 % v7 (old) | 07 / 2023 | MSI Pulse 17 B13VGK i7-13700H, GeForce RTX 4070 Laptop GPU | 2.7 kg | 27.2 mm | 17.30" | 1920x1080 | |
| 83.2 % v7 (old) | 01 / 2023 | MSI Pulse GL76 12UGK i7-12700H, GeForce RTX 3070 Laptop GPU | 2.6 kg | 24.2 mm | 17.30" | 1920x1080 | |
| 82.1 % v7 (old) | 02 / 2023 | MSI Katana 17 B13VFK i7-13620H, GeForce RTX 4060 Laptop GPU | 2.8 kg | 25.2 mm | 17.30" | 1920x1080 | |
| 87.2 % v7 (old) | 07 / 2023 | Acer Nitro 17 AN17-51-71ER i7-13700H, GeForce RTX 4060 Laptop GPU | 3 kg | 30.3 mm | 17.30" | 2560x1440 | |
| 85.9 % v7 (old) | 06 / 2023 | Schenker XMG Focus 17 (E23) i9-13900HX, GeForce RTX 4070 Laptop GPU | 2.9 kg | 29.3 mm | 17.30" | 2560x1440 | |
| 88.4 % v7 (old) | 04 / 2023 | Asus ROG Strix G17 G713PI R9 7945HX, GeForce RTX 4070 Laptop GPU | 2.8 kg | 30.7 mm | 17.30" | 2560x1440 |
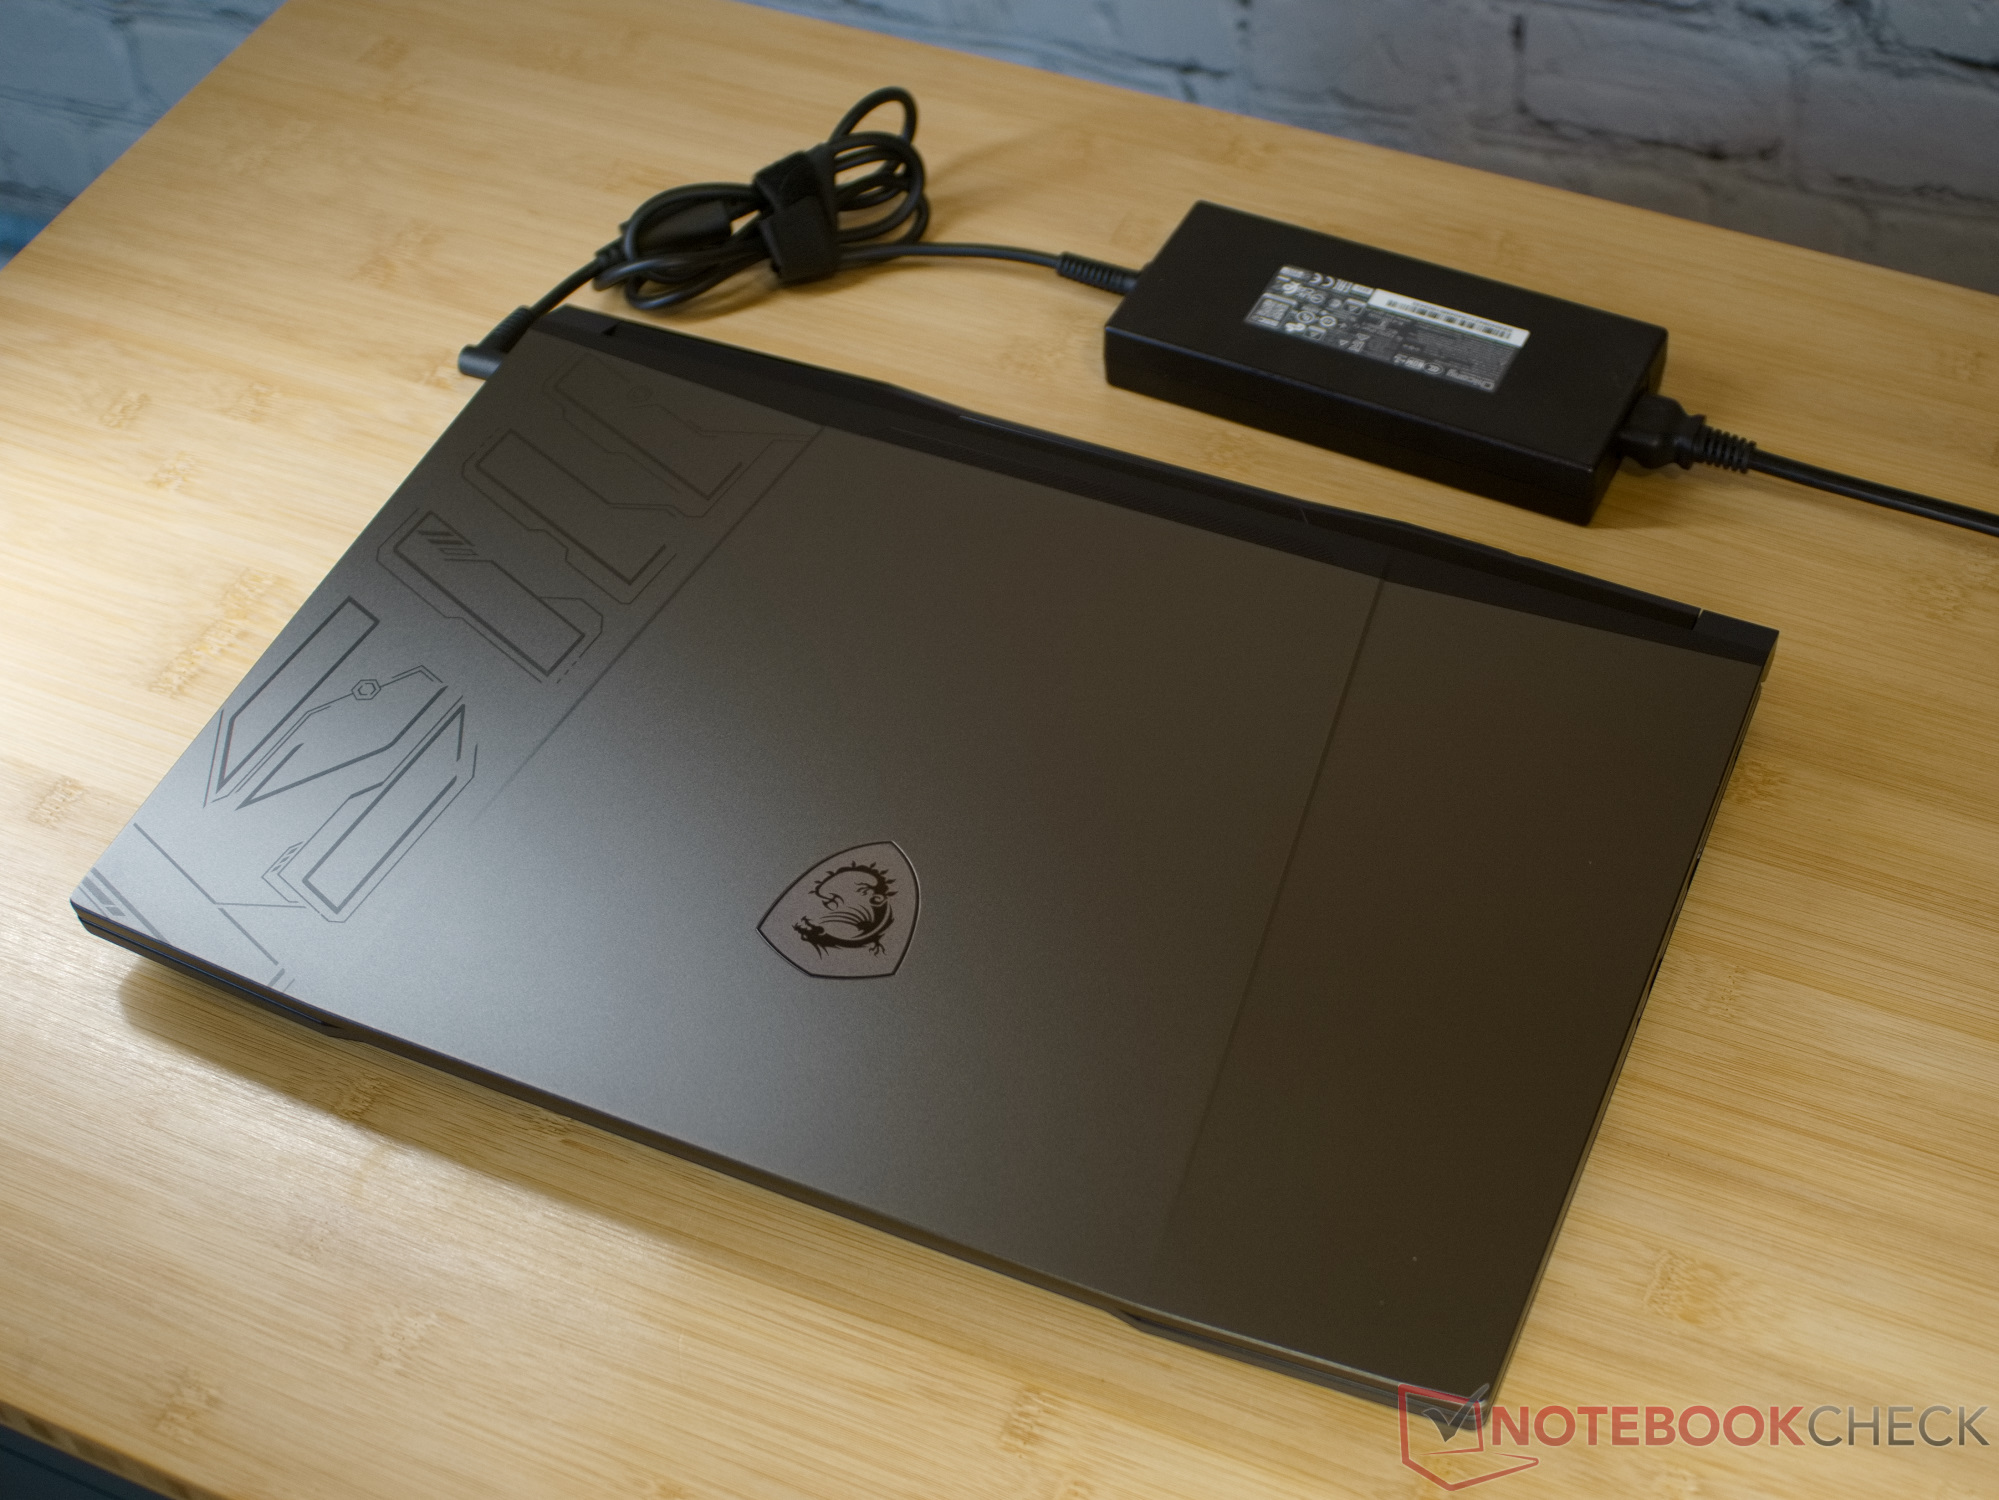
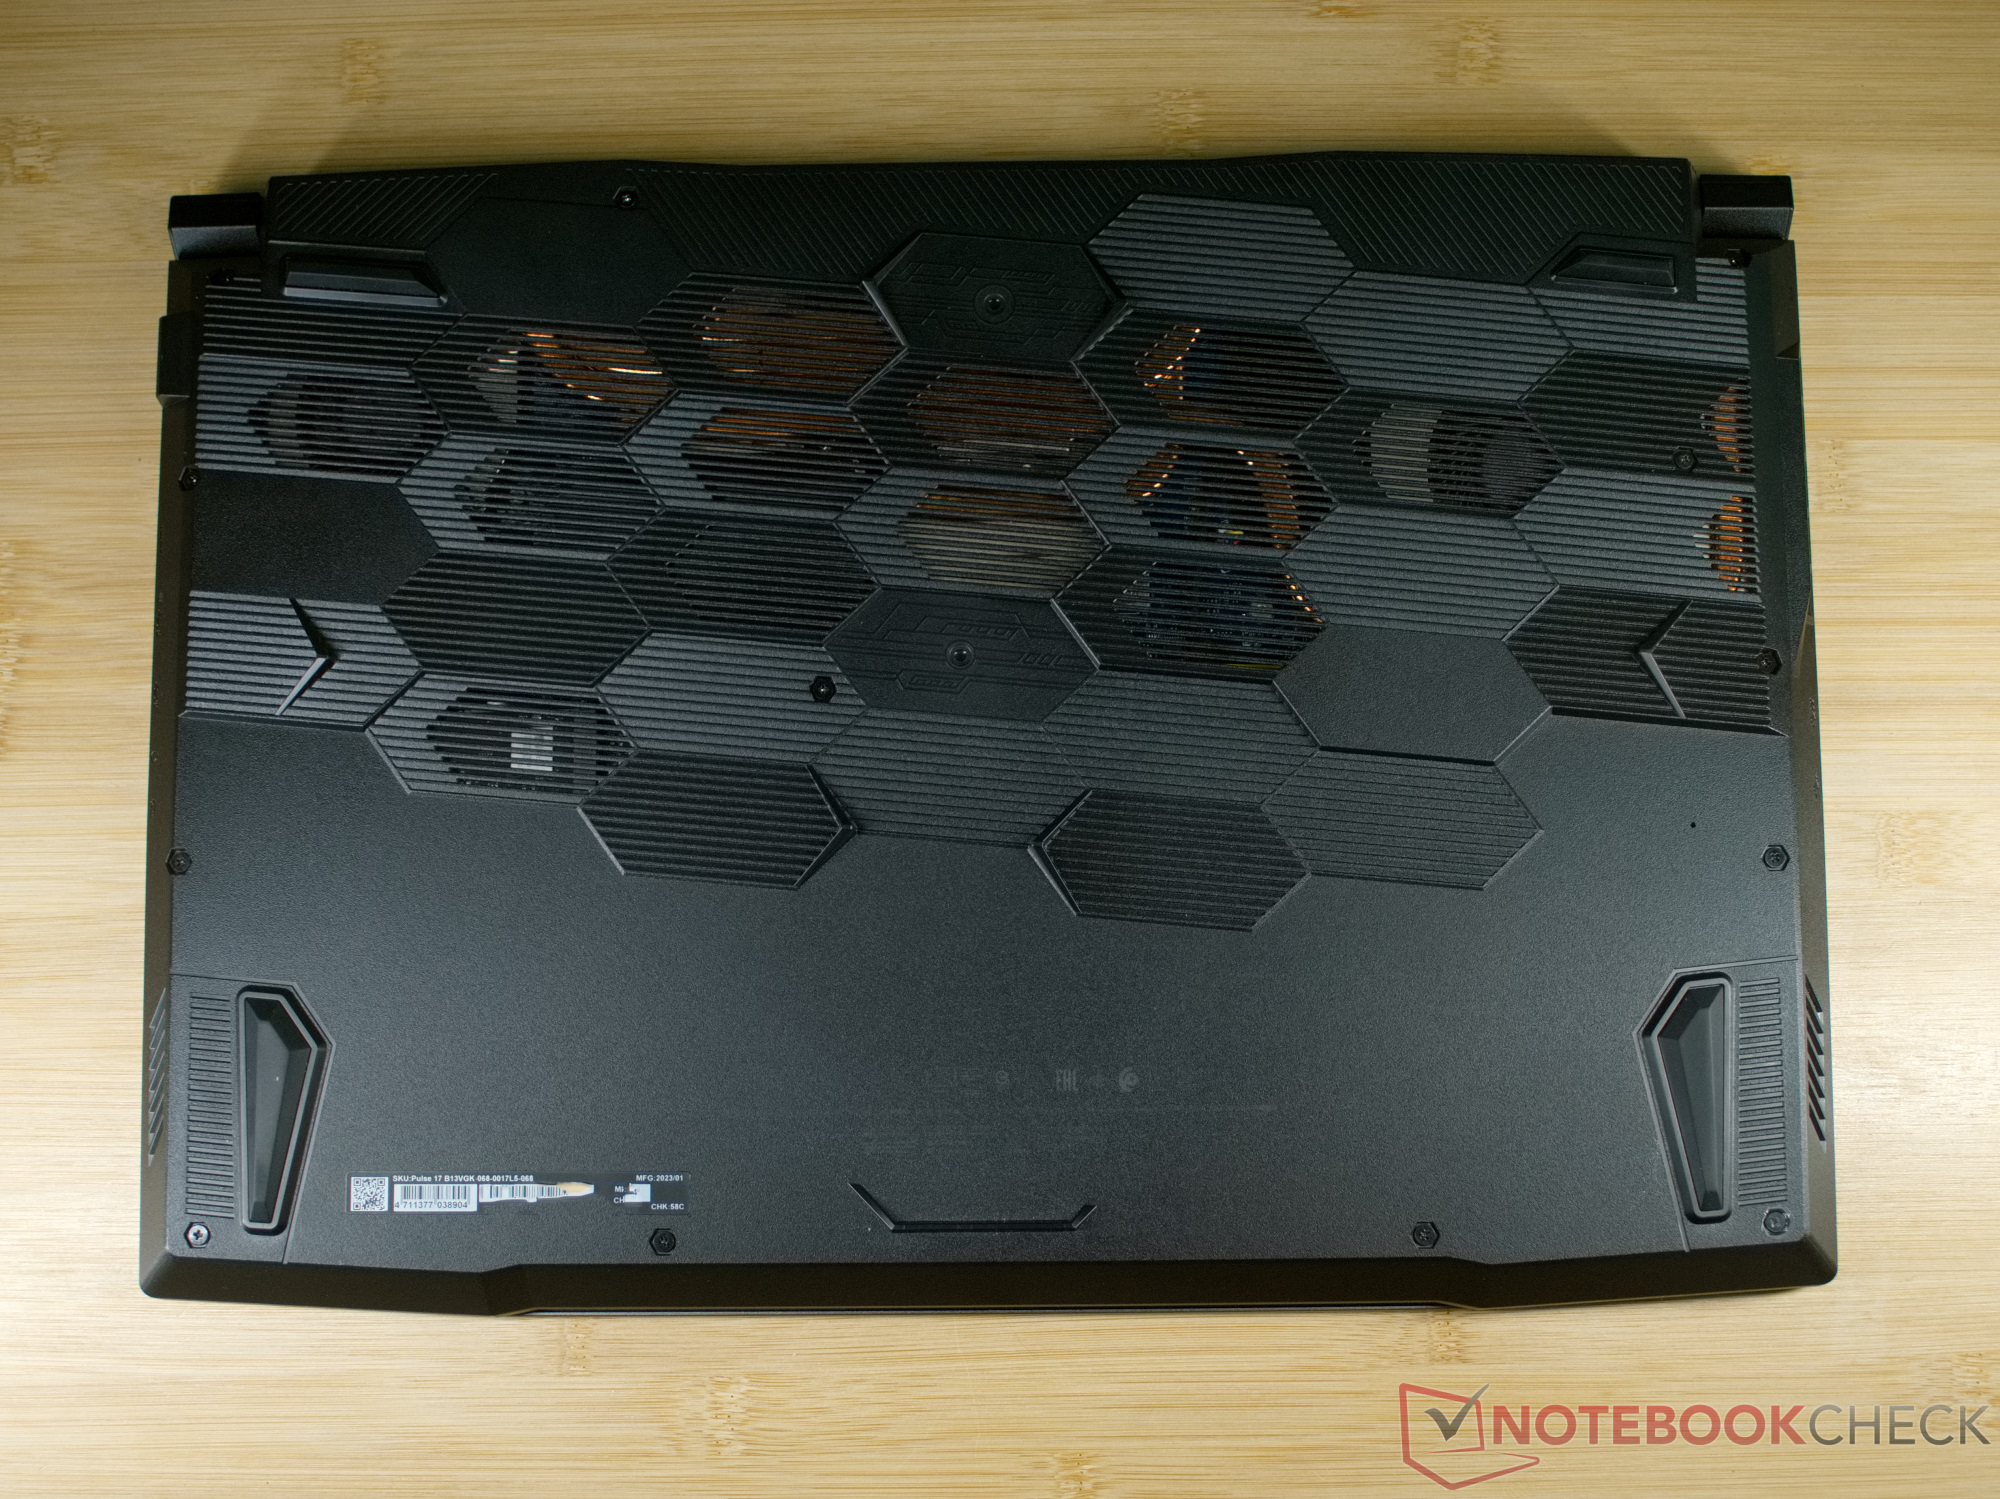
外壳 - 具有科幻外观的铝制展示盖
微星目前几乎所有的游戏笔记本电脑都采用了类似的设计理念。微星一次又一次地在显示屏盖子上使用了激进的线条,以及前卫的铰链和机箱底部的蜂窝状图案。在Pulse 17中,铝制的显示屏盖子被一些边缘装饰,给笔记本电脑增加了科幻感。 在盖子下方,微星也加入了许多设计元素,延续了未来主义的主题。
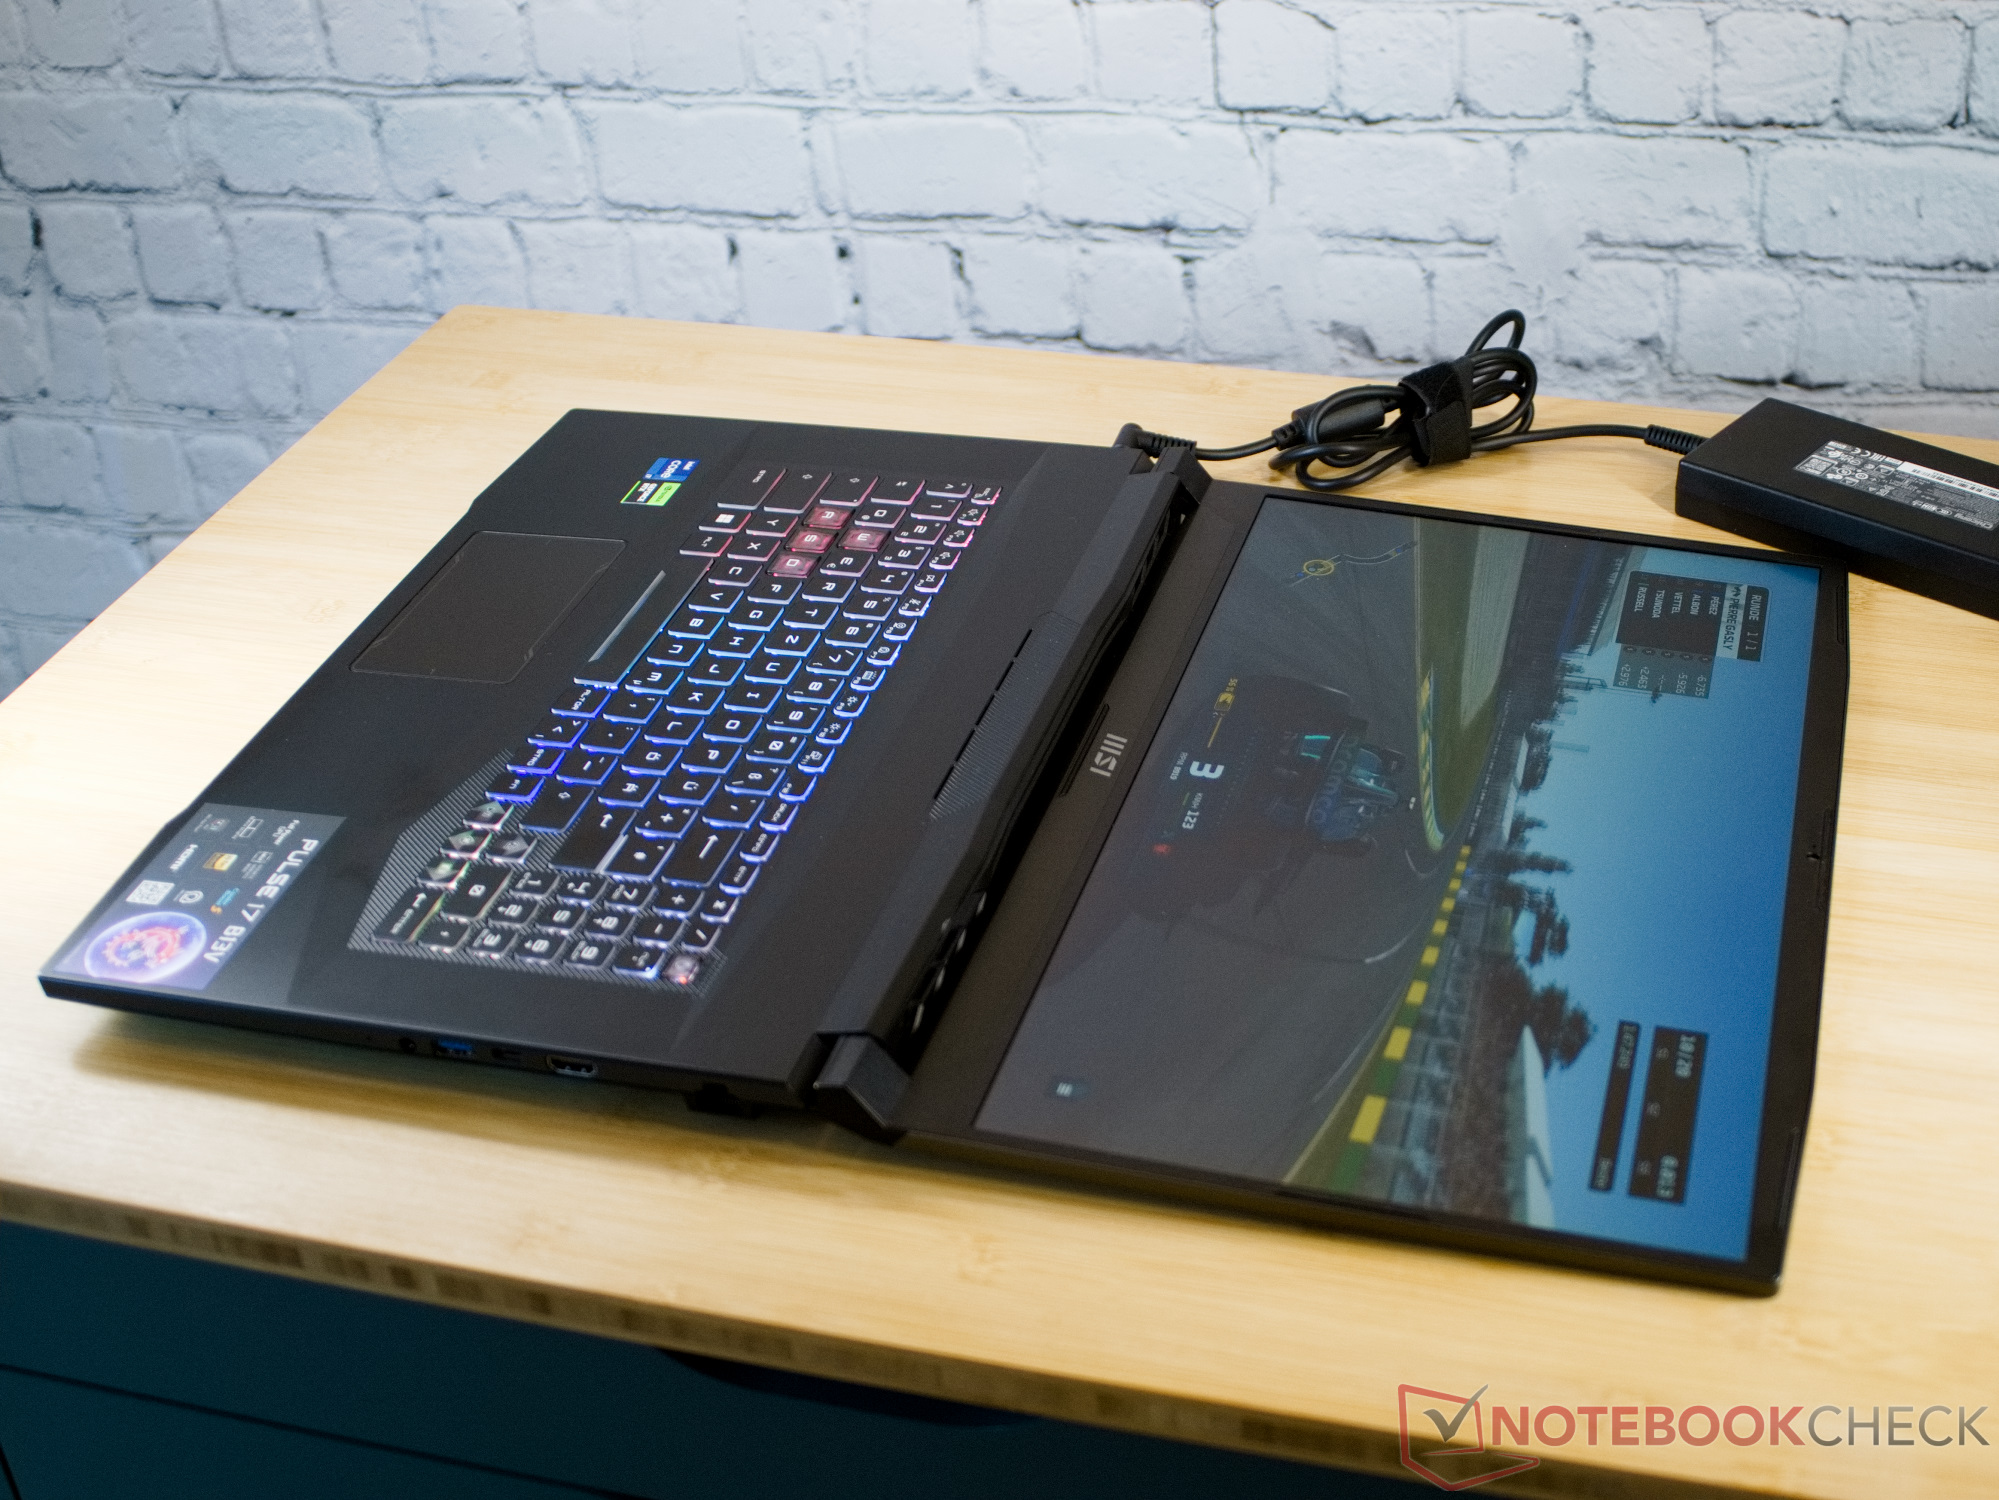
同时,微星Pulse 17的外壳相当坚固,但笔记本电脑的大尺寸也意味着它仍然有可能轻微翘曲或压入塑料元件。不过,Pulse 17整体上还是表现出了坚固的特性。大显示屏可以 180° 打开,并能在一定程度上保持其位置。铰链几乎很容易移动,轻微的震动或敲击显示屏都会使其稍有移动。
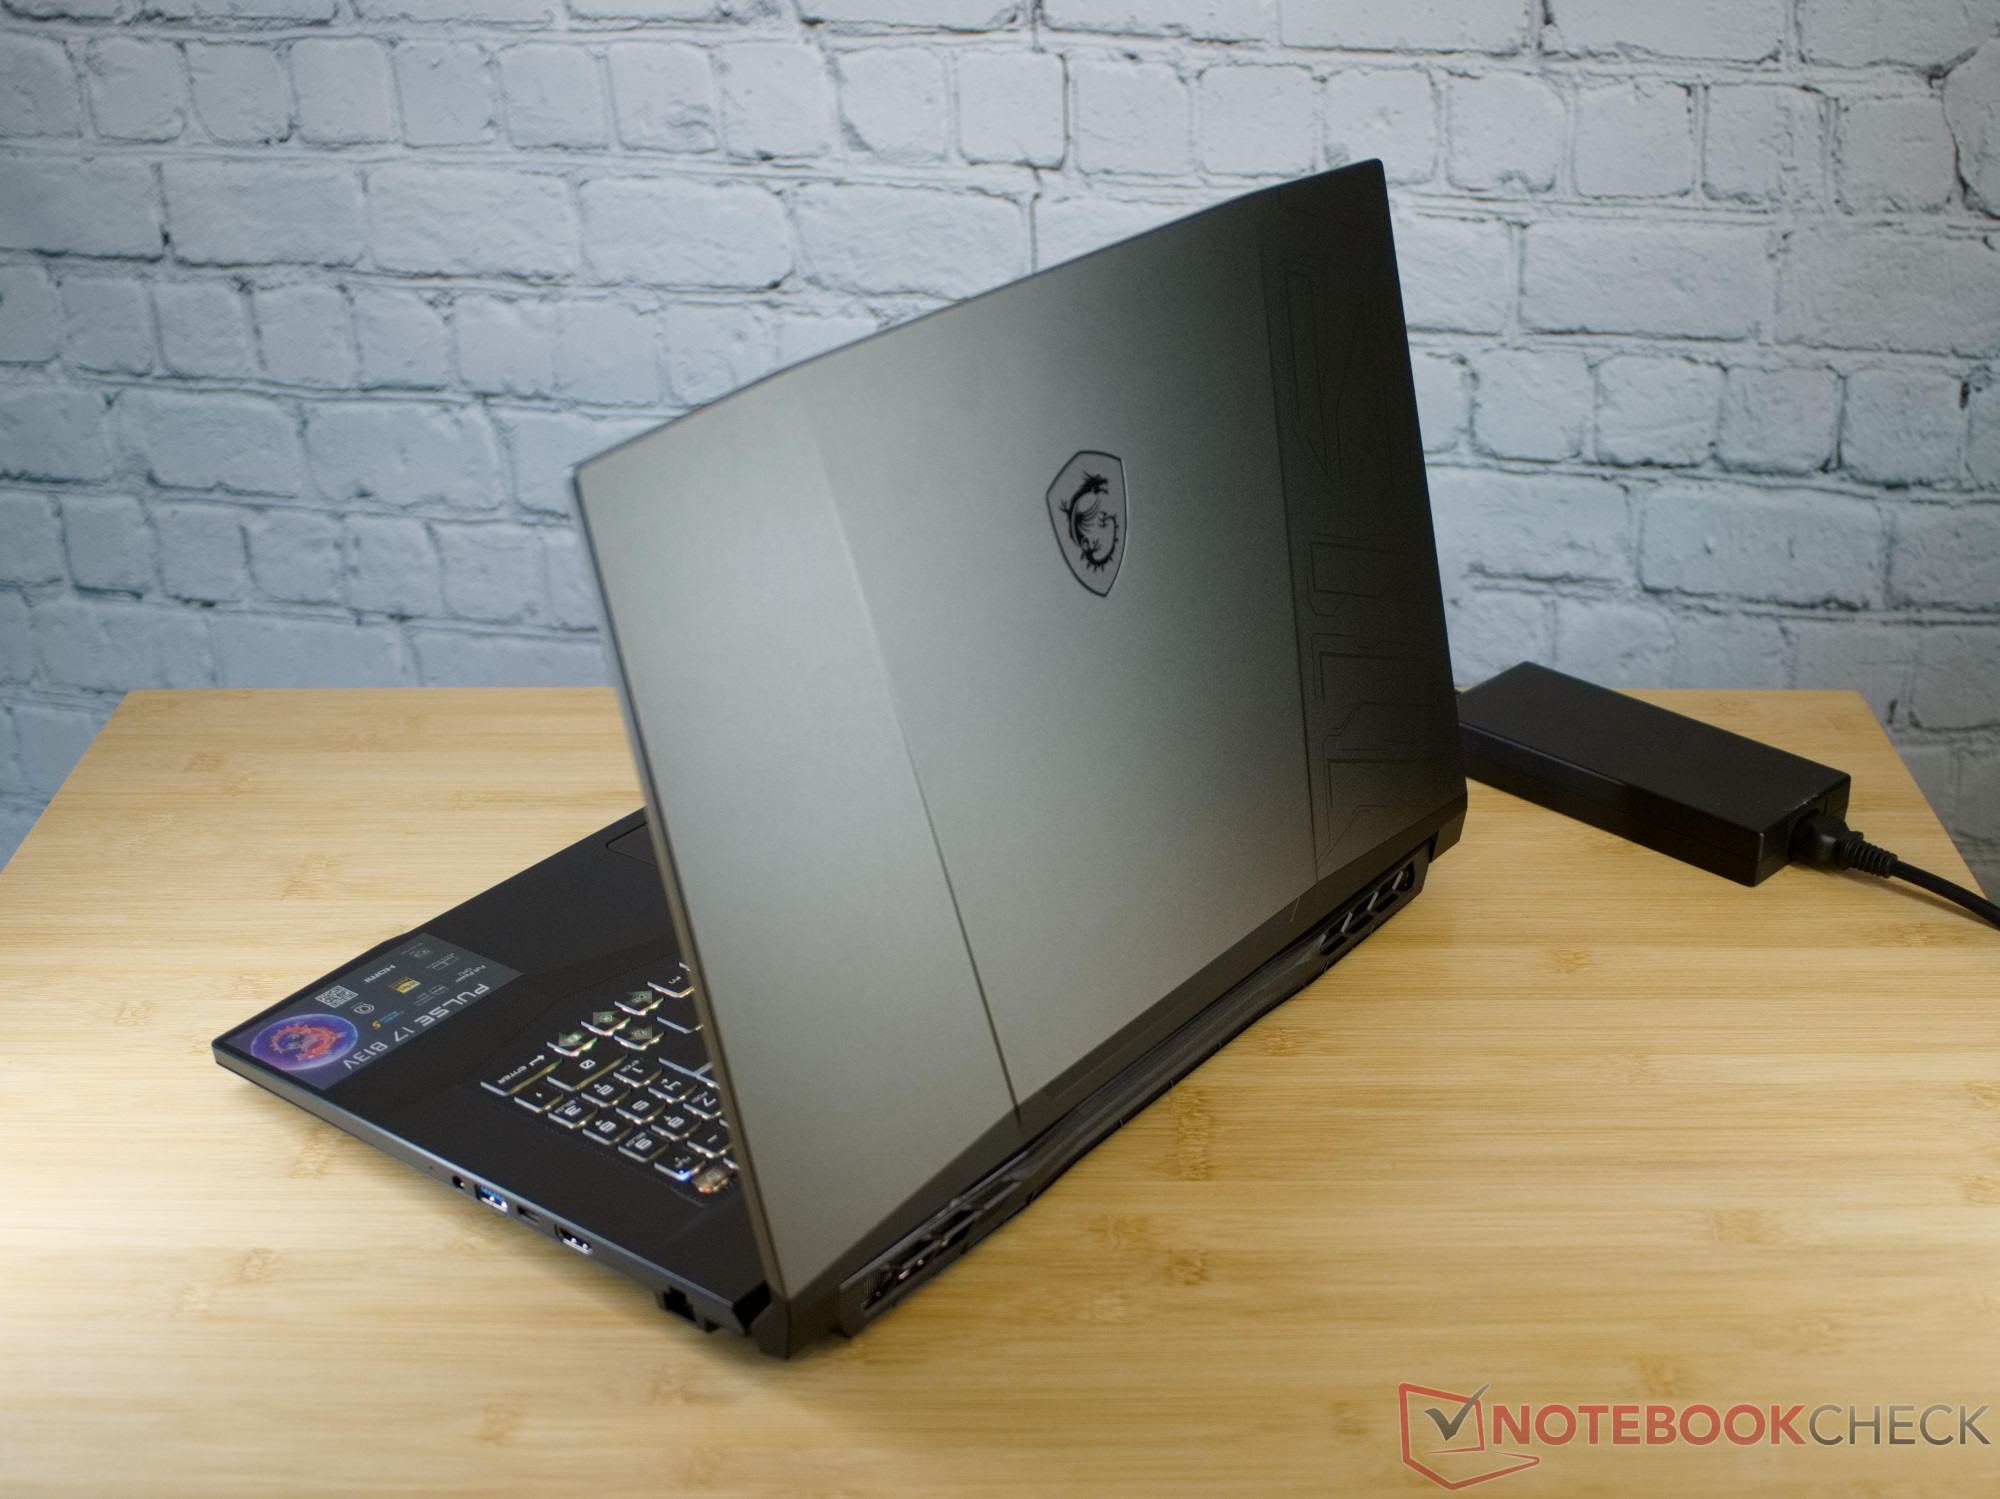
微星Pulse 17的重量为2.7千克(约6磅),在同等尺寸的竞争对手中是最轻的。 只有前代机型的重量更轻。除此之外,在我们的对比中,目前的游戏笔记本电脑在如何装载方面差别不大。
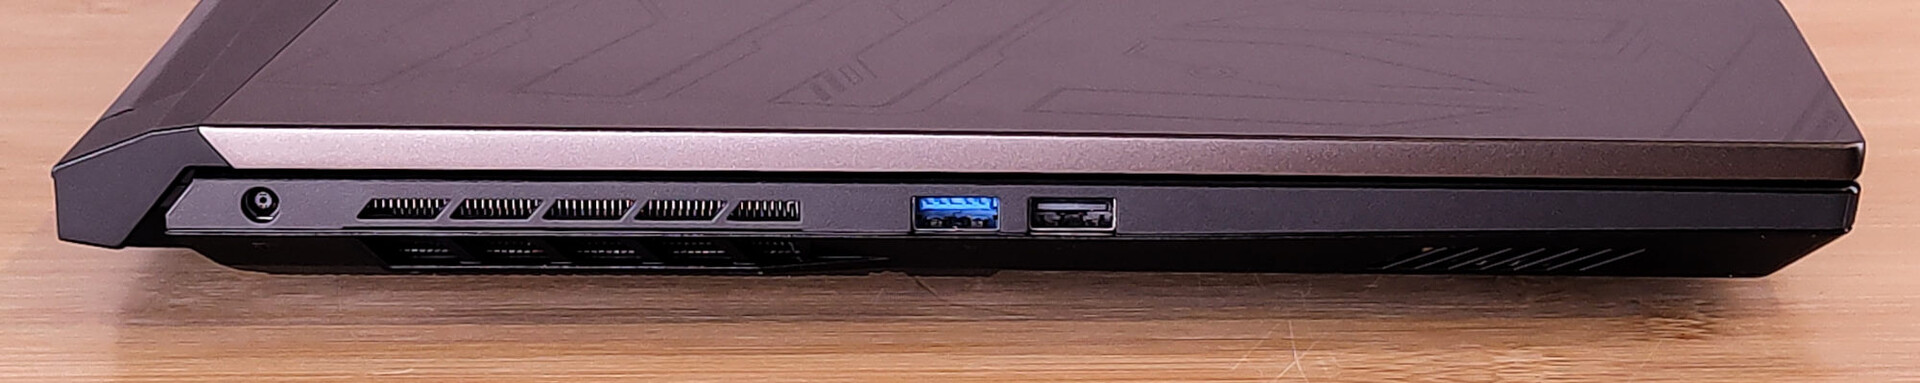
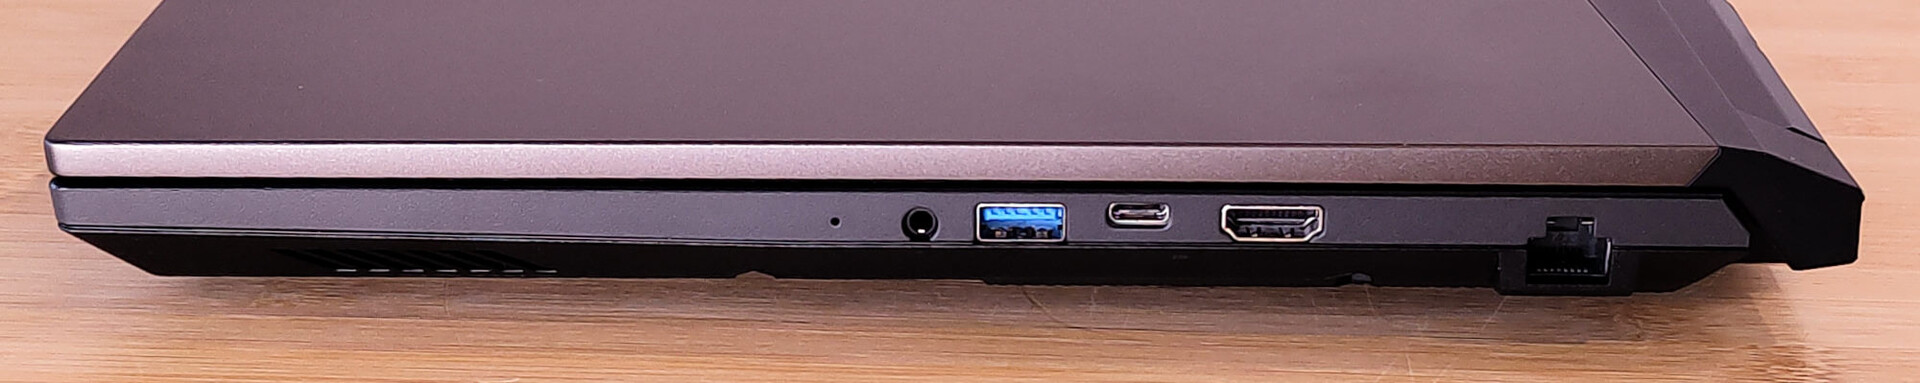
设备 - 无 Thunderbolt,仅有 USB 3.2 Gen 1
事实上,Pulse在两侧各提供了两个USB接口,这是一个巧妙的设计,让左右手用户都能避免线缆碍事。右侧的一个USB接口是USB-C连接,但遗憾的是它仅支持数据传输和DisplayPort。
通讯
通过英特尔AX201模块提供的千兆网卡和WiFi 6,Pulse 17在网络技术方面并没有真正跟上时代的步伐。另一方面,我们的测试设备显示,在5-GHz网络中也可以实现高速稳定的传输。
网络摄像头
微星Pulse 17的网络摄像头也不尽人意。该摄像头提供高清分辨率,在对比度较高的边缘会产生色差较大的模糊图像。


配件
除了常见的文件、印有红龙的贴纸和笔记本电脑的充电器外,我们在包装盒中没有找到任何其他配件。
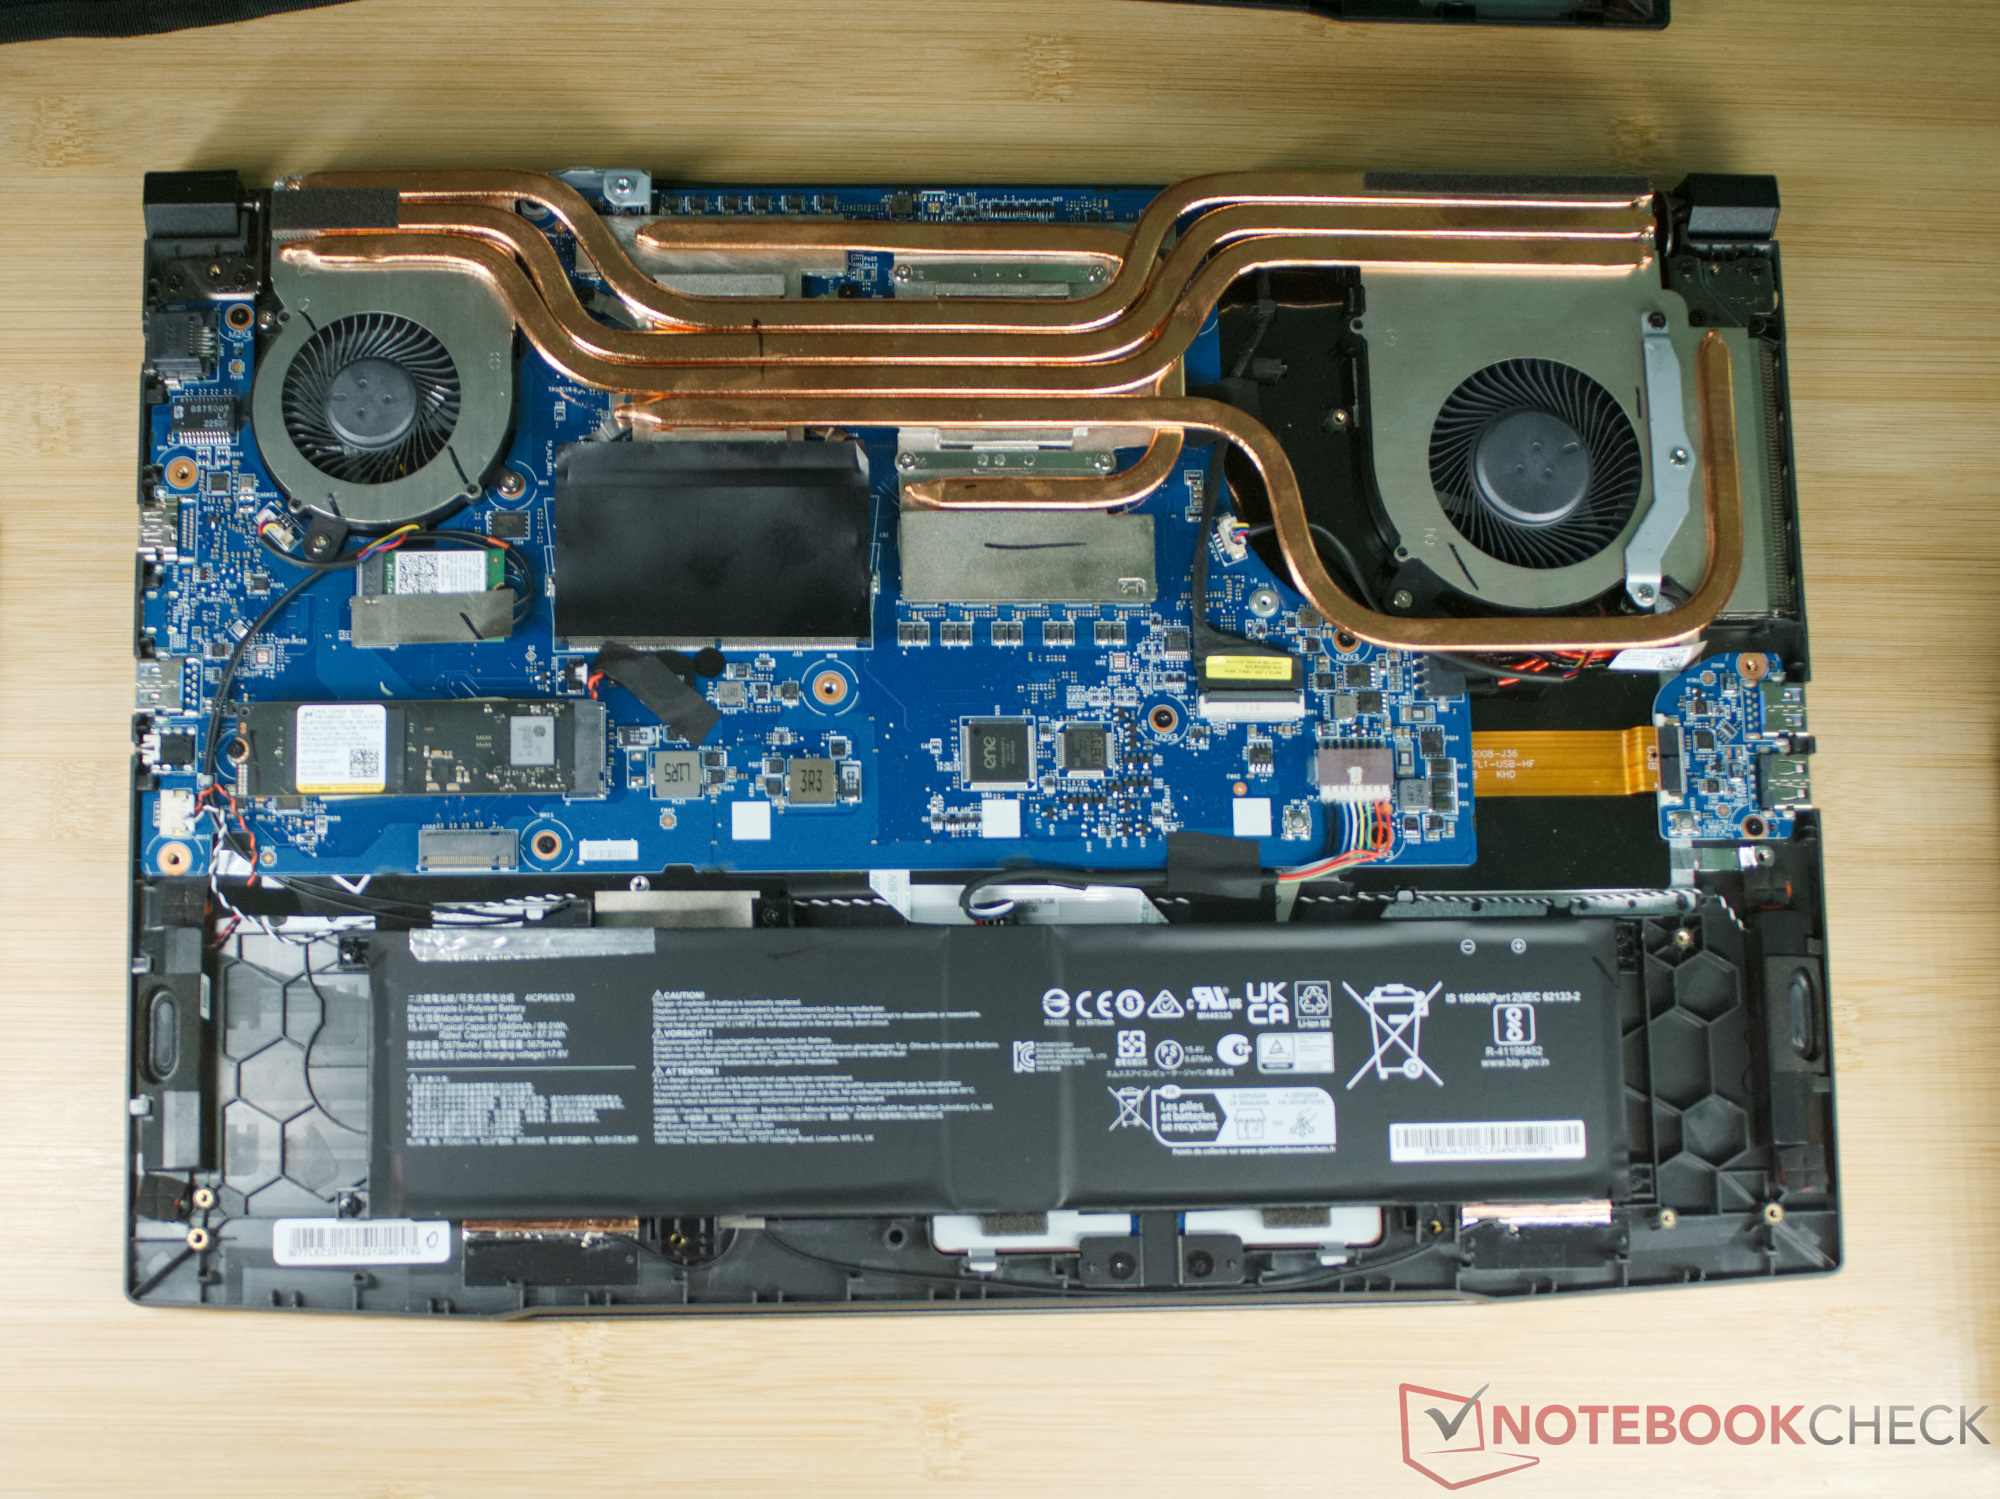
维护
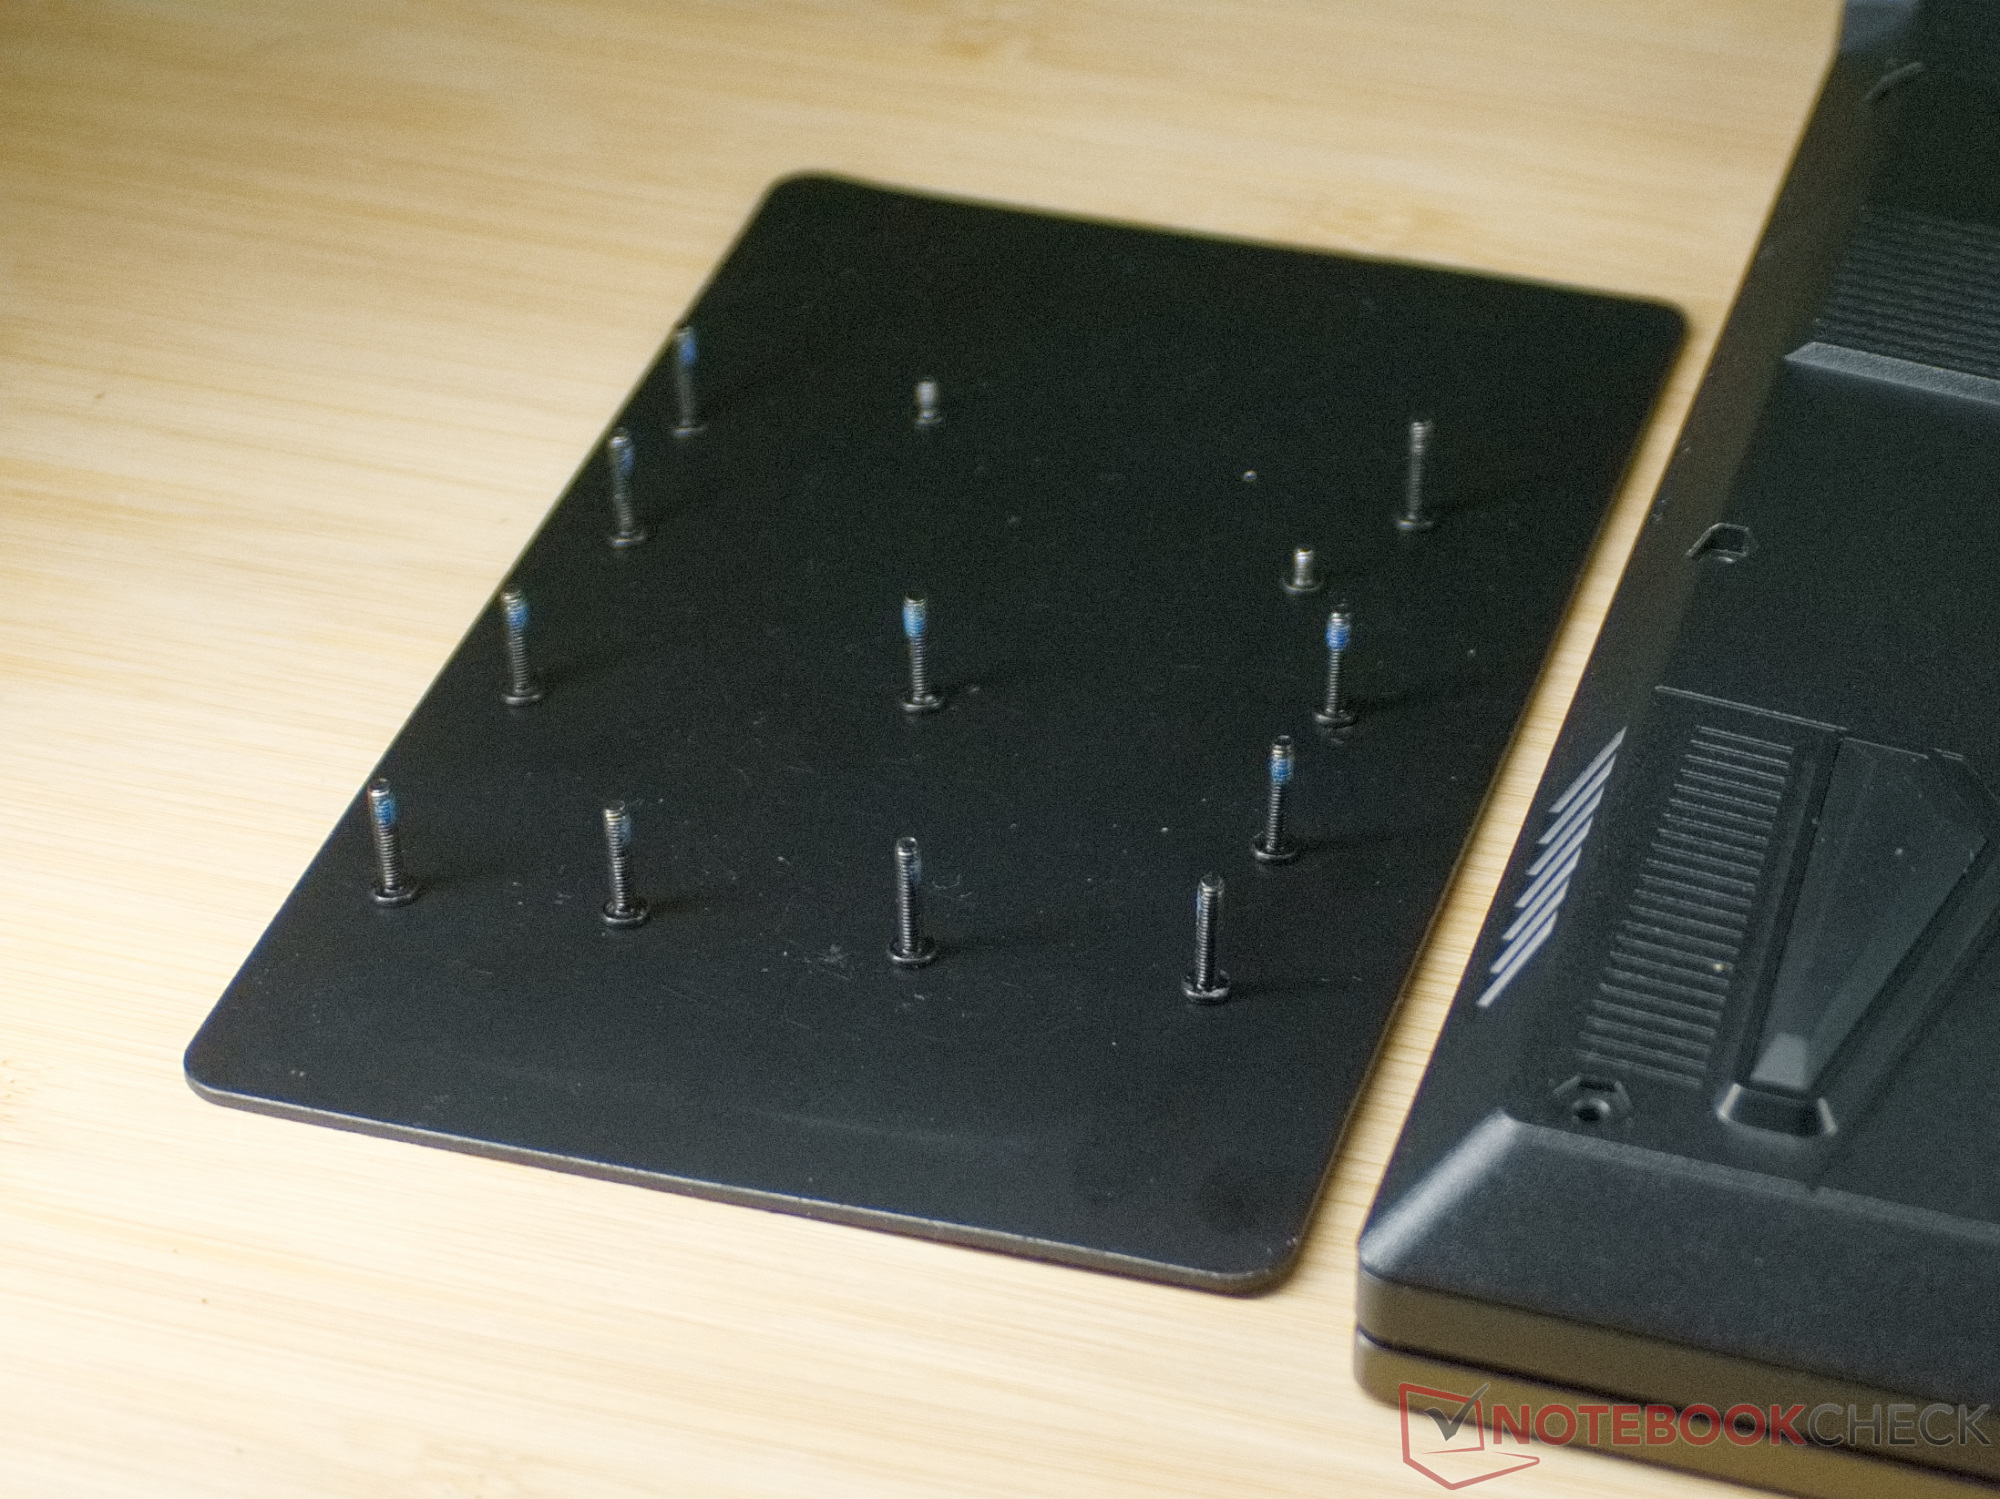
在我们的测试机中,用于固定机箱底部的13颗十字PH0螺丝中有一颗被贴上了封条。尽管微星一再强调这与保修无关,但如果在保修期内破坏了密封条,一些供应商可能会提出抗议。
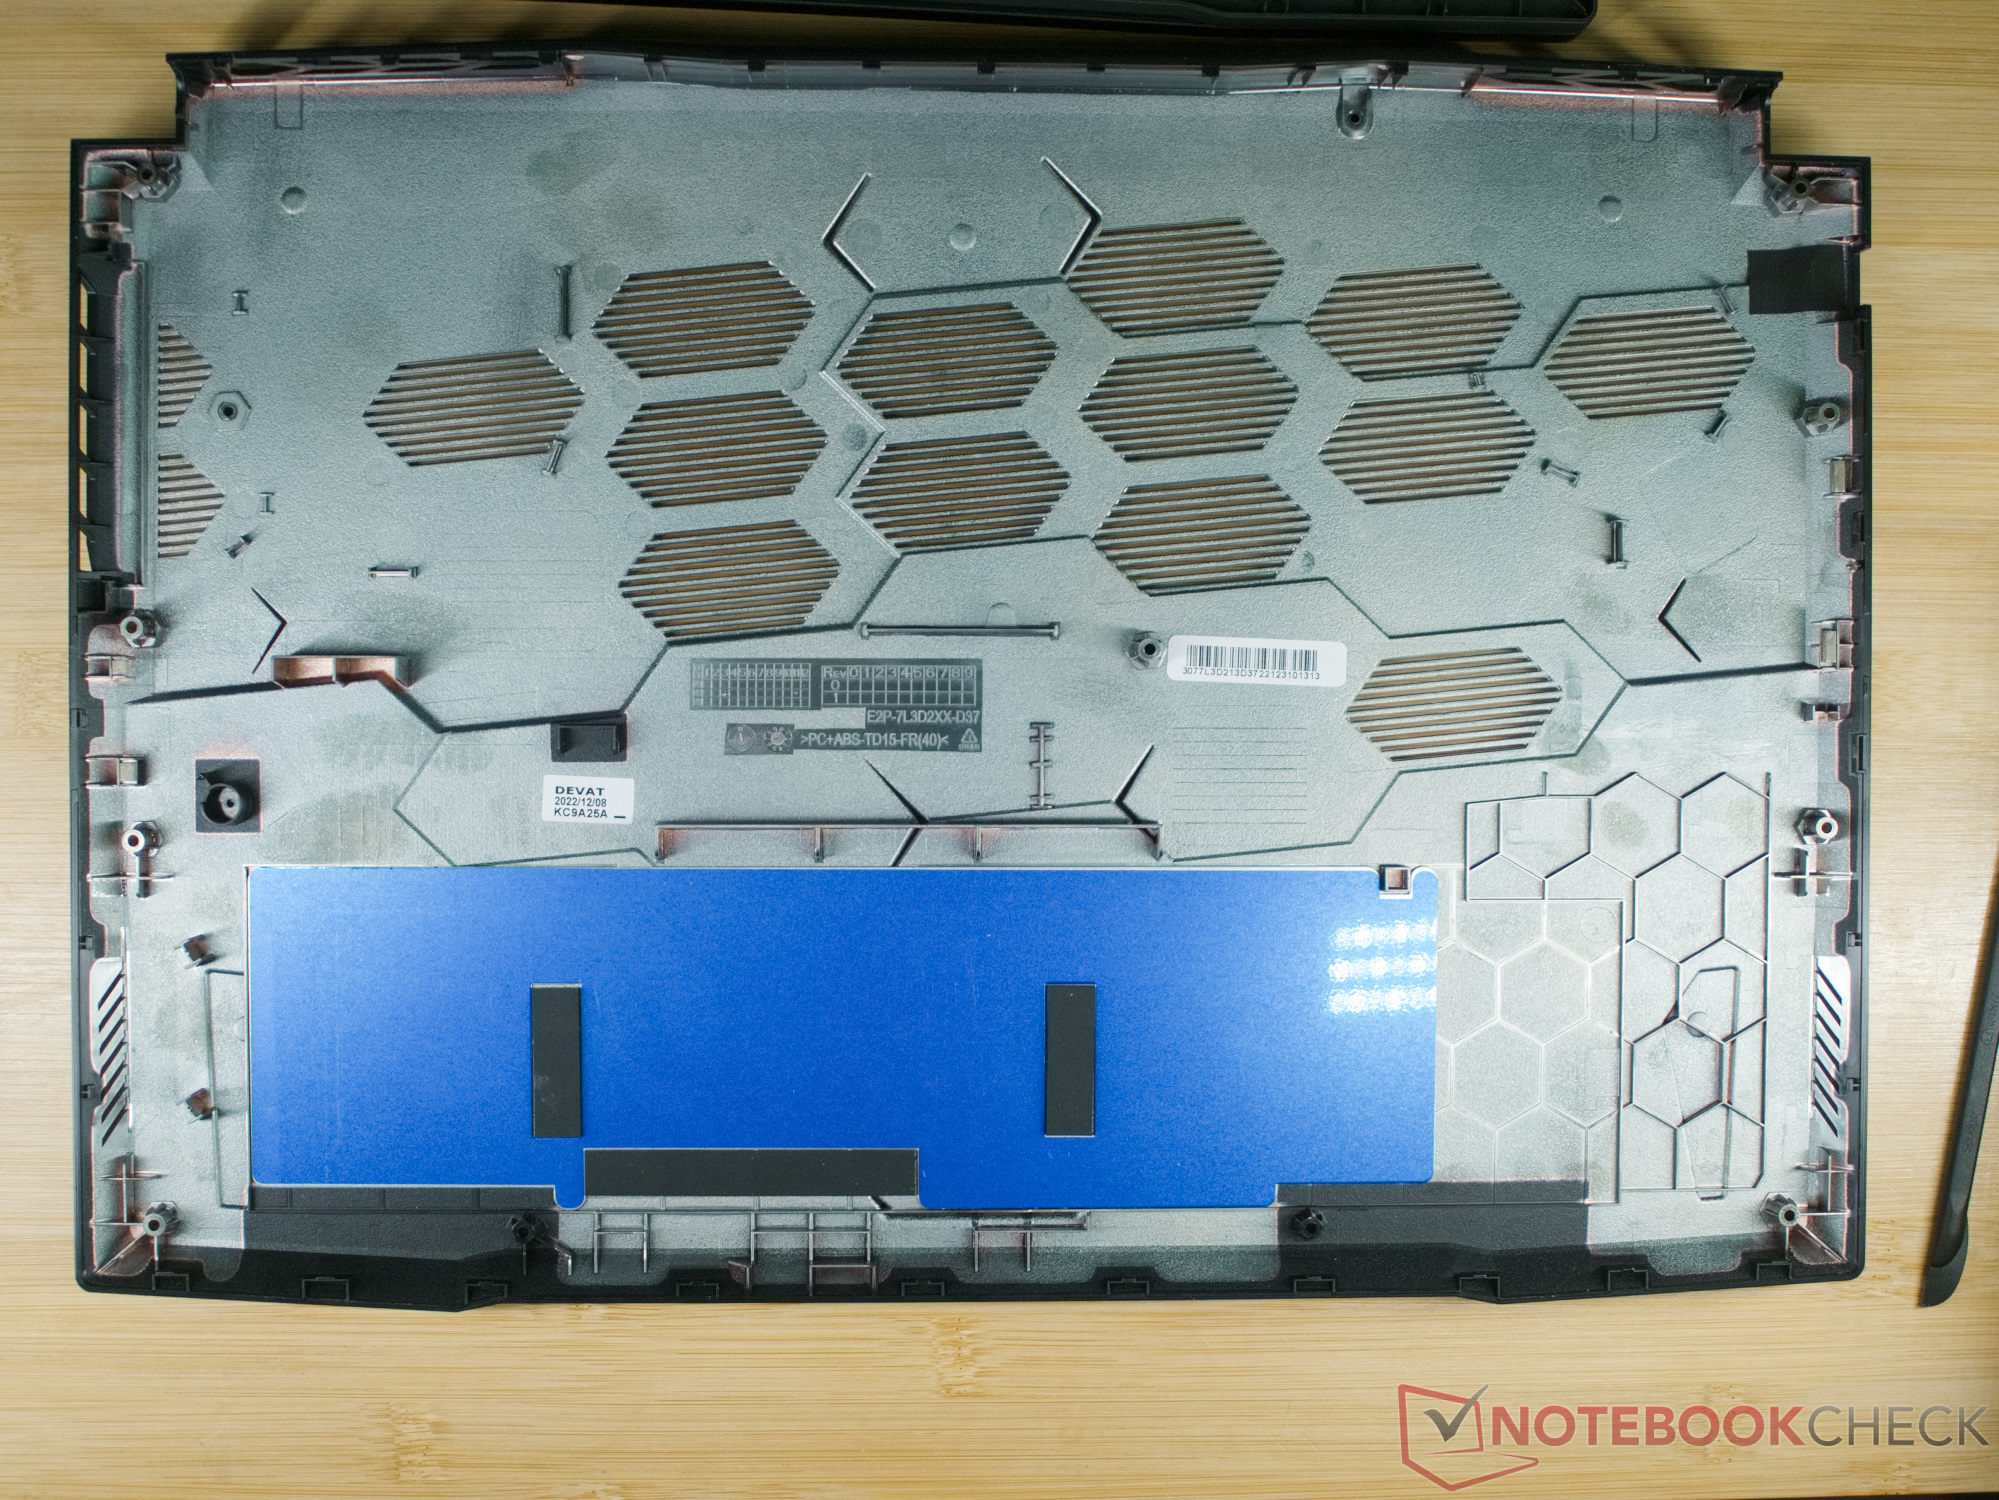
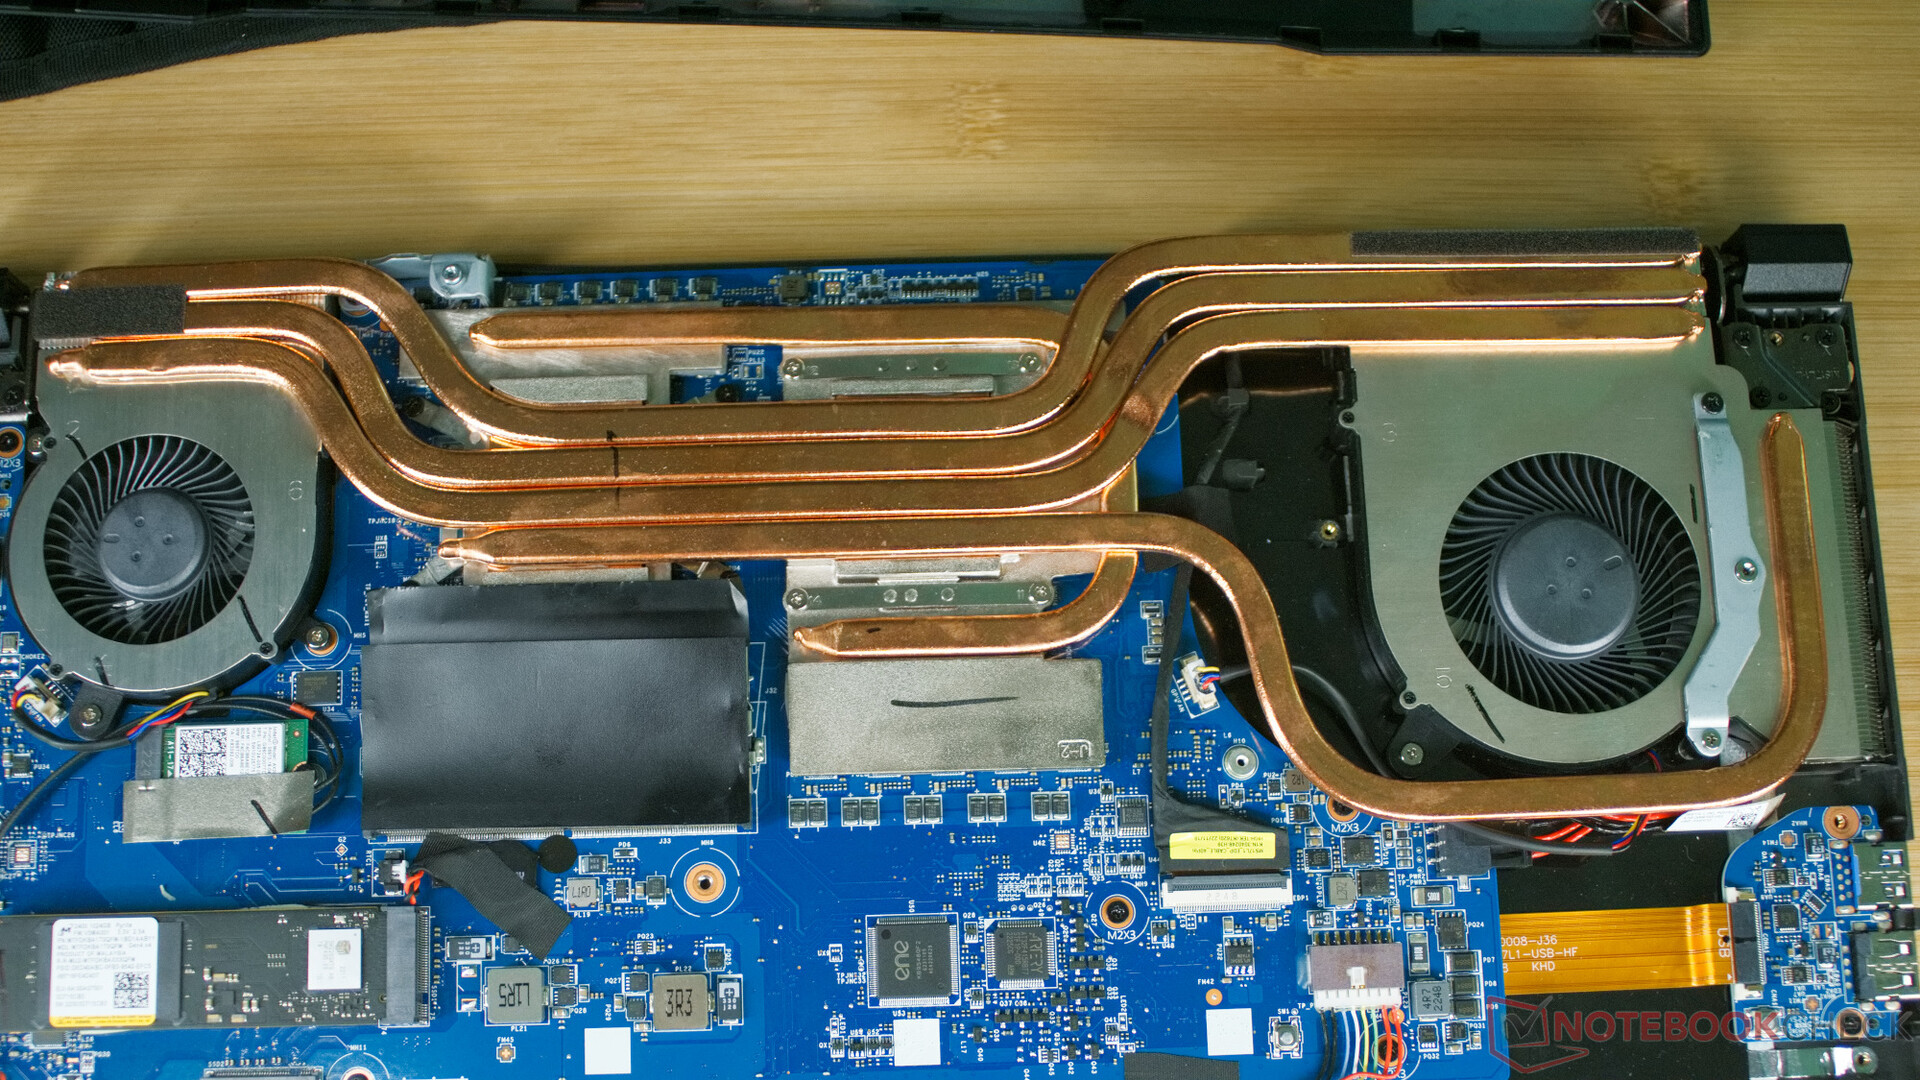
在拆卸13颗螺丝时,您还应该标记它们的位置,因为其中两颗螺丝明显较短。底盖也由几个夹子固定,但这些夹子可以用塑料撬棍轻松打开,之后就可以掀开底盖了。
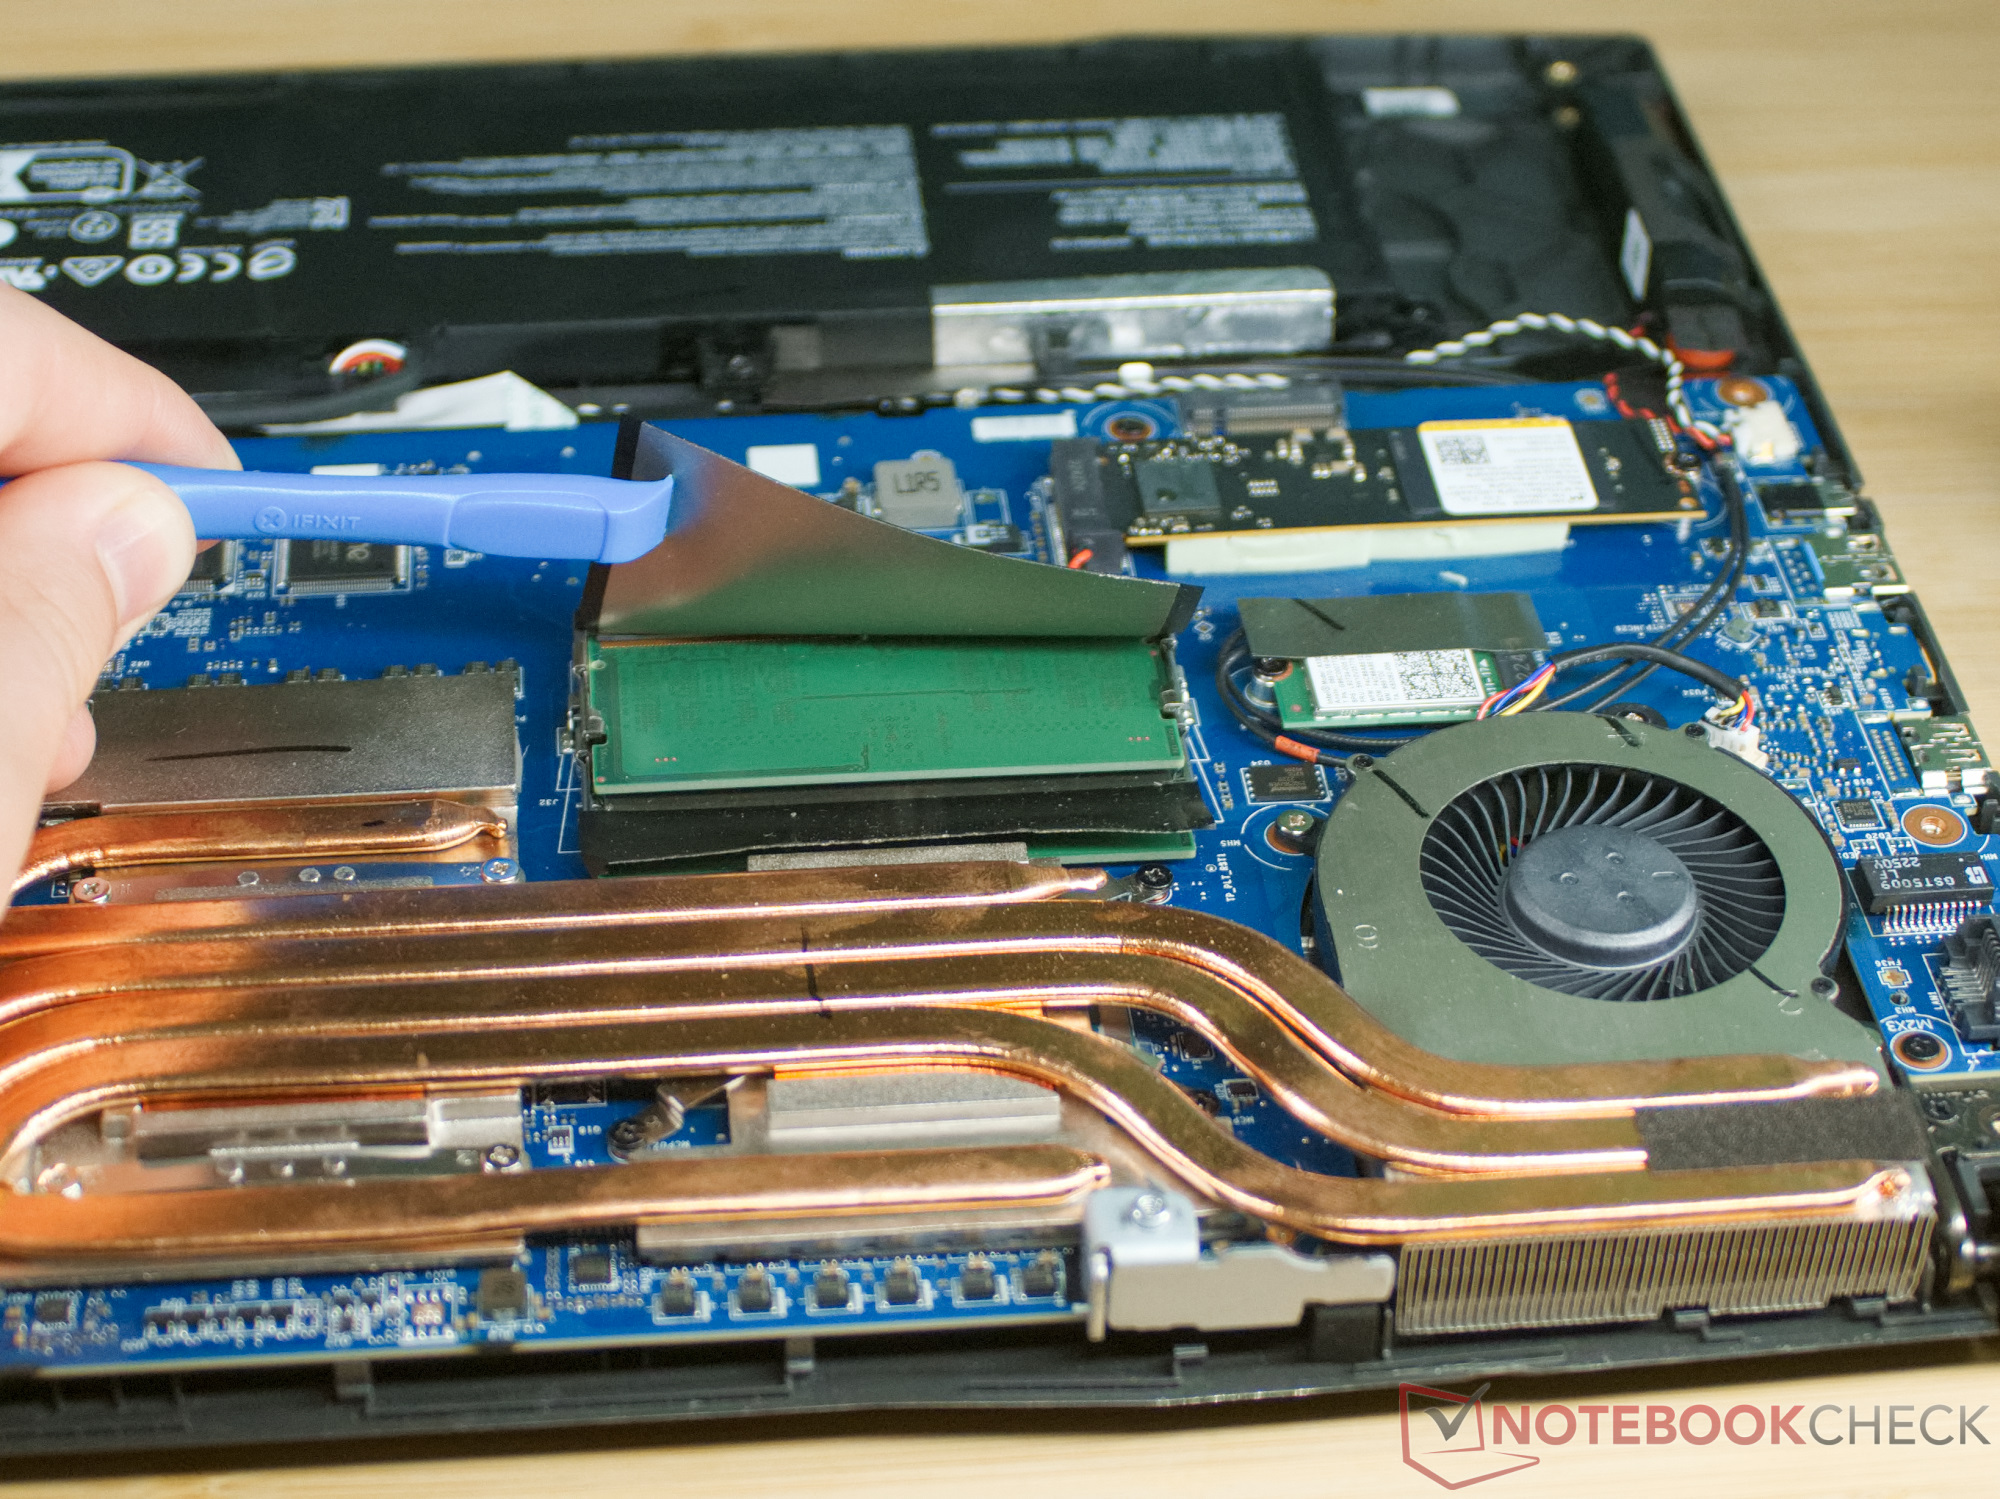
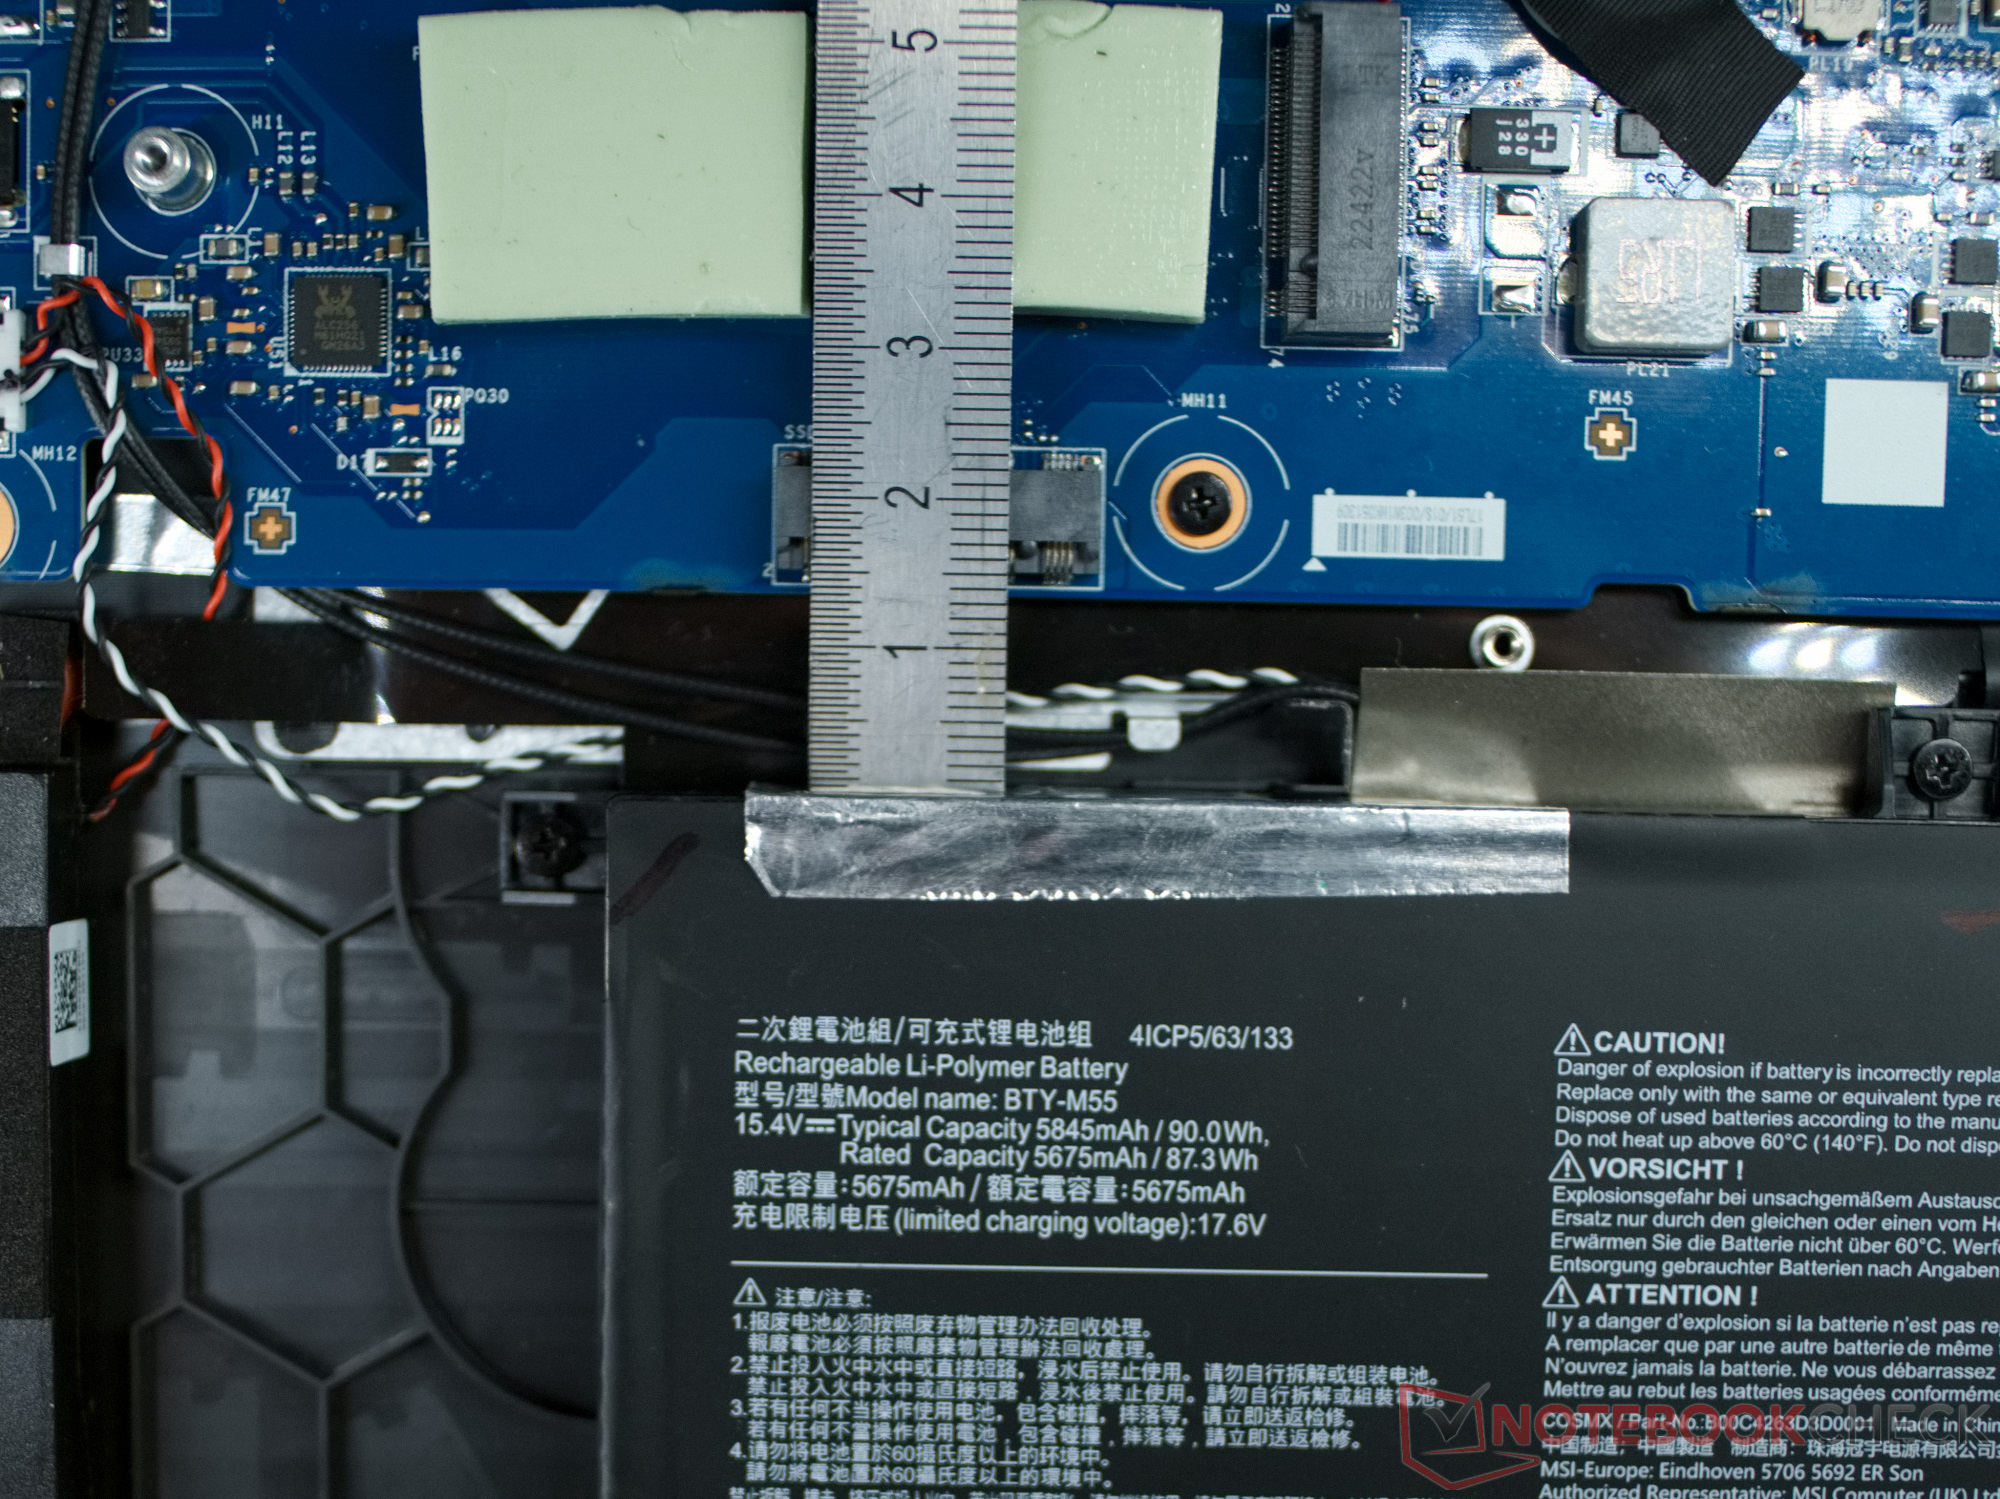
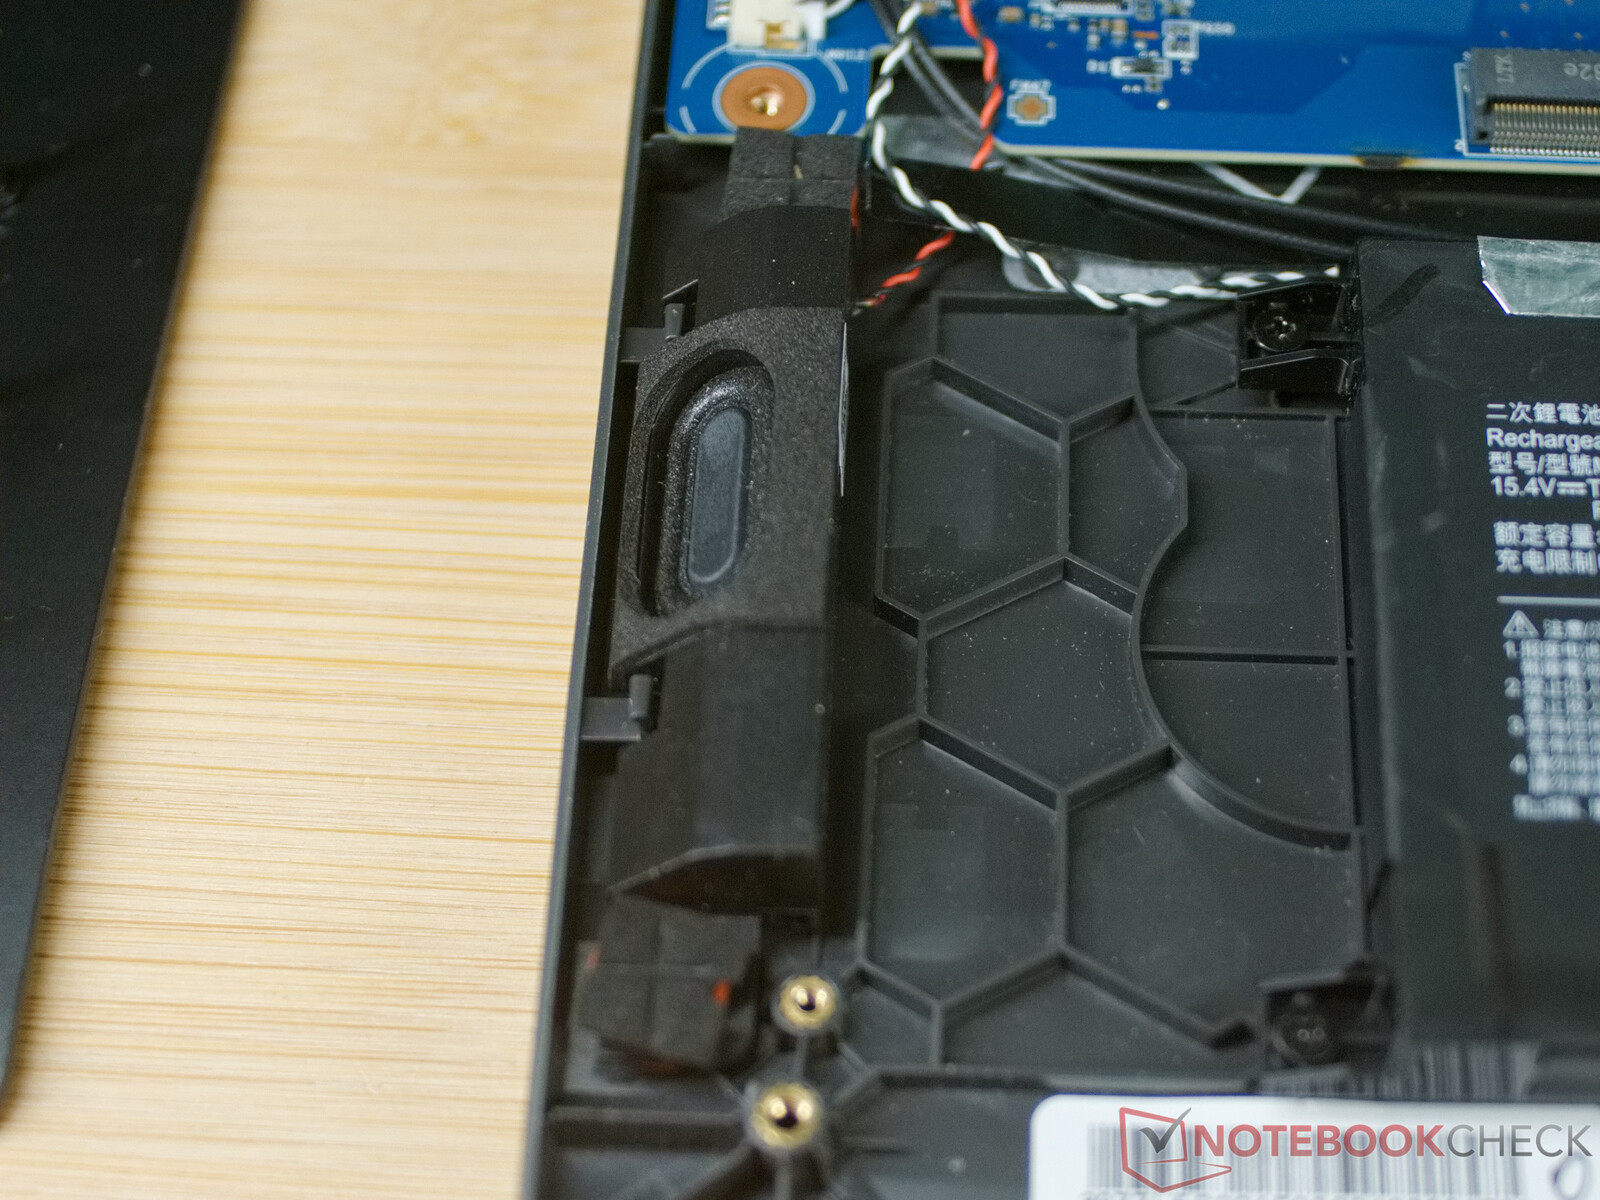
在笔记本内部,我们发现了一个相当模块化的结构,因此可以快速更换内存、NVMe SSD和WLAN/Modul。电池、扬声器和带有两个USB接口的电路板也可以轻松更换。不过,经常需要清除风扇和散热片之间灰尘的用户必须拆下整个散热系统才能进行。
该笔记本电脑还提供了第二个M.2 PCIe插槽,但不幸的是,它被电池挡住了。因此,您可能只能通过使用适配器和线缆的解决方案来安装第二个固态硬盘。
质保
微星为欧洲地区的用户提供24个月的保修服务。
Input Devices - Four RGB zones and a small touchpad in the MSI Pulse
键盘
微星控制中心允许您控制微星Pluse 17键盘的RGB背景照明。制造商还允许使用第三方软件来改变键盘四个照明区的颜色和效果。 透明的W、A、S和D键在这里特别强调。键盘提供了良好的触觉反馈,键程约为1.2毫米(约0.05英寸)。
触摸板
Pulse 17的触摸板相对较小,但这也意味着它在游戏时不会妨碍手掌。触摸板表面光滑、按键清晰、精度高,总体上运行良好。
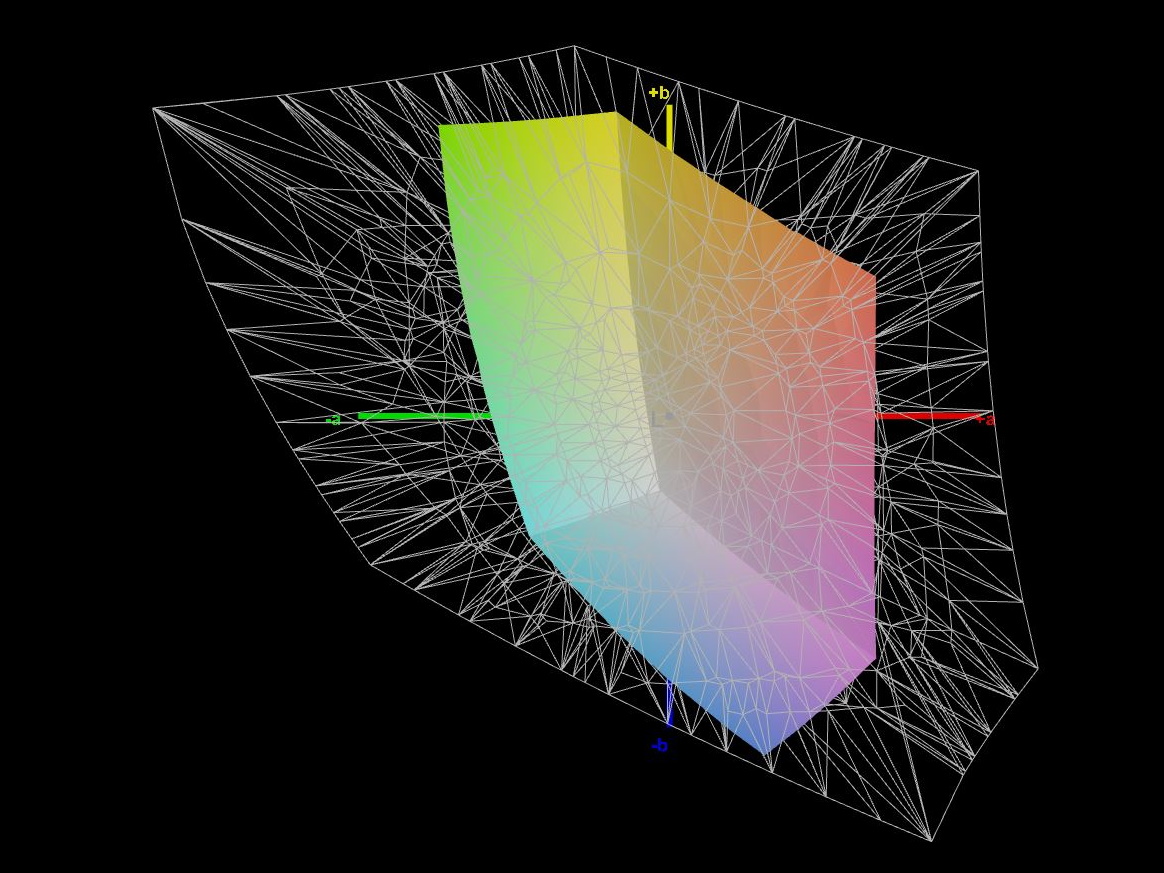
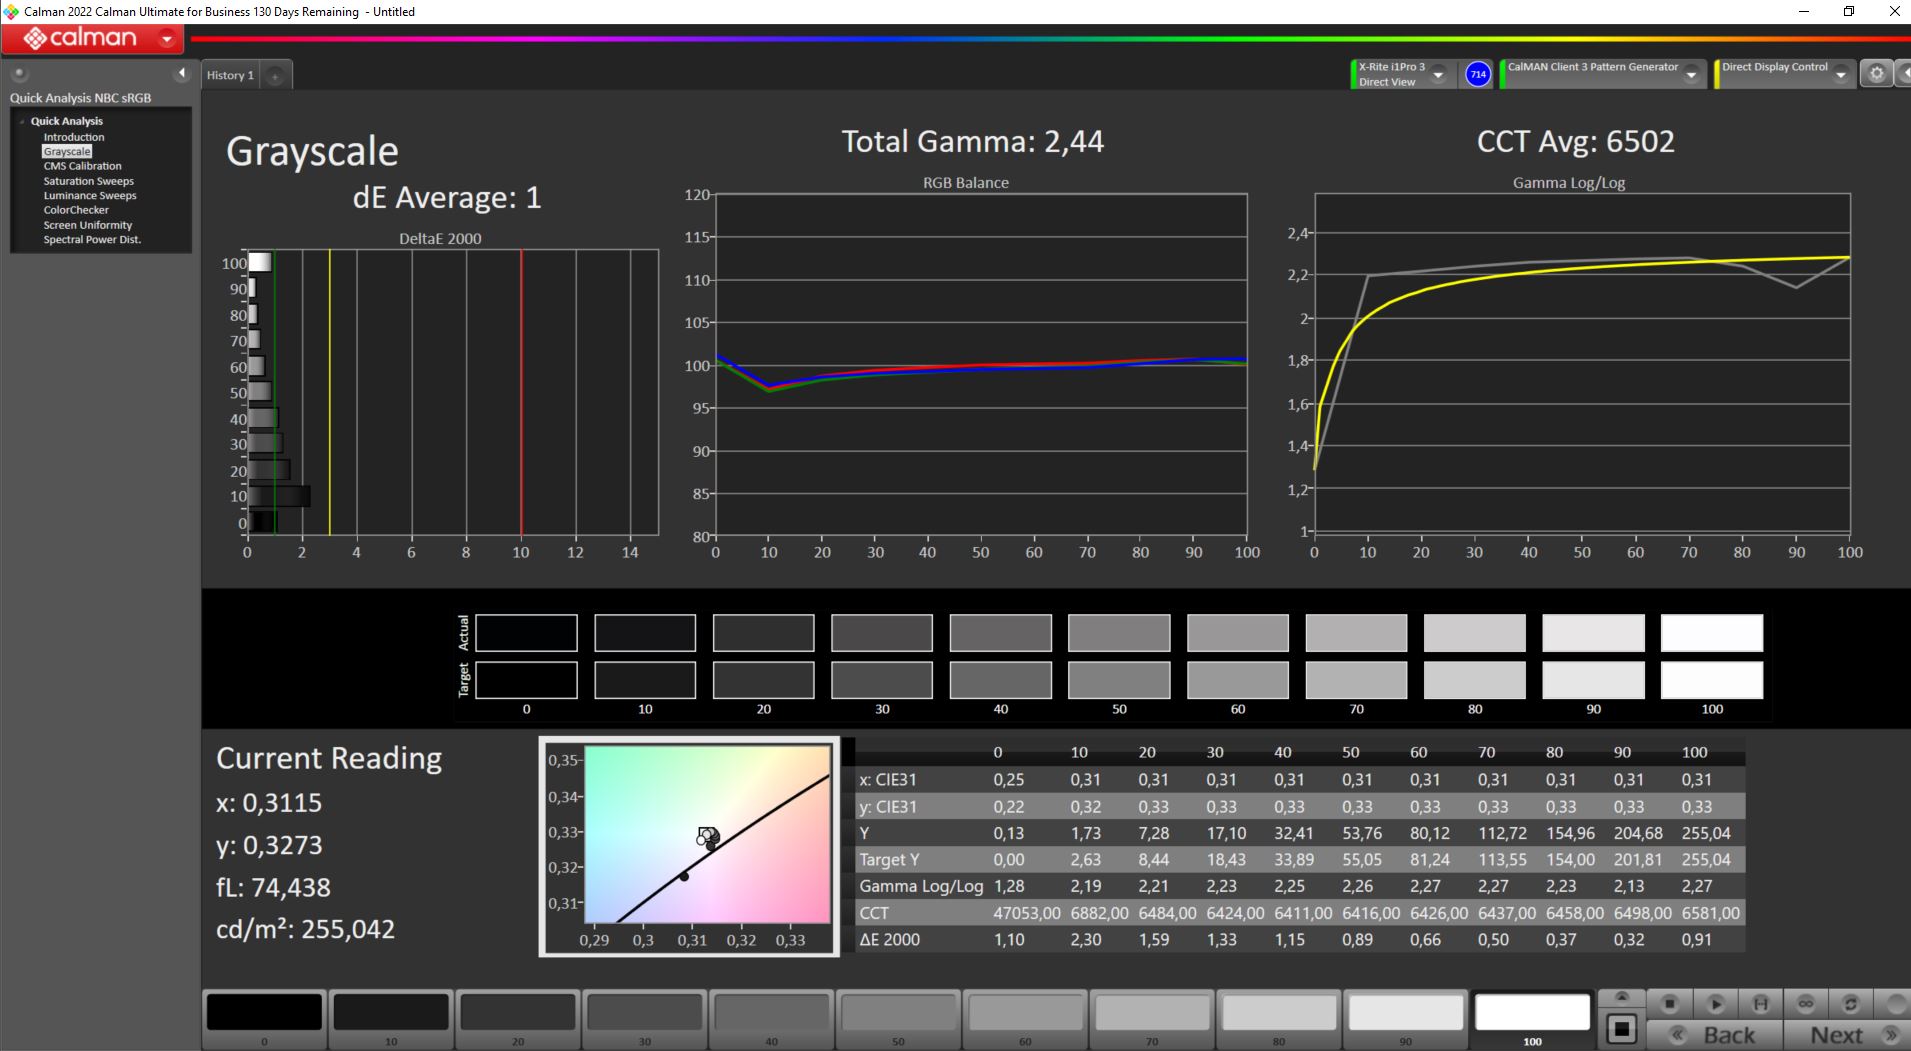
显示屏 - 小于60% sRGB覆盖率
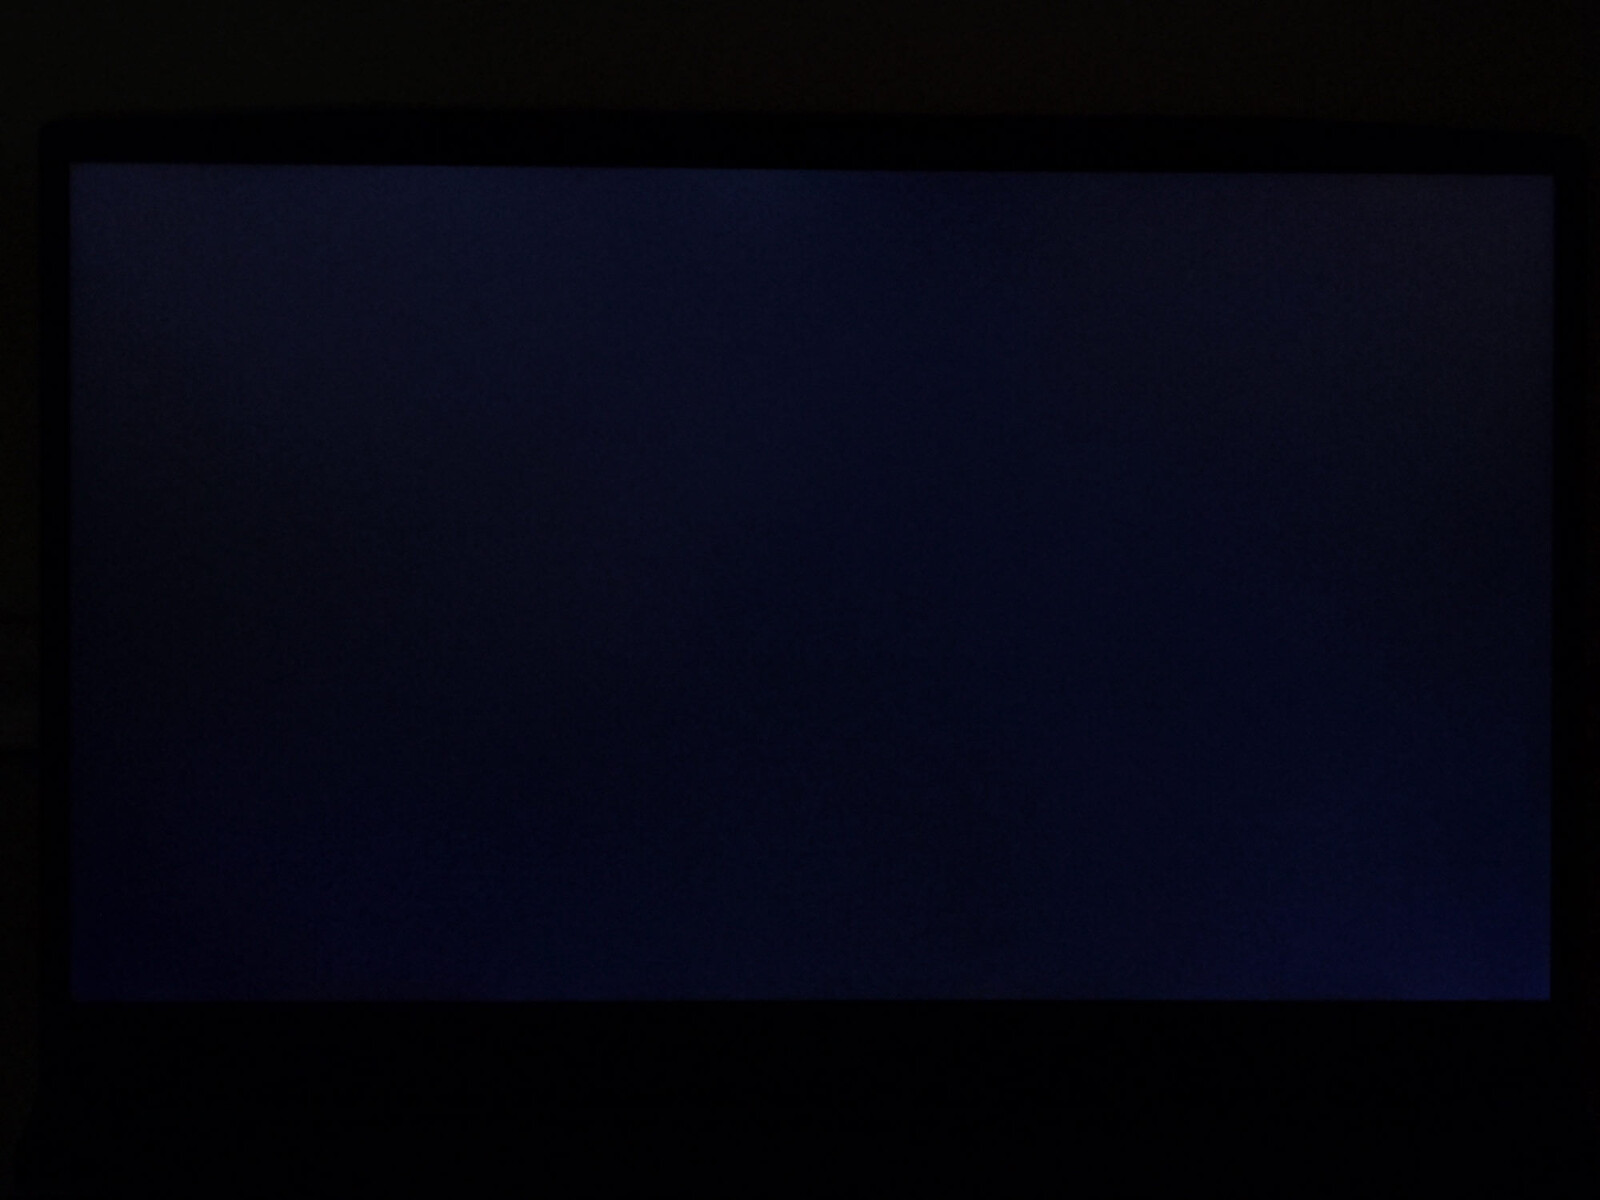
在游戏笔记本电脑中,显示屏应该反应灵敏,完全覆盖sRGB色彩空间,并提供高对比度。其中,只有高对比度才能体现微星Pulse的显示效果。尽管平均亮度为250 cd/m²的雾面显示屏并不特别明亮,但低黑值确保了高对比度。亮度分布不是特别均匀,但至少我们没有注意到任何可见的光晕。
这意味着Pulse 17的显示效果比Pulse GL76差很多。 Pulse GL76.与Pulse GL76相比,Pulse 17的响应时间几乎增加了一倍,有时几乎慢了6倍,可显示的颜色数量几乎减少了一半。因此,微星对显示屏进行了大幅降级。
| |||||||||||||||||||||||||
Brightness Distribution: 91 %
Center on Battery: 253 cd/m²
Contrast: 1814:1 (Black: 0.14 cd/m²)
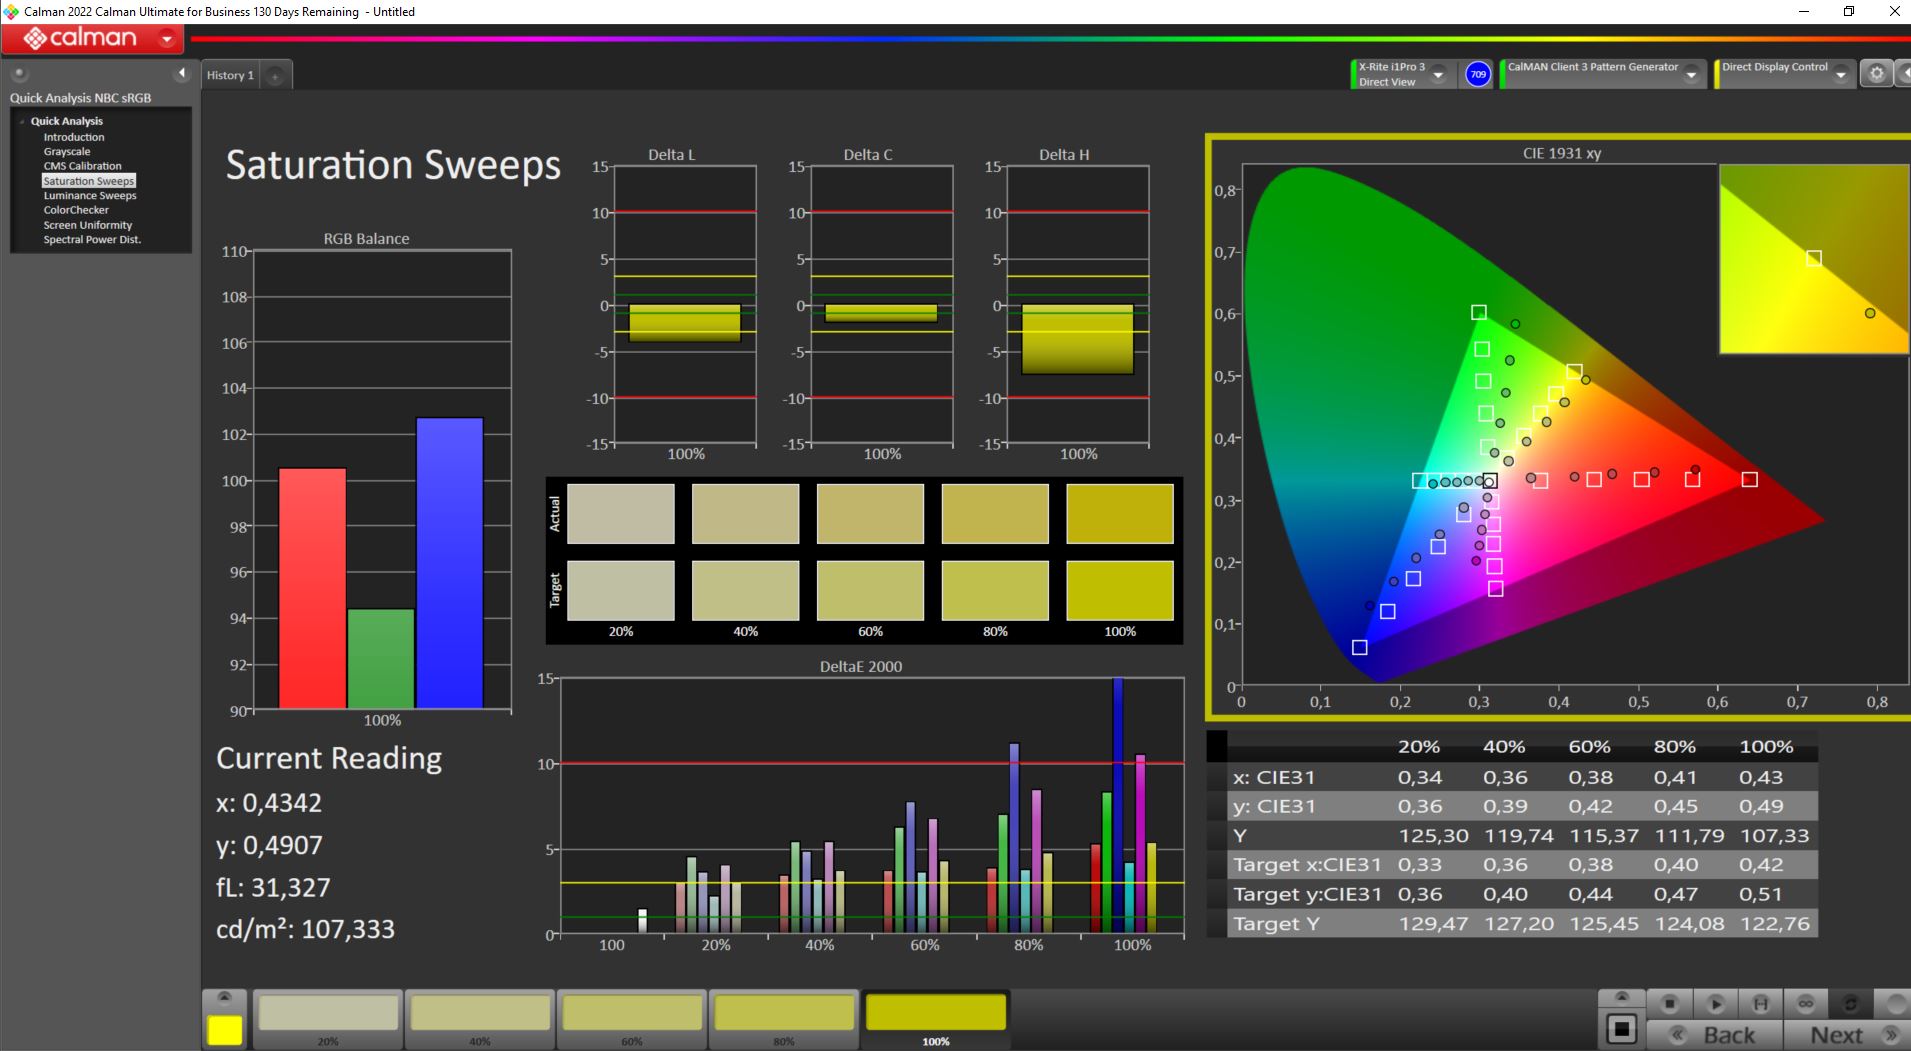
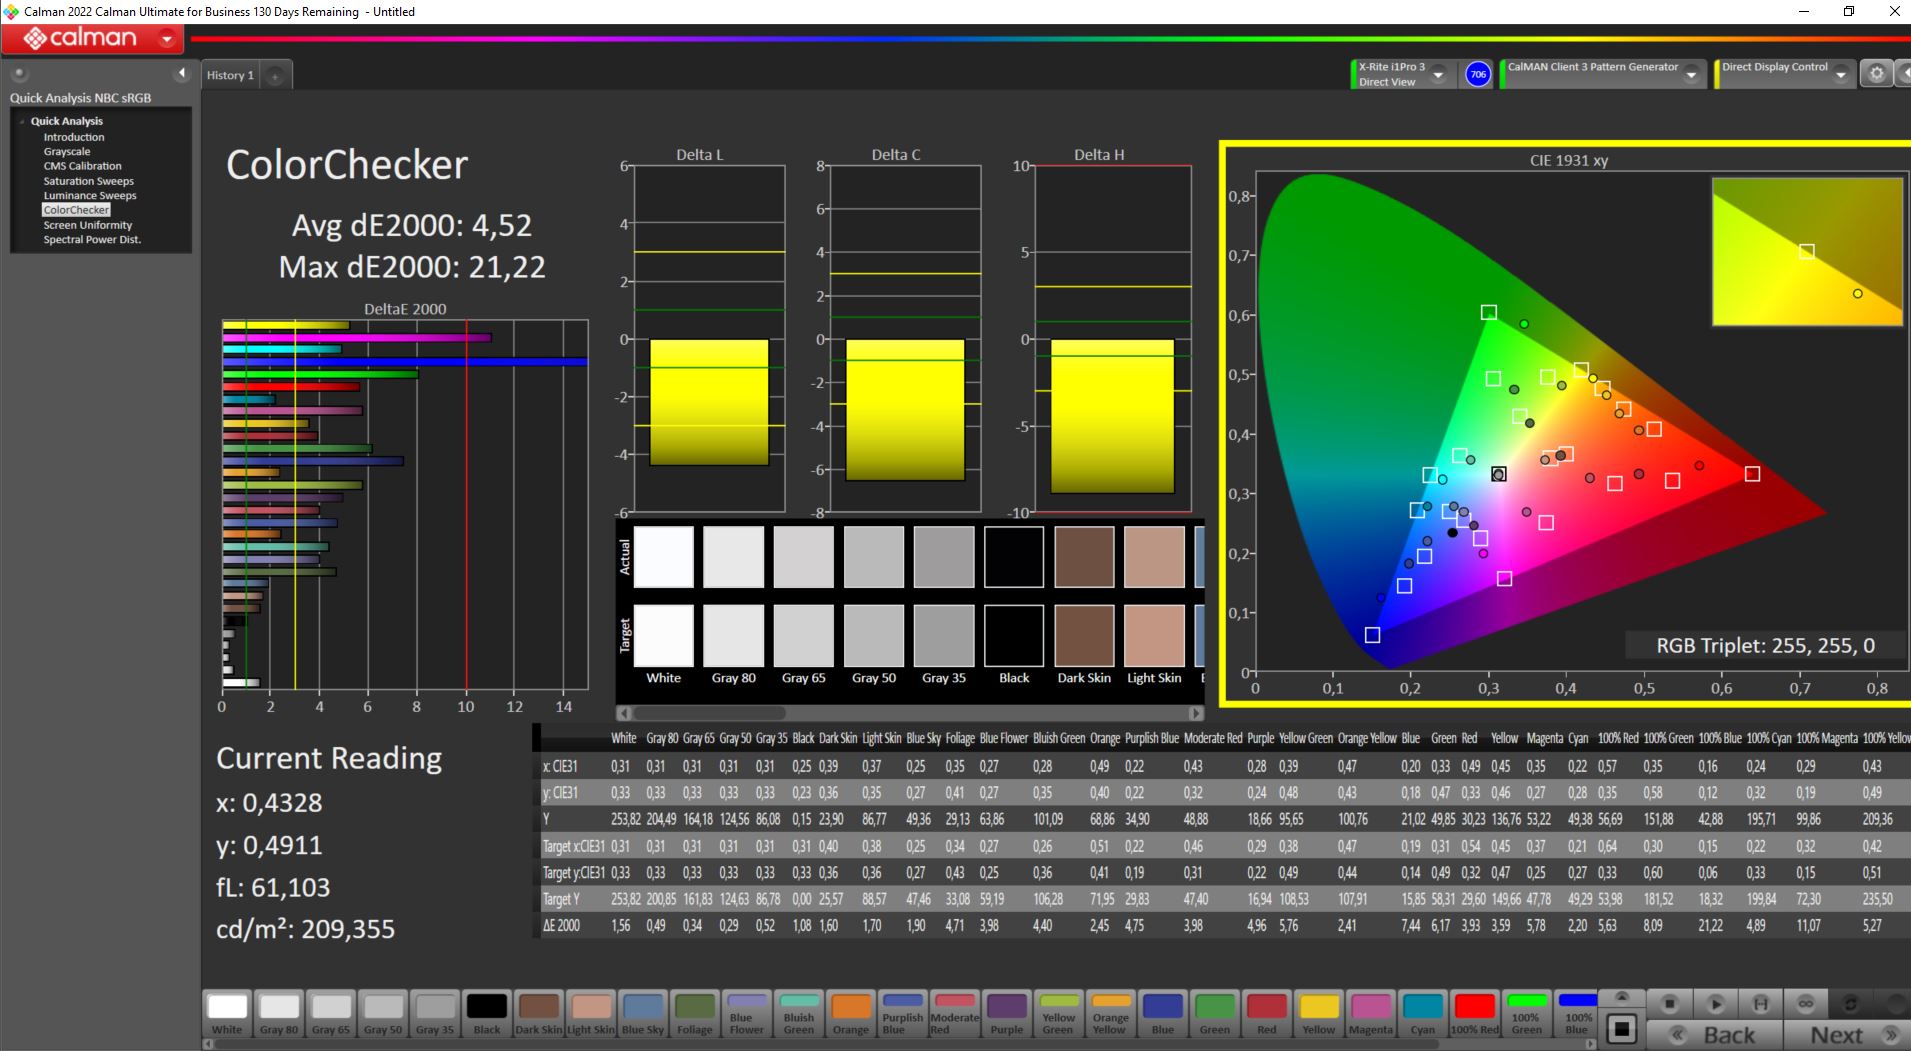
ΔE ColorChecker Calman: 4.52 | ∀{0.5-29.43 Ø4.71}
calibrated: 4.52
ΔE Greyscale Calman: 1 | ∀{0.09-98 Ø4.96}
39.7% AdobeRGB 1998 (Argyll 3D)
57.5% sRGB (Argyll 3D)
38.4% Display P3 (Argyll 3D)
Gamma: 2.44
CCT: 6502 K
| MSI Pulse 17 B13VGK AU Optronics B173HAN04.9, IPS, 1920x1080, 17.3" | MSI Pulse GL76 12UGK Sharp LQ173M1JW08, IPS, 1920x1080, 17.3" | MSI Katana 17 B13VFK B173HAN04.9, IPS LED, 1920x1080, 17.3" | Acer Nitro 17 AN17-51-71ER BOE0B7C NE173QHM-NY6, , 2560x1440, 17.3" | Schenker XMG Focus 17 (E23) BOE09F9 NE173QHM-NZ1, IPS, 2560x1440, 17.3" | Asus ROG Strix G17 G713PI BOE0B69, IPS, 2560x1440, 17.3" | |
|---|---|---|---|---|---|---|
| Display | 82% | 6% | 115% | 113% | 115% | |
| Display P3 Coverage (%) | 38.4 | 71.9 87% | 40.8 6% | 98.3 156% | 96.6 152% | 98.3 156% |
| sRGB Coverage (%) | 57.5 | 99.9 74% | 61 6% | 100 74% | 99.9 74% | 100 74% |
| AdobeRGB 1998 Coverage (%) | 39.7 | 73.7 86% | 42.2 6% | 85.7 116% | 84.5 113% | 85.9 116% |
| Response Times | 69% | -8% | 60% | 51% | 74% | |
| Response Time Grey 50% / Grey 80% * (ms) | 31.2 ? | 4.6 ? 85% | 33 ? -6% | 14.8 ? 53% | 16.4 ? 47% | 5.3 ? 83% |
| Response Time Black / White * (ms) | 23.6 ? | 11.2 ? 53% | 26 ? -10% | 8 ? 66% | 10.8 ? 54% | 8.6 ? 64% |
| PWM Frequency (Hz) | ||||||
| Screen | -55% | -13% | -50% | -10% | 2% | |
| Brightness middle (cd/m²) | 254 | 337.7 33% | 267 5% | 361 42% | 349 37% | 327 29% |
| Brightness (cd/m²) | 250 | 331 32% | 256 2% | 326 30% | 318 27% | 320 28% |
| Brightness Distribution (%) | 91 | 82 -10% | 93 2% | 87 -4% | 82 -10% | 89 -2% |
| Black Level * (cd/m²) | 0.14 | 0.31 -121% | 0.21 -50% | 0.6 -329% | 0.56 -300% | 0.38 -171% |
| Contrast (:1) | 1814 | 1089 -40% | 1271 -30% | 602 -67% | 623 -66% | 861 -53% |
| Colorchecker dE 2000 * | 4.52 | 4.12 9% | 4.7 -4% | 3.83 15% | 1.08 76% | 1.01 78% |
| Colorchecker dE 2000 max. * | 21.22 | 8.89 58% | 20.4 4% | 5.71 73% | 3.05 86% | 4.01 81% |
| Colorchecker dE 2000 calibrated * | 4.52 | 0.98 78% | 4.5 -0% | 3.48 23% | 1.08 76% | 0.41 91% |
| Greyscale dE 2000 * | 1 | 6.3 -530% | 1.5 -50% | 3.29 -229% | 1.14 -14% | 1.6 -60% |
| Gamma | 2.44 90% | 2.48 89% | 2.12 104% | 2.29 96% | 2.41 91% | 2.168 101% |
| CCT | 6502 100% | 6542 99% | 6552 99% | 6679 97% | 6687 97% | 6659 98% |
| Total Average (Program / Settings) | 32% /
-8% | -5% /
-9% | 42% /
1% | 51% /
25% | 64% /
37% |
* ... smaller is better
AdobeRGB和DisplayP3色彩空间的覆盖率不到40%,即使是sRGB,Pulse 17的覆盖率也不到60%。
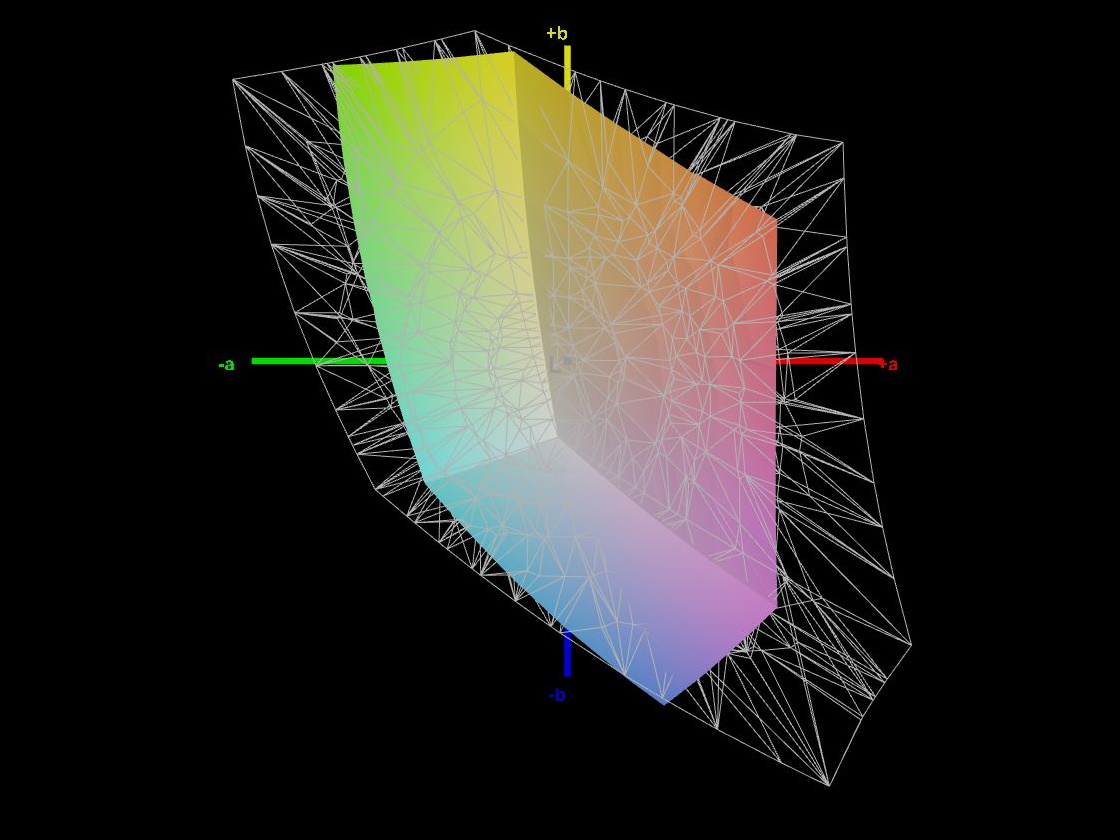
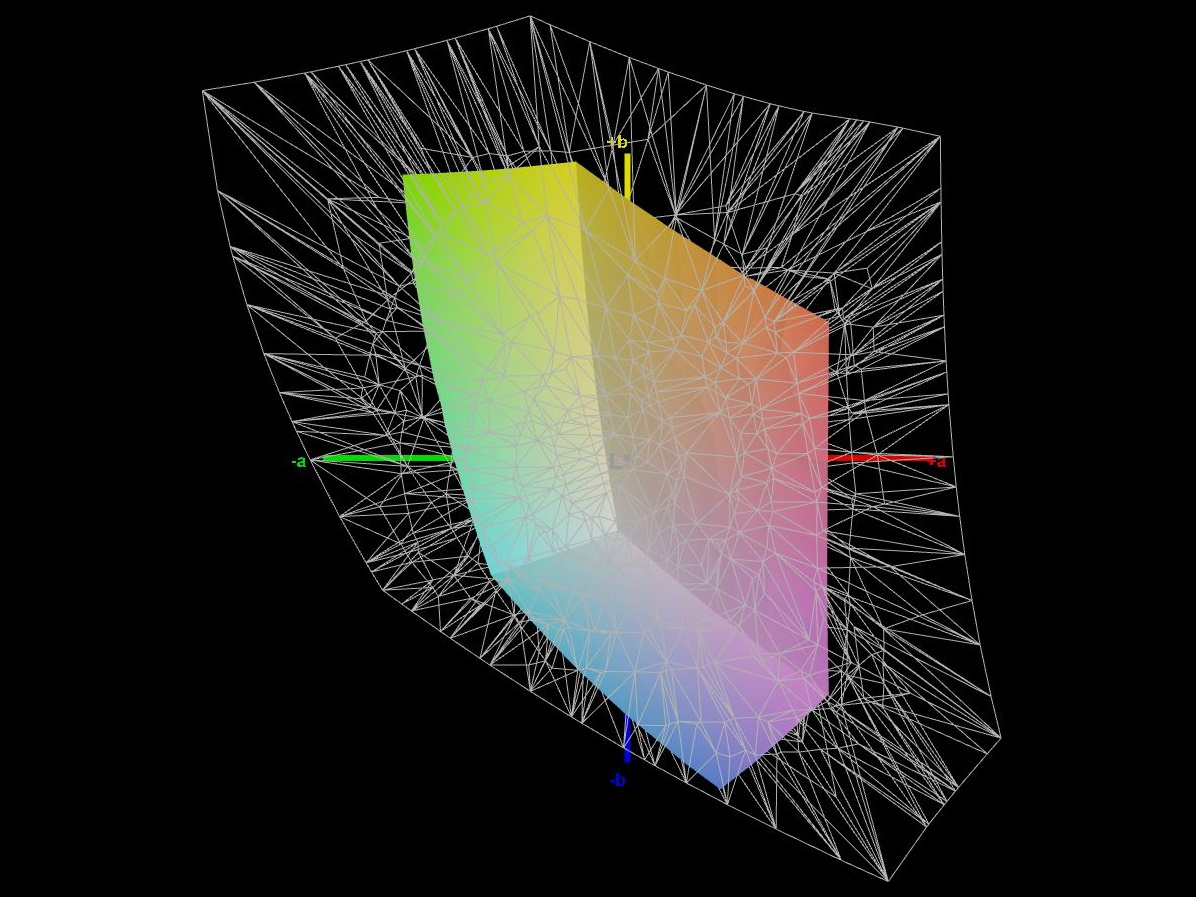
至少,Calman测试显示灰阶显示效果良好。然而,使用Calman ColorChecker对色彩再现的准确性进行评估,则清楚地揭示了显示器的局限性。在只有60%的sRGB色彩空间下,显示器明显缺少大部分色彩,红、绿、蓝三色也相应地偏离了色阶。这导致最大色彩偏差为ΔΕ 21.22。这是一个非常高的最大偏差,我们对比的其他笔记本电脑都没有达到这个水平。但在平均色彩偏差方面,该显示器的表现要稍好一些。然而,额外的校准并不会改变结果,因此即使是 微星Katana在使用我们的ICC配置文件时,色彩偏差也较低。
Display Response Times
| ↔ Response Time Black to White | ||
|---|---|---|
| 23.6 ms ... rise ↗ and fall ↘ combined | ↗ 12.2 ms rise | 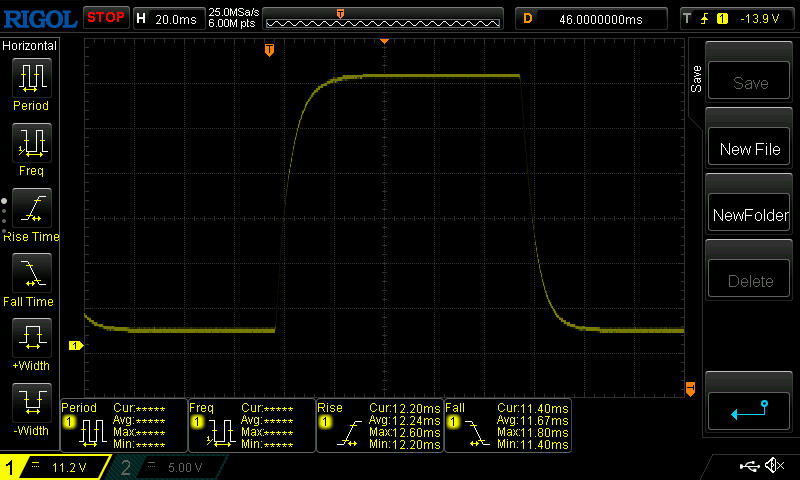 |
| ↘ 11.4 ms fall | ||
| The screen shows good response rates in our tests, but may be too slow for competitive gamers. In comparison, all tested devices range from 0.1 (minimum) to 240 (maximum) ms. » 54 % of all devices are better. This means that the measured response time is worse than the average of all tested devices (19.8 ms). | ||
| ↔ Response Time 50% Grey to 80% Grey | ||
| 31.2 ms ... rise ↗ and fall ↘ combined | ↗ 14.2 ms rise | 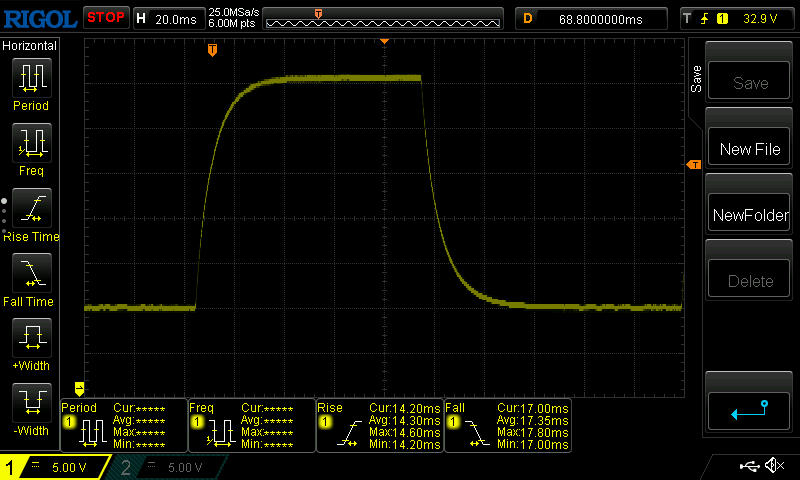 |
| ↘ 17 ms fall | ||
| The screen shows slow response rates in our tests and will be unsatisfactory for gamers. In comparison, all tested devices range from 0.165 (minimum) to 636 (maximum) ms. » 42 % of all devices are better. This means that the measured response time is similar to the average of all tested devices (31 ms). | ||
Screen Flickering / PWM (Pulse-Width Modulation)
| Screen flickering / PWM not detected | 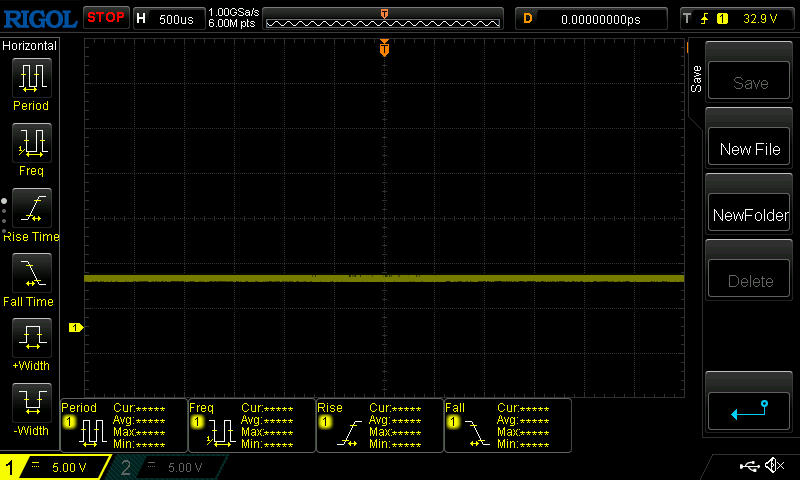 | ||
In comparison: 52 % of all tested devices do not use PWM to dim the display. If PWM was detected, an average of 7754 (minimum: 5 - maximum: 343500) Hz was measured. | |||
Pulse 17 IPS面板的可视角度在色彩还原方面相当稳定,但随着角度的增加,亮度明显下降。在室外使用时,由于显示屏的亮度不够,在强光下也无法看到,因此这款笔记本电脑的说服力有限。 即使在我们的工作室照明下,也会很快发现显示屏相当暗,磨砂表面仍然显示出相对较多的反光。

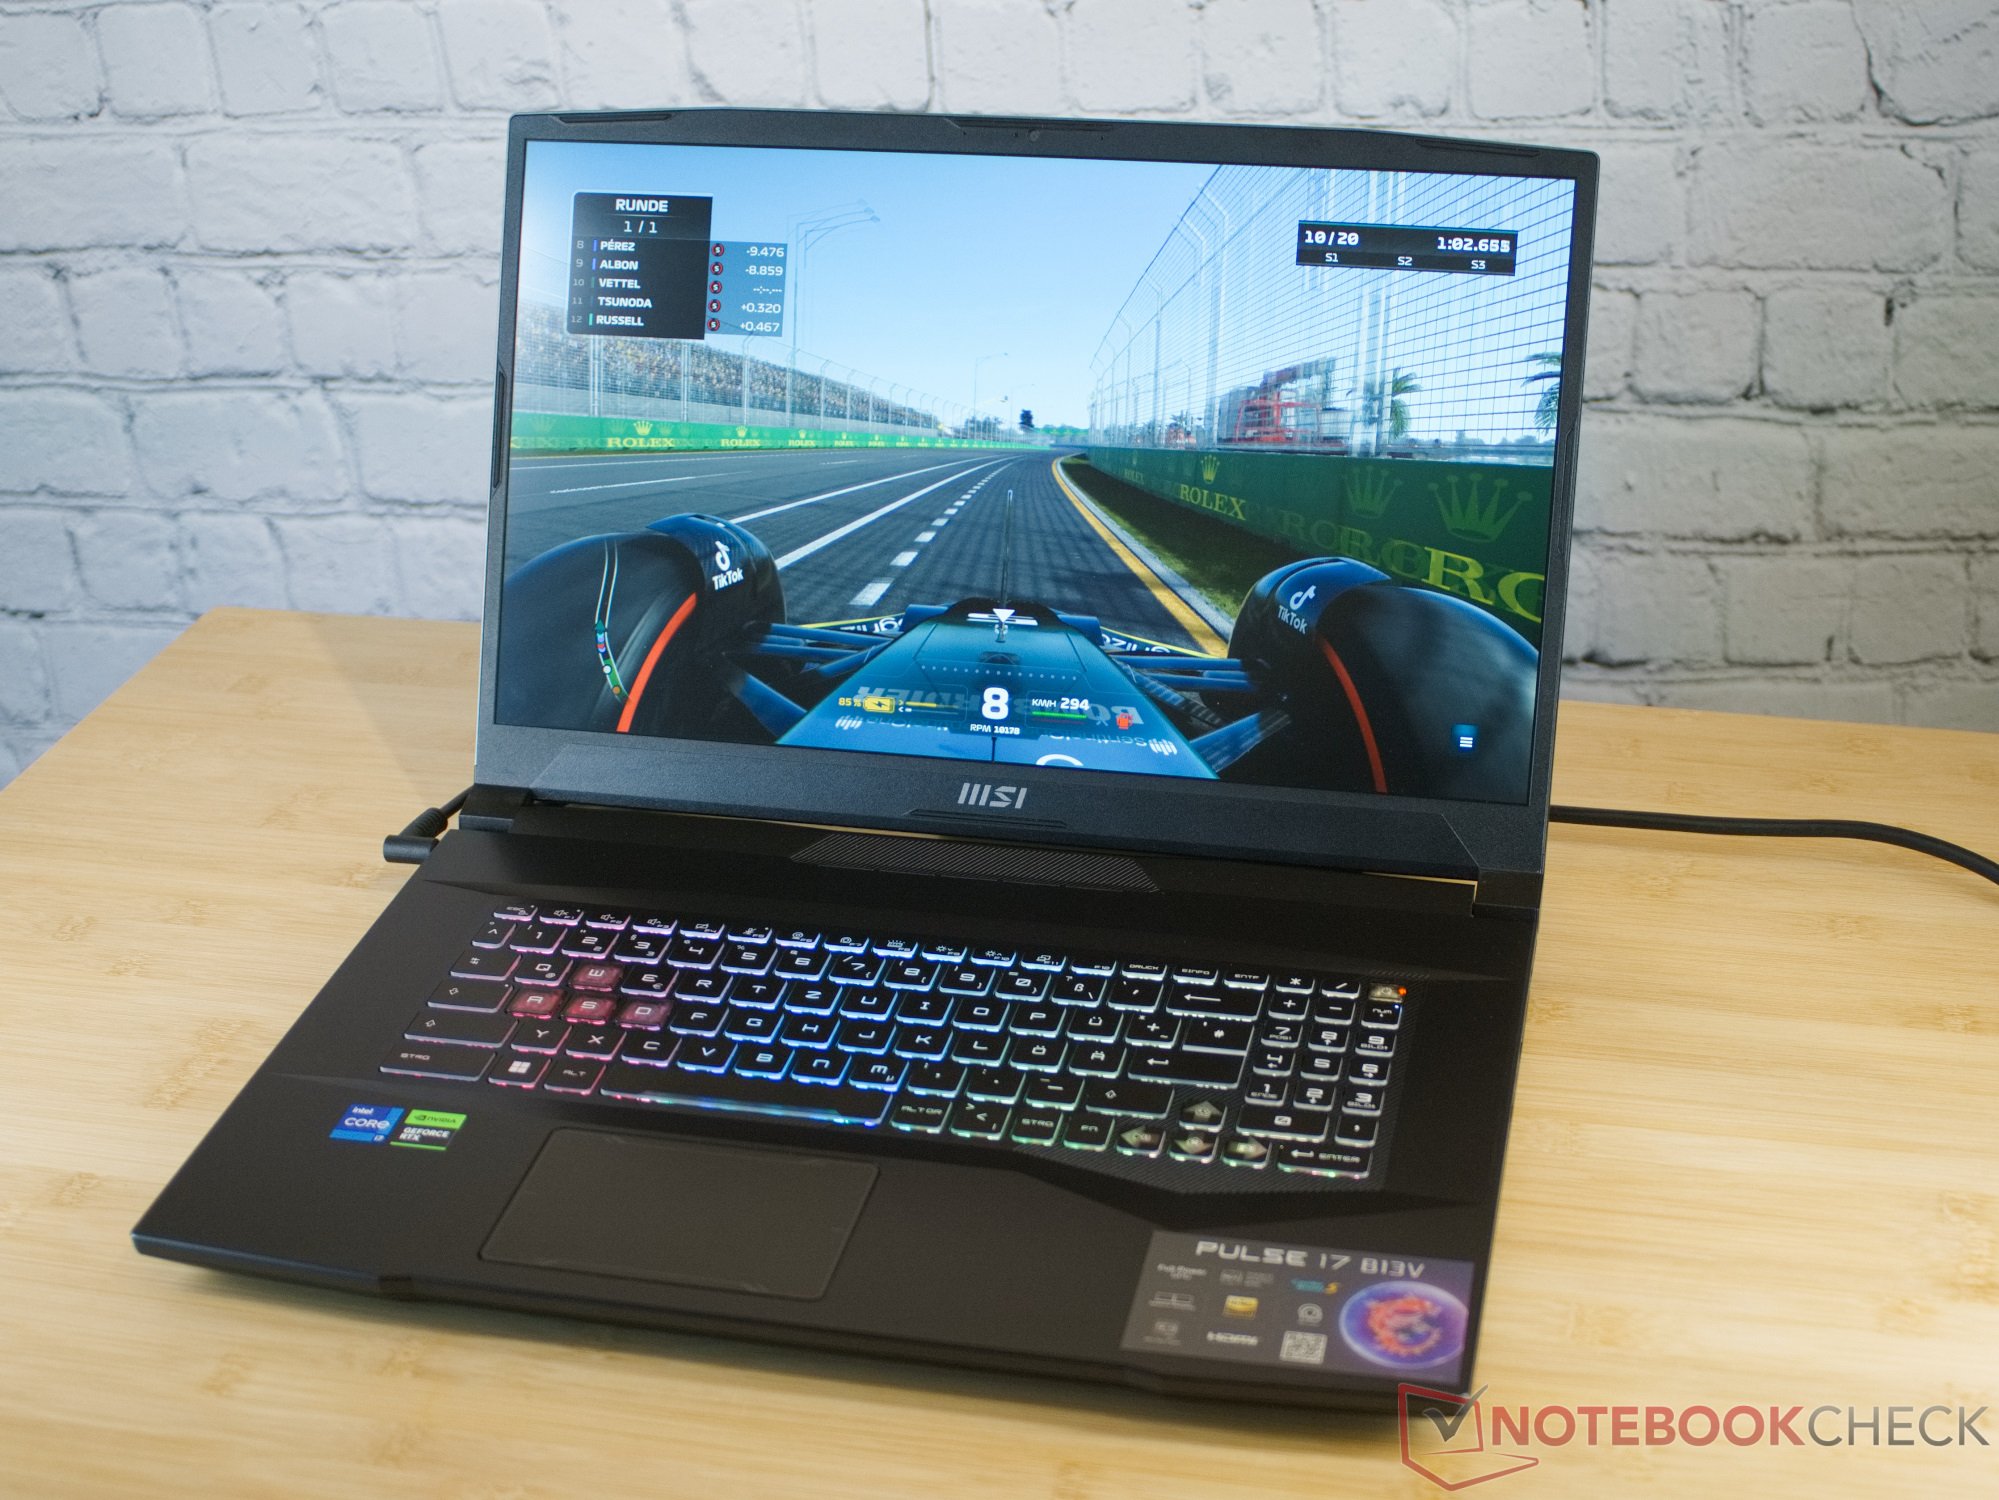
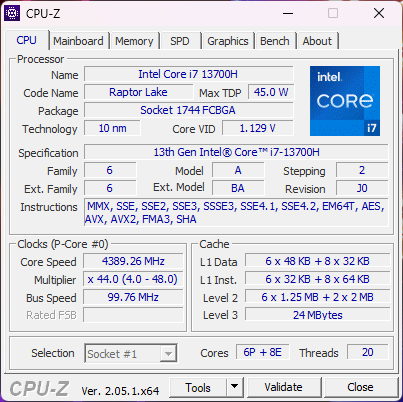
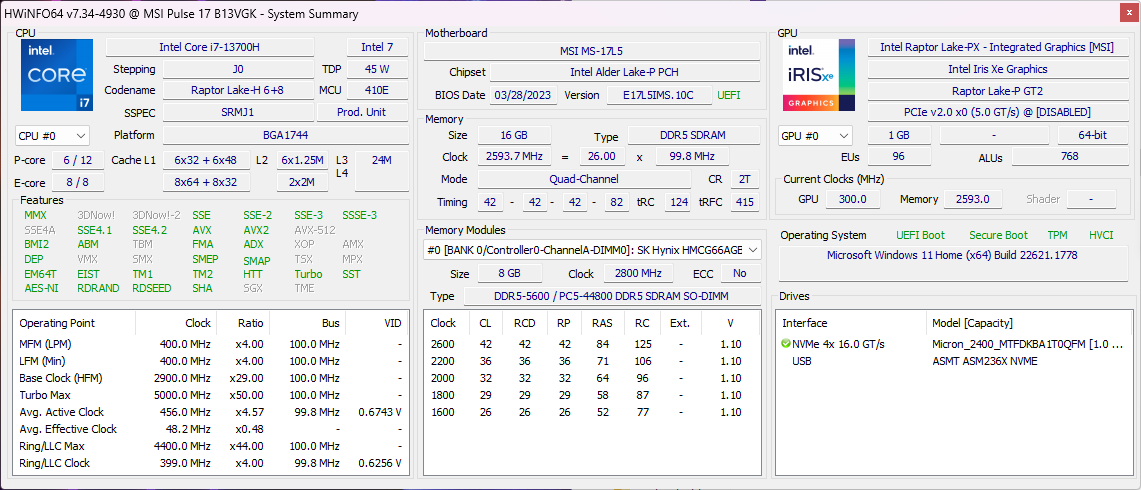
性能 - 非常强大的英特尔酷睿i7-13700H处理器
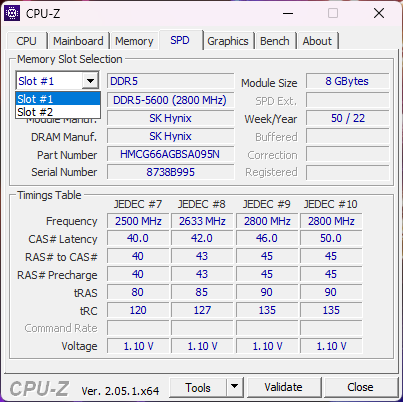
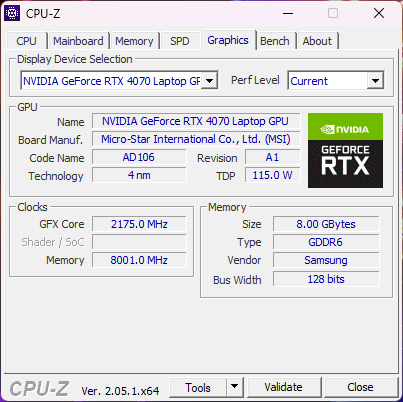
微星Pulse 17 B13V有两种设备配置,仅在GPU方面有所不同。我们的测试机使用的是NvidiaGeForce RTX 4070而另一种配置则配备了 RTX 4060.处理器 英特尔酷睿i7-13700H处理器。它配备了16 GB DDR5-5200内存和1 TB容量的固态硬盘。在如此强大的硬件配置下,我们的测试机适用于全高清以上分辨率的游戏。
电源控制和测试条件
微星在Pulse 17中提供了三种性能配置文件和一种省电模式。此外,您还可以使用微星的AI模式。当CPU单独运行时,在极致性能模式下,它能够使用90瓦的PL1,以及140瓦的强大提升性能(PL2)。在平衡模式下,PL1和PL2分别为70瓦和120瓦。在静音模式下,风扇不工作,功率为30瓦。
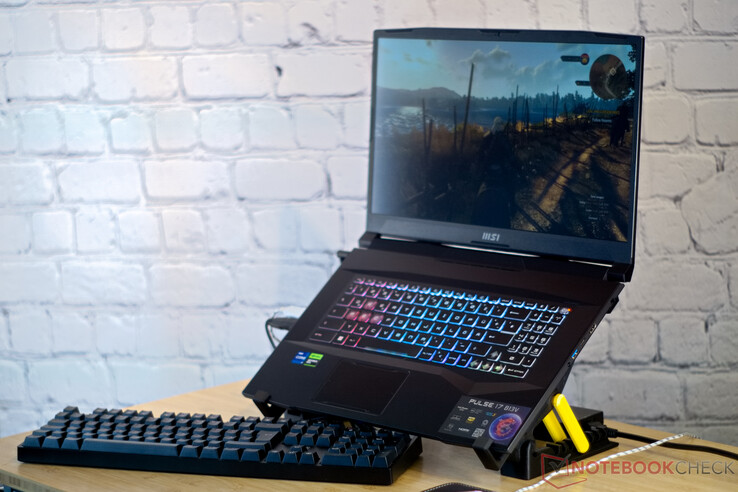
但对于游戏笔记本电脑来说,更有趣的是游戏时的性能。在我们测试的前10分钟内,三种性能模式几乎没有差别。只有温度值不同。性能模式和平衡模式确保CPU和GPU温度恒定。在 "安静运行 "模式下,温度升得很高,导致性能下降,大约10分钟后性能明显下降。
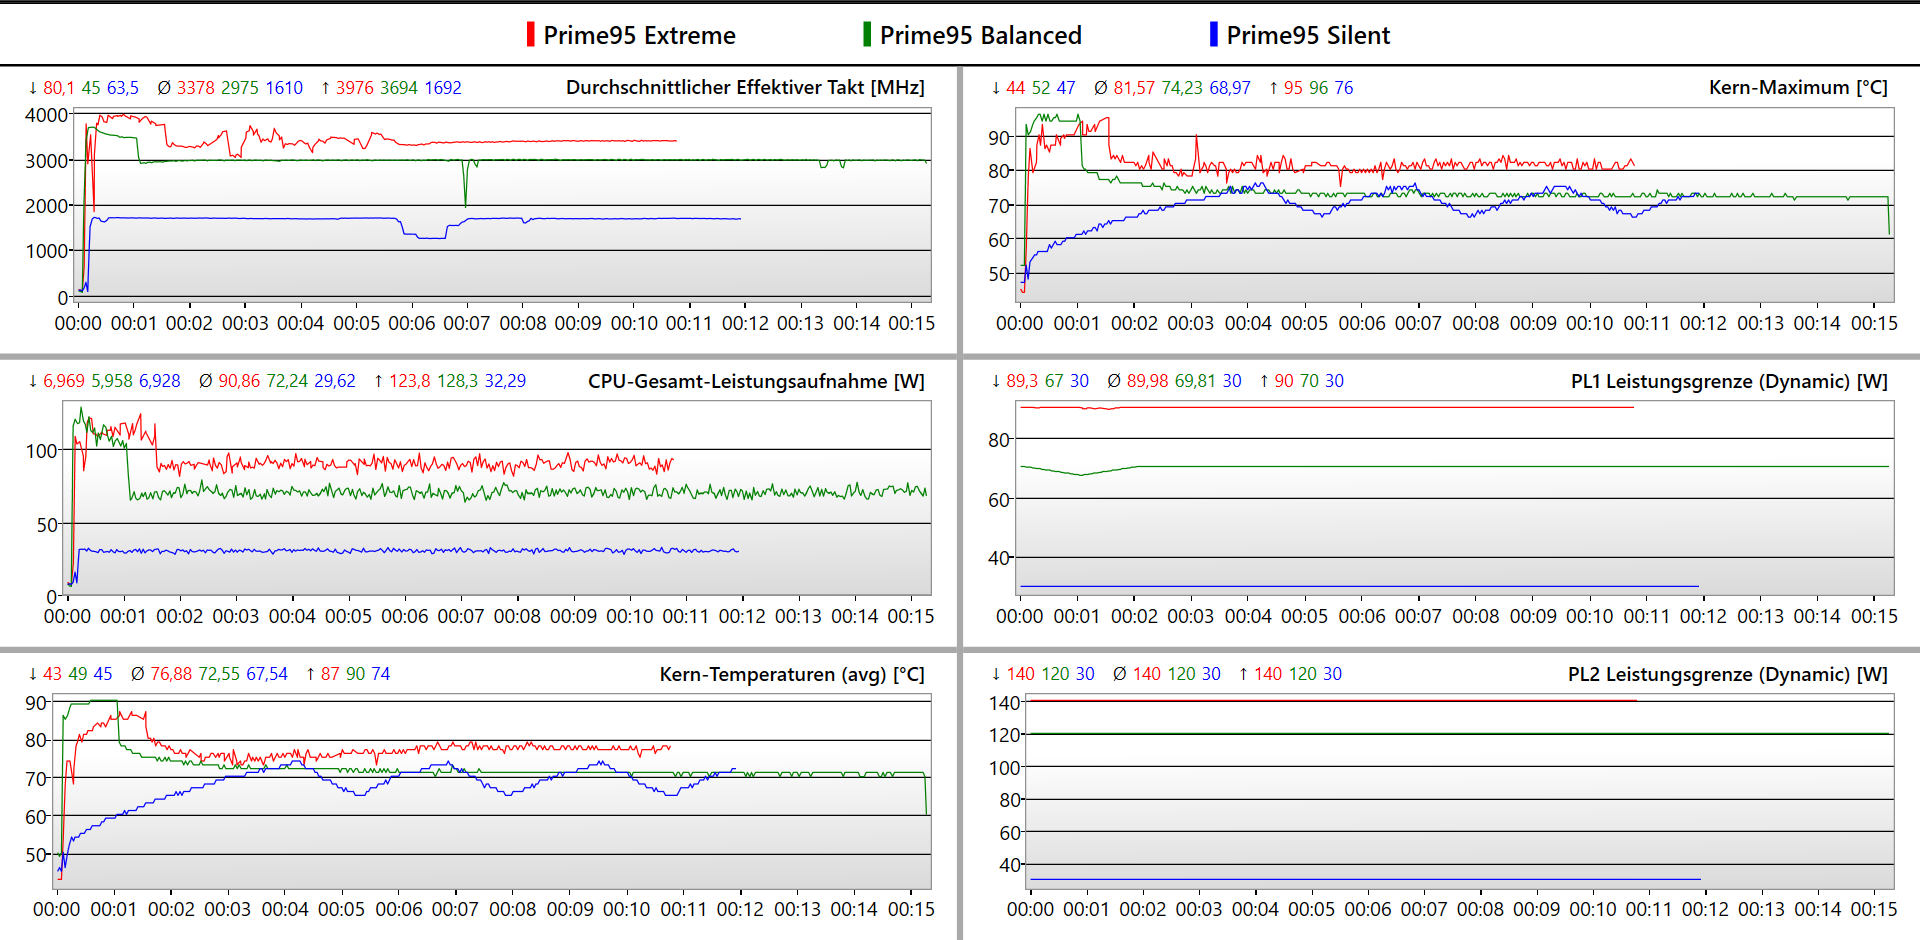
因此,我们决定在性能模式下运行所有通用基准测试,在平衡模式下运行游戏基准测试。在我们测试的所有游戏中,我们还在性能模式下以最高画质设置运行了额外的基准测试。在整个测试过程中,所达到的帧率相差不到一个百分点。这意味着性能模式在游戏中几乎没有任何FPS优势。
处理器
英特尔酷睿i7-13700H拥有6个P核和8个E核。 英特尔酷睿i7-13700HPulse 17中的英特尔酷睿i7-13700H能够处理20个线程。该处理器提供了相对较高的功率,因此能够勉强领先于其他采用酷睿i7的对比设备。然而XMG Focus 17配备了酷睿i9和 华硕ROG Strix G17搭载Ryzen 9明显超过i7处理器。
Cinebench R15 Multi Constant Load Test
Cinebench R23: Multi Core | Single Core
Cinebench R20: CPU (Multi Core) | CPU (Single Core)
Cinebench R15: CPU Multi 64Bit | CPU Single 64Bit
Blender: v2.79 BMW27 CPU
7-Zip 18.03: 7z b 4 | 7z b 4 -mmt1
Geekbench 5.5: Multi-Core | Single-Core
HWBOT x265 Benchmark v2.2: 4k Preset
LibreOffice : 20 Documents To PDF
R Benchmark 2.5: Overall mean
| CPU Performance rating | |
| Asus ROG Strix G17 G713PI | |
| Schenker XMG Focus 17 (E23) | |
| Average of class Gaming | |
| MSI Pulse 17 B13VGK | |
| MSI Pulse GL76 12UGK | |
| Average Intel Core i7-13700H | |
| MSI Katana 17 B13VFK | |
| Acer Nitro 17 AN17-51-71ER | |
| Cinebench R23 / Multi Core | |
| Asus ROG Strix G17 G713PI | |
| Schenker XMG Focus 17 (E23) | |
| Average of class Gaming (10488 - 42661, n=107, last 2 years) | |
| Acer Nitro 17 AN17-51-71ER | |
| MSI Pulse 17 B13VGK | |
| MSI Pulse GL76 12UGK | |
| MSI Katana 17 B13VFK | |
| Average Intel Core i7-13700H (5890 - 20034, n=29) | |
| Cinebench R23 / Single Core | |
| Average of class Gaming (1166 - 2415, n=107, last 2 years) | |
| Schenker XMG Focus 17 (E23) | |
| Asus ROG Strix G17 G713PI | |
| MSI Katana 17 B13VFK | |
| Average Intel Core i7-13700H (1323 - 1914, n=29) | |
| MSI Pulse GL76 12UGK | |
| MSI Pulse 17 B13VGK | |
| Acer Nitro 17 AN17-51-71ER | |
| Cinebench R20 / CPU (Multi Core) | |
| Average of class Gaming (4029 - 16433, n=106, last 2 years) | |
| Schenker XMG Focus 17 (E23) | |
| Asus ROG Strix G17 G713PI | |
| MSI Pulse 17 B13VGK | |
| Acer Nitro 17 AN17-51-71ER | |
| MSI Pulse GL76 12UGK | |
| MSI Katana 17 B13VFK | |
| Average Intel Core i7-13700H (2322 - 7674, n=29) | |
| Cinebench R20 / CPU (Single Core) | |
| Average of class Gaming (442 - 913, n=106, last 2 years) | |
| Schenker XMG Focus 17 (E23) | |
| Asus ROG Strix G17 G713PI | |
| Average Intel Core i7-13700H (508 - 741, n=29) | |
| MSI Katana 17 B13VFK | |
| MSI Pulse GL76 12UGK | |
| MSI Pulse 17 B13VGK | |
| Acer Nitro 17 AN17-51-71ER | |
| Cinebench R15 / CPU Multi 64Bit | |
| Asus ROG Strix G17 G713PI | |
| Schenker XMG Focus 17 (E23) | |
| Average of class Gaming (1578 - 6330, n=105, last 2 years) | |
| Acer Nitro 17 AN17-51-71ER | |
| MSI Pulse 17 B13VGK | |
| MSI Pulse GL76 12UGK | |
| Average Intel Core i7-13700H (905 - 2982, n=29) | |
| MSI Katana 17 B13VFK | |
| Cinebench R15 / CPU Single 64Bit | |
| Average of class Gaming (188.8 - 350, n=106, last 2 years) | |
| Asus ROG Strix G17 G713PI | |
| Schenker XMG Focus 17 (E23) | |
| Average Intel Core i7-13700H (213 - 278, n=29) | |
| MSI Katana 17 B13VFK | |
| MSI Pulse GL76 12UGK | |
| MSI Pulse 17 B13VGK | |
| Acer Nitro 17 AN17-51-71ER | |
| Blender / v2.79 BMW27 CPU | |
| Average Intel Core i7-13700H (169 - 555, n=29) | |
| MSI Katana 17 B13VFK | |
| MSI Pulse GL76 12UGK | |
| Acer Nitro 17 AN17-51-71ER | |
| MSI Pulse 17 B13VGK | |
| Average of class Gaming (79 - 330, n=104, last 2 years) | |
| Schenker XMG Focus 17 (E23) | |
| Asus ROG Strix G17 G713PI | |
| 7-Zip 18.03 / 7z b 4 | |
| Asus ROG Strix G17 G713PI | |
| Schenker XMG Focus 17 (E23) | |
| Average of class Gaming (33491 - 148086, n=105, last 2 years) | |
| MSI Pulse 17 B13VGK | |
| Acer Nitro 17 AN17-51-71ER | |
| MSI Pulse GL76 12UGK | |
| MSI Katana 17 B13VFK | |
| Average Intel Core i7-13700H (27322 - 76344, n=29) | |
| 7-Zip 18.03 / 7z b 4 -mmt1 | |
| Asus ROG Strix G17 G713PI | |
| Schenker XMG Focus 17 (E23) | |
| Average of class Gaming (4199 - 7436, n=105, last 2 years) | |
| Average Intel Core i7-13700H (4825 - 6238, n=29) | |
| MSI Katana 17 B13VFK | |
| MSI Pulse GL76 12UGK | |
| MSI Pulse 17 B13VGK | |
| Acer Nitro 17 AN17-51-71ER | |
| Geekbench 5.5 / Multi-Core | |
| Asus ROG Strix G17 G713PI | |
| Schenker XMG Focus 17 (E23) | |
| Average of class Gaming (6460 - 28263, n=105, last 2 years) | |
| MSI Pulse 17 B13VGK | |
| Acer Nitro 17 AN17-51-71ER | |
| MSI Pulse GL76 12UGK | |
| Average Intel Core i7-13700H (6165 - 14215, n=29) | |
| MSI Katana 17 B13VFK | |
| Geekbench 5.5 / Single-Core | |
| Average of class Gaming (986 - 2474, n=105, last 2 years) | |
| Asus ROG Strix G17 G713PI | |
| Schenker XMG Focus 17 (E23) | |
| Average Intel Core i7-13700H (1362 - 1919, n=29) | |
| MSI Katana 17 B13VFK | |
| MSI Pulse 17 B13VGK | |
| MSI Pulse GL76 12UGK | |
| Acer Nitro 17 AN17-51-71ER | |
| HWBOT x265 Benchmark v2.2 / 4k Preset | |
| Asus ROG Strix G17 G713PI | |
| Average of class Gaming (11.5 - 44.4, n=105, last 2 years) | |
| Schenker XMG Focus 17 (E23) | |
| MSI Pulse 17 B13VGK | |
| Acer Nitro 17 AN17-51-71ER | |
| MSI Pulse GL76 12UGK | |
| MSI Katana 17 B13VFK | |
| Average Intel Core i7-13700H (6.72 - 21.2, n=29) | |
| LibreOffice / 20 Documents To PDF | |
| MSI Pulse 17 B13VGK | |
| MSI Katana 17 B13VFK | |
| Acer Nitro 17 AN17-51-71ER | |
| Schenker XMG Focus 17 (E23) | |
| Average of class Gaming (33.2 - 88.8, n=105, last 2 years) | |
| Average Intel Core i7-13700H (31.3 - 62.4, n=29) | |
| MSI Pulse GL76 12UGK | |
| Asus ROG Strix G17 G713PI | |
| R Benchmark 2.5 / Overall mean | |
| Acer Nitro 17 AN17-51-71ER | |
| MSI Pulse 17 B13VGK | |
| MSI Pulse GL76 12UGK | |
| Average Intel Core i7-13700H (0.4308 - 0.607, n=29) | |
| MSI Katana 17 B13VFK | |
| Average of class Gaming (0.3439 - 0.759, n=106, last 2 years) | |
| Schenker XMG Focus 17 (E23) | |
| Asus ROG Strix G17 G713PI | |
* ... smaller is better
AIDA64: FP32 Ray-Trace | FPU Julia | CPU SHA3 | CPU Queen | FPU SinJulia | FPU Mandel | CPU AES | CPU ZLib | FP64 Ray-Trace | CPU PhotoWorxx
| Performance rating | |
| Asus ROG Strix G17 G713PI | |
| Average of class Gaming | |
| Schenker XMG Focus 17 (E23) | |
| Acer Nitro 17 AN17-51-71ER | |
| MSI Pulse 17 B13VGK | |
| MSI Pulse GL76 12UGK | |
| Average Intel Core i7-13700H | |
| MSI Katana 17 B13VFK | |
| AIDA64 / FP32 Ray-Trace | |
| Asus ROG Strix G17 G713PI | |
| Average of class Gaming (10227 - 85542, n=105, last 2 years) | |
| Schenker XMG Focus 17 (E23) | |
| MSI Pulse 17 B13VGK | |
| Acer Nitro 17 AN17-51-71ER | |
| MSI Pulse GL76 12UGK | |
| Average Intel Core i7-13700H (4986 - 18908, n=29) | |
| MSI Katana 17 B13VFK | |
| AIDA64 / FPU Julia | |
| Asus ROG Strix G17 G713PI | |
| Average of class Gaming (51376 - 238426, n=105, last 2 years) | |
| Schenker XMG Focus 17 (E23) | |
| MSI Pulse 17 B13VGK | |
| Acer Nitro 17 AN17-51-71ER | |
| MSI Pulse GL76 12UGK | |
| Average Intel Core i7-13700H (25360 - 92359, n=29) | |
| MSI Katana 17 B13VFK | |
| AIDA64 / CPU SHA3 | |
| Asus ROG Strix G17 G713PI | |
| Average of class Gaming (2180 - 10115, n=105, last 2 years) | |
| Schenker XMG Focus 17 (E23) | |
| Acer Nitro 17 AN17-51-71ER | |
| MSI Pulse 17 B13VGK | |
| MSI Pulse GL76 12UGK | |
| Average Intel Core i7-13700H (1339 - 4224, n=29) | |
| MSI Katana 17 B13VFK | |
| AIDA64 / CPU Queen | |
| Asus ROG Strix G17 G713PI | |
| Schenker XMG Focus 17 (E23) | |
| Average of class Gaming (49785 - 173351, n=90, last 2 years) | |
| MSI Pulse GL76 12UGK | |
| Acer Nitro 17 AN17-51-71ER | |
| MSI Pulse 17 B13VGK | |
| Average Intel Core i7-13700H (59324 - 107159, n=29) | |
| MSI Katana 17 B13VFK | |
| AIDA64 / FPU SinJulia | |
| Asus ROG Strix G17 G713PI | |
| Average of class Gaming (4424 - 33636, n=105, last 2 years) | |
| Schenker XMG Focus 17 (E23) | |
| MSI Pulse 17 B13VGK | |
| Acer Nitro 17 AN17-51-71ER | |
| MSI Pulse GL76 12UGK | |
| Average Intel Core i7-13700H (4800 - 11050, n=29) | |
| MSI Katana 17 B13VFK | |
| AIDA64 / FPU Mandel | |
| Asus ROG Strix G17 G713PI | |
| Average of class Gaming (25115 - 128721, n=105, last 2 years) | |
| Schenker XMG Focus 17 (E23) | |
| MSI Pulse 17 B13VGK | |
| Acer Nitro 17 AN17-51-71ER | |
| MSI Pulse GL76 12UGK | |
| Average Intel Core i7-13700H (12321 - 45118, n=29) | |
| MSI Katana 17 B13VFK | |
| AIDA64 / CPU AES | |
| Asus ROG Strix G17 G713PI | |
| Acer Nitro 17 AN17-51-71ER | |
| MSI Pulse GL76 12UGK | |
| Average of class Gaming (39258 - 247074, n=105, last 2 years) | |
| Schenker XMG Focus 17 (E23) | |
| MSI Pulse 17 B13VGK | |
| Average Intel Core i7-13700H (28769 - 151254, n=29) | |
| MSI Katana 17 B13VFK | |
| AIDA64 / CPU ZLib | |
| Asus ROG Strix G17 G713PI | |
| Schenker XMG Focus 17 (E23) | |
| Average of class Gaming (574 - 2531, n=105, last 2 years) | |
| Acer Nitro 17 AN17-51-71ER | |
| MSI Pulse 17 B13VGK | |
| MSI Pulse GL76 12UGK | |
| Average Intel Core i7-13700H (389 - 1215, n=29) | |
| MSI Katana 17 B13VFK | |
| AIDA64 / FP64 Ray-Trace | |
| Asus ROG Strix G17 G713PI | |
| Average of class Gaming (5509 - 45446, n=105, last 2 years) | |
| Schenker XMG Focus 17 (E23) | |
| MSI Pulse 17 B13VGK | |
| Acer Nitro 17 AN17-51-71ER | |
| MSI Pulse GL76 12UGK | |
| Average Intel Core i7-13700H (2540 - 10135, n=29) | |
| MSI Katana 17 B13VFK | |
| AIDA64 / CPU PhotoWorxx | |
| Schenker XMG Focus 17 (E23) | |
| Average of class Gaming (12271 - 89891, n=105, last 2 years) | |
| Average Intel Core i7-13700H (12872 - 52727, n=29) | |
| MSI Pulse 17 B13VGK | |
| Acer Nitro 17 AN17-51-71ER | |
| MSI Katana 17 B13VFK | |
| Asus ROG Strix G17 G713PI | |
| MSI Pulse GL76 12UGK | |
系统性能
CrossMark: Overall | Productivity | Creativity | Responsiveness
| PCMark 10 / Score | |
| Average of class Gaming (5828 - 12414, n=93, last 2 years) | |
| MSI Pulse 17 B13VGK | |
| MSI Pulse GL76 12UGK | |
| Asus ROG Strix G17 G713PI | |
| Average Intel Core i7-13700H, NVIDIA GeForce RTX 4070 Laptop GPU (7158 - 7956, n=8) | |
| MSI Katana 17 B13VFK | |
| Acer Nitro 17 AN17-51-71ER | |
| Schenker XMG Focus 17 (E23) | |
| PCMark 10 / Essentials | |
| Asus ROG Strix G17 G713PI | |
| MSI Pulse GL76 12UGK | |
| MSI Katana 17 B13VFK | |
| Average Intel Core i7-13700H, NVIDIA GeForce RTX 4070 Laptop GPU (10252 - 11449, n=8) | |
| Average of class Gaming (8810 - 11935, n=97, last 2 years) | |
| MSI Pulse 17 B13VGK | |
| Acer Nitro 17 AN17-51-71ER | |
| Schenker XMG Focus 17 (E23) | |
| PCMark 10 / Productivity | |
| Average of class Gaming (6845 - 25323, n=95, last 2 years) | |
| Asus ROG Strix G17 G713PI | |
| MSI Pulse 17 B13VGK | |
| MSI Pulse GL76 12UGK | |
| Schenker XMG Focus 17 (E23) | |
| Average Intel Core i7-13700H, NVIDIA GeForce RTX 4070 Laptop GPU (8501 - 10769, n=8) | |
| MSI Katana 17 B13VFK | |
| Acer Nitro 17 AN17-51-71ER | |
| PCMark 10 / Digital Content Creation | |
| Average of class Gaming (7602 - 19954, n=95, last 2 years) | |
| Acer Nitro 17 AN17-51-71ER | |
| MSI Pulse 17 B13VGK | |
| MSI Pulse GL76 12UGK | |
| Average Intel Core i7-13700H, NVIDIA GeForce RTX 4070 Laptop GPU (10358 - 12908, n=8) | |
| MSI Katana 17 B13VFK | |
| Schenker XMG Focus 17 (E23) | |
| Asus ROG Strix G17 G713PI | |
| CrossMark / Overall | |
| Asus ROG Strix G17 G713PI | |
| Schenker XMG Focus 17 (E23) | |
| Average of class Gaming (1366 - 2409, n=94, last 2 years) | |
| MSI Pulse 17 B13VGK | |
| Average Intel Core i7-13700H, NVIDIA GeForce RTX 4070 Laptop GPU (1768 - 2073, n=6) | |
| MSI Katana 17 B13VFK | |
| MSI Pulse GL76 12UGK | |
| Acer Nitro 17 AN17-51-71ER | |
| CrossMark / Productivity | |
| Asus ROG Strix G17 G713PI | |
| Schenker XMG Focus 17 (E23) | |
| Average of class Gaming (1386 - 2254, n=94, last 2 years) | |
| MSI Pulse 17 B13VGK | |
| Average Intel Core i7-13700H, NVIDIA GeForce RTX 4070 Laptop GPU (1645 - 2006, n=6) | |
| MSI Pulse GL76 12UGK | |
| MSI Katana 17 B13VFK | |
| Acer Nitro 17 AN17-51-71ER | |
| CrossMark / Creativity | |
| Asus ROG Strix G17 G713PI | |
| Schenker XMG Focus 17 (E23) | |
| Average of class Gaming (1343 - 2786, n=94, last 2 years) | |
| MSI Pulse 17 B13VGK | |
| Average Intel Core i7-13700H, NVIDIA GeForce RTX 4070 Laptop GPU (1936 - 2137, n=6) | |
| MSI Katana 17 B13VFK | |
| MSI Pulse GL76 12UGK | |
| Acer Nitro 17 AN17-51-71ER | |
| CrossMark / Responsiveness | |
| MSI Pulse GL76 12UGK | |
| MSI Pulse 17 B13VGK | |
| Schenker XMG Focus 17 (E23) | |
| Average Intel Core i7-13700H, NVIDIA GeForce RTX 4070 Laptop GPU (1451 - 2202, n=6) | |
| MSI Katana 17 B13VFK | |
| Average of class Gaming (1226 - 2334, n=94, last 2 years) | |
| Asus ROG Strix G17 G713PI | |
| Acer Nitro 17 AN17-51-71ER | |
| PCMark 10 Score | 7796 points | |
Help | ||
| AIDA64 / Memory Copy | |
| Schenker XMG Focus 17 (E23) | |
| Average of class Gaming (21750 - 129946, n=105, last 2 years) | |
| Average Intel Core i7-13700H (24334 - 78081, n=29) | |
| MSI Pulse 17 B13VGK | |
| Acer Nitro 17 AN17-51-71ER | |
| MSI Katana 17 B13VFK | |
| Asus ROG Strix G17 G713PI | |
| MSI Pulse GL76 12UGK | |
| AIDA64 / Memory Read | |
| Schenker XMG Focus 17 (E23) | |
| Average of class Gaming (22956 - 118858, n=105, last 2 years) | |
| MSI Pulse 17 B13VGK | |
| Acer Nitro 17 AN17-51-71ER | |
| Average Intel Core i7-13700H (23681 - 79656, n=29) | |
| MSI Katana 17 B13VFK | |
| Asus ROG Strix G17 G713PI | |
| MSI Pulse GL76 12UGK | |
| AIDA64 / Memory Write | |
| Average of class Gaming (22297 - 135096, n=105, last 2 years) | |
| Schenker XMG Focus 17 (E23) | |
| Average Intel Core i7-13700H (22986 - 99898, n=29) | |
| Acer Nitro 17 AN17-51-71ER | |
| MSI Pulse 17 B13VGK | |
| Asus ROG Strix G17 G713PI | |
| MSI Katana 17 B13VFK | |
| MSI Pulse GL76 12UGK | |
| AIDA64 / Memory Latency | |
| Acer Nitro 17 AN17-51-71ER | |
| Average of class Gaming (75.3 - 259, n=105, last 2 years) | |
| MSI Katana 17 B13VFK | |
| MSI Pulse 17 B13VGK | |
| Average Intel Core i7-13700H (82.4 - 136.8, n=29) | |
| MSI Pulse GL76 12UGK | |
| Schenker XMG Focus 17 (E23) | |
| Asus ROG Strix G17 G713PI | |
* ... smaller is better
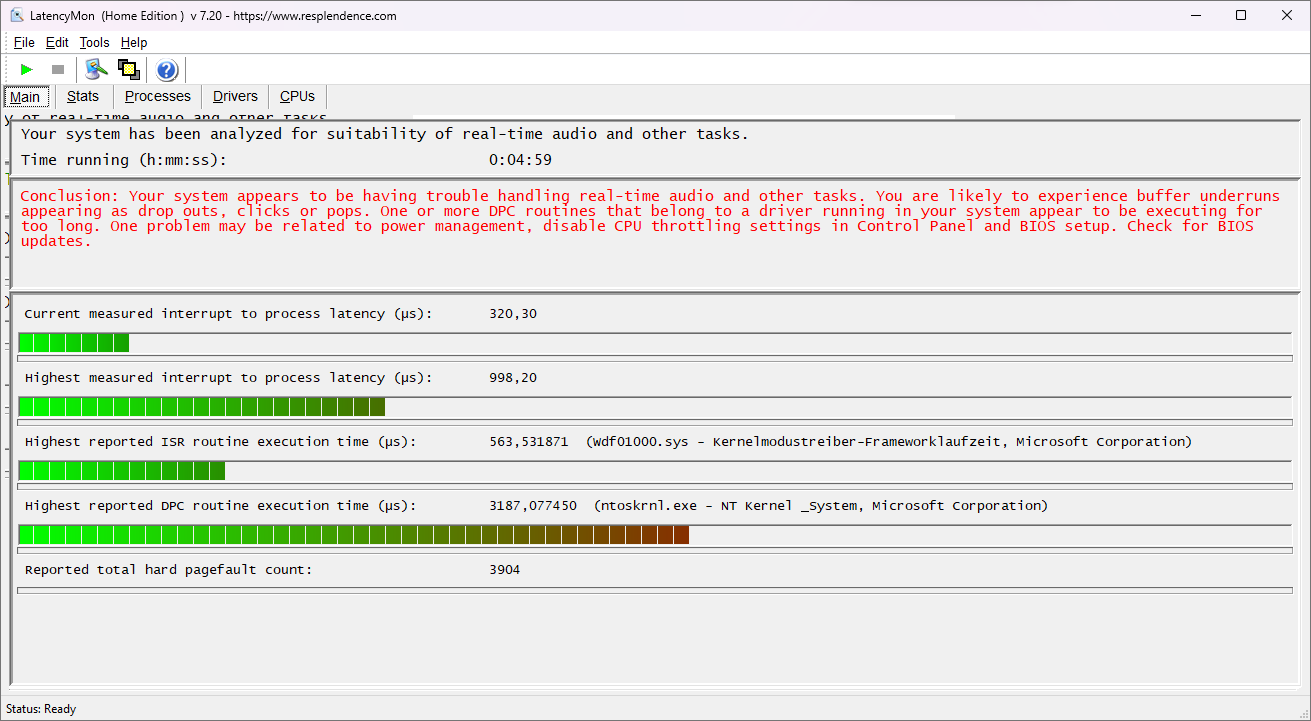
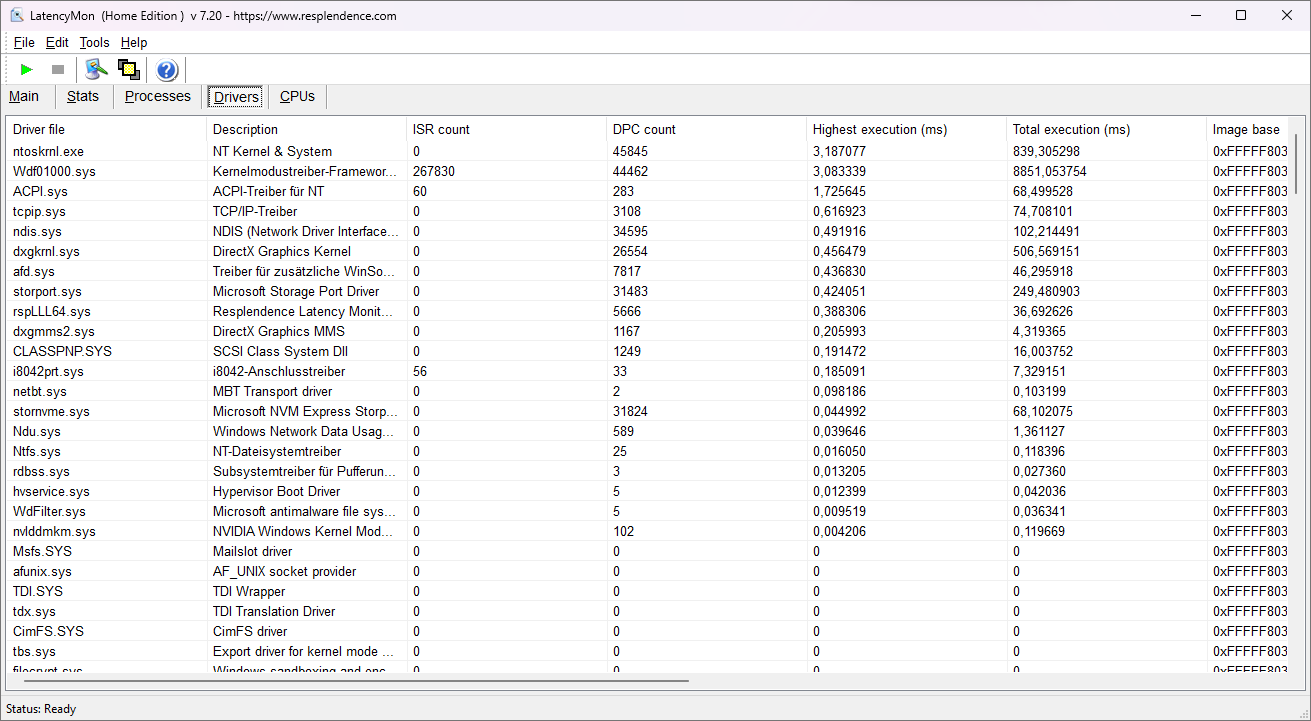
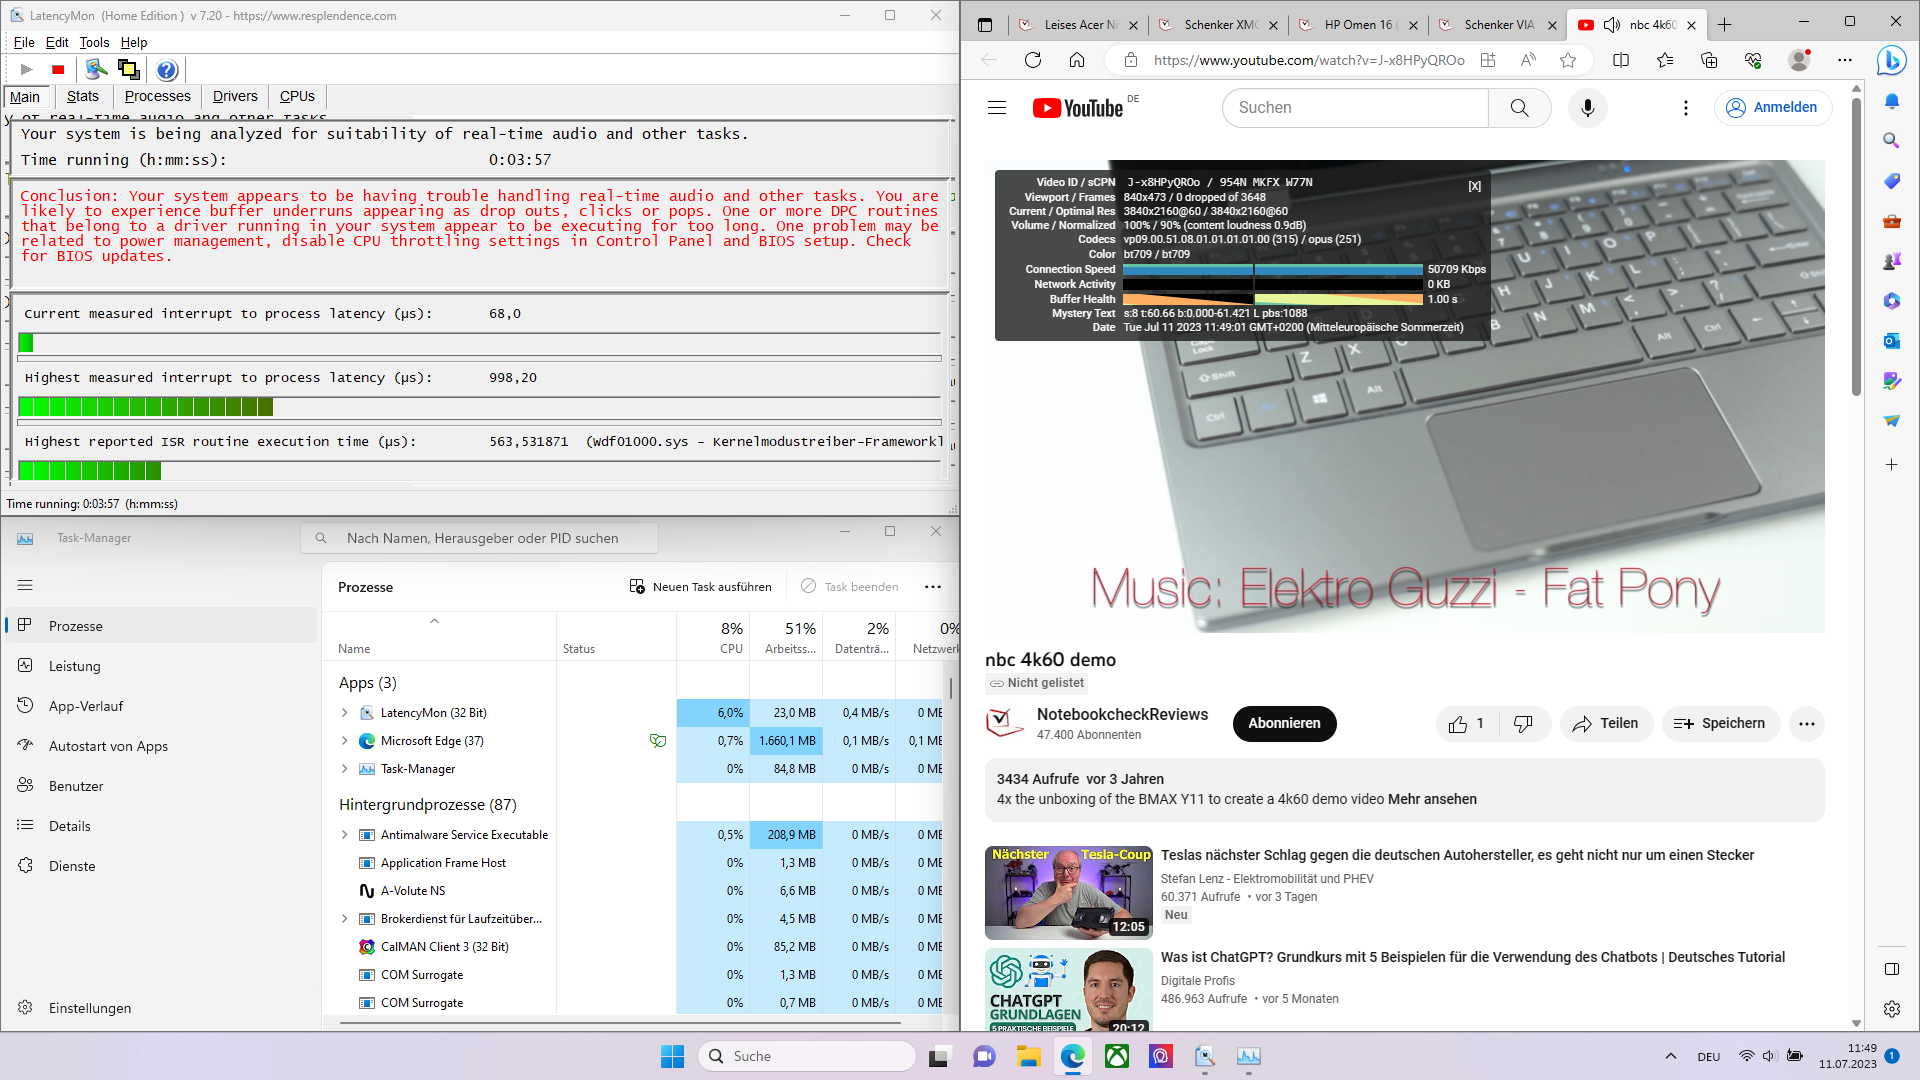
DPC延迟
在DPC延迟中,LatencyMon确定测试时可用更新的游戏笔记本电脑不适合实时处理音频。问题显然出在Windows内核上。
| DPC Latencies / LatencyMon - interrupt to process latency (max), Web, Youtube, Prime95 | |
| MSI Katana 17 B13VFK | |
| Asus ROG Strix G17 G713PI | |
| Acer Nitro 17 AN17-51-71ER | |
| MSI Pulse 17 B13VGK | |
| Schenker XMG Focus 17 (E23) | |
| MSI Pulse GL76 12UGK | |
* ... smaller is better
存储解决方案
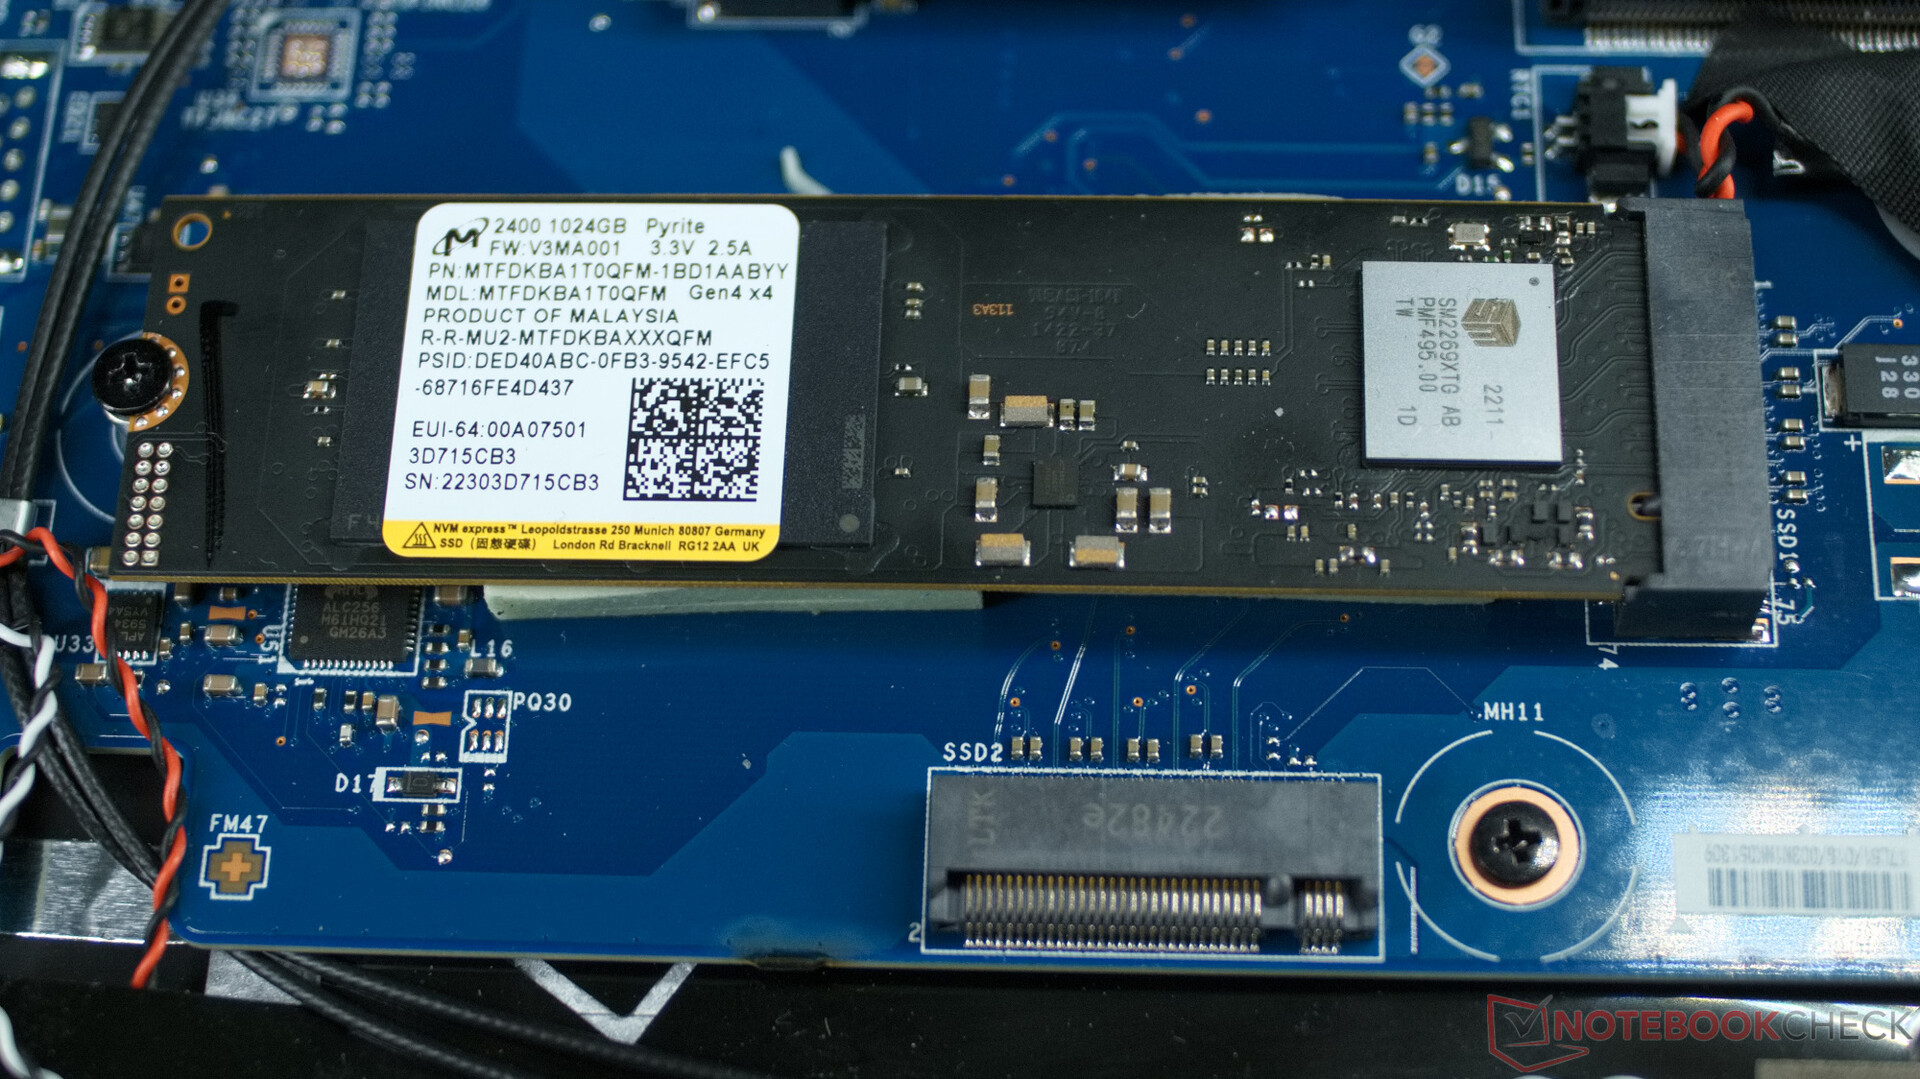
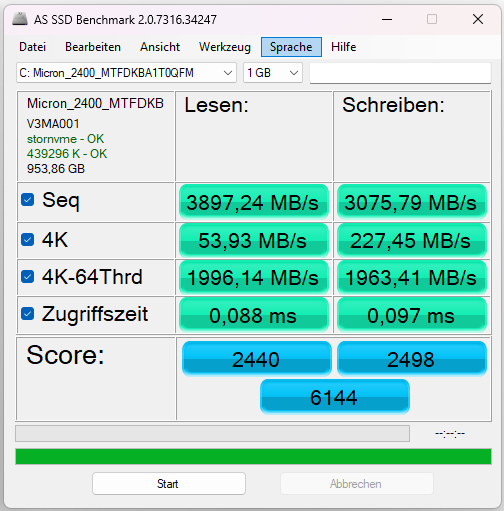
美光美光2400 NVMe固态硬盘的容量为1TB。其速度在游戏笔记本电脑中处于平均水平,在微星Pulse 17中长时间持续运行也不会出现任何问题。

* ... smaller is better
Constant Read Performance: DiskSpd Read Loop, Queue Depth 8
显卡
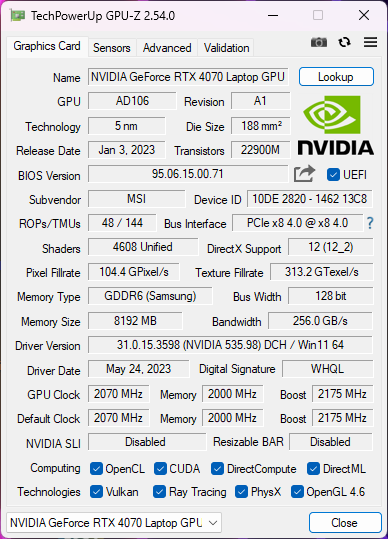
撅蝷Nvidia RTX 4070在微星Pulse 17中,Nvidia RTX 4070能够以100至140瓦的功率持续运行,芯片温度不会过高。因此,该图形芯片在3DMark基准测试中提供了相对较高的性能。这意味着全高清游戏和一些轻微的光线追踪应该不会对显卡造成任何问题,芯片还能快速掌握实际应用,如在Blender等程序中渲染3D图形。
| 3DMark 11 Performance | 34584 points | |
| 3DMark Cloud Gate Standard Score | 70329 points | |
| 3DMark Fire Strike Score | 27138 points | |
| 3DMark Time Spy Score | 12235 points | |
Help | ||
| Geekbench 6.7 - GPU OpenCL | |
| Average of class Gaming (67235 - 253130, n=103, last 2 years) | |
| MSI Pulse 17 B13VGK | |
| Average NVIDIA GeForce RTX 4070 Laptop GPU (85488 - 129836, n=45) | |
* ... smaller is better
游戏性能
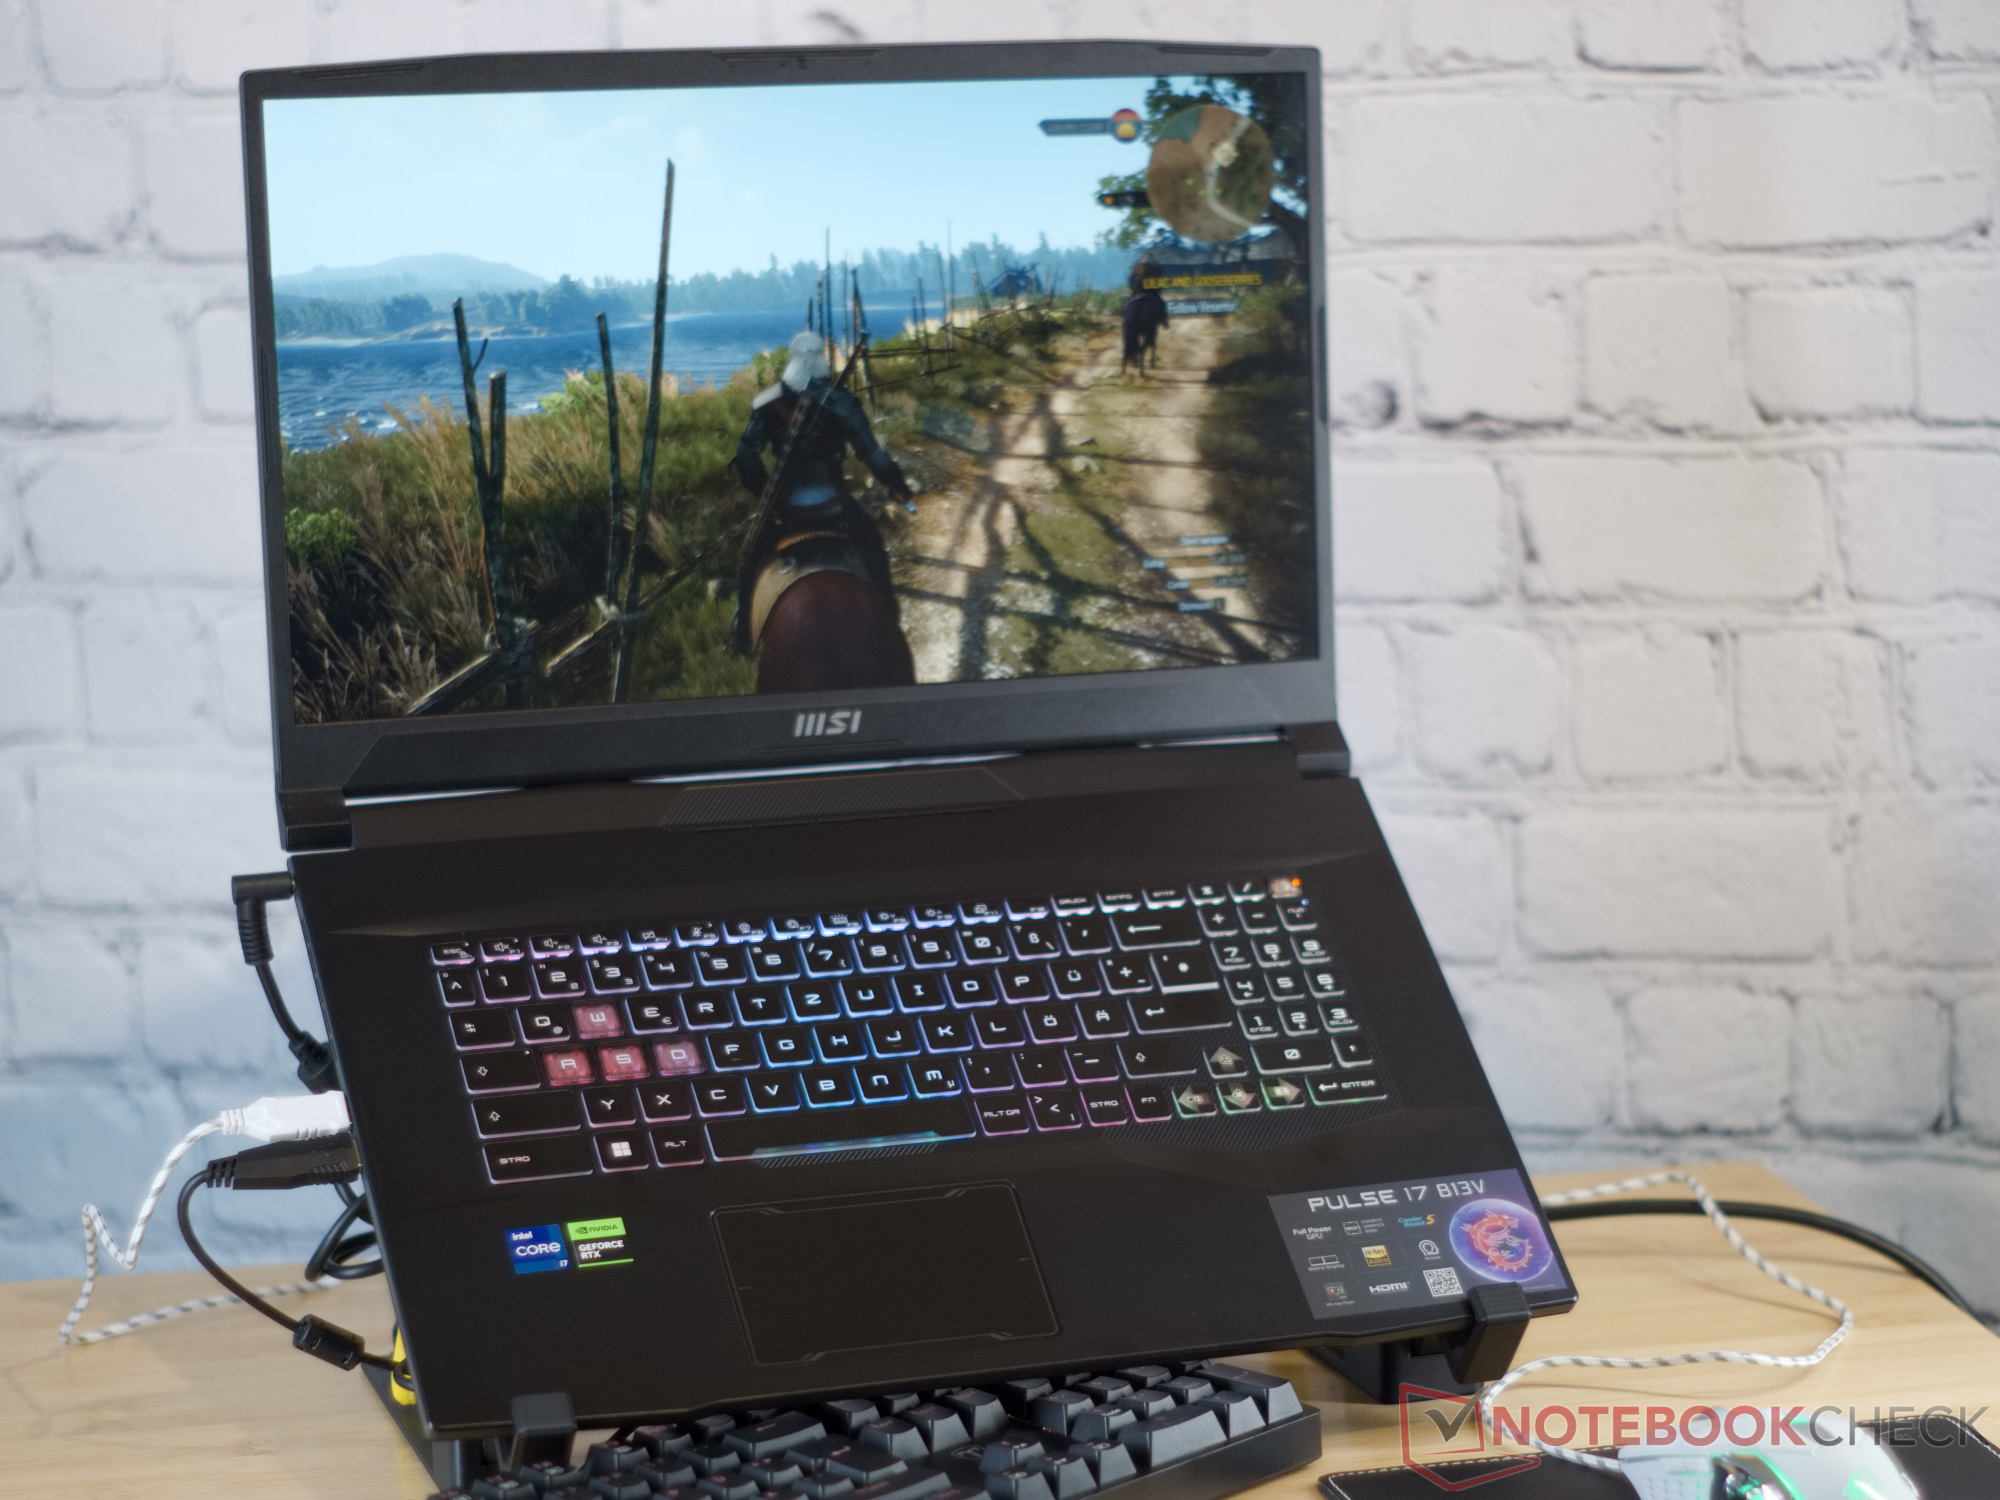
全球国际货运代理申克XMG焦点17和 华硕ROG Strix G17与微星Pulse 17相比,申克XMG Focus 17和华硕ROG Strix G17略胜一筹。这两款笔记本电脑只是提供了更快的处理器,这明显反映在CPU密集型游戏(如Dota 2 Reborn)的帧速率上。然而,Pulse 17也表明,在高画质设置甚至光线追踪的情况下,全高清游戏和更多游戏的帧数不会低于每秒60帧。与此同时,这款笔记本电脑的噪音仍然明显低于其他竞争对手,在平衡模式下,您可以在仅为42 dB(A)的噪音水平(从15厘米~6英寸的距离测量)下畅玩游戏而不会降低性能。
| Performance rating - Percent | |
| Average of class Gaming | |
| Asus ROG Strix G17 G713PI | |
| Schenker XMG Focus 17 (E23) | |
| MSI Katana 17 B13VFK | |
| MSI Pulse 17 B13VGK | |
| Acer Nitro 17 AN17-51-71ER | |
| MSI Pulse GL76 12UGK | |
| The Witcher 3 - 1920x1080 Ultra Graphics & Postprocessing (HBAO+) | |
| Average of class Gaming (104.7 - 240, n=7, last 2 years) | |
| Asus ROG Strix G17 G713PI | |
| Schenker XMG Focus 17 (E23) | |
| MSI Pulse 17 B13VGK | |
| Acer Nitro 17 AN17-51-71ER | |
| MSI Katana 17 B13VFK | |
| MSI Pulse GL76 12UGK | |
| GTA V - 1920x1080 Highest AA:4xMSAA + FX AF:16x | |
| Average of class Gaming (48.3 - 186.9, n=94, last 2 years) | |
| Schenker XMG Focus 17 (E23) | |
| MSI Pulse 17 B13VGK | |
| Acer Nitro 17 AN17-51-71ER | |
| Asus ROG Strix G17 G713PI | |
| MSI Katana 17 B13VFK | |
| MSI Pulse GL76 12UGK | |
| Final Fantasy XV Benchmark - 1920x1080 High Quality | |
| Average of class Gaming (41 - 215, n=95, last 2 years) | |
| Schenker XMG Focus 17 (E23) | |
| Asus ROG Strix G17 G713PI | |
| MSI Pulse 17 B13VGK | |
| Acer Nitro 17 AN17-51-71ER | |
| MSI Katana 17 B13VFK | |
| MSI Pulse GL76 12UGK | |
| Strange Brigade - 1920x1080 ultra AA:ultra AF:16 | |
| Average of class Gaming (76.3 - 458, n=87, last 2 years) | |
| Schenker XMG Focus 17 (E23) | |
| Asus ROG Strix G17 G713PI | |
| MSI Pulse 17 B13VGK | |
| Acer Nitro 17 AN17-51-71ER | |
| MSI Katana 17 B13VFK | |
| MSI Pulse GL76 12UGK | |
| Dota 2 Reborn - 1920x1080 ultra (3/3) best looking | |
| Schenker XMG Focus 17 (E23) | |
| Asus ROG Strix G17 G713PI | |
| MSI Katana 17 B13VFK | |
| Average of class Gaming (84.8 - 248, n=107, last 2 years) | |
| MSI Pulse 17 B13VGK | |
| Acer Nitro 17 AN17-51-71ER | |
| MSI Pulse GL76 12UGK | |
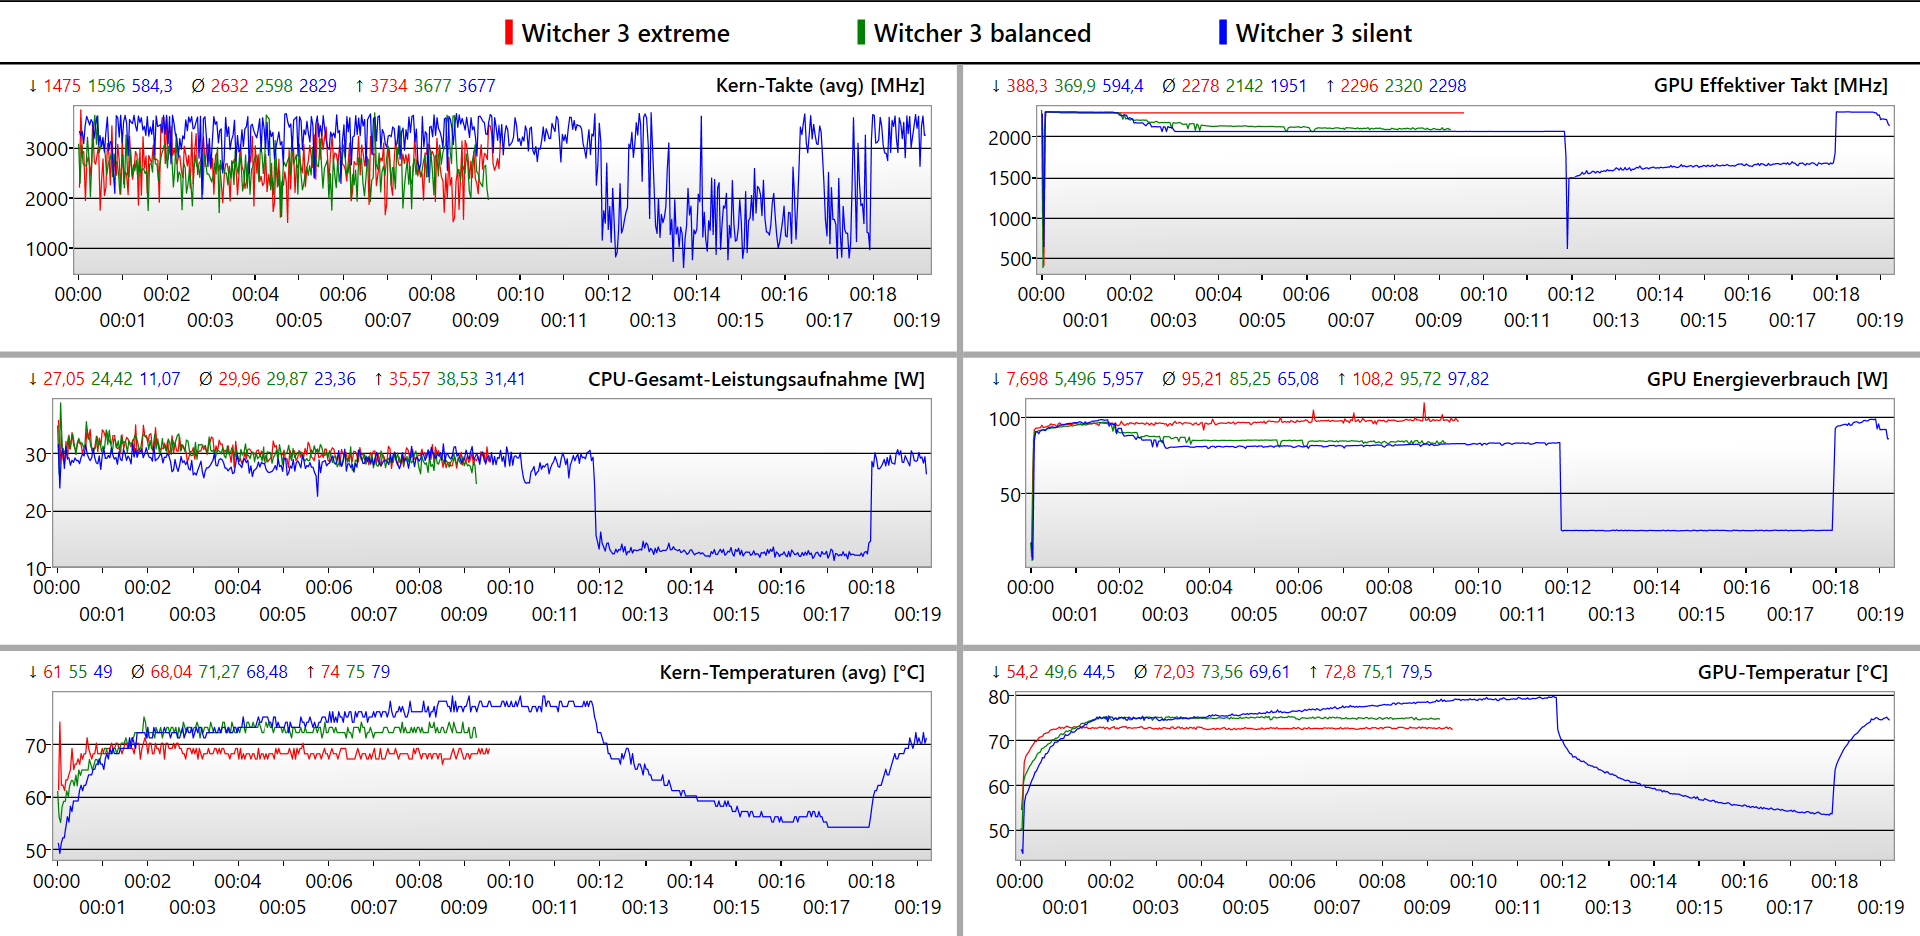
在《Witcher 3 》长达一小时的测试中,显示了游戏昼夜节奏下的典型FPS范围。我们在这里没有看到任何明显的异常值。
The Witcher 3 FPS Chart
| low | med. | high | ultra | QHD | 4K | |
|---|---|---|---|---|---|---|
| GTA V (2015) | 184.8 | 182.2 | 176.9 | 116.4 | ||
| The Witcher 3 (2015) | 106.9 | |||||
| Dota 2 Reborn (2015) | 174 | 158 | 146.3 | 138.5 | 132.4 | |
| Final Fantasy XV Benchmark (2018) | 150.5 | 111.9 | 86.2 | 47.5 | ||
| X-Plane 11.11 (2018) | 147.6 | 130.8 | 102 | 102.2 | ||
| Far Cry 5 (2018) | 163 | 154 | 145 | |||
| Strange Brigade (2018) | 468 | 295 | 233 | 202 | ||
| F1 22 (2022) | 239 | 228 | 186.7 | 71 | ||
| F1 23 (2023) | 248 | 251 | 199.2 | 100 |
静音风机
噪声排放
作为一款游戏笔记本电脑,微星Pulse 17非常安静。在性能模式下,我们测得的最大噪音值仅为46.5 dB(A),而在平衡模式下甚至低至4 dB(A)。风扇在负载情况下的声音也有延迟。例如,在我们使用PCMark 06进行的平均负载测量中,风扇仅在基准测试结束前不久才开始工作。
Noise level
| Idle |
| 24 / 24 / 24 dB(A) |
| Load |
| 32.49 / 46.51 dB(A) |
 | ||
30 dB silent 40 dB(A) audible 50 dB(A) loud |
||
min: | ||
| MSI Pulse 17 B13VGK GeForce RTX 4070 Laptop GPU, i7-13700H, Micron 2400 MTFDKBA1T0QFM | MSI Pulse GL76 12UGK GeForce RTX 3070 Laptop GPU, i7-12700H, Micron 3400 1TB MTFDKBA1T0TFH | MSI Katana 17 B13VFK GeForce RTX 4060 Laptop GPU, i7-13620H, Micron 2400 MTFDKBA1T0QFM | Acer Nitro 17 AN17-51-71ER GeForce RTX 4060 Laptop GPU, i7-13700H, Samsung PM9A1 MZVL21T0HCLR | Schenker XMG Focus 17 (E23) GeForce RTX 4070 Laptop GPU, i9-13900HX, Crucial P5 Plus 1TB CT1000P5PSSD8 | Asus ROG Strix G17 G713PI GeForce RTX 4070 Laptop GPU, R9 7945HX, WD PC SN560 SDDPNQE-1T00 | |
|---|---|---|---|---|---|---|
| Noise | -13% | -24% | -11% | -19% | -14% | |
| off / environment * (dB) | 24 | 24.1 -0% | 24.5 -2% | 24 -0% | 24 -0% | 25 -4% |
| Idle Minimum * (dB) | 24 | 26.9 -12% | 24.5 -2% | 24 -0% | 24 -0% | 26 -8% |
| Idle Average * (dB) | 24 | 26.9 -12% | 24.5 -2% | 24 -0% | 24 -0% | 29 -21% |
| Idle Maximum * (dB) | 24 | 27 -13% | 40 -67% | 32.32 -35% | 26.47 -10% | 30 -25% |
| Load Average * (dB) | 32.49 | 43.8 -35% | 48.3 -49% | 35.18 -8% | 55.72 -71% | 46 -42% |
| Witcher 3 ultra * (dB) | 46.51 | 44.7 4% | 56 -20% | 54.78 -18% | 57.94 -25% | 46 1% |
| Load Maximum * (dB) | 46.51 | 58.3 -25% | 59.1 -27% | 54.78 -18% | 57.94 -25% | 47 -1% |
* ... smaller is better
温度
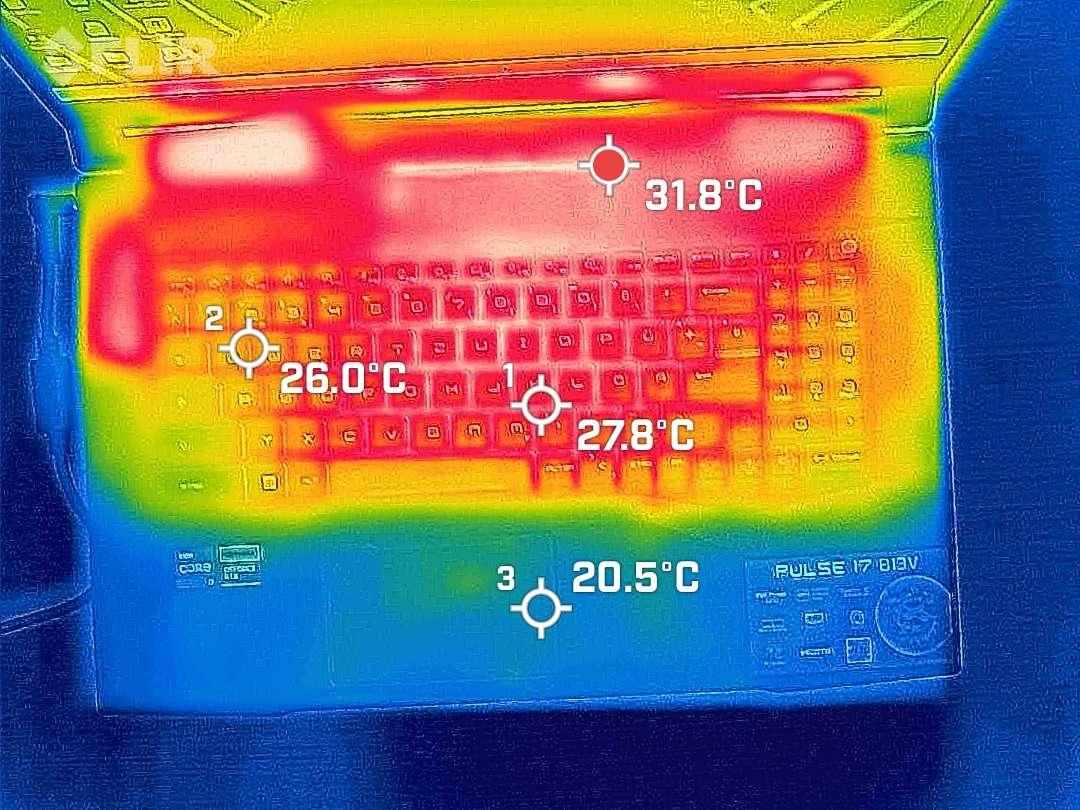
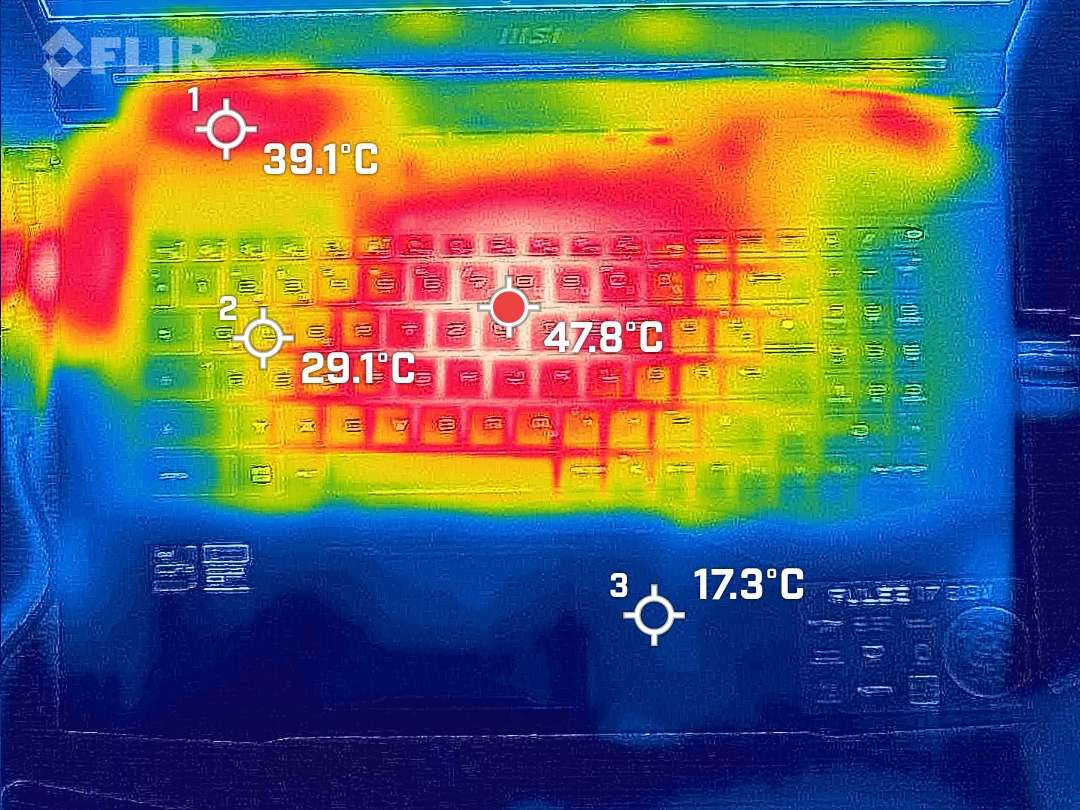
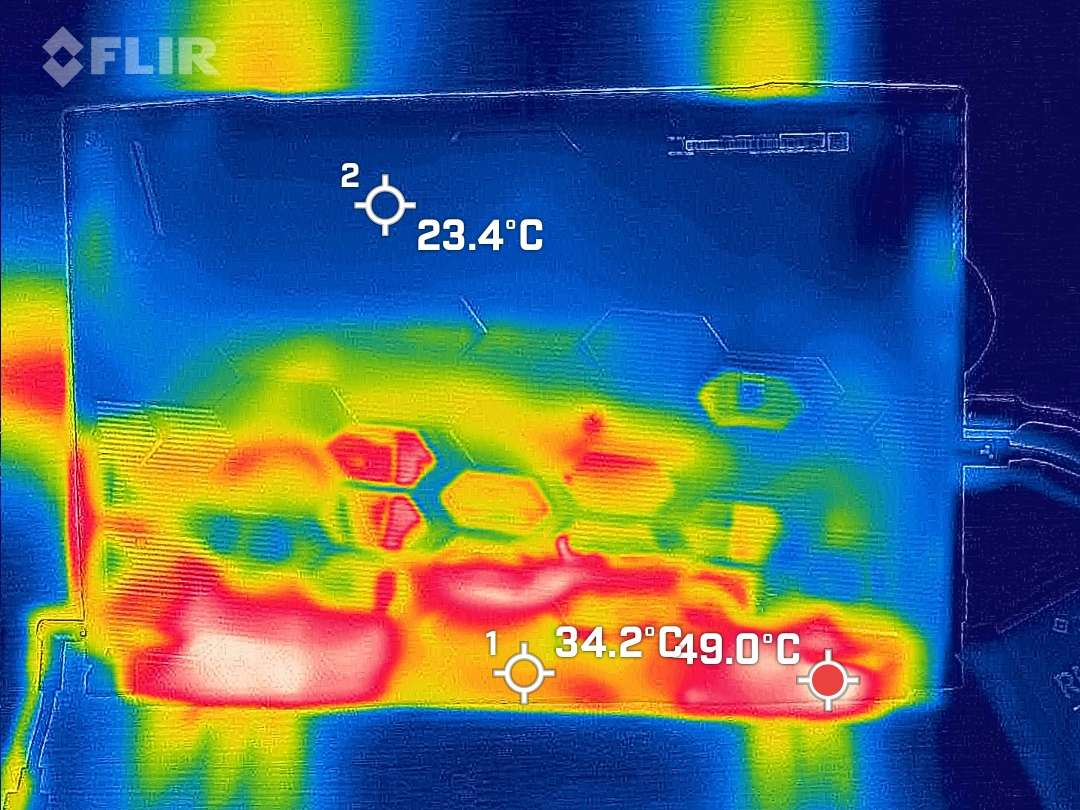
在我们的测试设备中,掌托的表面温度始终保持低温,仅略高于室温。设备的最高温度为48 °C(118 °F),分布在散热系统上方和下方的后边缘以及键盘中心的大面积区域。然而,在游戏的重要区域以及高性能游戏笔记本电脑的底部,温度仍保持在可承受的范围内。
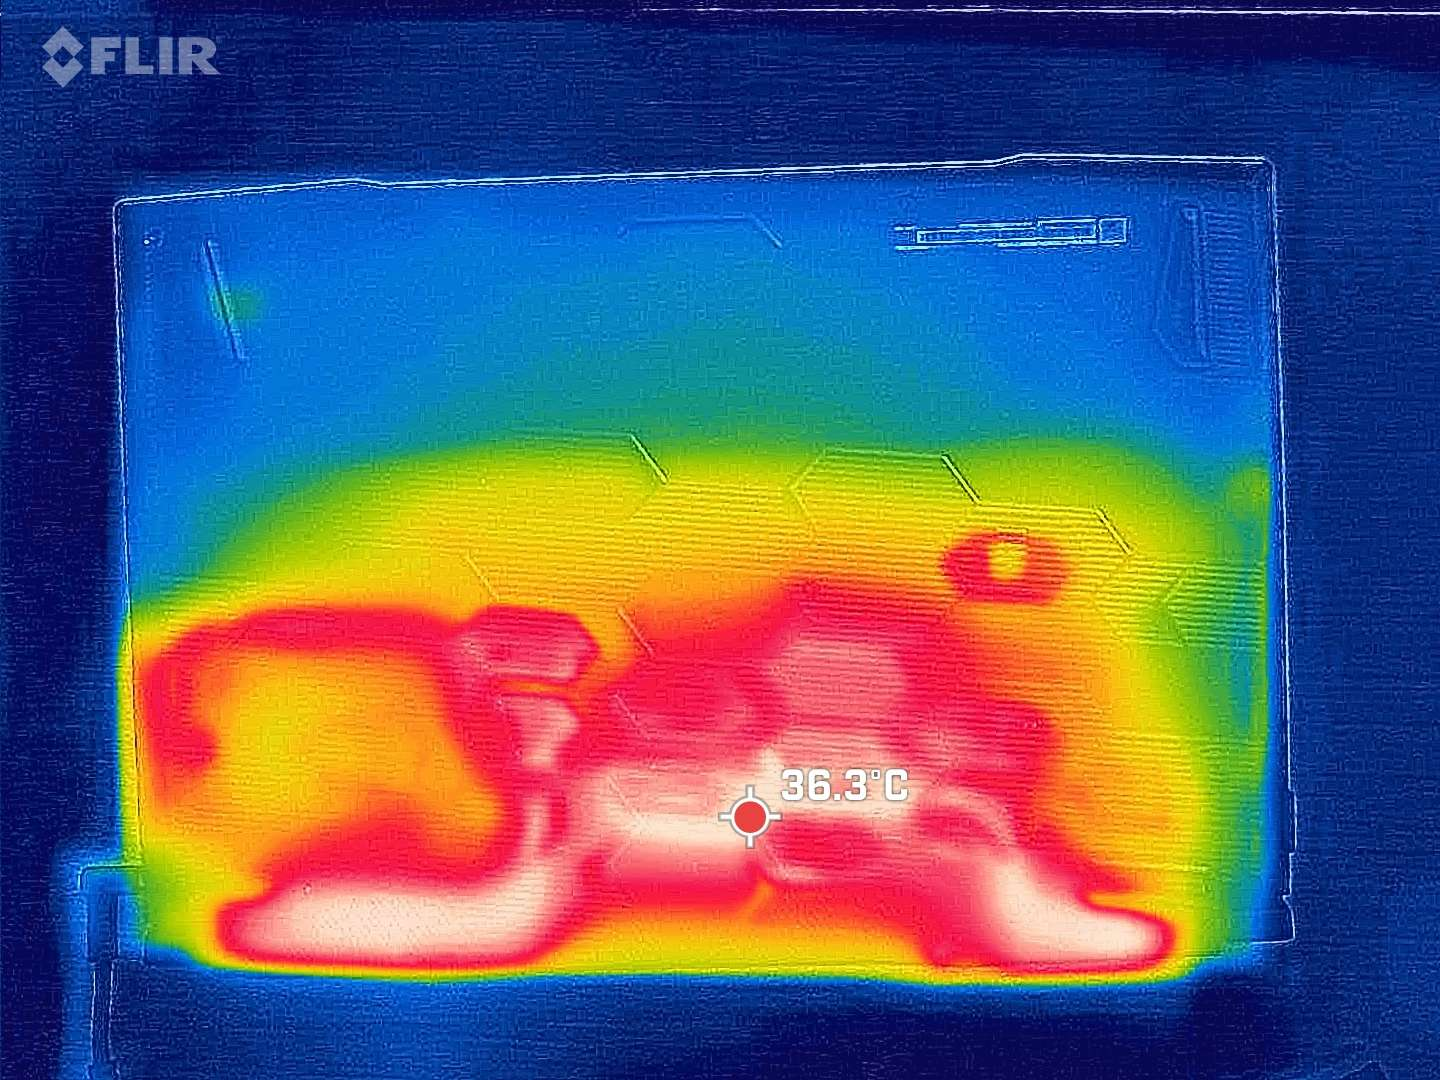
(-) The maximum temperature on the upper side is 48 °C / 118 F, compared to the average of 40.4 °C / 105 F, ranging from 21.2 to 68.8 °C for the class Gaming.
(-) The bottom heats up to a maximum of 50 °C / 122 F, compared to the average of 43.2 °C / 110 F
(+) In idle usage, the average temperature for the upper side is 27.8 °C / 82 F, compared to the device average of 33.9 °C / 93 F.
(±) Playing The Witcher 3, the average temperature for the upper side is 37 °C / 99 F, compared to the device average of 33.9 °C / 93 F.
(+) The palmrests and touchpad are cooler than skin temperature with a maximum of 24 °C / 75.2 F and are therefore cool to the touch.
(+) The average temperature of the palmrest area of similar devices was 28.8 °C / 83.8 F (+4.8 °C / 8.6 F).
| MSI Pulse 17 B13VGK Intel Core i7-13700H, NVIDIA GeForce RTX 4070 Laptop GPU | |
|---|---|
| Heat | |
| Maximum Upper Side * (°C) | 48 |
| Maximum Bottom * (°C) | 50 |
| Idle Upper Side * (°C) | 30 |
| Idle Bottom * (°C) | 33 |
* ... smaller is better
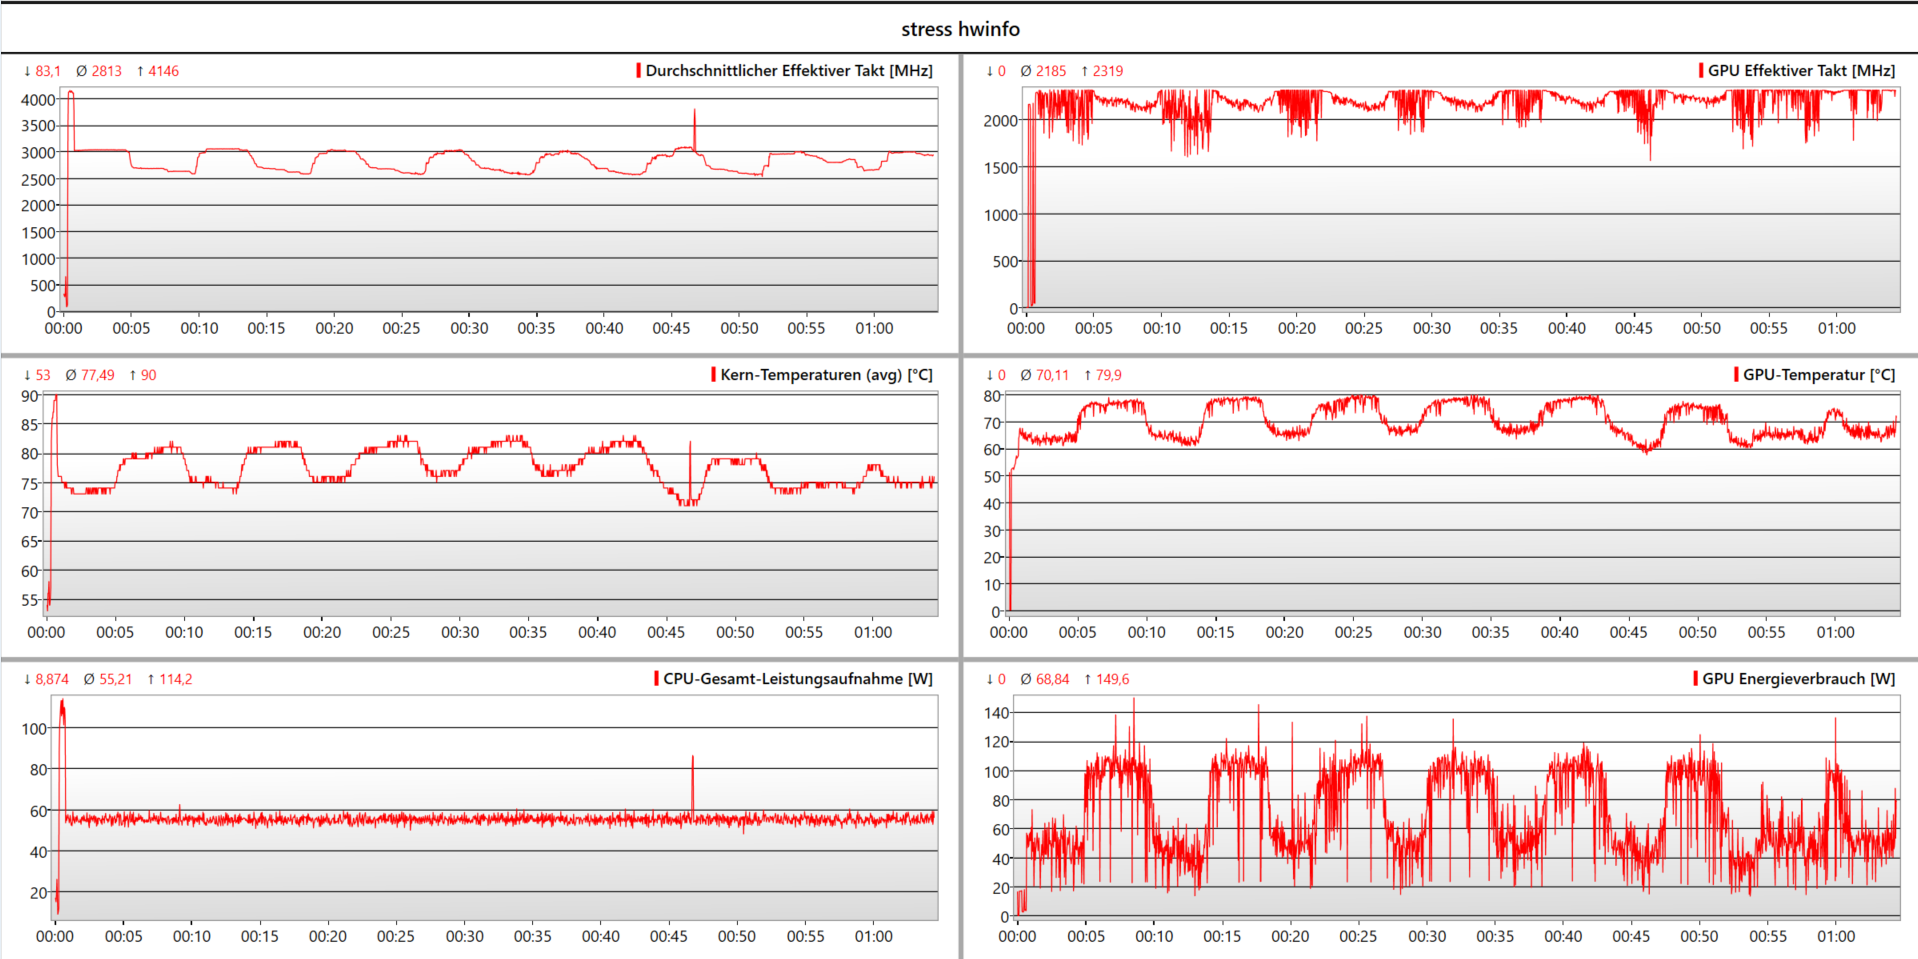
压力测试
我们在几乎全新的微星Pulse 17上进行了压力测试。显然,GPU的目标温度约为80 °C(176 °F)。一旦达到这个值,性能就会受到影响,直到GPU稍微冷却下来。这在我们的Prime95和Furmark压力测试日志中引起了一些波澜。在短暂的提升阶段之后,Core i7的运行功耗始终保持在55瓦左右。而RTX 4070则不断地从110瓦降低到50瓦。在我们对微星Pulse 17的后期测试中,笔记本电脑的电源控制明显趋于稳定,因此我们可以假定这里存在一些学习效应。
扬声器
过于强调的中音让微星Pulse 17听起来有点刺耳。然而,高达85 dB(A)的小型扬声器音量相对较大,很容易淹没这款游戏笔记本的静音风扇。不喜欢扬声器的用户可以使用蓝牙或3.5毫米音频接口连接外部设备。
MSI Pulse 17 B13VGK audio analysis
(+) | speakers can play relatively loud (85.01 dB)
Bass 100 - 315 Hz
(±) | reduced bass - on average 13.2% lower than median
(±) | linearity of bass is average (12.3% delta to prev. frequency)
Mids 400 - 2000 Hz
(±) | higher mids - on average 9.4% higher than median
(+) | mids are linear (5.7% delta to prev. frequency)
Highs 2 - 16 kHz
(+) | balanced highs - only 2.9% away from median
(+) | highs are linear (6.7% delta to prev. frequency)
Overall 100 - 16.000 Hz
(±) | linearity of overall sound is average (15.8% difference to median)
Compared to same class
» 37% of all tested devices in this class were better, 7% similar, 56% worse
» The best had a delta of 6%, average was 18%, worst was 132%
Compared to all devices tested
» 24% of all tested devices were better, 5% similar, 70% worse
» The best had a delta of 4%, average was 23%, worst was 134%
Apple MacBook Pro 16 2021 M1 Pro audio analysis
(+) | speakers can play relatively loud (84.7 dB)
Bass 100 - 315 Hz
(+) | good bass - only 3.8% away from median
(+) | bass is linear (5.2% delta to prev. frequency)
Mids 400 - 2000 Hz
(+) | balanced mids - only 1.3% away from median
(+) | mids are linear (2.1% delta to prev. frequency)
Highs 2 - 16 kHz
(+) | balanced highs - only 1.9% away from median
(+) | highs are linear (2.7% delta to prev. frequency)
Overall 100 - 16.000 Hz
(+) | overall sound is linear (4.6% difference to median)
Compared to same class
» 0% of all tested devices in this class were better, 0% similar, 100% worse
» The best had a delta of 5%, average was 17%, worst was 45%
Compared to all devices tested
» 0% of all tested devices were better, 0% similar, 100% worse
» The best had a delta of 4%, average was 23%, worst was 134%
电源管理 - 90 Wh电池确保电池寿命长
耗电量
虽然Pulse 17在负载情况下的最大功耗在笔记本电脑级别中相当典型,但在空闲运行期间,甚至在中等负载情况下,我们的测试设备对于一款游戏笔记本电脑来说异常高效。
| Off / Standby | |
| Idle | |
| Load |
|
Key:
min: | |
| MSI Pulse 17 B13VGK i7-13700H, GeForce RTX 4070 Laptop GPU, Micron 2400 MTFDKBA1T0QFM, IPS, 1920x1080, 17.3" | MSI Pulse GL76 12UGK i7-12700H, GeForce RTX 3070 Laptop GPU, Micron 3400 1TB MTFDKBA1T0TFH, IPS, 1920x1080, 17.3" | MSI Katana 17 B13VFK i7-13620H, GeForce RTX 4060 Laptop GPU, Micron 2400 MTFDKBA1T0QFM, IPS LED, 1920x1080, 17.3" | Acer Nitro 17 AN17-51-71ER i7-13700H, GeForce RTX 4060 Laptop GPU, Samsung PM9A1 MZVL21T0HCLR, , 2560x1440, 17.3" | Schenker XMG Focus 17 (E23) i9-13900HX, GeForce RTX 4070 Laptop GPU, Crucial P5 Plus 1TB CT1000P5PSSD8, IPS, 2560x1440, 17.3" | Asus ROG Strix G17 G713PI R9 7945HX, GeForce RTX 4070 Laptop GPU, WD PC SN560 SDDPNQE-1T00, IPS, 2560x1440, 17.3" | Average NVIDIA GeForce RTX 4070 Laptop GPU | Average of class Gaming | |
|---|---|---|---|---|---|---|---|---|
| Power Consumption | -45% | -26% | -18% | -97% | -75% | -58% | -66% | |
| Idle Minimum * (Watt) | 9 | 12.4 -38% | 12.2 -36% | 8.3 8% | 17 -89% | 15 -67% | 13.2 ? -47% | 13 ? -44% |
| Idle Average * (Watt) | 10.2 | 13.1 -28% | 14.9 -46% | 13.5 -32% | 18 -76% | 20 -96% | 18.2 ? -78% | 19 ? -86% |
| Idle Maximum * (Watt) | 10.8 | 25.3 -134% | 15.8 -46% | 14.8 -37% | 25.8 -139% | 29 -169% | 24.6 ? -128% | 24.6 ? -128% |
| Load Average * (Watt) | 72 | 105.4 -46% | 85.22 -18% | 77 -7% | 178 -147% | 121 -68% | 97 ? -35% | 110.7 ? -54% |
| Witcher 3 ultra * (Watt) | 130 | 150 -15% | 151.1 -16% | 154 -18% | 265 -104% | 179.8 -38% | ||
| Load Maximum * (Watt) | 221 | 240.5 -9% | 212.8 4% | 263 -19% | 275 -24% | 246 -11% | 221 ? -0% | 259 ? -17% |
* ... smaller is better
Power Consumption The Witcher 3 / Stress Test
Power Consumption With External Monitor
电池寿命
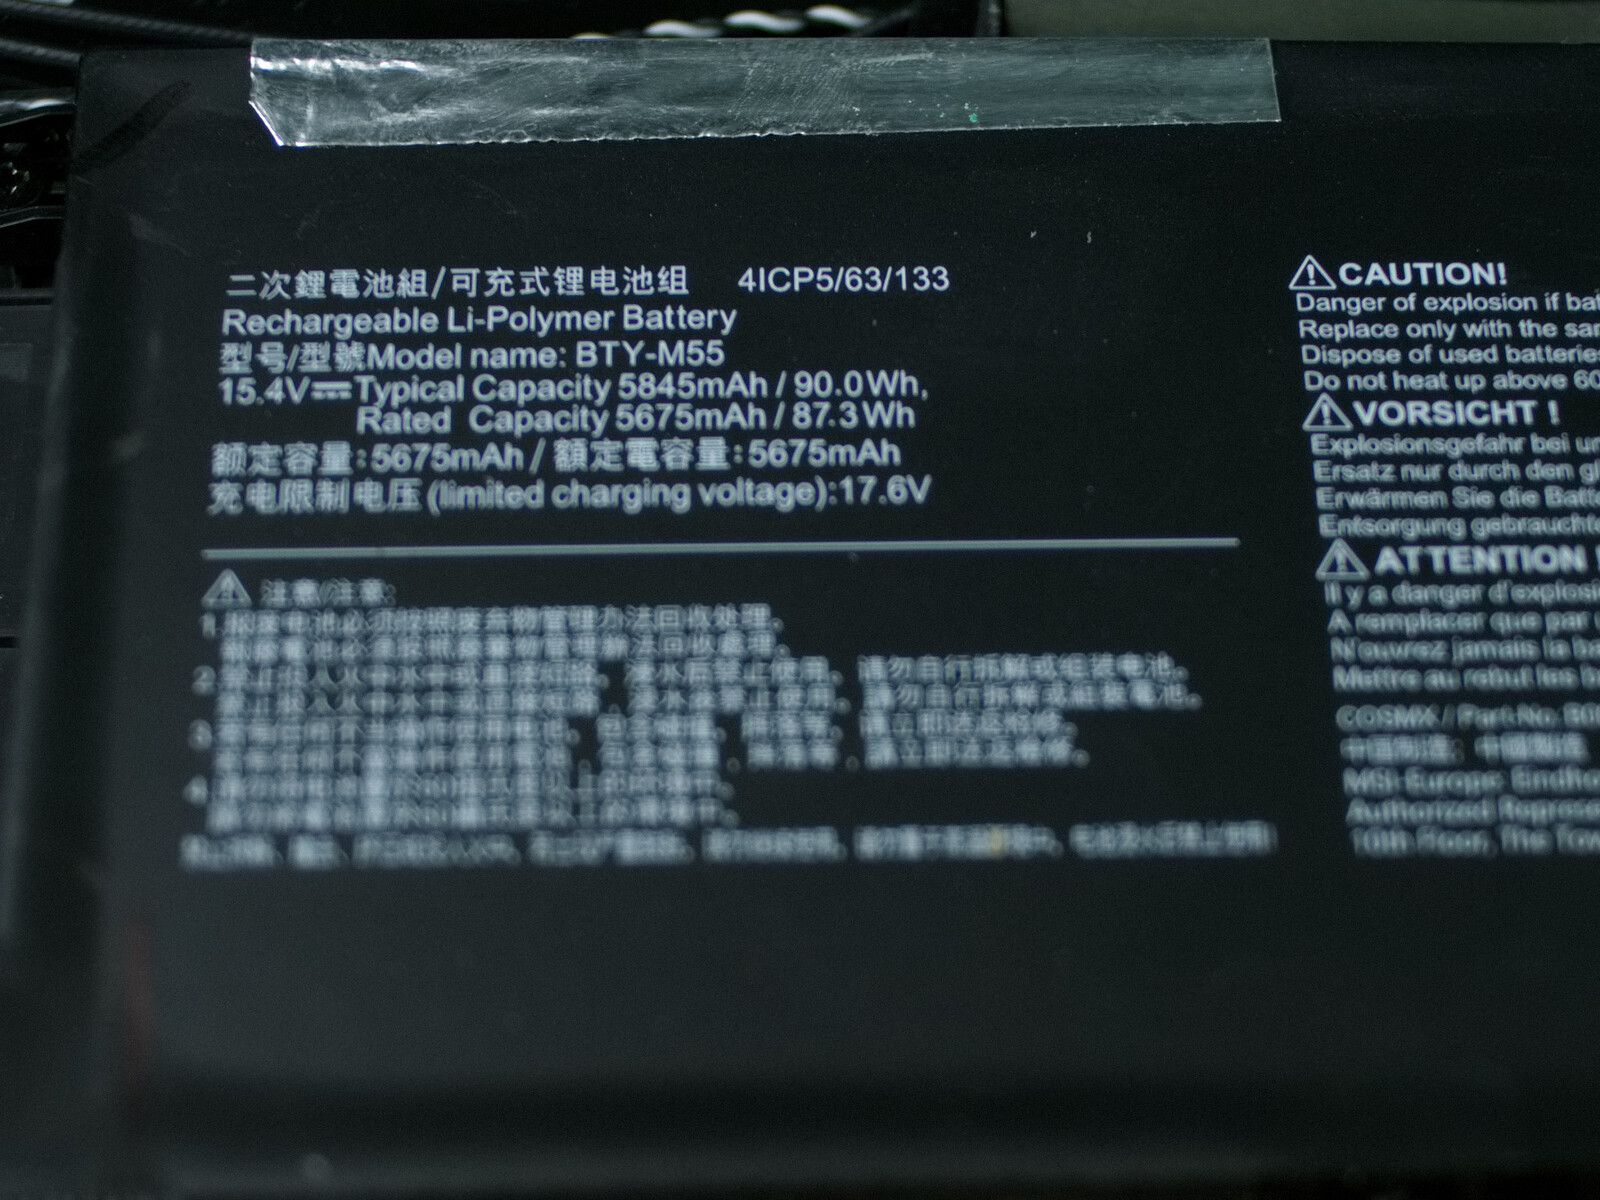
根据我们对功耗的测量结果,这款游戏笔记本电脑在WiFi网上冲浪测试中的90瓦时电池续航时间长达近9小时,这一点也不足为奇。即使在负载情况下,电池也能持续2小时。
| MSI Pulse 17 B13VGK i7-13700H, GeForce RTX 4070 Laptop GPU, 90 Wh | MSI Pulse GL76 12UGK i7-12700H, GeForce RTX 3070 Laptop GPU, 90 Wh | MSI Katana 17 B13VFK i7-13620H, GeForce RTX 4060 Laptop GPU, 53.5 Wh | Acer Nitro 17 AN17-51-71ER i7-13700H, GeForce RTX 4060 Laptop GPU, 90 Wh | Schenker XMG Focus 17 (E23) i9-13900HX, GeForce RTX 4070 Laptop GPU, 73 Wh | Asus ROG Strix G17 G713PI R9 7945HX, GeForce RTX 4070 Laptop GPU, 90 Wh | Average of class Gaming | |
|---|---|---|---|---|---|---|---|
| Battery runtime | -20% | -62% | -9% | -57% | -54% | -27% | |
| WiFi v1.3 (h) | 9 | 5.9 -34% | 2.9 -68% | 8.2 -9% | 3.9 -57% | 4.3 -52% | 7.11 ? -21% |
| Load (h) | 2.2 | 2.1 -5% | 1 -55% | 1 -55% | 1.502 ? -32% | ||
| Reader / Idle (h) | 7.3 | 8.27 ? | |||||
| H.264 (h) | 6.9 | 3.1 | 2.8 | 8.32 ? | |||
| Witcher 3 ultra (h) | 2.5 | 1 | 1.1 |
Pros
Cons
评价--蒸汽朋克多于科幻
在微星脉搏17的积极方面,有几个强点,为笔记本电脑说话,具有最佳性能的 酷睿i7处理器和 NvidiaGeForce RTX 4070最重要的是。为了实现这一目标,Pulse甚至不需要脉动风扇,笔记本电脑在其性能级别中特别安静。这款游戏笔记本电脑的其他优点还包括键盘和良好的外部连接位置。作为一款游戏笔记本电脑,其电池寿命也非常出色。
Pulse 17是一款能够在低噪音条件下提供强劲性能的游戏笔记本电脑。 另一方面,该设备在许多其他方面还没有完全到达2023年。
不幸的是,这款笔记本电脑也存在一些严重的缺点。除了微星Katana 17,我们对比的其他游戏笔记本电脑都没有如此糟糕的显示屏。USB2.0和USB3.2 Gen 1接口、1 GBit/s网速的连接设备以及6 GHz Wi-Fi的缺失,也让这款游戏笔记本电脑不像是一款高端设备。但真正令人讨厌的是M.2 NVMe端口被堵塞,因为制造商本可以通过两种方式避免这种情况。首先,主板和机箱可以留出足够的空间,将模块稍微向左移动,为电池留出一些空间。其次,不必要浪费的PCIe通道也可以投资在Thunderbolt端口上。
虽然与前代产品相比,现在的型号提供了G-Sync、MUX和Advanced Optimus支持,但仍然缺少Thunderbolt。此外,根据我们的测量,前代产品的显示效果明显更好。
在我们进行测试时,这款笔记本的市场价格从2150欧元(约合2415美元)起,有许多(部分还明显更实惠)笔记本可以替代我们的测试设备。华硕ROG Stix G17 向制造商支付的价格与许多供应商的微星设备处于同一水平。虽然您必须在电池寿命方面对华硕的笔记本电脑做出一些沉重的妥协,但除此之外,Pulse 17和ROG Strix G17在各方面的性能都相当接近。另一方面,ROG Strix的显示屏和连接设备要好得多。
价格和供货情况
微星Pulse 17 B13VGK仅在美国的少数几家销售商有售,如Newegg,售价约为1963美元。更多供应商提供它在英国,Australia或Canada例如
MSI Pulse 17 B13VGK
- 07/16/2023 v7 (old)
Marc Herter
Transparency
The selection of devices to be reviewed is made by our editorial team. The test sample was provided to the author as a loan by the manufacturer or retailer for the purpose of this review. The lender had no influence on this review, nor did the manufacturer receive a copy of this review before publication. There was no obligation to publish this review. As an independent media company, Notebookcheck is not subjected to the authority of manufacturers, retailers or publishers.
This is how Notebookcheck is testing
Every year, Notebookcheck independently reviews hundreds of laptops and smartphones using standardized procedures to ensure that all results are comparable. We have continuously developed our test methods for around 20 years and set industry standards in the process. In our test labs, high-quality measuring equipment is utilized by experienced technicians and editors. These tests involve a multi-stage validation process. Our complex rating system is based on hundreds of well-founded measurements and benchmarks, which maintains objectivity. Further information on our test methods can be found here.
Price comparison

