Aorus 15 BSF 评测:配备 RTX 4070 且运行时间出色的 QHD 游戏笔记本电脑
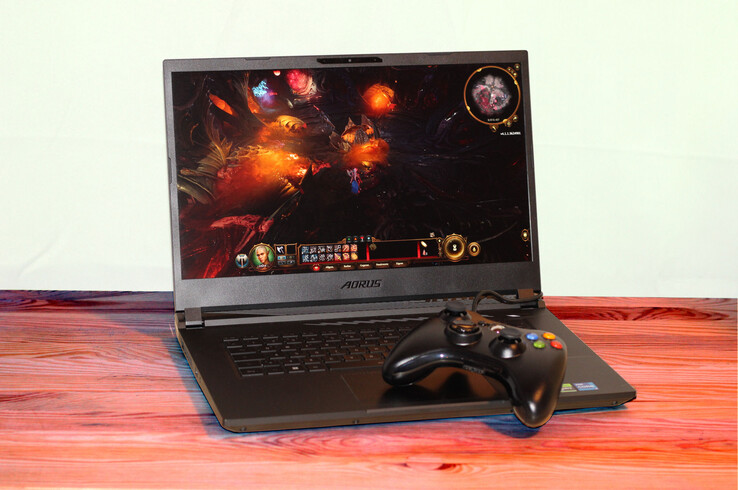
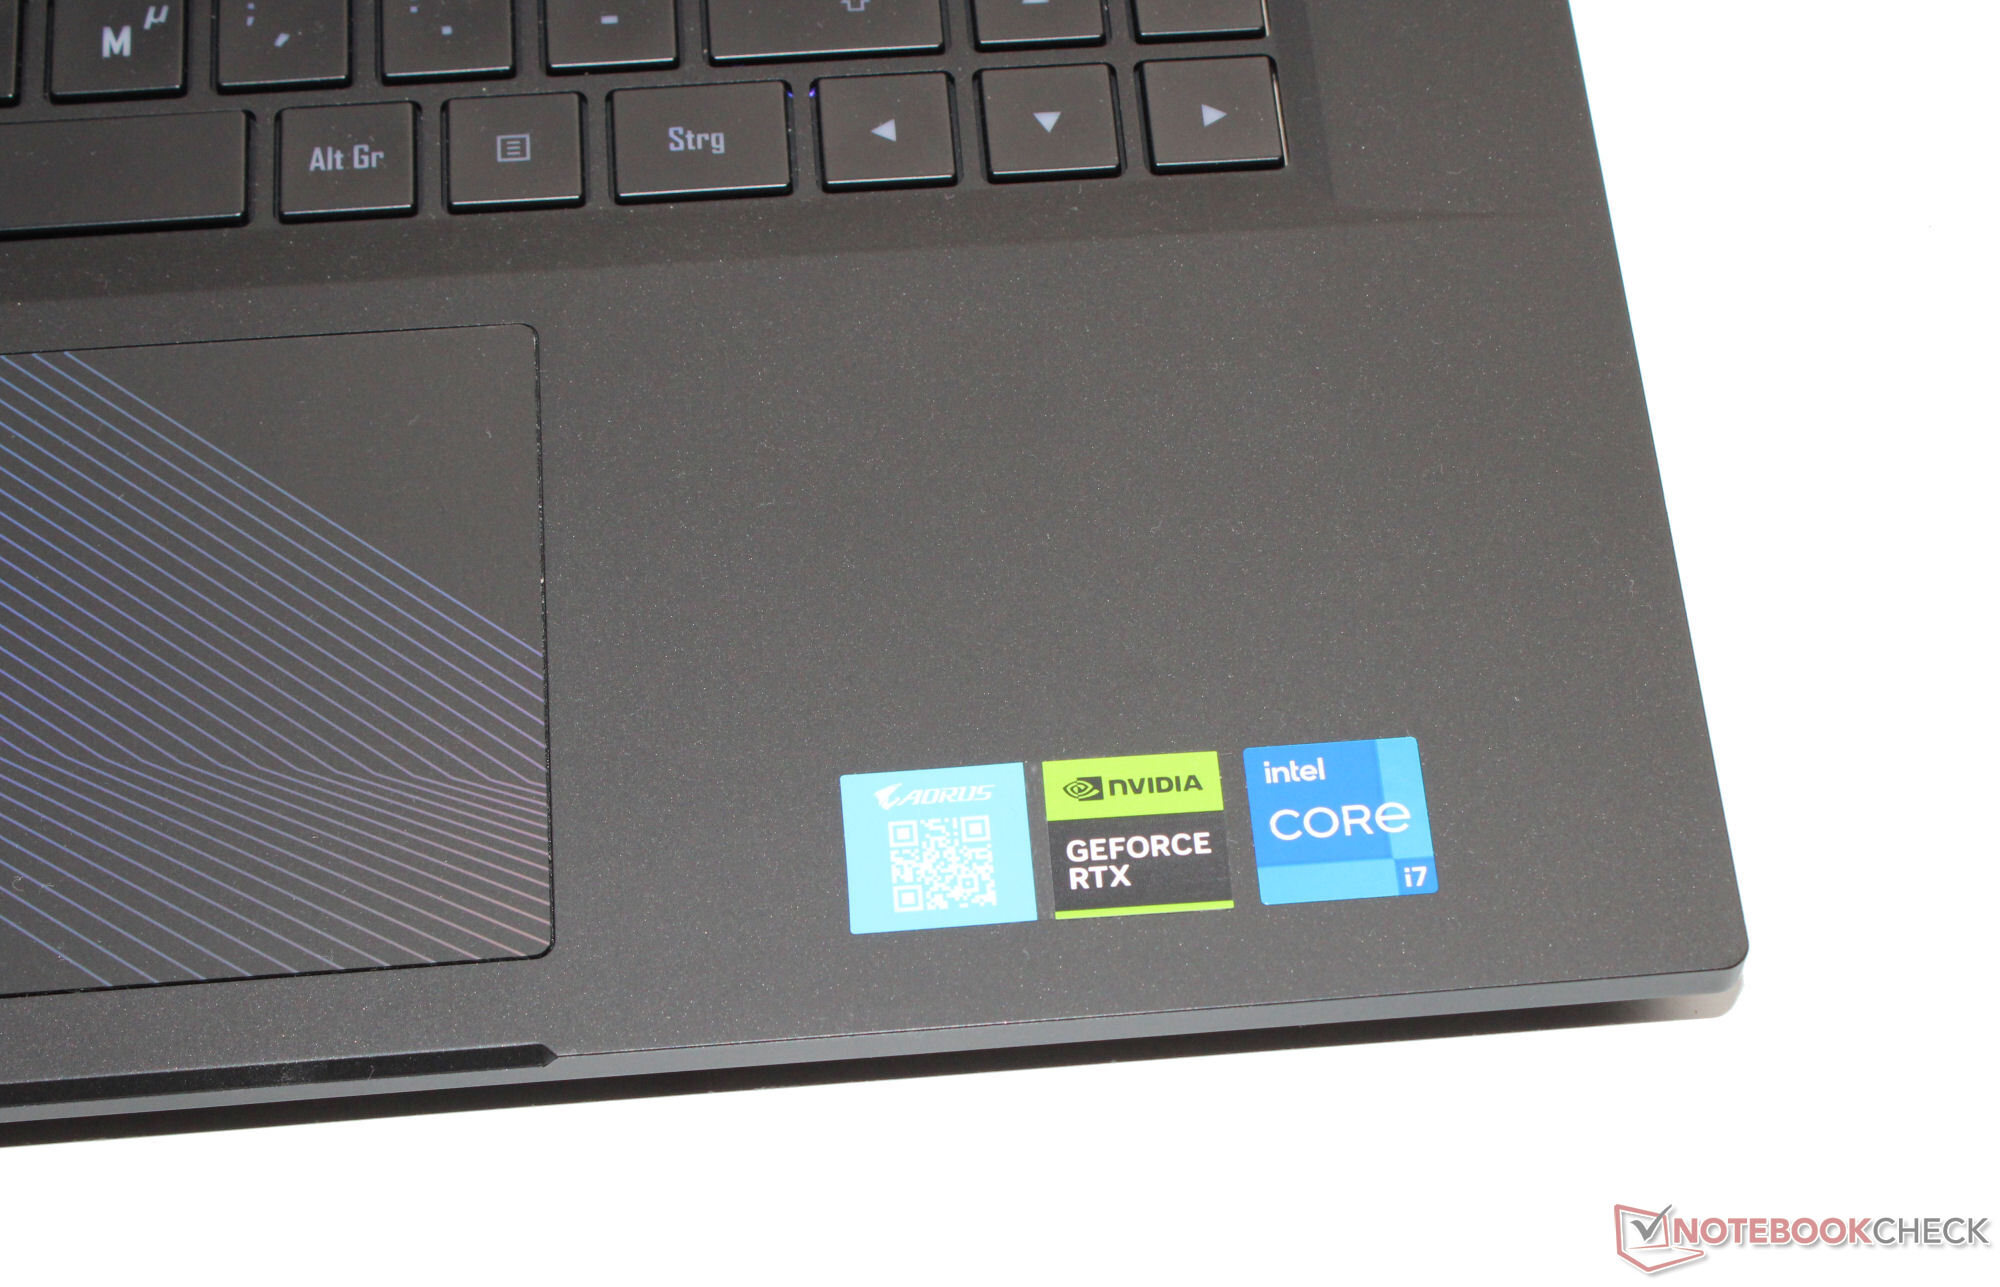
技嘉的 Aorus 15 BSF 是一款 15.6 英寸中端游戏笔记本电脑,采用最新硬件:Raptor Lake、Ada Lovelace、DDR5、PCIe 4。整套配置的售价约为 1,700 美元。竞争对手包括惠普奥门创见 16, 微星脉搏 17 B13VGK, 联想Legion Slim 7i 16 Gen 8, 宏碁 Nitro 16 AN16-41和华硕 TUF Gaming A16 FA617XS.
潜在的竞争对手比较
Rating | Date | Model | Weight | Height | Size | Resolution | Price |
|---|---|---|---|---|---|---|---|
| 85.7 % v7 (old) | 08 / 2023 | Aorus 15 BSF i7-13700H, GeForce RTX 4070 Laptop GPU | 2.4 kg | 20.9 mm | 15.60" | 2560x1440 | |
| 87.9 % v7 (old) | 08 / 2023 | HP Omen Transcend 16 i9-13900HX, GeForce RTX 4070 Laptop GPU | 2.3 kg | 19.8 mm | 16.00" | 2560x1600 | |
| 86.3 % v7 (old) | 07 / 2023 | MSI Pulse 17 B13VGK i7-13700H, GeForce RTX 4070 Laptop GPU | 2.7 kg | 27.2 mm | 17.30" | 1920x1080 | |
| 90 % v7 (old) | 07 / 2023 | Lenovo Legion Slim 7i 16 Gen 8 i9-13900H, GeForce RTX 4070 Laptop GPU | 2.1 kg | 19.9 mm | 16.00" | 2560x1600 | |
| 88.1 % v7 (old) | 06 / 2023 | Acer Nitro 16 AN16-41 R7 7735HS, GeForce RTX 4070 Laptop GPU | 2.7 kg | 27.9 mm | 16.00" | 2560x1600 | |
| 86.9 % v7 (old) | 06 / 2023 | Asus TUF Gaming A16 FA617XS R9 7940HS, Radeon RX 7600S | 2.2 kg | 22.1 mm | 16.00" | 1920x1200 |
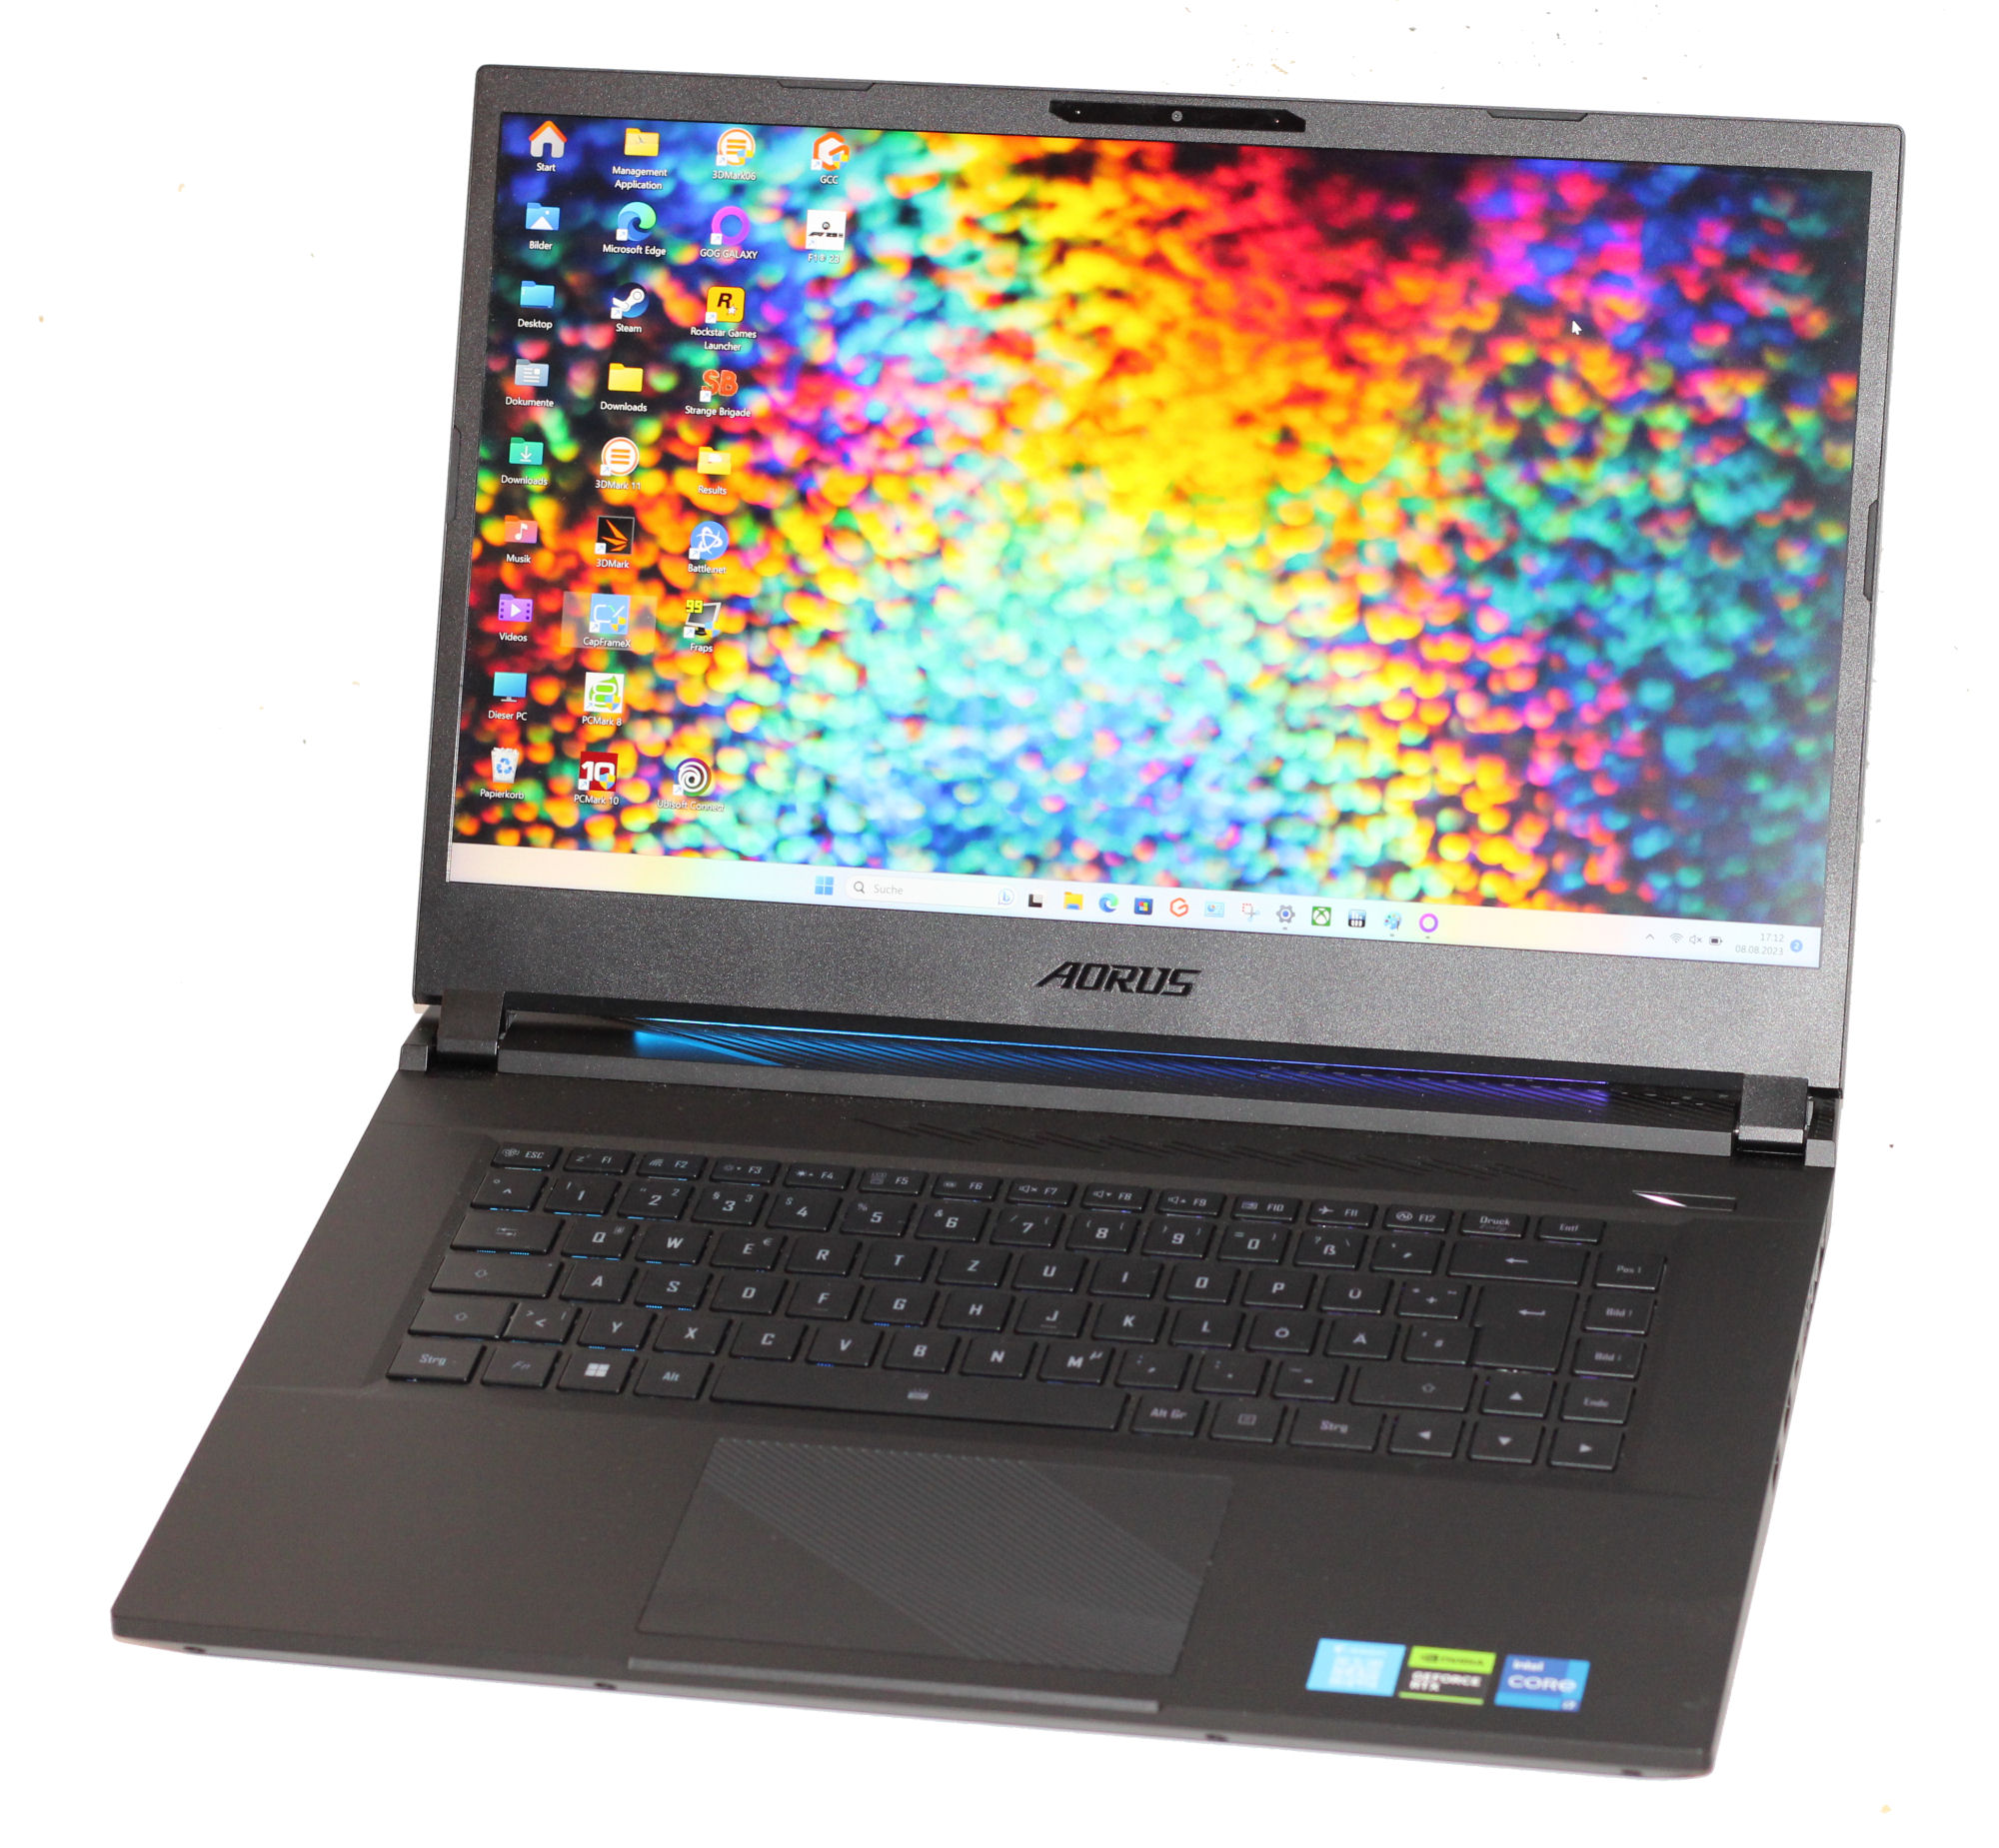
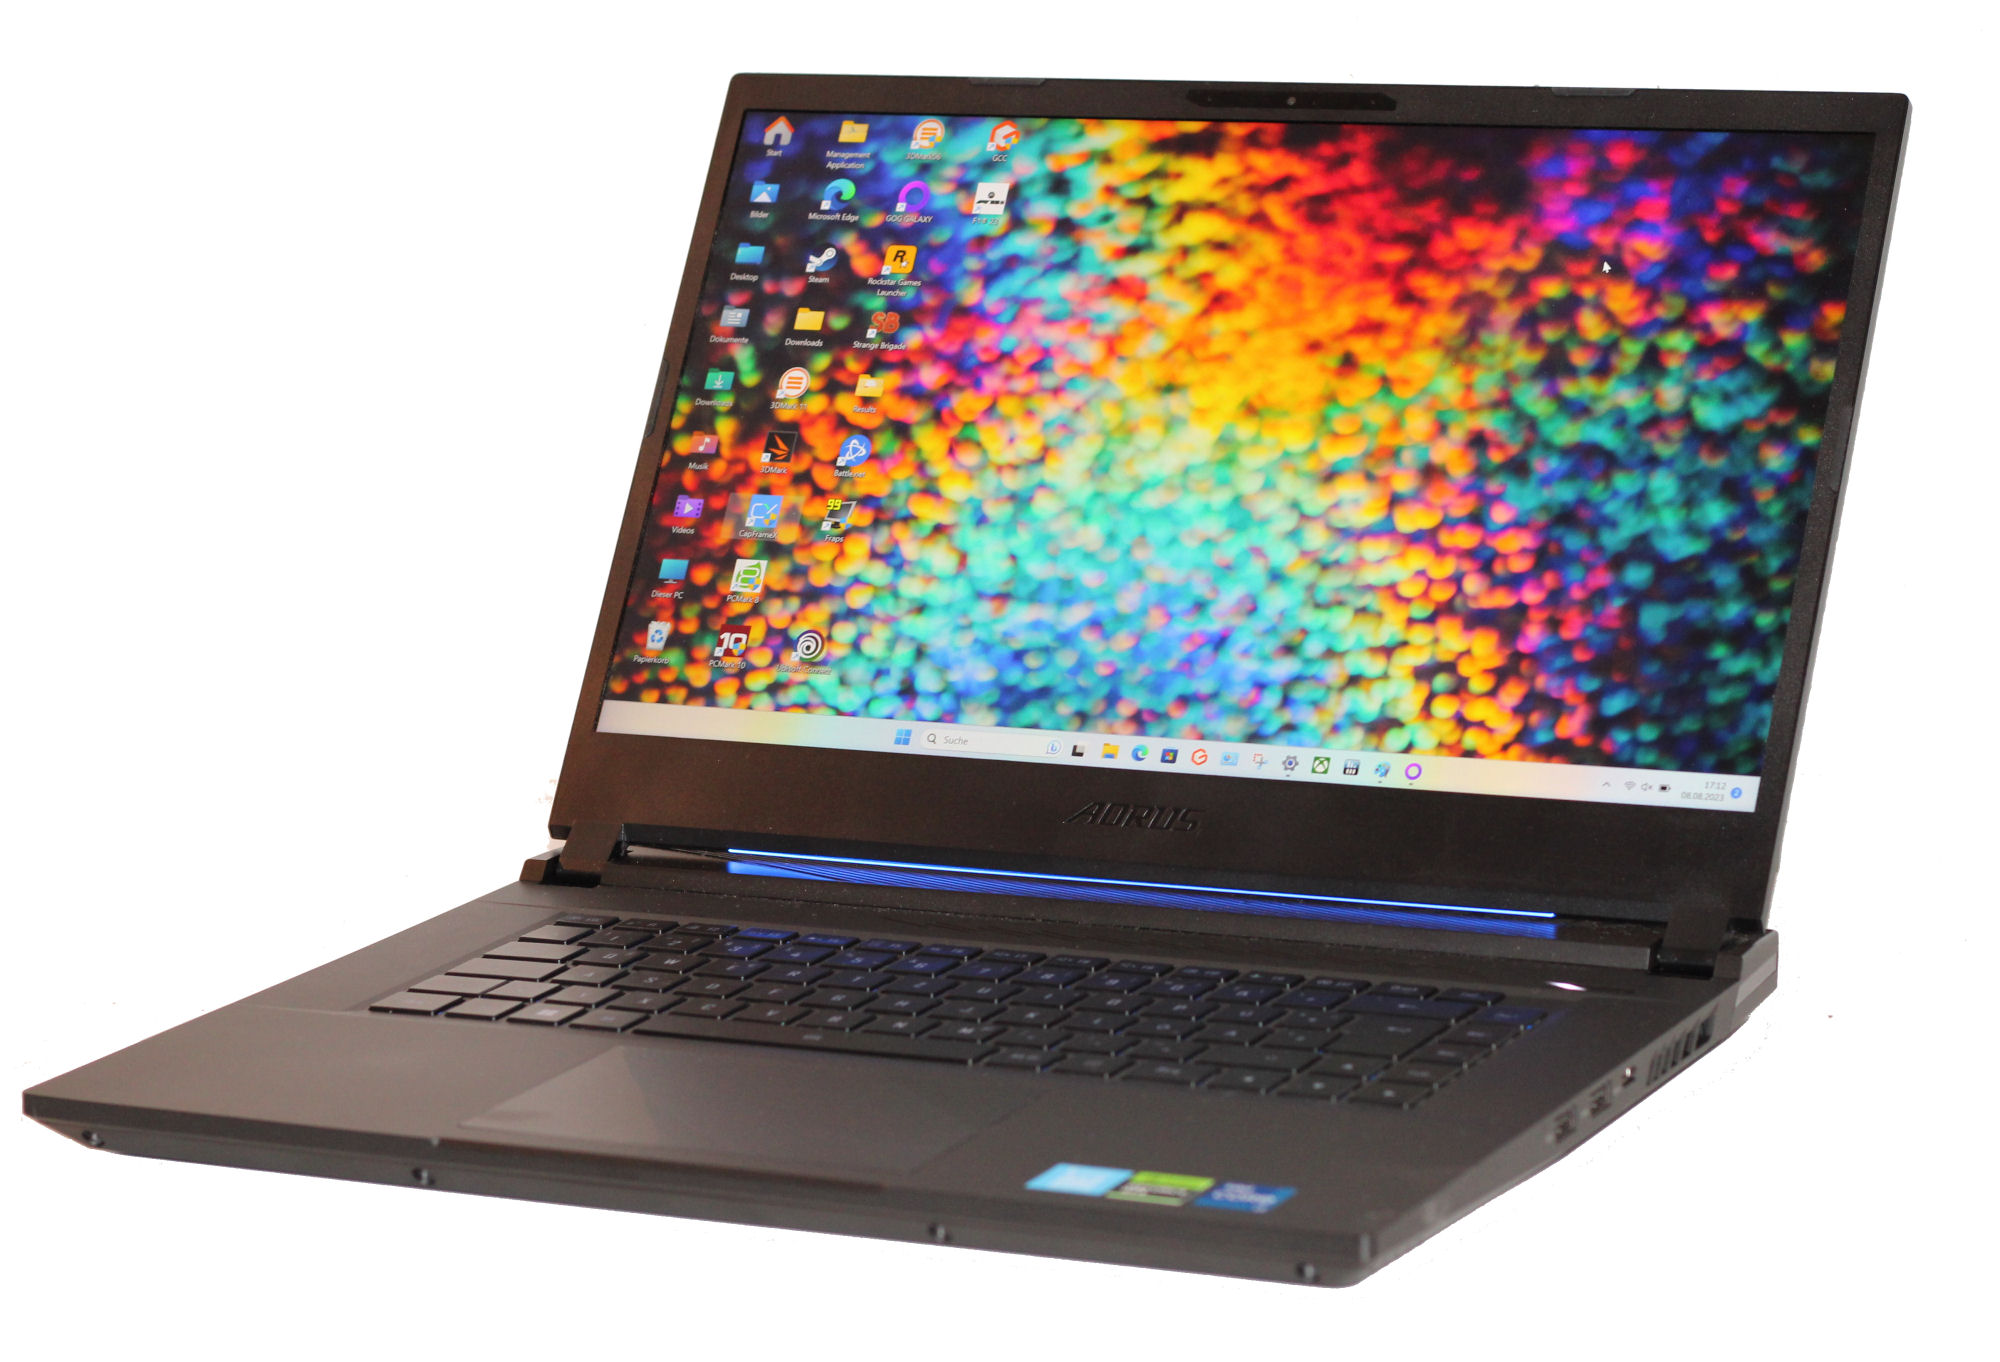
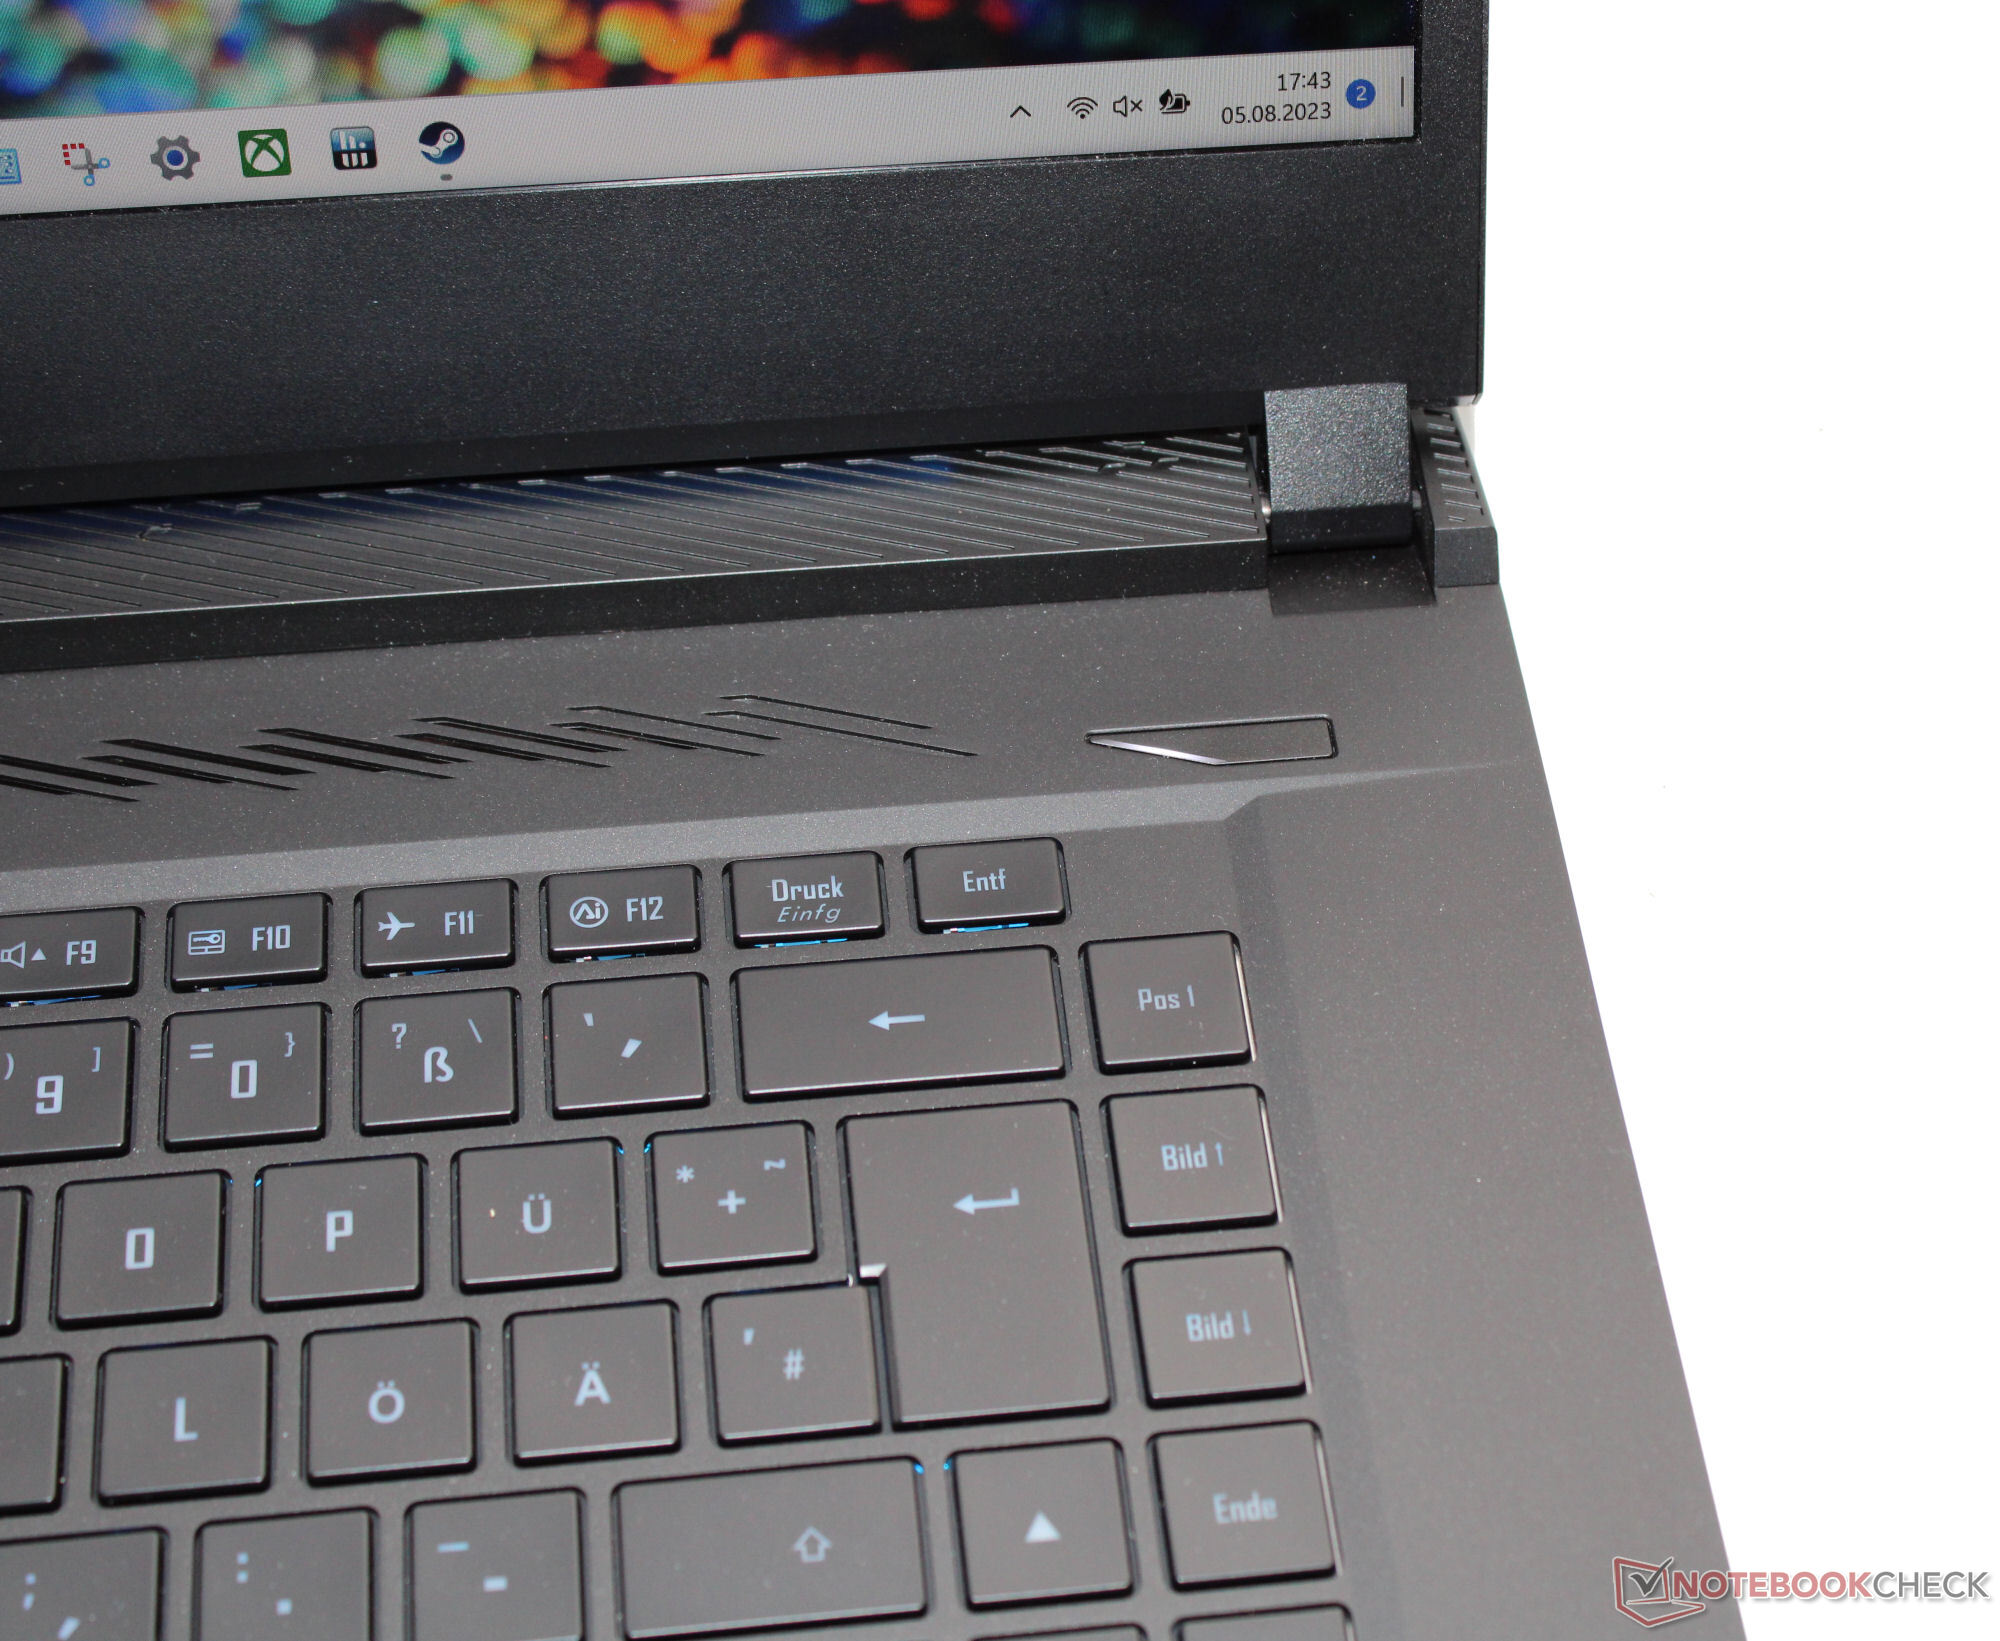
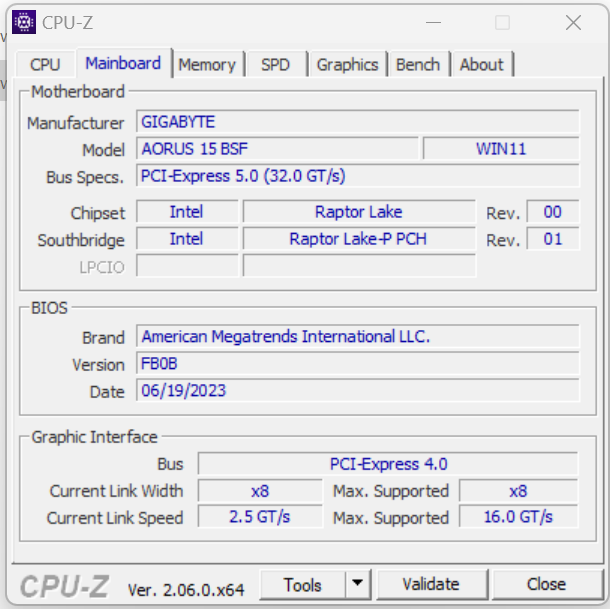
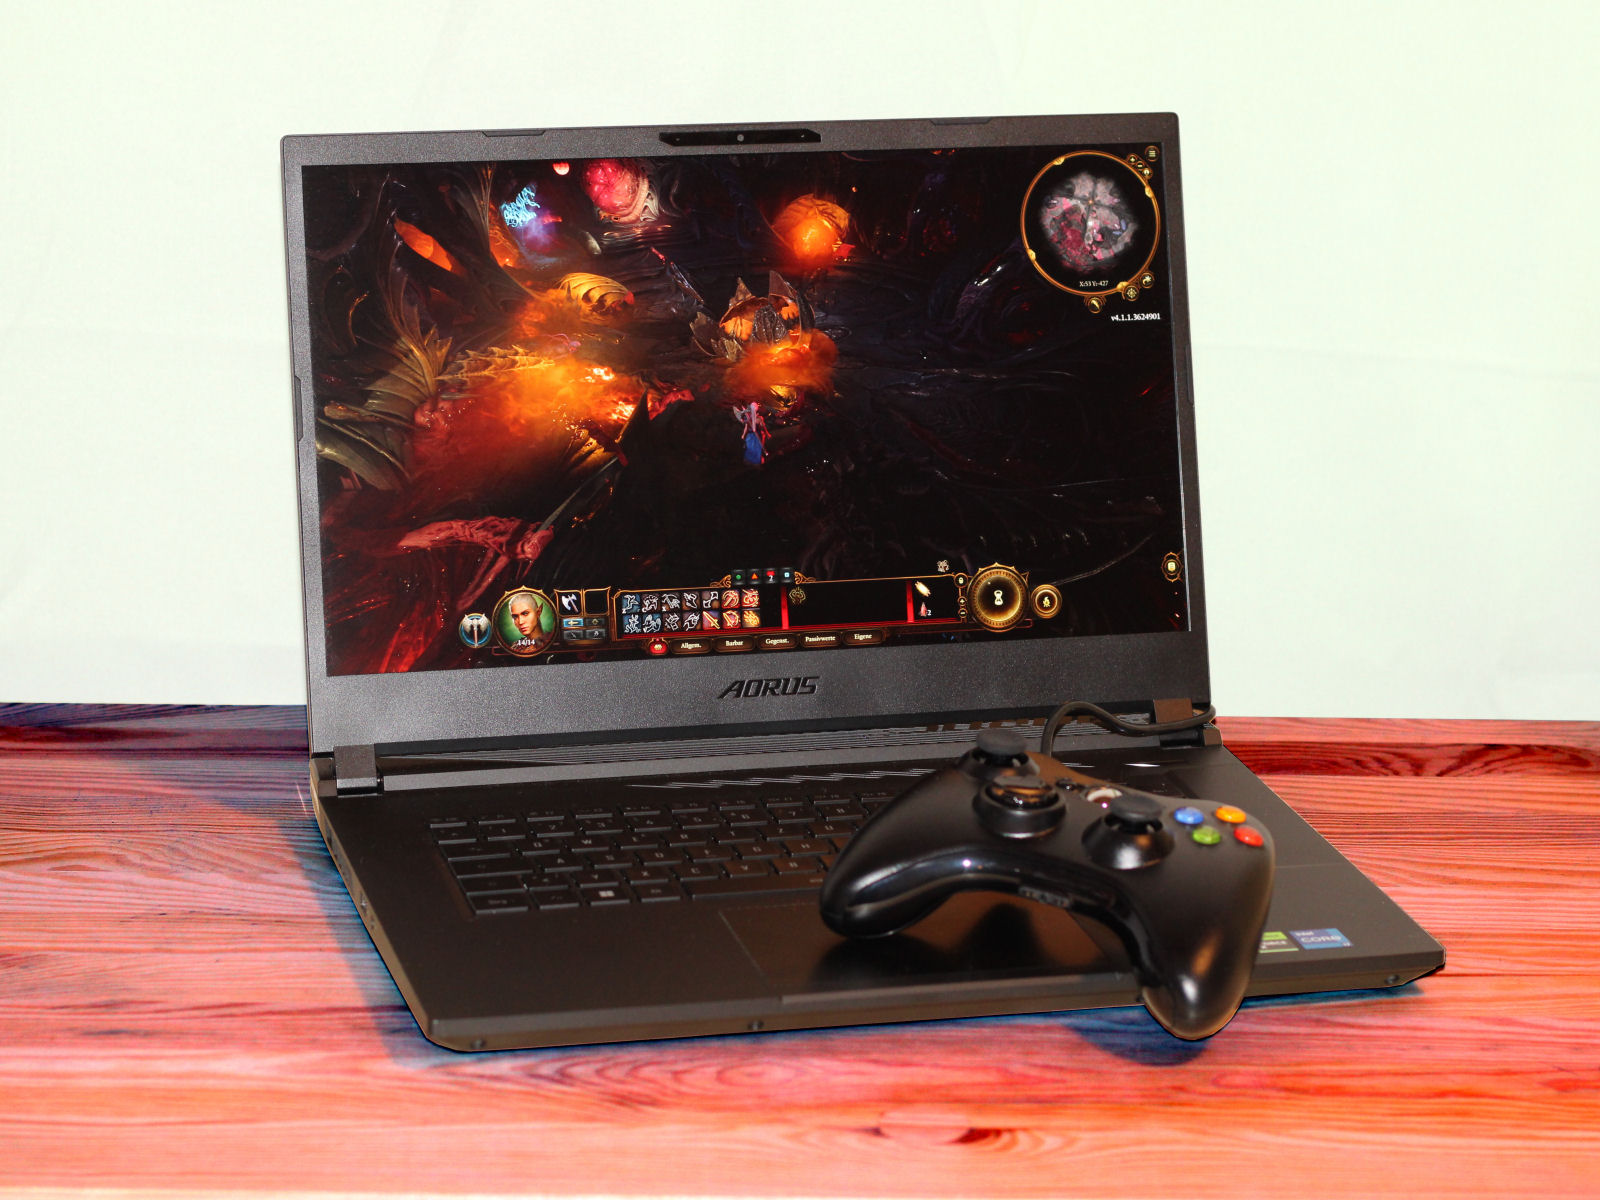
外壳 - 技嘉将技术置于金属外壳内
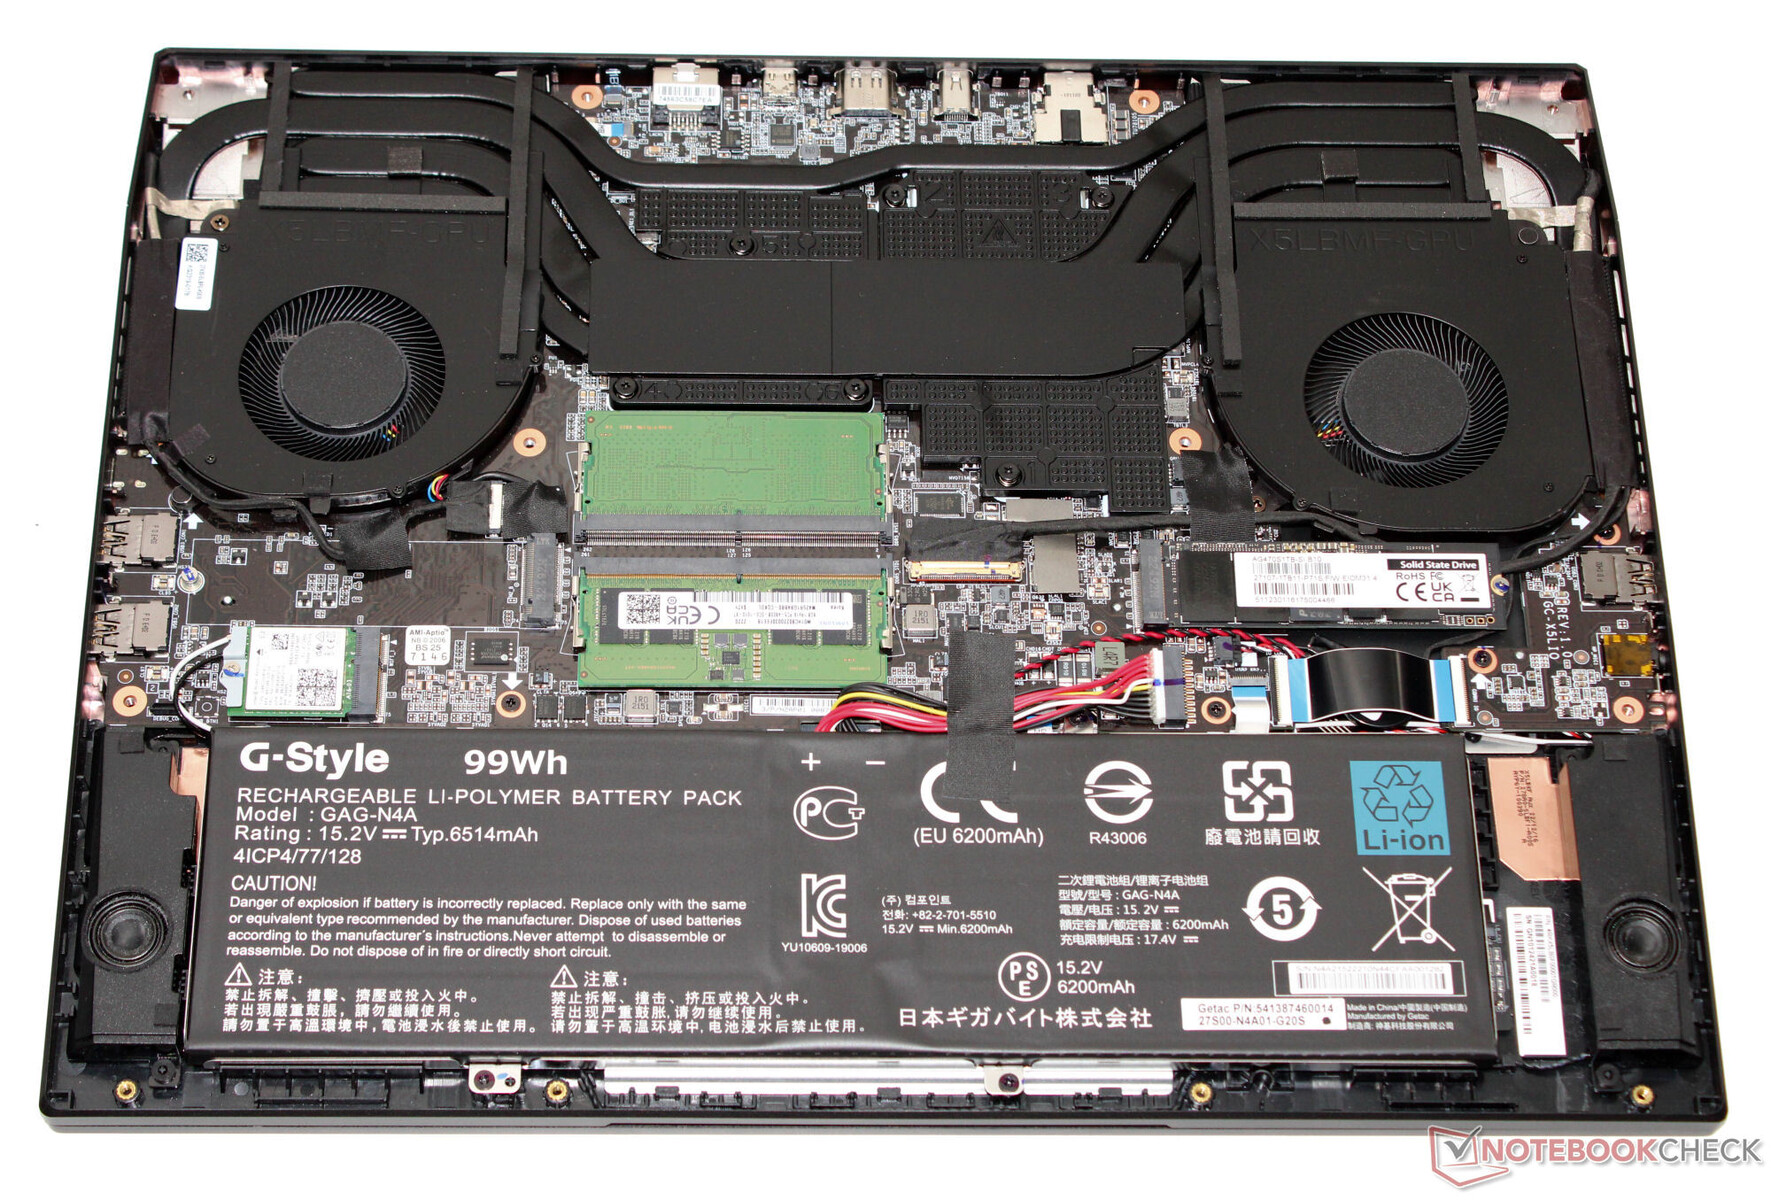
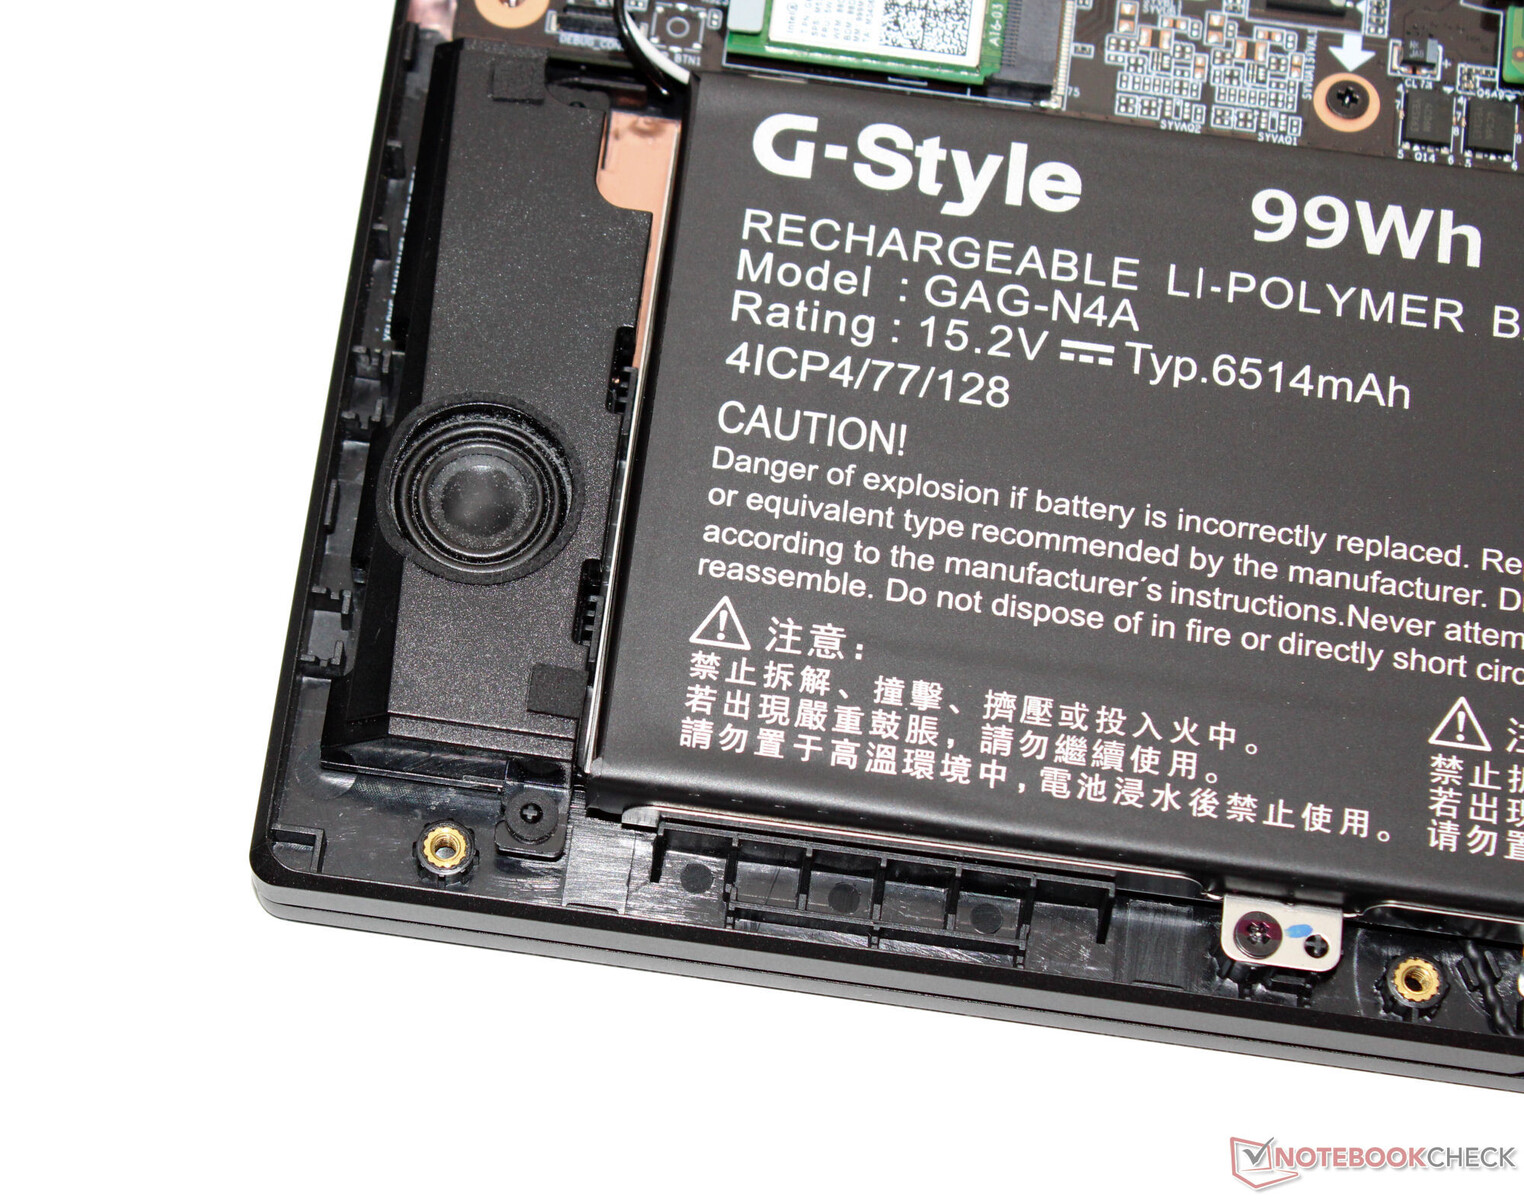
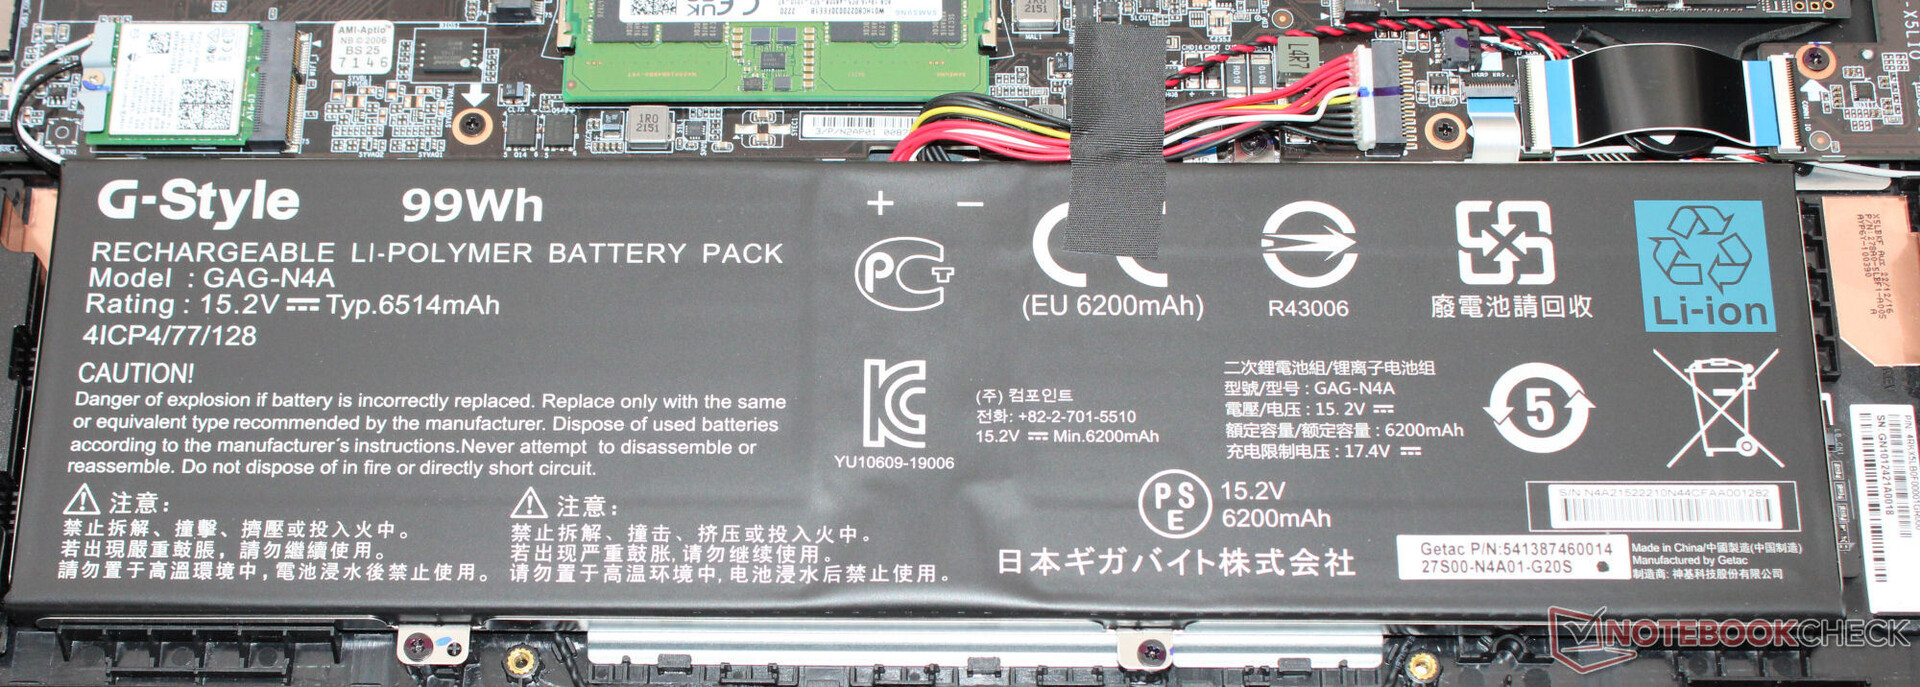
技嘉采用了黑色金属外壳,表面光滑磨砂。这款笔记本电脑没有采用任何外向型设计。机盖底部前方(笔记本电脑打开时)的 LED 灯带与发光键盘一起为设备增添了一些色彩。拆开机壳底部后,可以看到电池(用螺丝固定,而不是粘上去的)以及笔记本电脑的其他内部结构。
这款笔记本电脑似乎没有任何设计或制造缺陷。所有缝隙都整齐划一,看不到任何多余的材料。底座只能轻微扭曲,盖子则更难。虽然如此:按压背面并不会导致画面发生任何变化。铰链将盖子牢牢固定,其最大开启角度约为 130 度。单手即可打开设备。
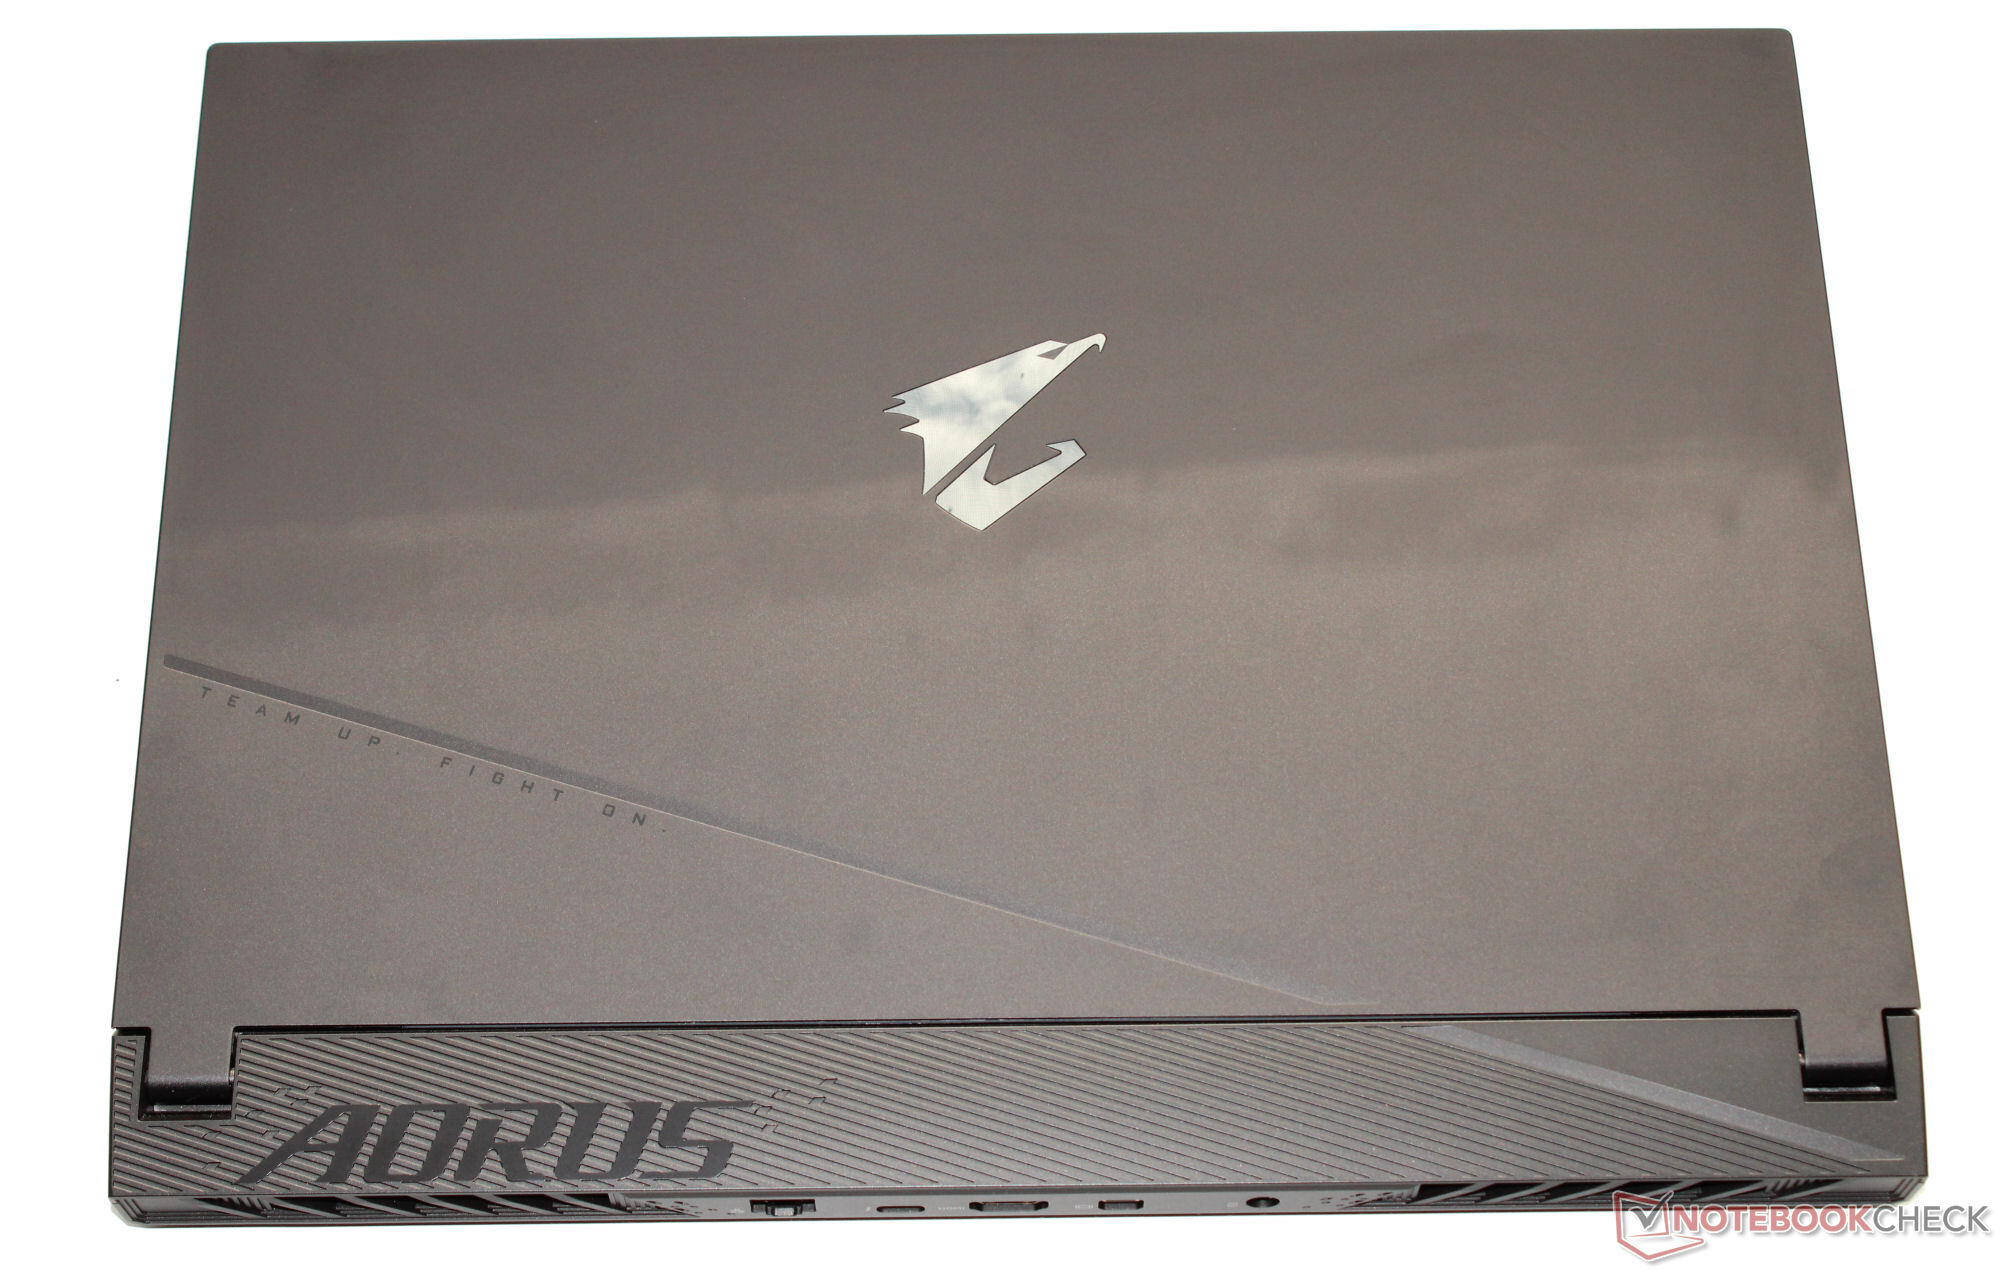
在对比领域,Aorus 15 是占地面积最大的笔记本电脑之一。其重量与平均水平相当。
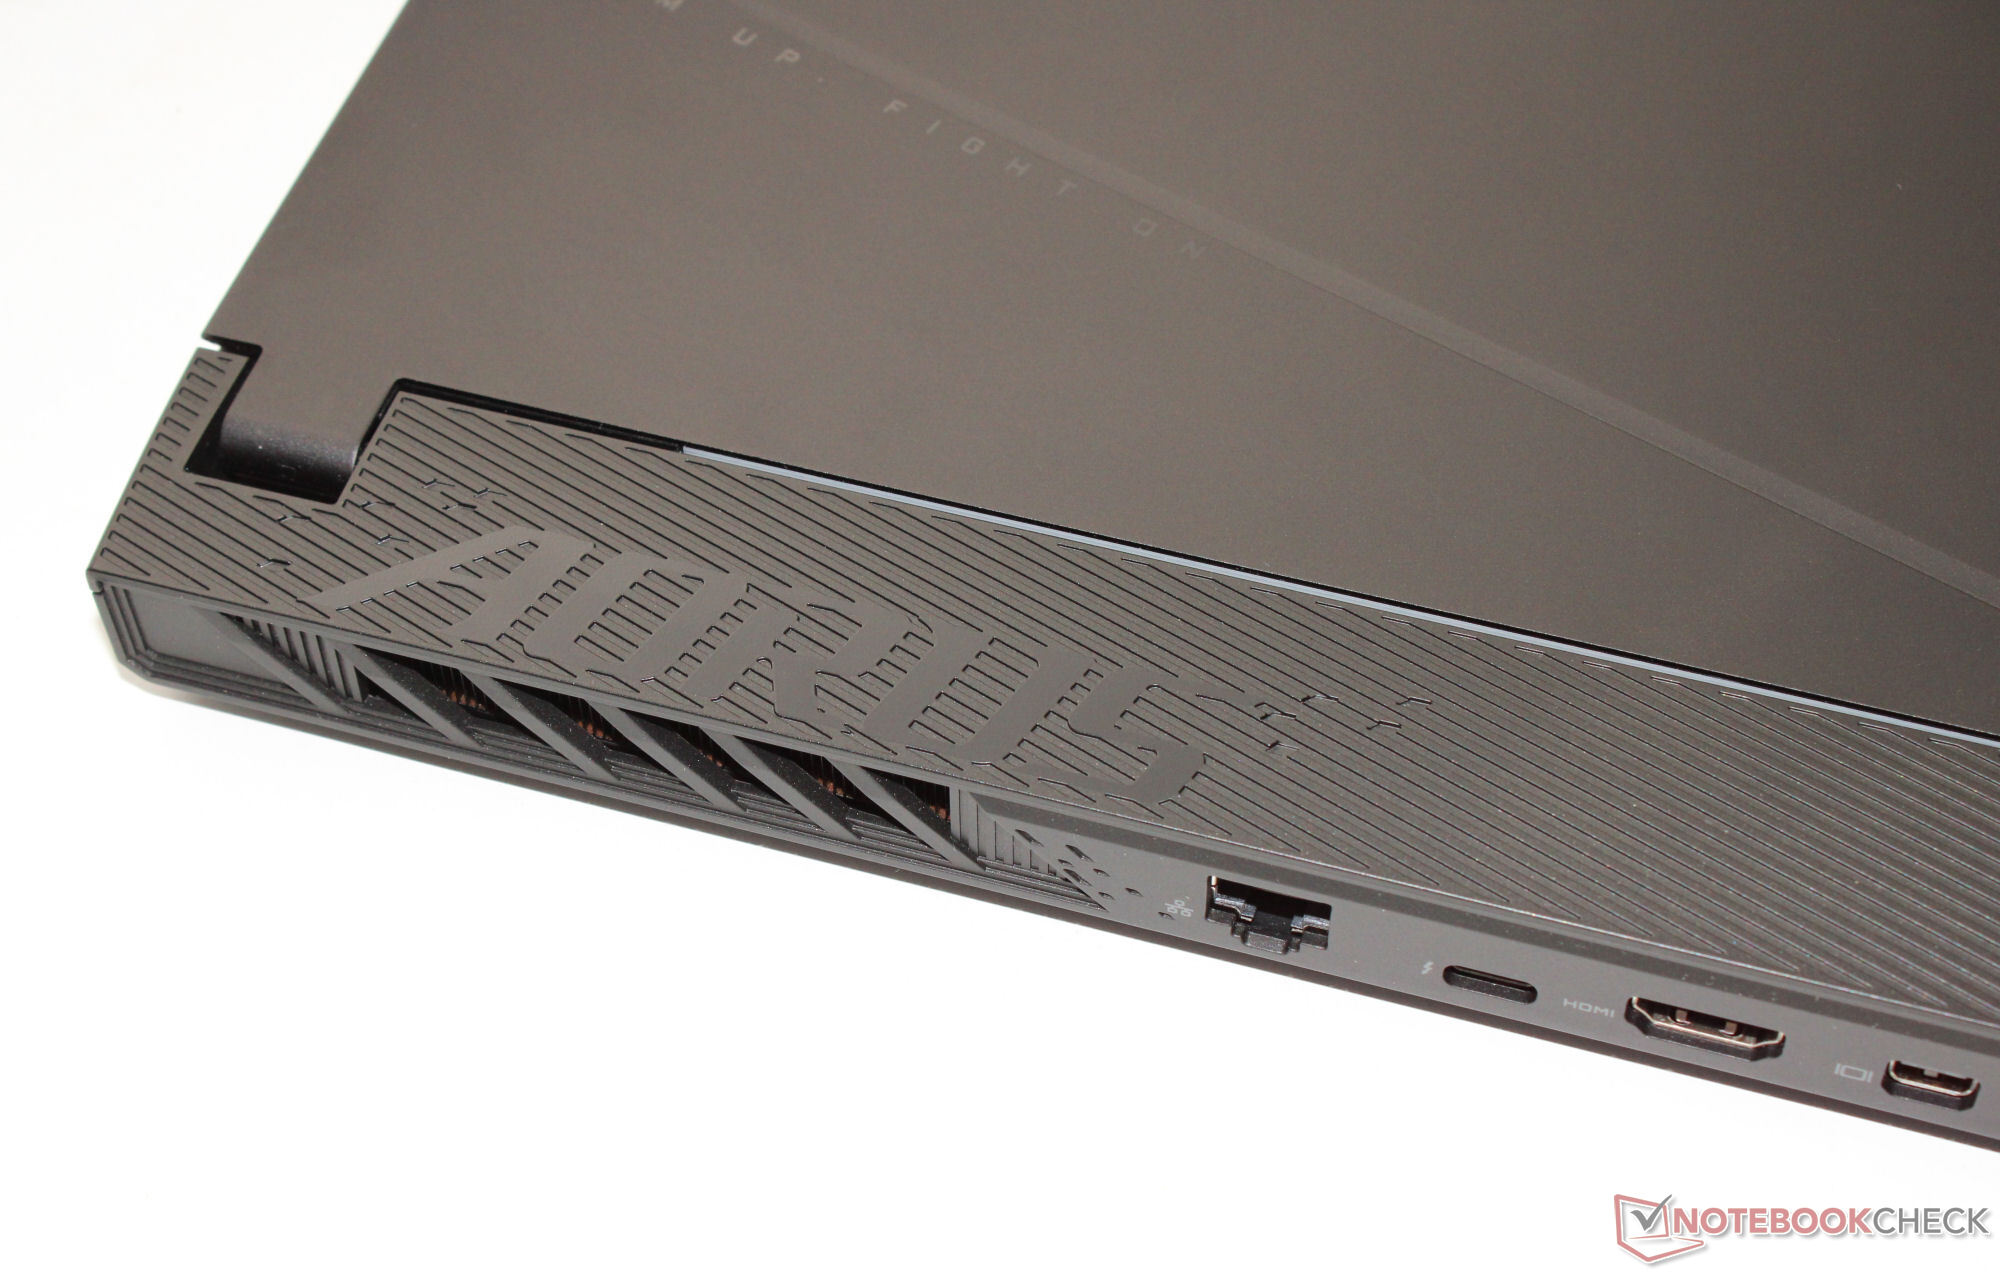
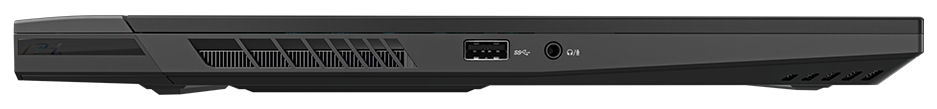
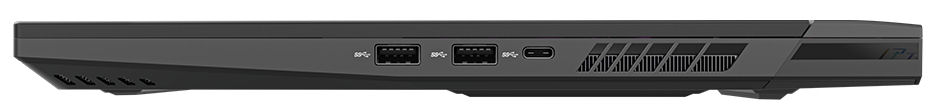
连接性 - 包括 Thunderbolt 4
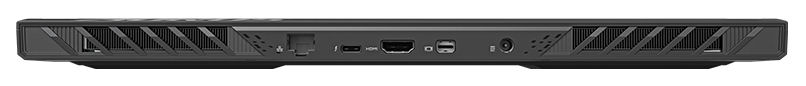
Aorus 配备三个 USB-A 端口(2 个 USB 3.2 Gen 2、1 个 USB 3.2 Gen 1)和两个 USB-C 连接(1 个 Thunderbolt 4、1 个 USB 3.2 Gen 2)。TB4 端口支持 Power Delivery,但不能输出 DisplayPort 信号。这意味着它总共有两个视频输出端口,即一个 HDMI 端口(2.1)和一个专用 Mini DisplayPort(1.4)。这款笔记本电脑没有 SD 读卡器。
它的视频输出、电源连接和千兆以太网端口都位于设备的背面,这意味着所有线缆都从背面穿过,不会碍事。
交流
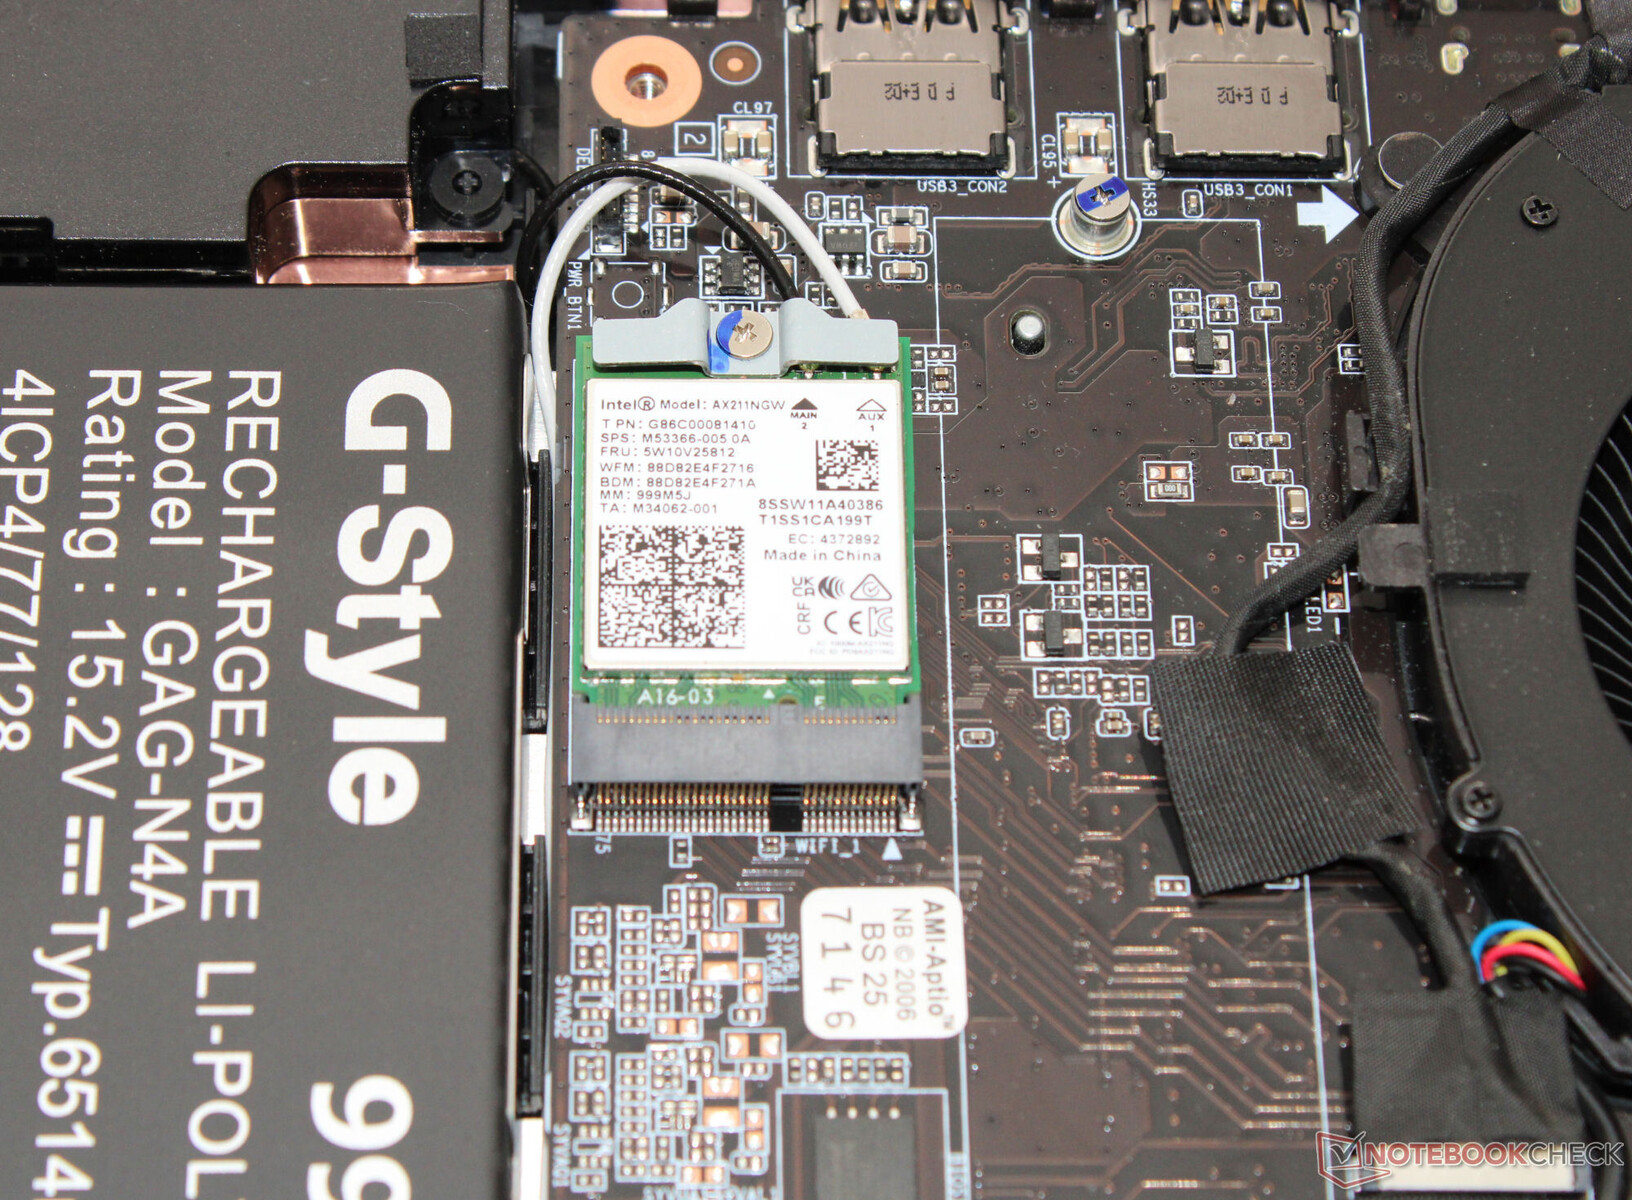
在理想的条件下(附近没有 WLAN 设备,笔记本电脑和服务器电脑之间的距离很短),笔记本电脑能实现极佳的 WiFi 数据传输速率。该设备使用 WiFi 6E 芯片(英特尔 AX211)。有线连接由 Realtek 的控制器(RTL8125;2.5 GBit)负责。
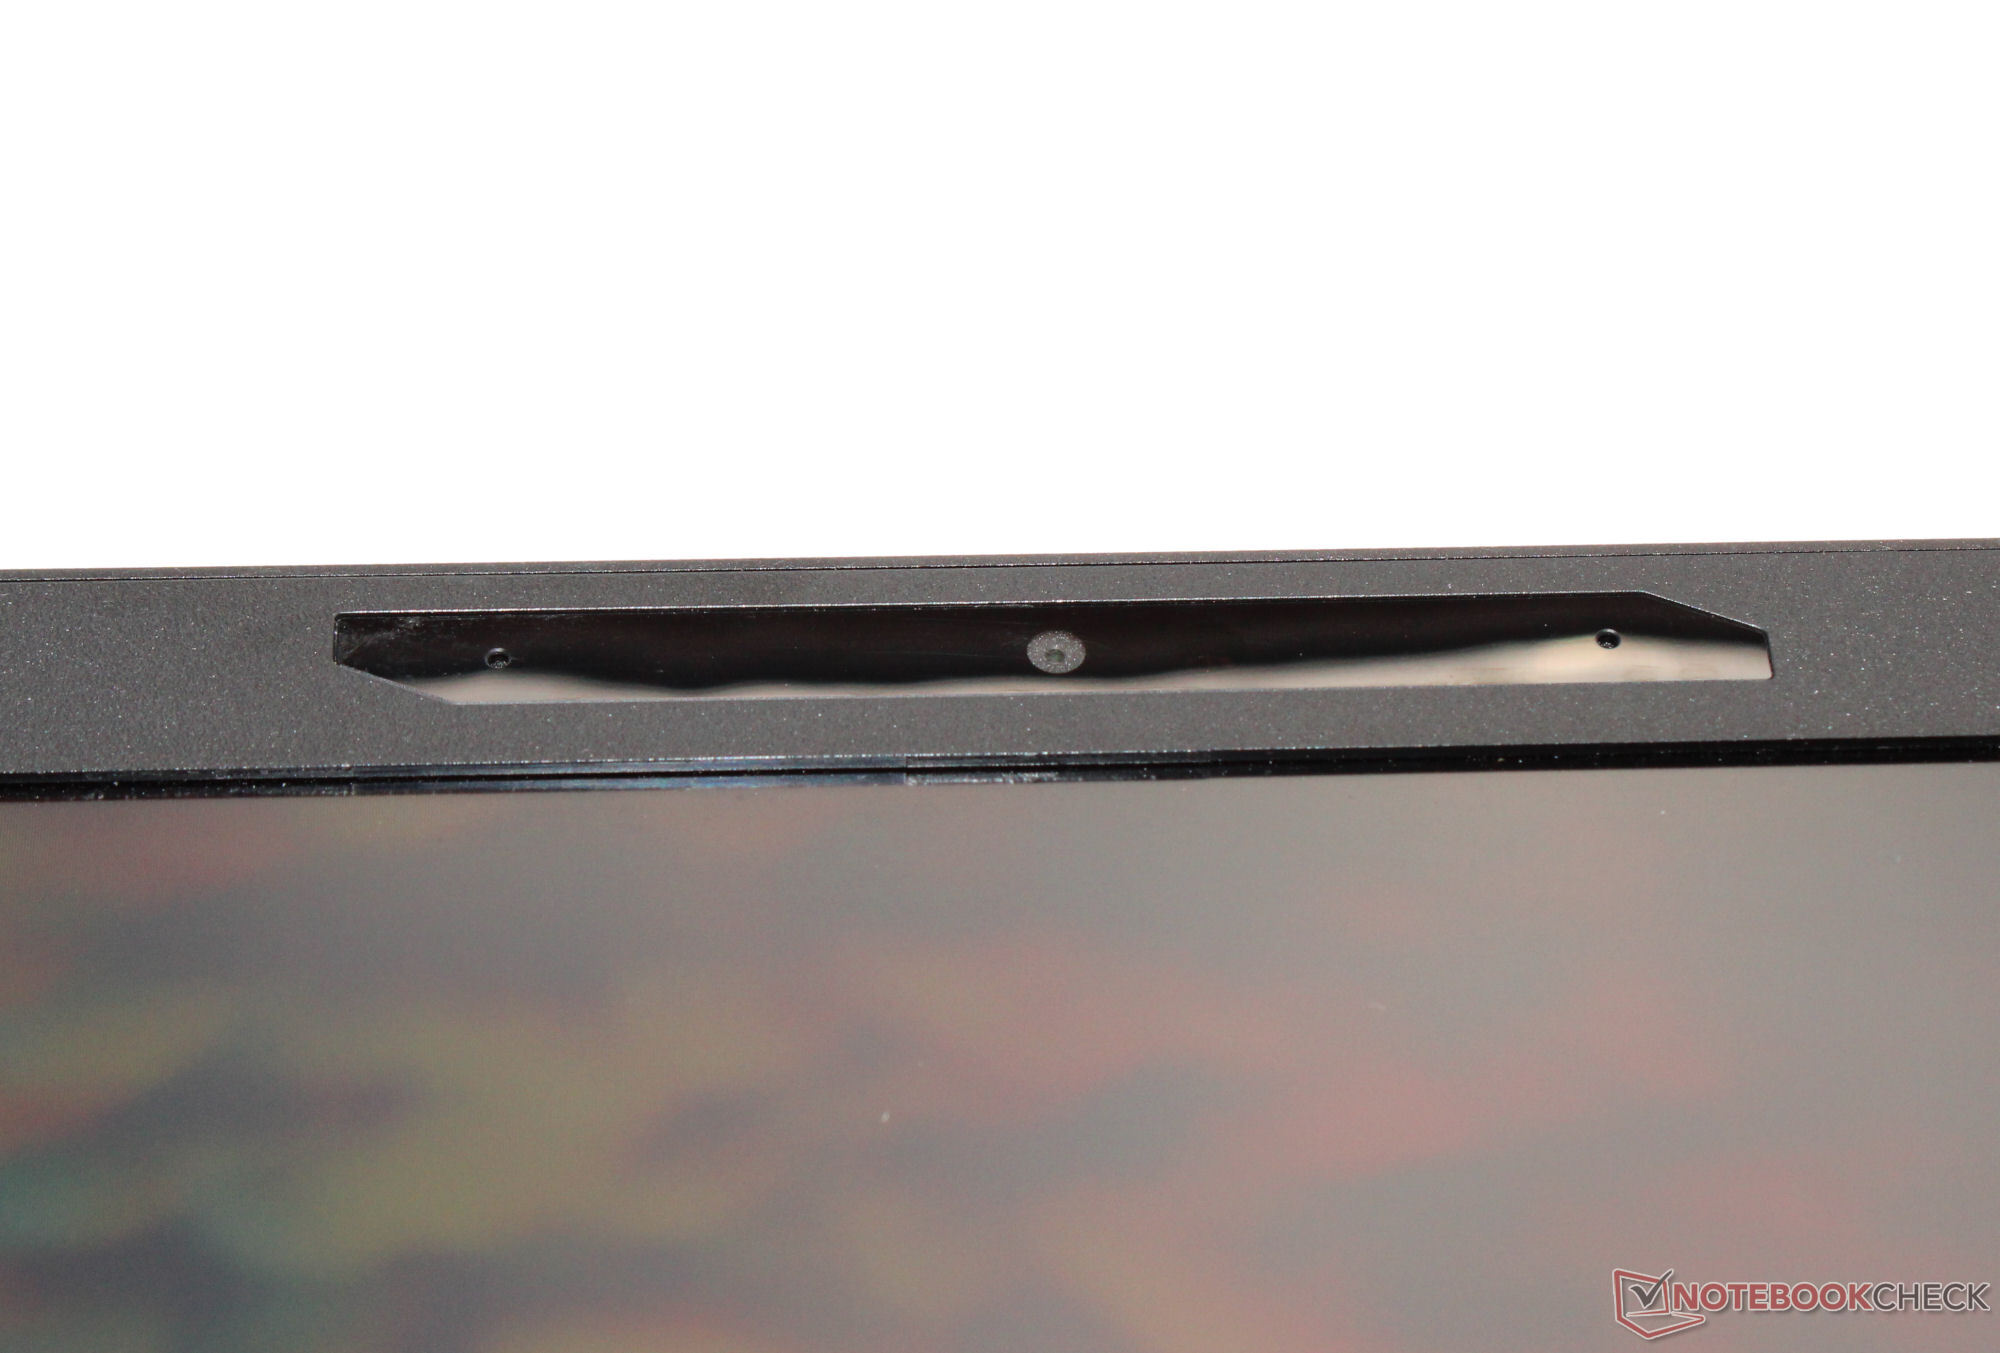
网络摄像头
其网络摄像头的质量(210 万像素,最大 1,920 x 1,080 像素)与同类产品相比并无差异。它没有机械盖。


配件
除了常规文件(快速入门指南和保修信息)外,这款笔记本电脑没有附带任何其他配件。
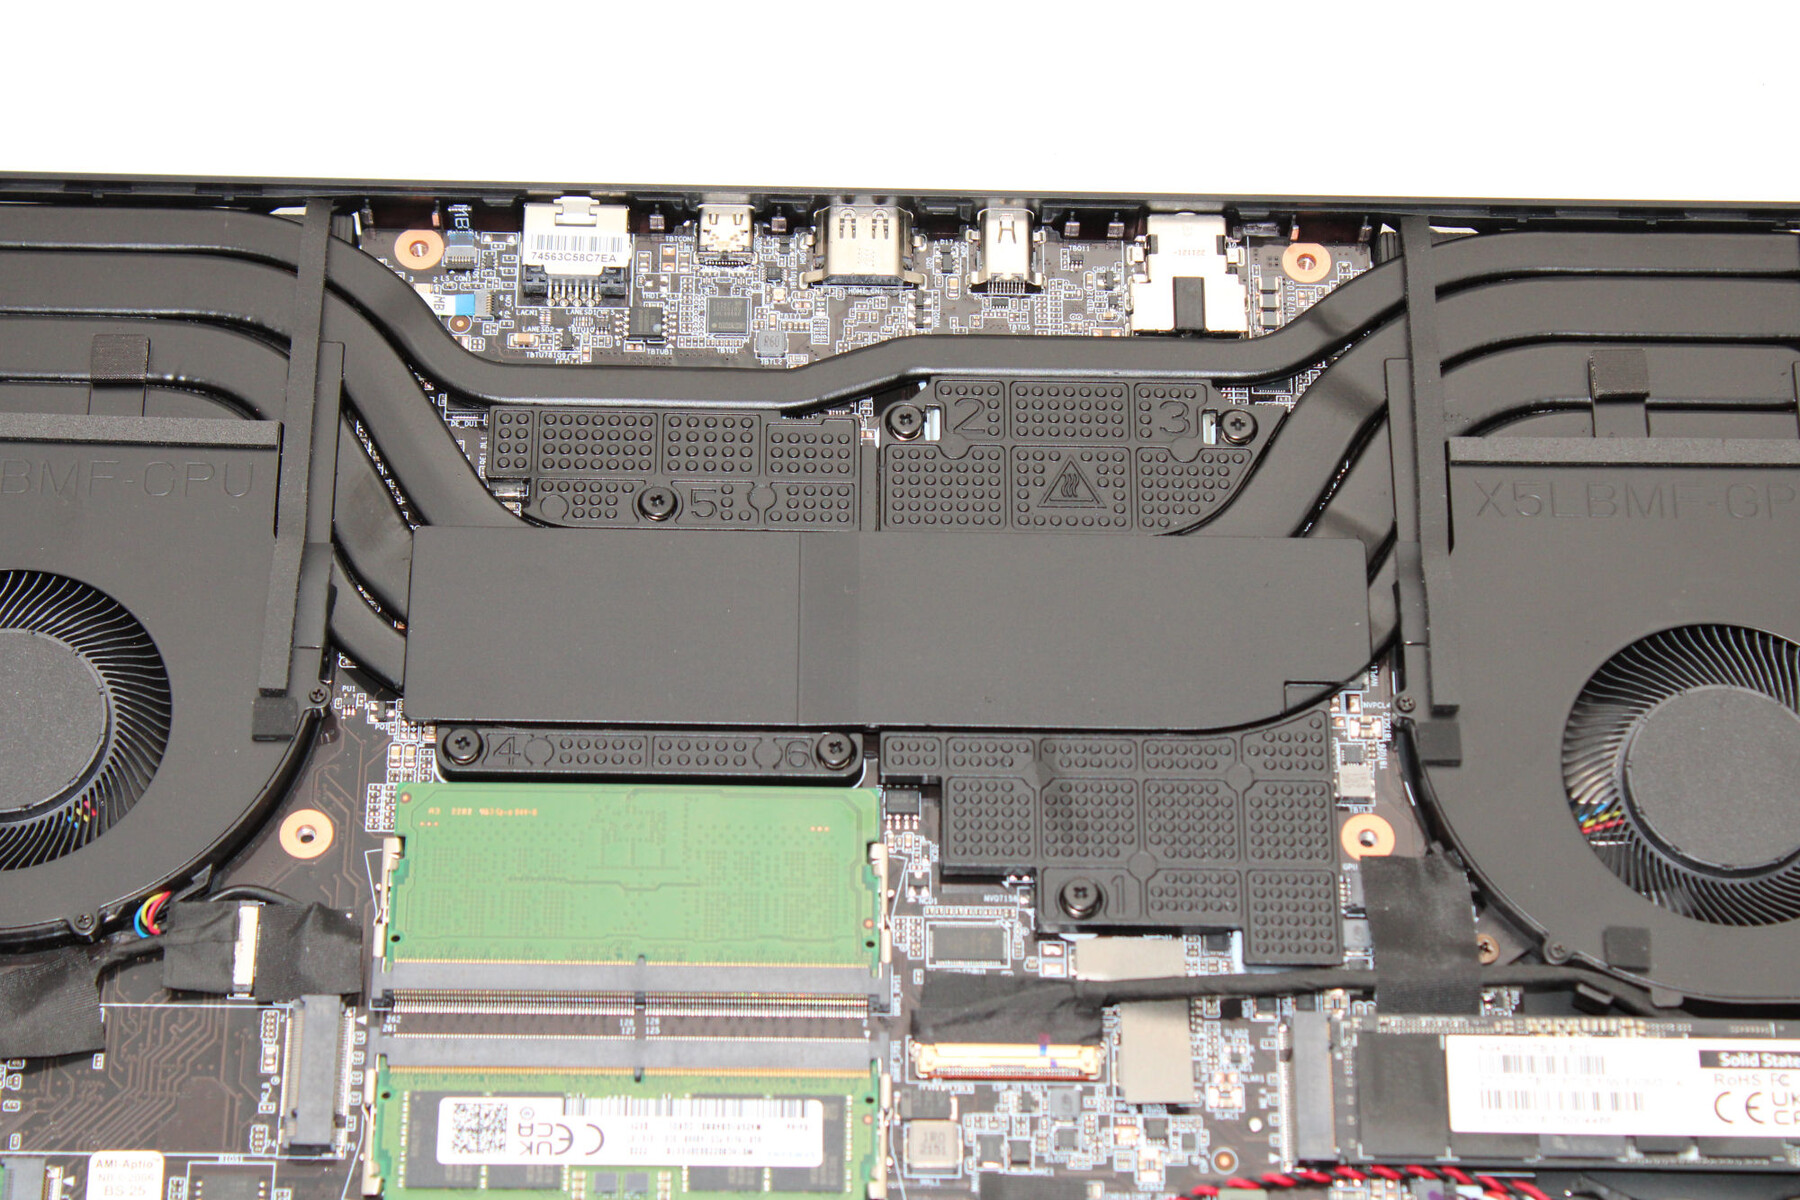
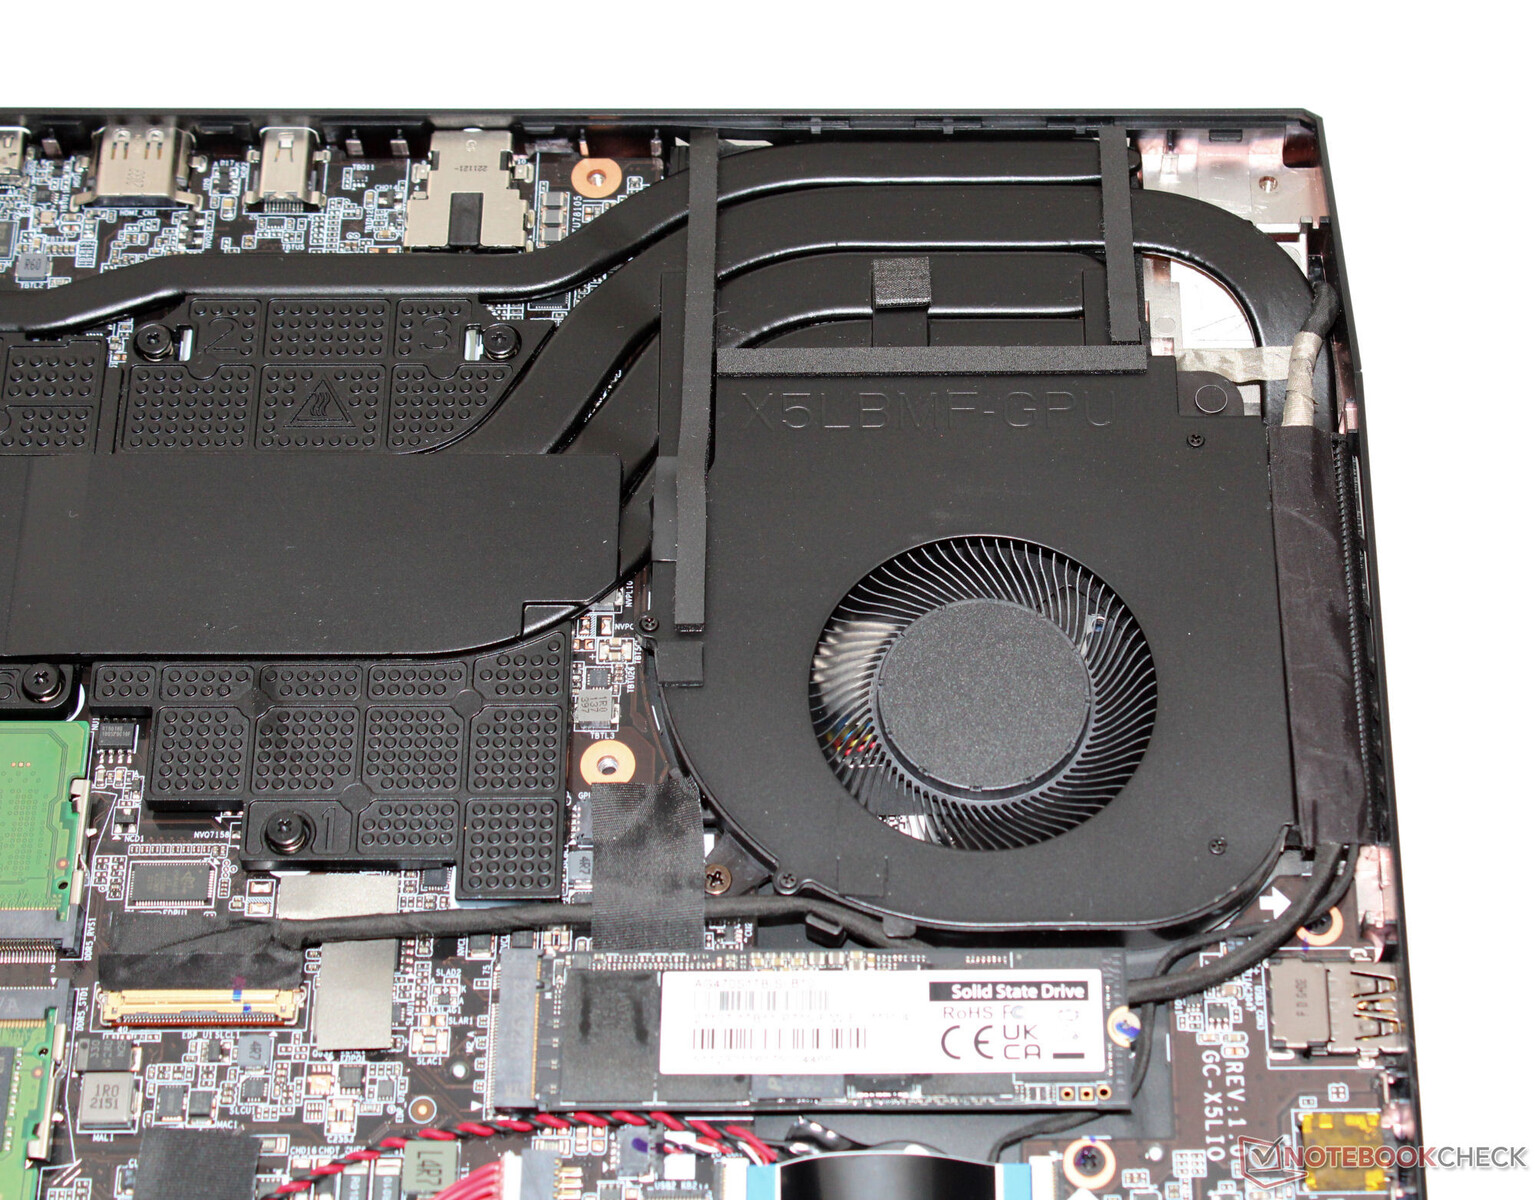
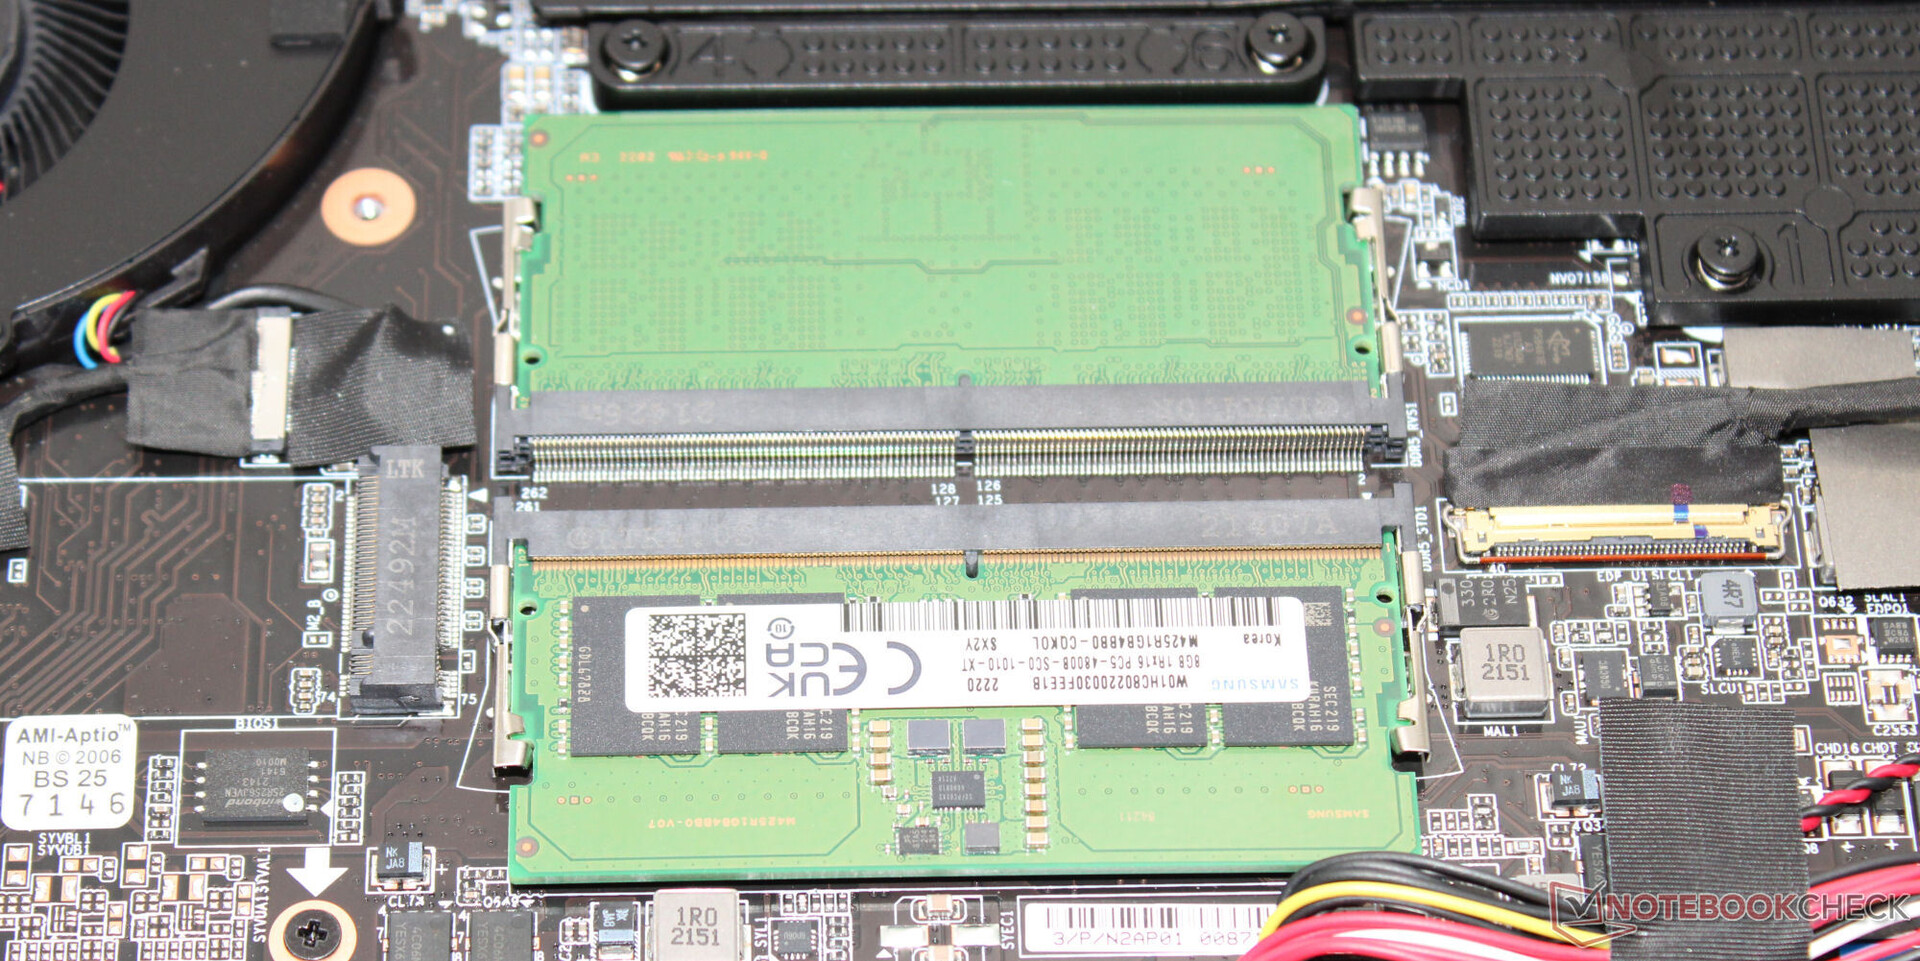
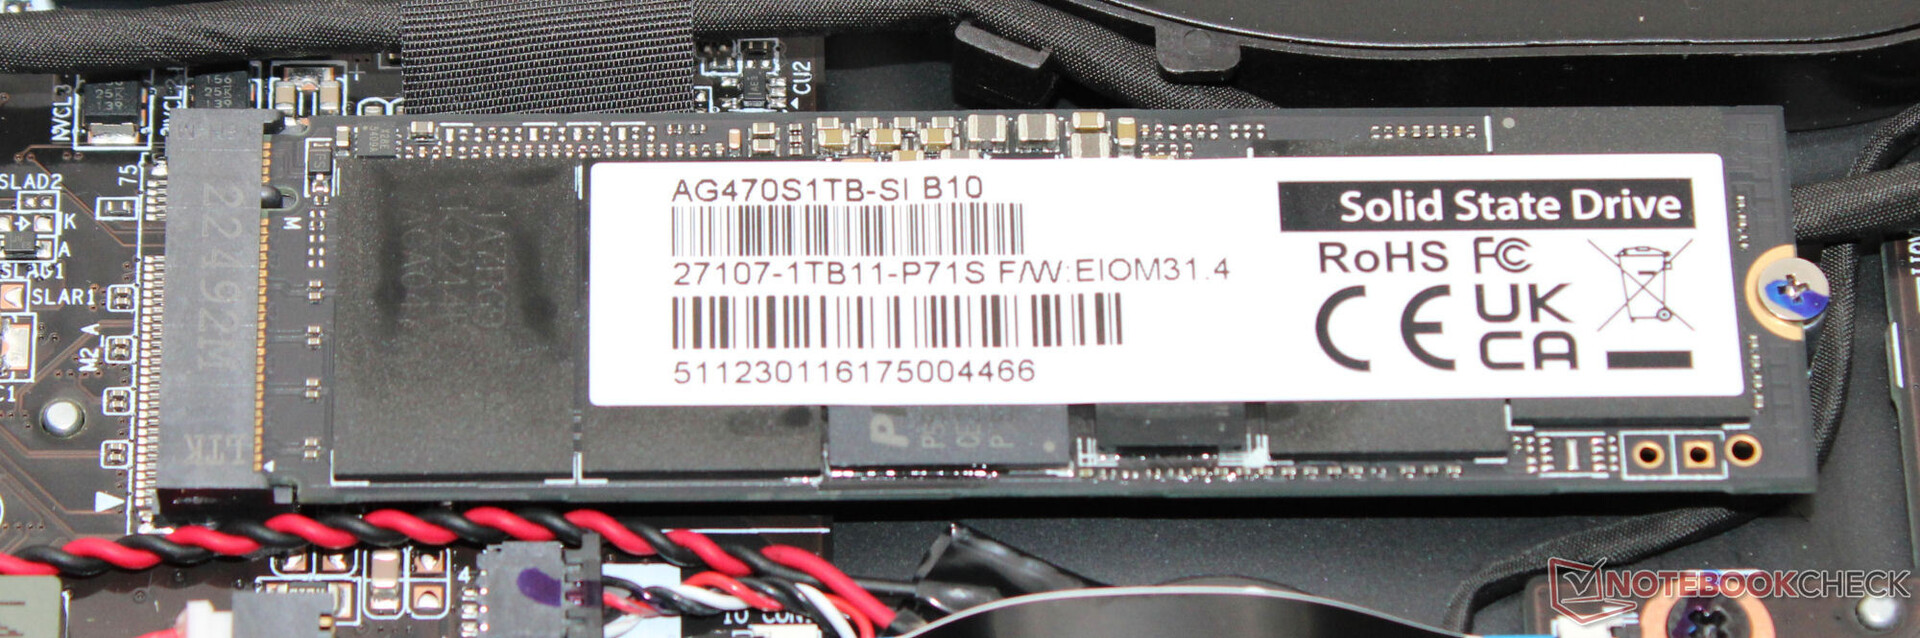
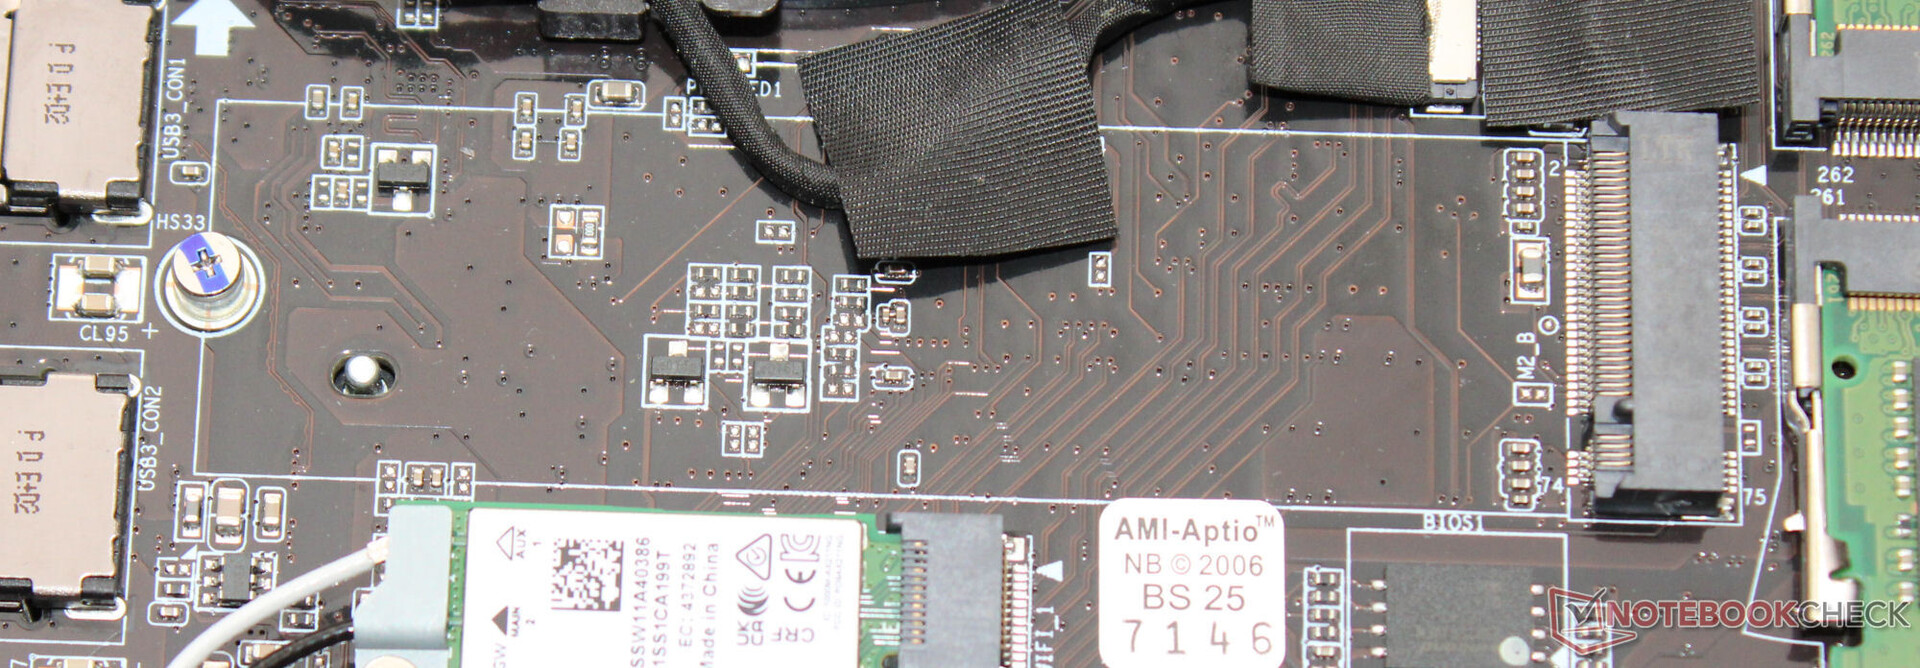
维护
拧下设备底部的所有螺丝后,可借助刮刀或拨子弹取下机箱底部。随后,您可以访问内存插槽(两个都占用)、固态硬盘(PCIe 4、M.2 2280)、第二个 M.2 2280 插槽(PCIe 4、M.2 2280)、BIOS 电池、WLAN 模块、风扇、扬声器和电池。

保修
技嘉 15.6 英寸笔记本电脑的保修期为一年。无法延长保修期。
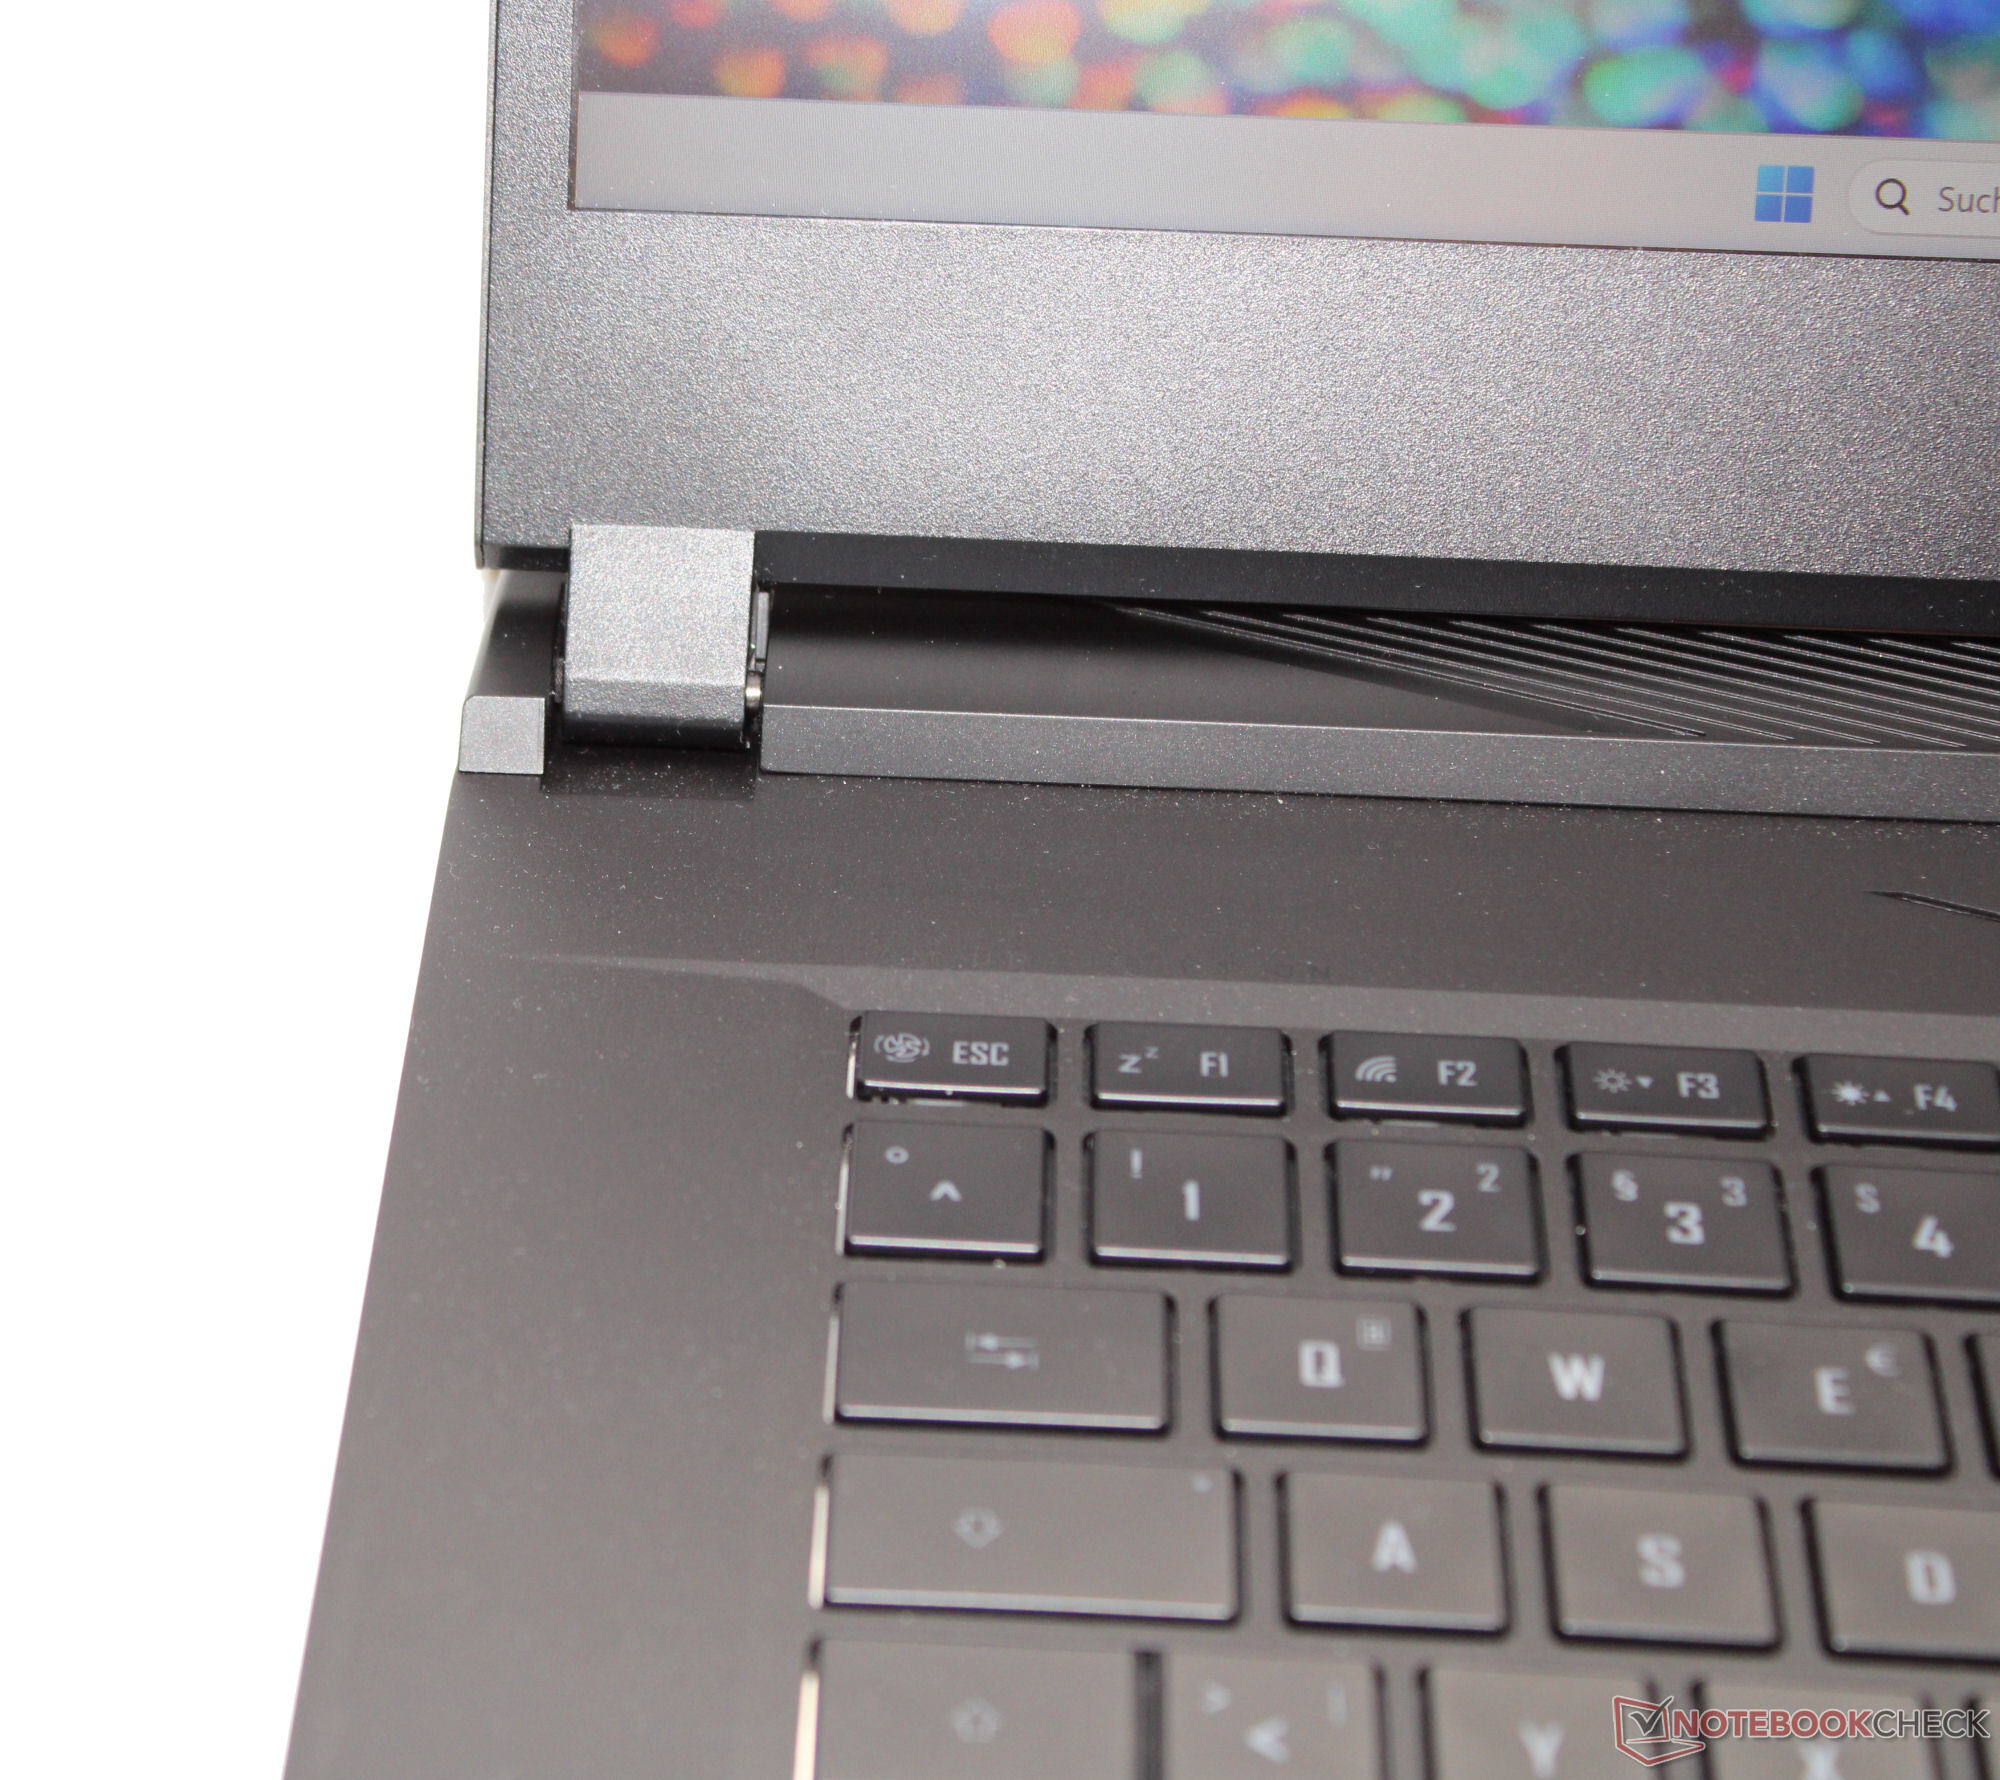
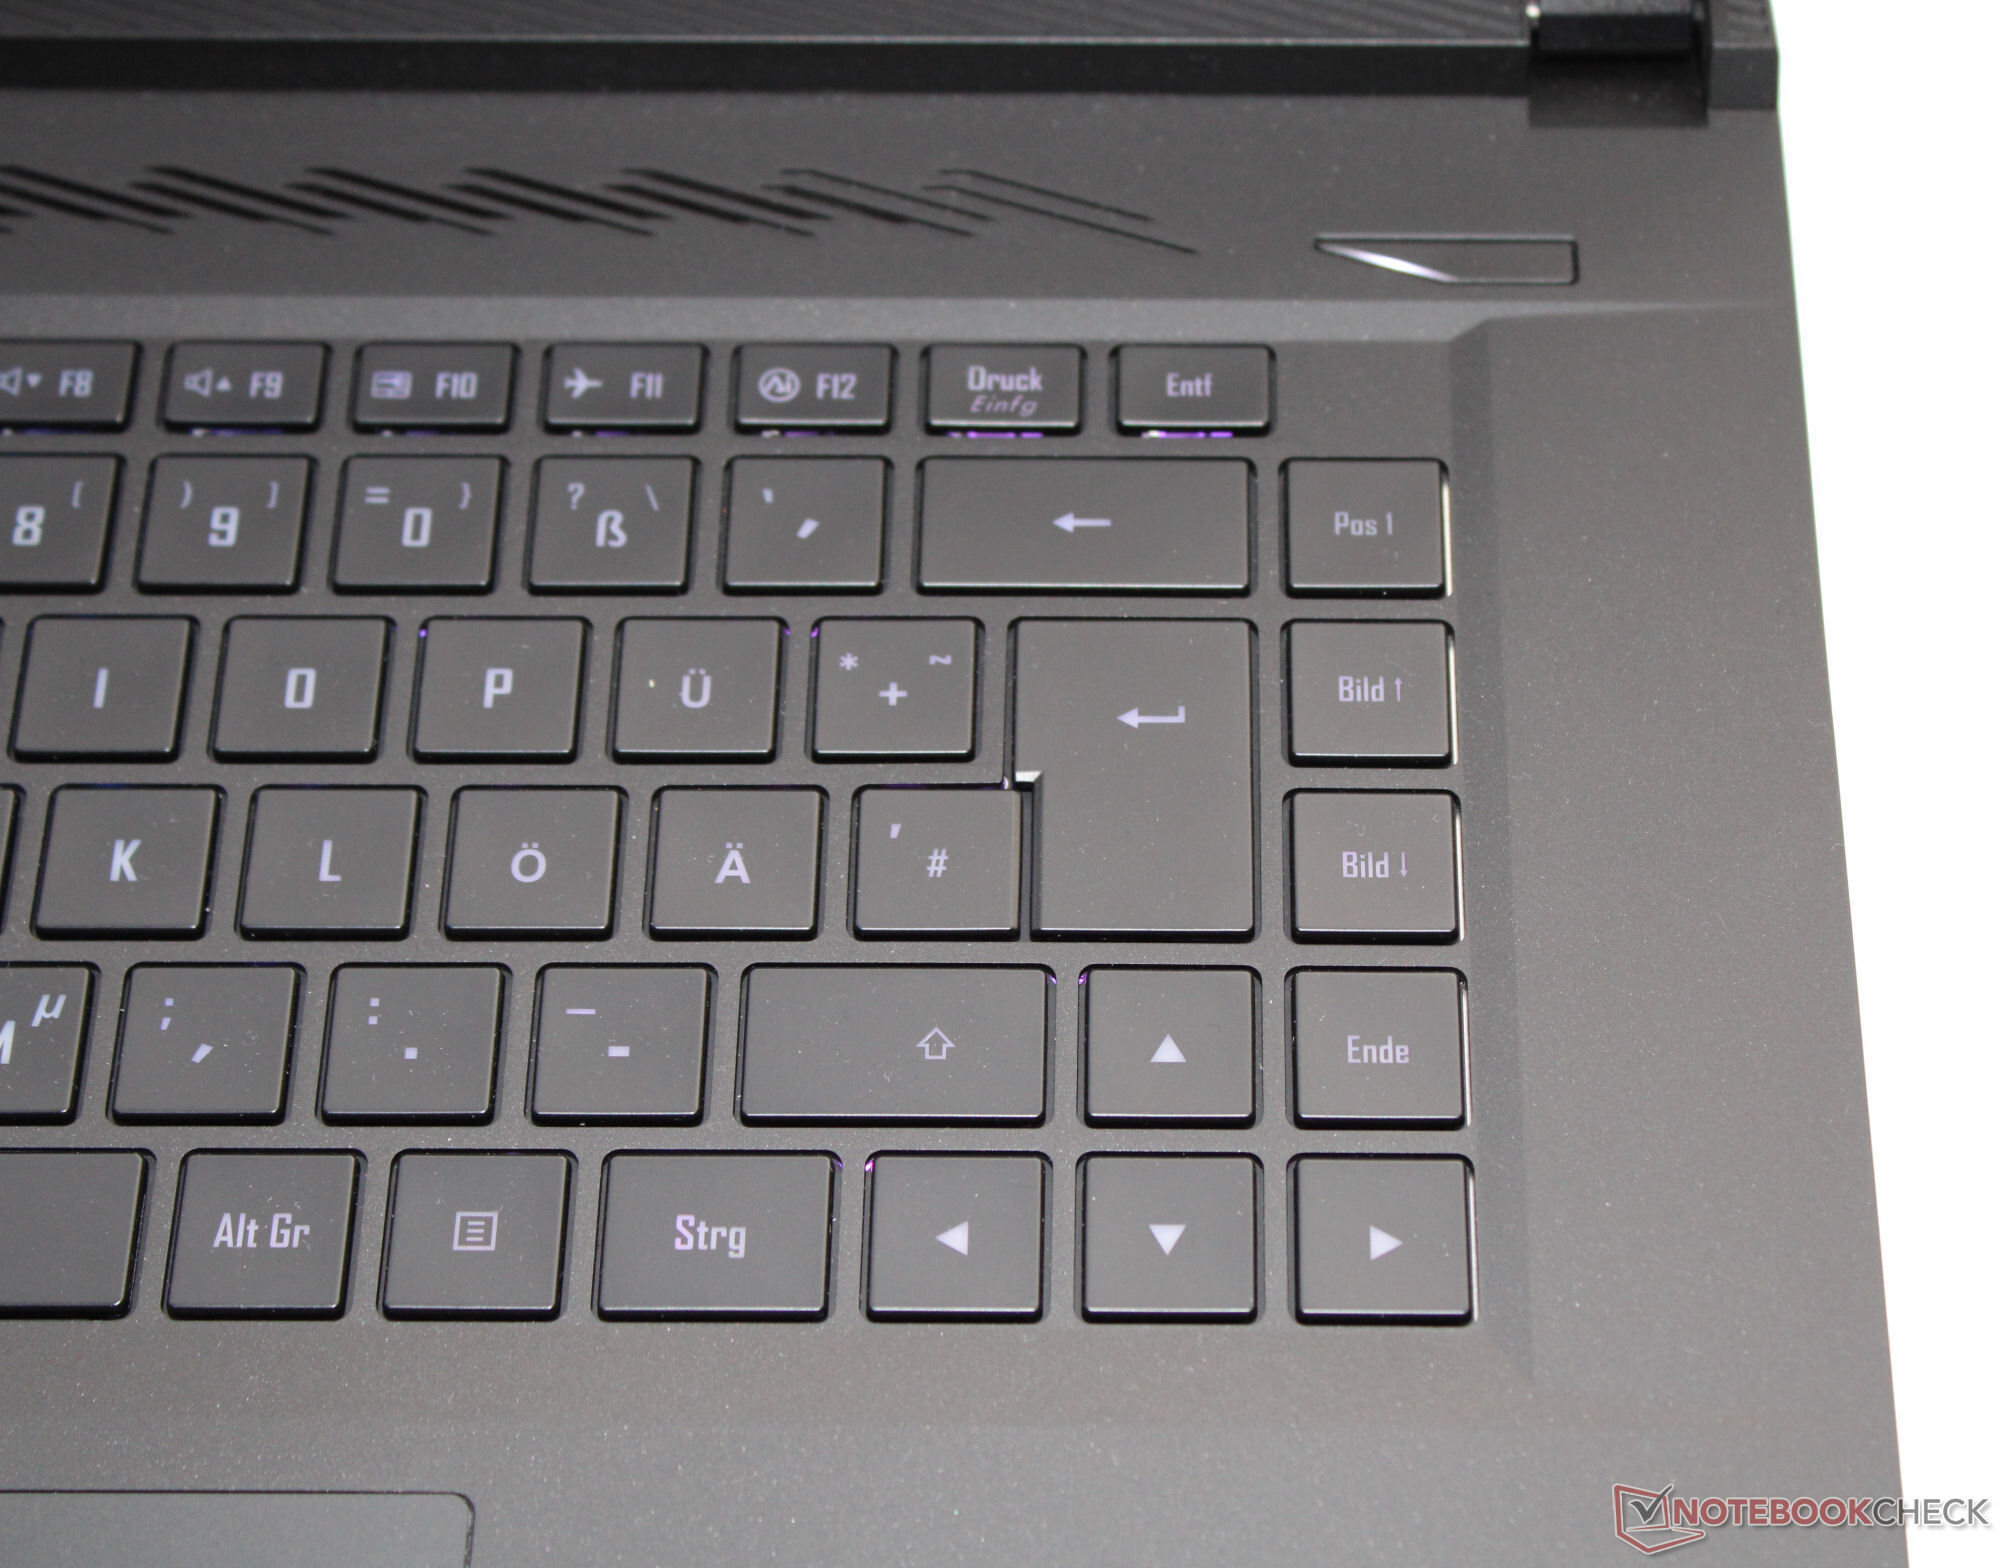
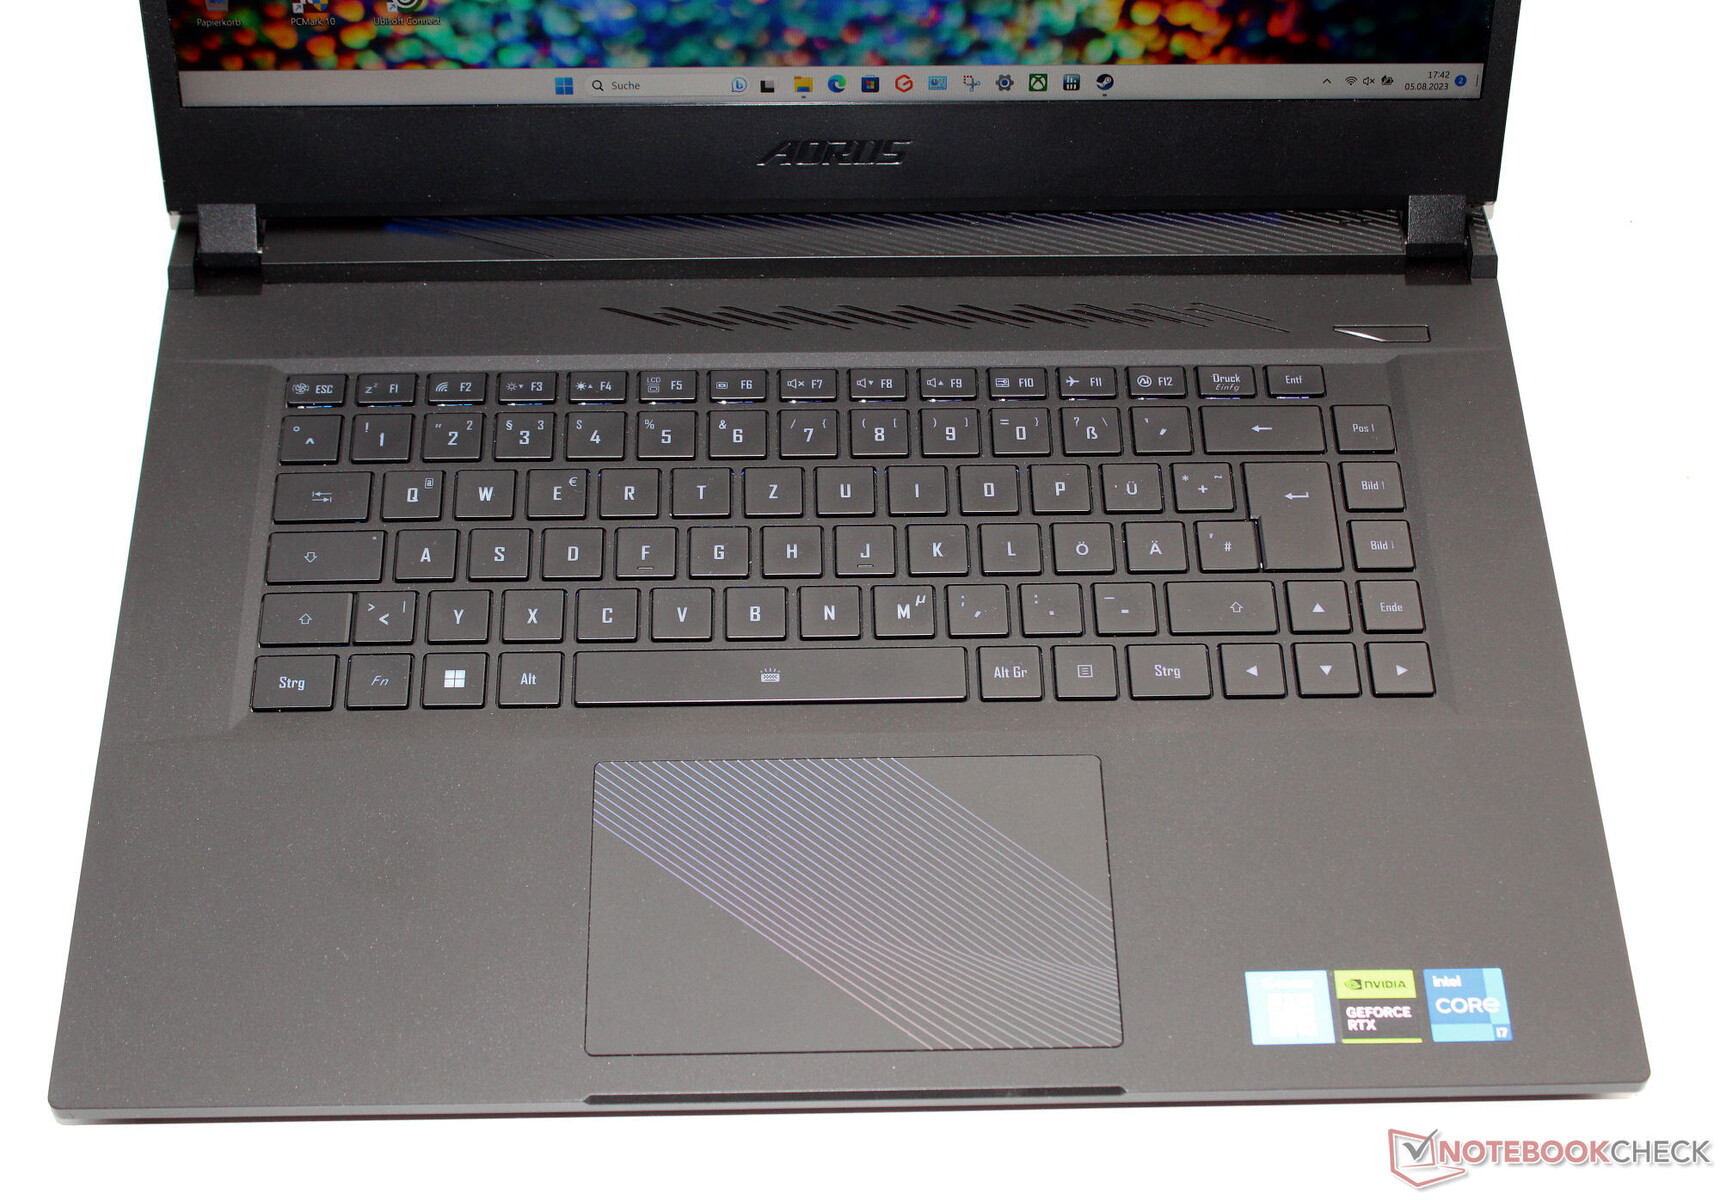
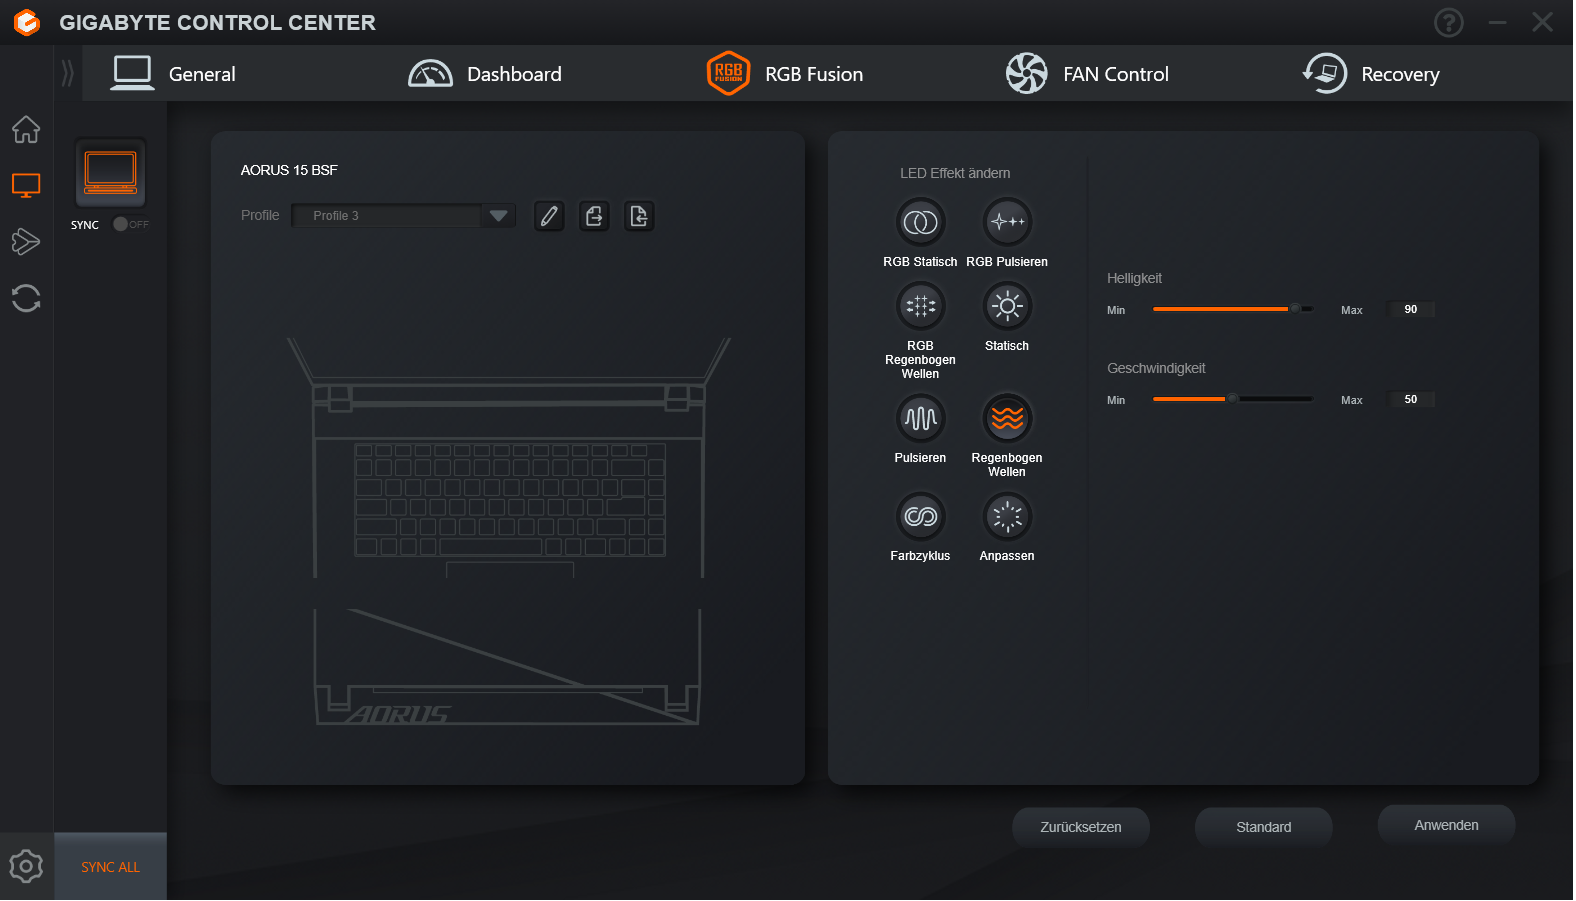
输入设备 - 配备 RGB 灯光的游戏笔记本电脑
键盘
带照明的 Chiclet 键盘按键光滑,键程适中,按压点清晰。按键的阻力适中--在键入时,按键会有轻微的松动,但不会太恼人。正面:四个方向键的大小都很合适。总而言之,这是一款适合日常使用的键盘。
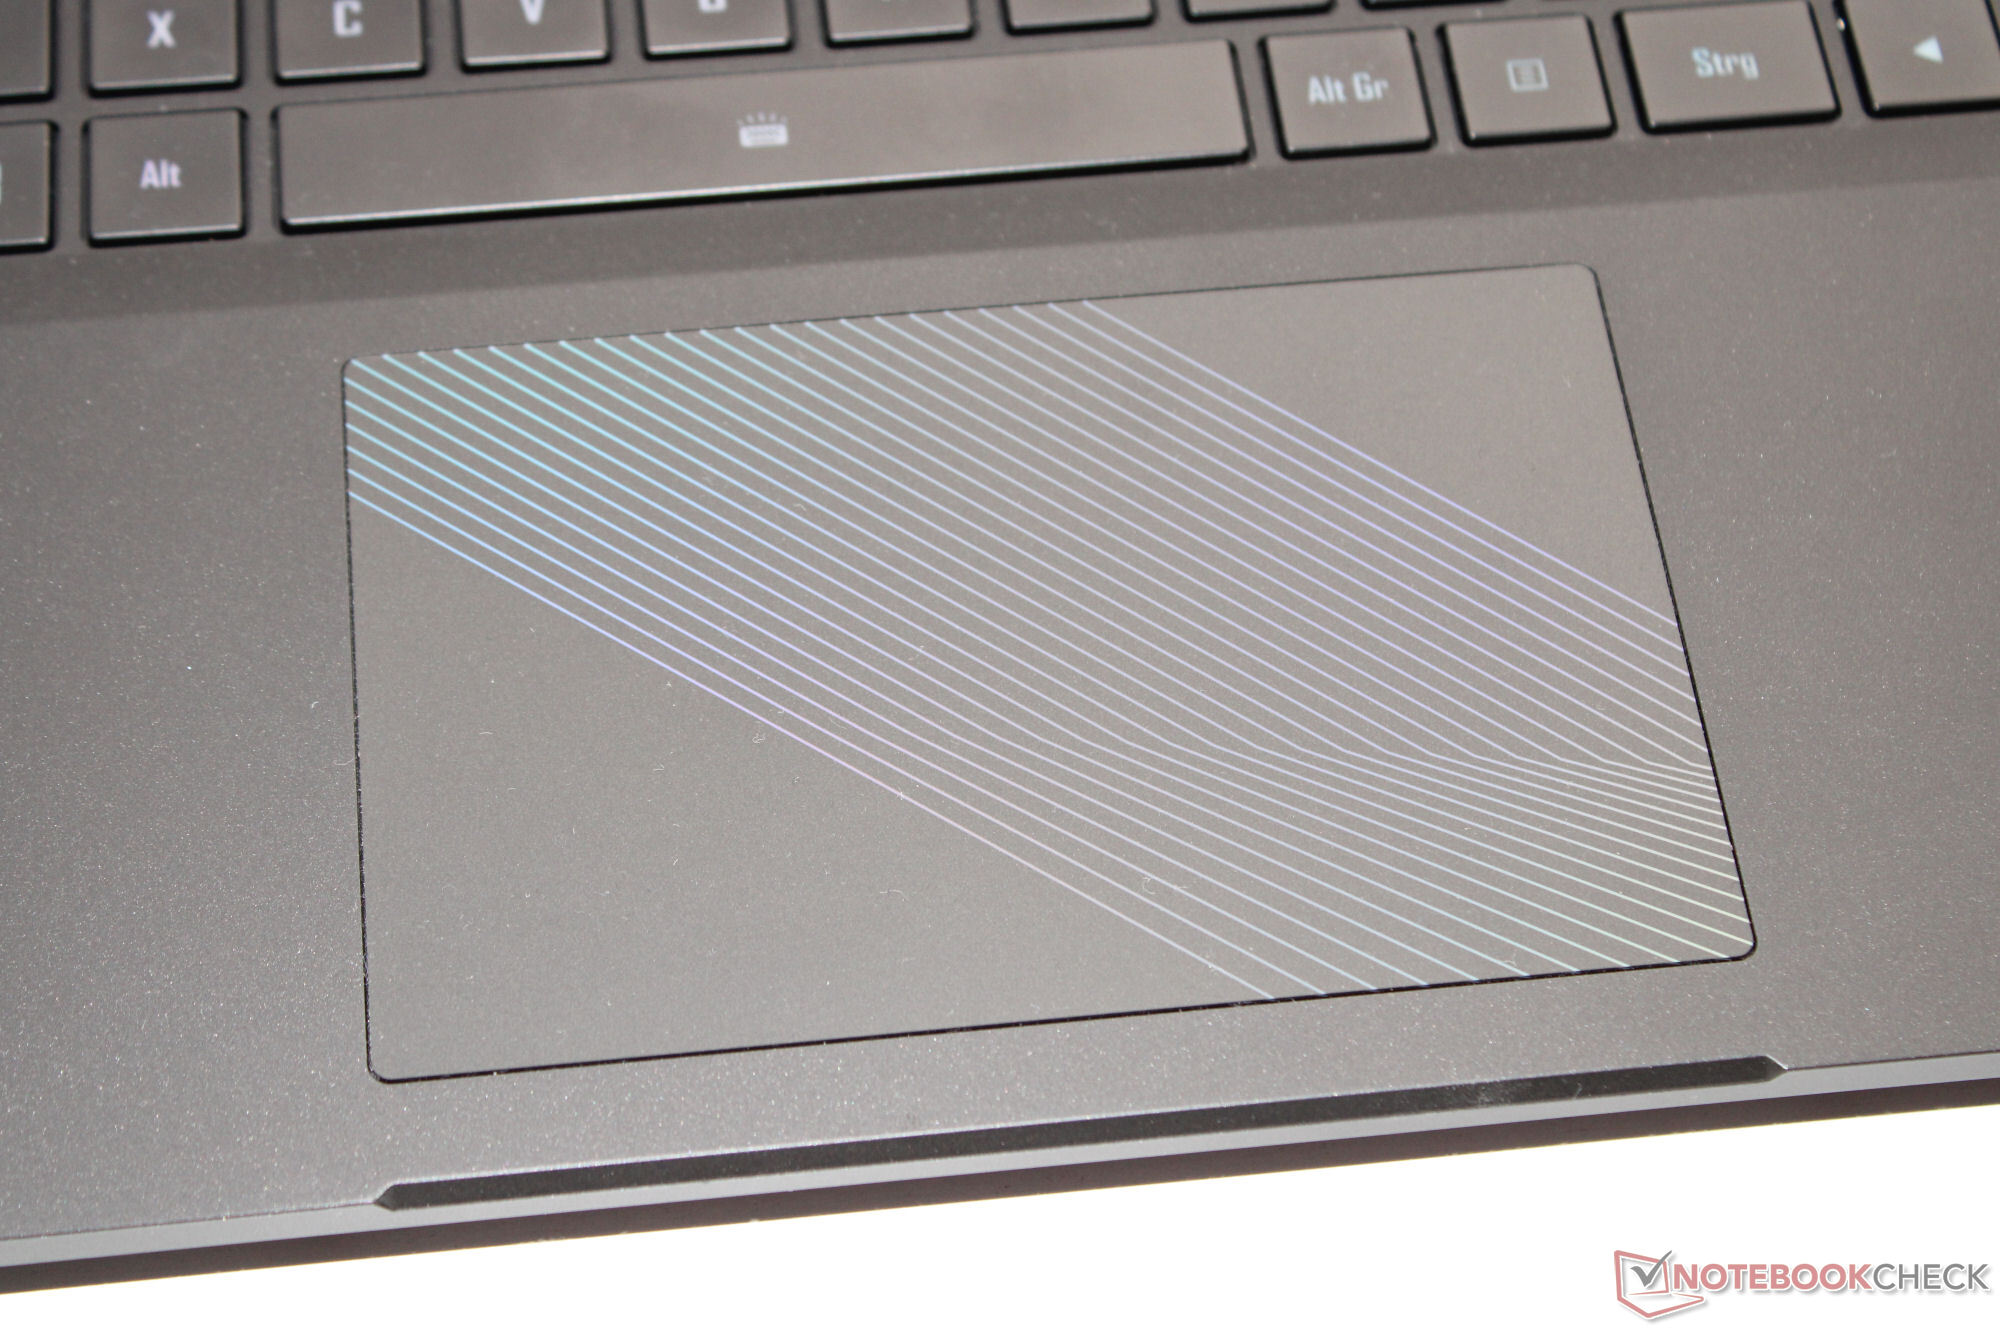
触摸板
点击垫(12.1 x 7.6 厘米)可替代鼠标,手指可在其光滑的表面上轻松滑动。它有一个较短的提升和一个清晰的压力点。
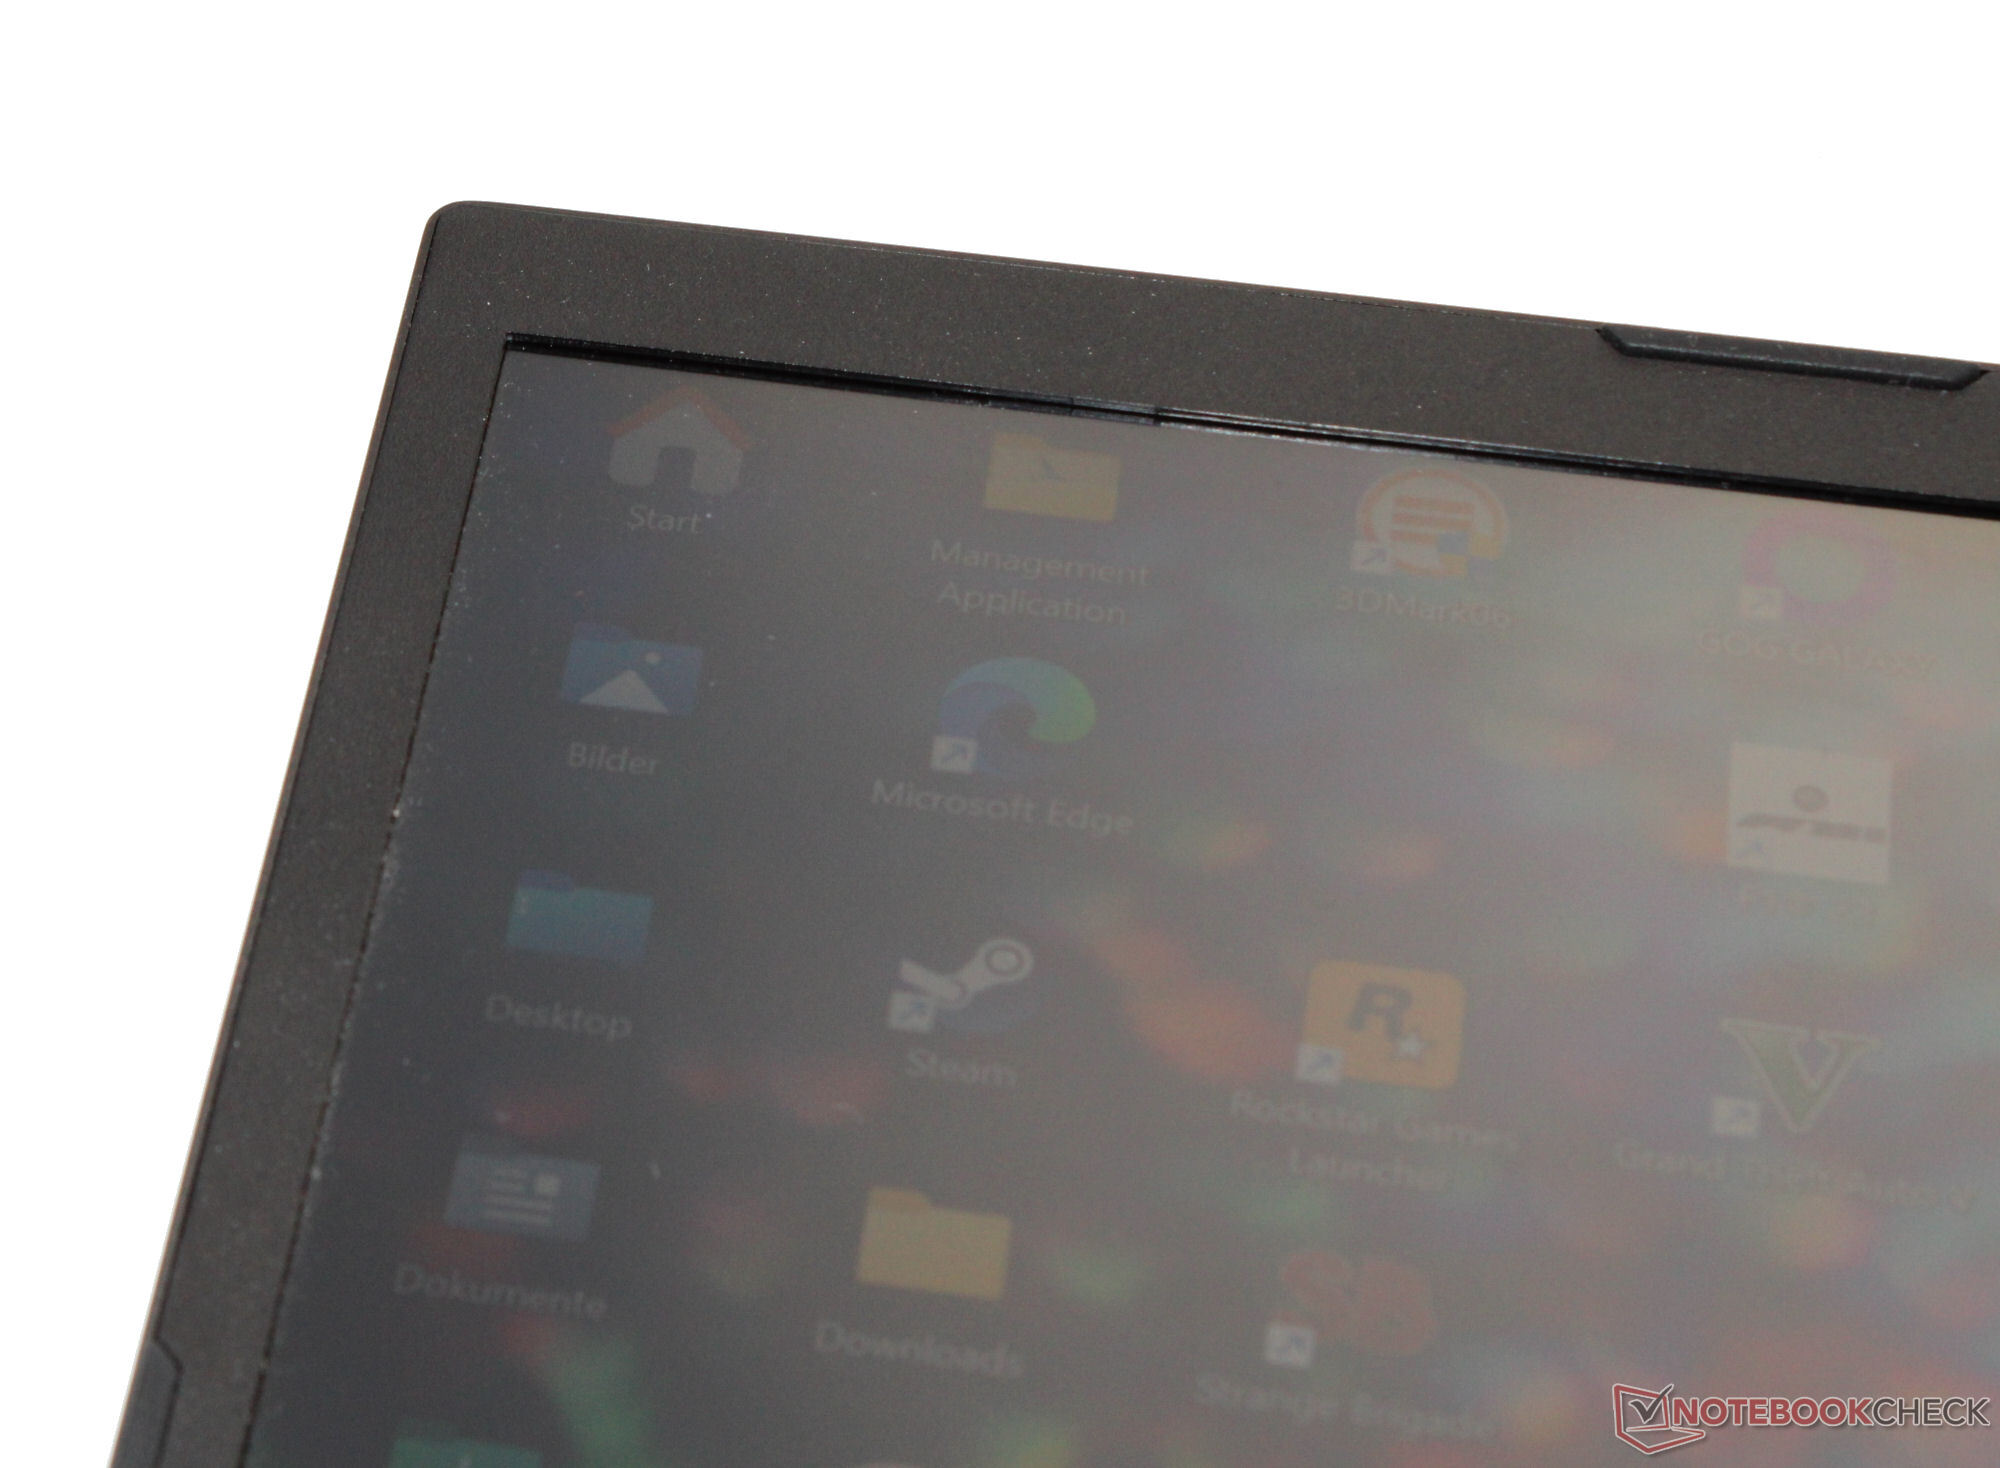
显示屏 - 覆盖 DCI-P3 的 QHD 面板
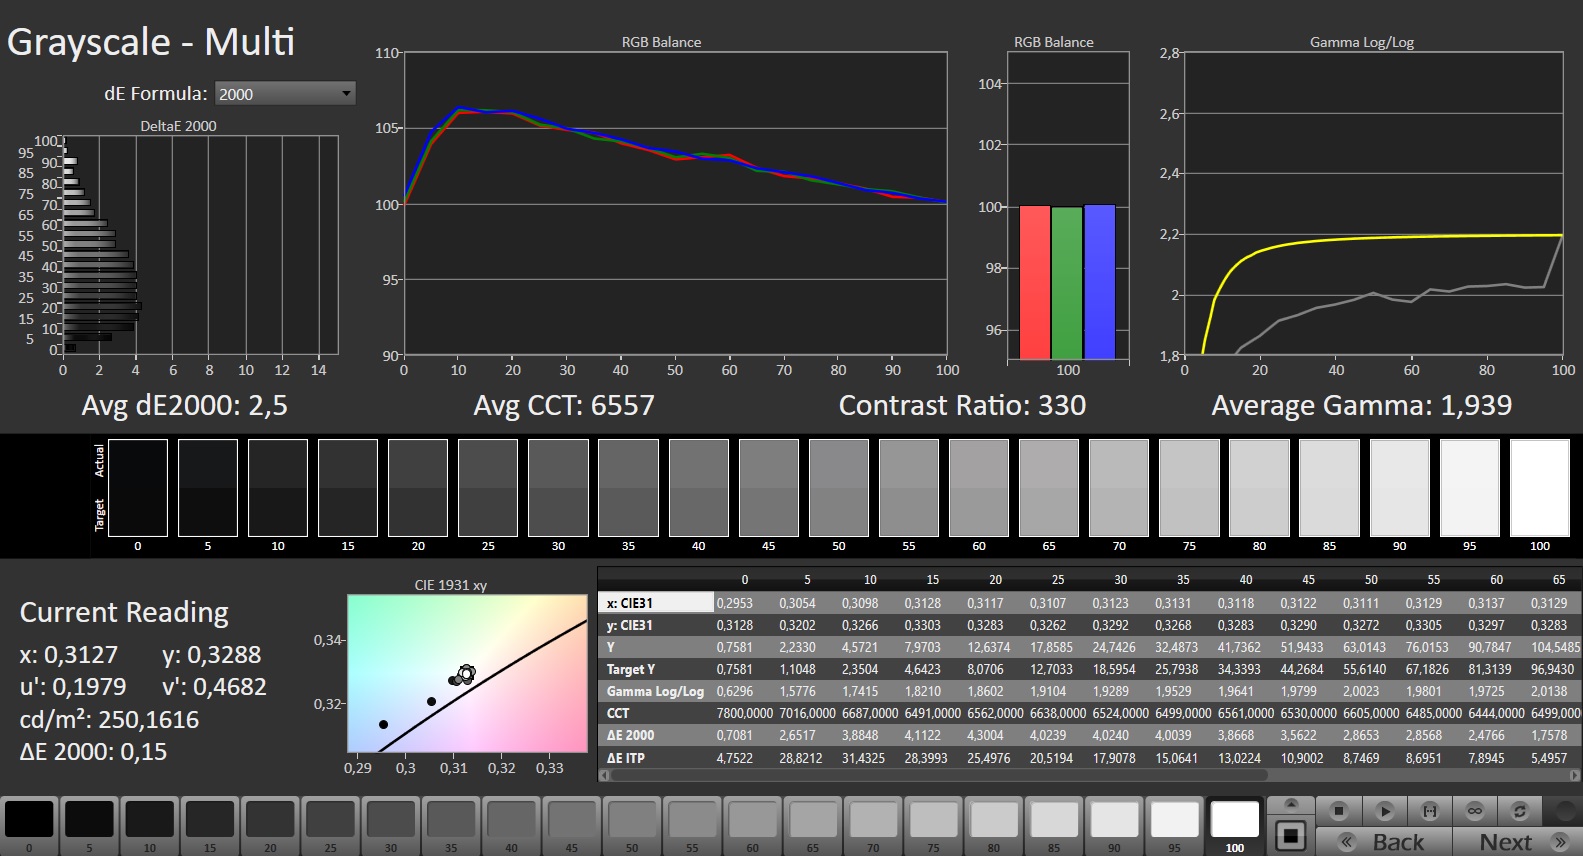
165-Hz 的快速反应屏幕因其哑光表面和无 PWM 闪烁而得分。比例为 16:9 的 15.6 英寸显示屏(2,560 x 1,440 像素,IPS)的亮度和对比度水平未能达到各自的目标(大于 300 cd/m² 和 1.000:1)。
| |||||||||||||||||||||||||
Brightness Distribution: 82 %
Center on Battery: 299 cd/m²
Contrast: 965:1 (Black: 0.31 cd/m²)
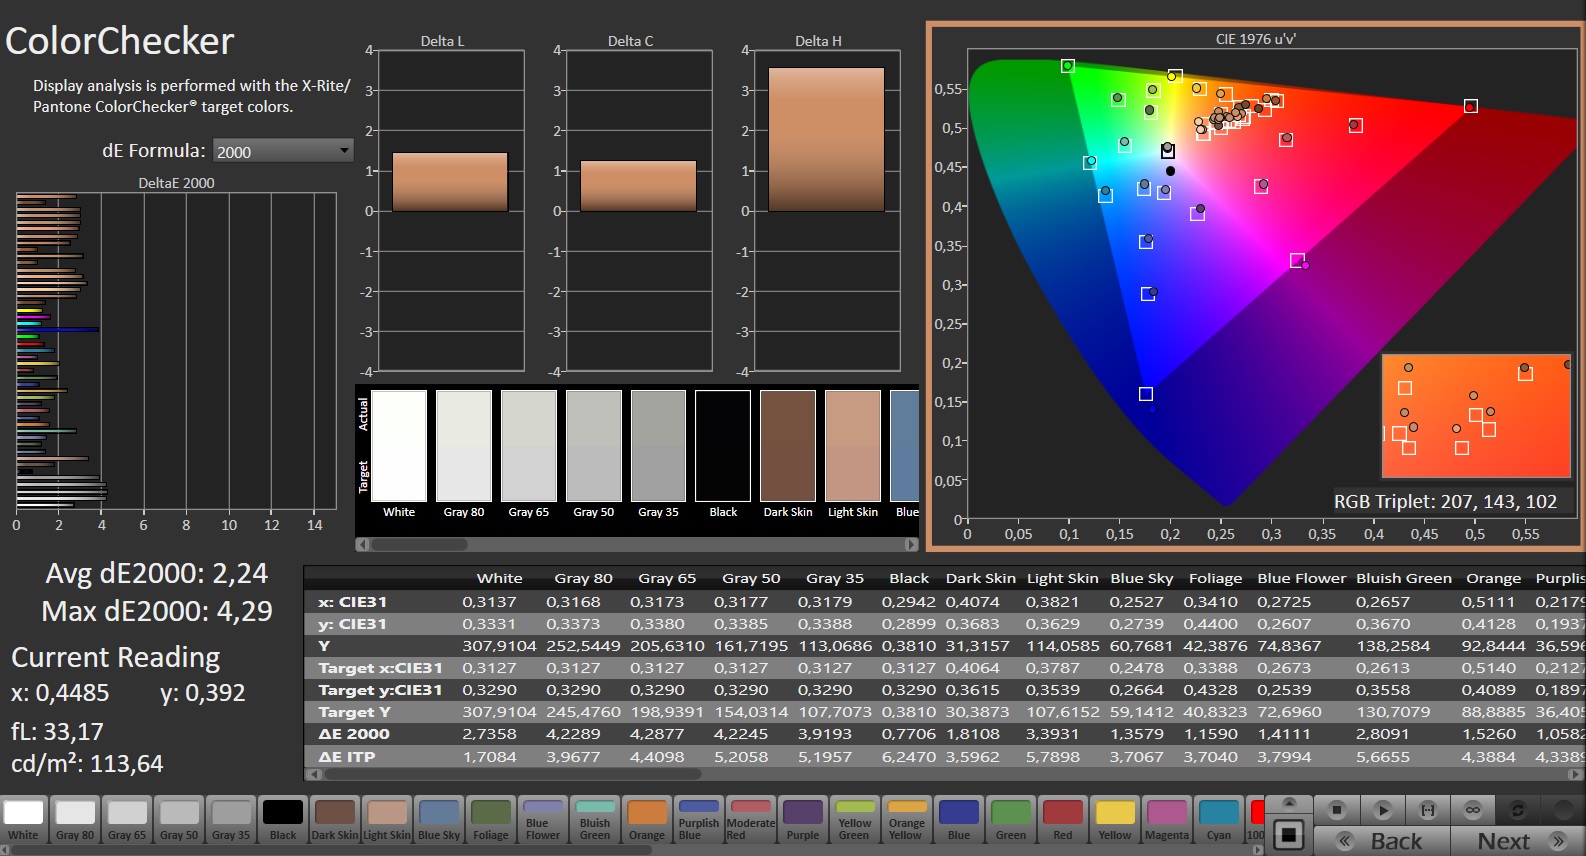
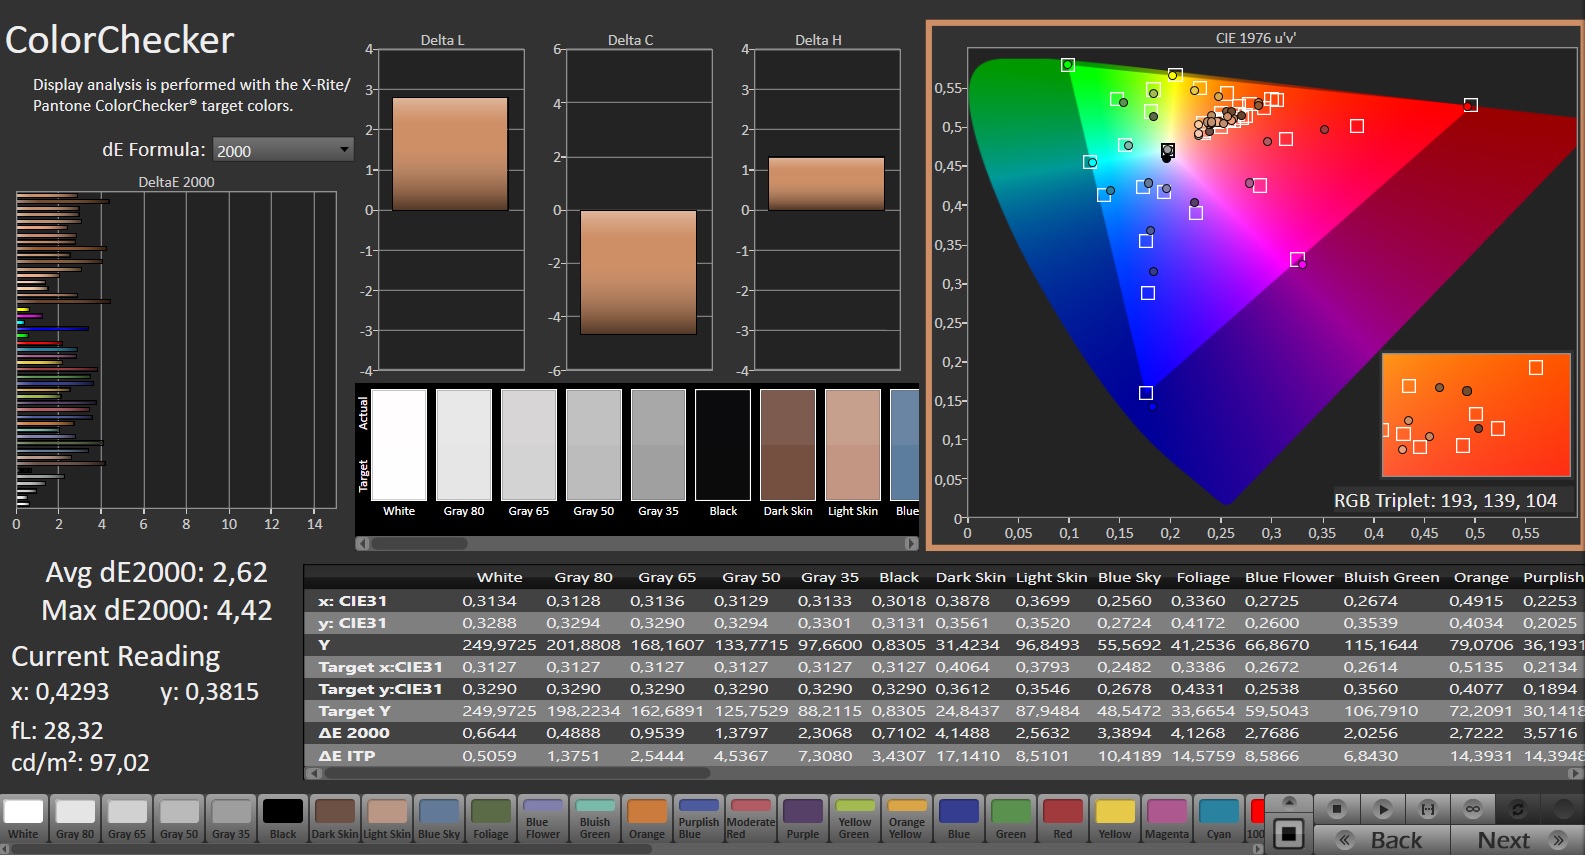
ΔE ColorChecker Calman: 2.24 | ∀{0.5-29.43 Ø4.71}
calibrated: 2.62
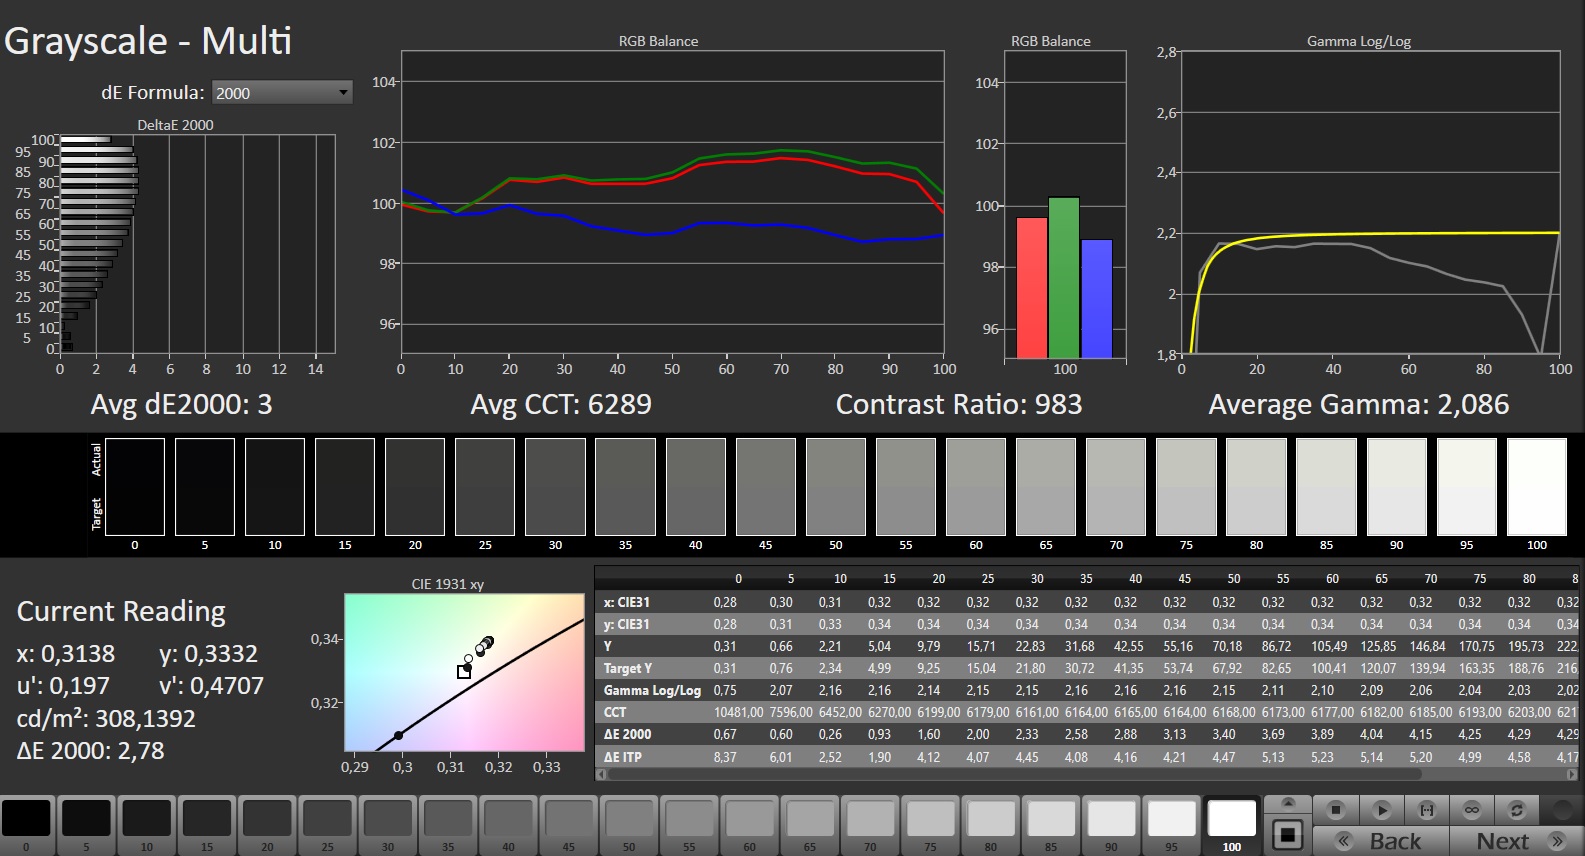
ΔE Greyscale Calman: 3 | ∀{0.09-98 Ø4.96}
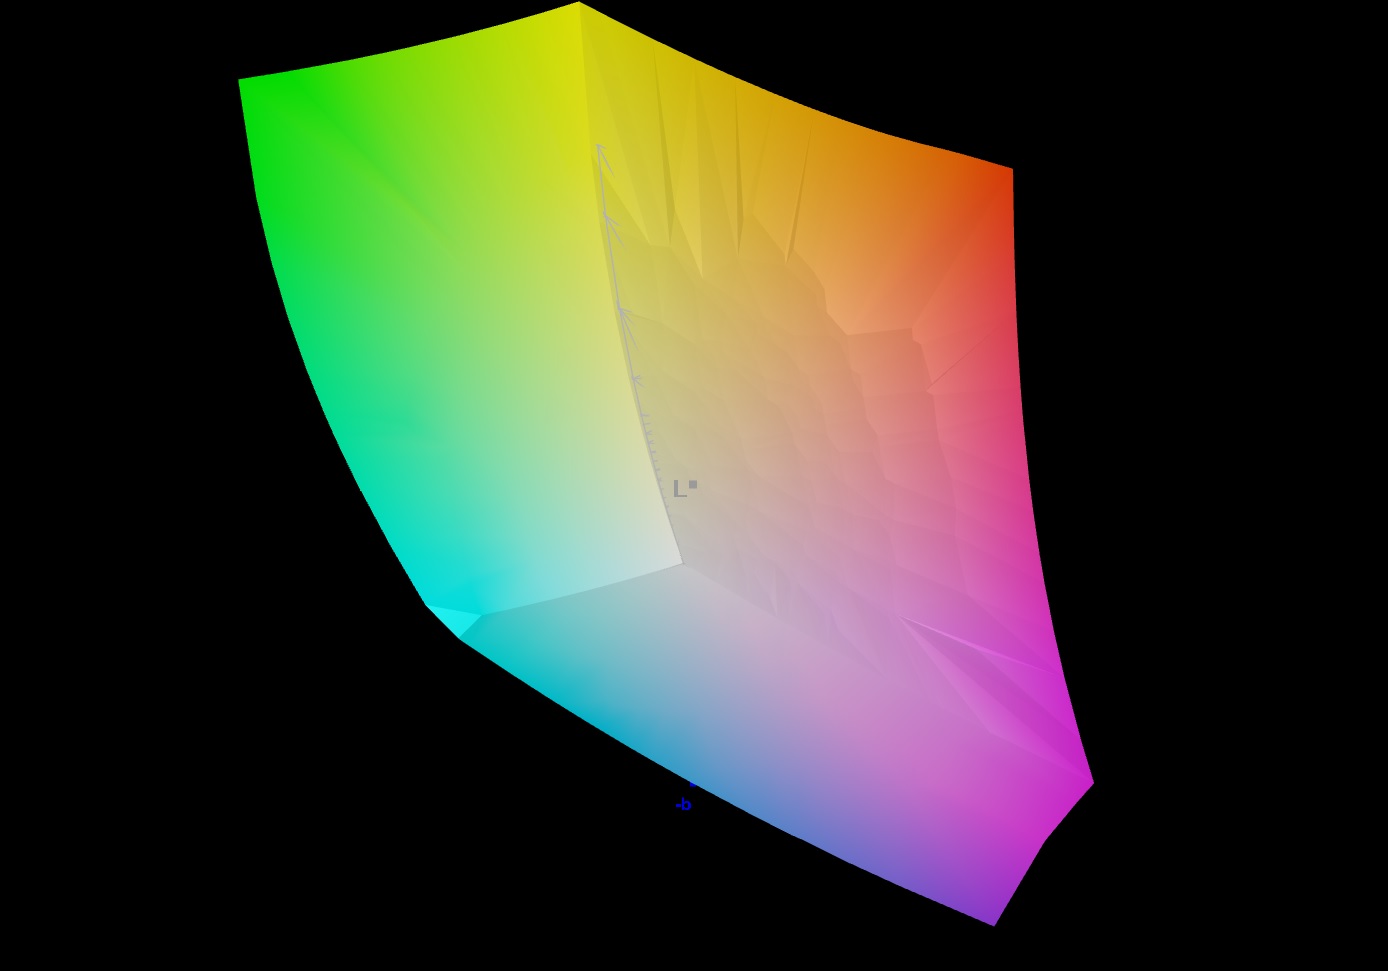
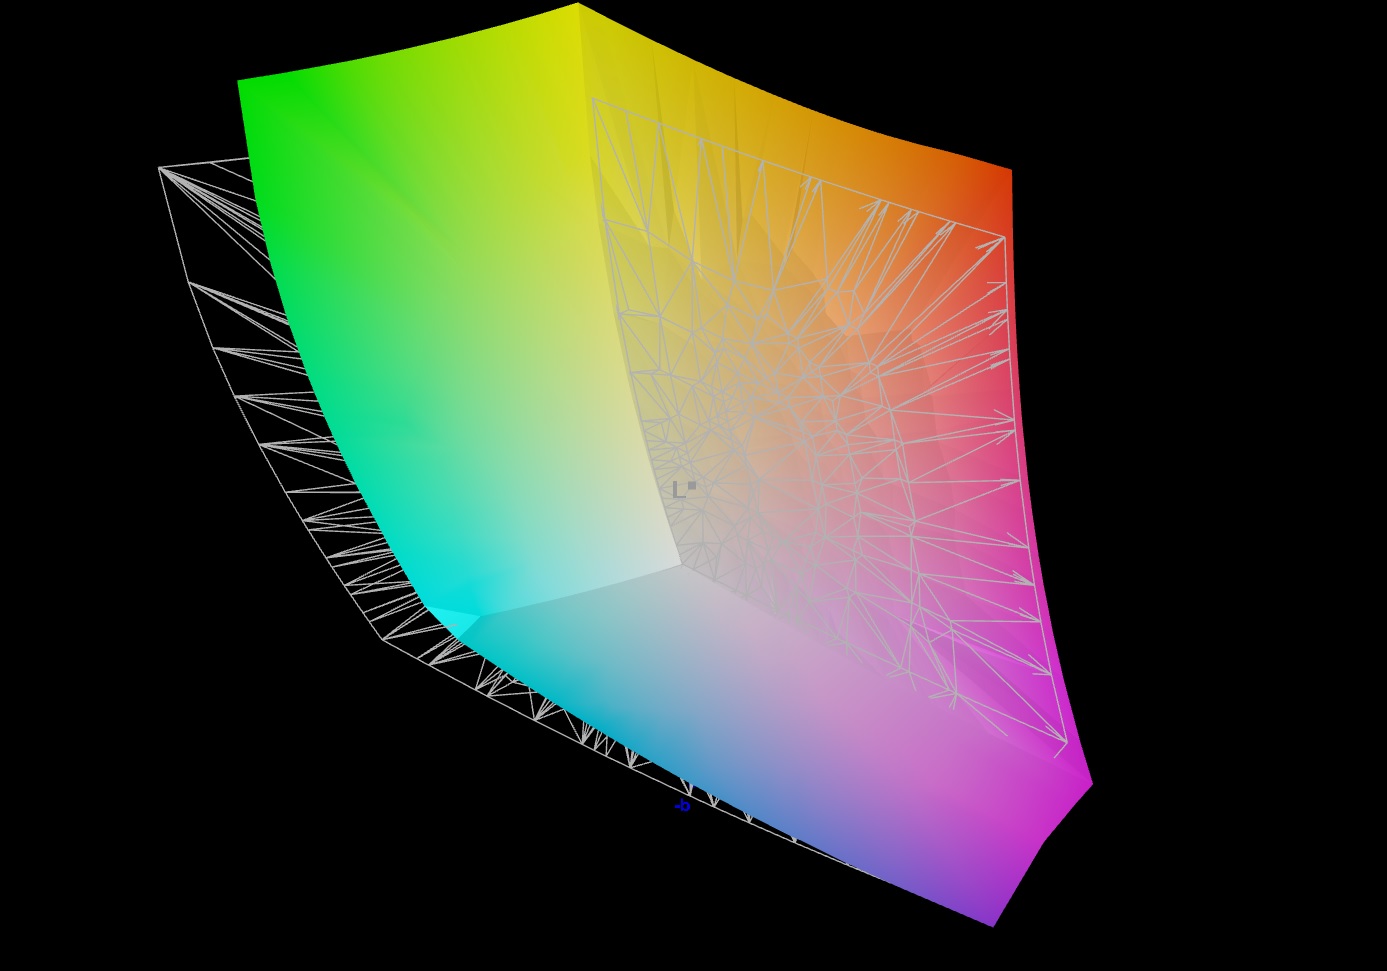
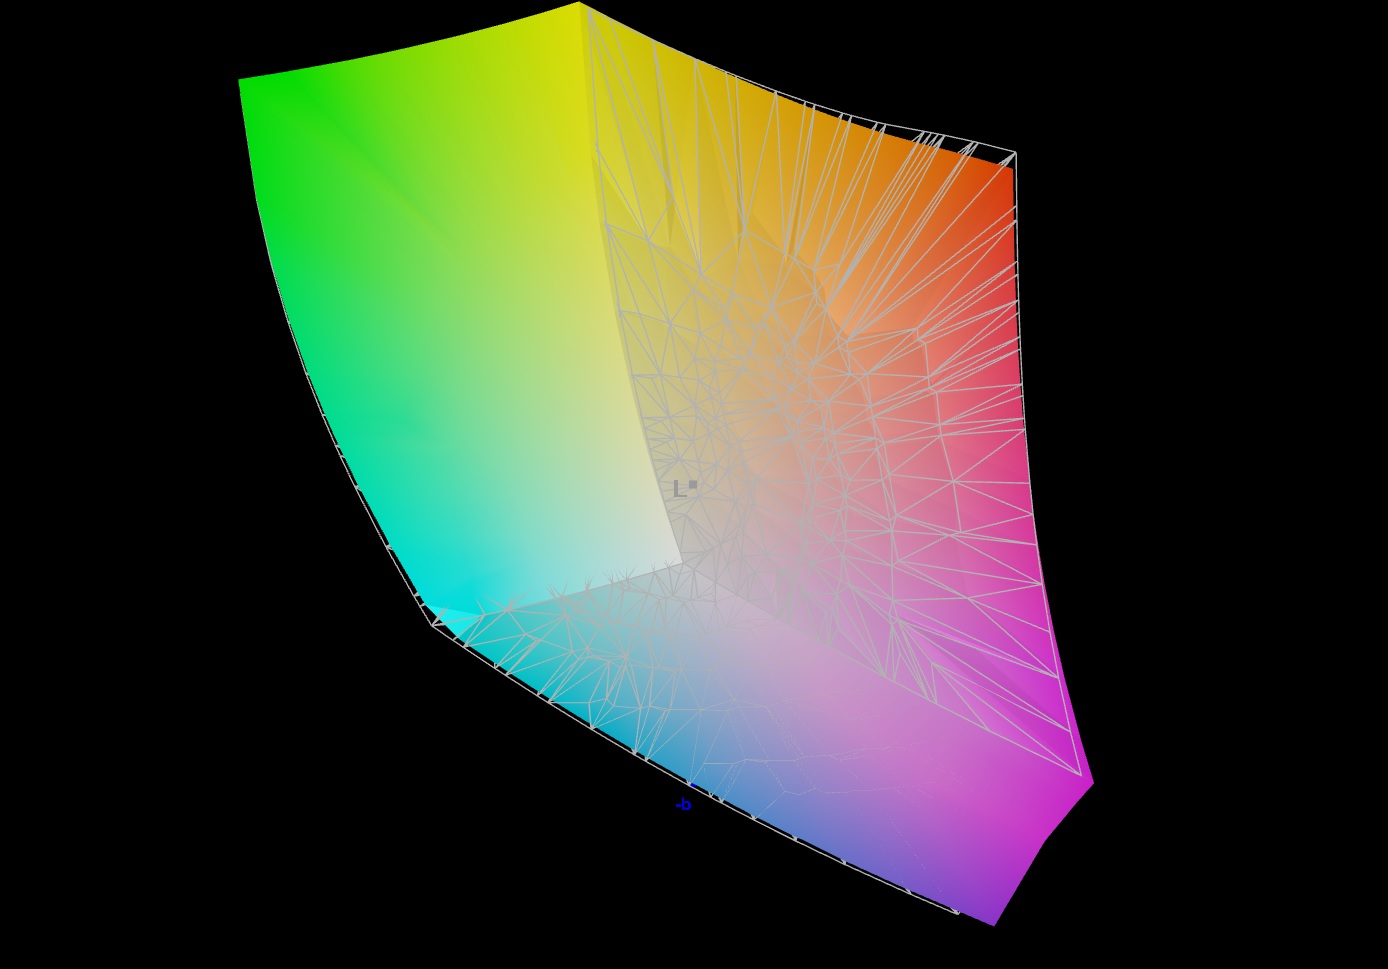
85.7% AdobeRGB 1998 (Argyll 3D)
99.9% sRGB (Argyll 3D)
98.2% Display P3 (Argyll 3D)
Gamma: 2.086
CCT: 6289 K
| Aorus 15 BSF Sharp LQ156T1JW05, IPS, 2560x1440, 15.6" | HP Omen Transcend 16 AUOA3A6, Mini-LED, 2560x1600, 16" | MSI Pulse 17 B13VGK AU Optronics B173HAN04.9, IPS, 1920x1080, 17.3" | Lenovo Legion Slim 7i 16 Gen 8 CSOT T3 MNG007DA2-3, IPS, 2560x1600, 16" | Acer Nitro 16 AN16-41 BOE CQ NE16QDM-NY1, IPS, 2560x1600, 16" | Asus TUF Gaming A16 FA617XS BOE NE160WUM-NX2, IPS, 1920x1200, 16" | |
|---|---|---|---|---|---|---|
| Display | 1% | -52% | -15% | -17% | -17% | |
| Display P3 Coverage (%) | 98.2 | 99.2 1% | 38.4 -61% | 70.4 -28% | 67.9 -31% | 69.3 -29% |
| sRGB Coverage (%) | 99.9 | 100 0% | 57.5 -42% | 99.4 -1% | 99.1 -1% | 97.3 -3% |
| AdobeRGB 1998 Coverage (%) | 85.7 | 87.6 2% | 39.7 -54% | 72.5 -15% | 69.9 -18% | 70.7 -18% |
| Response Times | -219% | -207% | -17% | 16% | -41% | |
| Response Time Grey 50% / Grey 80% * (ms) | 11.3 ? | 26.4 ? -134% | 31.2 ? -176% | 12 ? -6% | 11 ? 3% | 15.6 ? -38% |
| Response Time Black / White * (ms) | 7 ? | 28.2 ? -303% | 23.6 ? -237% | 8.9 ? -27% | 5 ? 29% | 10 ? -43% |
| PWM Frequency (Hz) | 3506 ? | |||||
| Screen | 234% | -42% | 22% | 25% | 23% | |
| Brightness middle (cd/m²) | 299 | 791.1 165% | 254 -15% | 474.6 59% | 520 74% | 301 1% |
| Brightness (cd/m²) | 282 | 800 184% | 250 -11% | 445 58% | 494 75% | 294 4% |
| Brightness Distribution (%) | 82 | 95 16% | 91 11% | 86 5% | 91 11% | 94 15% |
| Black Level * (cd/m²) | 0.31 | 0.04 87% | 0.14 55% | 0.39 -26% | 0.39 -26% | 0.21 32% |
| Contrast (:1) | 965 | 19778 1950% | 1814 88% | 1217 26% | 1333 38% | 1433 48% |
| Colorchecker dE 2000 * | 2.24 | 4.37 -95% | 4.52 -102% | 2.12 5% | 1.94 13% | 1.79 20% |
| Colorchecker dE 2000 max. * | 4.29 | 10.39 -142% | 21.22 -395% | 4.73 -10% | 5.62 -31% | 3.48 19% |
| Colorchecker dE 2000 calibrated * | 2.62 | 1.04 60% | 4.52 -73% | 0.57 78% | 0.74 72% | 1.2 54% |
| Greyscale dE 2000 * | 3 | 6.5 -117% | 1 67% | 2.8 7% | 2.94 2% | 2.5 17% |
| Gamma | 2.086 105% | 2.28 96% | 2.44 90% | 2.22 99% | 2.37 93% | 2.265 97% |
| CCT | 6289 103% | 6000 108% | 6502 100% | 6542 99% | 6443 101% | 6157 106% |
| Total Average (Program / Settings) | 5% /
120% | -100% /
-68% | -3% /
9% | 8% /
15% | -12% /
6% |
* ... smaller is better
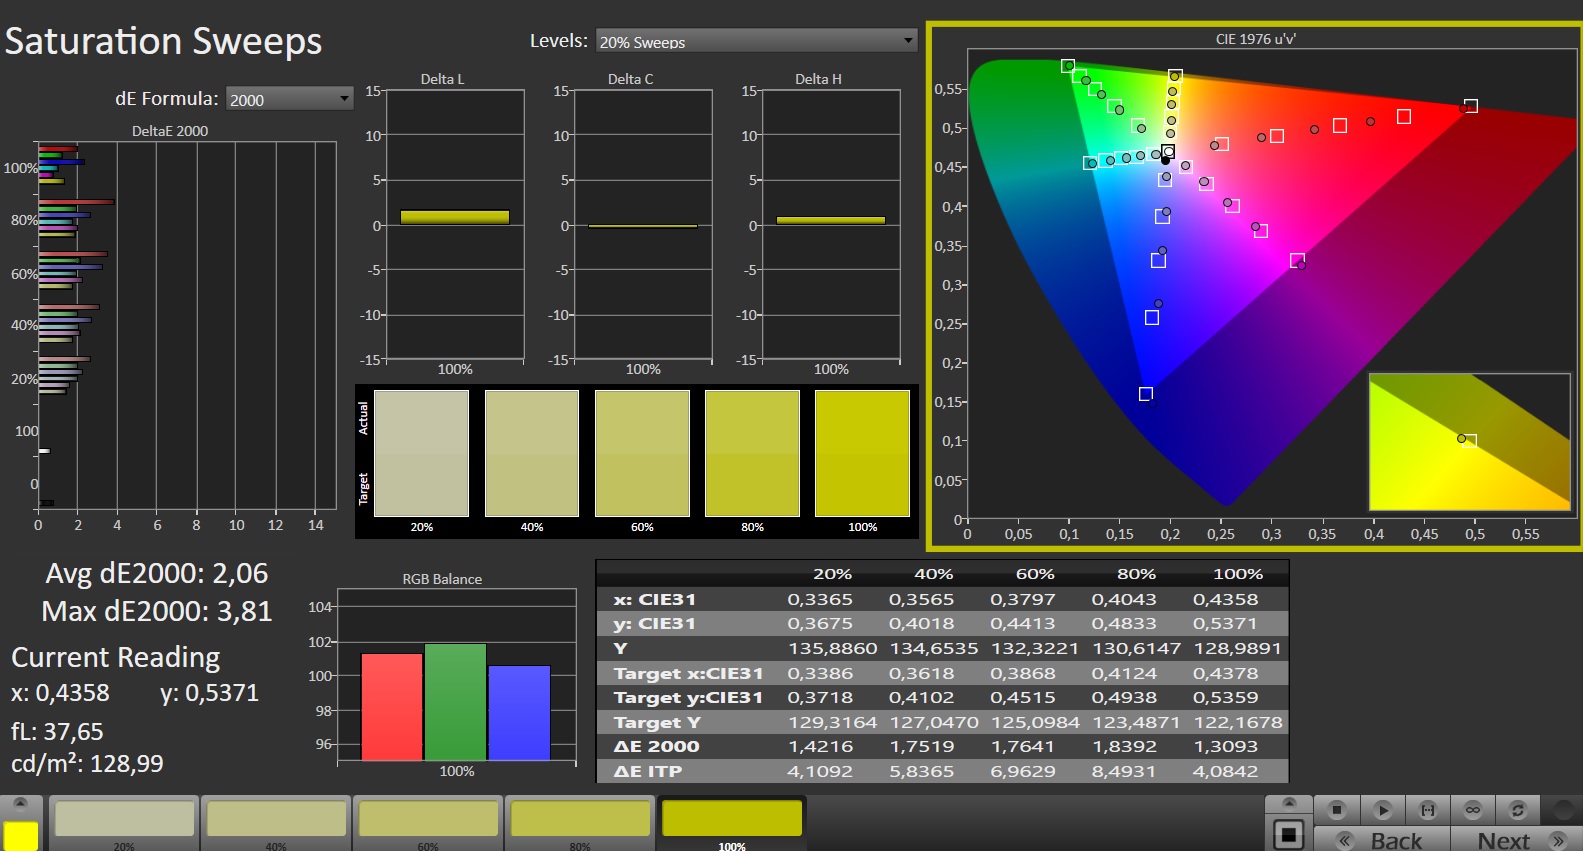
显示屏在交付状态下已显示出良好的色彩描绘:偏差为 2.24,达到了目标(DeltaE < 3)。校准后没有出现任何明显的差异。色彩准确:面板可以完全显示 sRGB 和 DCI-P3 色彩空间,86% 的 Adobe RGB 空间也可以显示。

Display Response Times
| ↔ Response Time Black to White | ||
|---|---|---|
| 7 ms ... rise ↗ and fall ↘ combined | ↗ 3.4 ms rise | 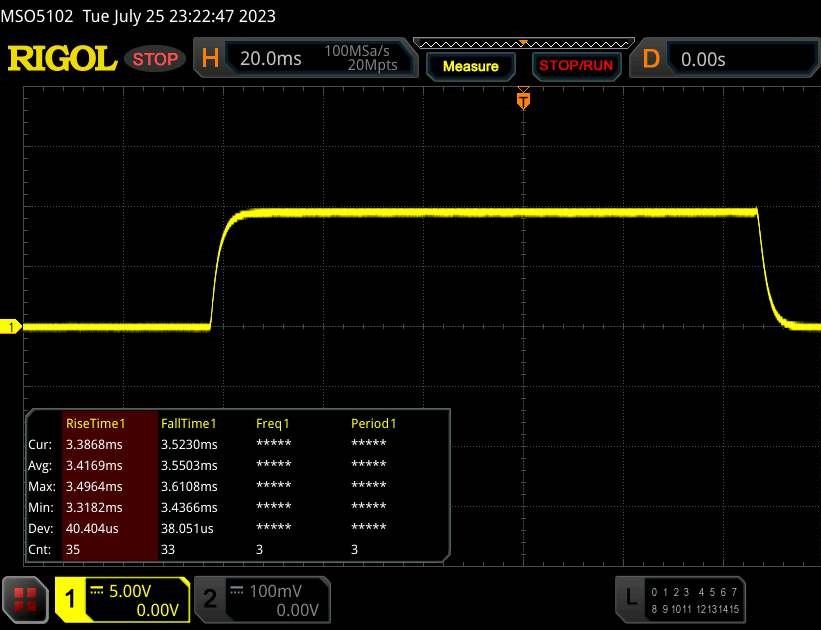 |
| ↘ 3.6 ms fall | ||
| The screen shows very fast response rates in our tests and should be very well suited for fast-paced gaming. In comparison, all tested devices range from 0.1 (minimum) to 240 (maximum) ms. » 21 % of all devices are better. This means that the measured response time is better than the average of all tested devices (19.8 ms). | ||
| ↔ Response Time 50% Grey to 80% Grey | ||
| 11.3 ms ... rise ↗ and fall ↘ combined | ↗ 5.2 ms rise | 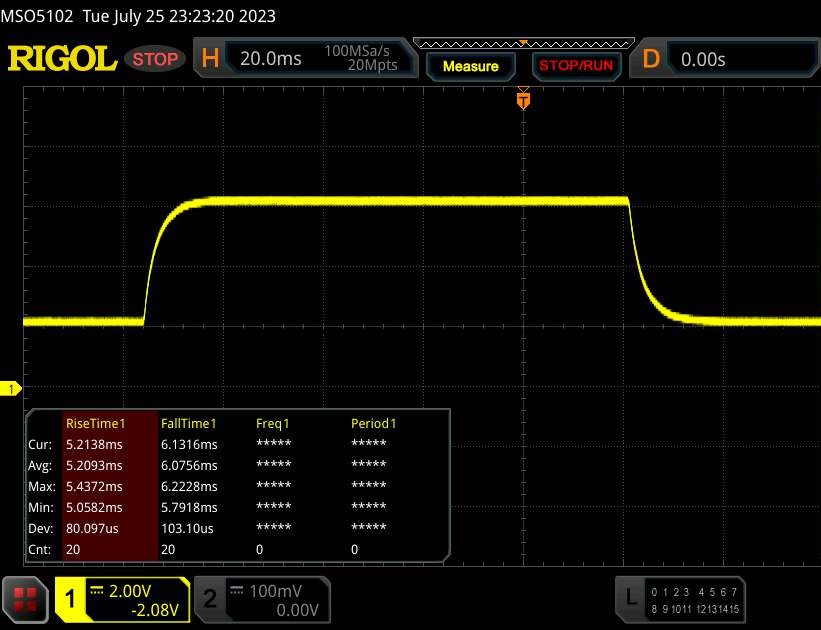 |
| ↘ 6.1 ms fall | ||
| The screen shows good response rates in our tests, but may be too slow for competitive gamers. In comparison, all tested devices range from 0.165 (minimum) to 636 (maximum) ms. » 25 % of all devices are better. This means that the measured response time is better than the average of all tested devices (31 ms). | ||
Screen Flickering / PWM (Pulse-Width Modulation)
| Screen flickering / PWM not detected |  | ||
In comparison: 52 % of all tested devices do not use PWM to dim the display. If PWM was detected, an average of 7757 (minimum: 5 - maximum: 343500) Hz was measured. | |||
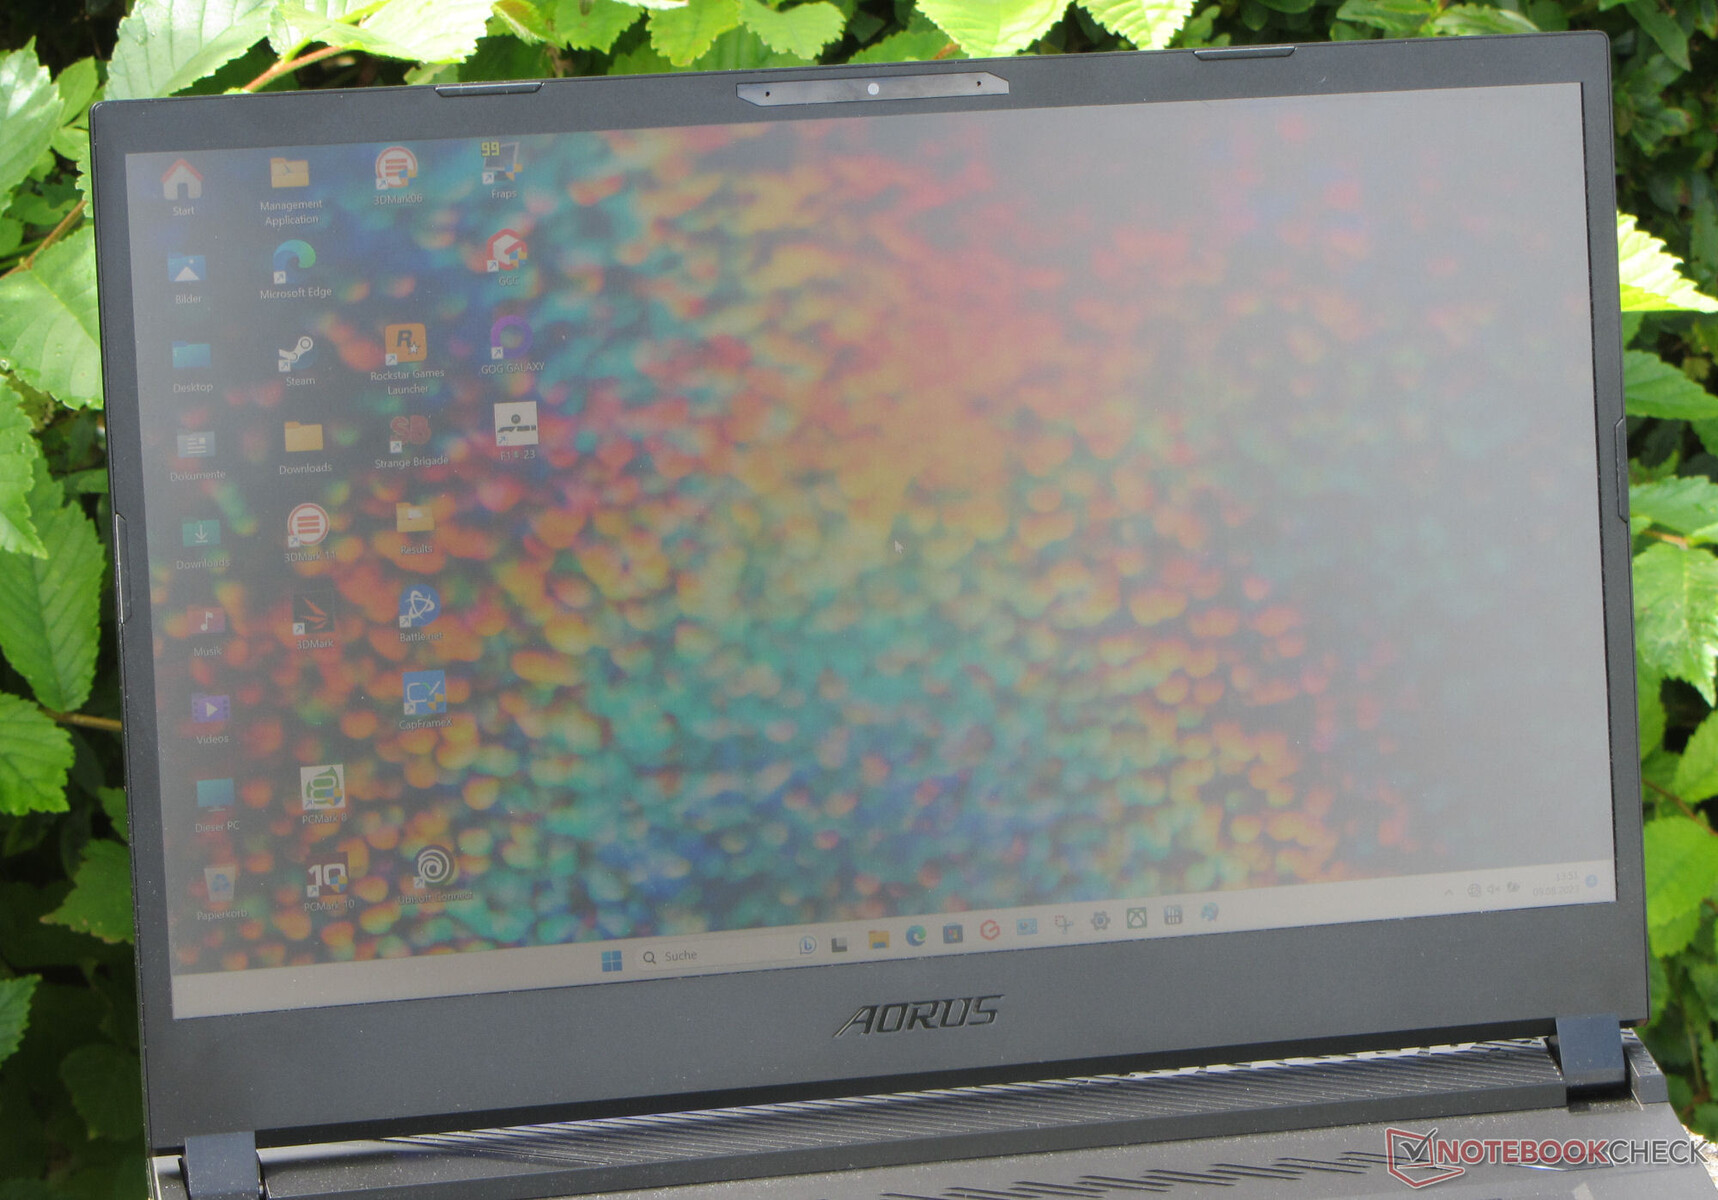
视角稳定的 IPS 面板可以在任何位置阅读。在室外,如果阳光不太强烈,也可以从屏幕上阅读。

性能 - Raptor Lake 和 Ada Lovelace 为技嘉电脑提供动力
Aorus 15 BSF 算得上是性能较强的中端游戏笔记本电脑之一,也可用于不同领域。Raptor Lake 和 Ada Lovelace 提供了必要的性能。这款设备的售价约为 1,700 美元。
测试条件
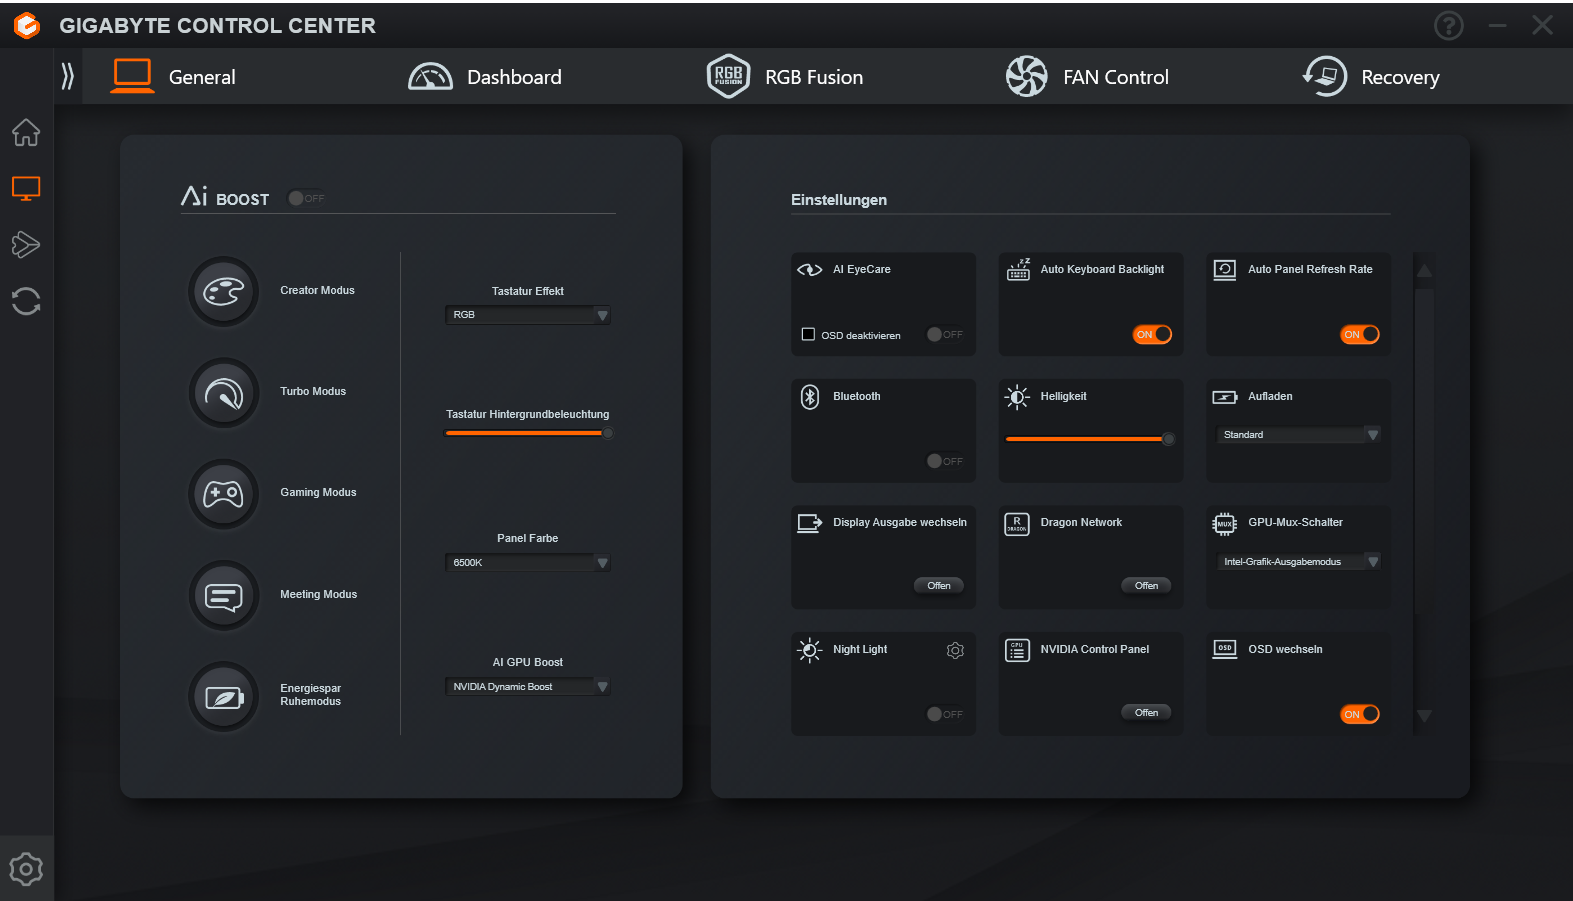
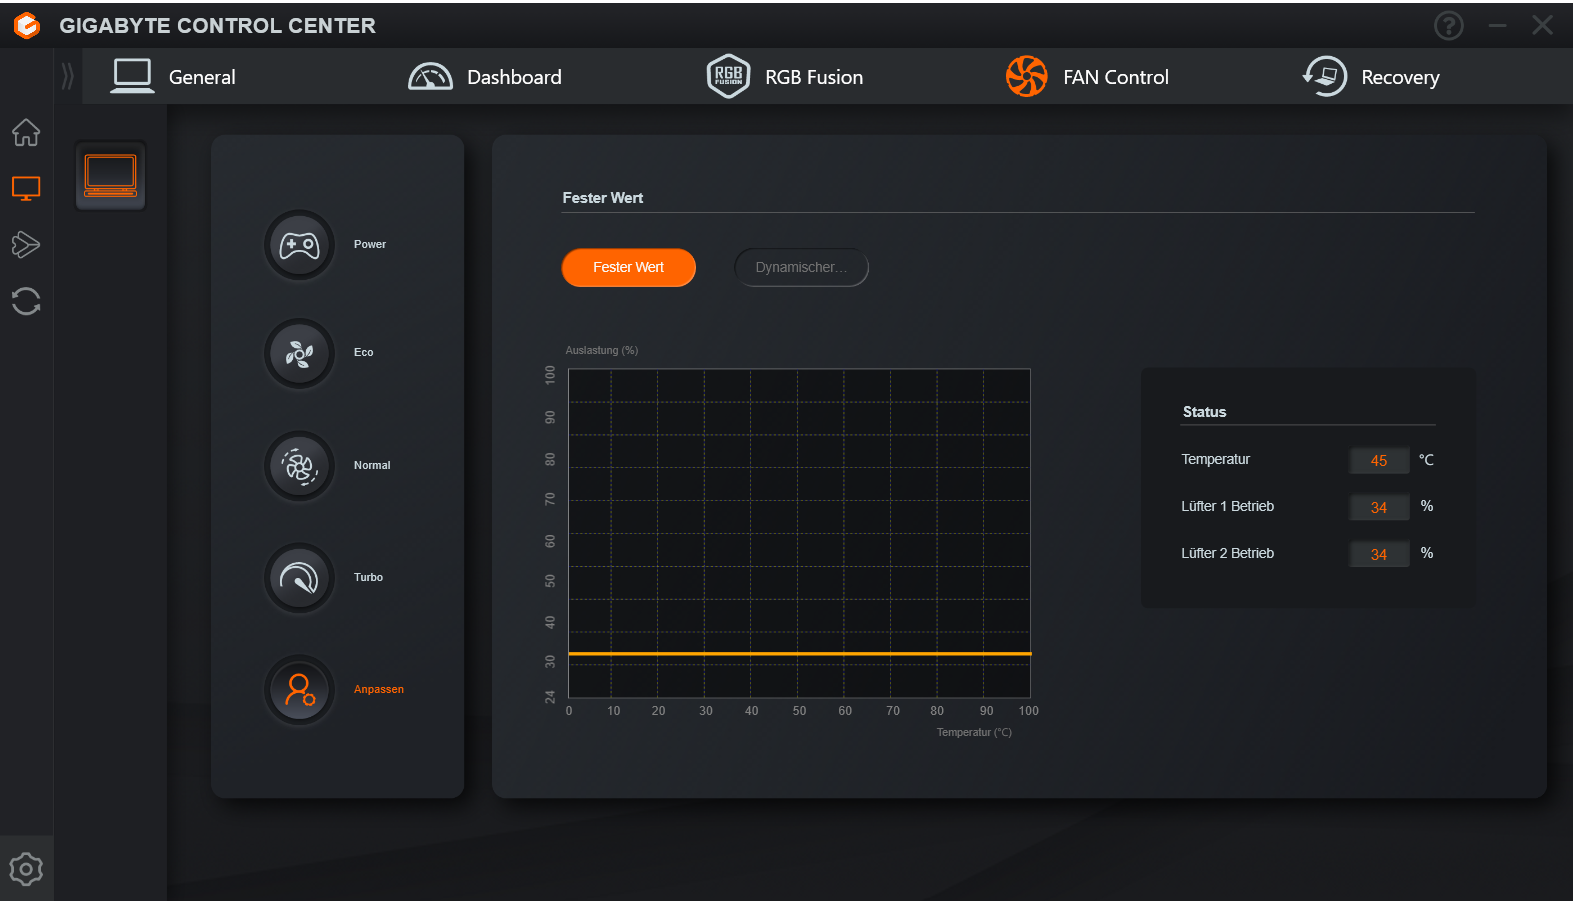
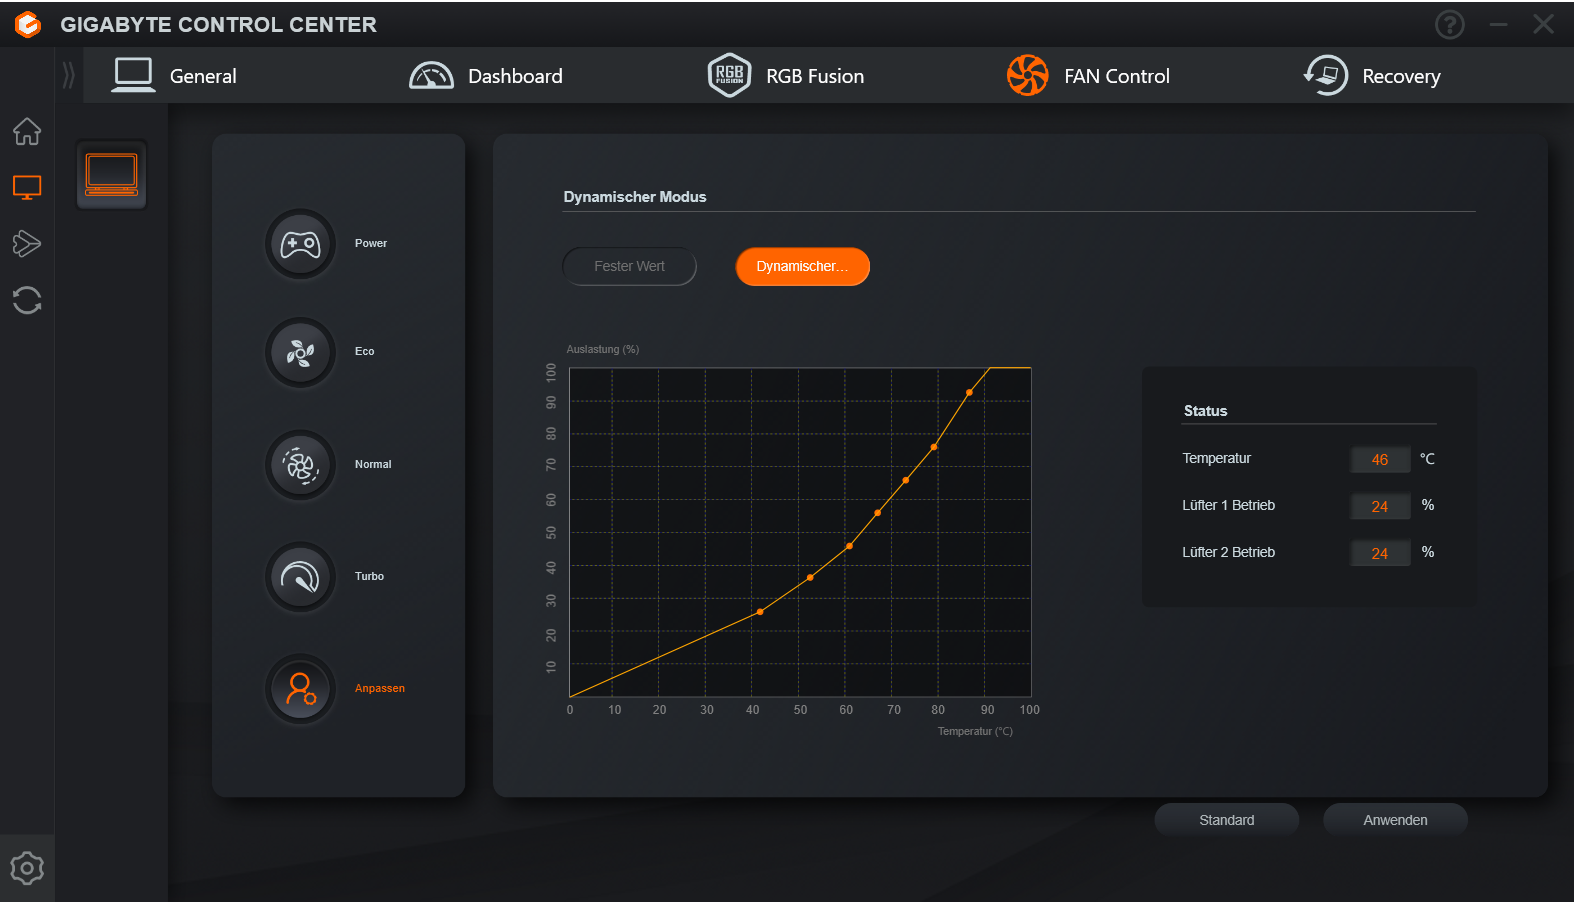
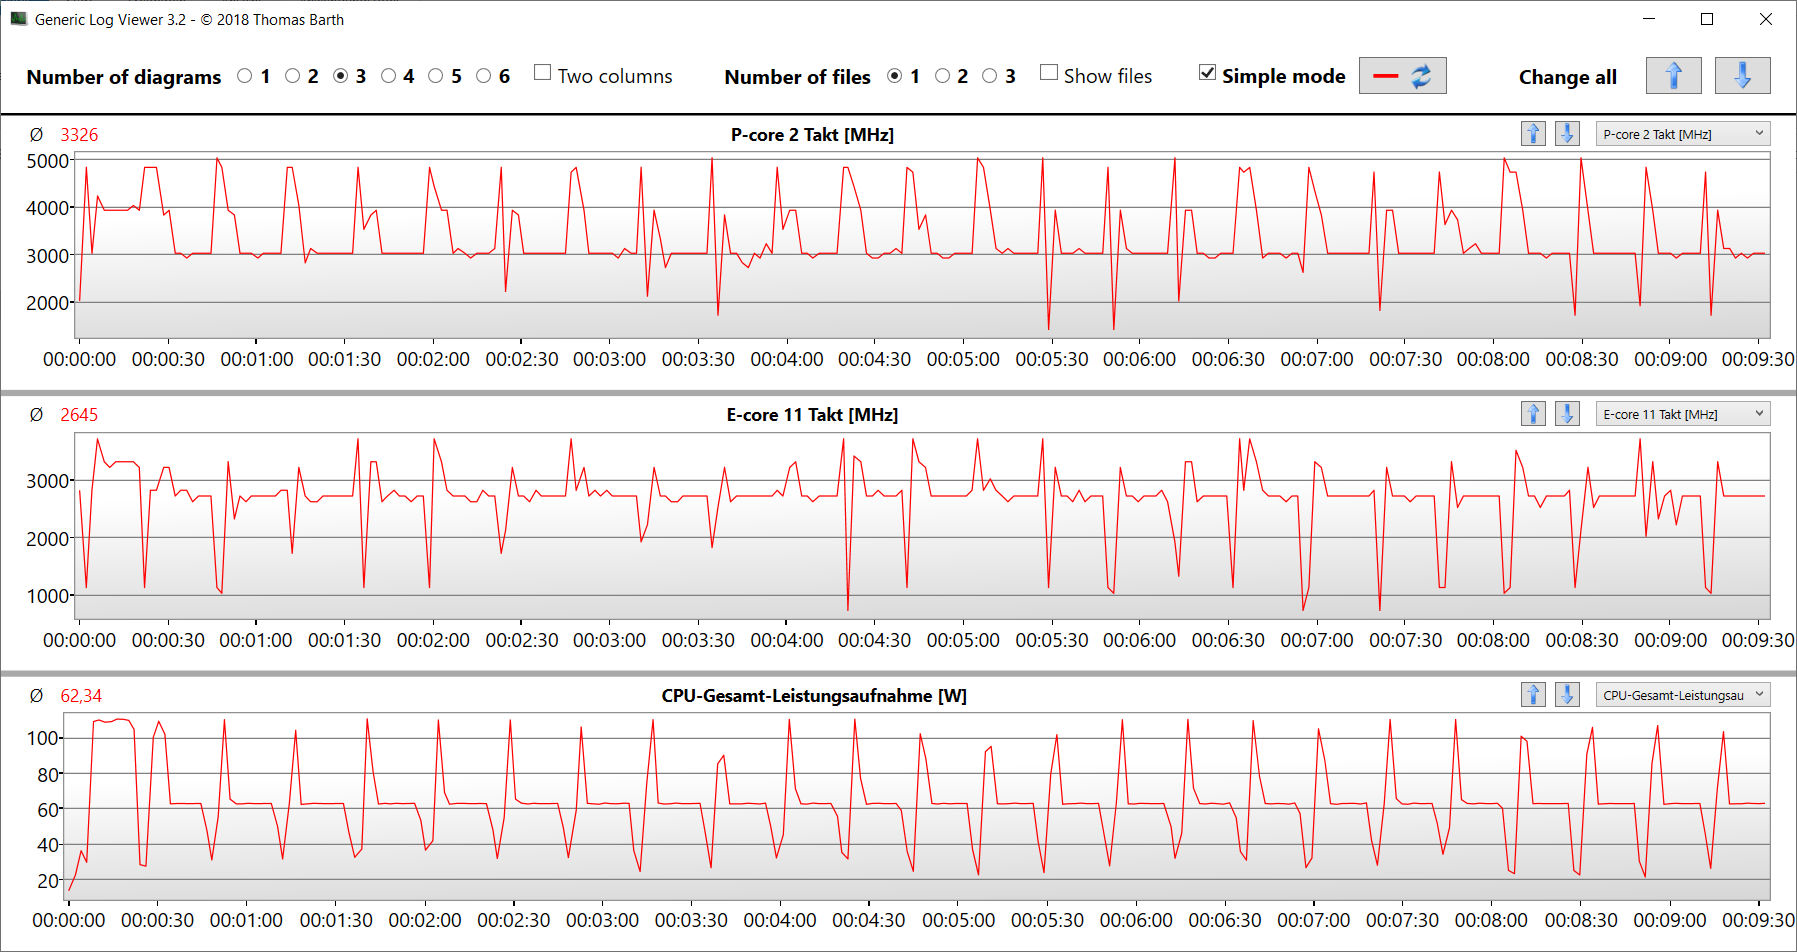
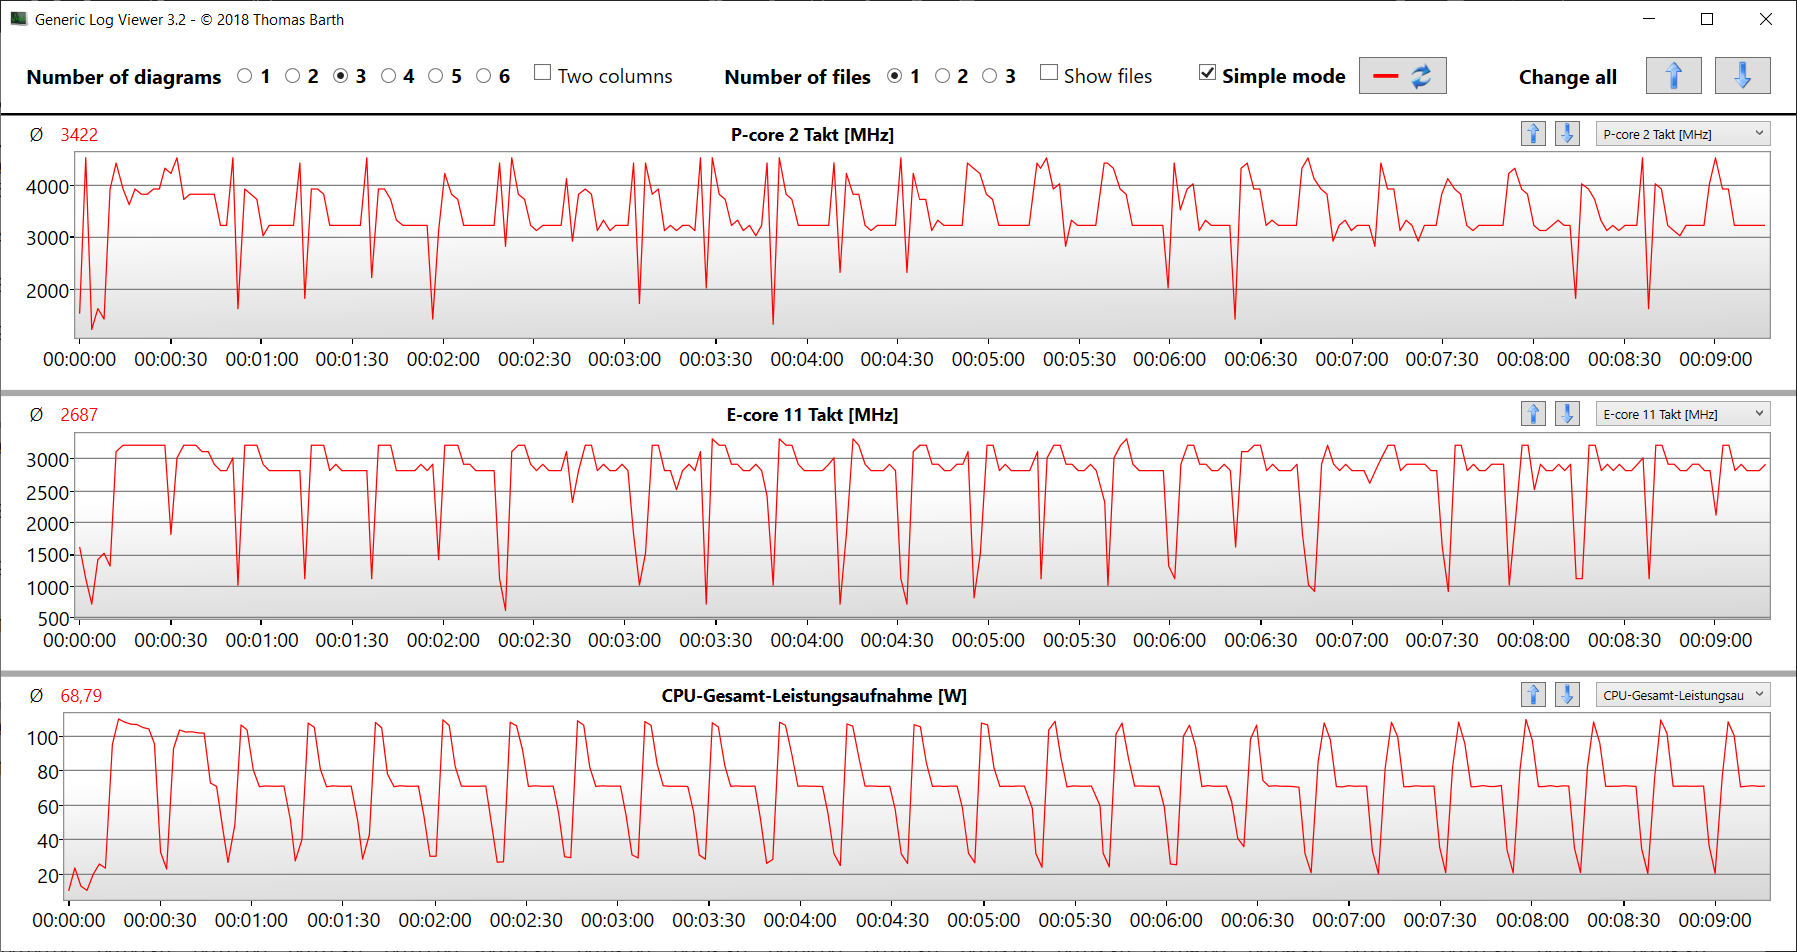
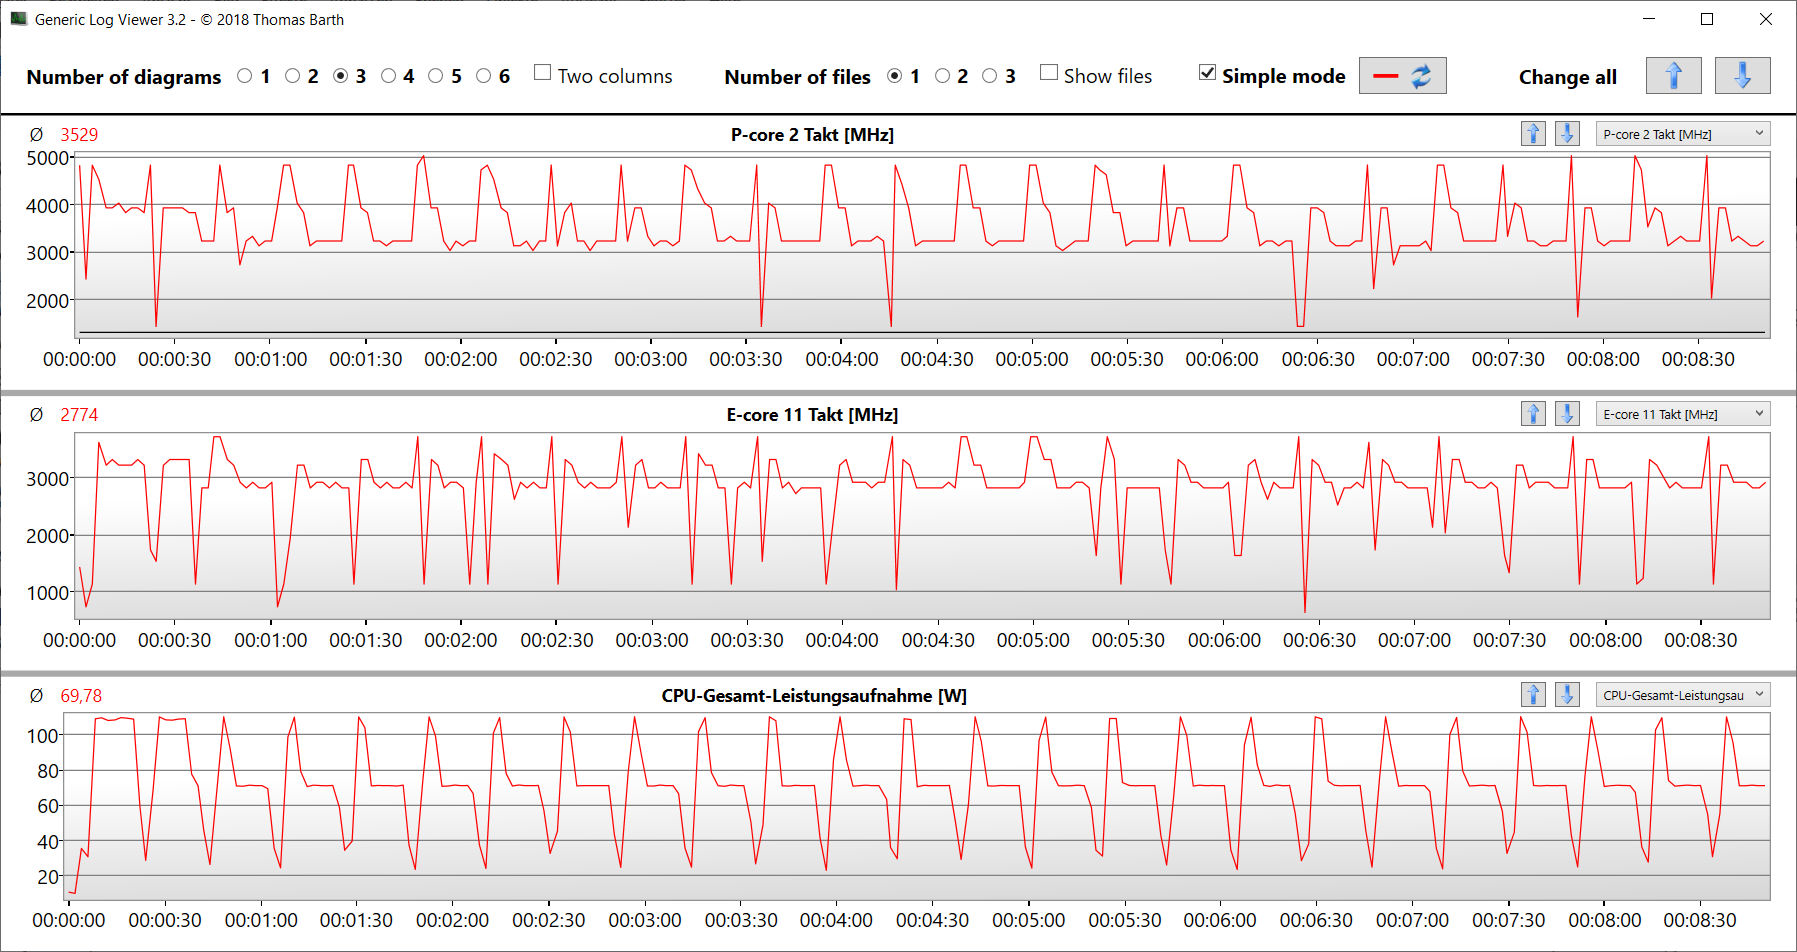
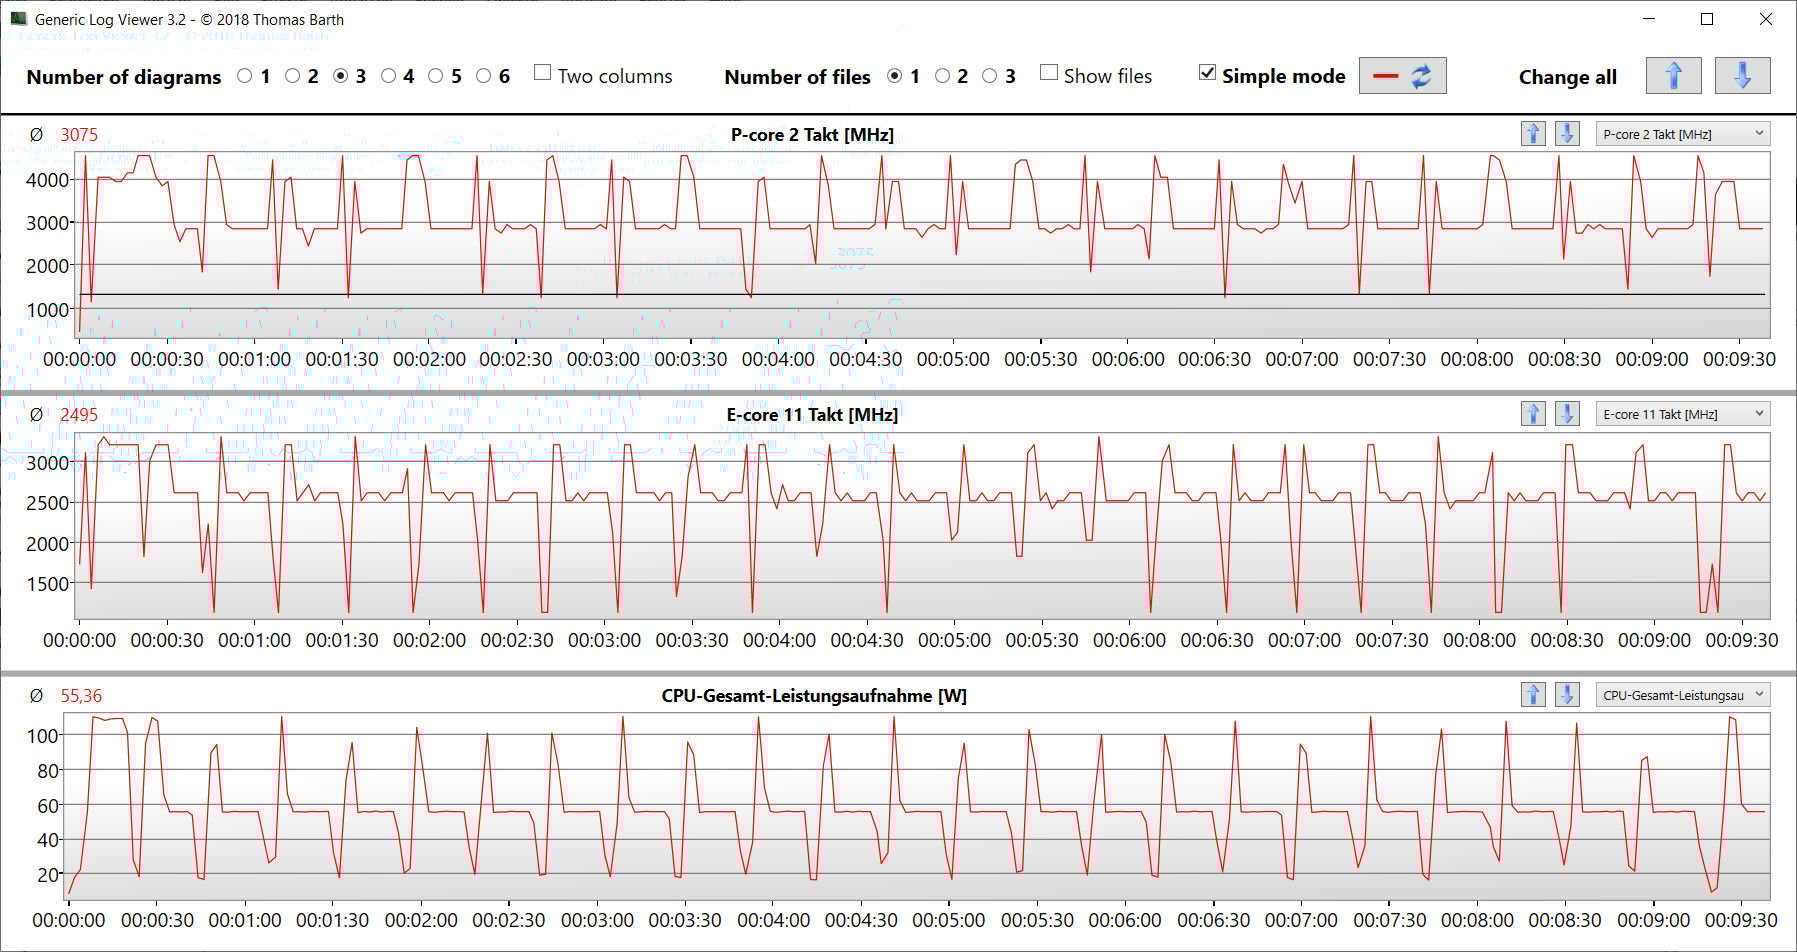
计算机的控制中心(技嘉控制中心)提供了更高级别的 AI Boost 功能,除了典型的性能模式外,我们还使用了该功能(见表)。随后,控制中心选择了相应的配置文件--"游戏模式 "和 "创作者模式 "用于基准测试,"节能睡眠模式 "用于电池测试。
| AI Boost | Creator | Turbo | Gaming | Meeting | 节能睡眠模式 | |
|---|---|---|---|---|---|---|
| 功率限制 1 (HWInfo) | 55-70 瓦 | 70 瓦 | 70 瓦 | 55 瓦 | 27 瓦 | 27 瓦 |
| 功率限制 2 (HWInfo) | 115 瓦 | 115 瓦 | 115 瓦 | 115 瓦 | 45 瓦 | 45 瓦 |
| 噪音 (Witcher 3) | 53 dB(A) | 52 dB(A) | 55 dB(A) | 53 dB(A) | 46 dB(A) | 46 dB(A) |
| 性能 (Witcher 3) | 118 fps | 118 fps | 118 fps | 118 fps | 118 fps | 118 fps |
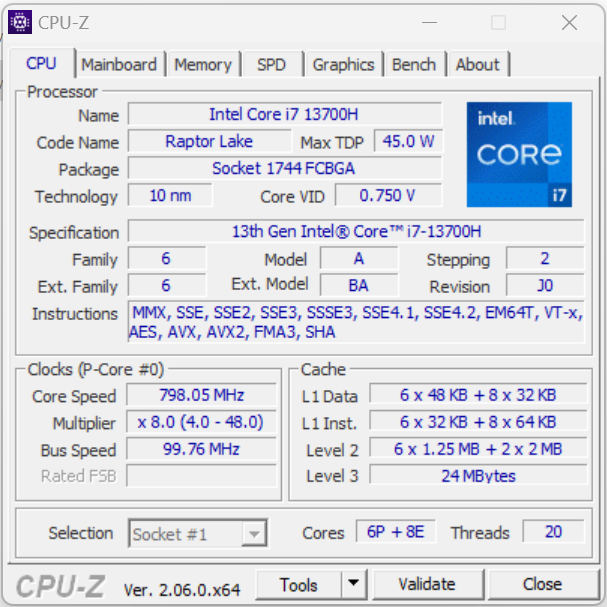
处理器
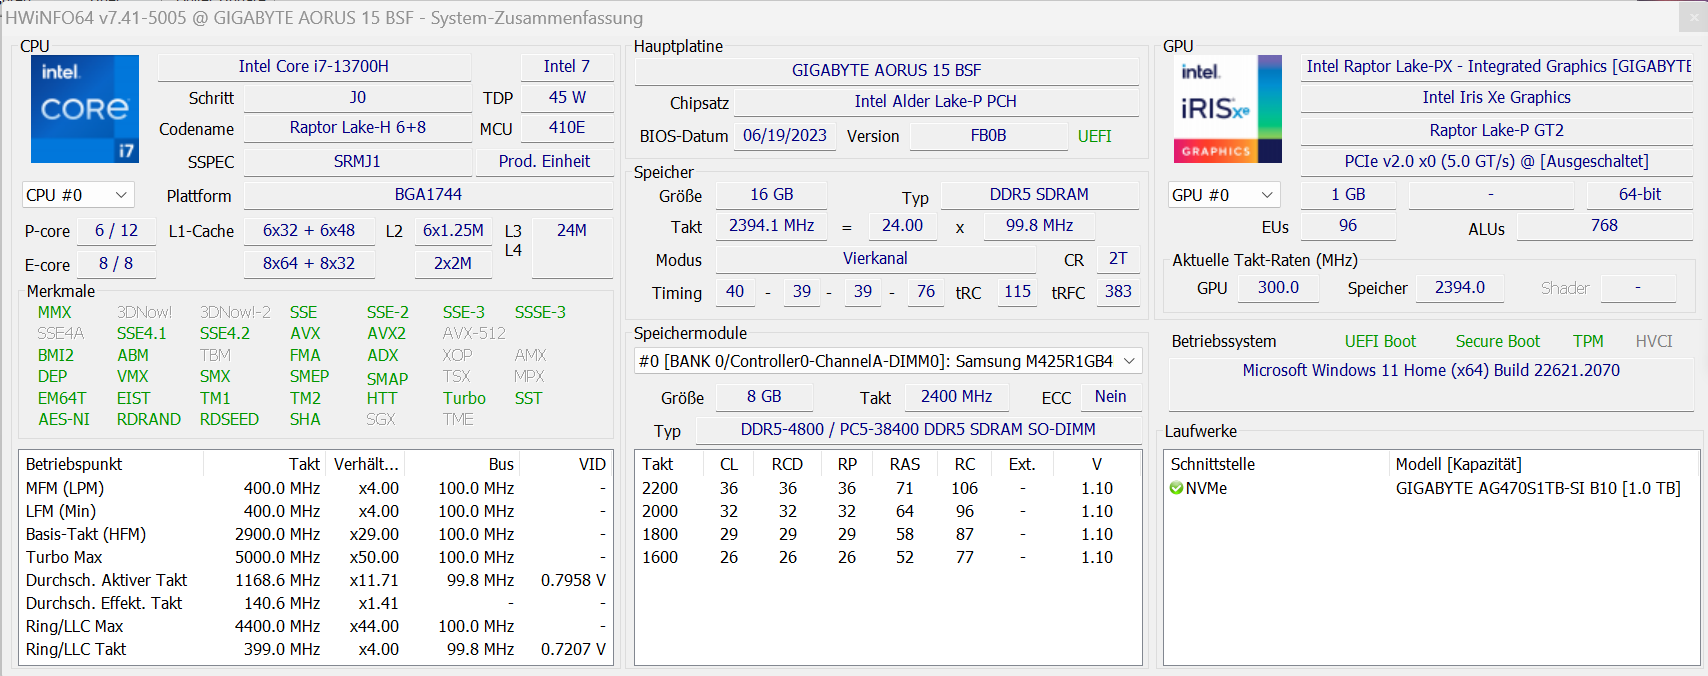
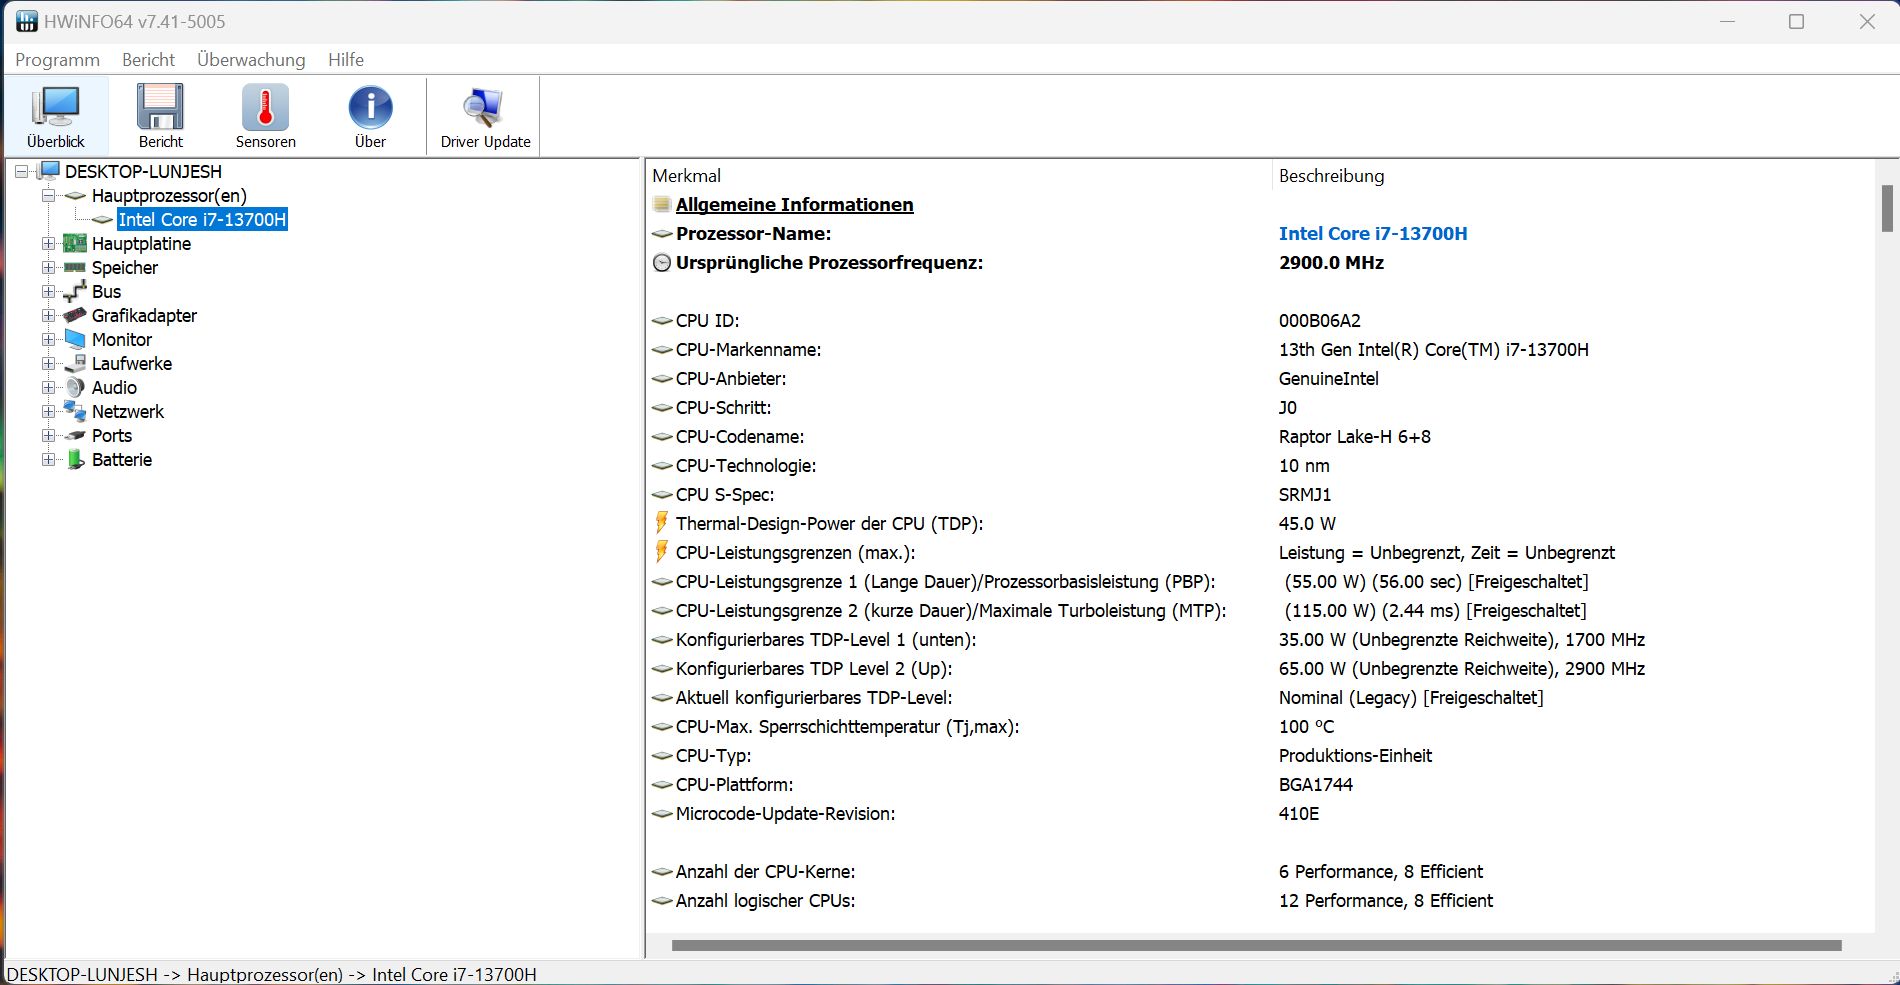
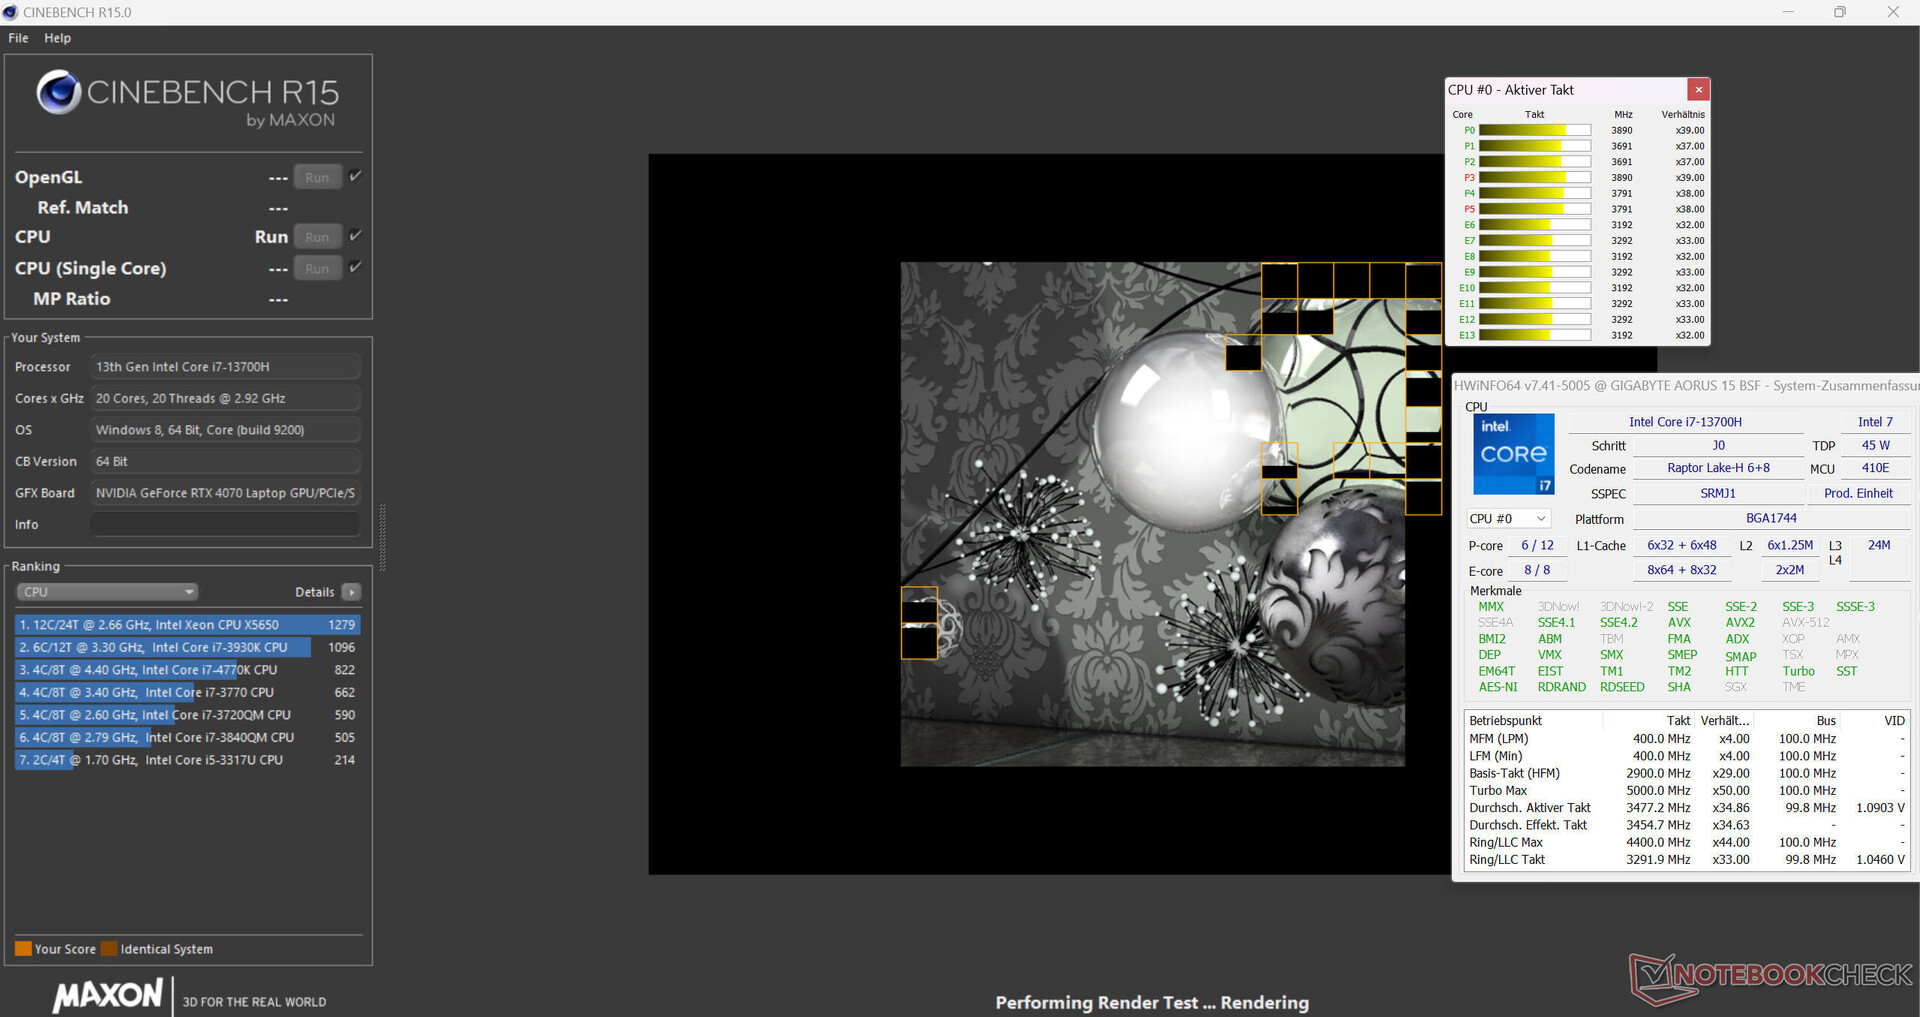
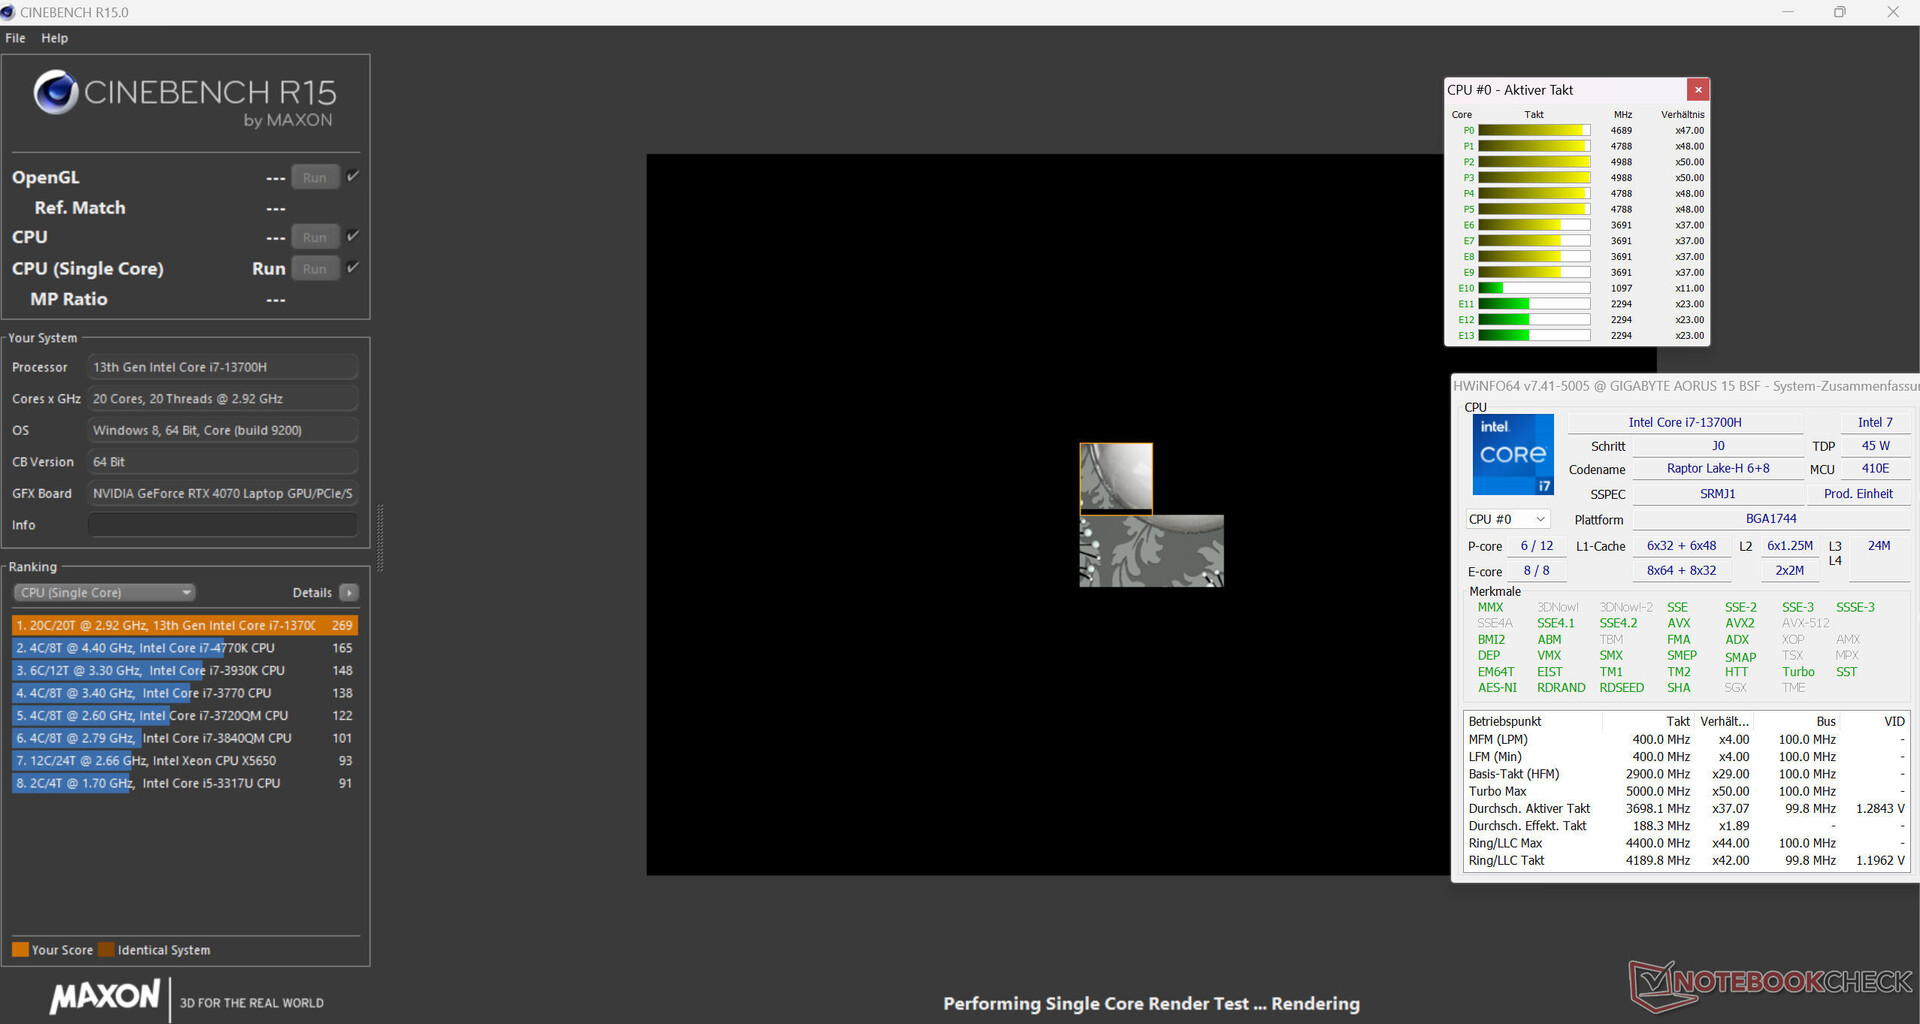
处理器处理器(猛禽湖处理器(Raptor Lake)由 8 个效率内核(无超线程,主频 1.8 - 3.7 GHz)和 6 个性能内核(超线程,主频 2.4 - 5 GHz)组成。总共有 20 个逻辑 CPU 内核。
连接电源时,笔记本电脑的基准测试结果高于 CPU 的平均水平。在电池使用状态下,其更相关的单线程性能(163 分)与多线程性能(1,614 分)下降幅度相似。
CB15 循环测试证实,CPU 涡轮增压已被长期使用。不过,无论使用哪种配置文件,第一次运行后时钟频率都会有所下降。"涡轮增压 "影响了总体性能水平。
Cinebench R15 Multi continuous test
* ... smaller is better
AIDA64: FP32 Ray-Trace | FPU Julia | CPU SHA3 | CPU Queen | FPU SinJulia | FPU Mandel | CPU AES | CPU ZLib | FP64 Ray-Trace | CPU PhotoWorxx
| Performance rating | |
| Average of class Gaming | |
| HP Omen Transcend 16 | |
| Asus TUF Gaming A16 FA617XS | |
| MSI Pulse 17 B13VGK | |
| Lenovo Legion Slim 7i 16 Gen 8 | |
| Acer Nitro 16 AN16-41 | |
| Aorus 15 BSF | |
| Average Intel Core i7-13700H | |
| AIDA64 / FP32 Ray-Trace | |
| Average of class Gaming (10227 - 85542, n=105, last 2 years) | |
| Asus TUF Gaming A16 FA617XS | |
| HP Omen Transcend 16 | |
| MSI Pulse 17 B13VGK | |
| Lenovo Legion Slim 7i 16 Gen 8 | |
| Acer Nitro 16 AN16-41 | |
| Average Intel Core i7-13700H (4986 - 18908, n=29) | |
| Aorus 15 BSF | |
| AIDA64 / FPU Julia | |
| Average of class Gaming (51376 - 238426, n=105, last 2 years) | |
| Asus TUF Gaming A16 FA617XS | |
| HP Omen Transcend 16 | |
| Acer Nitro 16 AN16-41 | |
| MSI Pulse 17 B13VGK | |
| Lenovo Legion Slim 7i 16 Gen 8 | |
| Average Intel Core i7-13700H (25360 - 92359, n=29) | |
| Aorus 15 BSF | |
| AIDA64 / CPU SHA3 | |
| Average of class Gaming (2180 - 10115, n=105, last 2 years) | |
| HP Omen Transcend 16 | |
| Asus TUF Gaming A16 FA617XS | |
| MSI Pulse 17 B13VGK | |
| Lenovo Legion Slim 7i 16 Gen 8 | |
| Acer Nitro 16 AN16-41 | |
| Aorus 15 BSF | |
| Average Intel Core i7-13700H (1339 - 4224, n=29) | |
| AIDA64 / CPU Queen | |
| HP Omen Transcend 16 | |
| Asus TUF Gaming A16 FA617XS | |
| Lenovo Legion Slim 7i 16 Gen 8 | |
| Average of class Gaming (49785 - 173351, n=90, last 2 years) | |
| Acer Nitro 16 AN16-41 | |
| Aorus 15 BSF | |
| MSI Pulse 17 B13VGK | |
| Average Intel Core i7-13700H (59324 - 107159, n=29) | |
| AIDA64 / FPU SinJulia | |
| Asus TUF Gaming A16 FA617XS | |
| Average of class Gaming (4424 - 33636, n=105, last 2 years) | |
| HP Omen Transcend 16 | |
| Acer Nitro 16 AN16-41 | |
| Lenovo Legion Slim 7i 16 Gen 8 | |
| MSI Pulse 17 B13VGK | |
| Aorus 15 BSF | |
| Average Intel Core i7-13700H (4800 - 11050, n=29) | |
| AIDA64 / FPU Mandel | |
| Average of class Gaming (25115 - 128721, n=105, last 2 years) | |
| Asus TUF Gaming A16 FA617XS | |
| HP Omen Transcend 16 | |
| Acer Nitro 16 AN16-41 | |
| MSI Pulse 17 B13VGK | |
| Lenovo Legion Slim 7i 16 Gen 8 | |
| Average Intel Core i7-13700H (12321 - 45118, n=29) | |
| Aorus 15 BSF | |
| AIDA64 / CPU AES | |
| Aorus 15 BSF | |
| HP Omen Transcend 16 | |
| Average of class Gaming (39258 - 247074, n=105, last 2 years) | |
| Asus TUF Gaming A16 FA617XS | |
| MSI Pulse 17 B13VGK | |
| Lenovo Legion Slim 7i 16 Gen 8 | |
| Average Intel Core i7-13700H (28769 - 151254, n=29) | |
| Acer Nitro 16 AN16-41 | |
| AIDA64 / CPU ZLib | |
| HP Omen Transcend 16 | |
| Average of class Gaming (574 - 2531, n=105, last 2 years) | |
| Lenovo Legion Slim 7i 16 Gen 8 | |
| MSI Pulse 17 B13VGK | |
| Asus TUF Gaming A16 FA617XS | |
| Average Intel Core i7-13700H (389 - 1215, n=29) | |
| Aorus 15 BSF | |
| Acer Nitro 16 AN16-41 | |
| AIDA64 / FP64 Ray-Trace | |
| Average of class Gaming (5509 - 45446, n=105, last 2 years) | |
| Asus TUF Gaming A16 FA617XS | |
| HP Omen Transcend 16 | |
| MSI Pulse 17 B13VGK | |
| Lenovo Legion Slim 7i 16 Gen 8 | |
| Acer Nitro 16 AN16-41 | |
| Average Intel Core i7-13700H (2540 - 10135, n=29) | |
| Aorus 15 BSF | |
| AIDA64 / CPU PhotoWorxx | |
| HP Omen Transcend 16 | |
| Average of class Gaming (12271 - 89891, n=105, last 2 years) | |
| Average Intel Core i7-13700H (12872 - 52727, n=29) | |
| MSI Pulse 17 B13VGK | |
| Aorus 15 BSF | |
| Asus TUF Gaming A16 FA617XS | |
| Acer Nitro 16 AN16-41 | |
| Lenovo Legion Slim 7i 16 Gen 8 | |
系统性能
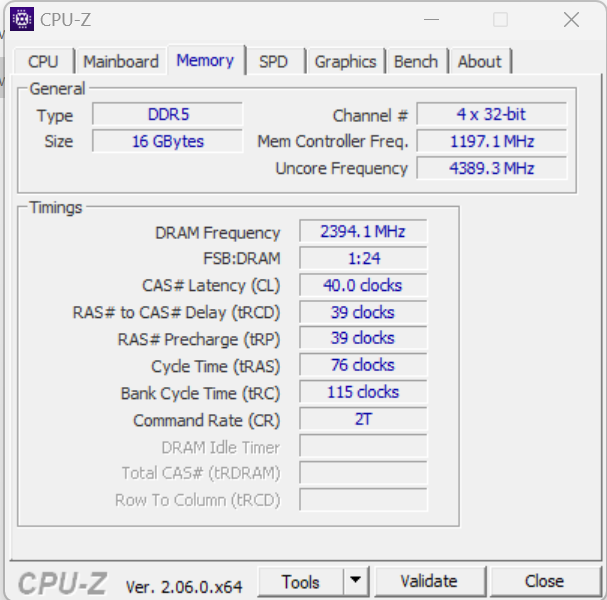
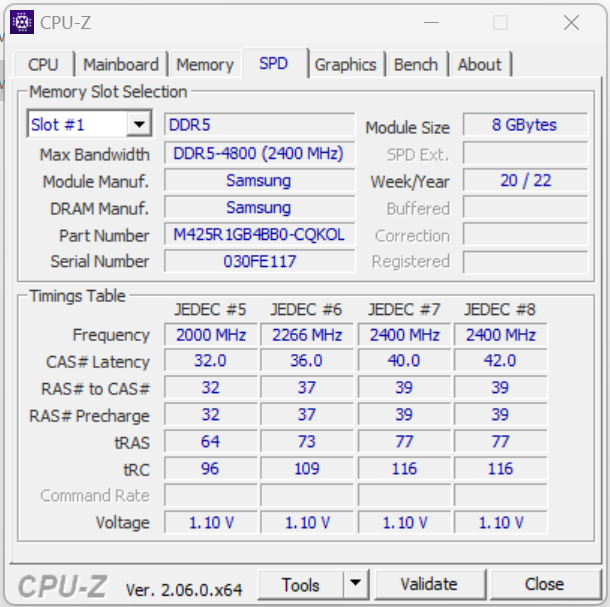
运行流畅的系统不失任何计算性能。事实证明,渲染和游戏对这款笔记本电脑来说不成问题。内存的传输速率达到了 DDR5 4800 内存的平均水平。
CrossMark: Overall | Productivity | Creativity | Responsiveness
| PCMark 10 / Score | |
| Lenovo Legion Slim 7i 16 Gen 8 | |
| Average of class Gaming (5828 - 12414, n=93, last 2 years) | |
| HP Omen Transcend 16 | |
| Asus TUF Gaming A16 FA617XS | |
| MSI Pulse 17 B13VGK | |
| Average Intel Core i7-13700H, NVIDIA GeForce RTX 4070 Laptop GPU (7158 - 7956, n=8) | |
| Aorus 15 BSF | |
| Acer Nitro 16 AN16-41 | |
| PCMark 10 / Essentials | |
| Lenovo Legion Slim 7i 16 Gen 8 | |
| HP Omen Transcend 16 | |
| Asus TUF Gaming A16 FA617XS | |
| Aorus 15 BSF | |
| Average Intel Core i7-13700H, NVIDIA GeForce RTX 4070 Laptop GPU (10252 - 11449, n=8) | |
| Average of class Gaming (8810 - 11935, n=97, last 2 years) | |
| Acer Nitro 16 AN16-41 | |
| MSI Pulse 17 B13VGK | |
| PCMark 10 / Productivity | |
| Average of class Gaming (6845 - 25323, n=95, last 2 years) | |
| Lenovo Legion Slim 7i 16 Gen 8 | |
| MSI Pulse 17 B13VGK | |
| Asus TUF Gaming A16 FA617XS | |
| HP Omen Transcend 16 | |
| Average Intel Core i7-13700H, NVIDIA GeForce RTX 4070 Laptop GPU (8501 - 10769, n=8) | |
| Acer Nitro 16 AN16-41 | |
| Aorus 15 BSF | |
| PCMark 10 / Digital Content Creation | |
| Average of class Gaming (7602 - 19954, n=95, last 2 years) | |
| Lenovo Legion Slim 7i 16 Gen 8 | |
| HP Omen Transcend 16 | |
| Asus TUF Gaming A16 FA617XS | |
| MSI Pulse 17 B13VGK | |
| Average Intel Core i7-13700H, NVIDIA GeForce RTX 4070 Laptop GPU (10358 - 12908, n=8) | |
| Aorus 15 BSF | |
| Acer Nitro 16 AN16-41 | |
| CrossMark / Overall | |
| Aorus 15 BSF | |
| Average of class Gaming (1366 - 2409, n=94, last 2 years) | |
| Lenovo Legion Slim 7i 16 Gen 8 | |
| HP Omen Transcend 16 | |
| MSI Pulse 17 B13VGK | |
| Average Intel Core i7-13700H, NVIDIA GeForce RTX 4070 Laptop GPU (1768 - 2073, n=6) | |
| Asus TUF Gaming A16 FA617XS | |
| Acer Nitro 16 AN16-41 | |
| CrossMark / Productivity | |
| Aorus 15 BSF | |
| Lenovo Legion Slim 7i 16 Gen 8 | |
| Average of class Gaming (1386 - 2254, n=94, last 2 years) | |
| HP Omen Transcend 16 | |
| MSI Pulse 17 B13VGK | |
| Average Intel Core i7-13700H, NVIDIA GeForce RTX 4070 Laptop GPU (1645 - 2006, n=6) | |
| Asus TUF Gaming A16 FA617XS | |
| Acer Nitro 16 AN16-41 | |
| CrossMark / Creativity | |
| HP Omen Transcend 16 | |
| Average of class Gaming (1343 - 2786, n=94, last 2 years) | |
| Aorus 15 BSF | |
| Lenovo Legion Slim 7i 16 Gen 8 | |
| MSI Pulse 17 B13VGK | |
| Average Intel Core i7-13700H, NVIDIA GeForce RTX 4070 Laptop GPU (1936 - 2137, n=6) | |
| Asus TUF Gaming A16 FA617XS | |
| Acer Nitro 16 AN16-41 | |
| CrossMark / Responsiveness | |
| Aorus 15 BSF | |
| Lenovo Legion Slim 7i 16 Gen 8 | |
| MSI Pulse 17 B13VGK | |
| Average Intel Core i7-13700H, NVIDIA GeForce RTX 4070 Laptop GPU (1451 - 2202, n=6) | |
| Average of class Gaming (1226 - 2334, n=94, last 2 years) | |
| HP Omen Transcend 16 | |
| Asus TUF Gaming A16 FA617XS | |
| Acer Nitro 16 AN16-41 | |
| PCMark 10 Score | 7309 points | |
Help | ||
| AIDA64 / Memory Copy | |
| HP Omen Transcend 16 | |
| Average of class Gaming (21750 - 129946, n=105, last 2 years) | |
| Average Intel Core i7-13700H (24334 - 78081, n=29) | |
| MSI Pulse 17 B13VGK | |
| Aorus 15 BSF | |
| Asus TUF Gaming A16 FA617XS | |
| Acer Nitro 16 AN16-41 | |
| Lenovo Legion Slim 7i 16 Gen 8 | |
| AIDA64 / Memory Read | |
| HP Omen Transcend 16 | |
| Average of class Gaming (22956 - 118858, n=105, last 2 years) | |
| MSI Pulse 17 B13VGK | |
| Aorus 15 BSF | |
| Average Intel Core i7-13700H (23681 - 79656, n=29) | |
| Asus TUF Gaming A16 FA617XS | |
| Acer Nitro 16 AN16-41 | |
| Lenovo Legion Slim 7i 16 Gen 8 | |
| AIDA64 / Memory Write | |
| Aorus 15 BSF | |
| Average of class Gaming (22297 - 135096, n=105, last 2 years) | |
| HP Omen Transcend 16 | |
| Asus TUF Gaming A16 FA617XS | |
| Average Intel Core i7-13700H (22986 - 99898, n=29) | |
| MSI Pulse 17 B13VGK | |
| Acer Nitro 16 AN16-41 | |
| Lenovo Legion Slim 7i 16 Gen 8 | |
| AIDA64 / Memory Latency | |
| Average of class Gaming (75.3 - 259, n=105, last 2 years) | |
| MSI Pulse 17 B13VGK | |
| Average Intel Core i7-13700H (82.4 - 136.8, n=29) | |
| Acer Nitro 16 AN16-41 | |
| Aorus 15 BSF | |
| Asus TUF Gaming A16 FA617XS | |
| HP Omen Transcend 16 | |
| Lenovo Legion Slim 7i 16 Gen 8 | |
* ... smaller is better
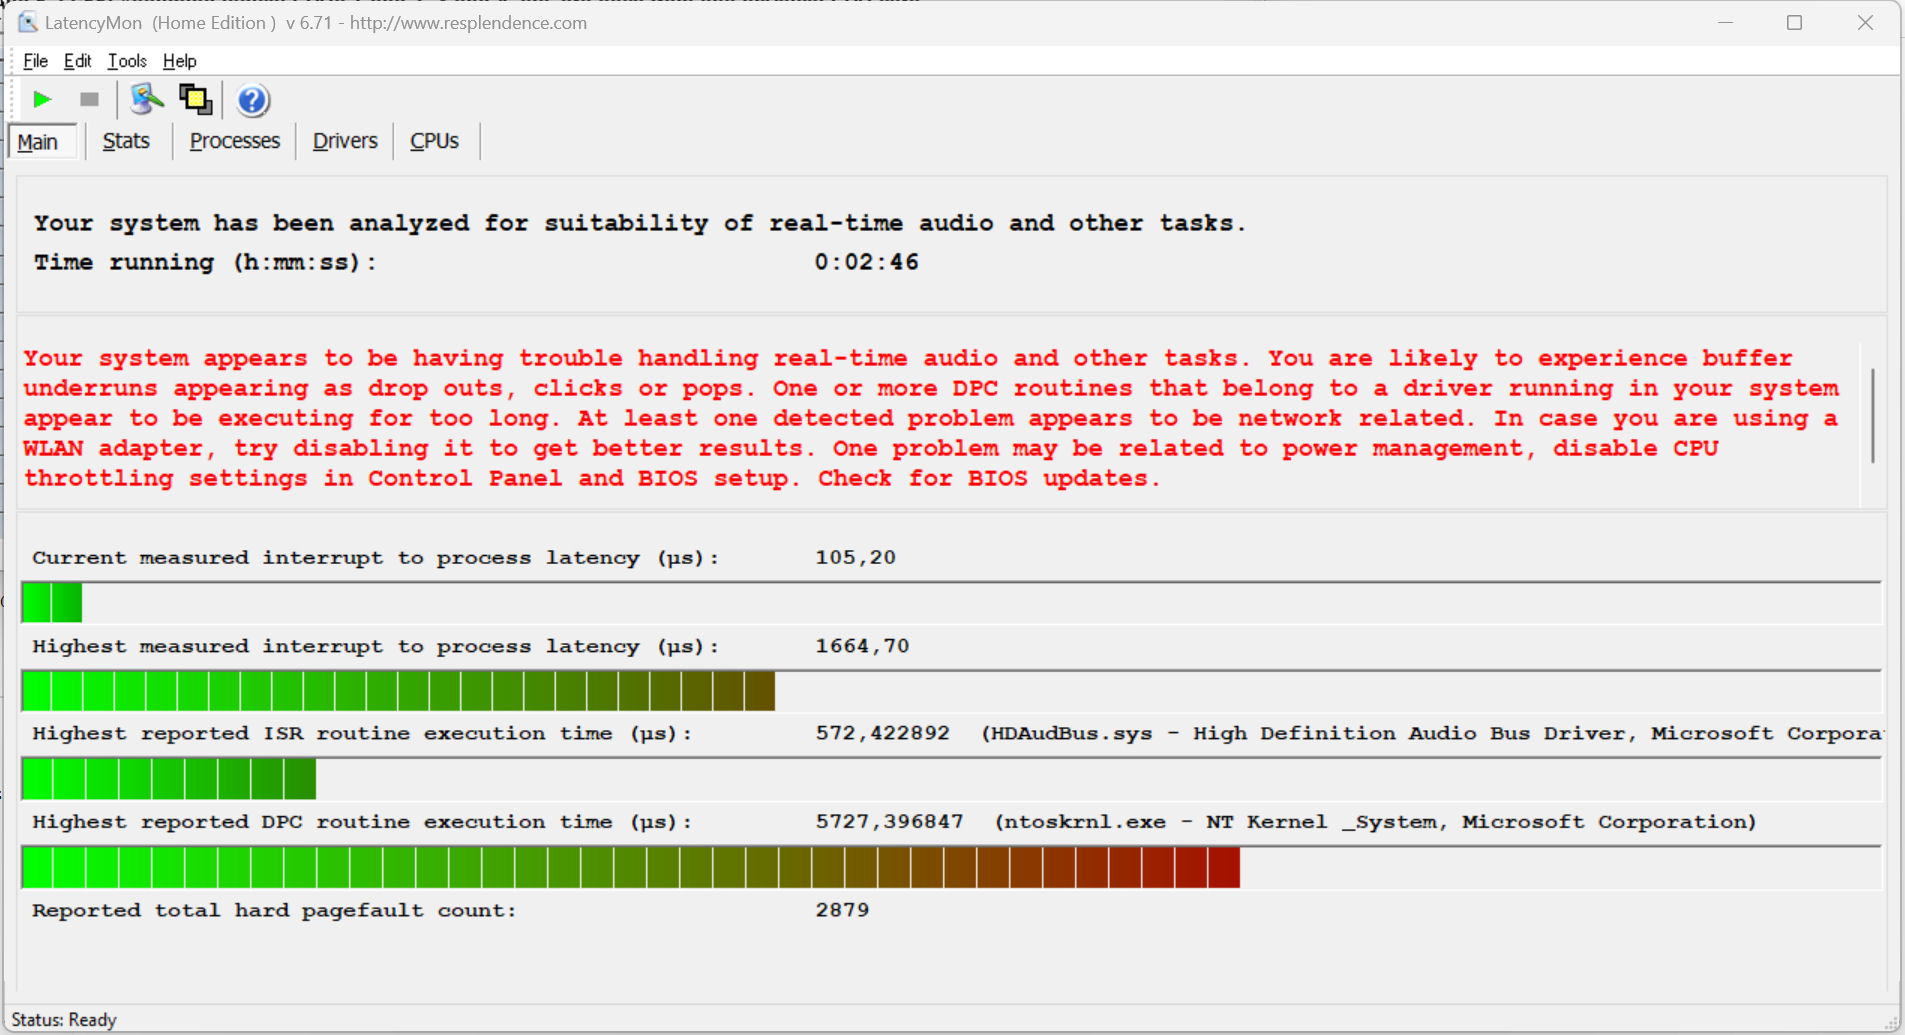
DPC 延迟
标准延迟监控测试(网上冲浪、4K 视频播放、Prime95 高负载)发现了一些异常情况。该系统似乎不适合实时视频和音频编辑。未来的软件更新可能会带来改进,甚至降低性能。
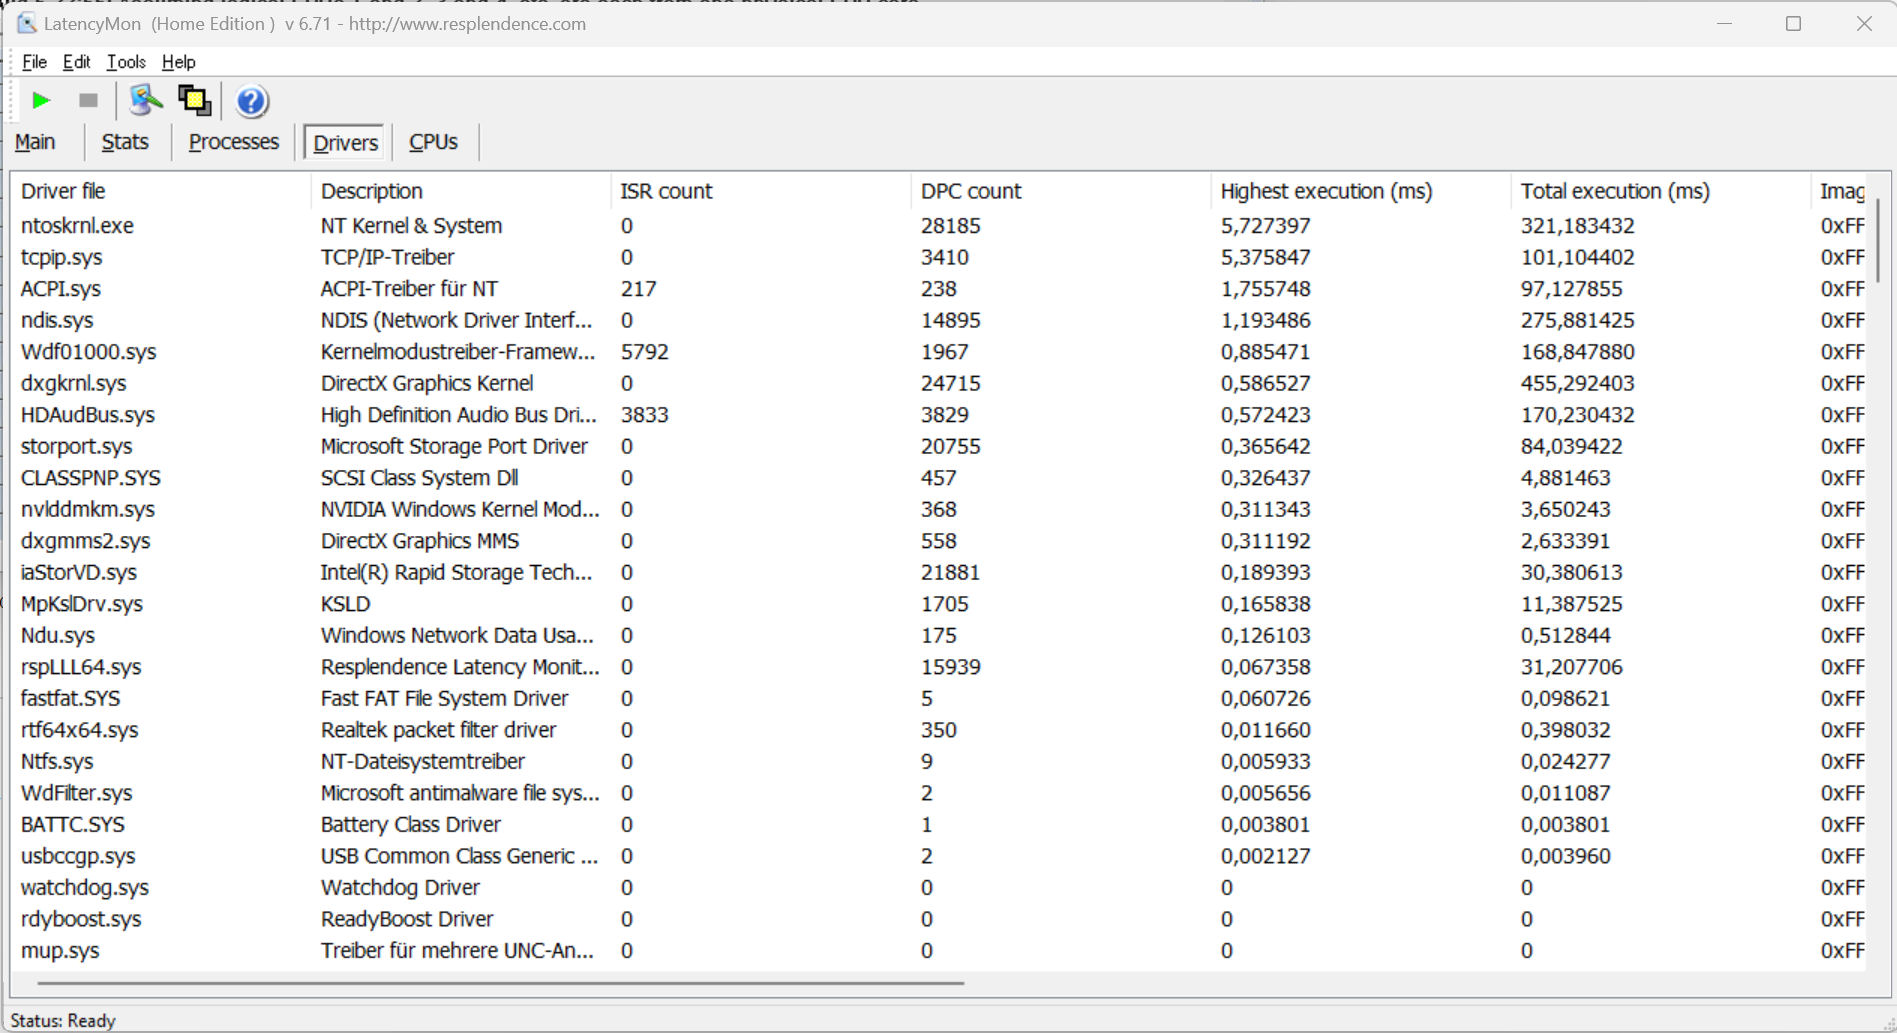
| DPC Latencies / LatencyMon - interrupt to process latency (max), Web, Youtube, Prime95 | |
| Lenovo Legion Slim 7i 16 Gen 8 | |
| Aorus 15 BSF | |
| HP Omen Transcend 16 | |
| Acer Nitro 16 AN16-41 | |
| Asus TUF Gaming A16 FA617XS | |
| MSI Pulse 17 B13VGK | |
* ... smaller is better
存储设备
这台笔记本电脑配备了技嘉的 1 TB SSD(PCIe 4,M.2 2280),数据传输率非常高。正面:我们没有注意到任何与温度有关的节流现象。该设备还有空间再安装一个固态硬盘。

* ... smaller is better
Reading continuous performance: DiskSpd Read Loop, Queue Depth 8
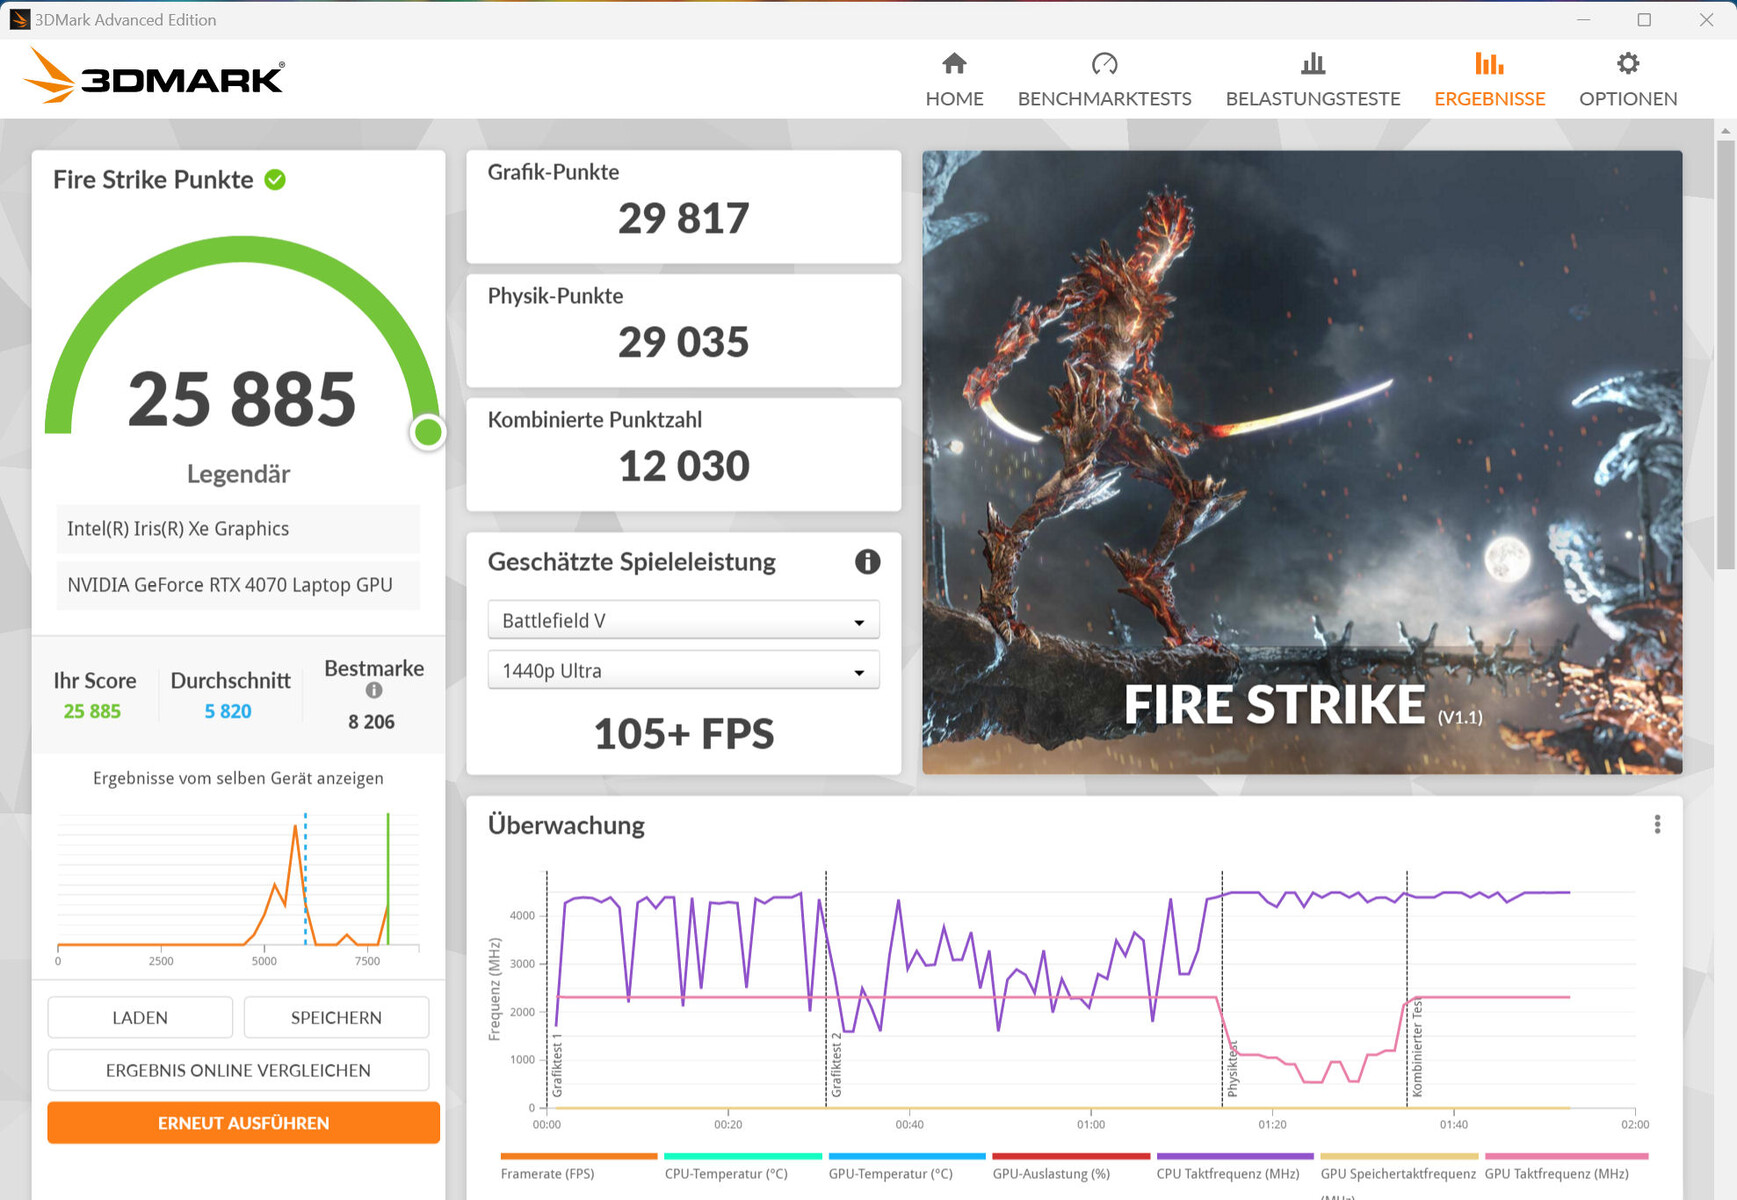
图形卡
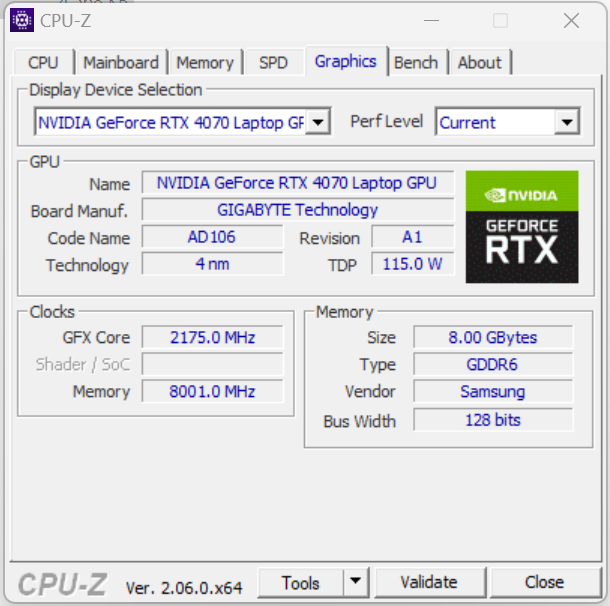
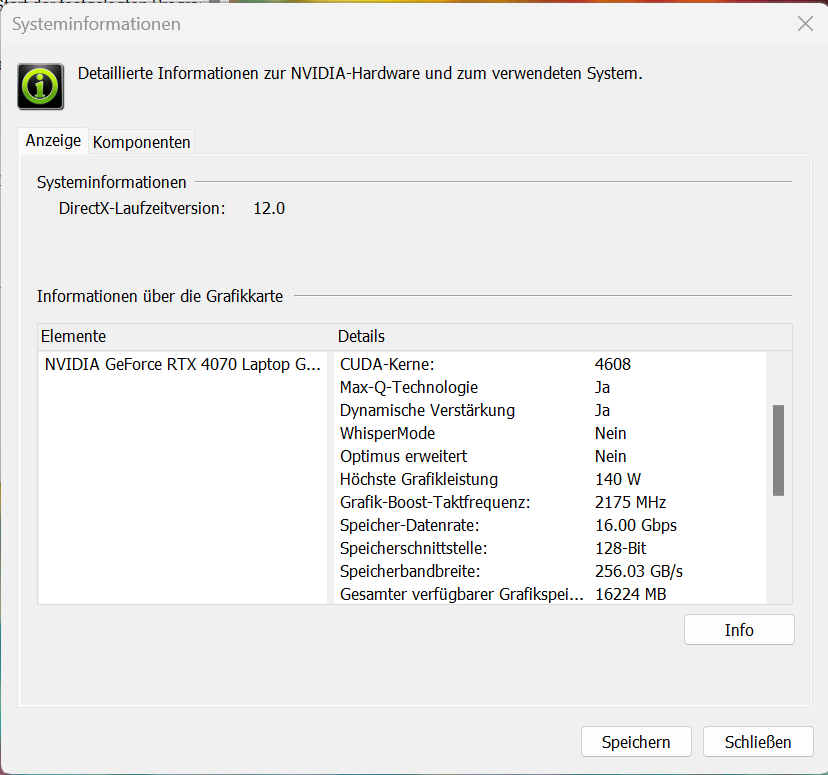
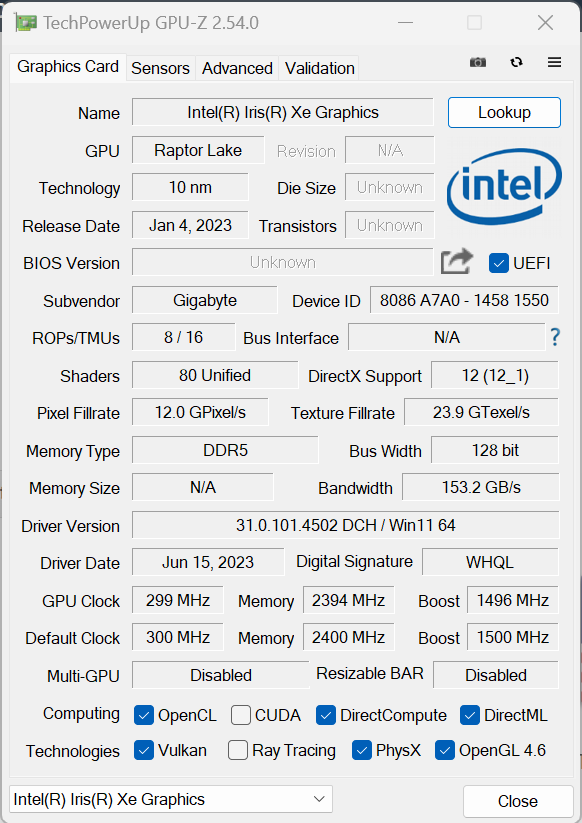
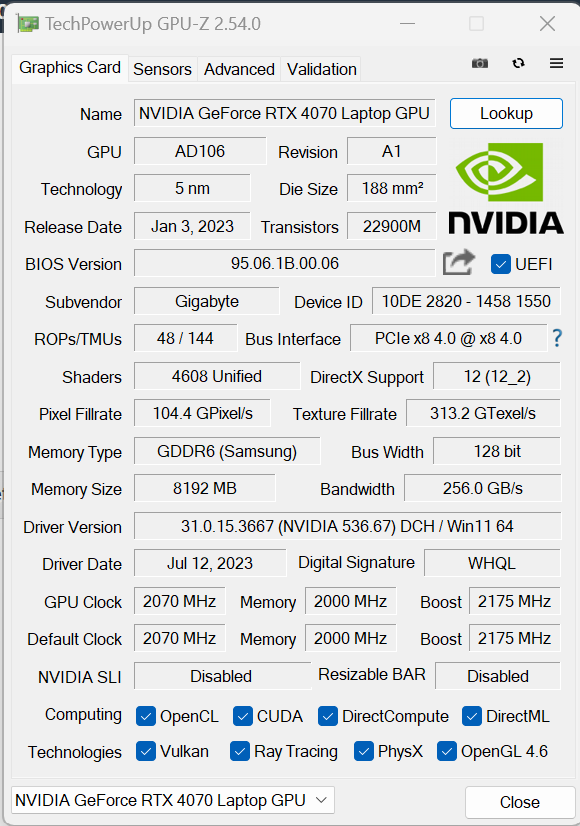
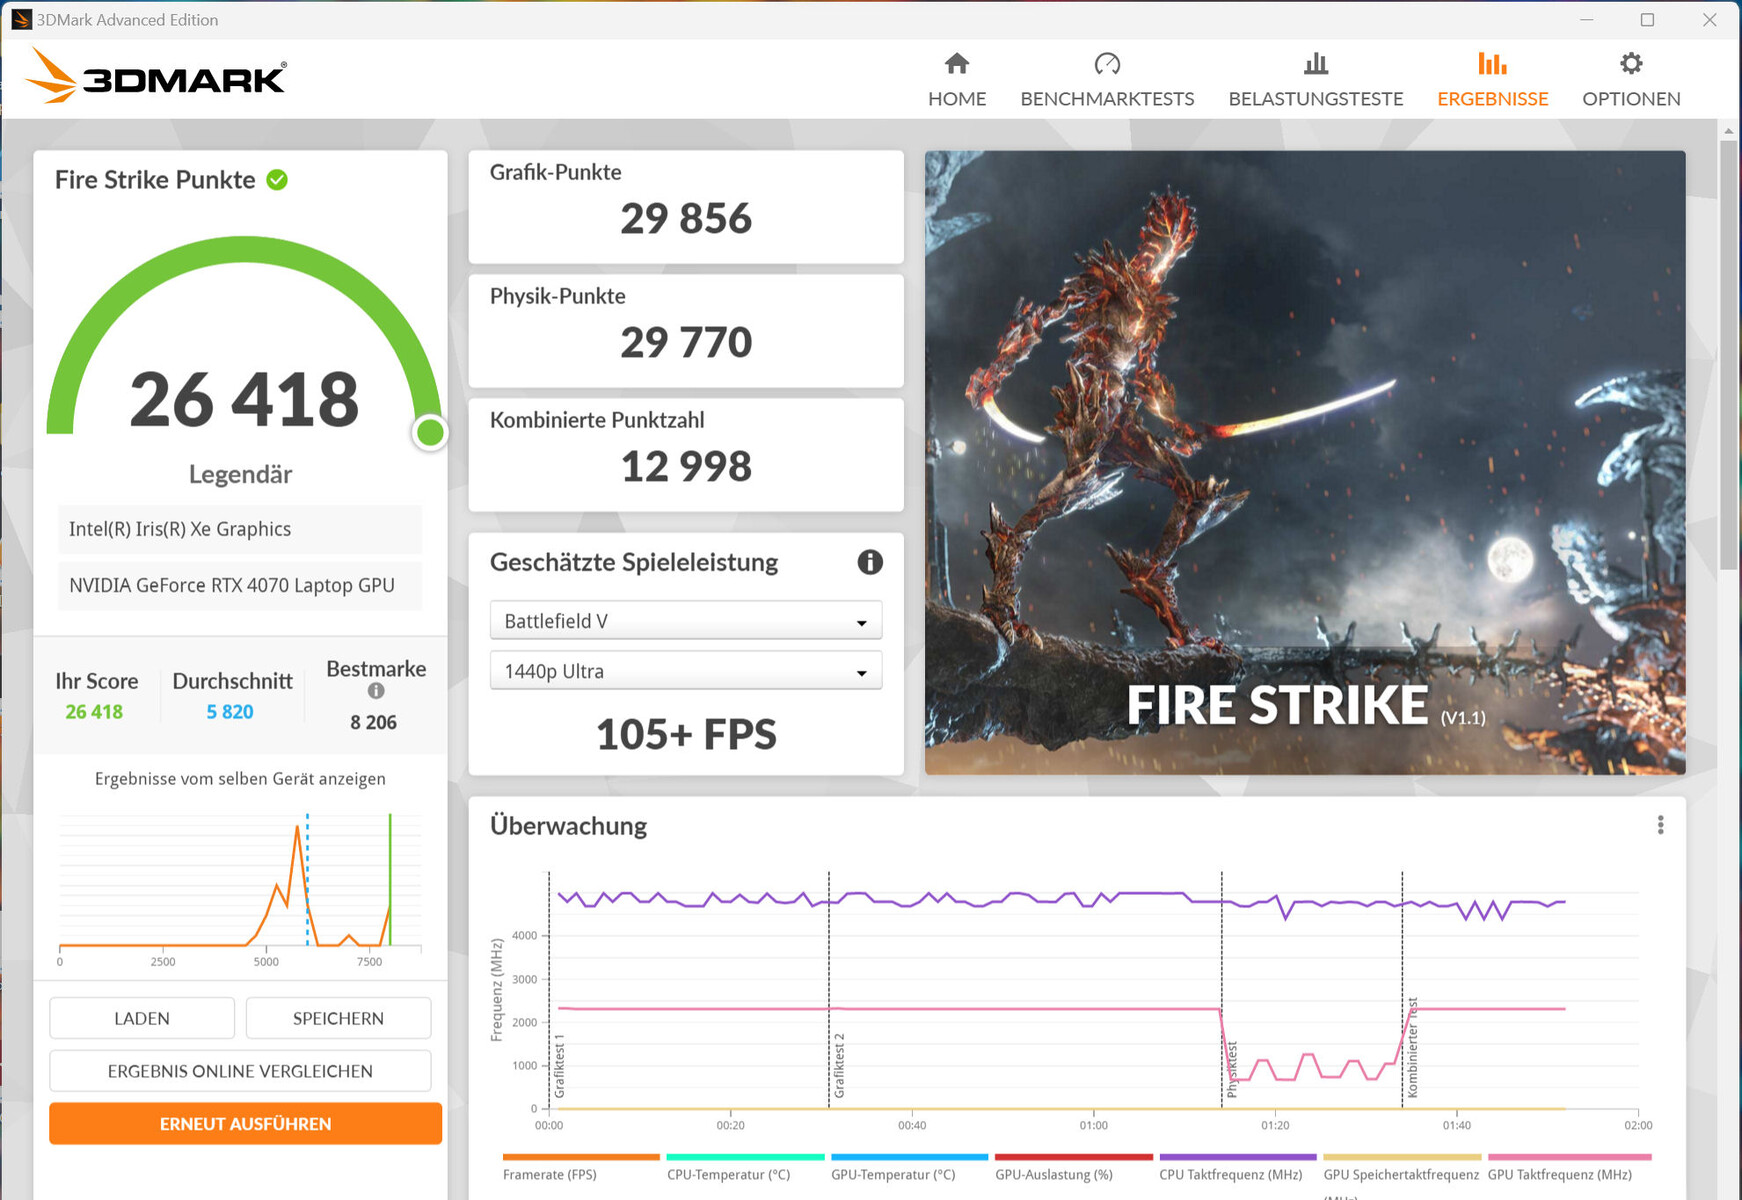
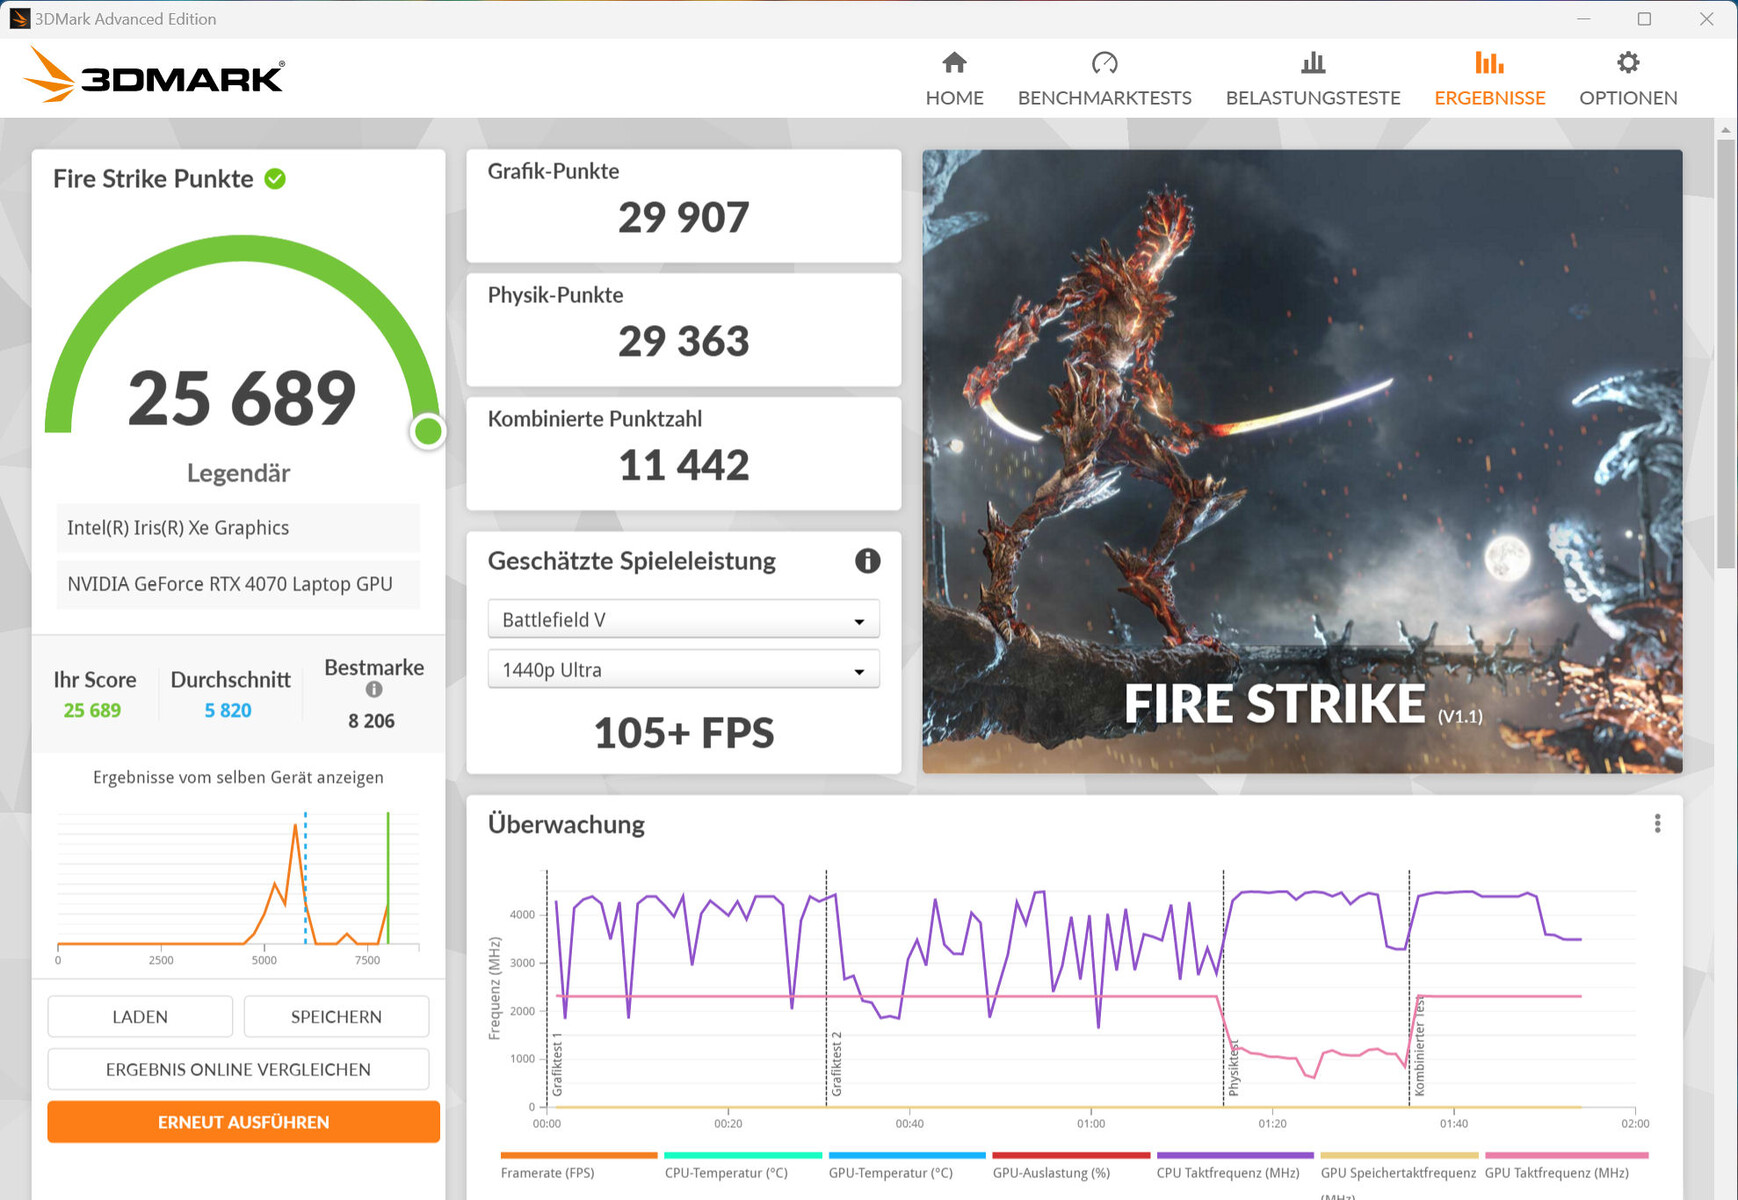
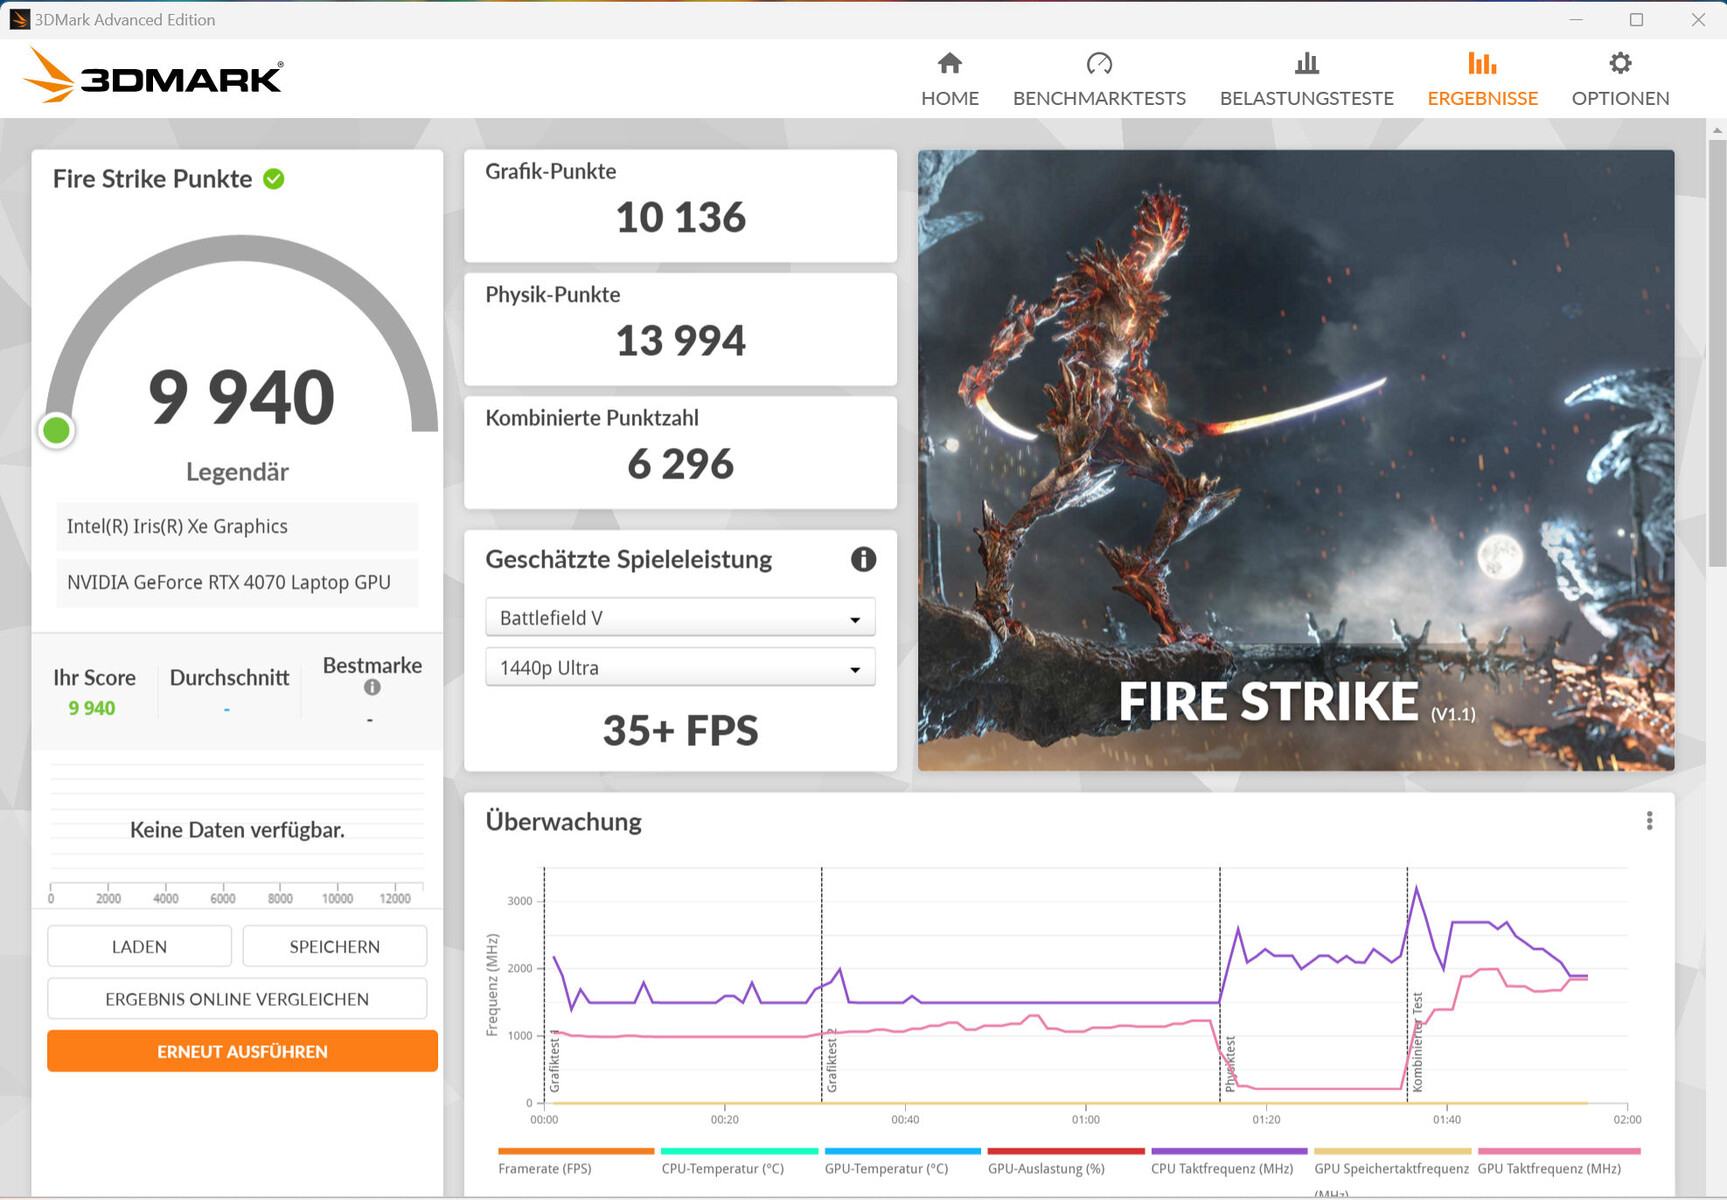
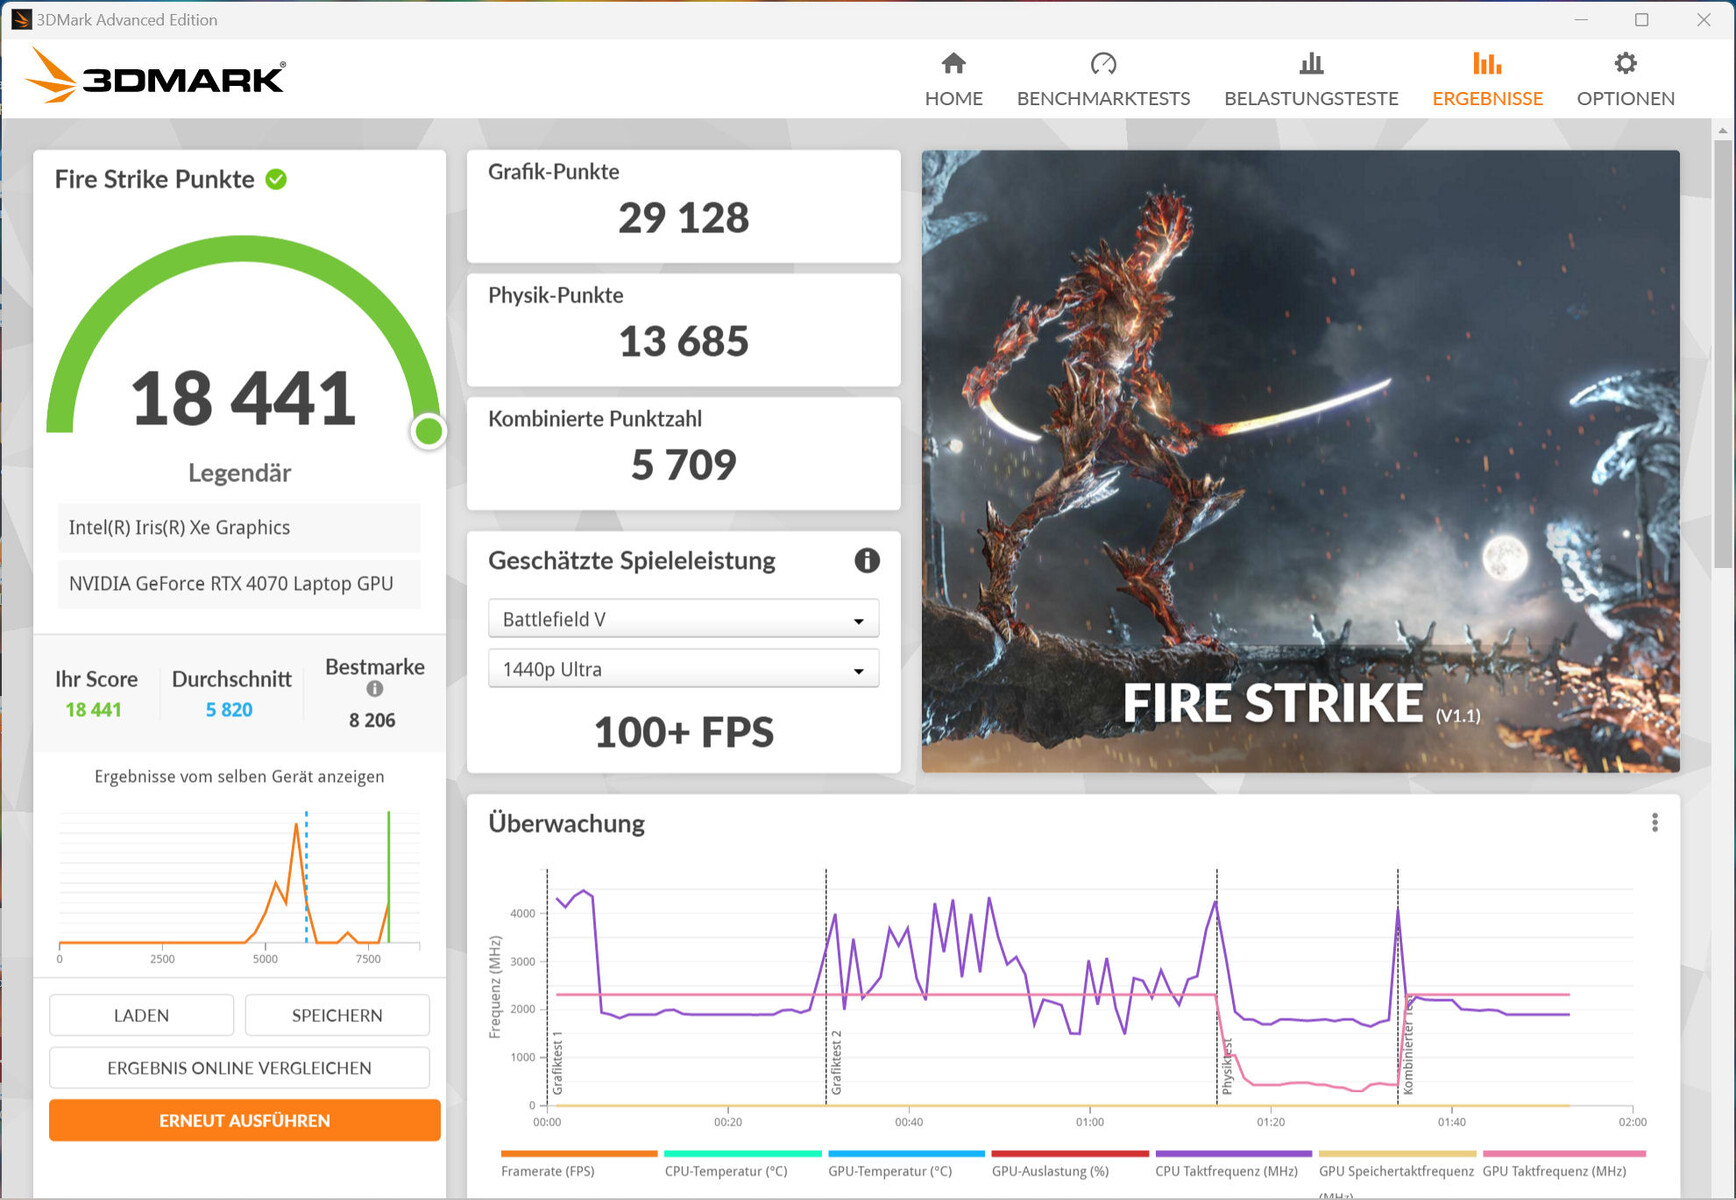
......(英文GeForce RTX 4070拥有 4608 个着色器、快速 GDDR6 内存(虽然只有 8192 MB)和 128 位宽总线。技嘉为其设定的最大 TGP 为 140 瓦(115 瓦 + 25 瓦),不可能更高。根据 Witcher 3测试显示,TGP 并未完全发挥优势。
其基准测试结果高于之前 RTX 4070 的平均水平。使用 dGPU 模式没有带来任何改进。在 Optimus 模式("英特尔图形输出模式")和 dGPU 模式("Nvidia 图形输出模式")之间切换,可以通过控制中心(常规 -> GPU MUX 开关)完成。您必须重新启动笔记本电脑。技嘉依赖 MUX 开关 - 不支持高级 Optimus。

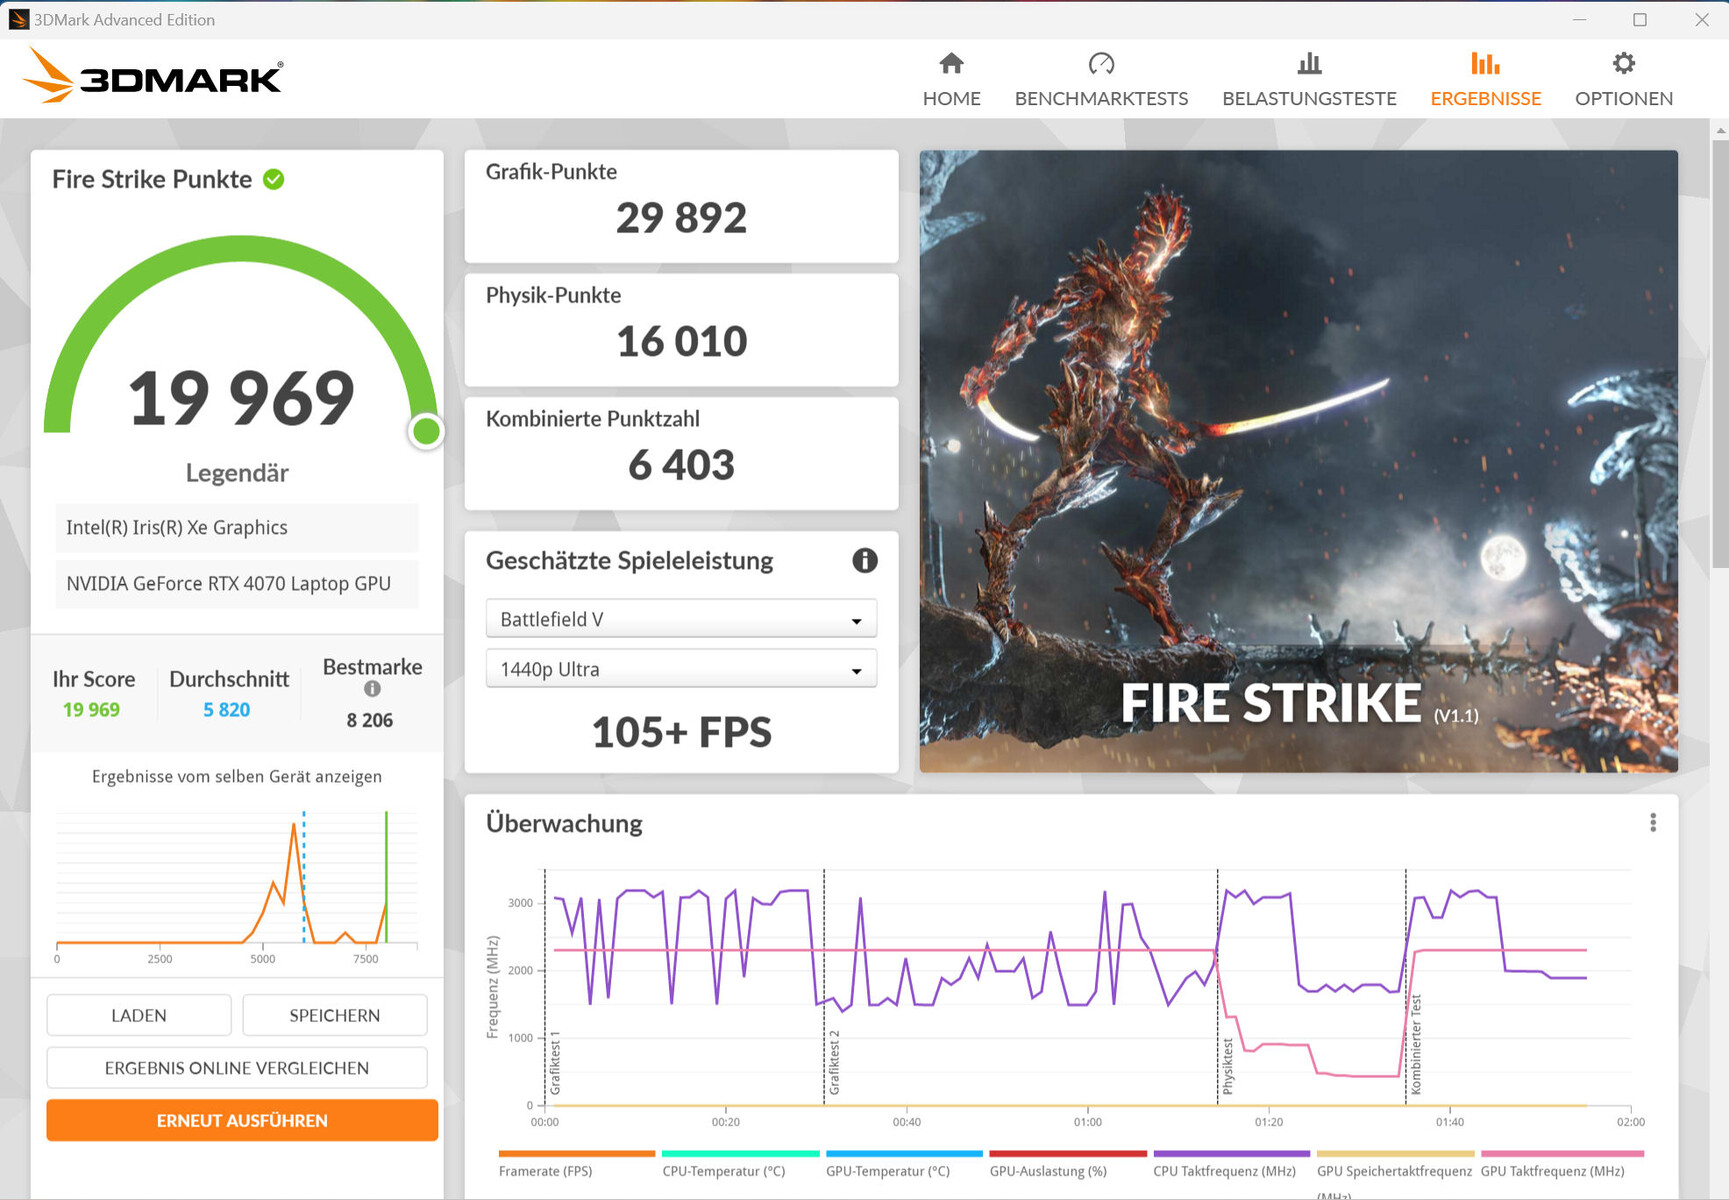
| 3DMark 06 Standard Score | 55084 points | |
| 3DMark 11 Performance | 33789 points | |
| 3DMark Cloud Gate Standard Score | 57822 points | |
| 3DMark Fire Strike Score | 26593 points | |
| 3DMark Time Spy Score | 12234 points | |
Help | ||
| Geekbench 6.7 - GPU OpenCL | |
| Average of class Gaming (67235 - 253130, n=103, last 2 years) | |
| Aorus 15 BSF | |
| MSI Pulse 17 B13VGK | |
| Average NVIDIA GeForce RTX 4070 Laptop GPU (85488 - 129836, n=45) | |
* ... smaller is better
游戏性能
这款笔记本电脑适用于高至最高设置下的 QHD 游戏。更高分辨率可与合适的显示器搭配使用,有时还可降低设置。我们测试的游戏帧率均高于确定的 RTX 4070 平均帧率。使用 dGPU 模式并没有带来更高的性能。
使用会议模式可以降低游戏噪音:在 GPU 性能保持不变的情况下,CPU 性能会因功耗限制降低而下降。这时可能需要降低设置。
| The Witcher 3 - 1920x1080 Ultra Graphics & Postprocessing (HBAO+) | |
| Average of class Gaming (104.7 - 240, n=7, last 2 years) | |
| Lenovo Legion Slim 7i 16 Gen 8 | |
| Aorus 15 BSF | |
| Acer Nitro 16 AN16-41 | |
| Average NVIDIA GeForce RTX 4070 Laptop GPU (69.8 - 133.7, n=57) | |
| HP Omen Transcend 16 | |
| MSI Pulse 17 B13VGK | |
| Asus TUF Gaming A16 FA617XS | |
| Final Fantasy XV Benchmark - 1920x1080 High Quality | |
| Average of class Gaming (41 - 215, n=95, last 2 years) | |
| Lenovo Legion Slim 7i 16 Gen 8 | |
| Aorus 15 BSF | |
| MSI Pulse 17 B13VGK | |
| Average NVIDIA GeForce RTX 4070 Laptop GPU (41 - 131.9, n=65) | |
| Acer Nitro 16 AN16-41 | |
| Asus TUF Gaming A16 FA617XS | |
| Cyberpunk 2077 1.6 | |
| 1920x1080 Ultra Preset | |
| Lenovo Legion Slim 7i 16 Gen 8 | |
| Aorus 15 BSF | |
| HP Omen Transcend 16 | |
| Acer Nitro 16 AN16-41 | |
| Average NVIDIA GeForce RTX 4070 Laptop GPU (48 - 110, n=24) | |
| 2560x1440 Ultra Preset | |
| HP Omen Transcend 16 | |
| Lenovo Legion Slim 7i 16 Gen 8 | |
| Acer Nitro 16 AN16-41 | |
| Aorus 15 BSF | |
| Average NVIDIA GeForce RTX 4070 Laptop GPU (30 - 63.9, n=24) | |
| 1920x1080 Ray Tracing Ultra Preset (DLSS off) | |
| Average NVIDIA GeForce RTX 4070 Laptop GPU (36.2 - 65, n=5) | |
| Aorus 15 BSF | |
| The Callisto Protocol | |
| 1920x1080 Ultra Preset (without FSR Upscaling) | |
| Aorus 15 BSF | |
| Acer Nitro 16 AN16-41 | |
| Average NVIDIA GeForce RTX 4070 Laptop GPU (78.9 - 88, n=4) | |
| 2560x1440 Ultra Preset (without FSR Upscaling) | |
| Aorus 15 BSF | |
| Acer Nitro 16 AN16-41 | |
| Average NVIDIA GeForce RTX 4070 Laptop GPU (58.4 - 68.3, n=4) | |
| 1920x1080 Ultra Preset (without FSR Upscaling) + Full Ray-Tracing | |
| Aorus 15 BSF | |
| Average NVIDIA GeForce RTX 4070 Laptop GPU (50.8 - 70, n=4) | |
| Acer Nitro 16 AN16-41 | |
| Returnal | |
| 1920x1080 Epic Preset | |
| Aorus 15 BSF | |
| HP Omen Transcend 16 | |
| Average NVIDIA GeForce RTX 4070 Laptop GPU (54 - 90, n=12) | |
| Asus TUF Gaming A16 FA617XS | |
| Lenovo Legion Slim 7i 16 Gen 8 | |
| 2560x1440 Epic Preset | |
| Aorus 15 BSF | |
| HP Omen Transcend 16 | |
| Average NVIDIA GeForce RTX 4070 Laptop GPU (39 - 66, n=12) | |
| Lenovo Legion Slim 7i 16 Gen 8 | |
| 1920x1080 Epic Preset + Epic Ray-Tracing | |
| Aorus 15 BSF | |
| Average NVIDIA GeForce RTX 4070 Laptop GPU (71 - 75, n=5) | |
| Asus TUF Gaming A16 FA617XS | |
| Baldur's Gate 3 | |
| 1920x1080 Ultra Preset AA:T | |
| Average of class Gaming (59.4 - 246, n=104, last 2 years) | |
| Average NVIDIA GeForce RTX 4070 Laptop GPU (66.7 - 128.5, n=30) | |
| Aorus 15 BSF | |
| 2560x1440 Ultra Preset AA:T | |
| Average of class Gaming (60 - 175.5, n=85, last 2 years) | |
| Average NVIDIA GeForce RTX 4070 Laptop GPU (54.4 - 89.6, n=25) | |
| Aorus 15 BSF | |
| Ratchet & Clank Rift Apart | |
| 1920x1080 Very High Preset AA:T | |
| Aorus 15 BSF | |
| Average NVIDIA GeForce RTX 4070 Laptop GPU (52.3 - 58.1, n=4) | |
| 2560x1440 Very High Preset AA:T | |
| Average NVIDIA GeForce RTX 4070 Laptop GPU (48.7 - 49.1, n=3) | |
| Aorus 15 BSF | |
| 1920x1080 Very High Preset + Very High Raytracing AA:T | |
| Average NVIDIA GeForce RTX 4070 Laptop GPU (43.4 - 44.8, n=2) | |
| Aorus 15 BSF | |
为了测试帧频是否能在较长时间内保持稳定,我们在全高清分辨率和最高质量设置下让游戏《Witcher 3》运行了约 60 分钟。我们没有移动角色。我们没有发现帧速率有任何下降。
Witcher 3 FPS diagram
| low | med. | high | ultra | QHD | |
|---|---|---|---|---|---|
| The Witcher 3 (2015) | 432.4 | 371.8 | 230.9 | 117 | |
| Dota 2 Reborn (2015) | 186.9 | 167.6 | 162.4 | 149.9 | |
| Final Fantasy XV Benchmark (2018) | 213 | 163.9 | 115.4 | 84.4 | |
| X-Plane 11.11 (2018) | 160 | 142.1 | 113.4 | ||
| Far Cry 5 (2018) | 178 | 156 | 149 | 140 | 117 |
| Strange Brigade (2018) | 485 | 295 | 231 | 202 | 133.6 |
| Cyberpunk 2077 1.6 (2022) | 135.4 | 113.8 | 96.7 | 90 | 53.4 |
| The Callisto Protocol (2022) | 162.8 | 142.2 | 136 | 88 | 68.3 |
| Returnal (2023) | 117 | 114 | 104 | 87 | 64 |
| F1 23 (2023) | 248 | 255 | 209 | 71.7 | 46.3 |
| Ratchet & Clank Rift Apart (2023) | 90.4 | 78.8 | 62.3 | 57.1 | 48.8 |
| Baldur's Gate 3 (2023) | 137.1 | 114.2 | 91.4 | 88.5 | 60.2 |
噪音 - Aorus 笔记本电脑可能会产生相当大的噪音
噪音排放
游戏时,噪音最高可达 55 dB(A)("Turbo")。当我们使用 "AI Boost "模式时,测得噪音为 53 dB(A)。会议模式在性能、噪音和功耗方面的组合更为均衡。
在空闲模式和日常使用(办公、上网)中,两个风扇一般不会发出太大噪音,有时甚至根本不转。但这并不意味着它们始终保持静音,我们测得的噪音高达 37 dB(A)。
Noise level
| Idle |
| 25 / 31 / 37 dB(A) |
| Load |
| 51 / 57 dB(A) |
 | ||
30 dB silent 40 dB(A) audible 50 dB(A) loud |
||
min: | ||
| Aorus 15 BSF i7-13700H, GeForce RTX 4070 Laptop GPU | HP Omen Transcend 16 i9-13900HX, GeForce RTX 4070 Laptop GPU | MSI Pulse 17 B13VGK i7-13700H, GeForce RTX 4070 Laptop GPU | Lenovo Legion Slim 7i 16 Gen 8 i9-13900H, GeForce RTX 4070 Laptop GPU | Acer Nitro 16 AN16-41 R7 7735HS, GeForce RTX 4070 Laptop GPU | Asus TUF Gaming A16 FA617XS R9 7940HS, Radeon RX 7600S | |
|---|---|---|---|---|---|---|
| Noise | 5% | 19% | 20% | 10% | 10% | |
| off / environment * (dB) | 24 | 22.9 5% | 24 -0% | 22.8 5% | 25.7 -7% | 25 -4% |
| Idle Minimum * (dB) | 25 | 29.1 -16% | 24 4% | 23.6 6% | 25.7 -3% | 25 -0% |
| Idle Average * (dB) | 31 | 29.1 6% | 24 23% | 23.6 24% | 25.7 17% | 26 16% |
| Idle Maximum * (dB) | 37 | 29.1 21% | 24 35% | 25.7 31% | 26.3 29% | 28 24% |
| Load Average * (dB) | 51 | 45.7 10% | 32.49 36% | 27.6 46% | 33.9 34% | 43 16% |
| Load Maximum * (dB) | 57 | 54.3 5% | 46.51 18% | 54.4 5% | 62 -9% | 53 7% |
| Witcher 3 ultra * (dB) | 54.3 | 46.51 | 54.4 | 51 |
* ... smaller is better
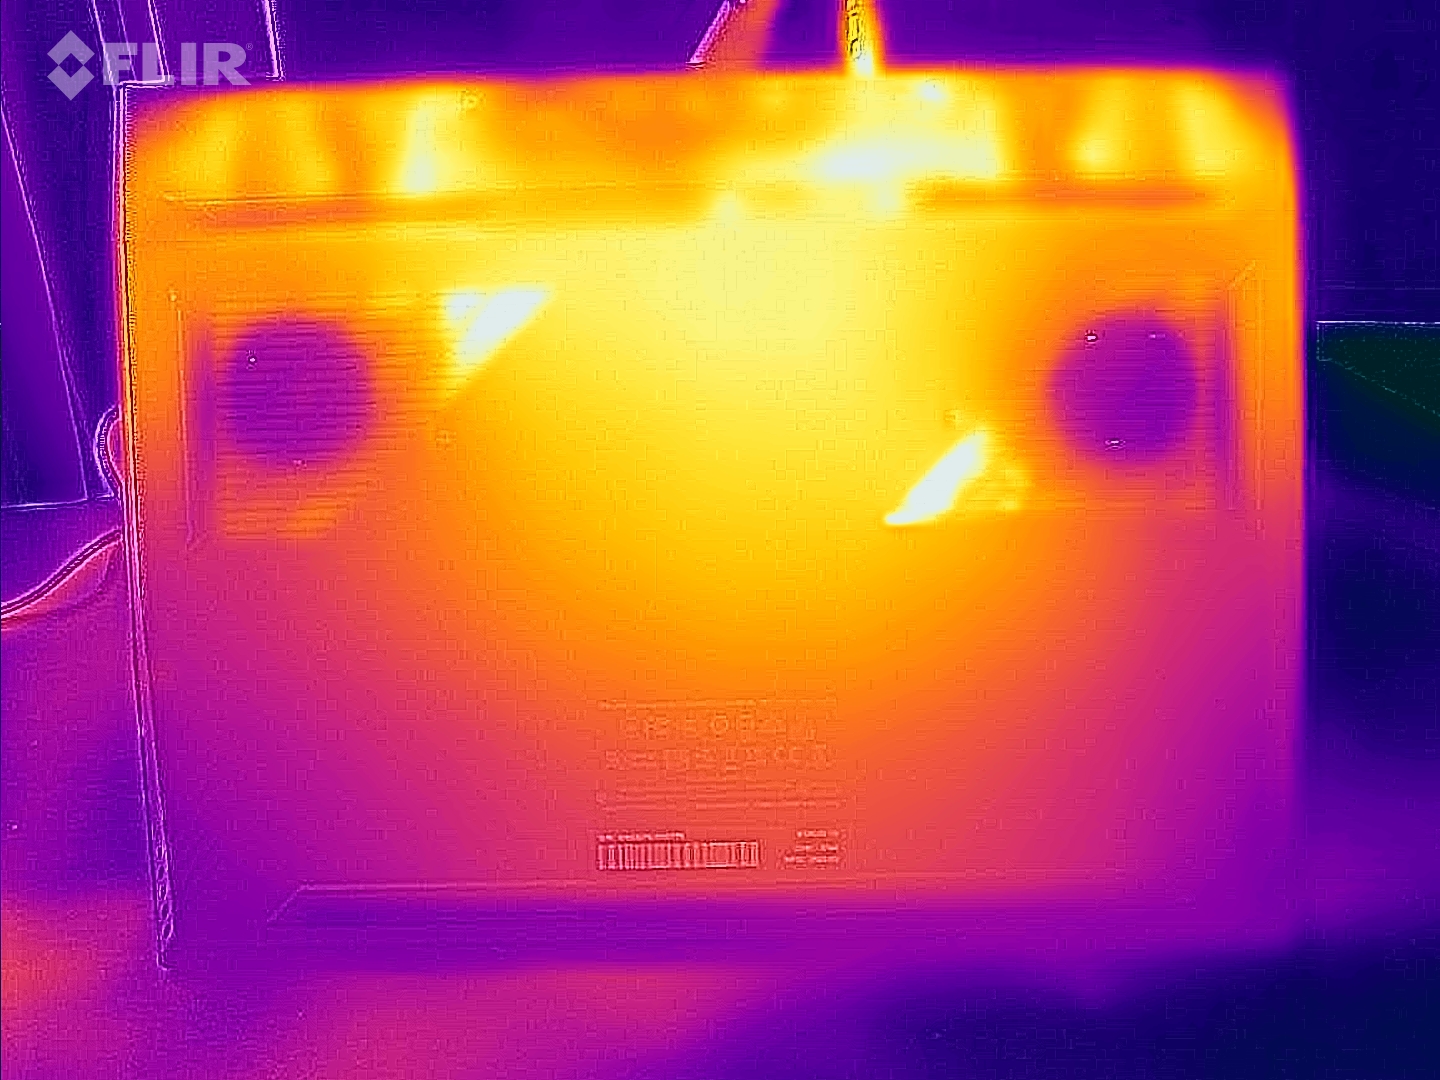
温度
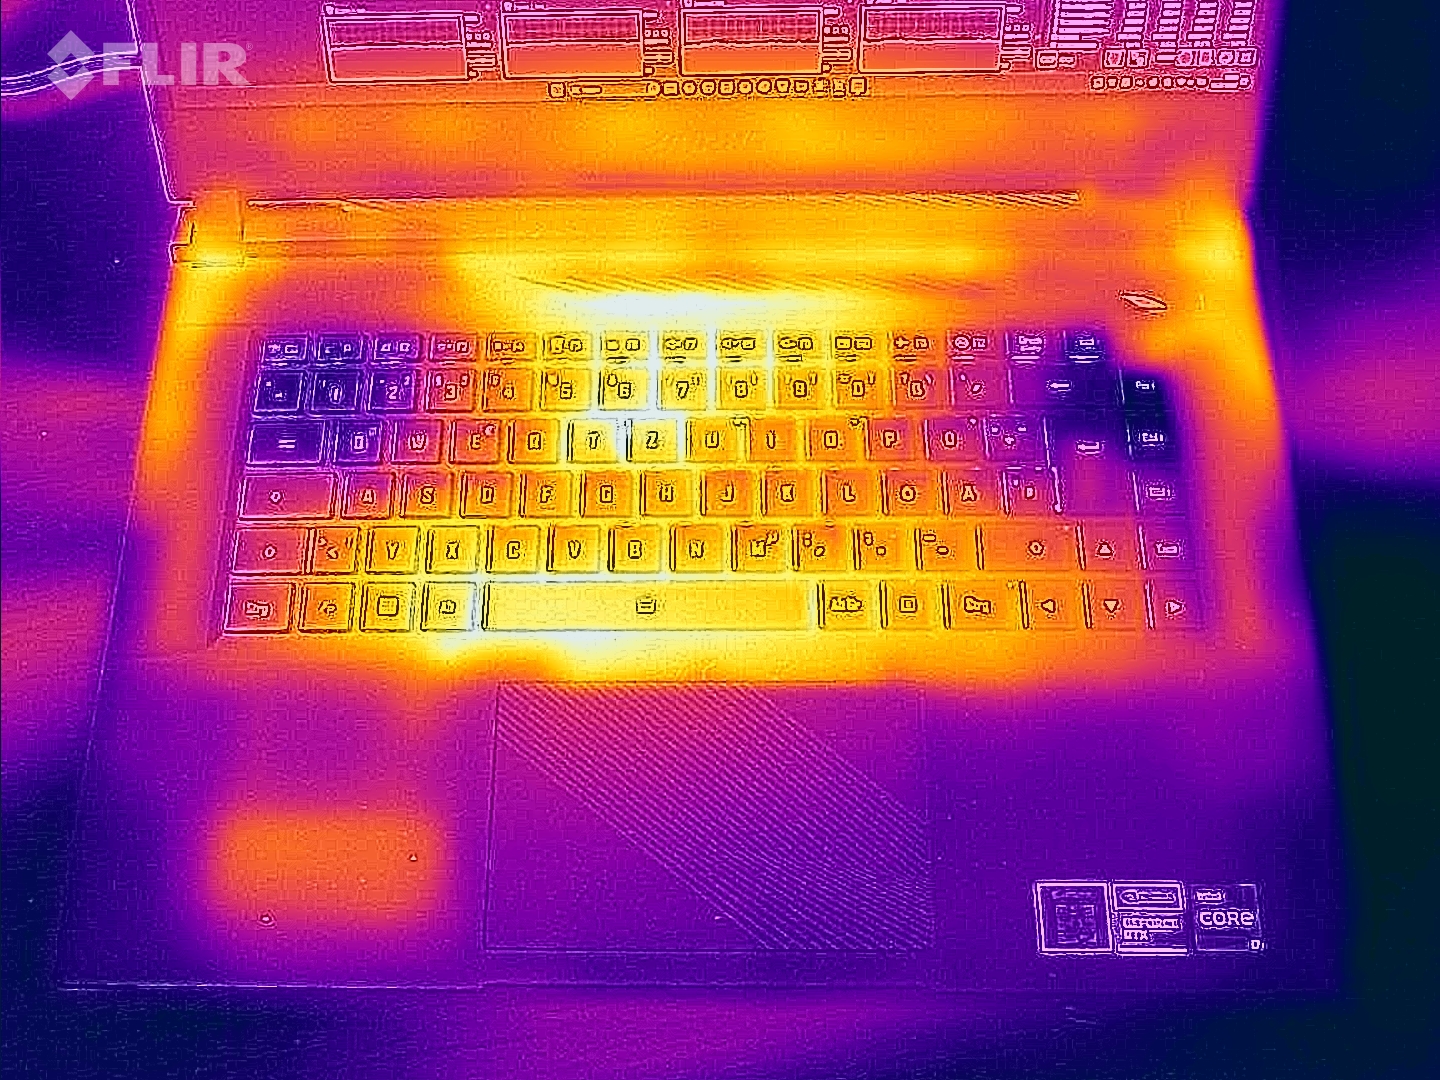
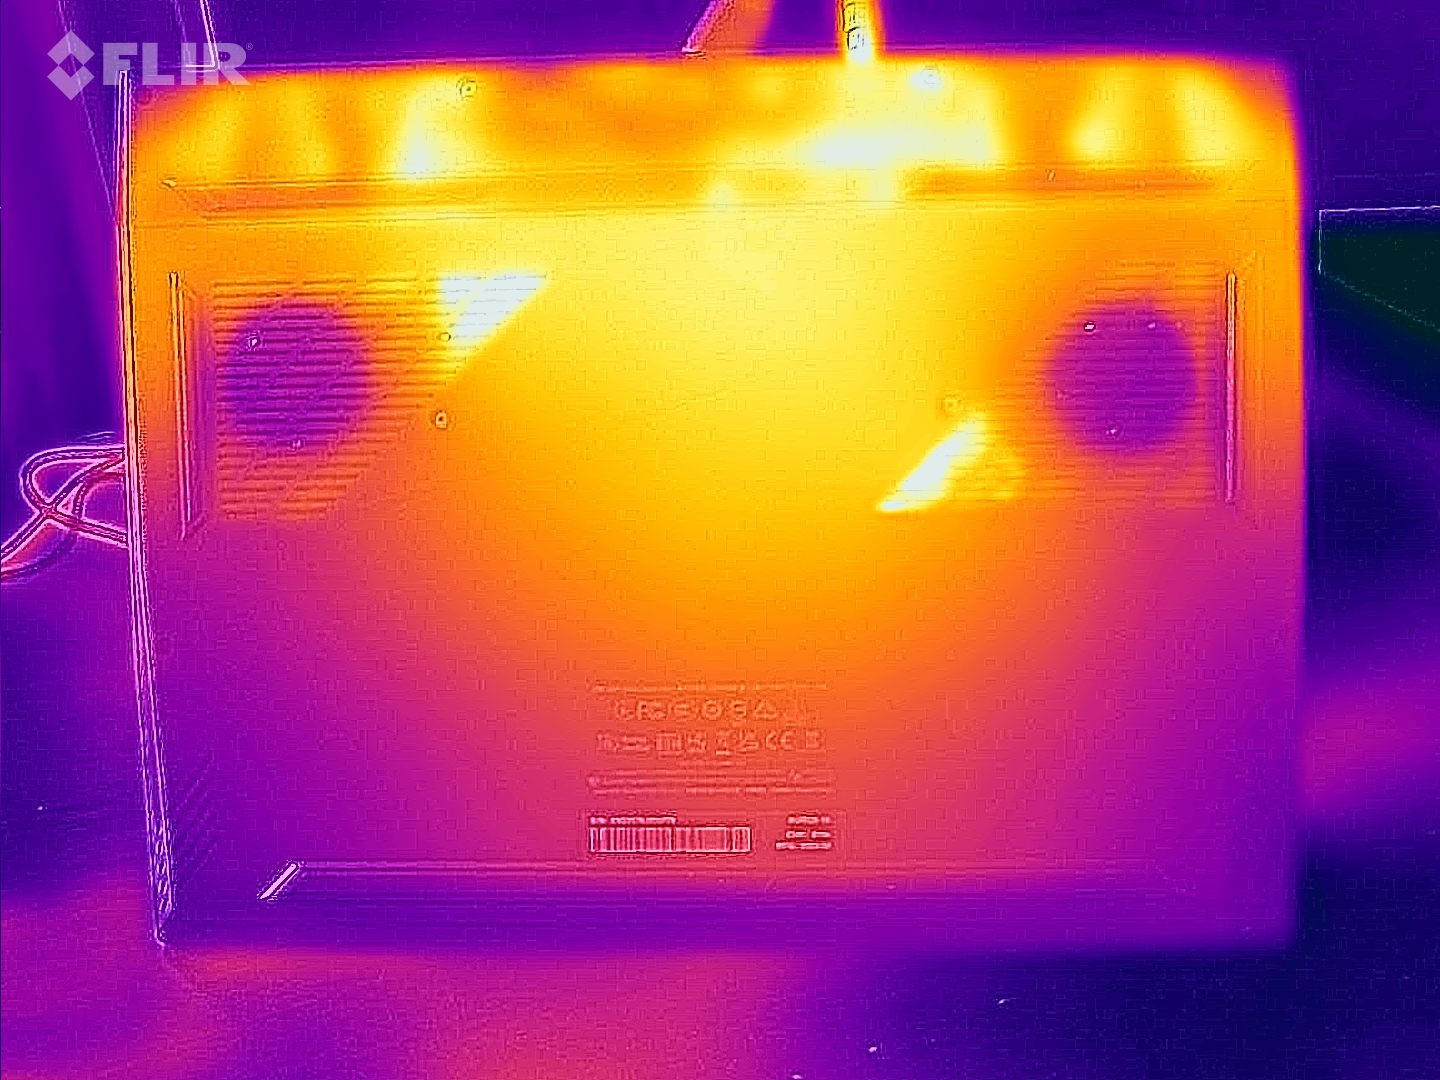
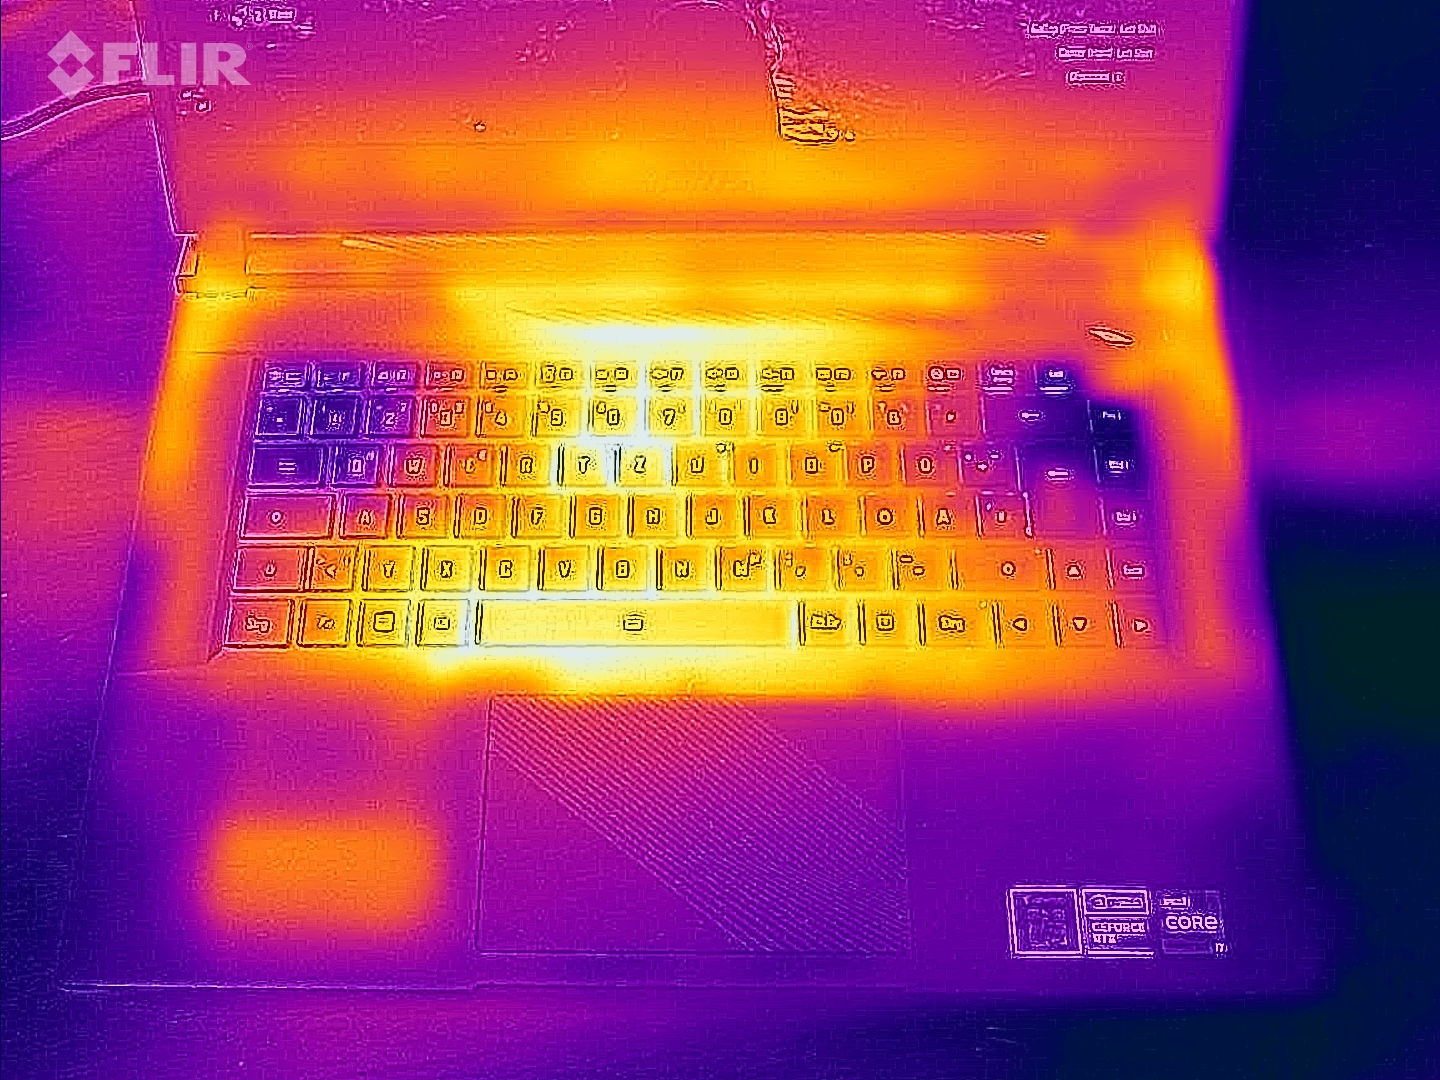
我们的压力测试和Witcher 3 测试导致笔记本电脑明显发热,但并不严重。在日常使用中(办公、上网),机箱温度一般保持在绿色区域内--与同类笔记本电脑相比,它们略微偏高。
(-) The maximum temperature on the upper side is 48 °C / 118 F, compared to the average of 40.4 °C / 105 F, ranging from 21.2 to 68.8 °C for the class Gaming.
(-) The bottom heats up to a maximum of 47 °C / 117 F, compared to the average of 43.2 °C / 110 F
(±) In idle usage, the average temperature for the upper side is 35.6 °C / 96 F, compared to the device average of 33.9 °C / 93 F.
(-) Playing The Witcher 3, the average temperature for the upper side is 41.9 °C / 107 F, compared to the device average of 33.9 °C / 93 F.
(-) The palmrests and touchpad can get very hot to the touch with a maximum of 42 °C / 107.6 F.
(-) The average temperature of the palmrest area of similar devices was 28.8 °C / 83.8 F (-13.2 °C / -23.8 F).
| Aorus 15 BSF Intel Core i7-13700H, NVIDIA GeForce RTX 4070 Laptop GPU | HP Omen Transcend 16 Intel Core i9-13900HX, NVIDIA GeForce RTX 4070 Laptop GPU | MSI Pulse 17 B13VGK Intel Core i7-13700H, NVIDIA GeForce RTX 4070 Laptop GPU | Lenovo Legion Slim 7i 16 Gen 8 Intel Core i9-13900H, NVIDIA GeForce RTX 4070 Laptop GPU | Acer Nitro 16 AN16-41 AMD Ryzen 7 7735HS, NVIDIA GeForce RTX 4070 Laptop GPU | Asus TUF Gaming A16 FA617XS AMD Ryzen 9 7940HS, AMD Radeon RX 7600S | |
|---|---|---|---|---|---|---|
| Heat | 7% | 6% | 8% | 6% | 6% | |
| Maximum Upper Side * (°C) | 48 | 47.4 1% | 48 -0% | 49.8 -4% | 41.5 14% | 53 -10% |
| Maximum Bottom * (°C) | 47 | 54.4 -16% | 50 -6% | 48.8 -4% | 51.8 -10% | 48 -2% |
| Idle Upper Side * (°C) | 39 | 28.4 27% | 30 23% | 29.4 25% | 31.6 19% | 30 23% |
| Idle Bottom * (°C) | 35 | 29.2 17% | 33 6% | 30 14% | 34.5 1% | 30 14% |
* ... smaller is better
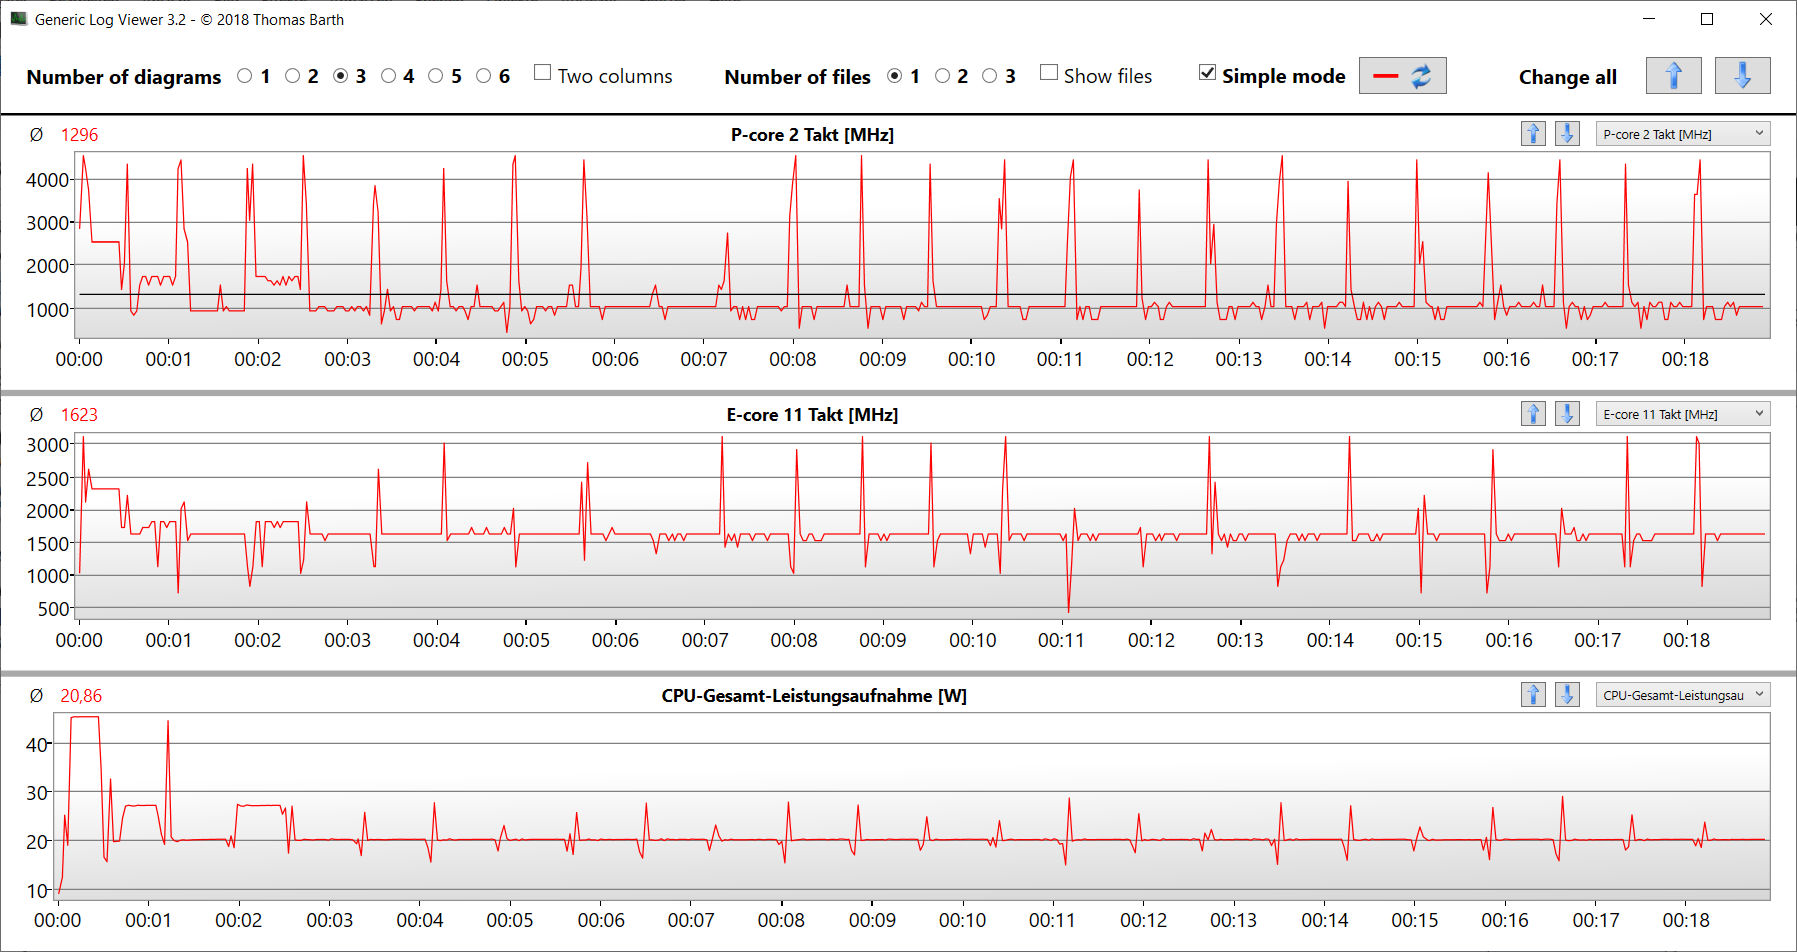
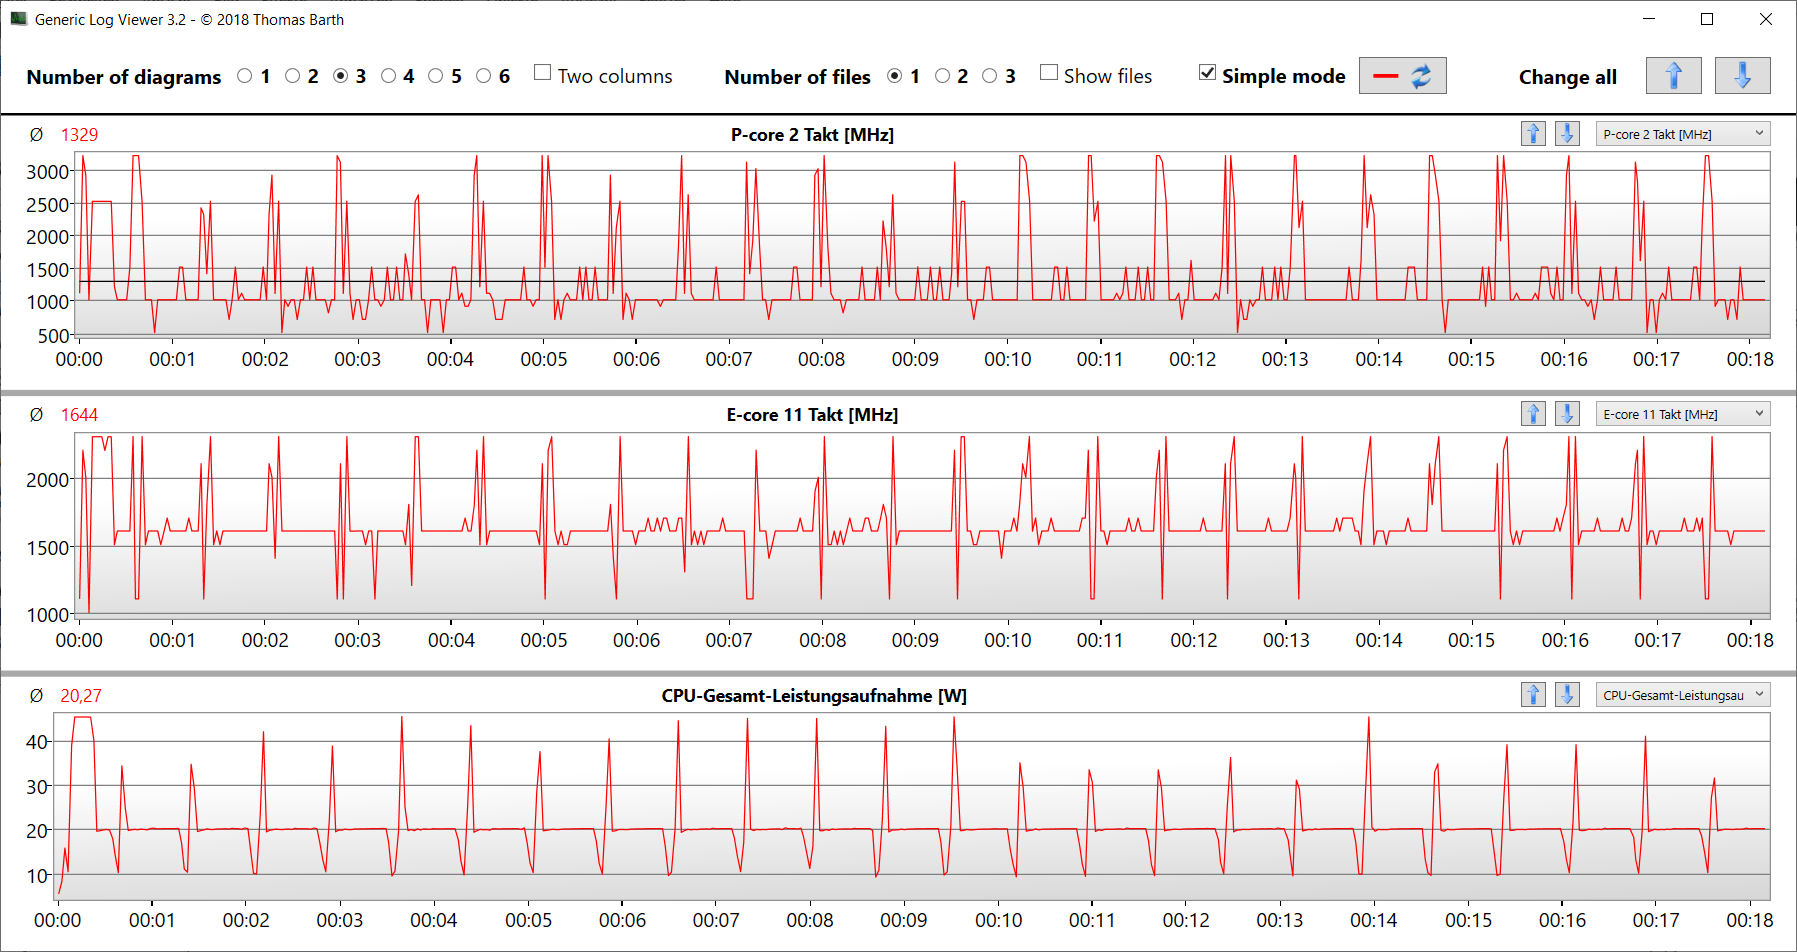
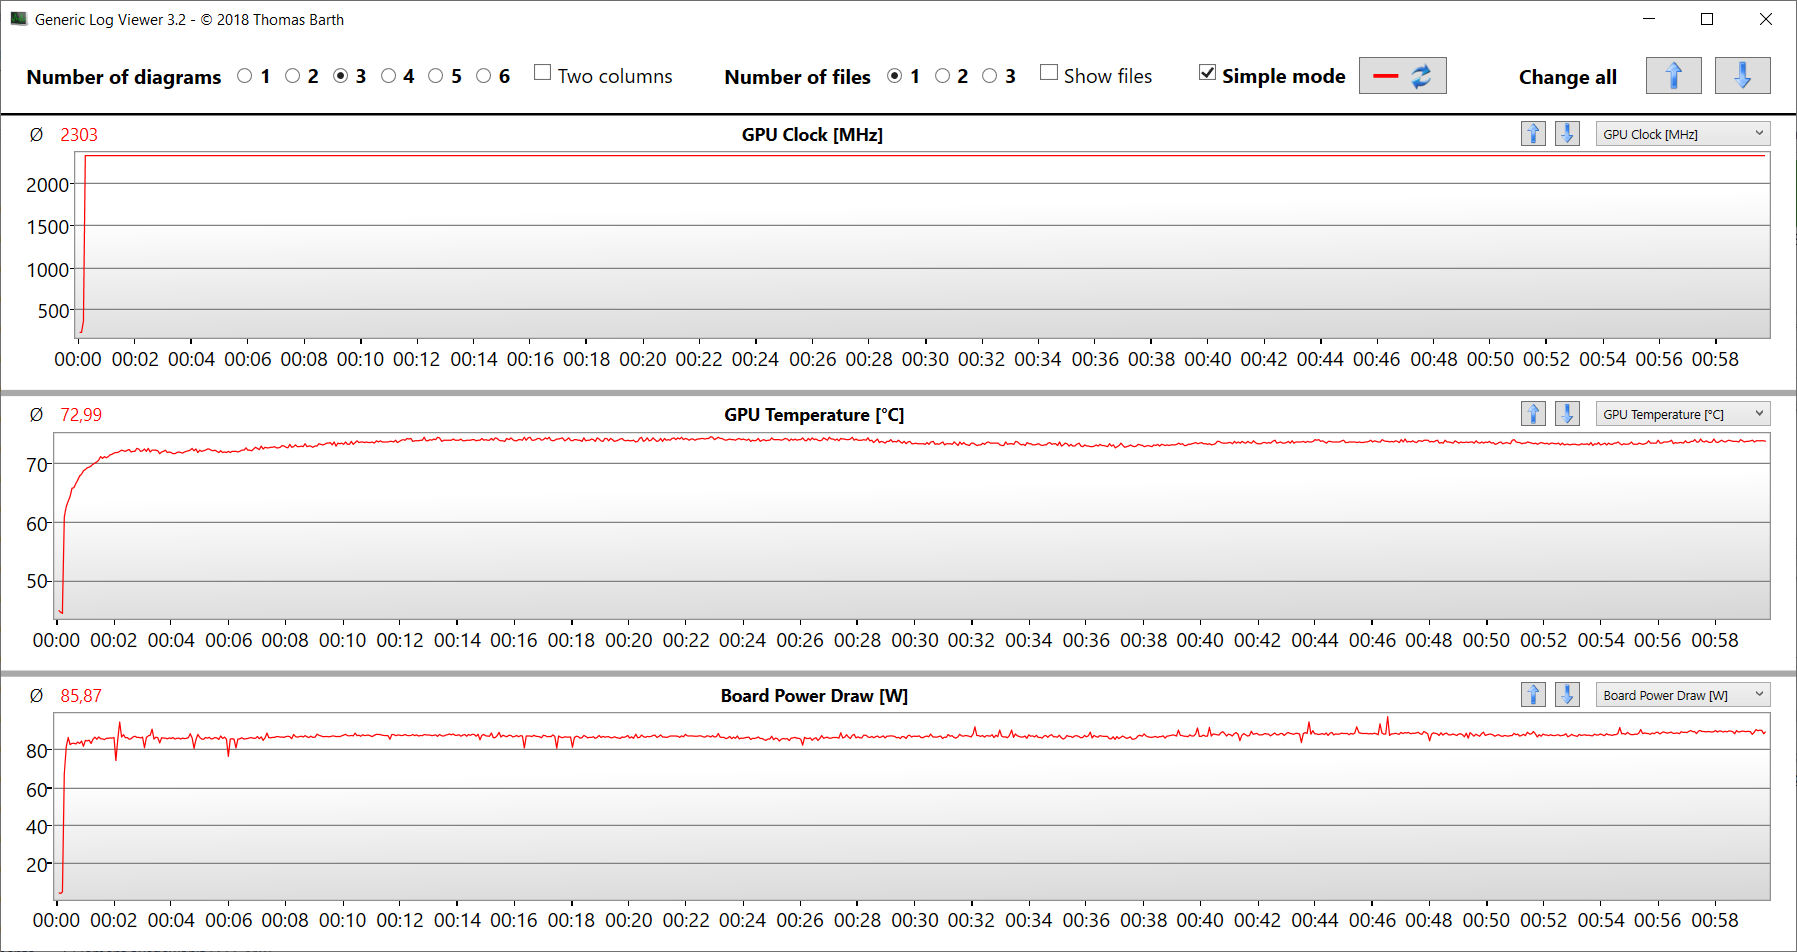
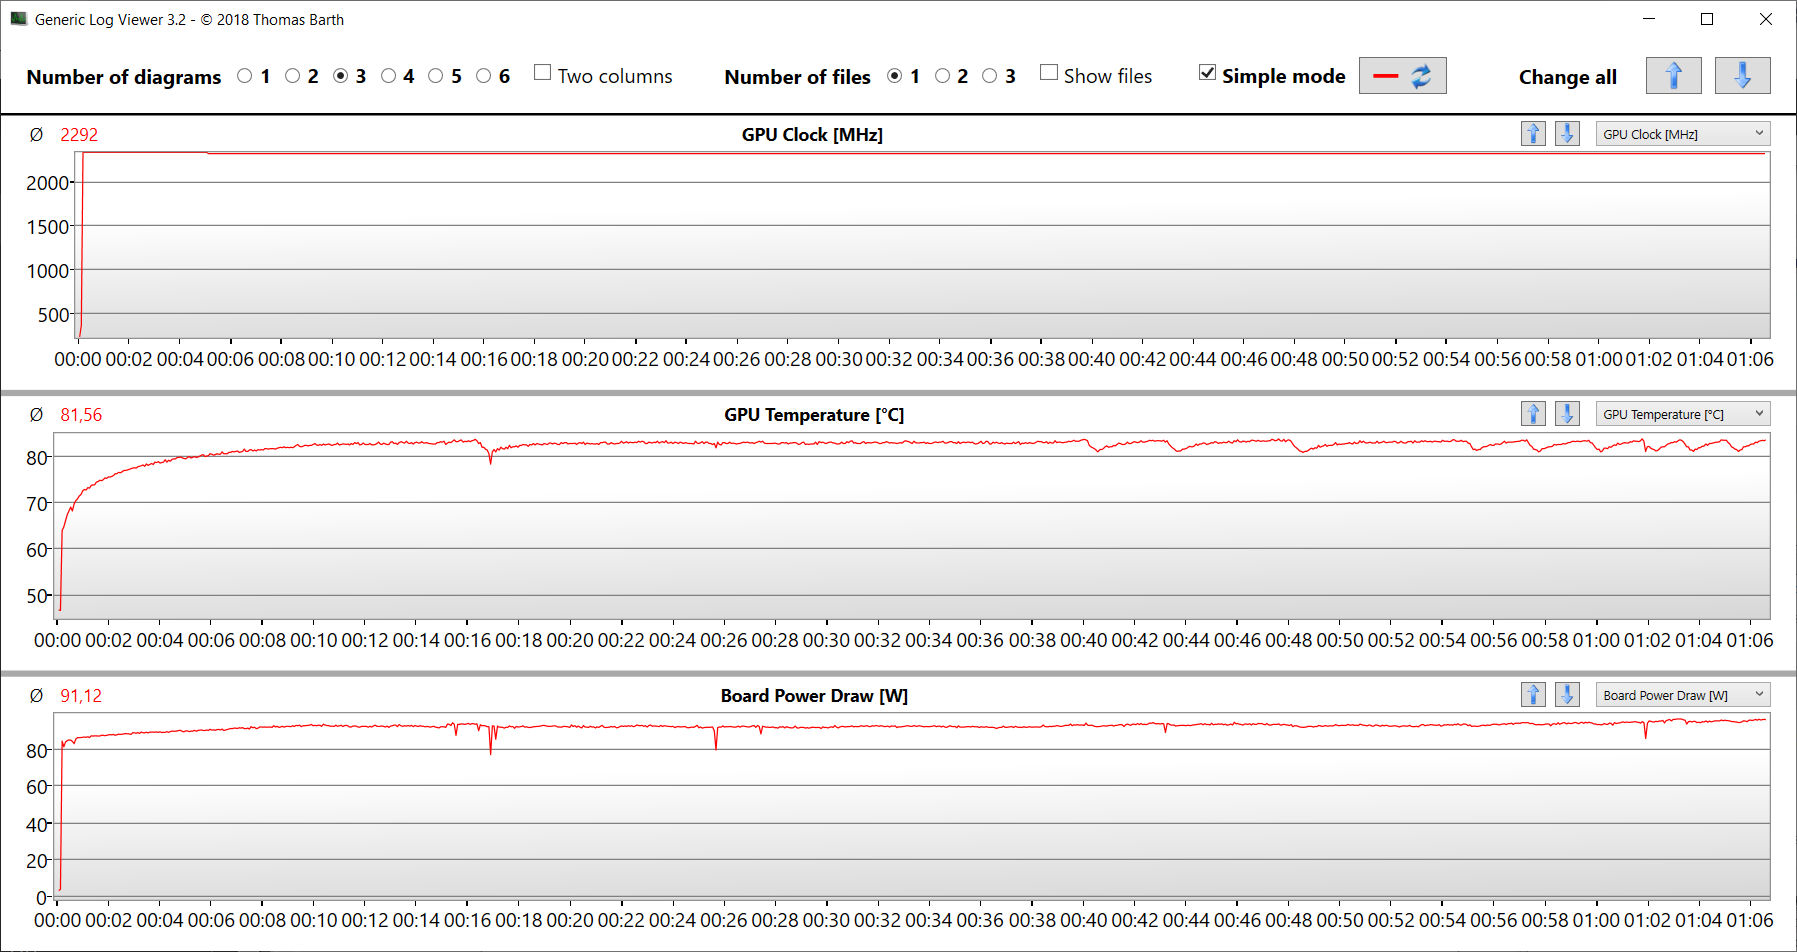
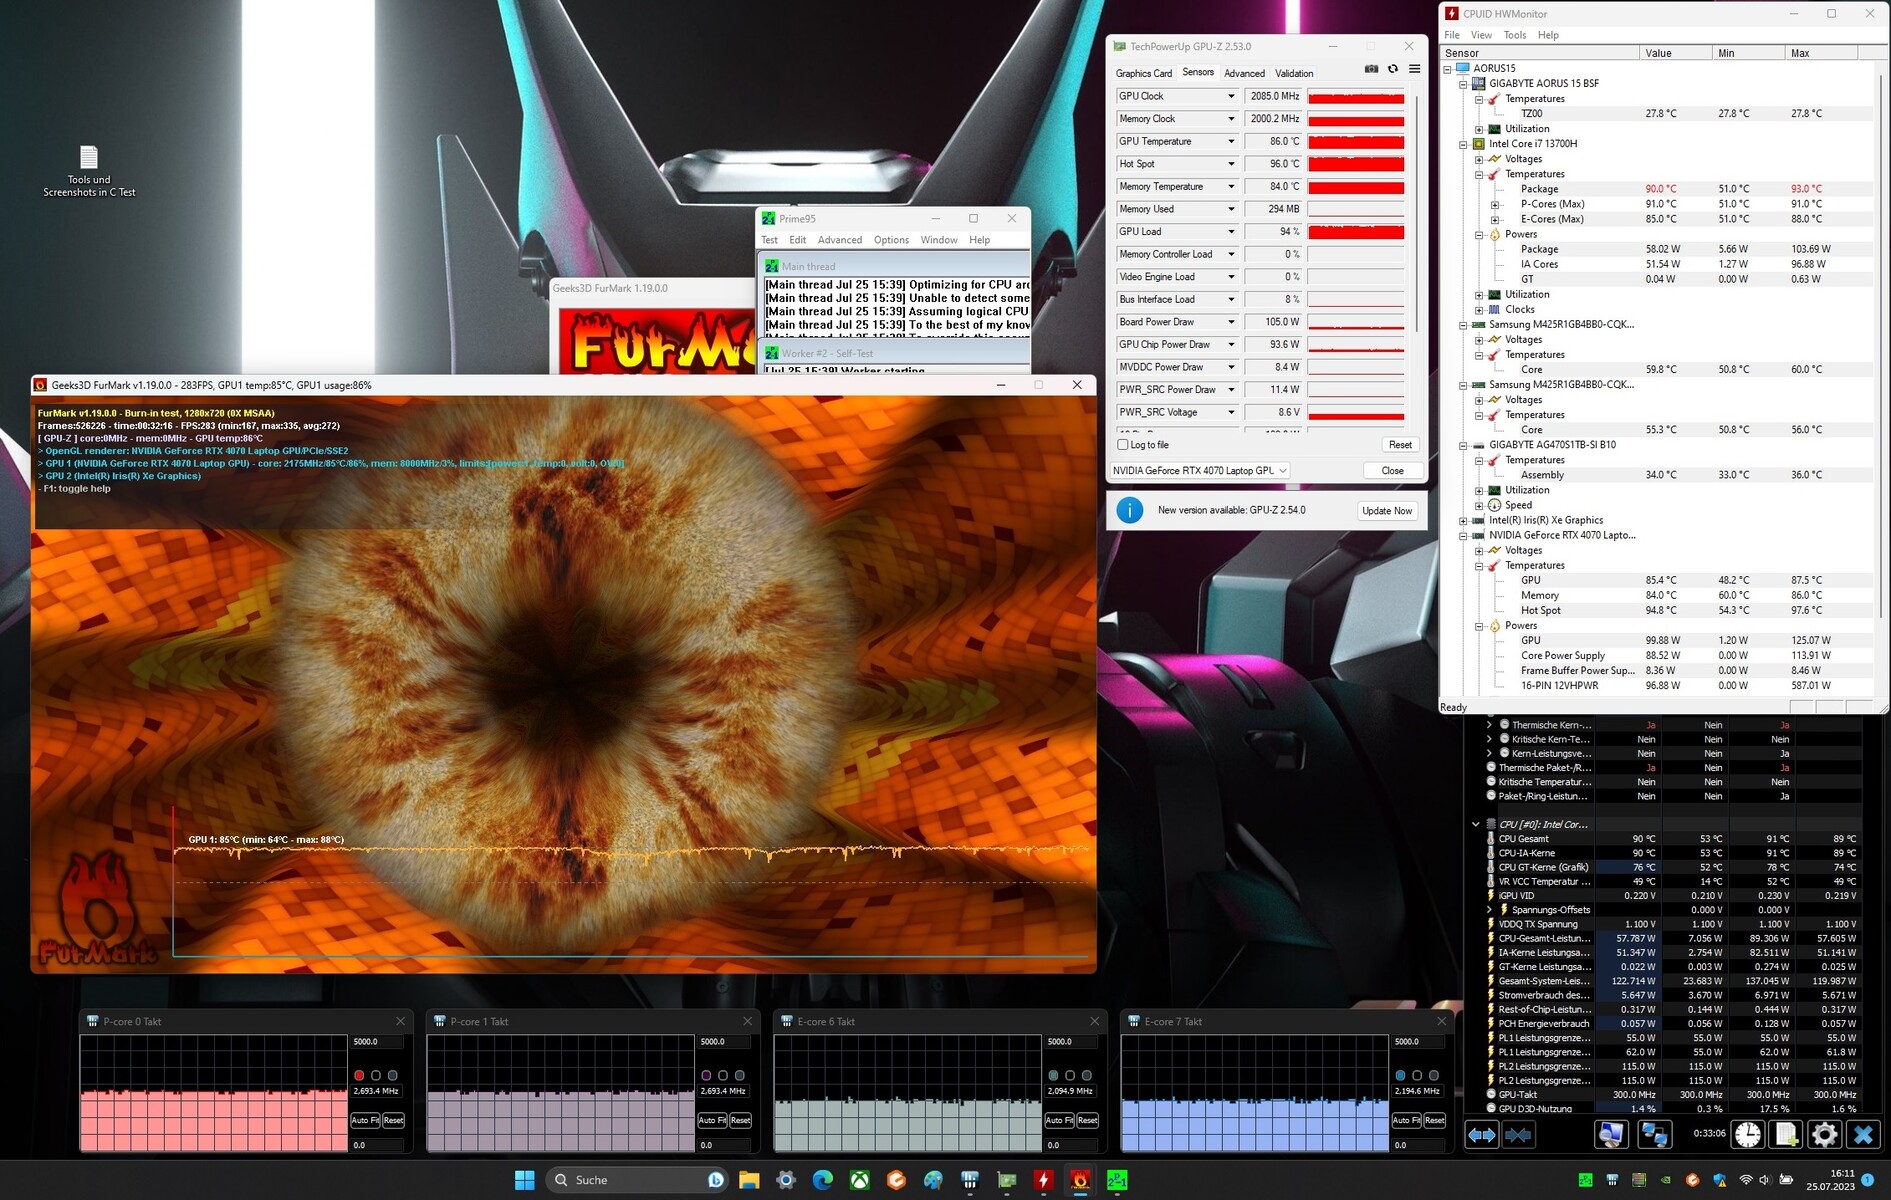
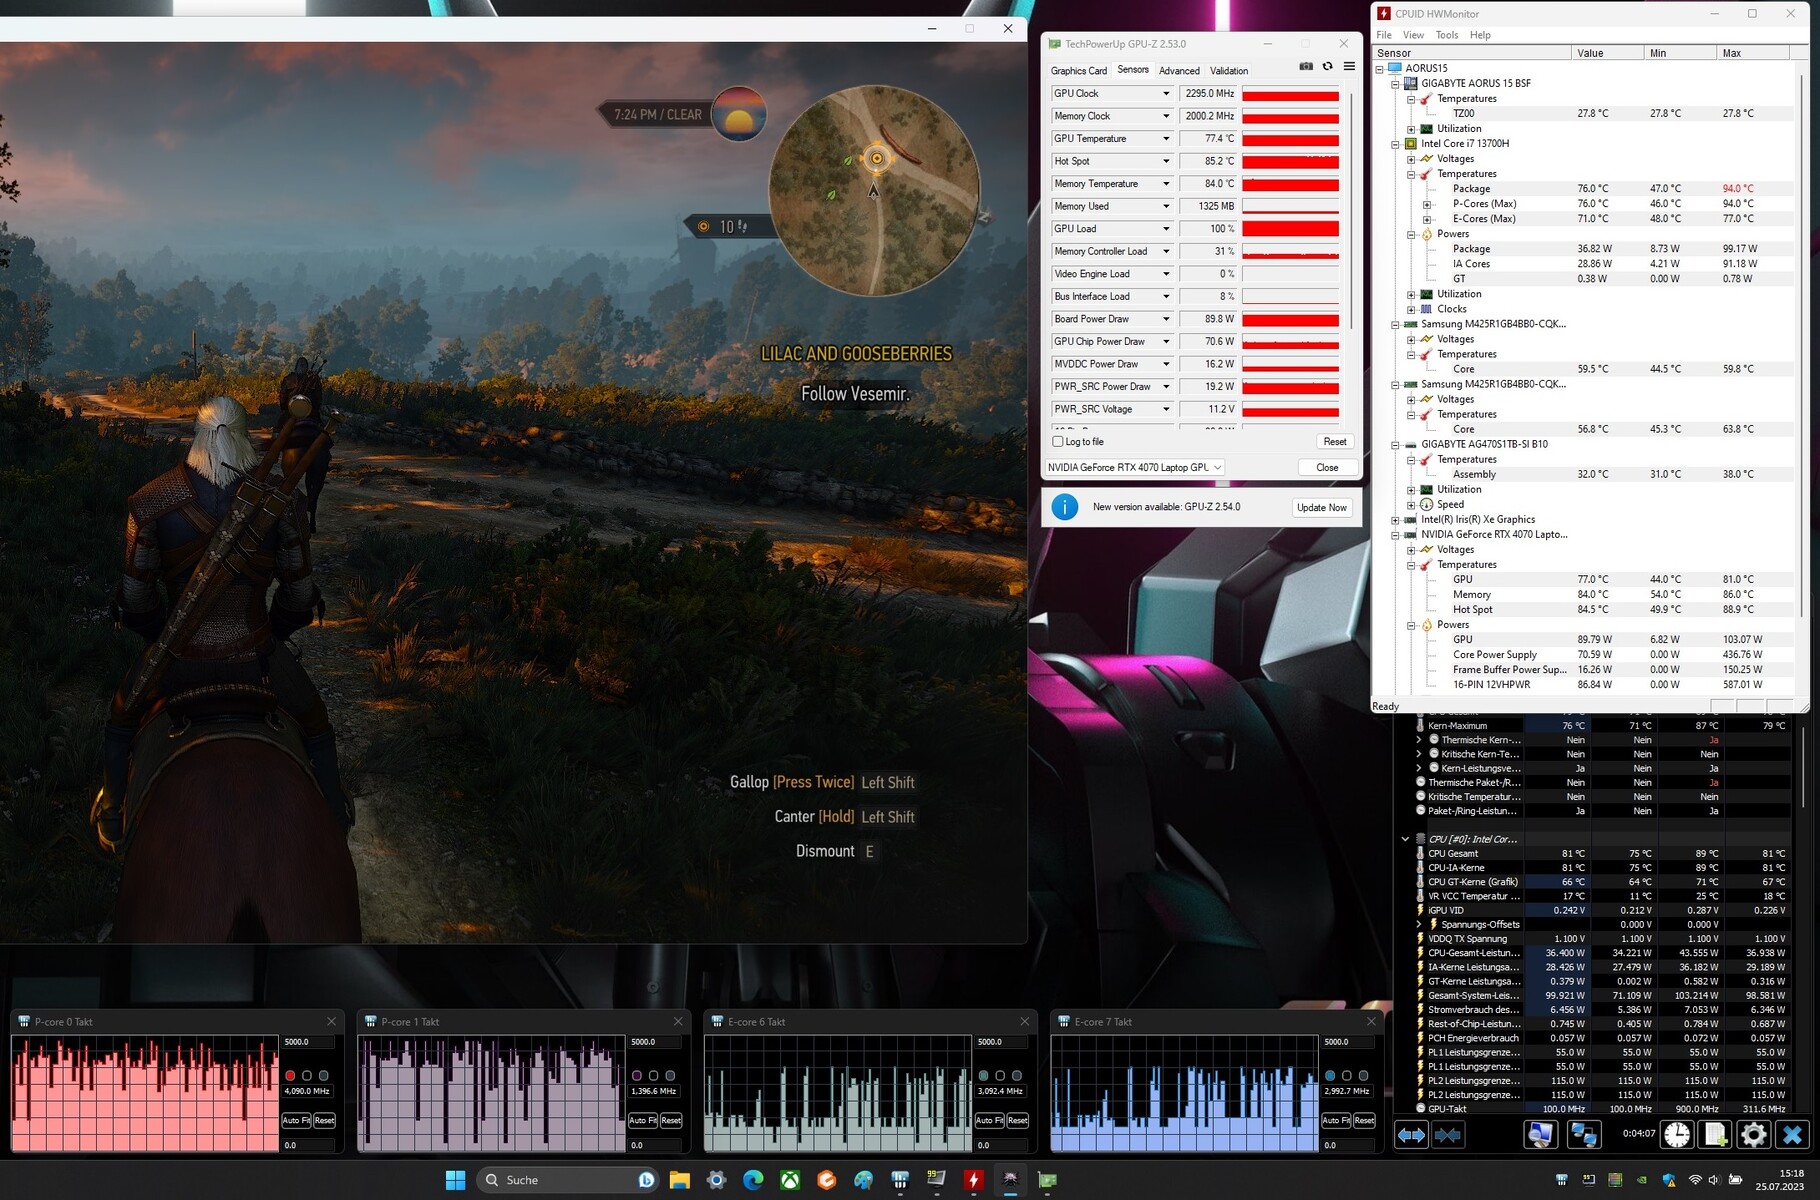
压力测试
压力测试(连续使用 Prime95 和 Furmark)创建了一个极端场景,以检查系统在满负荷情况下的稳定性。开始测试时,CPU(P:2.7 - 2.8 GHz,E:2.5 GHz)处于平均时钟速度。不久后,时钟频率降至 2.6 - 2.7 GHz(P 内核)和 2.1 - 2.2 GHz(E 内核)左右。GPU 的时钟频率从 2.3 GHz 降至 2.1 GHz。
发言人
立体声扬声器能产生不错的音效,但几乎没有低音。建议使用耳机或外置扬声器,以获得更好的音效体验。
Aorus 15 BSF audio analysis
(+) | speakers can play relatively loud (83 dB)
Bass 100 - 315 Hz
(-) | nearly no bass - on average 27.1% lower than median
(-) | bass is not linear (16% delta to prev. frequency)
Mids 400 - 2000 Hz
(+) | balanced mids - only 4.2% away from median
(+) | mids are linear (3.6% delta to prev. frequency)
Highs 2 - 16 kHz
(+) | balanced highs - only 2.8% away from median
(+) | highs are linear (6.8% delta to prev. frequency)
Overall 100 - 16.000 Hz
(±) | linearity of overall sound is average (17.3% difference to median)
Compared to same class
» 47% of all tested devices in this class were better, 12% similar, 41% worse
» The best had a delta of 6%, average was 18%, worst was 132%
Compared to all devices tested
» 32% of all tested devices were better, 8% similar, 59% worse
» The best had a delta of 4%, average was 23%, worst was 134%
Acer Nitro 16 AN16-41 audio analysis
(+) | speakers can play relatively loud (83.9 dB)
Bass 100 - 315 Hz
(-) | nearly no bass - on average 33.5% lower than median
(±) | linearity of bass is average (13.2% delta to prev. frequency)
Mids 400 - 2000 Hz
(+) | balanced mids - only 2.4% away from median
(+) | mids are linear (4.9% delta to prev. frequency)
Highs 2 - 16 kHz
(+) | balanced highs - only 3.6% away from median
(+) | highs are linear (4.2% delta to prev. frequency)
Overall 100 - 16.000 Hz
(±) | linearity of overall sound is average (19.6% difference to median)
Compared to same class
» 68% of all tested devices in this class were better, 6% similar, 25% worse
» The best had a delta of 6%, average was 18%, worst was 132%
Compared to all devices tested
» 49% of all tested devices were better, 7% similar, 44% worse
» The best had a delta of 4%, average was 23%, worst was 134%
电源管理 - 技嘉电脑并不缺乏耐用性
耗电量
技嘉笔记本电脑在功耗方面没有任何问题。对于所安装的硬件而言,耗电量处于正常水平。测试 Witcher 3测试和压力测试时,耗电量相对稳定。电源(240 瓦)的功率足够大。
| Off / Standby | |
| Idle | |
| Load |
|
Key:
min: | |
| Aorus 15 BSF i7-13700H, GeForce RTX 4070 Laptop GPU | HP Omen Transcend 16 i9-13900HX, GeForce RTX 4070 Laptop GPU | MSI Pulse 17 B13VGK i7-13700H, GeForce RTX 4070 Laptop GPU | Lenovo Legion Slim 7i 16 Gen 8 i9-13900H, GeForce RTX 4070 Laptop GPU | Acer Nitro 16 AN16-41 R7 7735HS, GeForce RTX 4070 Laptop GPU | Asus TUF Gaming A16 FA617XS R9 7940HS, Radeon RX 7600S | Average of class Gaming | |
|---|---|---|---|---|---|---|---|
| Power Consumption | -85% | 15% | -74% | -19% | 15% | -38% | |
| Idle Minimum * (Watt) | 7 | 19.2 -174% | 9 -29% | 22 -214% | 11.6 -66% | 7 -0% | 13 ? -86% |
| Idle Average * (Watt) | 12 | 22.7 -89% | 10.2 15% | 29 -142% | 15.6 -30% | 10 17% | 19 ? -58% |
| Idle Maximum * (Watt) | 20 | 55.4 -177% | 10.8 46% | 39.5 -98% | 16.5 17% | 15 25% | 24.6 ? -23% |
| Load Average * (Watt) | 94 | 128.4 -37% | 72 23% | 98.7 -5% | 155 -65% | 86 9% | 110.7 ? -18% |
| Witcher 3 ultra * (Watt) | 175.8 | 206 -17% | 130 26% | 171.8 2% | 154.8 12% | 160.6 9% | |
| Load Maximum * (Watt) | 247 | 292 -18% | 221 11% | 213.2 14% | 205 17% | 172 30% | 259 ? -5% |
* ... smaller is better
Power consumption Witcher 3 / stress test
Power consumption with external monitor
电池寿命
在 WLAN 测试(通过脚本调用网站)和视频测试(循环播放短片 Big Buck Bunny(H.264 编码,FHD))中,这款 15.6 英寸设备的运行时间分别为 10:19 小时和 9:01 小时。在这两项测试中,笔记本电脑的节能功能被禁用,显示屏亮度被调至约 150 cd/m²。在视频测试中,无线模块也被禁用。
该设备的运行时间非常出色。尽管电池容量相似,但许多竞争对手都远远落后于 Aorus 15。Aorus 笔记本电脑仍然无法接近华硕 TUF Gaming A16的惊人成绩。华硕电脑得益于其更为节俭的 AMD APU。
| Aorus 15 BSF i7-13700H, GeForce RTX 4070 Laptop GPU, 99 Wh | HP Omen Transcend 16 i9-13900HX, GeForce RTX 4070 Laptop GPU, 97 Wh | MSI Pulse 17 B13VGK i7-13700H, GeForce RTX 4070 Laptop GPU, 90 Wh | Lenovo Legion Slim 7i 16 Gen 8 i9-13900H, GeForce RTX 4070 Laptop GPU, 99.9 Wh | Acer Nitro 16 AN16-41 R7 7735HS, GeForce RTX 4070 Laptop GPU, 90 Wh | Asus TUF Gaming A16 FA617XS R9 7940HS, Radeon RX 7600S, 90 Wh | Average of class Gaming | |
|---|---|---|---|---|---|---|---|
| Battery runtime | -49% | -7% | -56% | -2% | 21% | -24% | |
| Reader / Idle (h) | 10.9 | 6.3 -42% | 5.1 -53% | 12.2 12% | 20.3 86% | 8.27 ? -24% | |
| H.264 (h) | 9 | 10.2 13% | 12.4 38% | 8.32 ? -8% | |||
| WiFi v1.3 (h) | 10.3 | 4.2 -59% | 9 -13% | 4.4 -57% | 9 -13% | 12.4 20% | 7.11 ? -31% |
| Load (h) | 2.2 | 1.2 -45% | 2.2 0% | 0.9 -59% | 1.8 -18% | 0.9 -59% | 1.502 ? -32% |
Pros
Cons
结论:QHD 游戏笔记本电脑物有所值
Aorus 15 专为 QHD 游戏(高至最高设置)而设计,但在其他领域(视频编辑、渲染)也同样出色。它的酷睿 i7-13700H和GeForce RTX 4070提供了必要的性能。这两款芯片的运行时钟频率始终保持在较高水平。快速 PCIe 4 SSD(1 TB)可提供所需的存储空间,并确保缩短加载时间。
技嘉 Aorus 15 BSF 是一款出色、全面的中端游戏笔记本电脑。
噪音和发热量符合这个价位的预期水平。降低噪音可能会牺牲笔记本电脑的部分性能。它的哑光 IPS 面板(15.6 英寸、2560 x 1440 像素、165 Hz、DCI P3)总体上给人留下了良好的印象。不过,其亮度和对比度还可以更好一些。
电池充满电(99 瓦时)后,实际运行时间约为 9 至 10 小时,这是一个非常不错的结果。优点电池可通过 USB-C 线缆充电(最小 65 瓦,20 V)--其 USB-C 端口(雷电 4)支持 Power Delivery。这意味着笨重的专有电源连接器(240 瓦)不必总是与设备一起运输。
这款笔记本电脑的替代品可能是华硕 TUF Gaming A16 FA617XS它的 CPU 性能更好,采用 16:10 显示屏,运行时间更长。在图形性能方面,它与 Aorus 15 相比略显劣势。
价格和供应情况
我们测试的 Aorus 15 BSF 版本在亚马逊上的售价为 1,699 美元。
Aorus 15 BSF
- 08/12/2023 v7 (old)
Sascha Mölck
Transparency
The selection of devices to be reviewed is made by our editorial team. The test sample was provided to the author as a loan by the manufacturer or retailer for the purpose of this review. The lender had no influence on this review, nor did the manufacturer receive a copy of this review before publication. There was no obligation to publish this review. As an independent media company, Notebookcheck is not subjected to the authority of manufacturers, retailers or publishers.
This is how Notebookcheck is testing
Every year, Notebookcheck independently reviews hundreds of laptops and smartphones using standardized procedures to ensure that all results are comparable. We have continuously developed our test methods for around 20 years and set industry standards in the process. In our test labs, high-quality measuring equipment is utilized by experienced technicians and editors. These tests involve a multi-stage validation process. Our complex rating system is based on hundreds of well-founded measurements and benchmarks, which maintains objectivity. Further information on our test methods can be found here.
Price comparison

