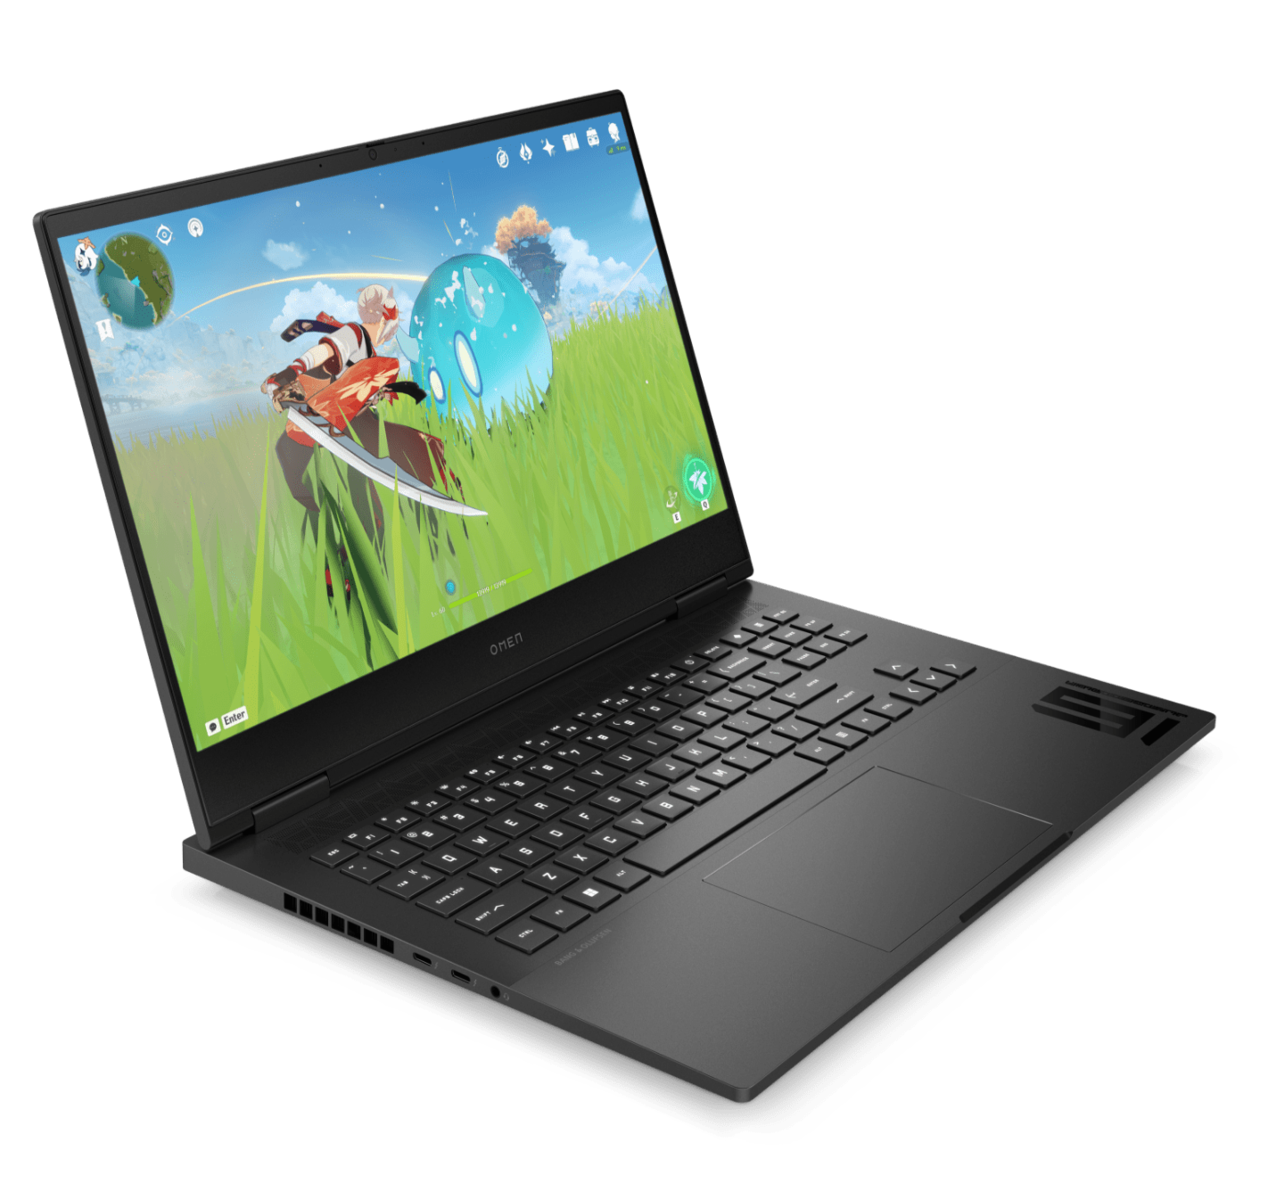
惠普 Omen Transcend 16 笔记本电脑评测:不仅仅是名称上的细微差别

Omen Transcend 16 是标准 Omen 16 的变体。虽然它们采用了类似的机箱设计和材料,但 Omen Transcend 16 拥有几个重要的不同点,潜在买家应该了解这些不同点。
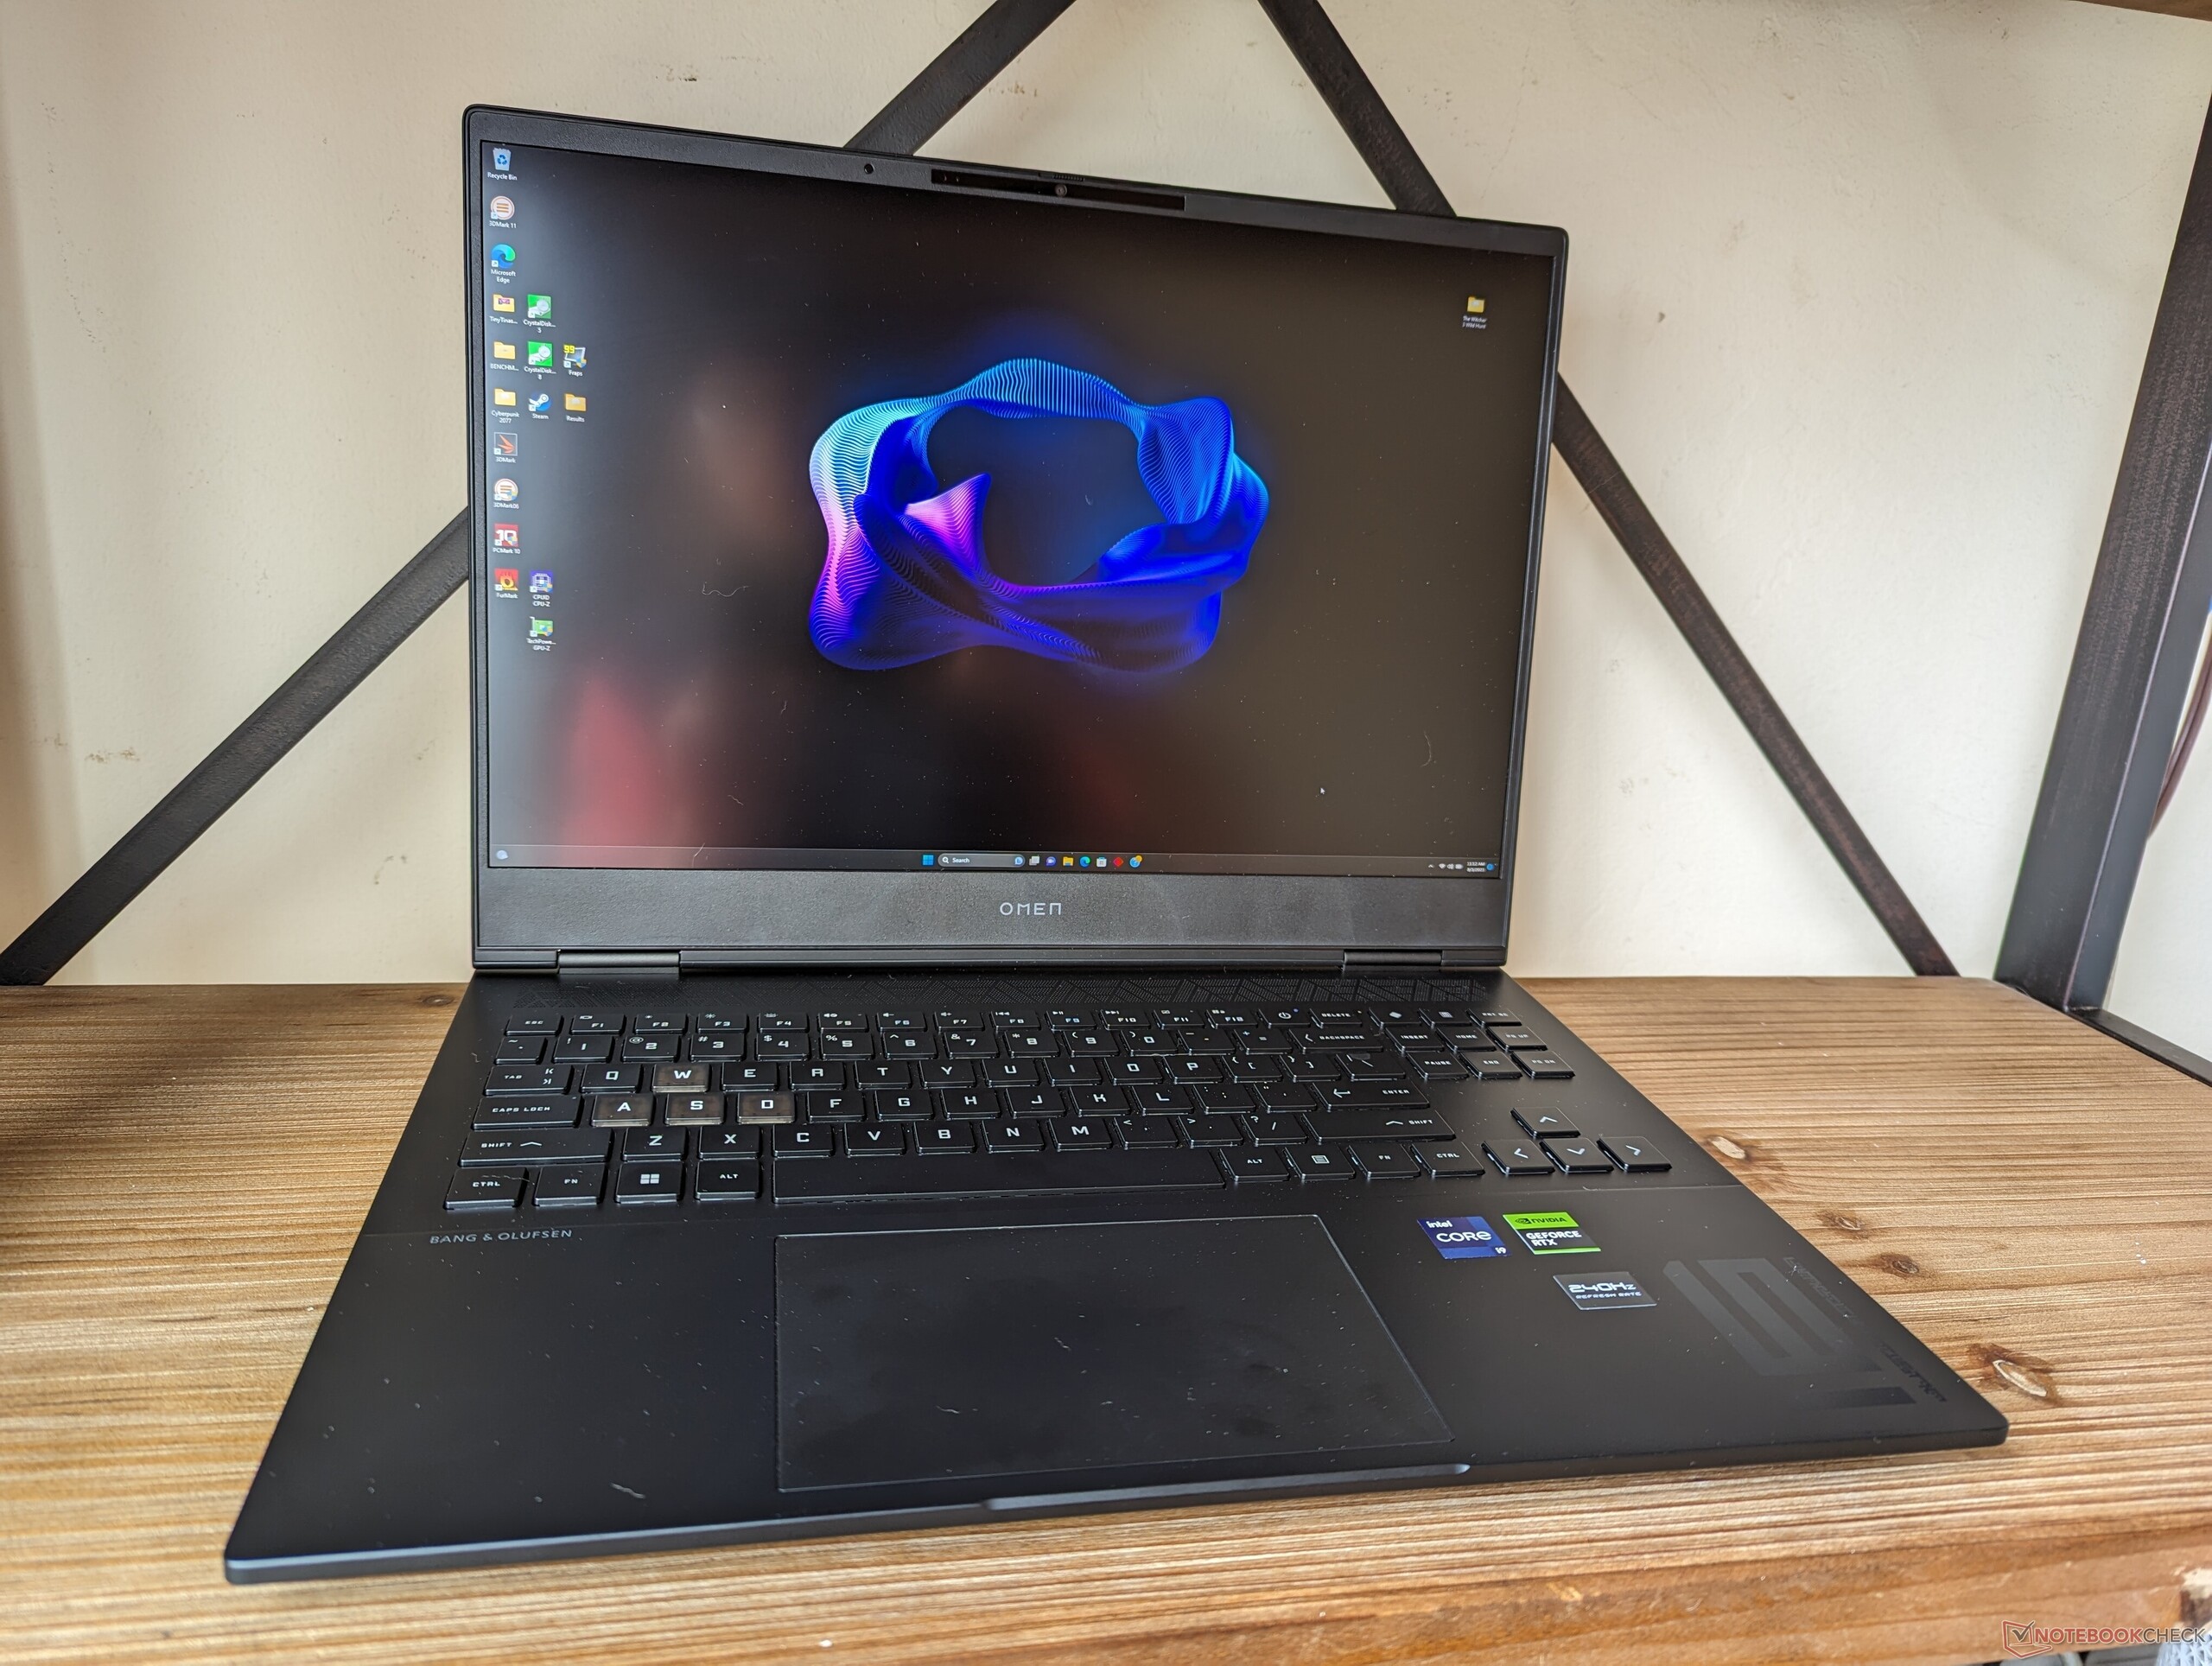
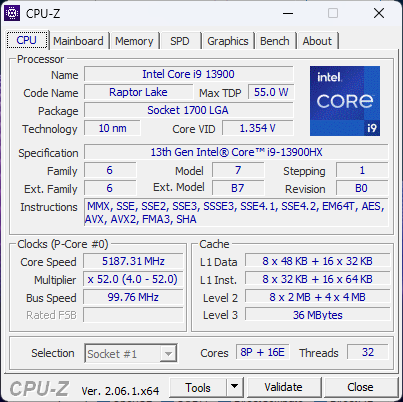
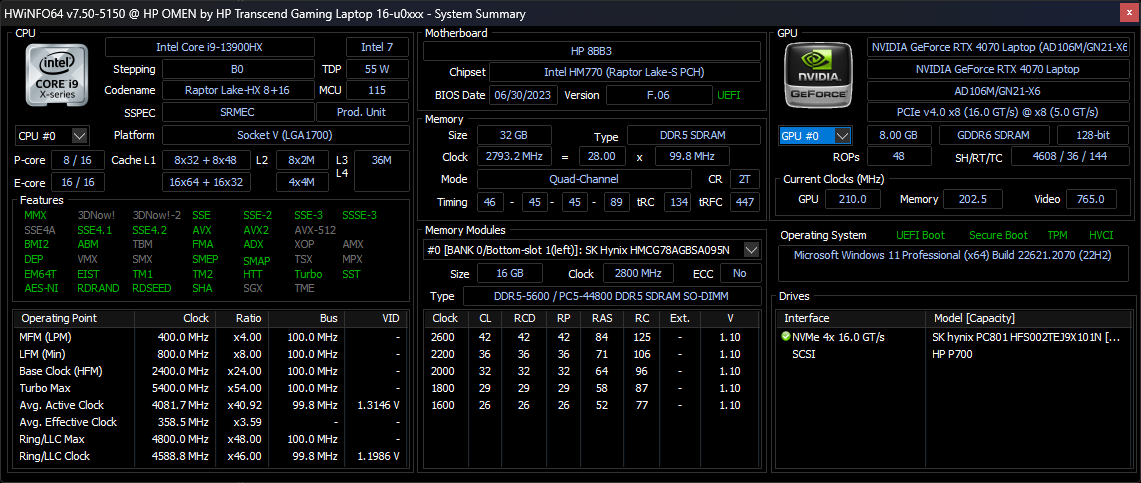
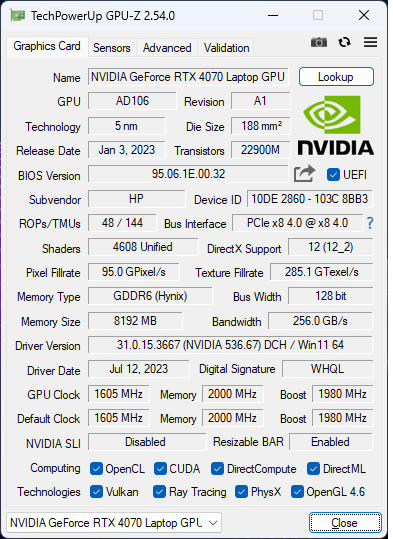
我们的评测机是最高配置,配备第 13 代 Raptor Lake Core i9-13900HX CPU、130 WGeForce RTX 4070 GPU 和 QHD+ (2560 x 1600) 240 Hz mini-LED 显示屏,全 DCI-P3 色彩,零售价约为 2500 美元。配置较低的 SKU 有酷睿 i7-13700HX、RTX 4050 GPU 和 165 Hz 1200p IPS,零售价约为 1250 美元。
该领域的竞争对手包括其他高端 16 英寸游戏笔记本电脑,如联想Legion Slim 7i 16 G8 ,宏碁 Nitro 16 ,Alienware x16 R1 ,或华硕 ROG Zephyrus M16 。
更多惠普评论:
潜在的竞争对手比较
Rating | Date | Model | Weight | Height | Size | Resolution | Price |
|---|---|---|---|---|---|---|---|
| 87.9 % v7 (old) | 08 / 2023 | HP Omen Transcend 16 i9-13900HX, GeForce RTX 4070 Laptop GPU | 2.3 kg | 19.8 mm | 16.00" | 2560x1600 | |
| 90 % v7 (old) | 07 / 2023 | Lenovo Legion Slim 7i 16 Gen 8 i9-13900H, GeForce RTX 4070 Laptop GPU | 2.1 kg | 19.9 mm | 16.00" | 2560x1600 | |
| 87.4 % v7 (old) | 07 / 2023 | HP Omen 16-wf000 i7-13700HX, GeForce RTX 4080 Laptop GPU | 2.4 kg | 23.6 mm | 16.10" | 2560x1440 | |
| 88.4 % v7 (old) | 06 / 2023 | Alienware x16 R1 i9-13900HK, GeForce RTX 4080 Laptop GPU | 2.6 kg | 18.57 mm | 16.00" | 2560x1600 | |
| 88.1 % v7 (old) | 06 / 2023 | Acer Nitro 16 AN16-41 R7 7735HS, GeForce RTX 4070 Laptop GPU | 2.7 kg | 27.9 mm | 16.00" | 2560x1600 | |
| 87.8 % v7 (old) | 02 / 2023 | Asus ROG Zephyrus M16 GU603Z i9-12900H, GeForce RTX 3070 Ti Laptop GPU | 2.1 kg | 19.9 mm | 16.00" | 2560x1600 |
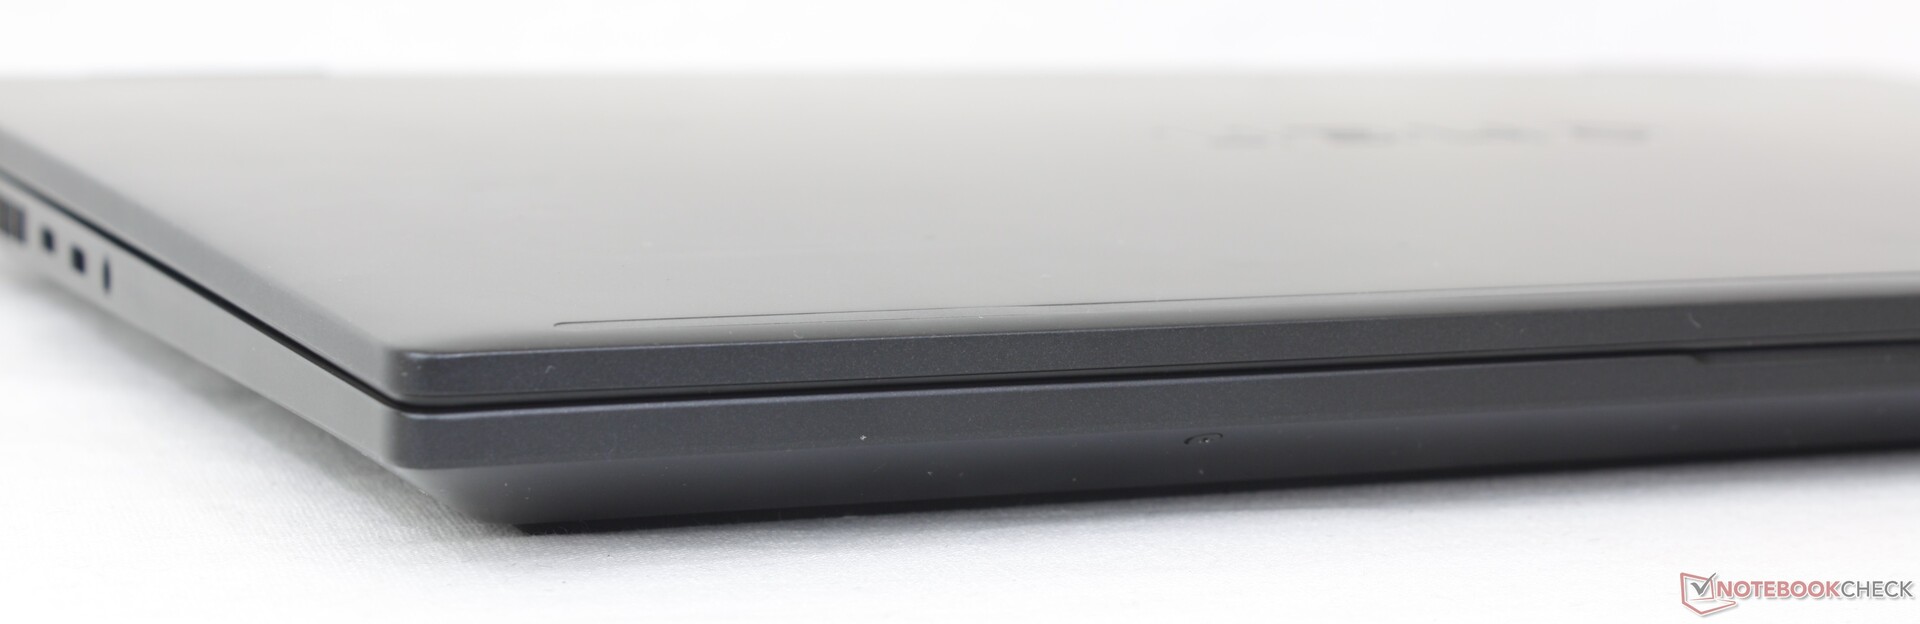
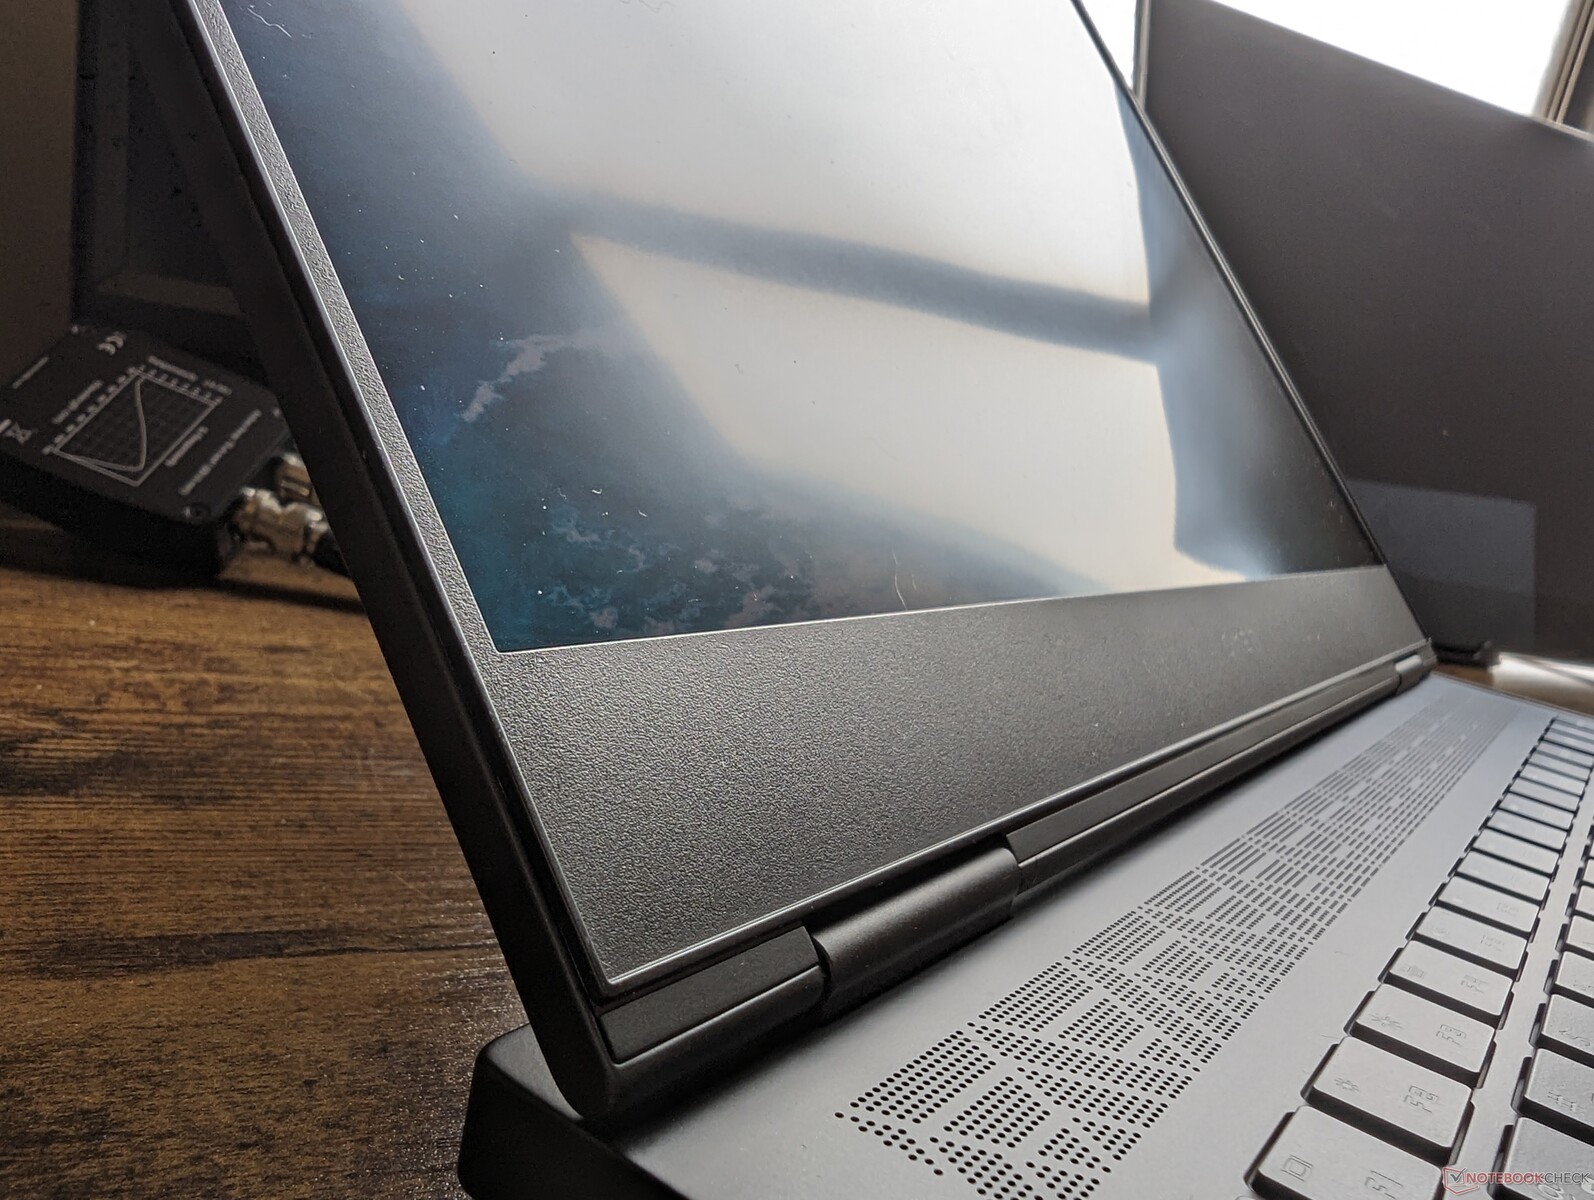
外壳 - 相同的材料,不同的尺寸
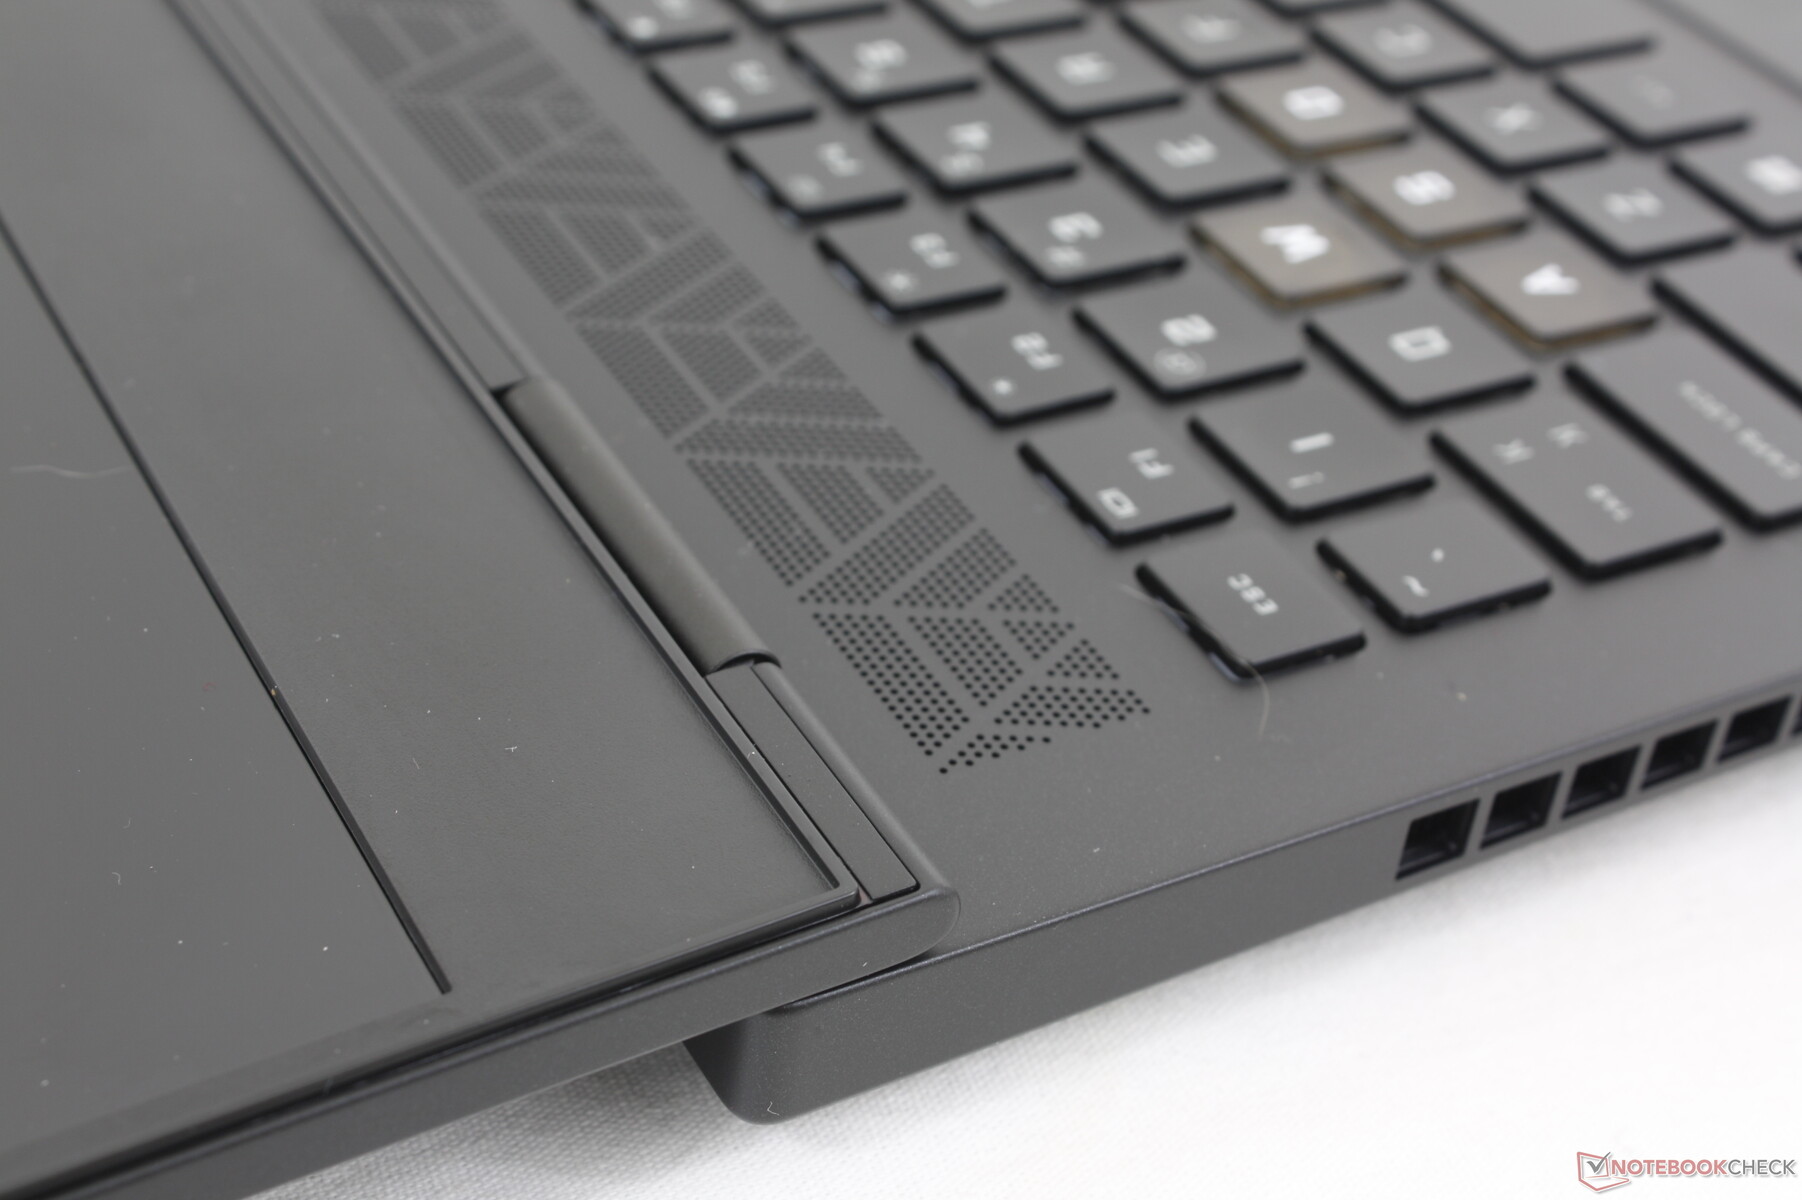
Omen 16 和 Omen Transcend 16 最大的外部差异之一是从 16:9 改为 16:10,因此它们的占地面积略有不同。除此之外,两款机型的金属材质和纹理都很相似。值得注意的是,尽管长宽比发生了变化,但屏幕底部边缘的边框并不比普通的 Omen 16 窄。
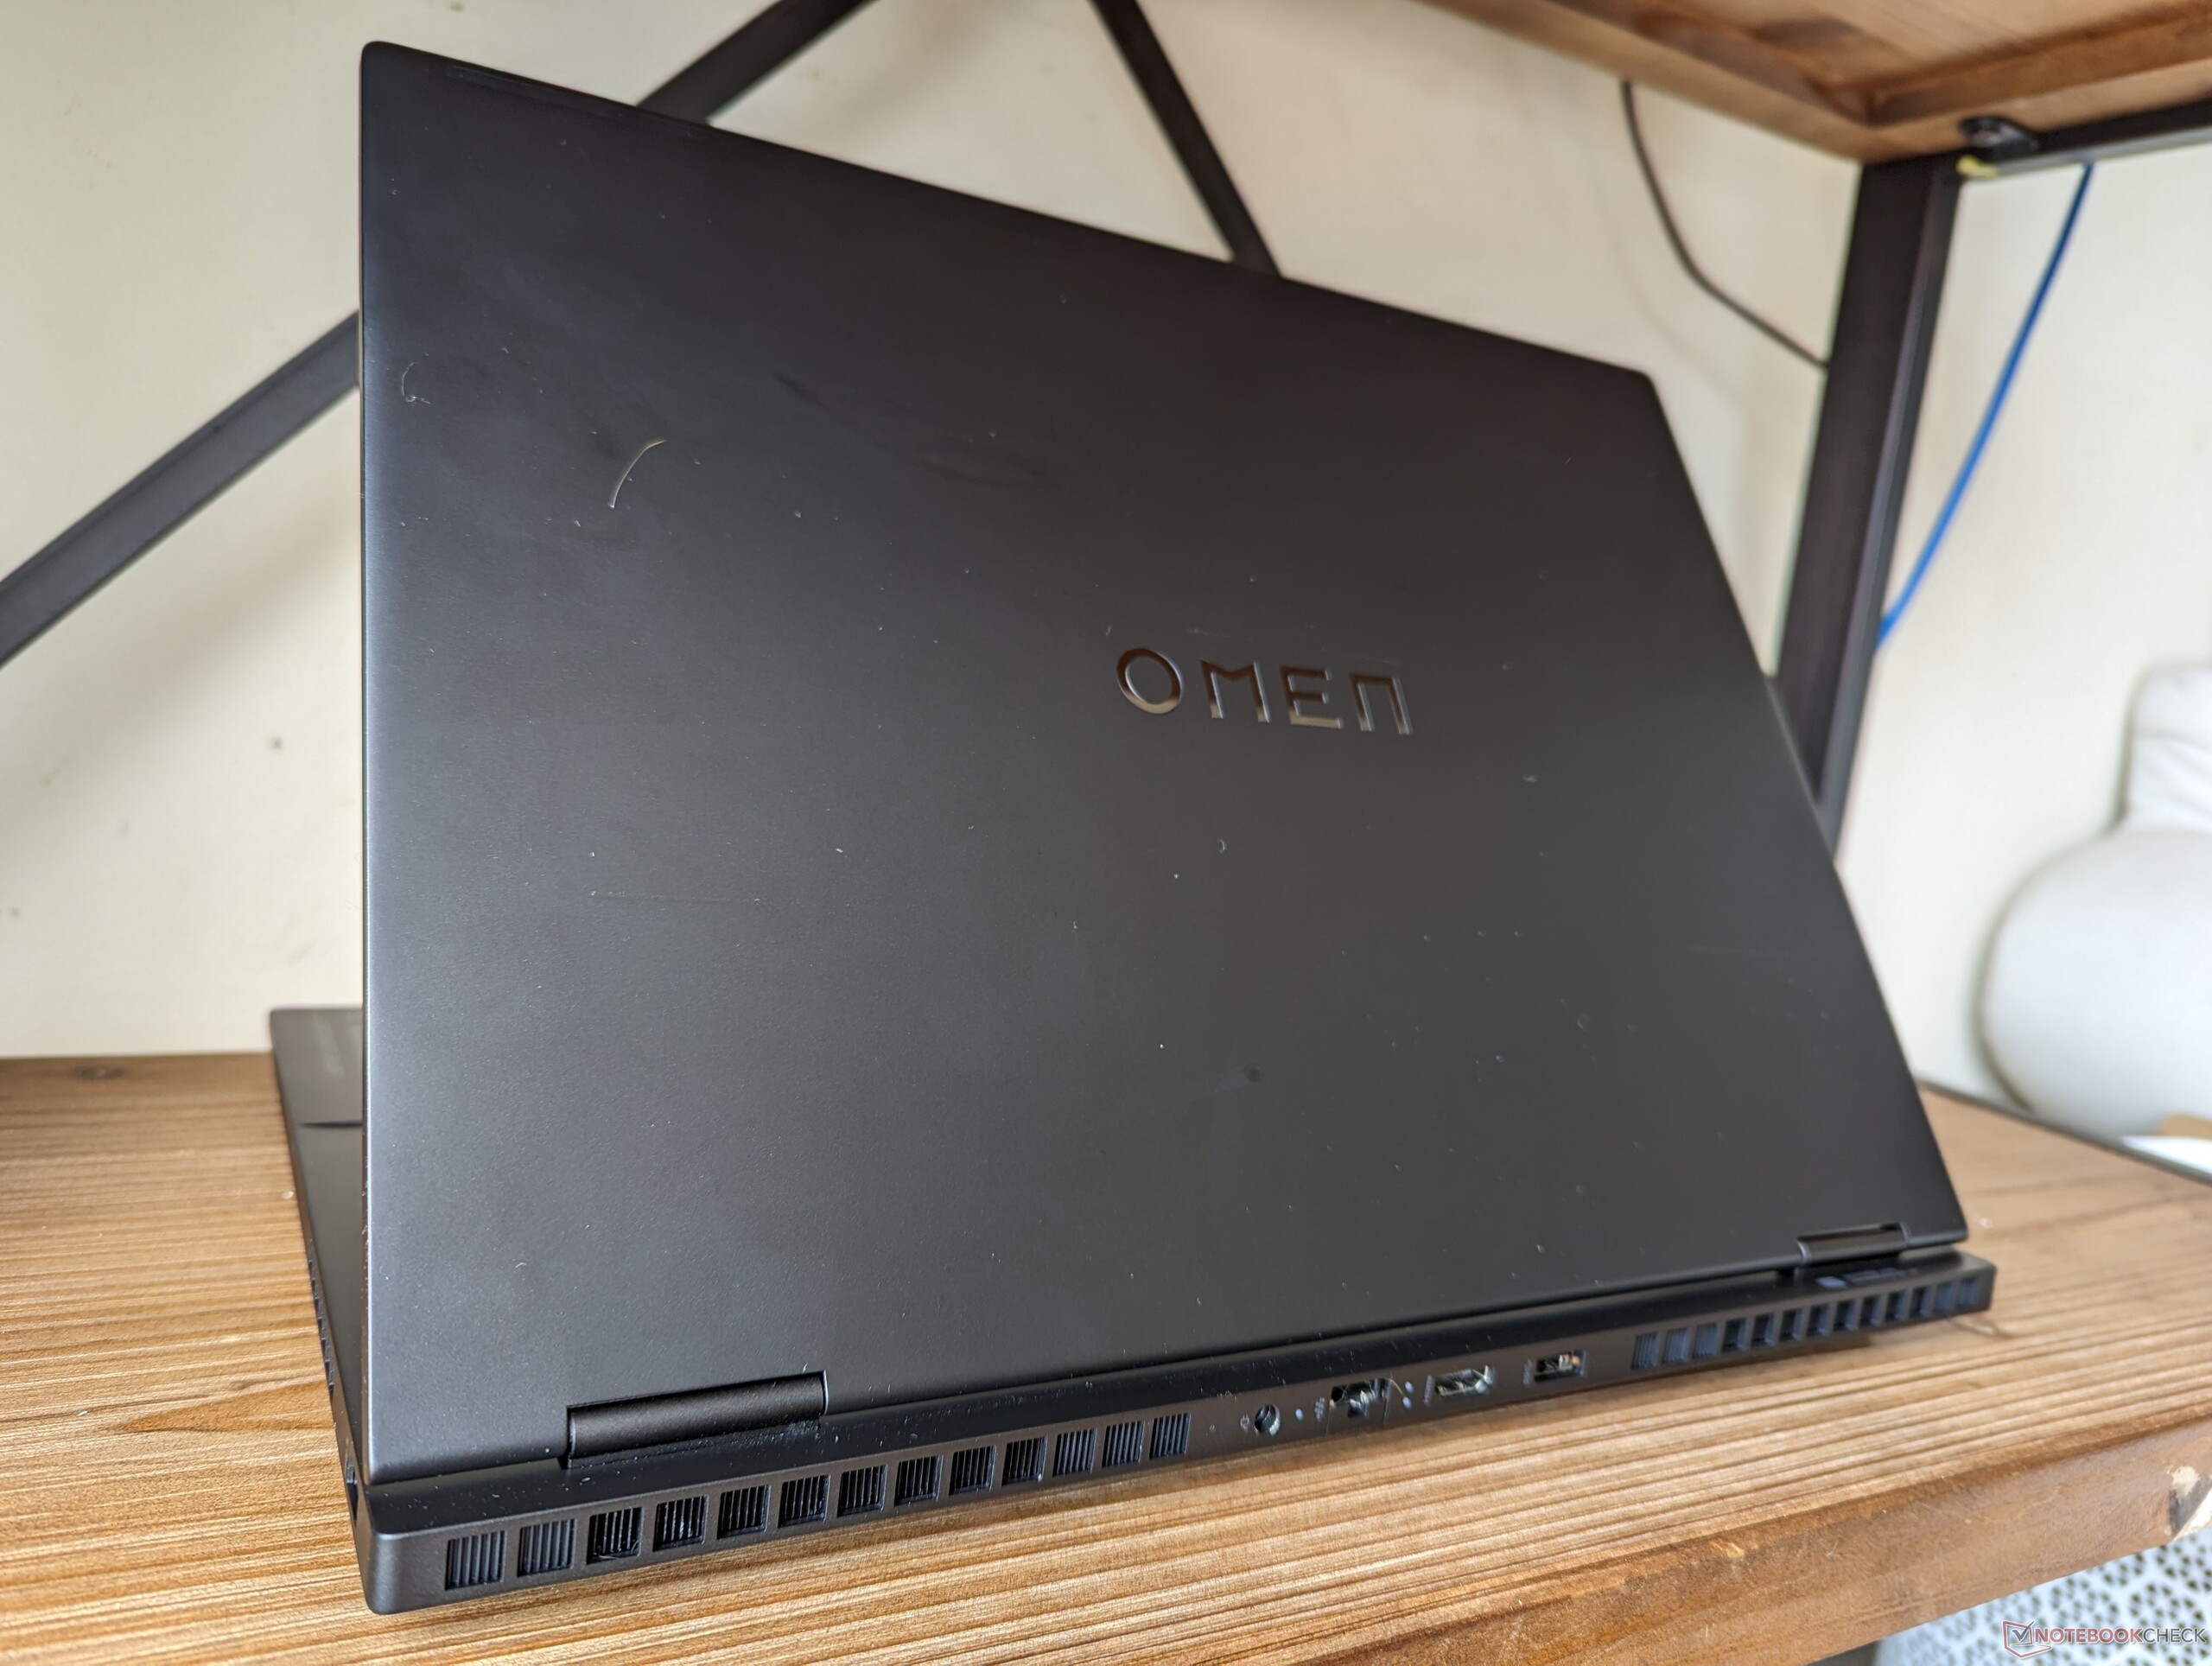
新的 16:10 外形使 Omen Transcend 16 比普通的 Omen 16 更方正,但整体厚度减少了近 4 毫米。因此,它的重量稍轻,但仍比不上 华硕 ROG Zephyrus M16或联想Legion Slim 7i 16 G8.
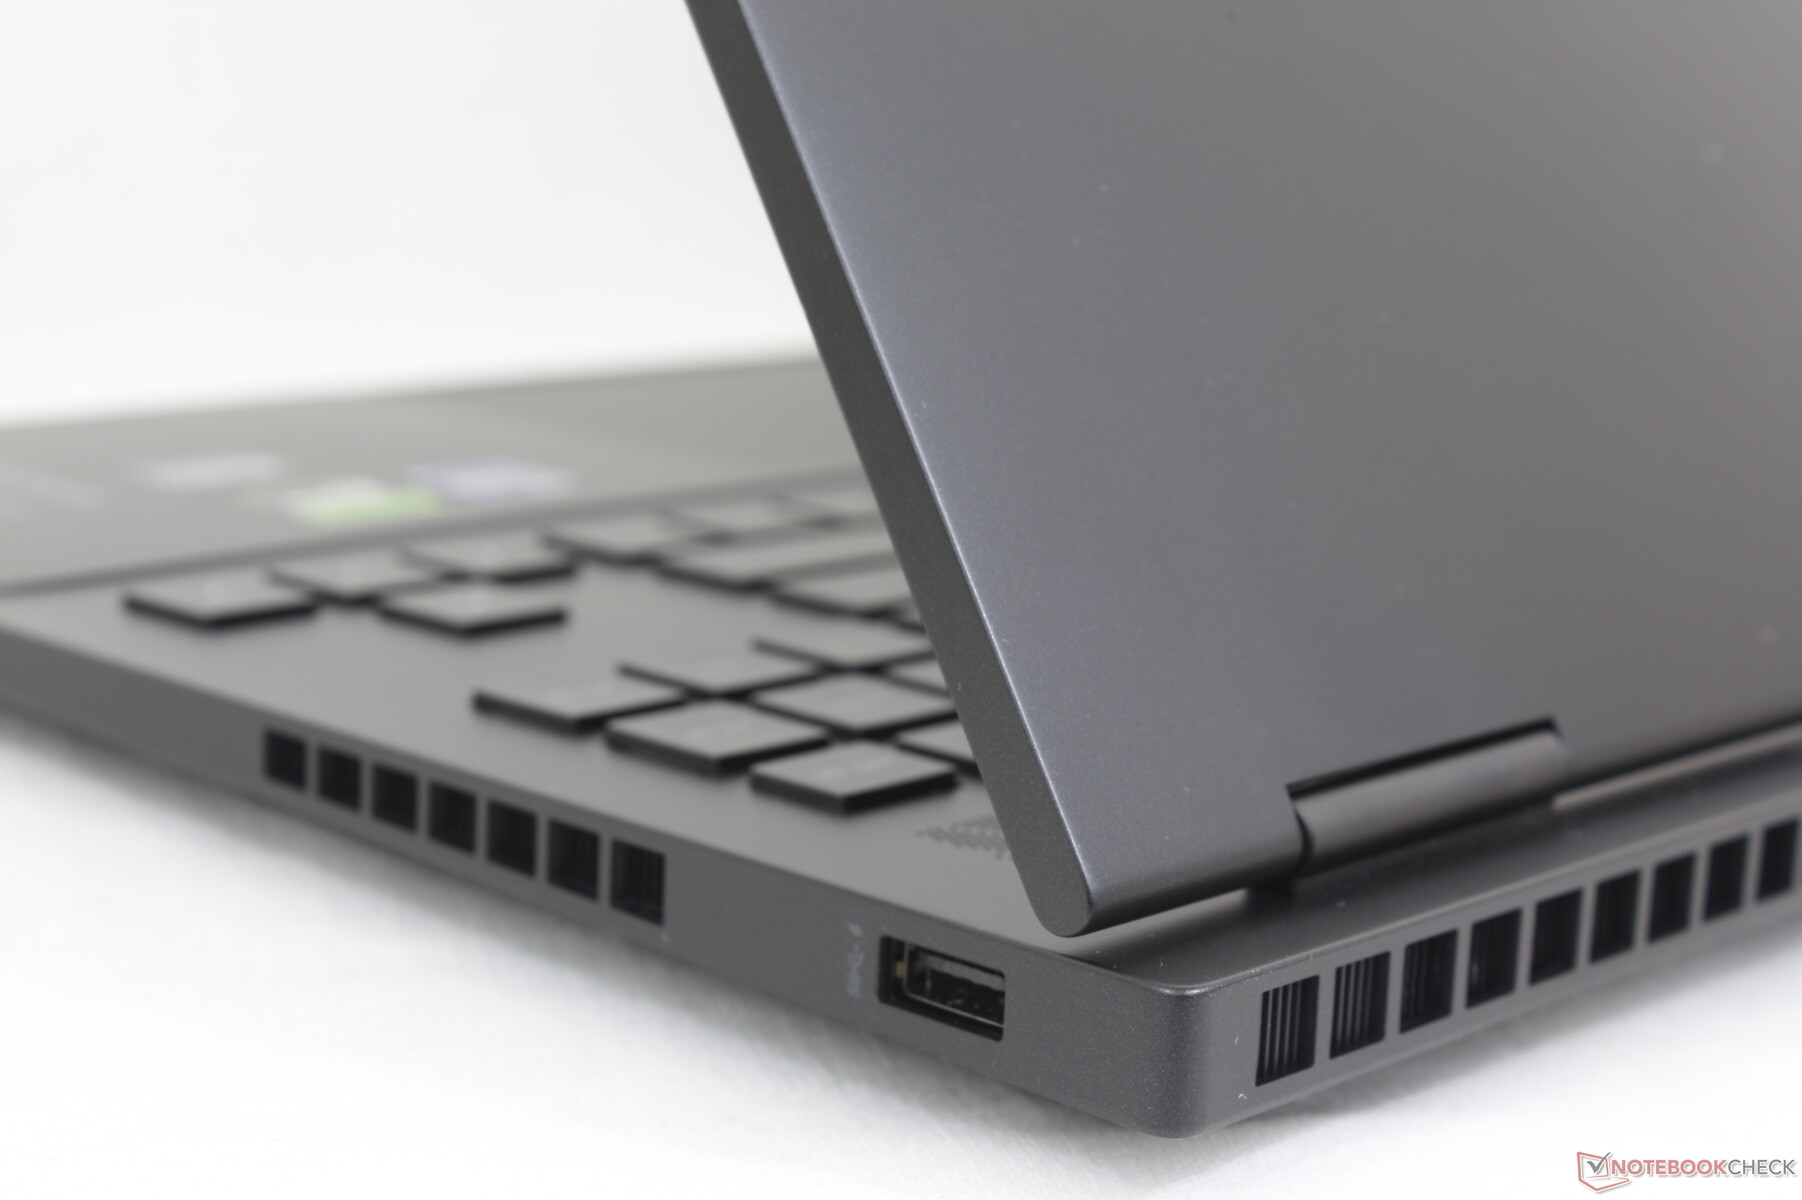
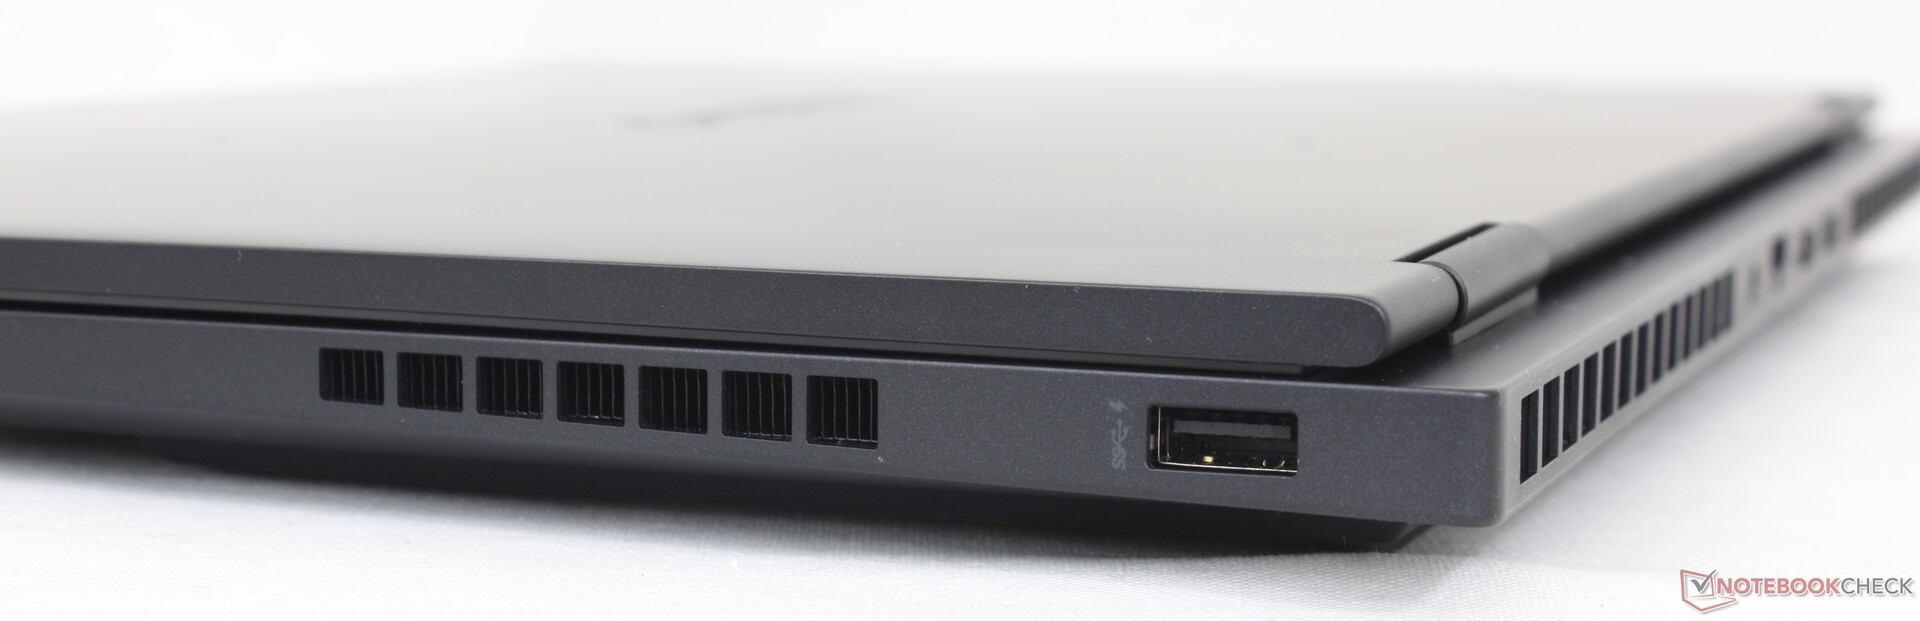
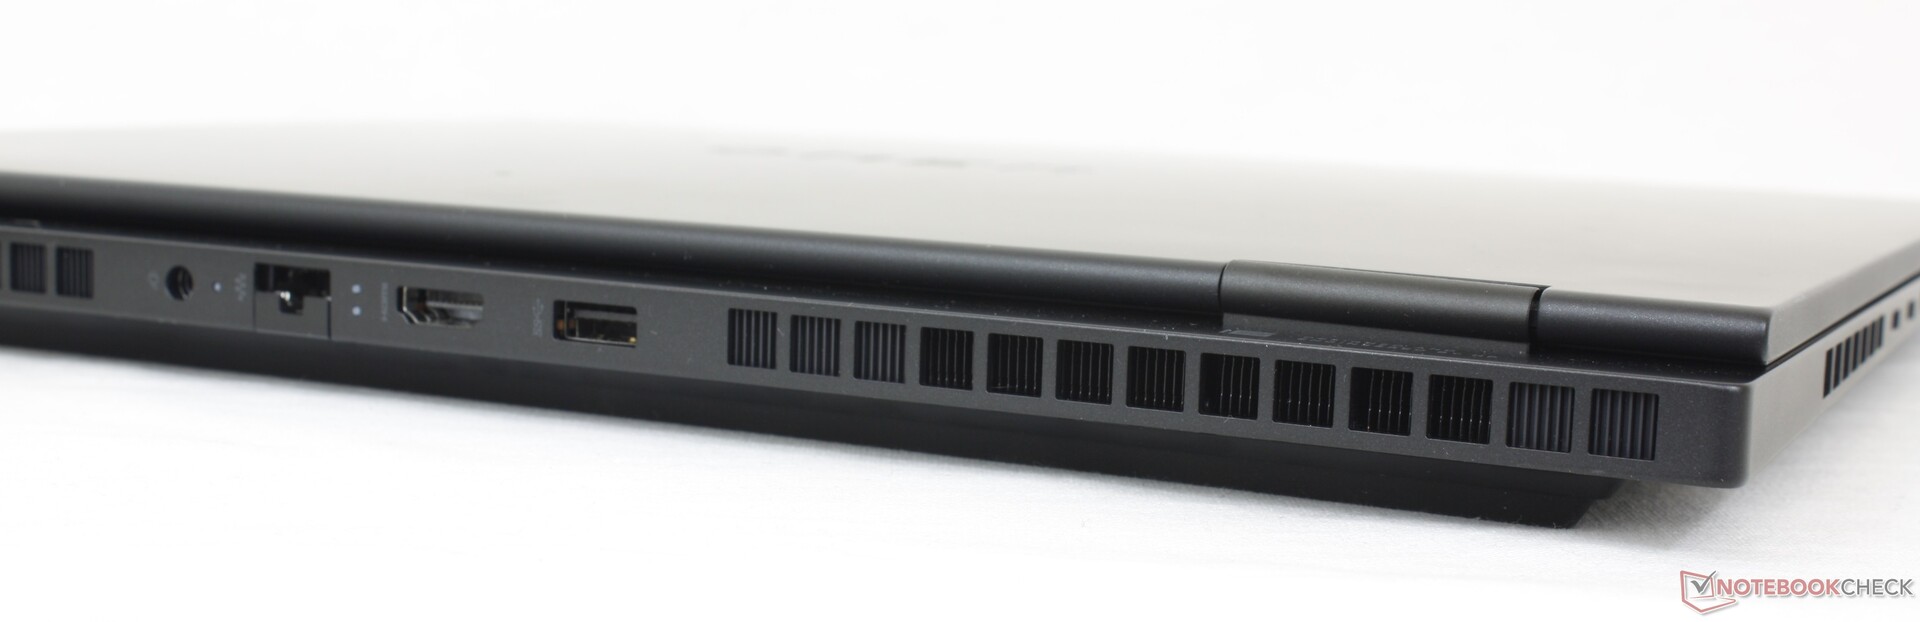
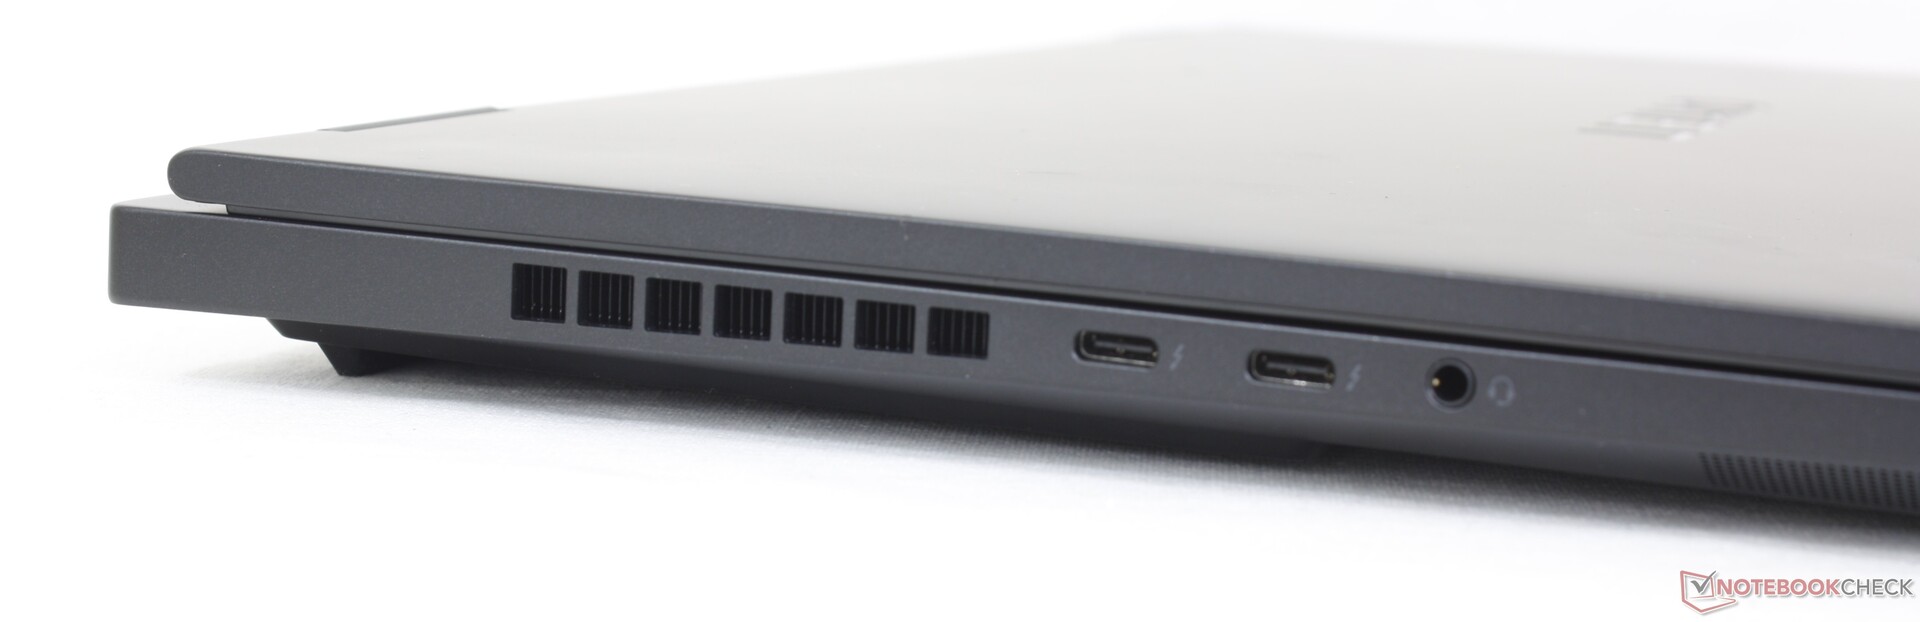
连接性
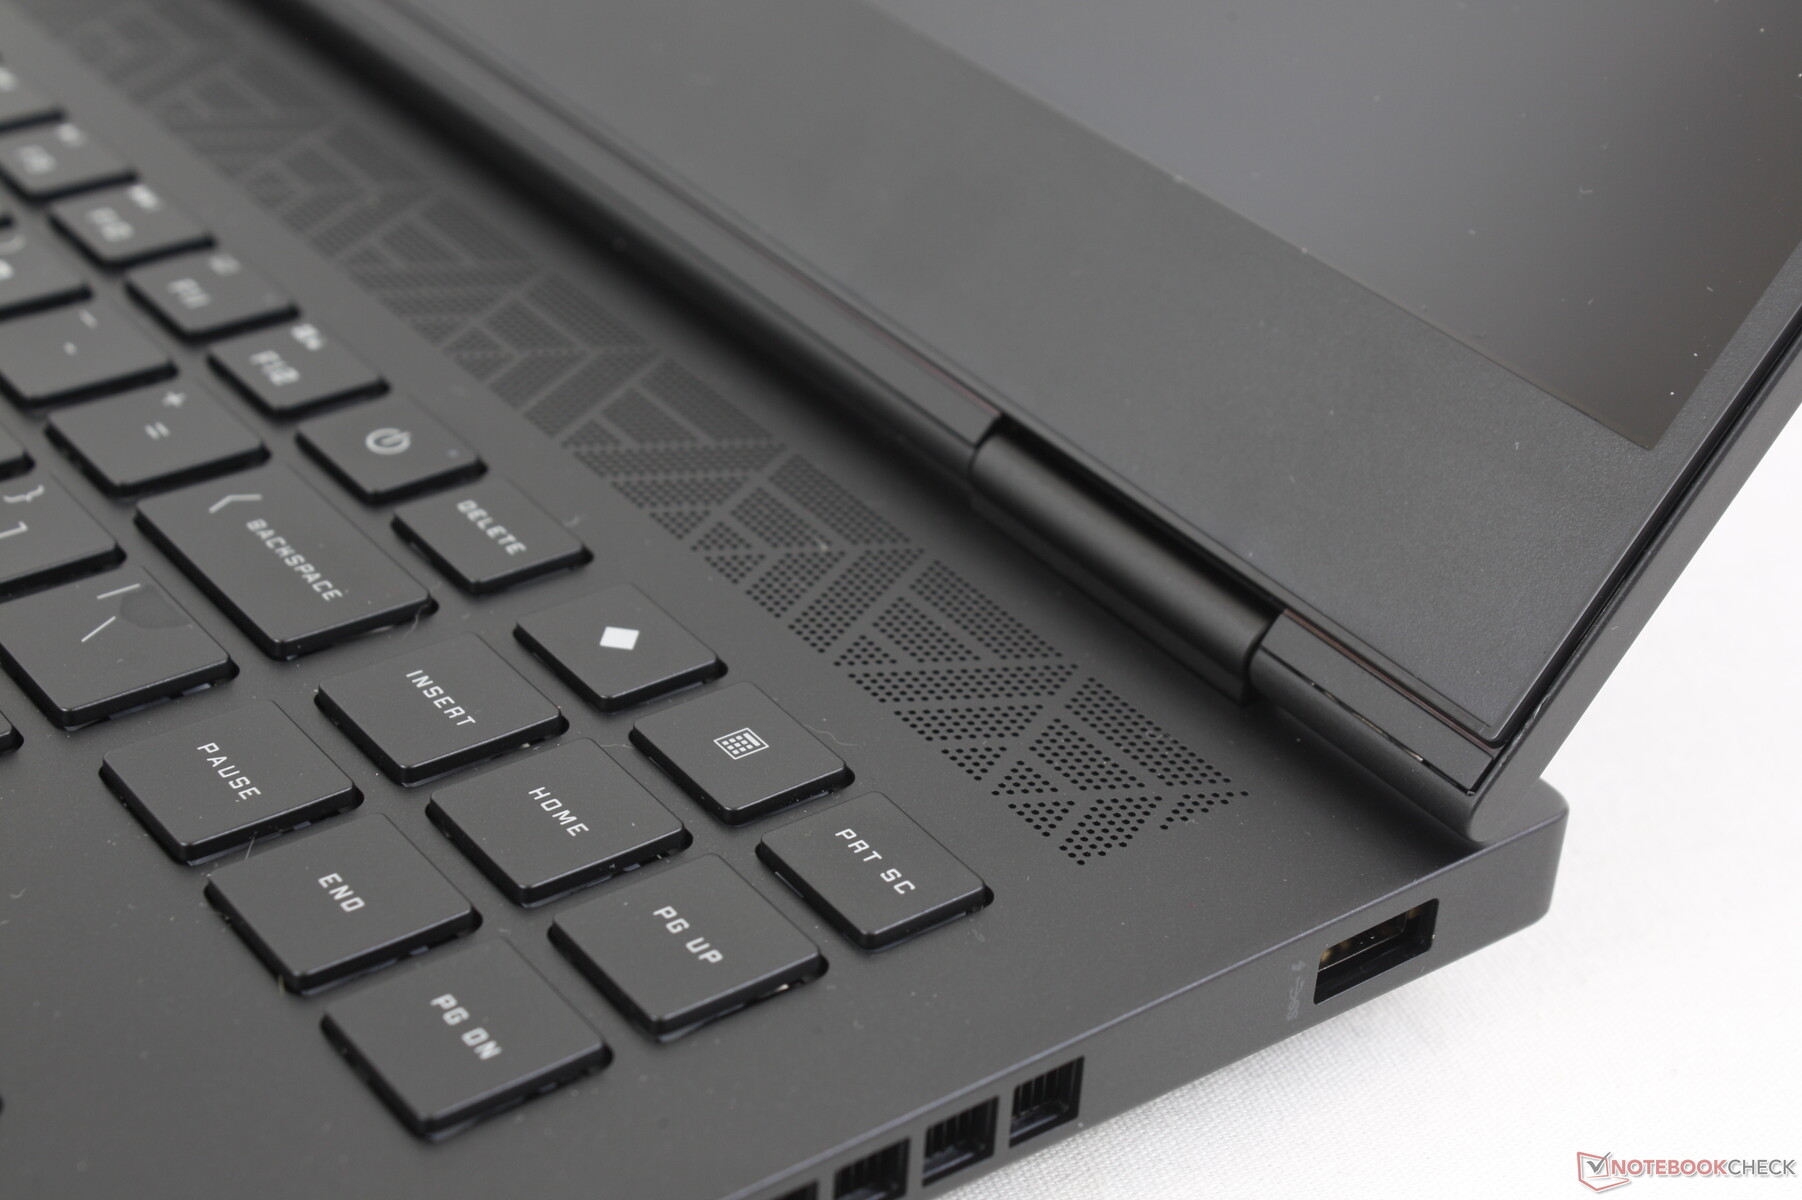
尽管有上述物理变化,但端口选项仍与 Omen 16 相同。不过,如果能将 1 Gbps RJ-45 升级到 2.5 Gbps,那就更好了。
交流
英特尔 AX211 标配 Wi-Fi 6E 和蓝牙 5.3 连接。与华硕 AXE11000 6GHz 网络配对时,我们体验到了稳定可靠的传输速率。
网络摄像头
普通 Omen 16 不支持红外功能,而 Omen 16 则支持红外功能。此外,两款 Omen 摄像头的 200 万像素网络摄像头和隐私快门均相同。


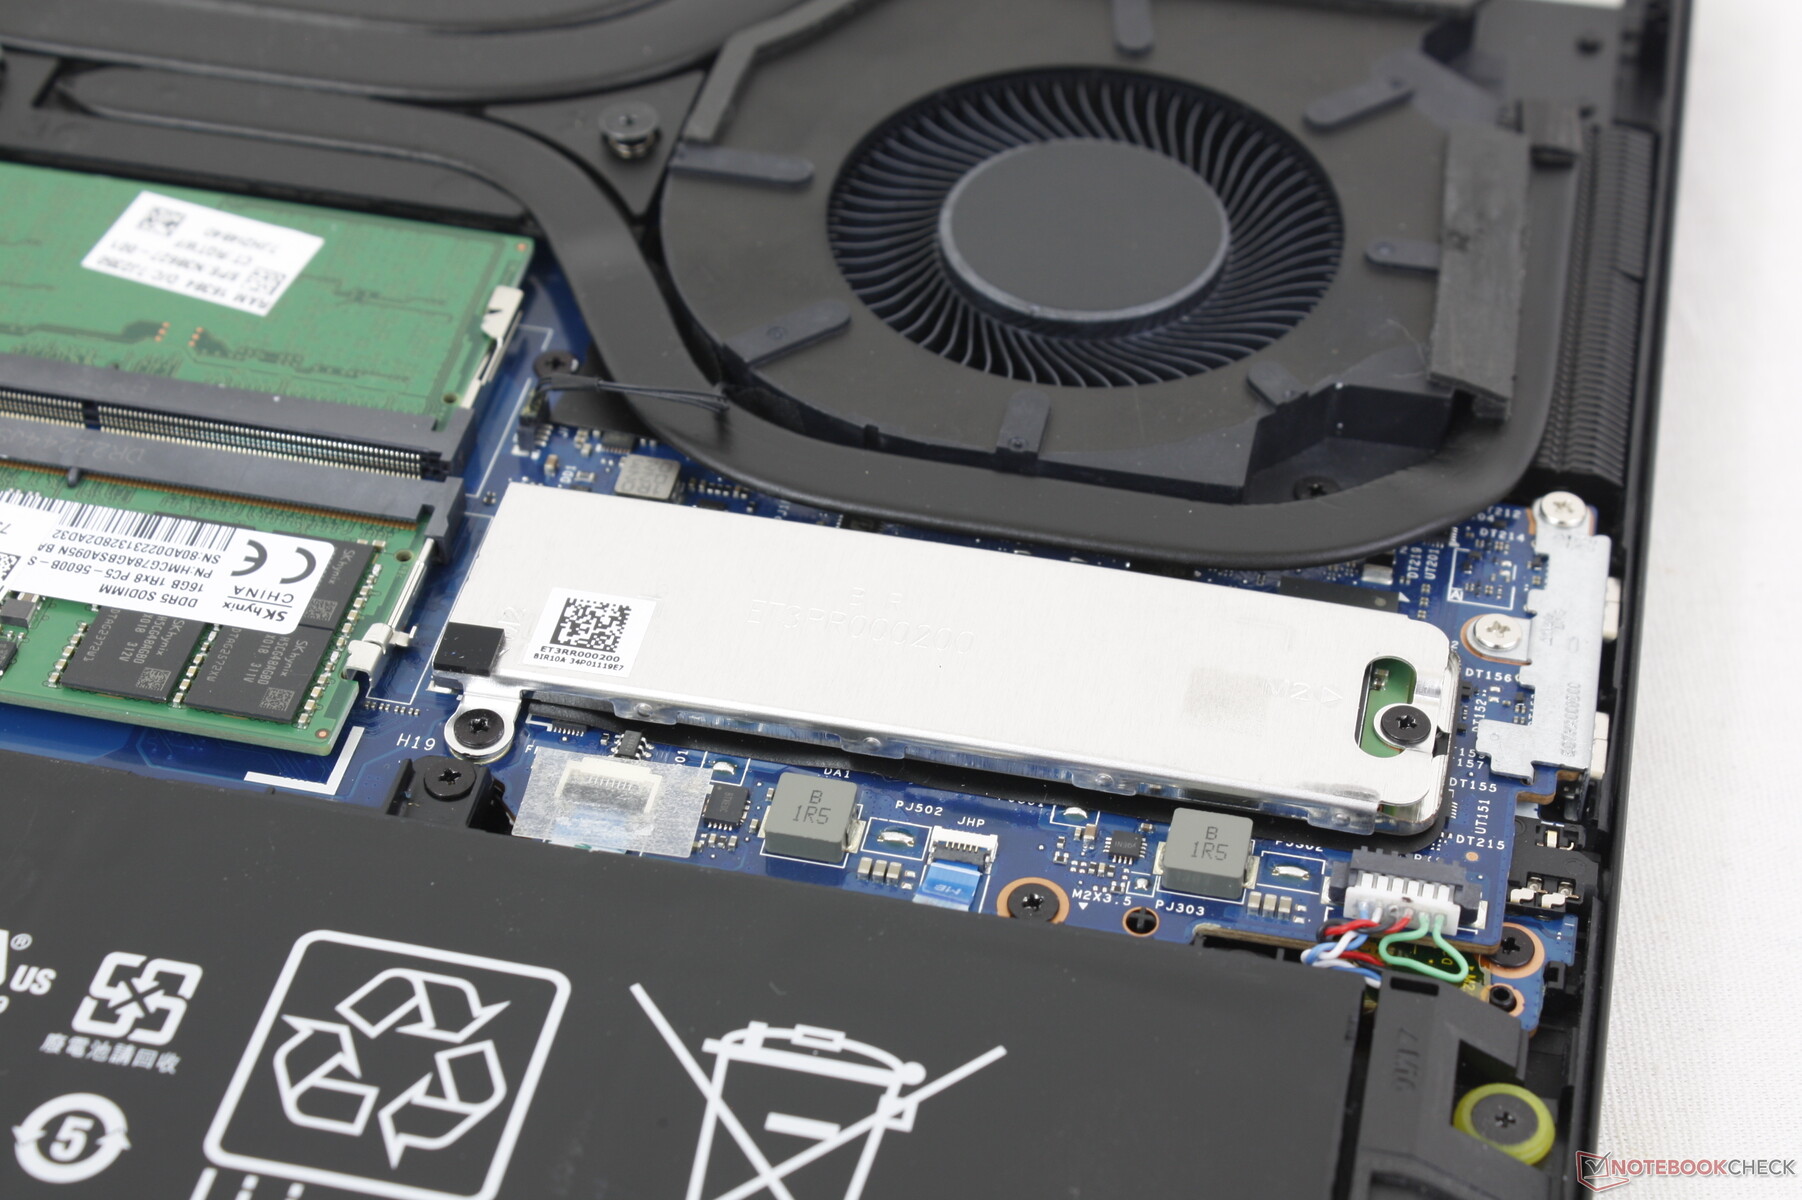
维护
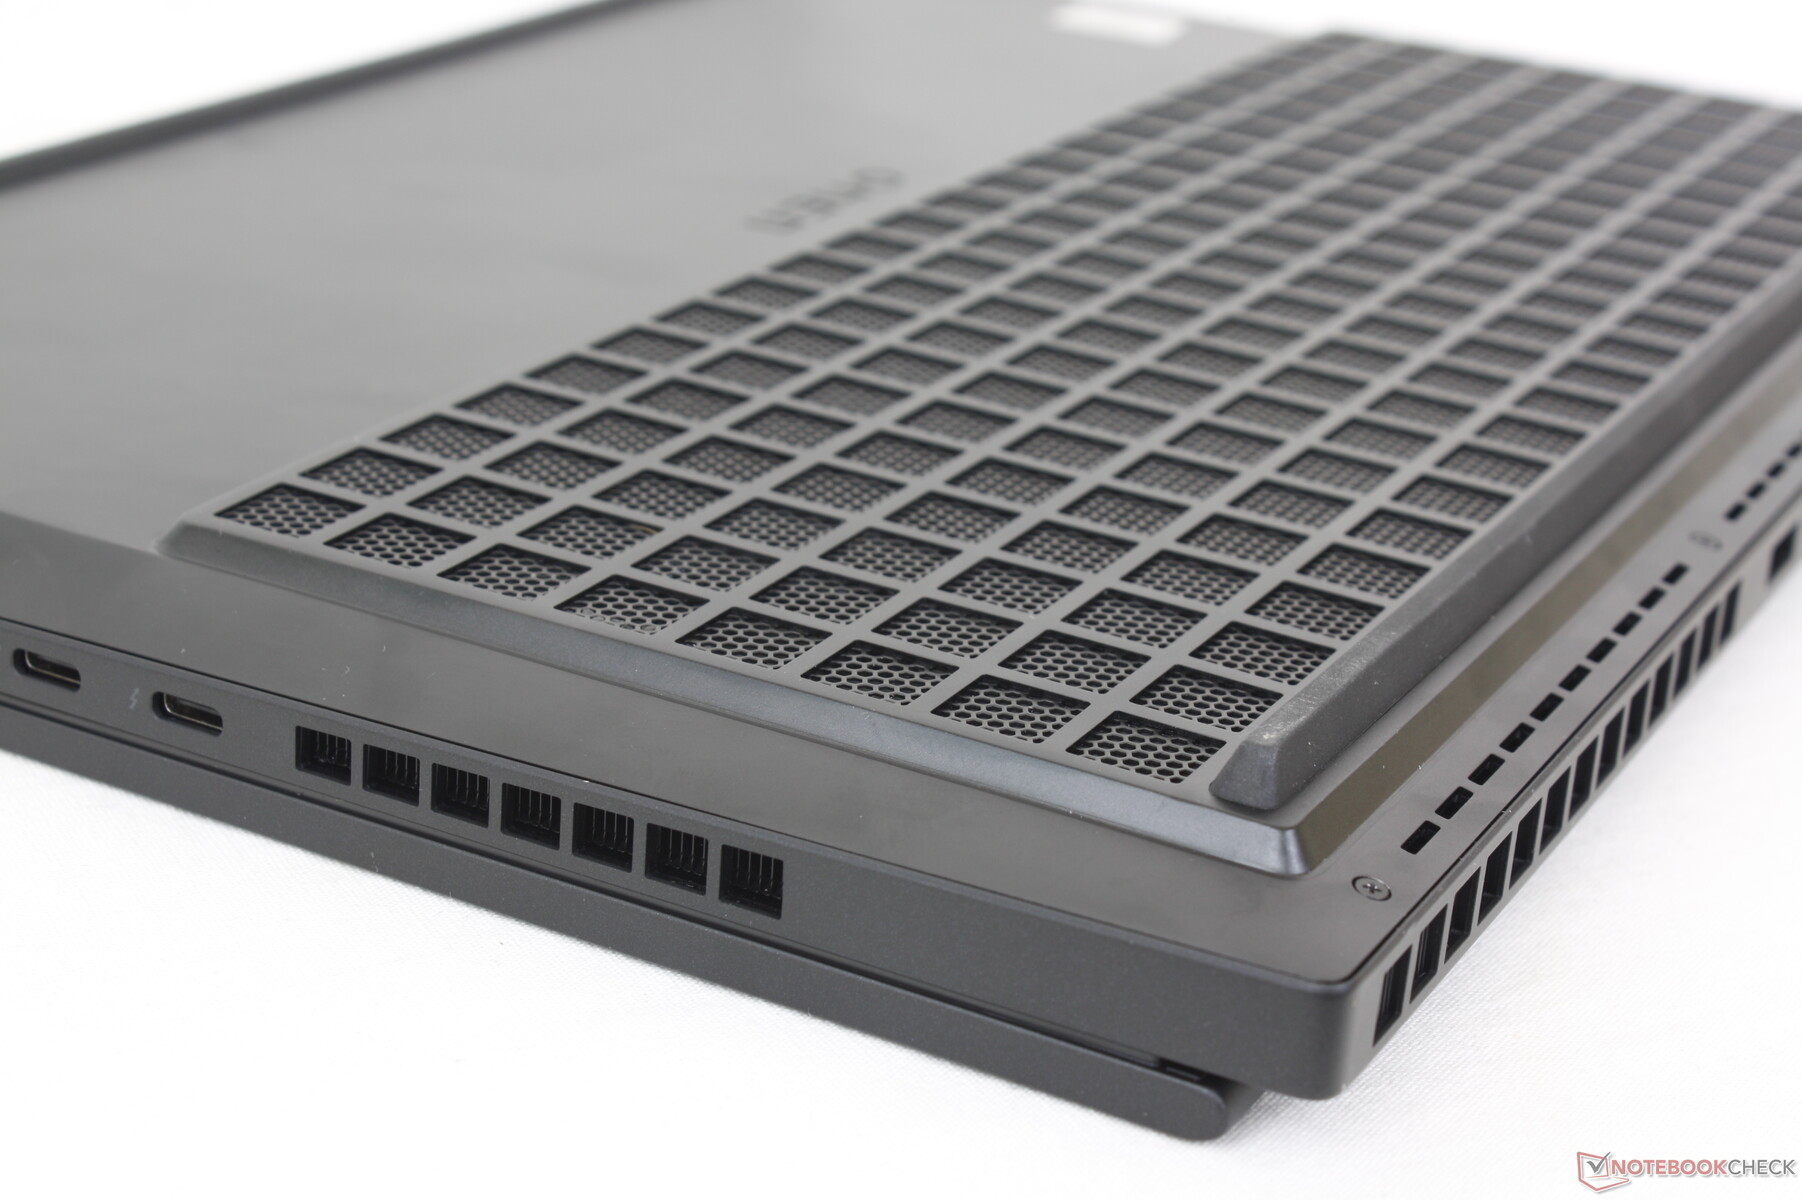
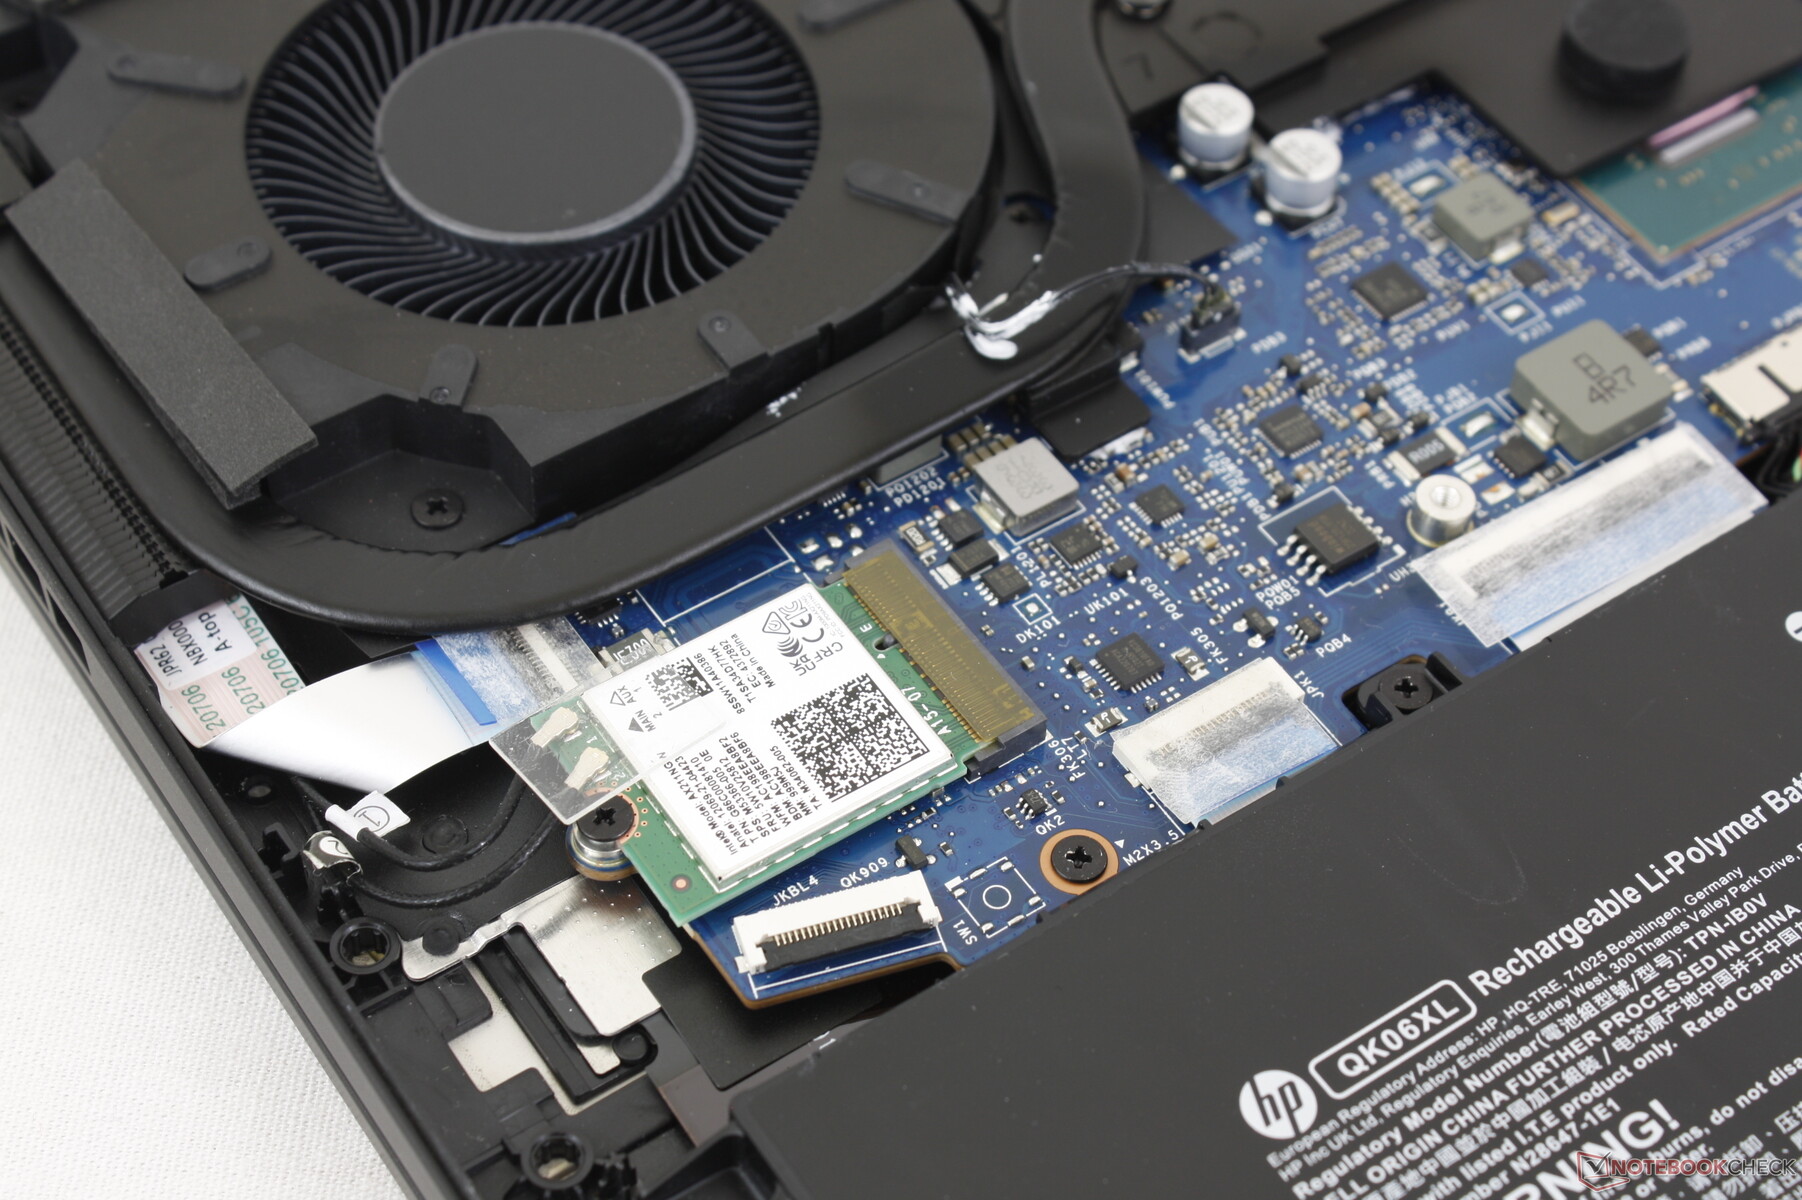
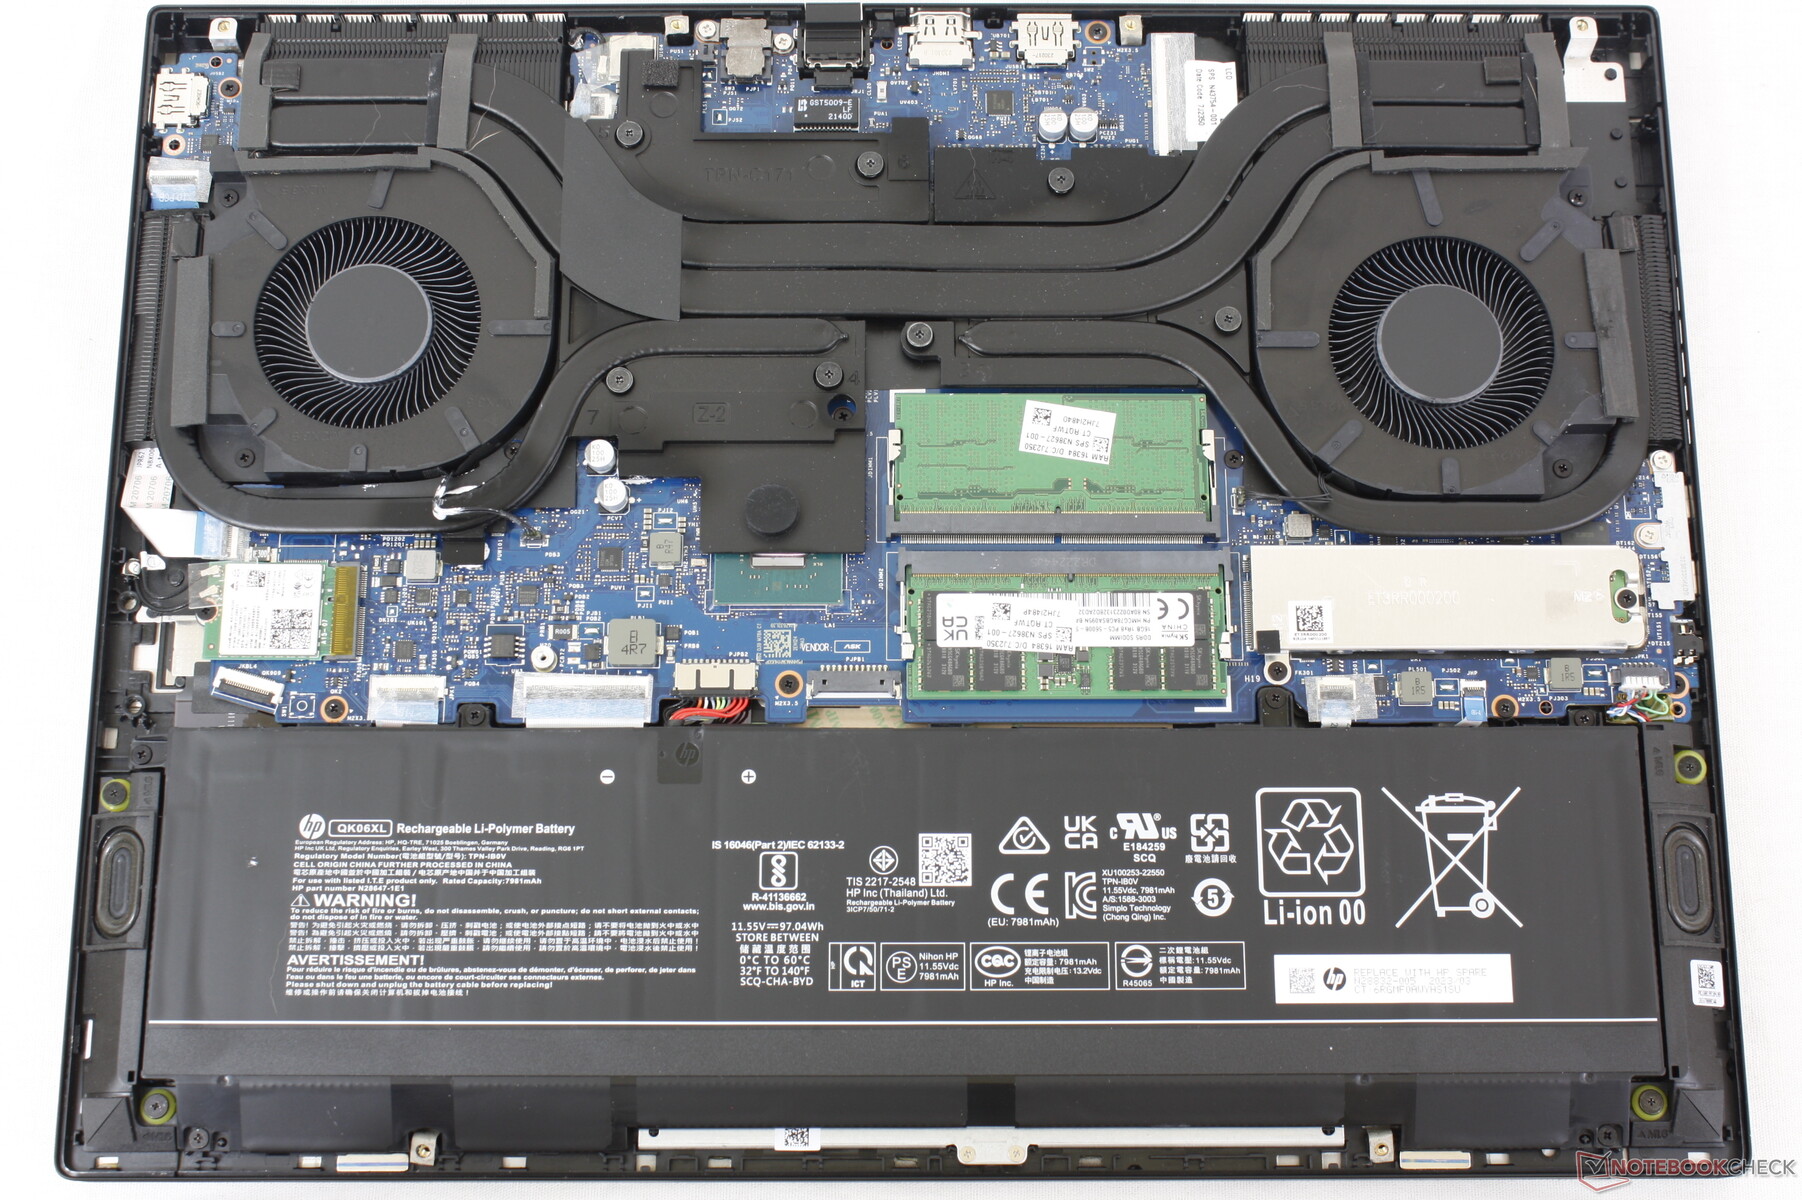
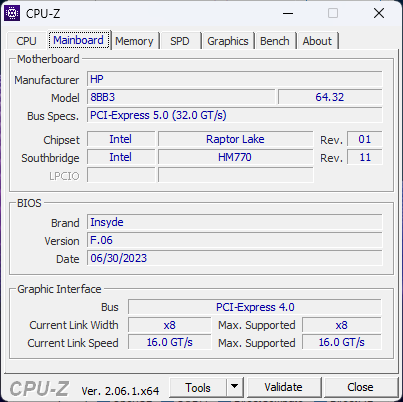
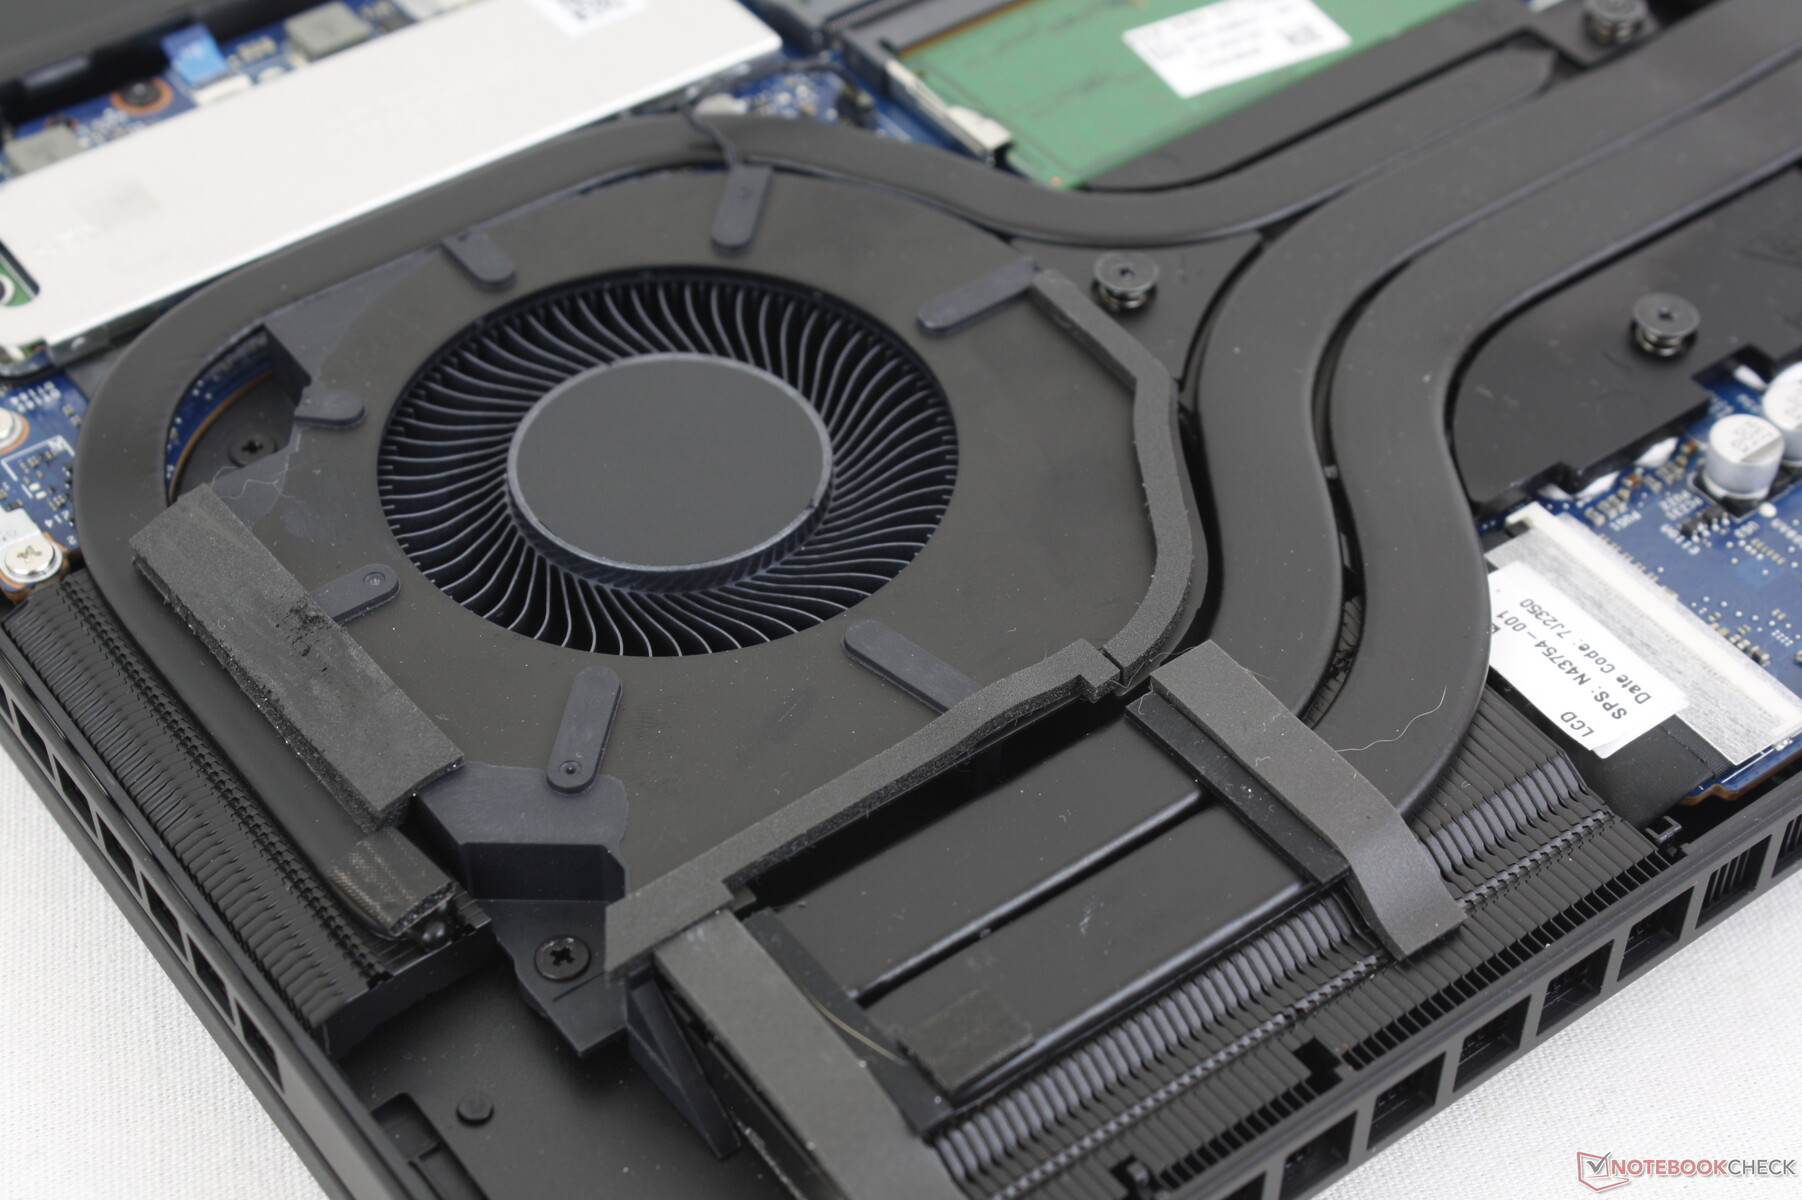
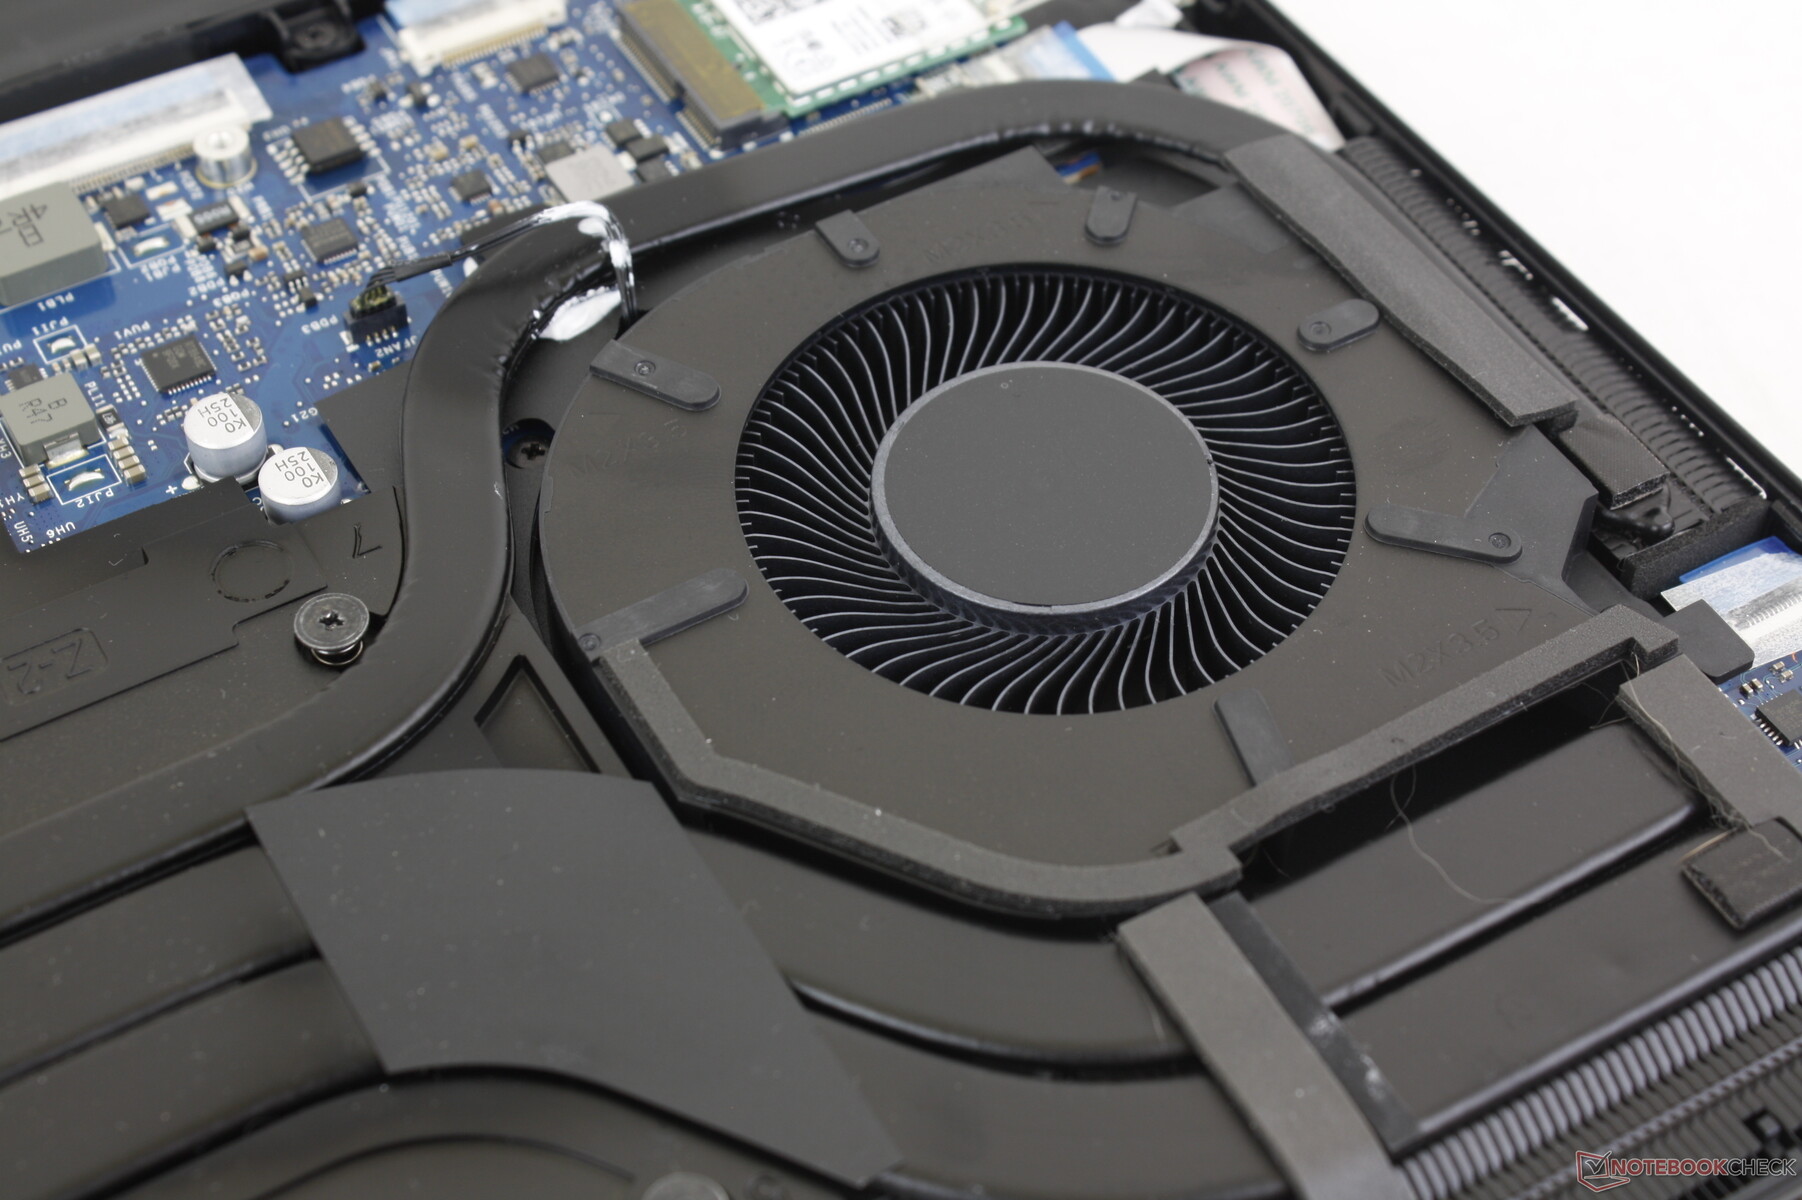
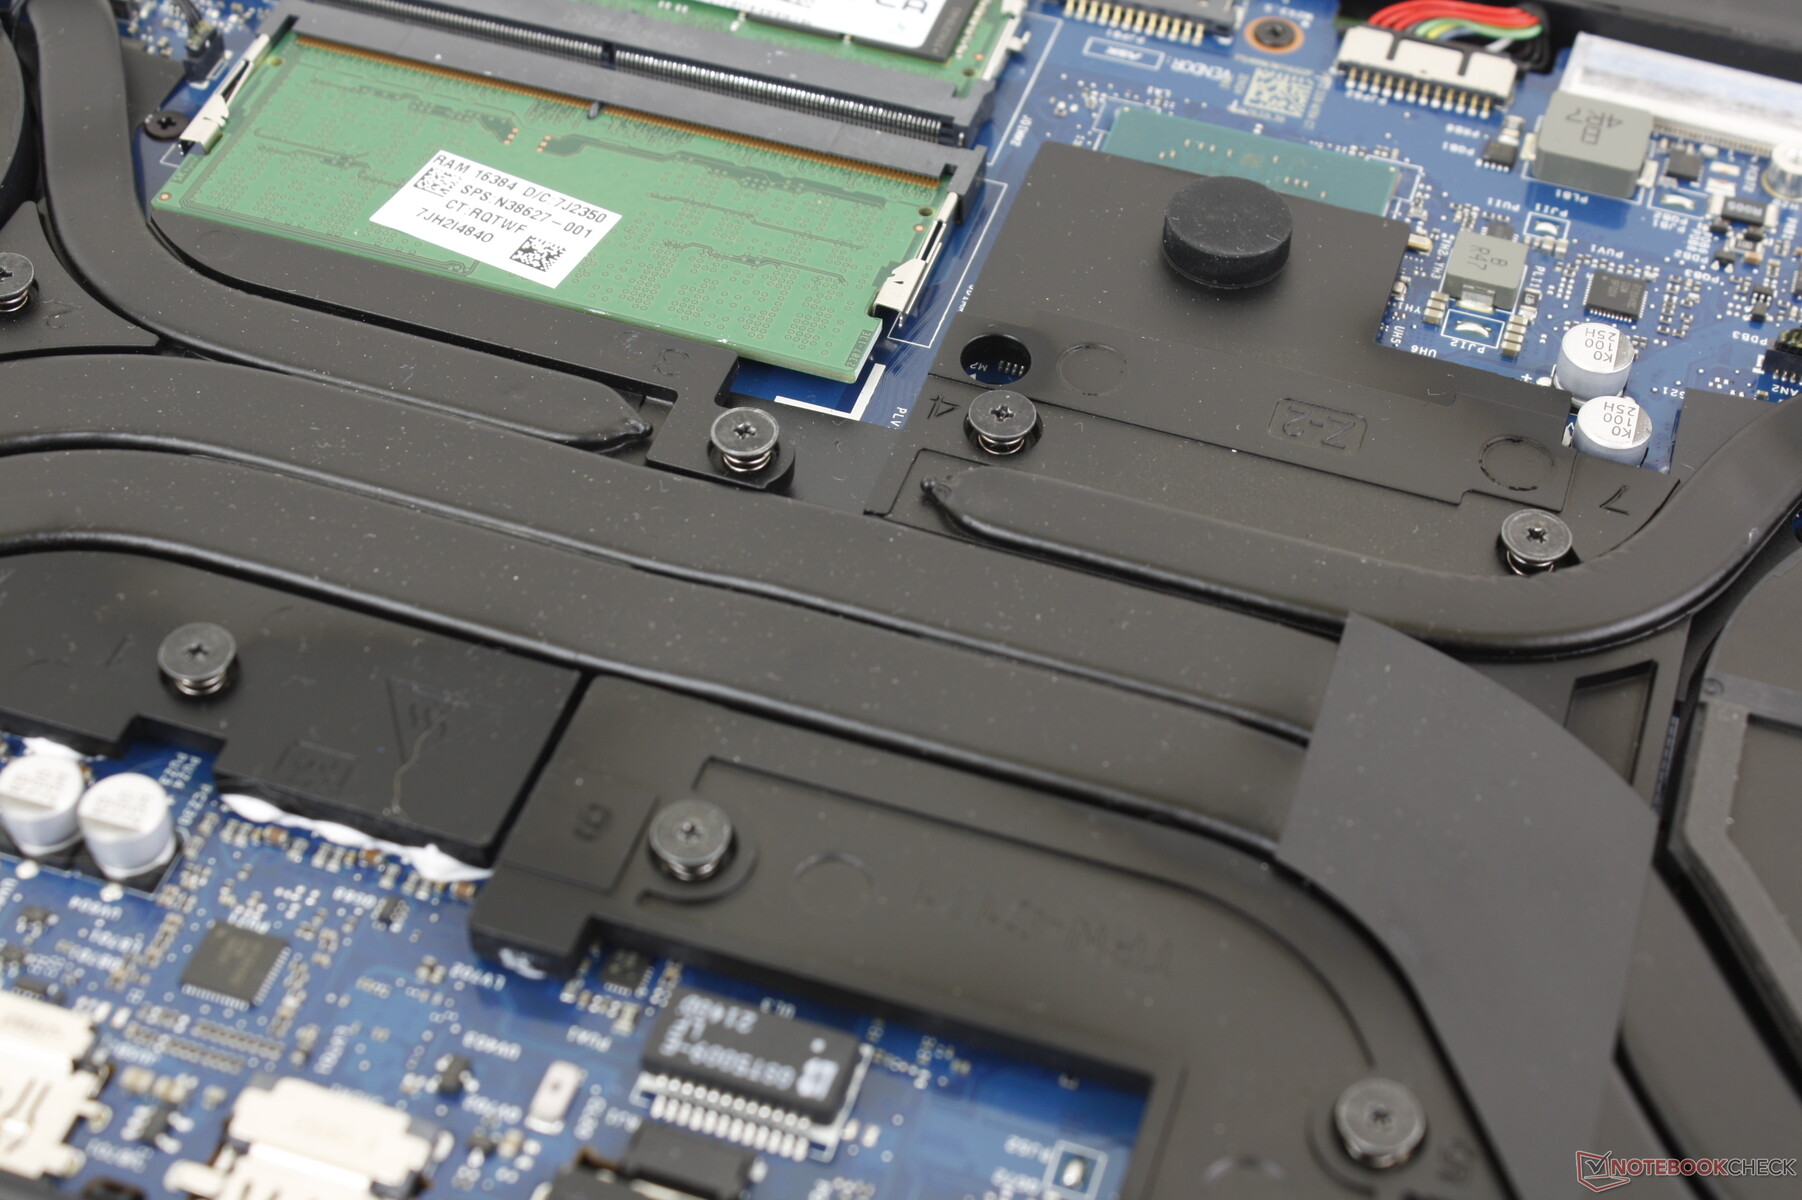
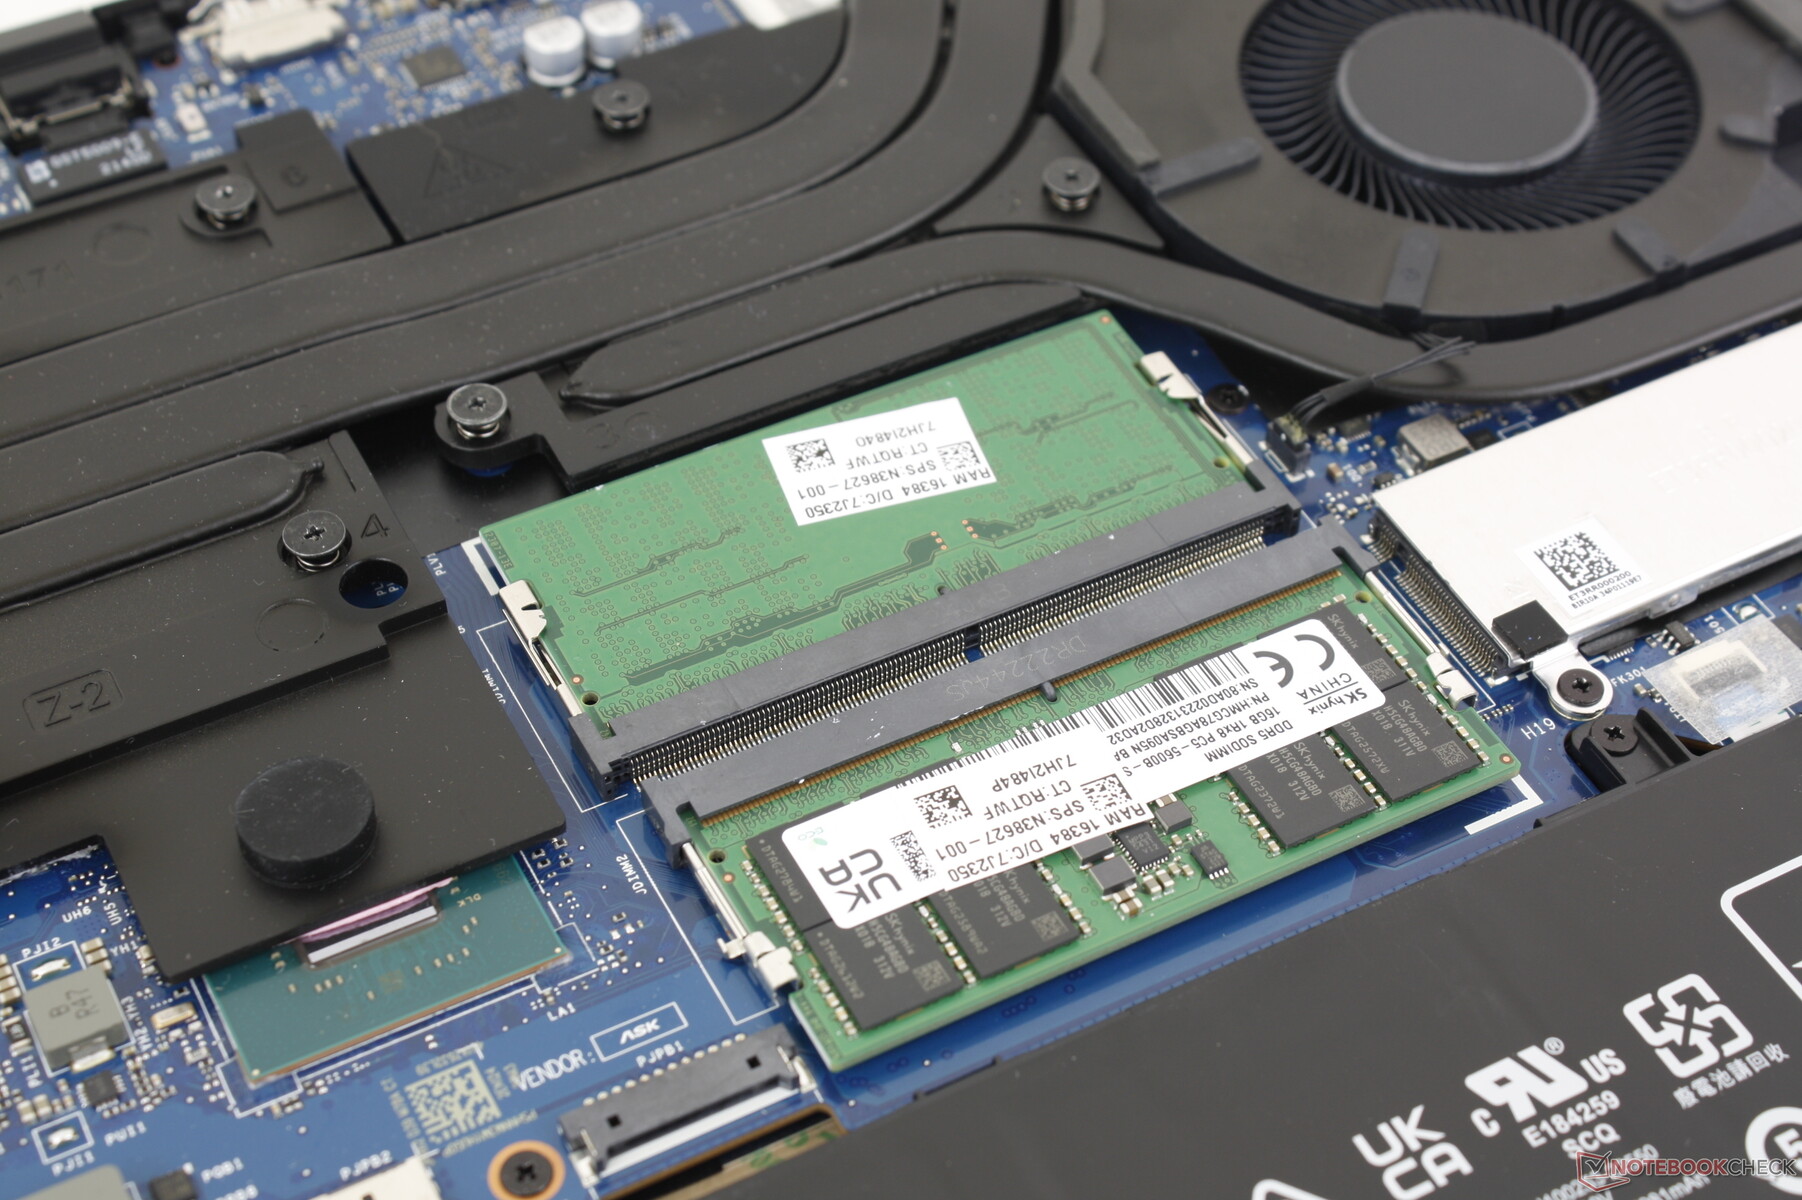
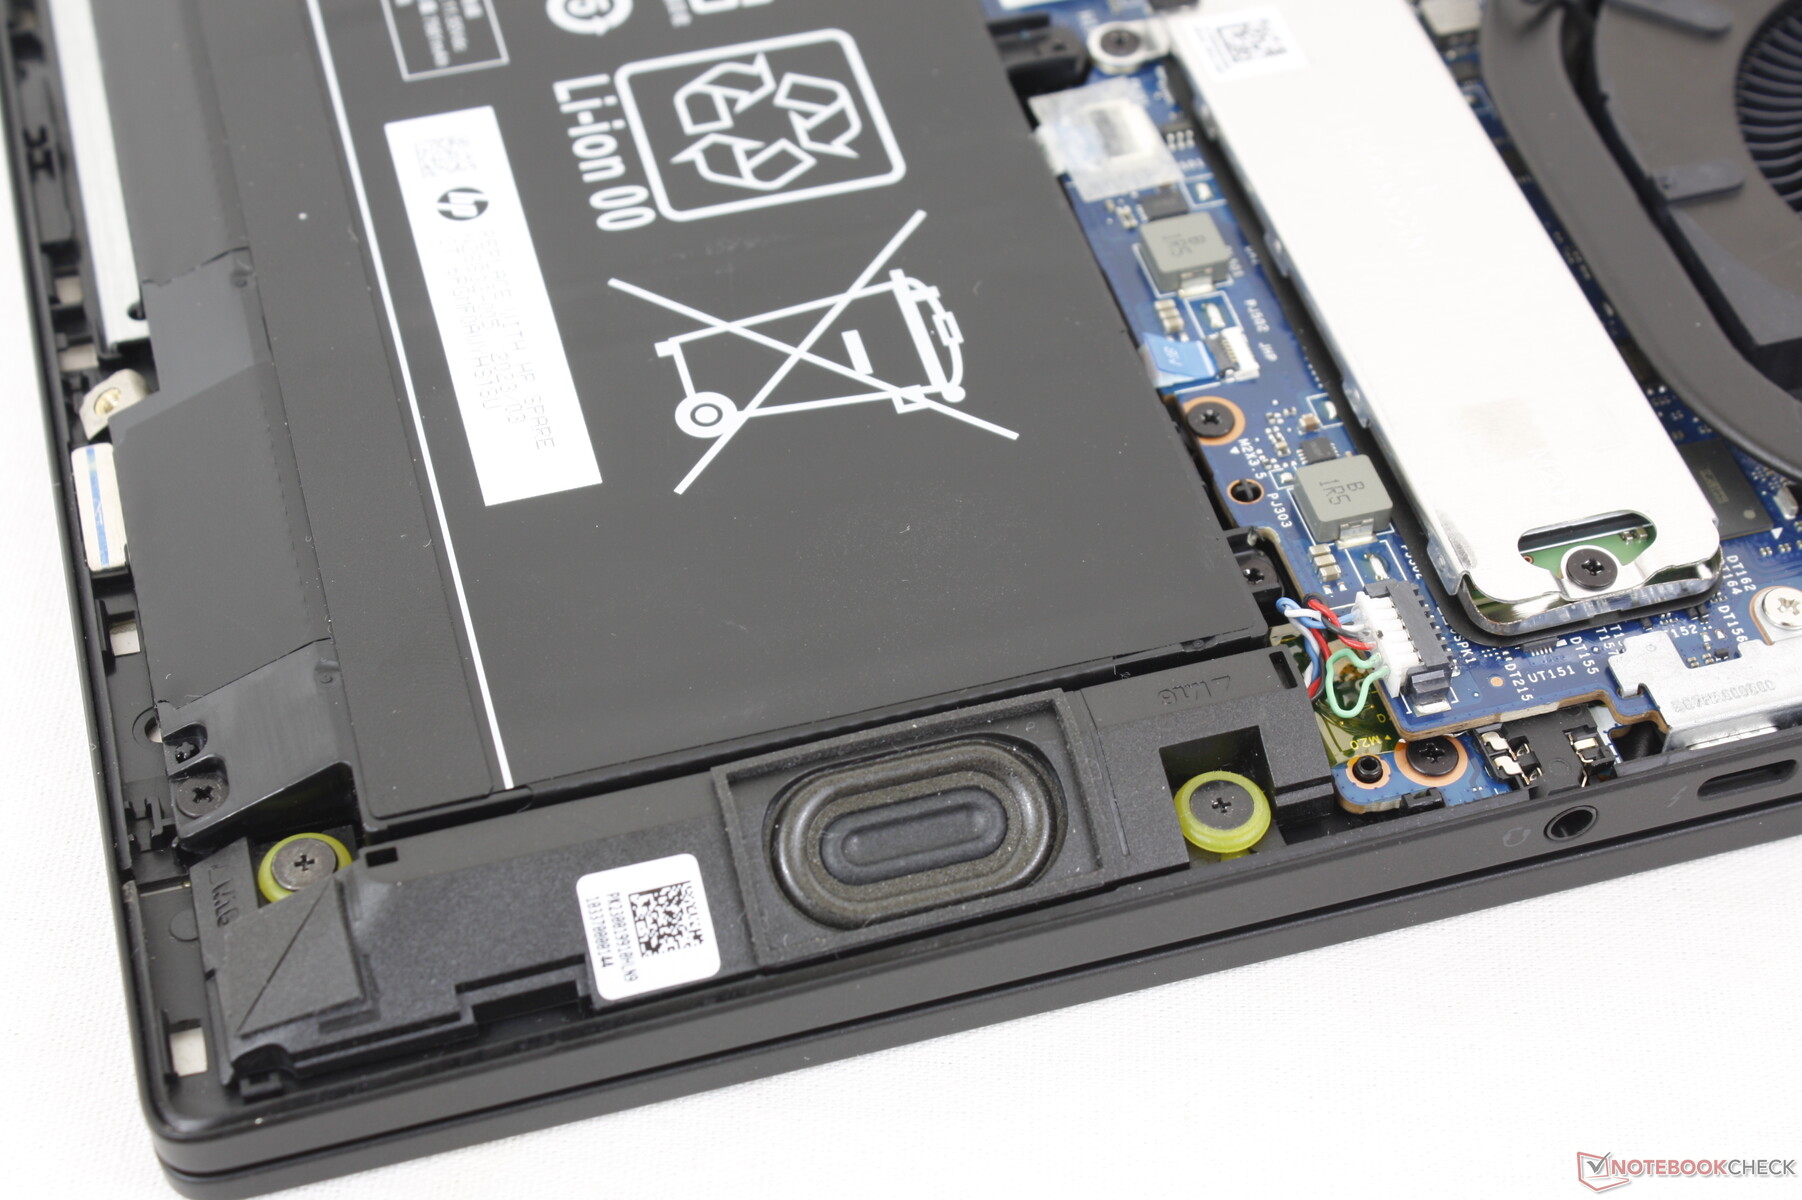
底部面板仅由六颗十字螺丝固定,方便用户使用。不过,与 Omen 16 相比,一个显著的变化是取消了第二个 M.2 固态硬盘插槽,原因是调整了 M.2 WLAN 插槽的位置,如下图所示。因此,Omen 创见 16 最多只能支持一个内部固态硬盘,而不是两个。此外,扬声器和散热方案也进行了其他微调。
配件和保修
某些配置包括一个免费的 HyperX Cloud II Core 无线耳机。除此之外,零售包装盒中仅包含标准交流适配器和文件。
厂商提供标准的一年有限保修服务。
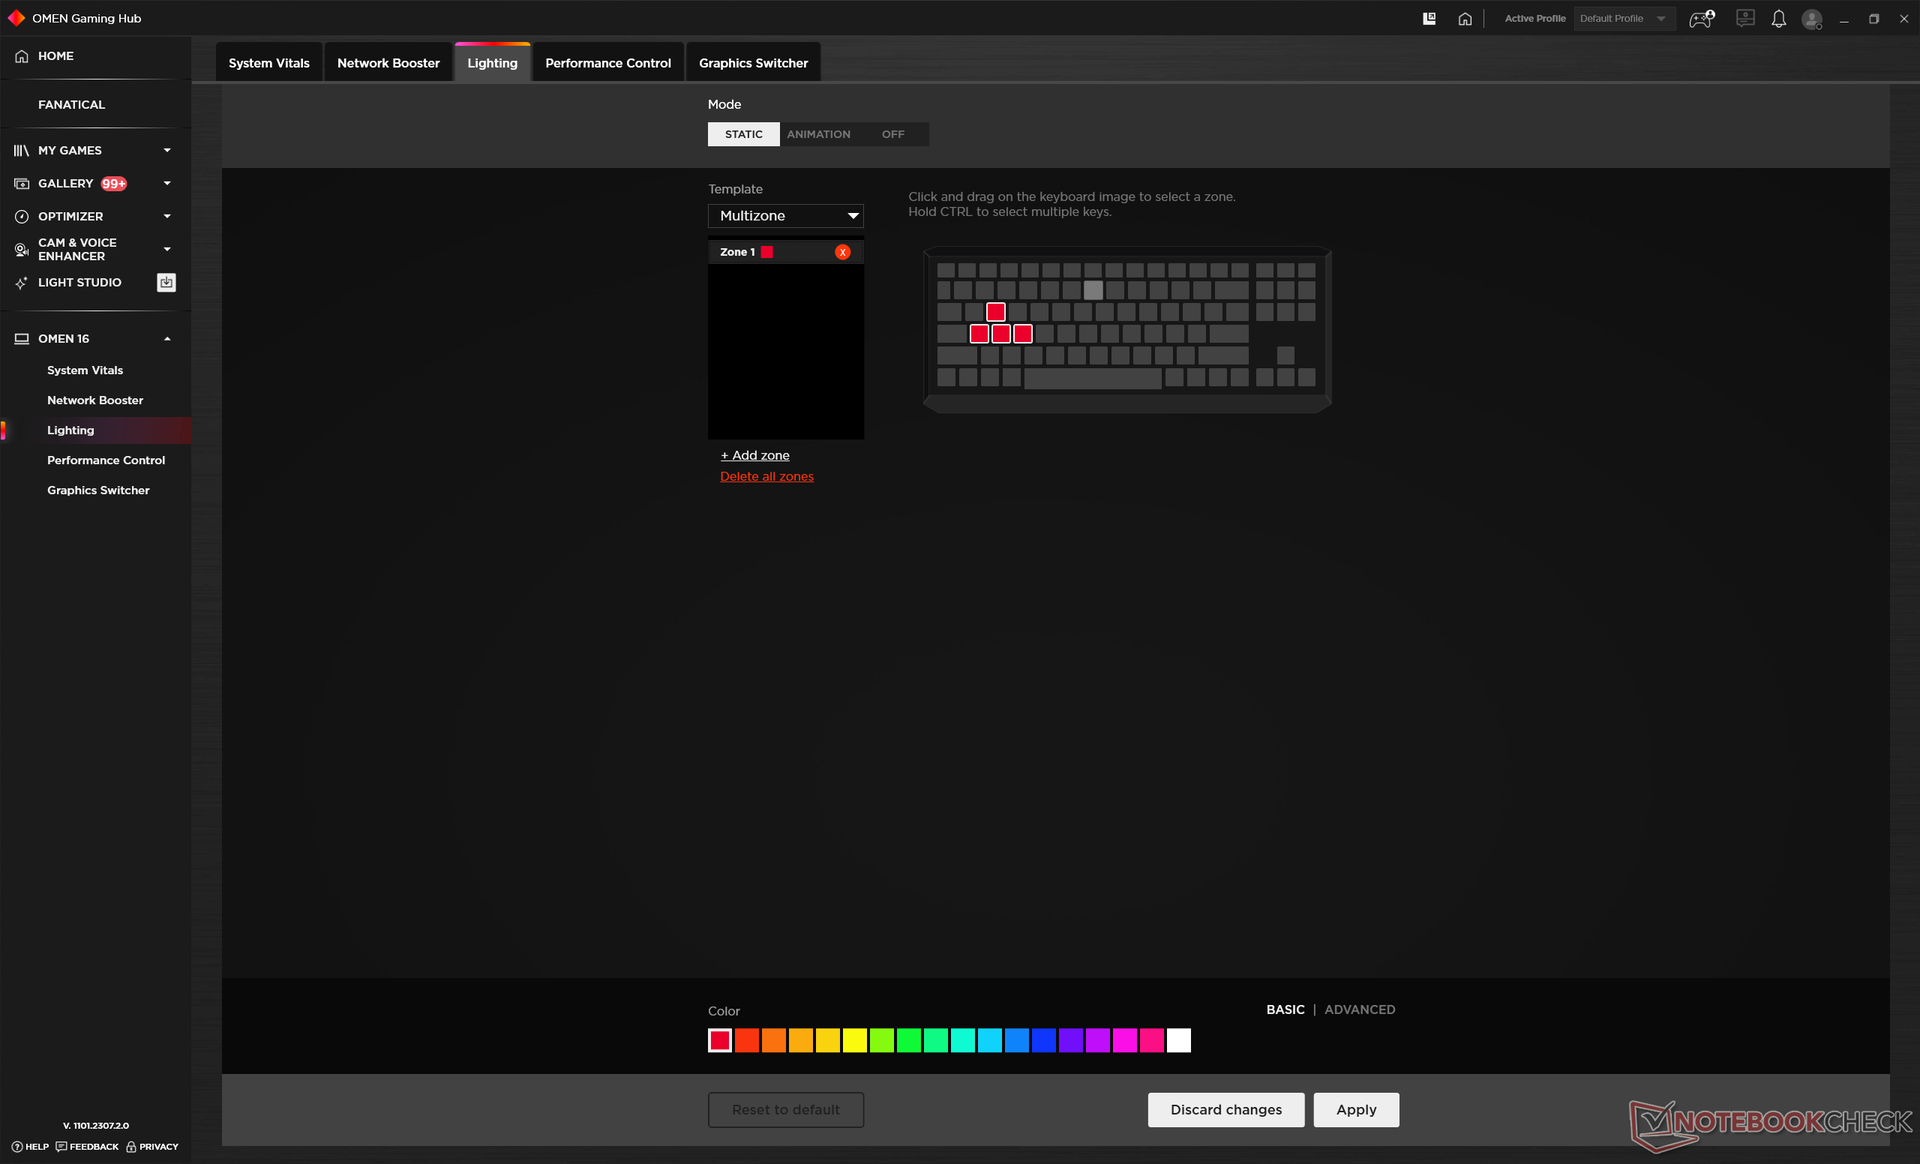
输入设备 - 熟悉的预兆外观和感觉
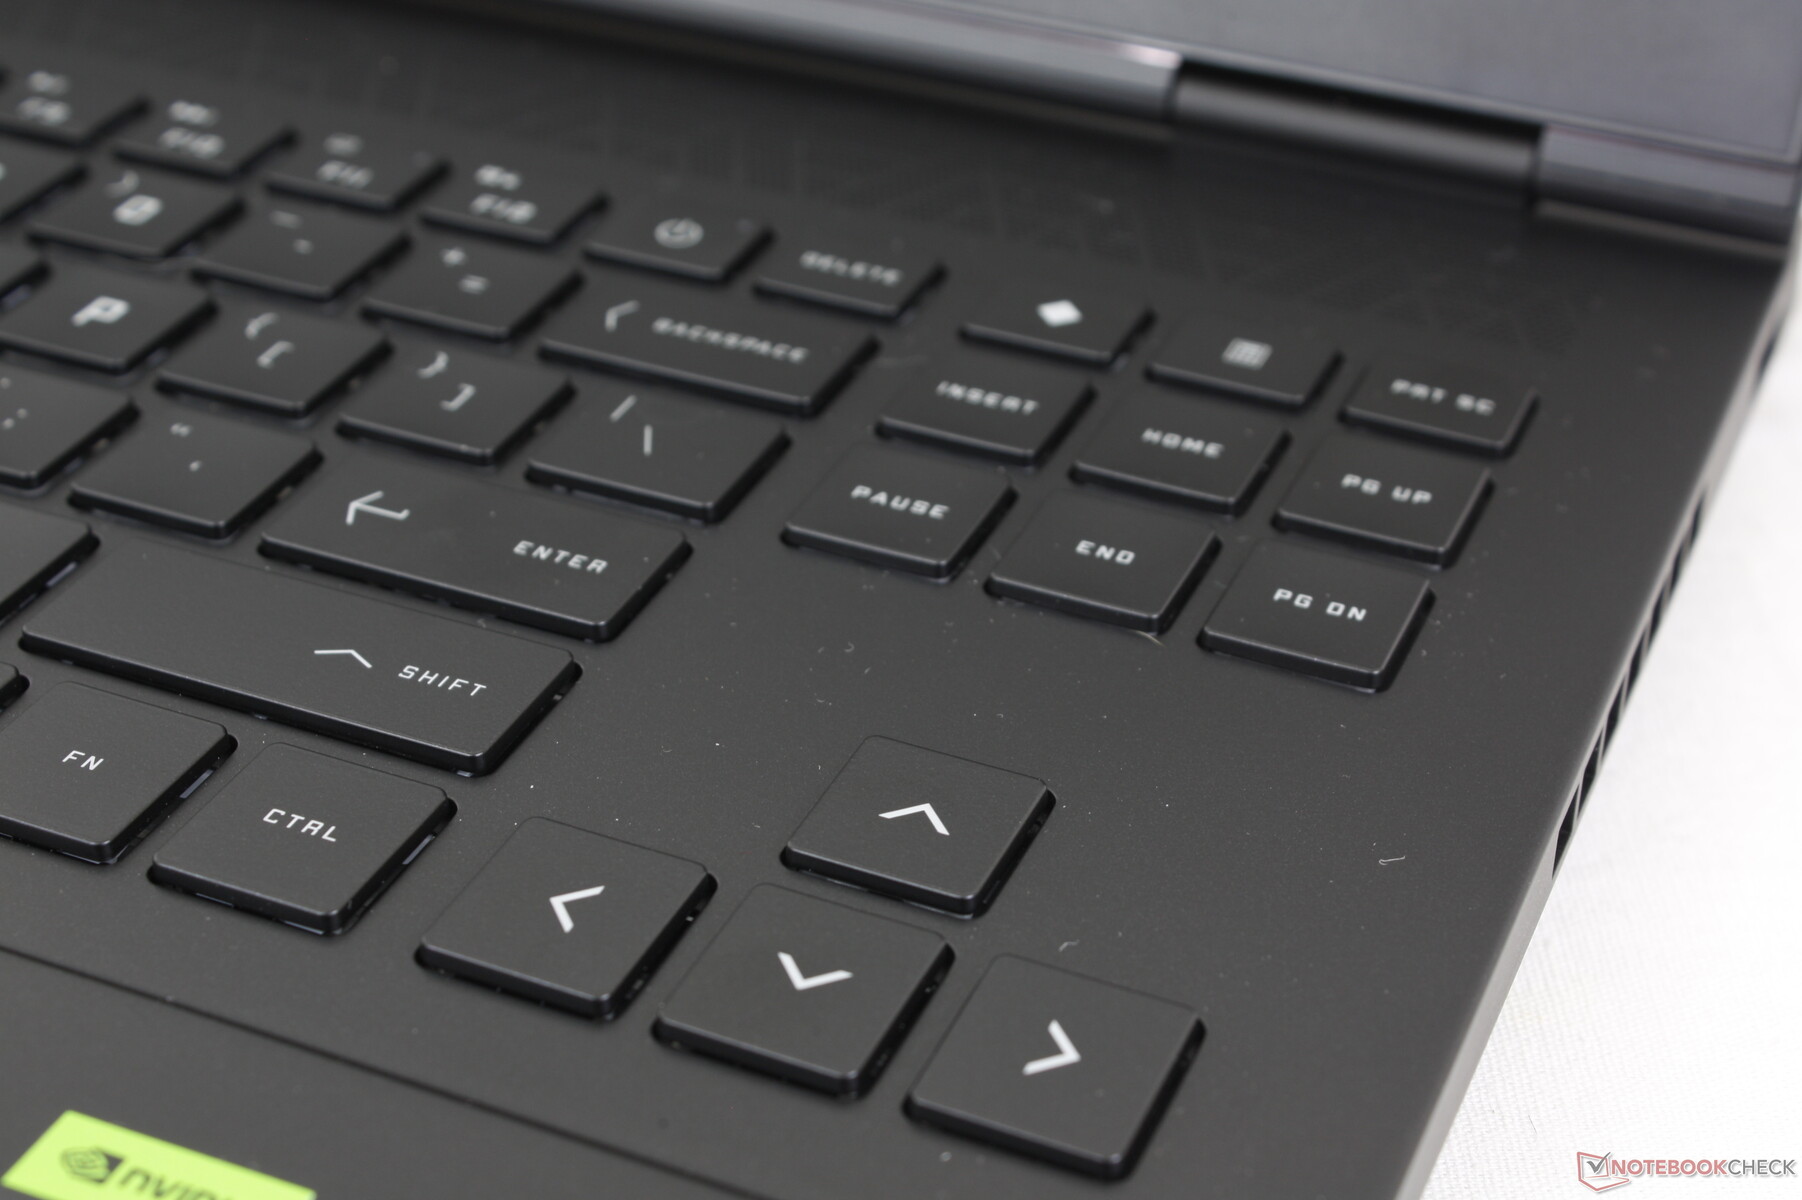
键盘
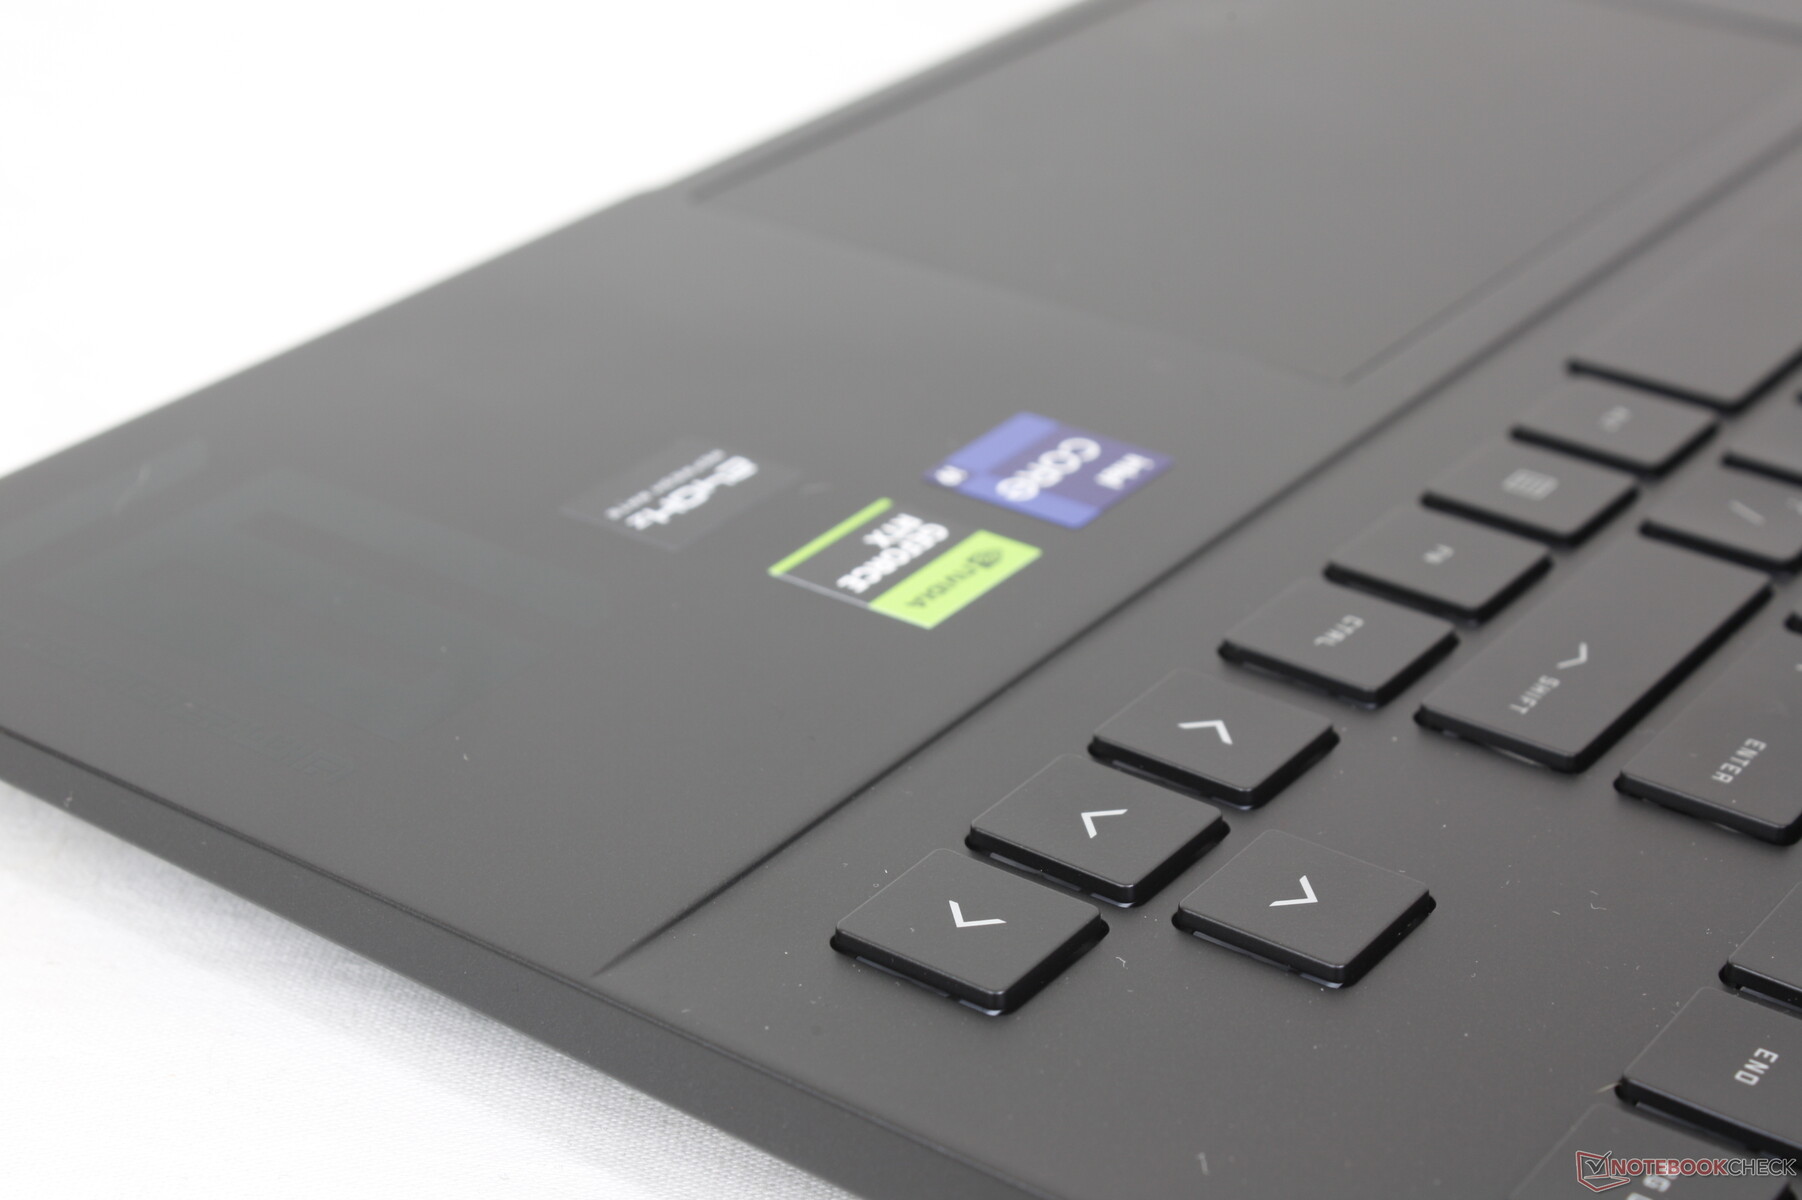
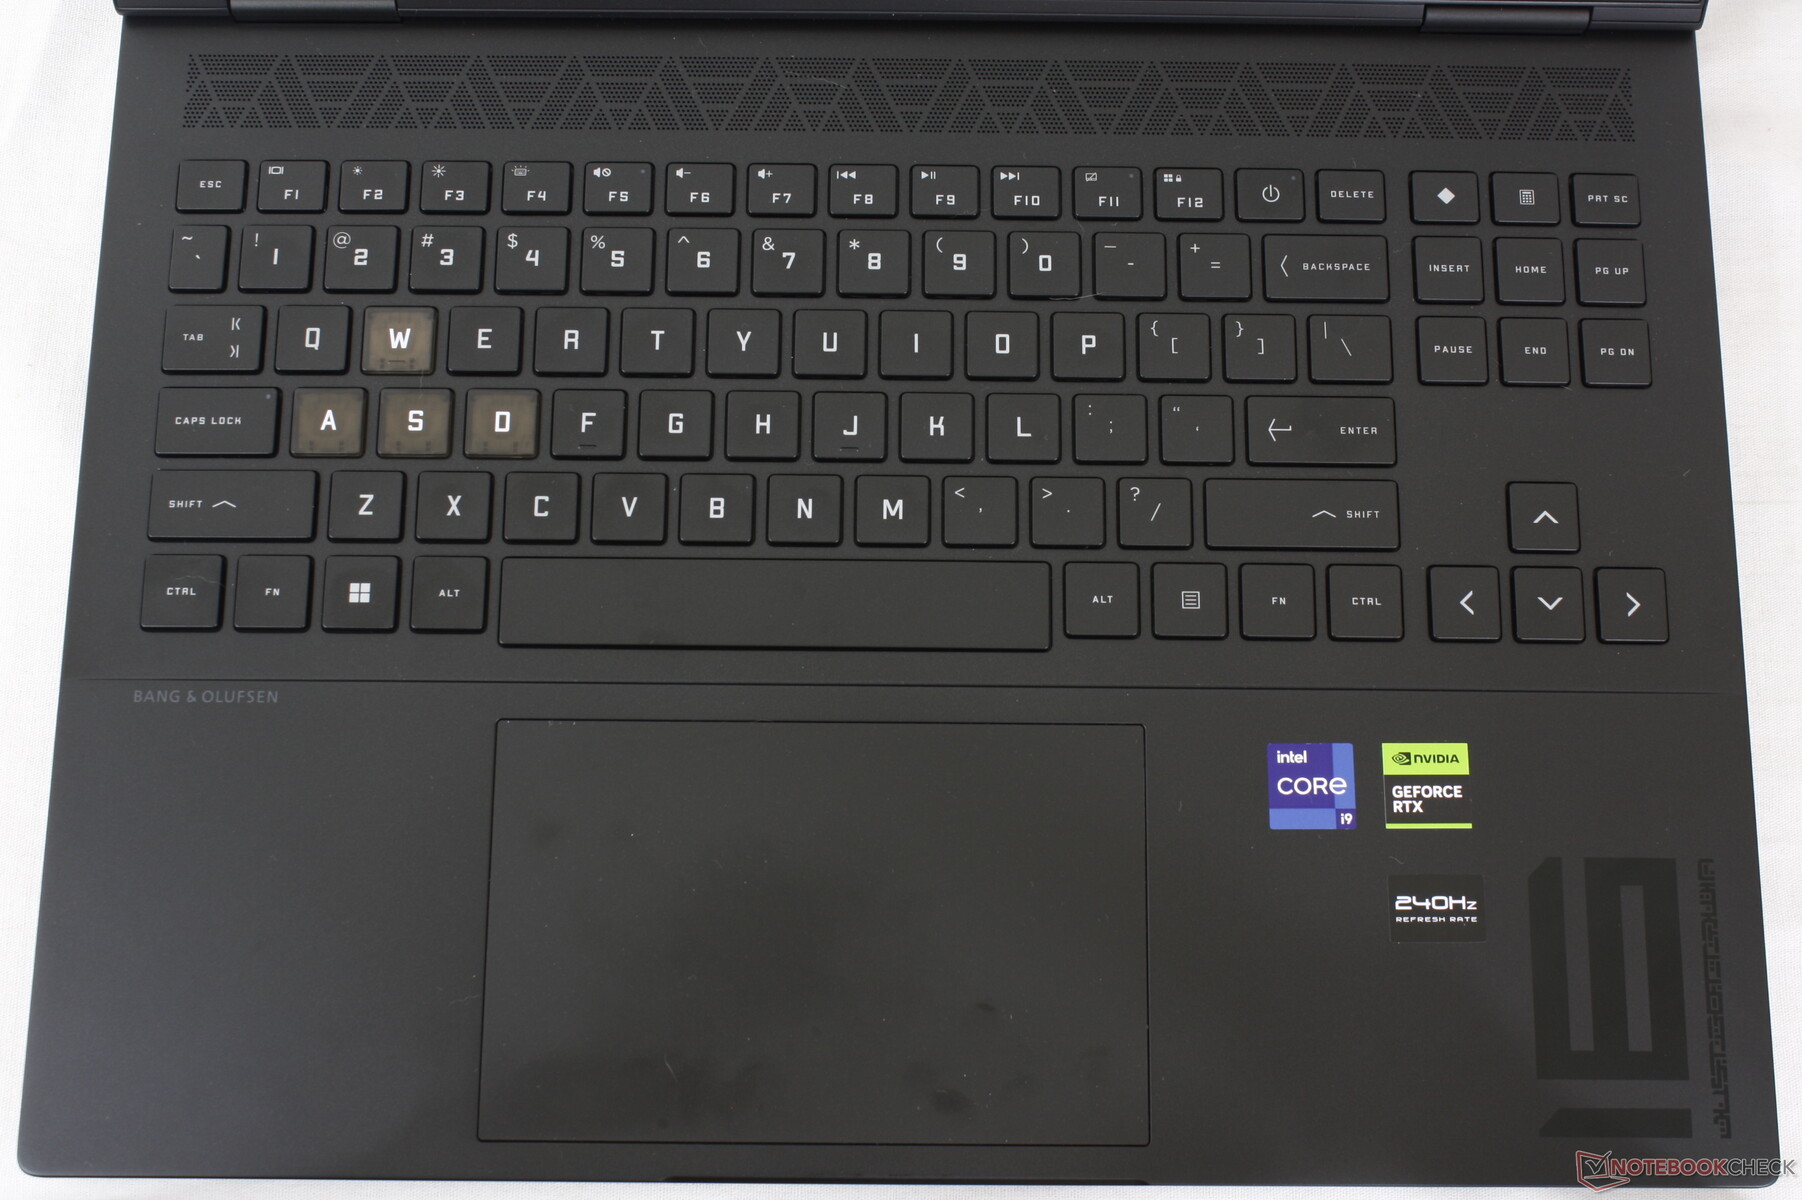
WASD 键现在采用了半透明键帽,更具游戏美感。我们对 Omen 16 键盘的所有评论仍然适用于 Omen Transcend 16。
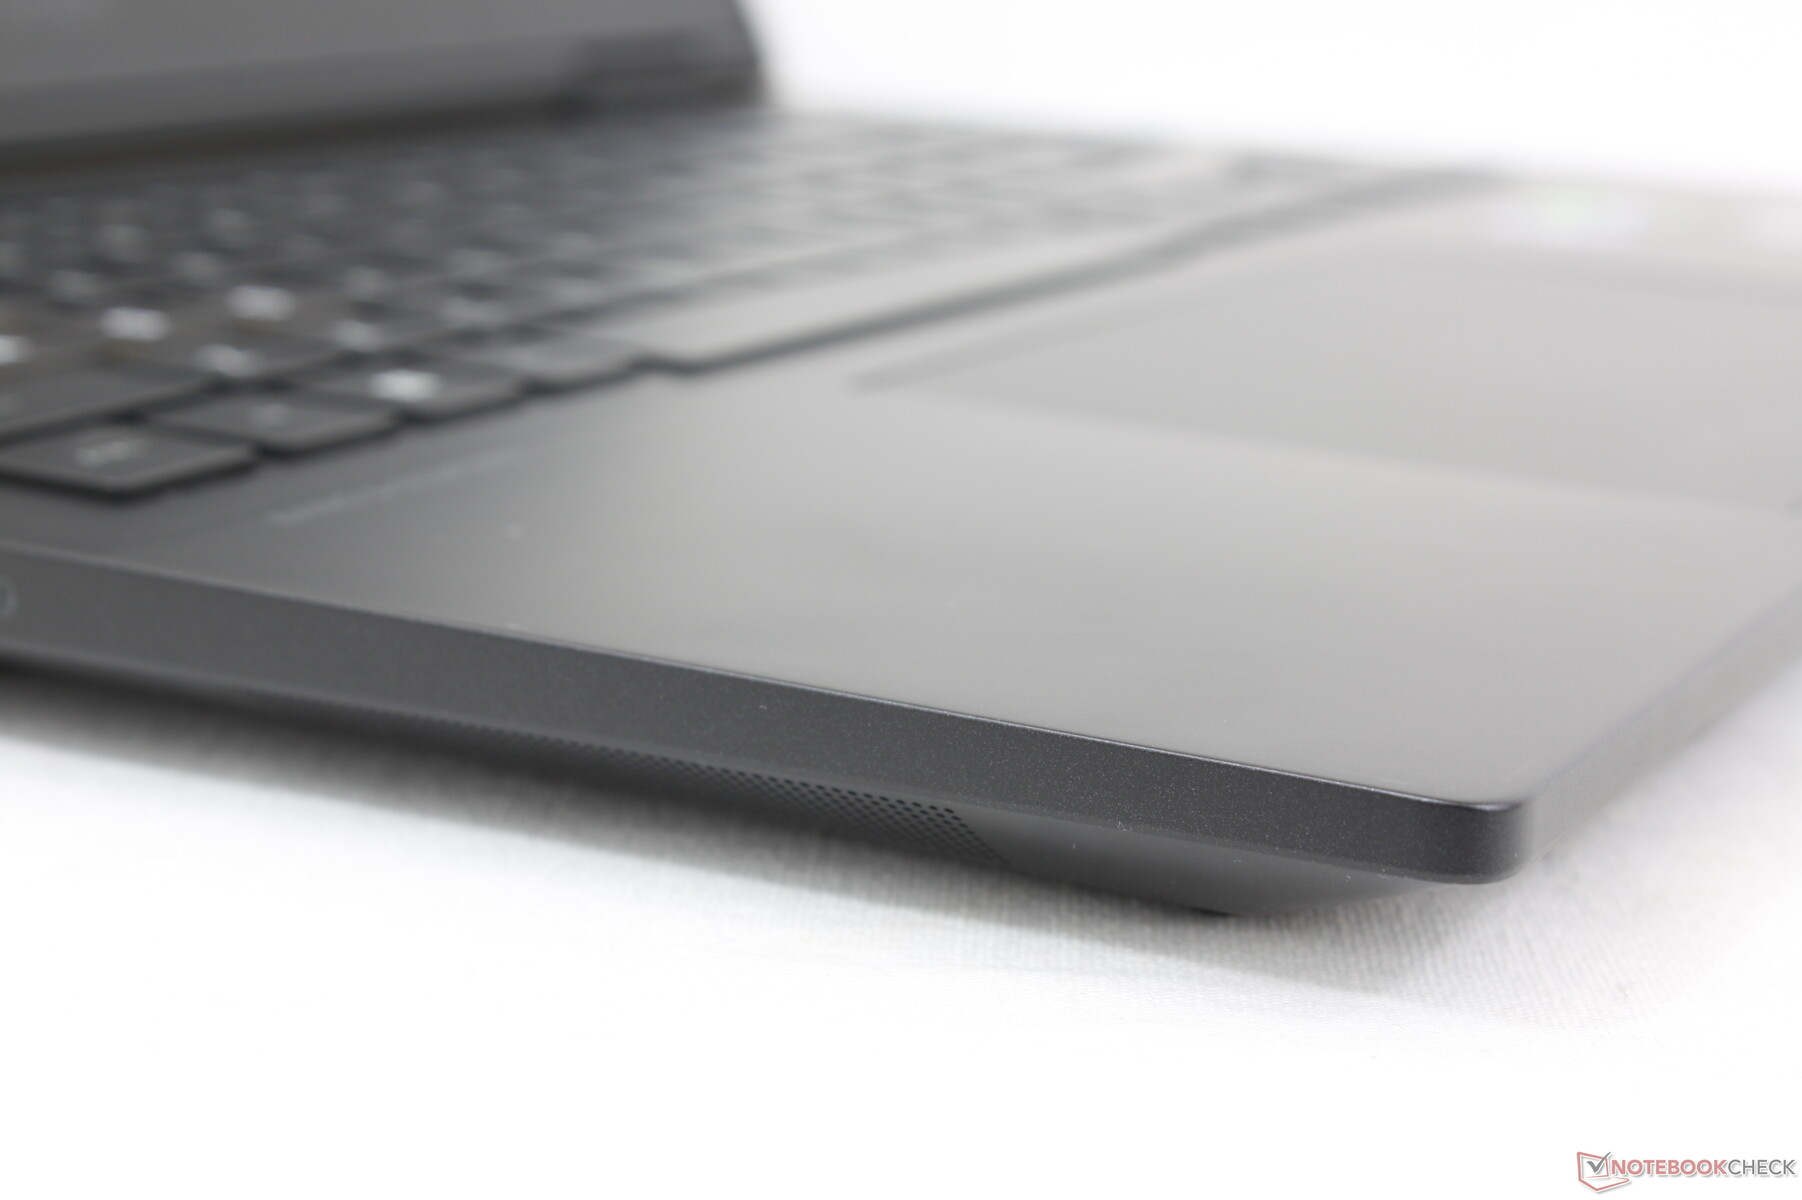
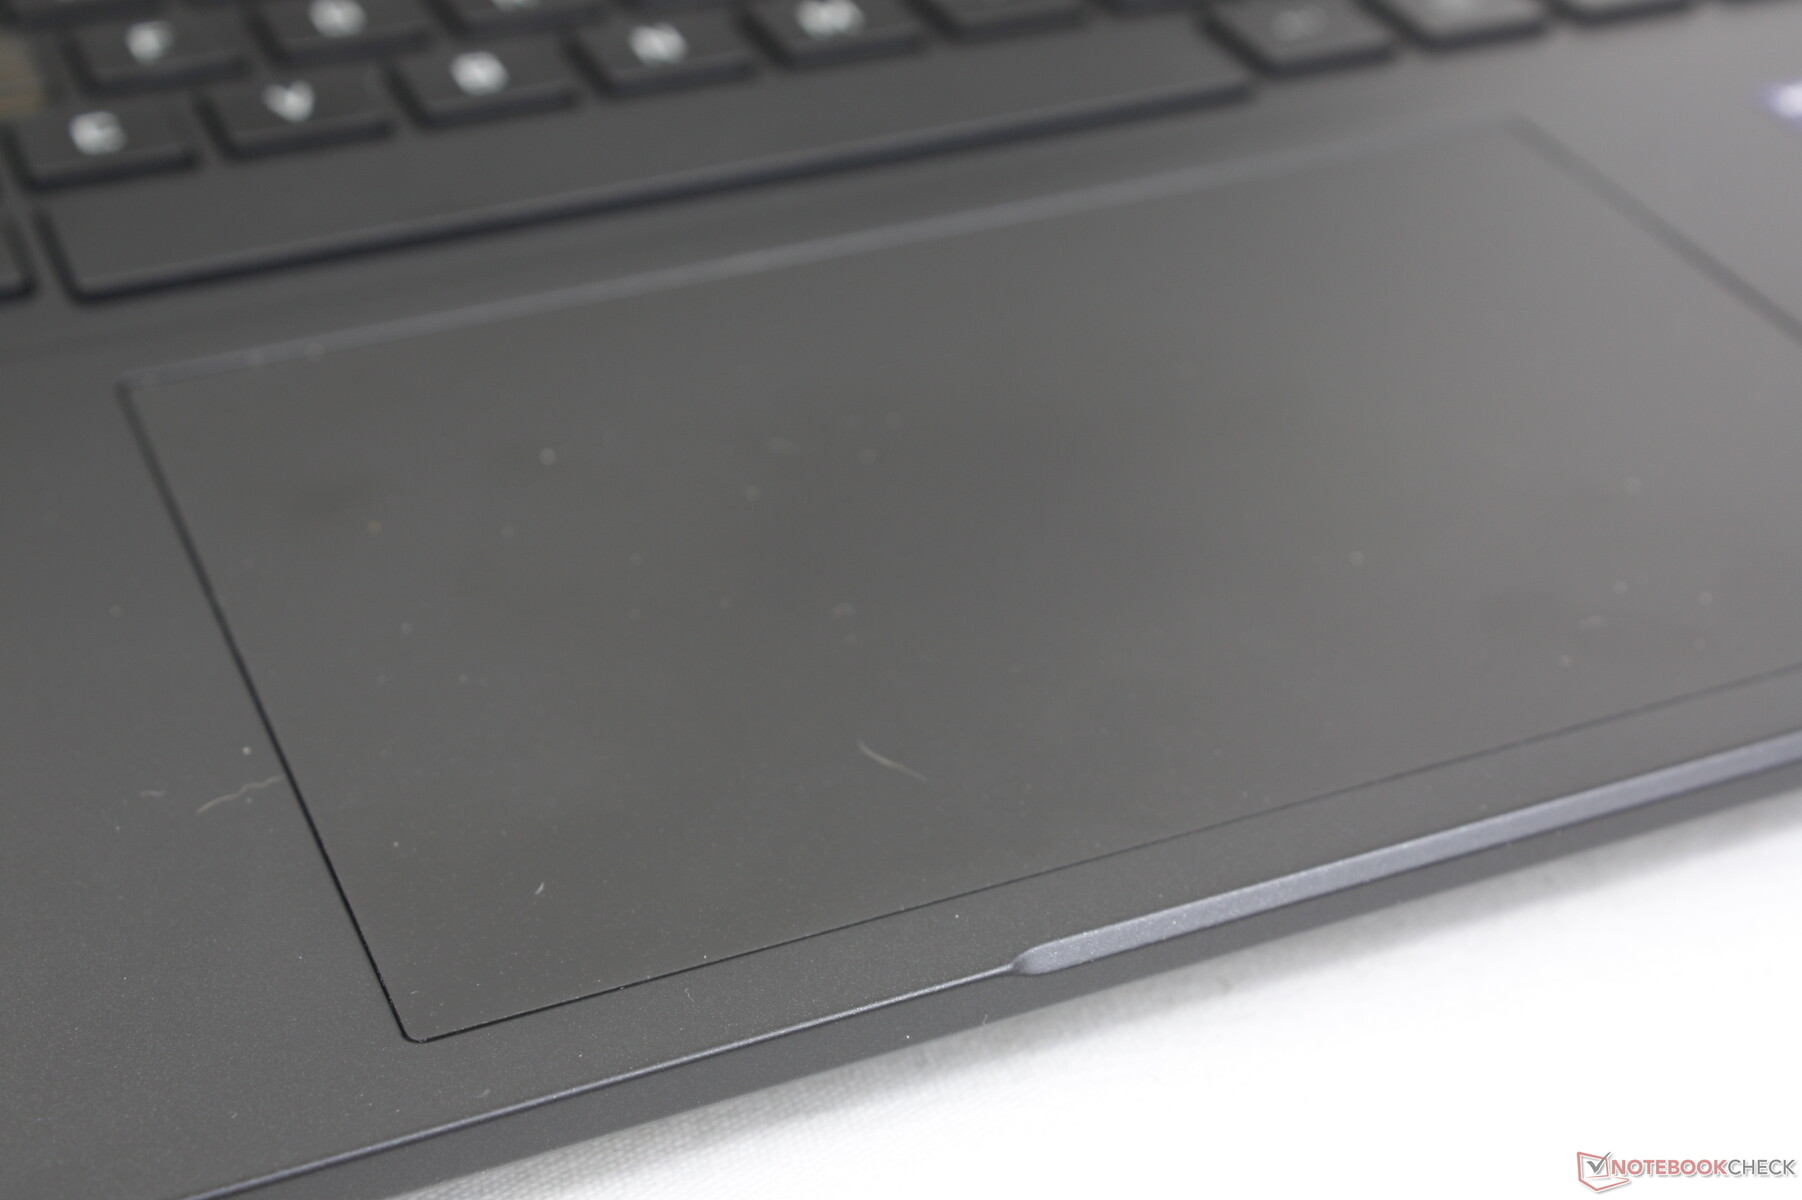
触摸板
点击板尺寸从最近的 Omen 16 的 12.5 x 8 厘米变为 Omen Transcend 16 的 13.5 x 8.6 厘米。虽然反应灵敏,滚动空间很大,但点击时的反馈较浅,如果能更有力一些,点击效果会更令人满意。

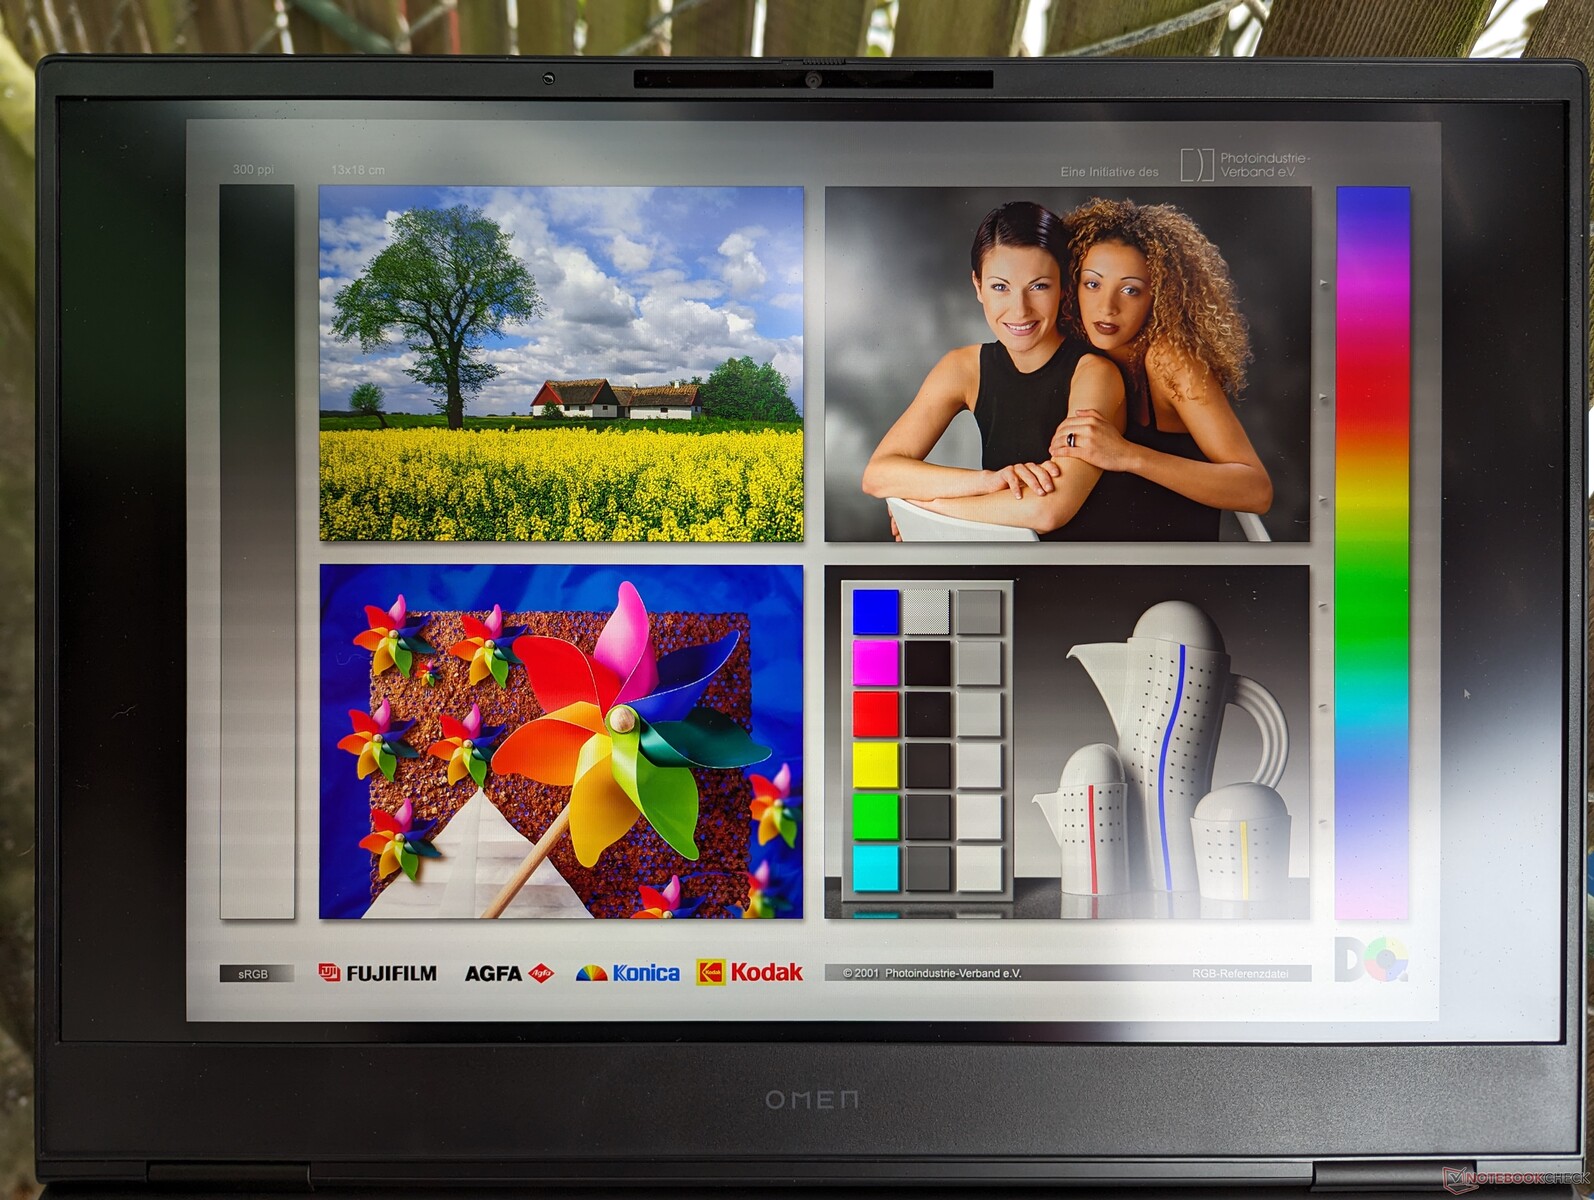
显示屏 - Mini-LED, 240 Hz, 1600p, 16:10, 1180 nits, 100% P3 Colors

Omen Transcend 16 和 Omen 16 之间的另一个主要区别因素是新的迷你 LED 面板选项。Mini-LED 结合了 IPS 的优势(即刷新率快、价格相对低廉)和 OLED 的优势(即亮度更高、黑度更深),是三种显示技术之间的中间选择。面板背后的 1000 个独立发光区提供了接近 OLED 独立发光像素的视觉体验。
惠普宣传的峰值亮度为 1180 尼特。我们使用HDR 亮度测试进行了独立测量 记录的最高亮度为 1233 尼特,证实了惠普的说法。请注意,只有在特定的 HDR 条件下才能达到这一最高值,类似于 华硕 VivoBook的最大亮度限制在约 800 尼特(显示全白无黑时)。即便如此,800 尼特的亮度几乎是大多数其他 IPS 笔记本电脑的 2 倍。
与同类竞争产品的迷你 LED 显示屏相比联想 Slim Pro 9 16惠普显示器的原始分辨率较低(2560 x 1600 对 3200 x 2000),但刷新率较高(240 Hz 对 165 Hz)。


| |||||||||||||||||||||||||
Brightness Distribution: 95 %
Center on Battery: 791.1 cd/m²
Contrast: 19778:1 (Black: 0.04 cd/m²)
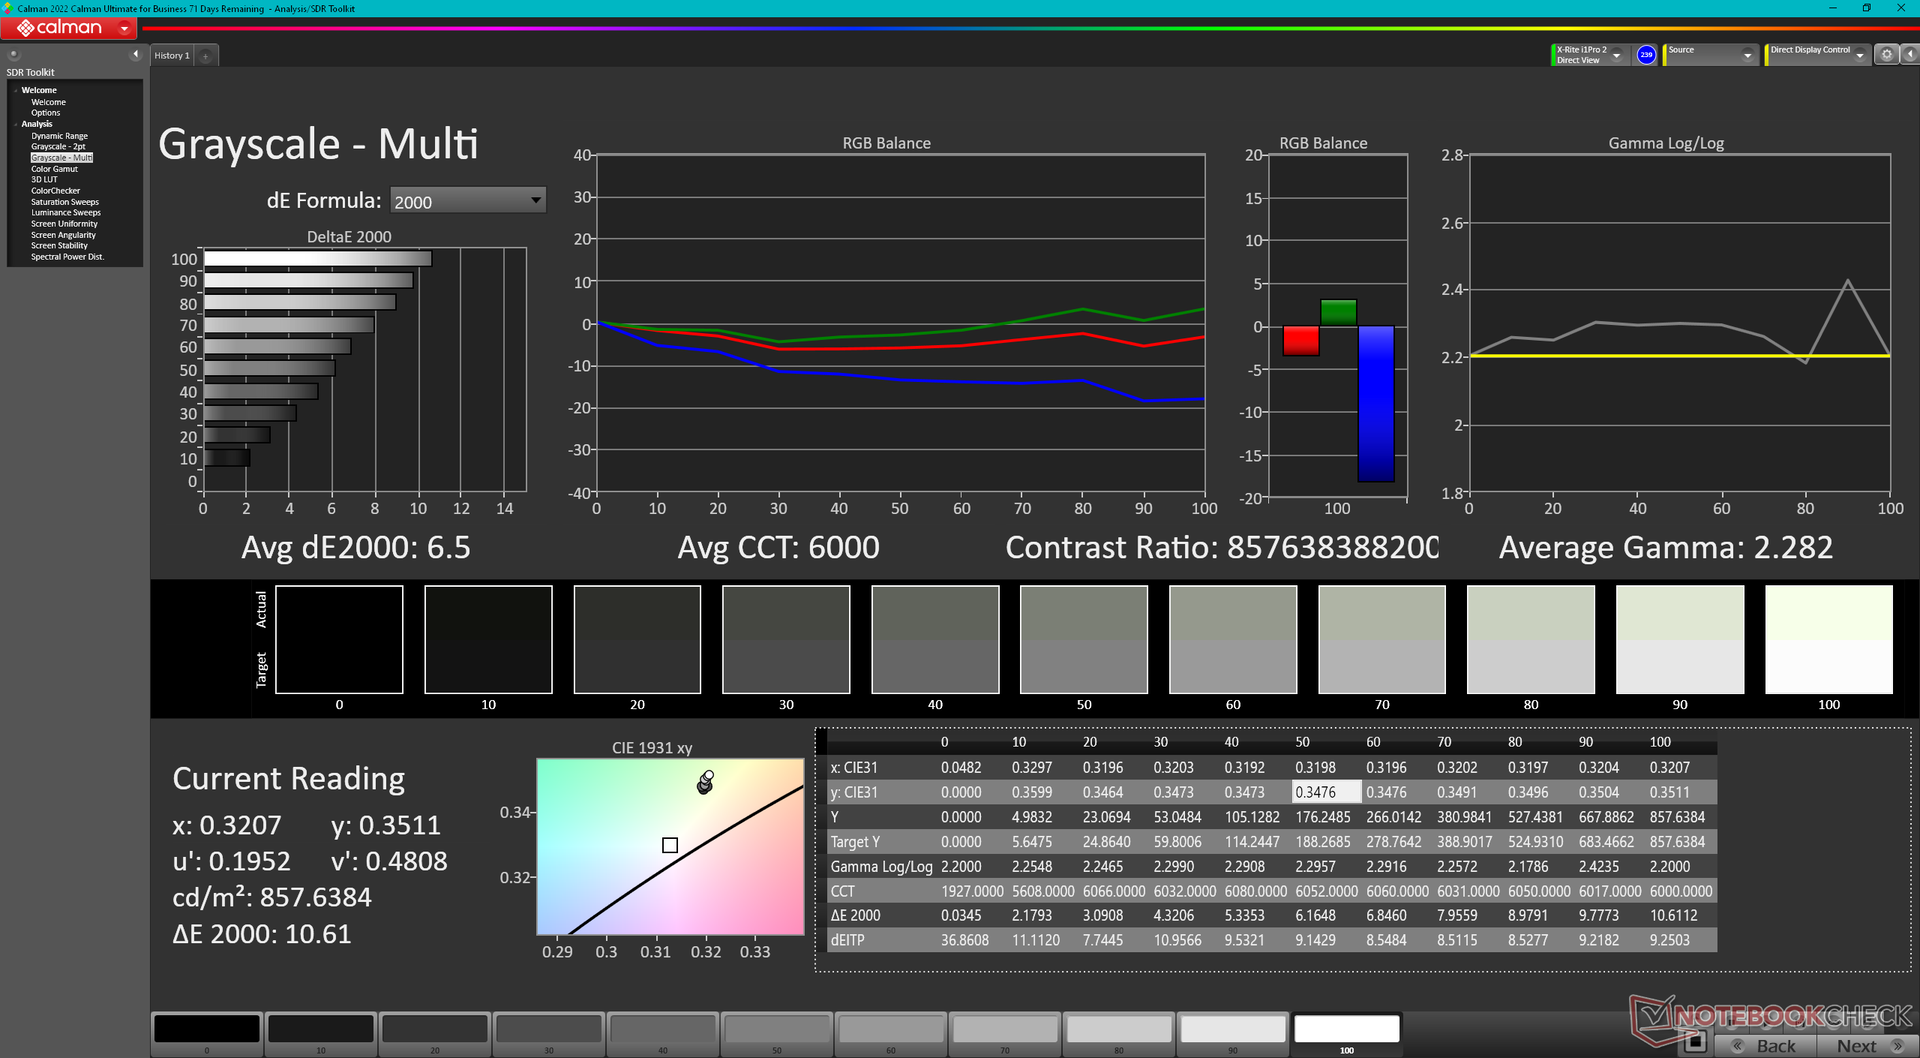
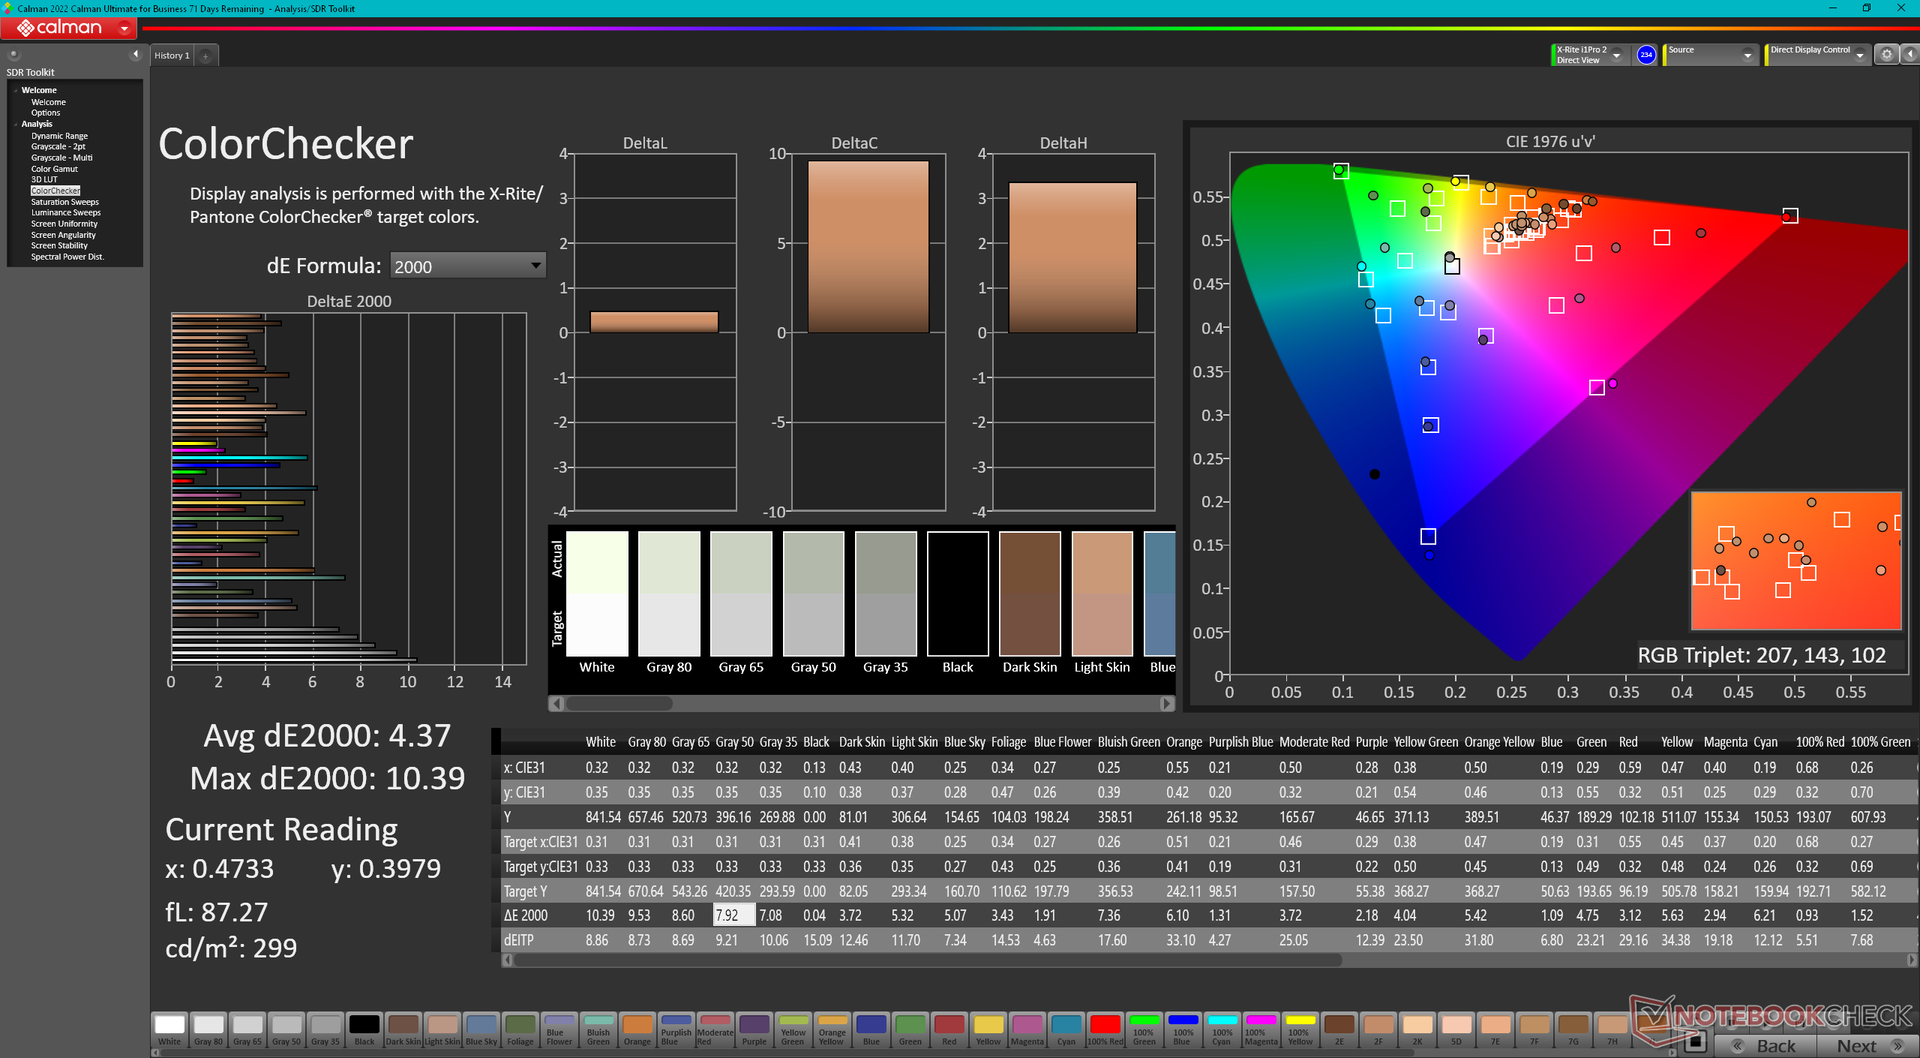
ΔE ColorChecker Calman: 4.37 | ∀{0.5-29.43 Ø4.71}
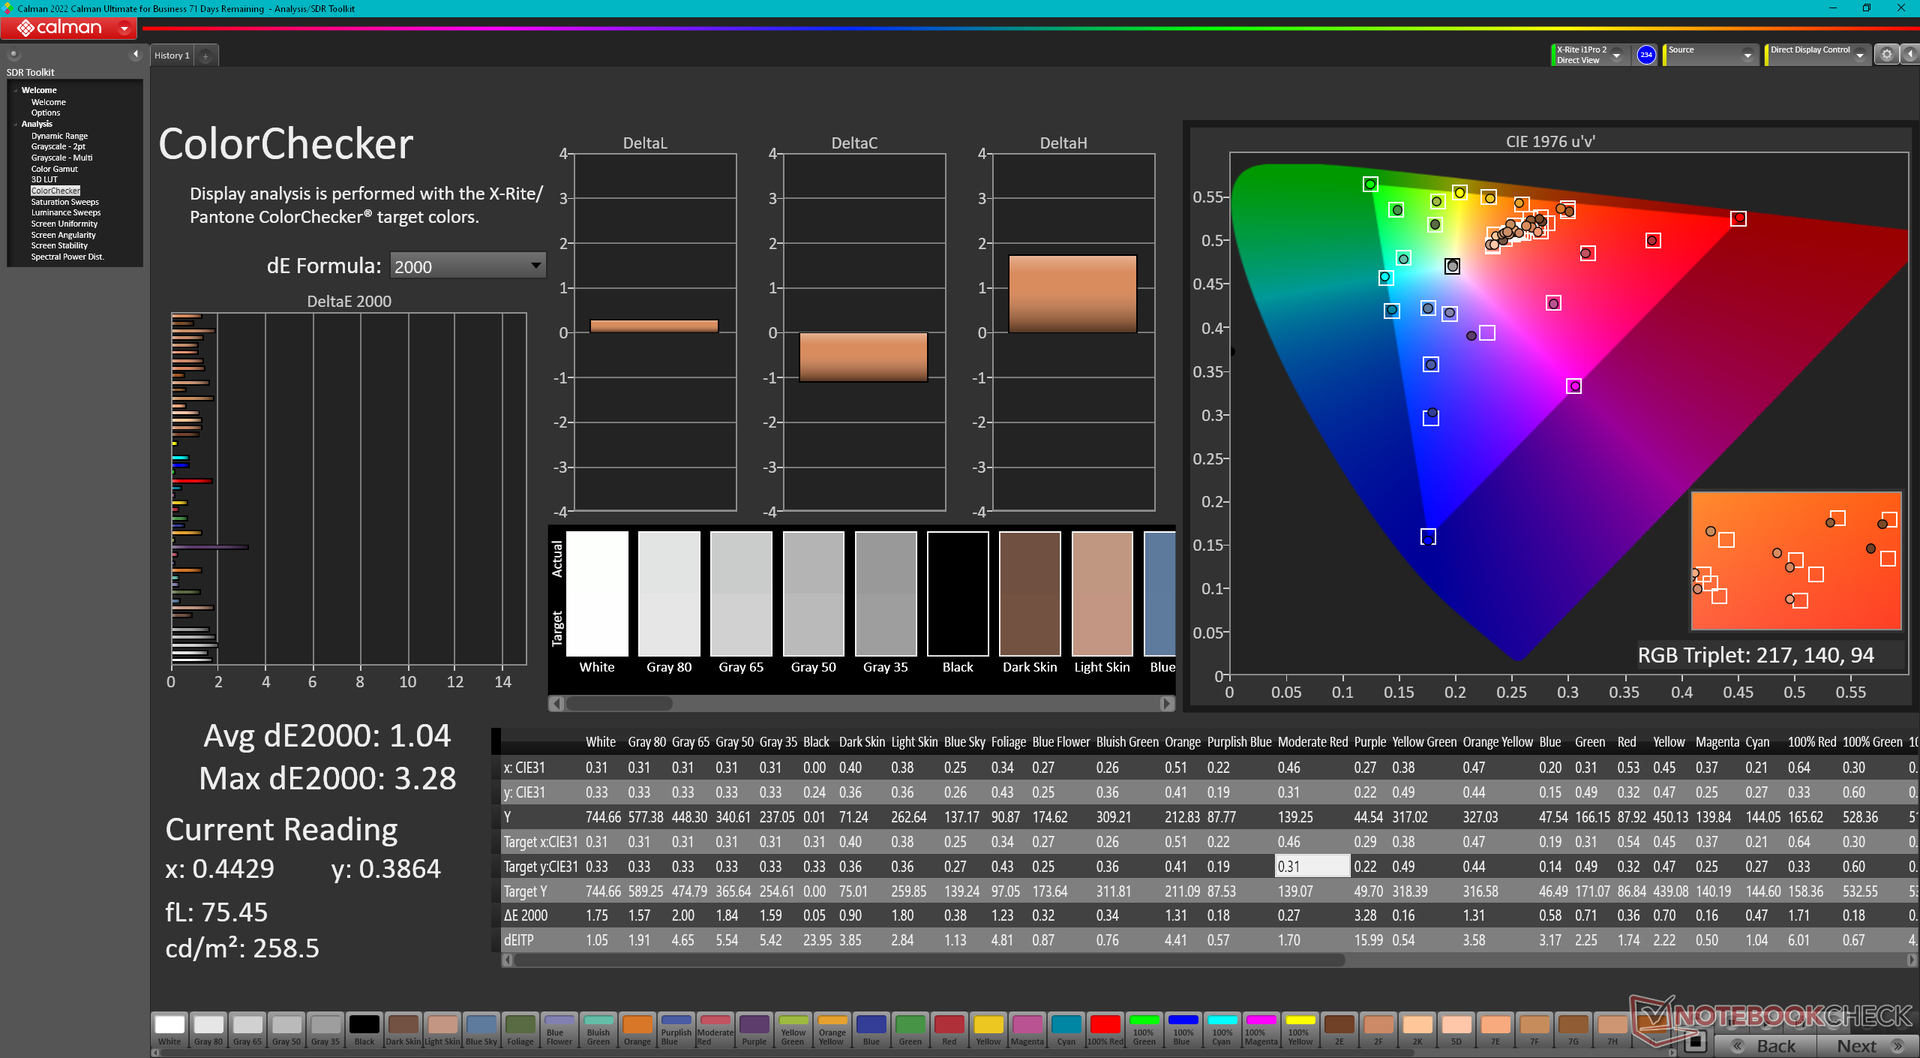
calibrated: 1.04
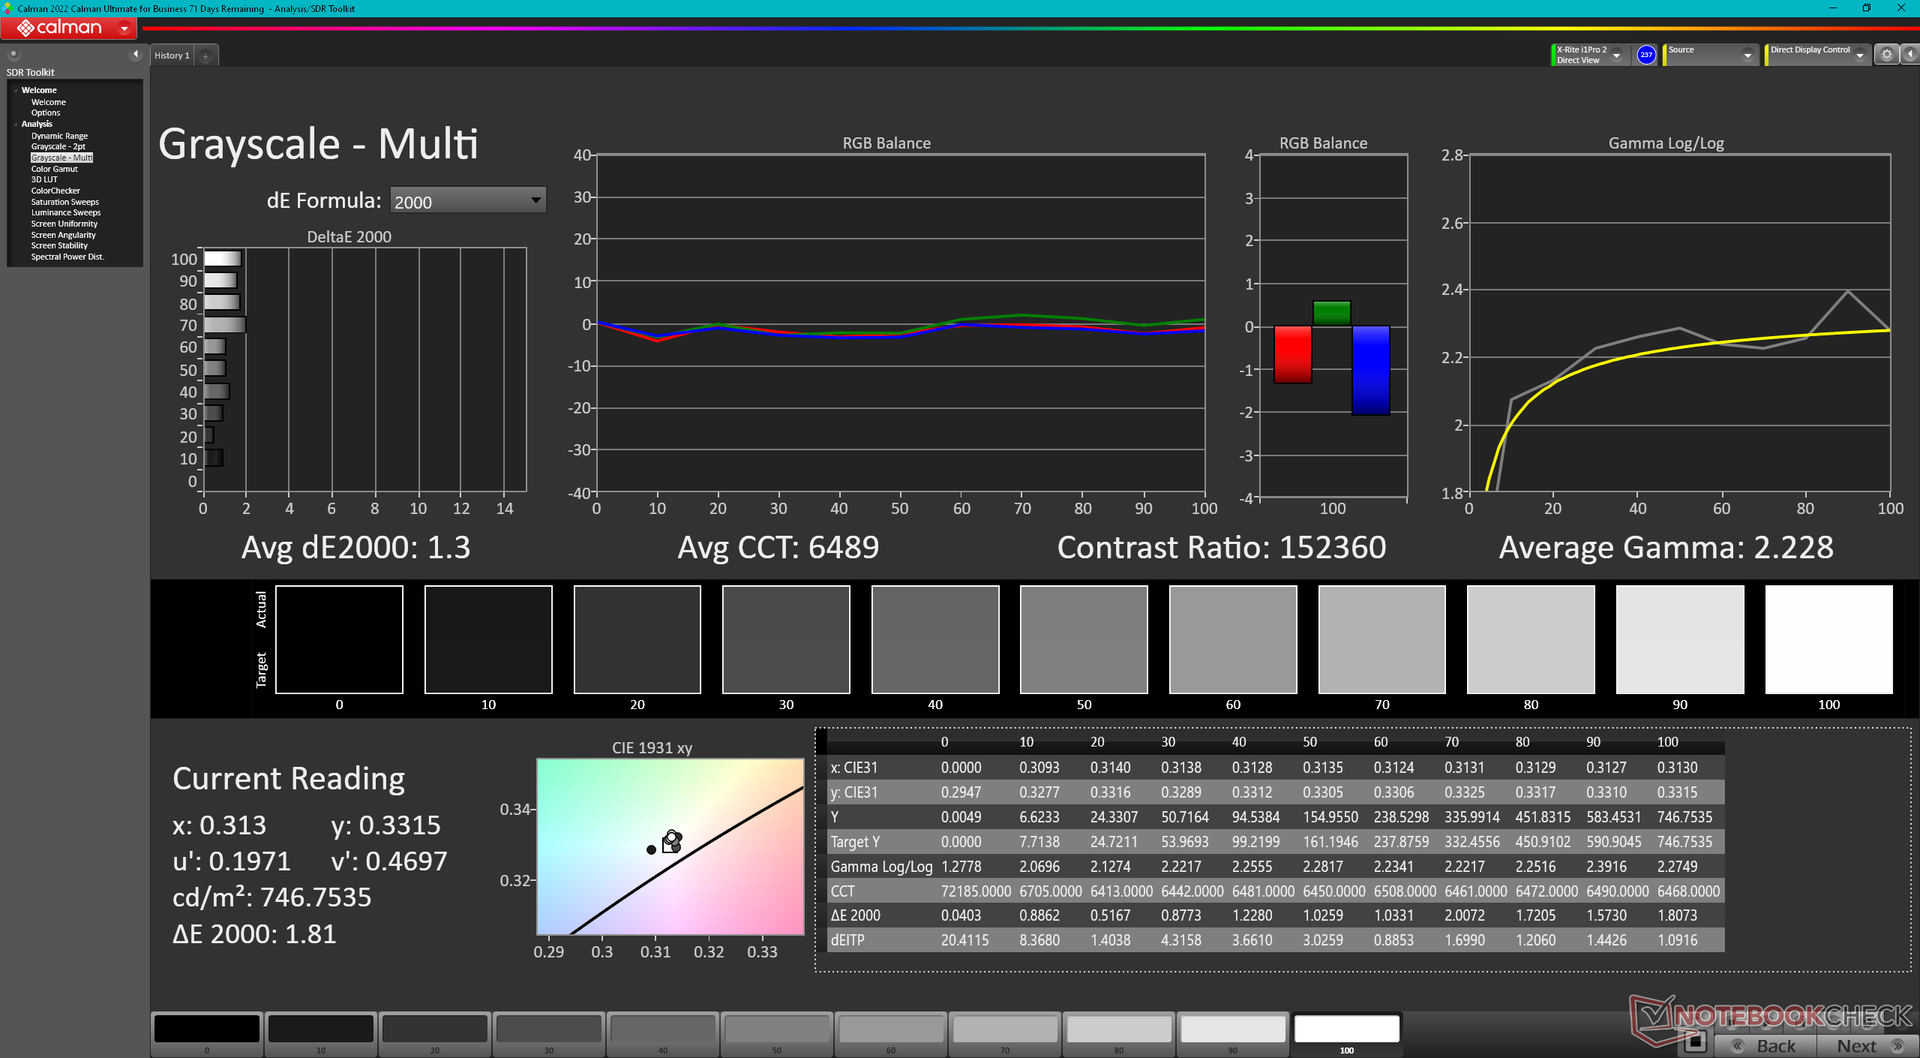
ΔE Greyscale Calman: 6.5 | ∀{0.09-98 Ø4.96}
87.6% AdobeRGB 1998 (Argyll 3D)
100% sRGB (Argyll 3D)
99.2% Display P3 (Argyll 3D)
Gamma: 2.28
CCT: 6000 K
| HP Omen Transcend 16 AUOA3A6, Mini-LED, 2560x1600, 16" | Lenovo Legion Slim 7i 16 Gen 8 CSOT T3 MNG007DA2-3, IPS, 2560x1600, 16" | HP Omen 16-wf000 BOE0B7D, IPS, 2560x1440, 16.1" | Alienware x16 R1 BOE NE16NZ4, IPS, 2560x1600, 16" | Acer Nitro 16 AN16-41 BOE CQ NE16QDM-NY1, IPS, 2560x1600, 16" | Asus ROG Zephyrus M16 GU603Z BOE0A0B (BOE CQ NE160QDM-NY3), IPS, 2560x1600, 16" | |
|---|---|---|---|---|---|---|
| Display | -16% | -17% | 0% | -18% | -4% | |
| Display P3 Coverage (%) | 99.2 | 70.4 -29% | 69 -30% | 99.2 0% | 67.9 -32% | 92.8 -6% |
| sRGB Coverage (%) | 100 | 99.4 -1% | 99.2 -1% | 100 0% | 99.1 -1% | 98.5 -1% |
| AdobeRGB 1998 Coverage (%) | 87.6 | 72.5 -17% | 71.2 -19% | 88.6 1% | 69.9 -20% | 83.1 -5% |
| Response Times | 62% | 75% | 72% | 70% | 68% | |
| Response Time Grey 50% / Grey 80% * (ms) | 26.4 ? | 12 ? 55% | 4.6 ? 83% | 5.1 ? 81% | 11 ? 58% | 7.6 ? 71% |
| Response Time Black / White * (ms) | 28.2 ? | 8.9 ? 68% | 9.7 ? 66% | 10.3 ? 63% | 5 ? 82% | 10 ? 65% |
| PWM Frequency (Hz) | 3506 ? | |||||
| Screen | -95% | -86% | -67% | -95% | -79% | |
| Brightness middle (cd/m²) | 791.1 | 474.6 -40% | 310.9 -61% | 302.2 -62% | 520 -34% | 497 -37% |
| Brightness (cd/m²) | 800 | 445 -44% | 296 -63% | 285 -64% | 494 -38% | 481 -40% |
| Brightness Distribution (%) | 95 | 86 -9% | 91 -4% | 89 -6% | 91 -4% | 82 -14% |
| Black Level * (cd/m²) | 0.04 | 0.39 -875% | 0.35 -775% | 0.26 -550% | 0.39 -875% | 0.21 -425% |
| Contrast (:1) | 19778 | 1217 -94% | 888 -96% | 1162 -94% | 1333 -93% | 2367 -88% |
| Colorchecker dE 2000 * | 4.37 | 2.12 51% | 2.18 50% | 1.63 63% | 1.94 56% | 3.53 19% |
| Colorchecker dE 2000 max. * | 10.39 | 4.73 54% | 3.58 66% | 4.13 60% | 5.62 46% | 6.15 41% |
| Colorchecker dE 2000 calibrated * | 1.04 | 0.57 45% | 0.52 50% | 1.17 -13% | 0.74 29% | 3.53 -239% |
| Greyscale dE 2000 * | 6.5 | 2.8 57% | 2.8 57% | 2.5 62% | 2.94 55% | 1.74 73% |
| Gamma | 2.28 96% | 2.22 99% | 2.18 101% | 2.23 99% | 2.37 93% | 2.2 100% |
| CCT | 6000 108% | 6542 99% | 6002 108% | 6590 99% | 6443 101% | 6418 101% |
| Total Average (Program / Settings) | -16% /
-56% | -9% /
-48% | 2% /
-33% | -14% /
-55% | -5% /
-42% |
* ... smaller is better
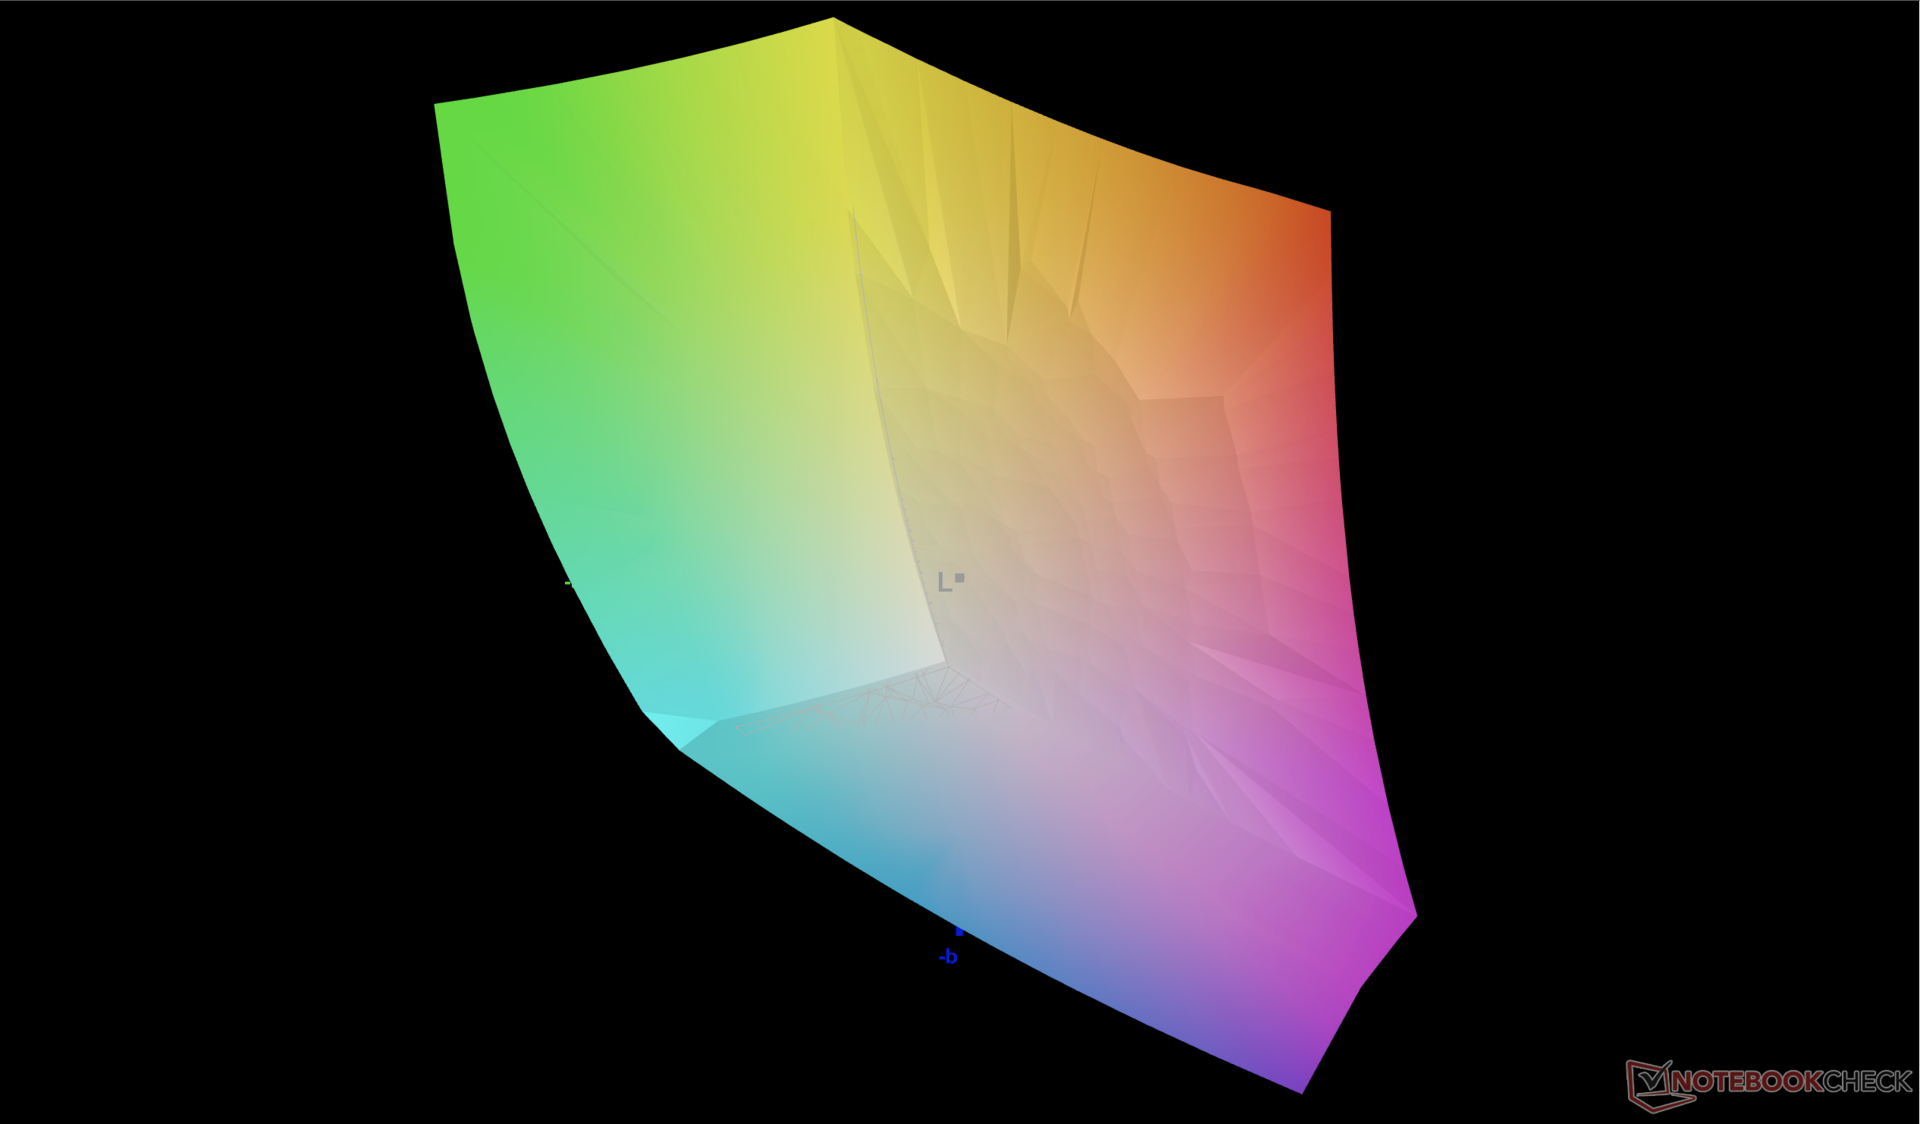
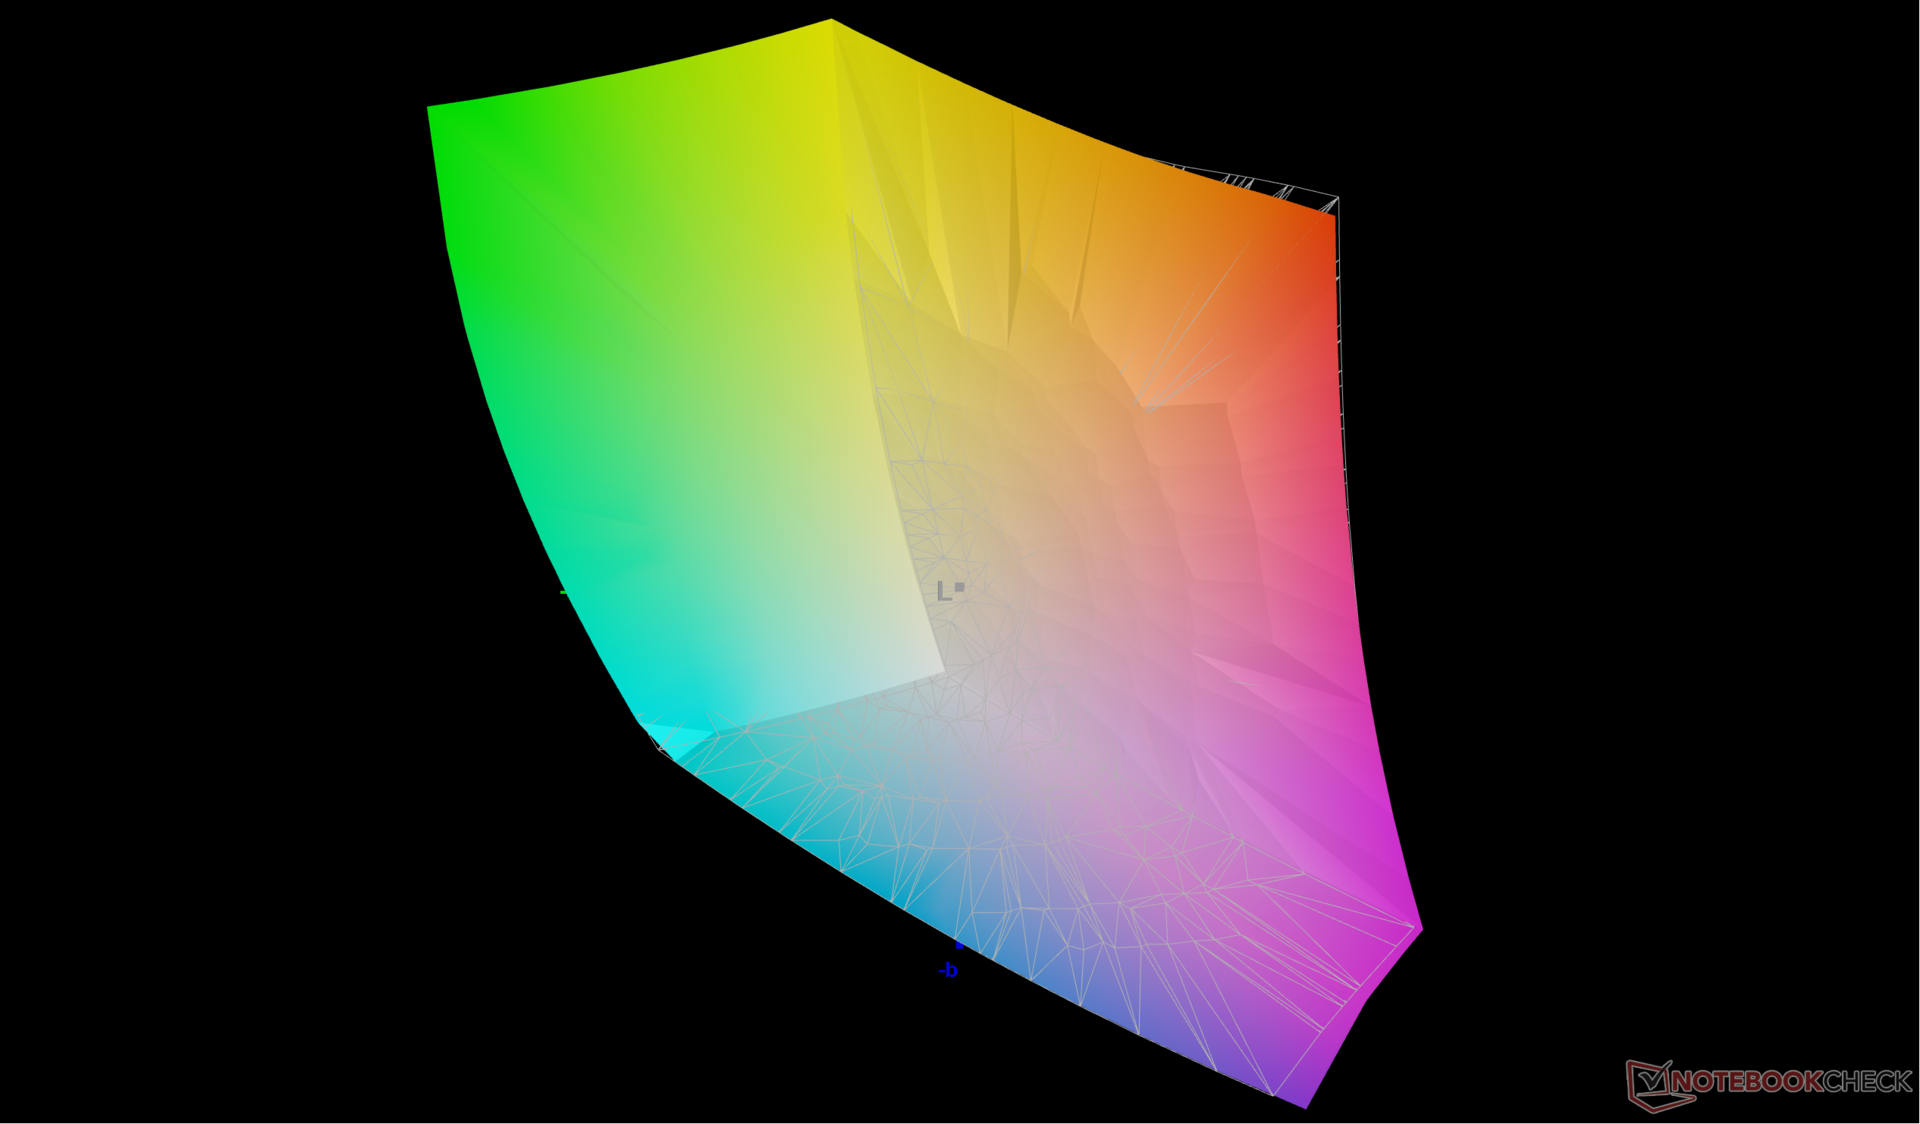
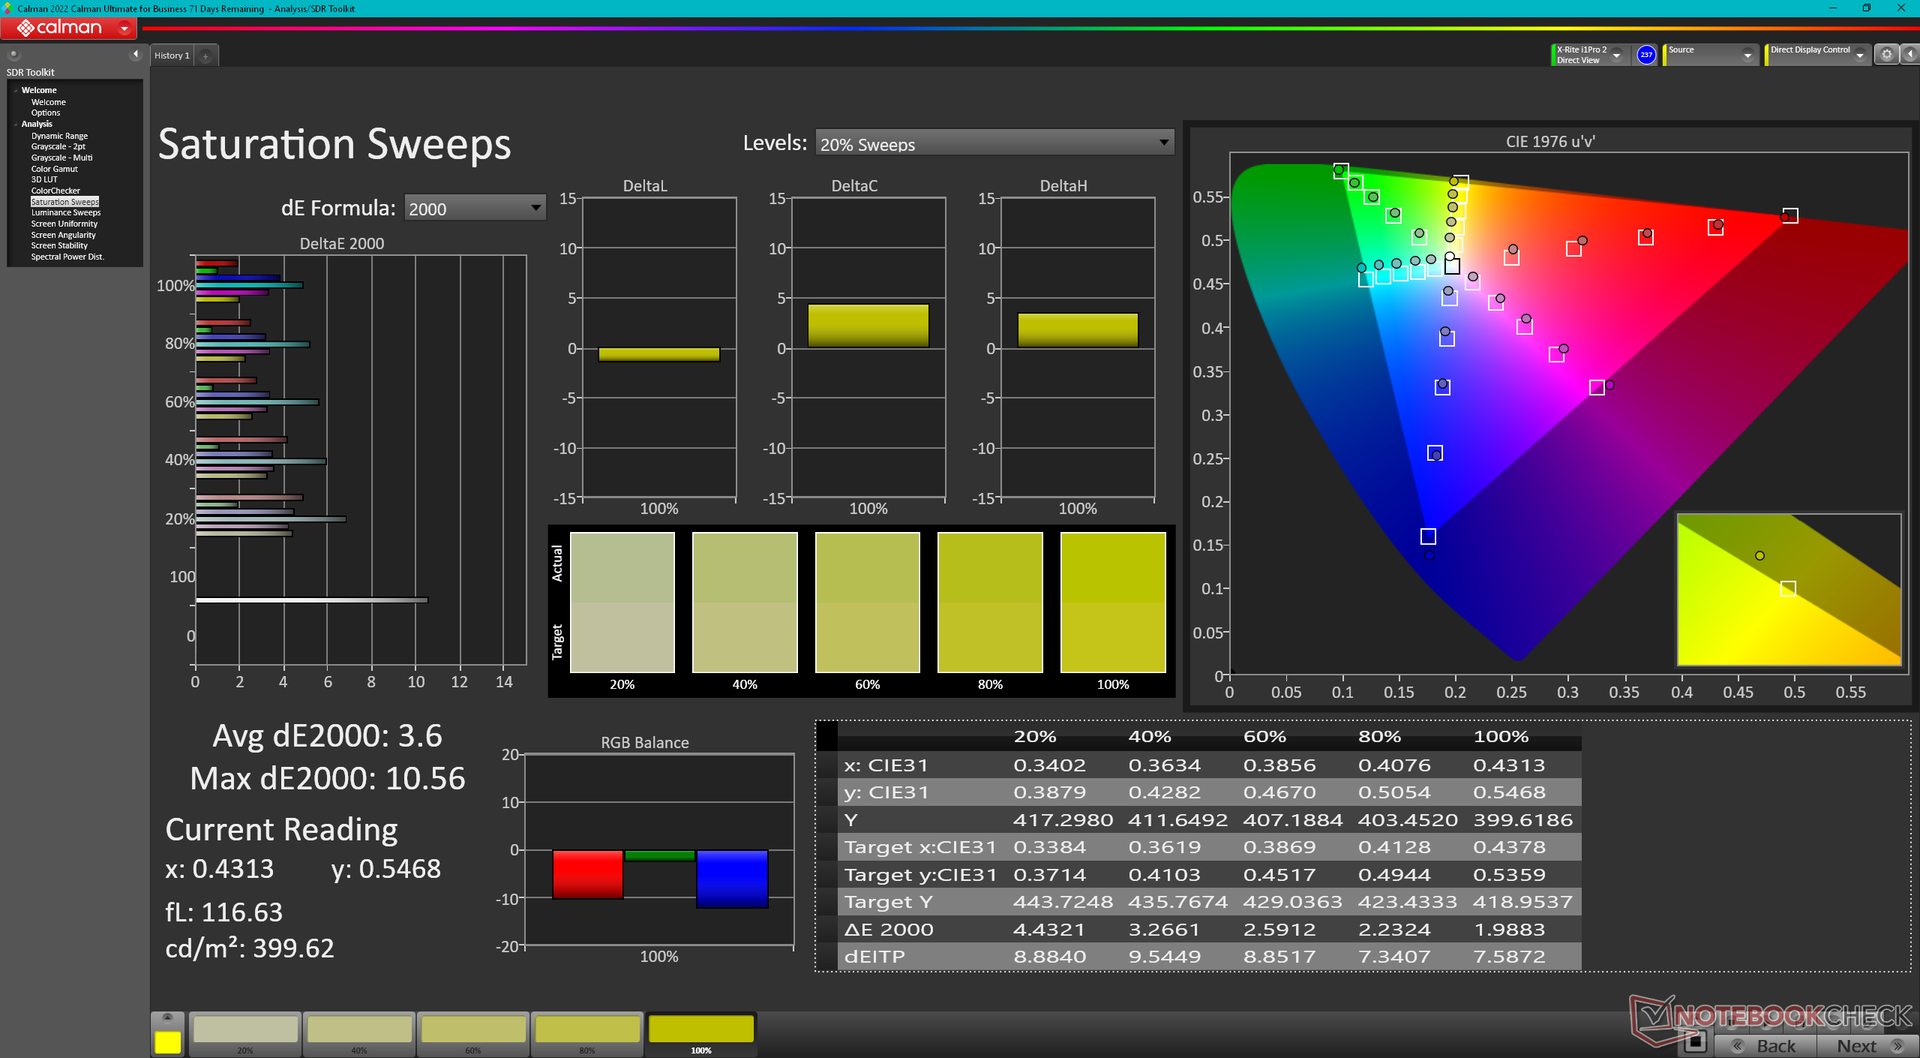
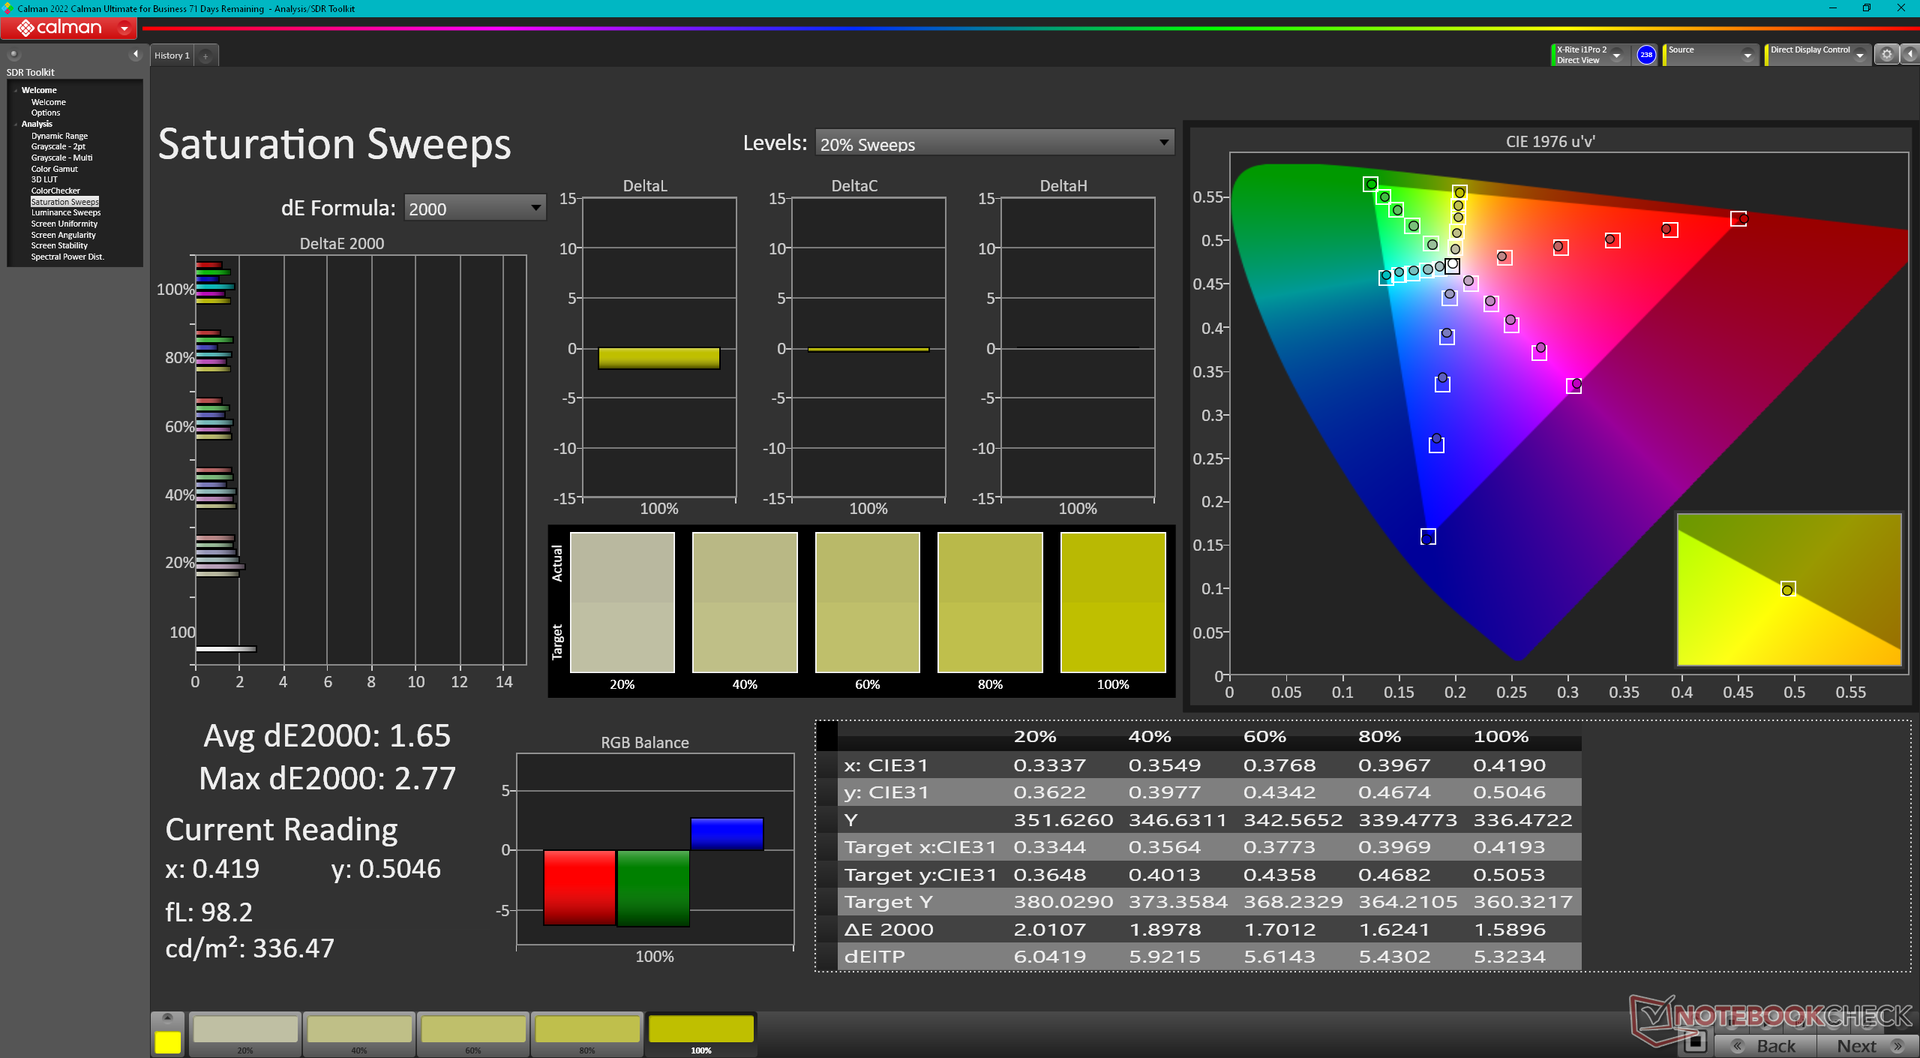
面板出厂时未经校准。色温比预期的 6000K 要高,因此饱和度较低时的色彩并不准确。使用我们的 X-Rite 色度计校准面板,可将色温提高到标准的 6500K,使所有饱和度级别的色彩更加稳定。
Display Response Times
| ↔ Response Time Black to White | ||
|---|---|---|
| 28.2 ms ... rise ↗ and fall ↘ combined | ↗ 21.6 ms rise | 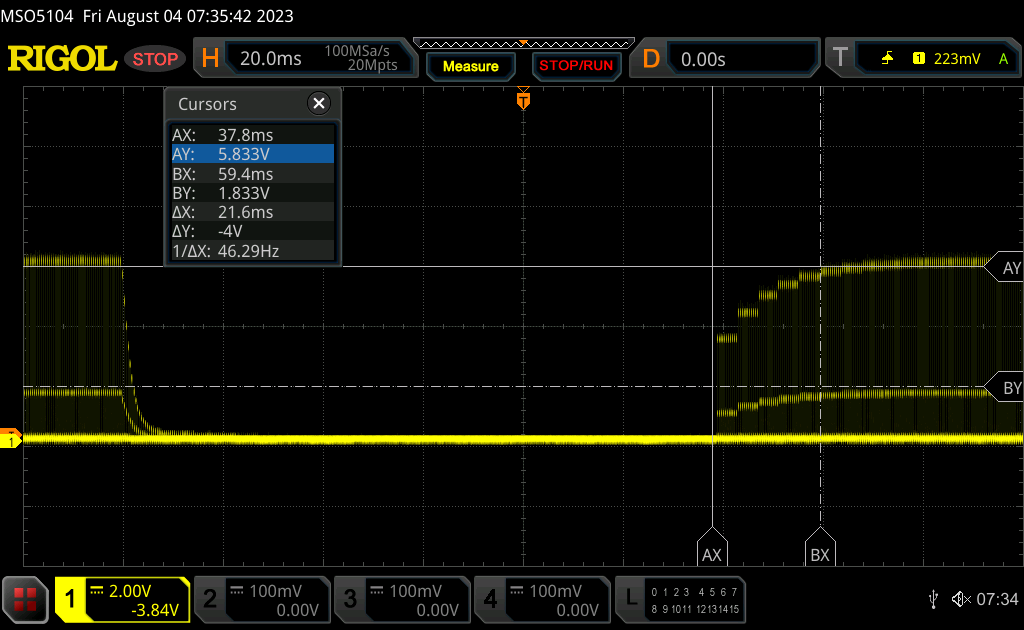 |
| ↘ 6.6 ms fall | ||
| The screen shows relatively slow response rates in our tests and may be too slow for gamers. In comparison, all tested devices range from 0.1 (minimum) to 240 (maximum) ms. » 75 % of all devices are better. This means that the measured response time is worse than the average of all tested devices (19.8 ms). | ||
| ↔ Response Time 50% Grey to 80% Grey | ||
| 26.4 ms ... rise ↗ and fall ↘ combined | ↗ 15 ms rise | 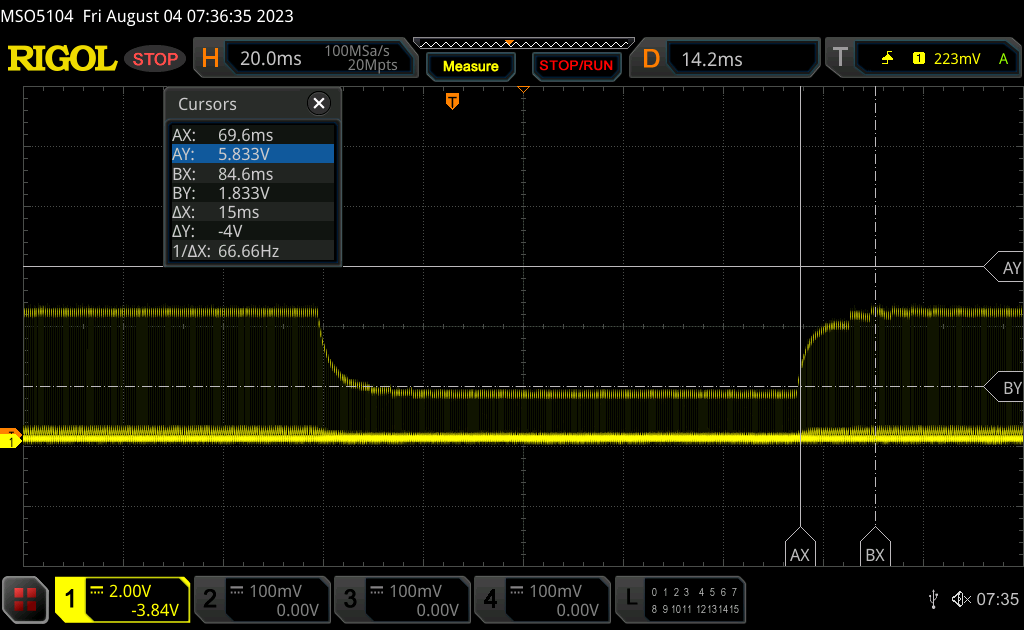 |
| ↘ 11.4 ms fall | ||
| The screen shows relatively slow response rates in our tests and may be too slow for gamers. In comparison, all tested devices range from 0.165 (minimum) to 636 (maximum) ms. » 36 % of all devices are better. This means that the measured response time is better than the average of all tested devices (31 ms). | ||
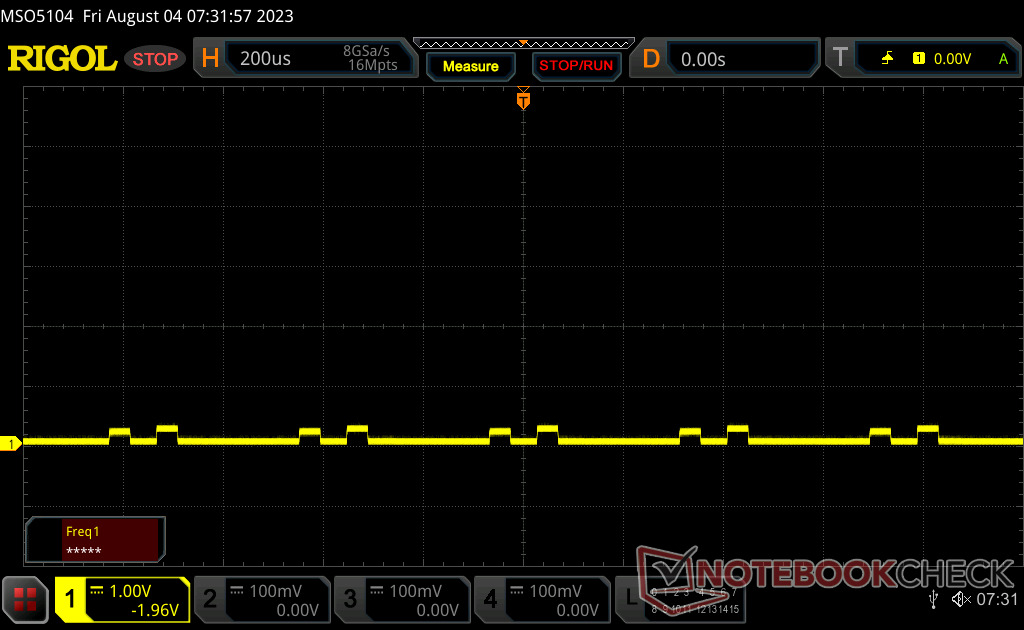
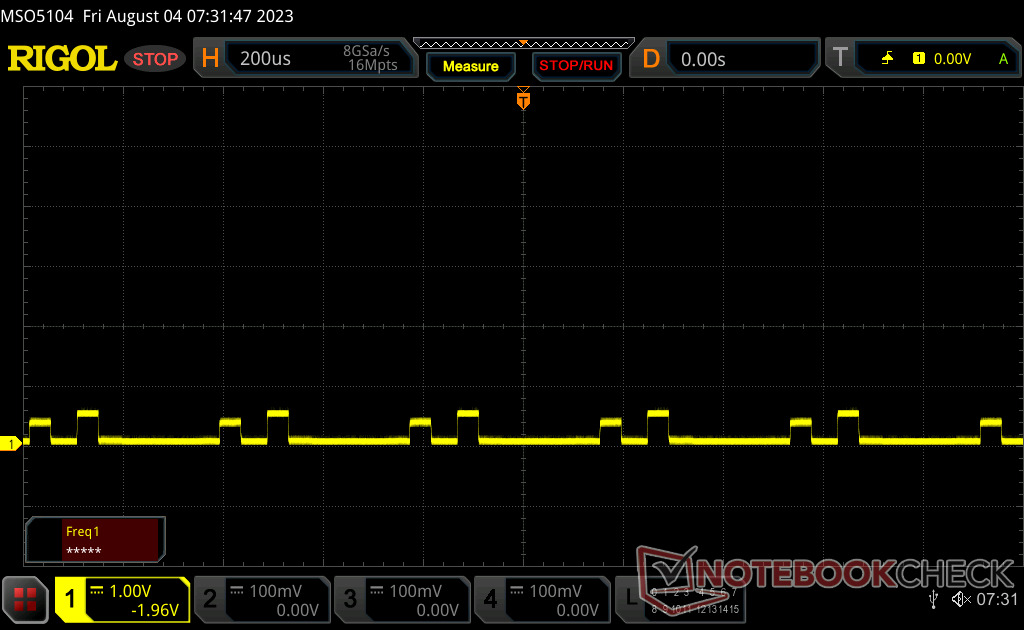
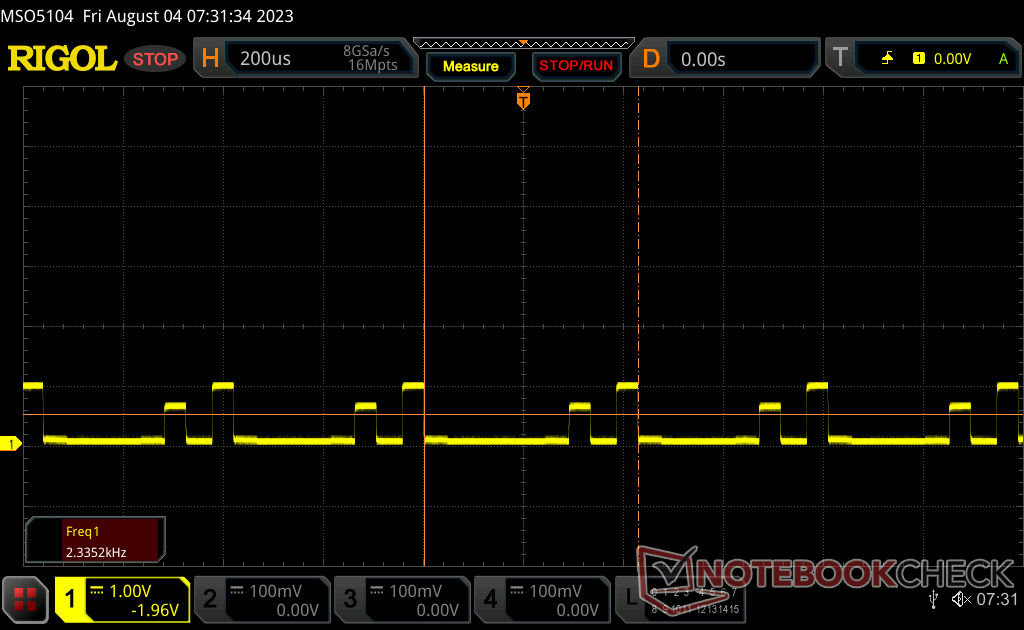
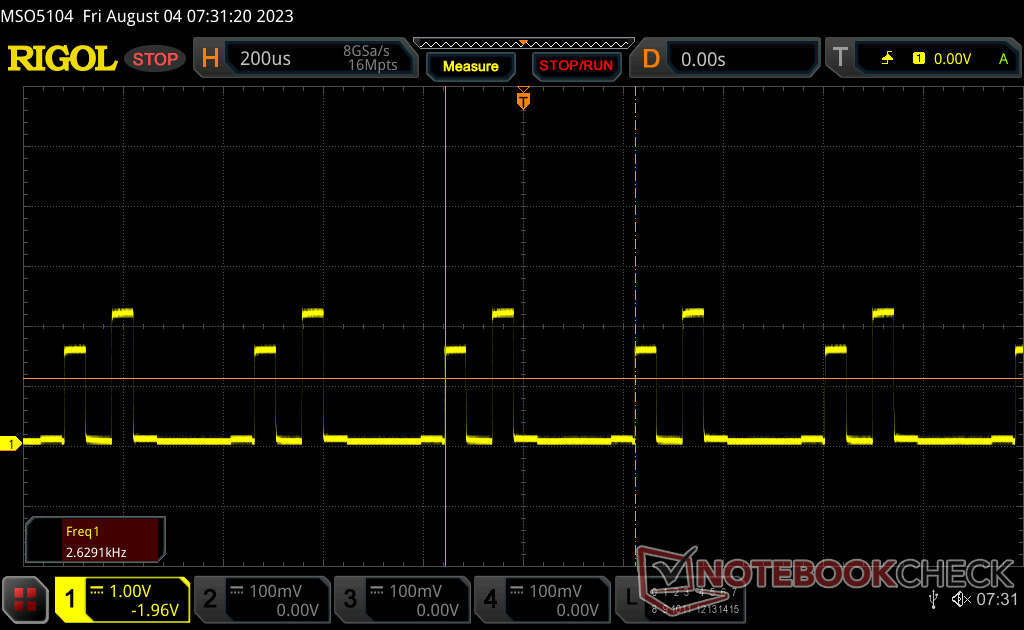
Screen Flickering / PWM (Pulse-Width Modulation)
| Screen flickering / PWM detected | 3506 Hz | ≤ 100 % brightness setting | 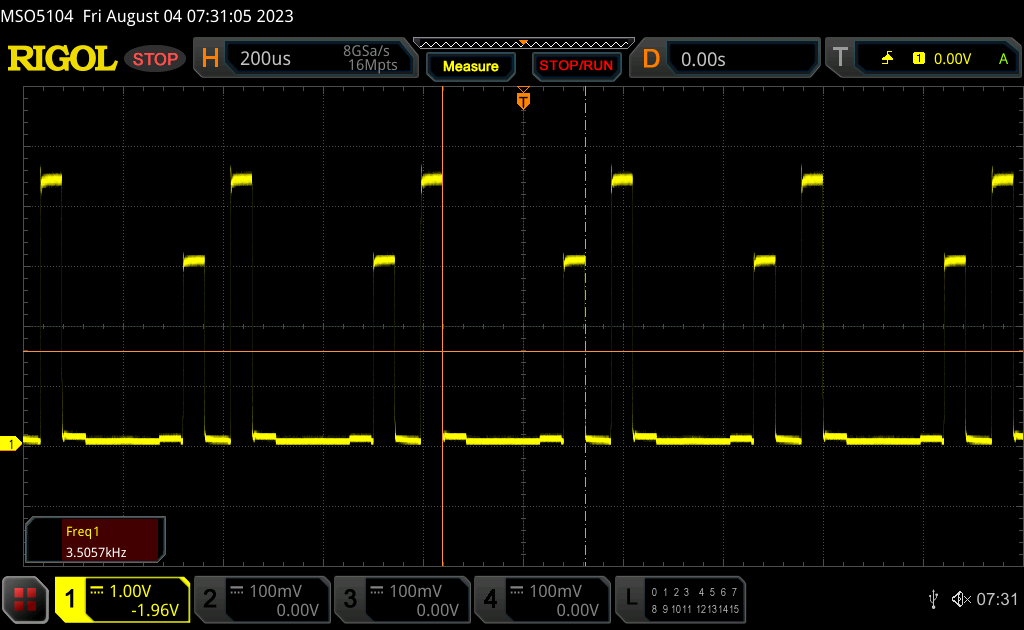 |
The display backlight flickers at 3506 Hz (worst case, e.g., utilizing PWM) Flickering detected at a brightness setting of 100 % and below. There should be no flickering or PWM above this brightness setting. The frequency of 3506 Hz is quite high, so most users sensitive to PWM should not notice any flickering. In comparison: 52 % of all tested devices do not use PWM to dim the display. If PWM was detected, an average of 7757 (minimum: 5 - maximum: 343500) Hz was measured. | |||
所有亮度下都会出现闪烁。不过,3506 Hz 的频率相对较高,对大多数用户来说应该不成问题。闪烁还会带来一个不幸的后果,即更难精确测量响应时间。
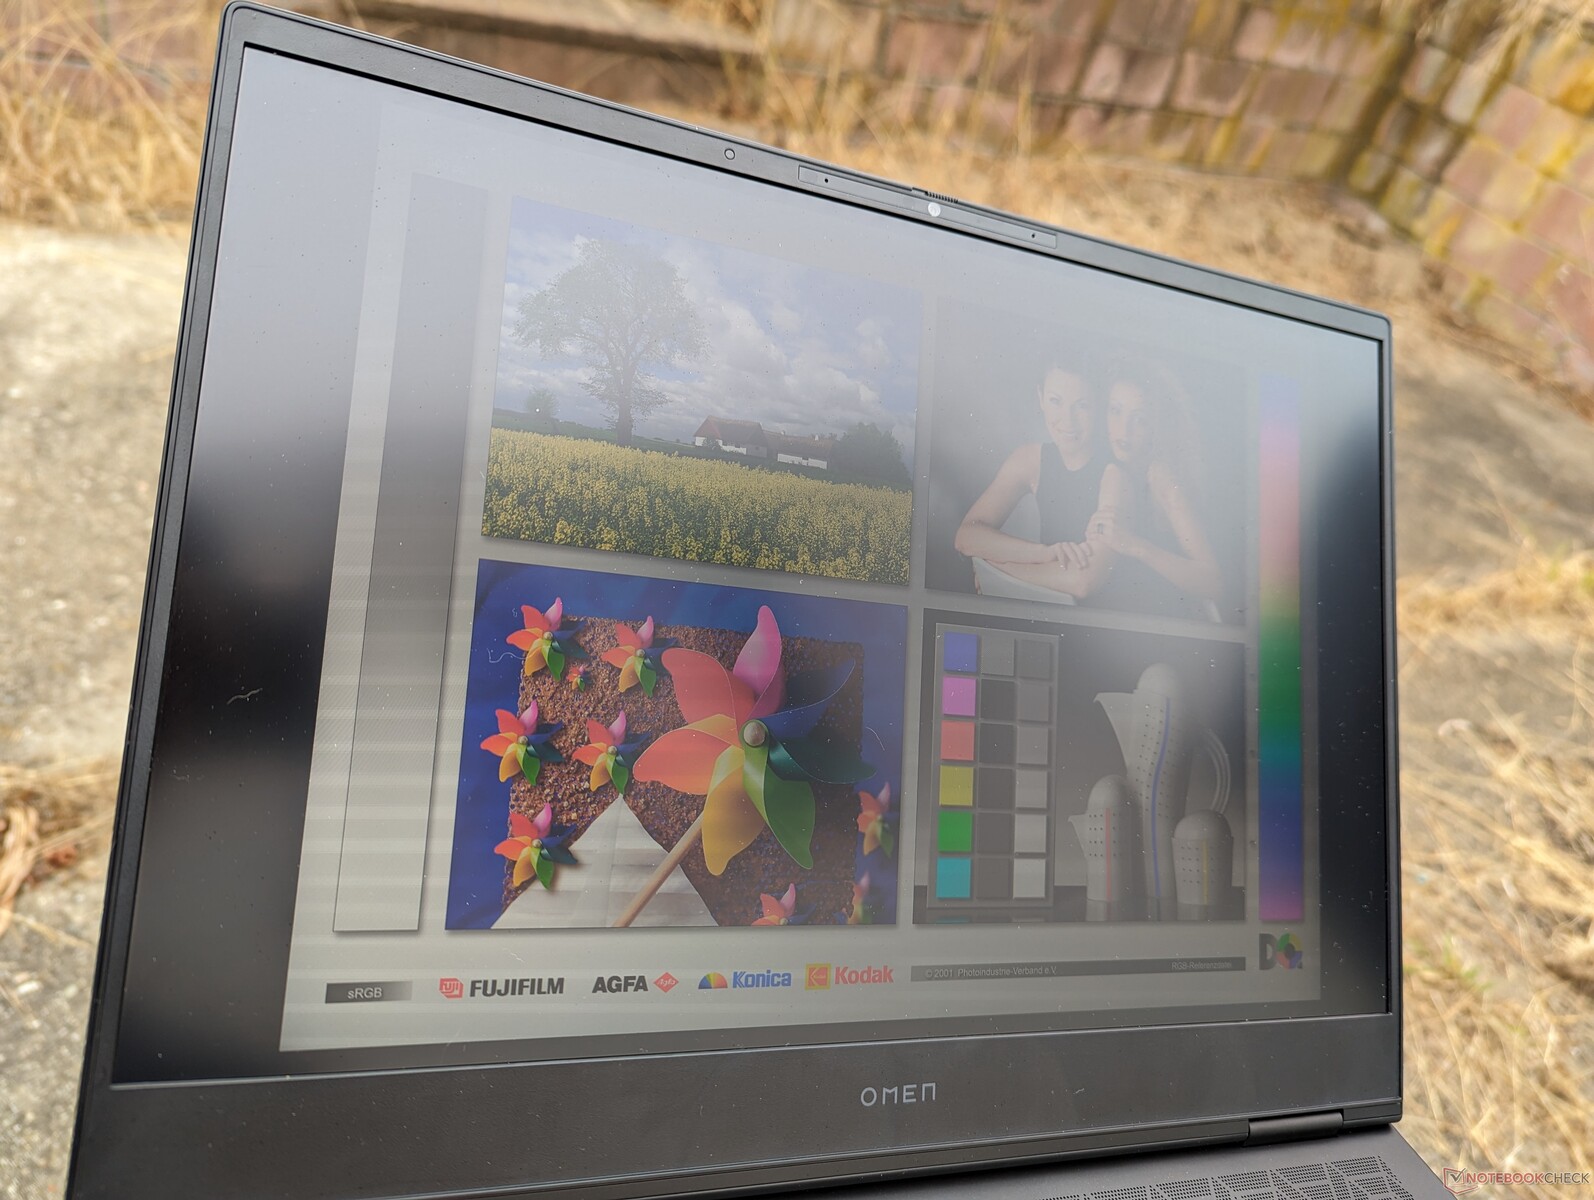
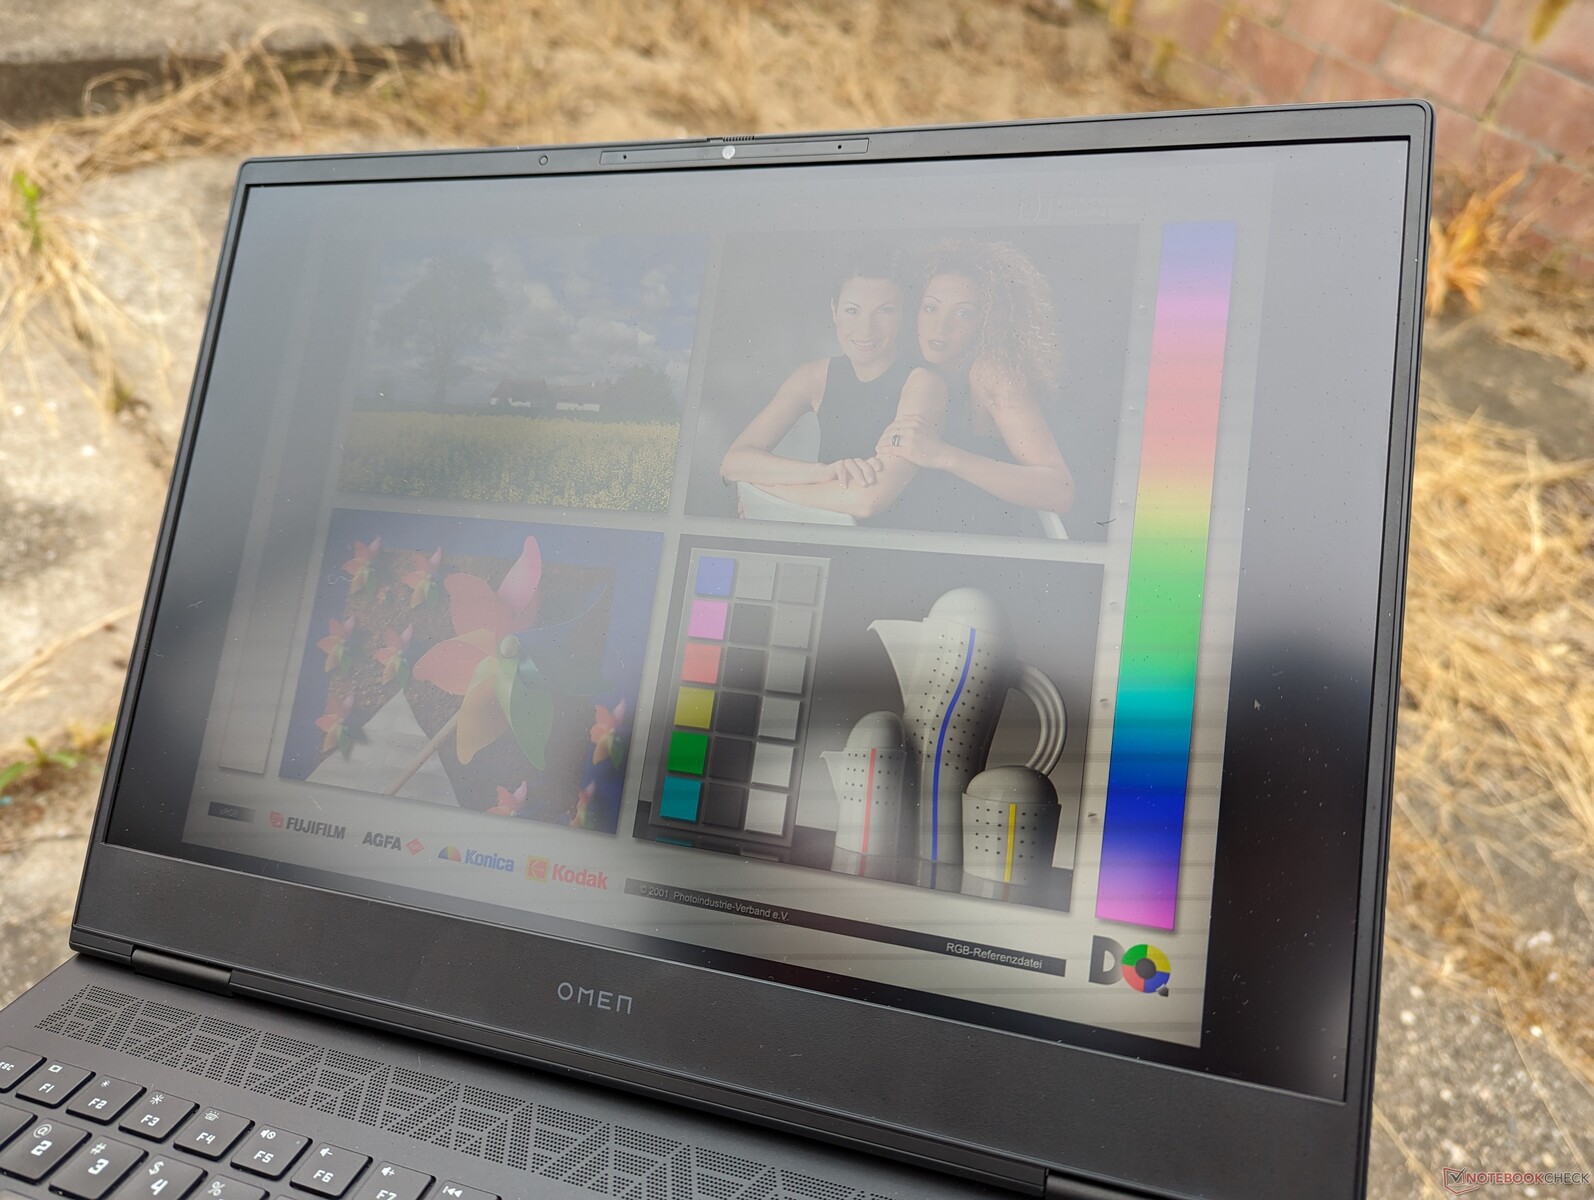
在阴凉处的室外能见度较好,但在较明亮的环境或阳光下,色彩仍然会变得暗淡。最大亮度约为 800 尼特,可依靠电池电量维持。
性能 - 第 13 代英特尔 Raptor Lake-HX
测试条件
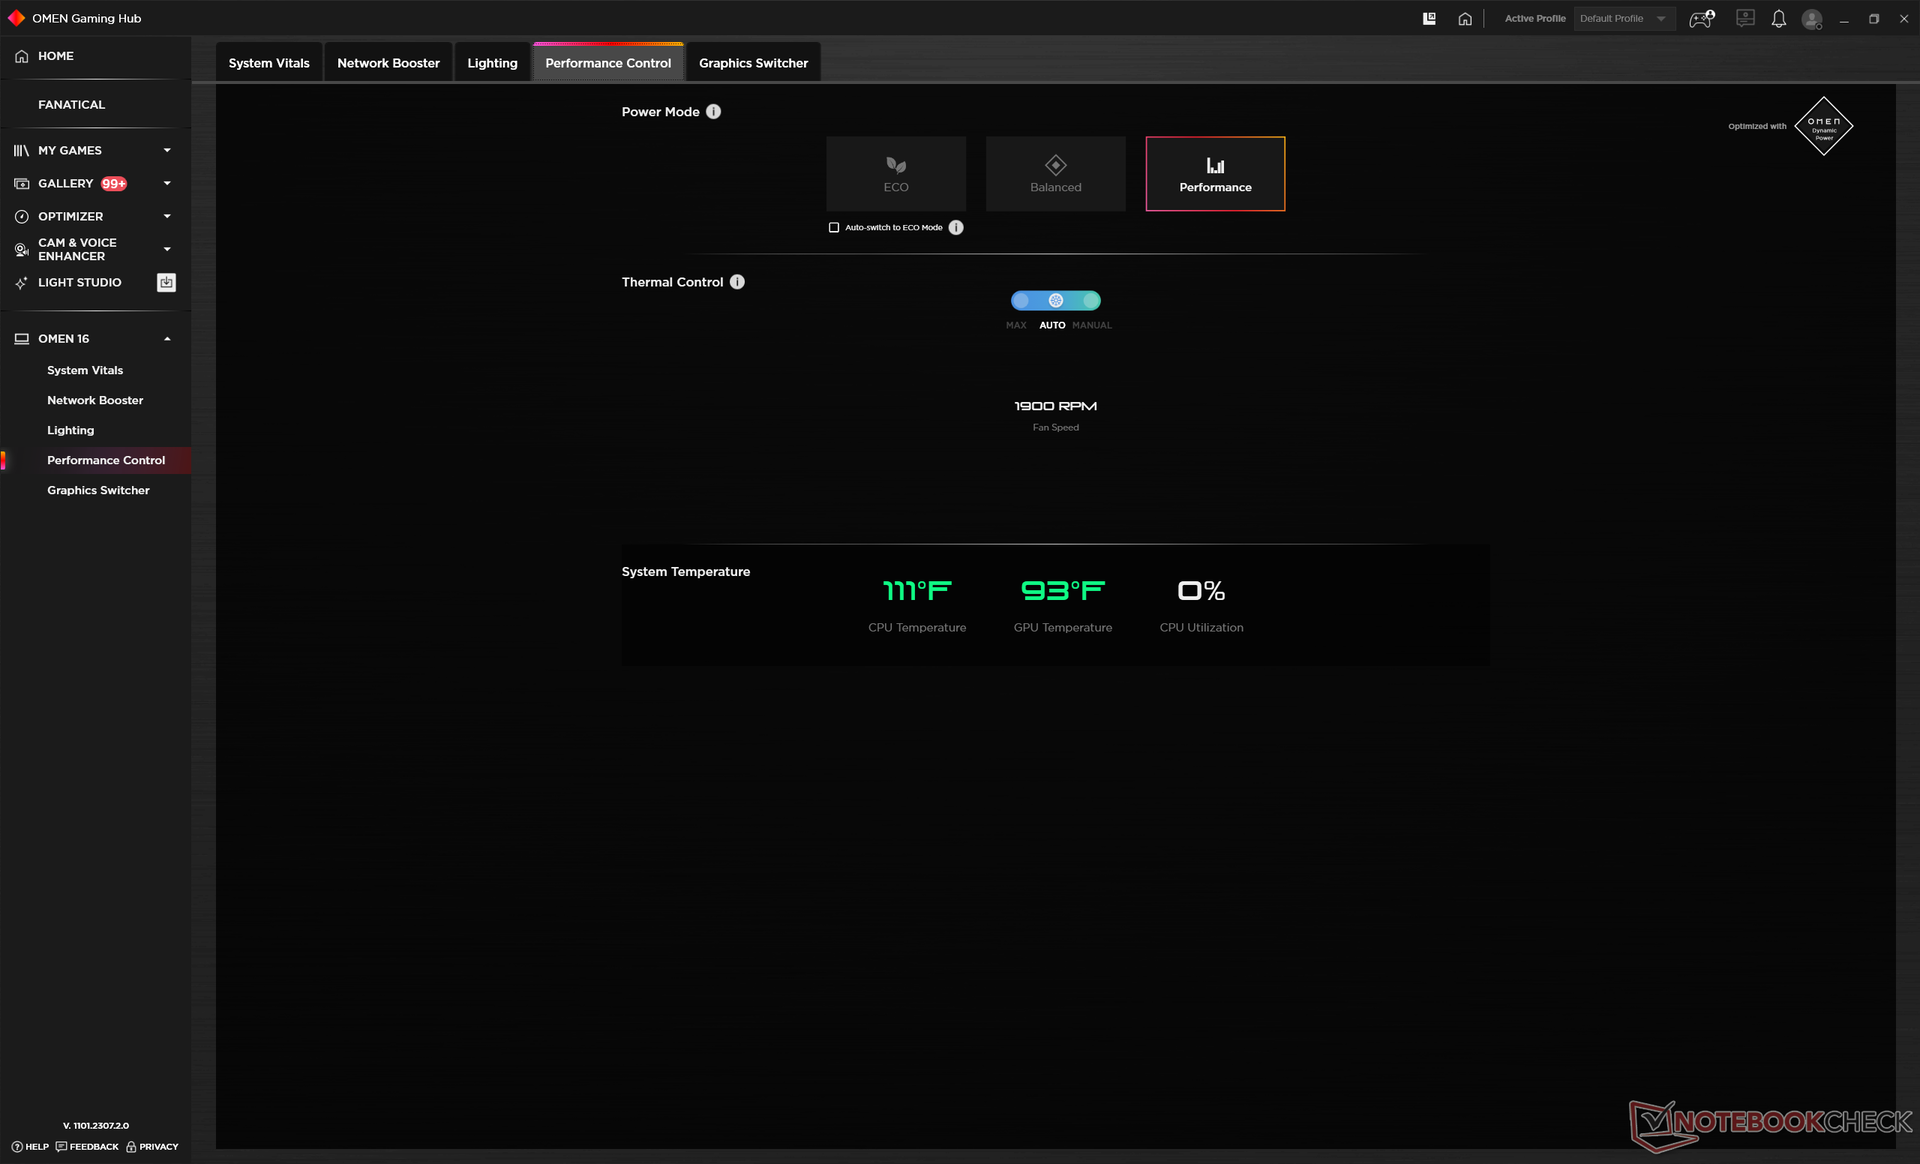
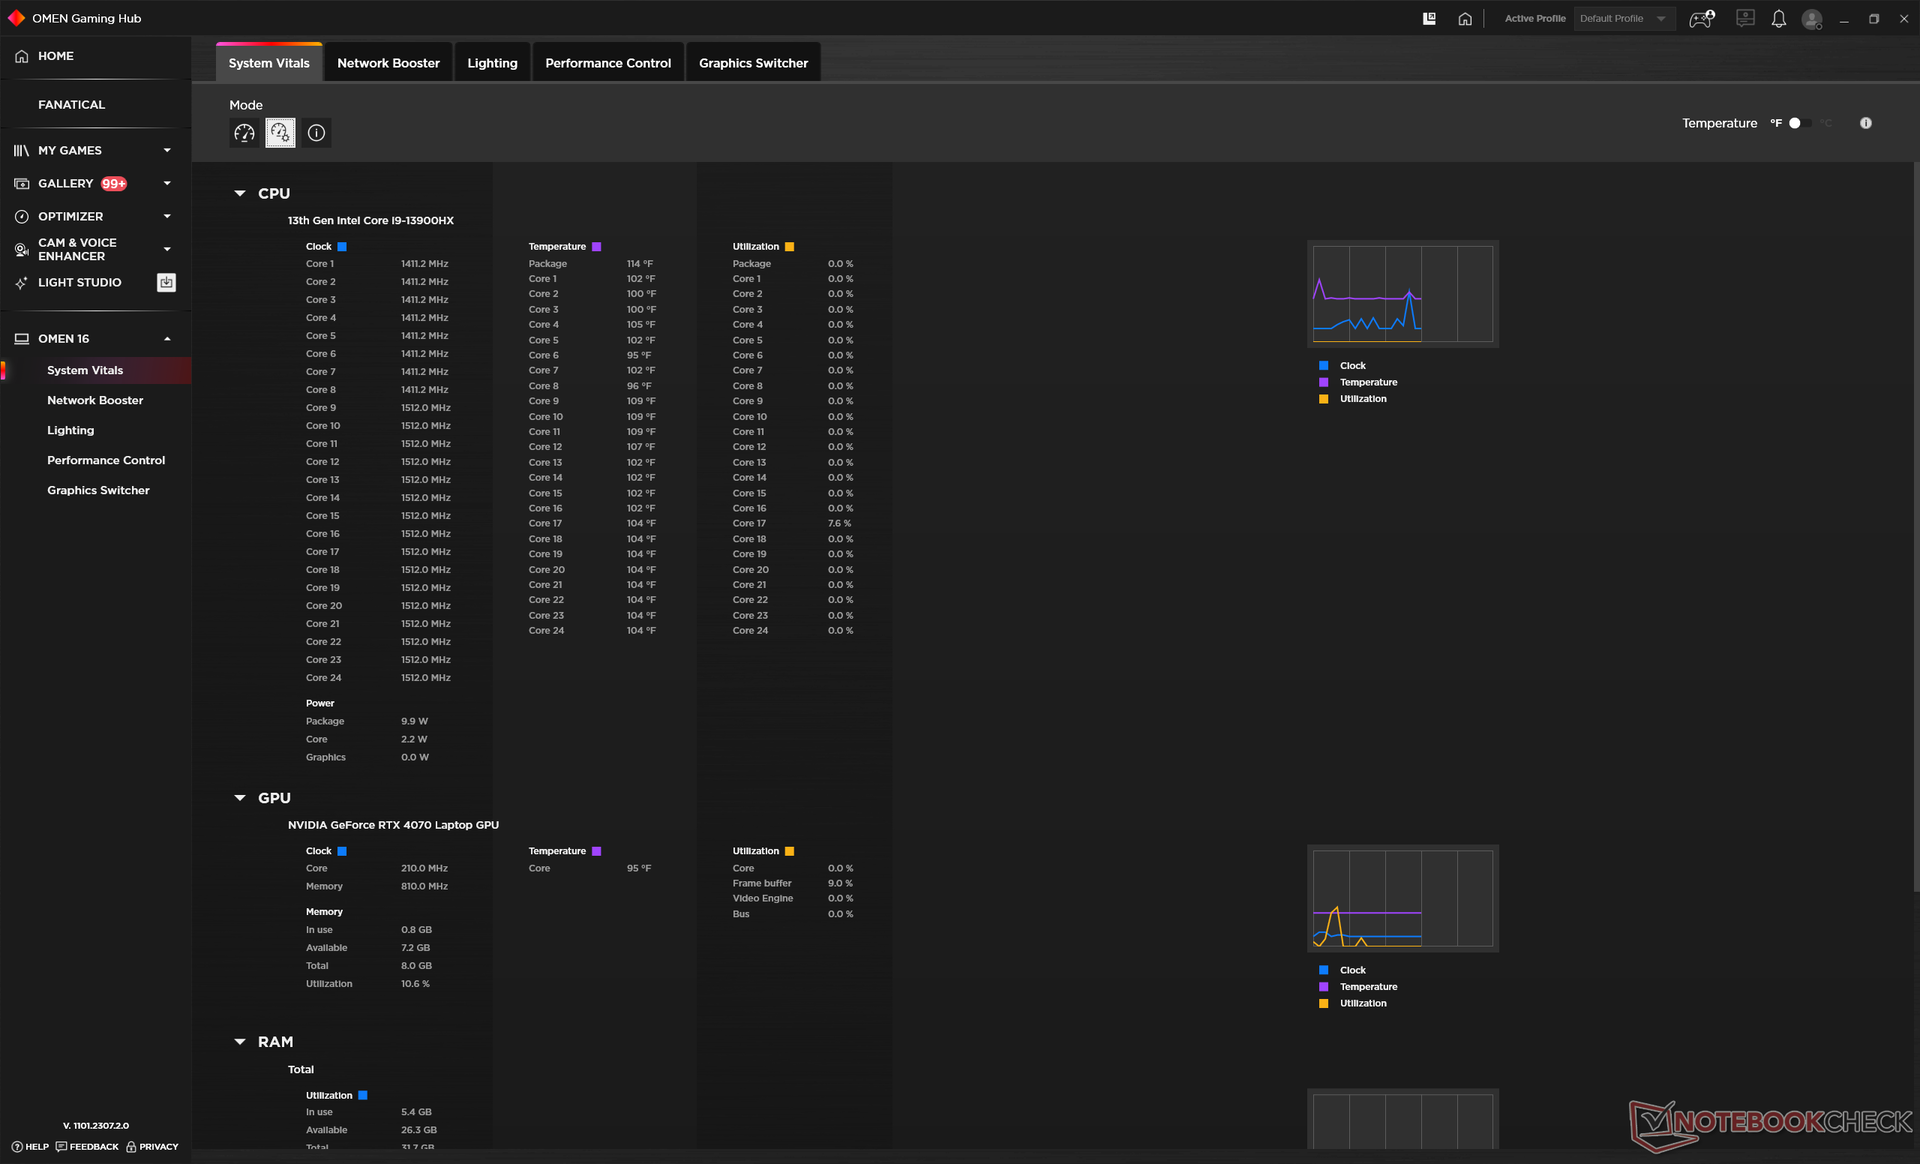
在运行下面的基准测试之前,我们通过 Windows 将设备设置为 "性能模式",并通过 Omen Gaming Hub 软件再次设置为 "性能模式"。令人恼火的是,调整一个电源配置文件设置并不会自动调整另一个。
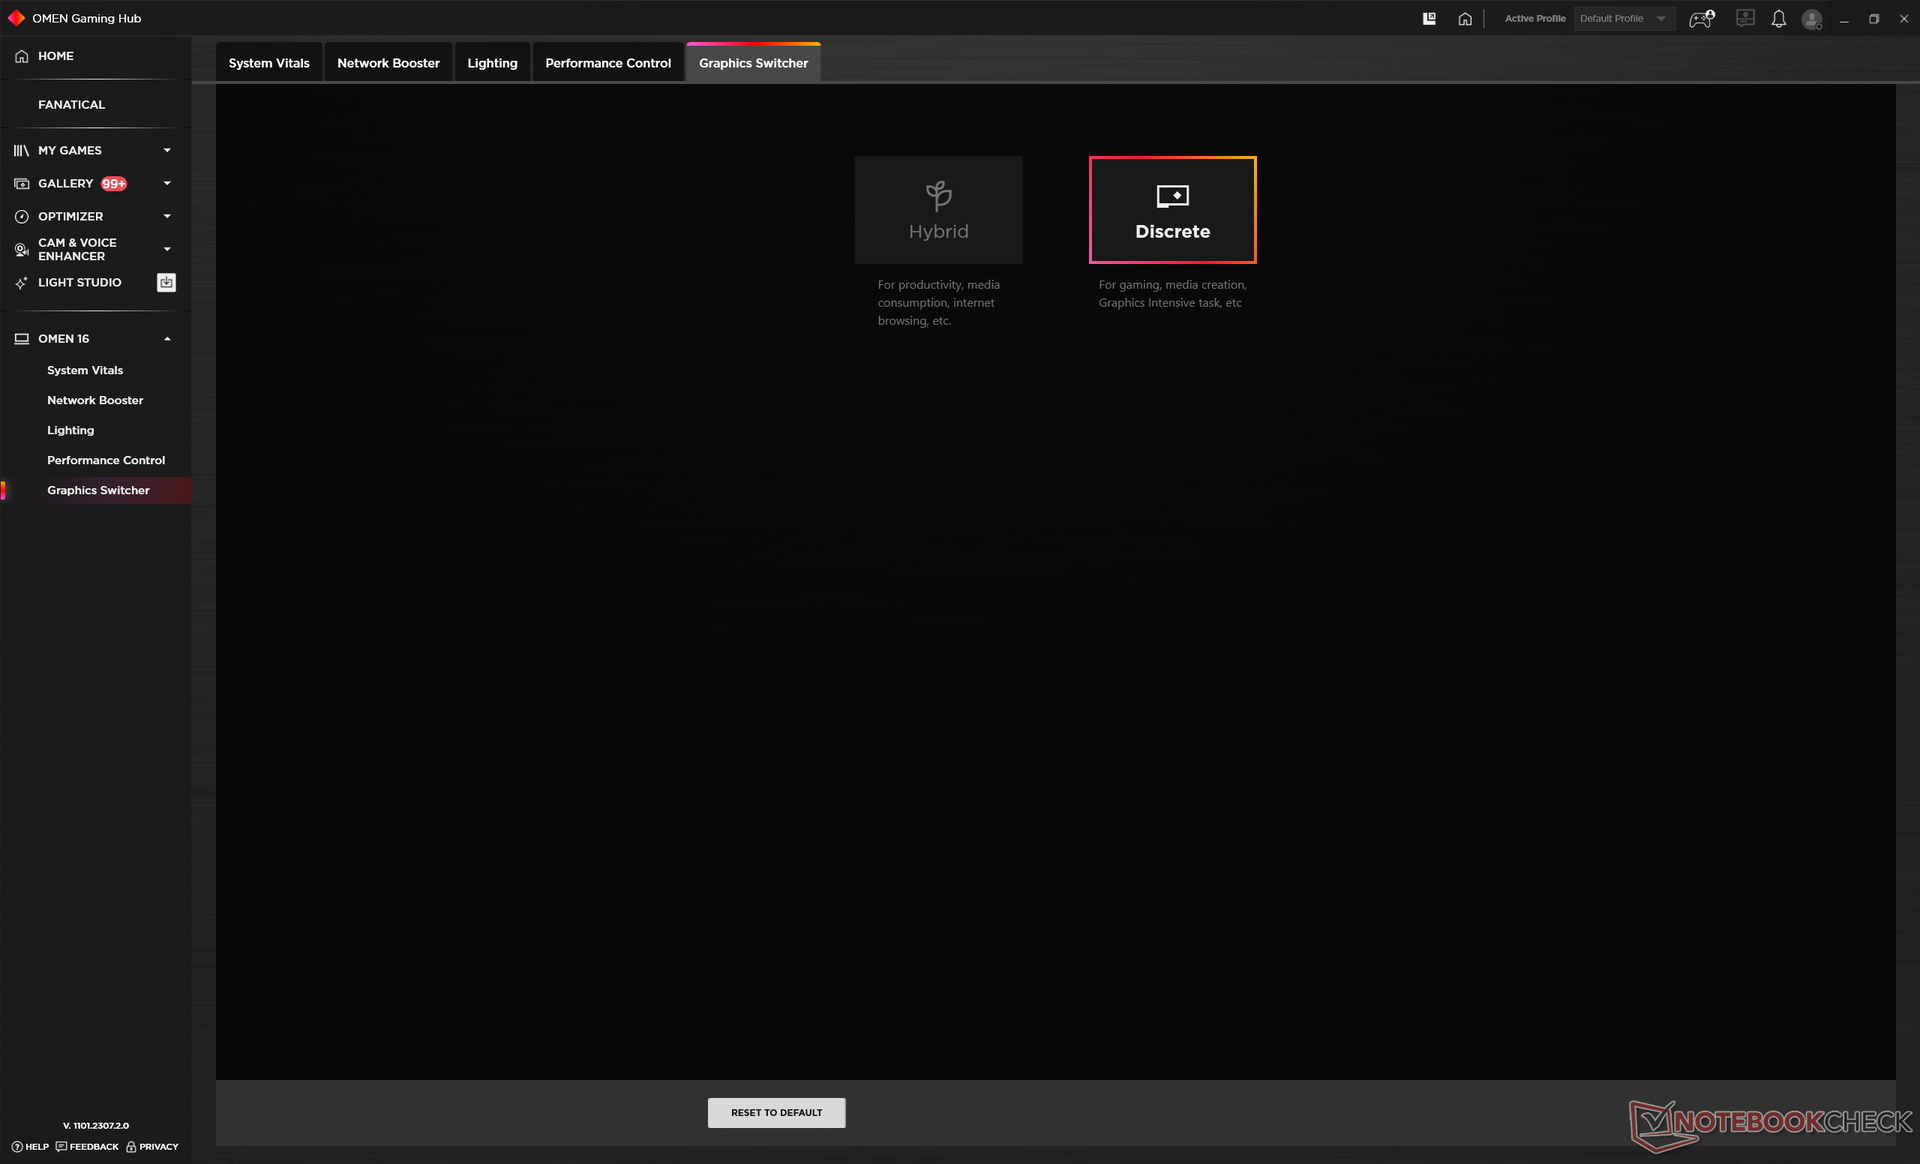
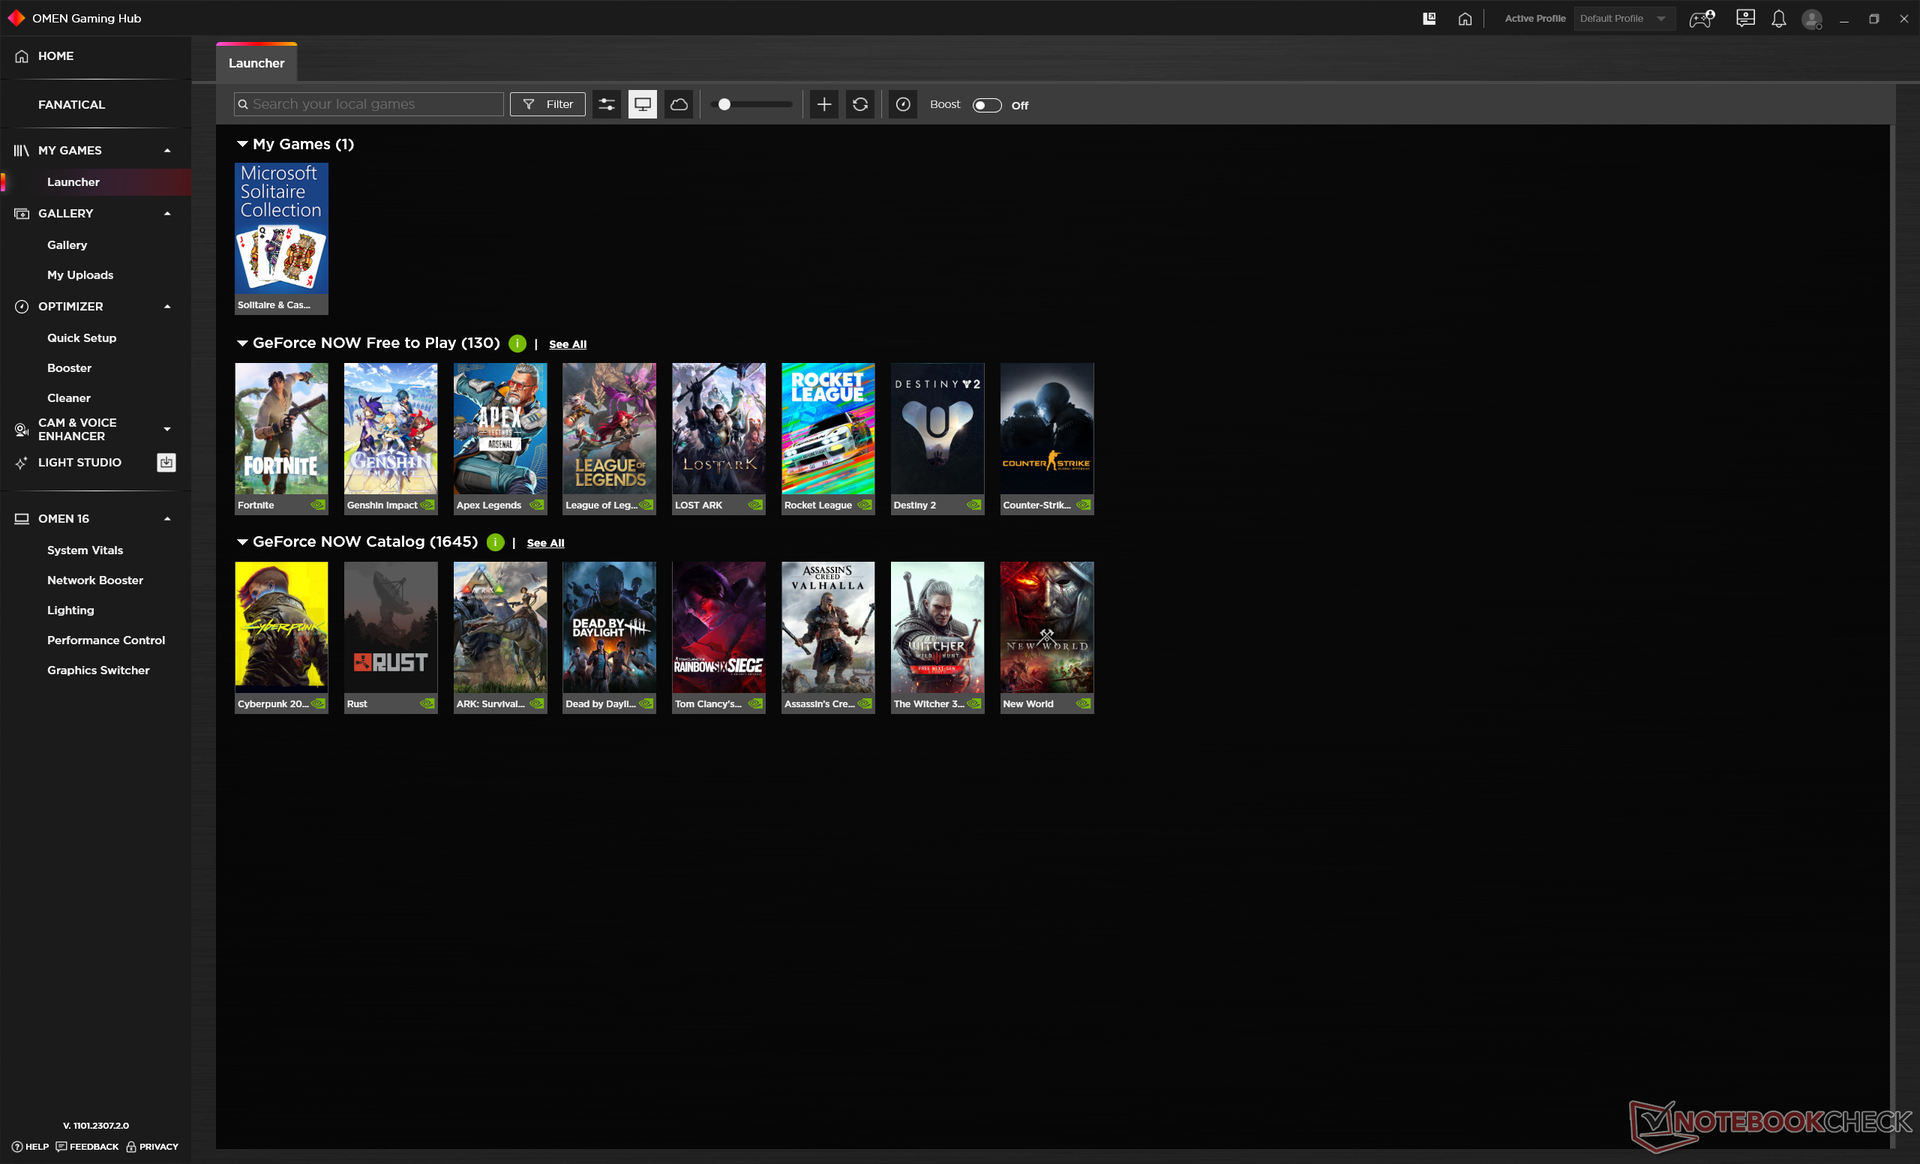
如下截图所示,MUX 开关可通过 Omen Gaming Hub 访问。因此,强烈建议用户熟悉该软件,因为关键功能都在这里切换。性能配置文件被隐藏在多个子菜单下,这也是该软件另一个恼人之处。
不支持高级 Optimus 或 Optimus 2.0。因此,在 iGPU 和 dGPU 之间切换时需要软重启。内置显示屏支持 G-Sync。

处理器
酷睿 i9-13900HX酷睿 i9-13900HXOmen Transcend 16 中的酷睿 i9-13900HX 比我们数据库中配备相同处理器的普通笔记本电脑性能要慢 5% 到 10%。一个极端的例子是 联想Legion Pro 7尽管它们都配备了酷睿 i9-13900HX,但联想 Pro 7 的速度比惠普快 20%。我们的 Omen Transcend 16 仍是市场上速度最快的游戏笔记本之一,但根据我们使用其他高端游戏机型的经验,处理器性能肯定会更快一些。
在其他方面,性能稳定性也非常出色,在循环运行 CineBench R15 xT 时没有出现大的节流问题。
Cinebench R15 Multi Loop
Cinebench R23: Multi Core | Single Core
Cinebench R20: CPU (Multi Core) | CPU (Single Core)
Cinebench R15: CPU Multi 64Bit | CPU Single 64Bit
Blender: v2.79 BMW27 CPU
7-Zip 18.03: 7z b 4 | 7z b 4 -mmt1
Geekbench 5.5: Multi-Core | Single-Core
HWBOT x265 Benchmark v2.2: 4k Preset
LibreOffice : 20 Documents To PDF
R Benchmark 2.5: Overall mean
| CPU Performance rating | |
| Asus Zephyrus Duo 16 GX650PY-NM006W | |
| Average Intel Core i9-13900HX | |
| HP Omen Transcend 16 | |
| Lenovo Legion Slim 7i 16 Gen 8 -1! | |
| Alienware x16 R1 -1! | |
| Lenovo Legion Pro 5 16ARX8 | |
| HP Omen 16-wf000 -1! | |
| Asus ROG Zephyrus M16 GU603Z | |
| Lenovo Legion S7 16ARHA7 | |
| Acer Nitro 16 AN16-41 | |
| HP Omen 16-n0033dx | |
| Dell Inspiron 16 Plus 7610-MHJ8F | |
| Blender / v2.79 BMW27 CPU | |
| Dell Inspiron 16 Plus 7610-MHJ8F | |
| HP Omen 16-n0033dx | |
| Acer Nitro 16 AN16-41 | |
| Lenovo Legion S7 16ARHA7 | |
| Asus ROG Zephyrus M16 GU603Z | |
| Lenovo Legion Pro 5 16ARX8 | |
| HP Omen Transcend 16 | |
| Average Intel Core i9-13900HX (101 - 153, n=22) | |
| Asus Zephyrus Duo 16 GX650PY-NM006W | |
* ... smaller is better
AIDA64: FP32 Ray-Trace | FPU Julia | CPU SHA3 | CPU Queen | FPU SinJulia | FPU Mandel | CPU AES | CPU ZLib | FP64 Ray-Trace | CPU PhotoWorxx
| Performance rating | |
| Average Intel Core i9-13900HX | |
| HP Omen Transcend 16 | |
| Alienware x16 R1 | |
| HP Omen 16-wf000 | |
| Lenovo Legion Slim 7i 16 Gen 8 | |
| Acer Nitro 16 AN16-41 | |
| Asus ROG Zephyrus M16 GU603Z | |
| AIDA64 / FP32 Ray-Trace | |
| Average Intel Core i9-13900HX (17589 - 27615, n=22) | |
| HP Omen Transcend 16 | |
| HP Omen 16-wf000 | |
| Alienware x16 R1 | |
| Lenovo Legion Slim 7i 16 Gen 8 | |
| Acer Nitro 16 AN16-41 | |
| Asus ROG Zephyrus M16 GU603Z | |
| AIDA64 / FPU Julia | |
| Average Intel Core i9-13900HX (88686 - 137015, n=22) | |
| HP Omen Transcend 16 | |
| Acer Nitro 16 AN16-41 | |
| HP Omen 16-wf000 | |
| Alienware x16 R1 | |
| Lenovo Legion Slim 7i 16 Gen 8 | |
| Asus ROG Zephyrus M16 GU603Z | |
| AIDA64 / CPU SHA3 | |
| Average Intel Core i9-13900HX (4362 - 7029, n=22) | |
| HP Omen Transcend 16 | |
| HP Omen 16-wf000 | |
| Alienware x16 R1 | |
| Lenovo Legion Slim 7i 16 Gen 8 | |
| Asus ROG Zephyrus M16 GU603Z | |
| Acer Nitro 16 AN16-41 | |
| AIDA64 / CPU Queen | |
| Average Intel Core i9-13900HX (125644 - 141385, n=22) | |
| HP Omen Transcend 16 | |
| Lenovo Legion Slim 7i 16 Gen 8 | |
| Alienware x16 R1 | |
| Acer Nitro 16 AN16-41 | |
| Asus ROG Zephyrus M16 GU603Z | |
| HP Omen 16-wf000 | |
| AIDA64 / FPU SinJulia | |
| Average Intel Core i9-13900HX (12334 - 17179, n=22) | |
| HP Omen Transcend 16 | |
| Acer Nitro 16 AN16-41 | |
| HP Omen 16-wf000 | |
| Alienware x16 R1 | |
| Lenovo Legion Slim 7i 16 Gen 8 | |
| Asus ROG Zephyrus M16 GU603Z | |
| AIDA64 / FPU Mandel | |
| Average Intel Core i9-13900HX (43850 - 69202, n=22) | |
| HP Omen Transcend 16 | |
| Acer Nitro 16 AN16-41 | |
| HP Omen 16-wf000 | |
| Alienware x16 R1 | |
| Lenovo Legion Slim 7i 16 Gen 8 | |
| Asus ROG Zephyrus M16 GU603Z | |
| AIDA64 / CPU AES | |
| Average Intel Core i9-13900HX (89413 - 237881, n=22) | |
| Asus ROG Zephyrus M16 GU603Z | |
| HP Omen Transcend 16 | |
| HP Omen 16-wf000 | |
| Alienware x16 R1 | |
| Lenovo Legion Slim 7i 16 Gen 8 | |
| Acer Nitro 16 AN16-41 | |
| AIDA64 / CPU ZLib | |
| Average Intel Core i9-13900HX (1284 - 1958, n=22) | |
| HP Omen Transcend 16 | |
| HP Omen 16-wf000 | |
| Lenovo Legion Slim 7i 16 Gen 8 | |
| Alienware x16 R1 | |
| Asus ROG Zephyrus M16 GU603Z | |
| Acer Nitro 16 AN16-41 | |
| AIDA64 / FP64 Ray-Trace | |
| Average Intel Core i9-13900HX (9481 - 15279, n=22) | |
| HP Omen Transcend 16 | |
| HP Omen 16-wf000 | |
| Alienware x16 R1 | |
| Lenovo Legion Slim 7i 16 Gen 8 | |
| Acer Nitro 16 AN16-41 | |
| Asus ROG Zephyrus M16 GU603Z | |
| AIDA64 / CPU PhotoWorxx | |
| HP Omen Transcend 16 | |
| Alienware x16 R1 | |
| Average Intel Core i9-13900HX (42994 - 51994, n=22) | |
| Asus ROG Zephyrus M16 GU603Z | |
| HP Omen 16-wf000 | |
| Acer Nitro 16 AN16-41 | |
| Lenovo Legion Slim 7i 16 Gen 8 | |
系统性能
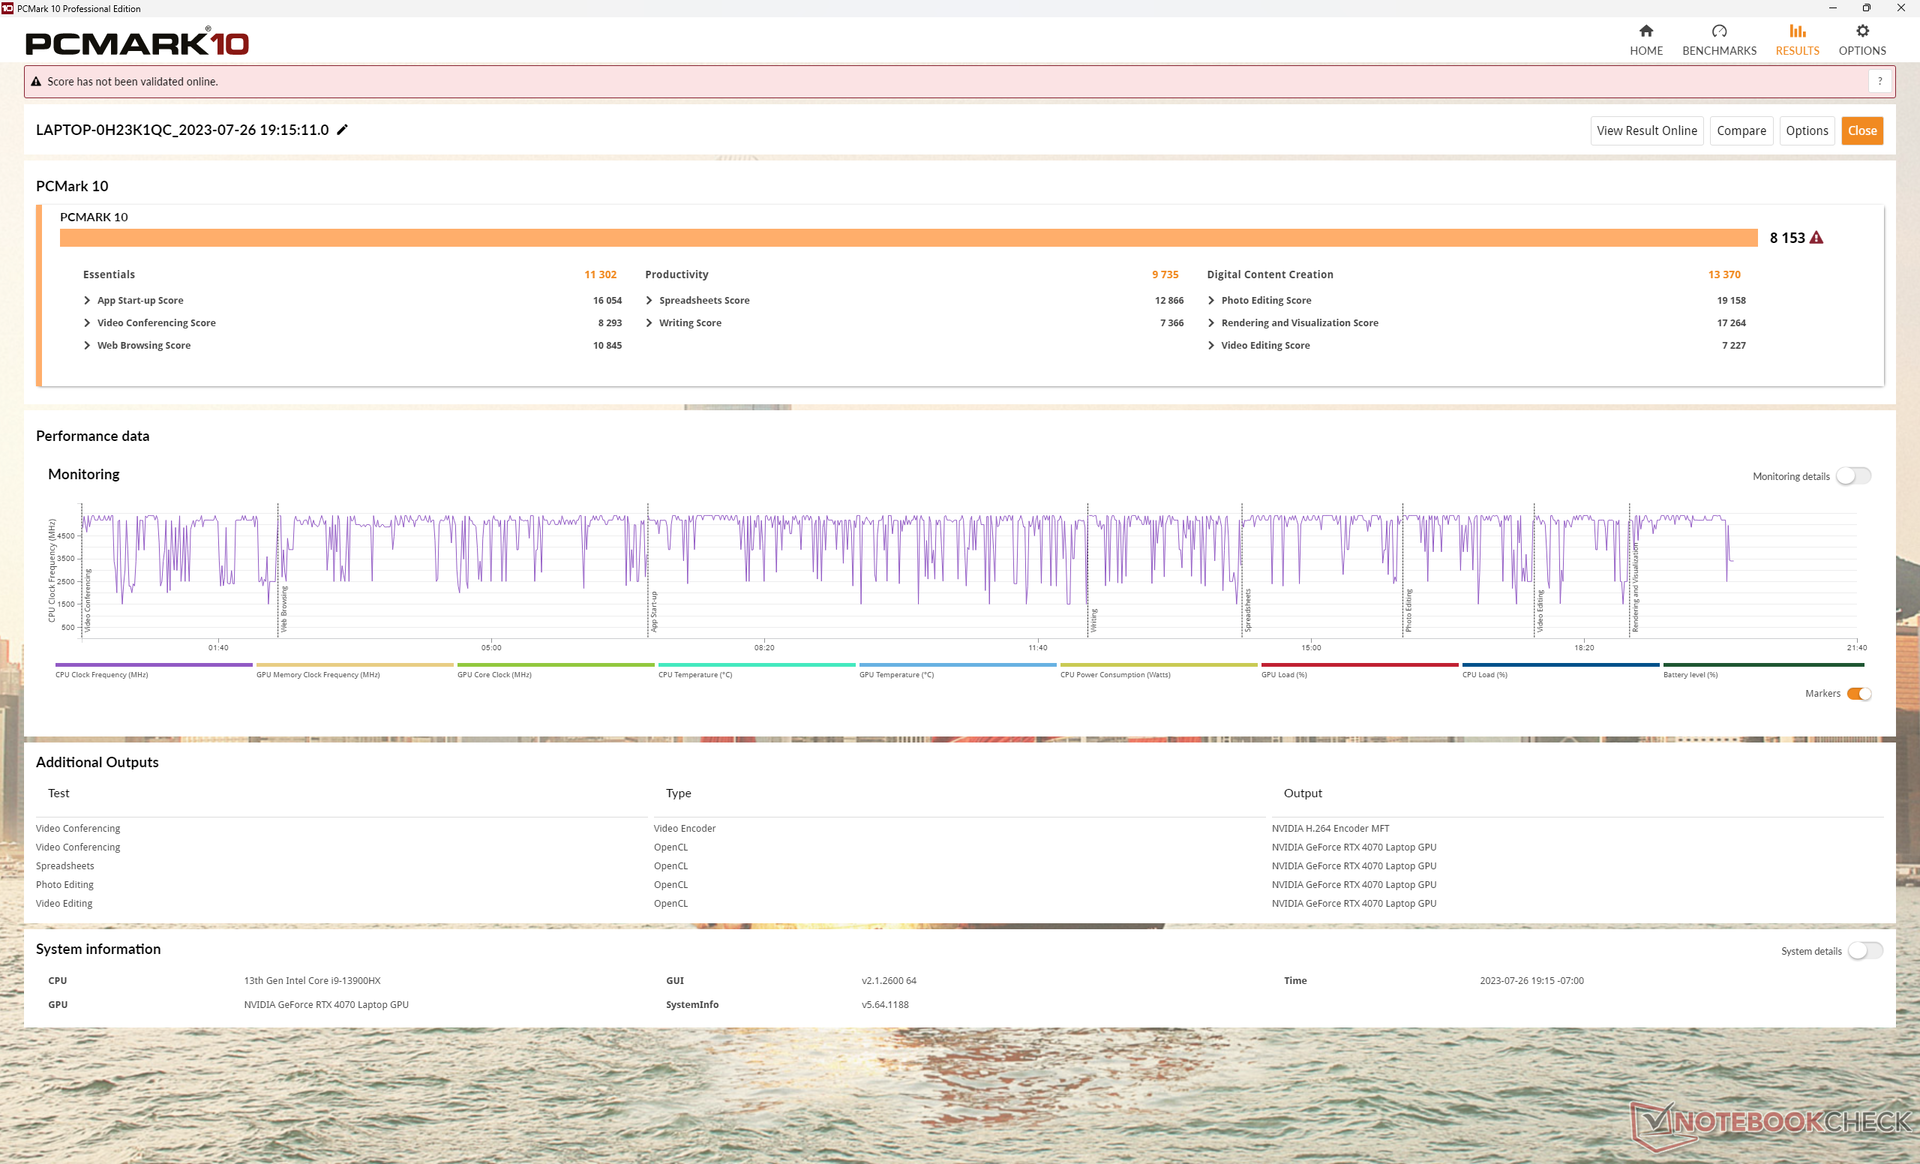
除了在数字内容创建(Digital Content Creation)方面,由于我们的 RTX 4070 显卡速度较慢,PCMark 结果仅略微领先于搭载 RTX 4080 的 Omen 16。我们没有遇到从睡眠中唤醒的问题或 BSOD,这与我们最近使用的 联想超薄 Pro 9i 16.
CrossMark: Overall | Productivity | Creativity | Responsiveness
| PCMark 10 / Score | |
| Lenovo Legion Slim 7i 16 Gen 8 | |
| Alienware x16 R1 | |
| HP Omen Transcend 16 | |
| Asus ROG Zephyrus M16 GU603Z | |
| HP Omen 16-wf000 | |
| Average Intel Core i9-13900HX, NVIDIA GeForce RTX 4070 Laptop GPU (6956 - 8153, n=3) | |
| Acer Nitro 16 AN16-41 | |
| PCMark 10 / Essentials | |
| Lenovo Legion Slim 7i 16 Gen 8 | |
| HP Omen Transcend 16 | |
| Alienware x16 R1 | |
| Average Intel Core i9-13900HX, NVIDIA GeForce RTX 4070 Laptop GPU (9865 - 11653, n=3) | |
| Asus ROG Zephyrus M16 GU603Z | |
| Acer Nitro 16 AN16-41 | |
| HP Omen 16-wf000 | |
| PCMark 10 / Productivity | |
| Lenovo Legion Slim 7i 16 Gen 8 | |
| Asus ROG Zephyrus M16 GU603Z | |
| Alienware x16 R1 | |
| HP Omen Transcend 16 | |
| Average Intel Core i9-13900HX, NVIDIA GeForce RTX 4070 Laptop GPU (9470 - 9850, n=3) | |
| Acer Nitro 16 AN16-41 | |
| HP Omen 16-wf000 | |
| PCMark 10 / Digital Content Creation | |
| Alienware x16 R1 | |
| Lenovo Legion Slim 7i 16 Gen 8 | |
| HP Omen 16-wf000 | |
| HP Omen Transcend 16 | |
| Asus ROG Zephyrus M16 GU603Z | |
| Average Intel Core i9-13900HX, NVIDIA GeForce RTX 4070 Laptop GPU (9776 - 13370, n=3) | |
| Acer Nitro 16 AN16-41 | |
| CrossMark / Overall | |
| Lenovo Legion Slim 7i 16 Gen 8 | |
| HP Omen Transcend 16 | |
| Average Intel Core i9-13900HX, NVIDIA GeForce RTX 4070 Laptop GPU (1842 - 2029, n=3) | |
| Alienware x16 R1 | |
| Asus ROG Zephyrus M16 GU603Z | |
| HP Omen 16-wf000 | |
| Acer Nitro 16 AN16-41 | |
| CrossMark / Productivity | |
| Lenovo Legion Slim 7i 16 Gen 8 | |
| Alienware x16 R1 | |
| HP Omen Transcend 16 | |
| Asus ROG Zephyrus M16 GU603Z | |
| Average Intel Core i9-13900HX, NVIDIA GeForce RTX 4070 Laptop GPU (1700 - 1872, n=3) | |
| HP Omen 16-wf000 | |
| Acer Nitro 16 AN16-41 | |
| CrossMark / Creativity | |
| HP Omen Transcend 16 | |
| Average Intel Core i9-13900HX, NVIDIA GeForce RTX 4070 Laptop GPU (2088 - 2316, n=3) | |
| Lenovo Legion Slim 7i 16 Gen 8 | |
| Alienware x16 R1 | |
| Asus ROG Zephyrus M16 GU603Z | |
| HP Omen 16-wf000 | |
| Acer Nitro 16 AN16-41 | |
| CrossMark / Responsiveness | |
| Alienware x16 R1 | |
| Lenovo Legion Slim 7i 16 Gen 8 | |
| Asus ROG Zephyrus M16 GU603Z | |
| Average Intel Core i9-13900HX, NVIDIA GeForce RTX 4070 Laptop GPU (1557 - 1752, n=3) | |
| HP Omen Transcend 16 | |
| HP Omen 16-wf000 | |
| Acer Nitro 16 AN16-41 | |
| PCMark 10 Score | 8153 points | |
Help | ||
| AIDA64 / Memory Copy | |
| HP Omen Transcend 16 | |
| Average Intel Core i9-13900HX (67716 - 79193, n=22) | |
| Alienware x16 R1 | |
| HP Omen 16-wf000 | |
| Asus ROG Zephyrus M16 GU603Z | |
| Acer Nitro 16 AN16-41 | |
| Lenovo Legion Slim 7i 16 Gen 8 | |
| AIDA64 / Memory Read | |
| HP Omen Transcend 16 | |
| Average Intel Core i9-13900HX (73998 - 88462, n=22) | |
| Alienware x16 R1 | |
| HP Omen 16-wf000 | |
| Asus ROG Zephyrus M16 GU603Z | |
| Acer Nitro 16 AN16-41 | |
| Lenovo Legion Slim 7i 16 Gen 8 | |
| AIDA64 / Memory Write | |
| Alienware x16 R1 | |
| HP Omen Transcend 16 | |
| Average Intel Core i9-13900HX (65472 - 77045, n=22) | |
| HP Omen 16-wf000 | |
| Asus ROG Zephyrus M16 GU603Z | |
| Acer Nitro 16 AN16-41 | |
| Lenovo Legion Slim 7i 16 Gen 8 | |
| AIDA64 / Memory Latency | |
| Alienware x16 R1 | |
| Acer Nitro 16 AN16-41 | |
| Asus ROG Zephyrus M16 GU603Z | |
| HP Omen Transcend 16 | |
| HP Omen 16-wf000 | |
| Average Intel Core i9-13900HX (75.3 - 91.1, n=22) | |
| Lenovo Legion Slim 7i 16 Gen 8 | |
* ... smaller is better
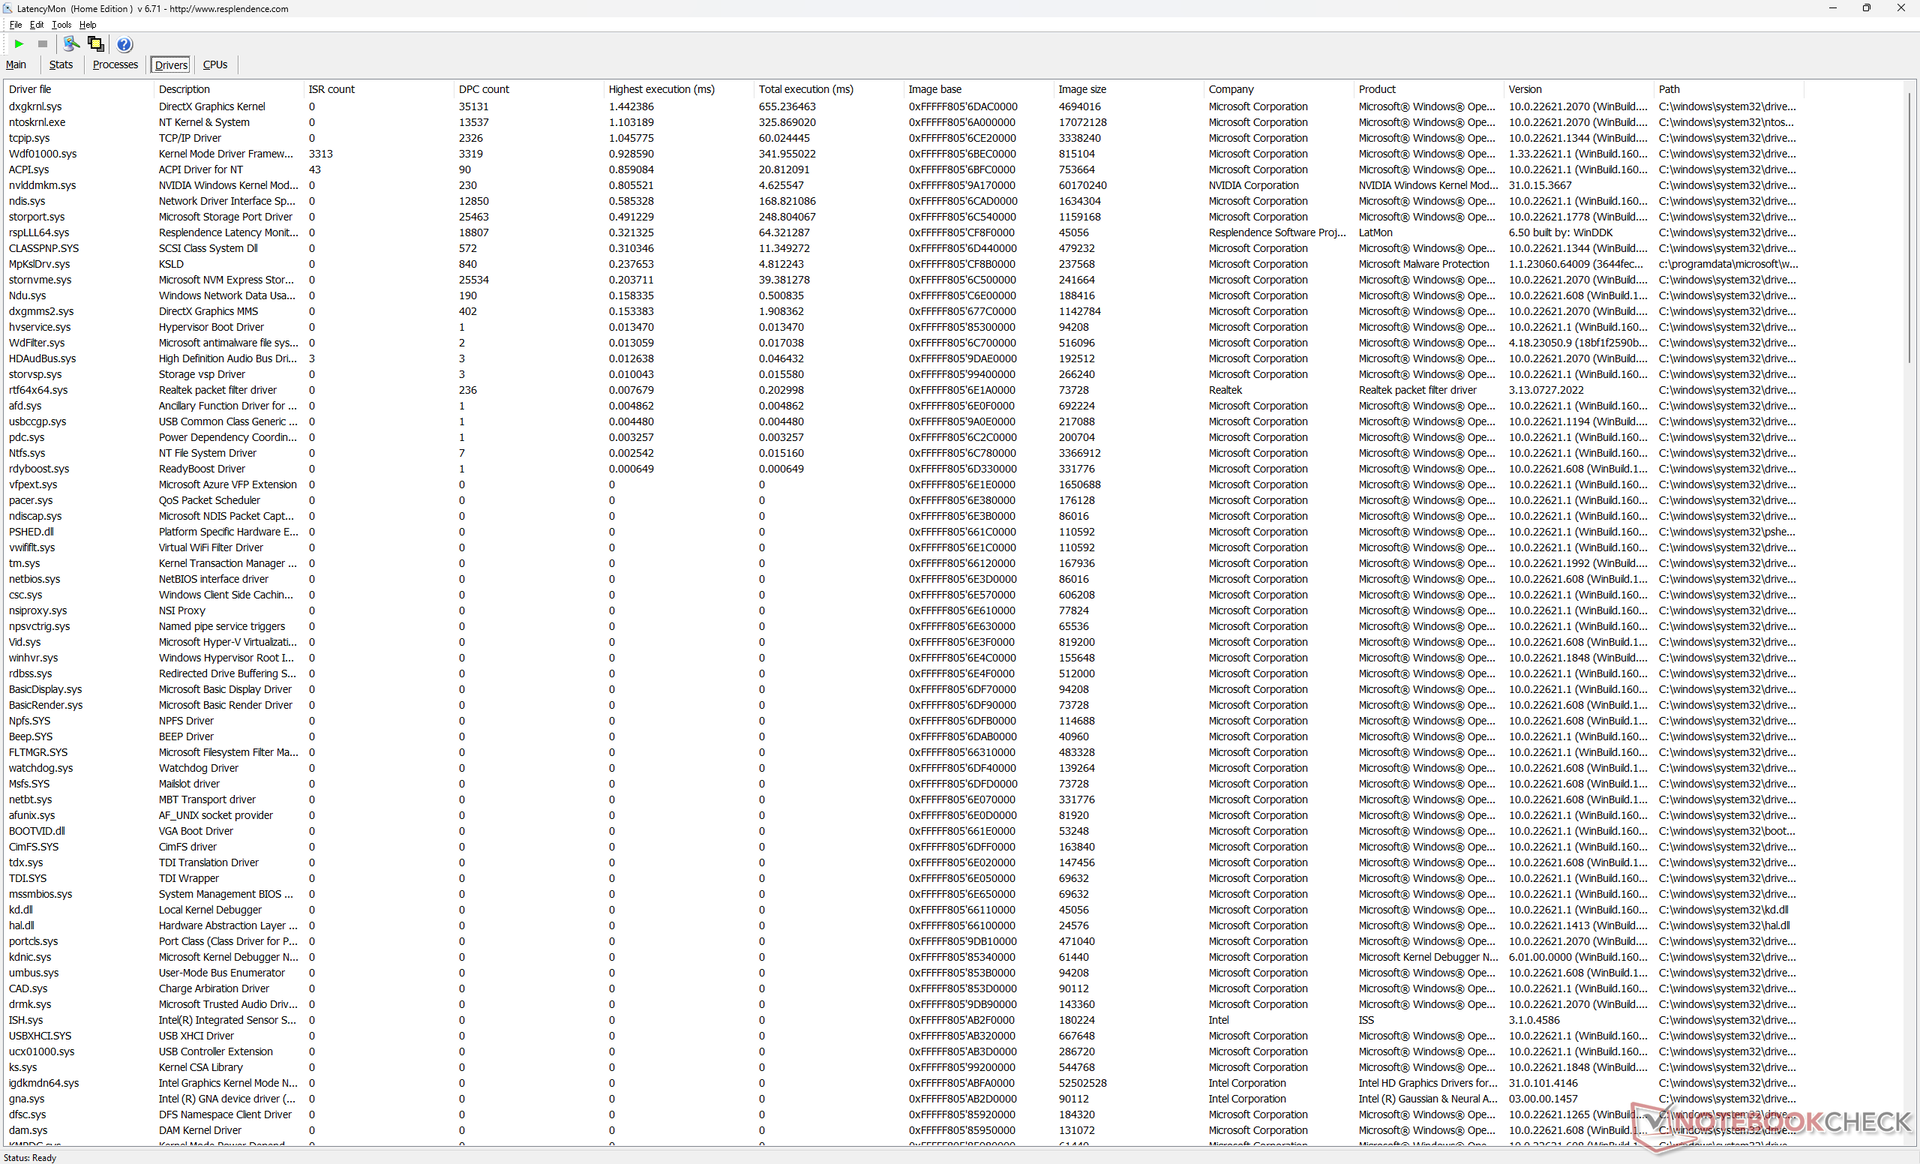
DPC 延迟
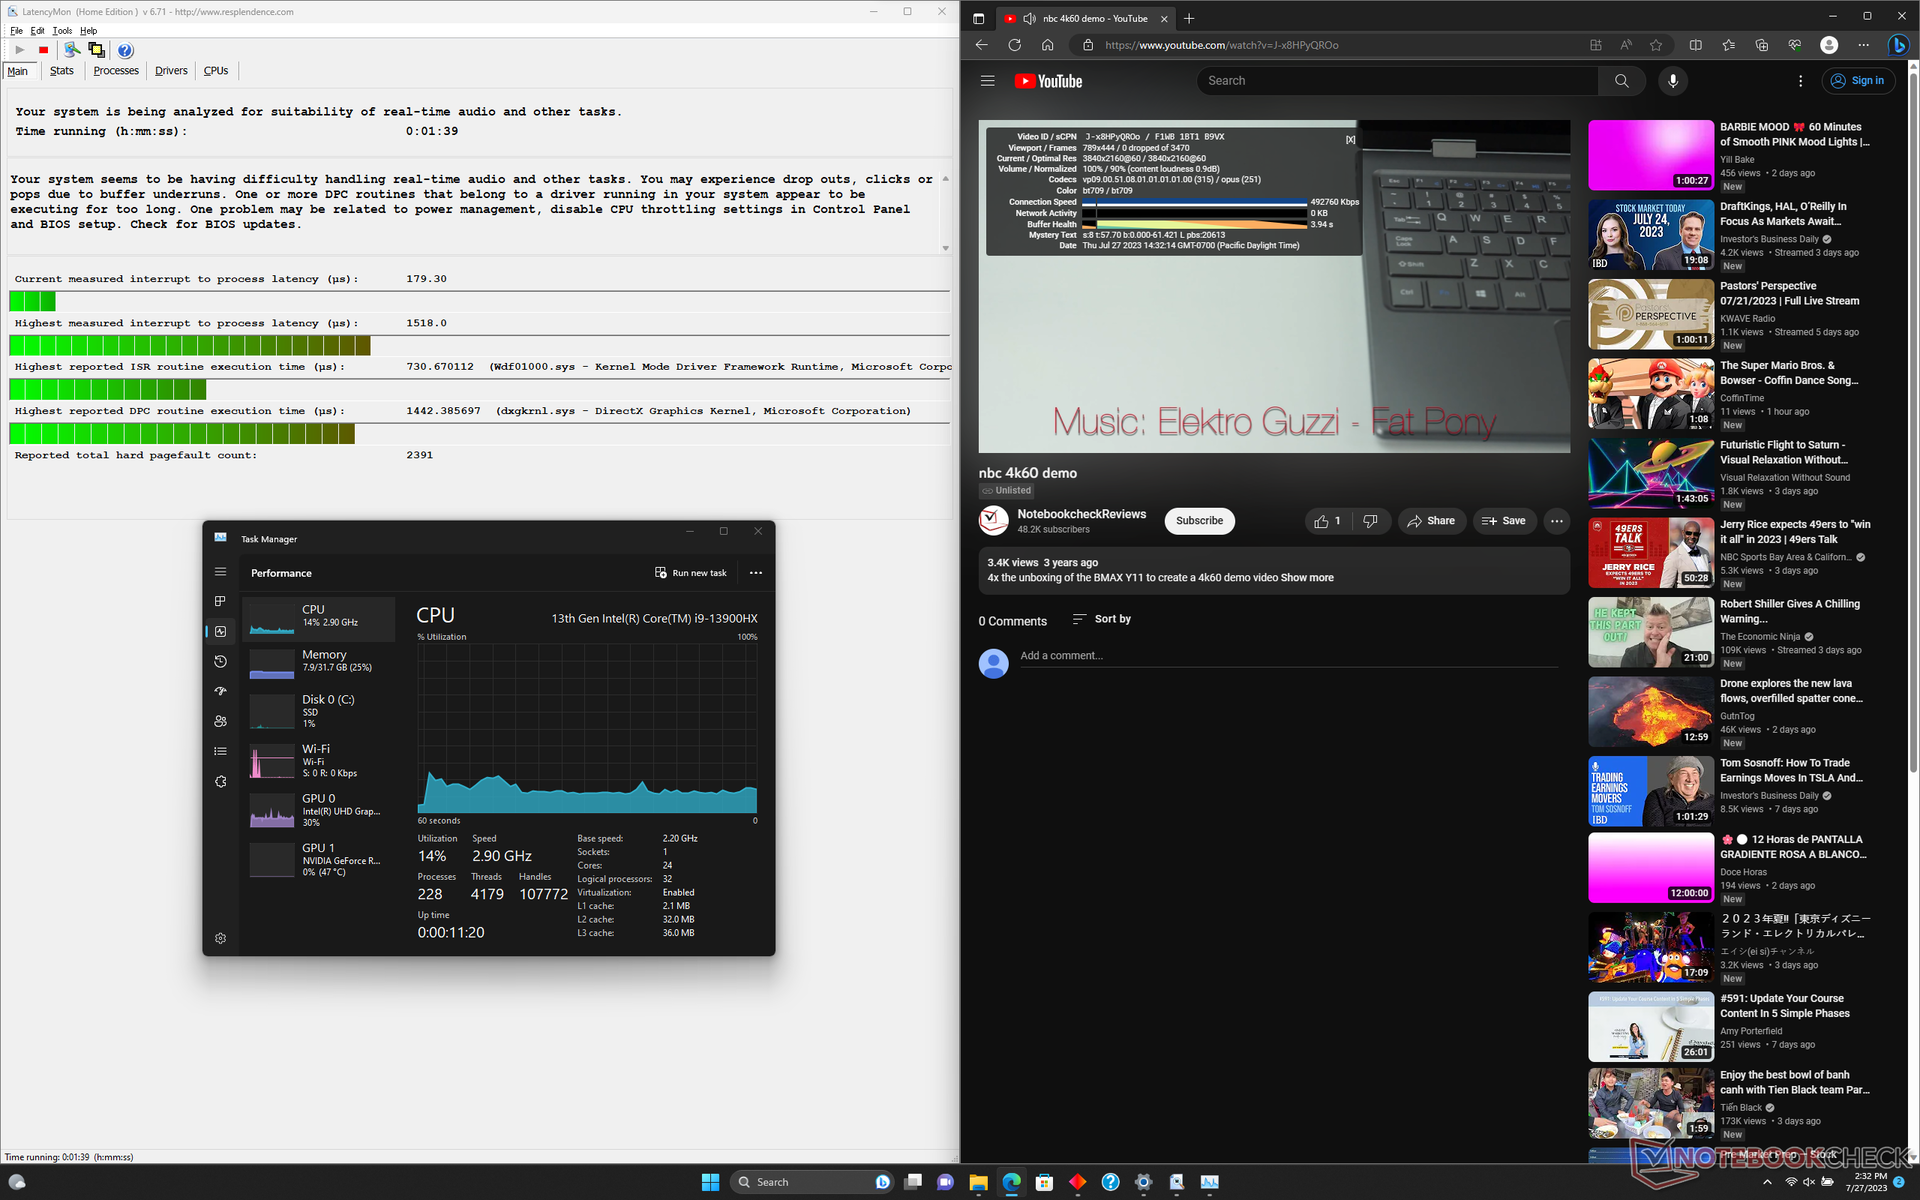
在打开主页的多个浏览器标签页时,LatencyMon 会显示轻微的 DPC 问题。在其他方面,以 60 FPS 播放 4K 视频也非常完美,完全没有掉帧现象。
| DPC Latencies / LatencyMon - interrupt to process latency (max), Web, Youtube, Prime95 | |
| Lenovo Legion Slim 7i 16 Gen 8 | |
| HP Omen 16-wf000 | |
| HP Omen Transcend 16 | |
| Alienware x16 R1 | |
| Acer Nitro 16 AN16-41 | |
| Asus ROG Zephyrus M16 GU603Z | |
* ... smaller is better
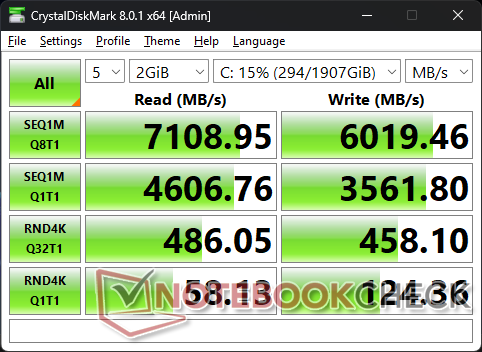
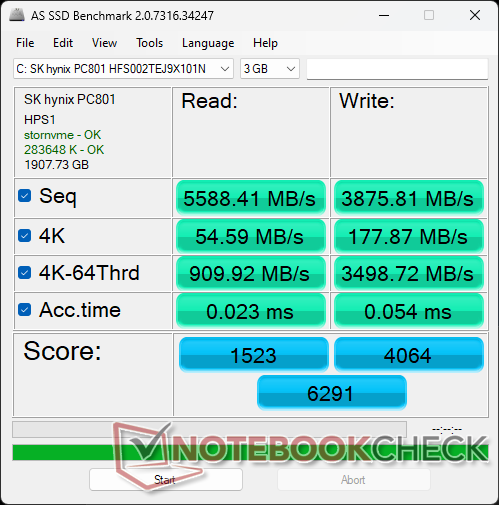
存储设备
Omen Transcend 16 配备了相同的 SK hynix PC801固态硬盘。在我们的压力测试中,该硬盘没有表现出任何性能节流问题,因此能够维持近 7000 MB/s 的最高传输速率,没有出现任何问题。

| Drive Performance rating - Percent | |
| Alienware x16 R1 | |
| Lenovo Legion Slim 7i 16 Gen 8 | |
| Asus ROG Zephyrus M16 GU603Z | |
| HP Omen 16-wf000 | |
| Acer Nitro 16 AN16-41 | |
| HP Omen Transcend 16 | |
* ... smaller is better
Disk Throttling: DiskSpd Read Loop, Queue Depth 8
GPU 性能 - 130 瓦 TGP GPU
图形性能与我们数据库中配备相同移动 RTX 4070 的普通笔记本电脑相当。 移动 RTX 4070图形处理器。不过联想Legion Slim 7i 16 G8的部分原因是其 TGP 目标值略高(145 W 对 130 W)。
降级到 RTX 4060SKU 图形性能将降低约 10%至 20%。同时 RTX 4080可将性能大幅提升 40% 至 50%,但 Omen Transcend 16 目前仅限于 RTX 4070。相比之下,普通的 Omen 16 可以配置比 RTX 4070 更大的 GPU 选项。
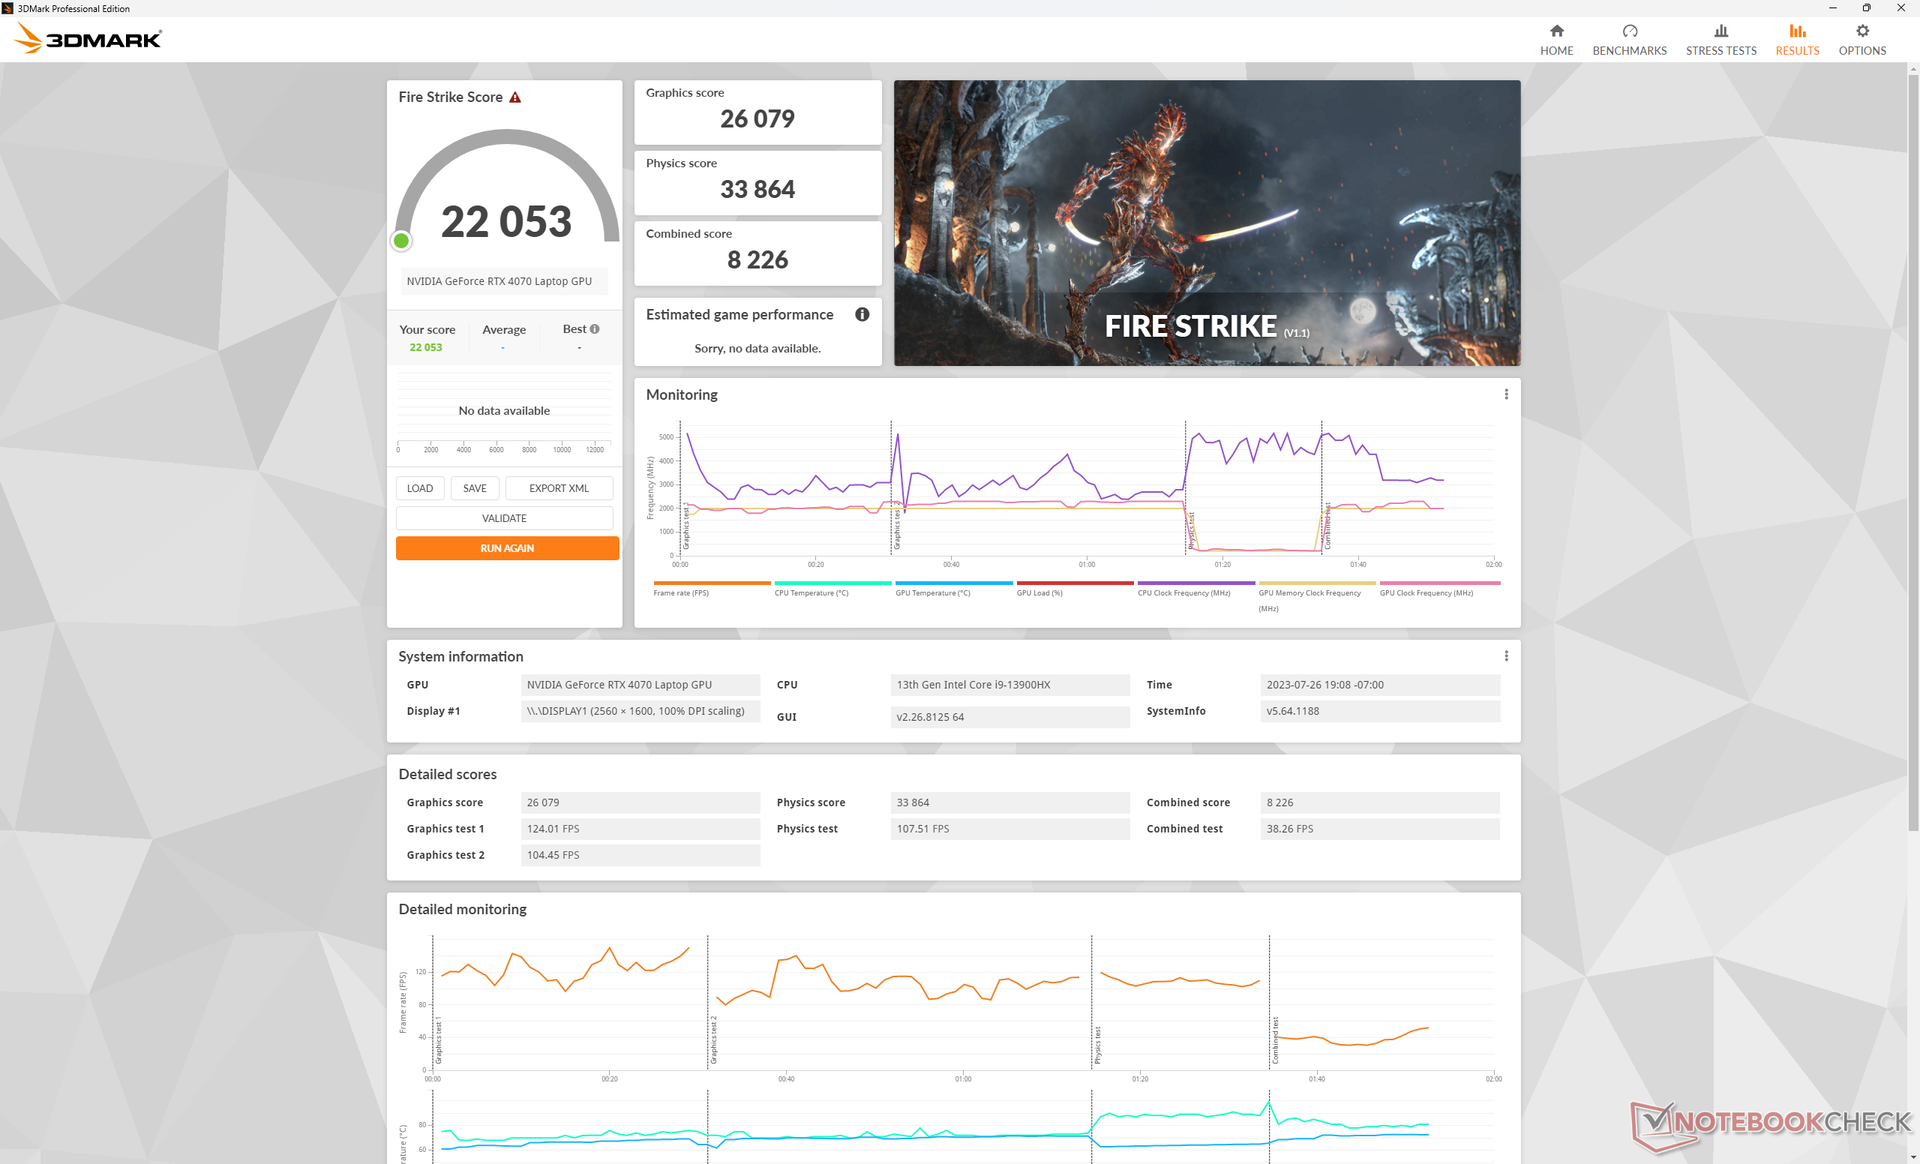
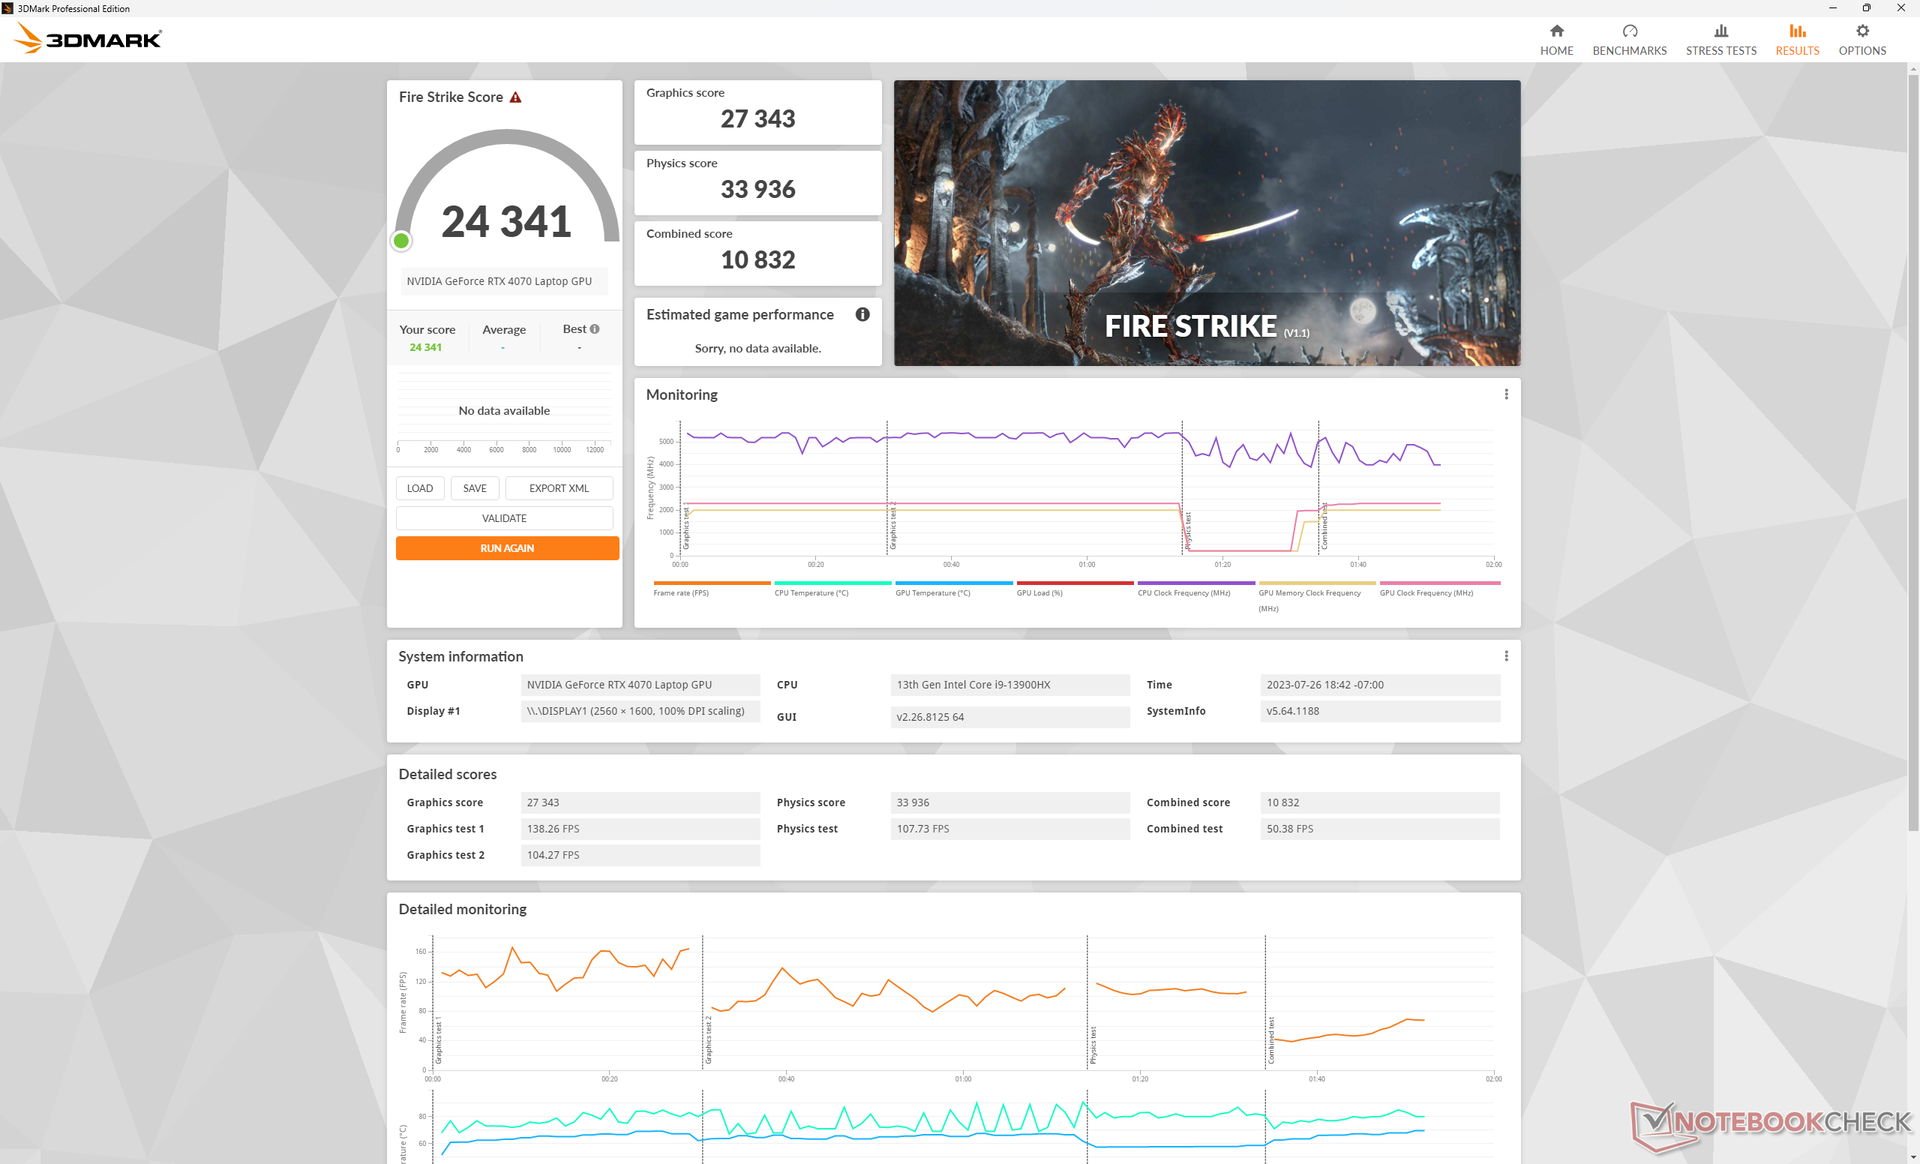
如下表Fire Strike 所示,在平衡模式而非性能模式下运行只会略微降低性能。这一点很重要,因为平衡模式和性能模式之间的风扇噪音差异很大,我们将在系统噪音部分进行说明。
| 电源配置文件 | 图形分数 | 物理得分 | 综合得分 |
| 均衡 | 26079 (-5%) | 33864 (-0%) | 8226 (-24%) |
| 成绩 | 27343 | 33936 | 10832 |
| 3DMark 11 Performance | 32031 points | |
| 3DMark Fire Strike Score | 24341 points | |
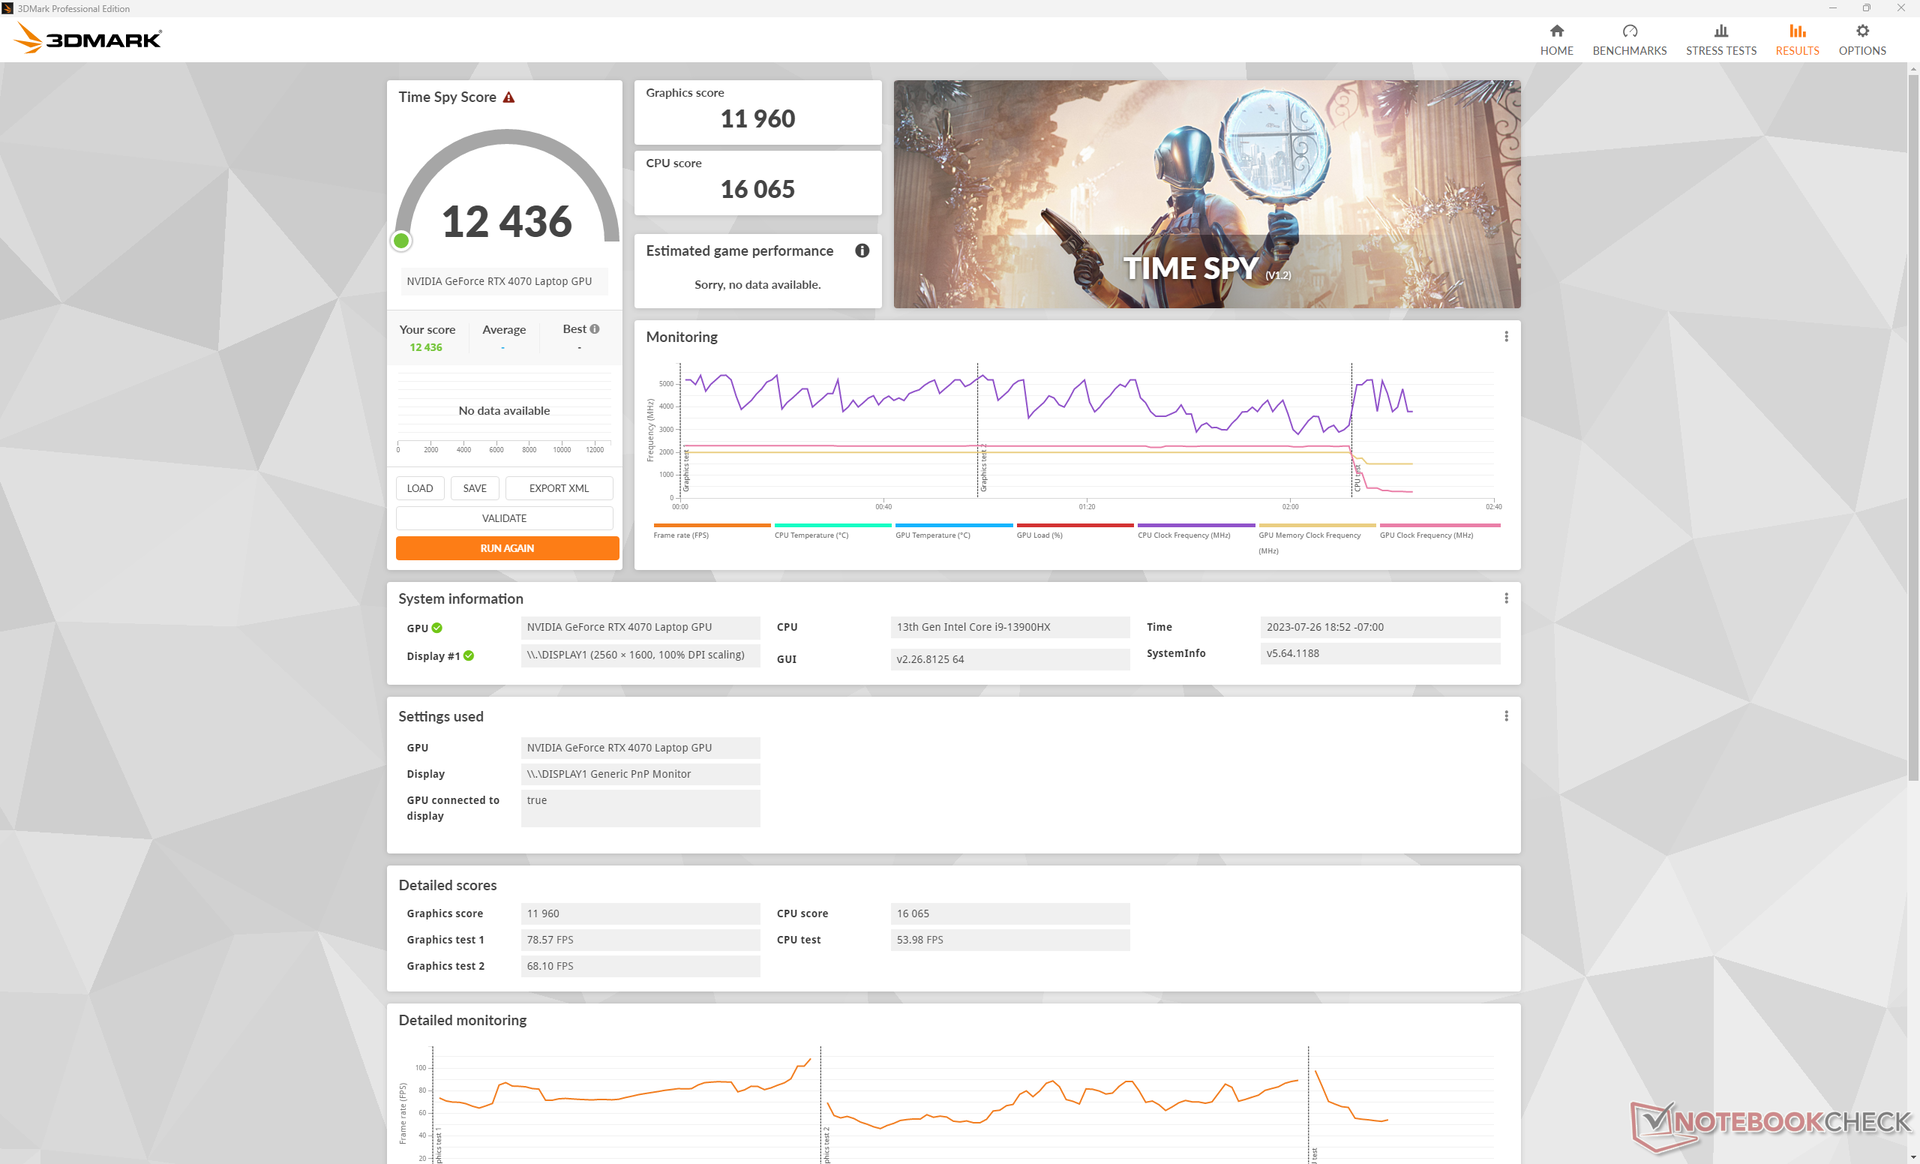
| 3DMark Time Spy Score | 12436 points | |
Help | ||
* ... smaller is better
游戏性能
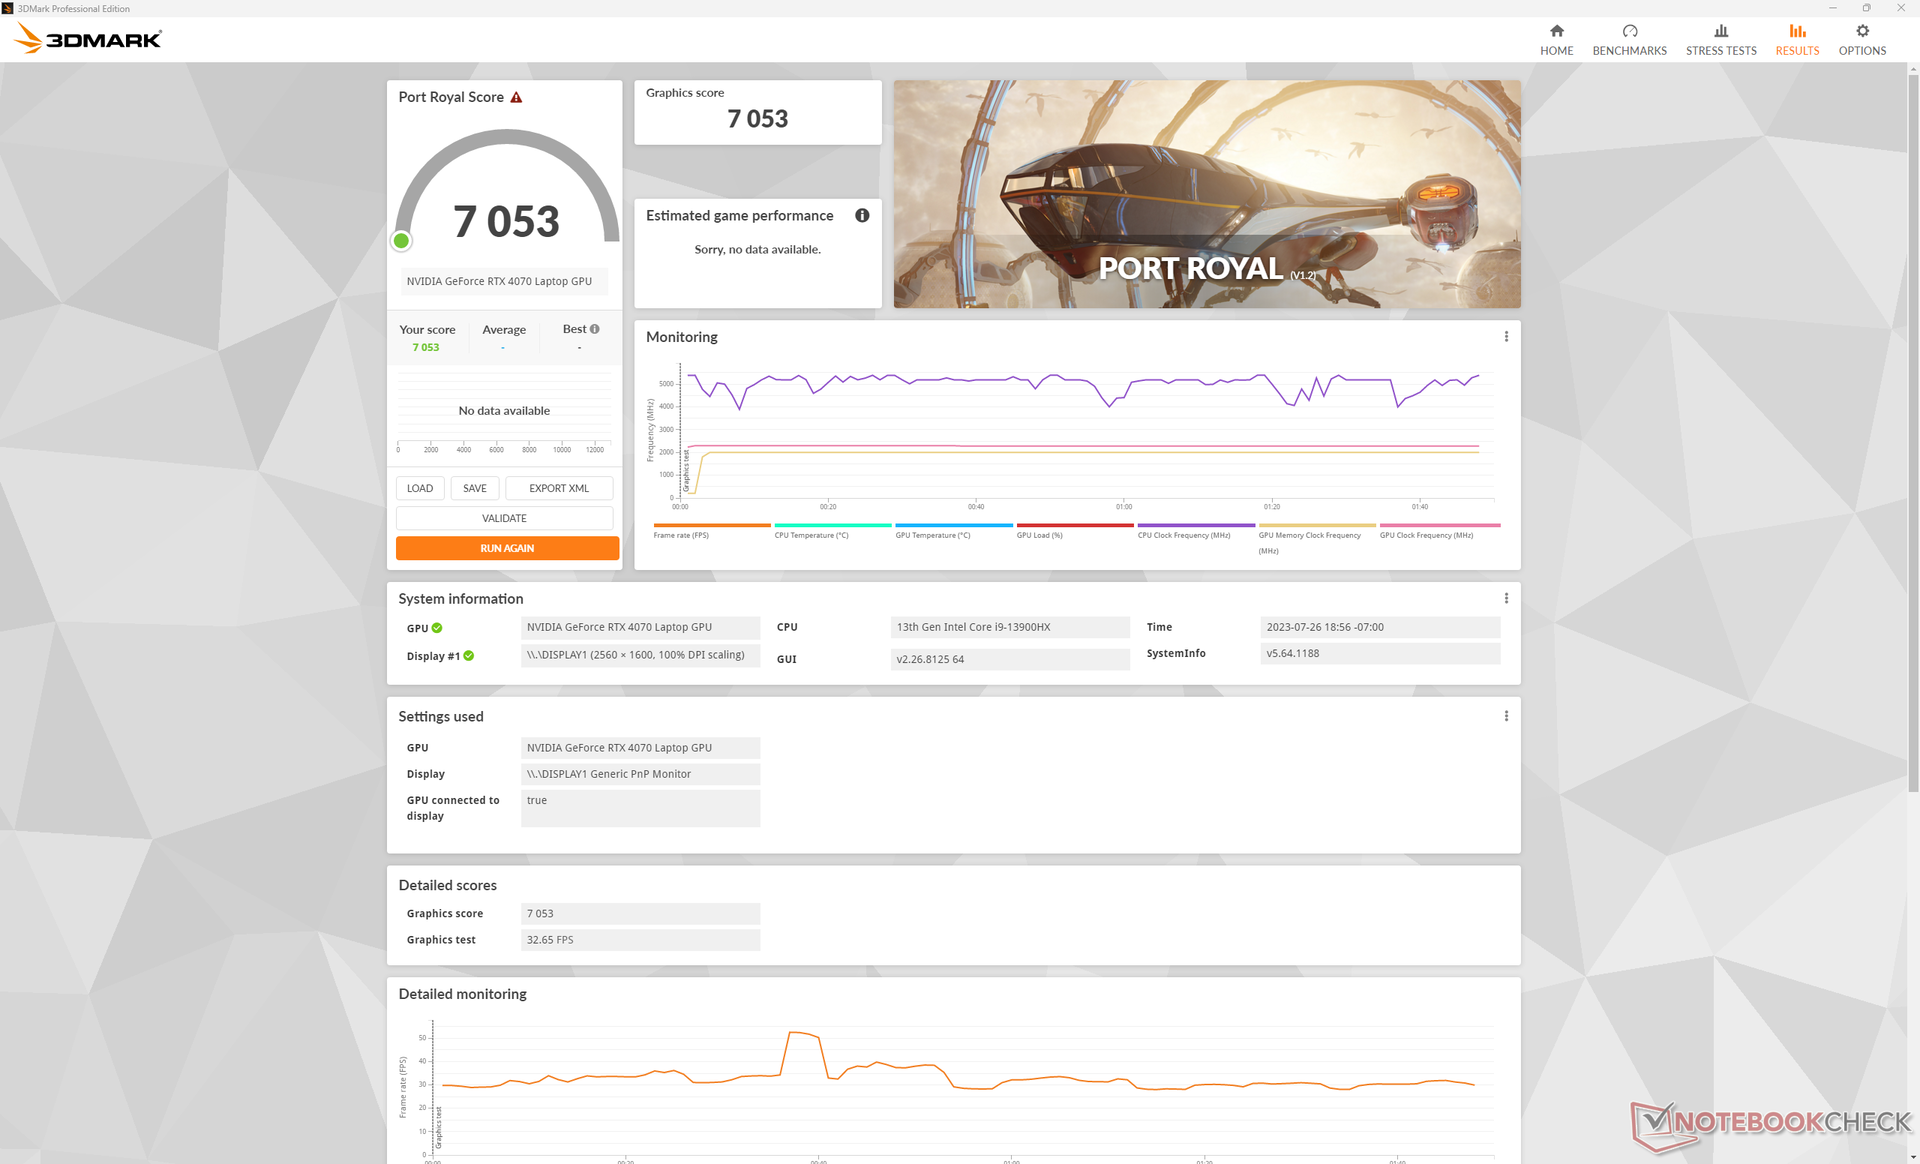
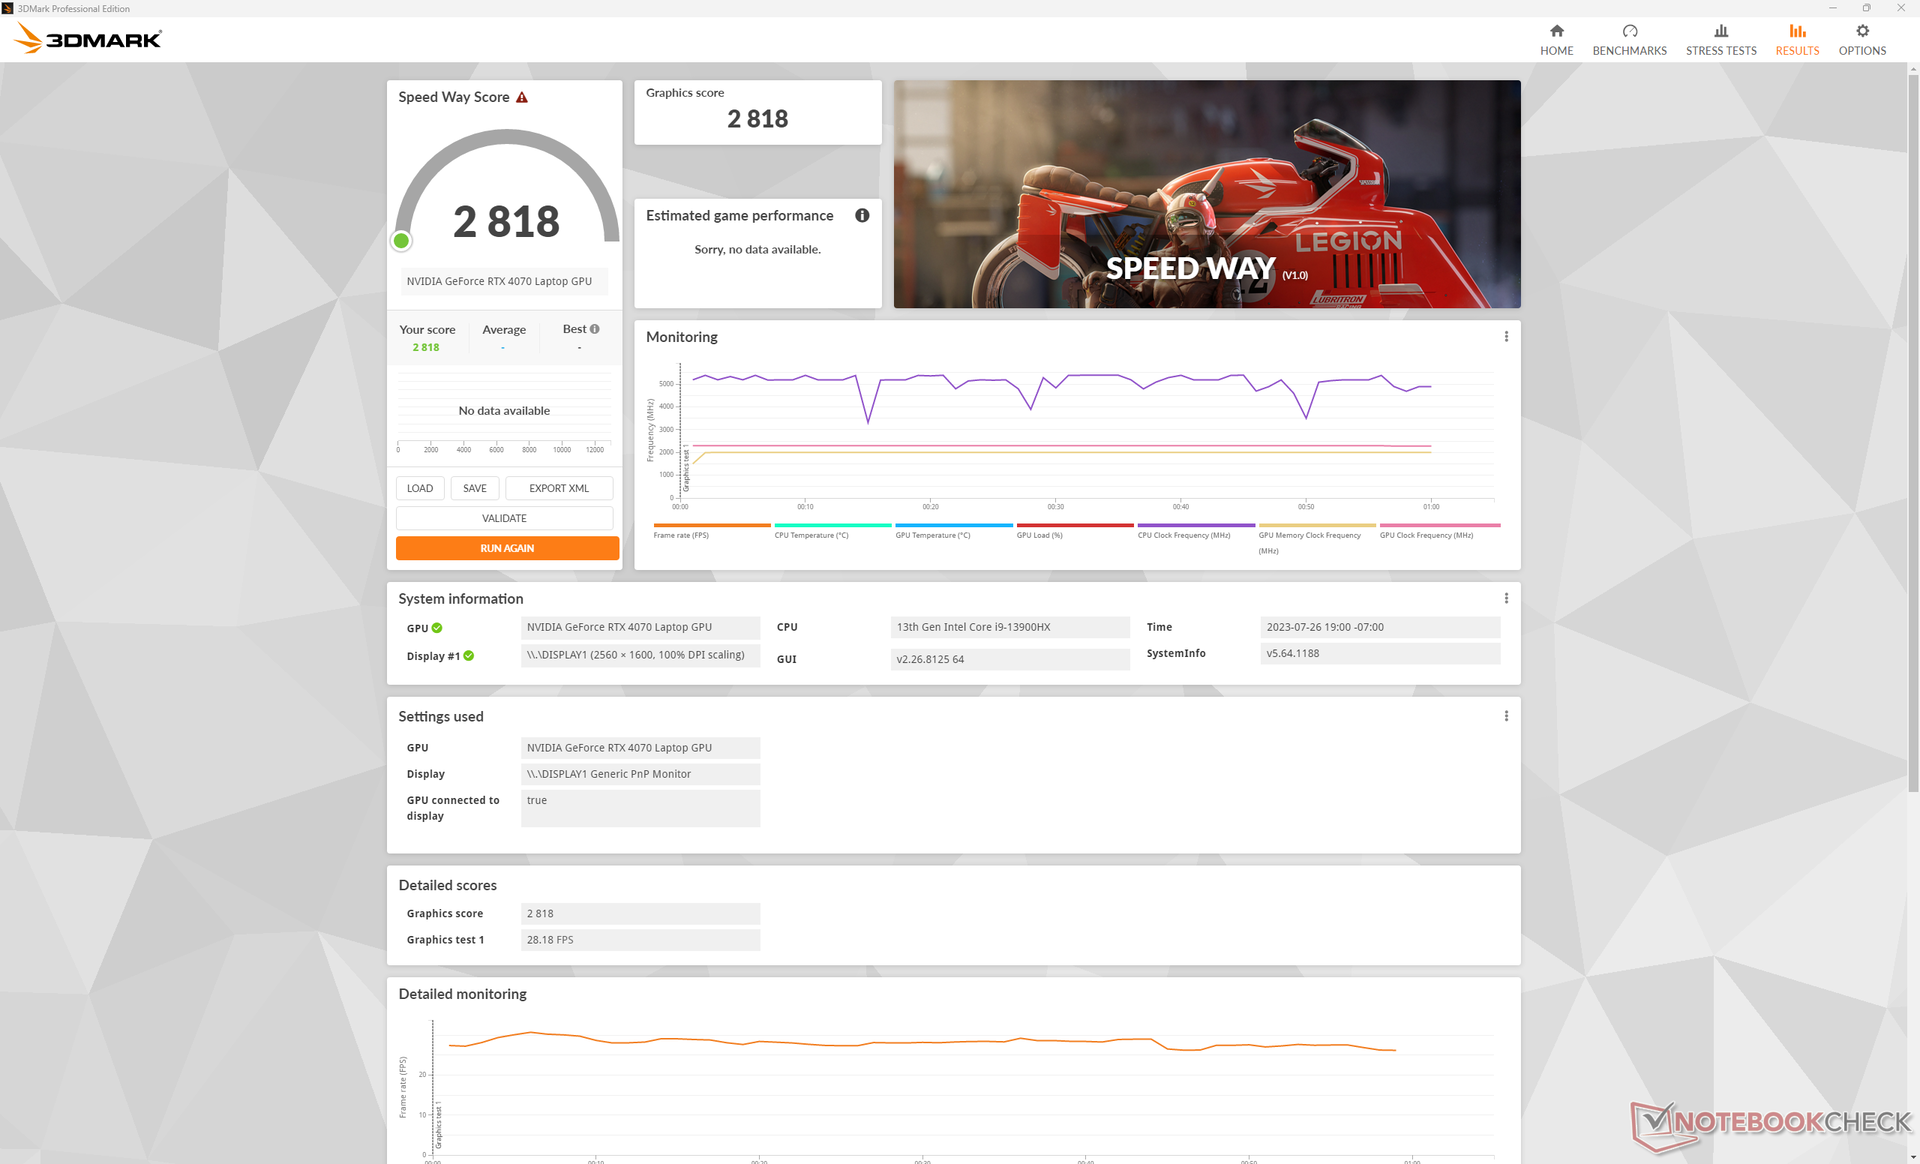
所有游戏均可在原生 QHD+ 分辨率下以高至最高设置进行游戏,甚至包括《Returnal 》或《赛博朋克 2077》等要求苛刻的游戏。如果启用 RT 功能或在外部 4K 显示器上播放,仍建议使用 DLSS。
Witcher 3 FPS Chart
| low | med. | high | ultra | QHD | 4K | |
|---|---|---|---|---|---|---|
| The Witcher 3 (2015) | 500.9 | 375.9 | 222.7 | 111.8 | 65.7 | |
| Dota 2 Reborn (2015) | 212 | 192 | 188.4 | 168.4 | 142.5 | |
| Final Fantasy XV Benchmark (2018) | 220 | 164.8 | 82.6 | 47.1 | ||
| X-Plane 11.11 (2018) | 191.5 | 169.8 | 132.9 | 114 | ||
| Strange Brigade (2018) | 414 | 310 | 245 | 208 | 133.3 | 71.4 |
| Cyberpunk 2077 1.6 (2022) | 128.5 | 118.1 | 103 | 87.5 | 54.5 | 23.5 |
| Tiny Tina's Wonderlands (2022) | 241.7 | 195.6 | 132.5 | 102 | 70.4 | 33.6 |
| F1 22 (2022) | 301 | 289 | 221 | 79.3 | 50.4 | 24.7 |
| Returnal (2023) | 109 | 115 | 101 | 79 | 64 | 37 |
排放量
系统噪声 - 平衡模式与性能模式之间的巨大差异
整体风扇噪音比我们在 Omen 16 上体验到的噪音略小。 奥门 16但值得注意的是,Omen 16 配备了速度更快的 RTX 4080 GPU,其 TGP 为 145 W,而我们的 RTX 4070 GPU 的 TGP 为 130 W。
在性能模式下进行游戏时,风扇噪音可高达 54.3 dB(A),而在平衡模式下仅为 42 dB(A)。如上所述,你会损失一些性能,但噪音的显著降低可能值得考虑。此外,50 分贝(A)左右的游戏音量也可与其他产品媲美,如Alienware x16 R1.
Noise level
| Idle |
| 29.1 / 29.1 / 29.1 dB(A) |
| Load |
| 45.7 / 54.3 dB(A) |
 | ||
30 dB silent 40 dB(A) audible 50 dB(A) loud |
||
min: | ||
| HP Omen Transcend 16 GeForce RTX 4070 Laptop GPU, i9-13900HX, SK hynix PC801 HFS002TEJ9X101N | Lenovo Legion Slim 7i 16 Gen 8 GeForce RTX 4070 Laptop GPU, i9-13900H, Samsung PM9A1 MZVL21T0HCLR | HP Omen 16-wf000 GeForce RTX 4080 Laptop GPU, i7-13700HX, SK hynix PC801 HFS002TEJ9X101N | Alienware x16 R1 GeForce RTX 4080 Laptop GPU, i9-13900HK, SK hynix PC801 HFS001TEJ9X101N | Acer Nitro 16 AN16-41 GeForce RTX 4070 Laptop GPU, R7 7735HS, Samsung PM9A1 MZVL21T0HCLR | Asus ROG Zephyrus M16 GU603Z GeForce RTX 3070 Ti Laptop GPU, i9-12900H, Micron 3400 1TB MTFDKBA1T0TFH | |
|---|---|---|---|---|---|---|
| Noise | 13% | 1% | 9% | 6% | -2% | |
| off / environment * (dB) | 22.9 | 22.8 -0% | 23 -0% | 22.7 1% | 25.7 -12% | 23 -0% |
| Idle Minimum * (dB) | 29.1 | 23.6 19% | 29.6 -2% | 23.1 21% | 25.7 12% | 23 21% |
| Idle Average * (dB) | 29.1 | 23.6 19% | 29.8 -2% | 25.8 11% | 25.7 12% | 24 18% |
| Idle Maximum * (dB) | 29.1 | 25.7 12% | 30.4 -4% | 25.8 11% | 26.3 10% | 47 -62% |
| Load Average * (dB) | 45.7 | 27.6 40% | 33.8 26% | 39.3 14% | 33.9 26% | 47.91 -5% |
| Witcher 3 ultra * (dB) | 54.3 | 54.4 -0% | 57 -5% | 49.9 8% | 48.91 10% | |
| Load Maximum * (dB) | 54.3 | 54.4 -0% | 58.3 -7% | 54.8 -1% | 62 -14% | 50.25 7% |
* ... smaller is better
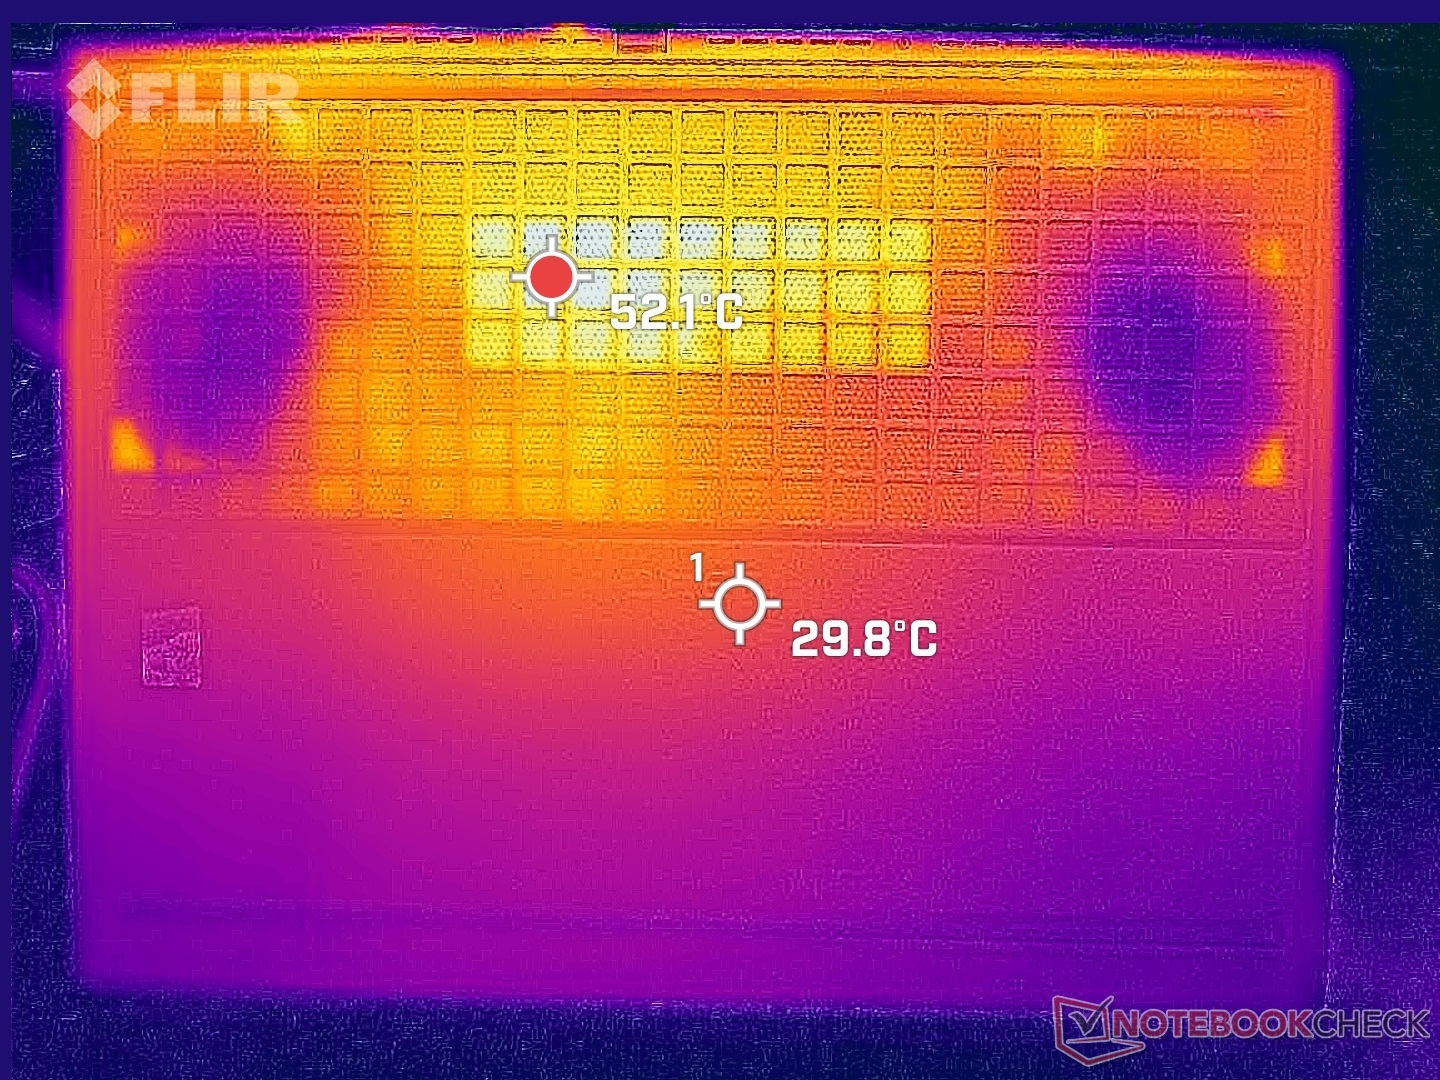
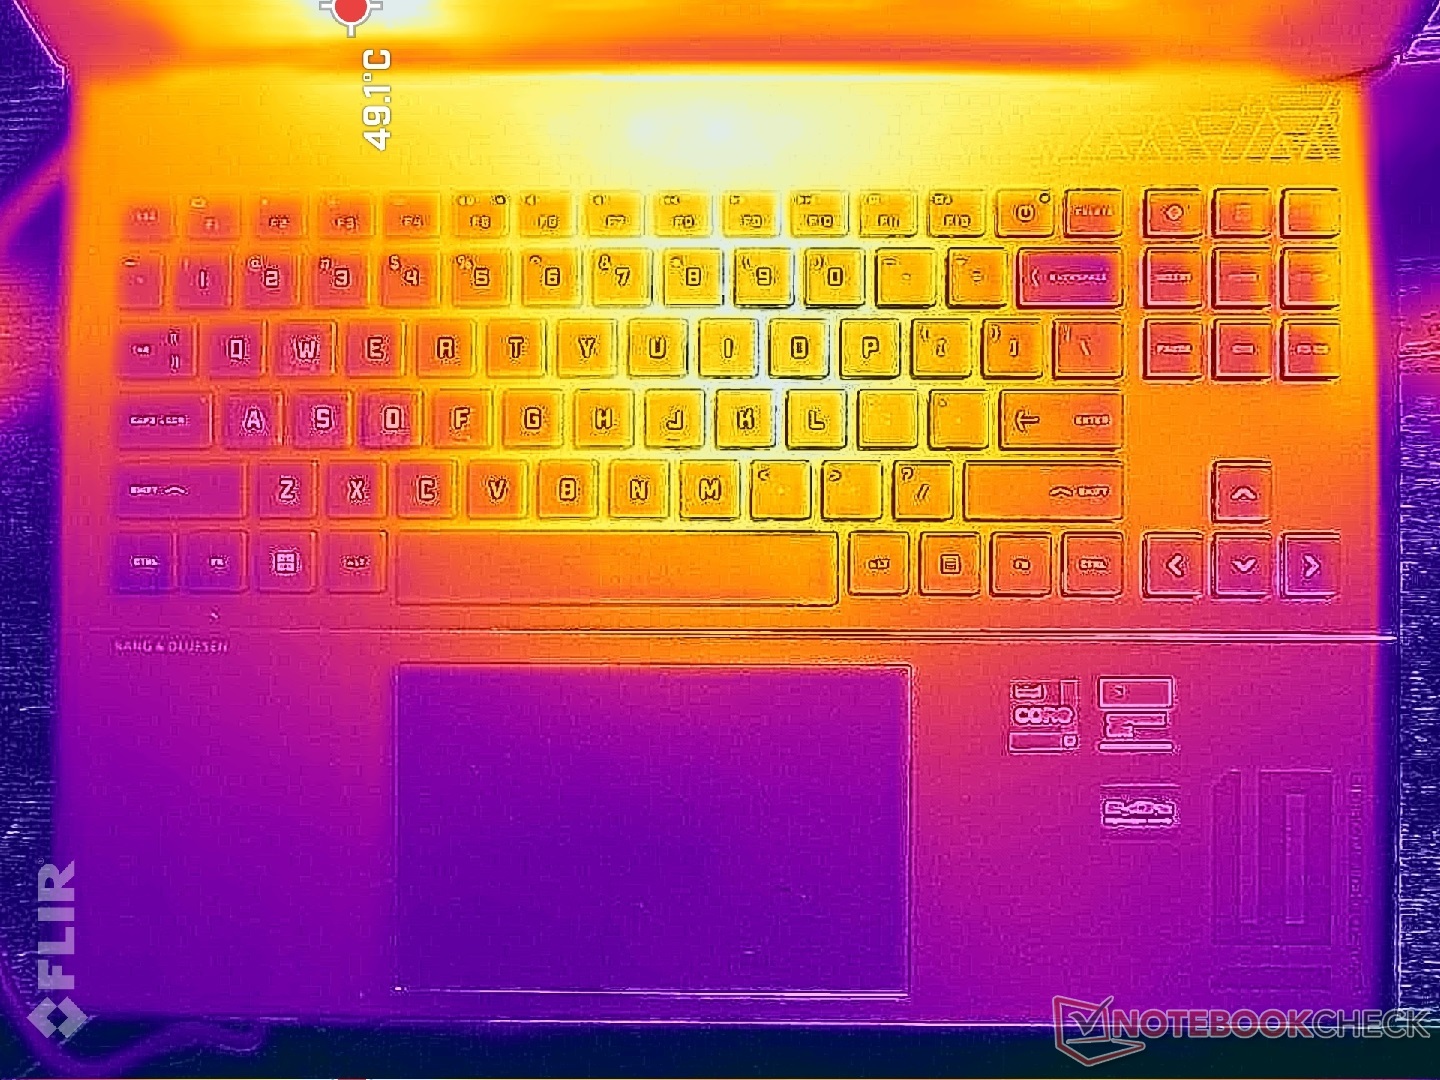
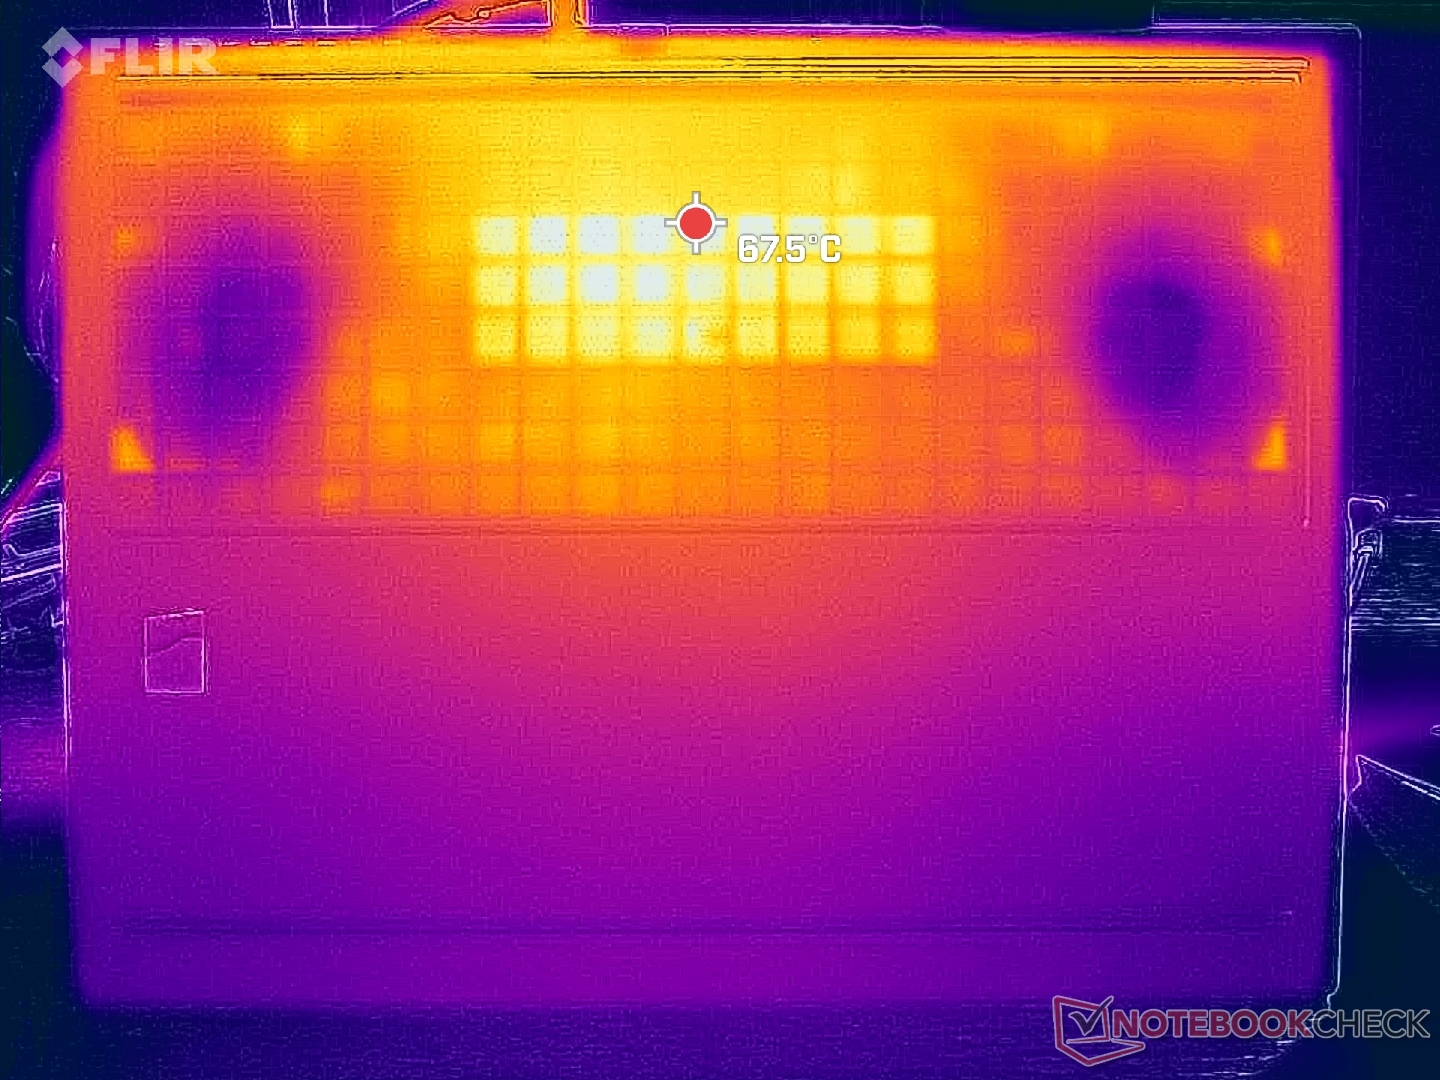
温度
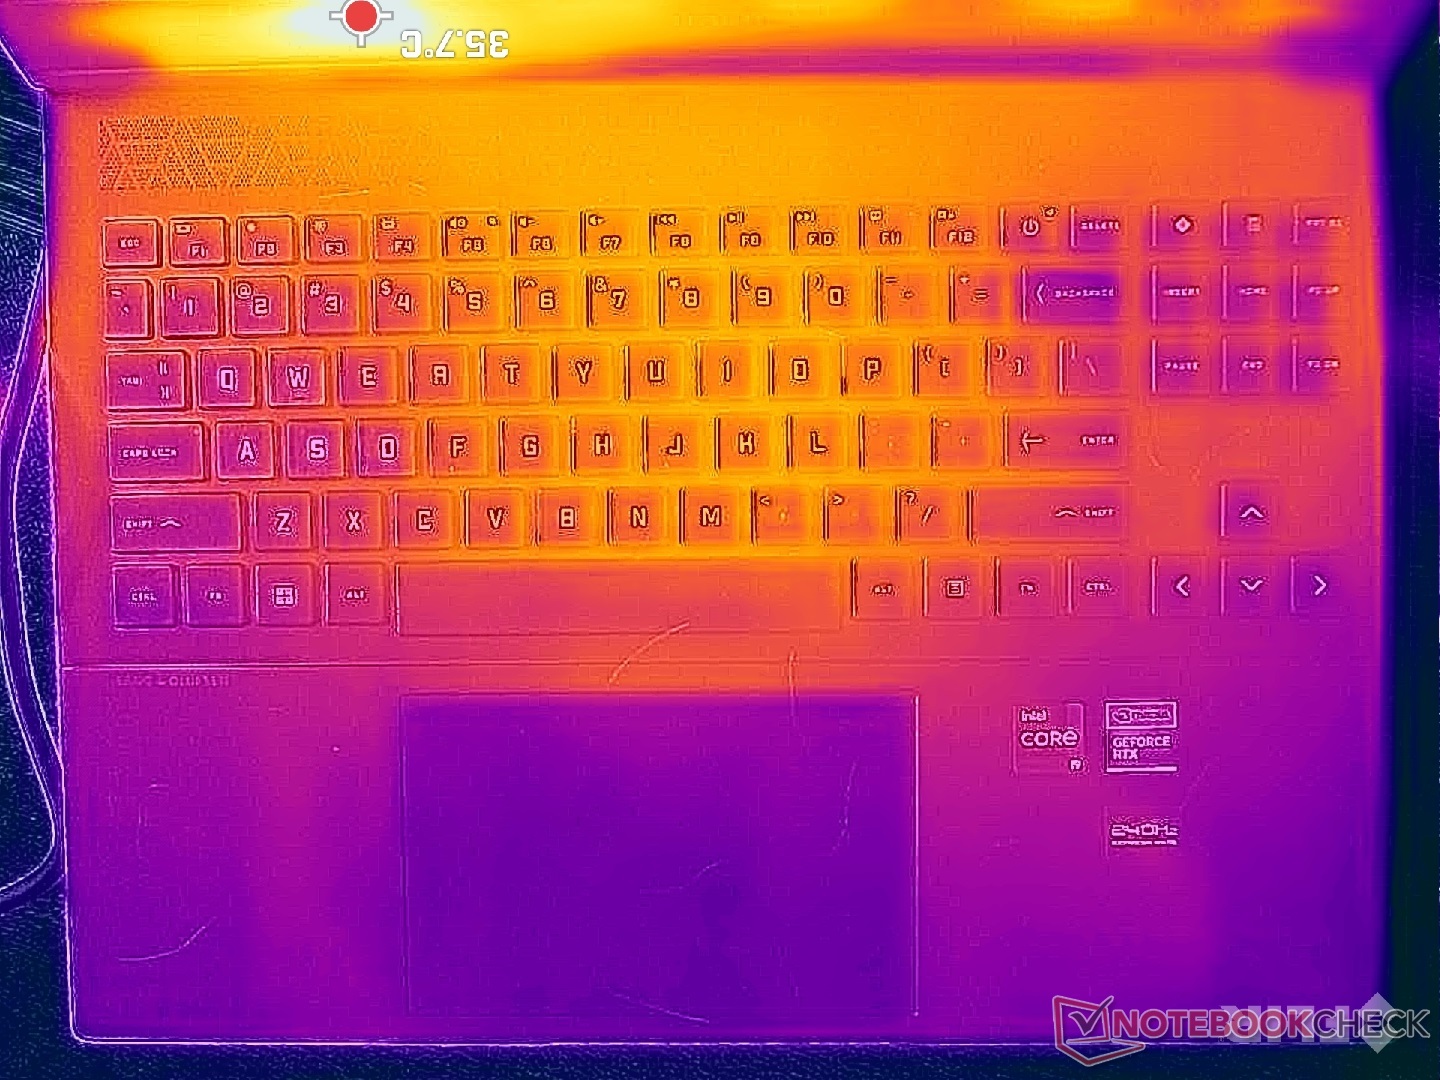
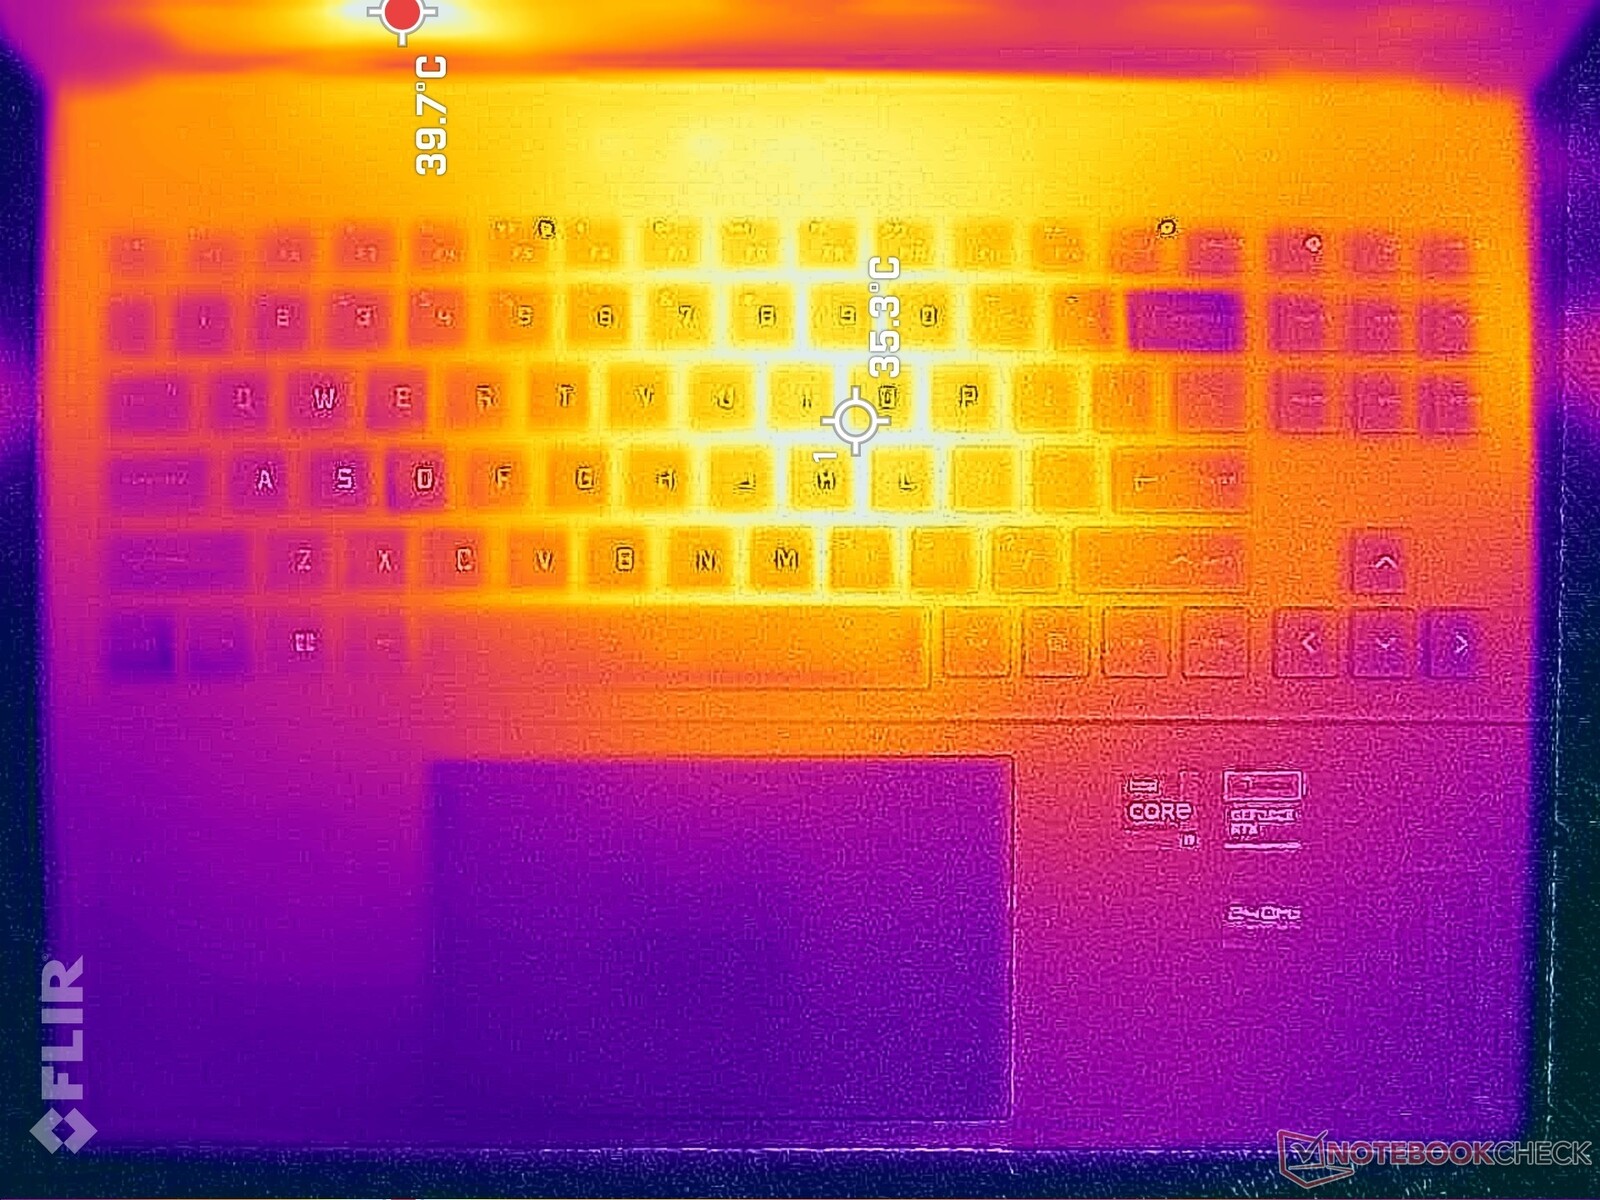
由于内部采用了对称散热解决方案,键盘表面温度以中心温度最高。游戏时,键盘中心温度可达 40 至 45 摄氏度,底部温度更高。不过,这个范围仍与Legion Slim 7i 16 G8.笔记本电脑的其他部分温度较低,包括掌托、WASD 键和方向键,这些地方在游戏时皮肤接触较多。
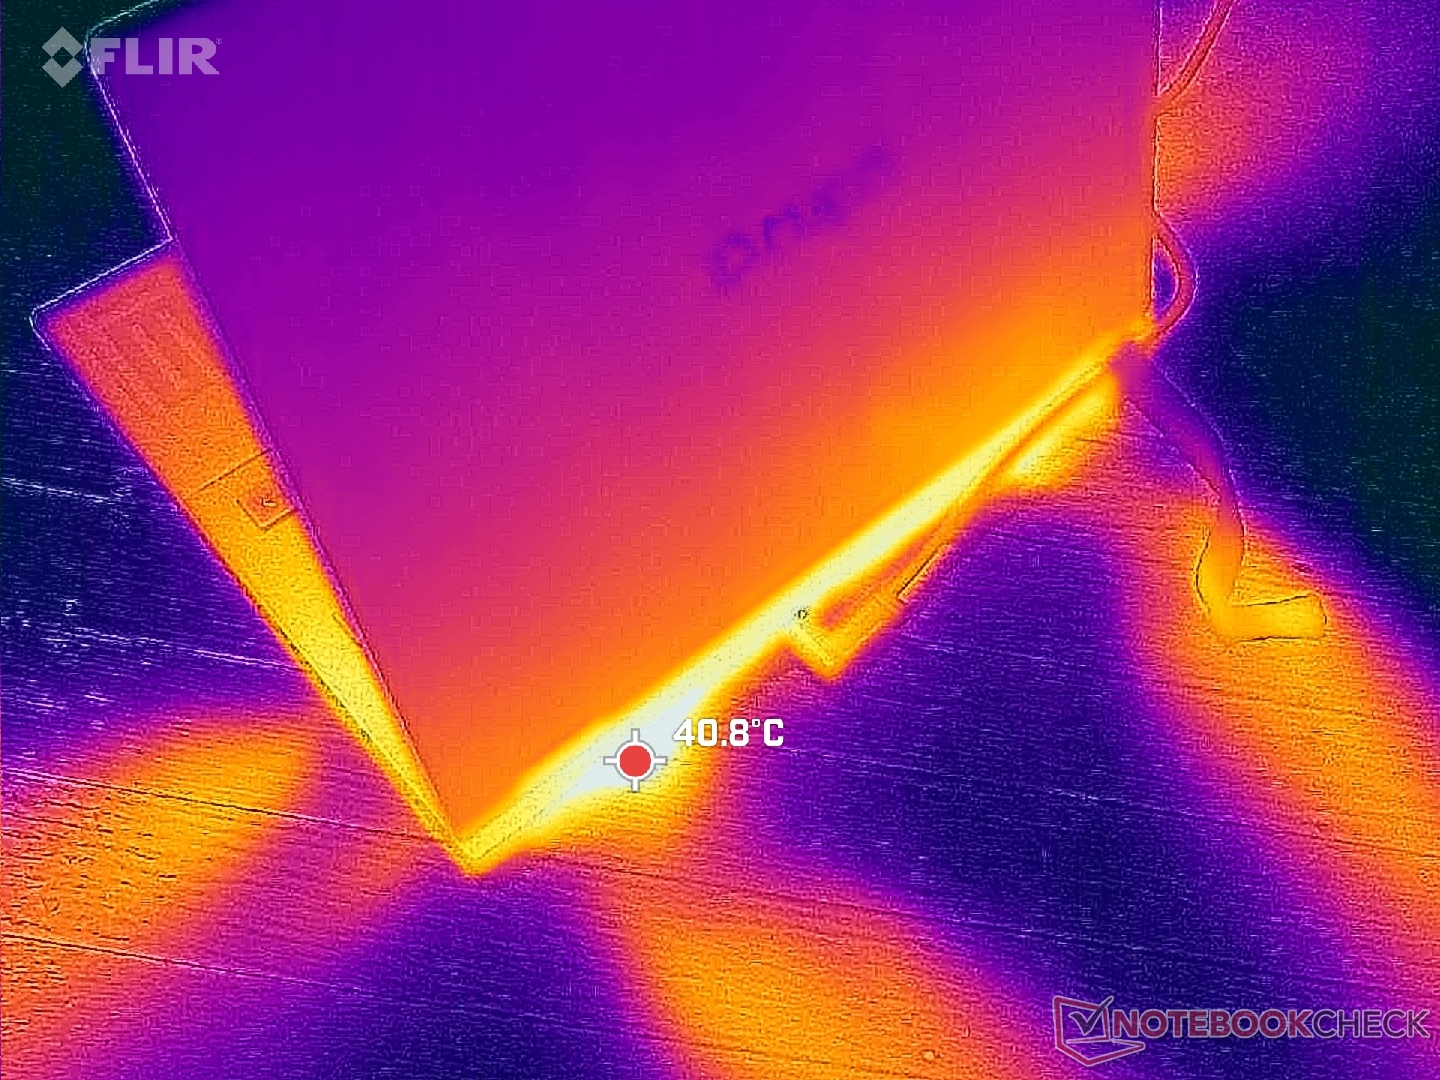
(-) The maximum temperature on the upper side is 47.4 °C / 117 F, compared to the average of 40.4 °C / 105 F, ranging from 21.2 to 68.8 °C for the class Gaming.
(-) The bottom heats up to a maximum of 54.4 °C / 130 F, compared to the average of 43.2 °C / 110 F
(+) In idle usage, the average temperature for the upper side is 25.4 °C / 78 F, compared to the device average of 33.9 °C / 93 F.
(±) Playing The Witcher 3, the average temperature for the upper side is 32.5 °C / 91 F, compared to the device average of 33.9 °C / 93 F.
(+) The palmrests and touchpad are cooler than skin temperature with a maximum of 29.6 °C / 85.3 F and are therefore cool to the touch.
(±) The average temperature of the palmrest area of similar devices was 28.8 °C / 83.8 F (-0.8 °C / -1.5 F).
| HP Omen Transcend 16 Intel Core i9-13900HX, NVIDIA GeForce RTX 4070 Laptop GPU | Lenovo Legion Slim 7i 16 Gen 8 Intel Core i9-13900H, NVIDIA GeForce RTX 4070 Laptop GPU | HP Omen 16-wf000 Intel Core i7-13700HX, NVIDIA GeForce RTX 4080 Laptop GPU | Alienware x16 R1 Intel Core i9-13900HK, NVIDIA GeForce RTX 4080 Laptop GPU | Acer Nitro 16 AN16-41 AMD Ryzen 7 7735HS, NVIDIA GeForce RTX 4070 Laptop GPU | Asus ROG Zephyrus M16 GU603Z Intel Core i9-12900H, NVIDIA GeForce RTX 3070 Ti Laptop GPU | |
|---|---|---|---|---|---|---|
| Heat | -1% | 3% | -10% | -3% | -5% | |
| Maximum Upper Side * (°C) | 47.4 | 49.8 -5% | 45 5% | 47.2 -0% | 41.5 12% | 52 -10% |
| Maximum Bottom * (°C) | 54.4 | 48.8 10% | 48.8 10% | 47.8 12% | 51.8 5% | 51 6% |
| Idle Upper Side * (°C) | 28.4 | 29.4 -4% | 29.2 -3% | 36.8 -30% | 31.6 -11% | 29 -2% |
| Idle Bottom * (°C) | 29.2 | 30 -3% | 28.8 1% | 35.8 -23% | 34.5 -18% | 33 -13% |
* ... smaller is better
压力测试
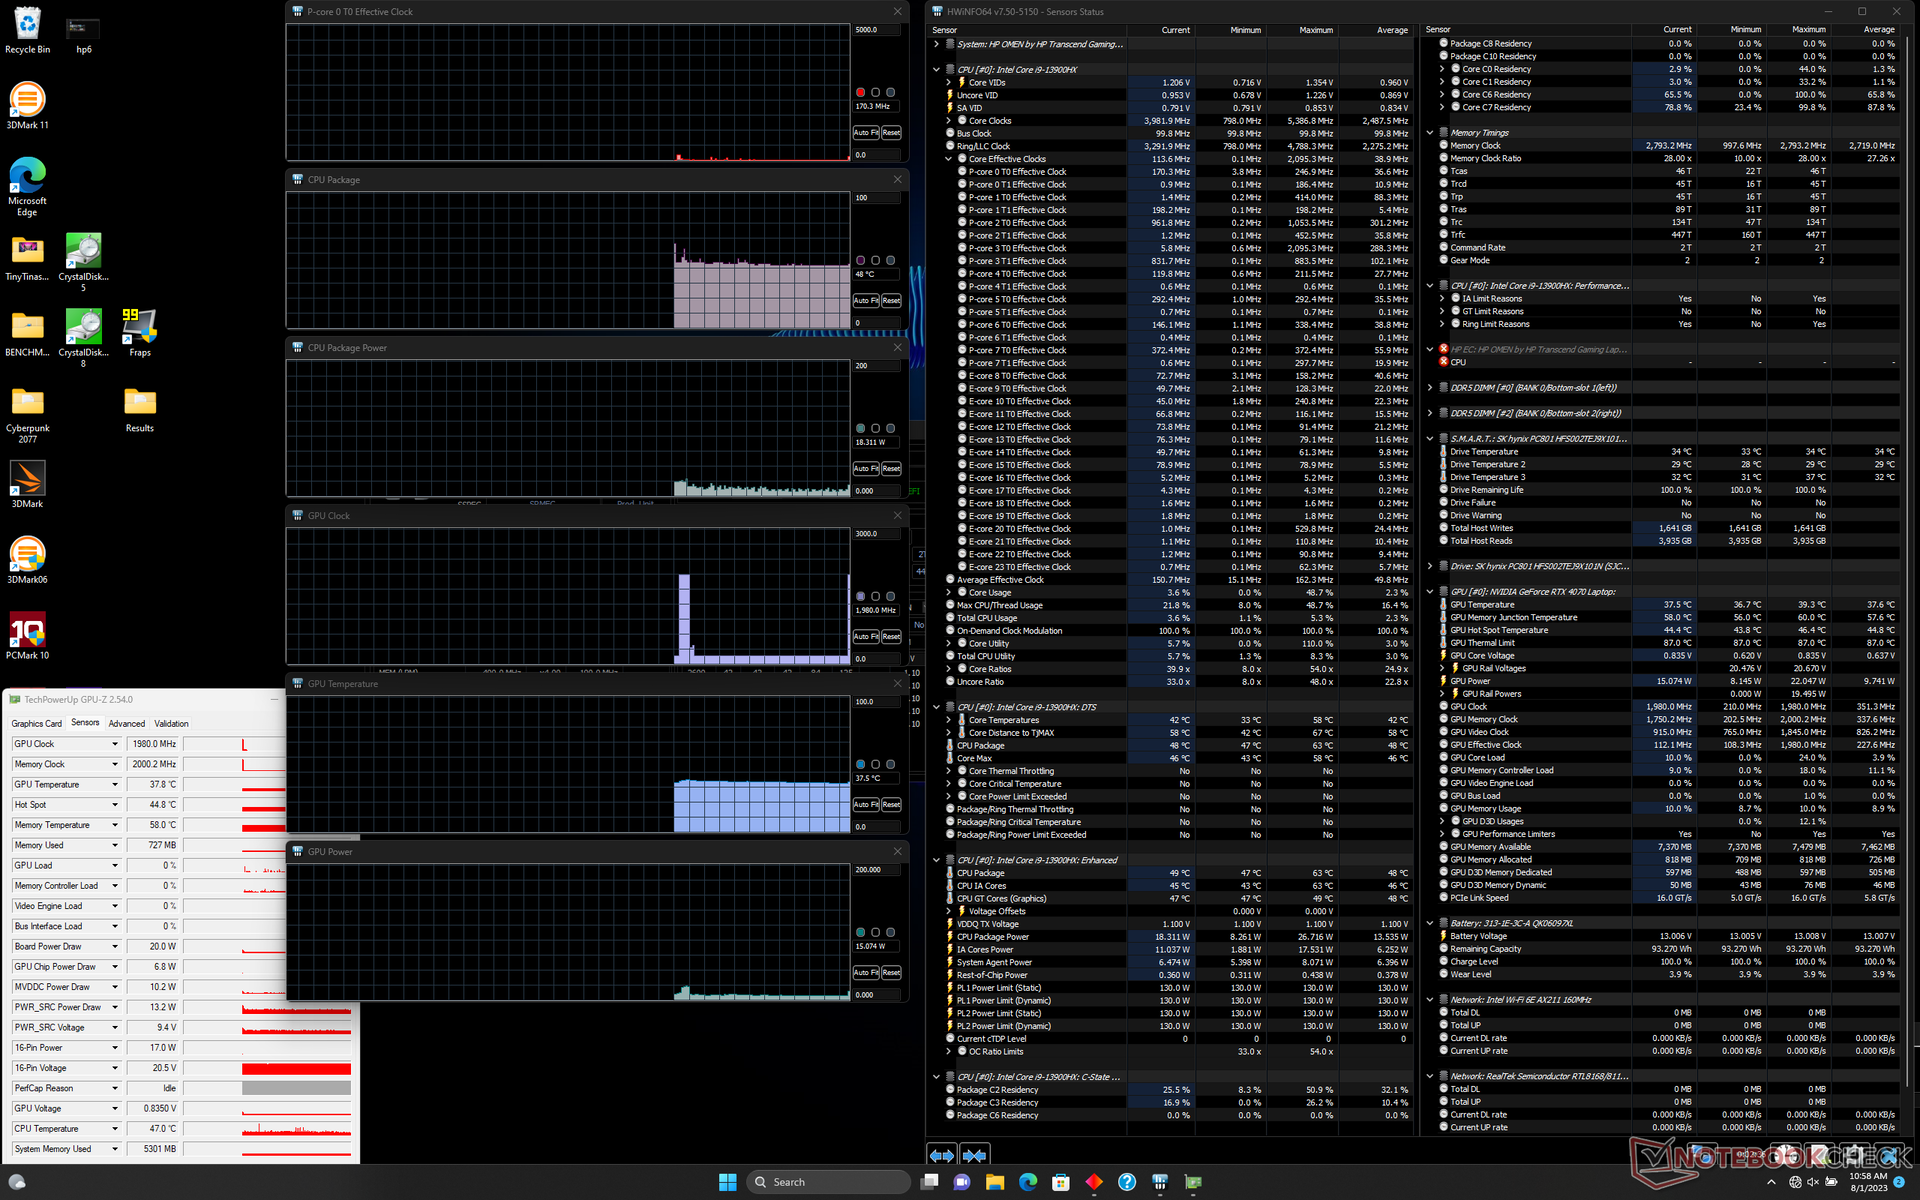
在运行 Prime95 压力测试时,CPU 的频率会升至 3.1 GHz,功耗为 101 W,然后迅速下降并稳定在 2.4 GHz 和 84 W 左右,以保持 81 C 的合理核心温度。
在性能模式下运行时,Nvidia GPU 将分别稳定在 2115 MHz、86 C 和 94 W。 Witcher 3性能模式。如果在平衡模式下,GPU 的频率将降至 2085 MHz、76 C 和 86 W。与 130 瓦的 TGP 目标值相比,我们只能达到 105 瓦的实际 GPU 功耗峰值。
使用电池供电限制了性能。Fire Strike ,物理和图形得分分别为 21003 分和 17627 分,而使用电源时分别为 33936 分和 27343 分。
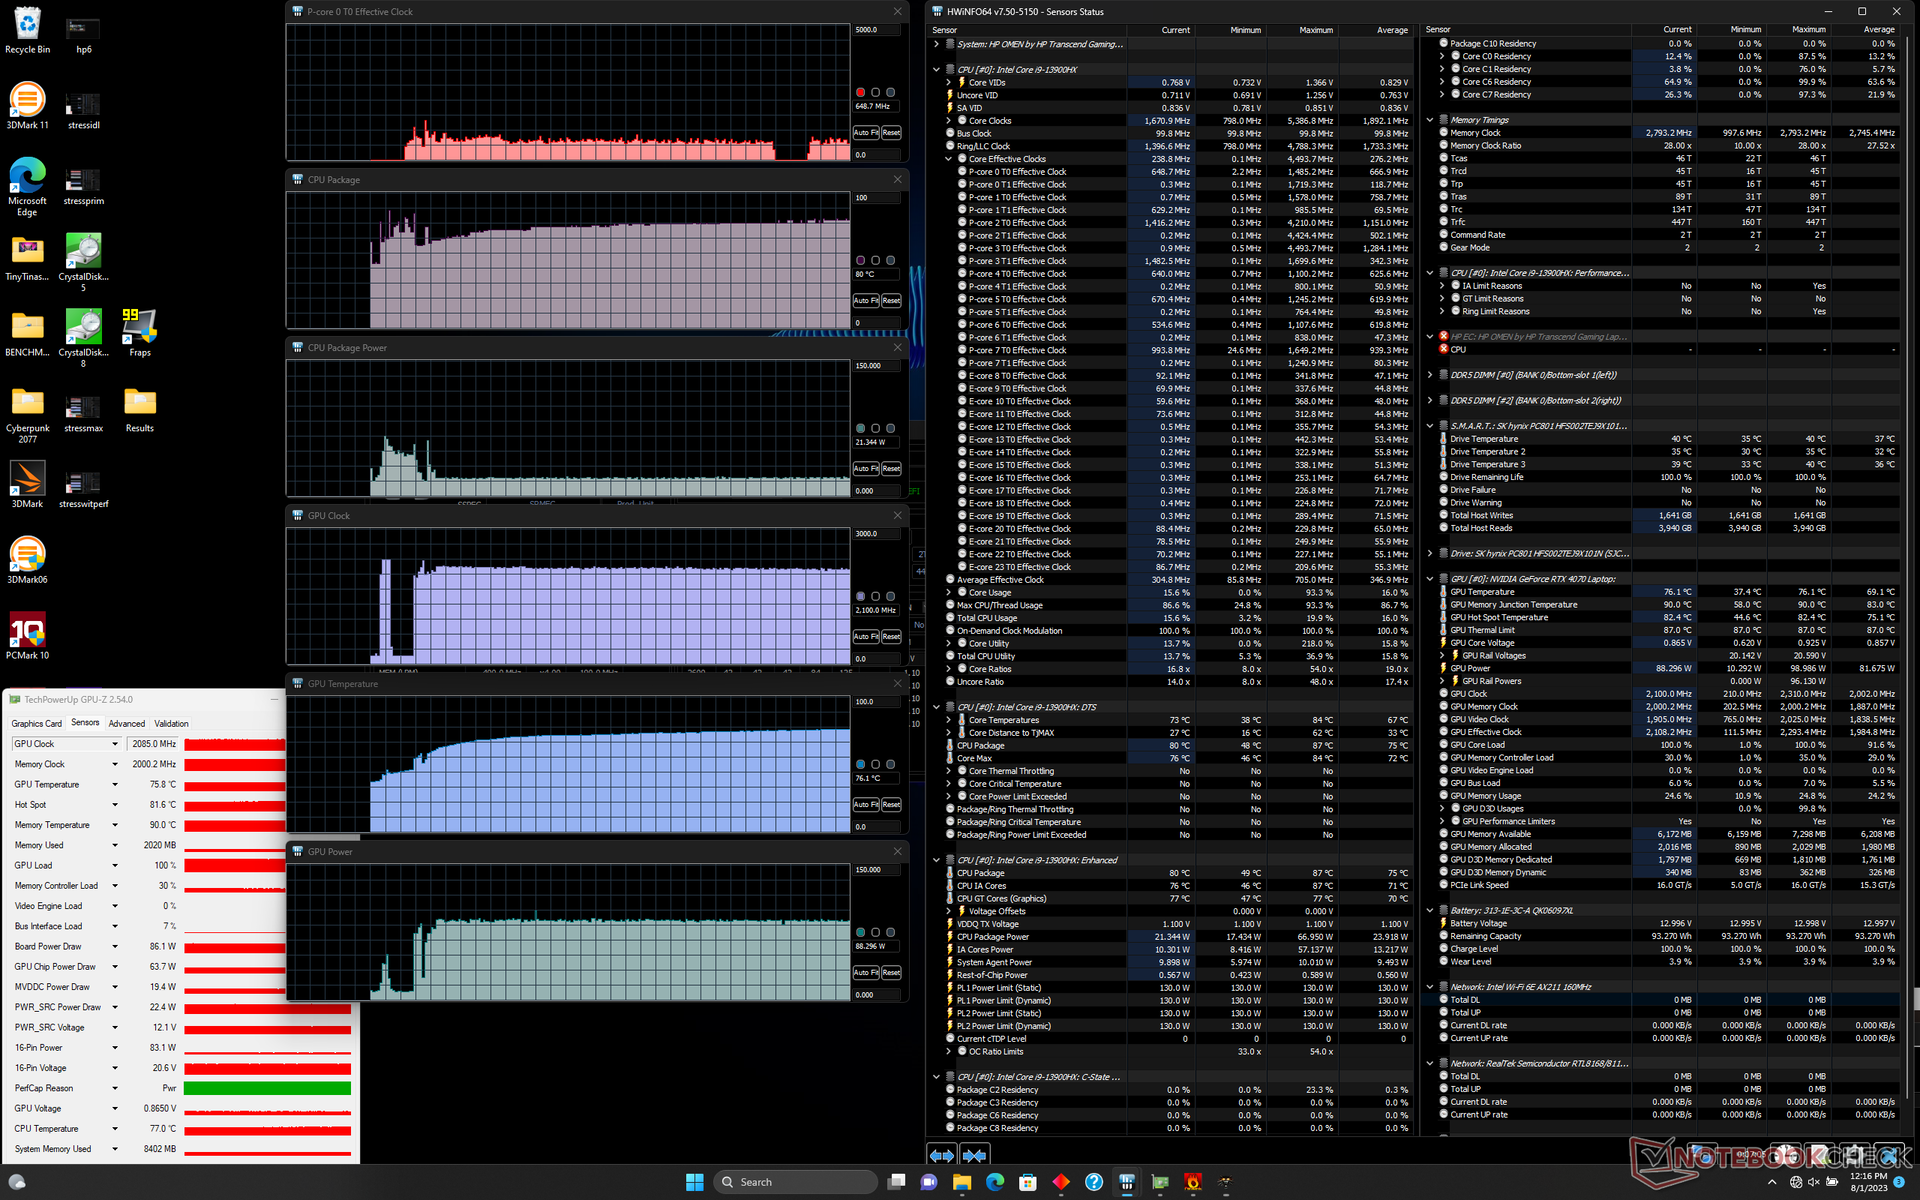
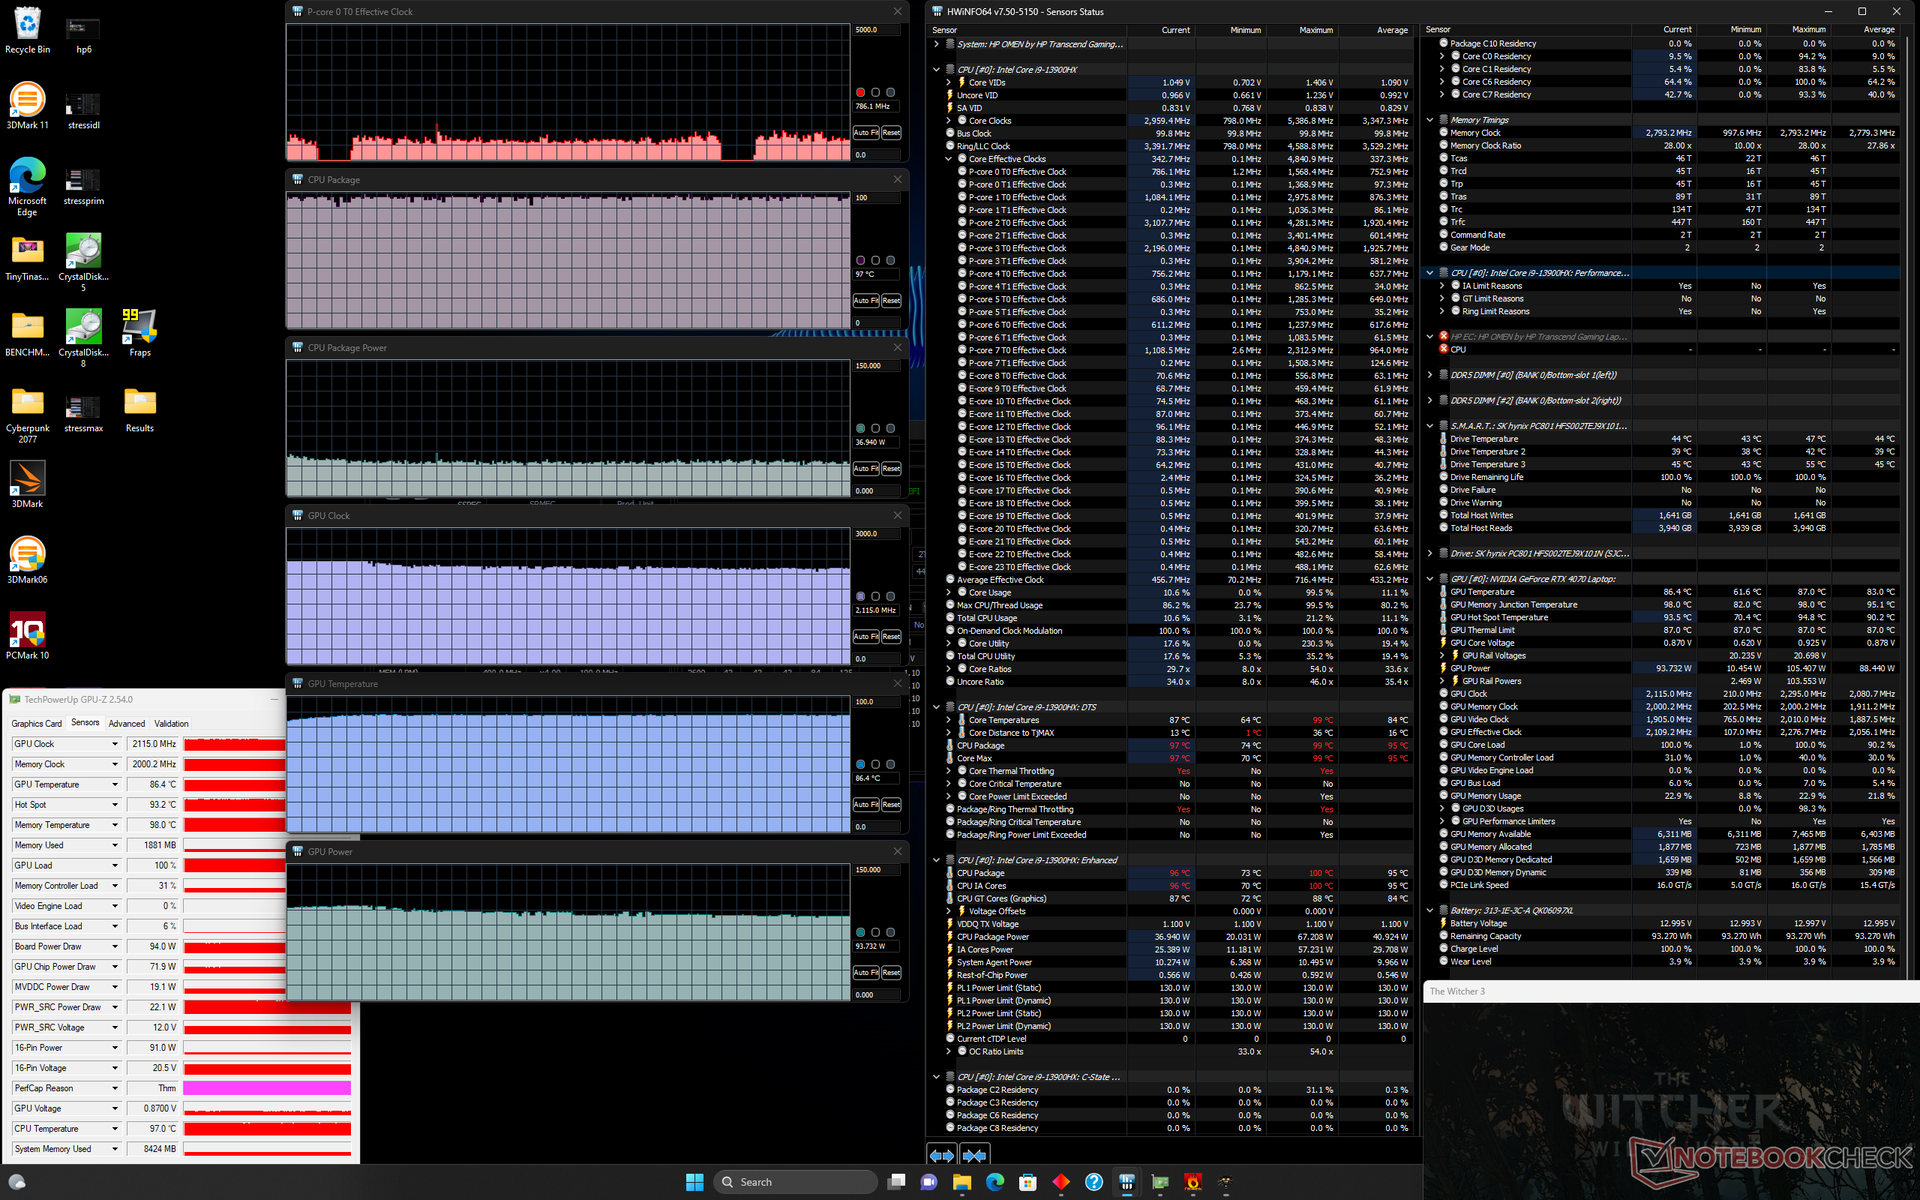
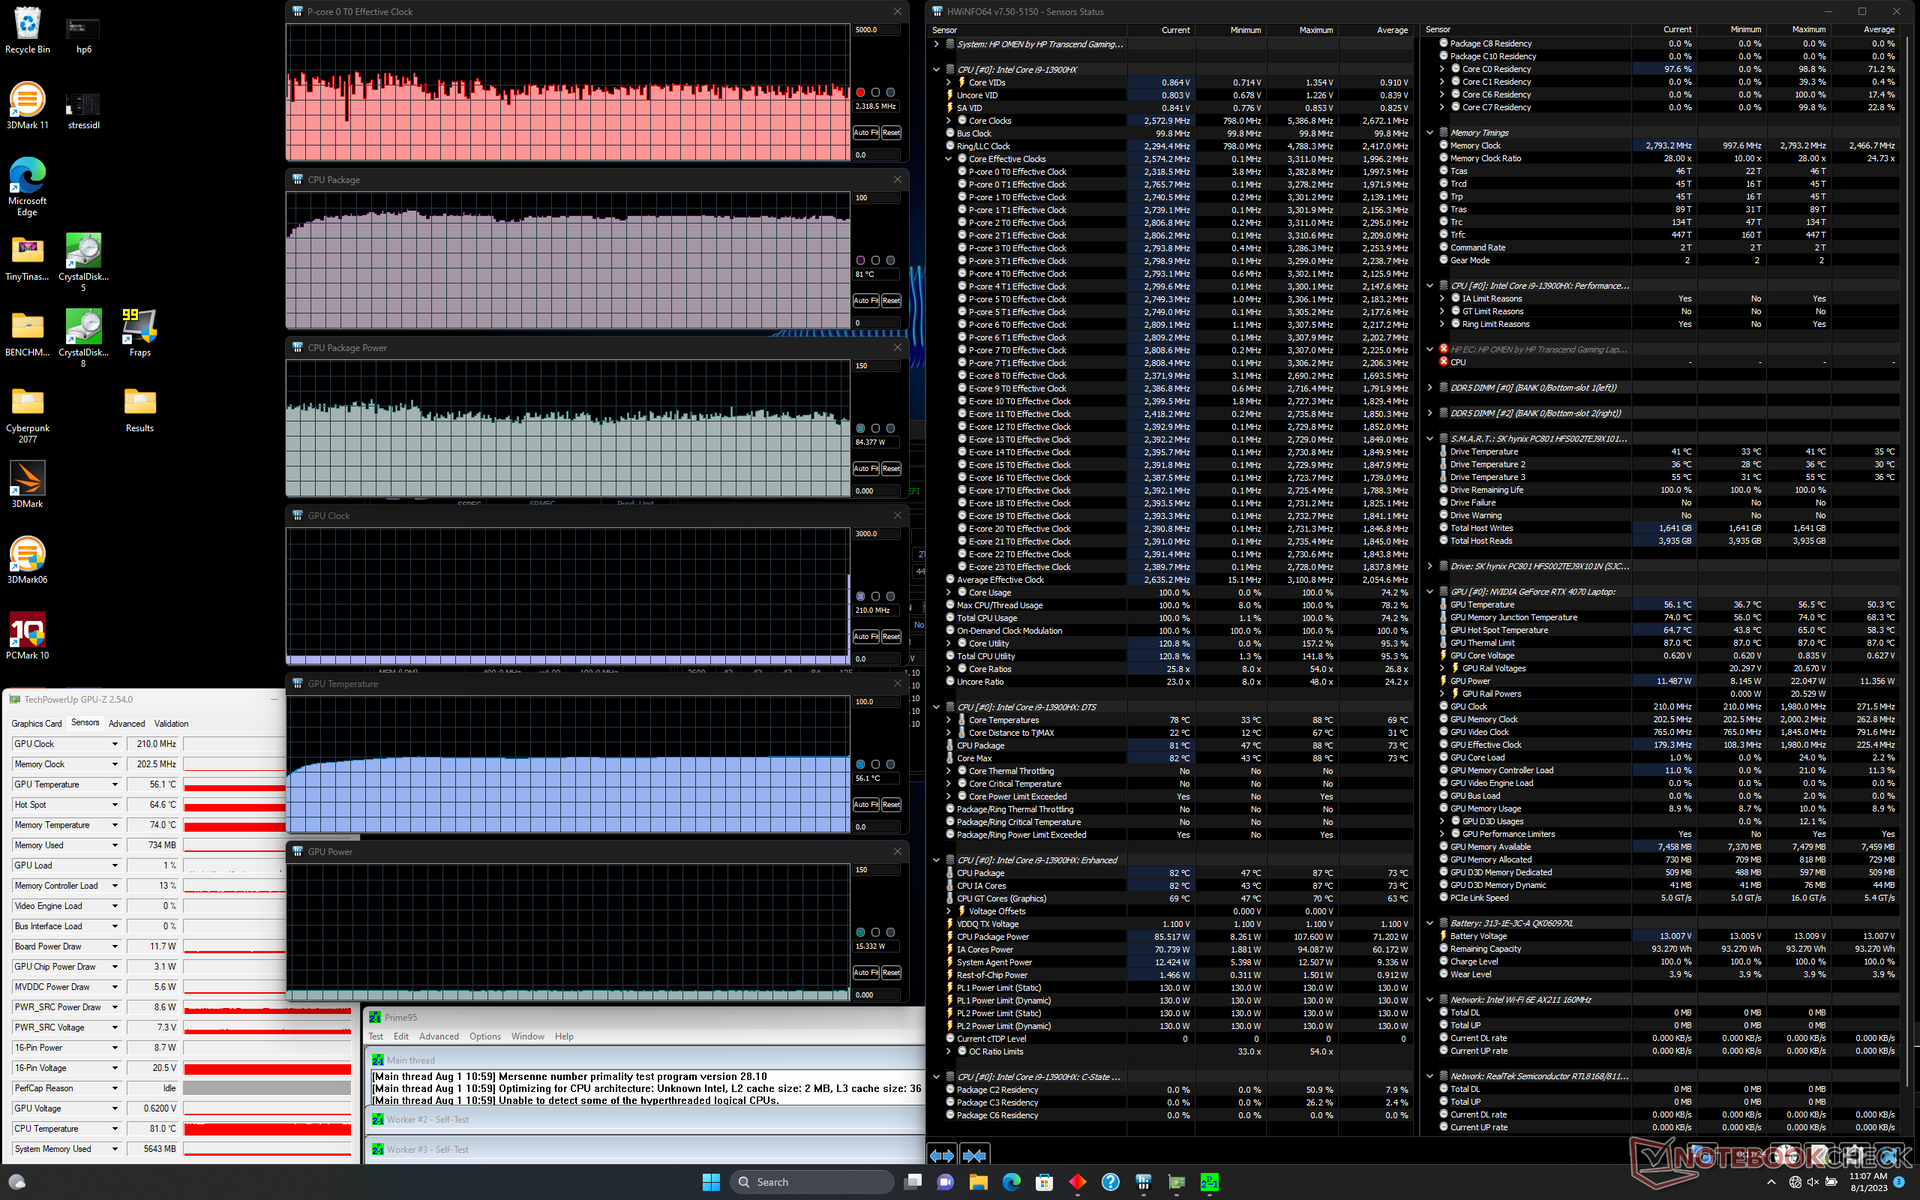
| CPU 时钟 (GHz) | GPU 时钟 (MHz) | CPU 平均温度 (°C) | GPU 平均温度(°C) | |
| 系统闲置 | -- | -- | 48 | 38 |
| Prime95 压力 | ~2.0 - 2.4 | -- | 81 | 56 |
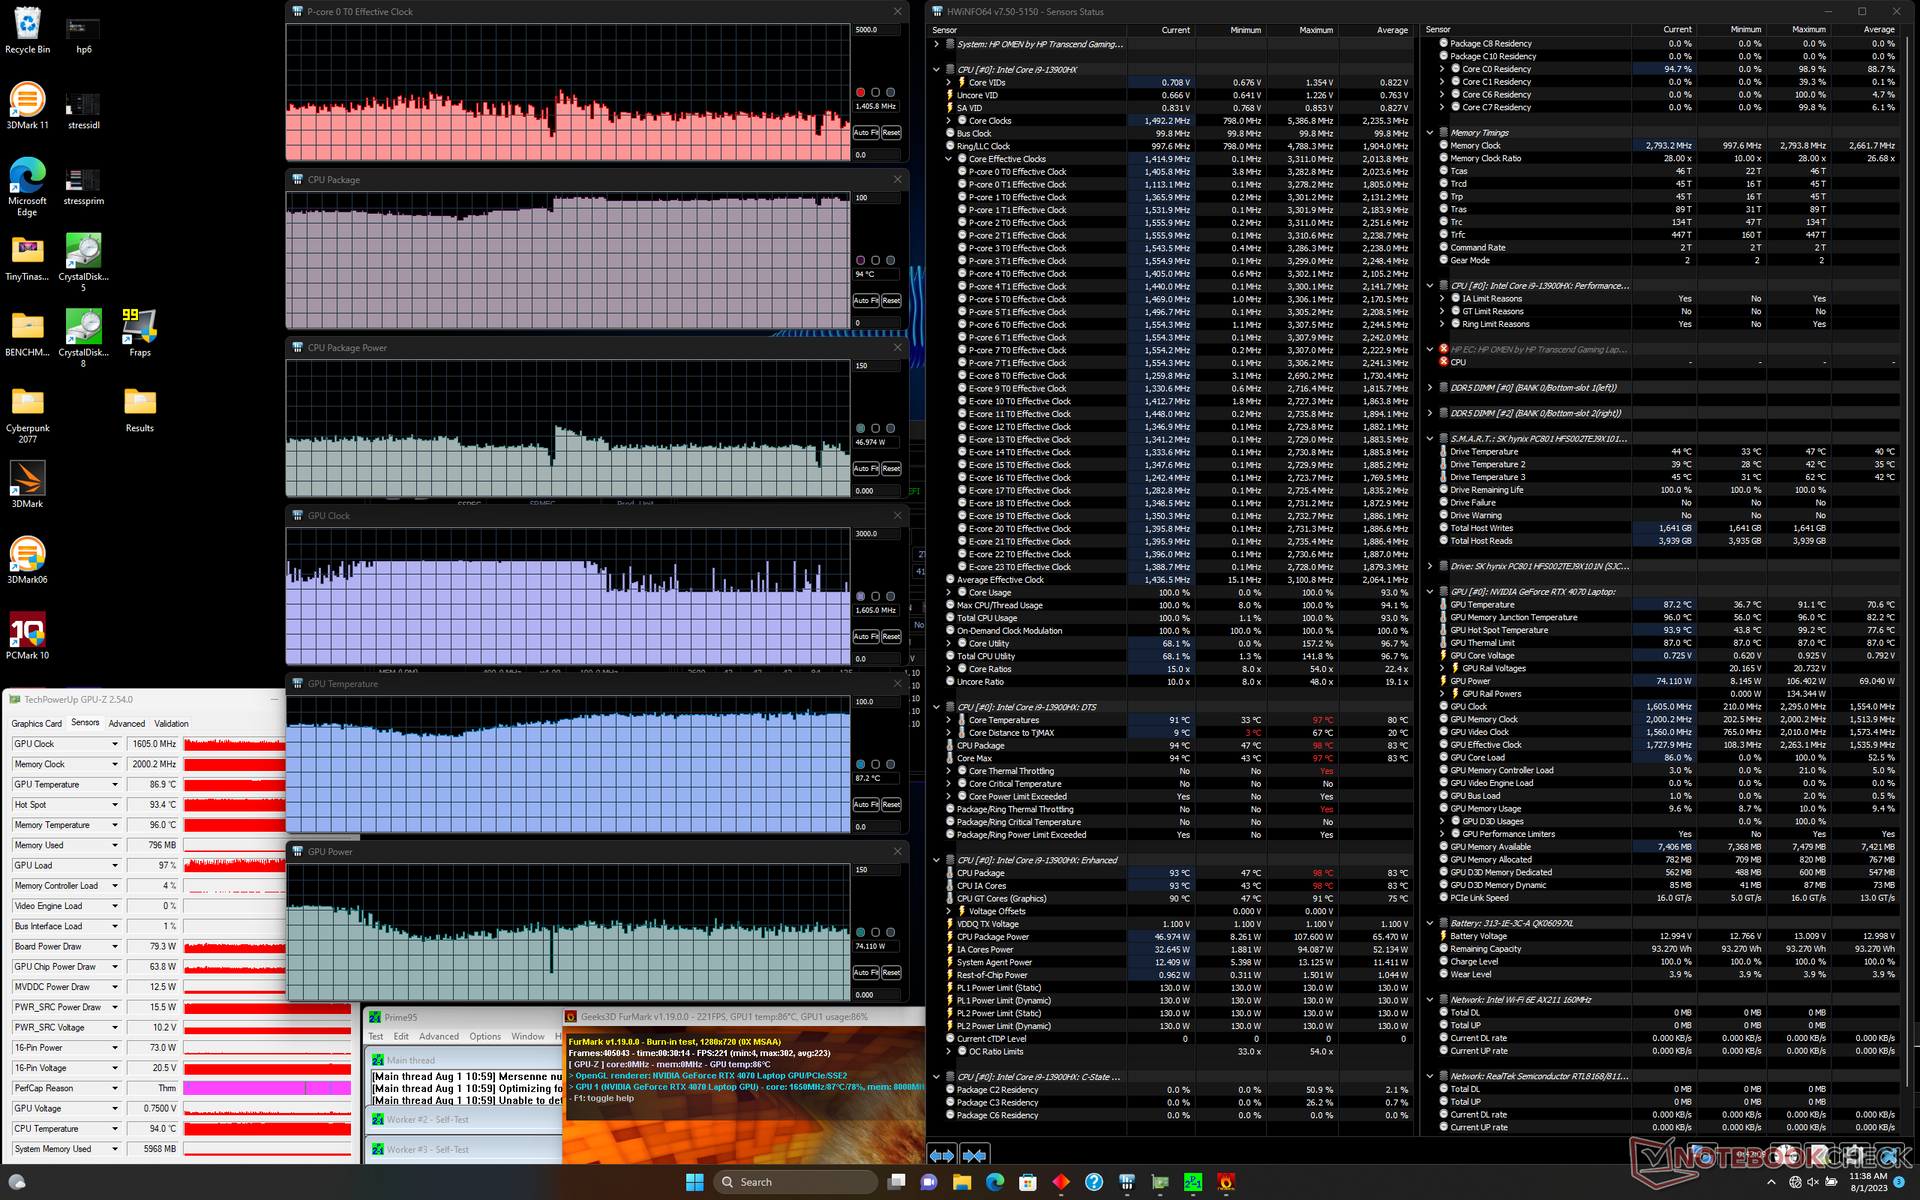
| Prime95 + FurMark 压力 | ~1.5 | 1605 | 94 | 87 |
| Witcher 3 压力(平衡模式) | ~0.7 | 2085 | 80 | 77 |
| Witcher 3 压力(性能模式) | ~0.7 | 2115 | 97 | 87 |
发言人
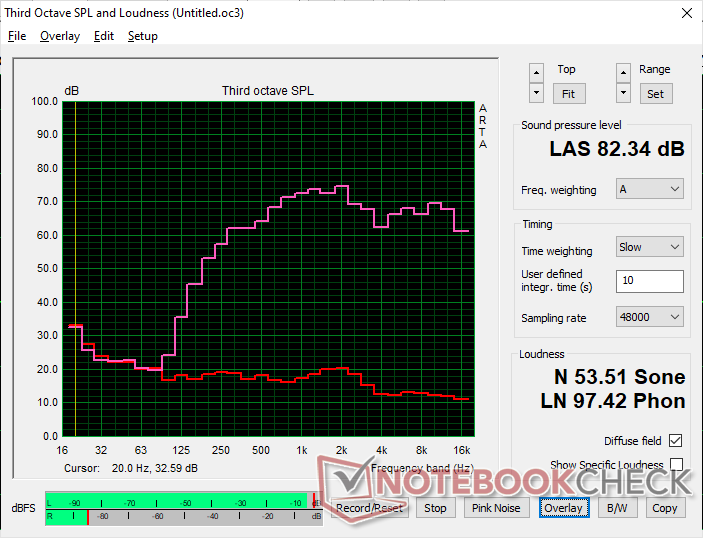
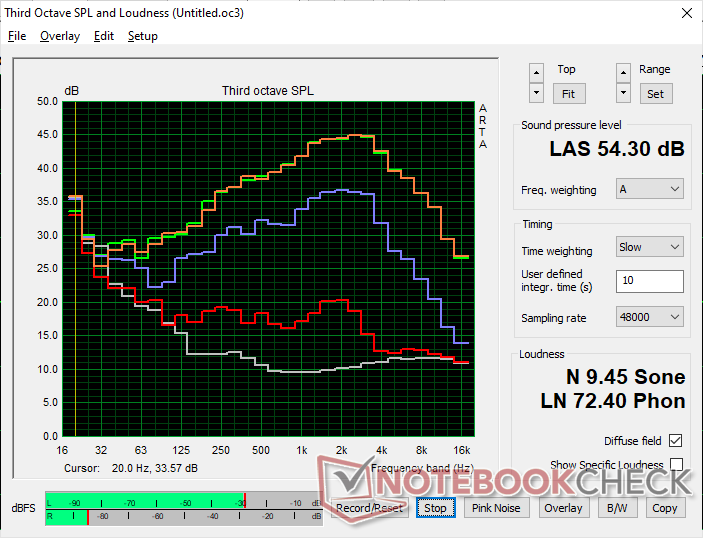
HP Omen Transcend 16 audio analysis
(+) | speakers can play relatively loud (82.3 dB)
Bass 100 - 315 Hz
(-) | nearly no bass - on average 20% lower than median
(±) | linearity of bass is average (14.3% delta to prev. frequency)
Mids 400 - 2000 Hz
(±) | higher mids - on average 5.2% higher than median
(+) | mids are linear (3.7% delta to prev. frequency)
Highs 2 - 16 kHz
(+) | balanced highs - only 2% away from median
(+) | highs are linear (6.7% delta to prev. frequency)
Overall 100 - 16.000 Hz
(±) | linearity of overall sound is average (17% difference to median)
Compared to same class
» 45% of all tested devices in this class were better, 12% similar, 43% worse
» The best had a delta of 6%, average was 18%, worst was 132%
Compared to all devices tested
» 31% of all tested devices were better, 8% similar, 61% worse
» The best had a delta of 4%, average was 23%, worst was 134%
Apple MacBook Pro 16 2021 M1 Pro audio analysis
(+) | speakers can play relatively loud (84.7 dB)
Bass 100 - 315 Hz
(+) | good bass - only 3.8% away from median
(+) | bass is linear (5.2% delta to prev. frequency)
Mids 400 - 2000 Hz
(+) | balanced mids - only 1.3% away from median
(+) | mids are linear (2.1% delta to prev. frequency)
Highs 2 - 16 kHz
(+) | balanced highs - only 1.9% away from median
(+) | highs are linear (2.7% delta to prev. frequency)
Overall 100 - 16.000 Hz
(+) | overall sound is linear (4.6% difference to median)
Compared to same class
» 0% of all tested devices in this class were better, 0% similar, 100% worse
» The best had a delta of 5%, average was 17%, worst was 45%
Compared to all devices tested
» 0% of all tested devices were better, 0% similar, 100% worse
» The best had a delta of 4%, average was 23%, worst was 134%
能源管理
耗电量 - 怠速时数值较高
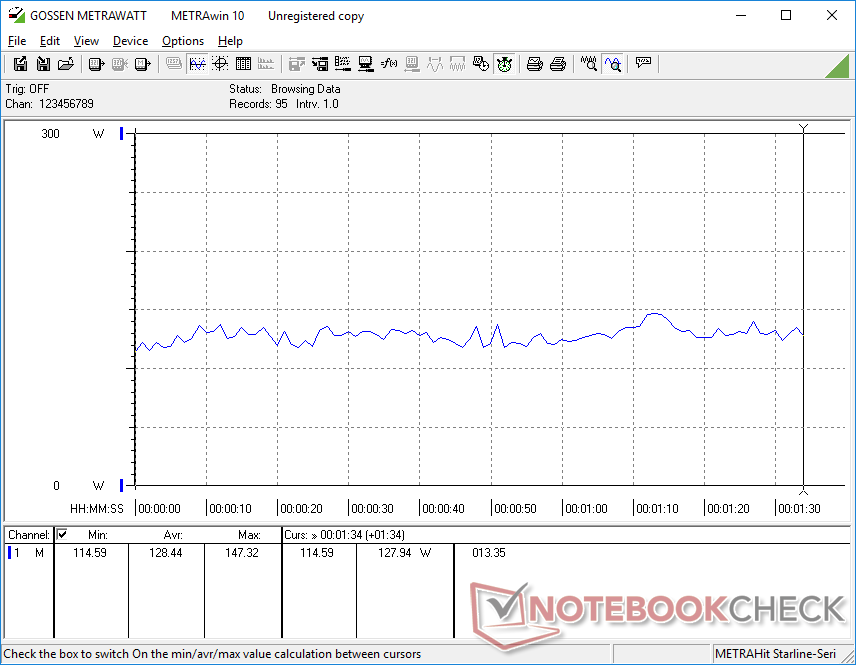
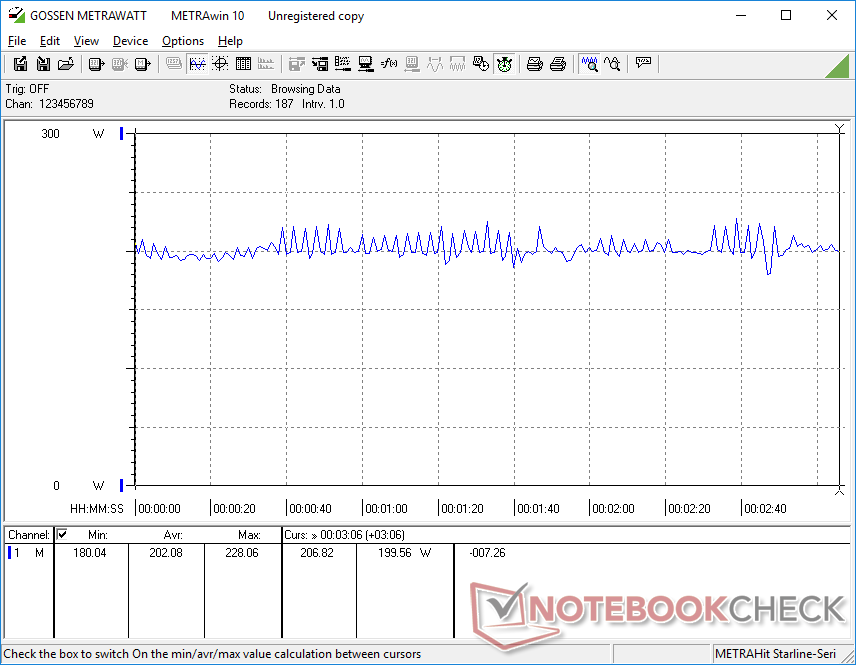
与 Omen 16 相比,我们的 Omen Transcend 16 配备了速度更快的 CPU,但 GPU 速度较慢,因此两者的平均功耗大致相同。如果只对 CPU 或 GPU 施加压力,它们之间的差异会更加明显。例如,我们的 Omen 创见 16 在运行 Prime95 时会多消耗约 15 到 20 瓦的电能,而在运行 FurMark 时则会少消耗约 15 瓦的电能。
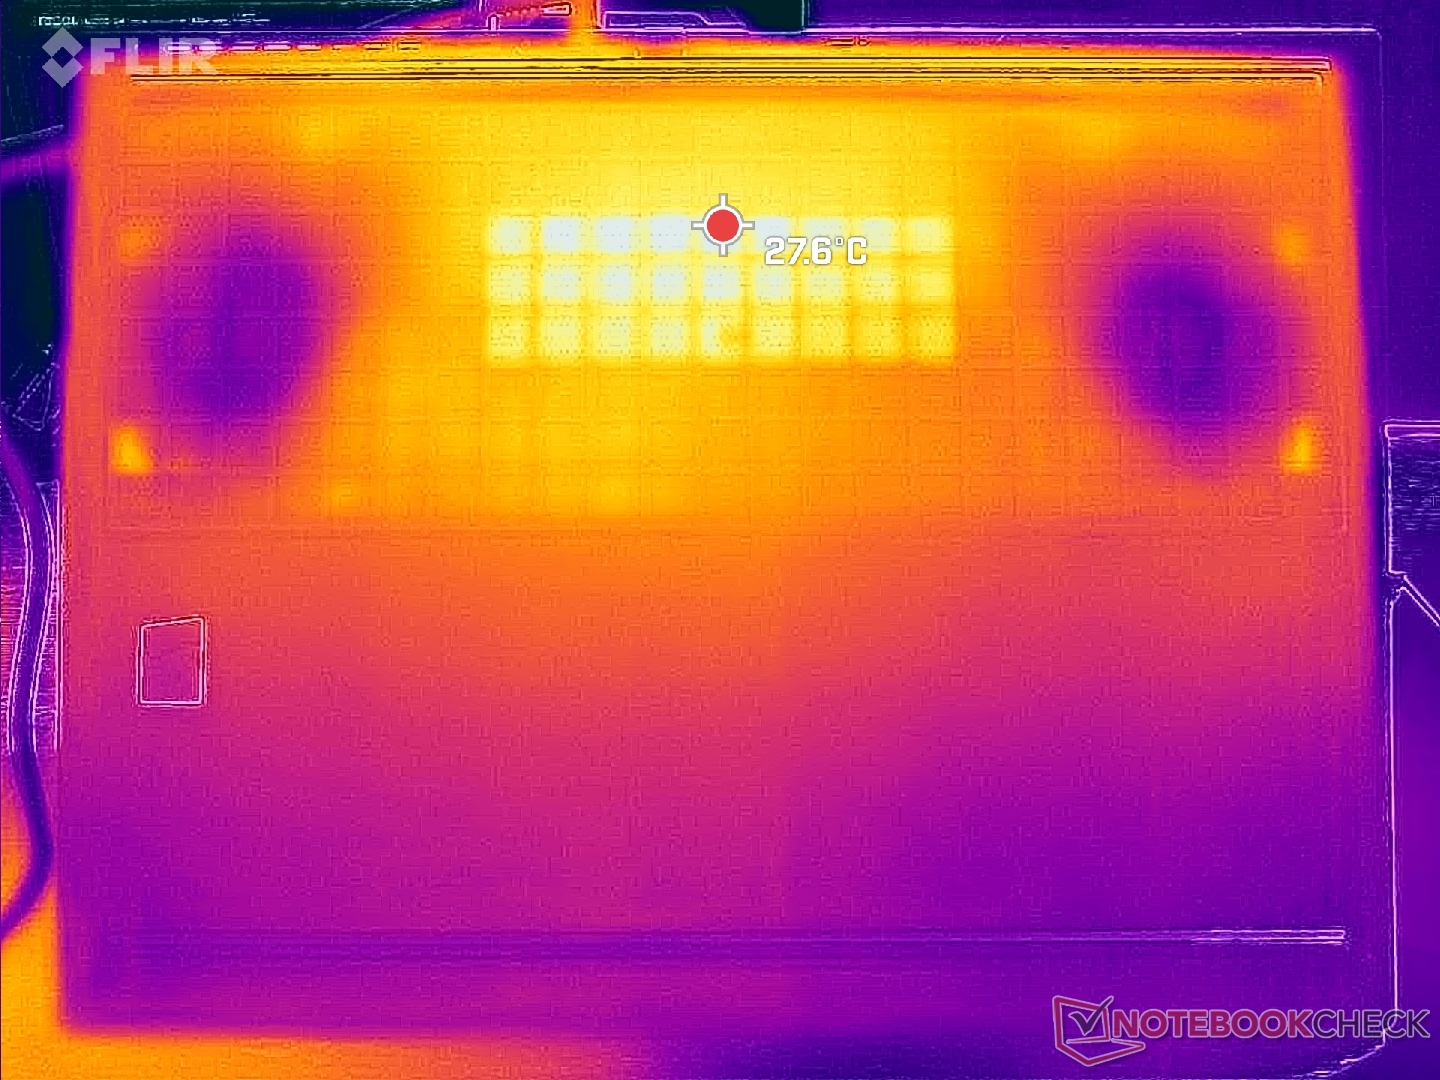
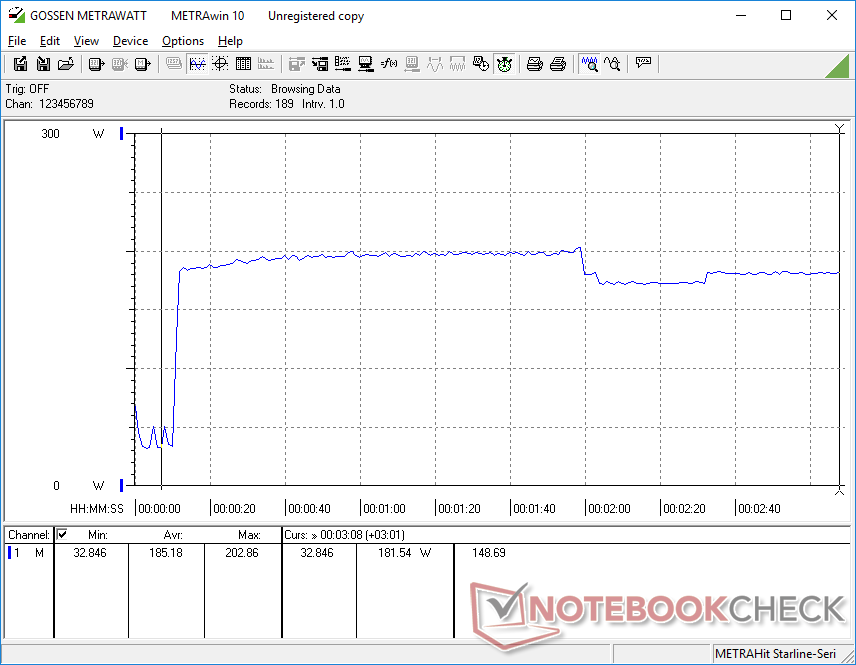
在 "性能 "配置文件下,台式机的空转功耗可高达 55 W。众所周知,Mini-LED 一般比标准 IPS 要求更高。
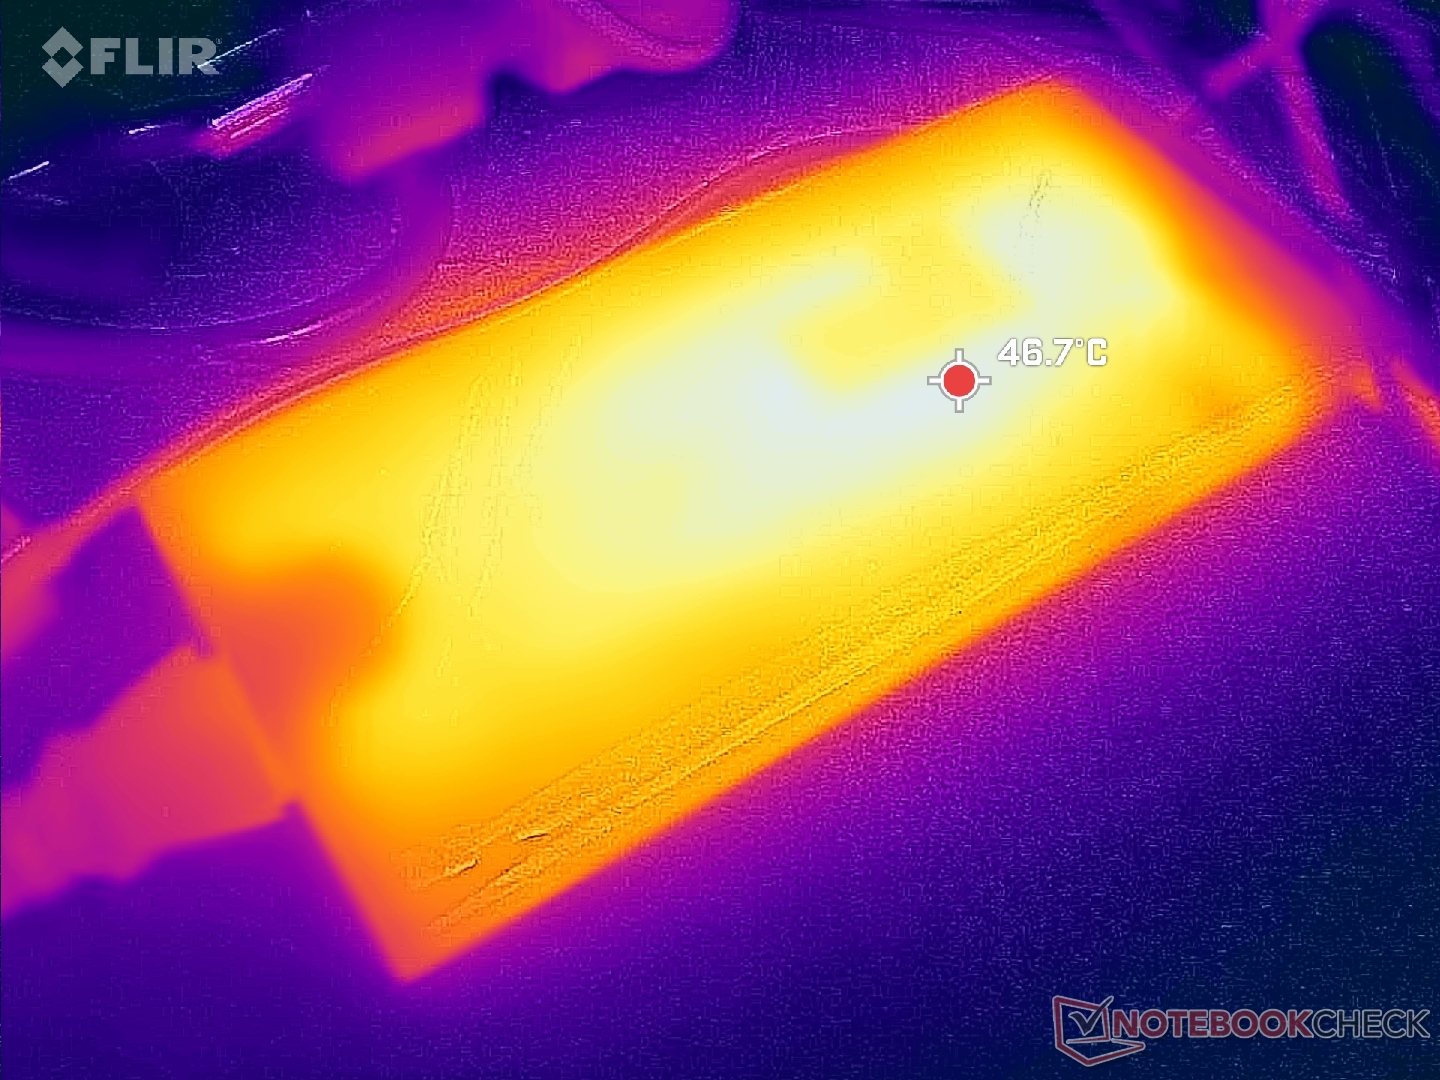
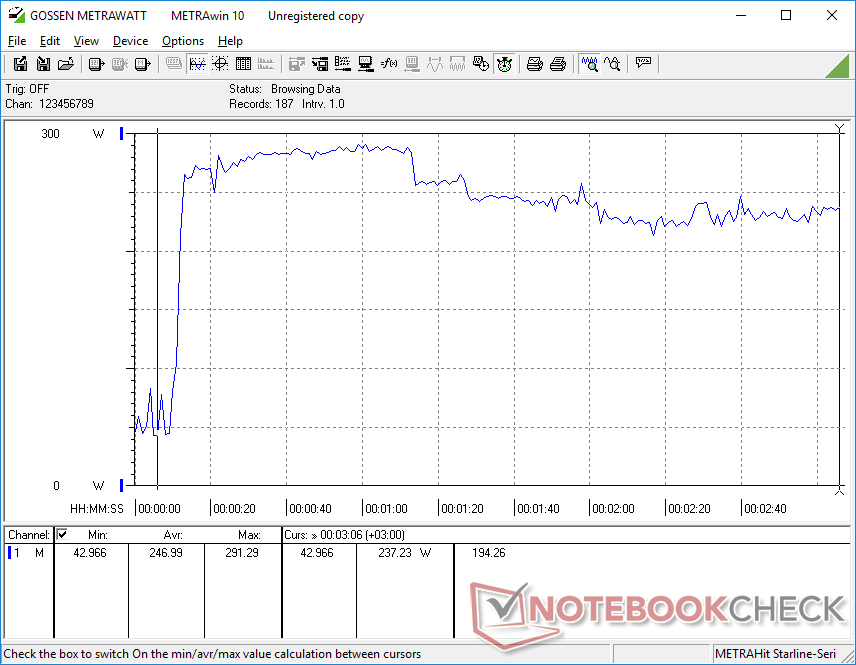
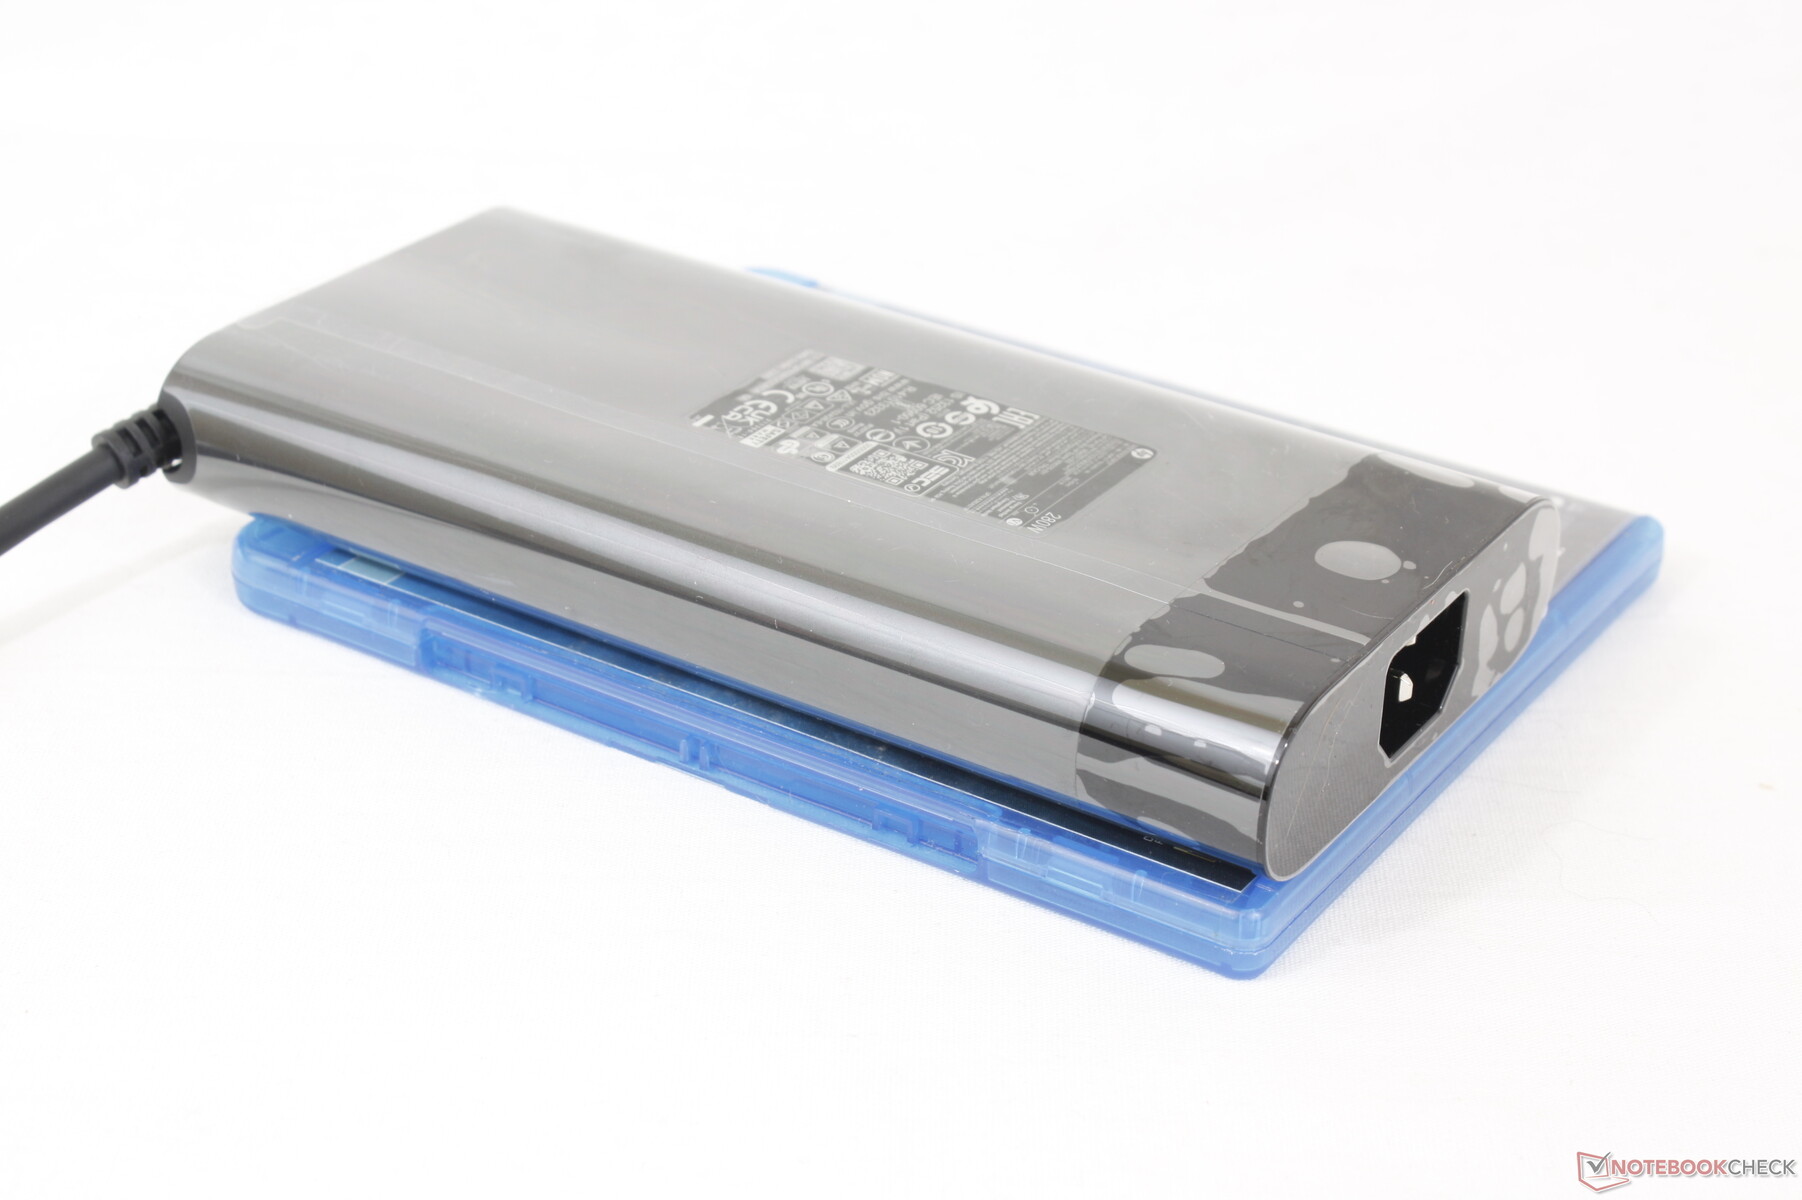
当 CPU 和 GPU 的使用率均为 100% 时,我们可以记录到中型(约 18 x 8.7 x 2.6 厘米)280 W AC 适配器的最大功耗为 292 W。大约一分钟后,耗电量将稳定在 240 W 范围内。
| Off / Standby | |
| Idle | |
| Load |
|
Key:
min: | |
| HP Omen Transcend 16 i9-13900HX, GeForce RTX 4070 Laptop GPU, SK hynix PC801 HFS002TEJ9X101N, Mini-LED, 2560x1600, 16" | Lenovo Legion Slim 7i 16 Gen 8 i9-13900H, GeForce RTX 4070 Laptop GPU, Samsung PM9A1 MZVL21T0HCLR, IPS, 2560x1600, 16" | HP Omen 16-wf000 i7-13700HX, GeForce RTX 4080 Laptop GPU, SK hynix PC801 HFS002TEJ9X101N, IPS, 2560x1440, 16.1" | Alienware x16 R1 i9-13900HK, GeForce RTX 4080 Laptop GPU, SK hynix PC801 HFS001TEJ9X101N, IPS, 2560x1600, 16" | Acer Nitro 16 AN16-41 R7 7735HS, GeForce RTX 4070 Laptop GPU, Samsung PM9A1 MZVL21T0HCLR, IPS, 2560x1600, 16" | Asus ROG Zephyrus M16 GU603Z i9-12900H, GeForce RTX 3070 Ti Laptop GPU, Micron 3400 1TB MTFDKBA1T0TFH, IPS, 2560x1600, 16" | |
|---|---|---|---|---|---|---|
| Power Consumption | 9% | 3% | -12% | 29% | 34% | |
| Idle Minimum * (Watt) | 19.2 | 22 -15% | 21.8 -14% | 25.2 -31% | 11.6 40% | 10.8 44% |
| Idle Average * (Watt) | 22.7 | 29 -28% | 26 -15% | 29.9 -32% | 15.6 31% | 17 25% |
| Idle Maximum * (Watt) | 55.4 | 39.5 29% | 36 35% | 49.8 10% | 16.5 70% | 17.8 68% |
| Load Average * (Watt) | 128.4 | 98.7 23% | 115.5 10% | 105.4 18% | 155 -21% | 116 10% |
| Witcher 3 ultra * (Watt) | 206 | 171.8 17% | 214 -4% | 263 -28% | 154.8 25% | 144 30% |
| Load Maximum * (Watt) | 292 | 213.2 27% | 269.7 8% | 313.8 -7% | 205 30% | 220 25% |
* ... smaller is better
Power Consumption Witcher 3 / Stresstest
Power Consumption external Monitor
电池寿命
电池容量从 Omen 16 的 83 Wh 增加到 Omen Transcend 16 的 97 Wh。尽管如此,由于采用了要求更高的微型 LED 面板,电池续航时间仍然较短。在使用 iGPU 的情况下,我们在平衡电源模式下的 WLAN 实际浏览时间仅为 4 个多小时,而 Omen 16 在类似设置下的实际浏览时间接近 5 个小时。
使用随附的交流适配器从空闲状态充至满电需要约 90 分钟。系统也可通过 USB-C 接口充电,但容量较低的适配器可能无法使用。例如,我们的 65 W USB-C 交流适配器会产生兼容性错误信息,而我们的 135 W USB-C 适配器则可以顺利充电。
| HP Omen Transcend 16 i9-13900HX, GeForce RTX 4070 Laptop GPU, 97 Wh | Lenovo Legion Slim 7i 16 Gen 8 i9-13900H, GeForce RTX 4070 Laptop GPU, 99.9 Wh | HP Omen 16-wf000 i7-13700HX, GeForce RTX 4080 Laptop GPU, 83 Wh | Alienware x16 R1 i9-13900HK, GeForce RTX 4080 Laptop GPU, 90 Wh | Acer Nitro 16 AN16-41 R7 7735HS, GeForce RTX 4070 Laptop GPU, 90 Wh | Asus ROG Zephyrus M16 GU603Z i9-12900H, GeForce RTX 3070 Ti Laptop GPU, 90 Wh | |
|---|---|---|---|---|---|---|
| Battery runtime | -13% | 0% | -22% | 86% | 47% | |
| Reader / Idle (h) | 6.3 | 5.1 -19% | 5.5 -13% | 7.3 16% | 12.2 94% | |
| WiFi v1.3 (h) | 4.2 | 4.4 5% | 5.1 21% | 2.5 -40% | 9 114% | 7.4 76% |
| Load (h) | 1.2 | 0.9 -25% | 1.1 -8% | 0.7 -42% | 1.8 50% | 1.4 17% |
| H.264 (h) | 10.2 | 7.3 |
Pros
Cons
评价--出色的设计和独特的迷你 LED 显示屏,但GeForce RTX 4080 在哪里?
与标准版 Omen 16 相比,Omen Transcend 16 进行了多项升级,包括红外传感器、16:10 宽高比、更大容量的电池和迷你 LED 显示器选项。后者可能是最独特的,因为该机型是首批配备 QHD+ 240 Hz mini-LED 显示屏的机型之一,其观看体验不同于大多数仍在使用 IPS 和 OLED 的游戏笔记本电脑。重视亮度和 HDR1000 功能的用户会特别欣赏迷你 LED 显示屏的优势。
Omen Transcend 16 采用更快的 CPU 和更轻薄的机身,从而放弃了更高的 GPU 选项。同时,它的 Mini-LED 显示屏亮度极高,可呈现任何游戏笔记本电脑上最鲜艳的 HDR 内容。
最新机型并不一定比普通的 Omen 16 更好,因为它省略了一些重要功能。首先,Omen Transcend 16 只支持一个内部固态硬盘,而 Omen 16 可以支持两个。其次,或许也是最重要的一点,Omen Transcend 16 最大支持 130 WGeForce RTX 4070 GPU,而 Omen 16 最高可配置 145 WGeForce RTX 4080。对 GPU 的限制可能是由于 Omen Transcend 16 采用了更薄的机身和更高的酷睿 i9-13900HX CPU。因此,喜欢更快 GPU 性能的用户可能会考虑 普通 Omen 16而喜欢更快 CPU 性能的用户则可以考虑 Omen Transcend 16。
HP Omen Transcend 16
- 08/04/2023 v7 (old)
Allen Ngo
Transparency
The selection of devices to be reviewed is made by our editorial team. The test sample was provided to the author as a loan by the manufacturer or retailer for the purpose of this review. The lender had no influence on this review, nor did the manufacturer receive a copy of this review before publication. There was no obligation to publish this review. As an independent media company, Notebookcheck is not subjected to the authority of manufacturers, retailers or publishers.
This is how Notebookcheck is testing
Every year, Notebookcheck independently reviews hundreds of laptops and smartphones using standardized procedures to ensure that all results are comparable. We have continuously developed our test methods for around 20 years and set industry standards in the process. In our test labs, high-quality measuring equipment is utilized by experienced technicians and editors. These tests involve a multi-stage validation process. Our complex rating system is based on hundreds of well-founded measurements and benchmarks, which maintains objectivity. Further information on our test methods can be found here.
Price comparison

