联想Legion Pro 5 16IRX9 笔记本电脑评测:性能卓越,但略显笨重

不要与视觉效果不同的 Legion 5 16IRX9Legion Pro 5 16IRX9 直接继承了去年的 Legion Pro 5 16 IRX8.它将 2023 Raptor Lake-HX CPU 换成了 2024 Raptor Lake-HX 更新阵容,同时引入了轻微的视觉变化和新的第三显示屏选项。
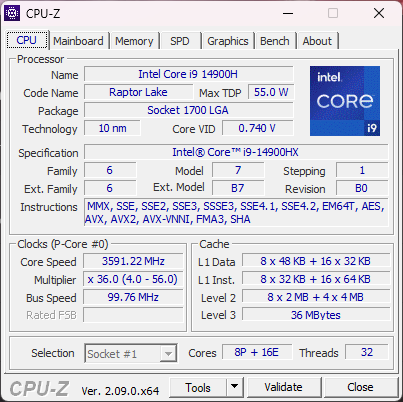
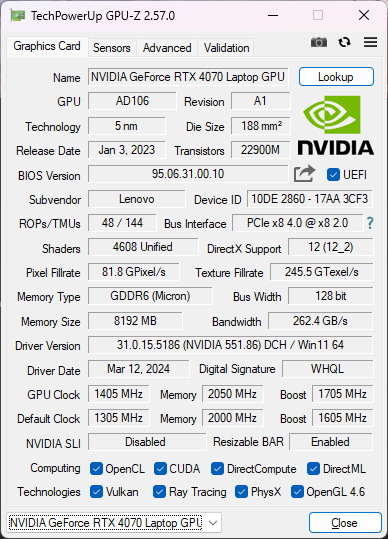
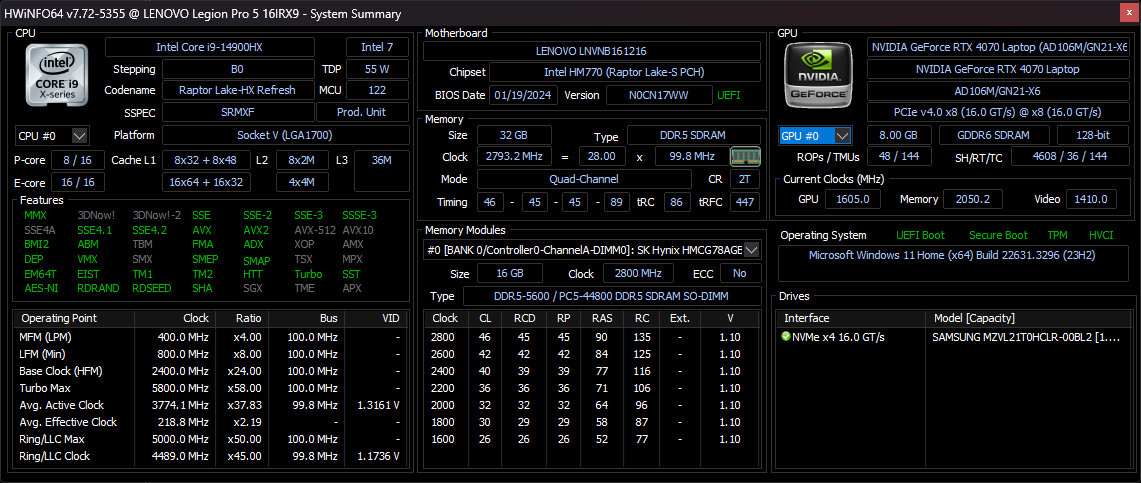
我们这次评测的是一款高端配置,配备酷睿 i9-14900HX CPU、140 WGeForce RTX 4070 GPU 和 1600p 165 Hz IPS sRGB 显示屏,零售价约为 1900 美元至 2100 美元。其他 SKU 起始配置为酷睿 i5-14500HX 和 RTX 4050,采用全 DCI-P3 色彩,但原生 1600p 分辨率都是一样的。
Legion Pro 5 16 IRX9 的替代产品包括其他中高档 16 英寸游戏笔记本电脑,如 HP Omen Transcend 16,华硕 ROG Zephyrus G16或 微星隐形 16.
更多联想评论:
潜在的竞争对手比较
Rating | Date | Model | Weight | Height | Size | Resolution | Price |
|---|---|---|---|---|---|---|---|
| 89.3 % v7 (old) | 04 / 2024 | Lenovo Legion Pro 5 16IRX9 i9-14900HX, GeForce RTX 4070 Laptop GPU | 2.5 kg | 26.95 mm | 16.00" | 2560x1600 | |
| 87.9 % v7 (old) | 05 / 2023 | Lenovo Legion Pro 5 16IRX8 i7-13700HX, GeForce RTX 4060 Laptop GPU | 2.5 kg | 26.8 mm | 16.00" | 2560x1600 | |
| 90.2 % v7 (old) | 03 / 2024 | Alienware m16 R2 Ultra 7 155H, GeForce RTX 4070 Laptop GPU | 2.5 kg | 23.5 mm | 16.00" | 2560x1600 | |
| 88.4 % v7 (old) | 02 / 2024 | HP Omen Transcend 16-u1095ng i9-14900HX, GeForce RTX 4070 Laptop GPU | 2.3 kg | 20 mm | 16.00" | 2560x1600 | |
| 92.3 % v7 (old) | 02 / 2024 | Asus ROG Zephyrus G16 2024 GU605M Ultra 7 155H, GeForce RTX 4070 Laptop GPU | 1.8 kg | 16.4 mm | 16.00" | 2560x1600 | |
| 89.1 % v7 (old) | 11 / 2023 | MSI Stealth 16 Mercedes-AMG Motorsport A13VG i9-13900H, GeForce RTX 4070 Laptop GPU | 1.9 kg | 20 mm | 16.00" | 3840x2400 |
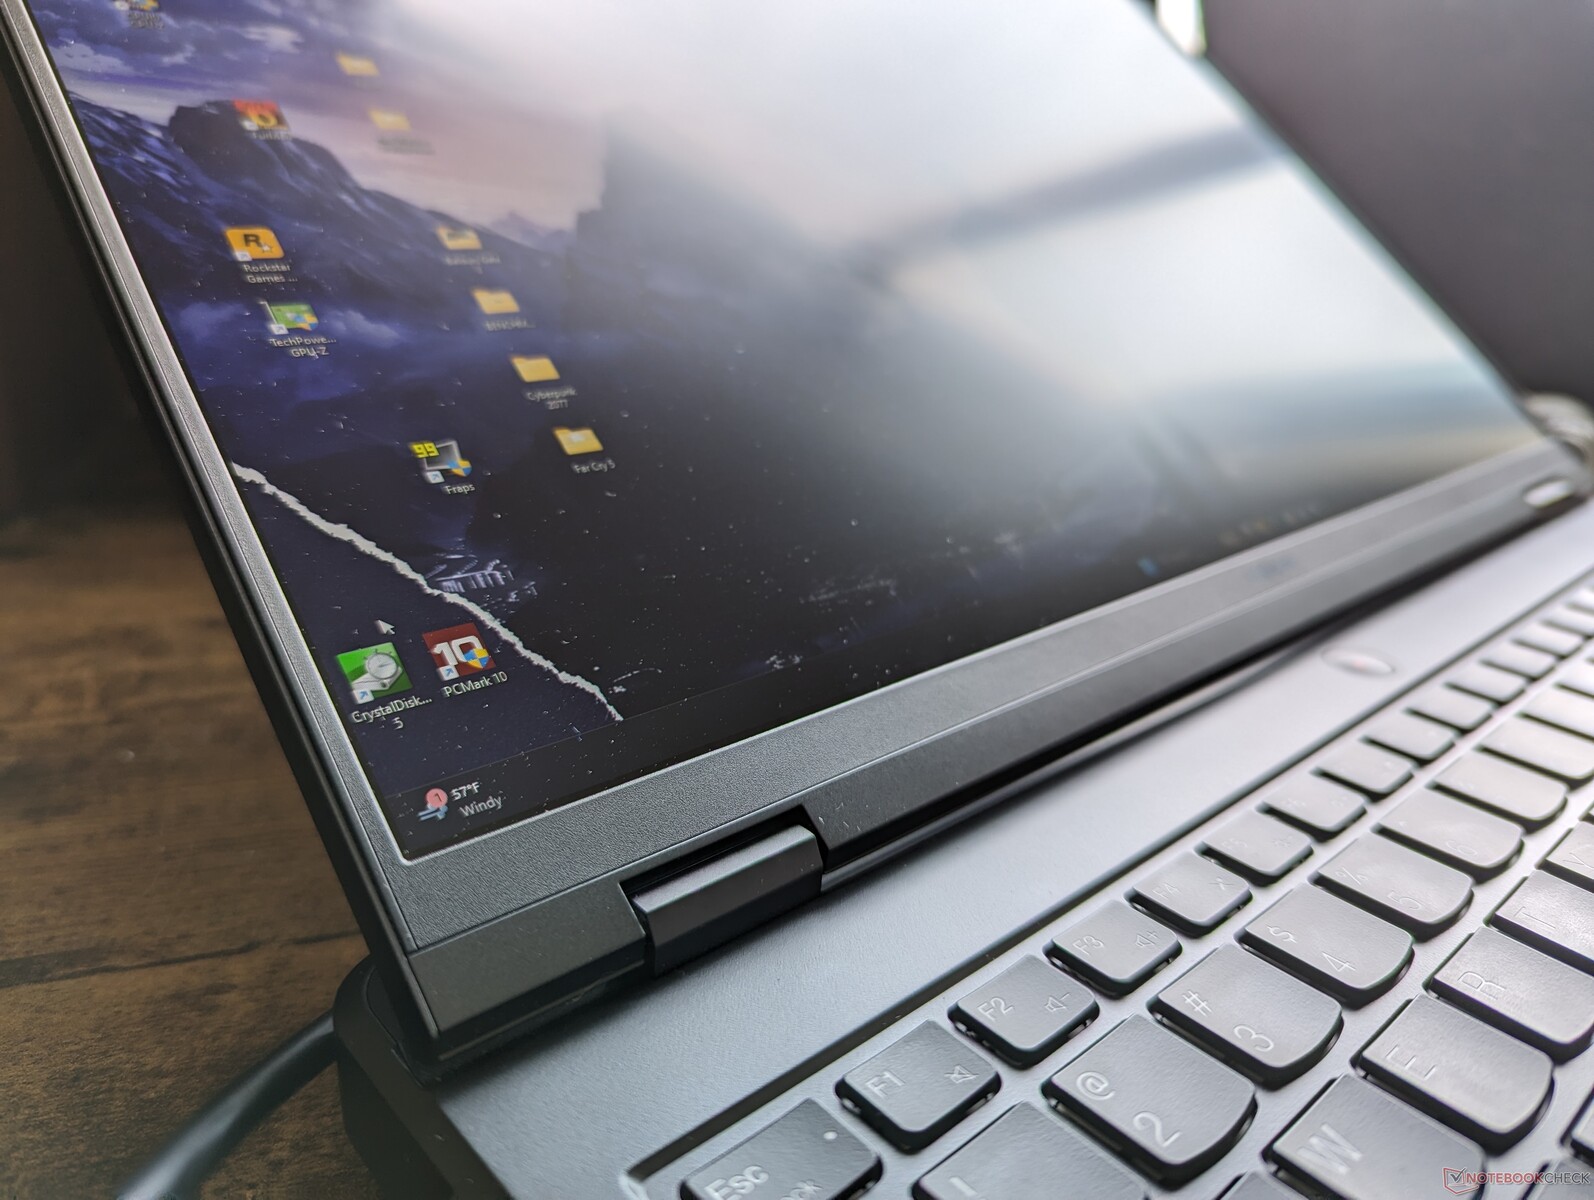
案例 - 细微的外部变化
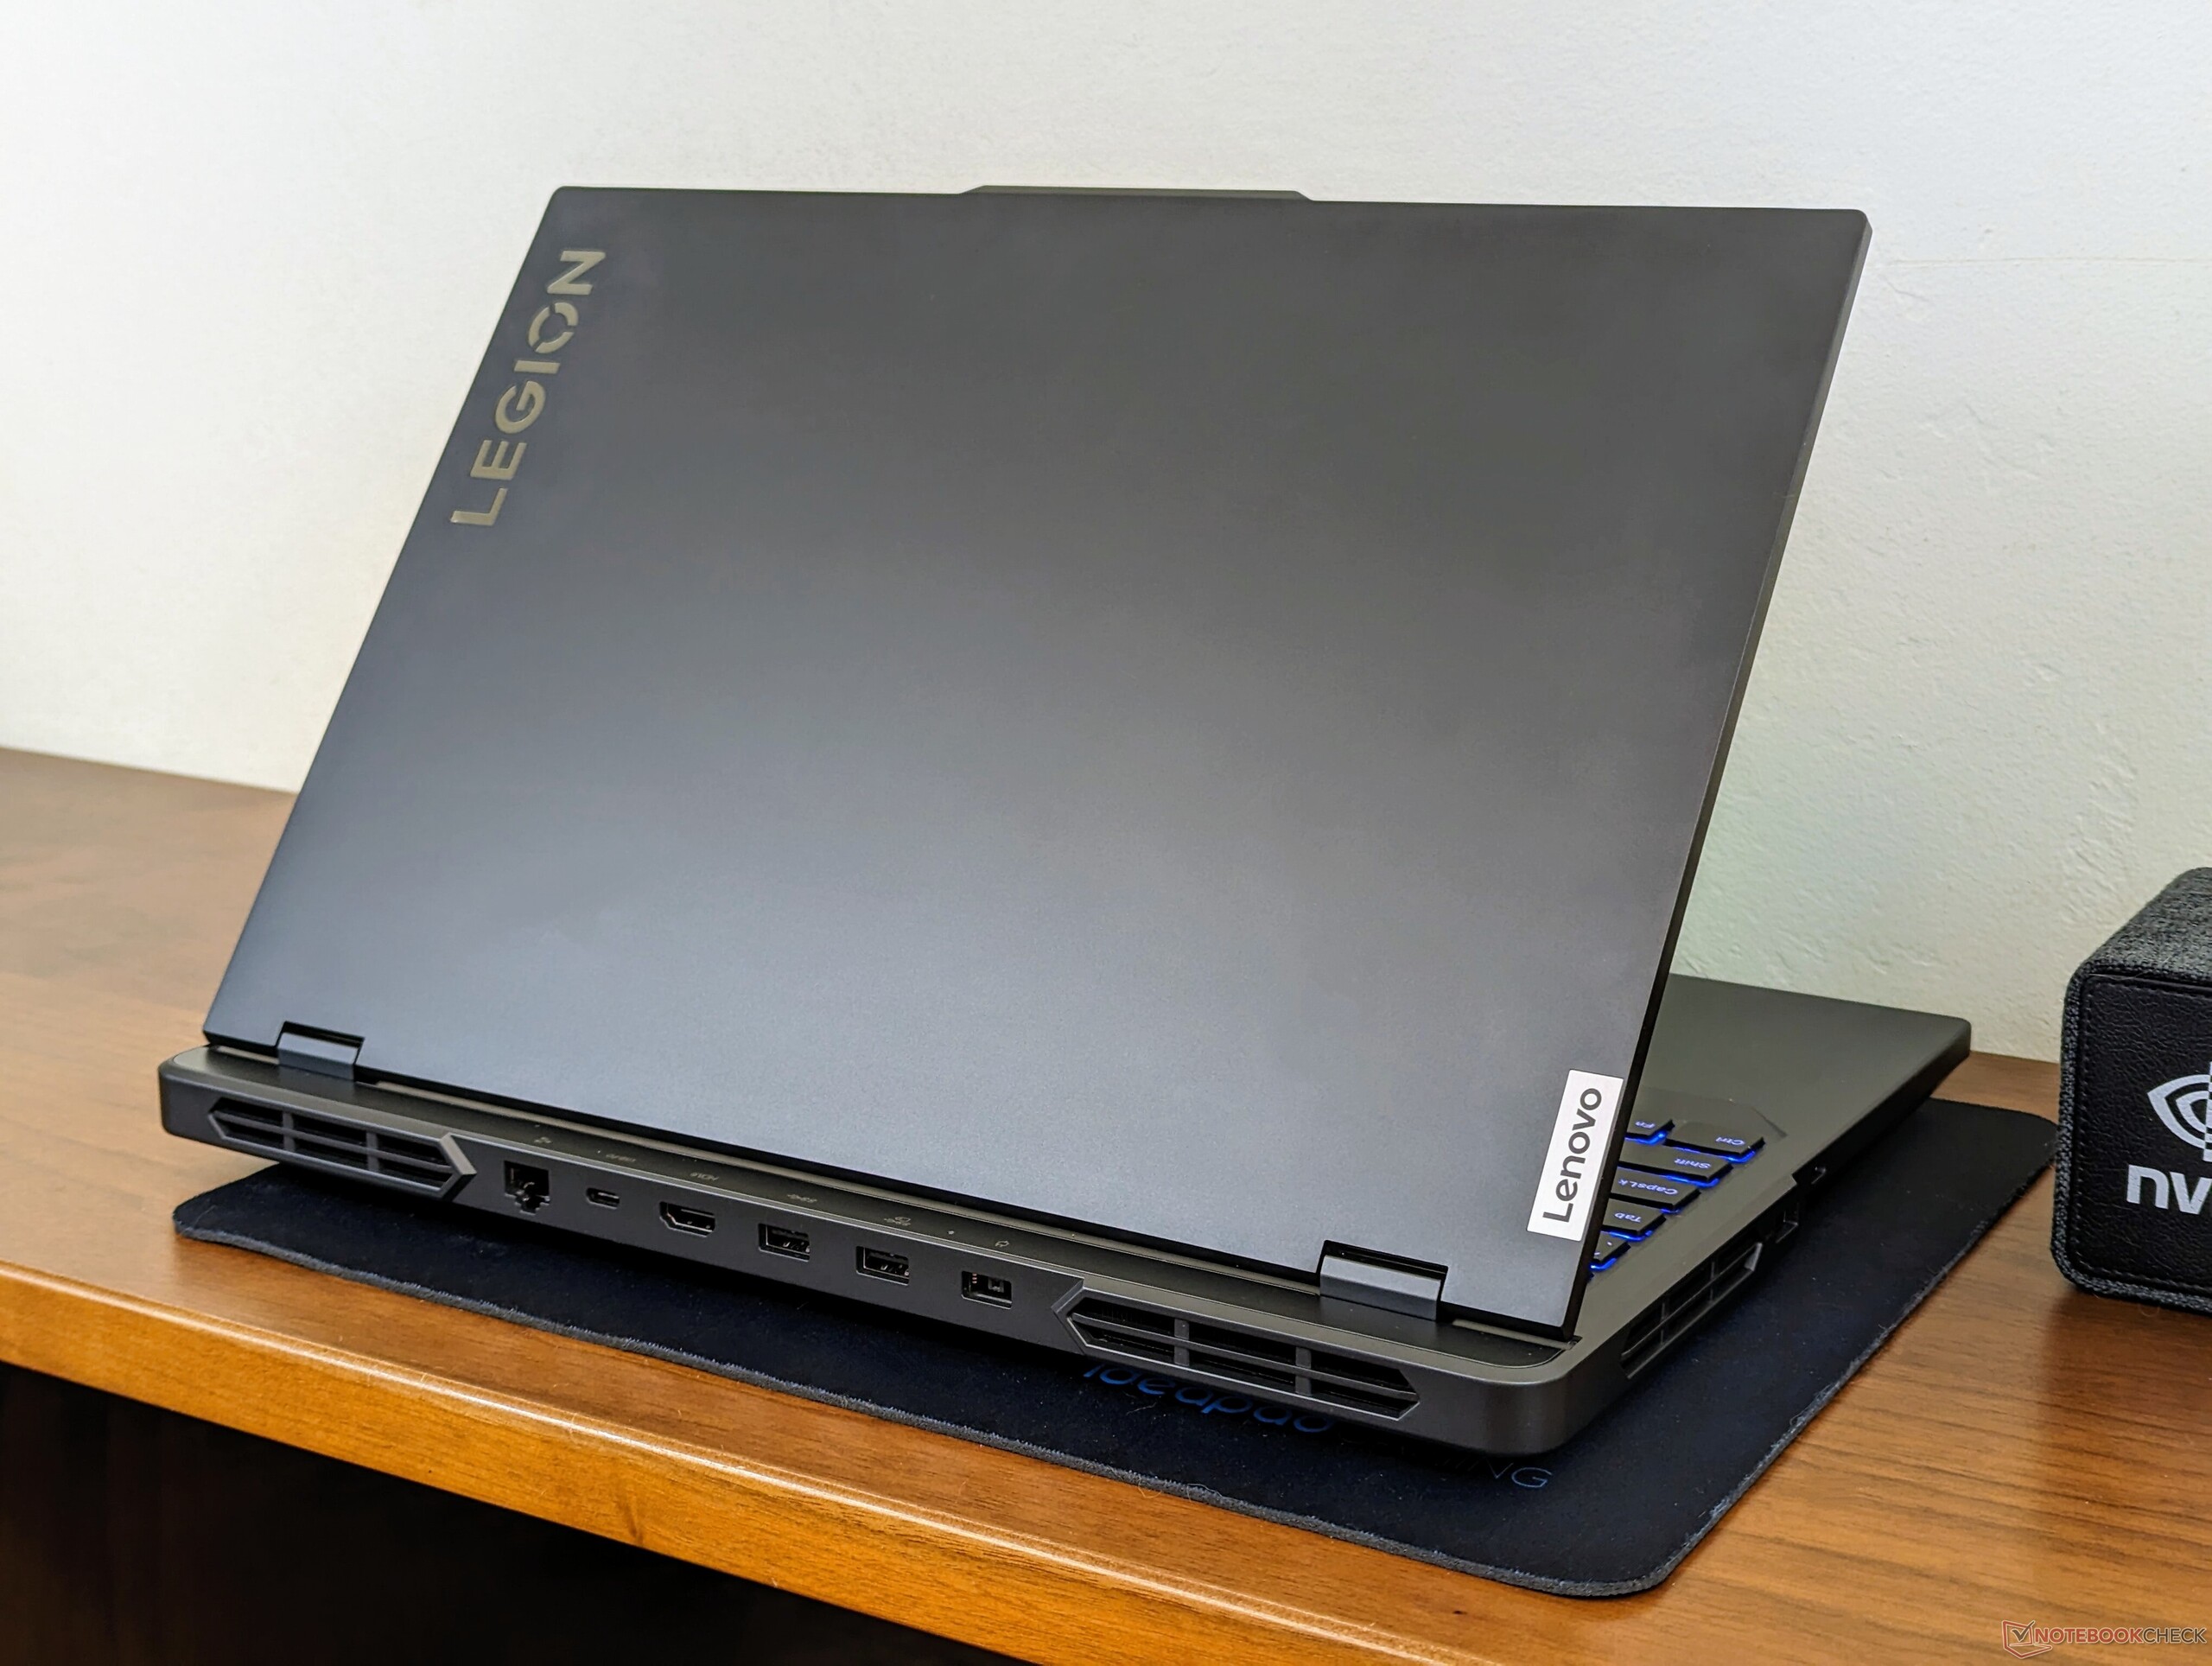
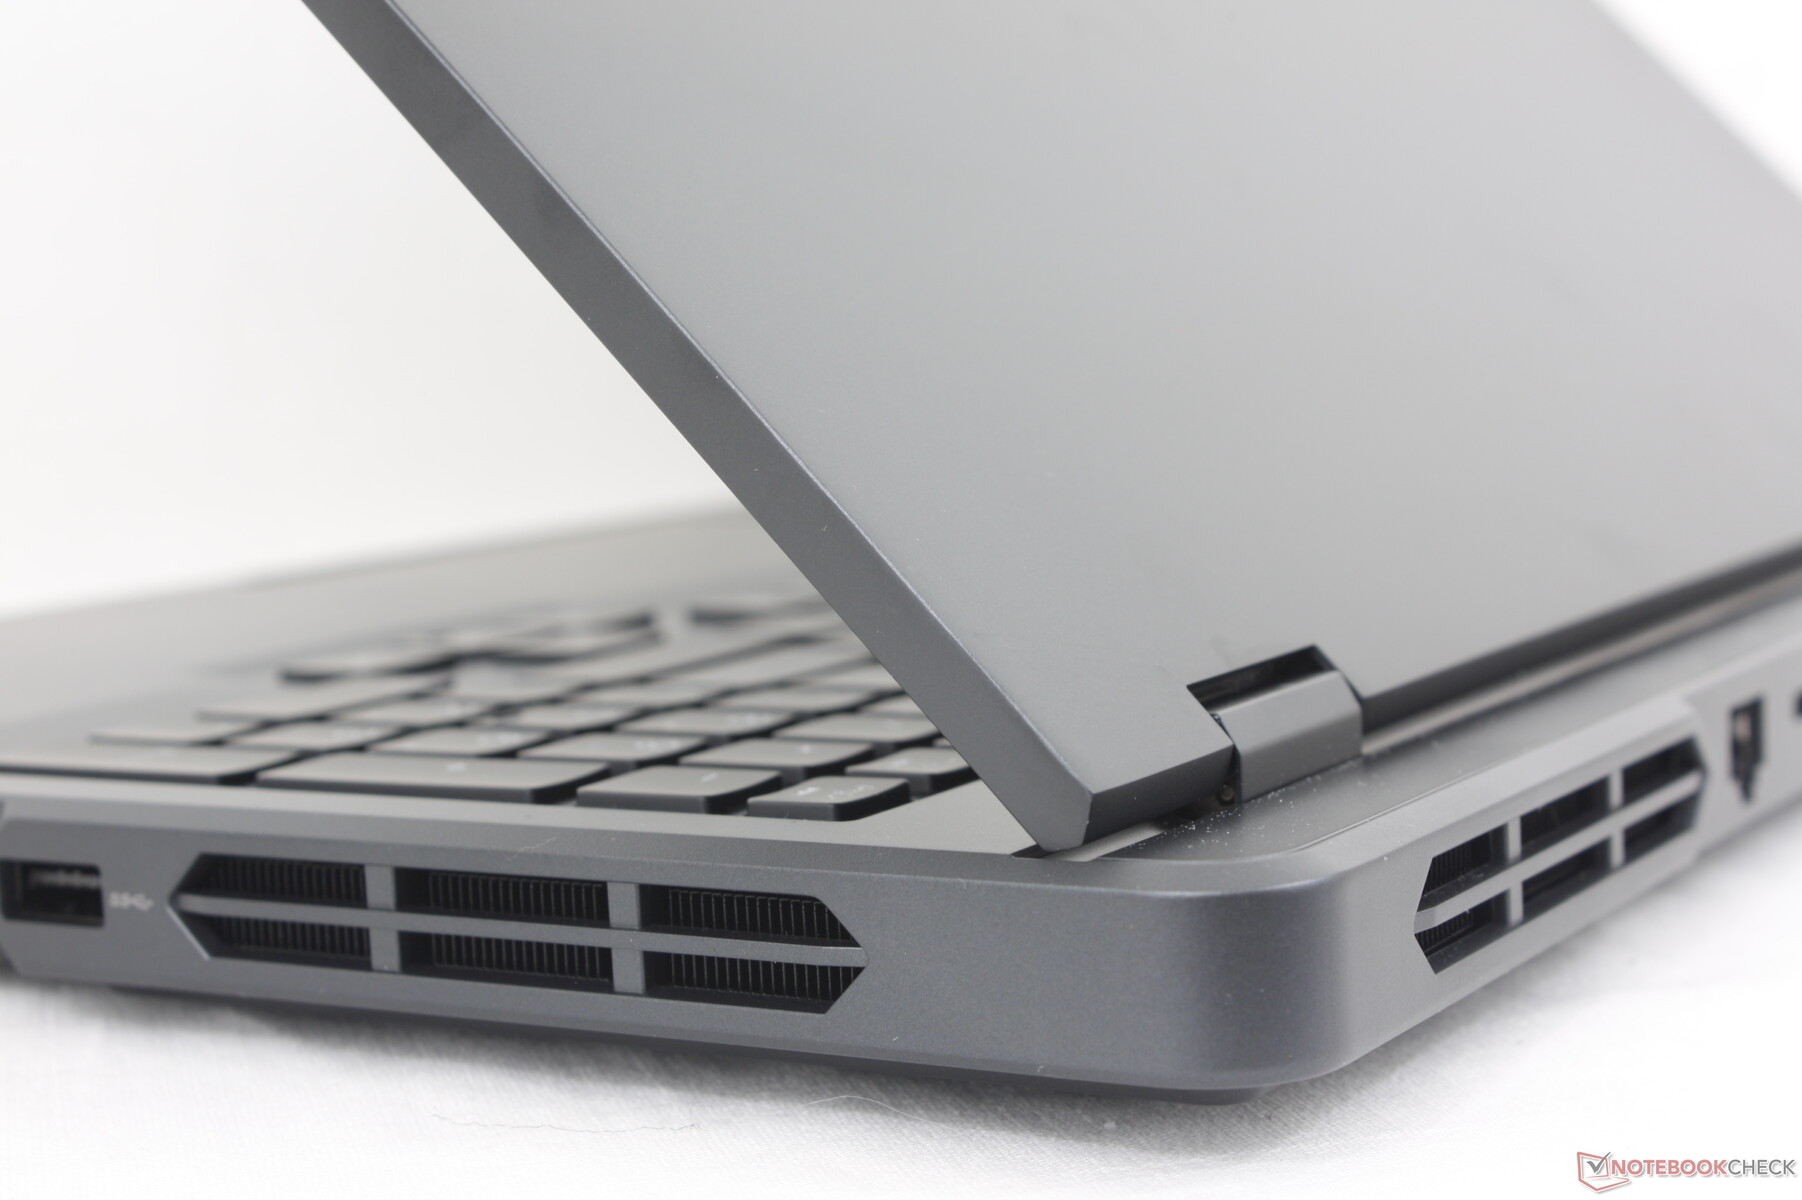
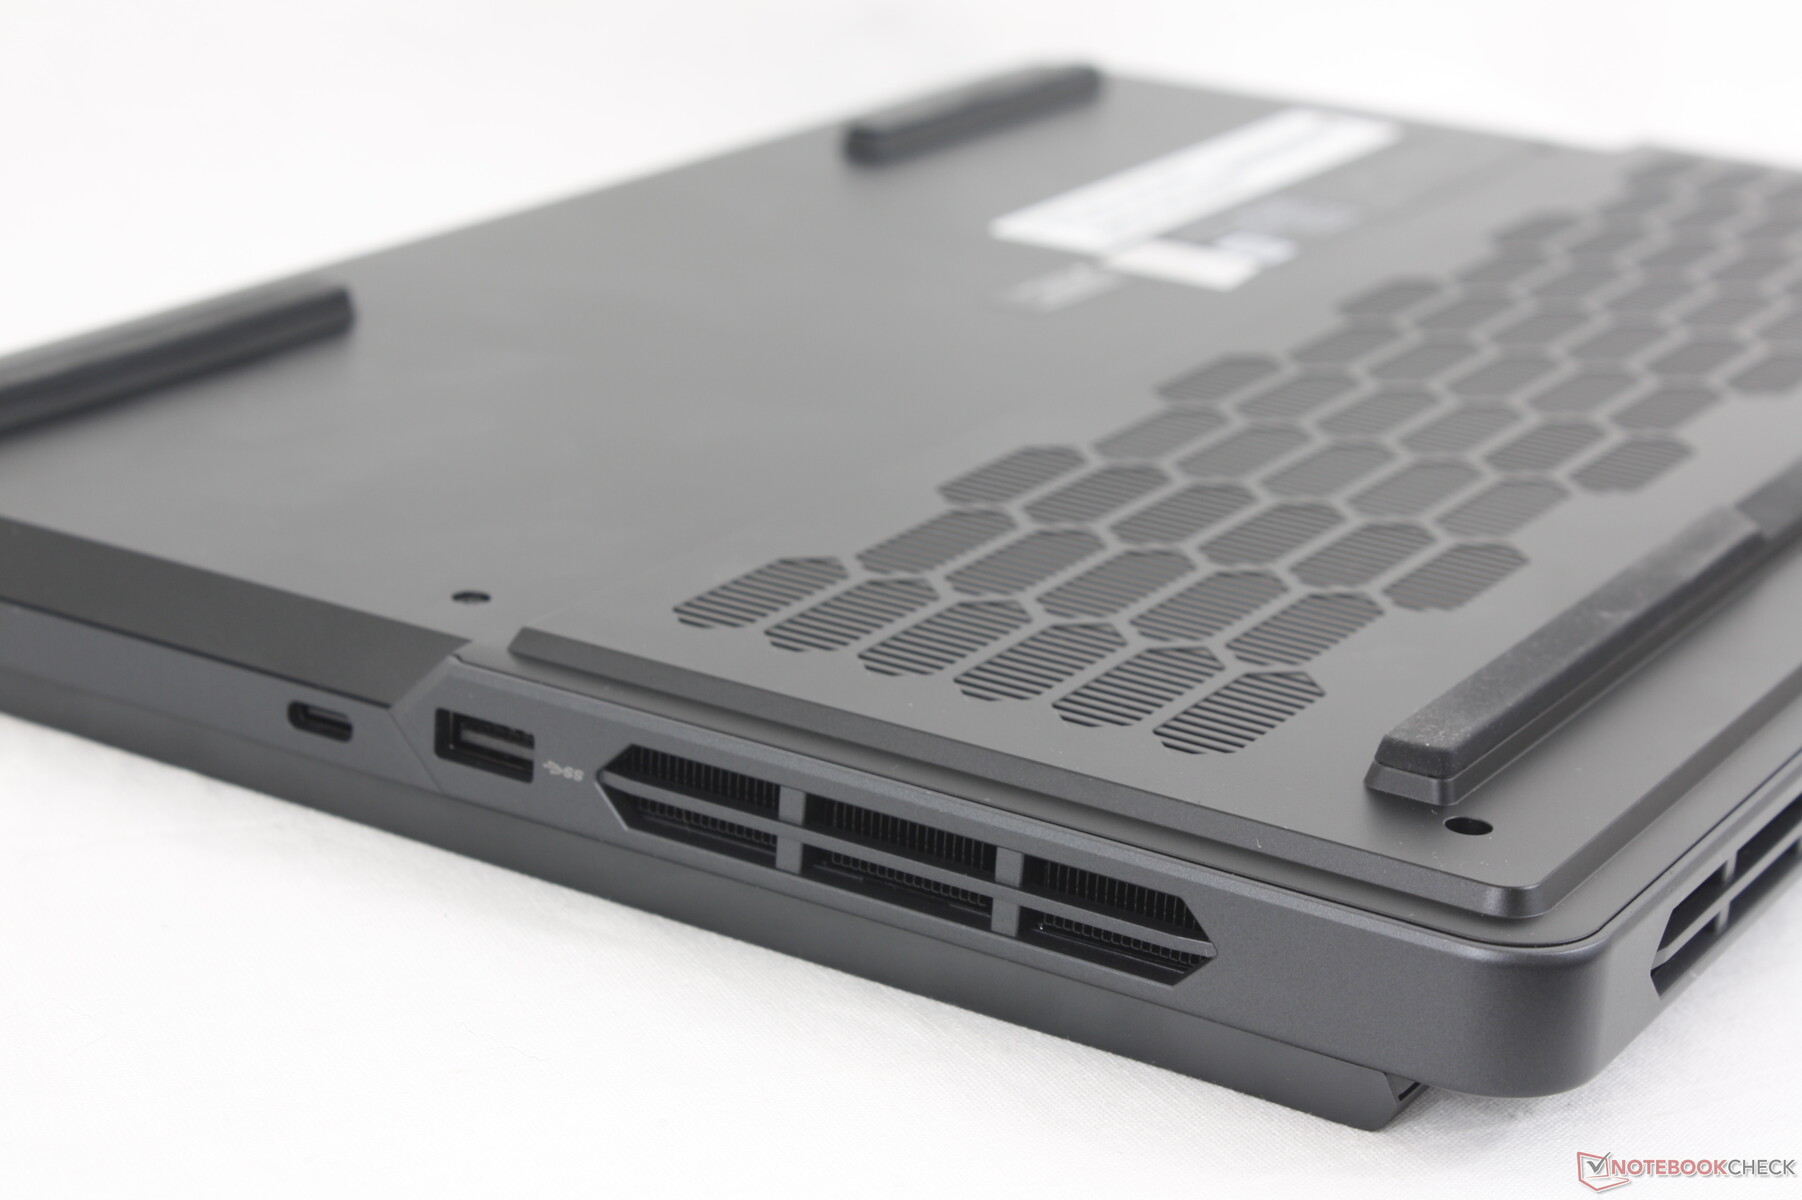
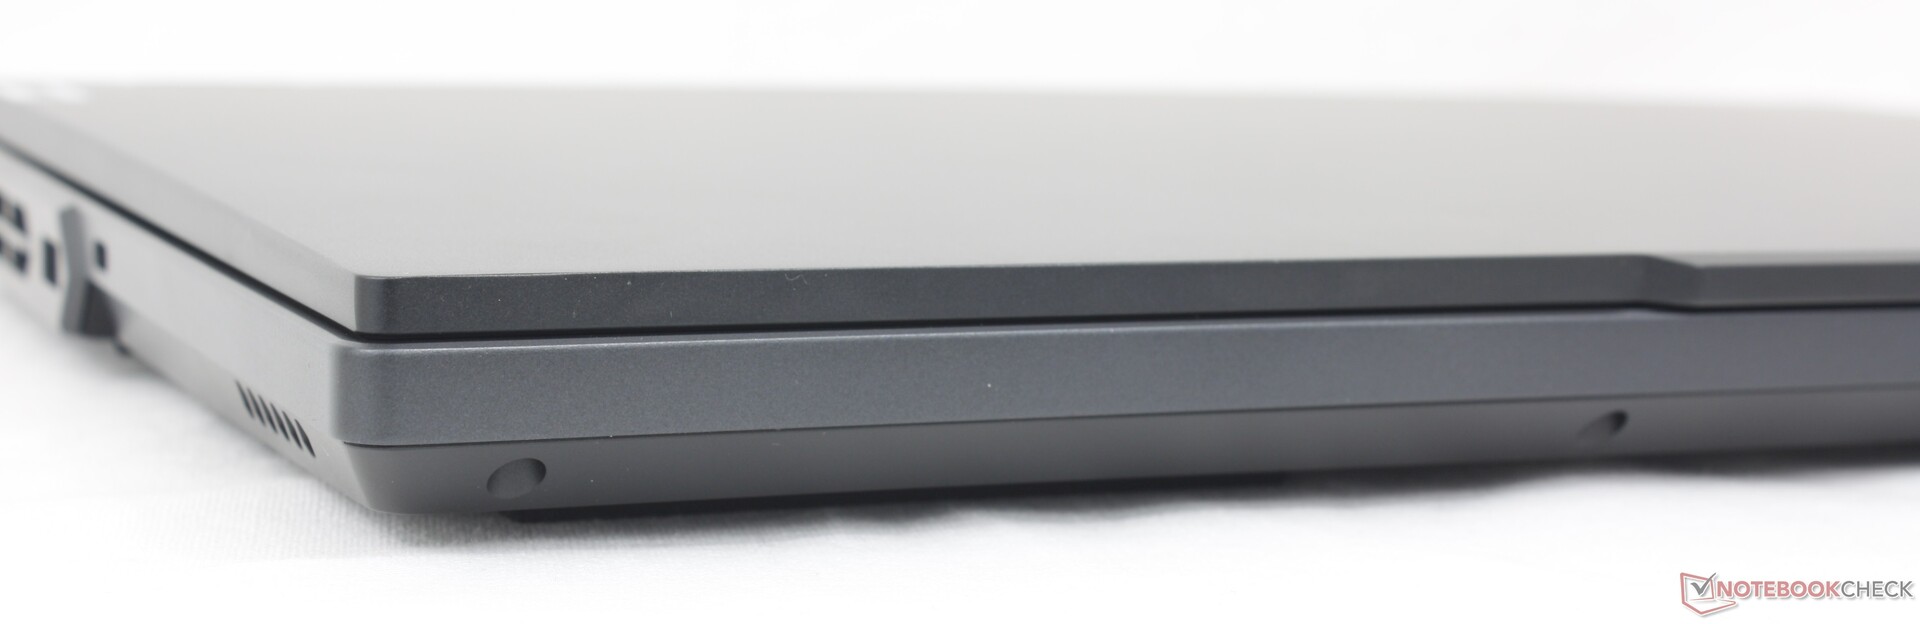
联想在其Legion 系列中使用了类似的灰色铝合金材料,Legion Pro 5 16IRX9 也不例外。该机型今年的新特点是重新设计了底板(D 侧)的通风栅栏,由原来的矩形变成了延伸的六边形。这种变化主要是表面上的,机箱的其他部分与Legion Pro 5 16IRX8 相同。
Legion Pro 5 16 仍是最大、最重的 16 英寸游戏笔记本电脑之一,在某些情况下重量超过 600 克。不过,更大的尺寸并没有浪费,因为联想配备了合适的酷睿-HX 系列 CPU,而更小更轻的替代品,如 Alienware m16 R2等更小更轻的替代产品则可能配备较慢的 Core Ultra CPU。
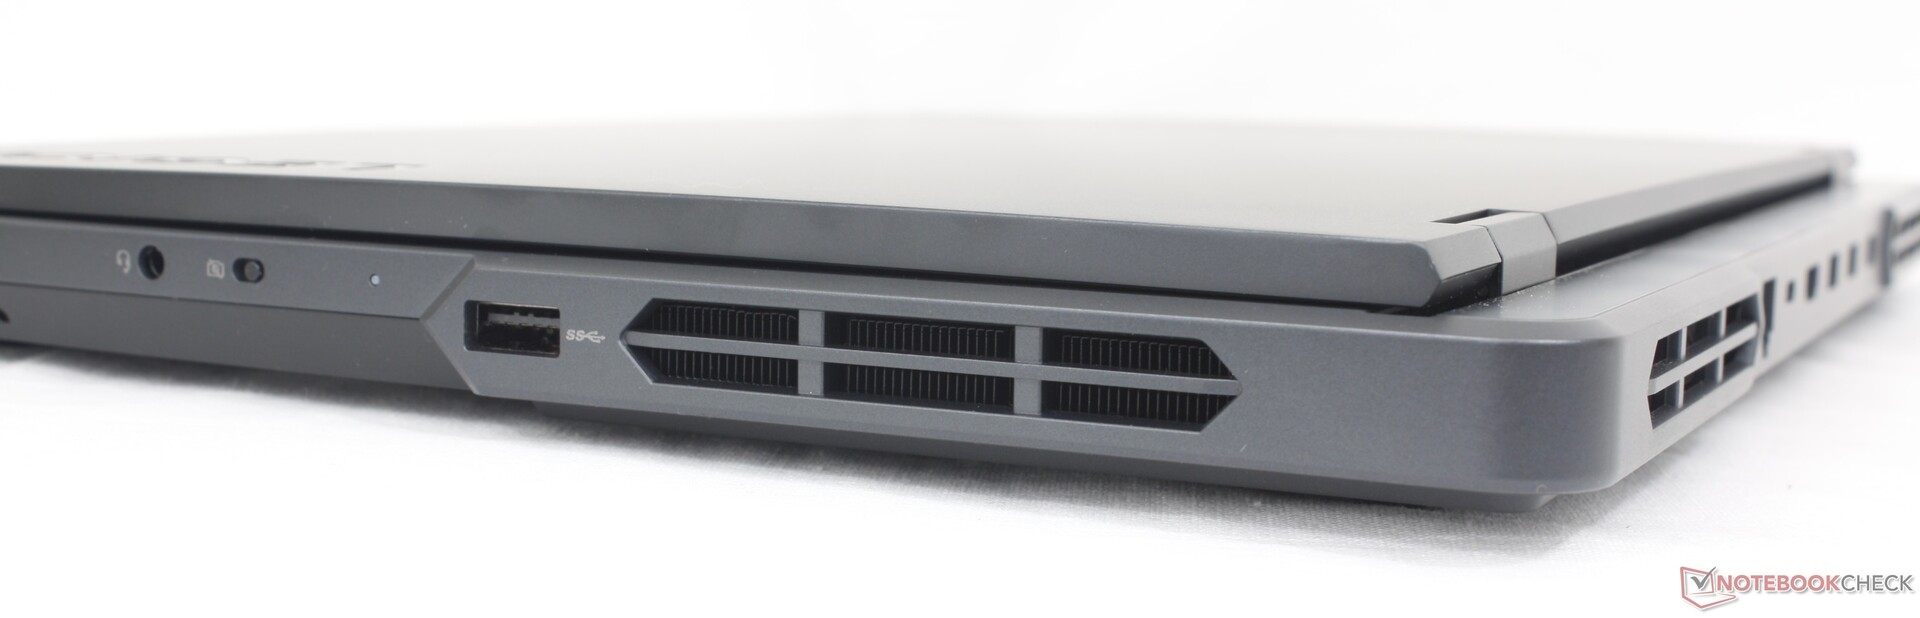
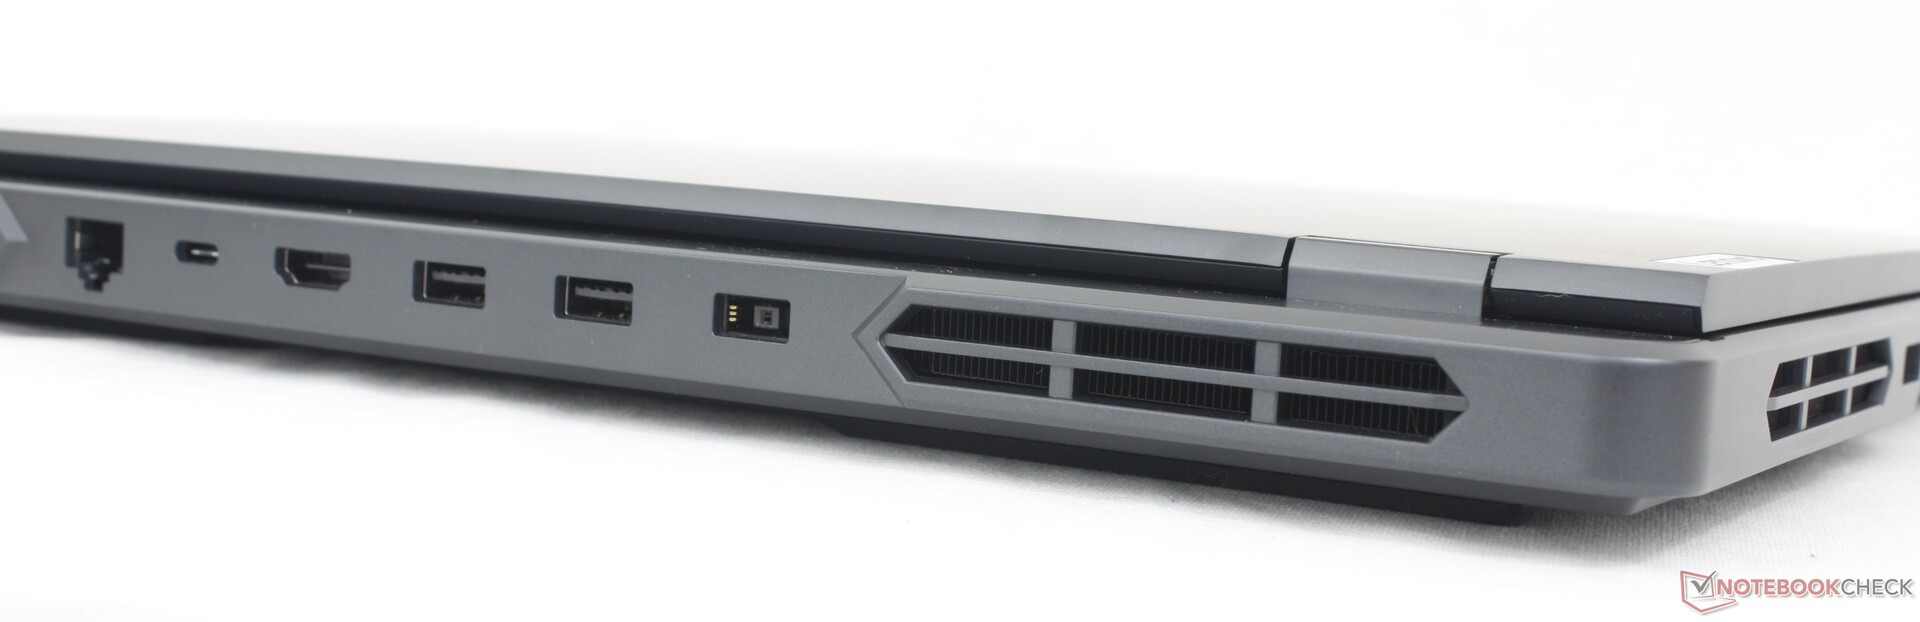
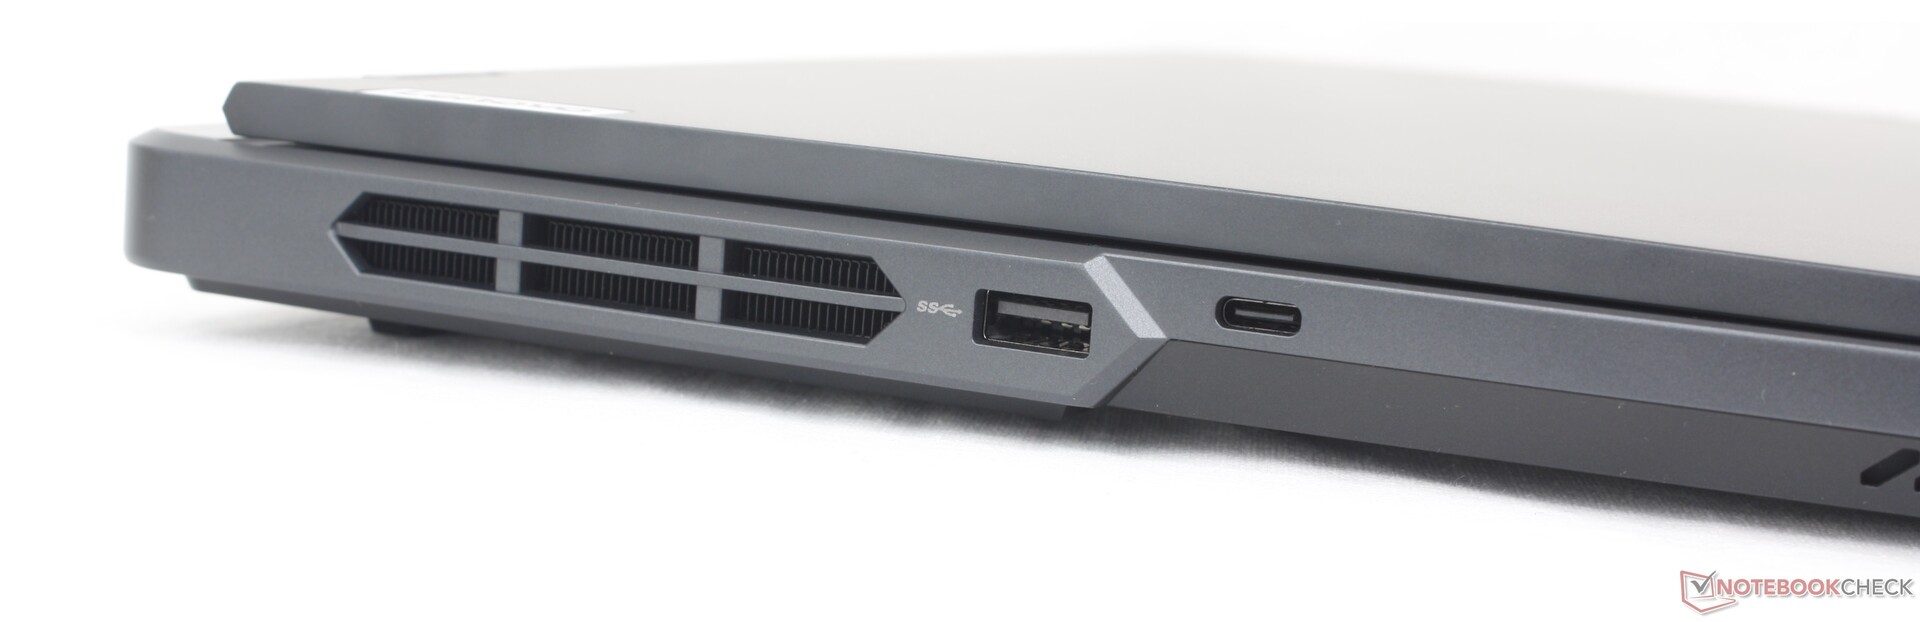
连接性
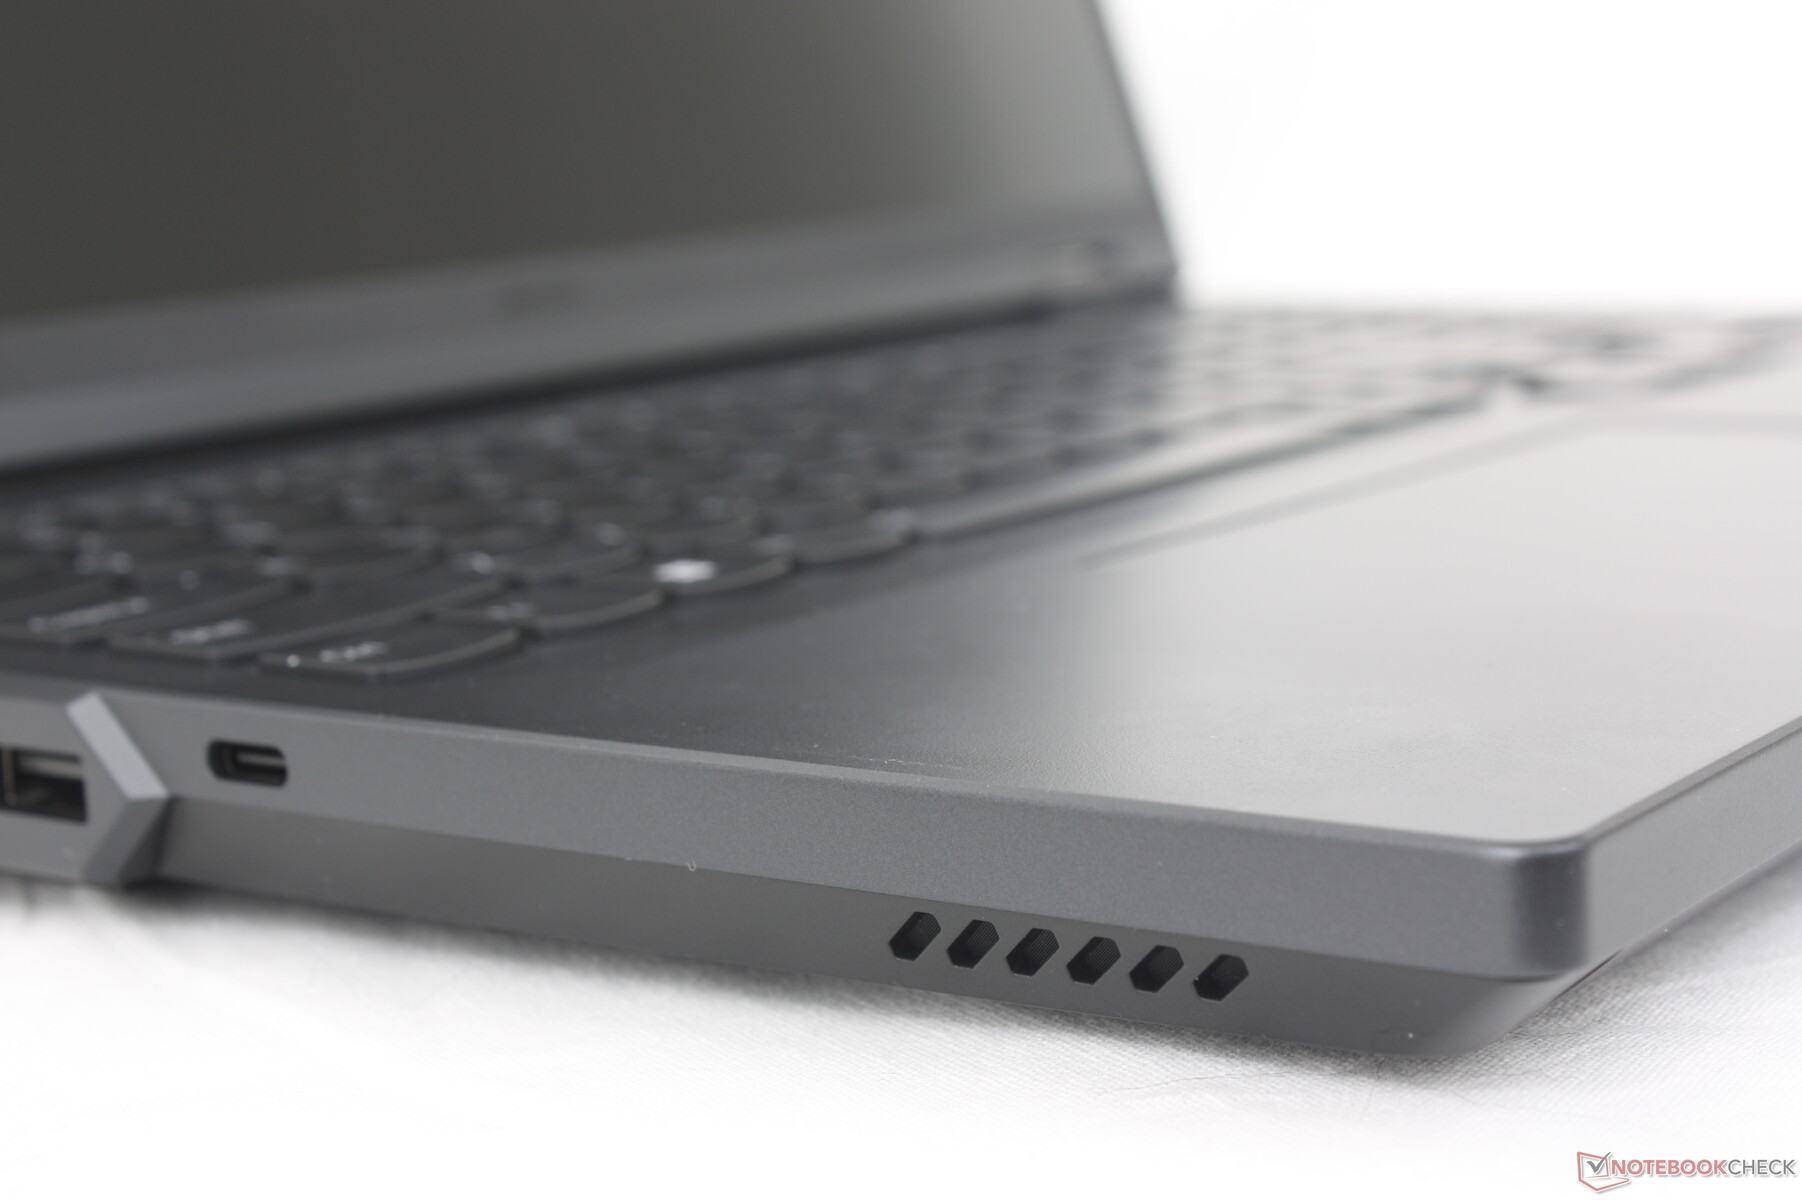
虽然没有集成 SD 卡读卡器可能会让一些内容创作者感到不满,但端口选项仍然很有竞争力。与 Alienware m16 R2 或 HP Omen Transcend 16 等笔记本电脑相比,沿散热甲板印制的端口符号更容易直观地识别后部端口。 HP Omen Transcend 16.不过,与 Pro 7 系列不同的是,这些符号并不发光。 Legion Pro 7 系列.
虽然支持 Thunderbolt 5 的笔记本电脑现在才开始进入市场,但Legion Pro 5 16 仍然只能使用 Thunderbolt 4。
交流
英特尔 AX211 标配 Wi-Fi 6E 和蓝牙 5.2 连接。在与华硕 AXE11000 测试路由器配对时,我们没有遇到任何问题。
网络摄像头
我们的测试机配备了 200 万像素网络摄像头,但有些型号可能只有 100 万像素网络摄像头。标配电子快门,无红外选项。


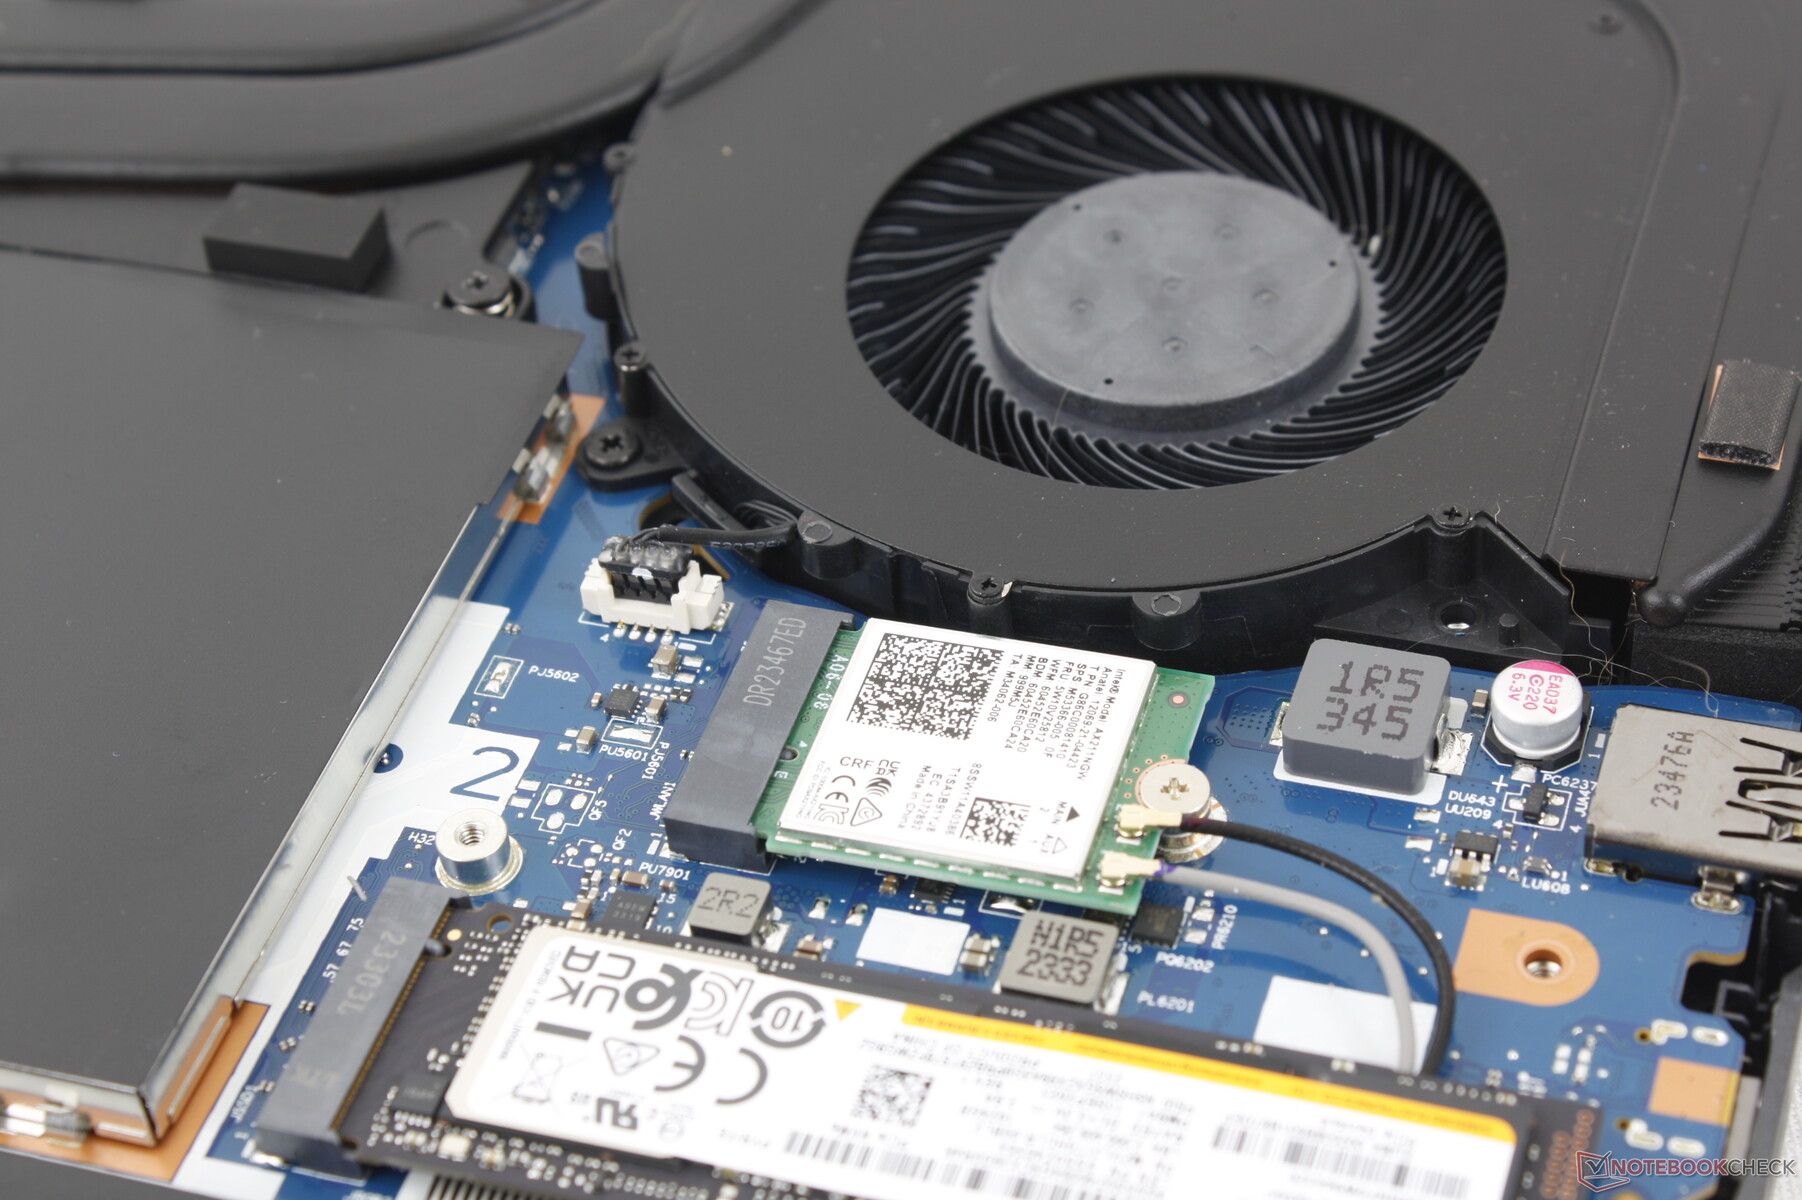
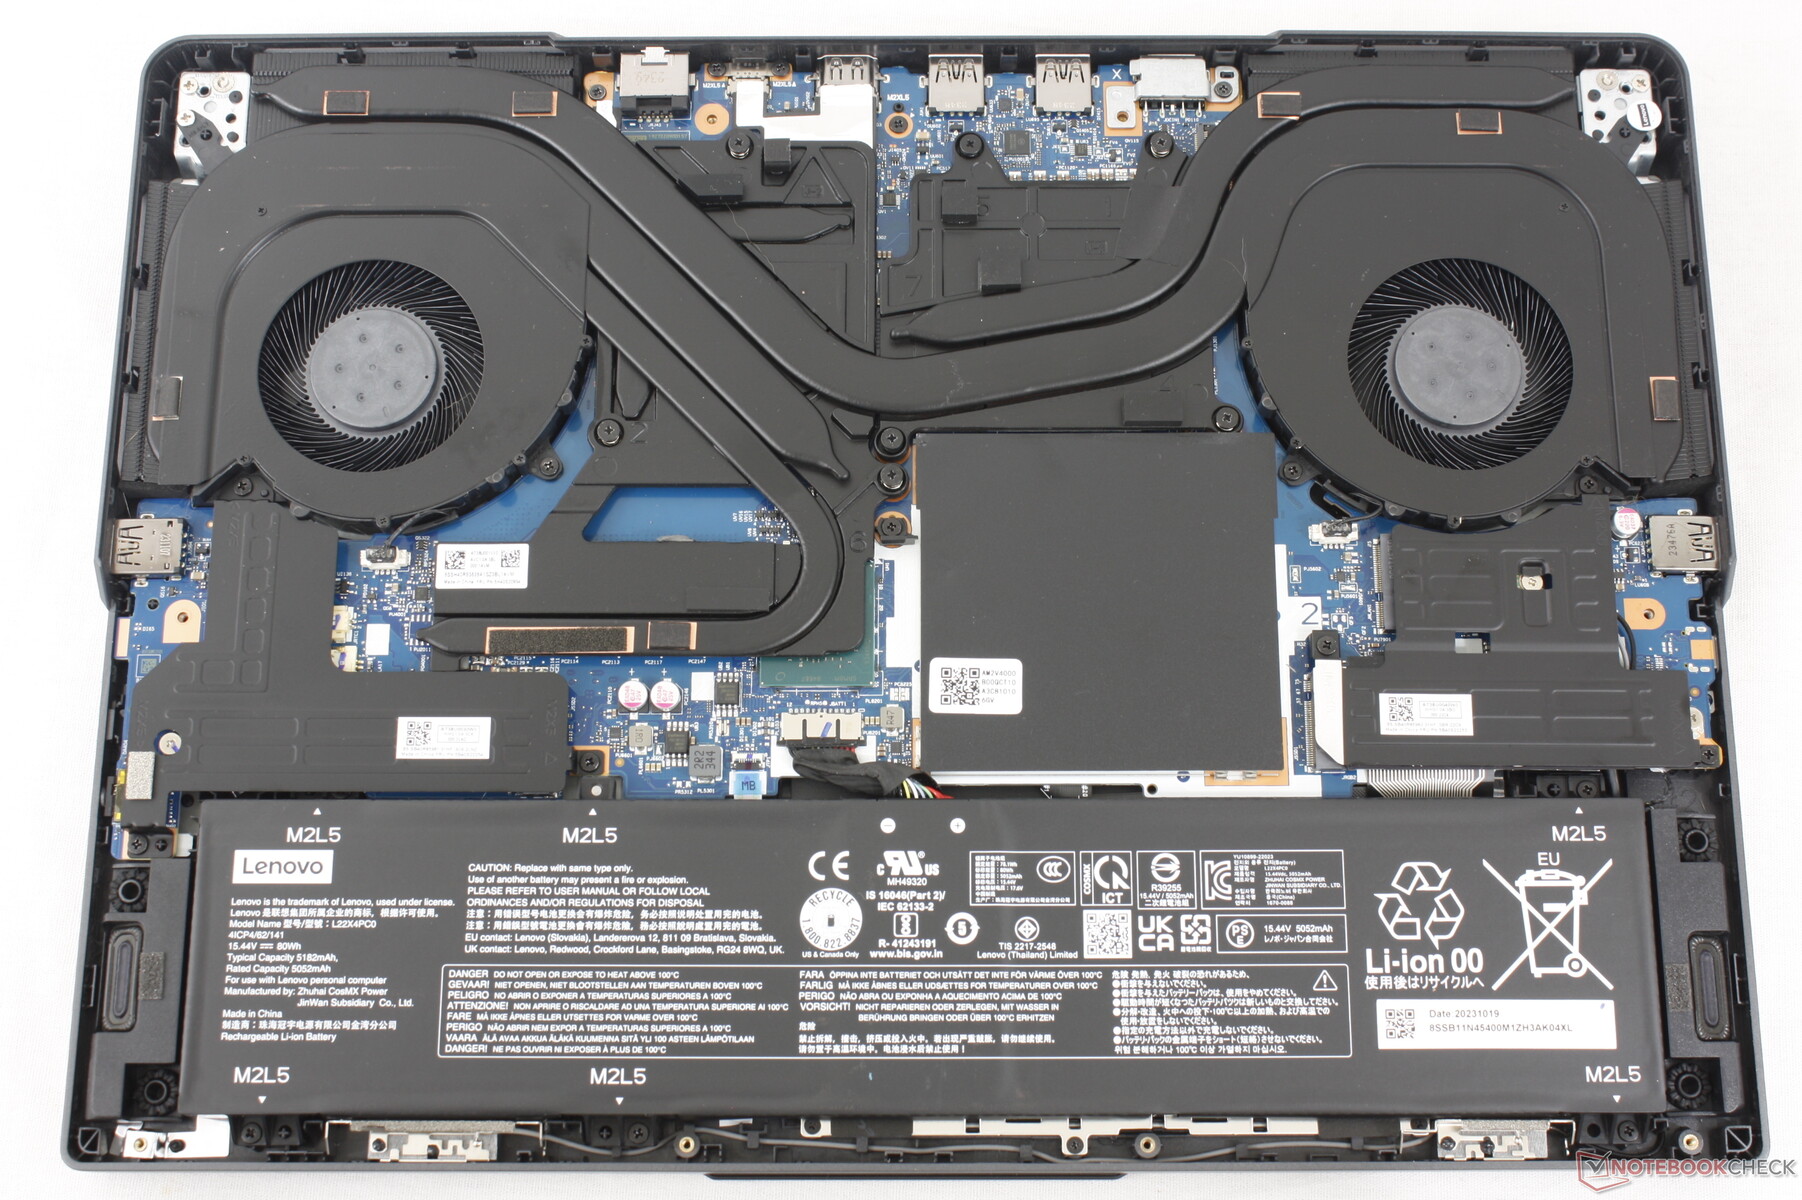
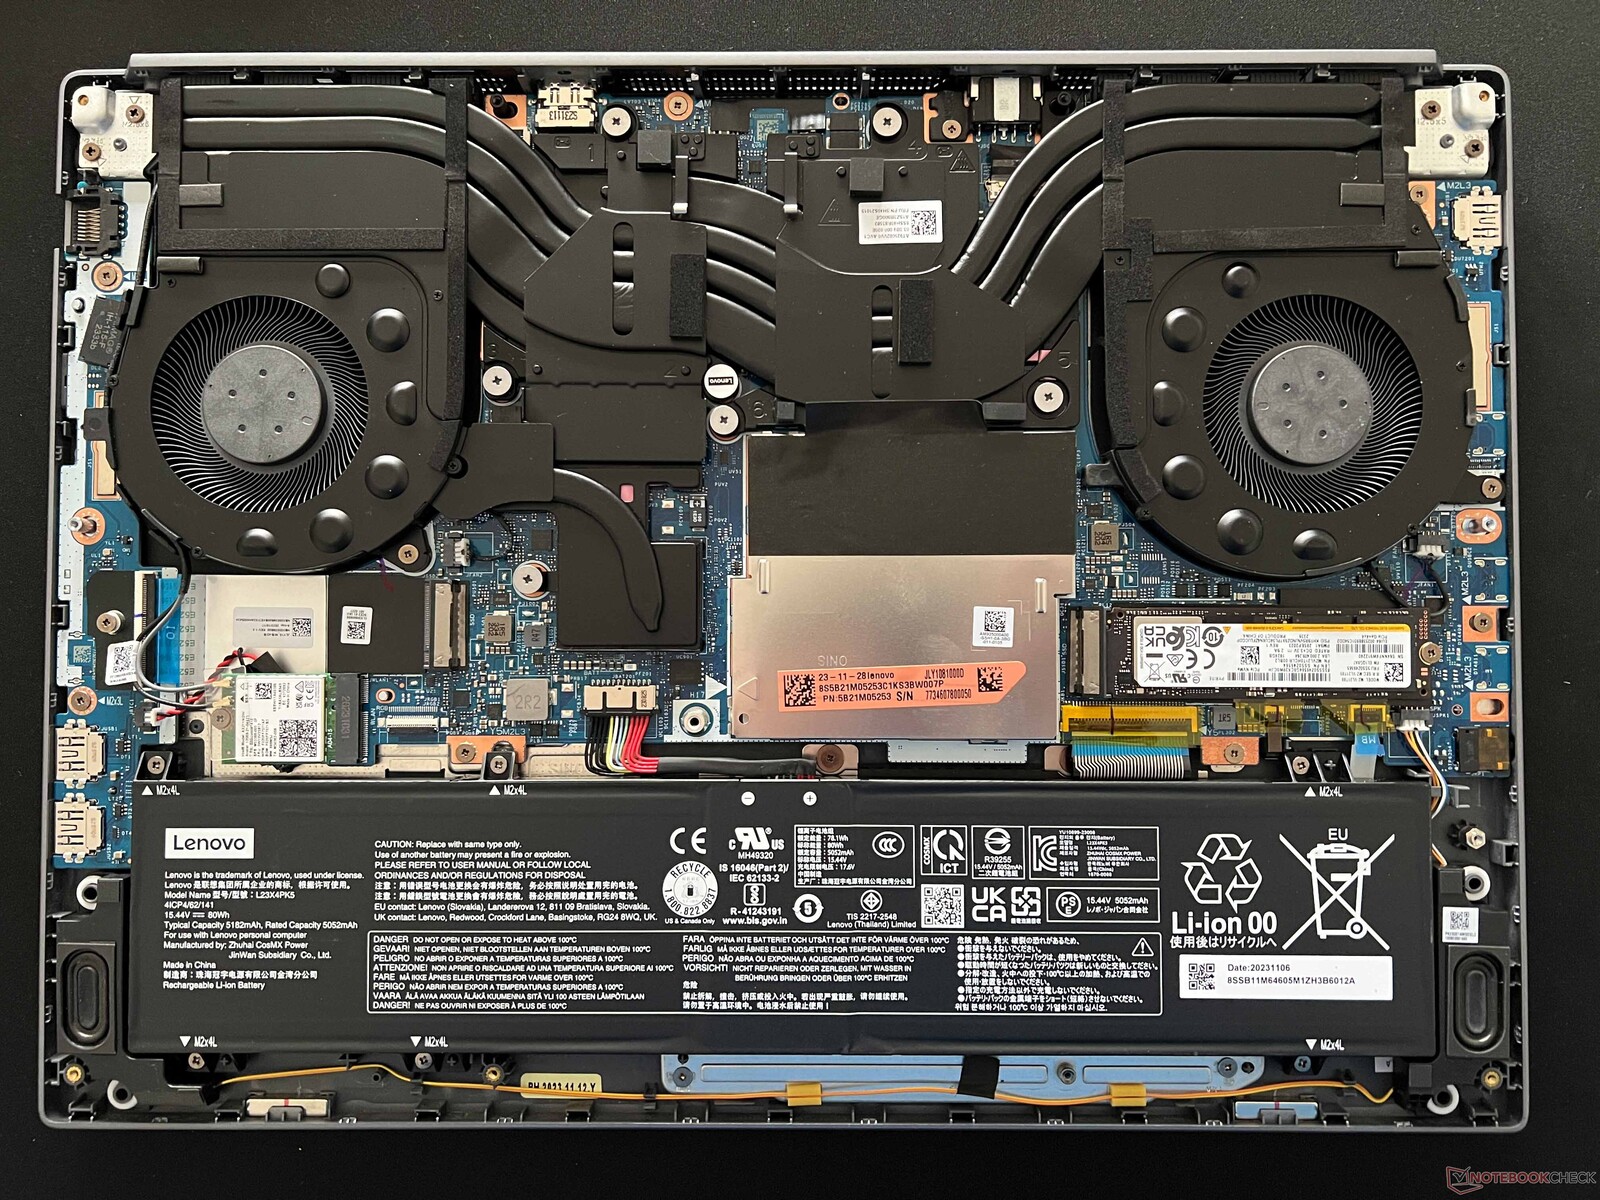
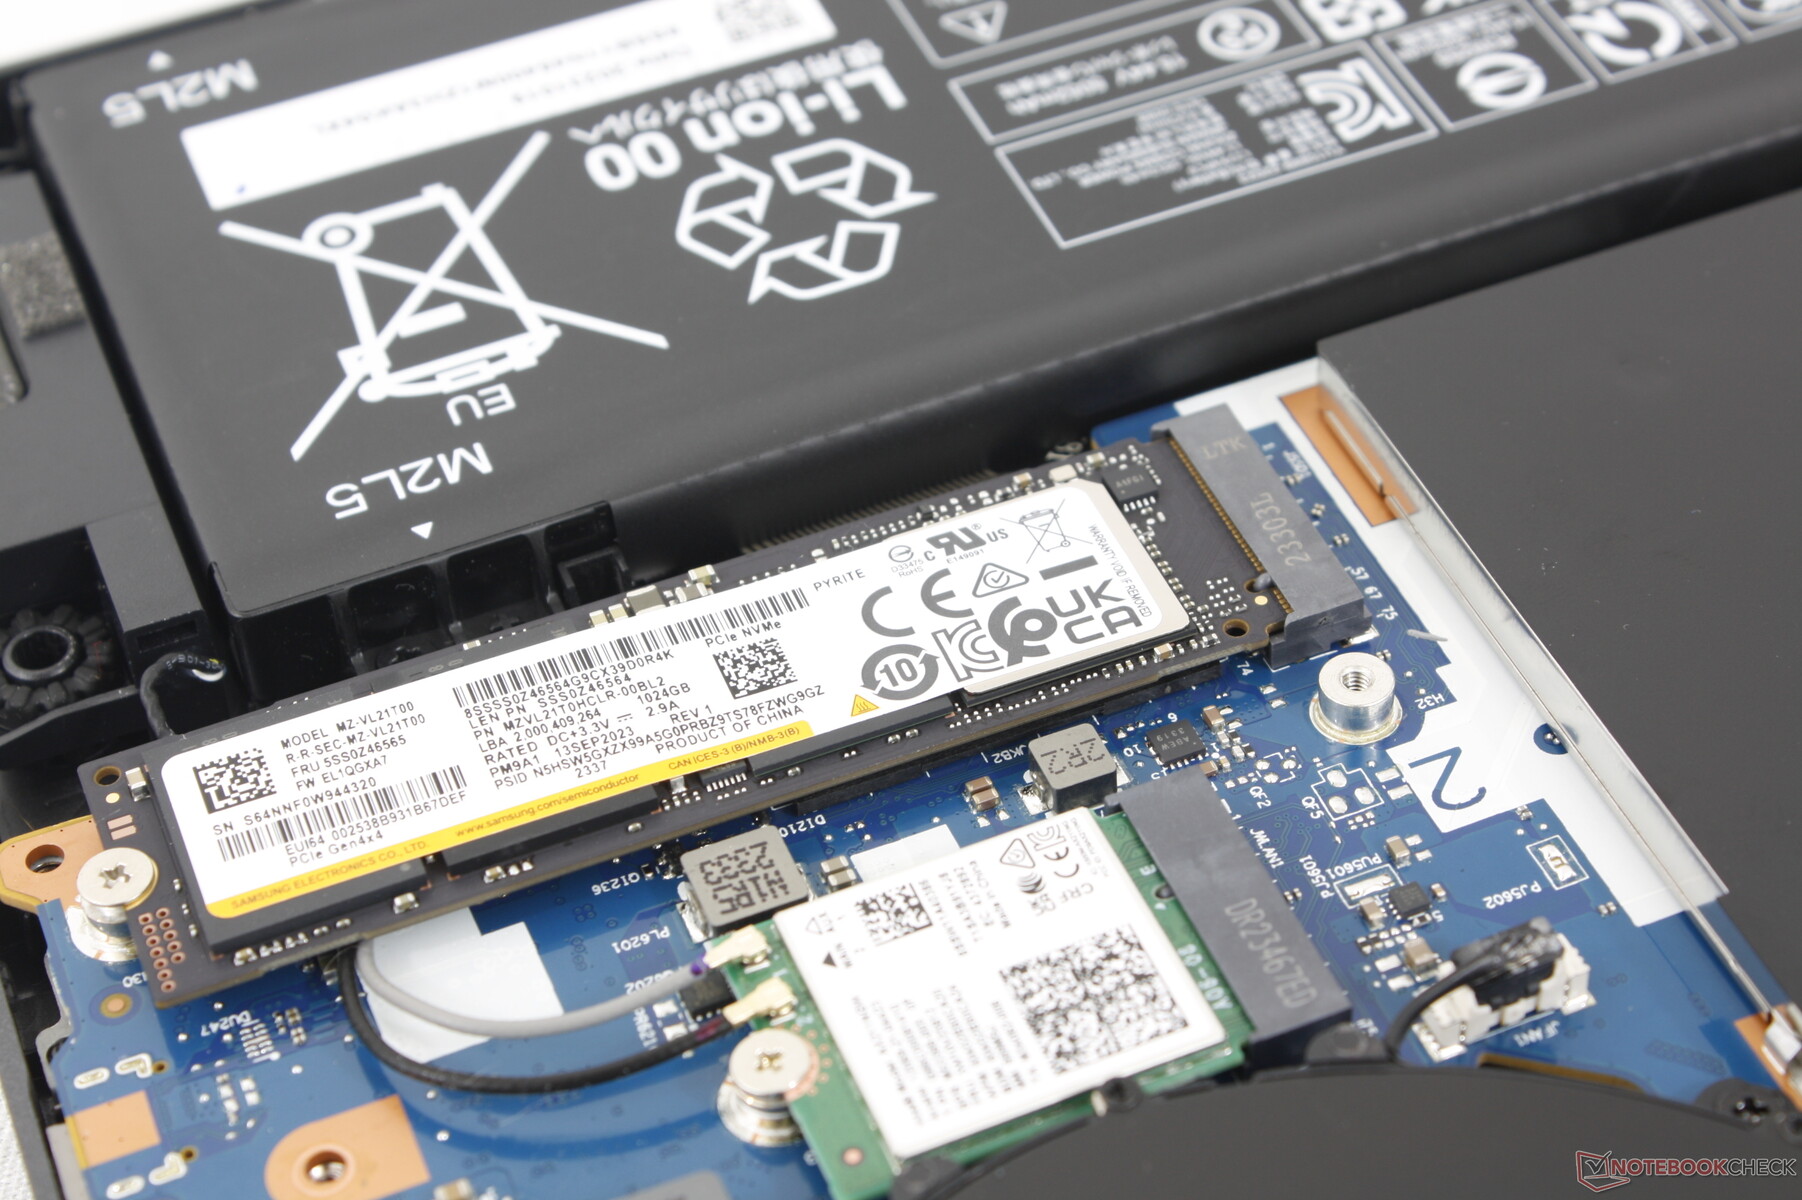
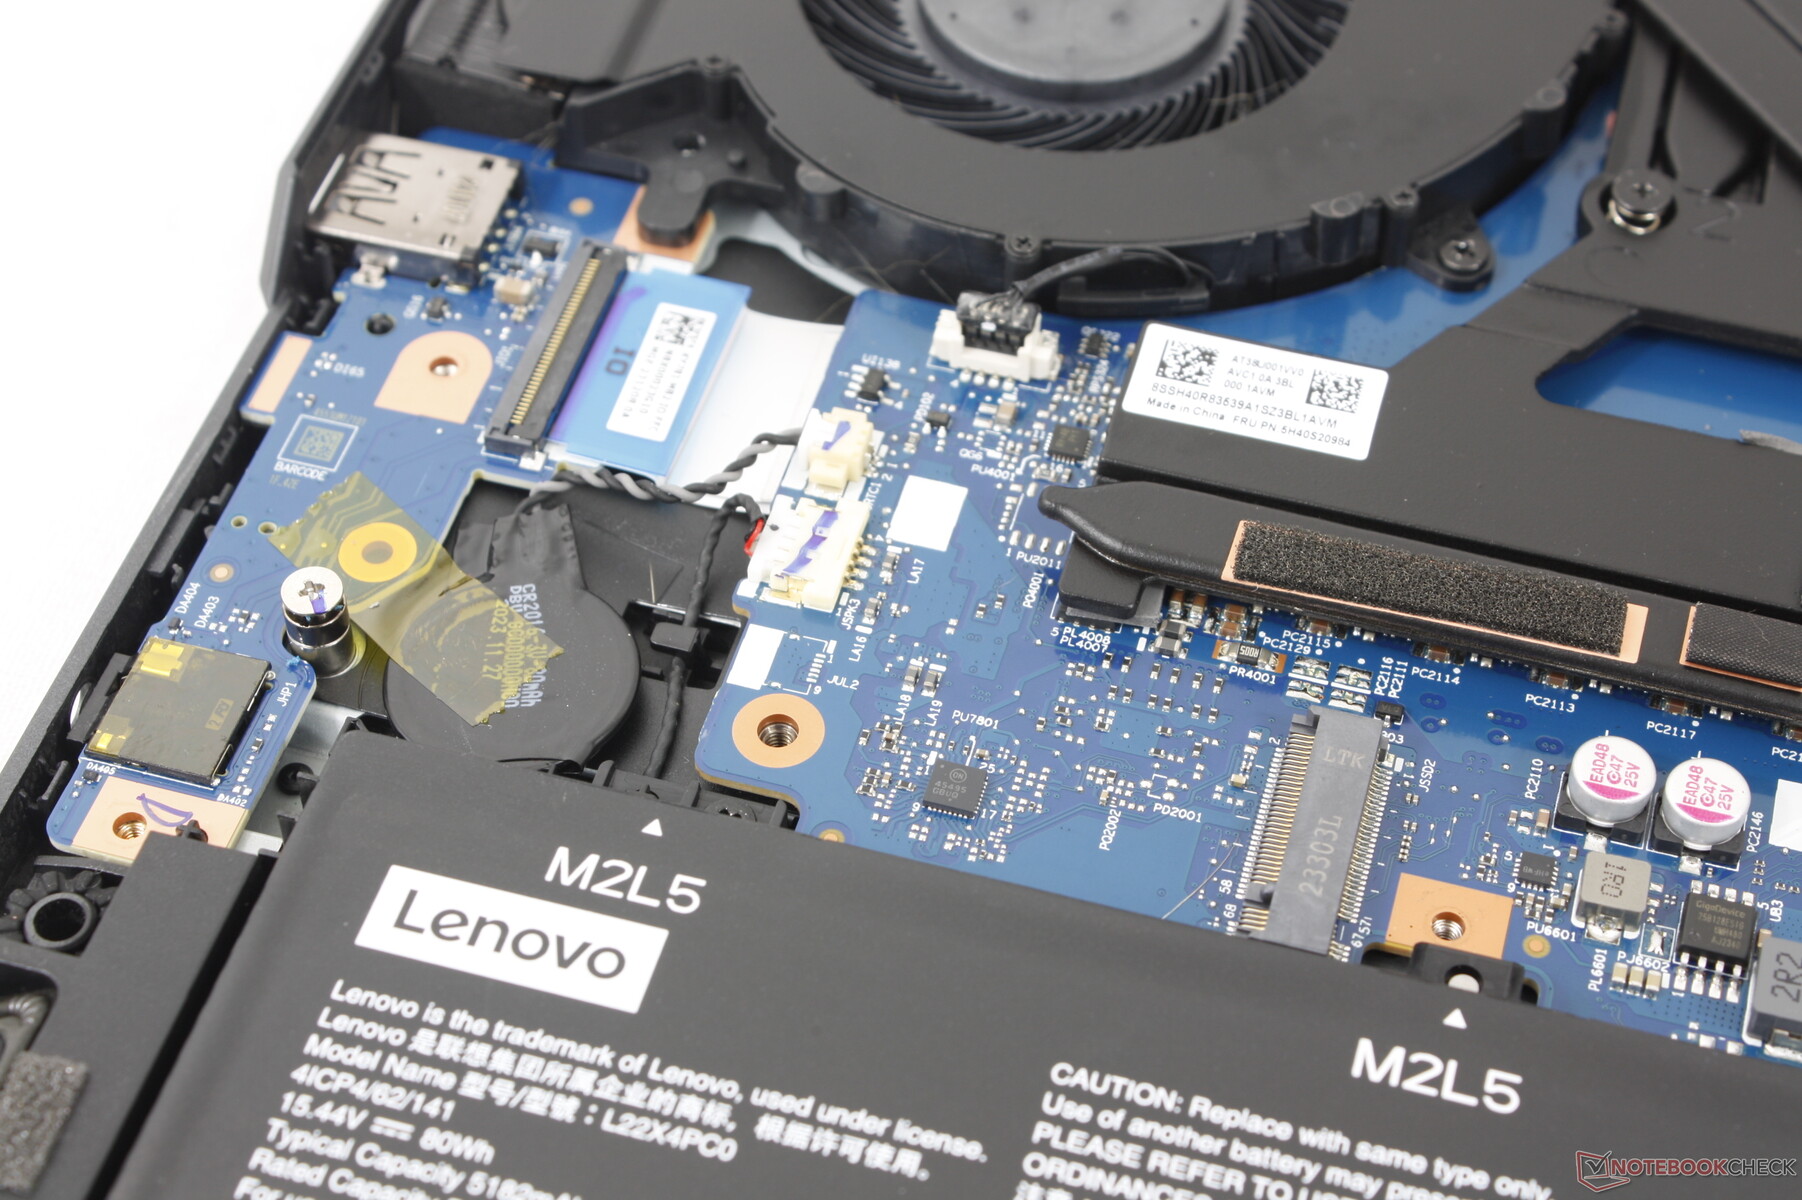
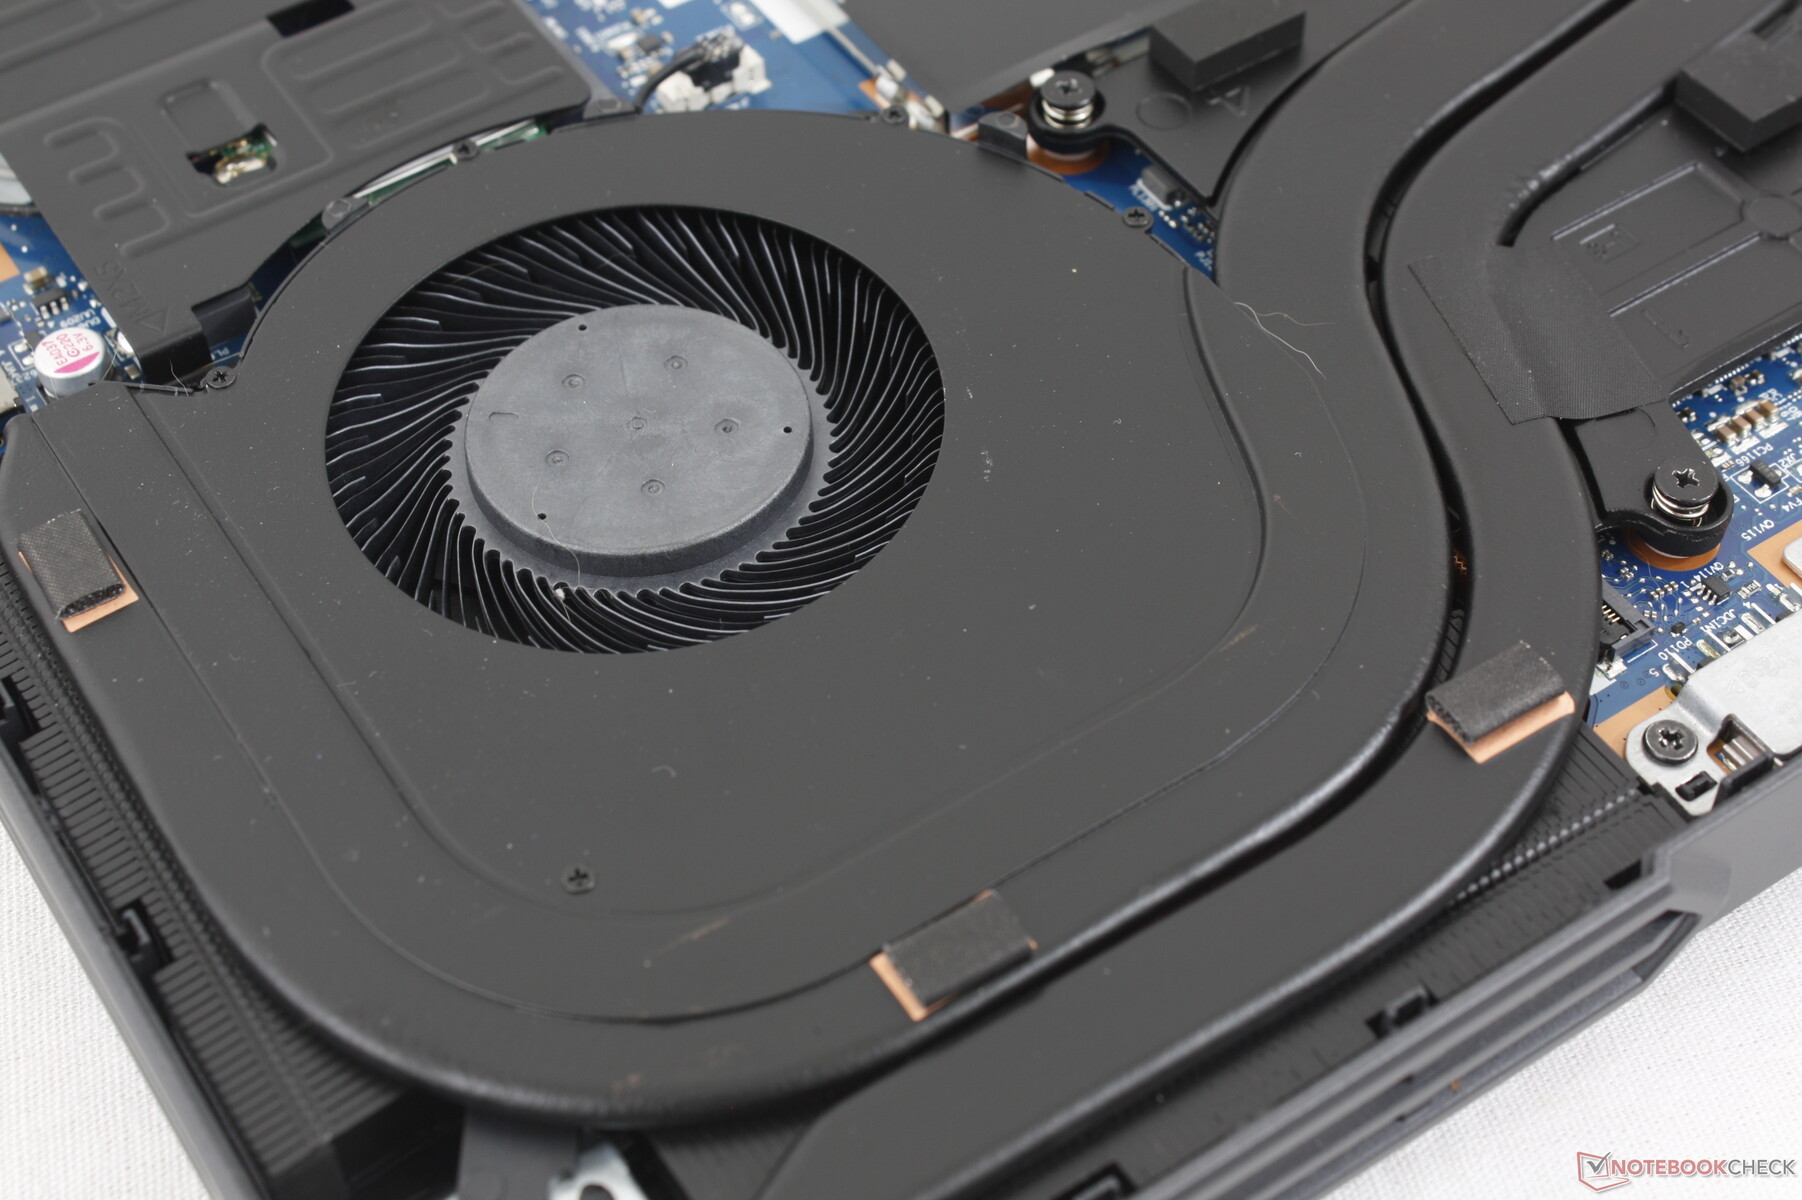
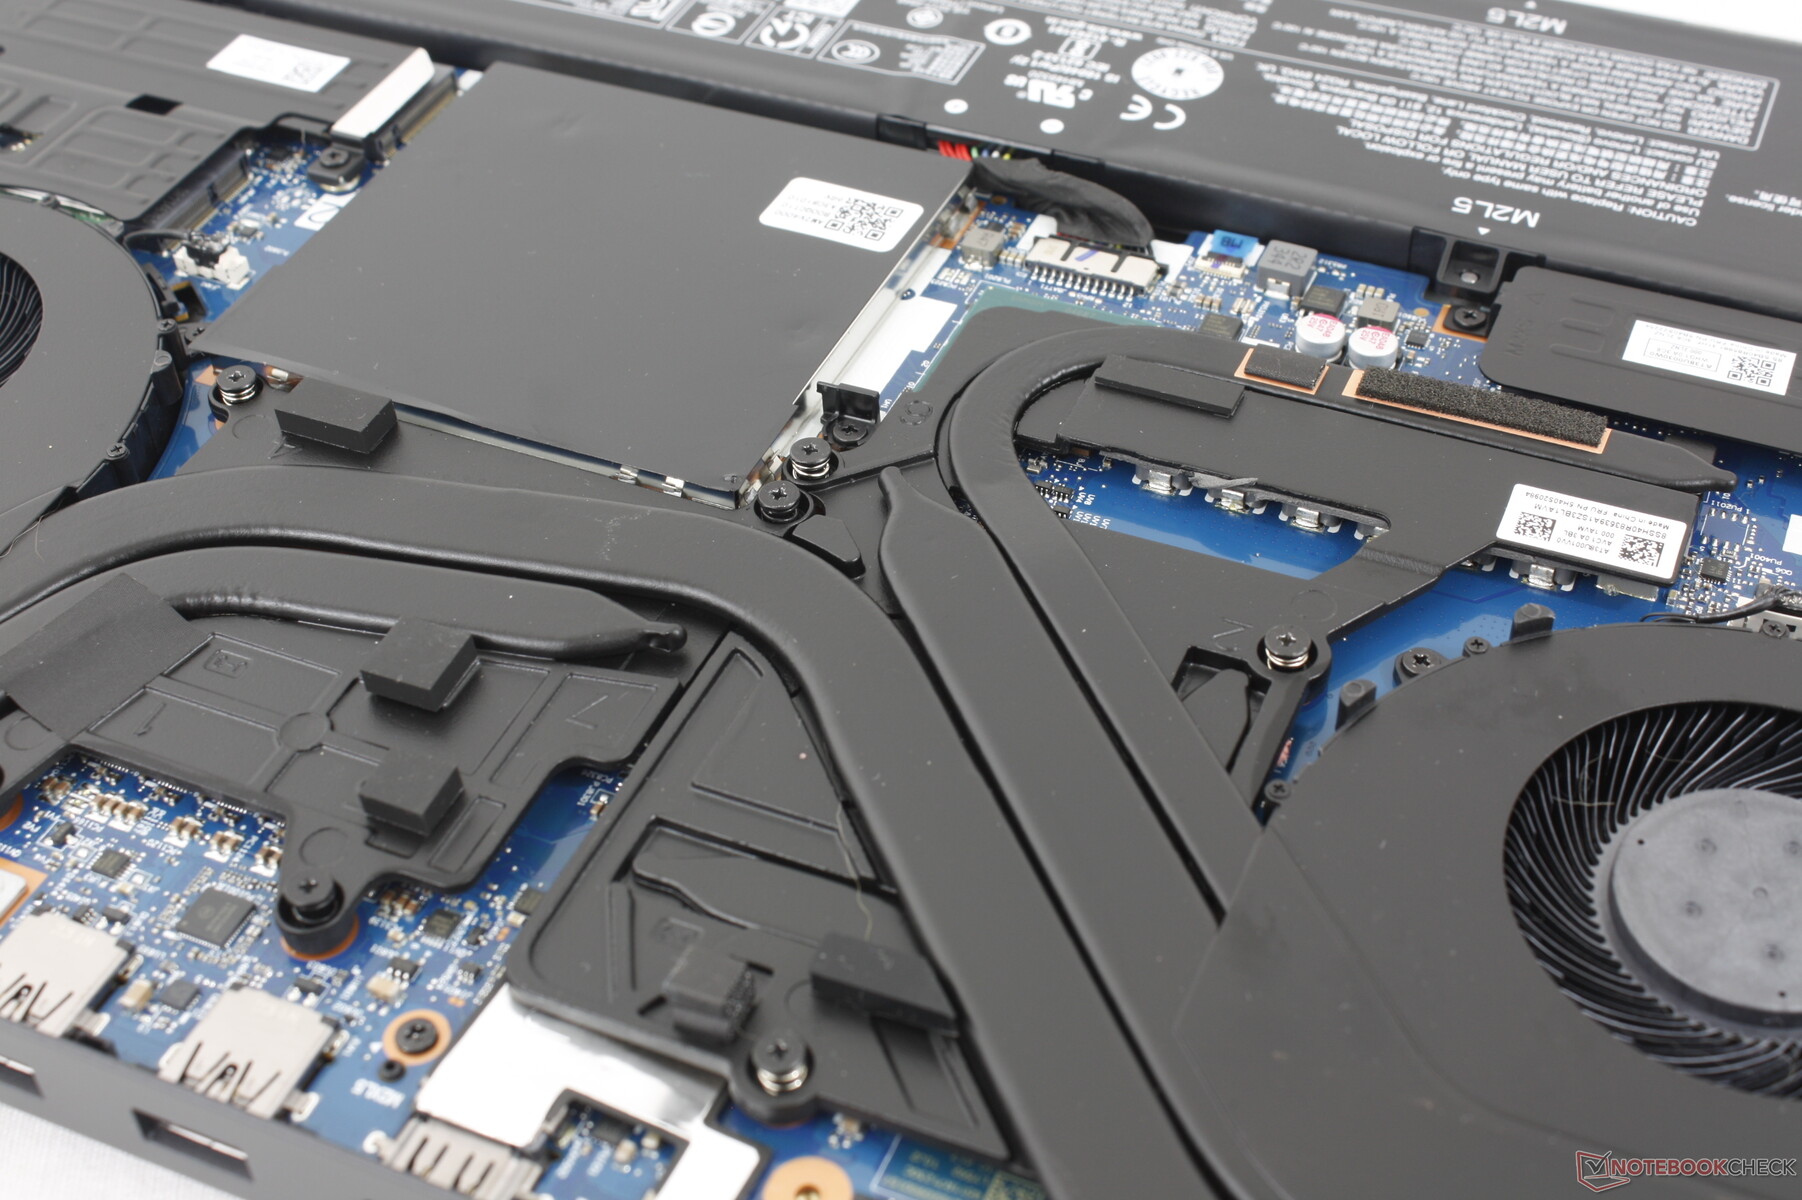
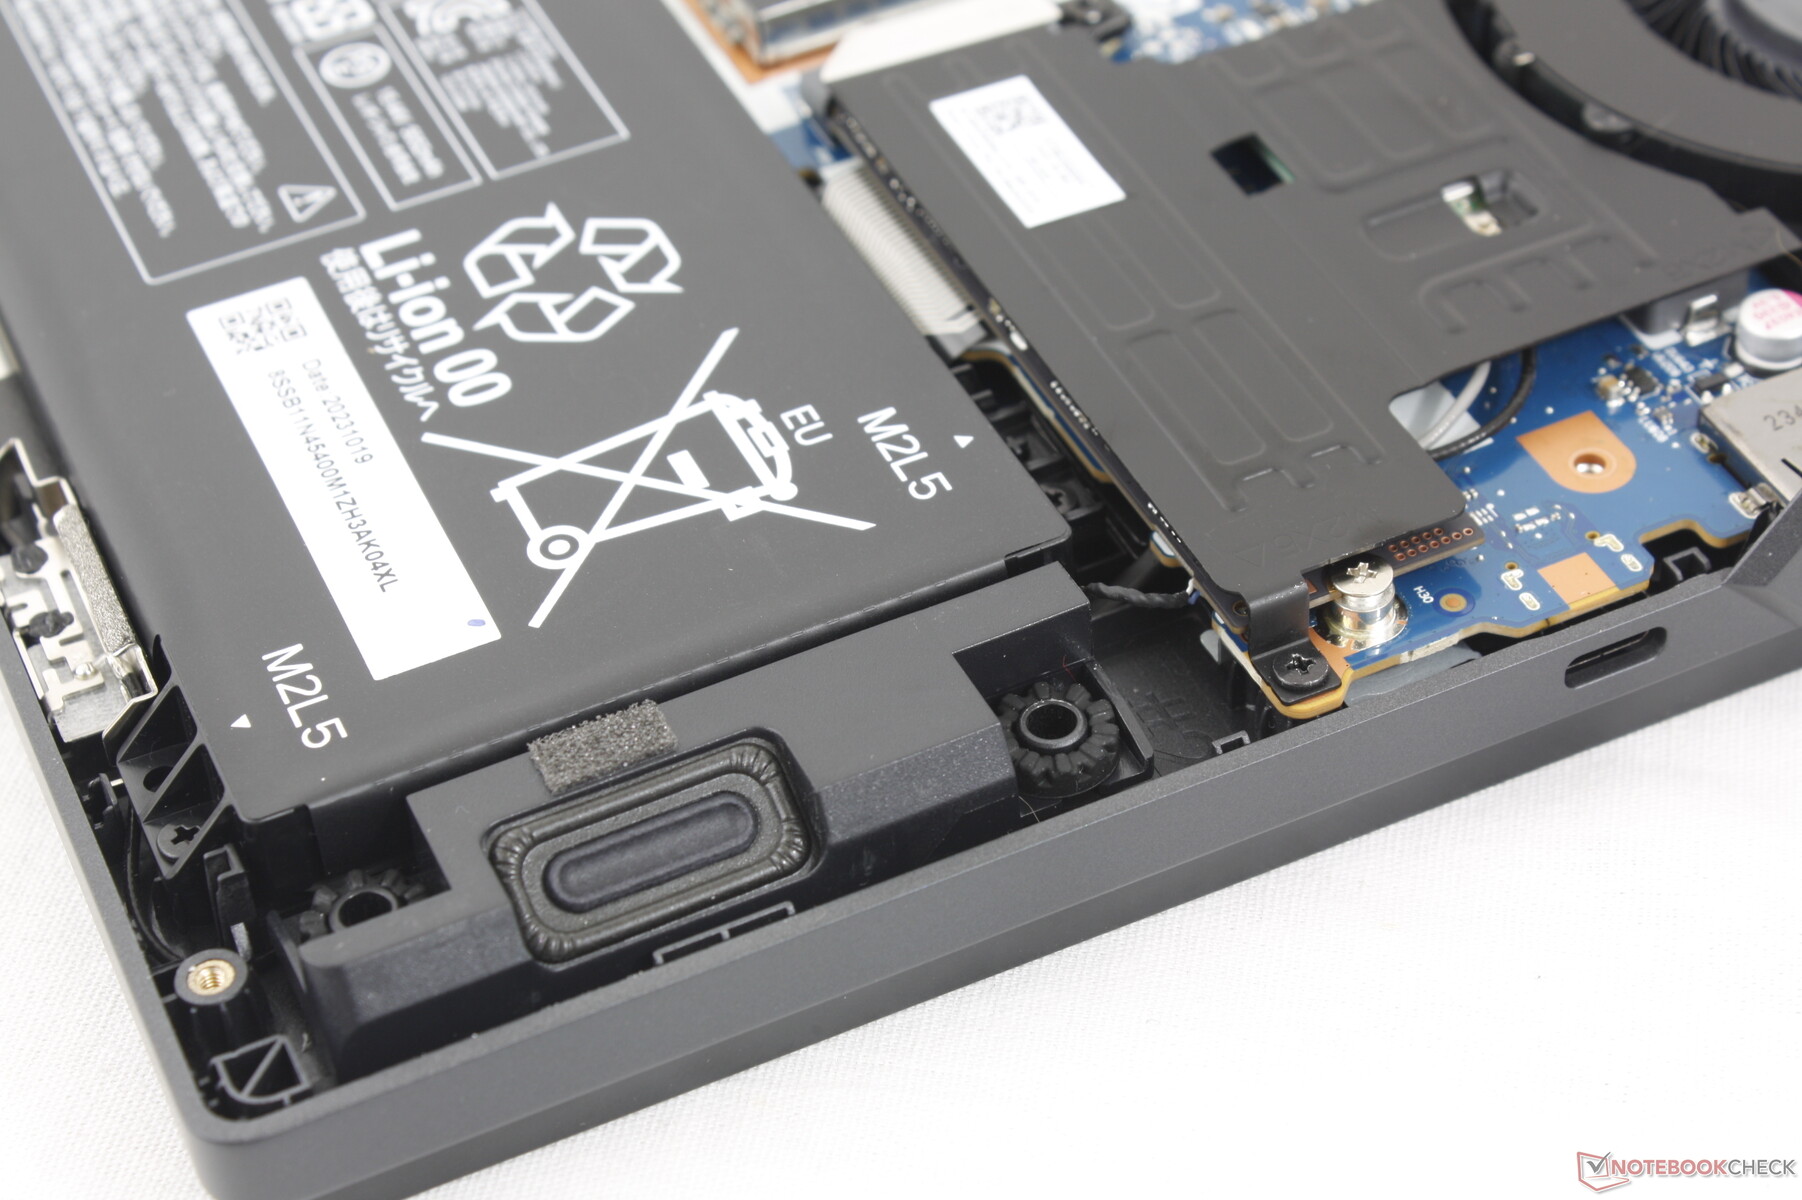
维护
与去年的设计相比,主板仅有细微变化。WLAN、内存和两个固态硬盘插槽被额外的铝板保护起来。有趣的是,与Legion 5 16 的设计相比,Legion Pro 5 16 使用了更少但更粗的铜导热管。
配件和保修
包装盒内除了交流适配器和文件外,没有其他附件。如果在美国购买,制造商通常提供一年有限保修。
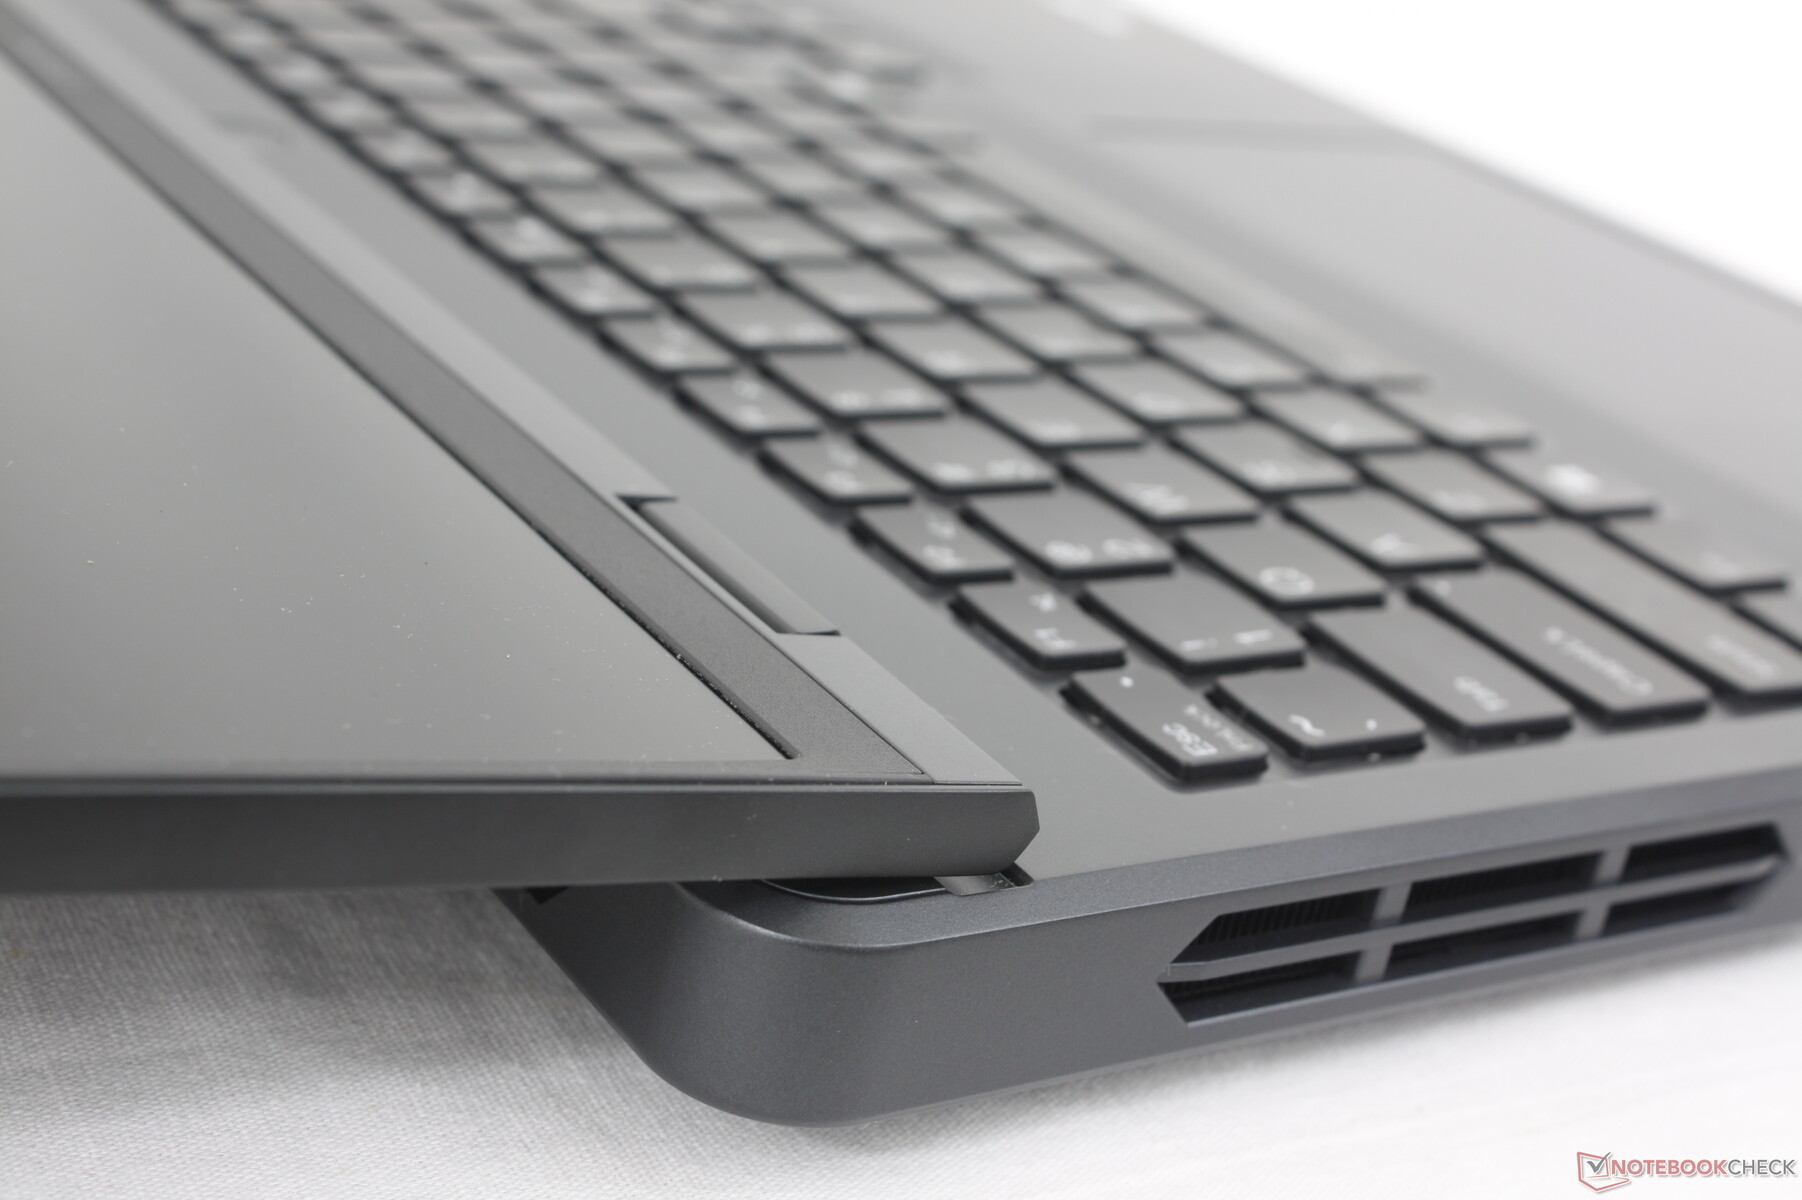
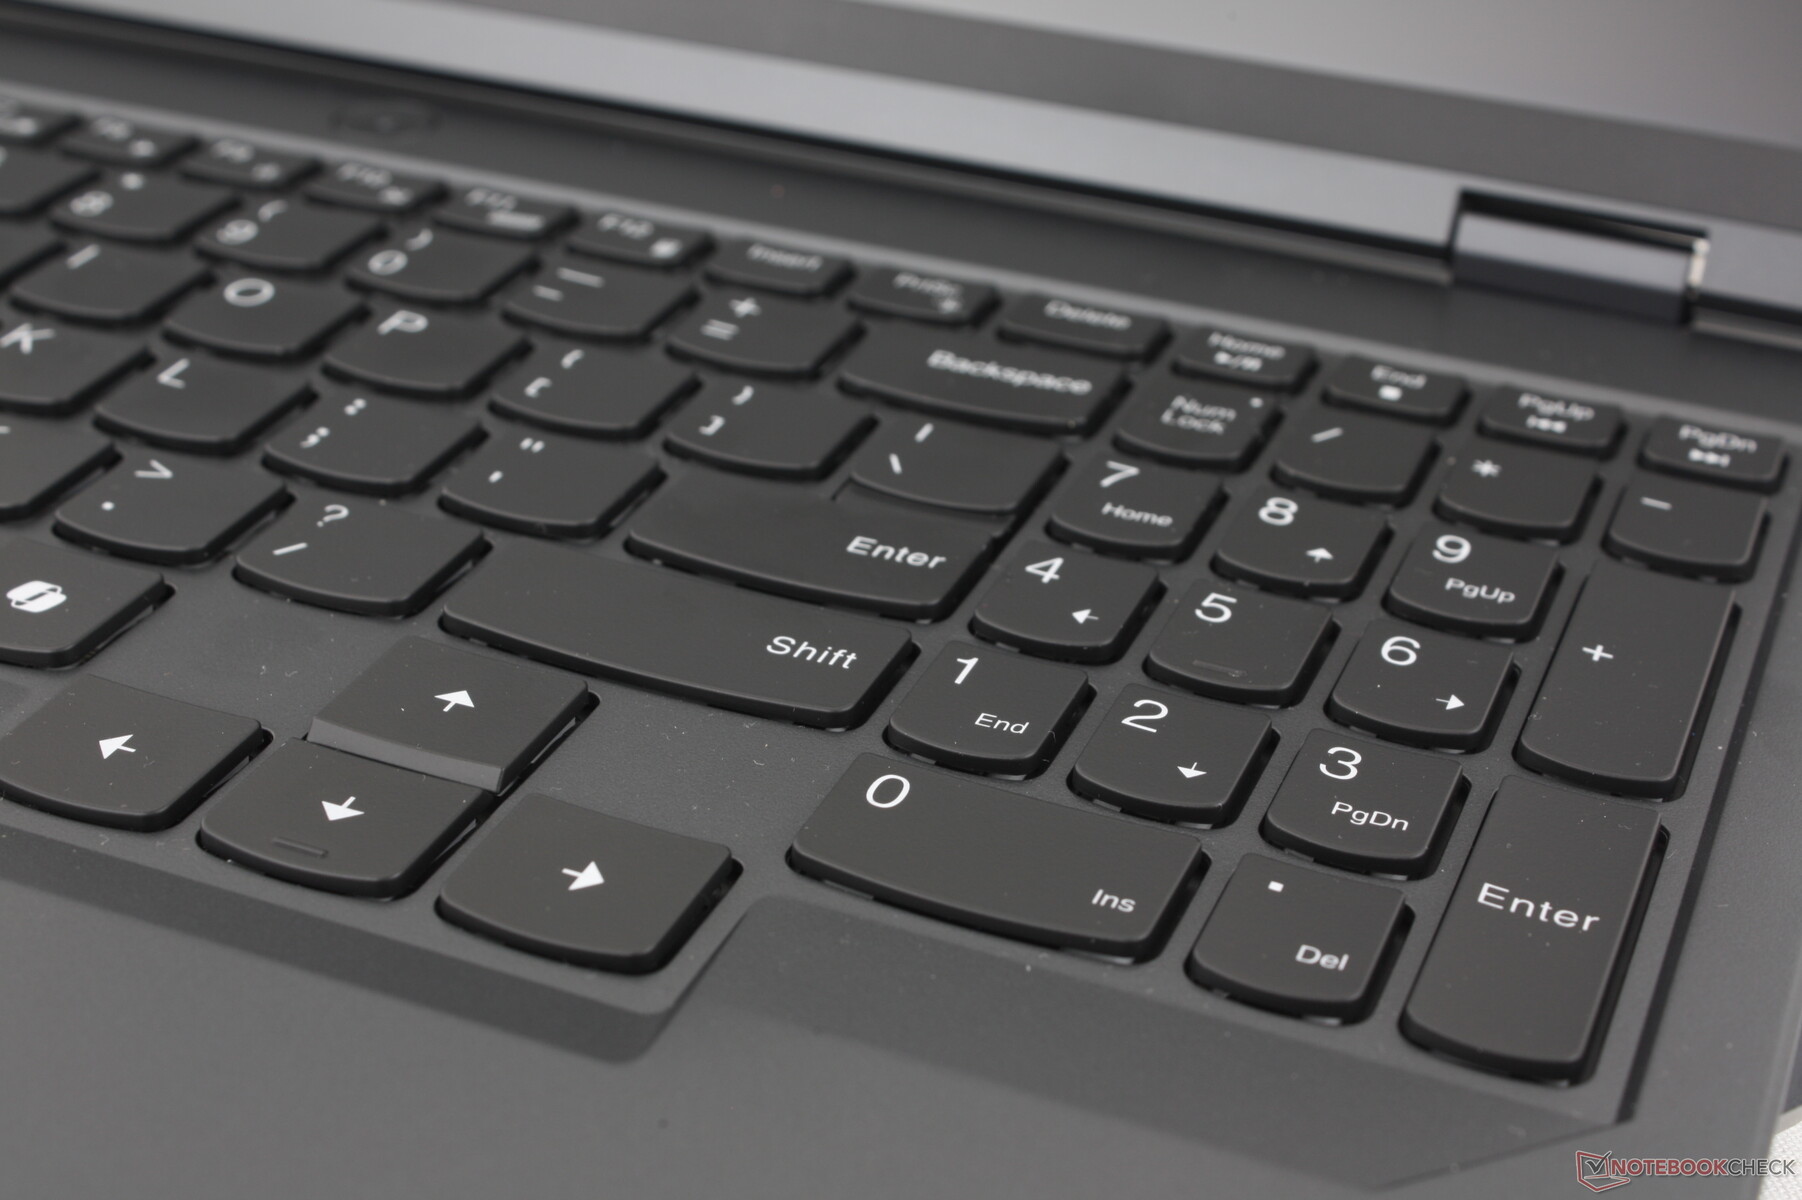
输入设备 - 熟悉的Legion 体验
键盘
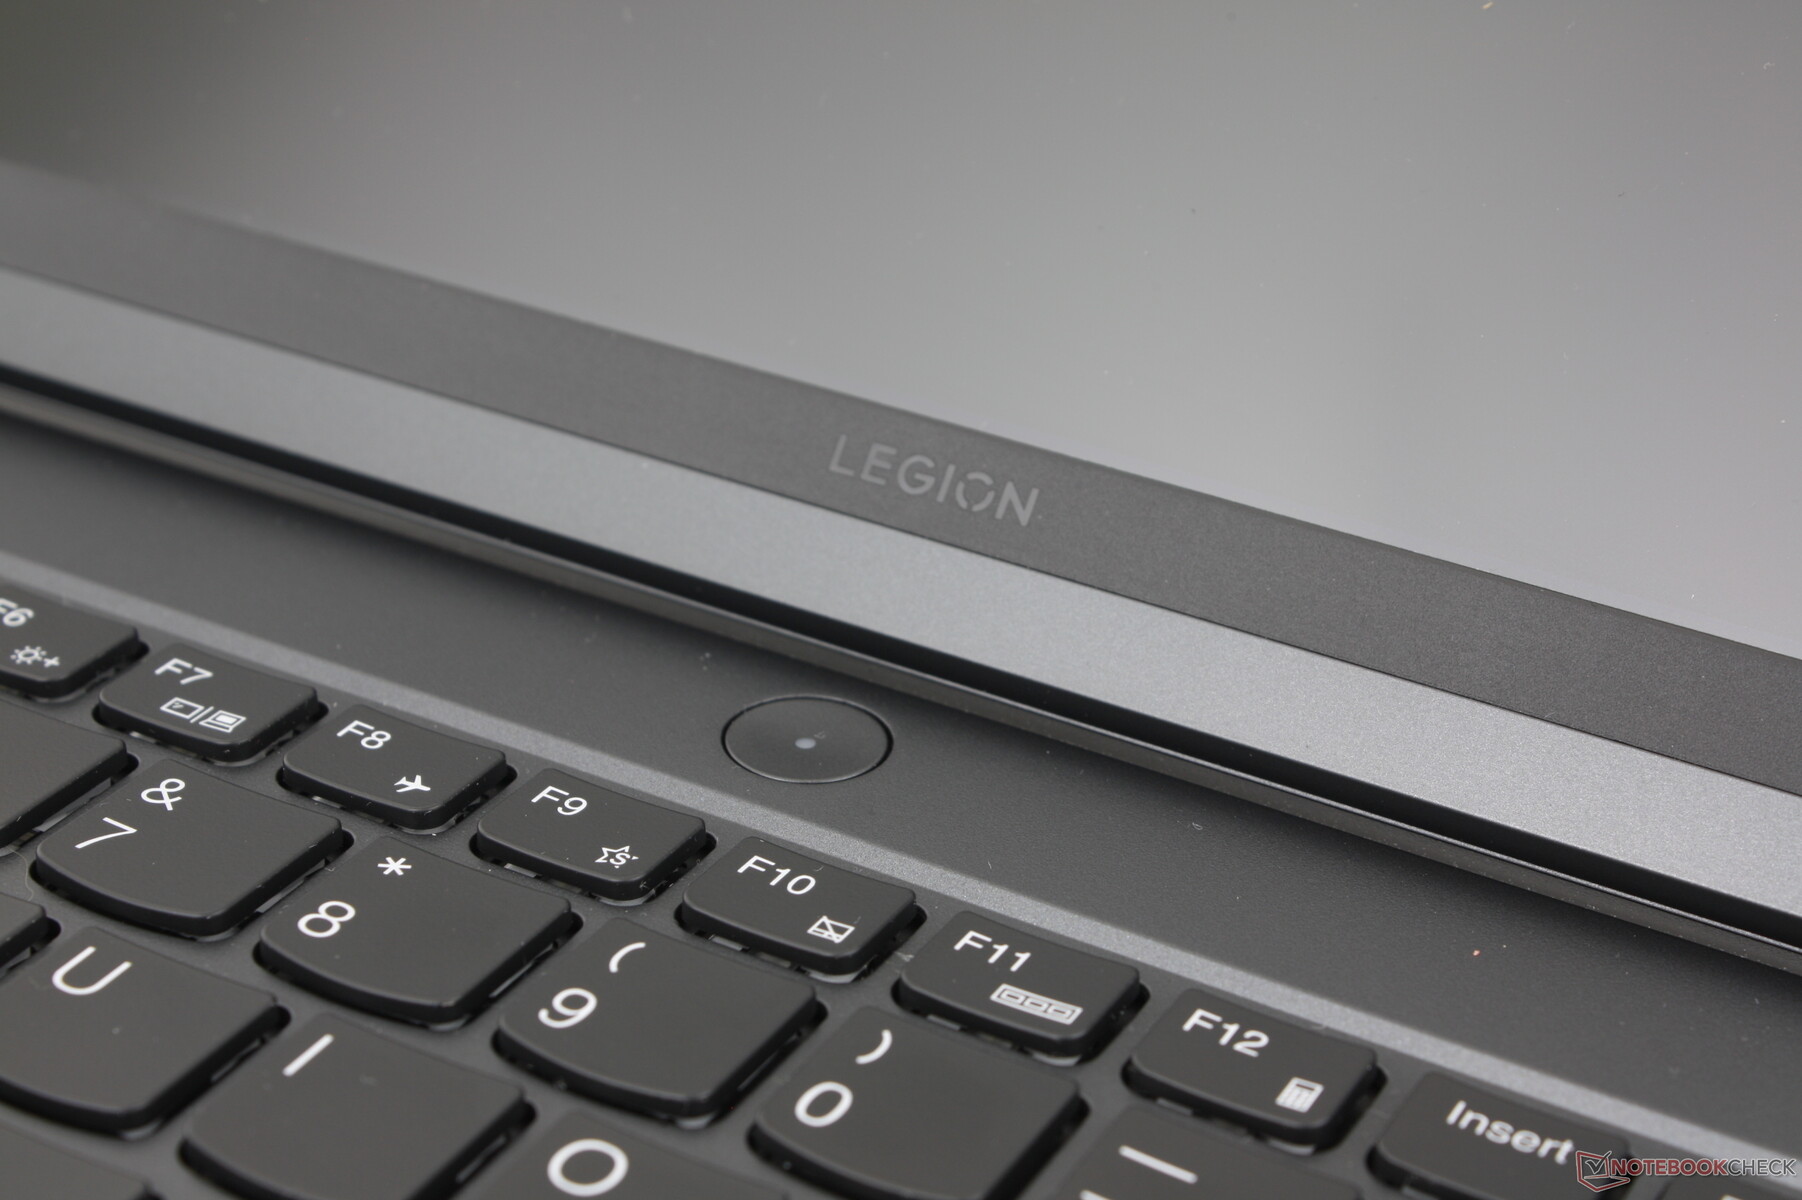
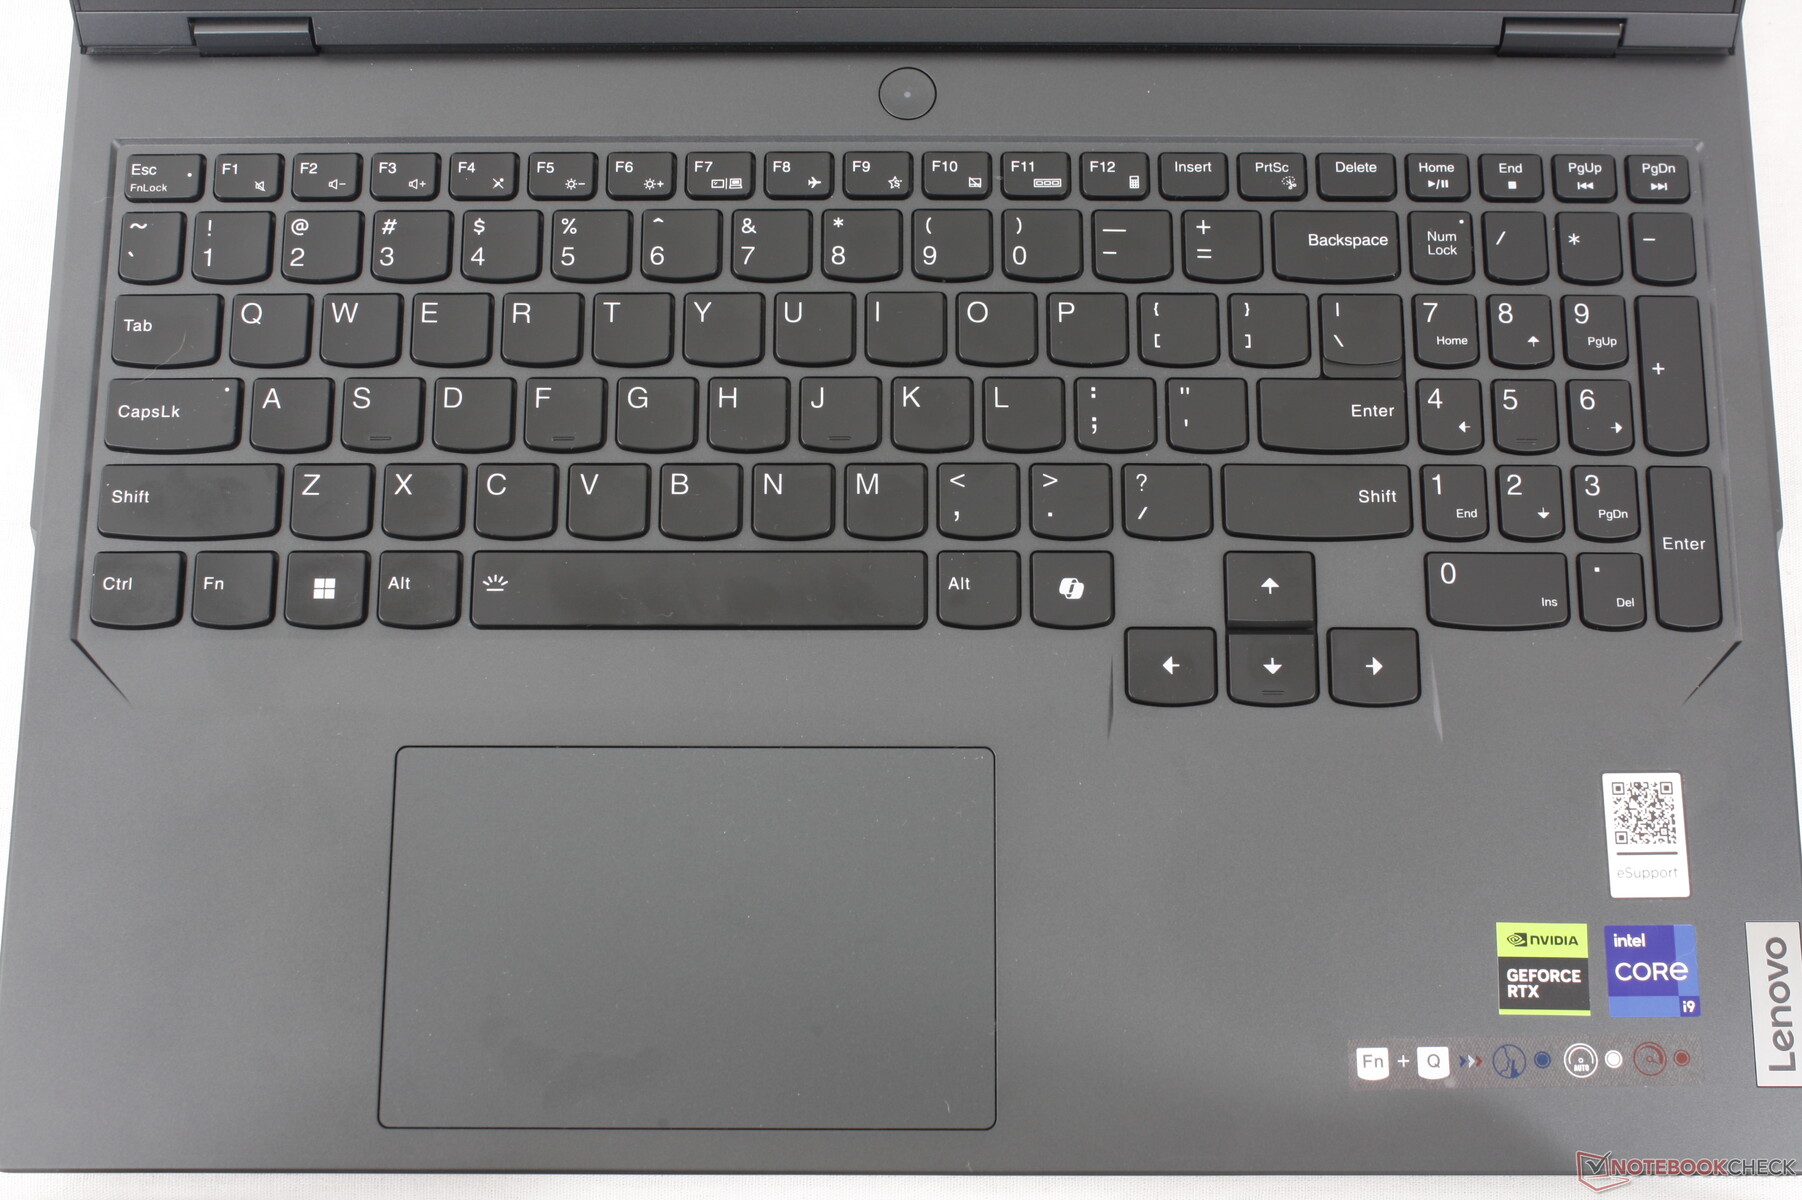
就像最近的 Yoga Slim 7 14 G9Legion Pro 5 16 G9 将第二个 Ctrl 键换成了专用的 Co-Pilot 键。预计微软将在今年推出围绕人工智能的 Windows 重要更新,因此新按键是联想为笔记本电脑面向未来的一种方式。
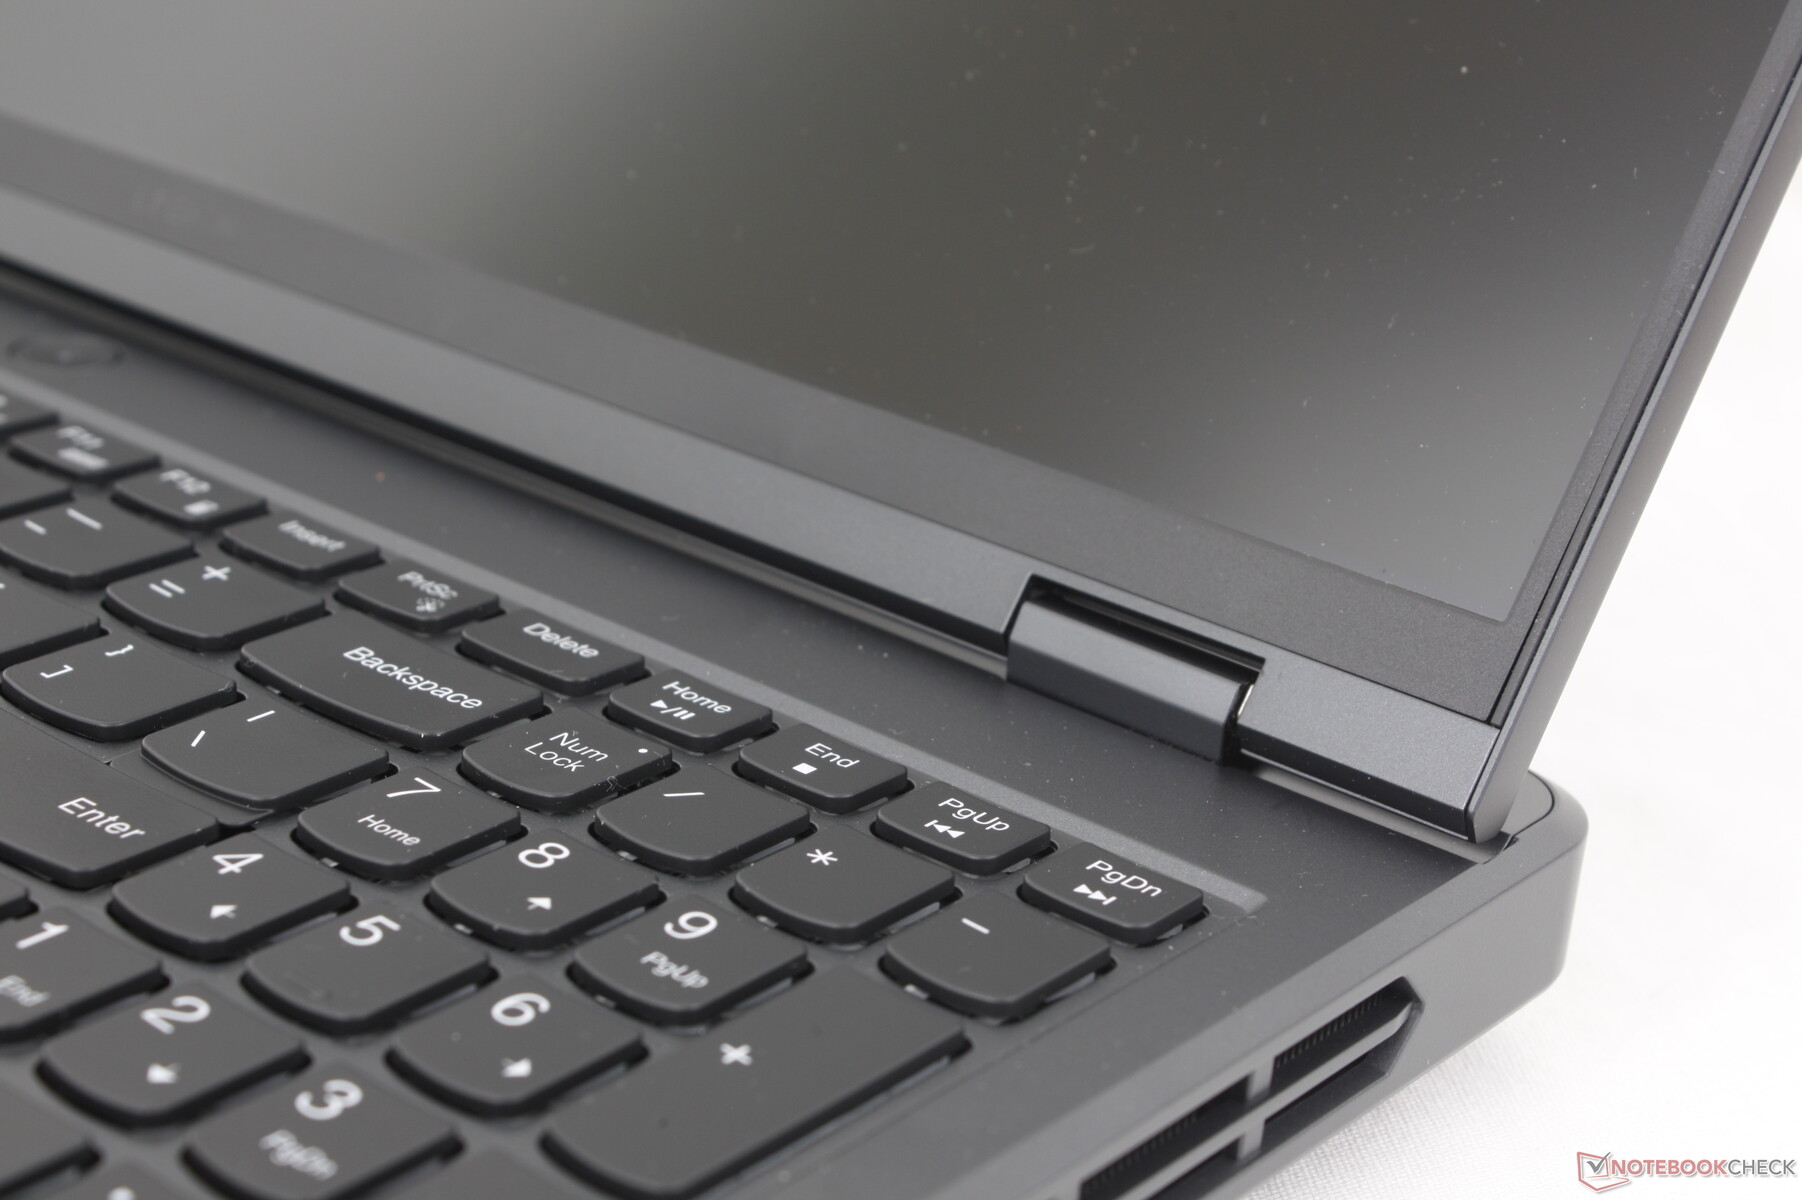
Legion Legion 机型仍然是为数不多的同时配备数字键盘和全尺寸方向键的游戏笔记本电脑之一。
键盘背光可配置为单区或四区 RGB。如果要按键使用 RGB 灯光,用户必须考虑价格更高的Legion Pro 7 系列。
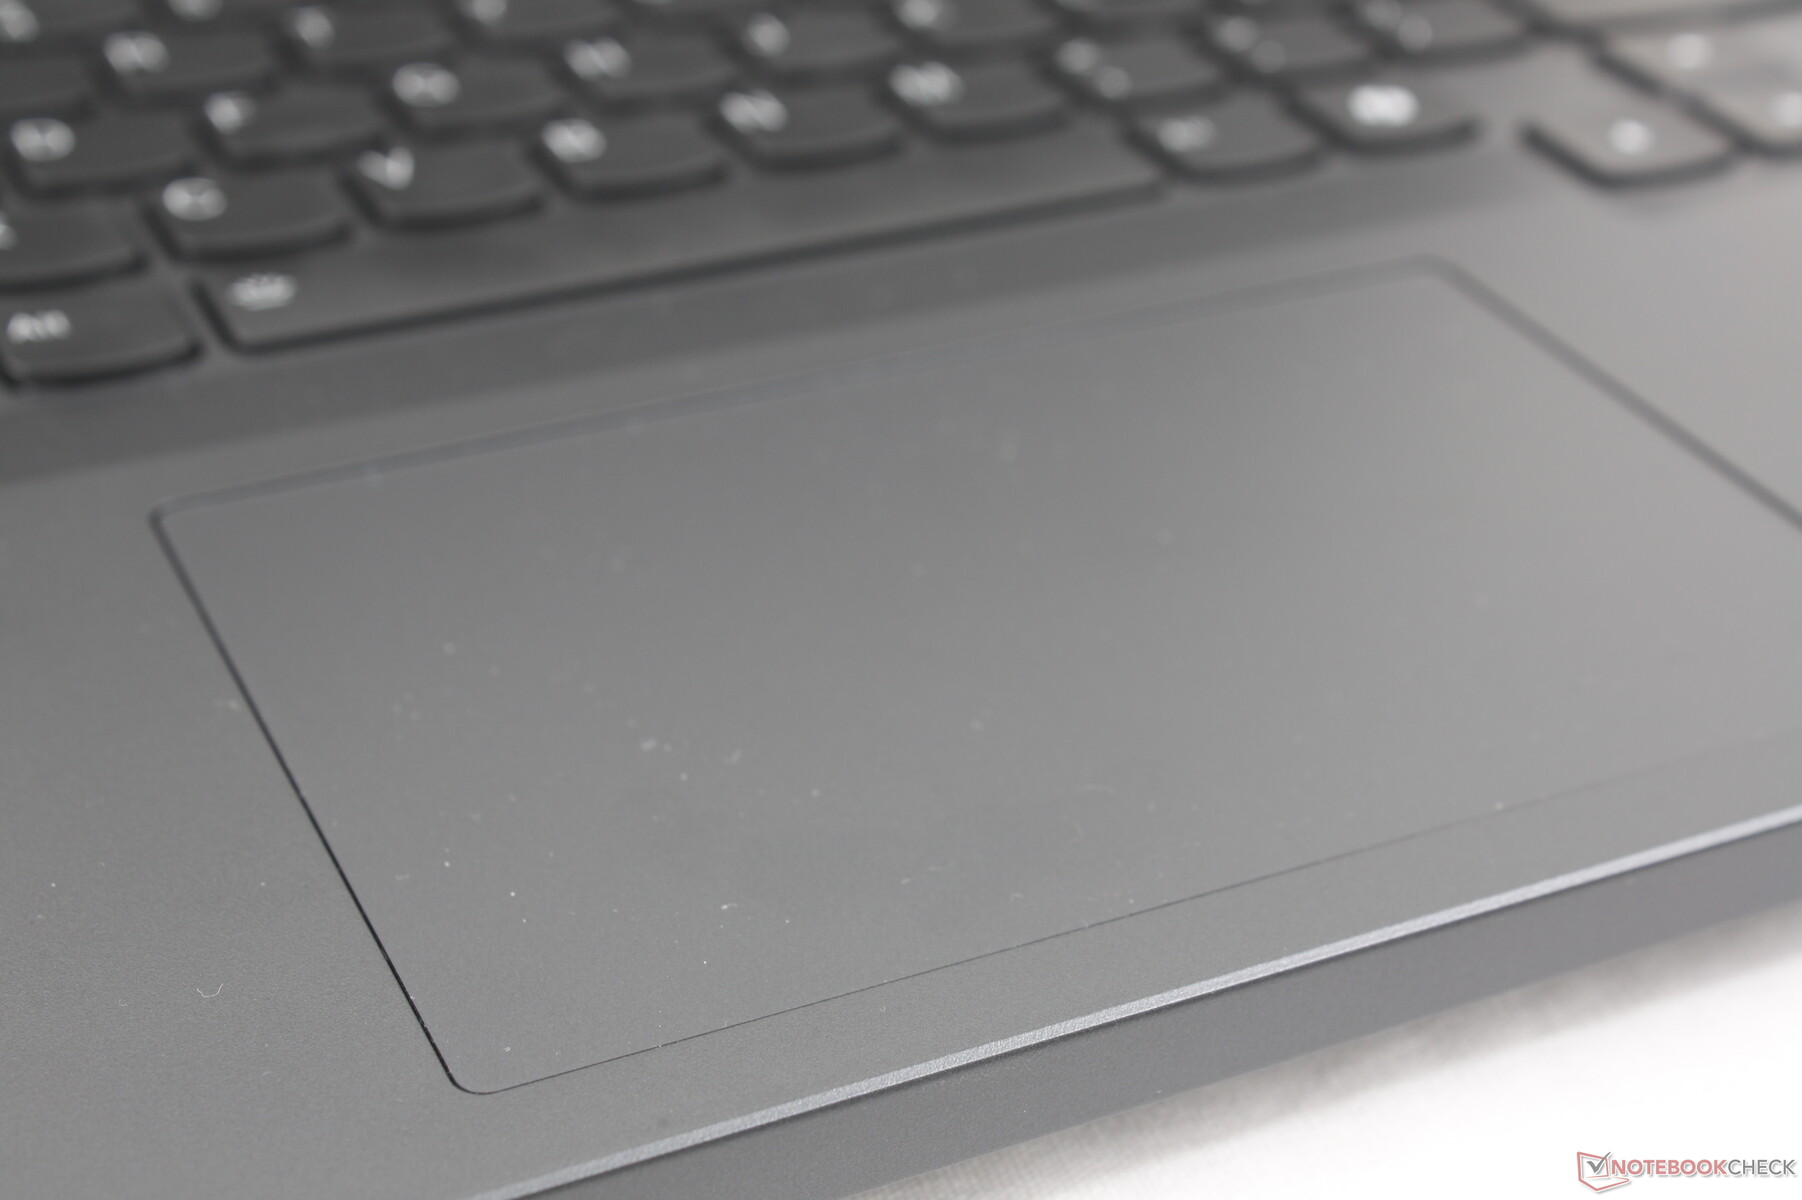
触摸板
Mylar 点击板的尺寸比 雷蛇刀锋 16 (12 x 7.5 厘米对 17 x 9.7 厘米),但对于浏览等简单任务而言,它仍然足够宽敞。点击仍然较浅,反馈不够,有一种令人不满意的海绵感。

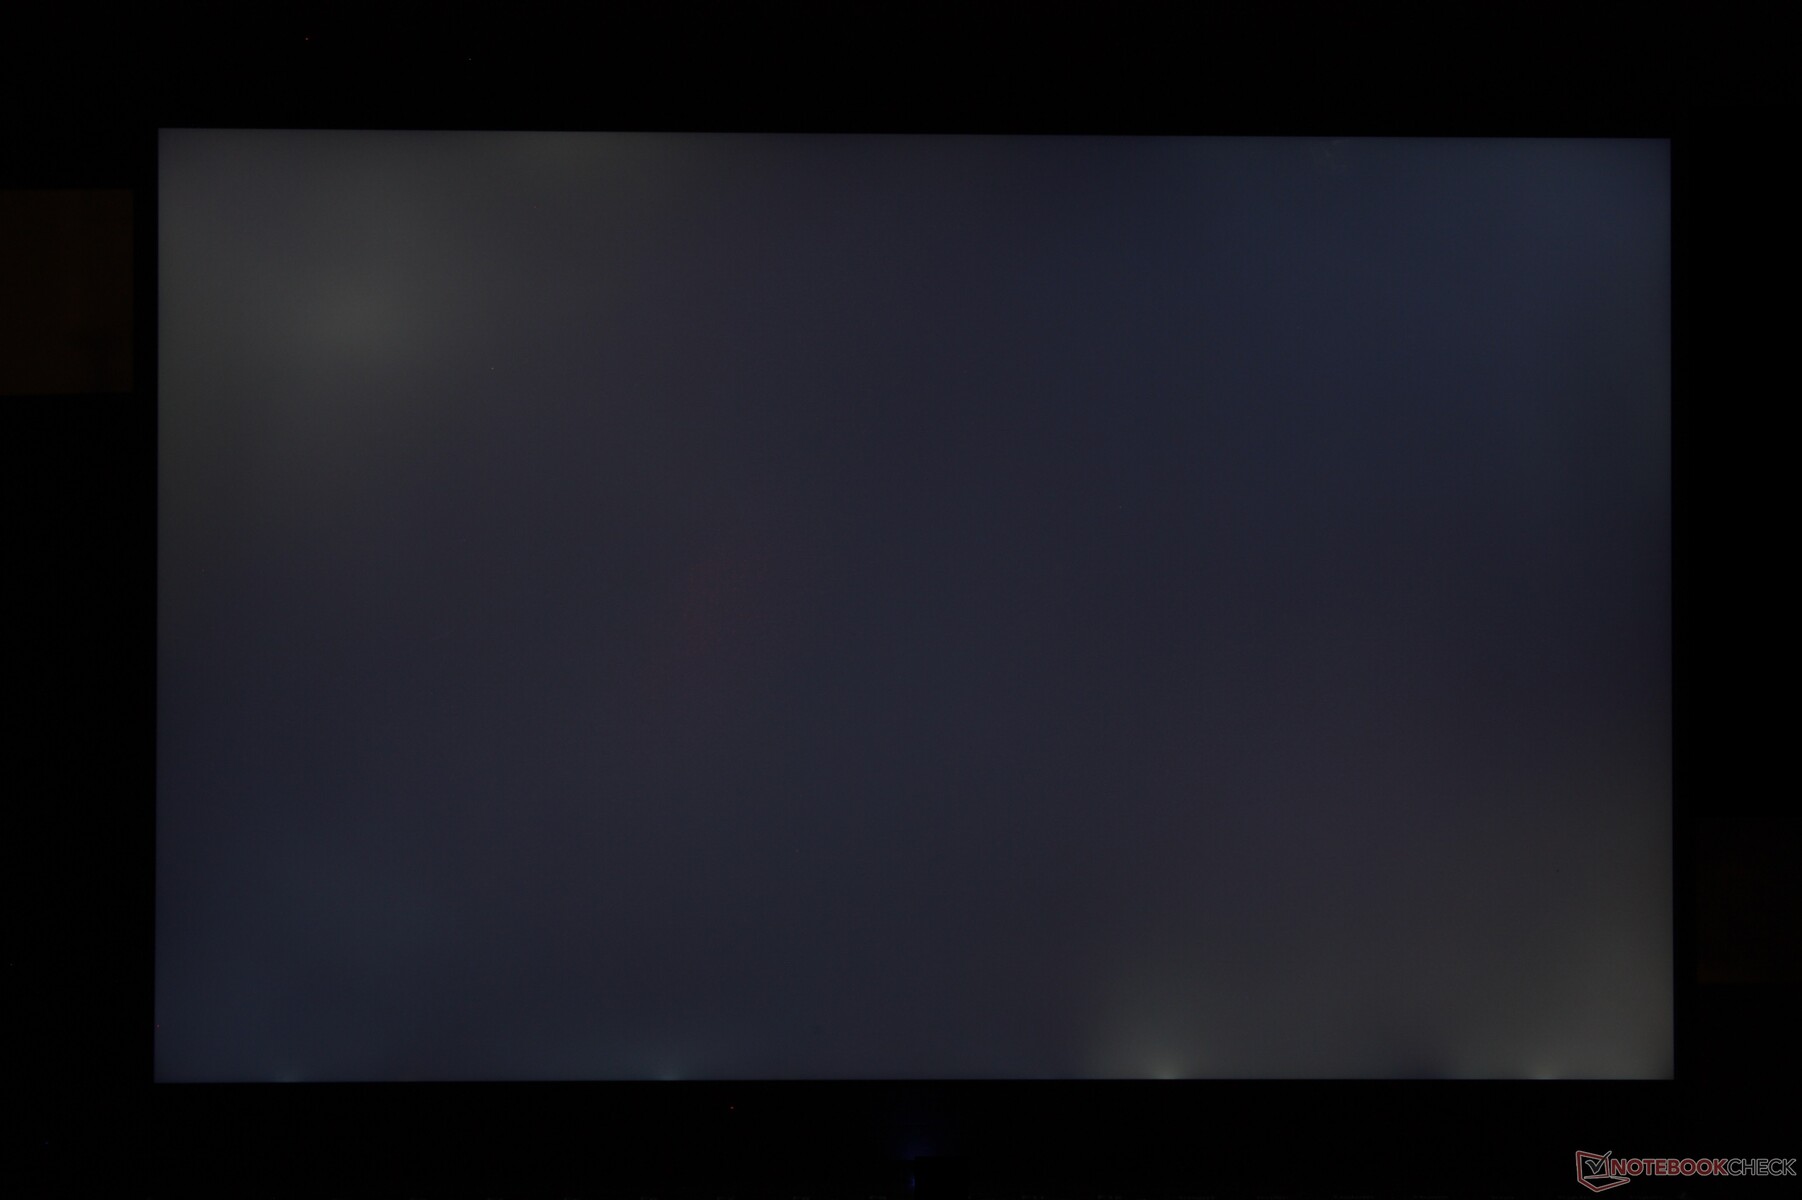
显示屏 - 标配全 sRGB 和快速刷新功能
现在有三种显示屏可供选择,而去年的机型只有两种。所有显示屏均为哑光 IPS,支持高级 Optimus,但只有两款支持 HDR。我们的测试机配备了下面突出显示的面板。
- 2560 x 1600,300 尼特,100% sRGB,165 赫兹
- 2560 x 1600,500 尼特,100% DCI-P3,240 赫兹,HDR400
- 2560 x 1600、500 尼特、100% sRGB、240 赫兹、HDR400
有趣的是,我们的测试设备使用的是京东方 NE160QDM-NYC 显示器,而去年的型号使用的是友达光电 B160QAN03.1。这两款产品均提供相同的 165 Hz 刷新率、快速黑白响应时间和全 sRGB 色彩,可带来相似的观看体验。虽然对于游戏和休闲编辑来说,它仍然是一款出色的面板,但它不支持 Windows 可变刷新率,而这是其他一些笔记本电脑(如Framework Laptop 16 )的新功能。此外,IPS 面板的 HDR 不如 OLED 或 mini-LED 的 HDR 那样令人印象深刻,因为它们的黑阶更深、白阶更亮。用户需要升级到价格更高的Legion Pro 9 系列 ,才能获得此类高端显示功能。


| |||||||||||||||||||||||||
Brightness Distribution: 91 %
Center on Battery: 384 cd/m²
Contrast: 1097:1 (Black: 0.35 cd/m²)
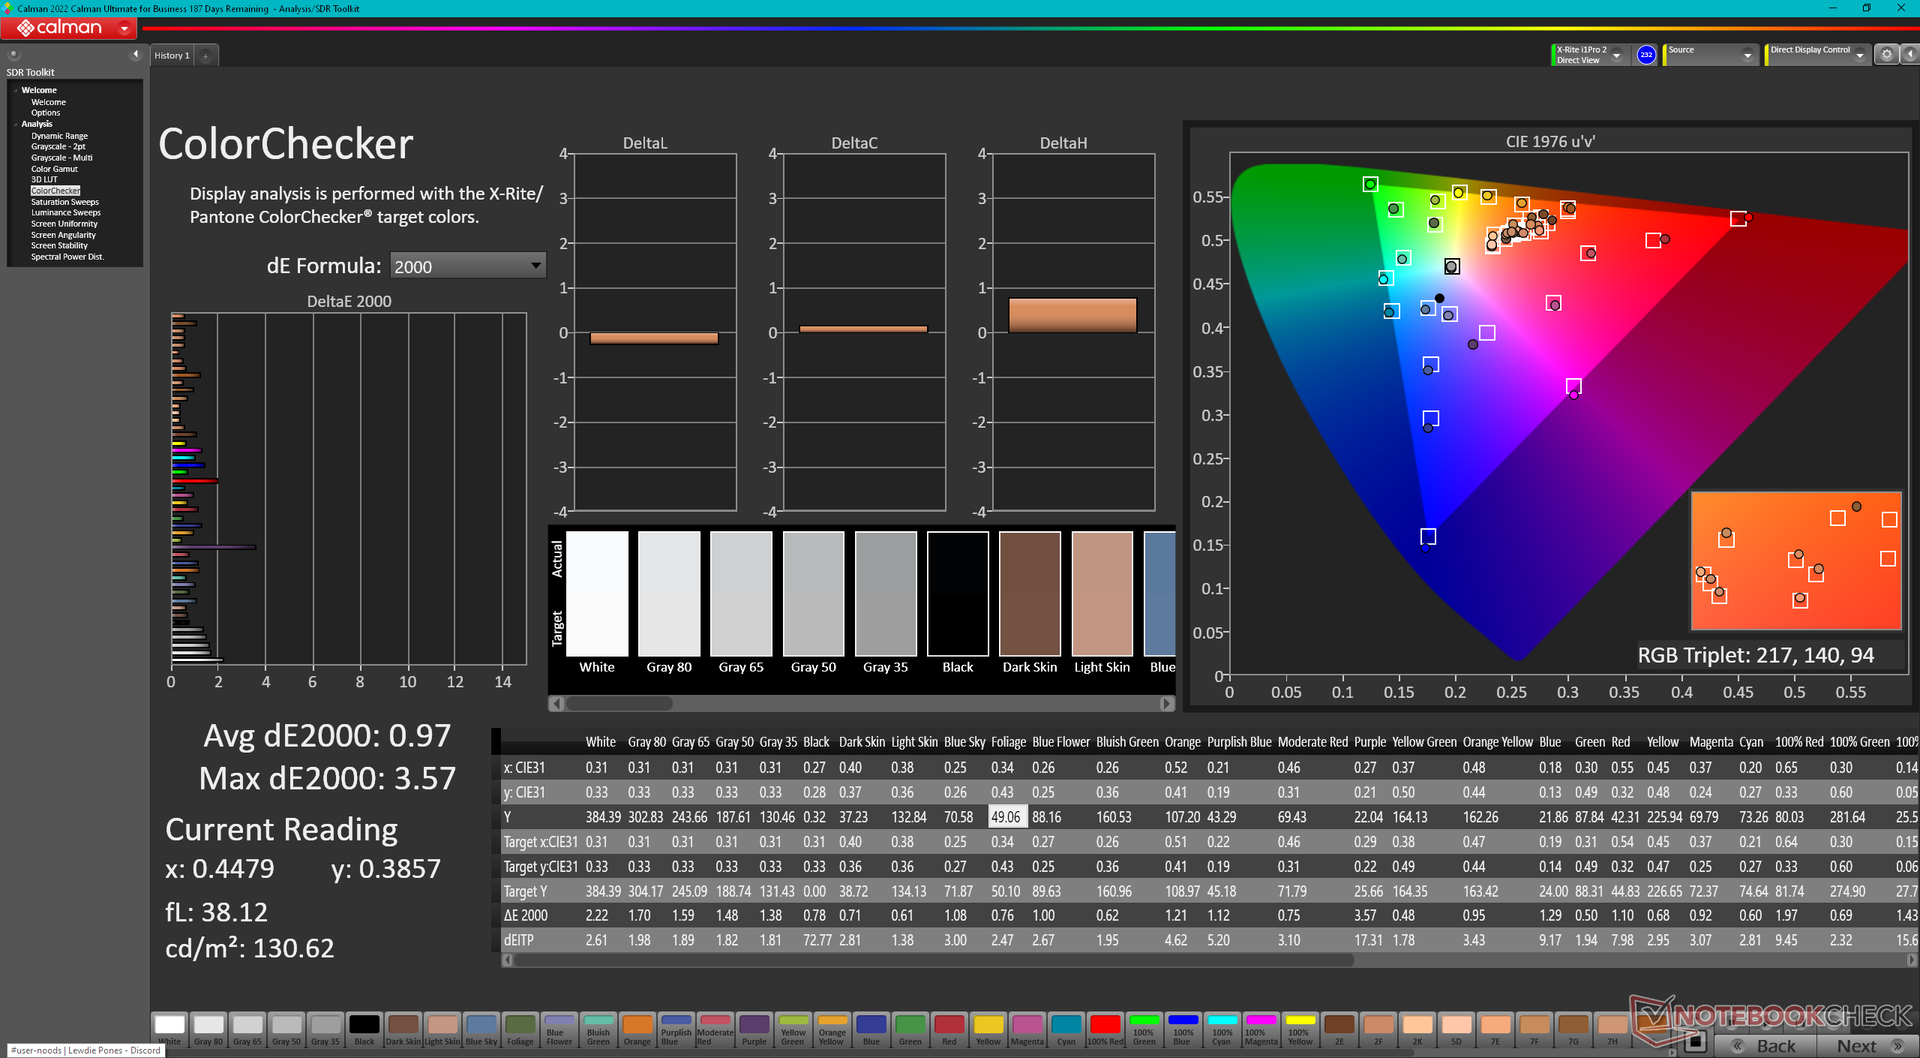
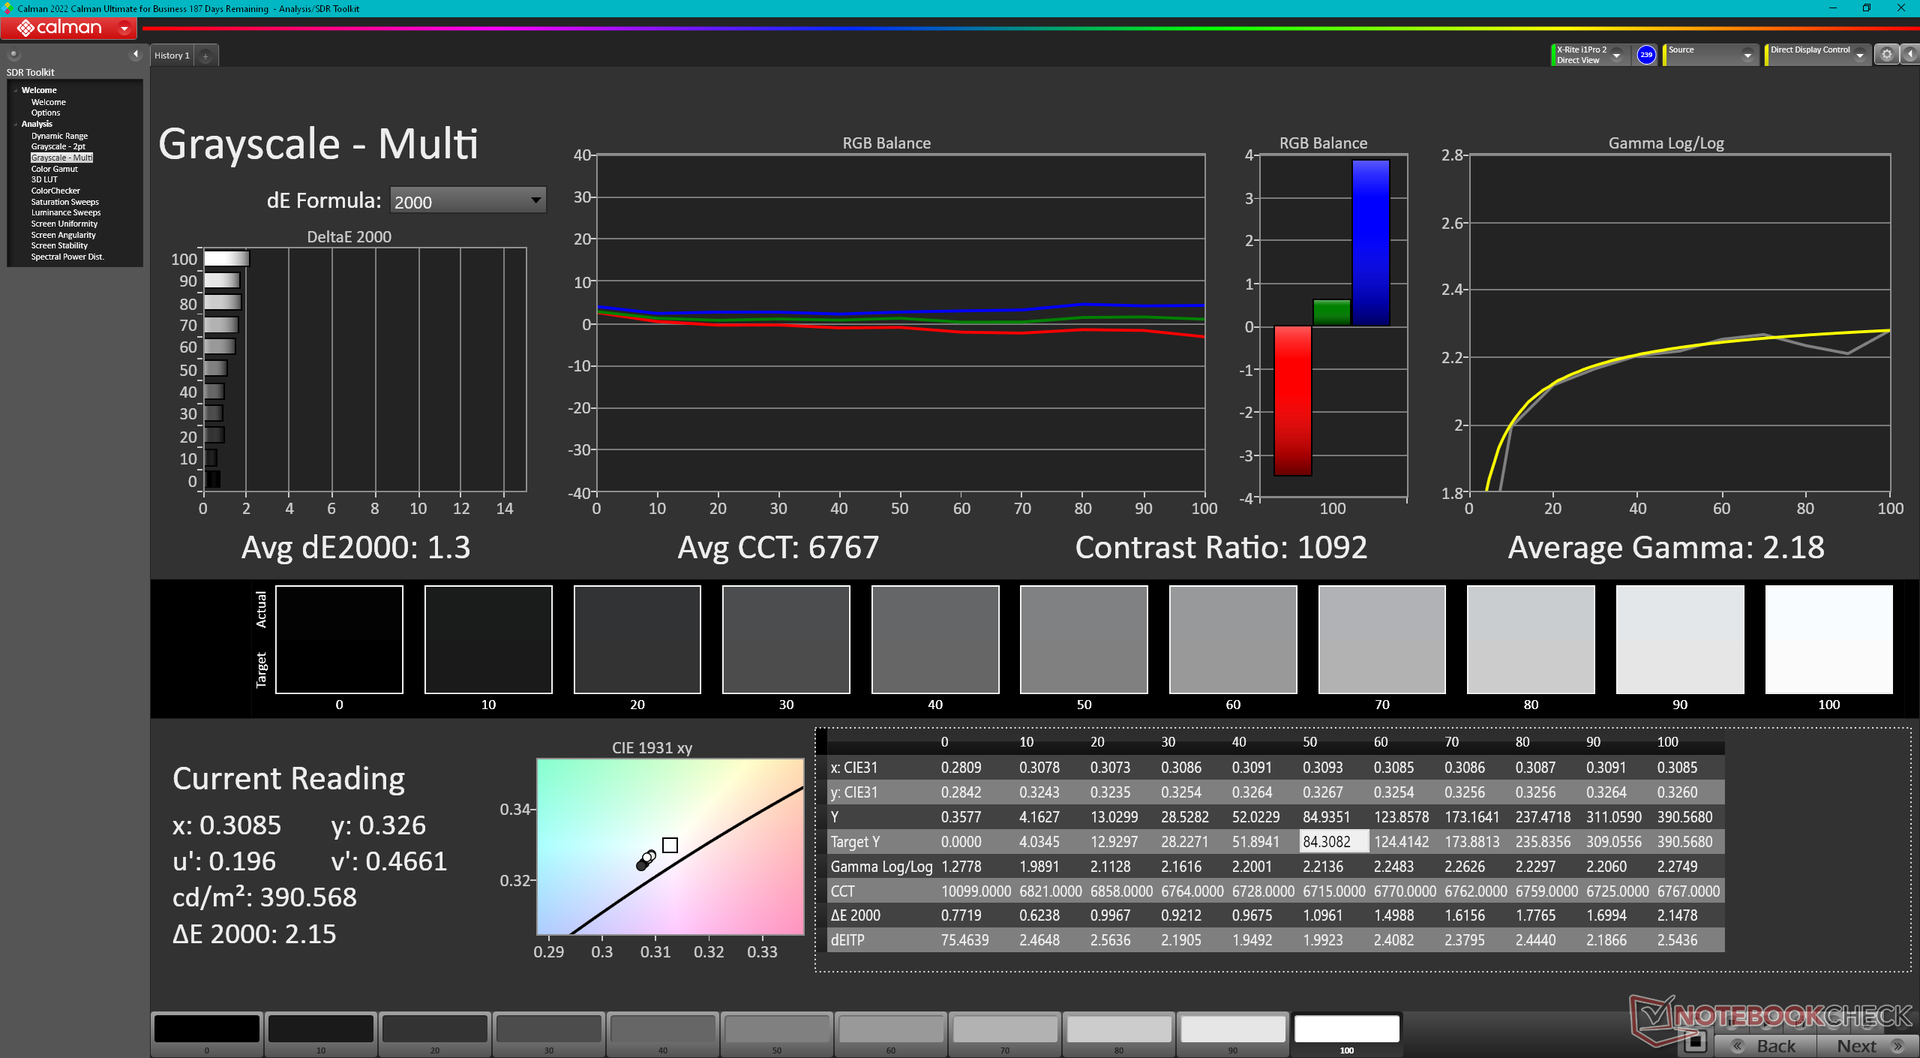
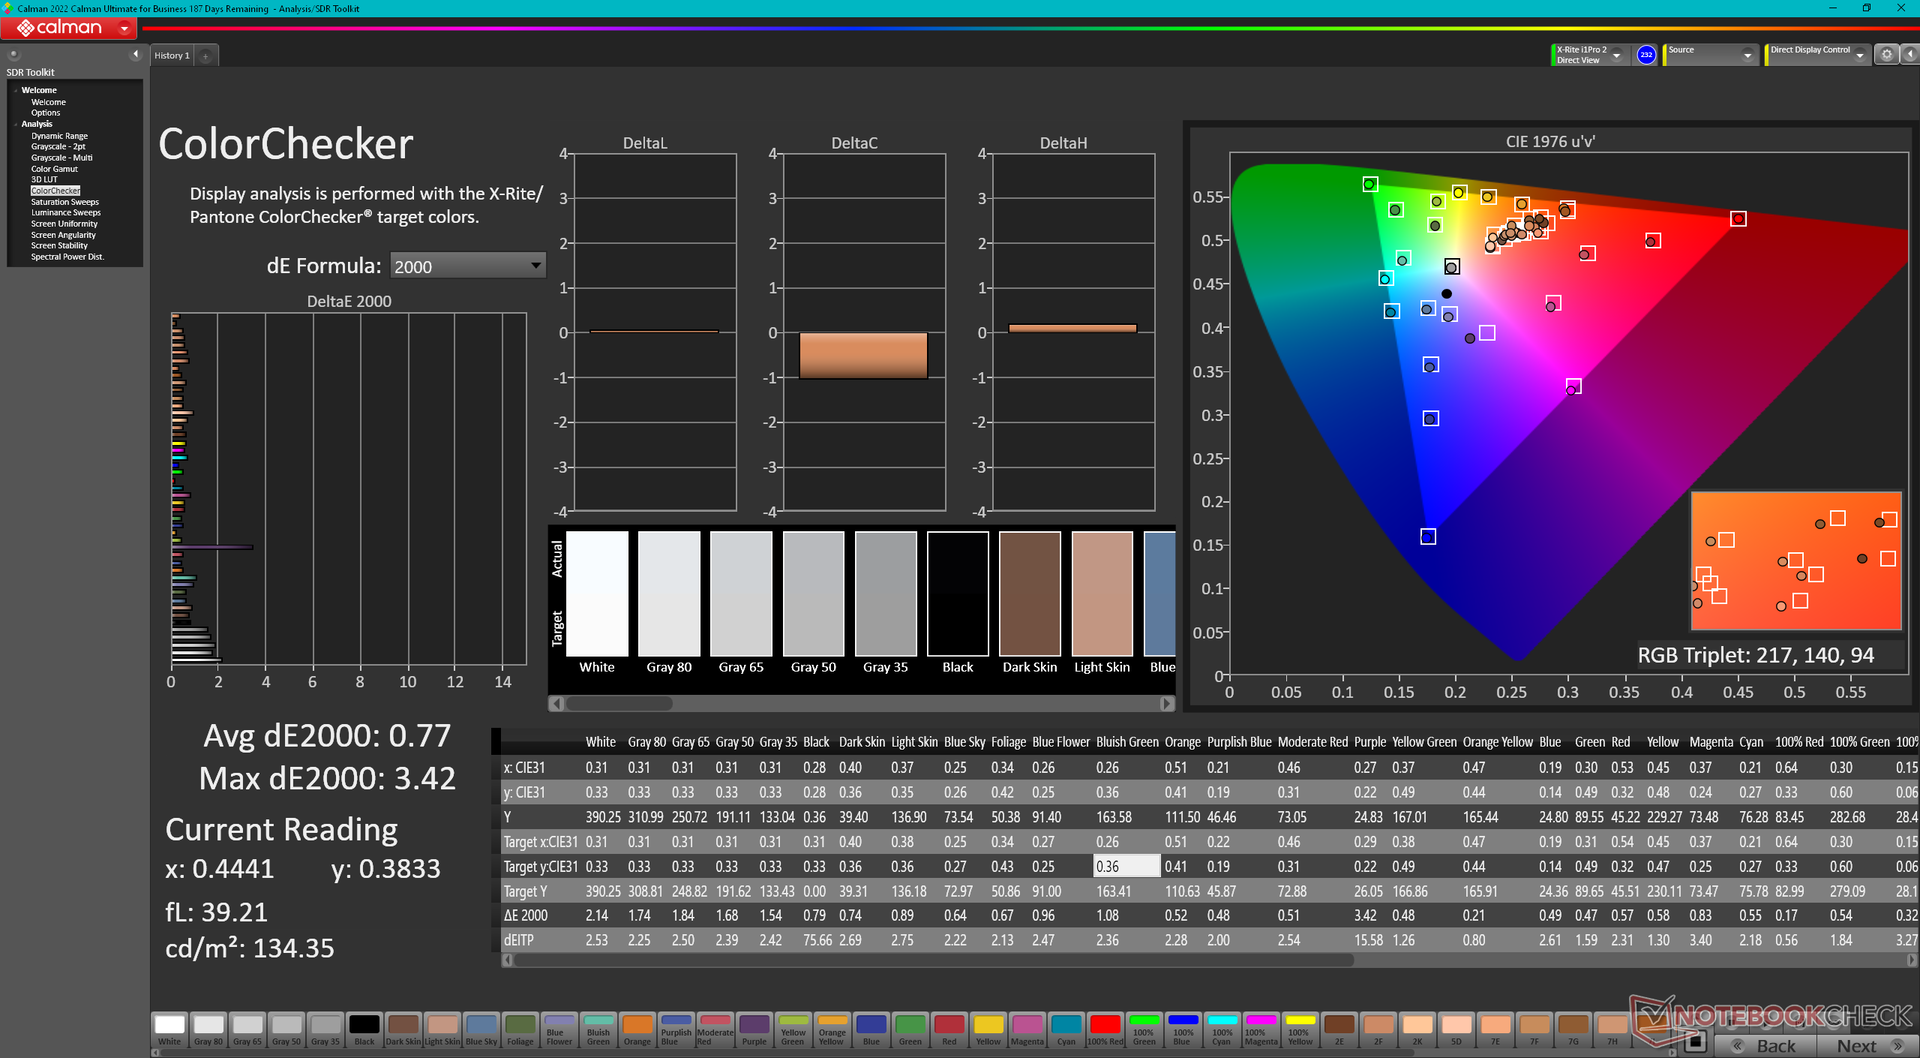
ΔE ColorChecker Calman: 0.97 | ∀{0.5-29.43 Ø4.71}
calibrated: 0.77
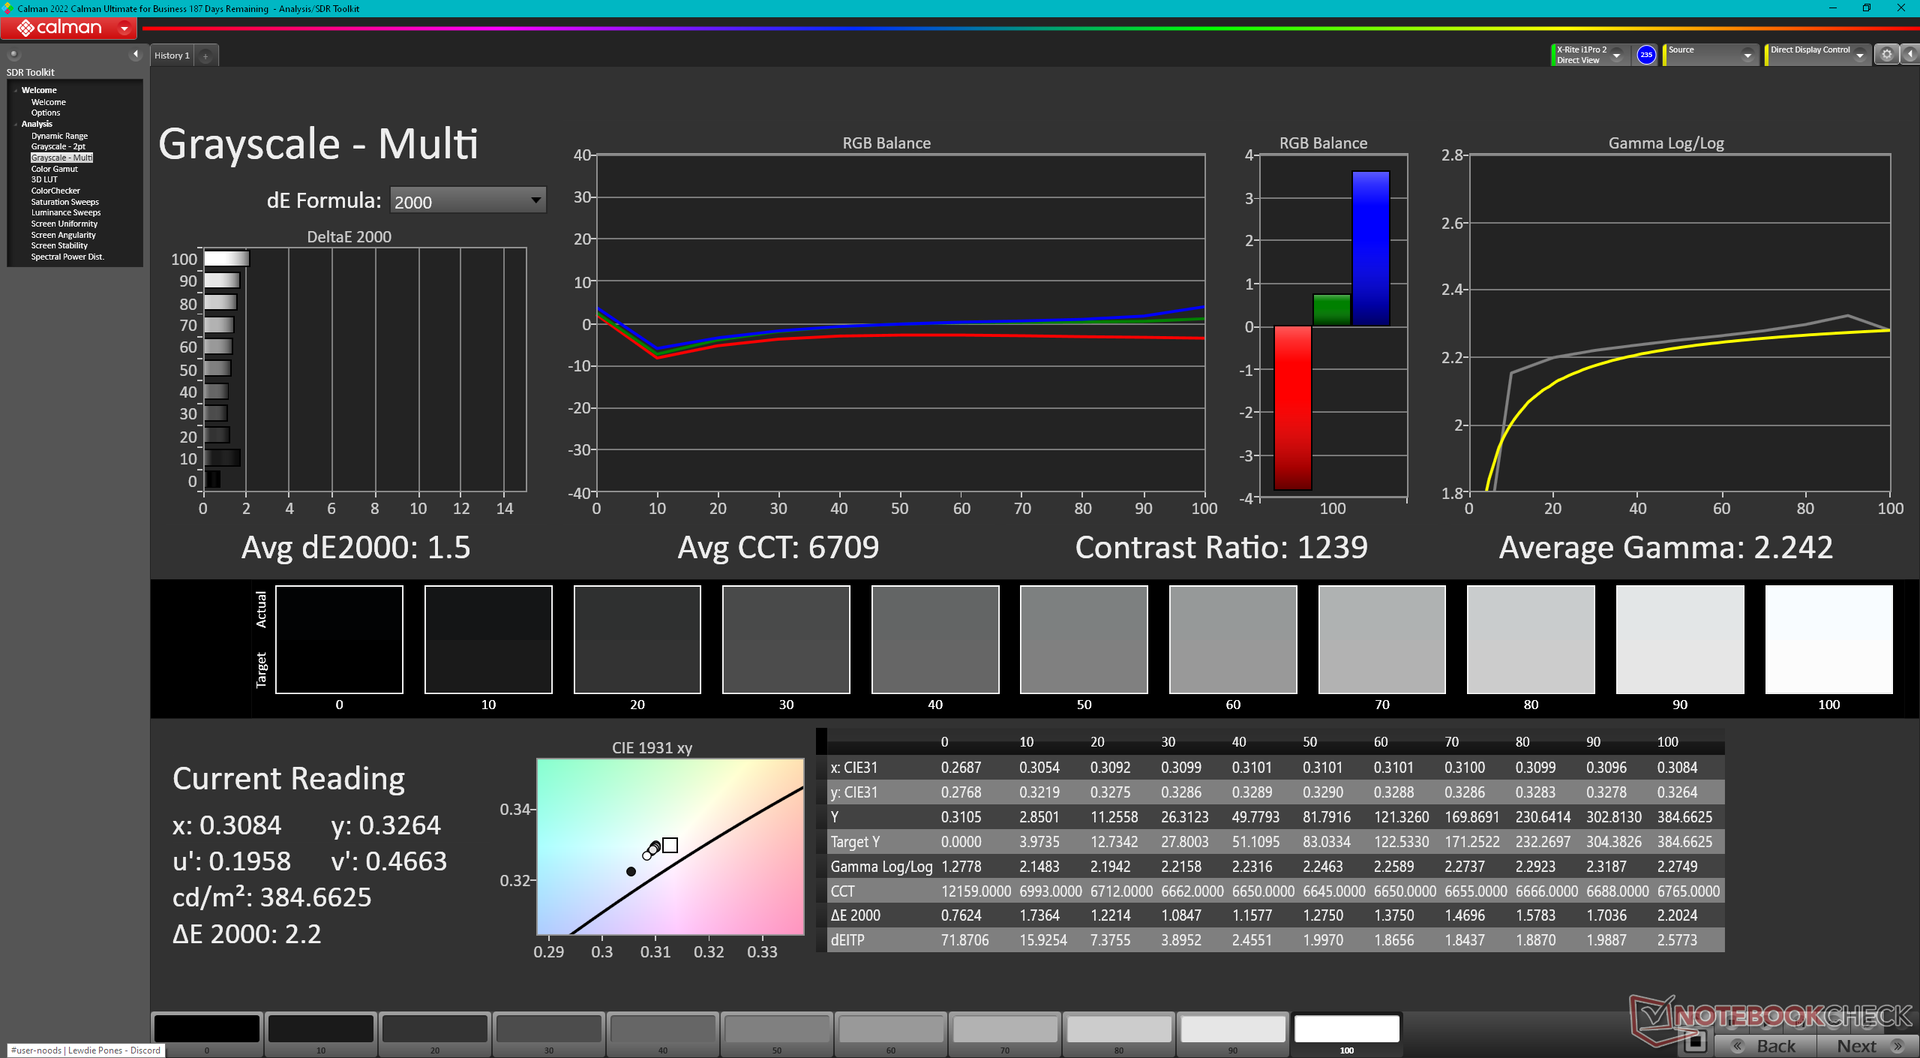
ΔE Greyscale Calman: 1.5 | ∀{0.09-98 Ø4.96}
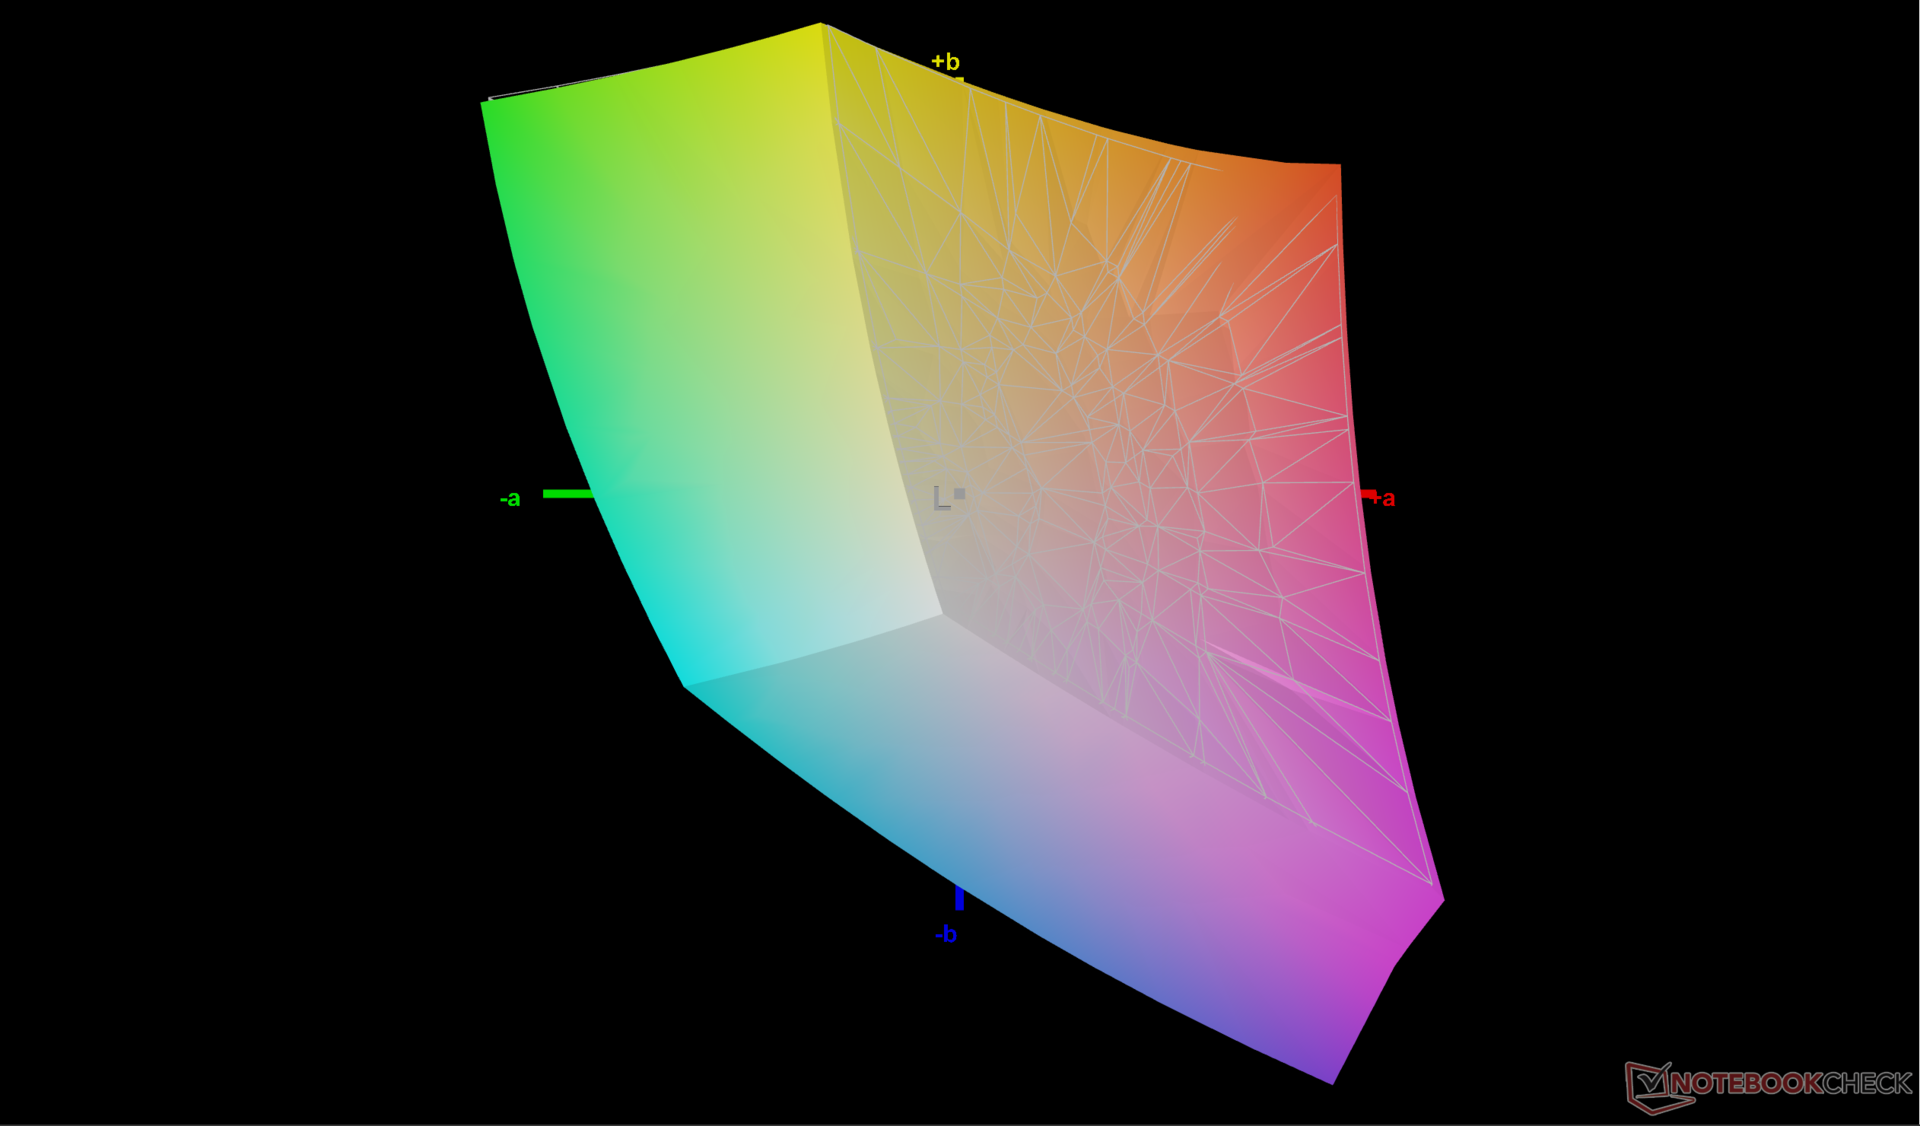
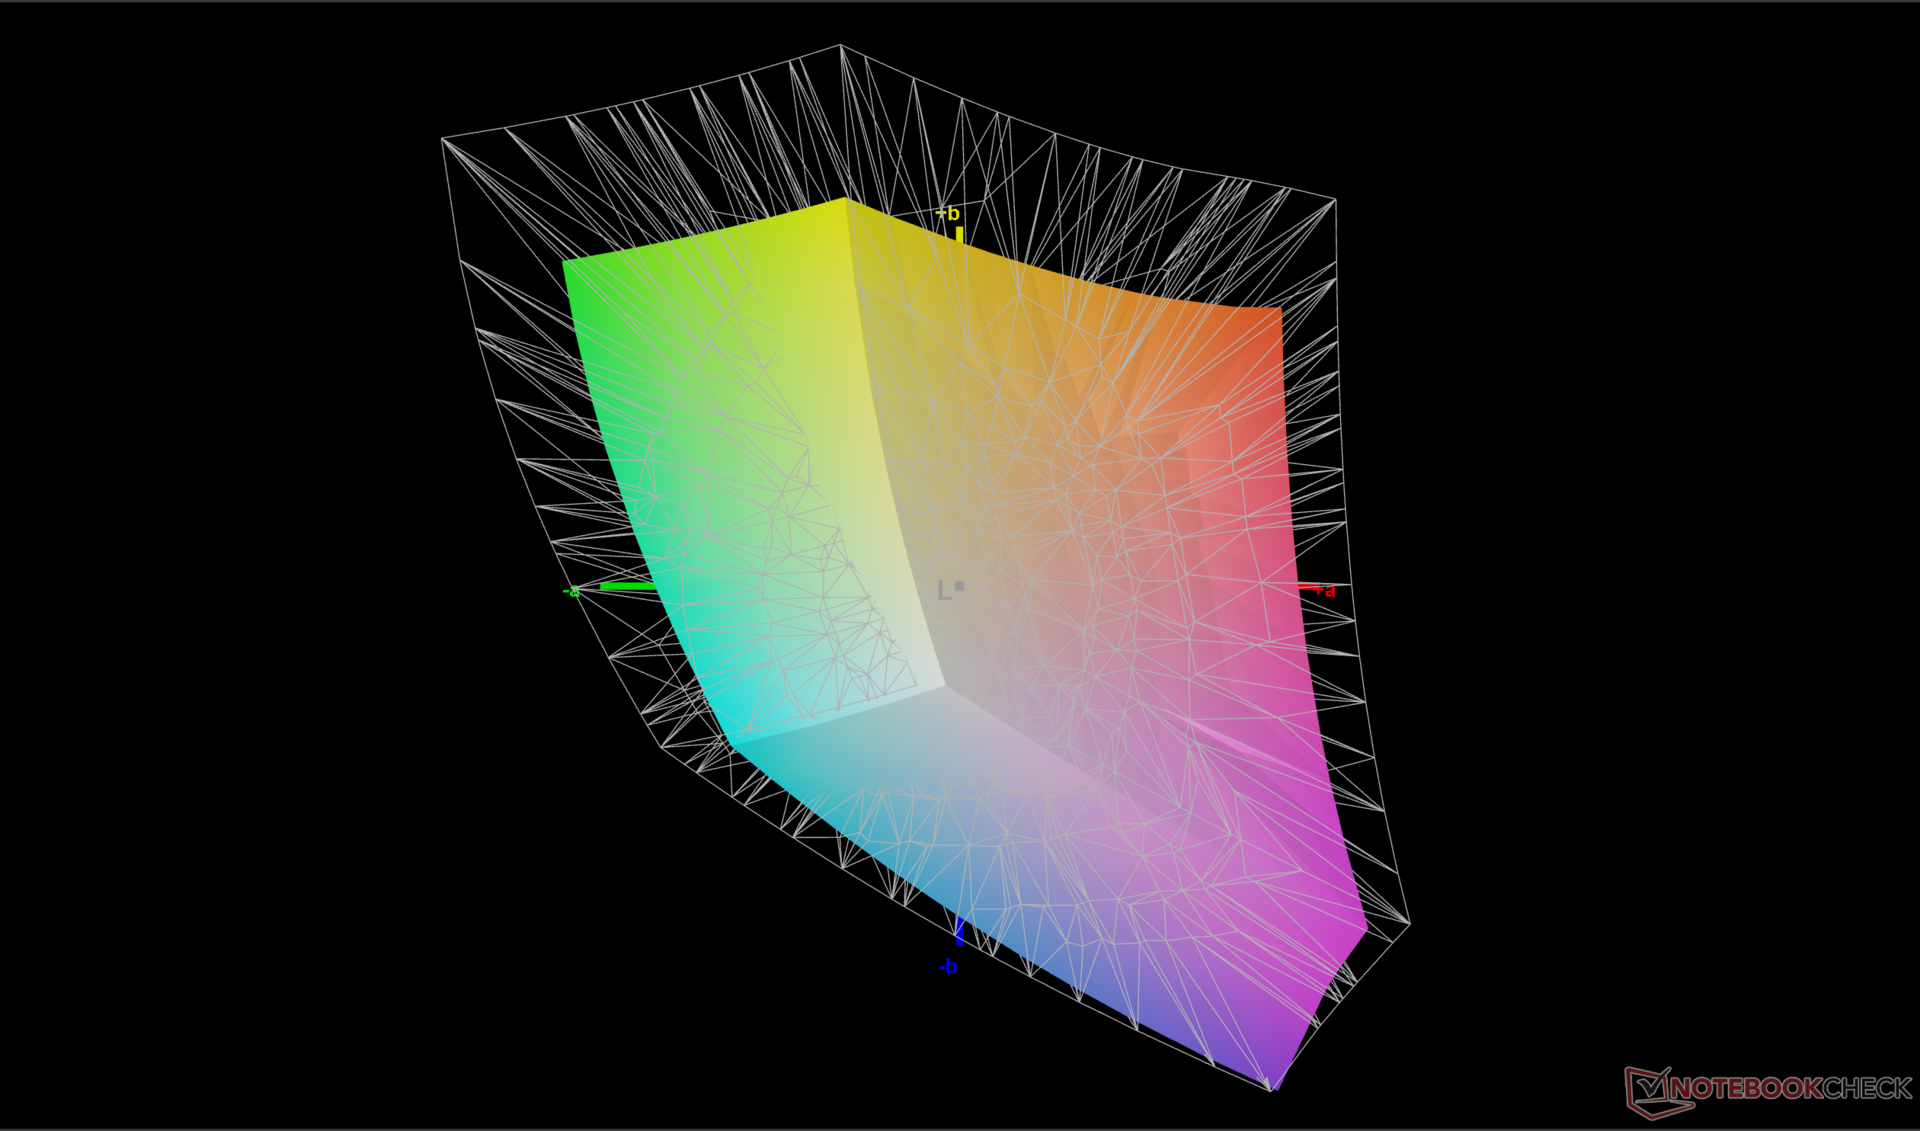
70.1% AdobeRGB 1998 (Argyll 3D)
99.4% sRGB (Argyll 3D)
69.3% Display P3 (Argyll 3D)
Gamma: 2.24
CCT: 6709 K
| Lenovo Legion Pro 5 16IRX9 BOE NE160QDM-NYC, IPS, 2560x1600, 16" | Lenovo Legion Pro 5 16IRX8 AU Optronics B160QAN03.1, IPS, 2560x1600, 16" | Alienware m16 R2 BOE NE16NYH, IPS, 2560x1600, 16" | HP Omen Transcend 16-u1095ng ATNA60DL02-0 (SDC41A4), OLED, 2560x1600, 16" | Asus ROG Zephyrus G16 2024 GU605M ATNA60DL01-0, OLED, 2560x1600, 16" | MSI Stealth 16 Mercedes-AMG Motorsport A13VG ATNA60YV09-0 (SDC4191), OLED, 3840x2400, 16" | |
|---|---|---|---|---|---|---|
| Display | 2% | 2% | 28% | 28% | 23% | |
| Display P3 Coverage (%) | 69.3 | 71.2 3% | 71 2% | 99.8 44% | 99.9 44% | 99.2 43% |
| sRGB Coverage (%) | 99.4 | 98.8 -1% | 100 1% | 100 1% | 100 1% | 99.9 1% |
| AdobeRGB 1998 Coverage (%) | 70.1 | 73.3 5% | 71.4 2% | 97 38% | 96.9 38% | 88.4 26% |
| Response Times | -20% | 27% | 98% | 98% | 87% | |
| Response Time Grey 50% / Grey 80% * (ms) | 11.9 ? | 14.5 ? -22% | 5.7 ? 52% | 0.2 ? 98% | 0.22 ? 98% | 1.5 ? 87% |
| Response Time Black / White * (ms) | 8.9 ? | 10.4 ? -17% | 8.7 ? 2% | 0.2 ? 98% | 0.25 ? 97% | 1.2 ? 87% |
| PWM Frequency (Hz) | 120 ? | 960 ? | 60 ? | |||
| Screen | -5% | -14% | 136% | -13% | 5% | |
| Brightness middle (cd/m²) | 384 | 405.7 6% | 345.8 -10% | 390 2% | 416 8% | 382 -1% |
| Brightness (cd/m²) | 366 | 368 1% | 337 -8% | 392 7% | 418 14% | 383 5% |
| Brightness Distribution (%) | 91 | 87 -4% | 87 -4% | 98 8% | 96 5% | 96 5% |
| Black Level * (cd/m²) | 0.35 | 0.38 -9% | 0.3 14% | 0.02 94% | ||
| Contrast (:1) | 1097 | 1068 -3% | 1153 5% | 19500 1678% | ||
| Colorchecker dE 2000 * | 0.97 | 1.65 -70% | 1.99 -105% | 1.94 -100% | 1.6 -65% | 0.84 13% |
| Colorchecker dE 2000 max. * | 3.57 | 4.2 -18% | 3.52 1% | 4.26 -19% | 2.1 41% | 3.39 5% |
| Colorchecker dE 2000 calibrated * | 0.77 | 0.53 31% | 0.62 19% | 4.21 -447% | 0.8 -4% | |
| Greyscale dE 2000 * | 1.5 | 1.2 20% | 2.1 -40% | 1.5 -0% | 2.7 -80% | 1.3 13% |
| Gamma | 2.24 98% | 2.3 96% | 2.32 95% | 2.221 99% | 2.16 102% | 2.166 102% |
| CCT | 6709 97% | 6453 101% | 6369 102% | 6395 102% | 6331 103% | 6550 99% |
| Total Average (Program / Settings) | -8% /
-6% | 5% /
-5% | 87% /
107% | 38% /
18% | 38% /
23% |
* ... smaller is better
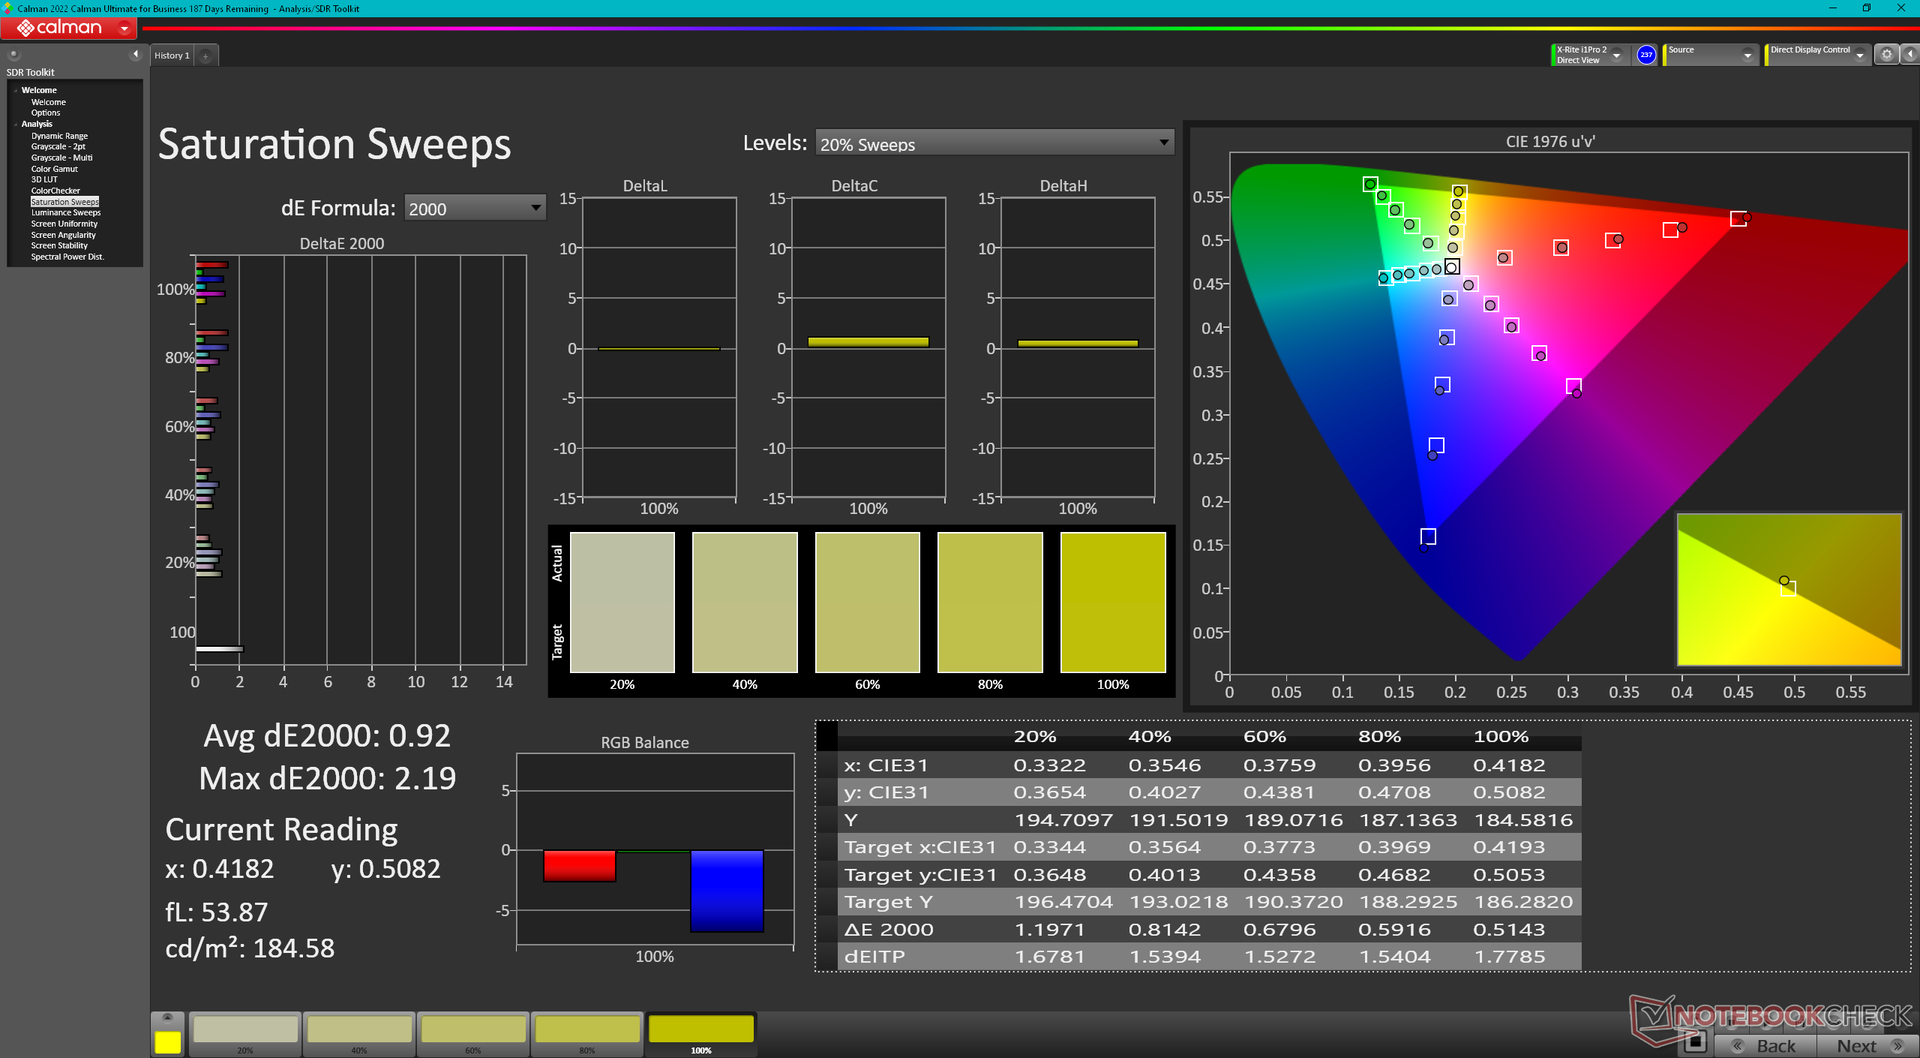
显示器开箱即进行了预校准,平均灰度和色彩 deltaE 值分别仅为 1.5 和 0.97,这在中端游戏笔记本电脑上实属罕见。因此,大多数用户无需进行最终用户校准。

Display Response Times
| ↔ Response Time Black to White | ||
|---|---|---|
| 8.9 ms ... rise ↗ and fall ↘ combined | ↗ 4.8 ms rise | 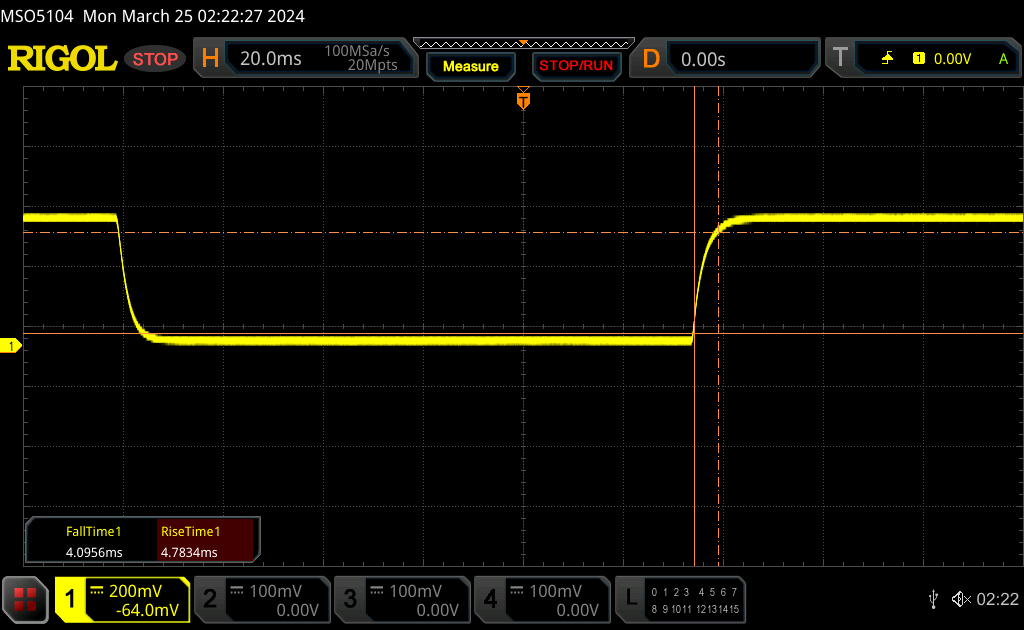 |
| ↘ 4.1 ms fall | ||
| The screen shows fast response rates in our tests and should be suited for gaming. In comparison, all tested devices range from 0.1 (minimum) to 240 (maximum) ms. » 25 % of all devices are better. This means that the measured response time is better than the average of all tested devices (19.8 ms). | ||
| ↔ Response Time 50% Grey to 80% Grey | ||
| 11.9 ms ... rise ↗ and fall ↘ combined | ↗ 5.5 ms rise | 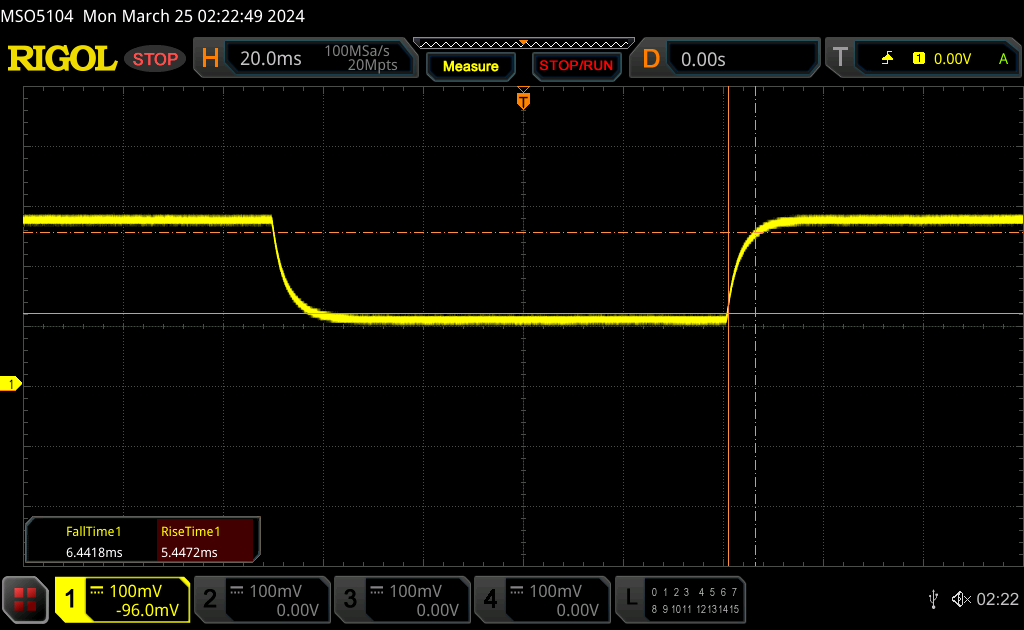 |
| ↘ 6.4 ms fall | ||
| The screen shows good response rates in our tests, but may be too slow for competitive gamers. In comparison, all tested devices range from 0.165 (minimum) to 636 (maximum) ms. » 25 % of all devices are better. This means that the measured response time is better than the average of all tested devices (31 ms). | ||
Screen Flickering / PWM (Pulse-Width Modulation)
| Screen flickering / PWM not detected | 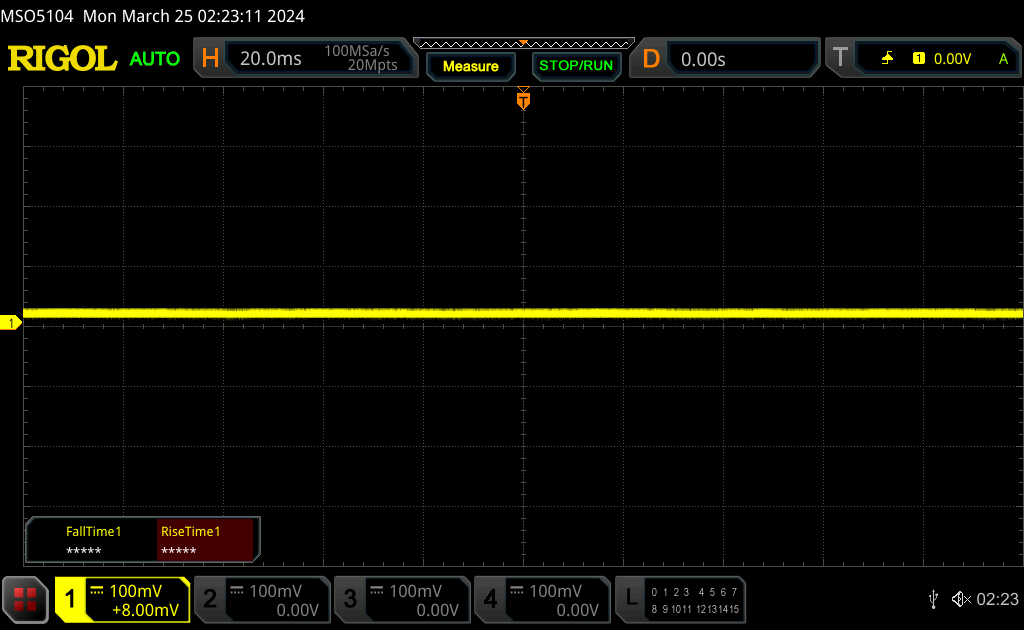 | ||
In comparison: 52 % of all tested devices do not use PWM to dim the display. If PWM was detected, an average of 7757 (minimum: 5 - maximum: 343500) Hz was measured. | |||
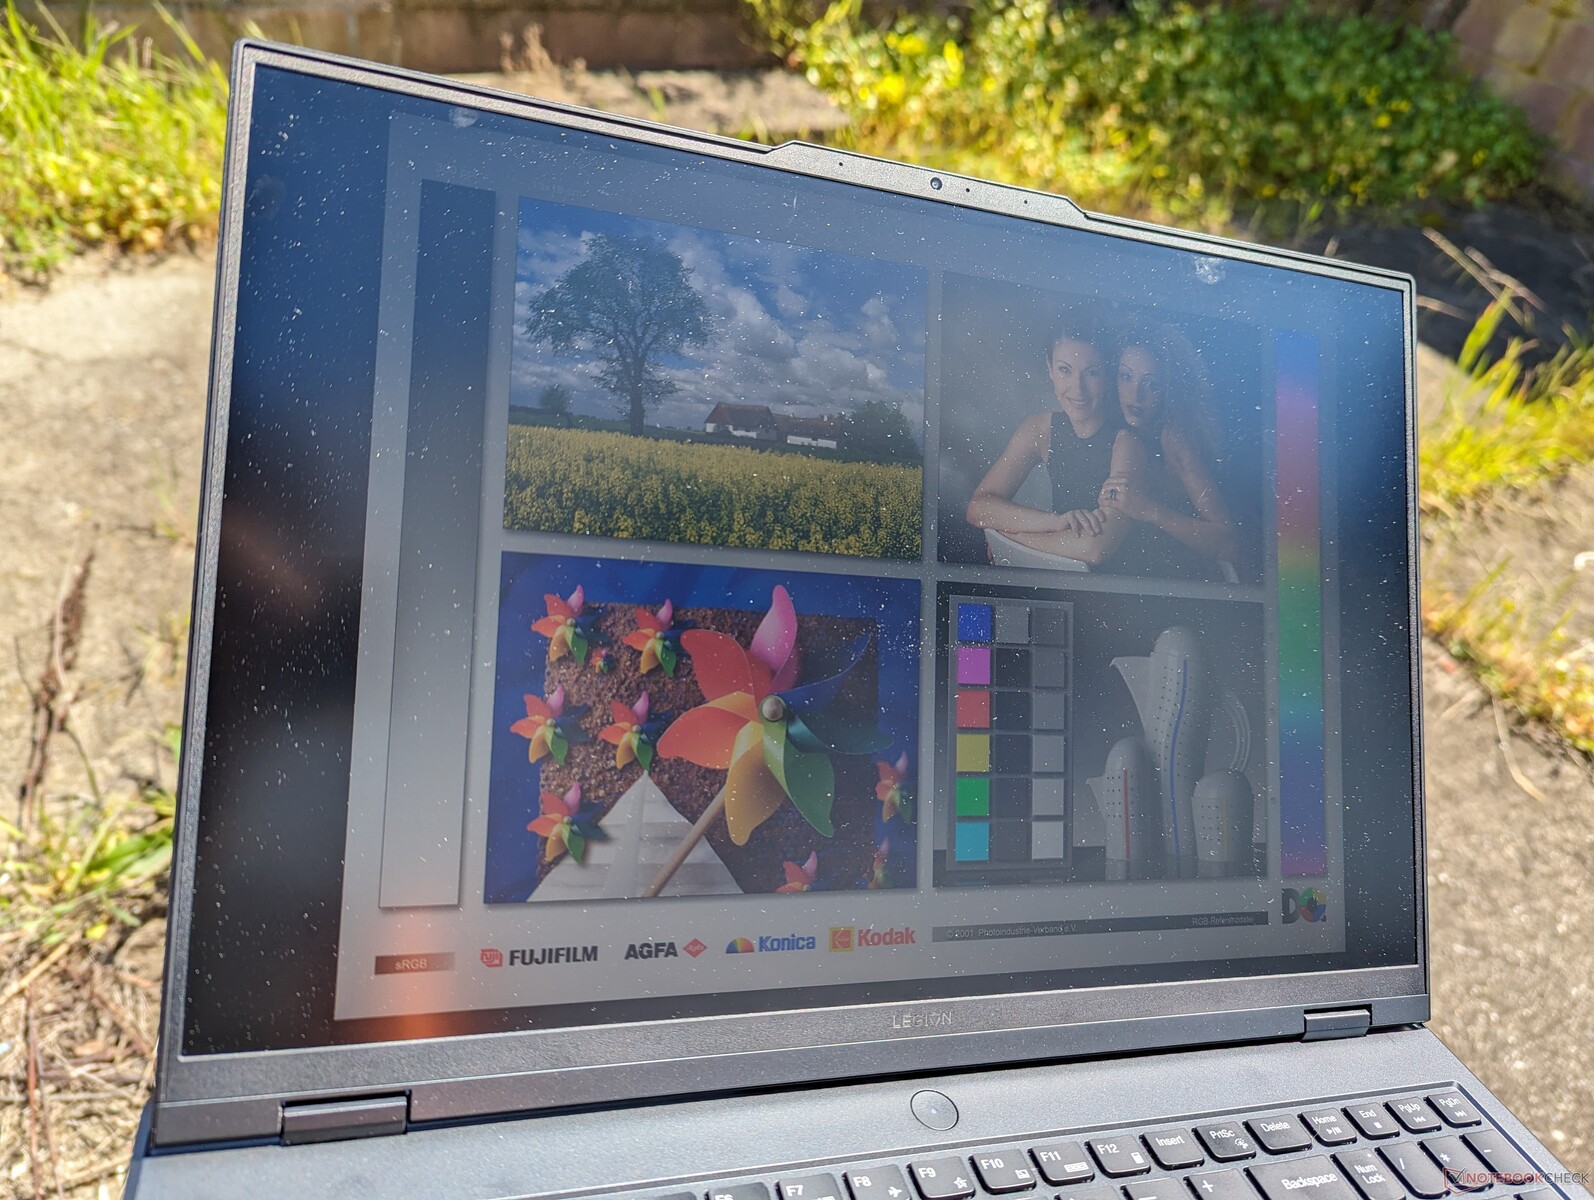
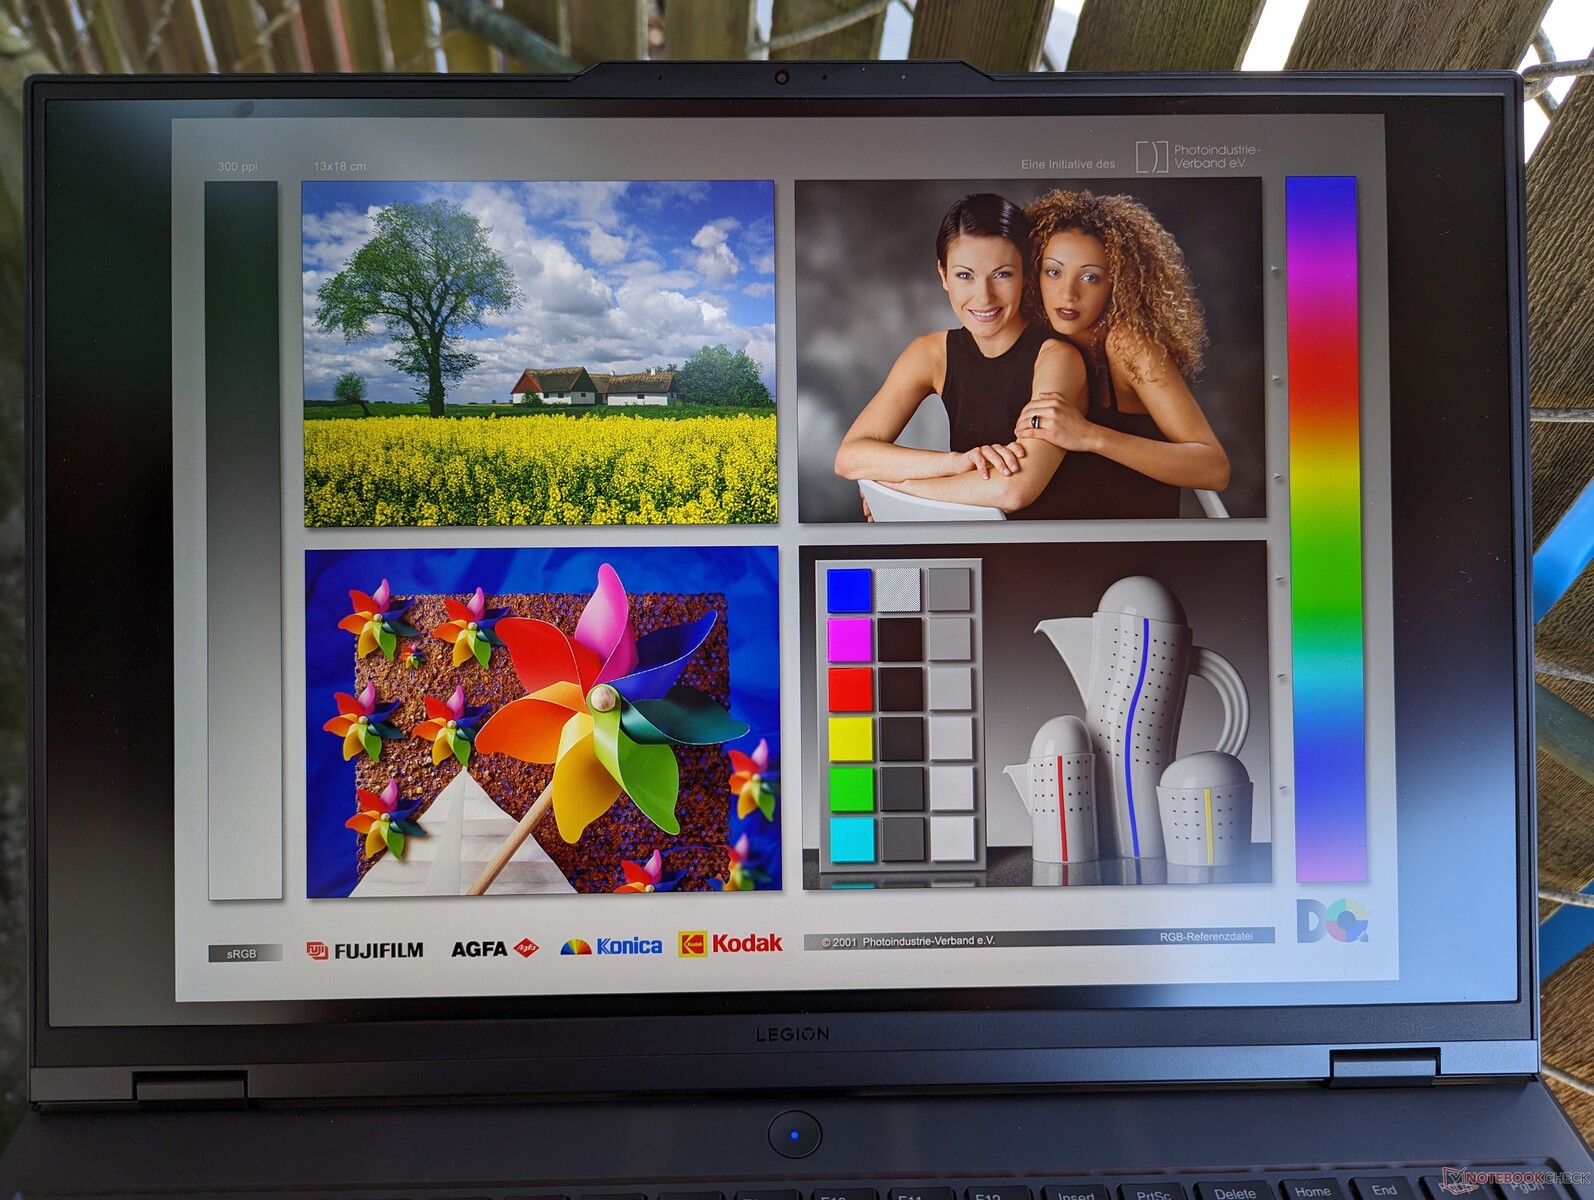
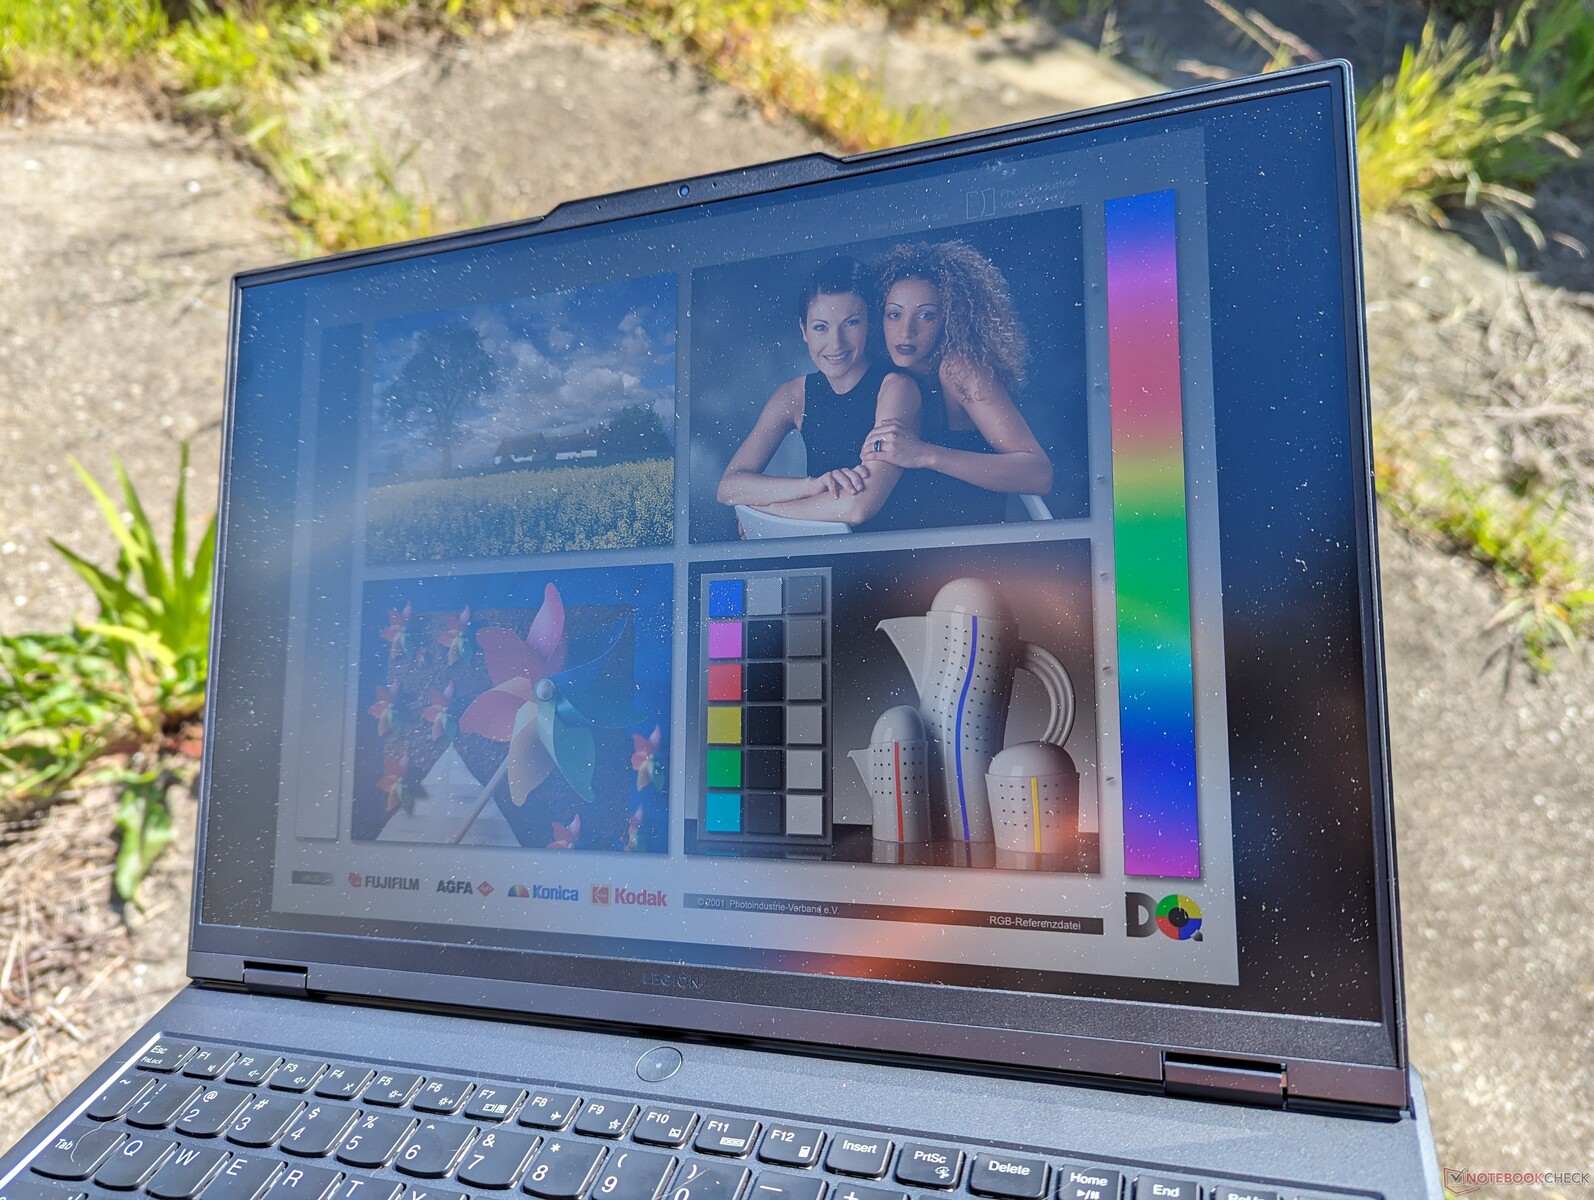
由于最大亮度基本相同,因此户外可见度与去年的型号相比没有太大变化。虽然该机型提供了更亮的面板,但增加的亮度并不明显,不足以在户外产生明显的差异。

性能 - 不同的名称,相同的性能
测试条件
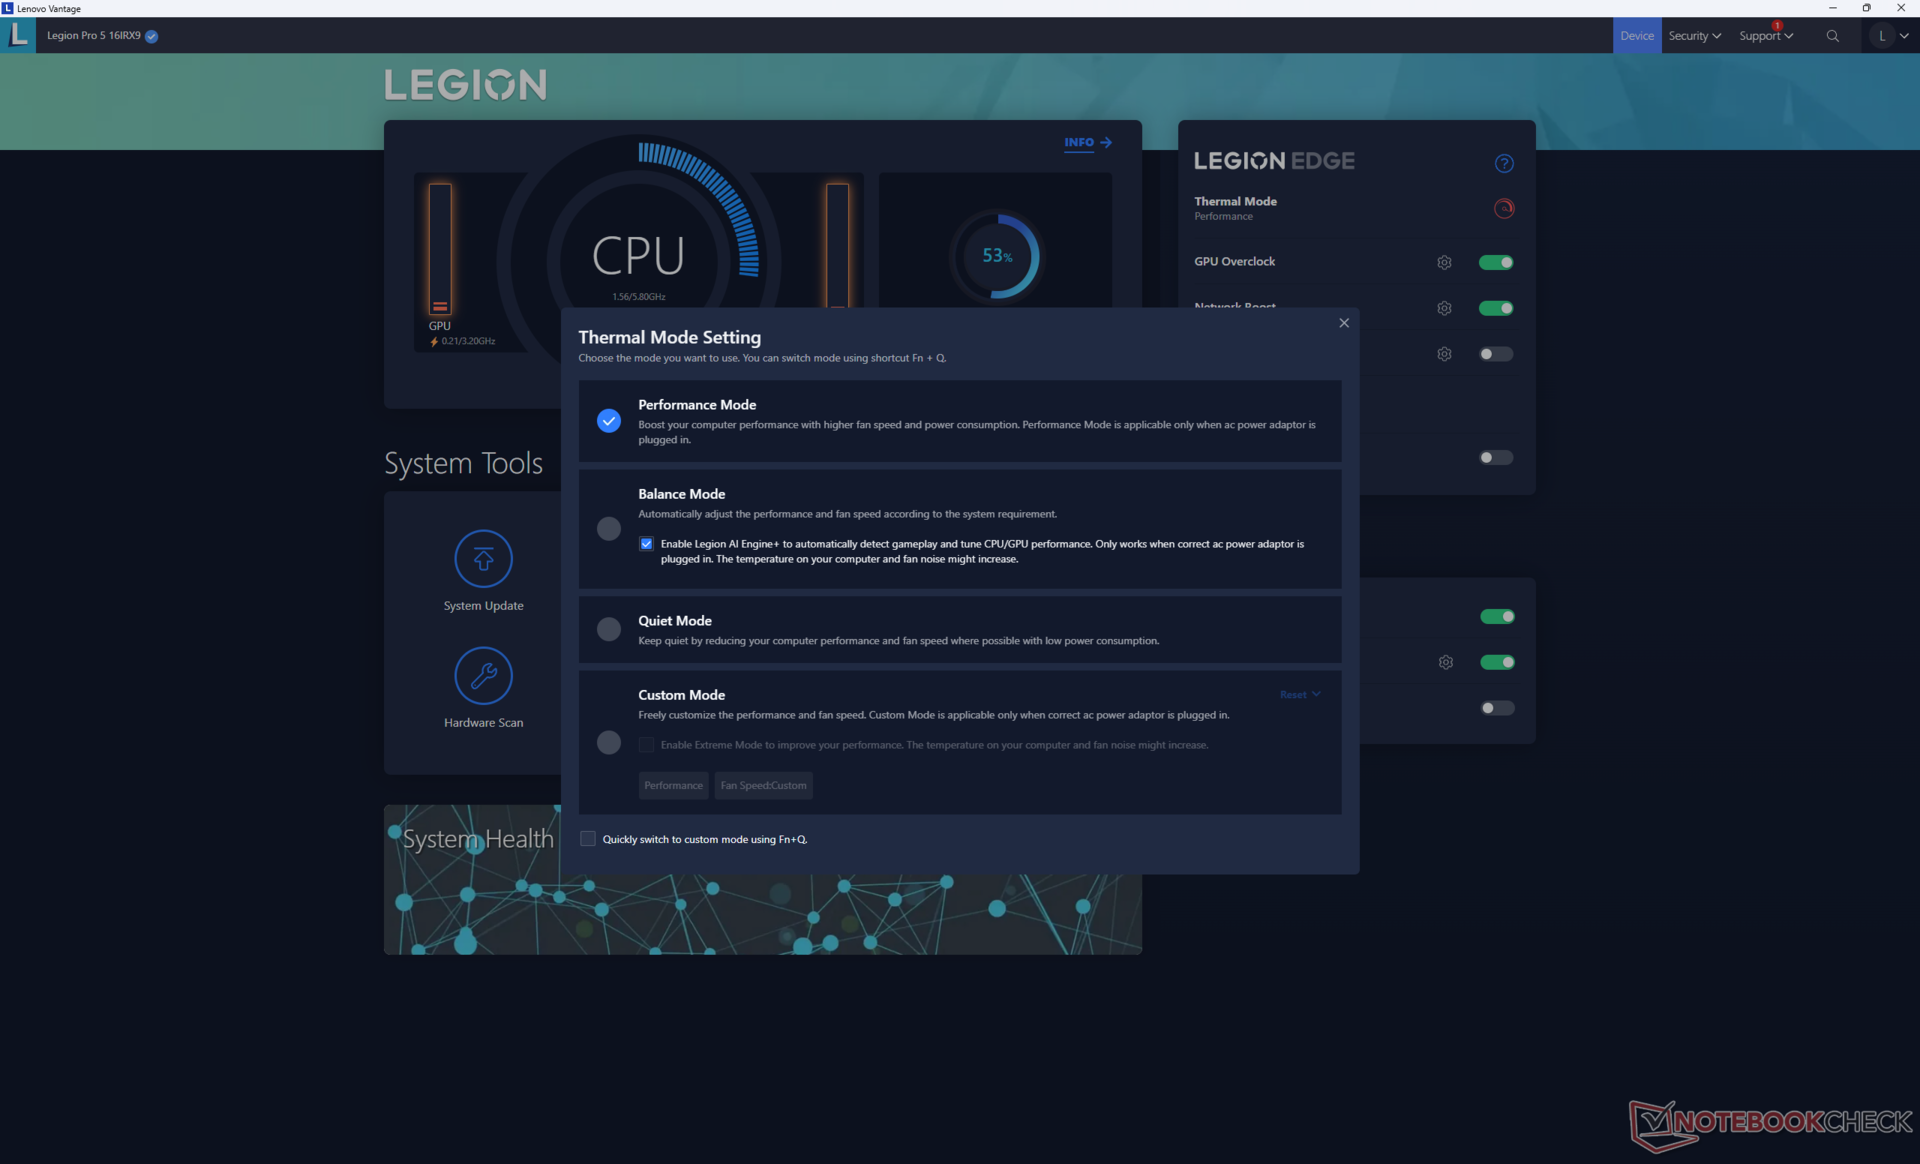
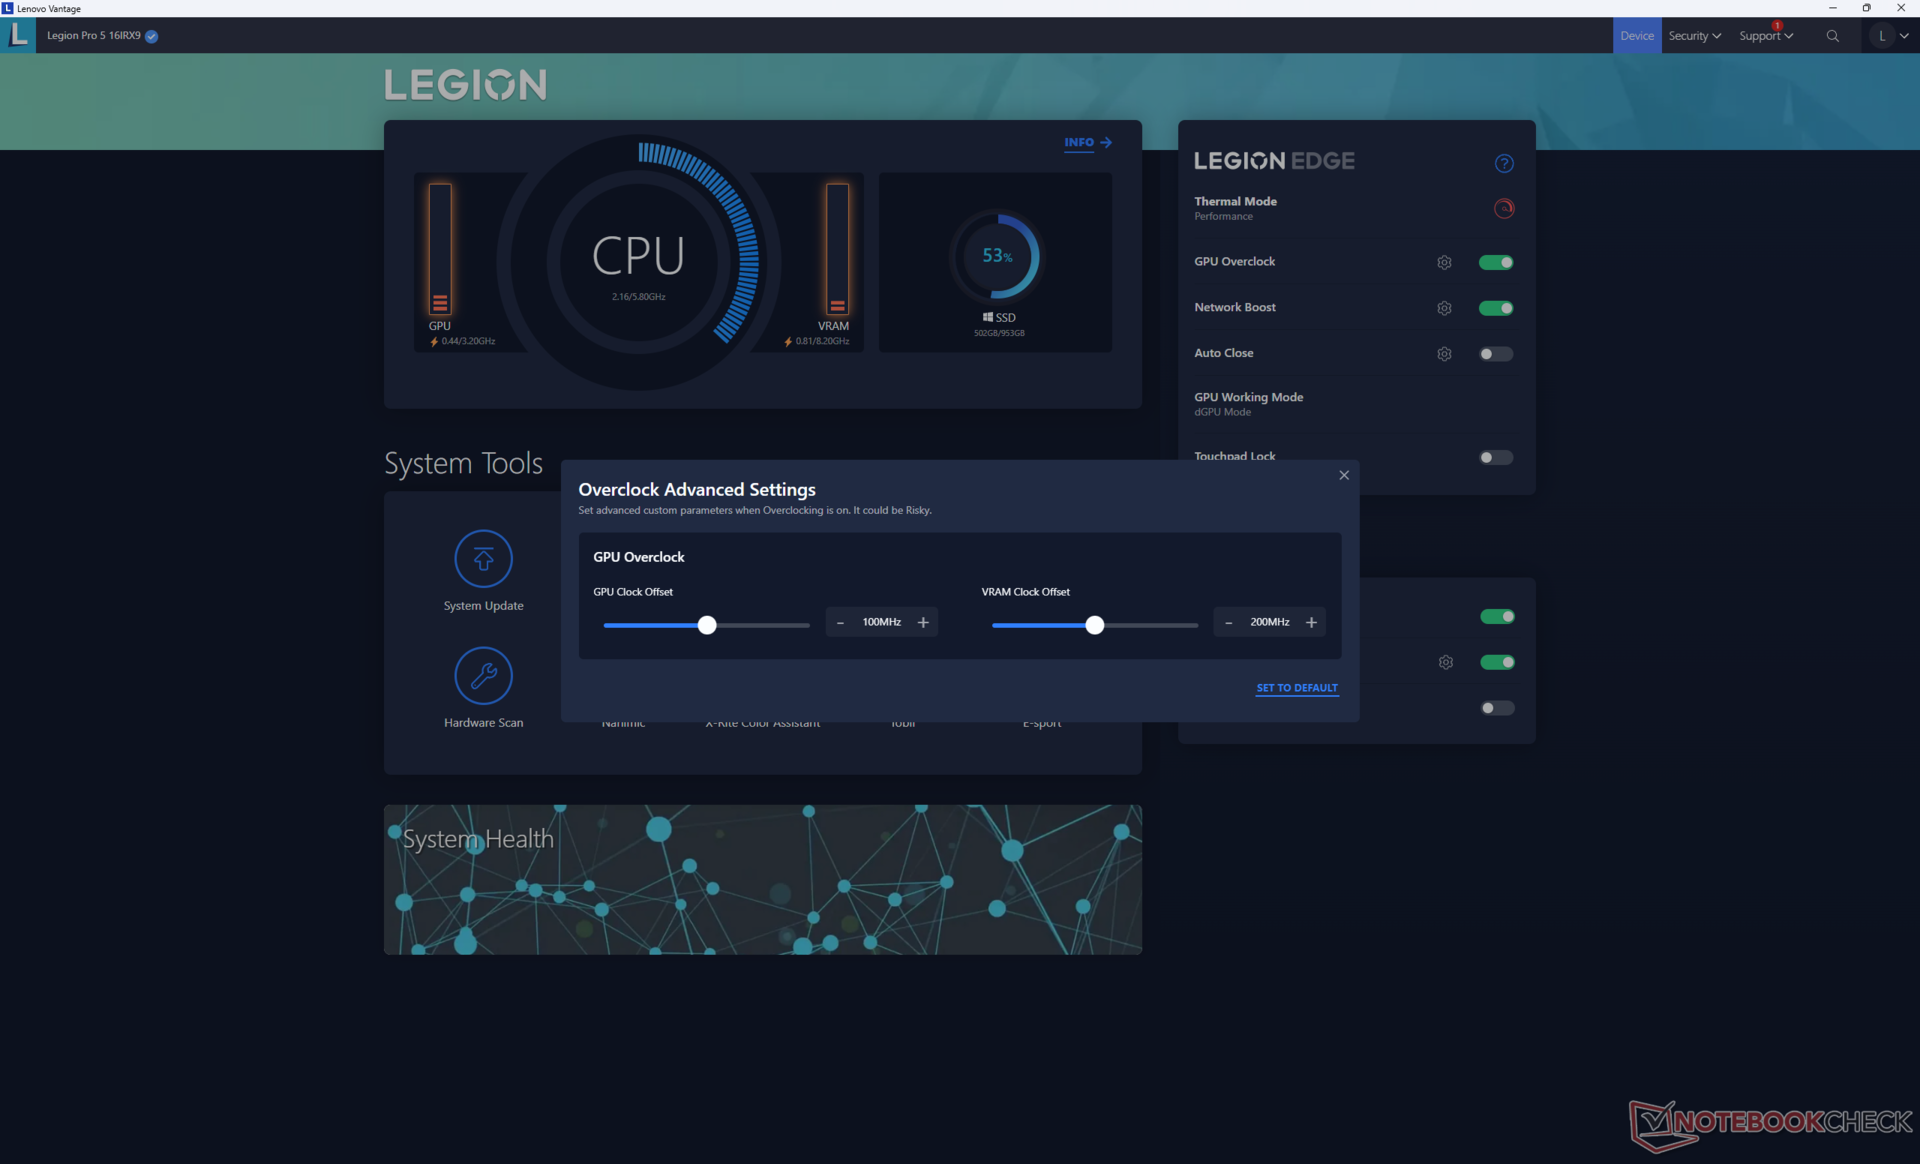
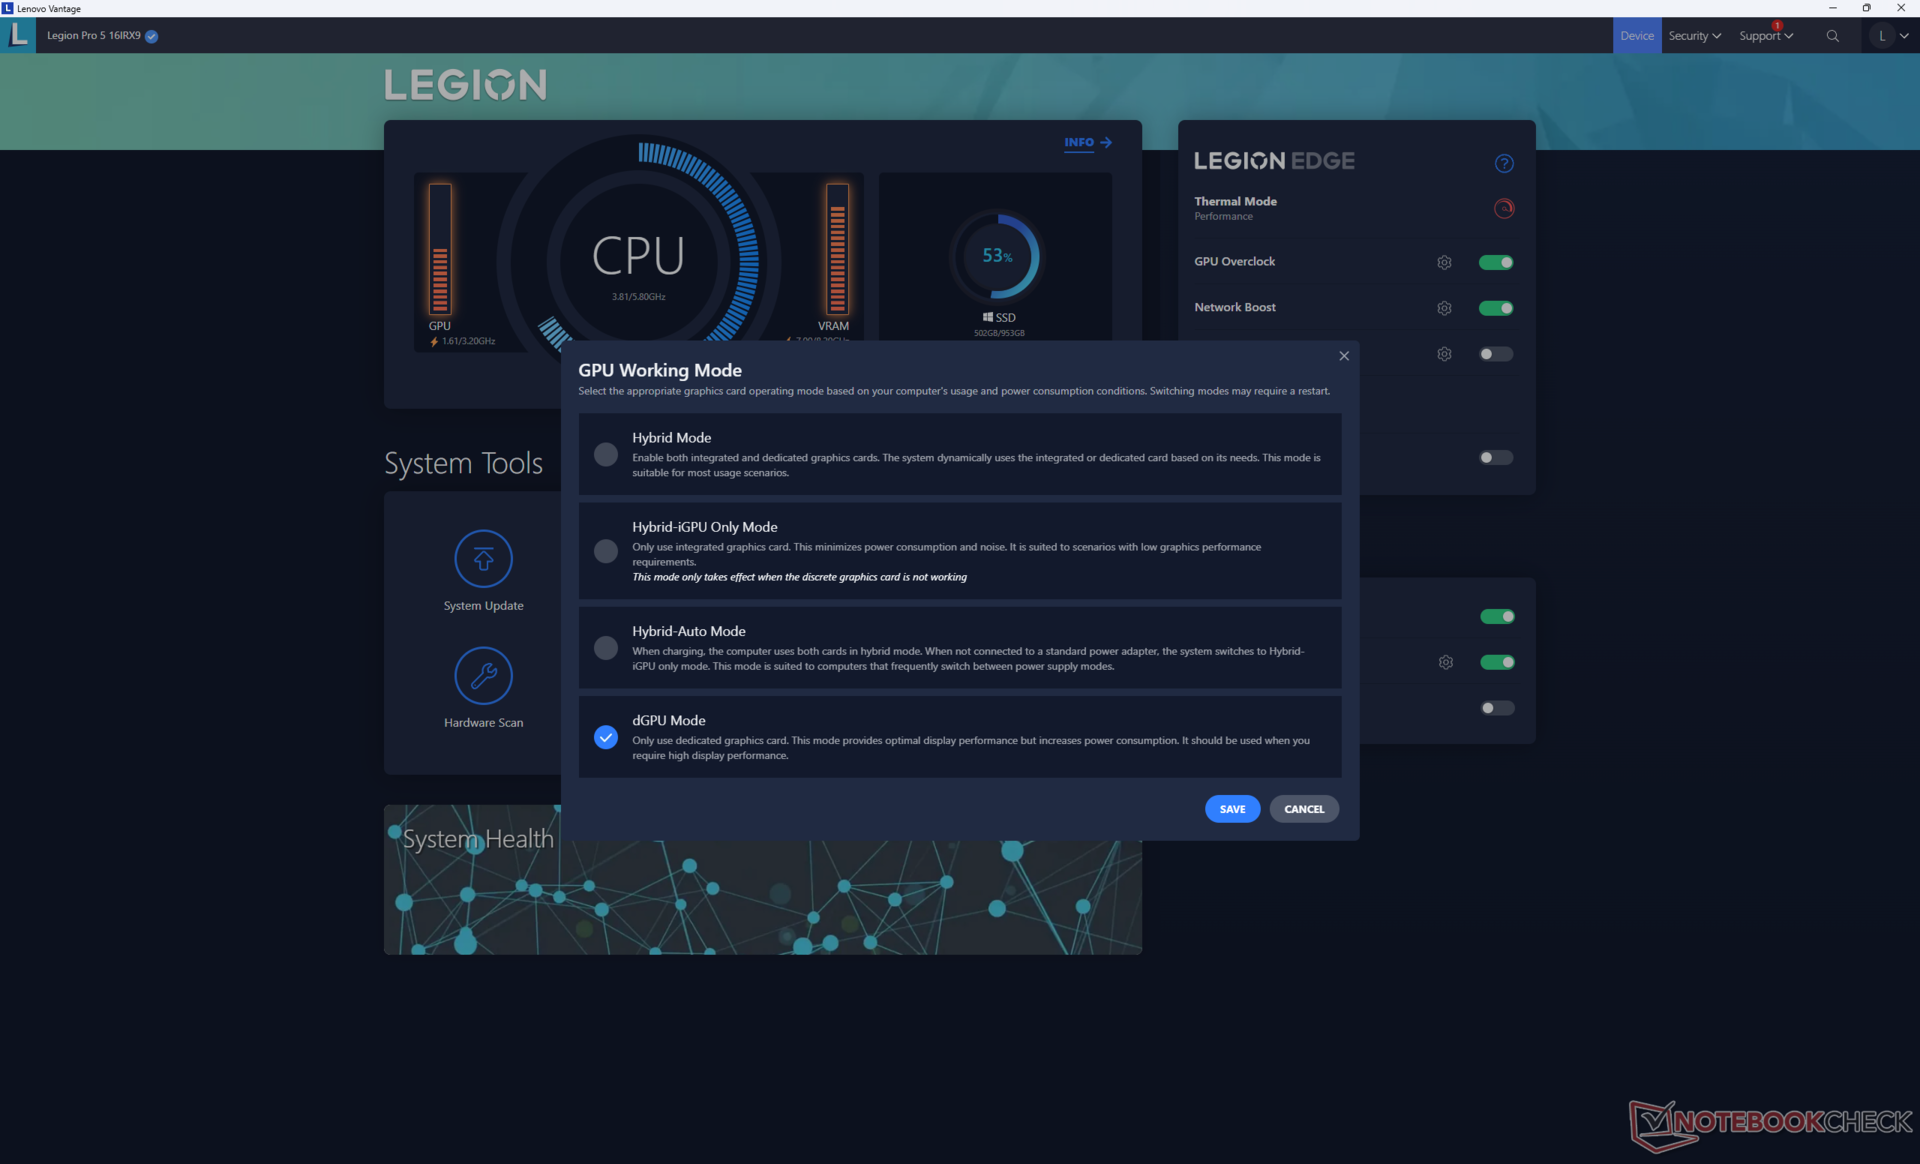
在运行下面的基准测试之前,我们将联想 Vantage 设置为性能模式、dGPU 模式,并将 Windows 设置为性能模式。GPU 超频也默认启用为 +100/+200 MHz 时钟/VRAM。
支持高级优化。与往常一样,当设置为 dGPU 模式时,G-Sync 仅对主显示屏有效。
处理器
CPU 性能卓越,尤其是与 HP Omen Transcend 16相同的 酷睿 i9-14900HX处理器相比,它的性能提升了近 50%。它还提供了非常可观的性能提升,比 酷睿 i7-13700HXLegion 相比提升了近 50%。即便如此,其整体性能仍可与价格较低的 酷睿 i9-13900HX因为 i9-14900HX 只是一个改型产品。
性能的可持续性很好,但并不完美。例如,在循环运行 CineBench R15 xT 时,性能会随时间下降约 6%。值得庆幸的是,这种下降并不像我们在上述惠普笔记本电脑上观察到的那样严重,如下图所示。
降级到 i7-14700HX或 i5-14500HX预计性能会降低约 35% 至 45%,因为它们也分别是较早的 i7-13700HX 和 i5-13500HX 的换代产品。
Cinebench R15 Multi Loop
Cinebench R23: Multi Core | Single Core
Cinebench R20: CPU (Multi Core) | CPU (Single Core)
Cinebench R15: CPU Multi 64Bit | CPU Single 64Bit
Blender: v2.79 BMW27 CPU
7-Zip 18.03: 7z b 4 | 7z b 4 -mmt1
Geekbench 6.7: Multi-Core | Single-Core
Geekbench 5.5: Multi-Core | Single-Core
HWBOT x265 Benchmark v2.2: 4k Preset
LibreOffice : 20 Documents To PDF
R Benchmark 2.5: Overall mean
* ... smaller is better
AIDA64: FP32 Ray-Trace | FPU Julia | CPU SHA3 | CPU Queen | FPU SinJulia | FPU Mandel | CPU AES | CPU ZLib | FP64 Ray-Trace | CPU PhotoWorxx
| Performance rating | |
| Lenovo Legion Pro 5 16IRX9 | |
| Average Intel Core i9-14900HX | |
| Lenovo Legion Pro 5 16IRX8 | |
| HP Omen Transcend 16-u1095ng | |
| MSI Stealth 16 Mercedes-AMG Motorsport A13VG | |
| Alienware m16 R2 | |
| Asus ROG Zephyrus G16 2024 GU605M | |
| AIDA64 / FP32 Ray-Trace | |
| Lenovo Legion Pro 5 16IRX9 | |
| Average Intel Core i9-14900HX (13098 - 33474, n=36) | |
| Lenovo Legion Pro 5 16IRX8 | |
| MSI Stealth 16 Mercedes-AMG Motorsport A13VG | |
| Alienware m16 R2 | |
| HP Omen Transcend 16-u1095ng | |
| Asus ROG Zephyrus G16 2024 GU605M | |
| AIDA64 / FPU Julia | |
| Lenovo Legion Pro 5 16IRX9 | |
| Average Intel Core i9-14900HX (67573 - 166040, n=36) | |
| Lenovo Legion Pro 5 16IRX8 | |
| Alienware m16 R2 | |
| MSI Stealth 16 Mercedes-AMG Motorsport A13VG | |
| HP Omen Transcend 16-u1095ng | |
| Asus ROG Zephyrus G16 2024 GU605M | |
| AIDA64 / CPU SHA3 | |
| Lenovo Legion Pro 5 16IRX9 | |
| Average Intel Core i9-14900HX (3589 - 7979, n=36) | |
| Lenovo Legion Pro 5 16IRX8 | |
| HP Omen Transcend 16-u1095ng | |
| Alienware m16 R2 | |
| MSI Stealth 16 Mercedes-AMG Motorsport A13VG | |
| Asus ROG Zephyrus G16 2024 GU605M | |
| AIDA64 / CPU Queen | |
| Lenovo Legion Pro 5 16IRX9 | |
| Average Intel Core i9-14900HX (118405 - 148966, n=36) | |
| HP Omen Transcend 16-u1095ng | |
| MSI Stealth 16 Mercedes-AMG Motorsport A13VG | |
| Lenovo Legion Pro 5 16IRX8 | |
| Asus ROG Zephyrus G16 2024 GU605M | |
| Alienware m16 R2 | |
| AIDA64 / FPU SinJulia | |
| Lenovo Legion Pro 5 16IRX9 | |
| Average Intel Core i9-14900HX (10475 - 18517, n=36) | |
| Lenovo Legion Pro 5 16IRX8 | |
| HP Omen Transcend 16-u1095ng | |
| MSI Stealth 16 Mercedes-AMG Motorsport A13VG | |
| Asus ROG Zephyrus G16 2024 GU605M | |
| Alienware m16 R2 | |
| AIDA64 / FPU Mandel | |
| Lenovo Legion Pro 5 16IRX9 | |
| Average Intel Core i9-14900HX (32543 - 83662, n=36) | |
| Lenovo Legion Pro 5 16IRX8 | |
| Alienware m16 R2 | |
| MSI Stealth 16 Mercedes-AMG Motorsport A13VG | |
| HP Omen Transcend 16-u1095ng | |
| Asus ROG Zephyrus G16 2024 GU605M | |
| AIDA64 / CPU AES | |
| Average Intel Core i9-14900HX (86964 - 241777, n=36) | |
| Lenovo Legion Pro 5 16IRX9 | |
| Lenovo Legion Pro 5 16IRX8 | |
| HP Omen Transcend 16-u1095ng | |
| MSI Stealth 16 Mercedes-AMG Motorsport A13VG | |
| Alienware m16 R2 | |
| Asus ROG Zephyrus G16 2024 GU605M | |
| AIDA64 / CPU ZLib | |
| Lenovo Legion Pro 5 16IRX9 | |
| Average Intel Core i9-14900HX (1054 - 2292, n=36) | |
| Lenovo Legion Pro 5 16IRX8 | |
| HP Omen Transcend 16-u1095ng | |
| Alienware m16 R2 | |
| MSI Stealth 16 Mercedes-AMG Motorsport A13VG | |
| Asus ROG Zephyrus G16 2024 GU605M | |
| AIDA64 / FP64 Ray-Trace | |
| Lenovo Legion Pro 5 16IRX9 | |
| Average Intel Core i9-14900HX (6809 - 18349, n=36) | |
| Lenovo Legion Pro 5 16IRX8 | |
| MSI Stealth 16 Mercedes-AMG Motorsport A13VG | |
| Alienware m16 R2 | |
| HP Omen Transcend 16-u1095ng | |
| Asus ROG Zephyrus G16 2024 GU605M | |
| AIDA64 / CPU PhotoWorxx | |
| Lenovo Legion Pro 5 16IRX9 | |
| HP Omen Transcend 16-u1095ng | |
| Asus ROG Zephyrus G16 2024 GU605M | |
| MSI Stealth 16 Mercedes-AMG Motorsport A13VG | |
| Average Intel Core i9-14900HX (23903 - 54702, n=36) | |
| Alienware m16 R2 | |
| Lenovo Legion Pro 5 16IRX8 | |
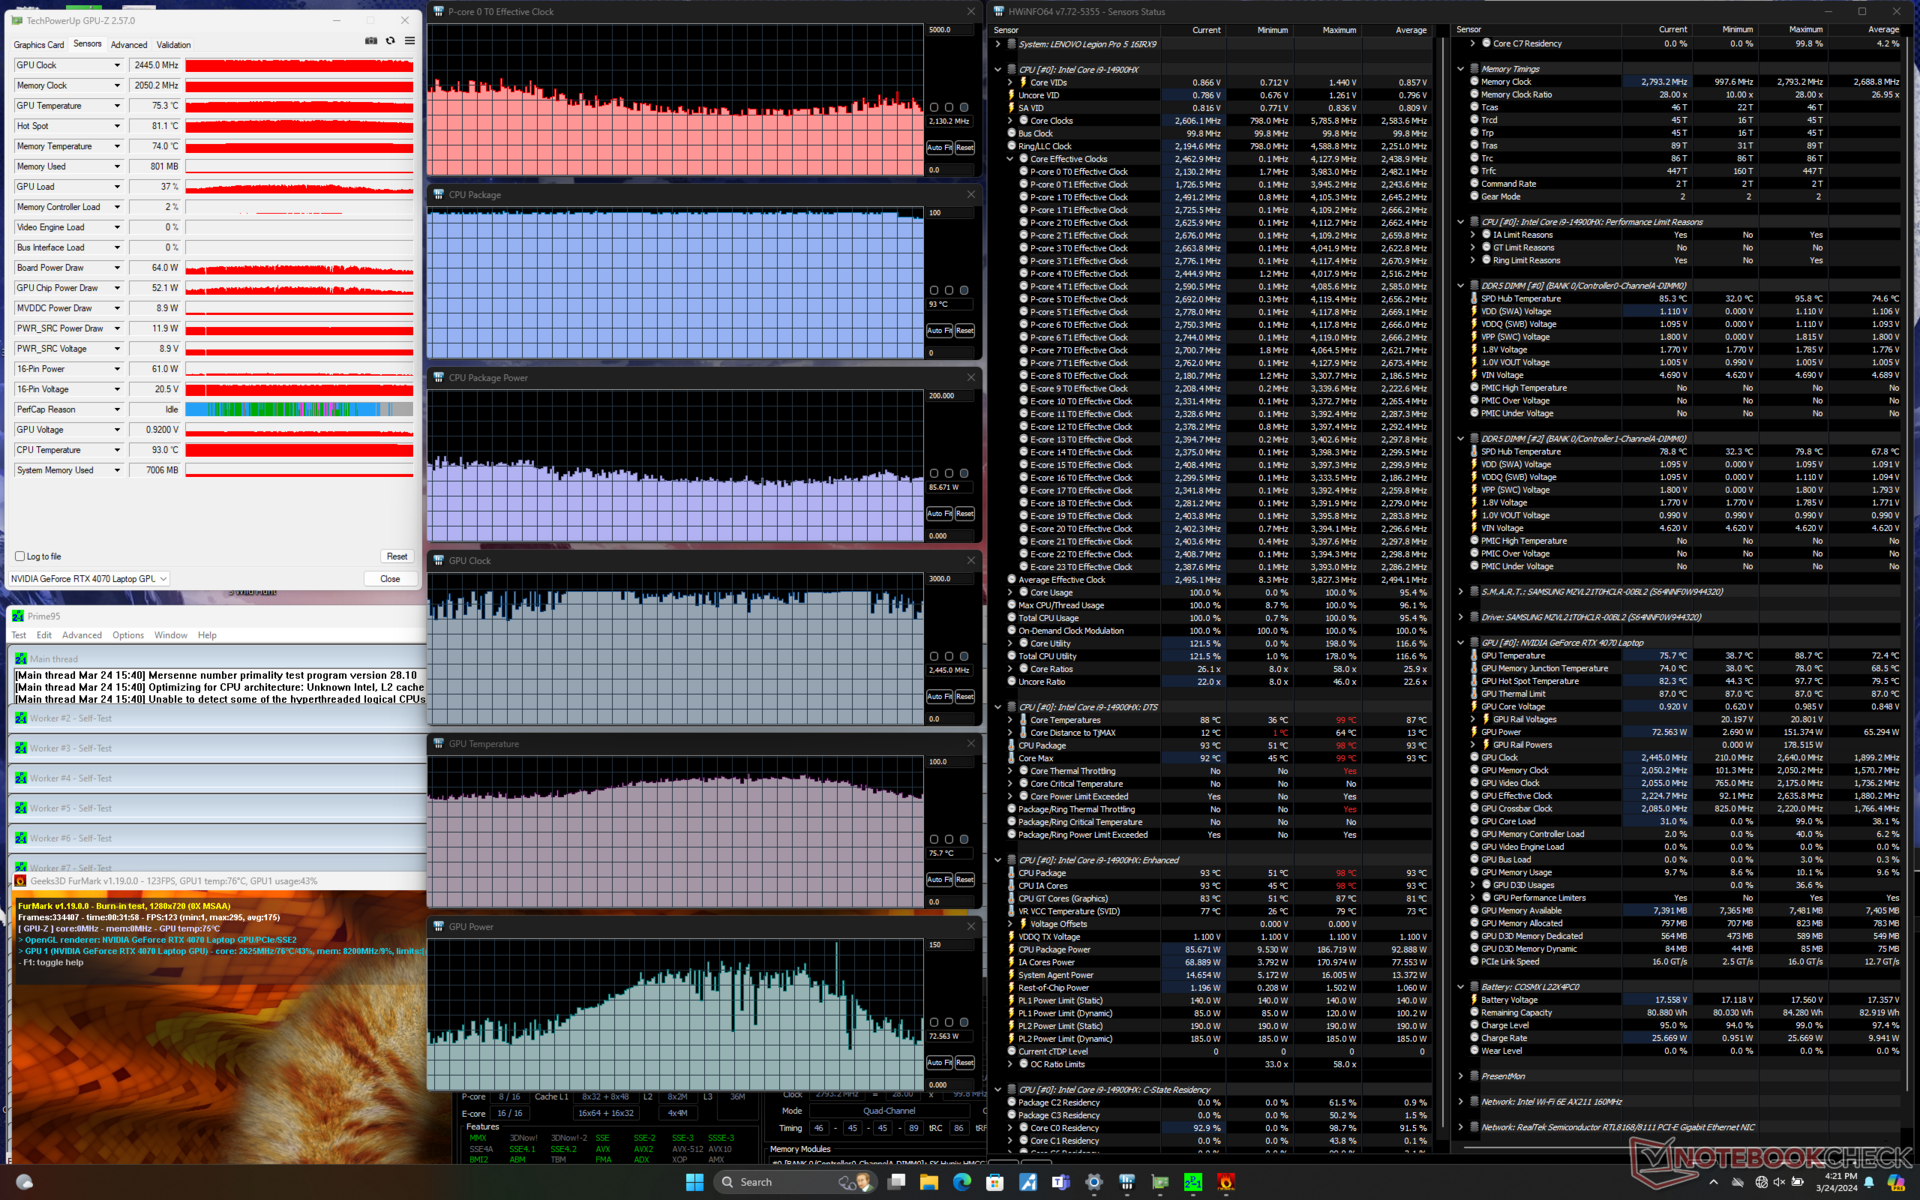
压力测试
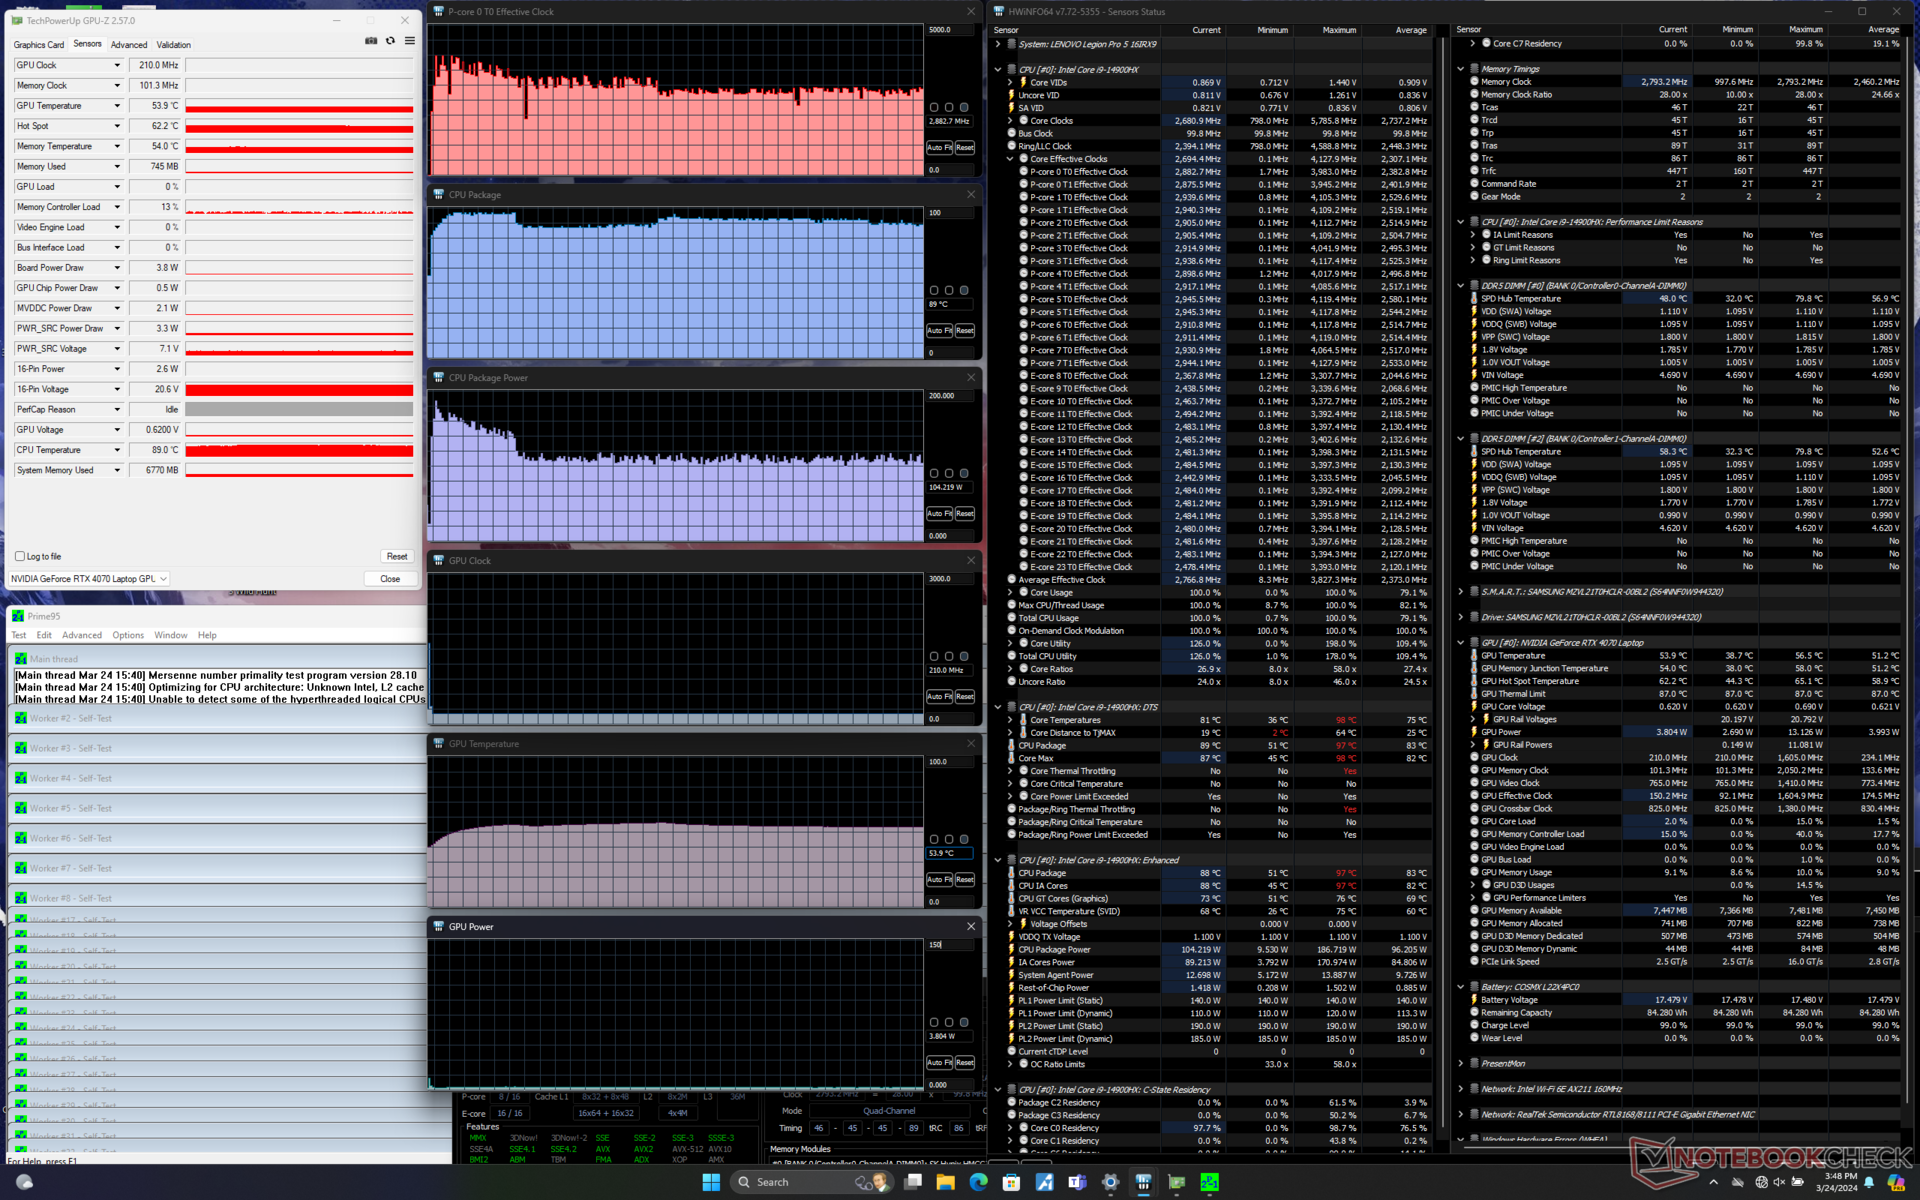
在运行 Prime95 压力测试时,CPU 会升至 4 GHz 和 187 W。几秒钟后,当核心温度达到 97 摄氏度时,CPU 会迅速稳定在 2.8 GHz 和 104 W,以便将核心温度维持在 89 摄氏度这一更易控制的水平。
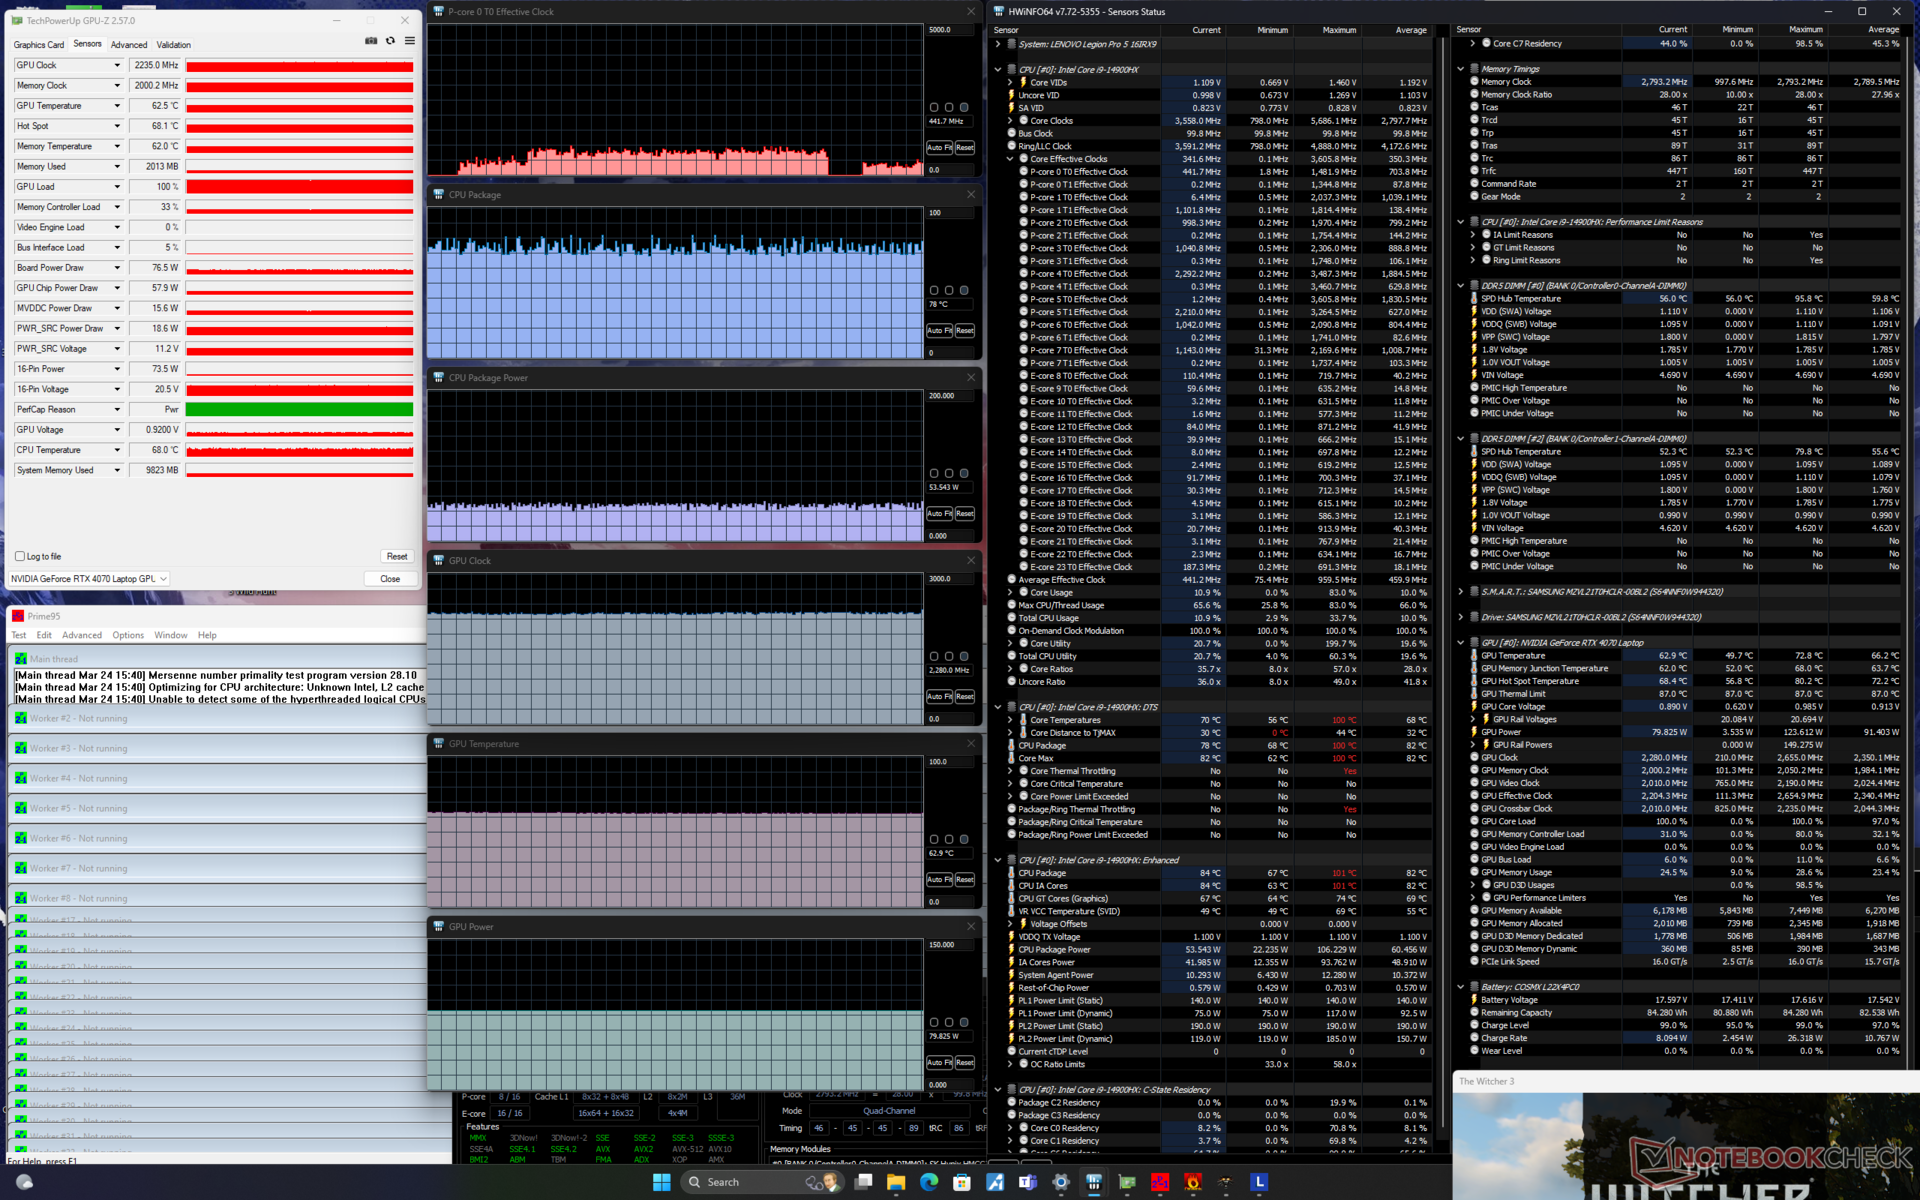
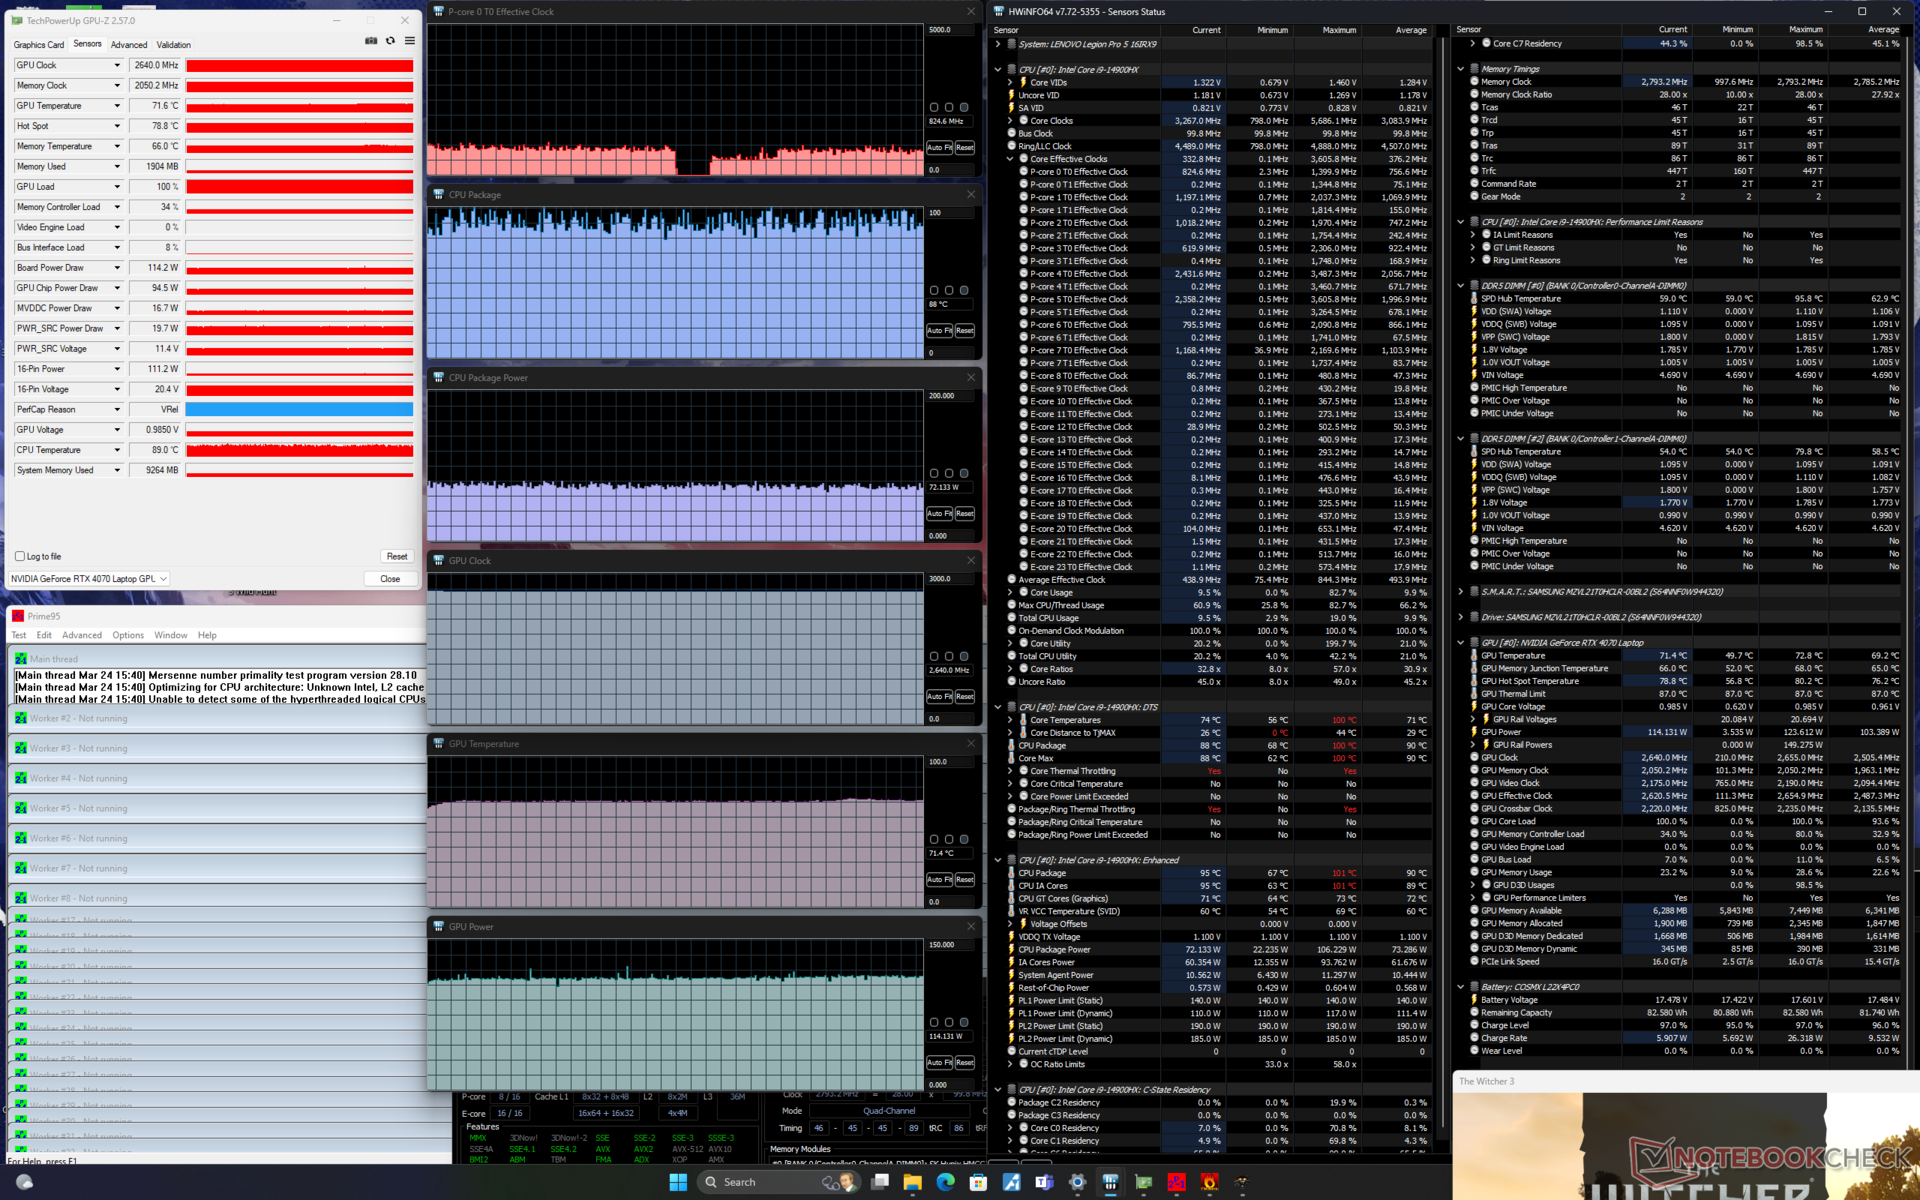
从 "性能 "模式切换到 "平衡 "模式时,图形性能会有所降低,这在下面的 "GPU 性能 "部分会提到。性能模式下 GPU 板功耗和时钟频率分别从 114 W 和 2640 MHz 降至平衡模式下的 2280 MHz 和 77 W。另一方面,由于整体性能较慢,在平衡模式下运行时,核心温度会明显降低约 10 摄氏度。
| CPU 时钟 (GHz) | GPU 时钟 (MHz) | CPU 平均温度 (°C) | GPU 平均温度(°C) | |
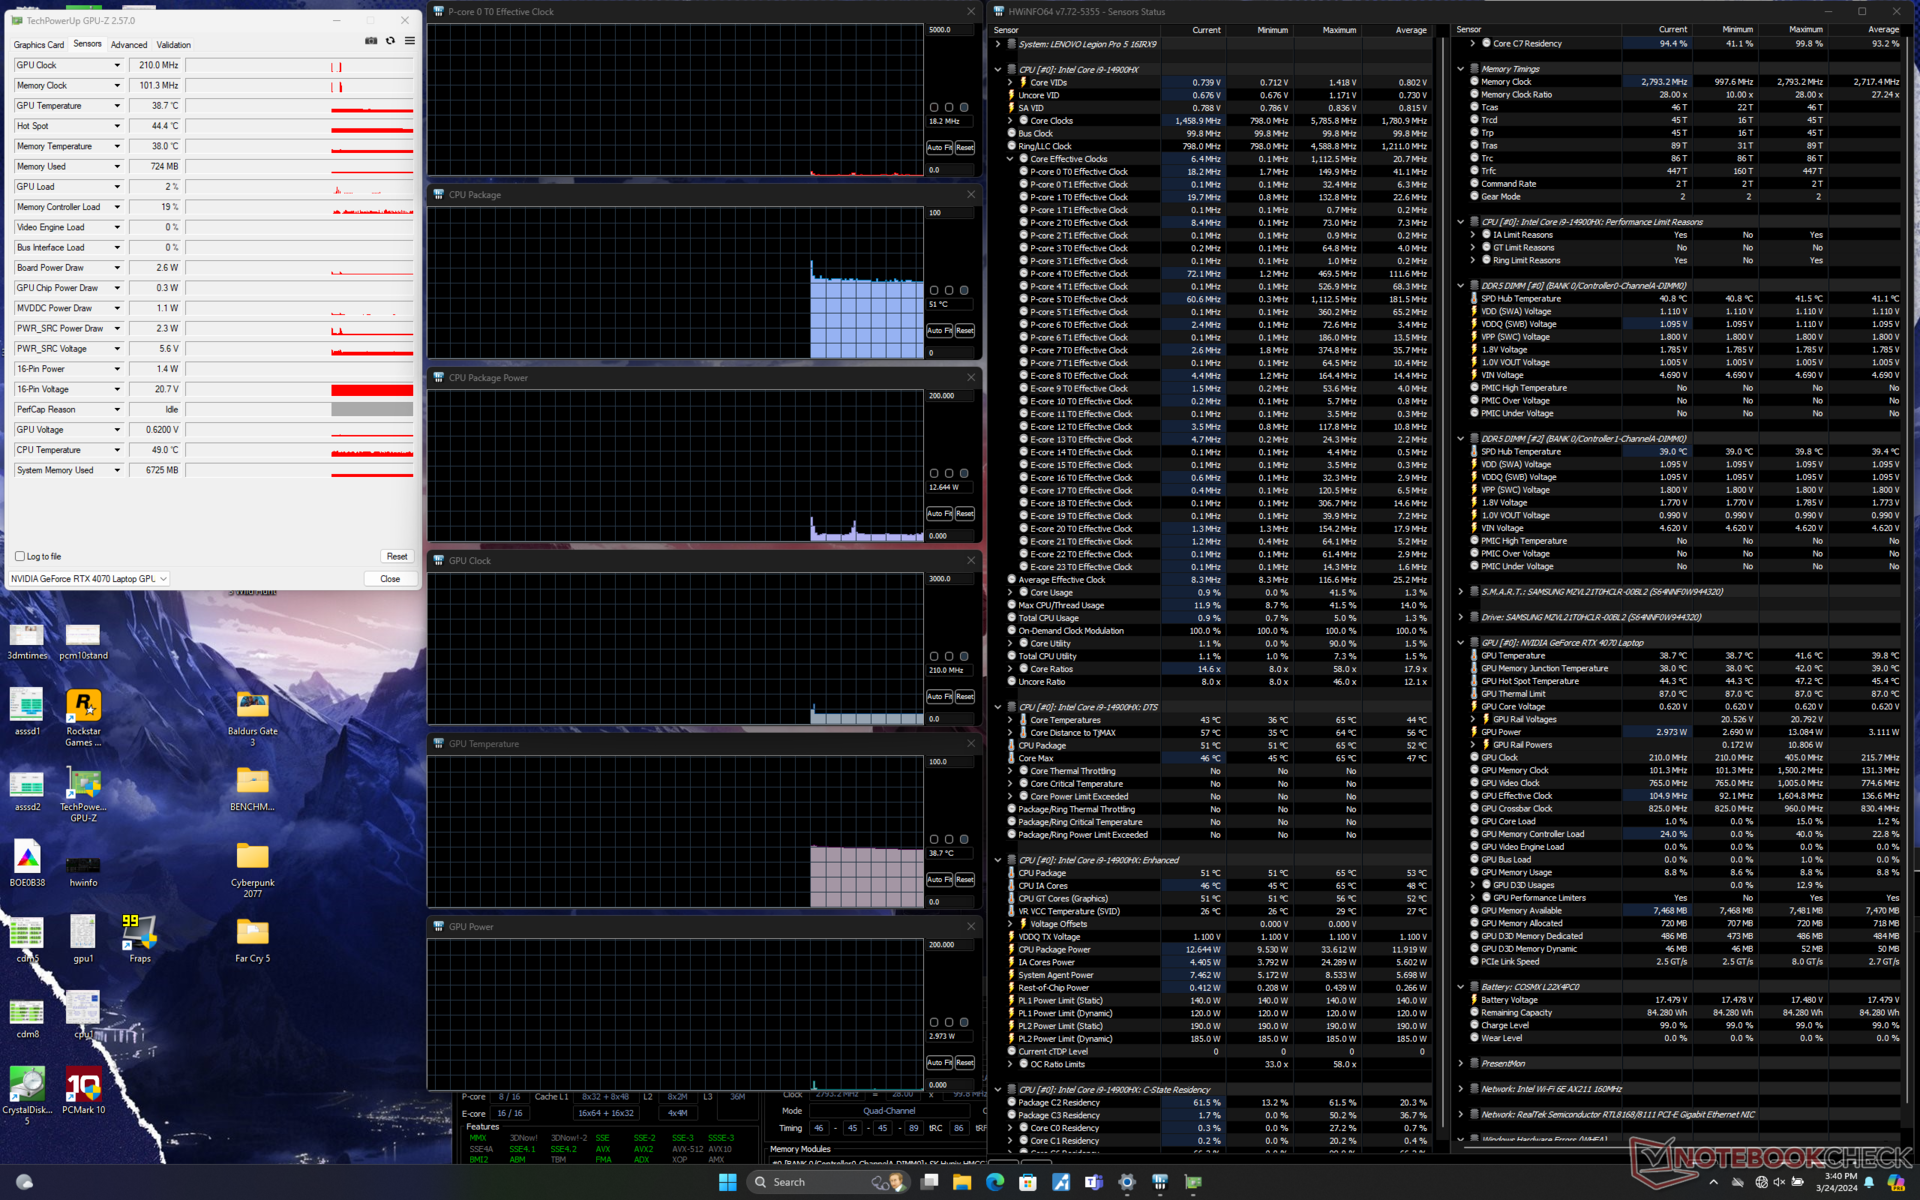
| 系统闲置 | -- | -- | 51 | 39 |
| Prime95 压力 | 2.8 | -- | 89 | 54 |
| Prime95 + FurMark 压力 | ~2.1 | 2100 - 2700 | 95 | 70 - 88 |
| Witcher 3 压力(平衡模式) | ~0.5 | 2280 | ~78 | 63 |
| Witcher 3 压力(性能模式) | ~0.9 | 2640 | ~88 | 72 |
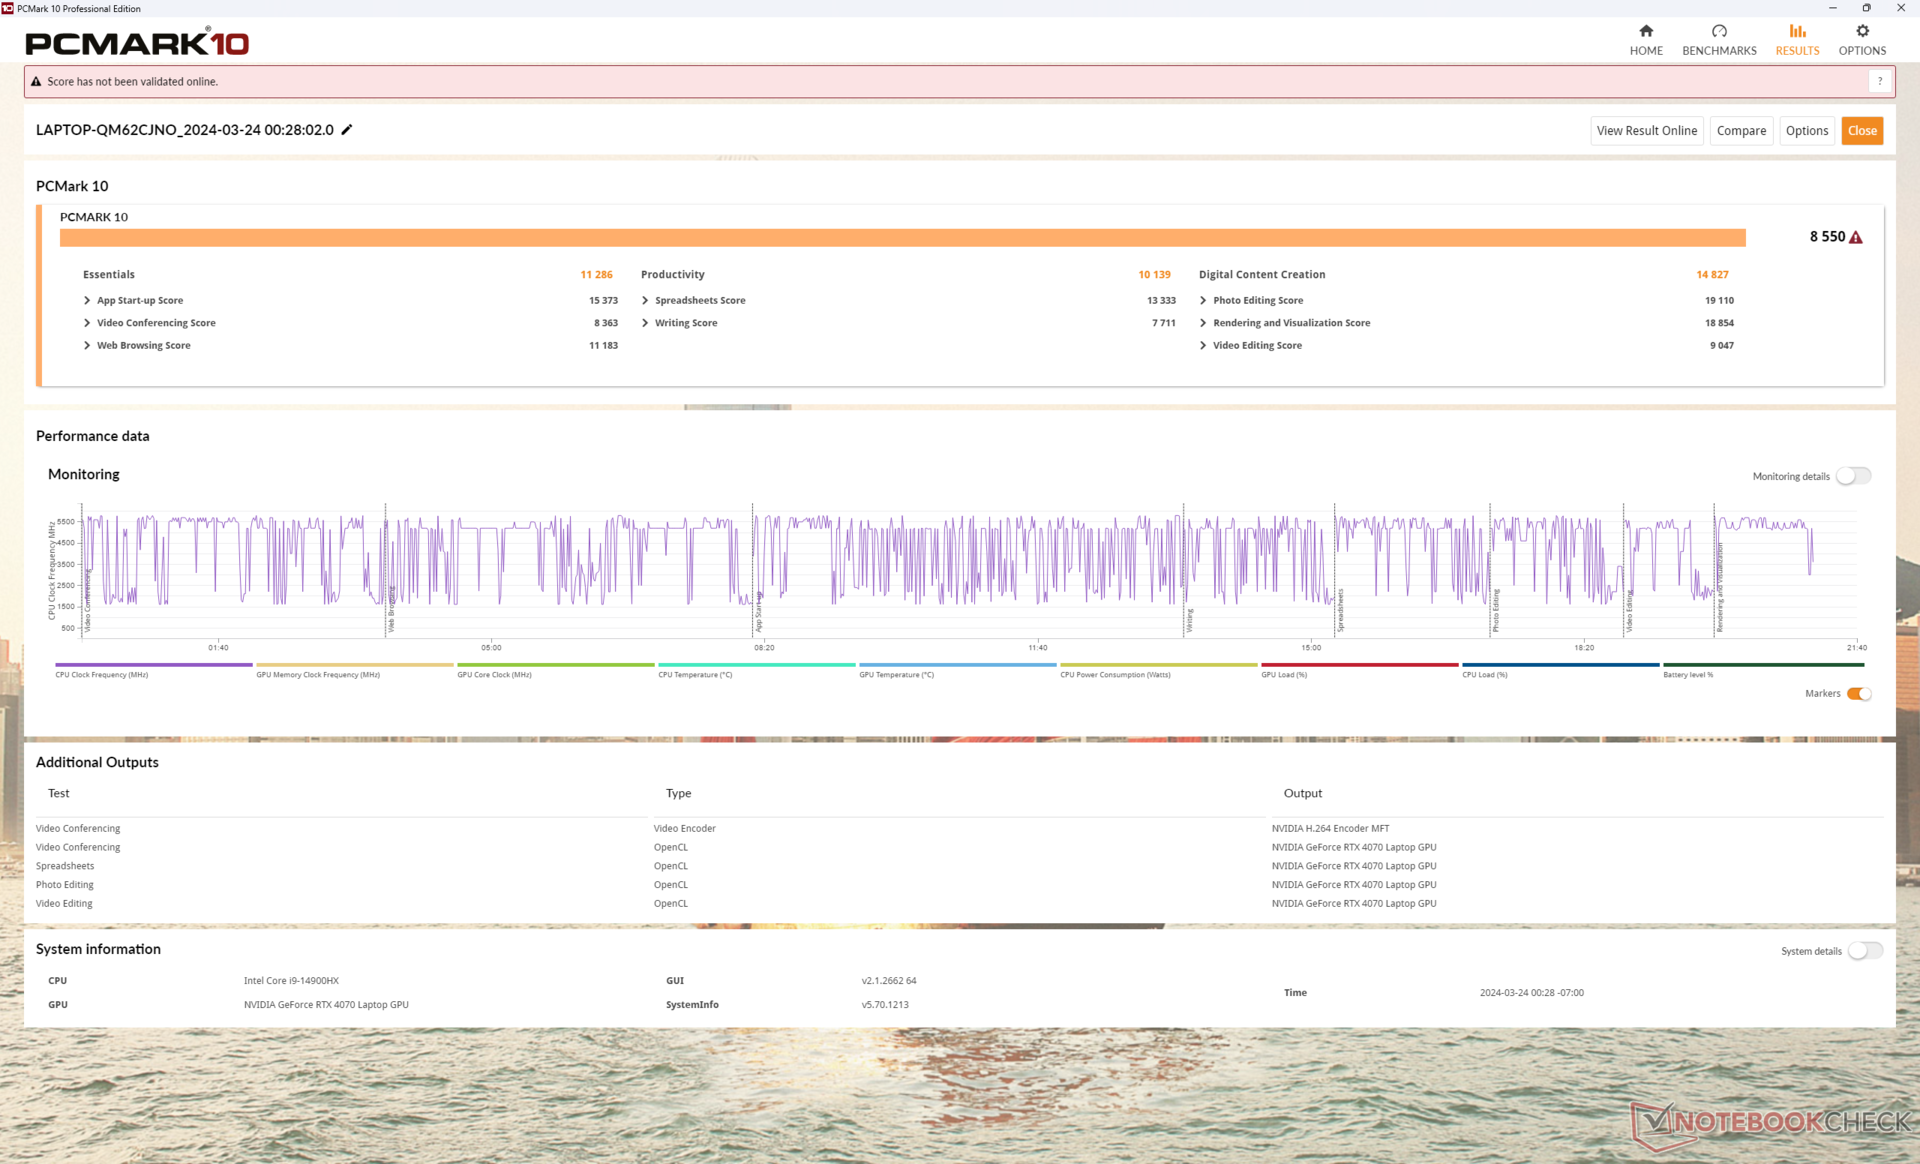
系统性能
由于我们的设备配置了更高端的酷睿 i9 和GeForce RTX 部件,因此 PCMark 分数一直领先于旧款Legion Pro 5 16IRX8。我们也没有遇到在最近的 Alienware m16 R2 上遇到的睡眠唤醒问题。
CrossMark: Overall | Productivity | Creativity | Responsiveness
WebXPRT 3: Overall
WebXPRT 4: Overall
Mozilla Kraken 1.1: Total
| PCMark 10 / Score | |
| Lenovo Legion Pro 5 16IRX9 | |
| Average Intel Core i9-14900HX, NVIDIA GeForce RTX 4070 Laptop GPU (7768 - 8550, n=8) | |
| HP Omen Transcend 16-u1095ng | |
| Alienware m16 R2 | |
| Lenovo Legion Pro 5 16IRX8 | |
| MSI Stealth 16 Mercedes-AMG Motorsport A13VG | |
| Asus ROG Zephyrus G16 2024 GU605M | |
| PCMark 10 / Essentials | |
| Lenovo Legion Pro 5 16IRX9 | |
| Average Intel Core i9-14900HX, NVIDIA GeForce RTX 4070 Laptop GPU (10104 - 11815, n=8) | |
| Lenovo Legion Pro 5 16IRX8 | |
| MSI Stealth 16 Mercedes-AMG Motorsport A13VG | |
| HP Omen Transcend 16-u1095ng | |
| Alienware m16 R2 | |
| Asus ROG Zephyrus G16 2024 GU605M | |
| PCMark 10 / Productivity | |
| Average Intel Core i9-14900HX, NVIDIA GeForce RTX 4070 Laptop GPU (9577 - 11103, n=8) | |
| HP Omen Transcend 16-u1095ng | |
| Lenovo Legion Pro 5 16IRX9 | |
| MSI Stealth 16 Mercedes-AMG Motorsport A13VG | |
| Alienware m16 R2 | |
| Asus ROG Zephyrus G16 2024 GU605M | |
| Lenovo Legion Pro 5 16IRX8 | |
| PCMark 10 / Digital Content Creation | |
| Lenovo Legion Pro 5 16IRX9 | |
| Average Intel Core i9-14900HX, NVIDIA GeForce RTX 4070 Laptop GPU (12114 - 14827, n=8) | |
| Alienware m16 R2 | |
| Lenovo Legion Pro 5 16IRX8 | |
| HP Omen Transcend 16-u1095ng | |
| Asus ROG Zephyrus G16 2024 GU605M | |
| MSI Stealth 16 Mercedes-AMG Motorsport A13VG | |
| CrossMark / Overall | |
| Average Intel Core i9-14900HX, NVIDIA GeForce RTX 4070 Laptop GPU (2002 - 2312, n=7) | |
| Lenovo Legion Pro 5 16IRX9 | |
| Alienware m16 R2 | |
| Asus ROG Zephyrus G16 2024 GU605M | |
| Lenovo Legion Pro 5 16IRX8 | |
| CrossMark / Productivity | |
| Average Intel Core i9-14900HX, NVIDIA GeForce RTX 4070 Laptop GPU (1827 - 2191, n=7) | |
| Lenovo Legion Pro 5 16IRX9 | |
| Alienware m16 R2 | |
| Asus ROG Zephyrus G16 2024 GU605M | |
| Lenovo Legion Pro 5 16IRX8 | |
| CrossMark / Creativity | |
| Average Intel Core i9-14900HX, NVIDIA GeForce RTX 4070 Laptop GPU (2258 - 2458, n=7) | |
| Lenovo Legion Pro 5 16IRX9 | |
| Asus ROG Zephyrus G16 2024 GU605M | |
| Alienware m16 R2 | |
| Lenovo Legion Pro 5 16IRX8 | |
| CrossMark / Responsiveness | |
| Average Intel Core i9-14900HX, NVIDIA GeForce RTX 4070 Laptop GPU (1734 - 2330, n=7) | |
| Lenovo Legion Pro 5 16IRX9 | |
| Lenovo Legion Pro 5 16IRX8 | |
| Alienware m16 R2 | |
| Asus ROG Zephyrus G16 2024 GU605M | |
| WebXPRT 3 / Overall | |
| HP Omen Transcend 16-u1095ng | |
| Lenovo Legion Pro 5 16IRX9 | |
| Average Intel Core i9-14900HX, NVIDIA GeForce RTX 4070 Laptop GPU (269 - 342, n=8) | |
| Alienware m16 R2 | |
| Asus ROG Zephyrus G16 2024 GU605M | |
| Lenovo Legion Pro 5 16IRX8 | |
| WebXPRT 4 / Overall | |
| Average Intel Core i9-14900HX, NVIDIA GeForce RTX 4070 Laptop GPU (291 - 304, n=6) | |
| Lenovo Legion Pro 5 16IRX9 | |
| Alienware m16 R2 | |
| Asus ROG Zephyrus G16 2024 GU605M | |
| Lenovo Legion Pro 5 16IRX8 | |
| Mozilla Kraken 1.1 / Total | |
| Asus ROG Zephyrus G16 2024 GU605M | |
| Alienware m16 R2 | |
| Lenovo Legion Pro 5 16IRX8 | |
| Lenovo Legion Pro 5 16IRX9 | |
| Average Intel Core i9-14900HX, NVIDIA GeForce RTX 4070 Laptop GPU (431 - 469, n=8) | |
| HP Omen Transcend 16-u1095ng | |
* ... smaller is better
| PCMark 10 Score | 8550 points | |
Help | ||
| AIDA64 / Memory Copy | |
| Asus ROG Zephyrus G16 2024 GU605M | |
| Lenovo Legion Pro 5 16IRX9 | |
| HP Omen Transcend 16-u1095ng | |
| Average Intel Core i9-14900HX (38028 - 83392, n=36) | |
| MSI Stealth 16 Mercedes-AMG Motorsport A13VG | |
| Alienware m16 R2 | |
| Lenovo Legion Pro 5 16IRX8 | |
| AIDA64 / Memory Read | |
| Asus ROG Zephyrus G16 2024 GU605M | |
| Lenovo Legion Pro 5 16IRX9 | |
| HP Omen Transcend 16-u1095ng | |
| Average Intel Core i9-14900HX (43306 - 87568, n=36) | |
| Alienware m16 R2 | |
| MSI Stealth 16 Mercedes-AMG Motorsport A13VG | |
| Lenovo Legion Pro 5 16IRX8 | |
| AIDA64 / Memory Write | |
| HP Omen Transcend 16-u1095ng | |
| Lenovo Legion Pro 5 16IRX9 | |
| Asus ROG Zephyrus G16 2024 GU605M | |
| MSI Stealth 16 Mercedes-AMG Motorsport A13VG | |
| Average Intel Core i9-14900HX (37146 - 80589, n=36) | |
| Alienware m16 R2 | |
| Lenovo Legion Pro 5 16IRX8 | |
| AIDA64 / Memory Latency | |
| Asus ROG Zephyrus G16 2024 GU605M | |
| Alienware m16 R2 | |
| MSI Stealth 16 Mercedes-AMG Motorsport A13VG | |
| HP Omen Transcend 16-u1095ng | |
| Average Intel Core i9-14900HX (76.1 - 105, n=36) | |
| Lenovo Legion Pro 5 16IRX9 | |
| Lenovo Legion Pro 5 16IRX8 | |
* ... smaller is better
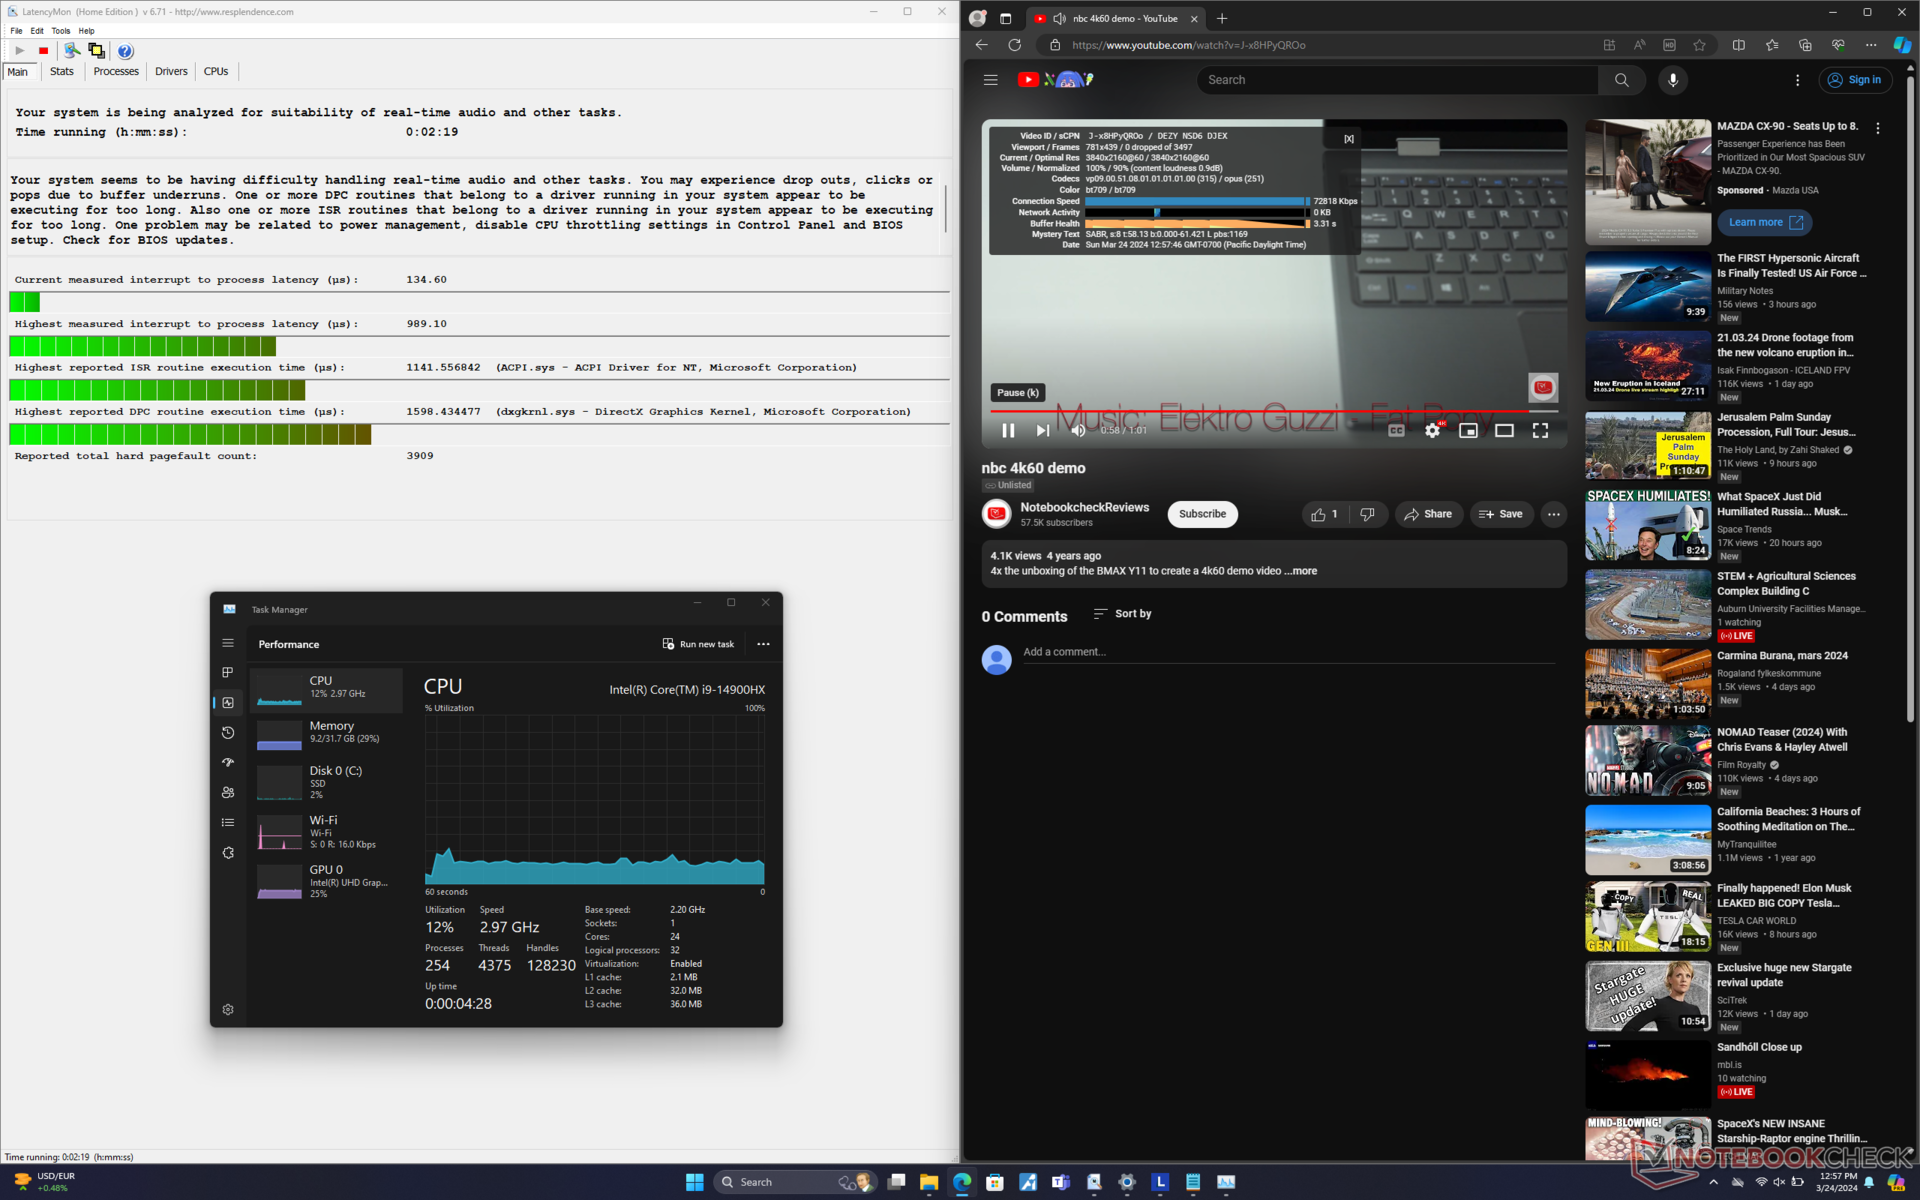
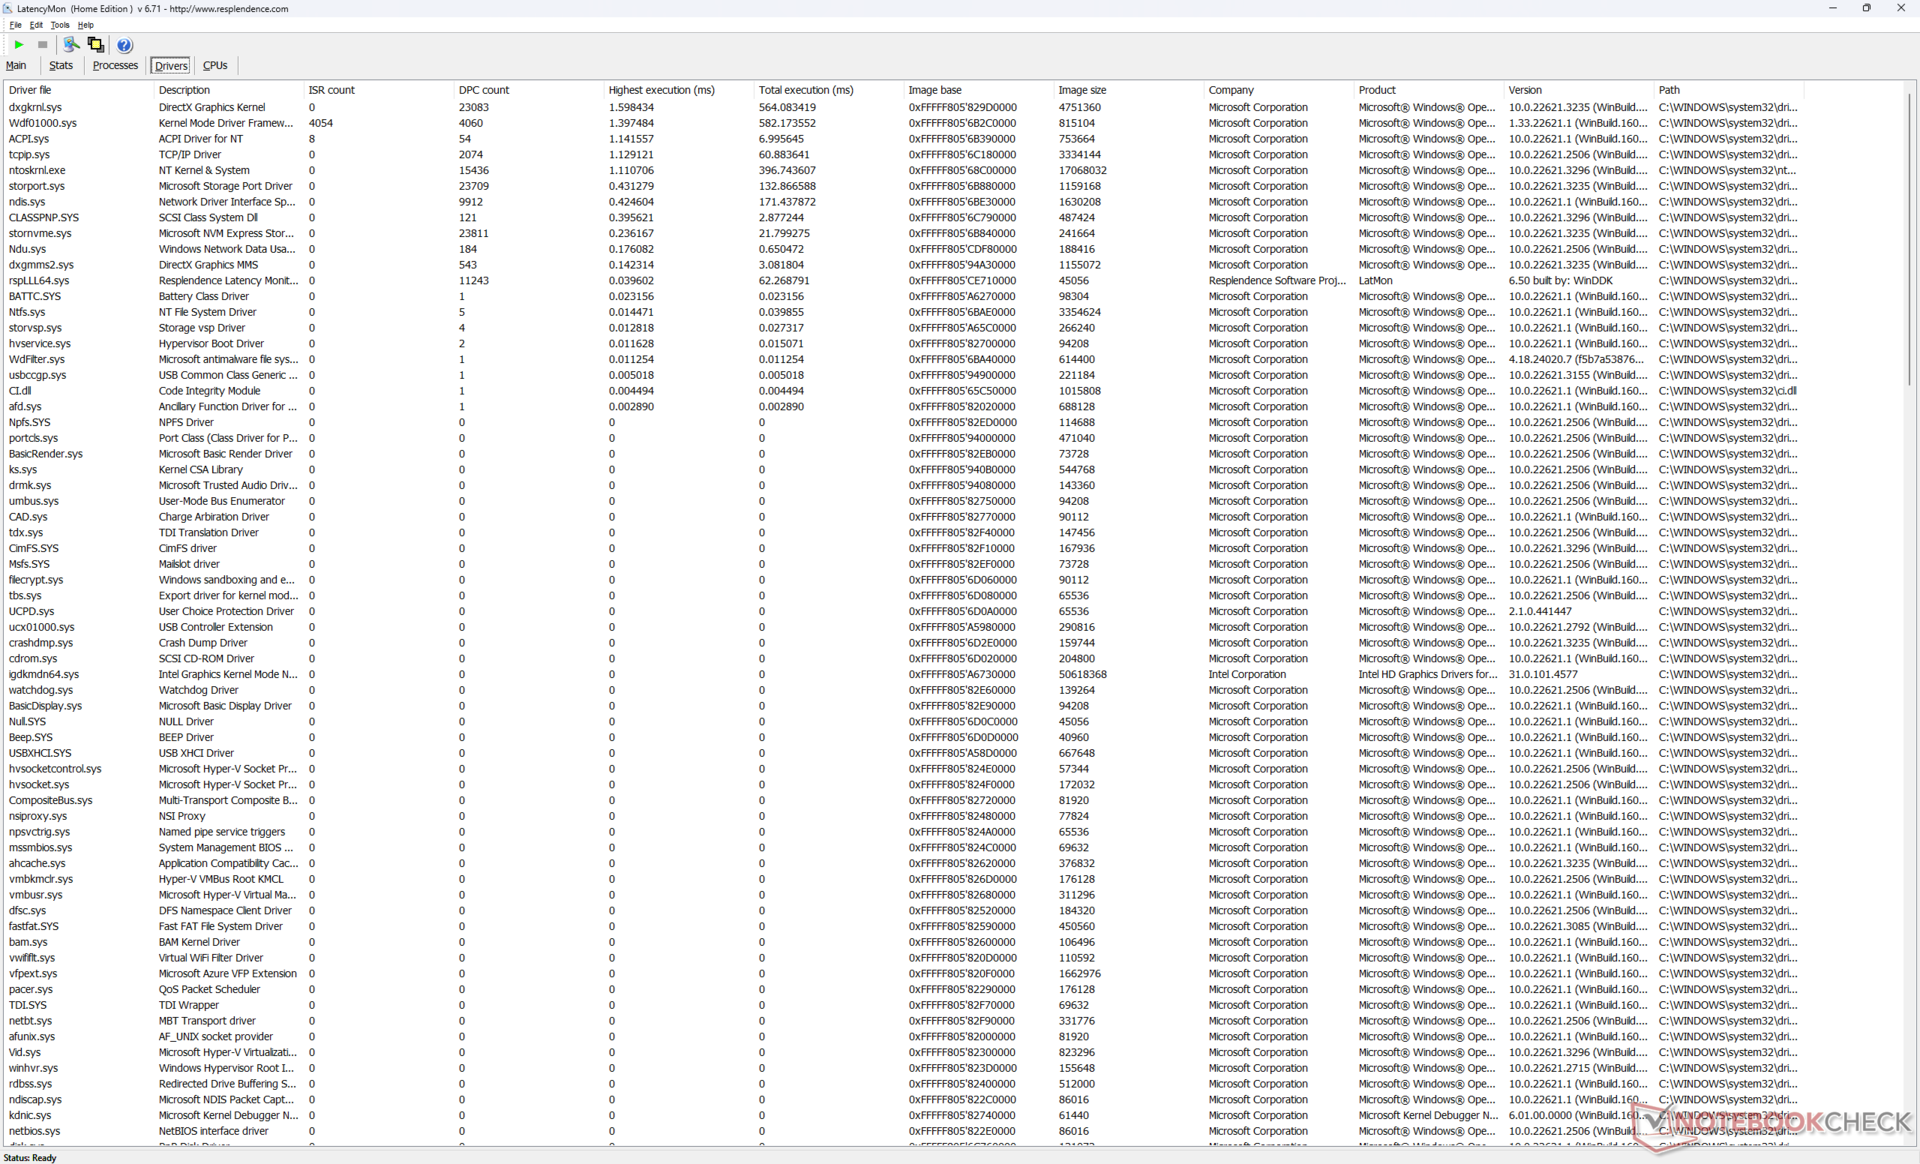
DPC 延迟
在打开我们主页的多个浏览器标签页时,LatencyMon 会显示 DPC 问题。在 iGPU 模式下,以 60 FPS 播放 4K 视频也非常完美,没有掉帧记录。
| DPC Latencies / LatencyMon - interrupt to process latency (max), Web, Youtube, Prime95 | |
| MSI Stealth 16 Mercedes-AMG Motorsport A13VG | |
| Asus ROG Zephyrus G16 2024 GU605M | |
| Alienware m16 R2 | |
| HP Omen Transcend 16-u1095ng | |
| Lenovo Legion Pro 5 16IRX9 | |
| Lenovo Legion Pro 5 16IRX8 | |
* ... smaller is better
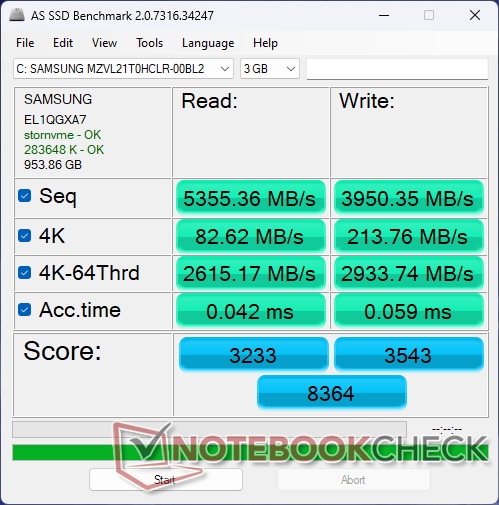
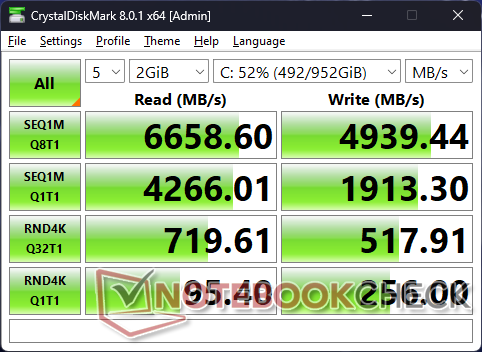
存储设备
我们的设备配有 三星 PM9A1而不是去年Legion Pro 5 16IRX8 上的 SK Hynix PC801。有趣的是,在 DiskSpd 循环测试中,我们的三星硬盘会出现节流现象,传输速率从 6600 MB/s 降至 3300 MB/s。与此同时,去年型号中的 SK Hynix 硬盘在类似条件下保持更高的传输速率却没有问题,如下图所示。遗憾的是,目前还没有简单的方法可以在购买前知道该机型将配备哪种固态硬盘。

* ... smaller is better
Disk Throttling: DiskSpd Read Loop, Queue Depth 8
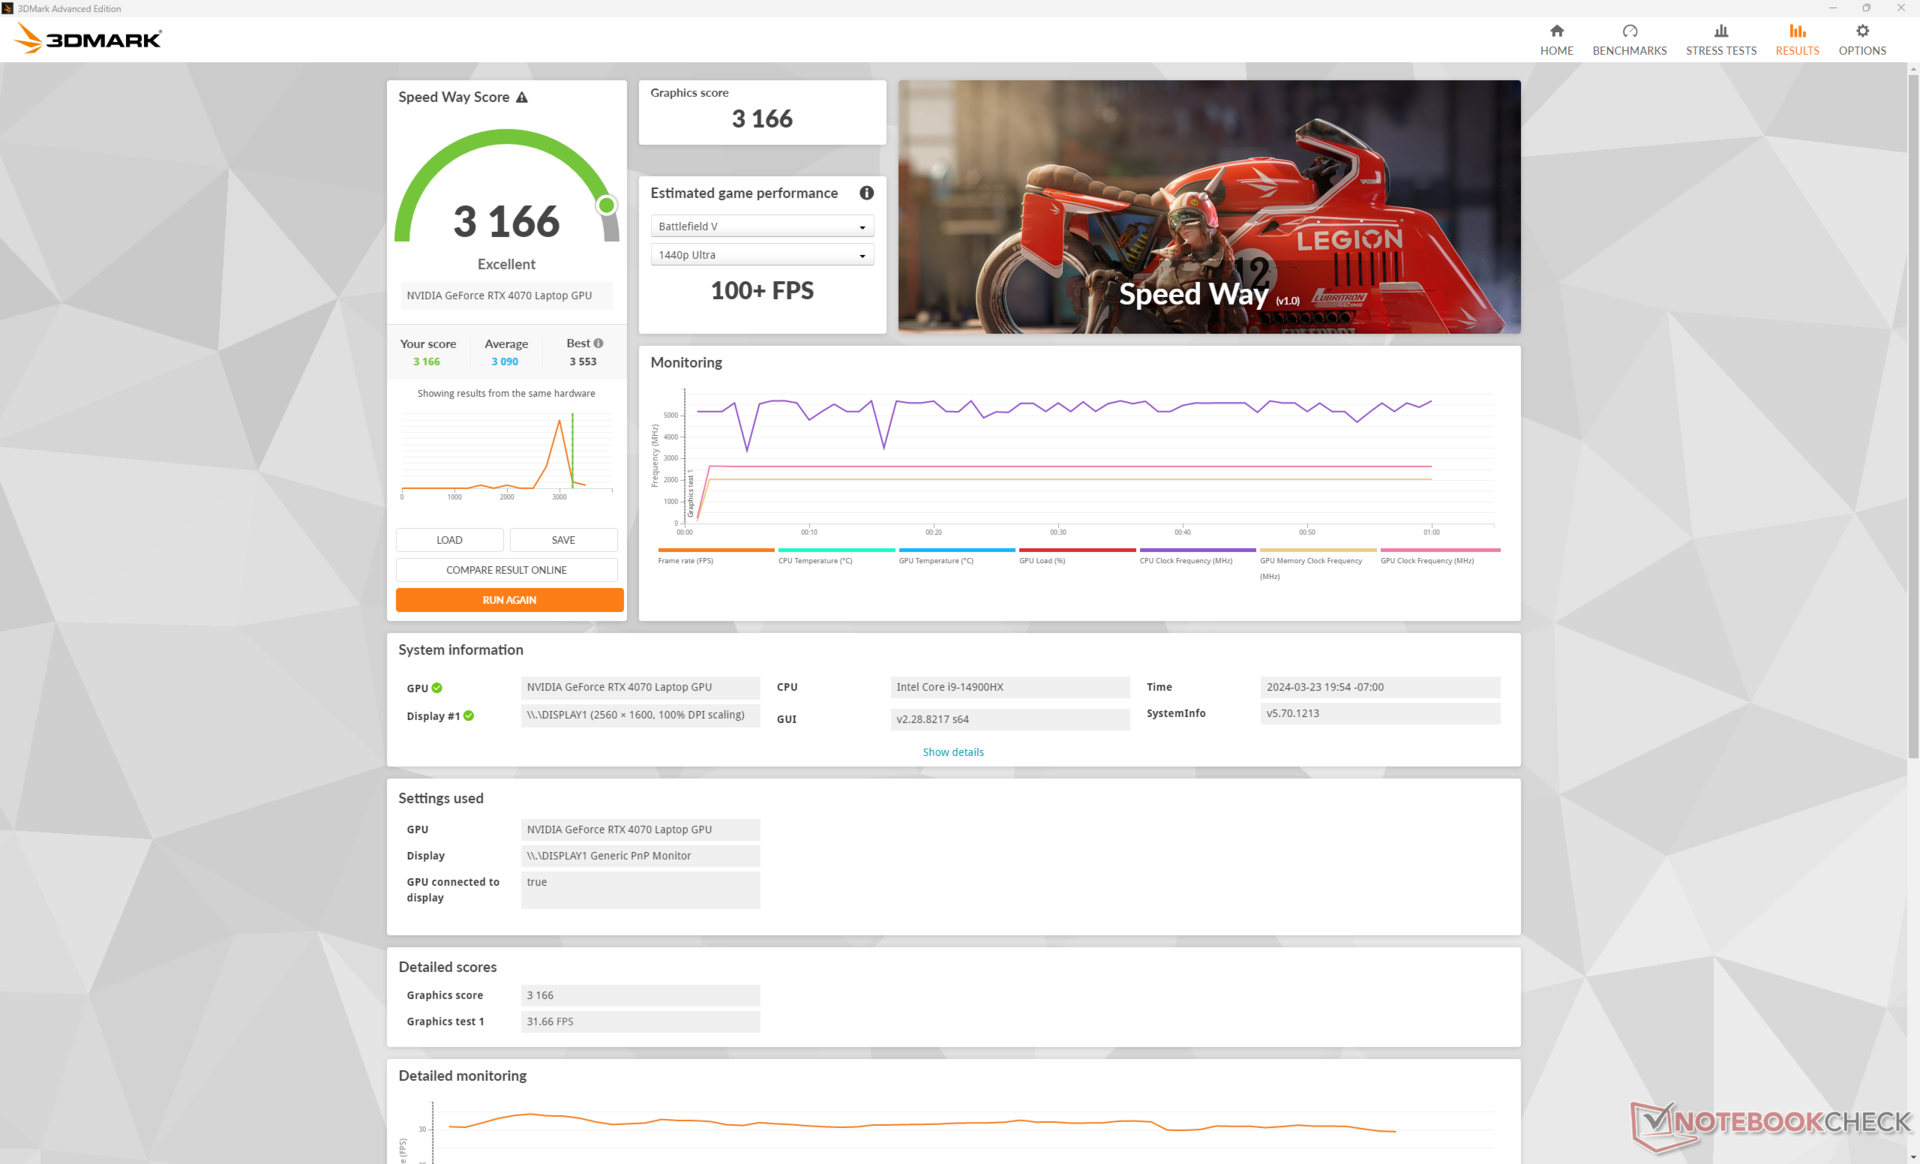
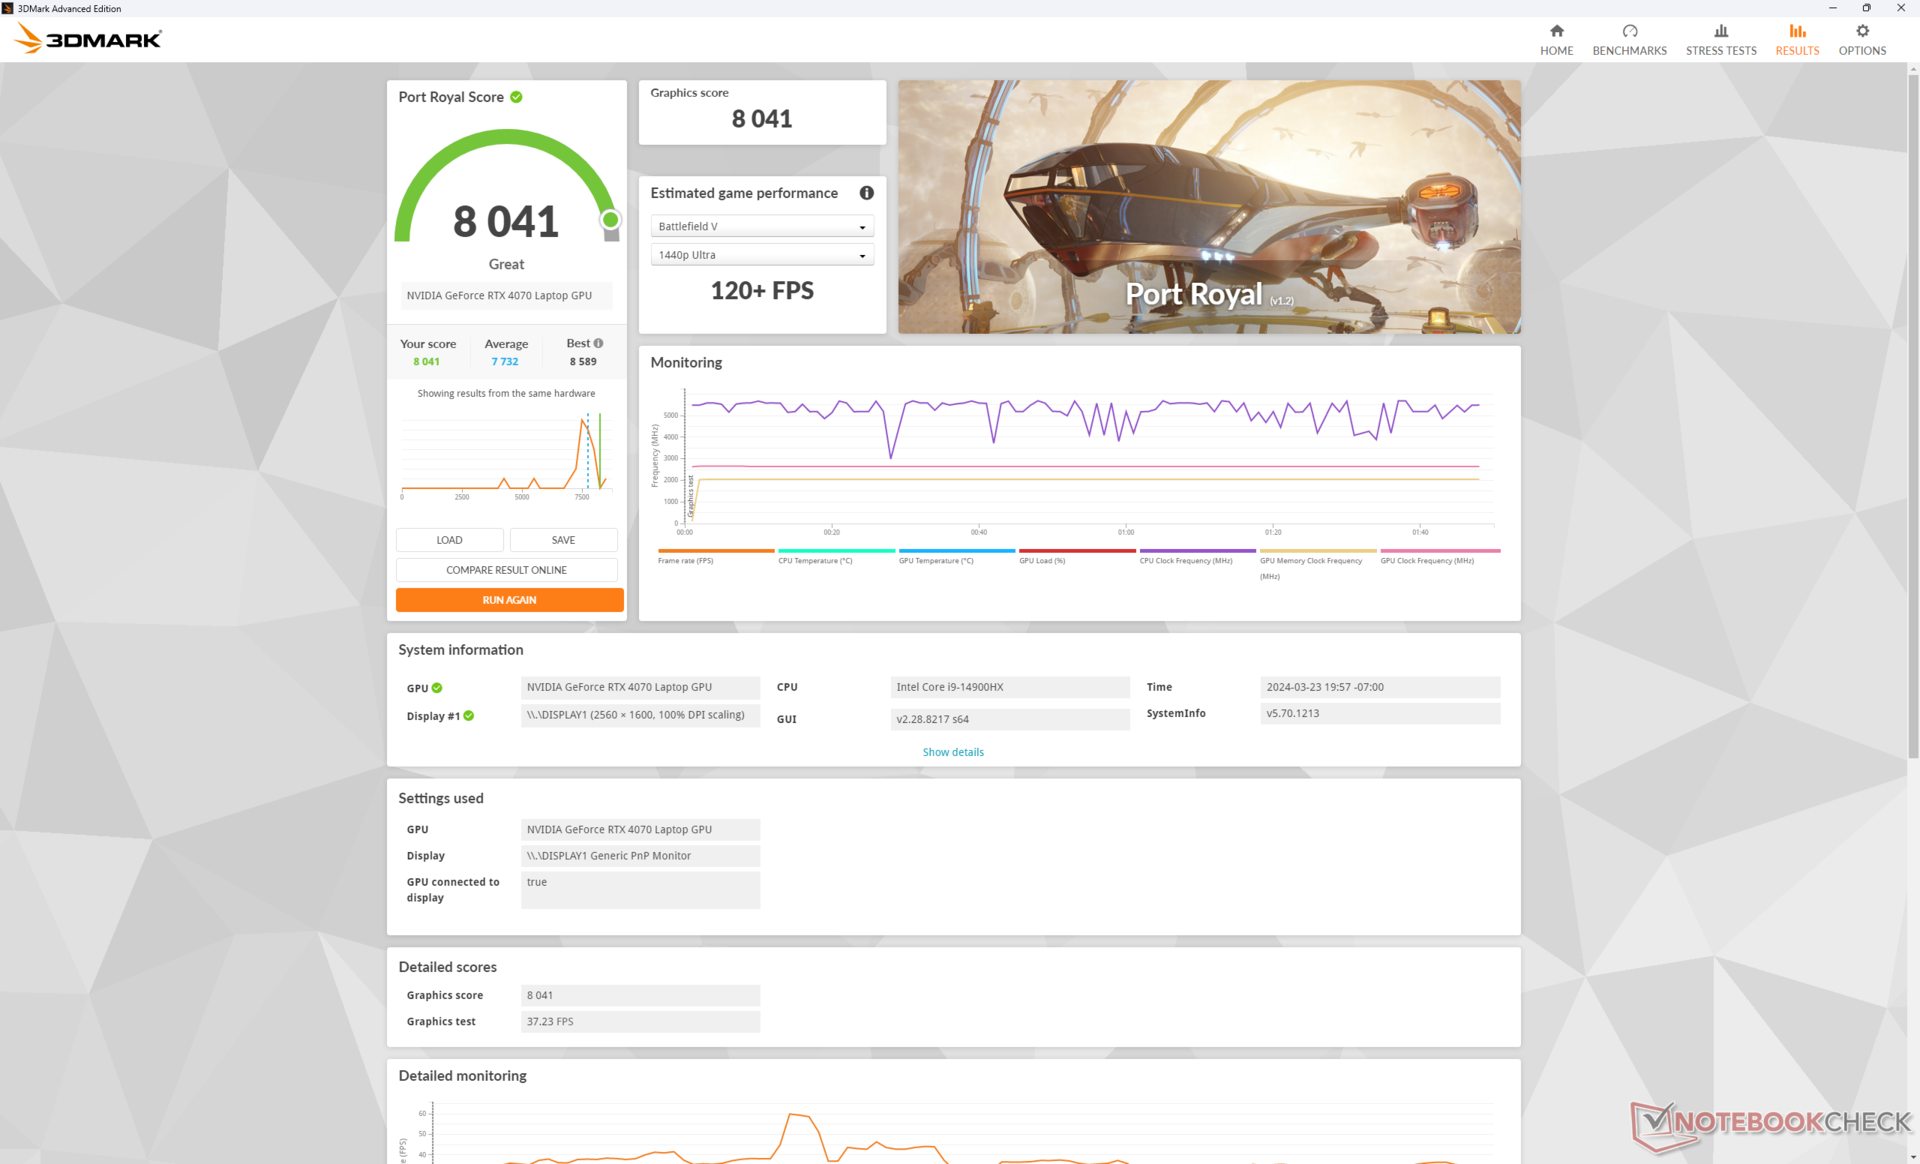
图形处理器性能
显卡选项包括GeForce RTX 4050、4060 和 4070,TGP 目标同样为 140 W。我们敢打赌,该机型可以支持更快的 RTX 4080和 4090 选项,但联想希望将这些高端选项保留给成本更高的Legion Pro 7 系列。不过 RTX 4070在我们的Legion Pro 5 16 中运行得非常好,其基准测试结果比我们数据库中具有相同 GPU 选项的普通笔记本电脑快 15%。
降级到 RTX 4060或 4050 配置预计将分别影响图形性能约 10% 至 20% 和 25% 至 35%。从旧版 RTX 3070 Ti笔记本电脑的用户不会看到明显的好处,除非该游戏支持 DLSS 3,因为该功能仍然是 RTX 40 Ada Lovelace GPU 的独有功能。
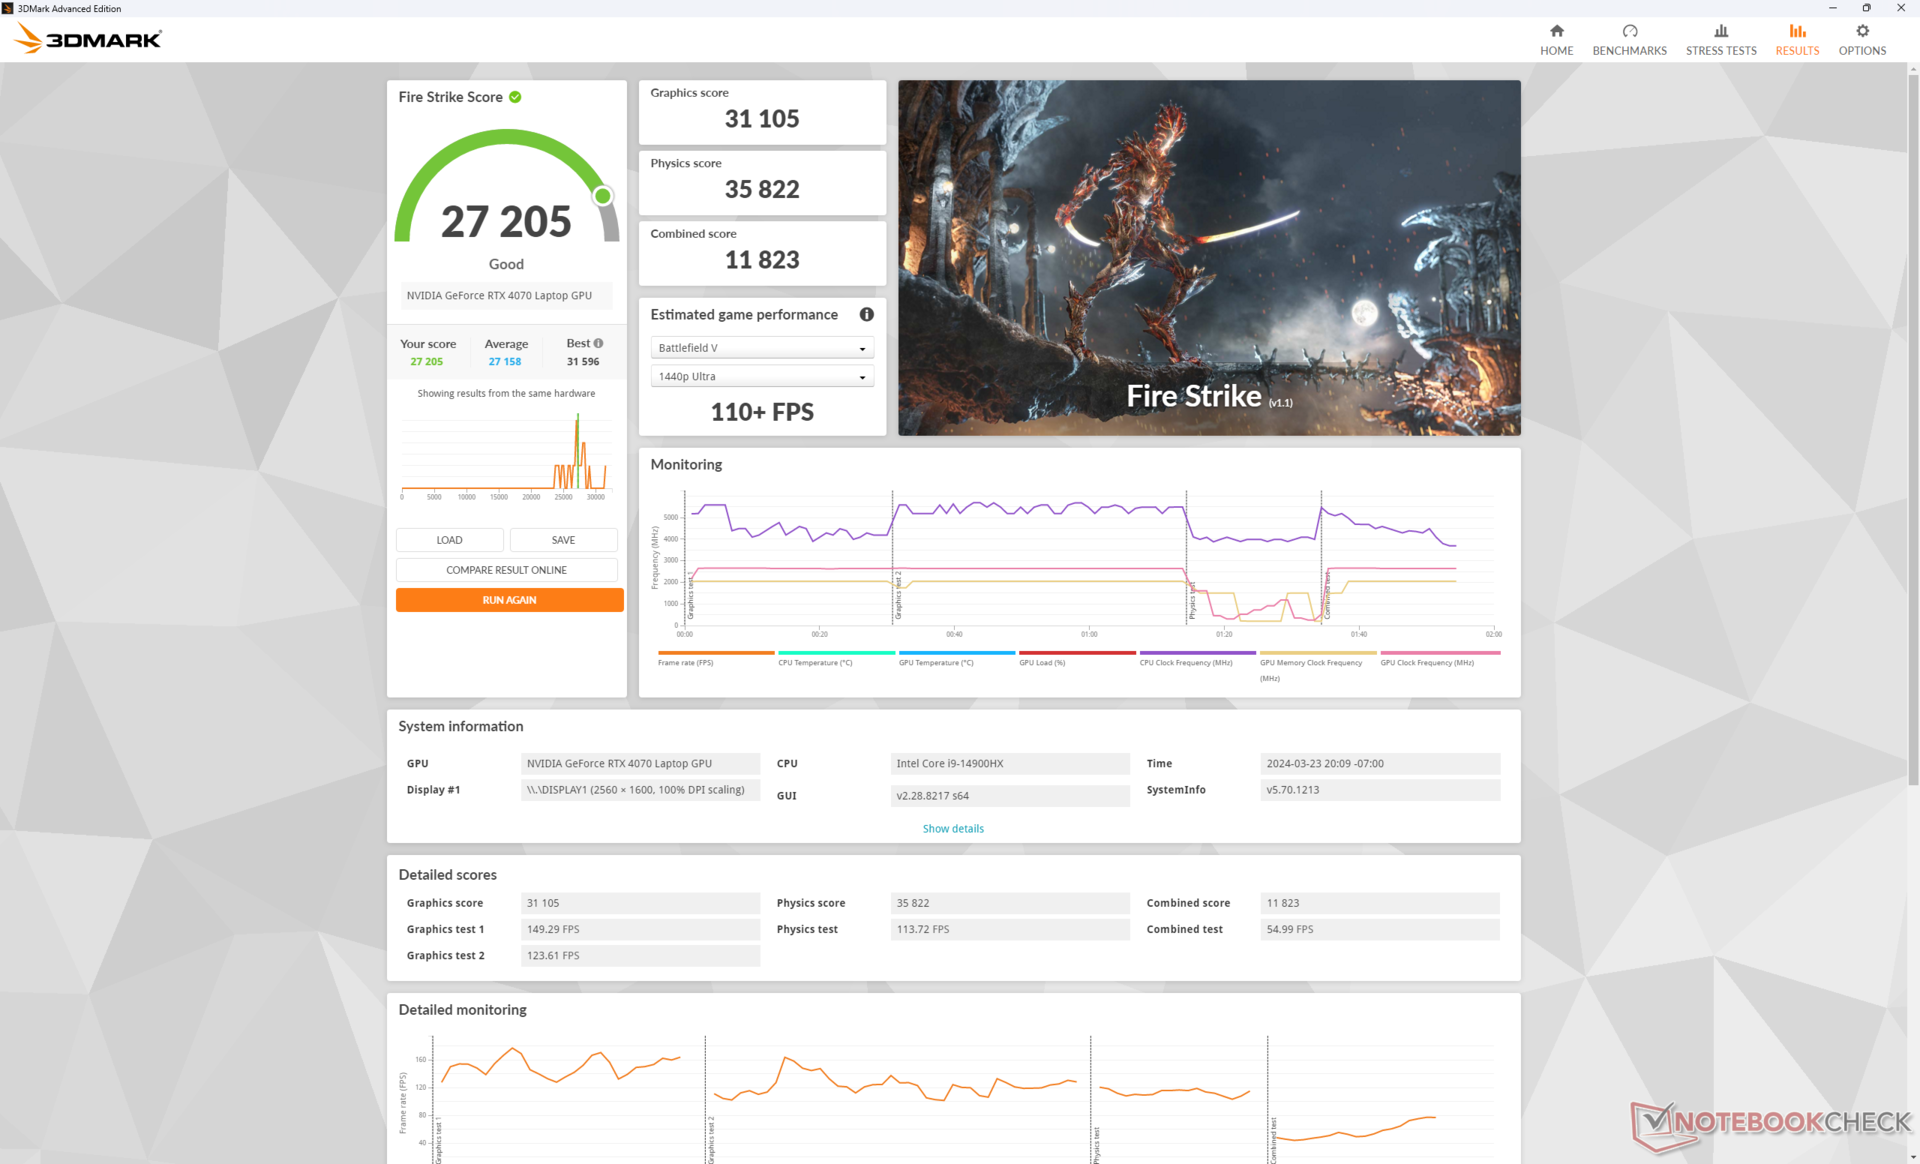
| 电源配置文件 | 图形分数 | 物理得分 | 综合得分 |
| 性能模式 | 31105 | 35822 | 11823 |
| 均衡模式 | 29127 (-6%) | 37119 (+4%) | 11040 (-7%) |
| 电池电量 | 21813 (-29%) | 21747 (-39%) | 6324 (-47%) |
将系统设置为 "平衡 "模式而非 "性能 "模式,GPU 性能将略微降低约 6%,而 CPU 性能则不受影响。
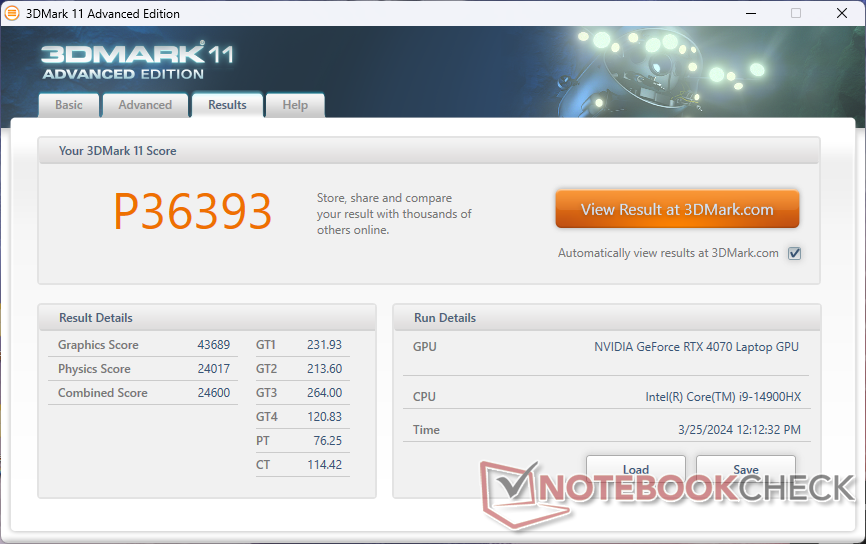
| 3DMark 11 Performance | 36393 points | |
| 3DMark Fire Strike Score | 27205 points | |
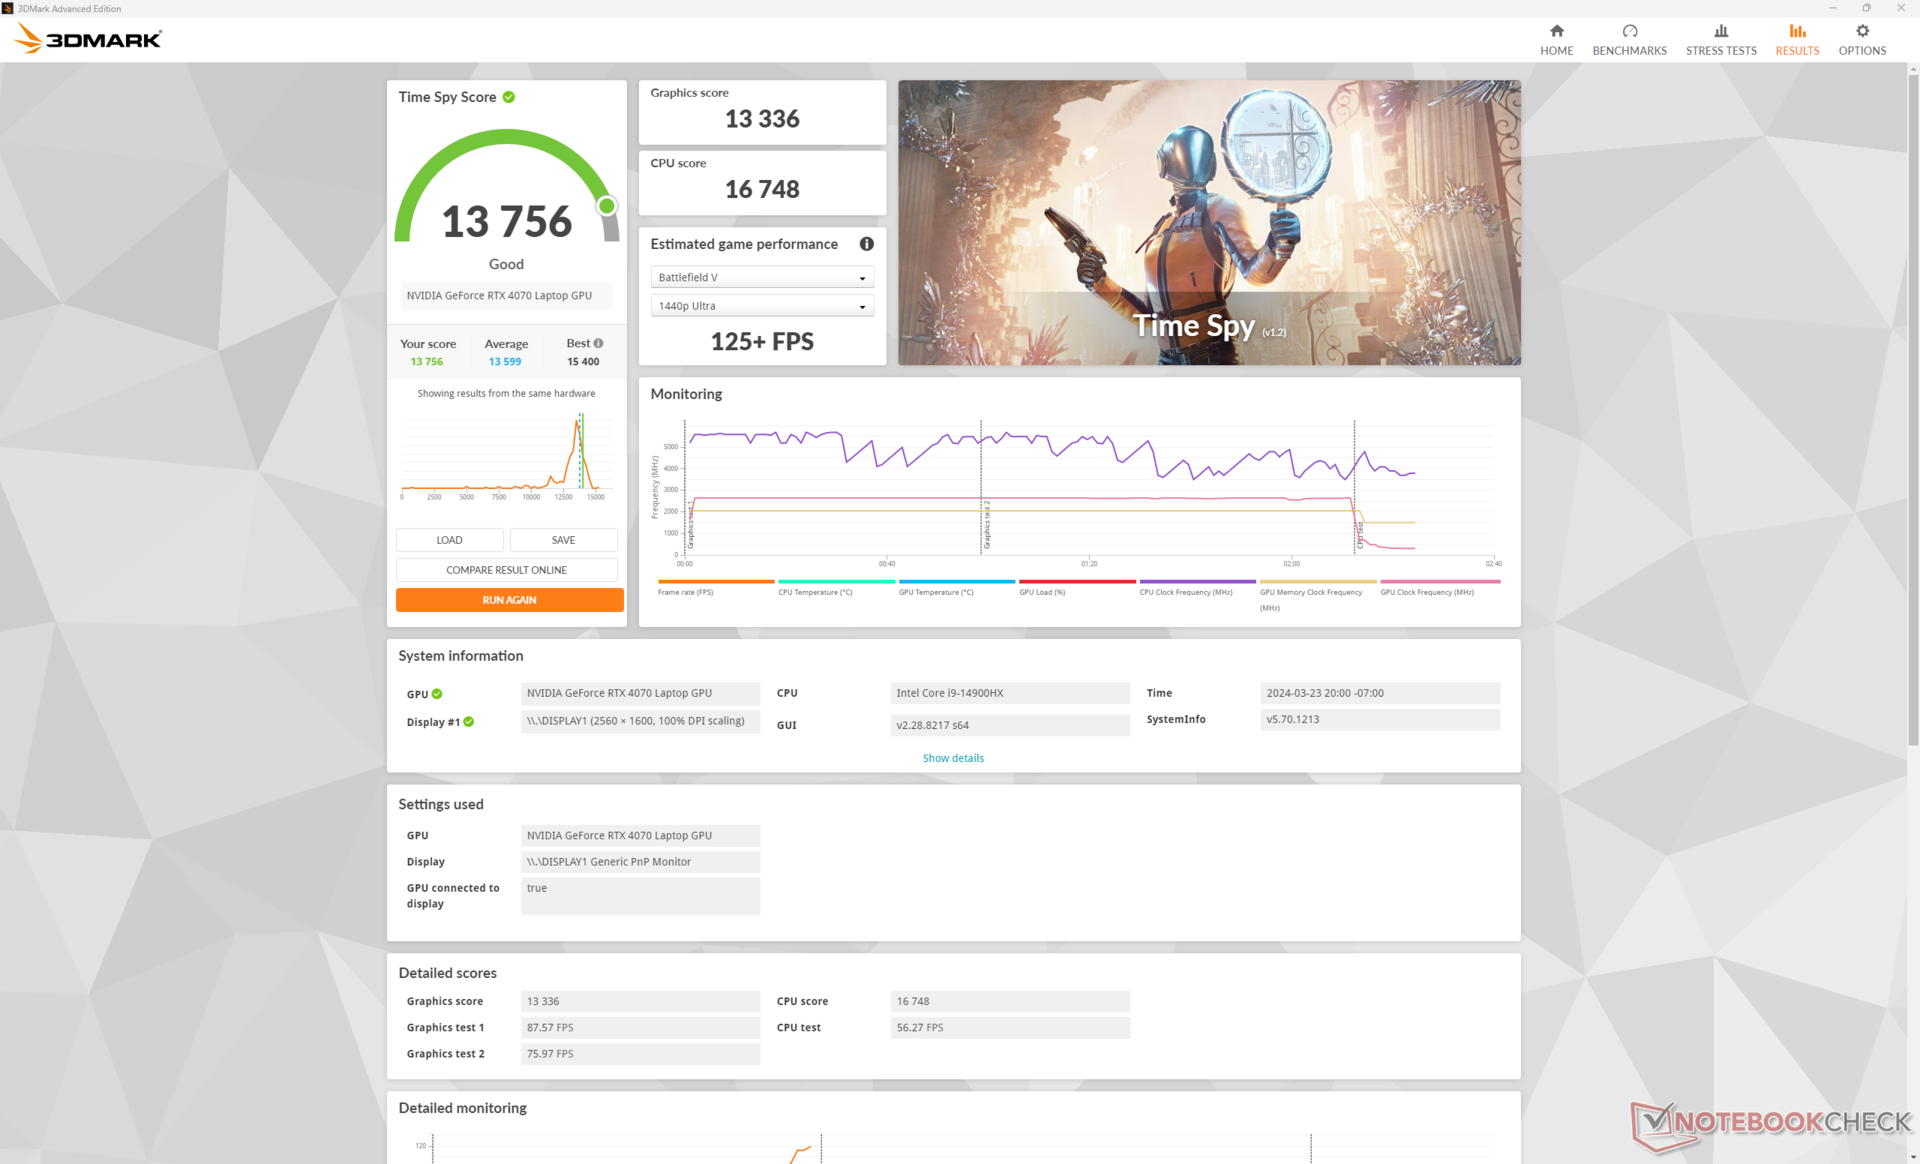
| 3DMark Time Spy Score | 13756 points | |
Help | ||
* ... smaller is better
游戏性能
我们的联想几乎一直比 Alienware m16 R2 高出 5%到 10%,尽管两者都配备了相同的 140 WGeForce RTX 4070 GPU。这种差异可能归因于我们更快的酷睿 i9-14900HX CPU,而 Alienware 配备的是酷睿 Ultra 7 155H。
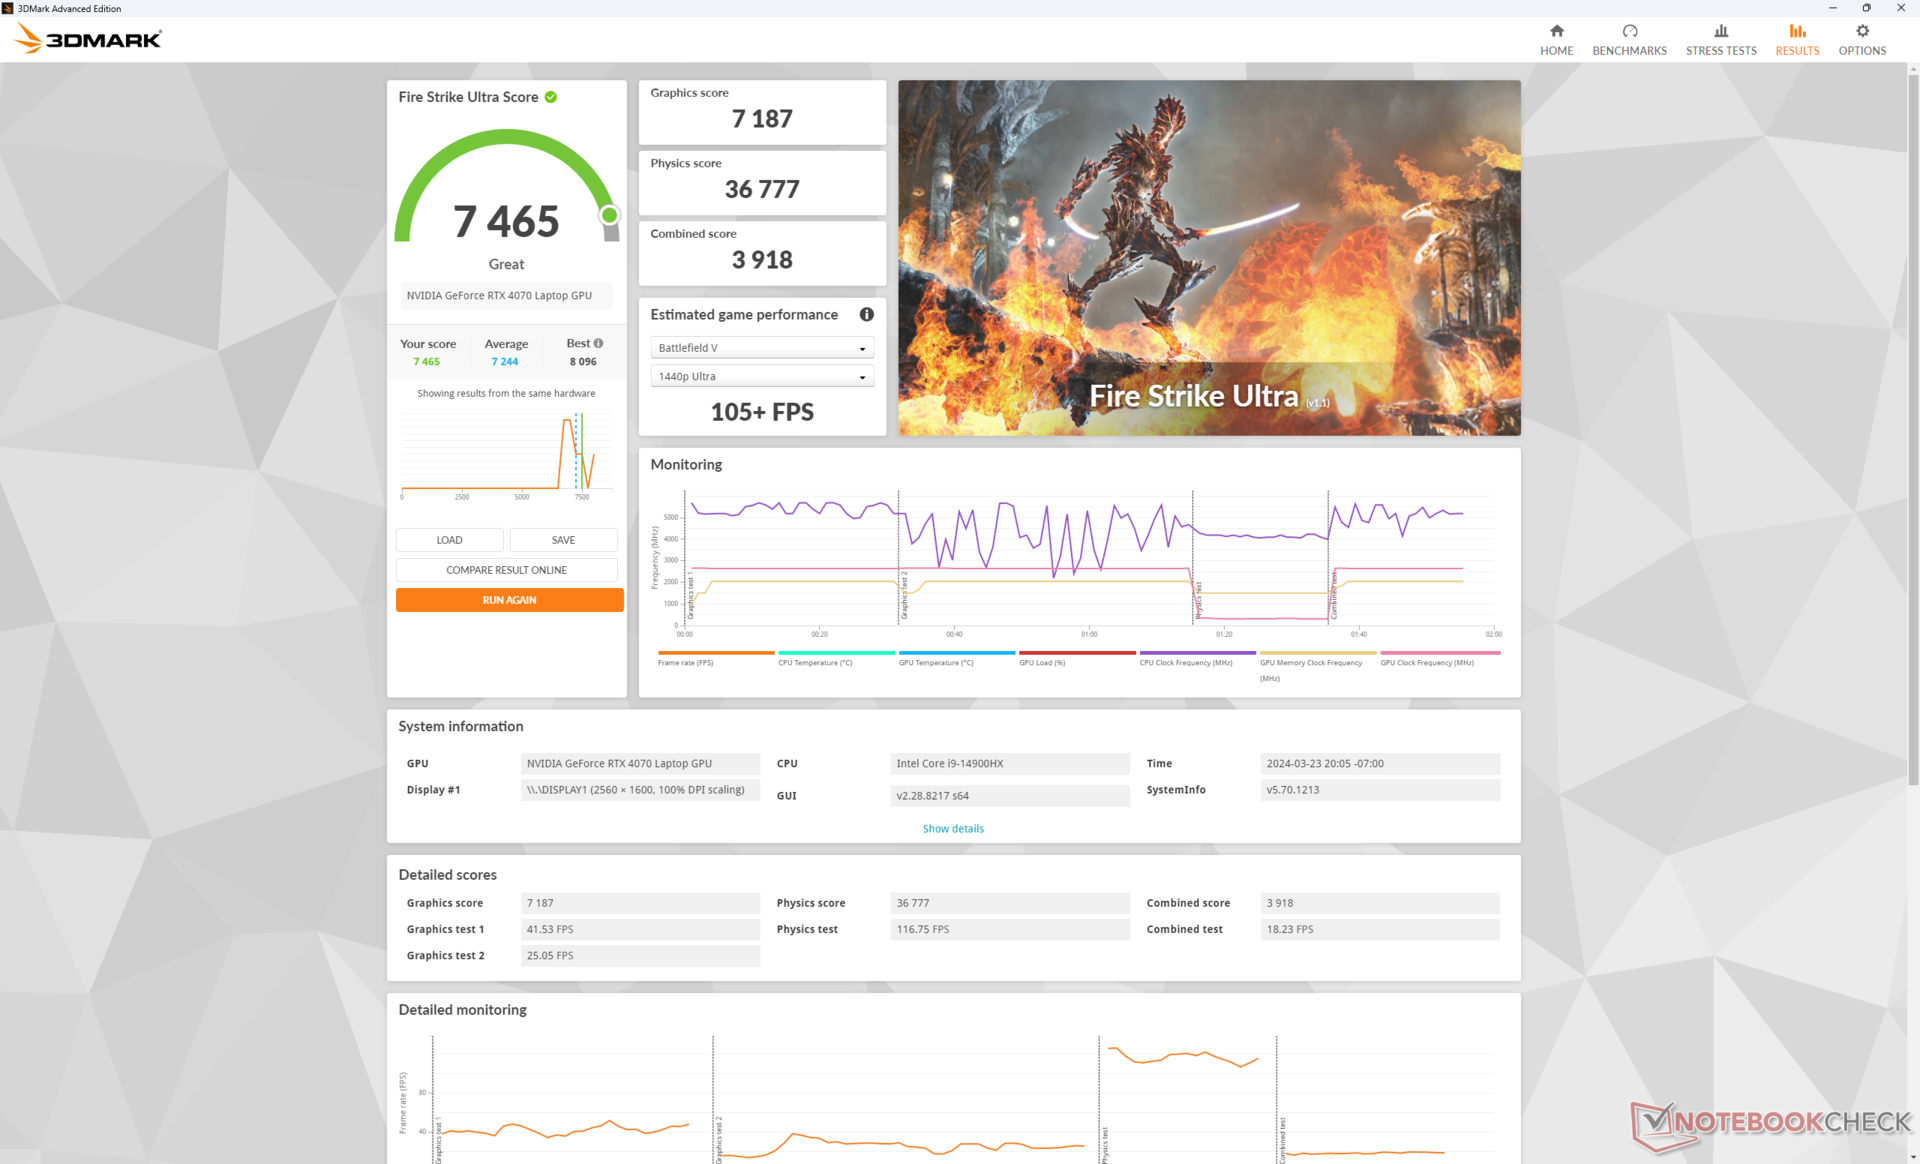
移动 RTX 4070 在 4K 分辨率下的性能很差,因为它比 "正规 "的台式机 RTX 4070 弱得多。在这些情况下,您需要随时启用 DLSS 2 和/或帧生成功能,以获得更流畅的帧速率。例如,在原生 4K 下运行《赛博朋克 2077》(Ultra settings)且不使用 RT 时,平均帧率仅为 21。但如果在平衡模式下启用 DLSS 3,平均帧率将跃升至 64。
Witcher 3 FPS Chart
| low | med. | high | ultra | QHD | 4K | |
|---|---|---|---|---|---|---|
| GTA V (2015) | 186.7 | 184.9 | 181.7 | 127.2 | 100.1 | 99.8 |
| The Witcher 3 (2015) | 607.3 | 448.7 | 268.3 | 133.7 | 83.5 | |
| Dota 2 Reborn (2015) | 231 | 205 | 196.7 | 185.3 | 153.3 | |
| Final Fantasy XV Benchmark (2018) | 205 | 185.9 | 131 | 95.1 | 52.8 | |
| X-Plane 11.11 (2018) | 188.3 | 173.3 | 137.6 | 120.3 | ||
| Far Cry 5 (2018) | 191 | 183 | 170 | 158 | 128 | 65 |
| Strange Brigade (2018) | 496 | 340 | 268 | 234 | 150.9 | 77.9 |
| Tiny Tina's Wonderlands (2022) | 283.4 | 230.6 | 151.4 | 115.9 | 79.5 | 36.9 |
| F1 22 (2022) | 320 | 312 | 245 | 88.7 | 58.8 | 27.6 |
| Baldur's Gate 3 (2023) | 176 | 150.8 | 128.5 | 125.6 | 89.6 | 45.2 |
| Cyberpunk 2077 (2023) | 143.4 | 124 | 102.2 | 87.1 | 52.8 | 23.5 |
排放量
系统噪音
风扇噪音一般比我们在去年的酷睿 i7 和 RTX 4060 机型上记录的噪音要大,这可能是由于我们采用了更快的酷睿 i9 和 RTX 4070 配置。在运行浏览器或视频等负载要求不高的情况下,风扇噪音通常会徘徊在 30 分贝(A)以下,在大多数情况下基本听不到。不过,在运行3DMark 06 时,即使设置为平衡模式,风扇也会迅速升速。
有趣的是,在平衡模式下进行游戏时,风扇噪音与性能模式相同,均为 51 分贝(A)。上述压力测试结果也证明了这一点,在平衡模式下,核心温度会明显降低。因此,我们建议使用 "性能 "模式进行游戏,因为 "平衡 "模式并不能提供明显更安静的体验。联想的噪音超过 50 dB(A),无论如何都会比其他大多数游戏笔记本电脑要大。
Noise level
| Idle |
| 24.3 / 24.3 / 28.9 dB(A) |
| Load |
| 45.8 / 56.6 dB(A) |
 | ||
30 dB silent 40 dB(A) audible 50 dB(A) loud |
||
min: | ||
| Lenovo Legion Pro 5 16IRX9 GeForce RTX 4070 Laptop GPU, i9-14900HX, Samsung PM9A1 MZVL21T0HCLR | Lenovo Legion Pro 5 16IRX8 GeForce RTX 4060 Laptop GPU, i7-13700HX, SK hynix PC801 HFS512GEJ9X115N | Alienware m16 R2 GeForce RTX 4070 Laptop GPU, Ultra 7 155H, Samsung PM9A1 MZVL21T0HCLR | HP Omen Transcend 16-u1095ng GeForce RTX 4070 Laptop GPU, i9-14900HX, Kioxia XG8 KXG80ZNV1T02 | Asus ROG Zephyrus G16 2024 GU605M GeForce RTX 4070 Laptop GPU, Ultra 7 155H, WD PC SN560 SDDPNQE-1T00 | MSI Stealth 16 Mercedes-AMG Motorsport A13VG GeForce RTX 4070 Laptop GPU, i9-13900H, Samsung PM9A1 MZVL22T0HBLB | |
|---|---|---|---|---|---|---|
| Noise | 8% | 2% | -2% | 5% | 4% | |
| off / environment * (dB) | 23.9 | 23 4% | 24.7 -3% | 24 -0% | 23.9 -0% | 25 -5% |
| Idle Minimum * (dB) | 24.3 | 23.1 5% | 25.3 -4% | 29 -19% | 23.9 2% | 25 -3% |
| Idle Average * (dB) | 24.3 | 23.1 5% | 25.3 -4% | 30 -23% | 27.8 -14% | 26 -7% |
| Idle Maximum * (dB) | 28.9 | 26.6 8% | 25.3 12% | 31 -7% | 30.1 -4% | 27 7% |
| Load Average * (dB) | 45.8 | 34.7 24% | 31.7 31% | 45 2% | 34.2 25% | 39 15% |
| Witcher 3 ultra * (dB) | 51 | 47.6 7% | 53.8 -5% | 44 14% | 46.4 9% | 45 12% |
| Load Maximum * (dB) | 56.6 | 54.8 3% | 62 -10% | 47 17% | 46.4 18% | 51 10% |
* ... smaller is better
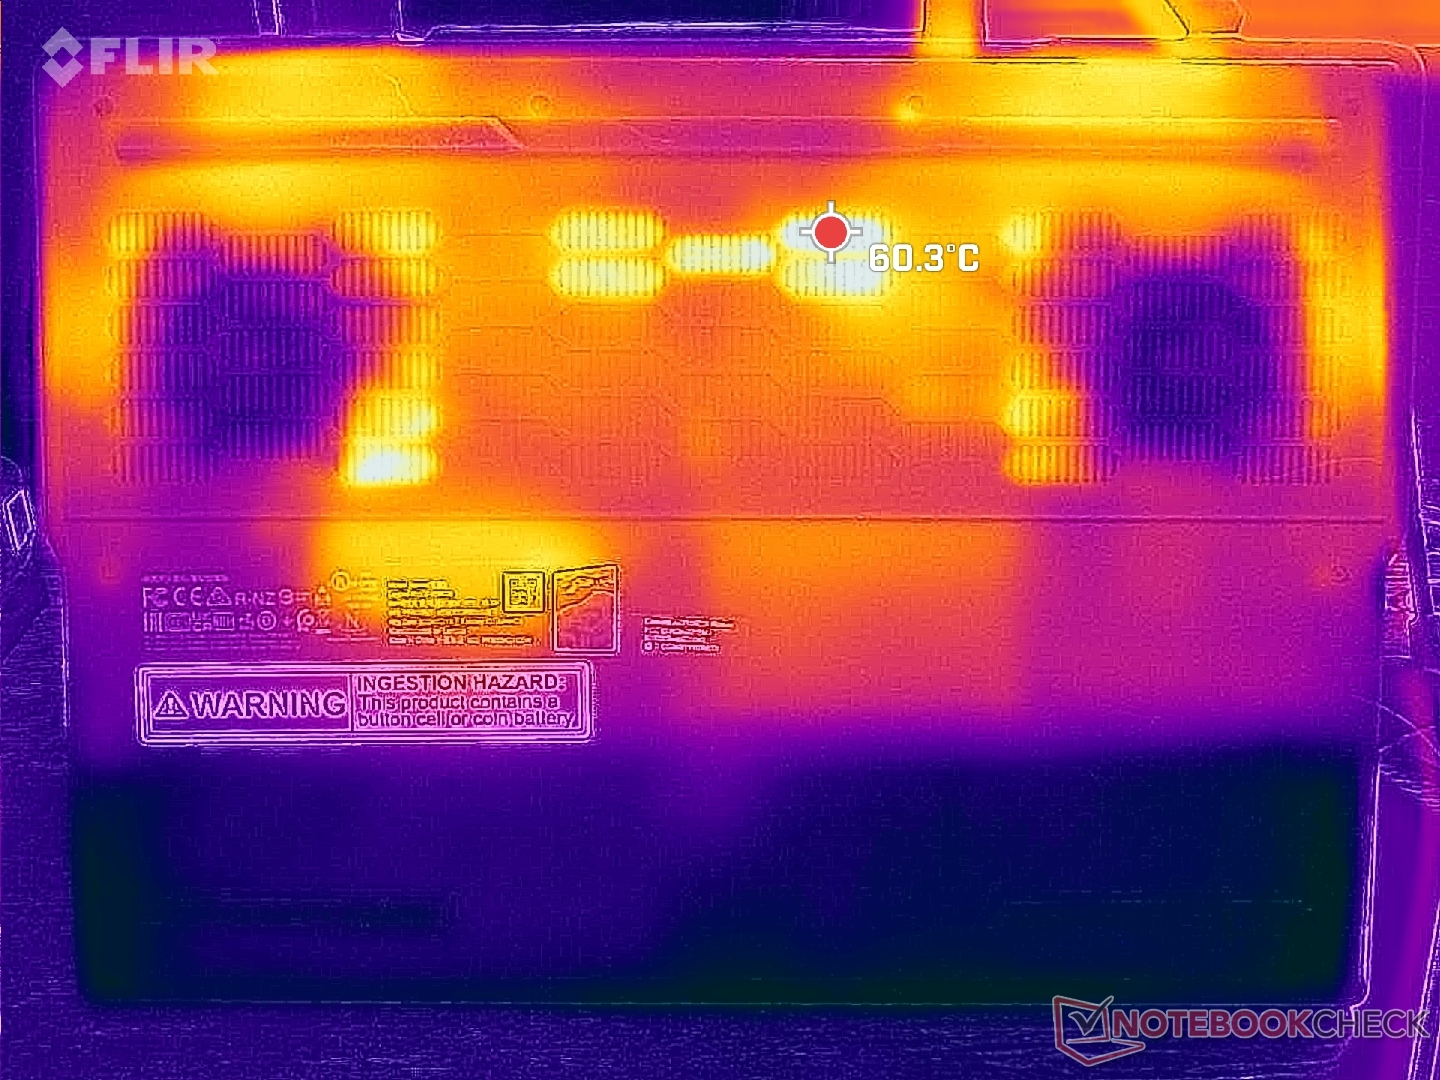
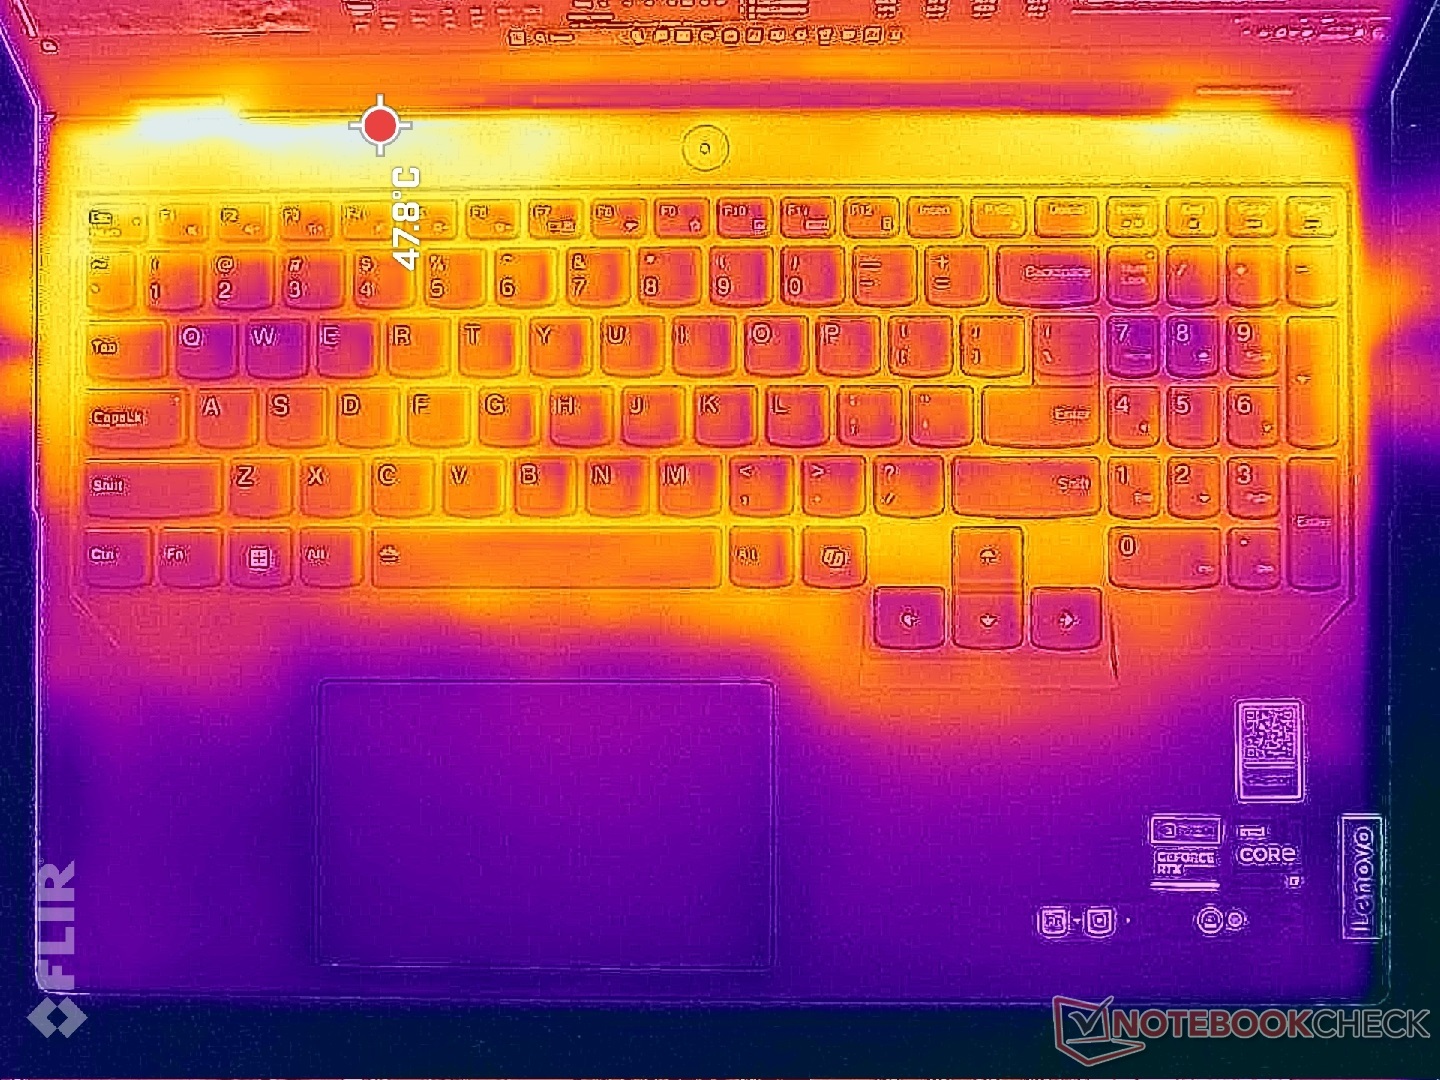
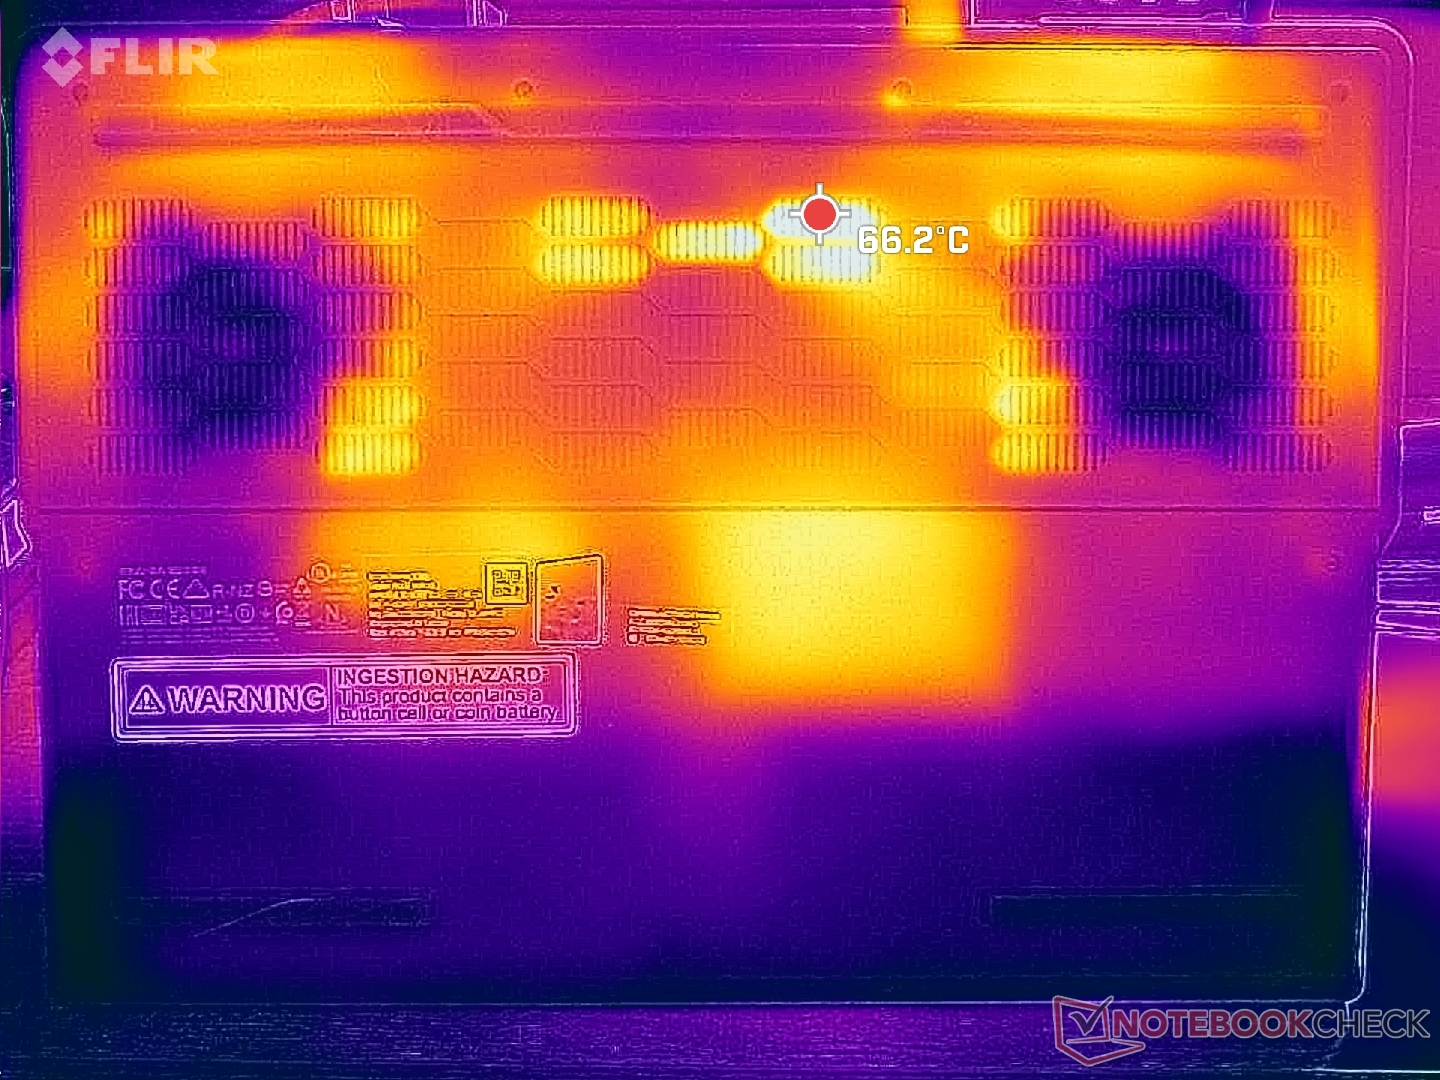
温度
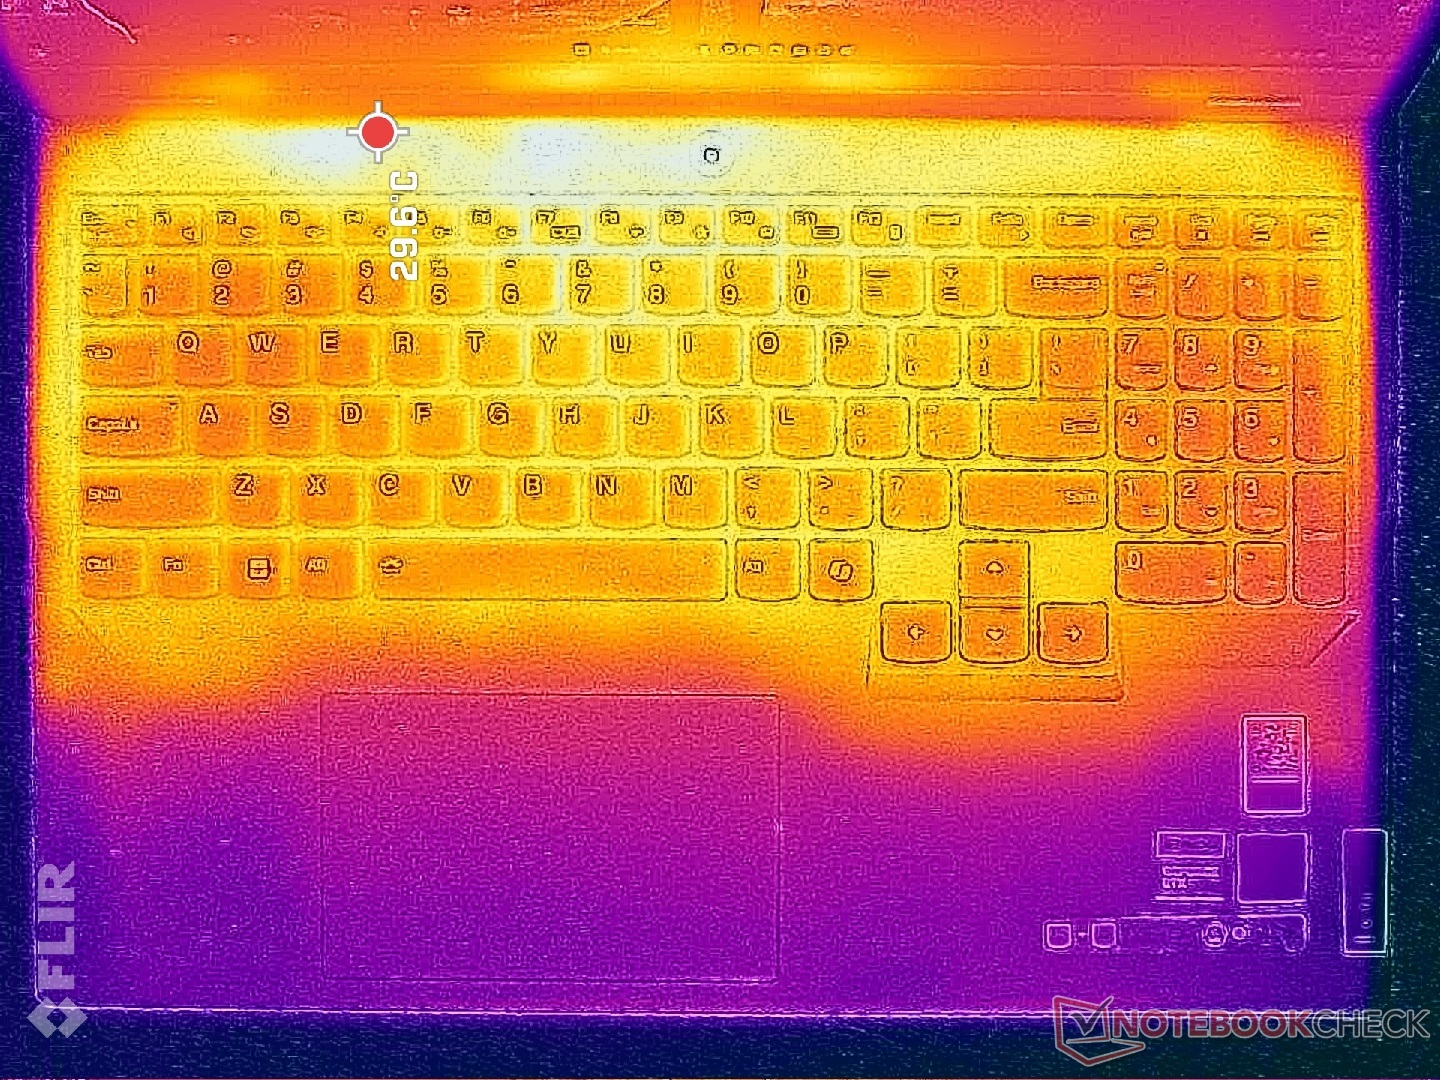
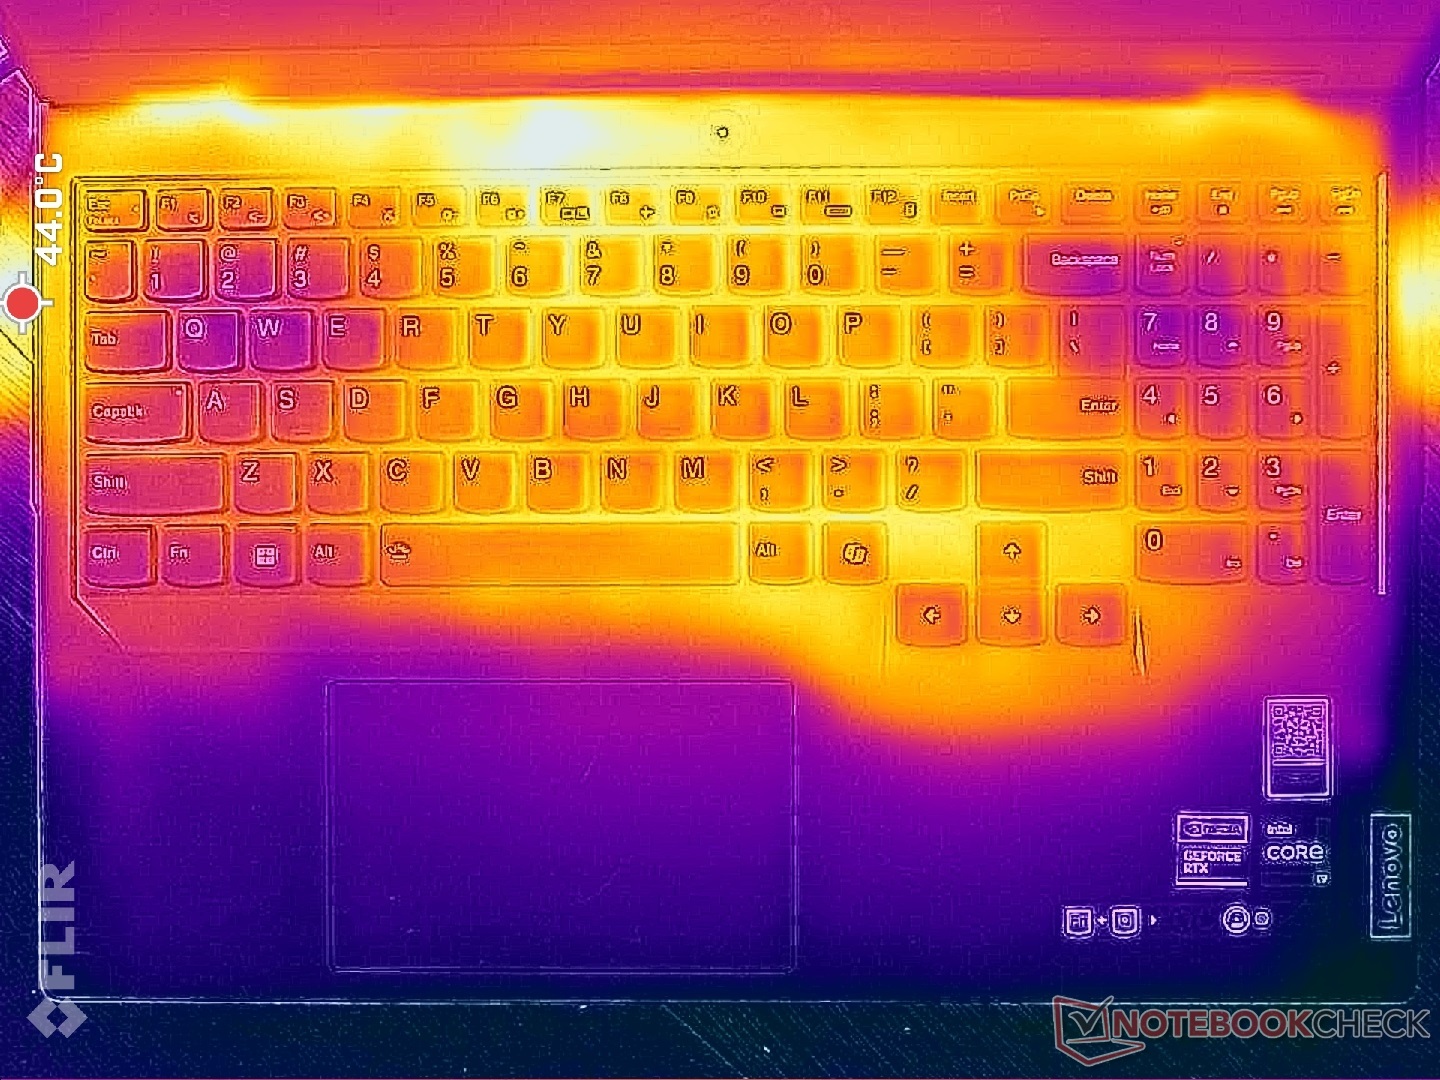
表面温度可能比我们在去年的机型上记录的温度更高。例如,在玩游戏时,键盘的大部分温度会达到 40 摄氏度,而Legion Pro 5 16IRX8 只有 36 摄氏度,Alienware m16 R2 为 34 摄氏度。掌托和 WASD 键仍会保持较低温度,以便在游戏时保持手部舒适,但笔记本电脑的其他部分会相当热。
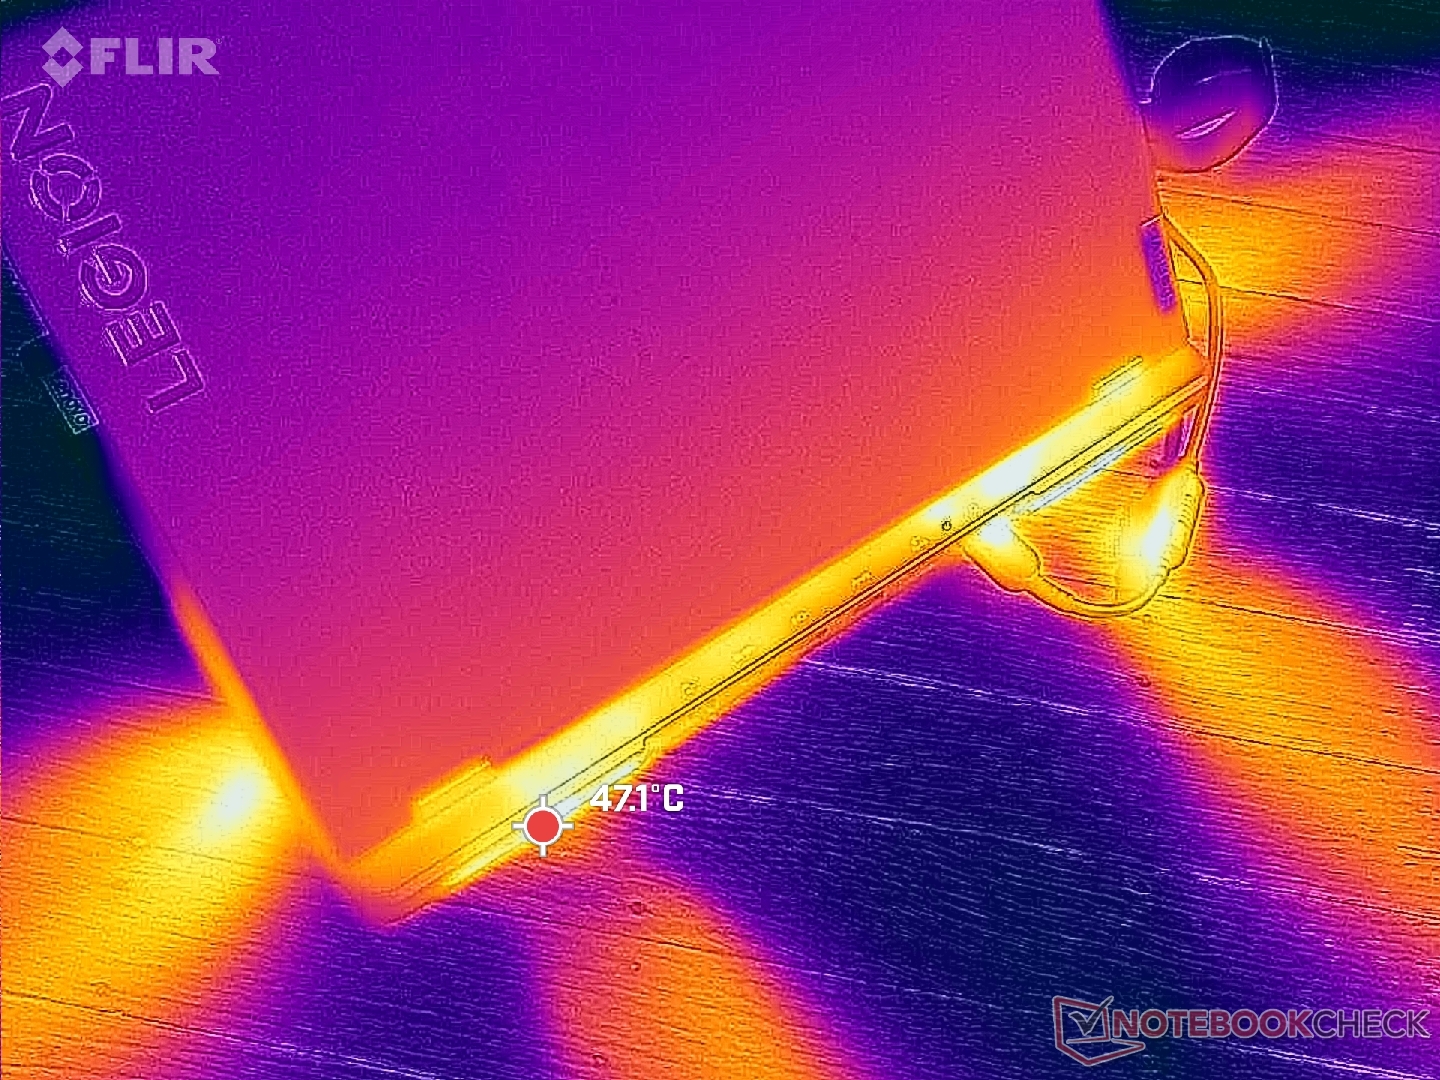
(±) The maximum temperature on the upper side is 43.8 °C / 111 F, compared to the average of 40.4 °C / 105 F, ranging from 21.2 to 68.8 °C for the class Gaming.
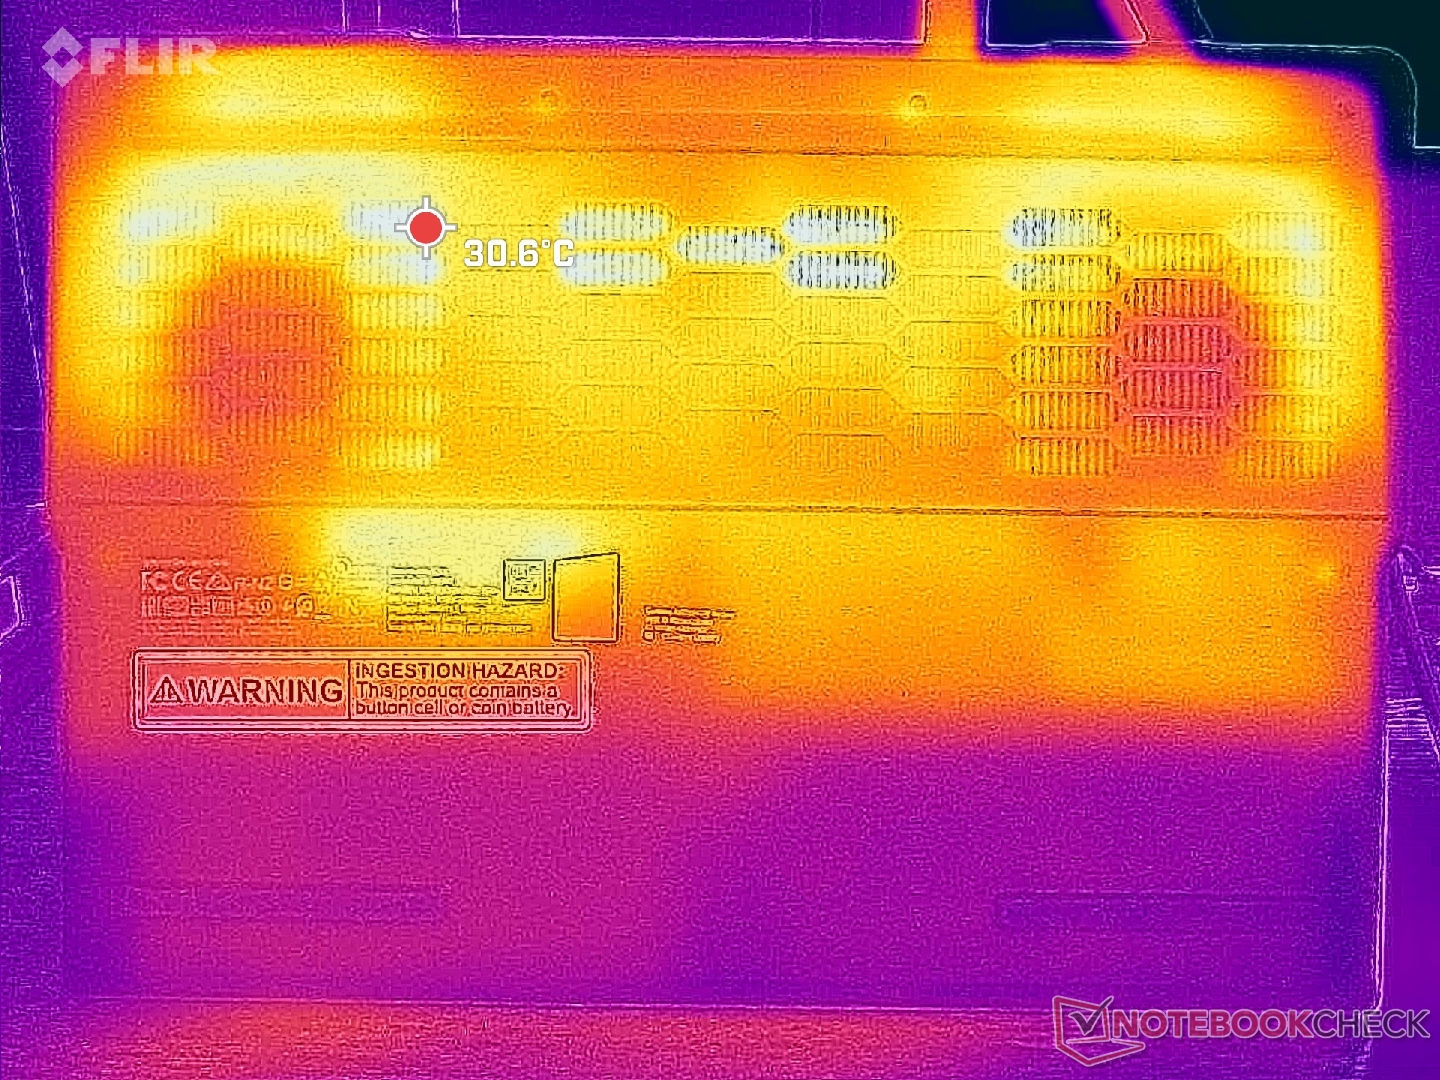
(-) The bottom heats up to a maximum of 55.4 °C / 132 F, compared to the average of 43.2 °C / 110 F
(+) In idle usage, the average temperature for the upper side is 29.6 °C / 85 F, compared to the device average of 33.9 °C / 93 F.
(±) Playing The Witcher 3, the average temperature for the upper side is 36.1 °C / 97 F, compared to the device average of 33.9 °C / 93 F.
(+) The palmrests and touchpad are cooler than skin temperature with a maximum of 28 °C / 82.4 F and are therefore cool to the touch.
(±) The average temperature of the palmrest area of similar devices was 28.8 °C / 83.8 F (+0.8 °C / 1.4 F).
| Lenovo Legion Pro 5 16IRX9 Intel Core i9-14900HX, NVIDIA GeForce RTX 4070 Laptop GPU | Lenovo Legion Pro 5 16IRX8 Intel Core i7-13700HX, NVIDIA GeForce RTX 4060 Laptop GPU | Alienware m16 R2 Intel Core Ultra 7 155H, NVIDIA GeForce RTX 4070 Laptop GPU | HP Omen Transcend 16-u1095ng Intel Core i9-14900HX, NVIDIA GeForce RTX 4070 Laptop GPU | Asus ROG Zephyrus G16 2024 GU605M Intel Core Ultra 7 155H, NVIDIA GeForce RTX 4070 Laptop GPU | MSI Stealth 16 Mercedes-AMG Motorsport A13VG Intel Core i9-13900H, NVIDIA GeForce RTX 4070 Laptop GPU | |
|---|---|---|---|---|---|---|
| Heat | 7% | -5% | 1% | 7% | 1% | |
| Maximum Upper Side * (°C) | 43.8 | 42.8 2% | 44.8 -2% | 49 -12% | 50.3 -15% | 49 -12% |
| Maximum Bottom * (°C) | 55.4 | 50 10% | 48 13% | 63 -14% | 48 13% | 52 6% |
| Idle Upper Side * (°C) | 32.8 | 29.6 10% | 37.2 -13% | 30 9% | 28.8 12% | 32 2% |
| Idle Bottom * (°C) | 36 | 34 6% | 42 -17% | 29 19% | 29.8 17% | 34 6% |
* ... smaller is better
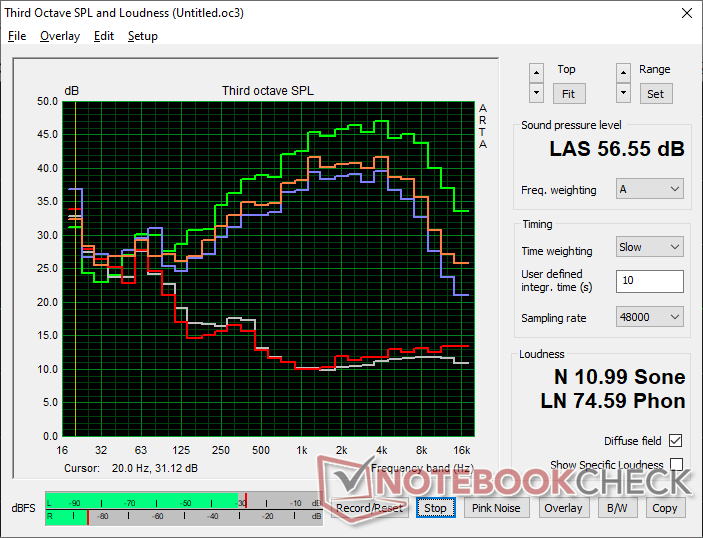
发言人
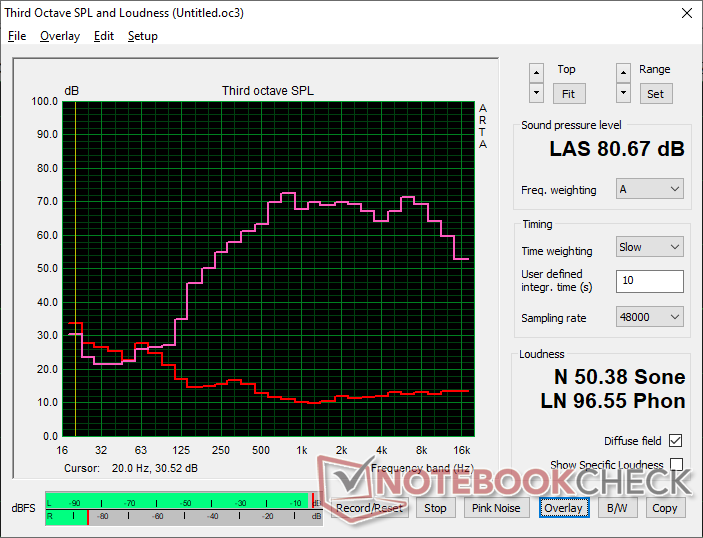
Lenovo Legion Pro 5 16IRX9 audio analysis
(±) | speaker loudness is average but good (80.7 dB)
Bass 100 - 315 Hz
(-) | nearly no bass - on average 19% lower than median
(±) | linearity of bass is average (10.1% delta to prev. frequency)
Mids 400 - 2000 Hz
(+) | balanced mids - only 4.7% away from median
(+) | mids are linear (5.7% delta to prev. frequency)
Highs 2 - 16 kHz
(+) | balanced highs - only 3.3% away from median
(+) | highs are linear (5.6% delta to prev. frequency)
Overall 100 - 16.000 Hz
(±) | linearity of overall sound is average (17.2% difference to median)
Compared to same class
» 47% of all tested devices in this class were better, 11% similar, 42% worse
» The best had a delta of 6%, average was 18%, worst was 132%
Compared to all devices tested
» 32% of all tested devices were better, 8% similar, 60% worse
» The best had a delta of 4%, average was 23%, worst was 134%
Apple MacBook Pro 16 2021 M1 Pro audio analysis
(+) | speakers can play relatively loud (84.7 dB)
Bass 100 - 315 Hz
(+) | good bass - only 3.8% away from median
(+) | bass is linear (5.2% delta to prev. frequency)
Mids 400 - 2000 Hz
(+) | balanced mids - only 1.3% away from median
(+) | mids are linear (2.1% delta to prev. frequency)
Highs 2 - 16 kHz
(+) | balanced highs - only 1.9% away from median
(+) | highs are linear (2.7% delta to prev. frequency)
Overall 100 - 16.000 Hz
(+) | overall sound is linear (4.6% difference to median)
Compared to same class
» 0% of all tested devices in this class were better, 0% similar, 100% worse
» The best had a delta of 5%, average was 17%, worst was 45%
Compared to all devices tested
» 0% of all tested devices were better, 0% similar, 100% worse
» The best had a delta of 4%, average was 23%, worst was 134%
能源管理
耗电量
运行Witcher 3 会徘徊在 220 W 左右,比我们在去年的机型上记录的要求更高。这也明显高于惠普 Omen Transcend 16,后者的 CPU 和 GPU 与联想的相同。这种差异在很大程度上归因于联想的酷睿 i9 CPU,当系统设置为性能模式时,它能保持较高的功耗状态。
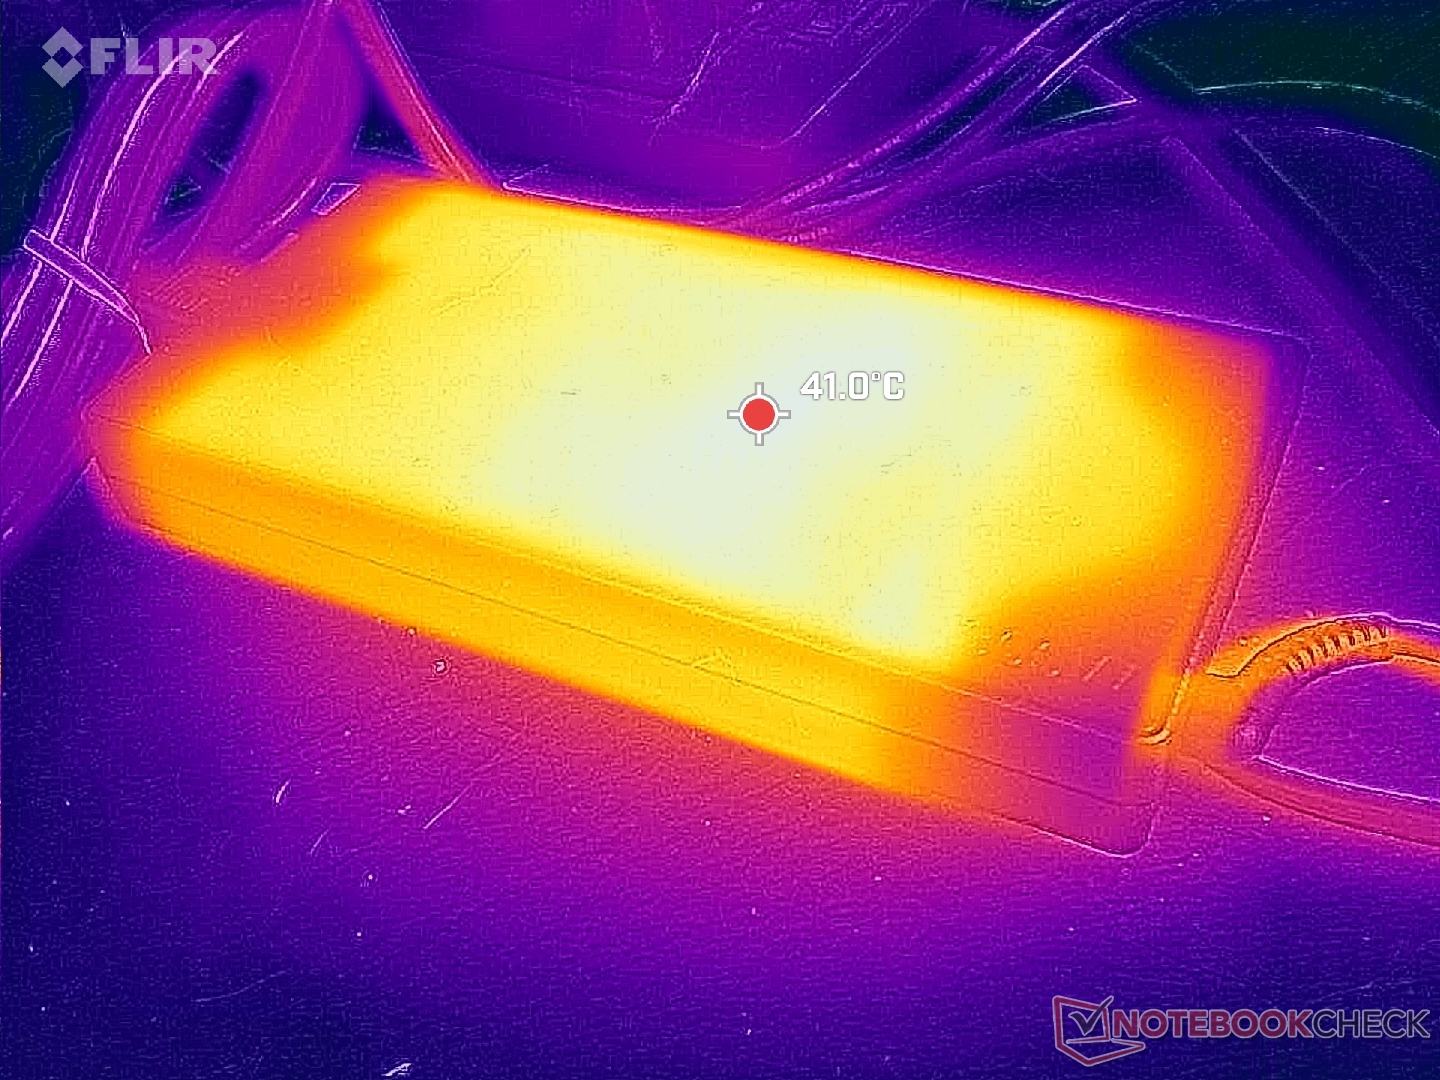
当 CPU 和 GPU 的利用率均为 100% 时,我们能记录到约 274 W 的临时最大功耗。大型(约 19.9 x 9.9 x 2.6 厘米)300 W 交流适配器与Legion 5 15、Legion 5 17 和Legion 7 16 型号的电源适配器相同。
(编者注:当我们的 Metrahit Energy 万用表维修完成后,我们将更新本节内容。不便之处,敬请谅解。)
| Off / Standby | |
| Idle | |
| Load |
|
Key:
min: | |
| Lenovo Legion Pro 5 16IRX9 i9-14900HX, GeForce RTX 4070 Laptop GPU, Samsung PM9A1 MZVL21T0HCLR, IPS, 2560x1600, 16" | Lenovo Legion Pro 5 16IRX8 i7-13700HX, GeForce RTX 4060 Laptop GPU, SK hynix PC801 HFS512GEJ9X115N, IPS, 2560x1600, 16" | Alienware m16 R2 Ultra 7 155H, GeForce RTX 4070 Laptop GPU, Samsung PM9A1 MZVL21T0HCLR, IPS, 2560x1600, 16" | HP Omen Transcend 16-u1095ng i9-14900HX, GeForce RTX 4070 Laptop GPU, Kioxia XG8 KXG80ZNV1T02, OLED, 2560x1600, 16" | Asus ROG Zephyrus G16 2024 GU605M Ultra 7 155H, GeForce RTX 4070 Laptop GPU, WD PC SN560 SDDPNQE-1T00, OLED, 2560x1600, 16" | MSI Stealth 16 Mercedes-AMG Motorsport A13VG i9-13900H, GeForce RTX 4070 Laptop GPU, Samsung PM9A1 MZVL22T0HBLB, OLED, 3840x2400, 16" | |
|---|---|---|---|---|---|---|
| Power Consumption | -19% | 12% | 8% | 42% | 22% | |
| Idle Minimum * (Watt) | 12.5 | 24.5 -96% | 8.1 35% | 10 20% | 8.3 34% | 11 12% |
| Idle Average * (Watt) | 24.6 | 29.2 -19% | 13 47% | 18 27% | 12.5 49% | 14 43% |
| Idle Maximum * (Watt) | 24.8 | 34.3 -38% | 40.3 -62% | 32 -29% | 12.8 48% | 28 -13% |
| Load Average * (Watt) | 109.6 | 98.7 10% | 79 28% | 128 -17% | 71.3 35% | 83 24% |
| Witcher 3 ultra * (Watt) | 218 | 178.6 18% | 188.1 14% | 148.4 32% | 127.5 42% | 140 36% |
| Load Maximum * (Watt) | 284.9 | 249.6 12% | 254.9 11% | 242 15% | 169.1 41% | 204 28% |
* ... smaller is better
Power Consumption Witcher 3 / Stresstest
Power Consumption external Monitor
电池寿命
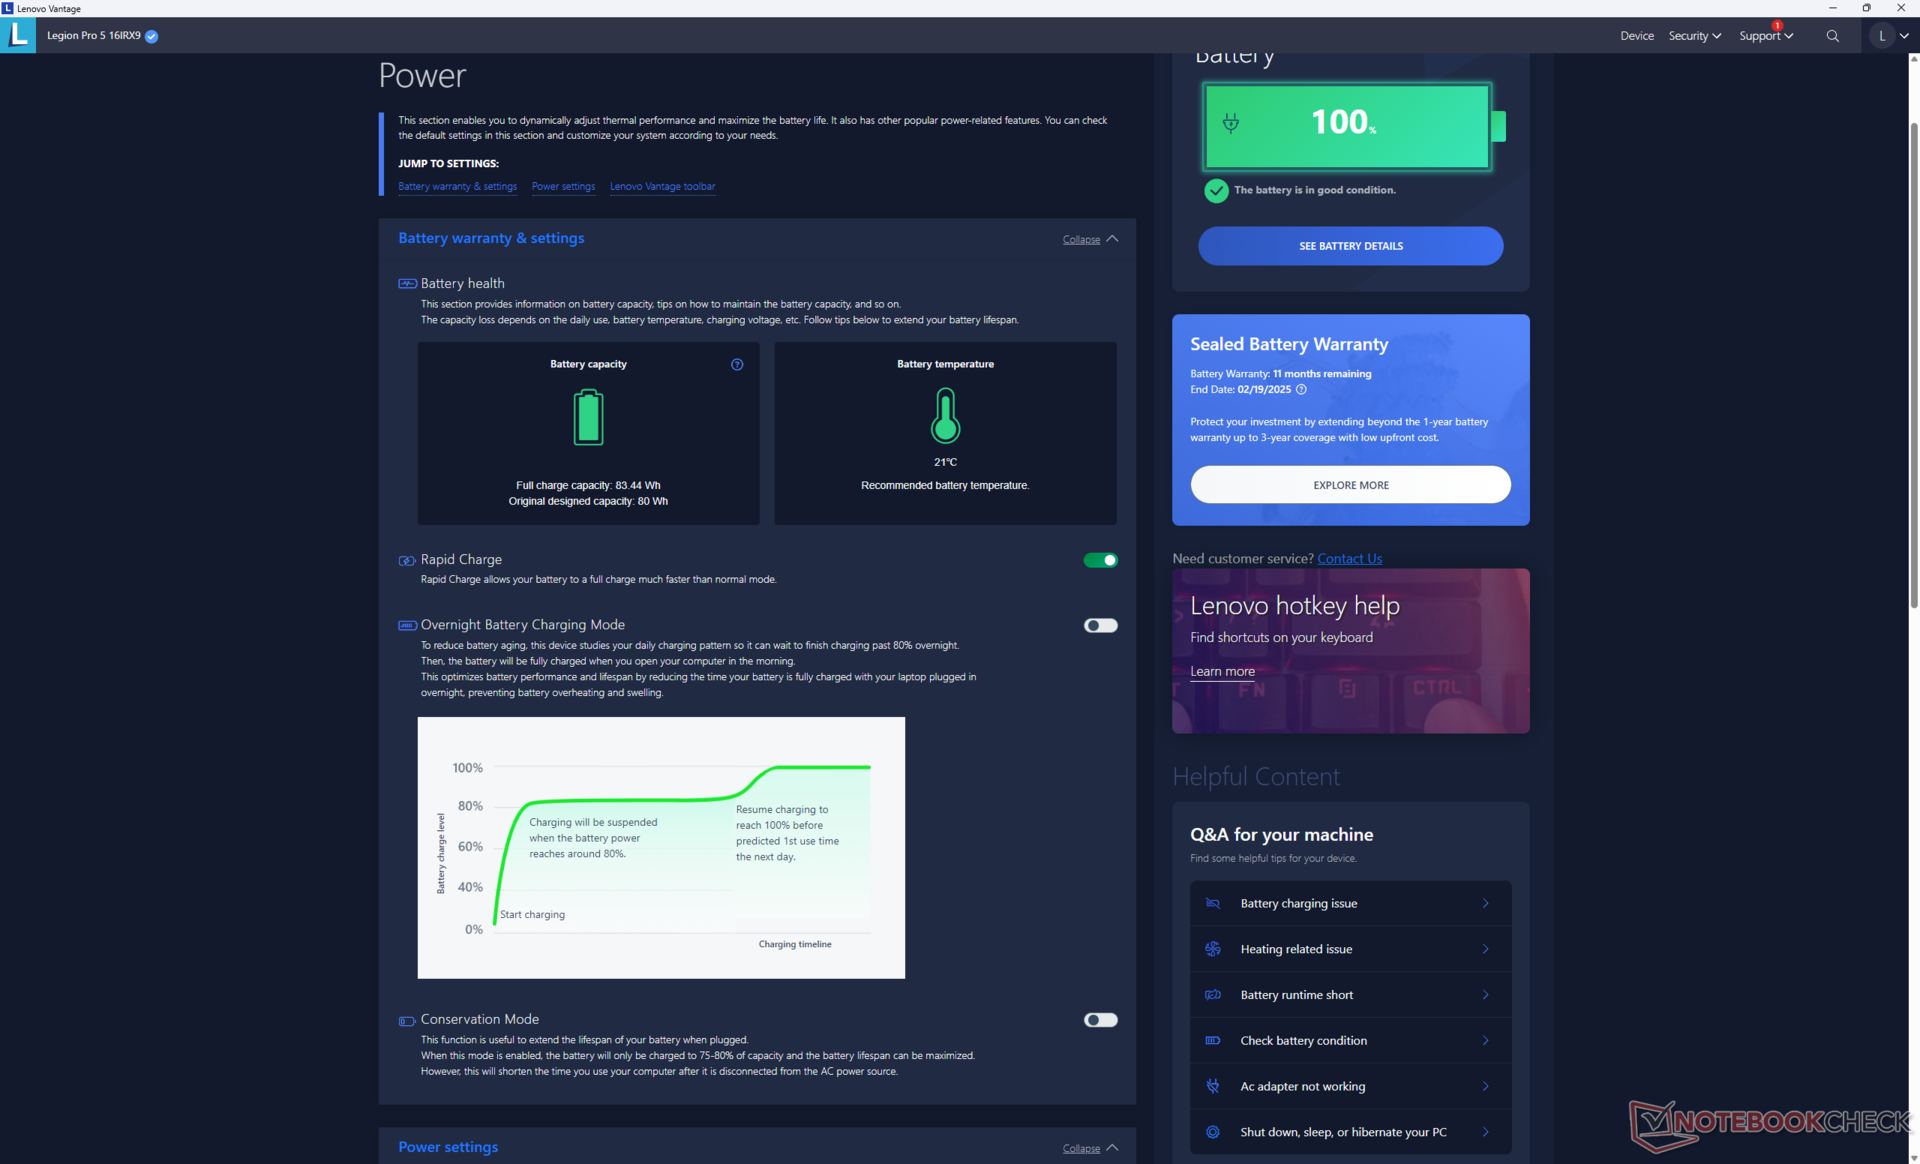
电池容量为 80 Wh,小于大多数其他 16 英寸笔记本电脑,后者的电池容量通常在 90 Wh 或更大。即便如此,电池续航时间还是比去年的Legion Pro 5 16IRX8 长了近 90 分钟。Zephyrus G16 和 Alienware m16 R2 的续航时间也分别长了几个小时,但它们配备的酷睿 Ultra 7 处理器的速度也较慢。
从空电到满电的充电速度非常快,只需不到一个小时,而其他大多数笔记本电脑需要 1.5 到 2 个小时。联想快速充电功能默认开启。系统还可以通过后置 USB-C 端口使用第三方 USB-C 适配器充电。
| Lenovo Legion Pro 5 16IRX9 i9-14900HX, GeForce RTX 4070 Laptop GPU, 80 Wh | Lenovo Legion Pro 5 16IRX8 i7-13700HX, GeForce RTX 4060 Laptop GPU, 80 Wh | Alienware m16 R2 Ultra 7 155H, GeForce RTX 4070 Laptop GPU, 90 Wh | HP Omen Transcend 16-u1095ng i9-14900HX, GeForce RTX 4070 Laptop GPU, 97 Wh | Asus ROG Zephyrus G16 2024 GU605M Ultra 7 155H, GeForce RTX 4070 Laptop GPU, 90 Wh | MSI Stealth 16 Mercedes-AMG Motorsport A13VG i9-13900H, GeForce RTX 4070 Laptop GPU, 99.99 Wh | |
|---|---|---|---|---|---|---|
| Battery runtime | -22% | 49% | 2% | 31% | 35% | |
| Reader / Idle (h) | 6.7 | 6.7 0% | 12.6 88% | |||
| WiFi v1.3 (h) | 4.8 | 3.4 -29% | 8.1 69% | 4.9 2% | 7.3 52% | 6.5 35% |
| Load (h) | 1.1 | 0.7 -36% | 1 -9% | 1.2 9% | ||
| H.264 (h) | 11.2 |
Pros
Cons
结论:简单改变,体验如初
与最近的 Alienware m18 R2与前代产品相比,联想Legion Pro 5 16 G9 并没有提供足够的升级价值。它的性能和以前一样好,但并没有太大的提升,因为它被锁定在相同的 GPU 选项和重新命名的 Raptor Lake-HX CPU 上。换句话说,2024Legion Pro 5 16 在游戏方面的表现几乎与价格较低的 2023 版本相同。在考虑较新的 2024 版本之前,最好先看看 2023 版本是否有优惠。
2024 有一些小的改进,最显著的是新的 DCI-P3 面板选项,而去年的型号仅限于 sRGB 色彩。不过,体积大、交流适配器大、风扇声音大等先天缺点依然存在。
除非你真的想要 DCI-P3 色彩,否则 2024 年的联想Legion Pro 5 16IRX9 在性能、选项和物理特性方面与现在价格较低的 2023 年机型几乎完全相同。
Legion Pro 5 16 对那些喜欢酷睿 HX 系列 CPU 而不是速度较慢的酷睿 Ultra 的用户具有吸引力。否则,像Asus ROG Zephyrus G16 或Alienware m16 R2 这样的更小或更便携的替代产品,处理器性能较慢,但游戏性能几乎相同。
价格和供应情况
联想现在出货的是Legion 5 Pro 16,酷睿 i7-14650HX 和 RTX 4060 配置的起价为 1770 美元,酷睿 i9-14900HX 和 RTX 4070 配置的起价为 2000 美元。
Lenovo Legion Pro 5 16IRX9
- 03/28/2024 v7 (old)
Allen Ngo
Transparency
The selection of devices to be reviewed is made by our editorial team. The test sample was provided to the author as a loan by the manufacturer or retailer for the purpose of this review. The lender had no influence on this review, nor did the manufacturer receive a copy of this review before publication. There was no obligation to publish this review. As an independent media company, Notebookcheck is not subjected to the authority of manufacturers, retailers or publishers.
This is how Notebookcheck is testing
Every year, Notebookcheck independently reviews hundreds of laptops and smartphones using standardized procedures to ensure that all results are comparable. We have continuously developed our test methods for around 20 years and set industry standards in the process. In our test labs, high-quality measuring equipment is utilized by experienced technicians and editors. These tests involve a multi-stage validation process. Our complex rating system is based on hundreds of well-founded measurements and benchmarks, which maintains objectivity. Further information on our test methods can be found here.
Price comparison

