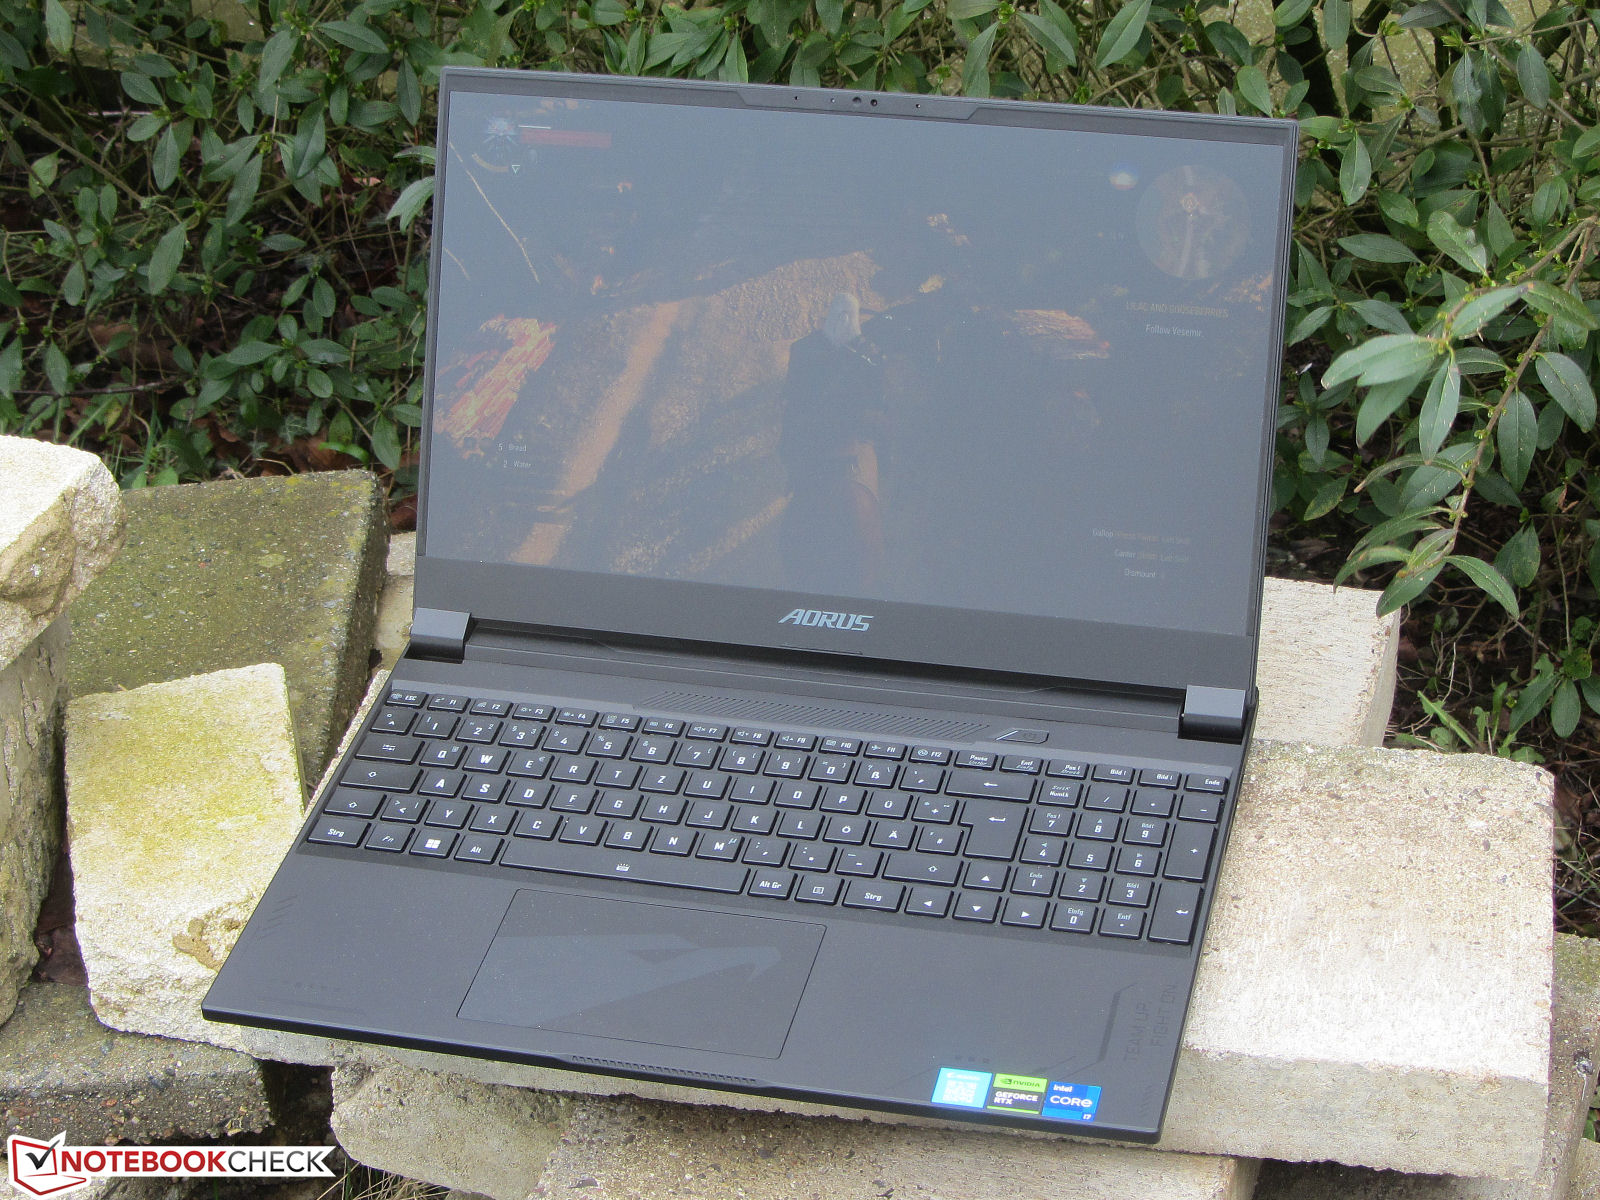
Aorus 15X ASF回顾:具有RTX 4070能力和耐力的游戏笔记本电脑
Aorus 15X--一款中端游戏笔记本电脑--由Raptor Lake Core i7和RTX 4070 GPU驱动。总包装的售价约为2,099美元。其竞争对手包括以下设备 Razer Blade 15 OLED(2022年初)。,以及华硕ROG Strix G17 G713PI,以及MSI Katana 17 B13VFK和宏碁掠夺者Helios 300.
潜在的竞争对手比较
Rating | Date | Model | Weight | Height | Size | Resolution | Price |
|---|---|---|---|---|---|---|---|
| 86.2 % v7 (old) | 04 / 2023 | Aorus 15X ASF i7-13700HX, GeForce RTX 4070 Laptop GPU | 2.3 kg | 19.7 mm | 15.60" | 2560x1440 | |
| 89.9 % v7 (old) | 03 / 2023 | Razer Blade 15 OLED (Early 2022) i9-12900H, GeForce RTX 3070 Ti Laptop GPU | 2 kg | 16.99 mm | 15.60" | 2560x1440 | |
| 82.1 % v7 (old) | 02 / 2023 | MSI Katana 17 B13VFK i7-13620H, GeForce RTX 4060 Laptop GPU | 2.8 kg | 25.2 mm | 17.30" | 1920x1080 | |
| 88.4 % v7 (old) | 04 / 2023 | Asus ROG Strix G17 G713PI R9 7945HX, GeForce RTX 4070 Laptop GPU | 2.8 kg | 30.7 mm | 17.30" | 2560x1440 | |
| 86.5 % v7 (old) | 11 / 2022 | Acer Predator Helios 300 (i7-12700H, RTX 3070 Ti) i7-12700H, GeForce RTX 3070 Ti Laptop GPU | 3 kg | 27.65 mm | 17.30" | 2560x1440 |
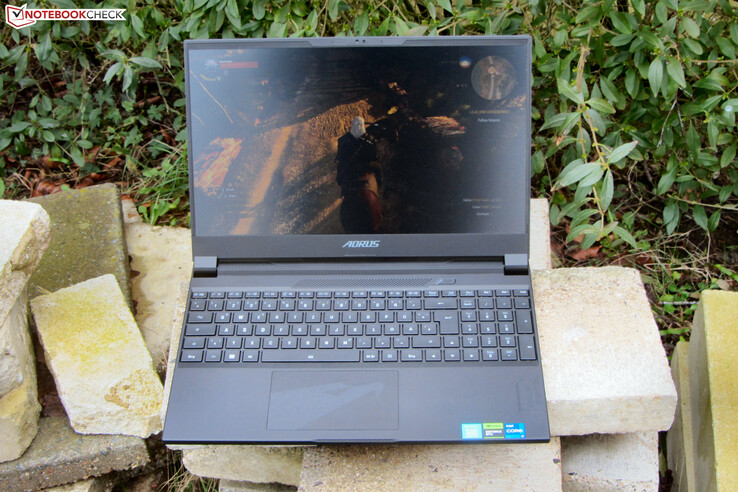
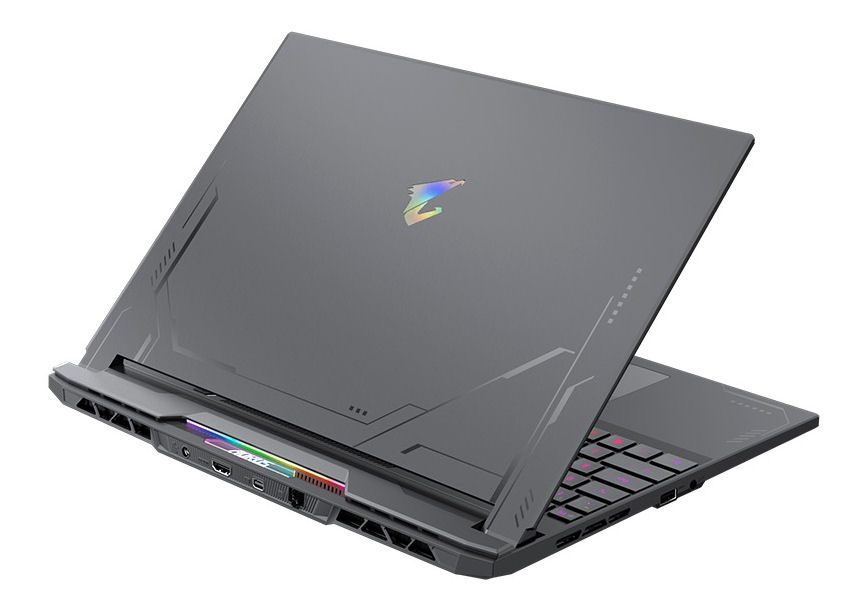
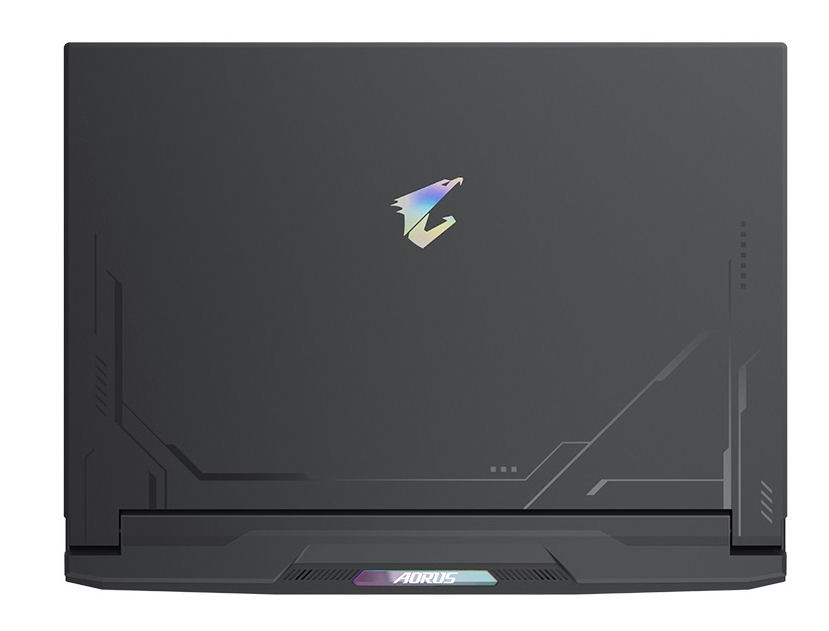
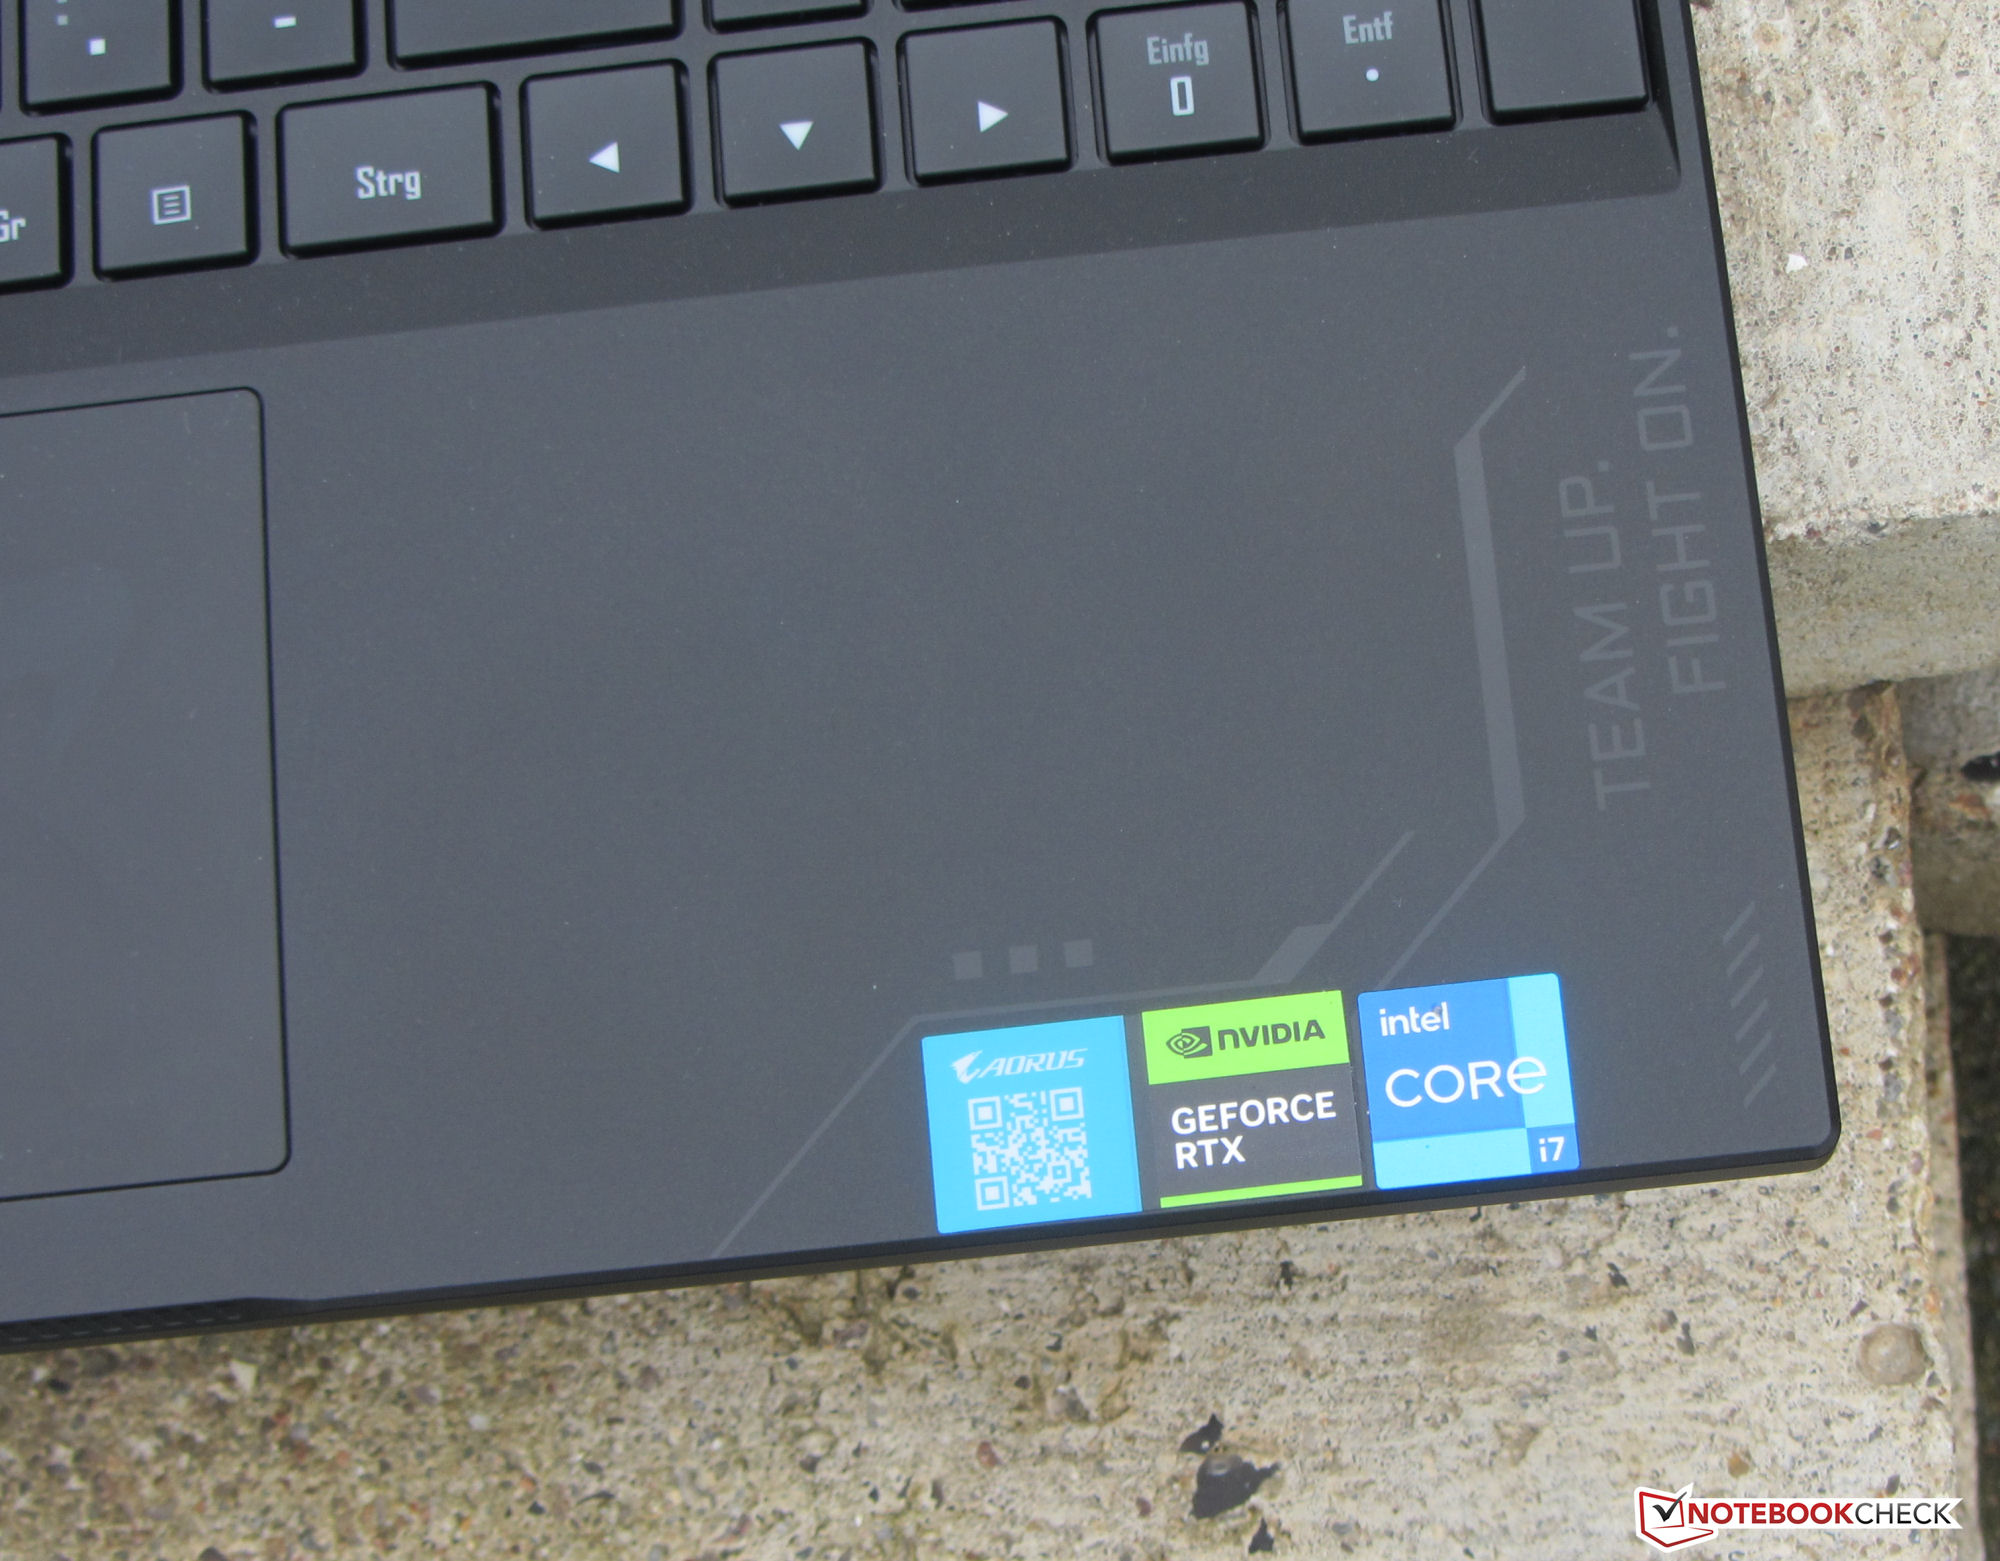
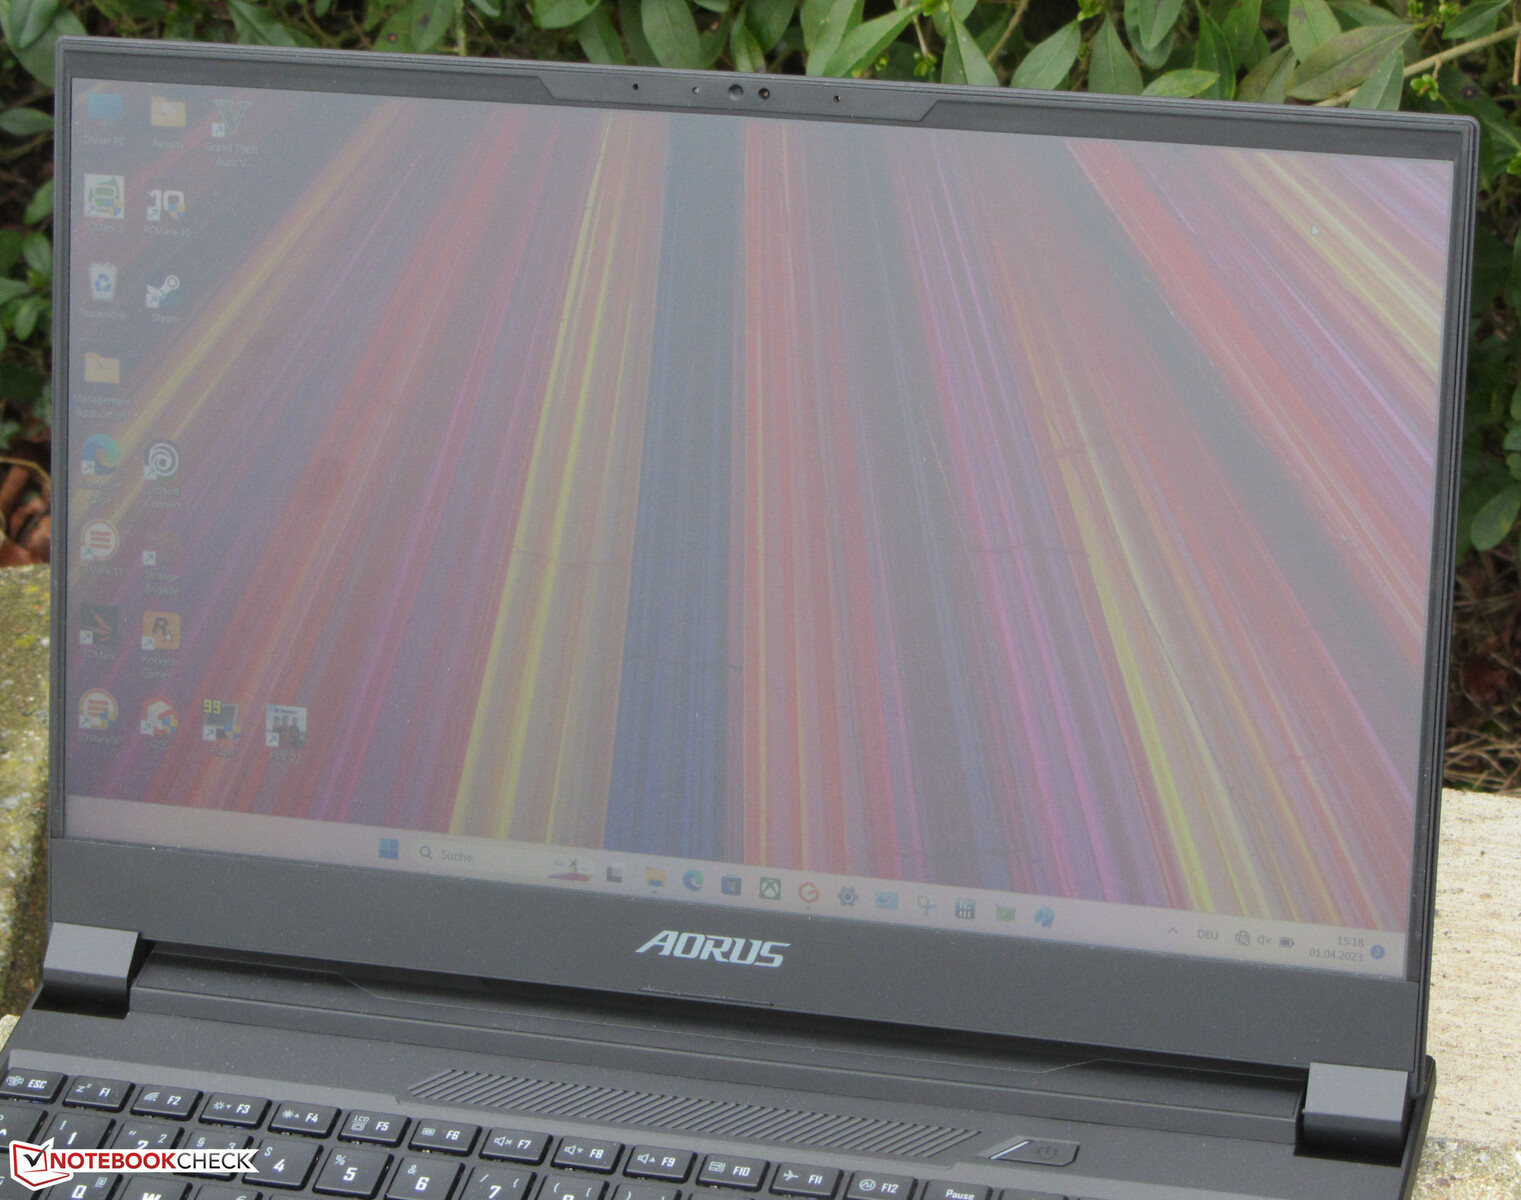
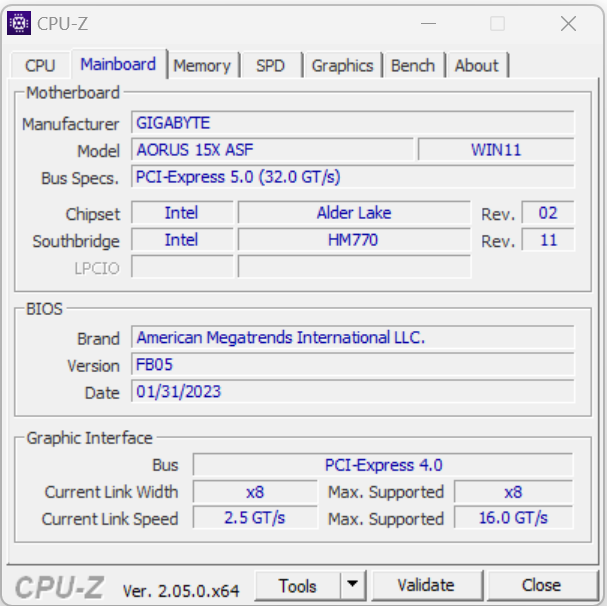
外壳 - 技嘉利用混合材料
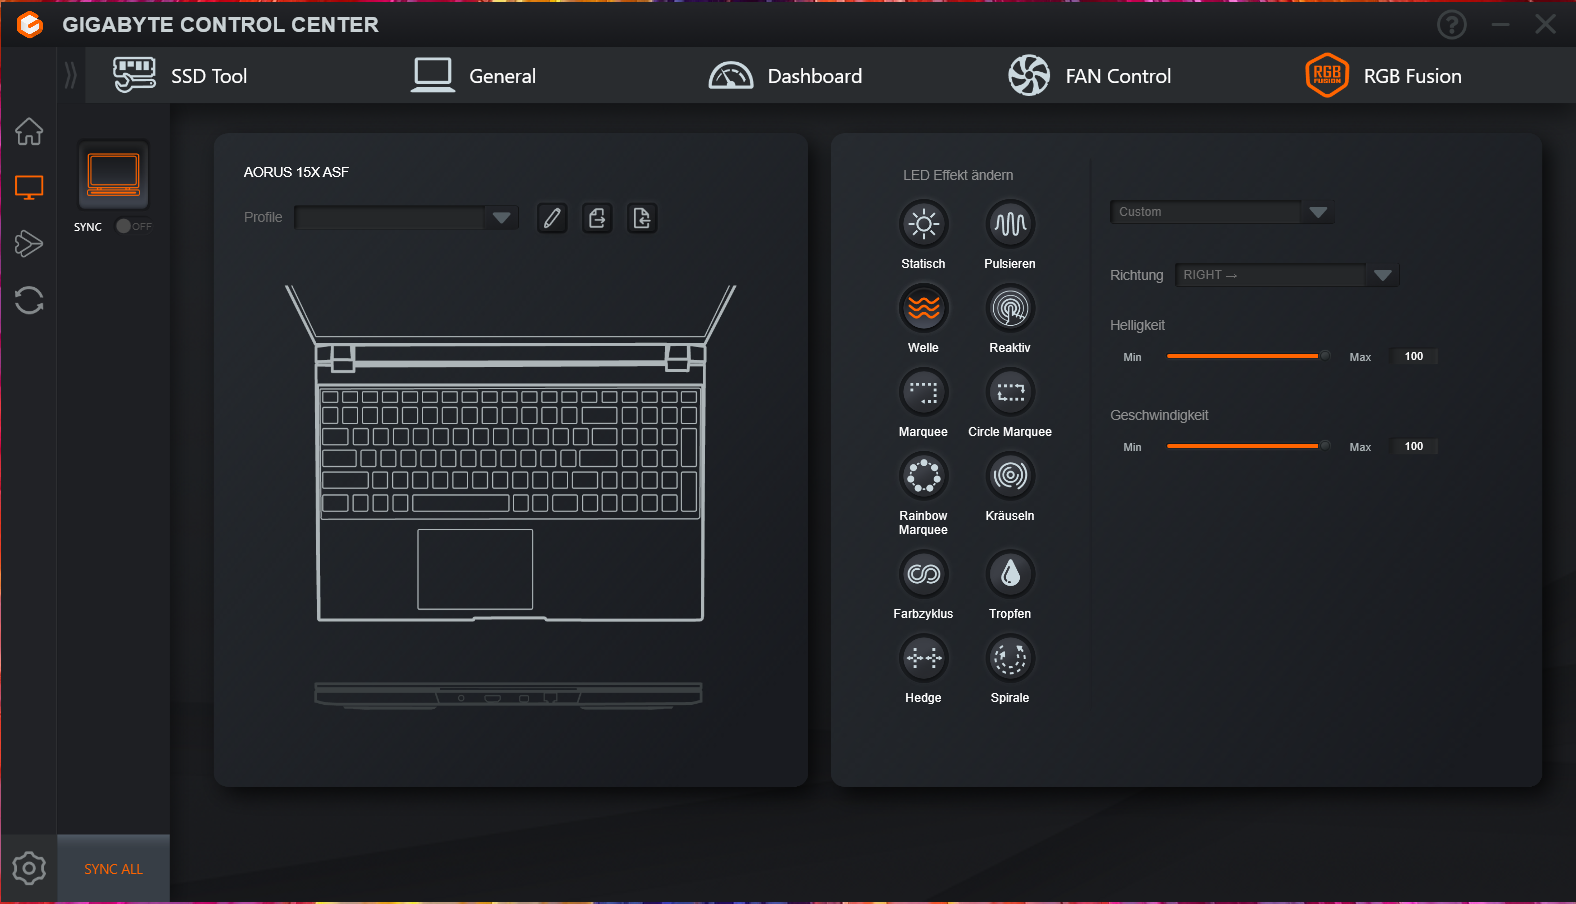
只有盖子的背面是由哑光的黑色金属制成的--基本单元是由塑料制成的。除了蚀刻在光滑外壳表面的图案外,技嘉没有添加任何花哨的视觉点缀。底座单元背面的LED灯带(RGB,可定制)和发光的按键(RGB)为该设备增添了一抹色彩。
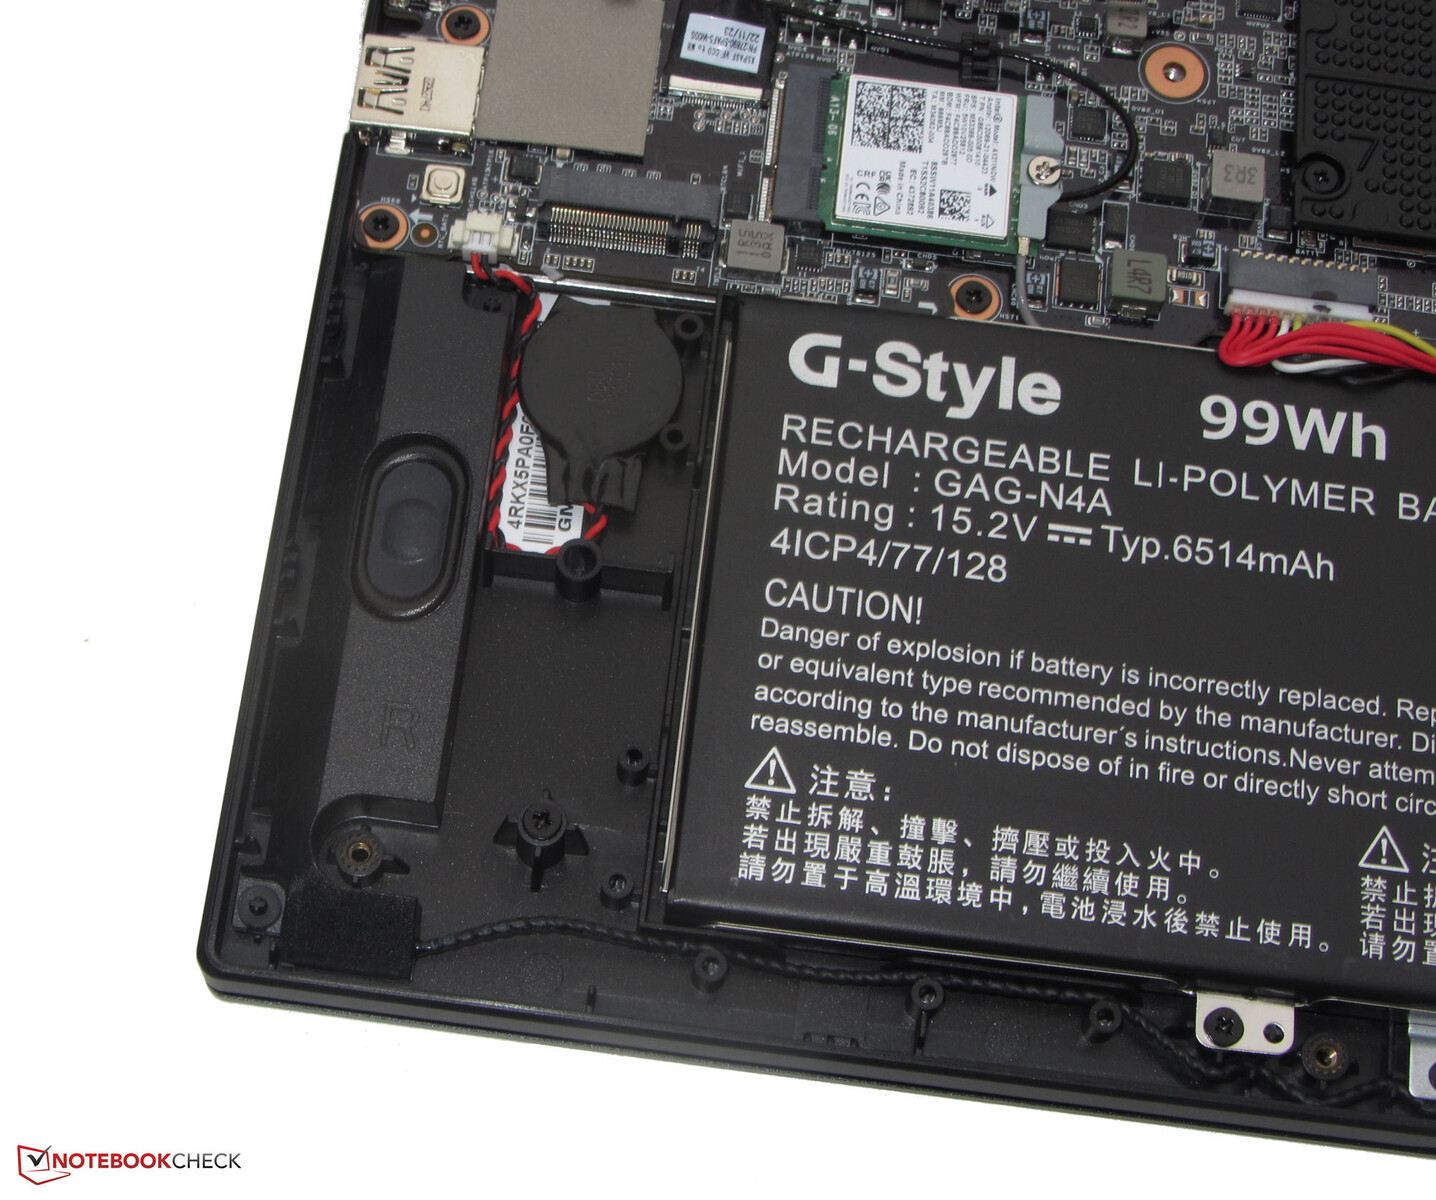
外壳组装得完美无缺--没有多余的材料,缝隙尺寸也都正确。底部装置只能轻微扭曲,盖子更甚。但这一切都保持在正常范围内。电池(用螺丝固定--不是用胶水)和笔记本的其他内部零件可以在拆下底层外壳后进入。铰链将盖子牢牢固定住,最大打开角度约为130度。可以用一只手打开盖子。
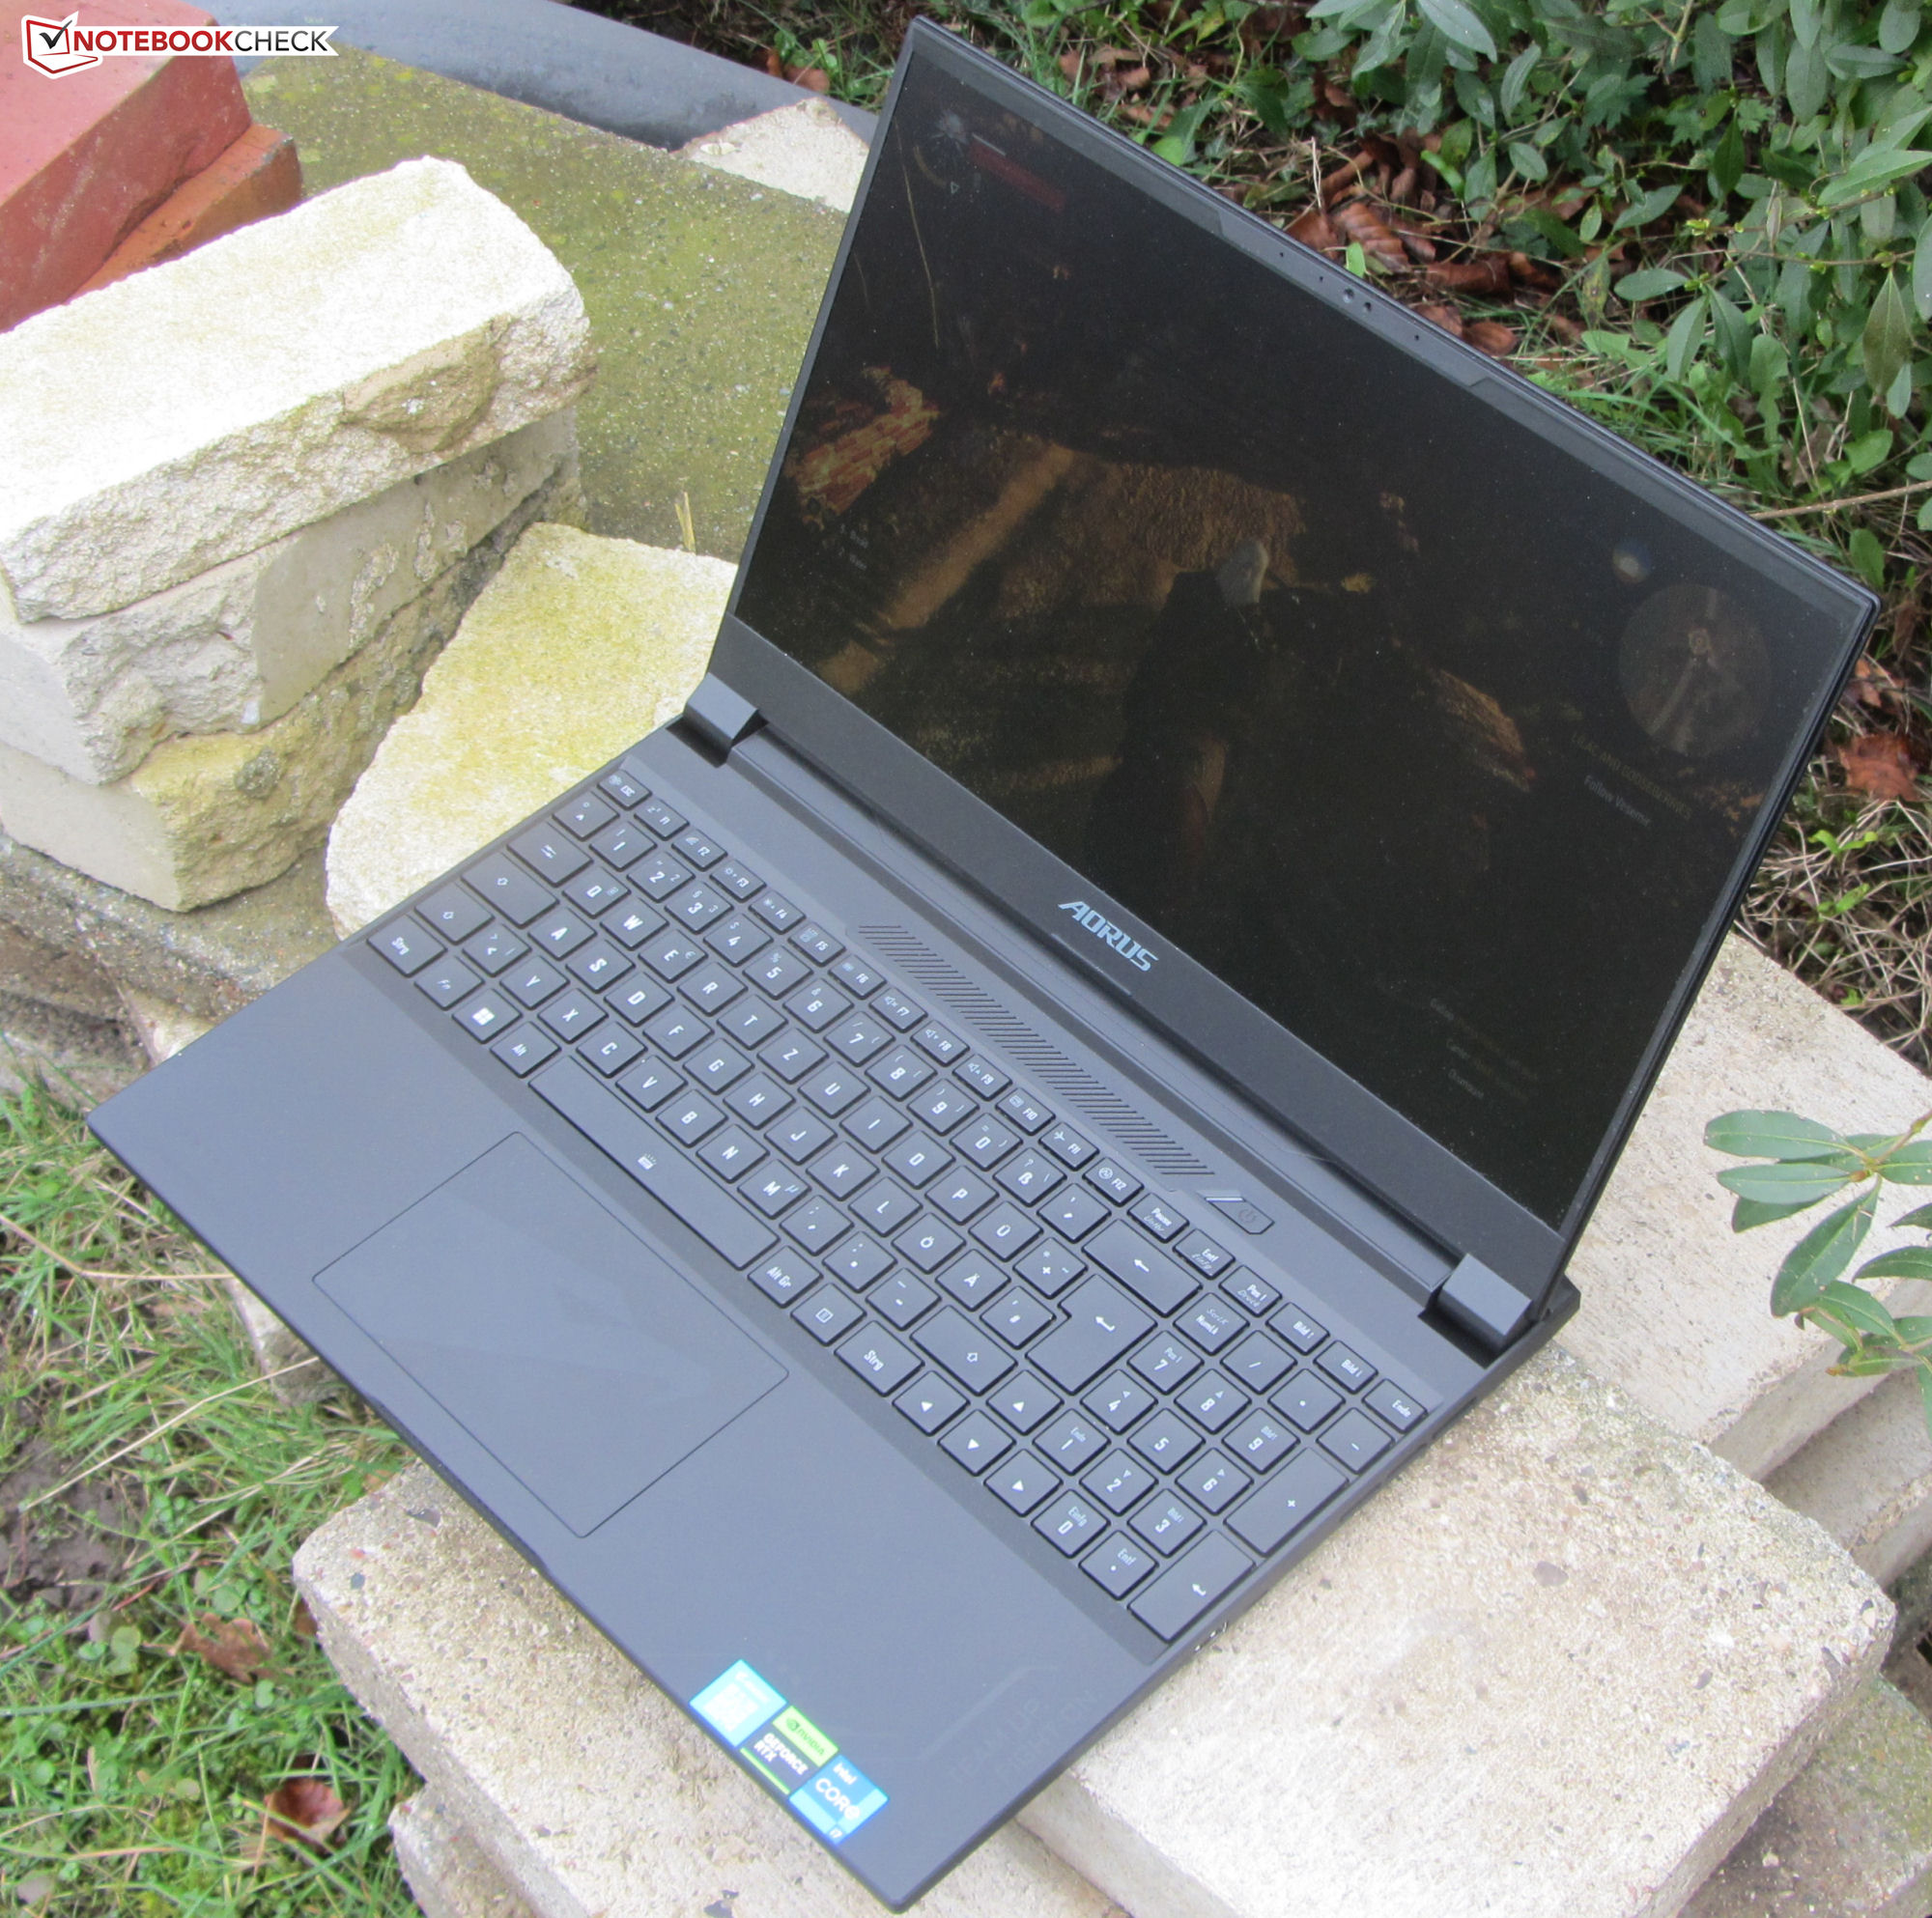
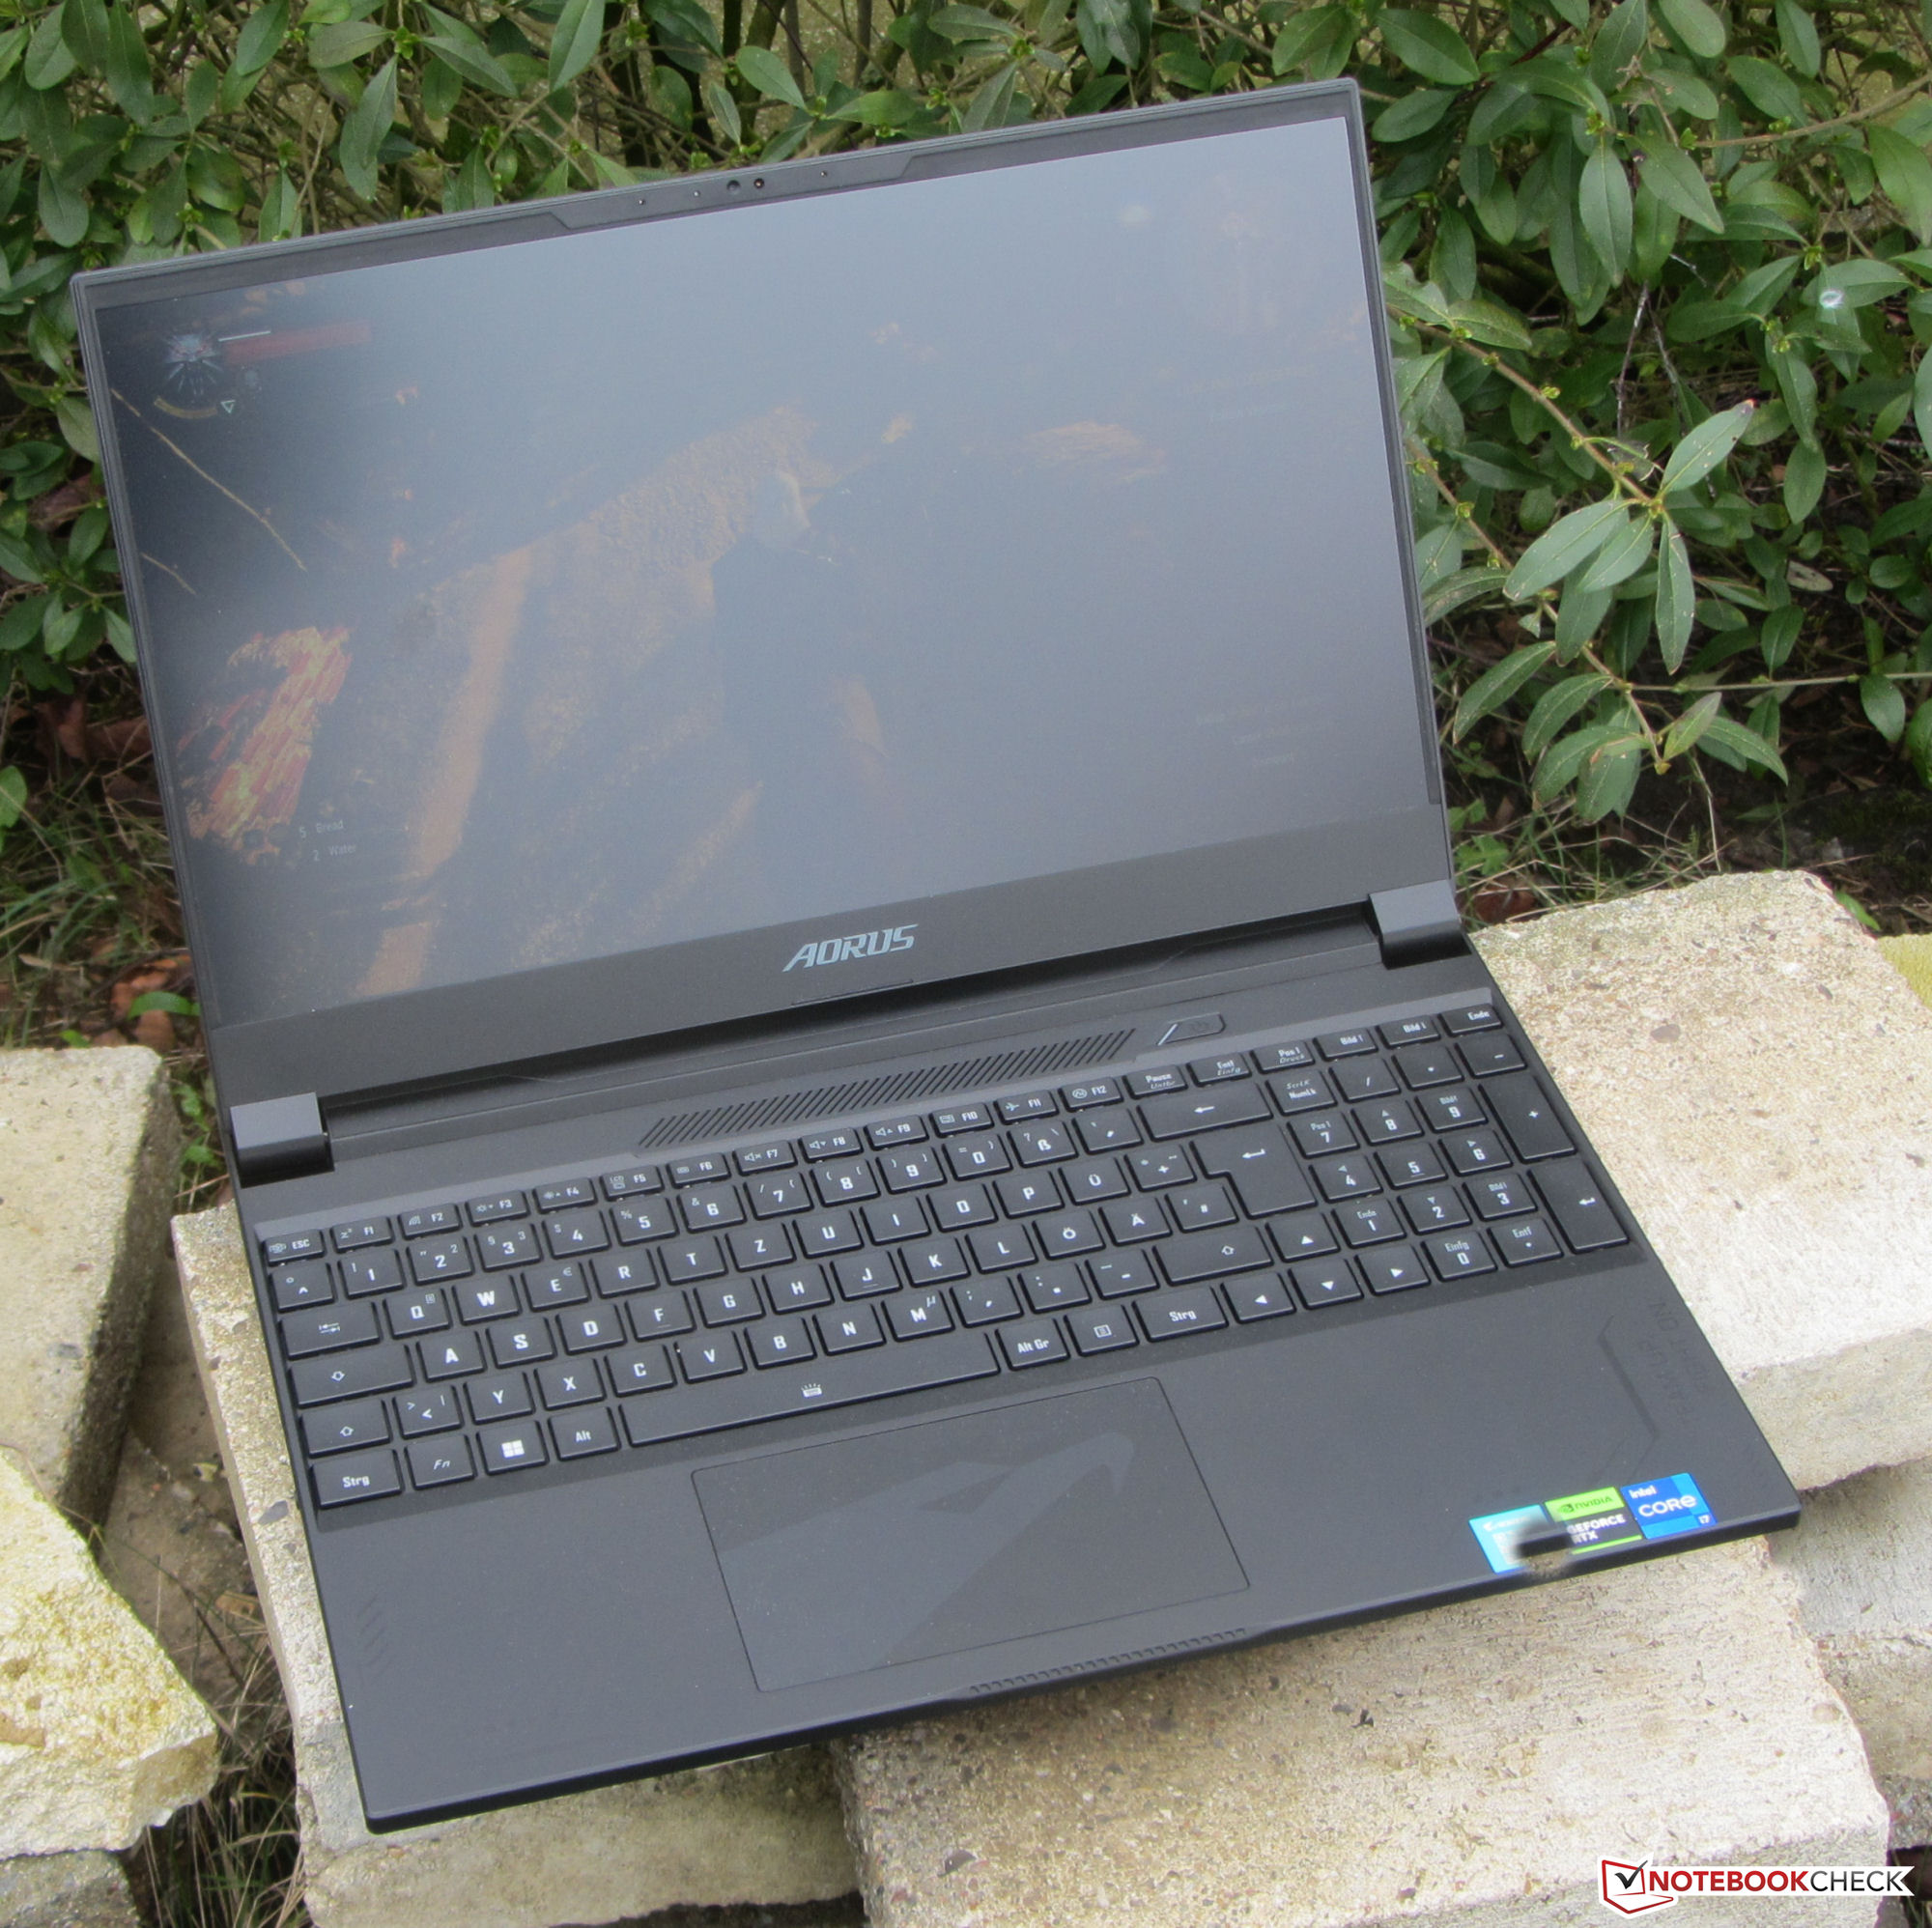
15X几乎可以被置于所有15.6英寸笔记本电脑的中间范围:它既不紧凑,也不是特别庞大。它的重量也可以说是如此。
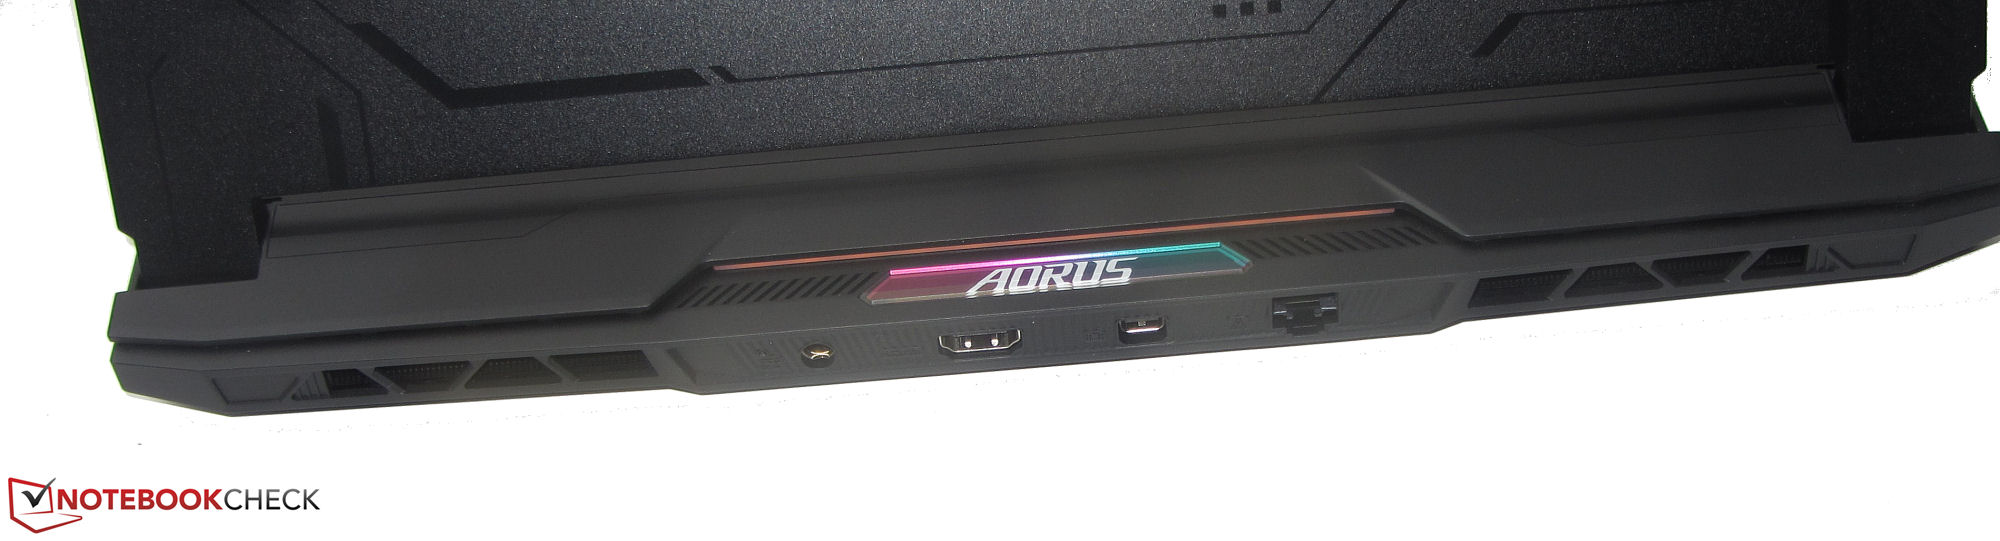
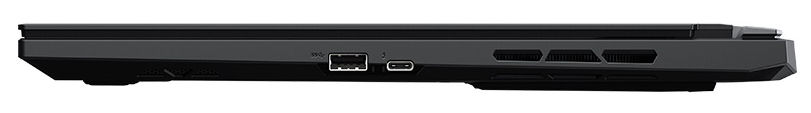
连接性--Aorus电脑具有Thunderbolt 4功能
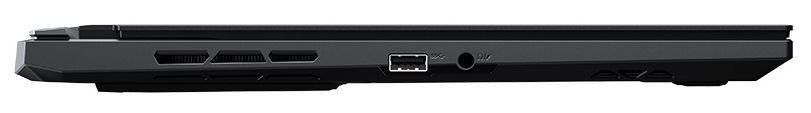
15X有两个USB-A端口(USB 3.2 Gen 2)和一个USB-C端口(Thunderbolt 4)。后者支持Power Delivery,可以输出DisplayPort信号。这与HDMI端口(2.1)和专用的Mini DisplayPort(1.4)一起,构成了三个视频输出。这台电脑没有配备SD读卡器。
两个专用视频输出以及以太网端口可以在设备的背面找到。这意味着,当你使用笔记本电脑时,电缆不会妨碍你。

沟通
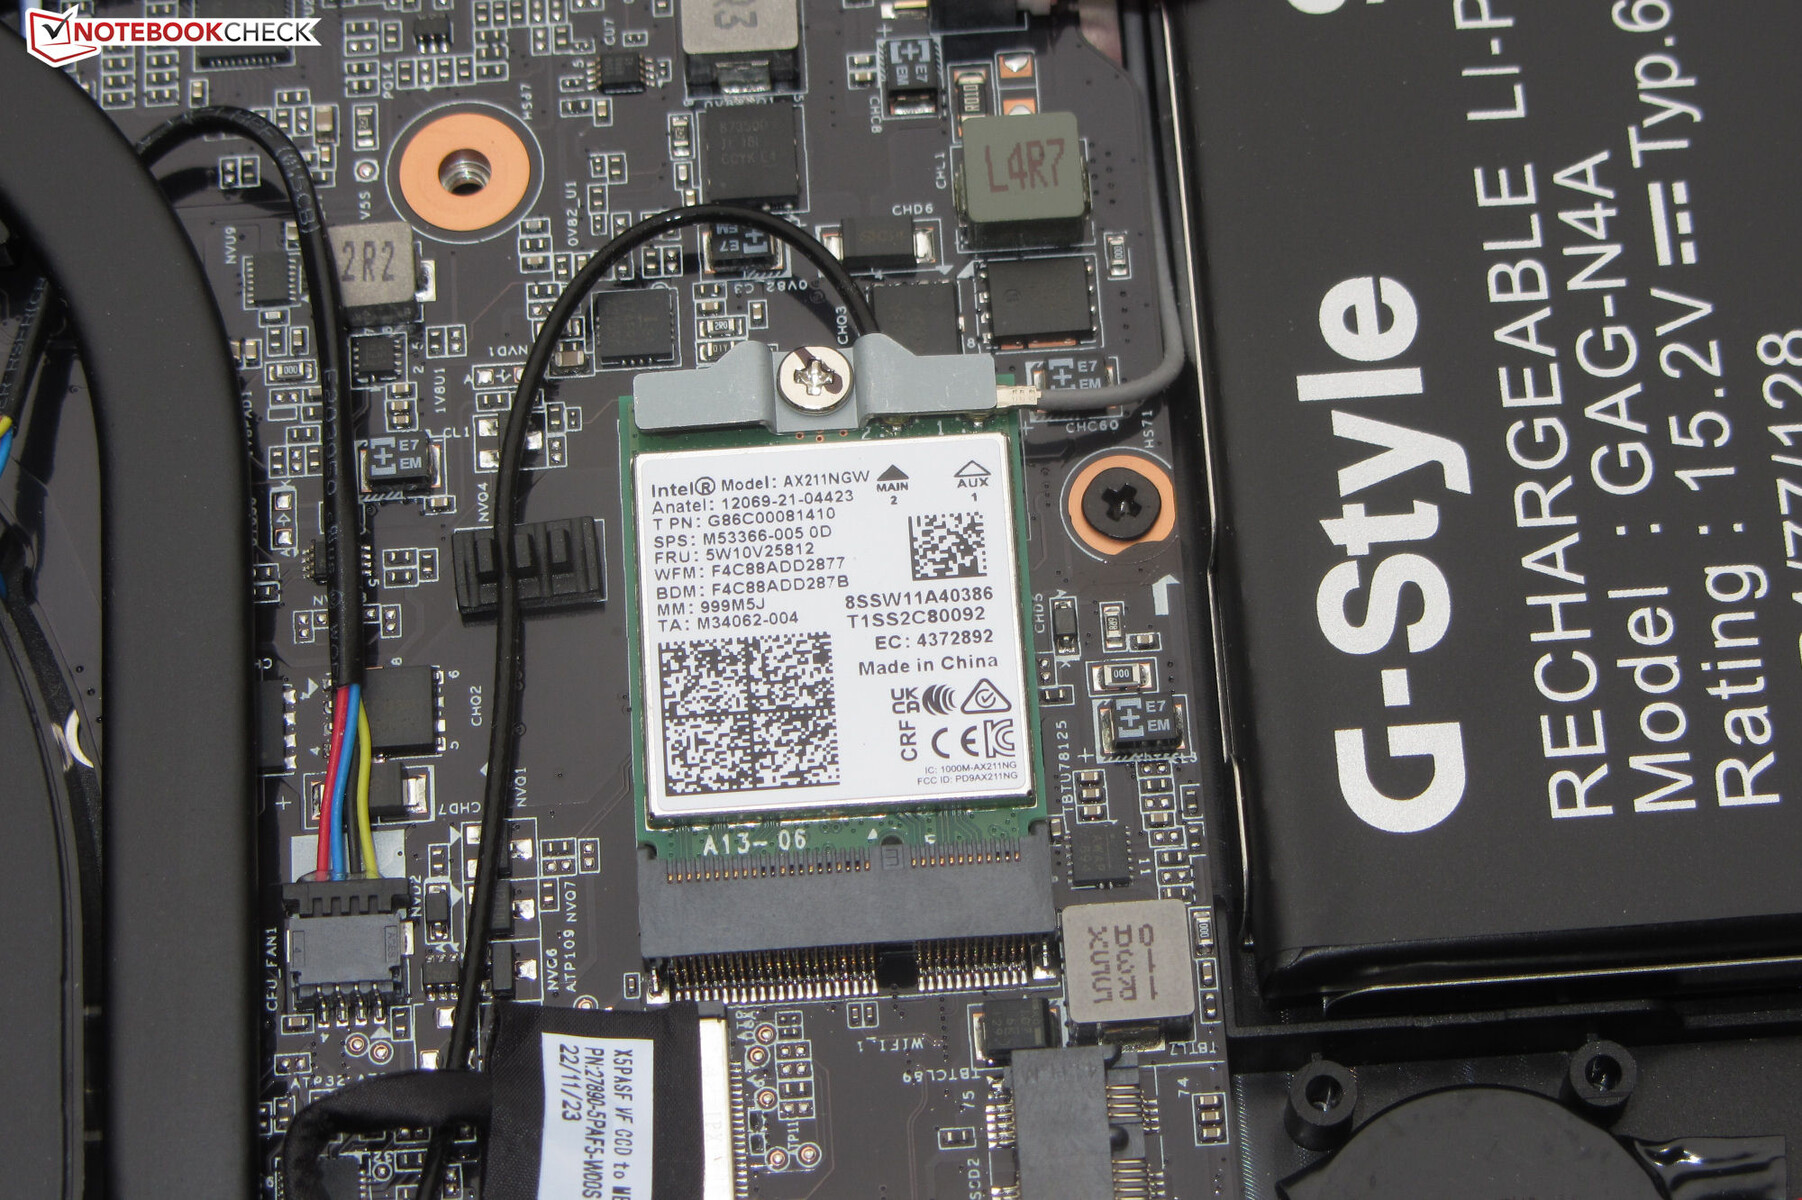
在最佳条件下(附近没有额外的WLAN设备,笔记本电脑和服务器PC之间的距离很小),笔记本电脑的WLAN传输速率很好,然而,考虑到这种Wi-Fi芯片(英特尔AX211;Wi-Fi 6E)所能做到的,它们仍然略低于平均水平。有线网络连接是通过Realtek的千兆以太网芯片(RTL8125;2.5Gbit)实现的。
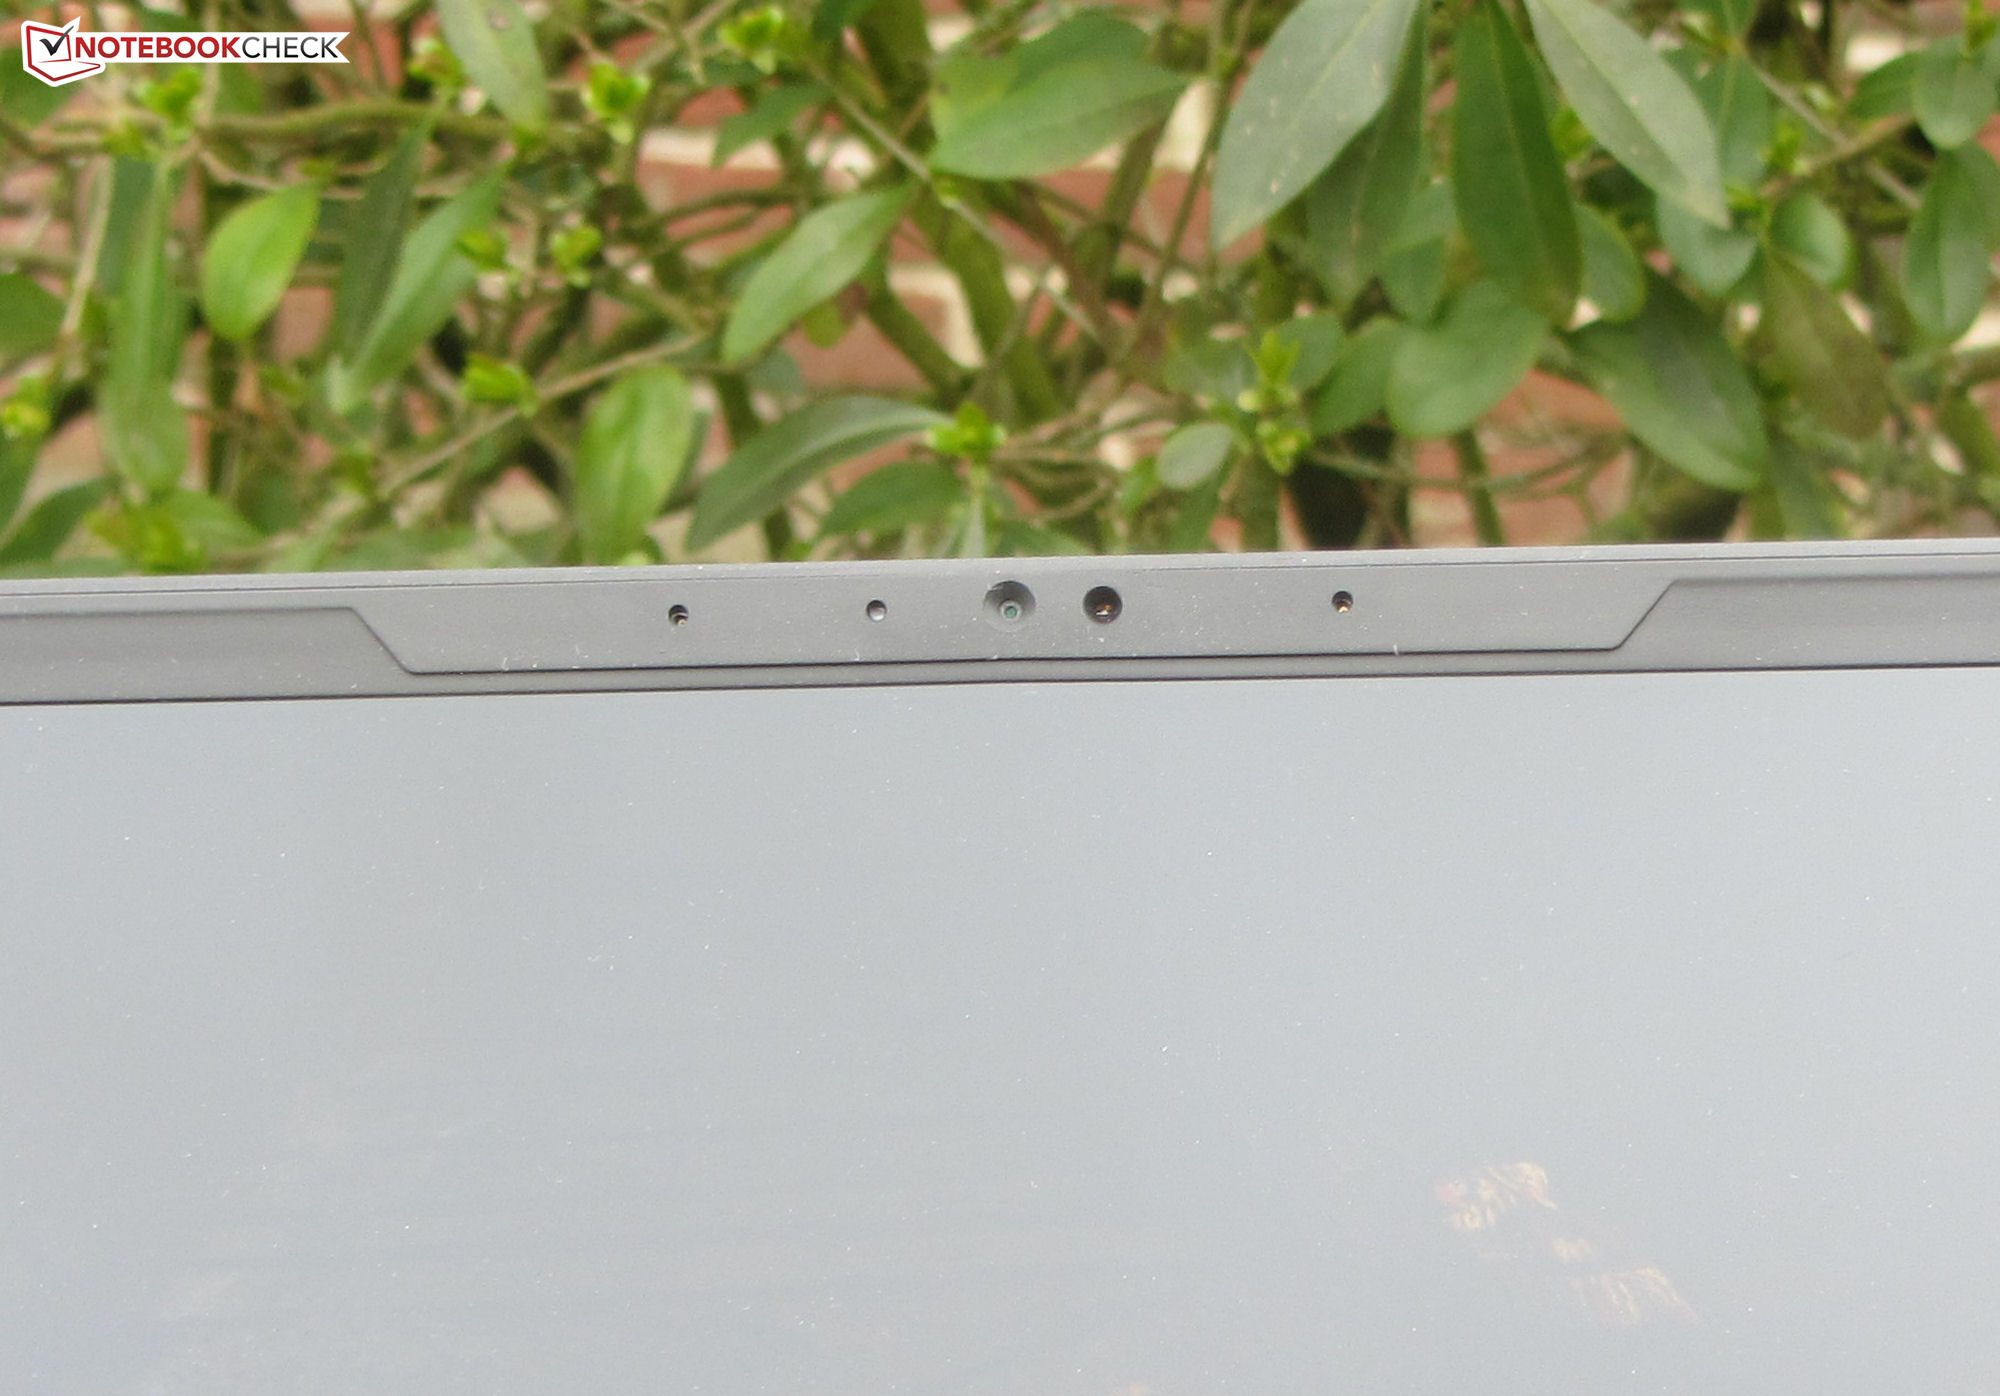
网络摄像头
该设备的网络摄像头(210万像素,最大1,920 x 1,080像素)没有盖子,然而,其质量相当标准。它在色彩准确性方面有点挣扎:它的色彩偏差为11,意味着这属于不可接受的范围(理想的:DeltaE小于3)。


辅料
除了通常的文件(快速入门指南和保修信息)外,这台笔记本电脑没有附带任何额外的配件。
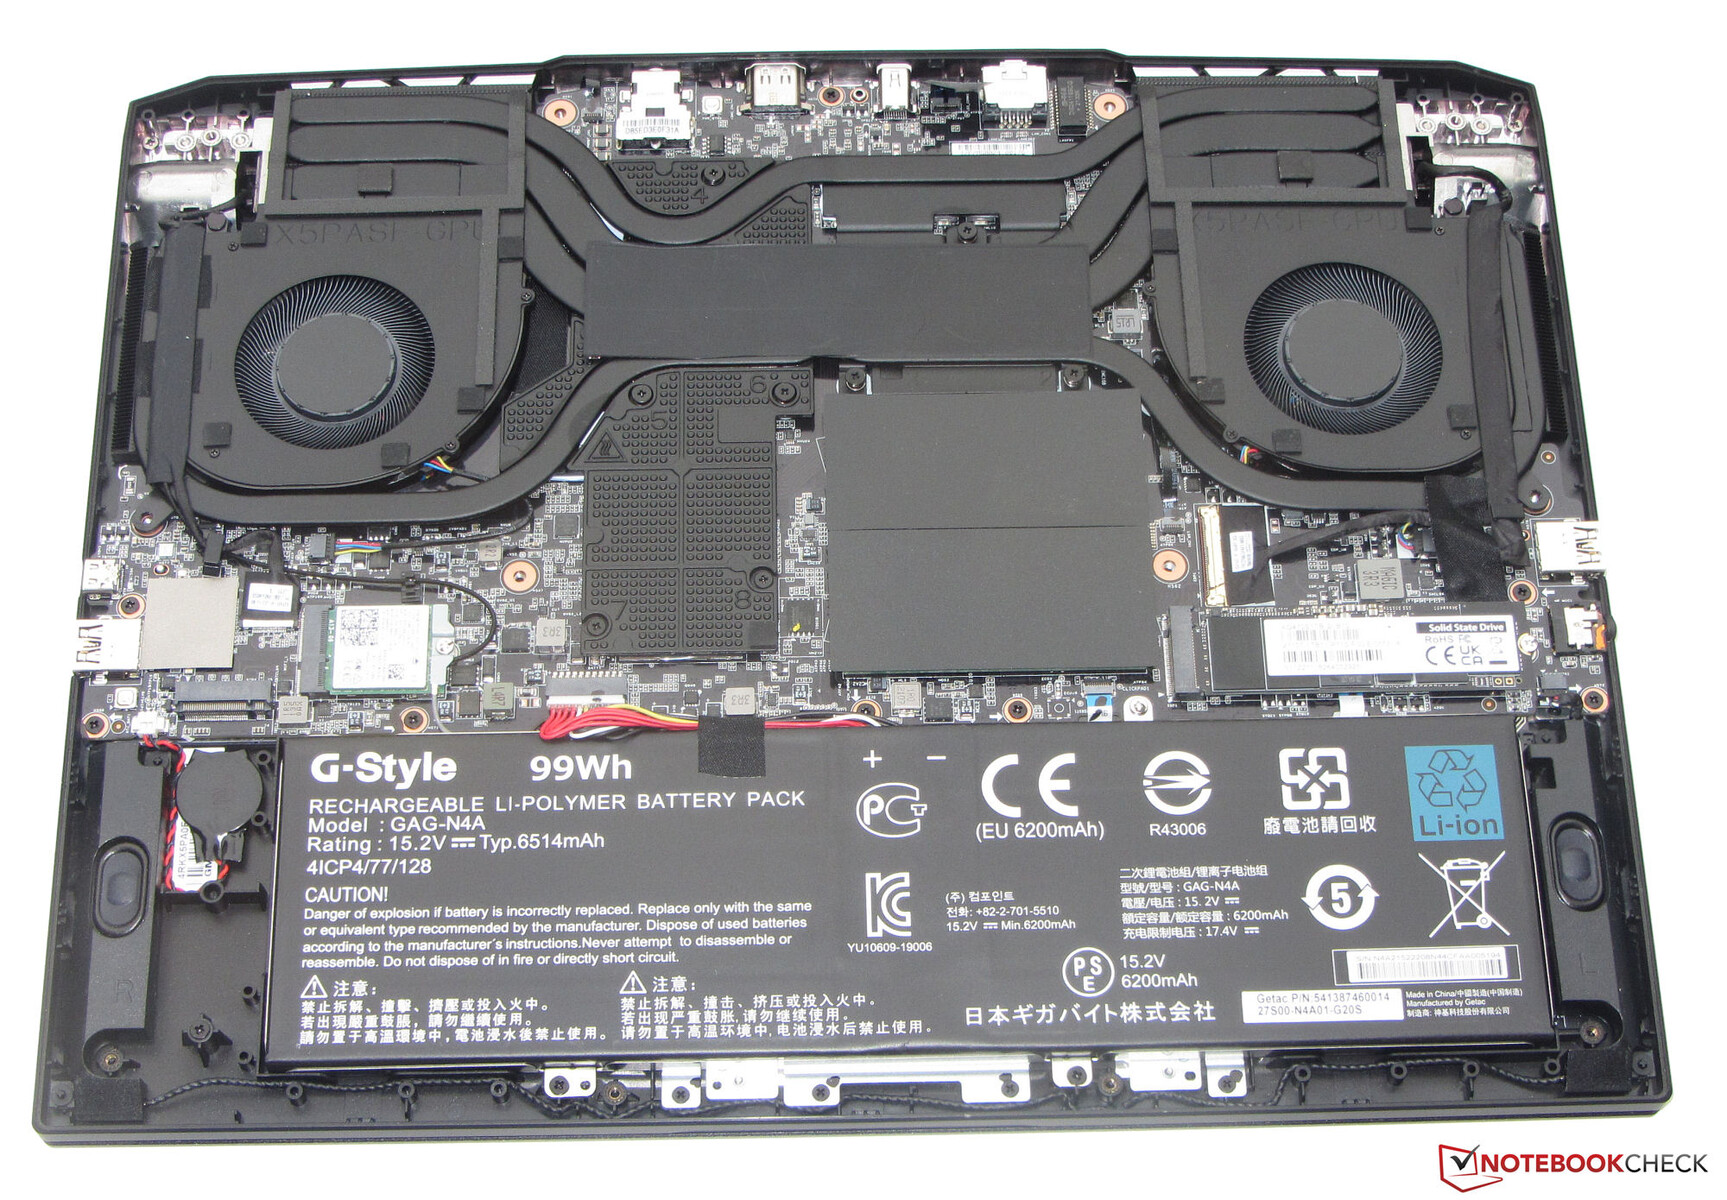
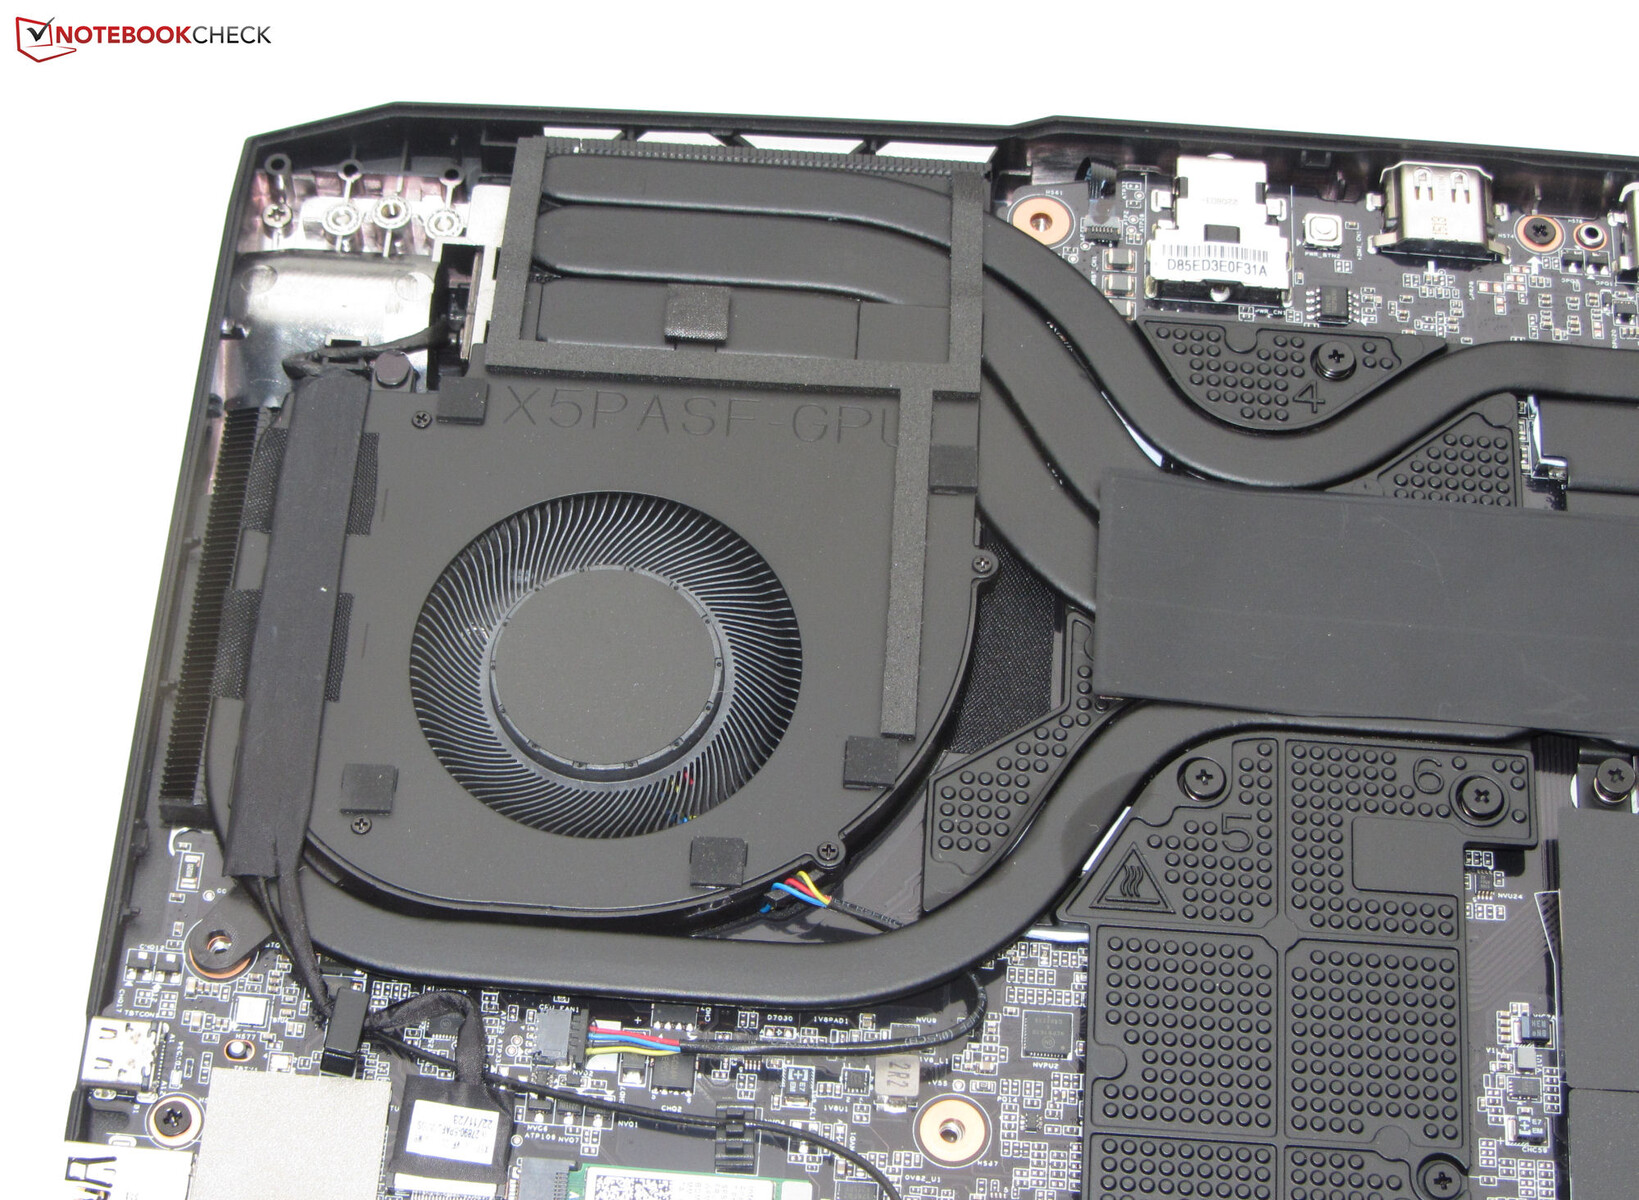
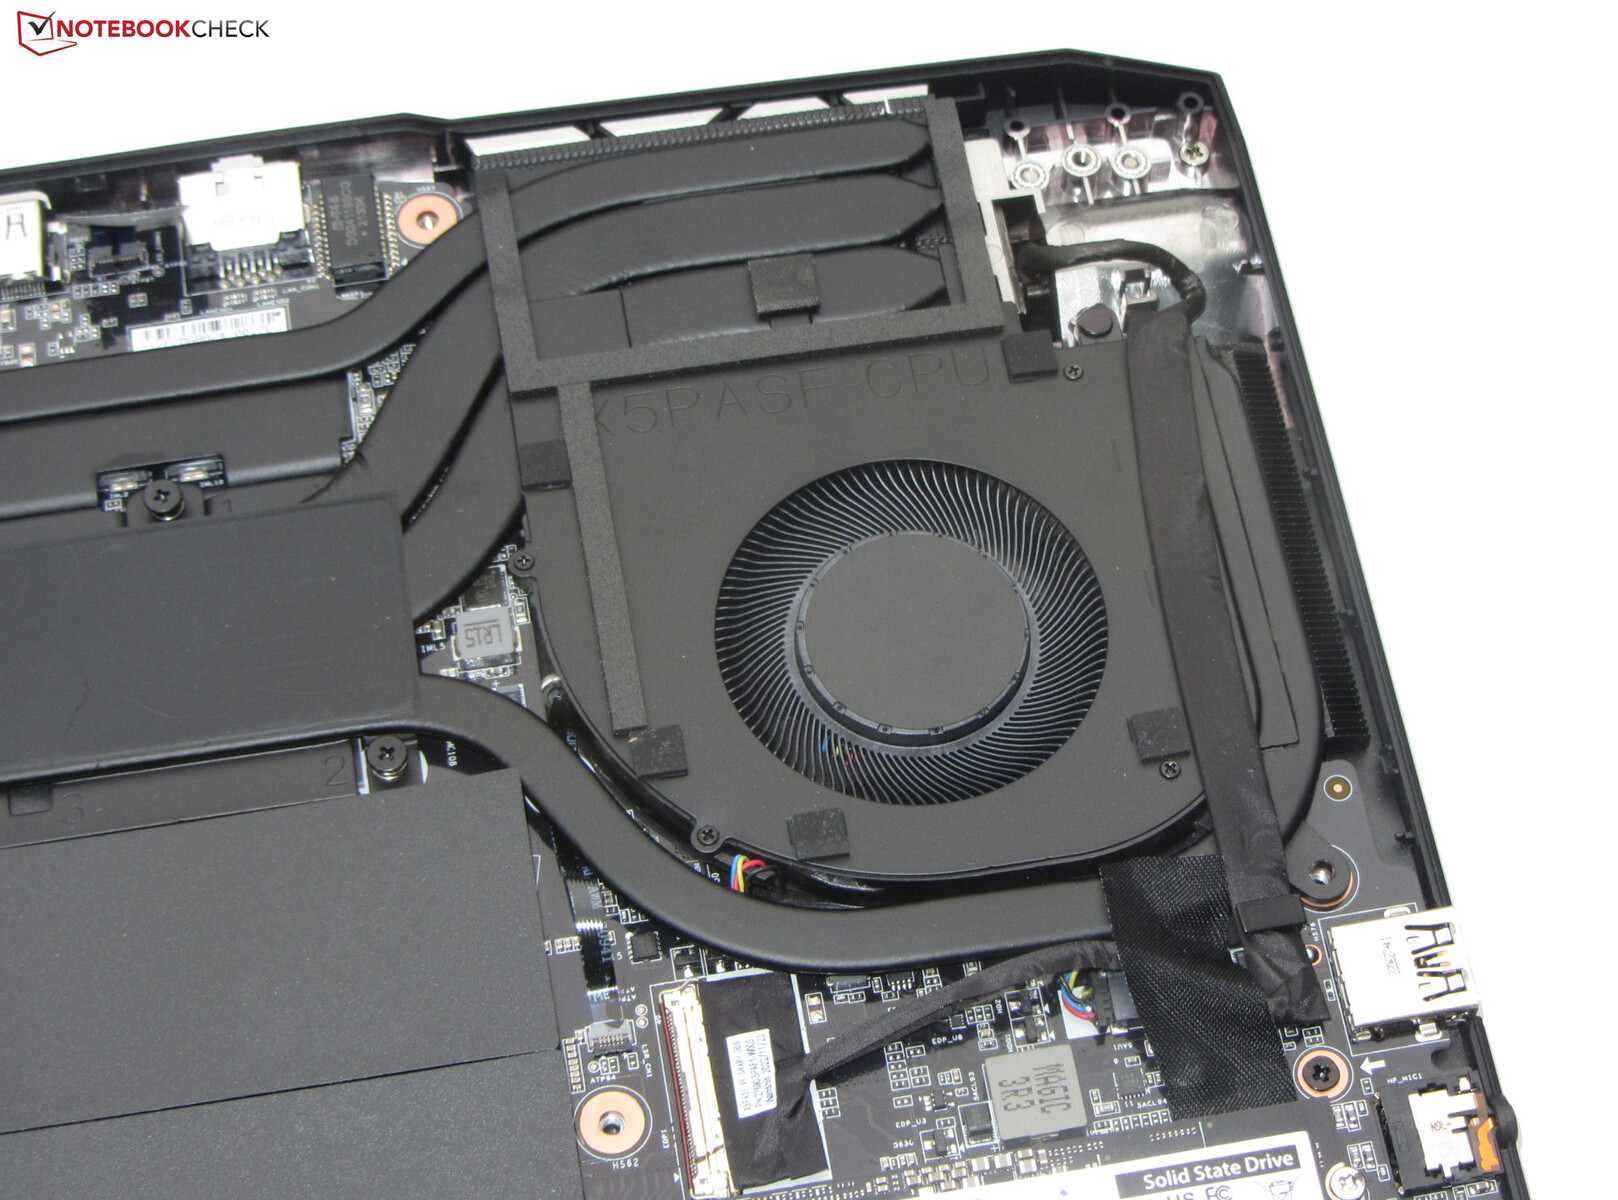
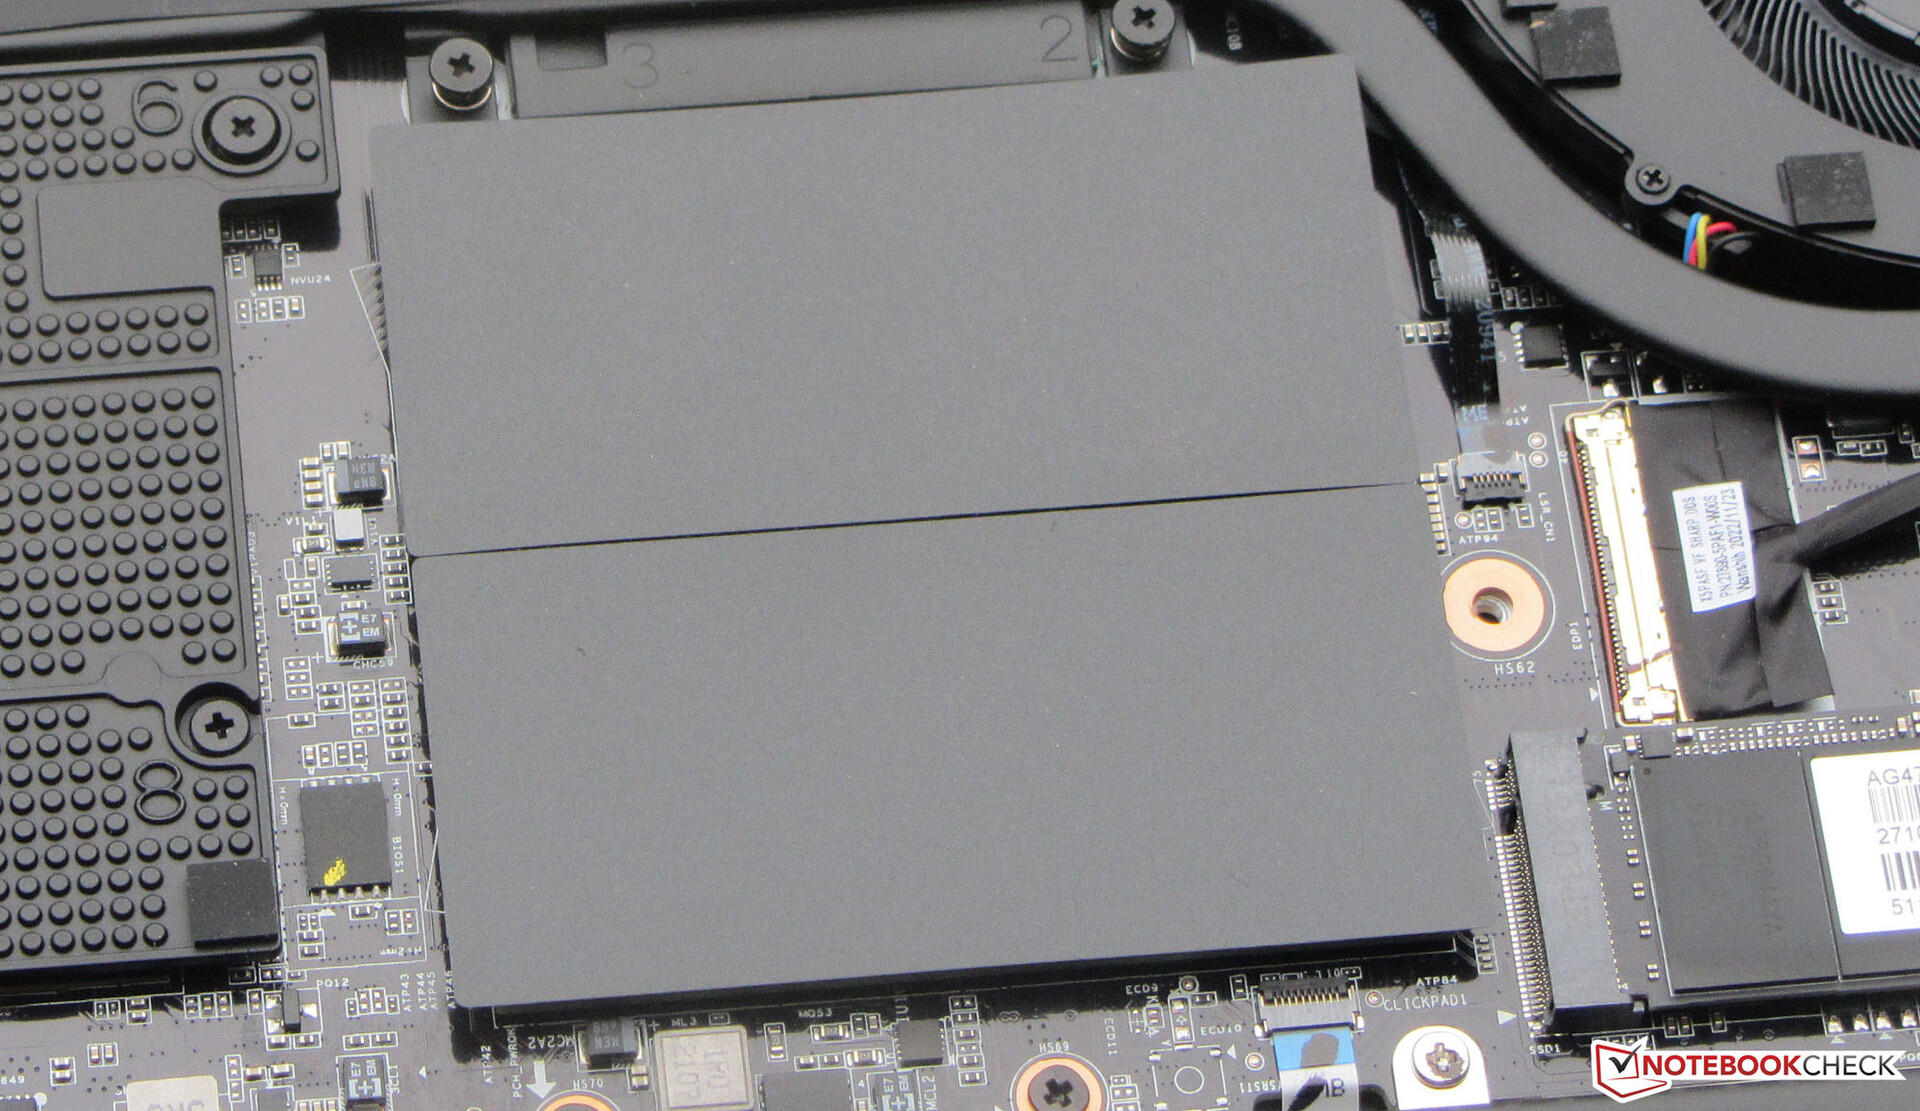
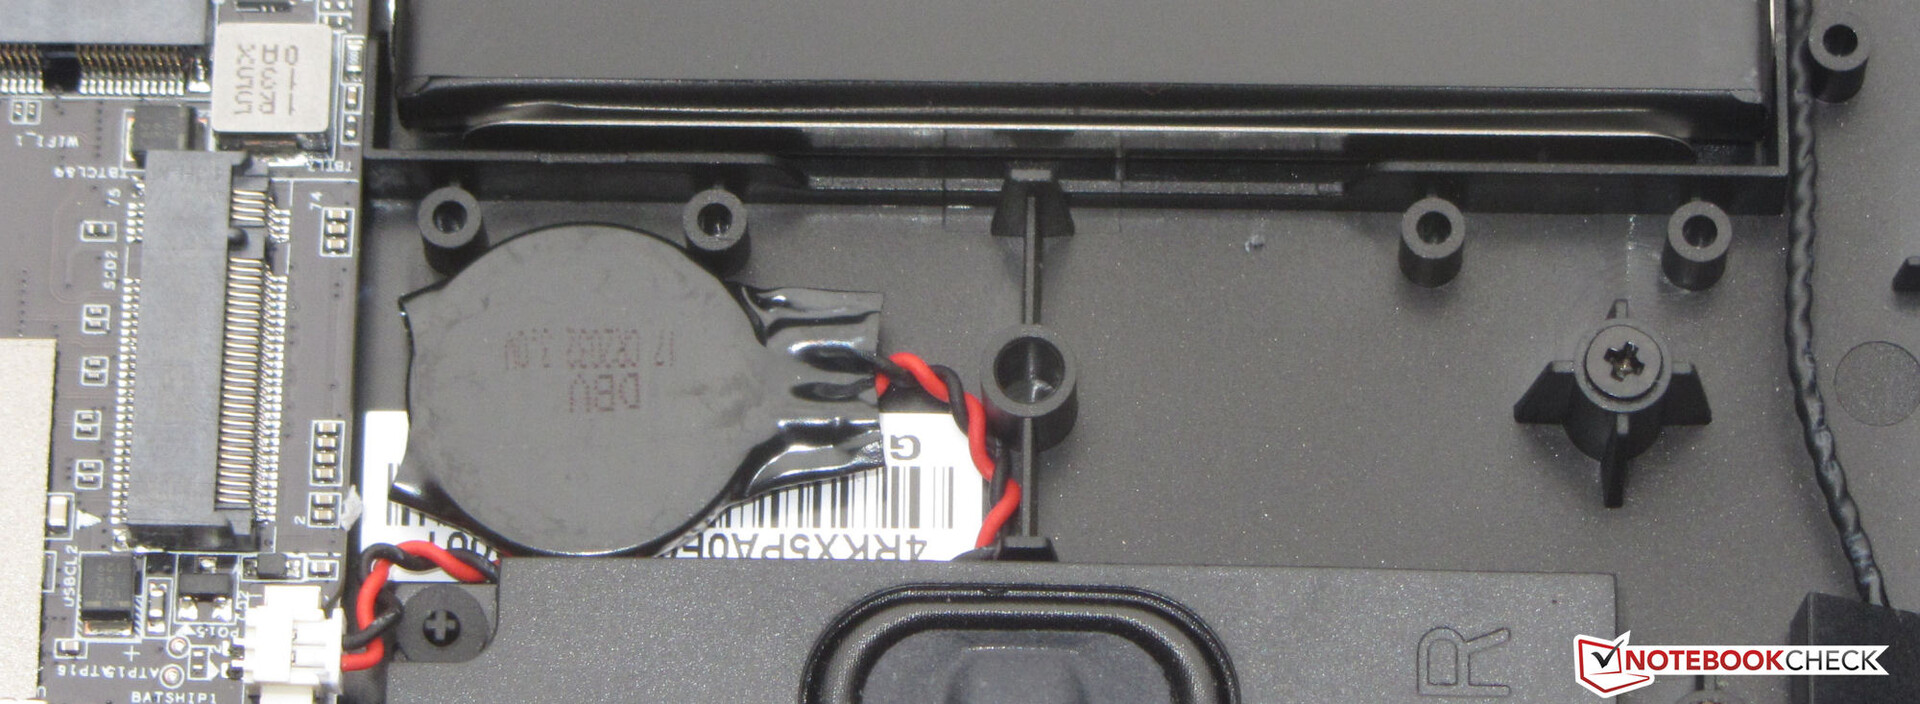
维护
从设备底部卸下所有螺丝后,可以用平铲或调色刀帮助卸下底部外壳。随后,可以访问RAM插槽(两个都在使用)、SSD(PCIe 4)、第二个M.2 2280插槽(PCIe 4)、BIOS电池、WLAN模块、风扇、扬声器和电池。
担保
这款15.6英寸的技嘉笔记本电脑有两年的保修期。保修期延长是不可能的。
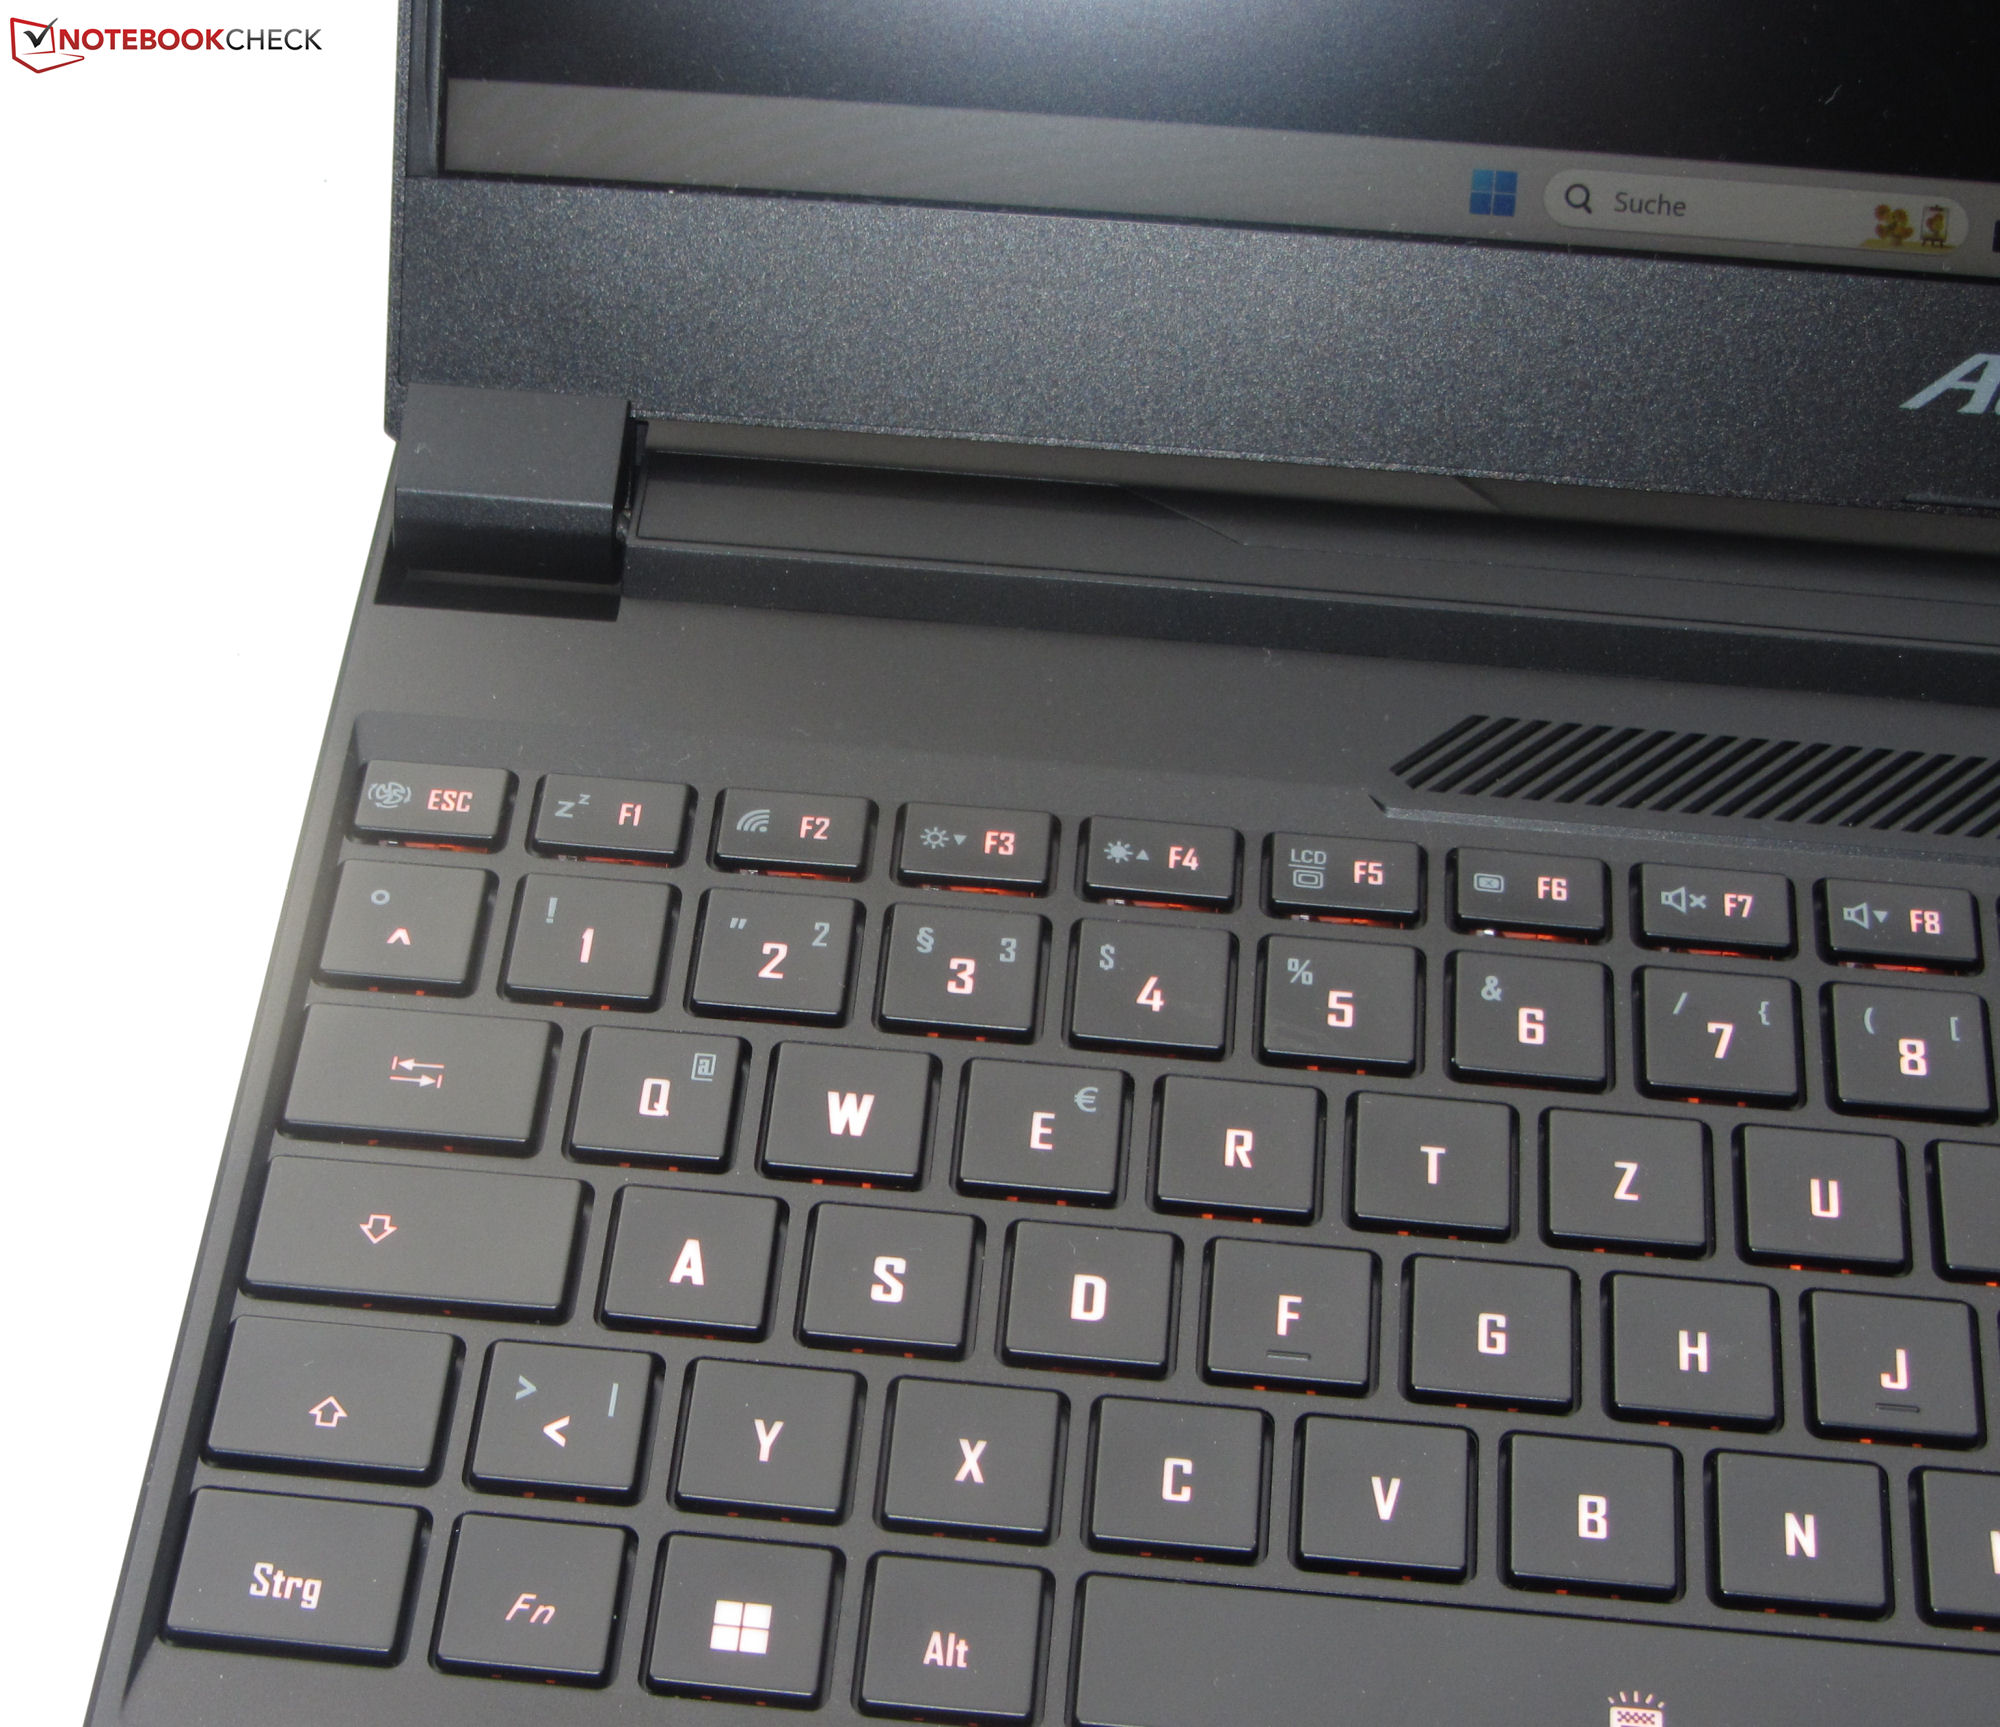
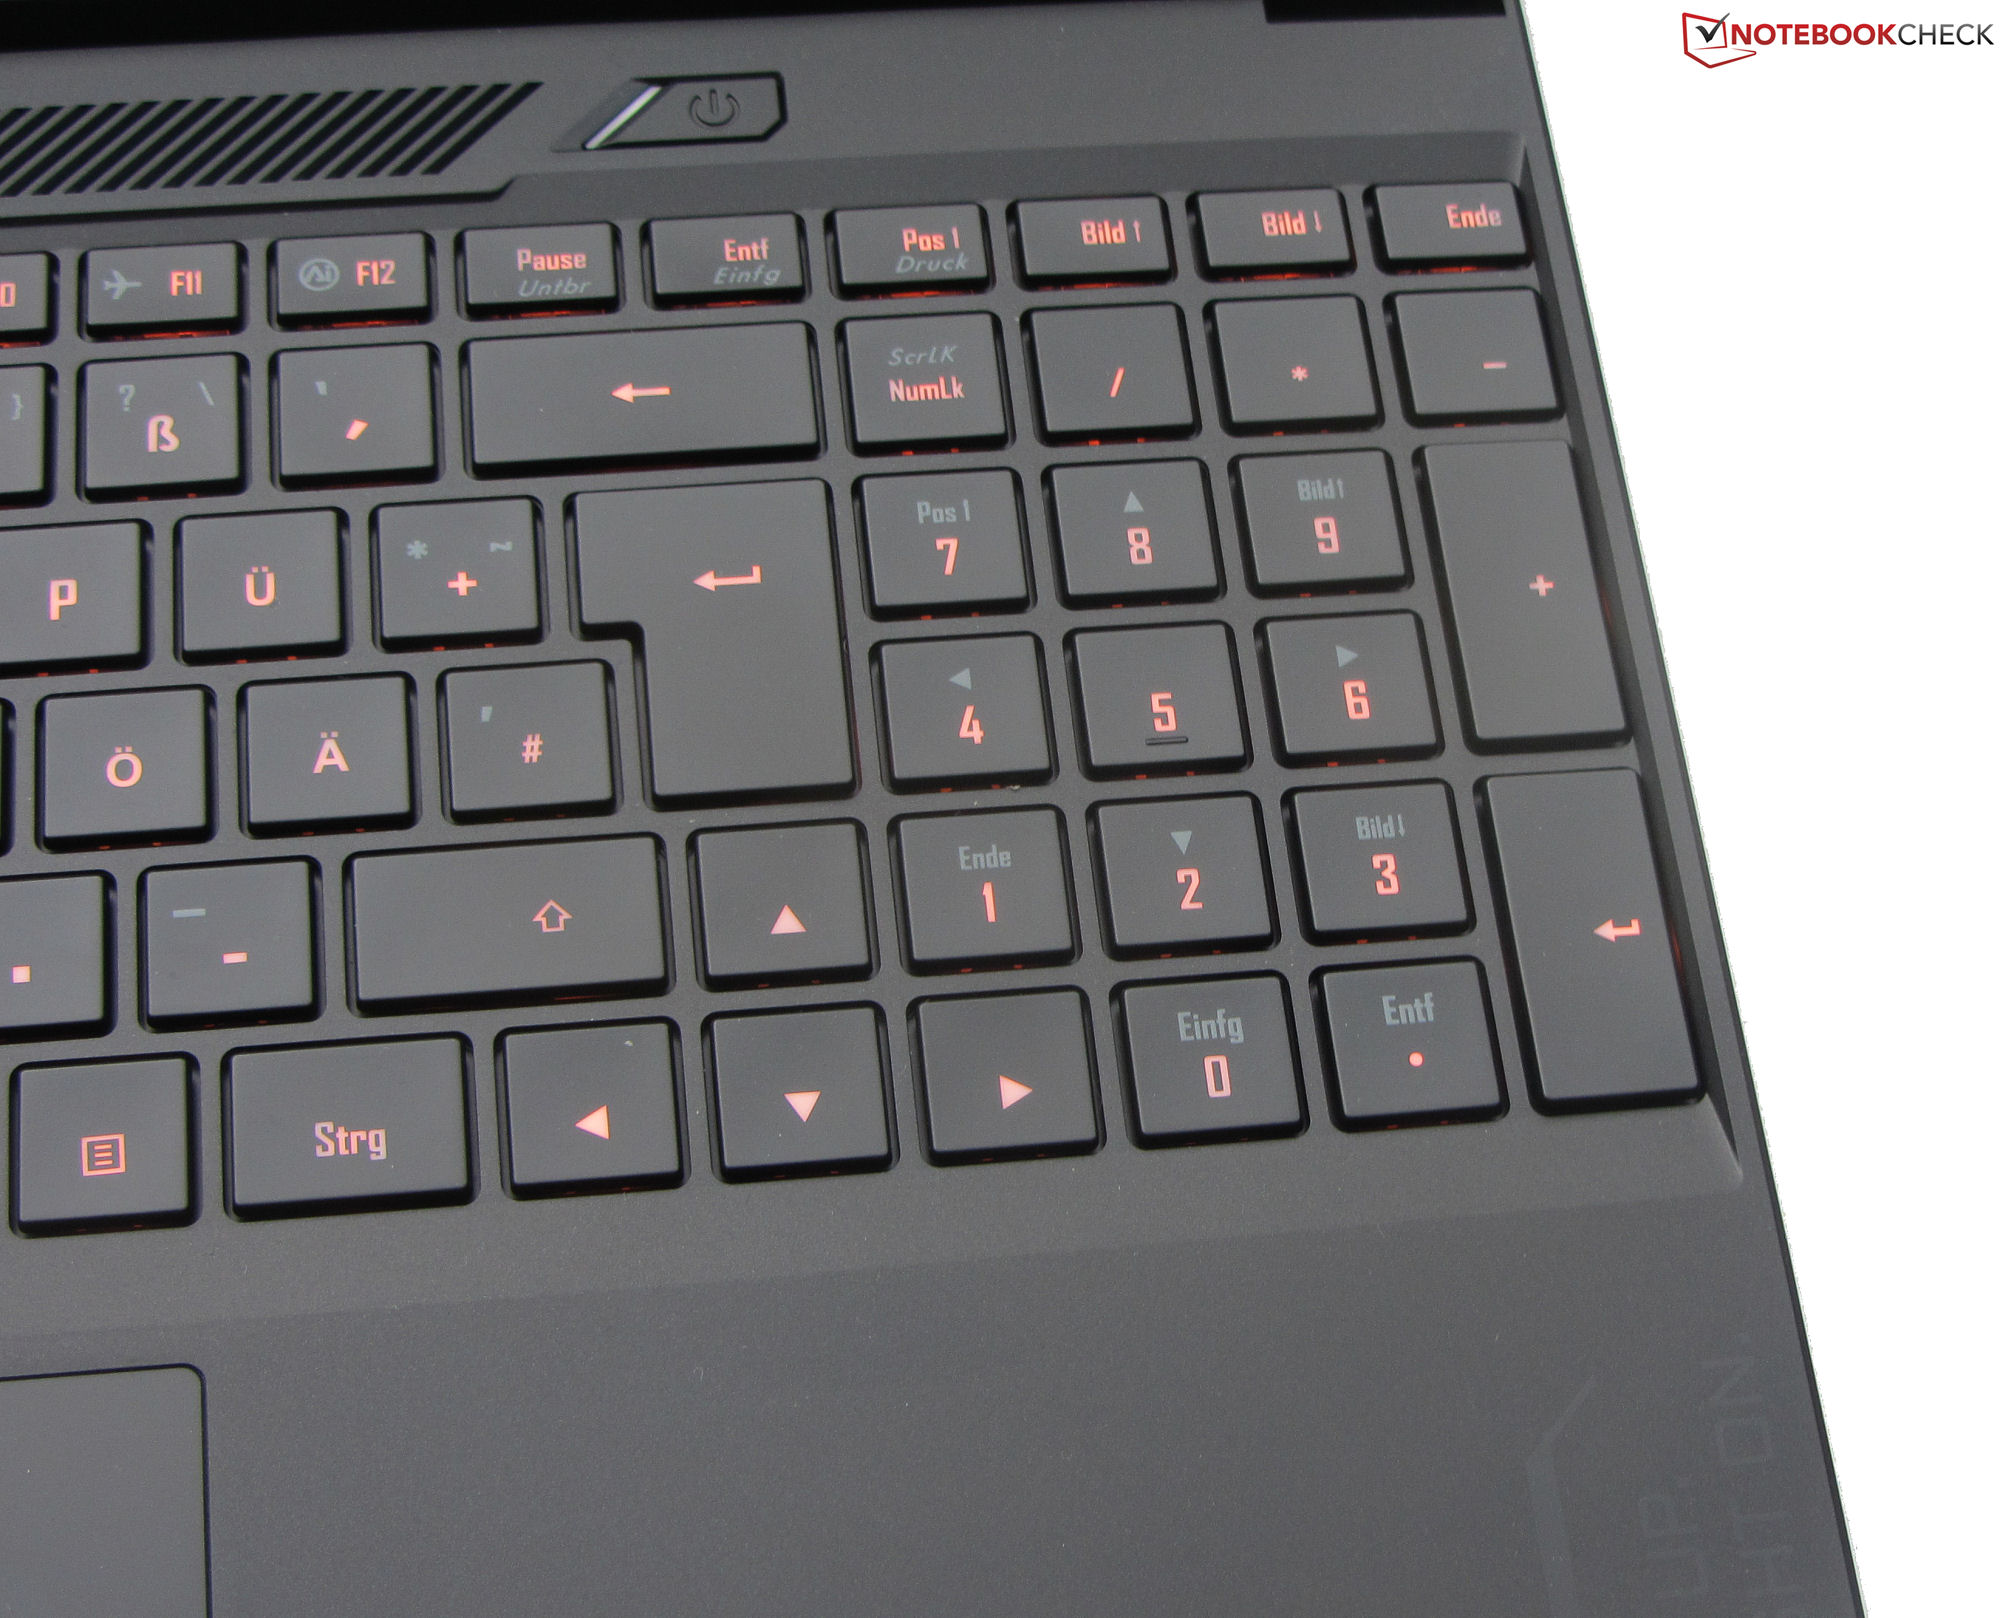
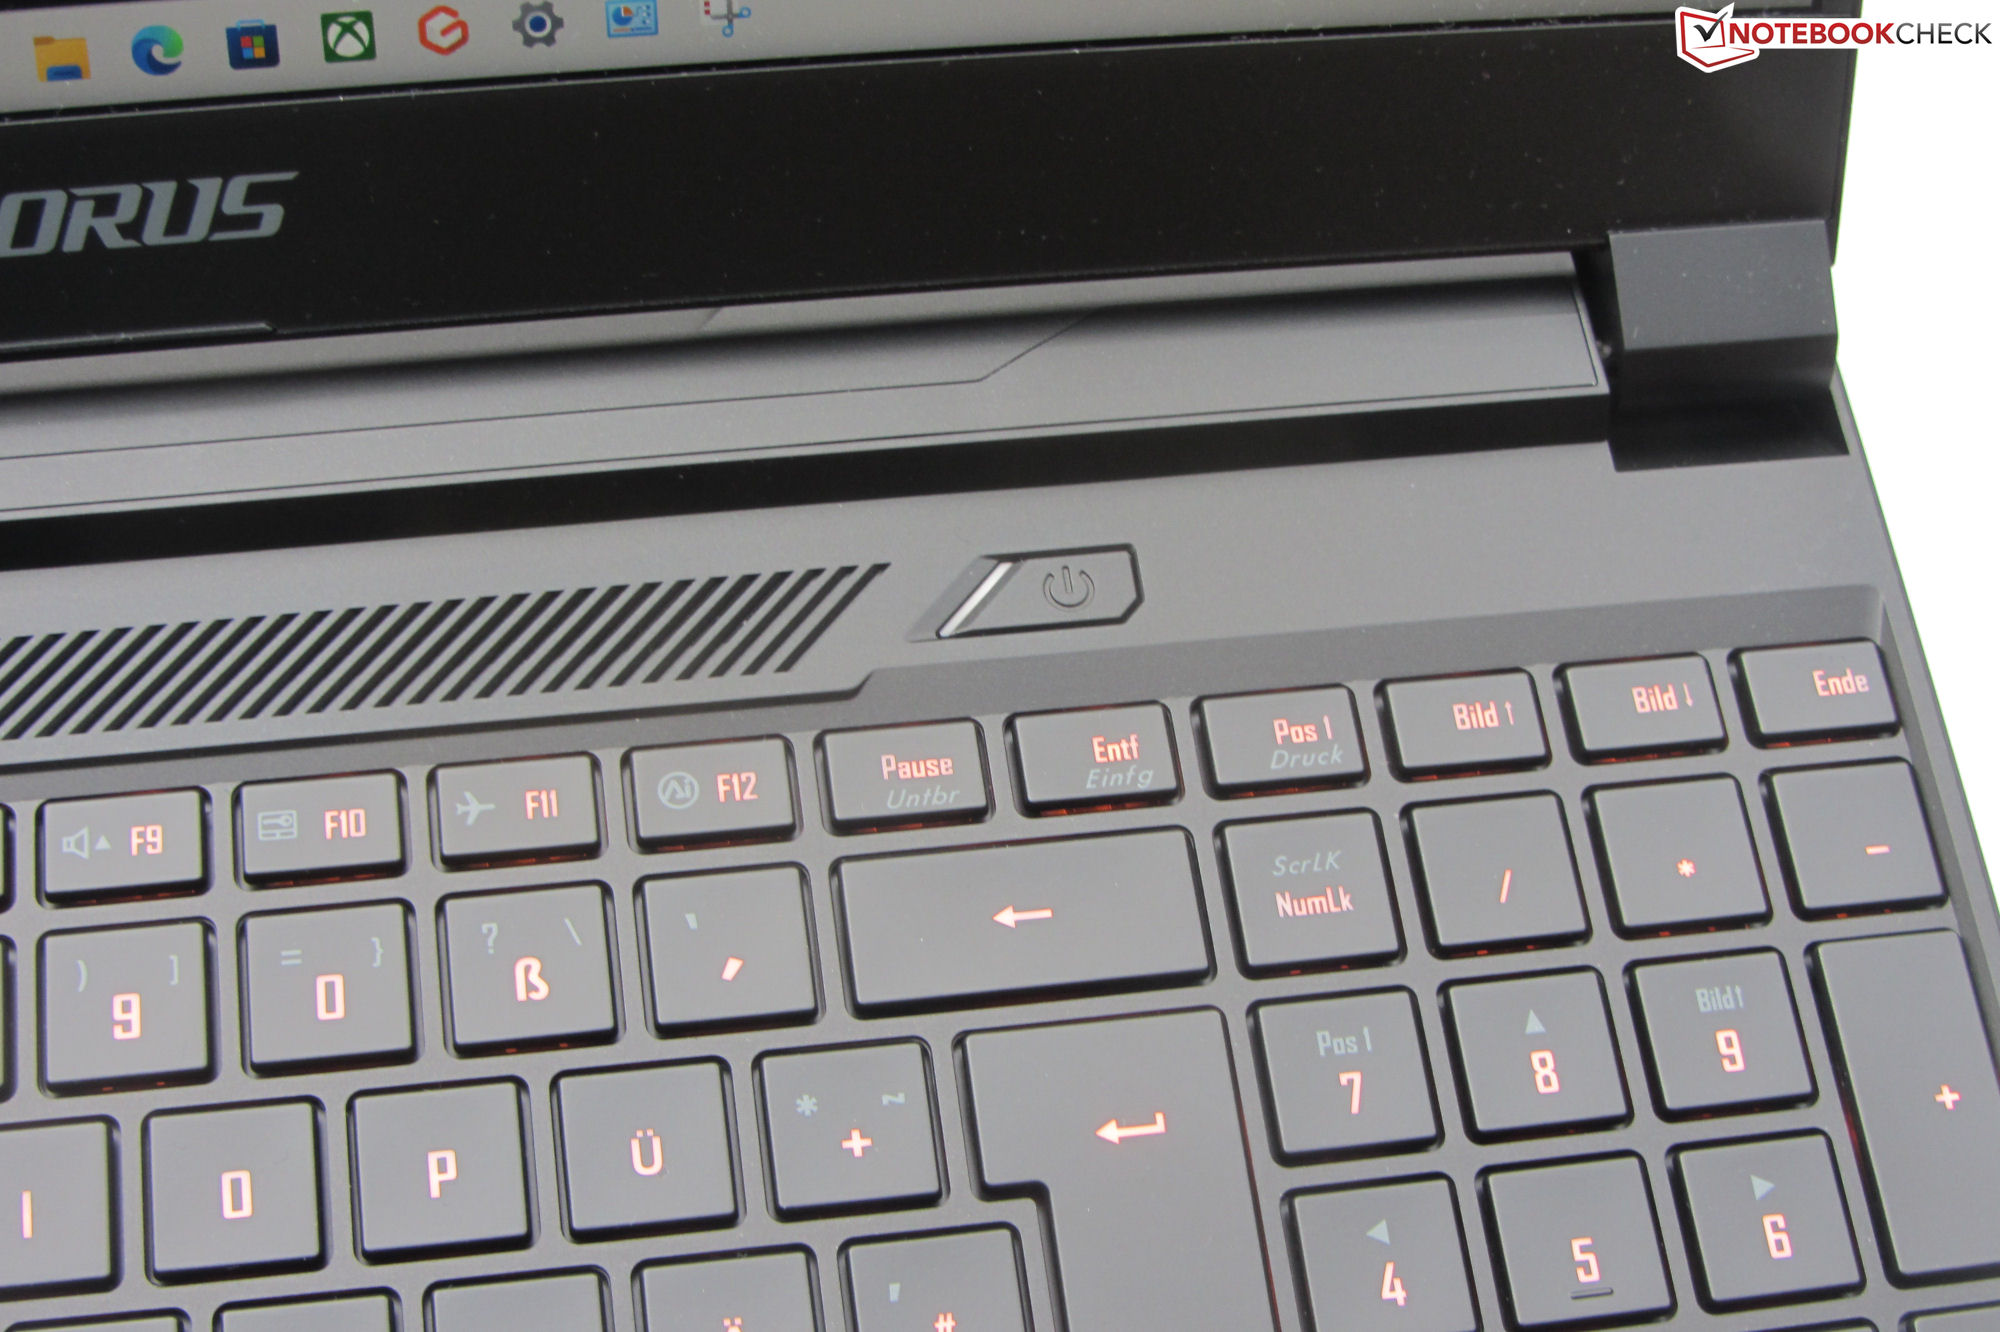
输入设备--带有独立照明键的游戏笔记本电脑
键盘
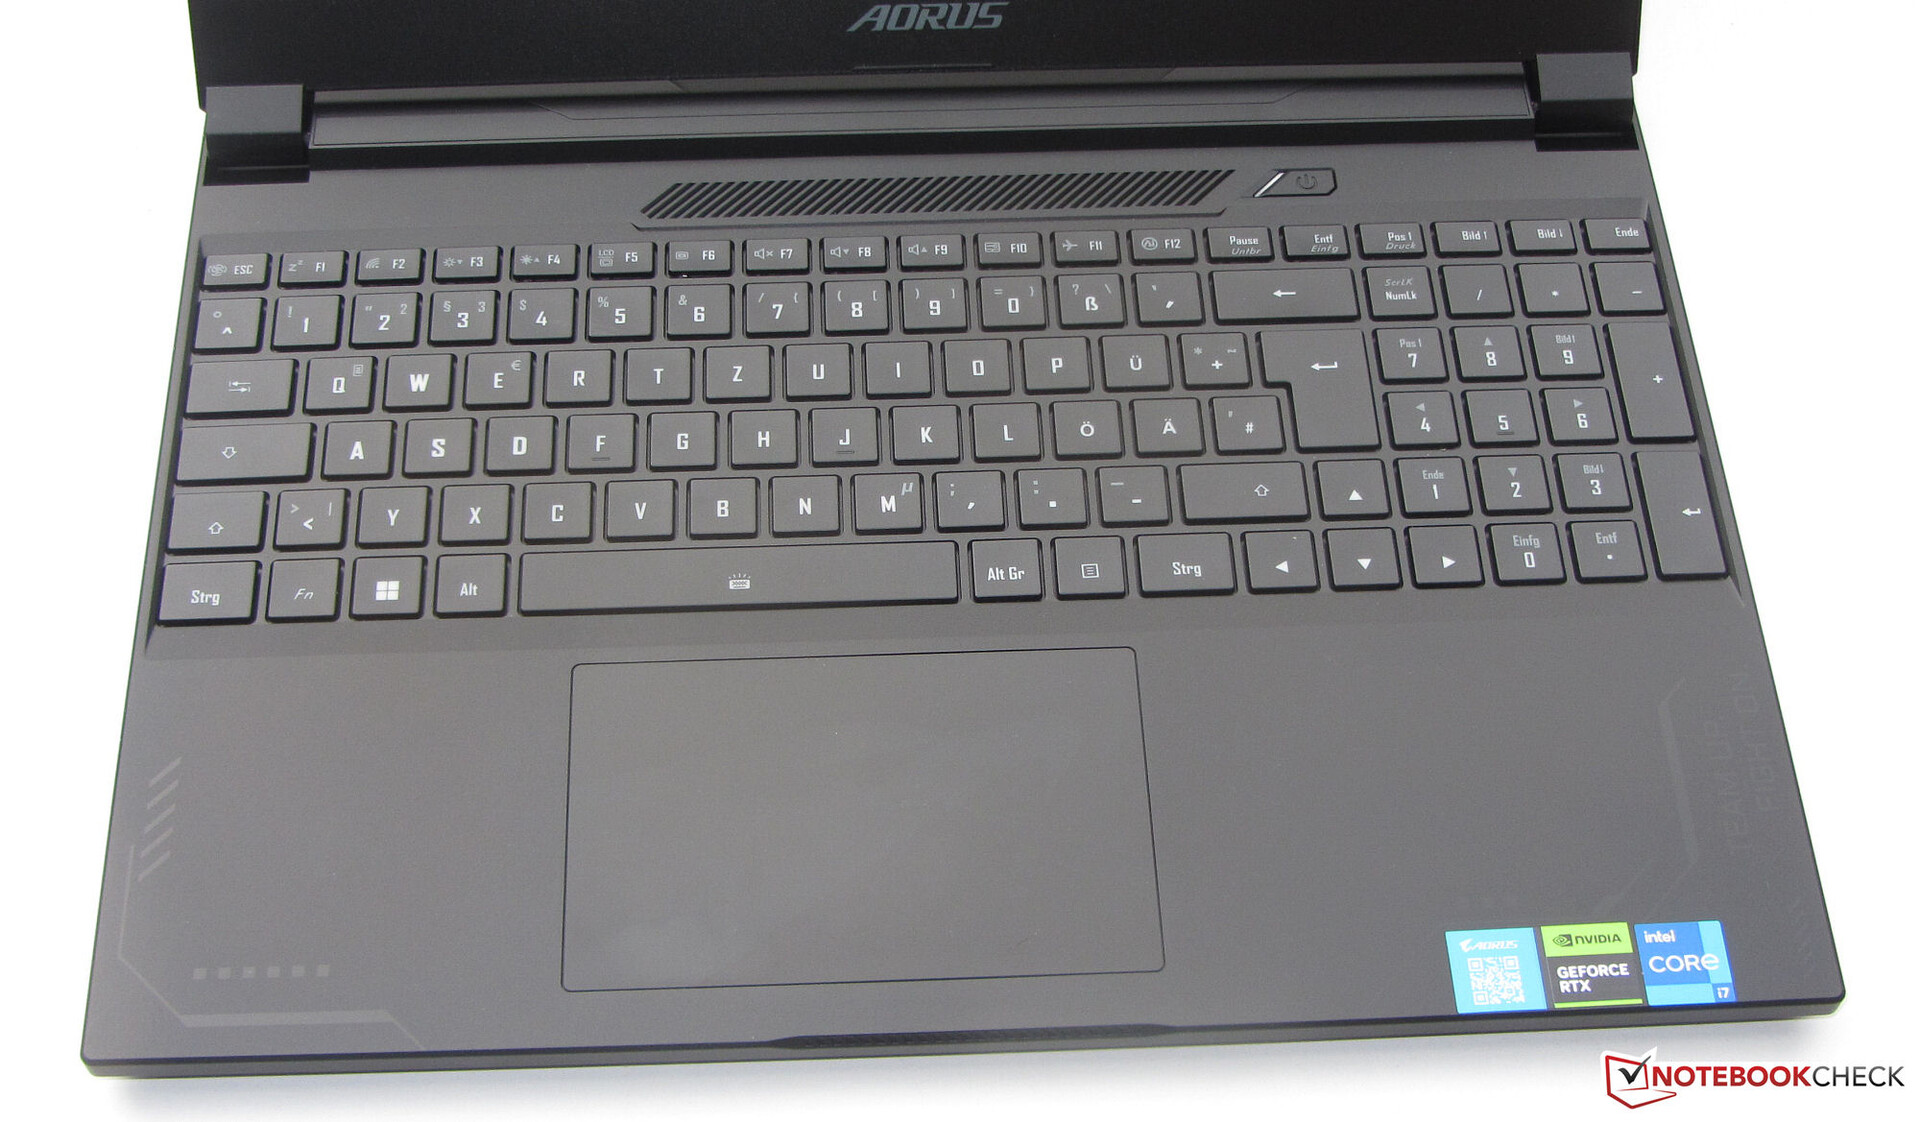
Chiclet键盘的光滑按键具有中等程度的提升和清晰的压力点。每个键都是单独点亮的(三个亮度级别)。负面的:钥匙的次要功能没有捕捉到任何光线,这意味着它们几乎无法辨认。当你打字的时候,按键只有很小的力度--但这应该不会太令人讨厌。总的来说,技嘉为该设备提供了一个良好的日常键盘。
触摸板
多点触摸点击板(大约12.1 x 7.6厘米)在这台电脑上取代了鼠标--其光滑的表面使其易于使用。角落对输入有反应,有轻微的给力,并有一个清晰的压力点。
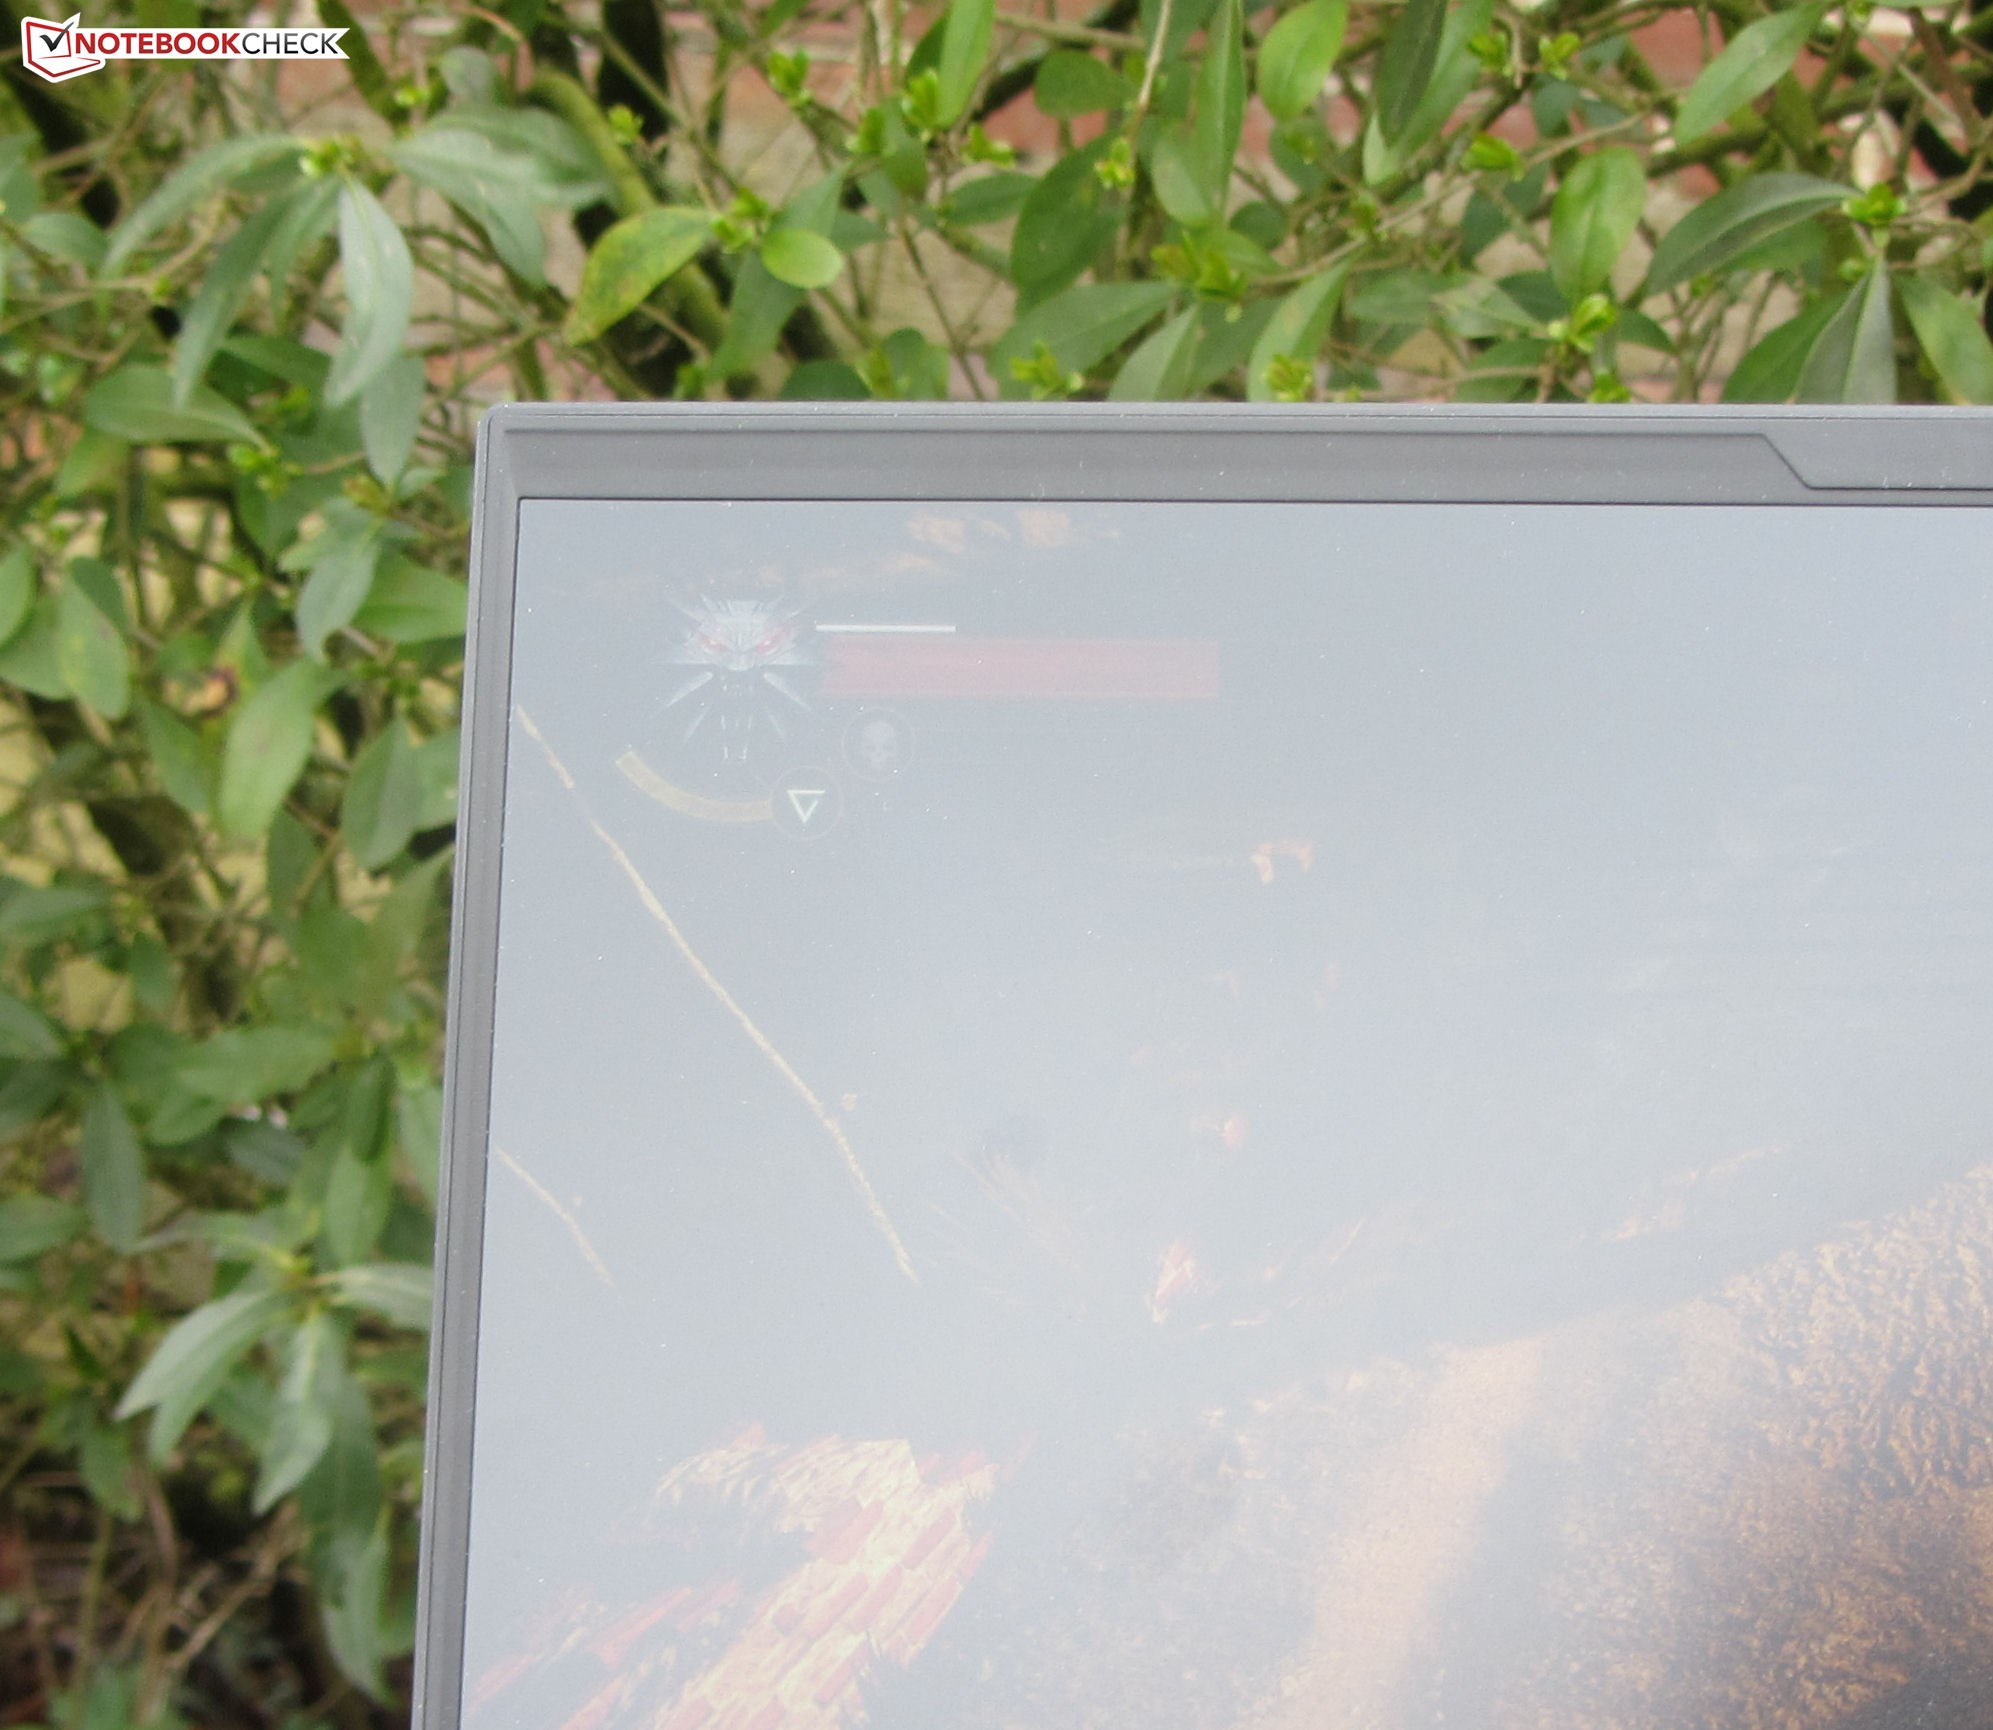
显示器 - 240赫兹QHD面板
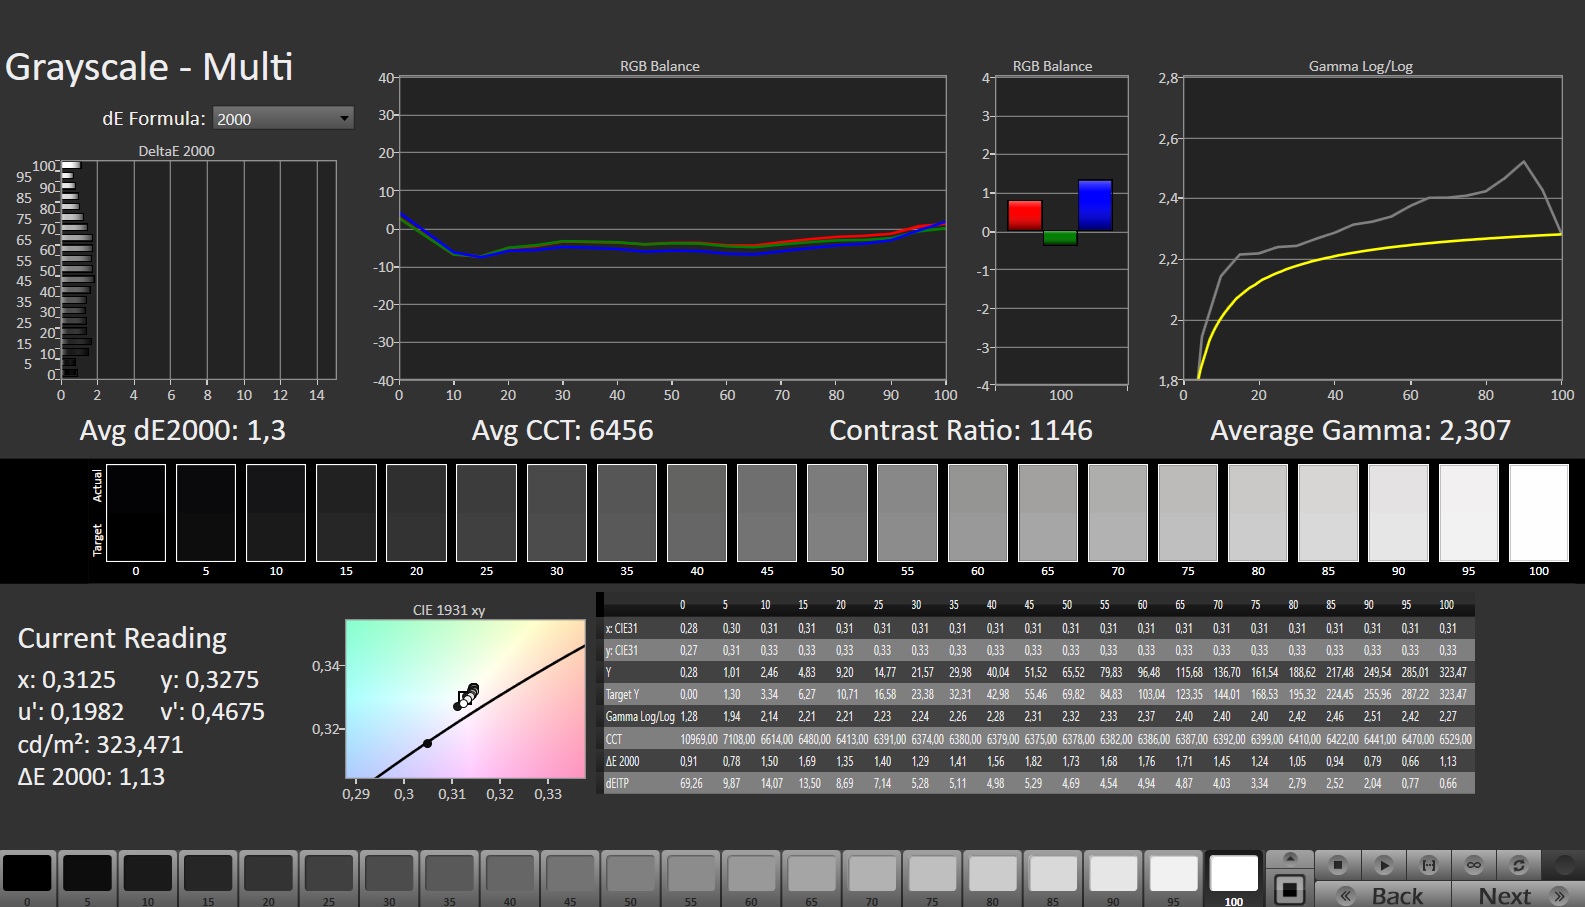
技嘉的15X配备了快速反应的16:9格式的240赫兹面板,在任何亮度水平下都不会出现PWM闪烁的情况。哑光15.6英寸显示屏(2,560 x 1,440像素)的亮度和对比度水平属于可接受的范围(> 300 cd/m²和1.000:1)。
与其竞争对手相比,Blade 15 由于其OLED面板而表现出色。
| |||||||||||||||||||||||||
Brightness Distribution: 90 %
Center on Battery: 316 cd/m²
Contrast: 1129:1 (Black: 0.28 cd/m²)
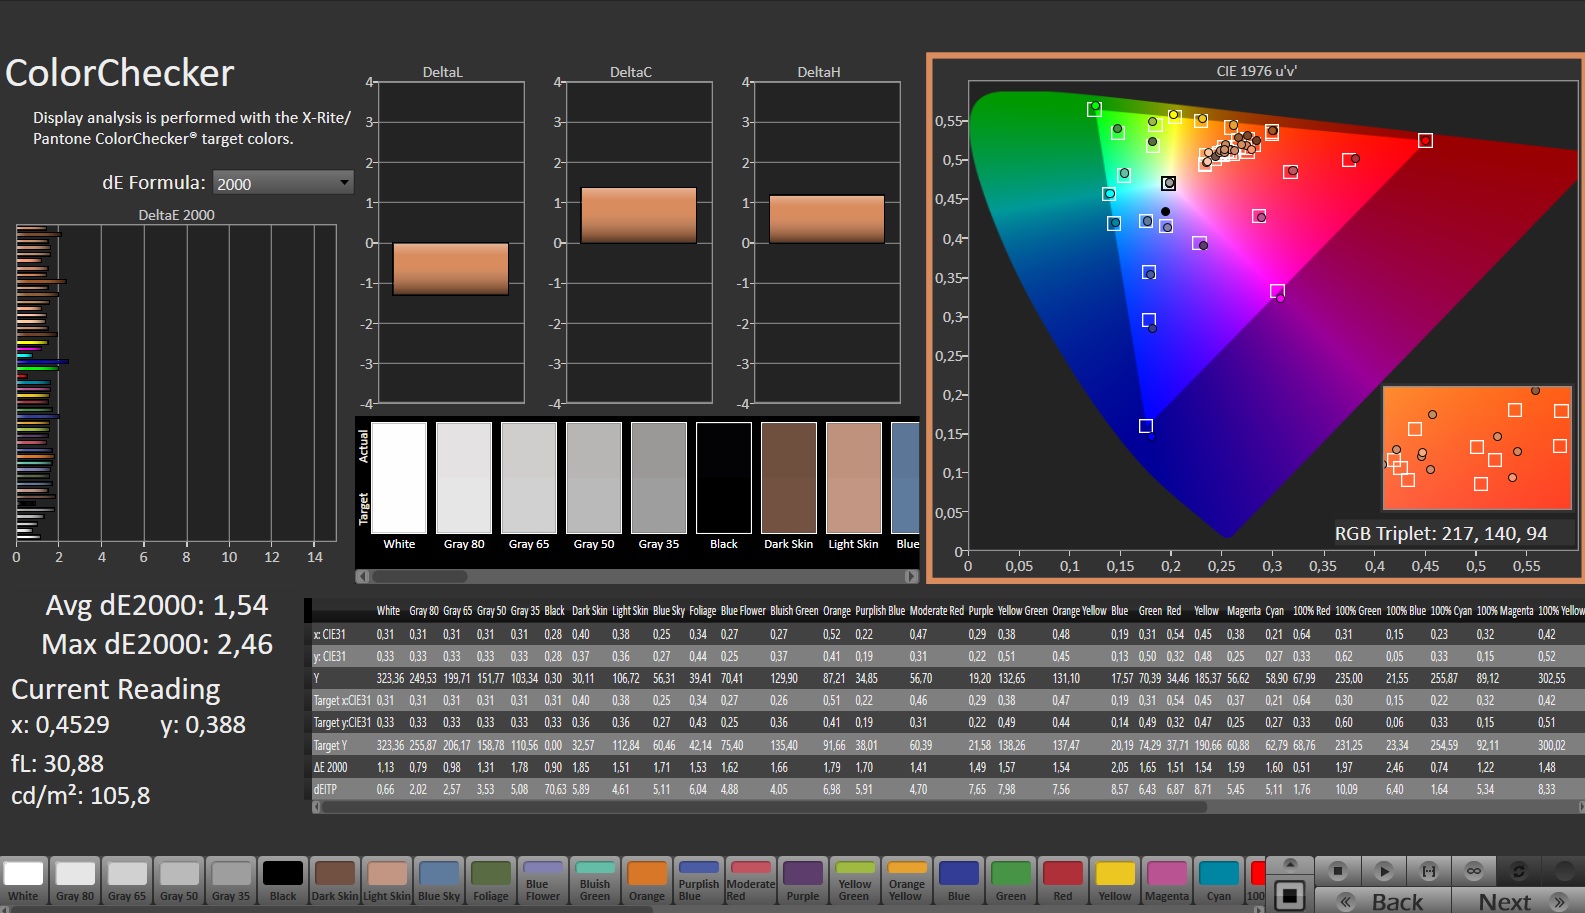
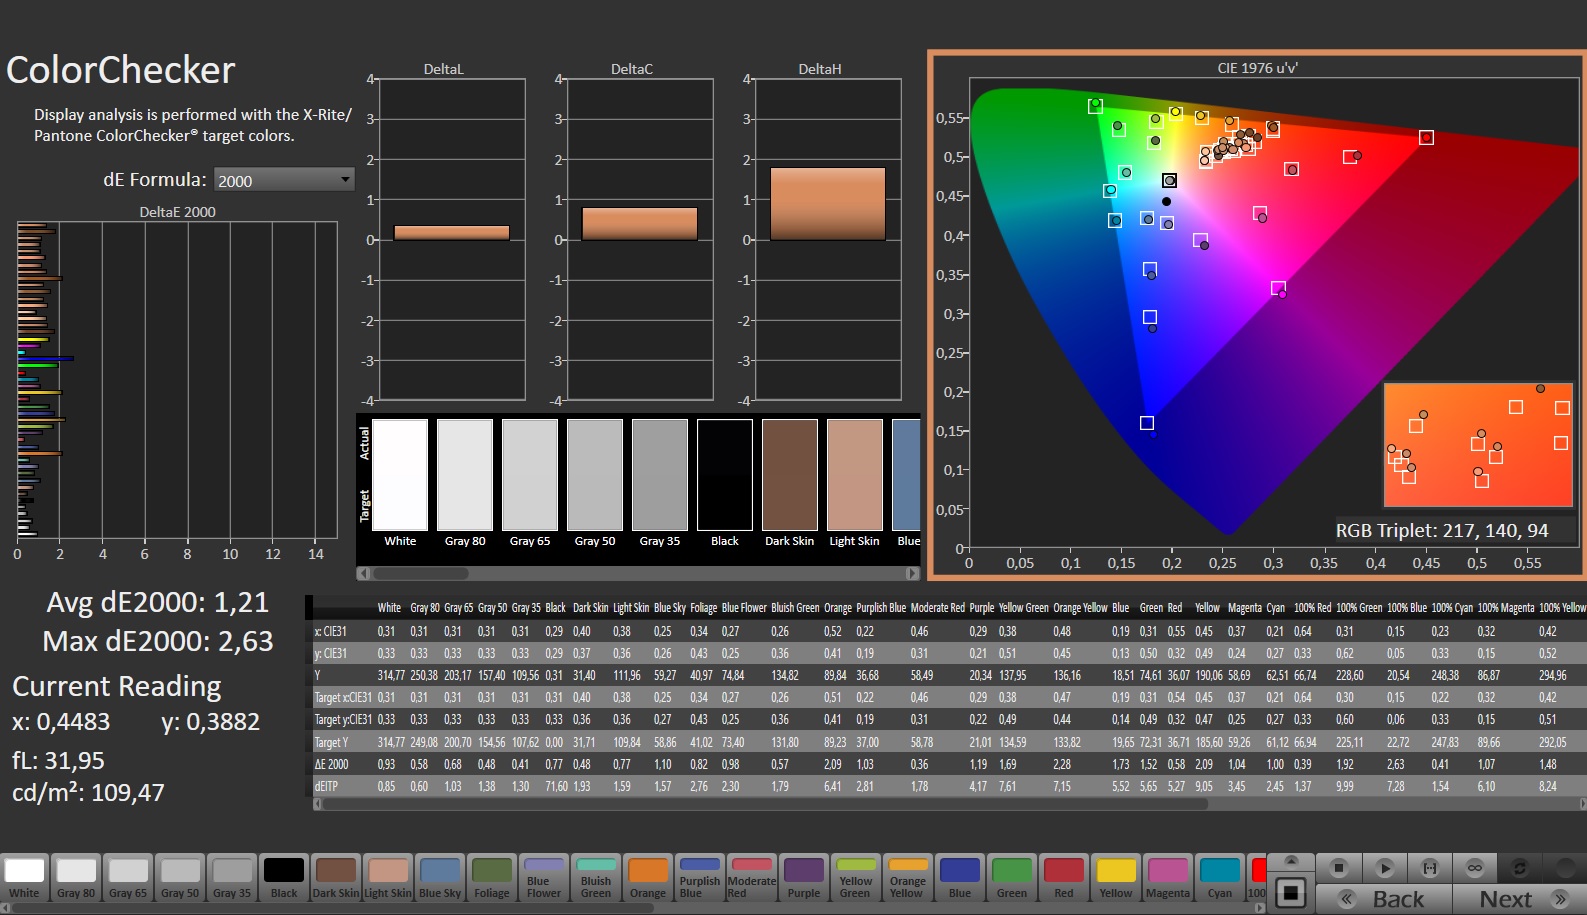
ΔE ColorChecker Calman: 1.54 | ∀{0.5-29.43 Ø4.71}
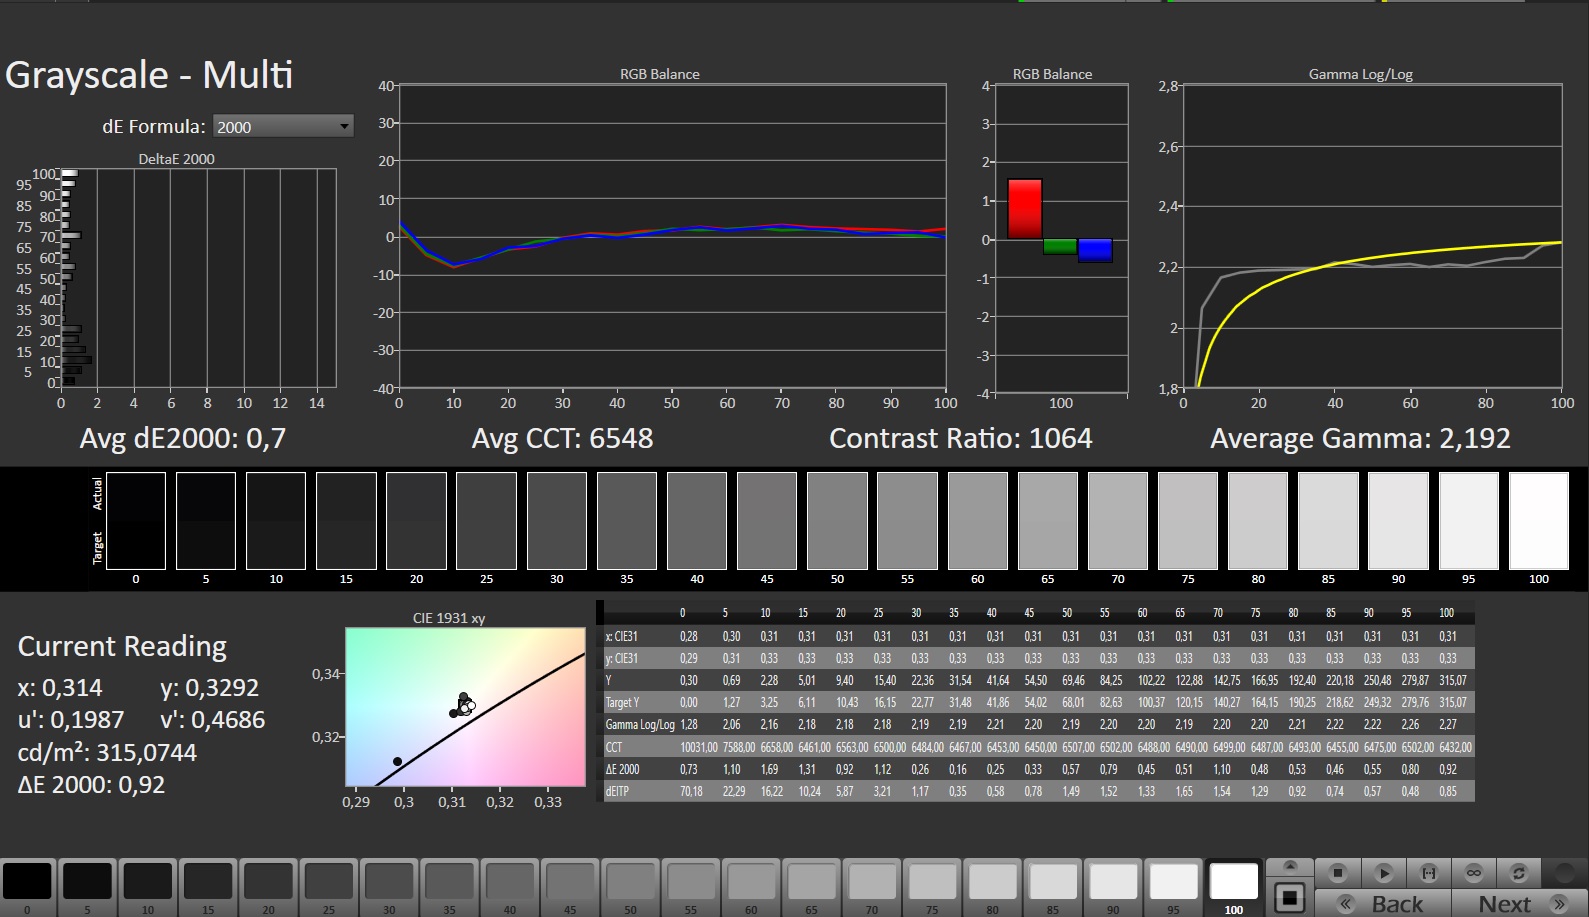
calibrated: 1.21
ΔE Greyscale Calman: 1.3 | ∀{0.09-98 Ø4.96}
70.5% AdobeRGB 1998 (Argyll 3D)
98.2% sRGB (Argyll 3D)
69.3% Display P3 (Argyll 3D)
Gamma: 2.307
CCT: 6456 K
| Aorus 15X ASF BOE CQ NE156QHM-NZ1, IPS, 2560x1440, 15.6" | Razer Blade 15 OLED (Early 2022) Samsung ATNA562P02-0, OLED, 2560x1440, 15.6" | MSI Katana 17 B13VFK B173HAN04.9, IPS LED, 1920x1080, 17.3" | Asus ROG Strix G17 G713PI BOE0B69, IPS, 2560x1440, 17.3" | Acer Predator Helios 300 (i7-12700H, RTX 3070 Ti) BOE0A1A, IPS, 2560x1440, 17.3" | |
|---|---|---|---|---|---|
| Display | 25% | -40% | 22% | 21% | |
| Display P3 Coverage (%) | 69.3 | 97.6 41% | 40.8 -41% | 98.3 42% | 96.8 40% |
| sRGB Coverage (%) | 98.2 | 99.4 1% | 61 -38% | 100 2% | 99.9 2% |
| AdobeRGB 1998 Coverage (%) | 70.5 | 94 33% | 42.2 -40% | 85.9 22% | 84.8 20% |
| Response Times | 82% | -172% | 33% | -26% | |
| Response Time Grey 50% / Grey 80% * (ms) | 12.4 ? | 2 ? 84% | 33 ? -166% | 5.3 ? 57% | 16.4 ? -32% |
| Response Time Black / White * (ms) | 9.4 ? | 2 ? 79% | 26 ? -177% | 8.6 ? 9% | 11.2 ? -19% |
| PWM Frequency (Hz) | 500 ? | ||||
| Screen | 109% | -135% | -4% | -60% | |
| Brightness middle (cd/m²) | 316 | 383 21% | 267 -16% | 327 3% | 366 16% |
| Brightness (cd/m²) | 301 | 384 28% | 256 -15% | 320 6% | 340 13% |
| Brightness Distribution (%) | 90 | 99 10% | 93 3% | 89 -1% | 85 -6% |
| Black Level * (cd/m²) | 0.28 | 0.03 89% | 0.21 25% | 0.38 -36% | 0.31 -11% |
| Contrast (:1) | 1129 | 12767 1031% | 1271 13% | 861 -24% | 1181 5% |
| Colorchecker dE 2000 * | 1.54 | 1.89 -23% | 4.7 -205% | 1.01 34% | 3.56 -131% |
| Colorchecker dE 2000 max. * | 2.46 | 3.76 -53% | 20.4 -729% | 4.01 -63% | 5.66 -130% |
| Colorchecker dE 2000 calibrated * | 1.21 | 2.67 -121% | 4.5 -272% | 0.41 66% | 3.31 -174% |
| Greyscale dE 2000 * | 1.3 | 1.26 3% | 1.5 -15% | 1.6 -23% | 2.84 -118% |
| Gamma | 2.307 95% | 2.41 91% | 2.12 104% | 2.168 101% | 2.29 96% |
| CCT | 6456 101% | 6386 102% | 6552 99% | 6659 98% | 6835 95% |
| Total Average (Program / Settings) | 72% /
87% | -116% /
-120% | 17% /
7% | -22% /
-38% |
* ... smaller is better
开箱后,该显示器已经显示出很好的色彩还原性:偏差为1.54,属于可接受范围(DeltaE<3)。校准使该数字降至1.21,并有助于更均匀地显示灰色调。
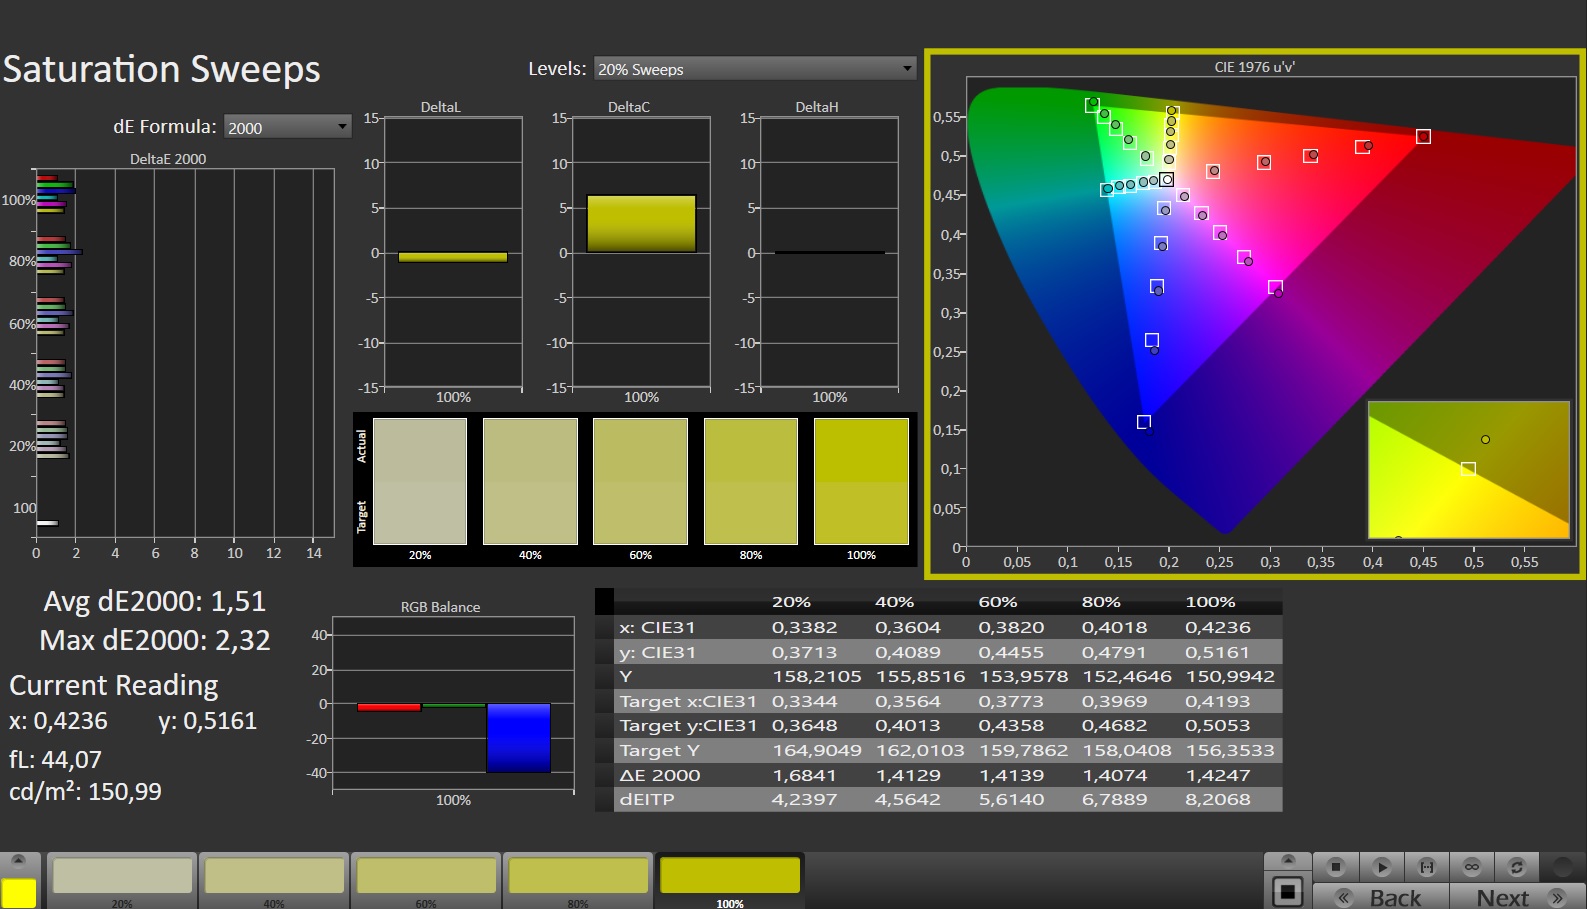
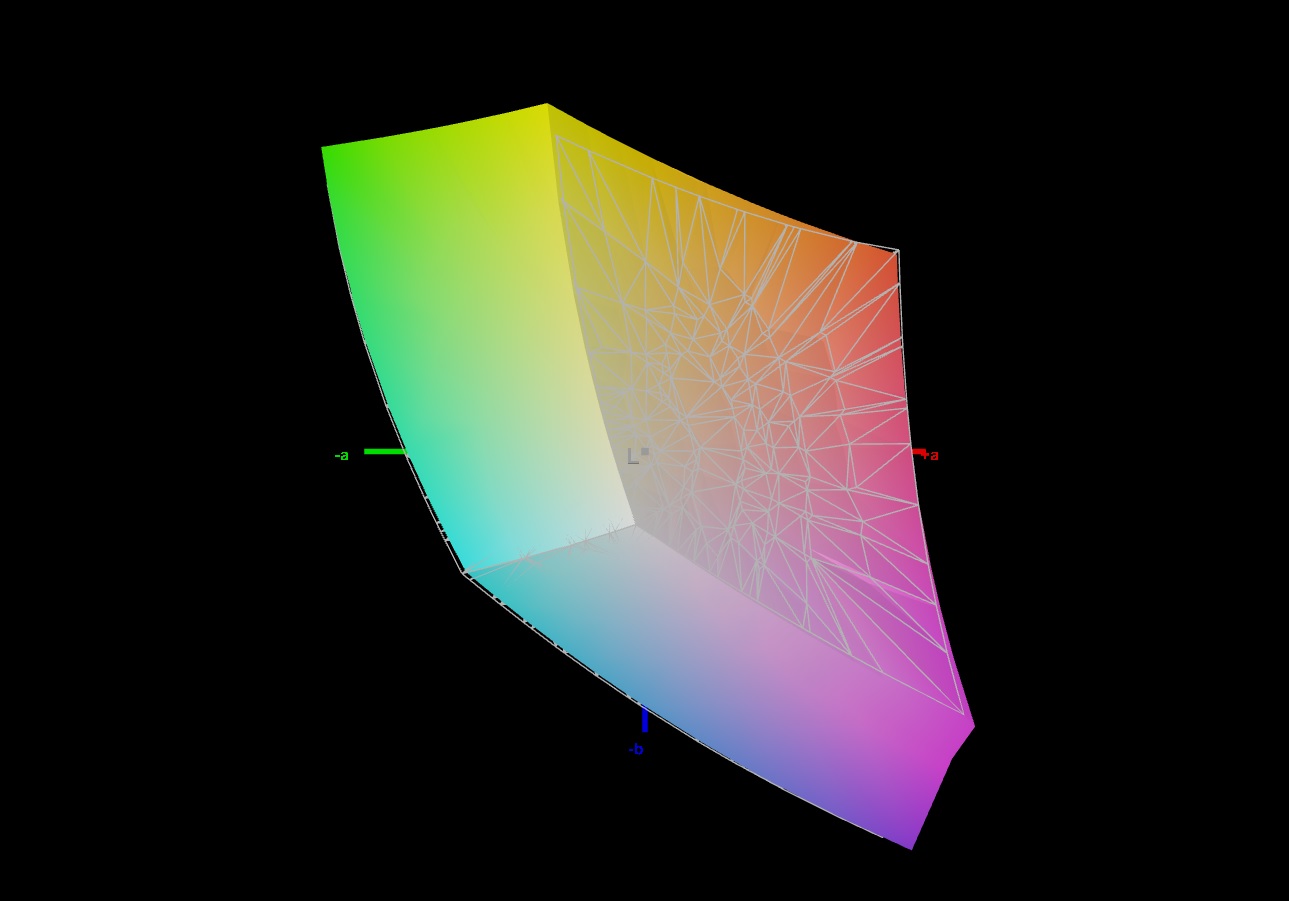
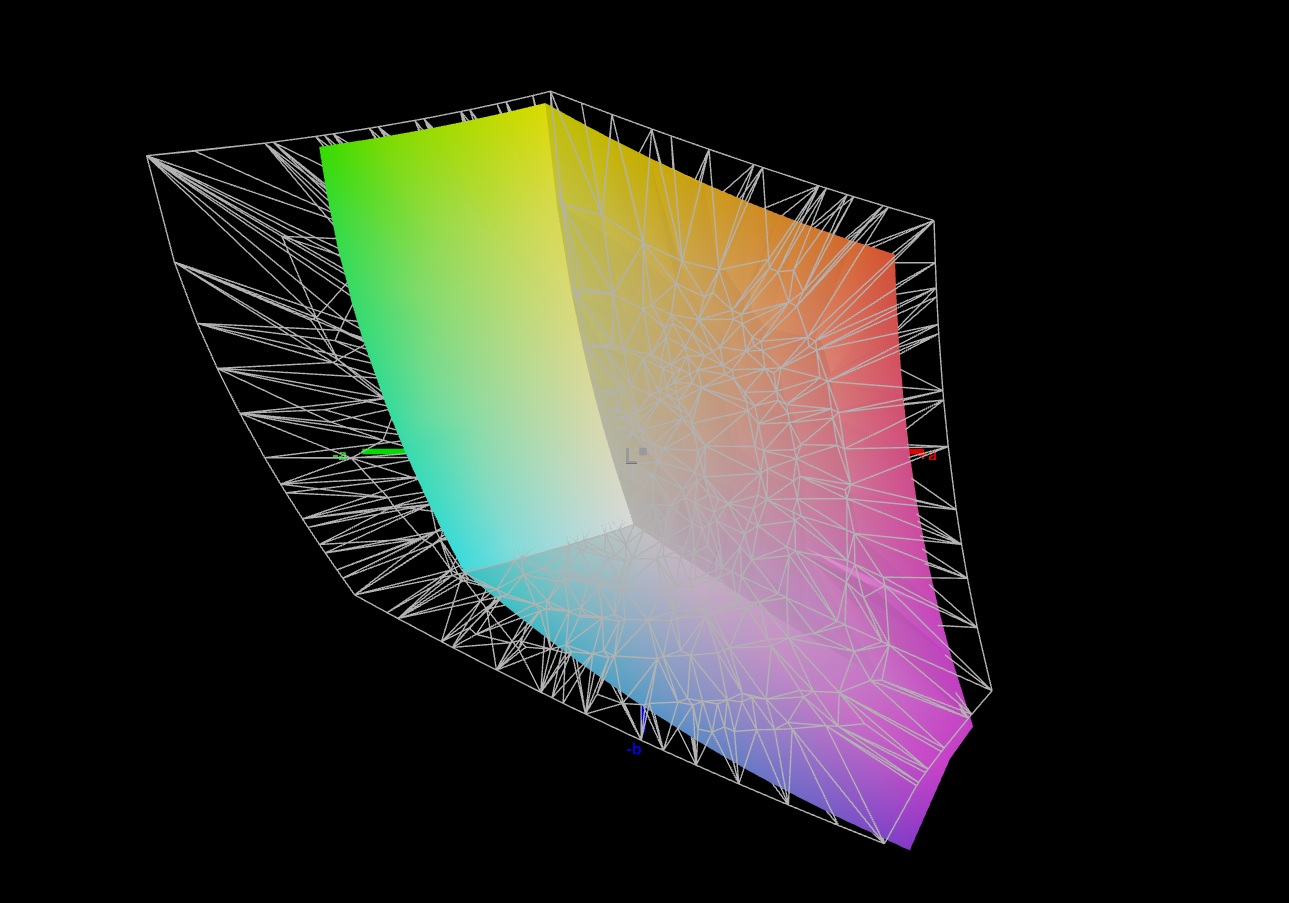
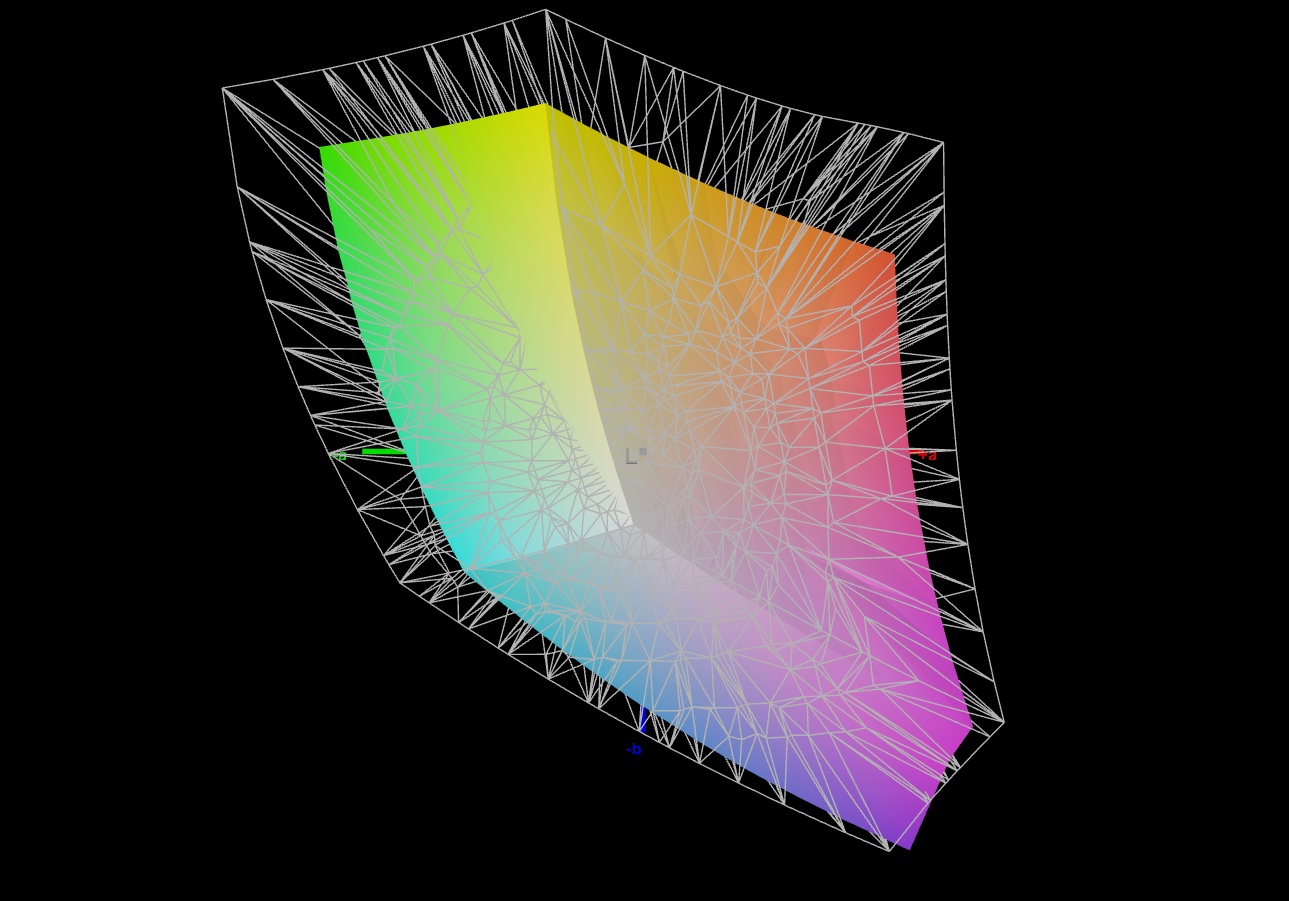
该显示器几乎可以描绘整个sRGB色彩空间--但不能描绘AdobeRGB和DCI-P3色彩空间。这意味着大多数竞争对手在这方面做得更好一些。

Display Response Times
| ↔ Response Time Black to White | ||
|---|---|---|
| 9.4 ms ... rise ↗ and fall ↘ combined | ↗ 4.9 ms rise | 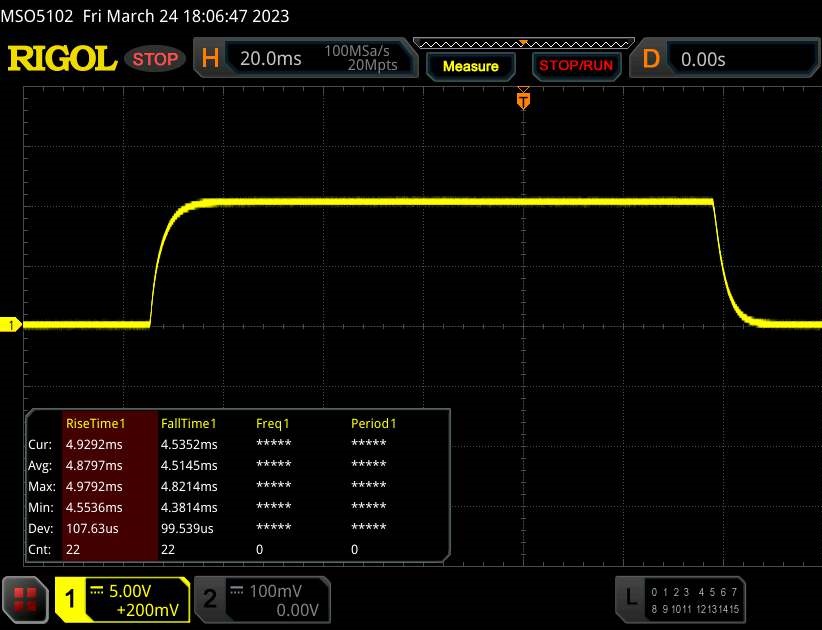 |
| ↘ 4.5 ms fall | ||
| The screen shows fast response rates in our tests and should be suited for gaming. In comparison, all tested devices range from 0.1 (minimum) to 240 (maximum) ms. » 26 % of all devices are better. This means that the measured response time is better than the average of all tested devices (19.8 ms). | ||
| ↔ Response Time 50% Grey to 80% Grey | ||
| 12.4 ms ... rise ↗ and fall ↘ combined | ↗ 6 ms rise | 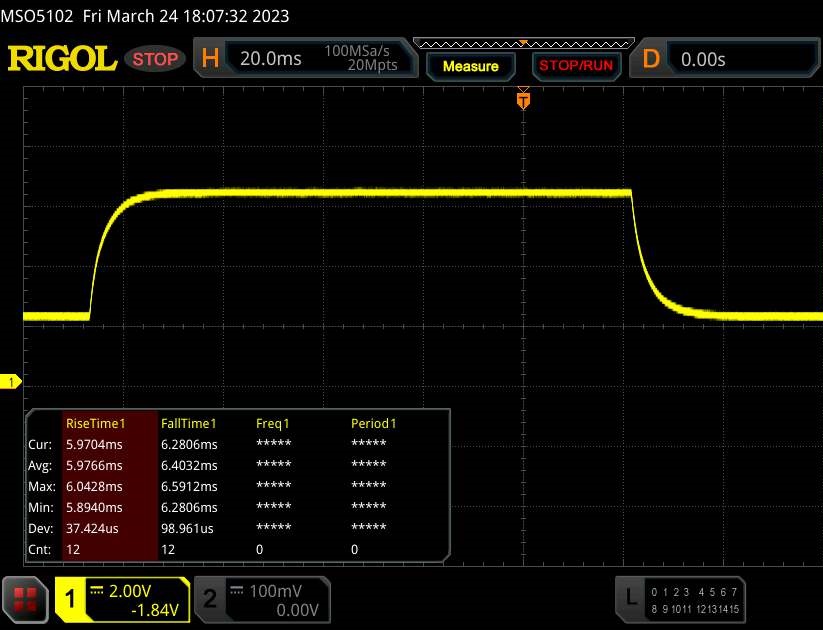 |
| ↘ 6.4 ms fall | ||
| The screen shows good response rates in our tests, but may be too slow for competitive gamers. In comparison, all tested devices range from 0.165 (minimum) to 636 (maximum) ms. » 26 % of all devices are better. This means that the measured response time is better than the average of all tested devices (31 ms). | ||
Screen Flickering / PWM (Pulse-Width Modulation)
| Screen flickering / PWM not detected | 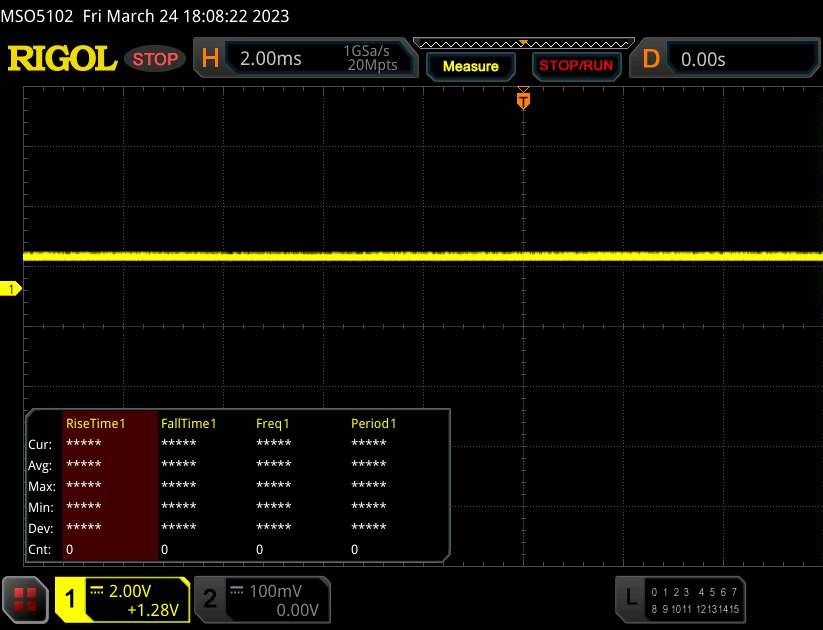 | ||
In comparison: 52 % of all tested devices do not use PWM to dim the display. If PWM was detected, an average of 7754 (minimum: 5 - maximum: 343500) Hz was measured. | |||
视角稳定的IPS面板可以从各个位置观看。在外面,只要阳光不是太亮,显示屏基本都能看到。

业绩
Aorus 15X被归类为强大的游戏笔记本电脑--但它不仅仅局限于这个领域。它的良好性能是由Raptor Lake和Ada Lovelace实现的。所介绍的测试设备可以以大约2,099美元的价格购买。
测试条件
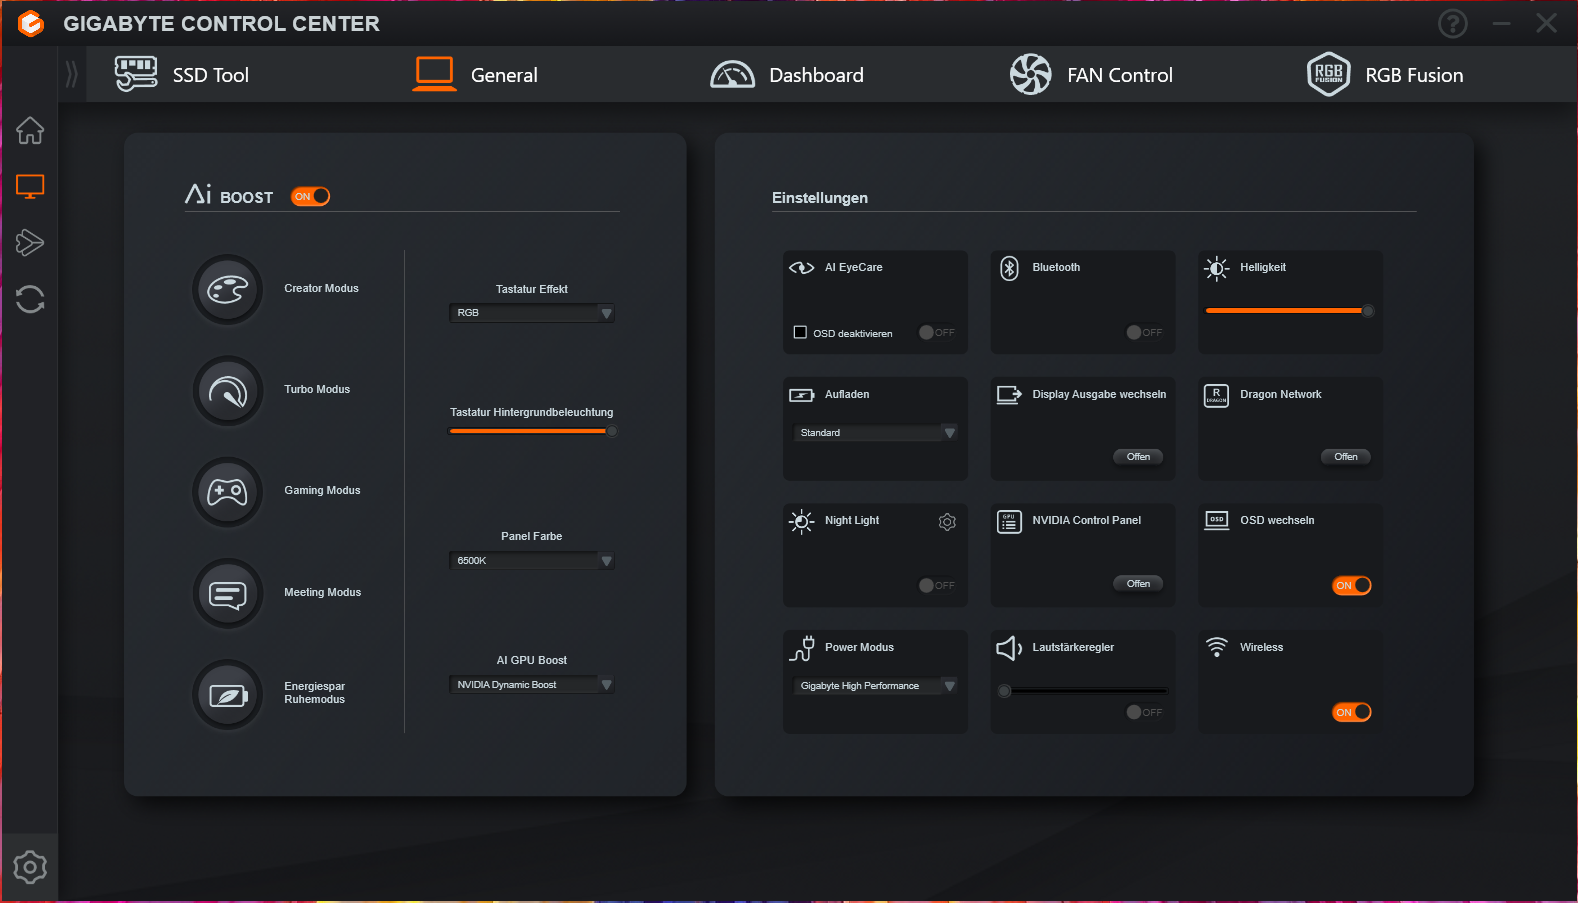
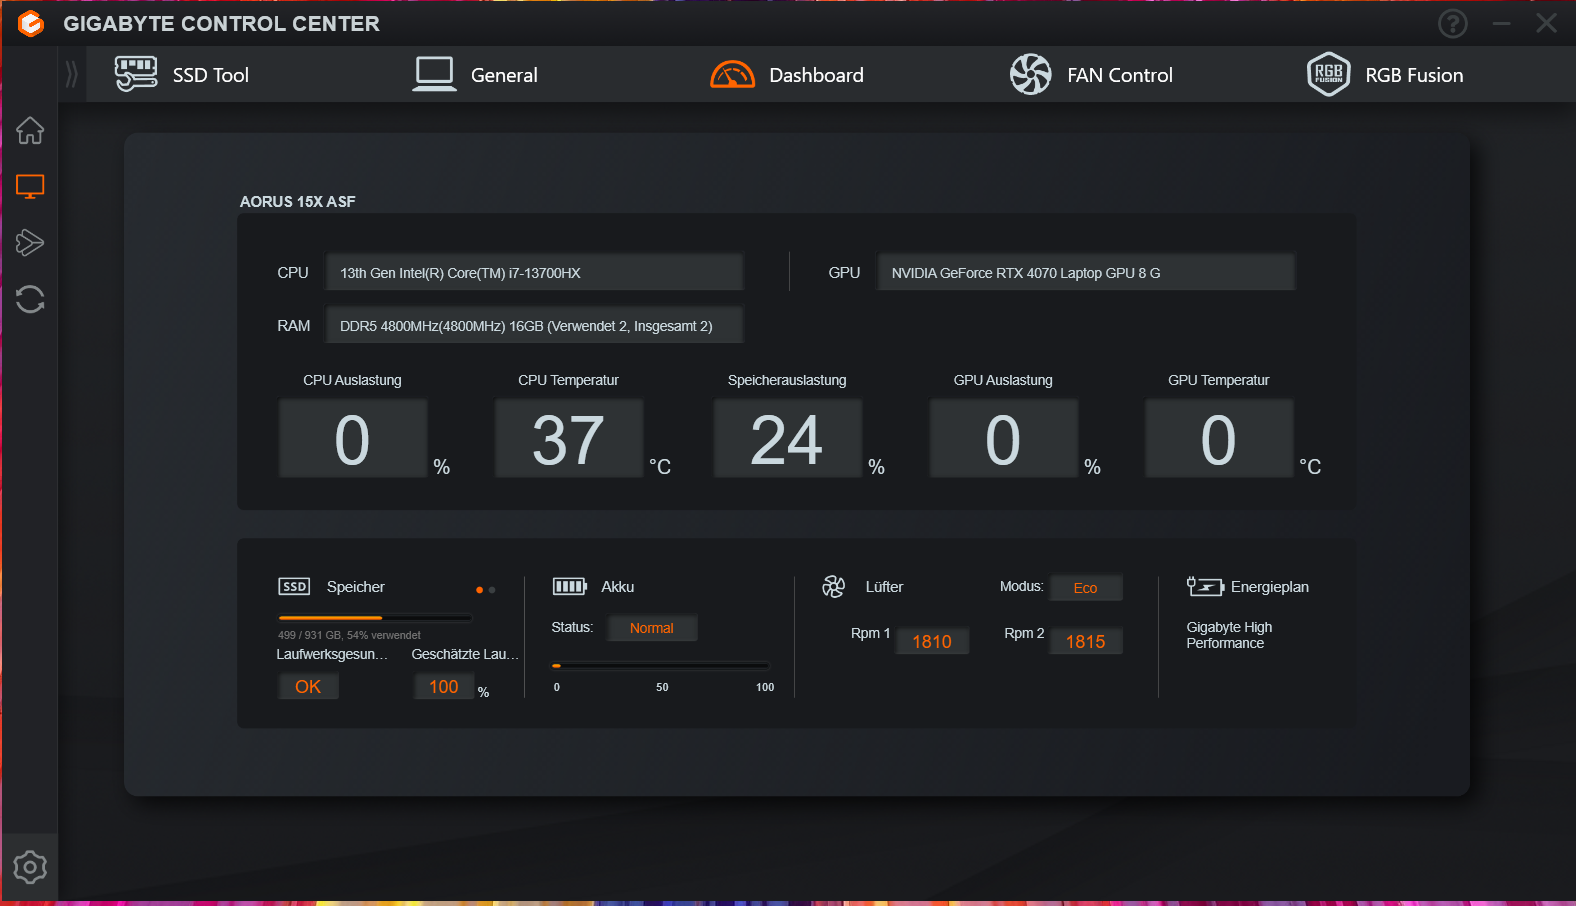
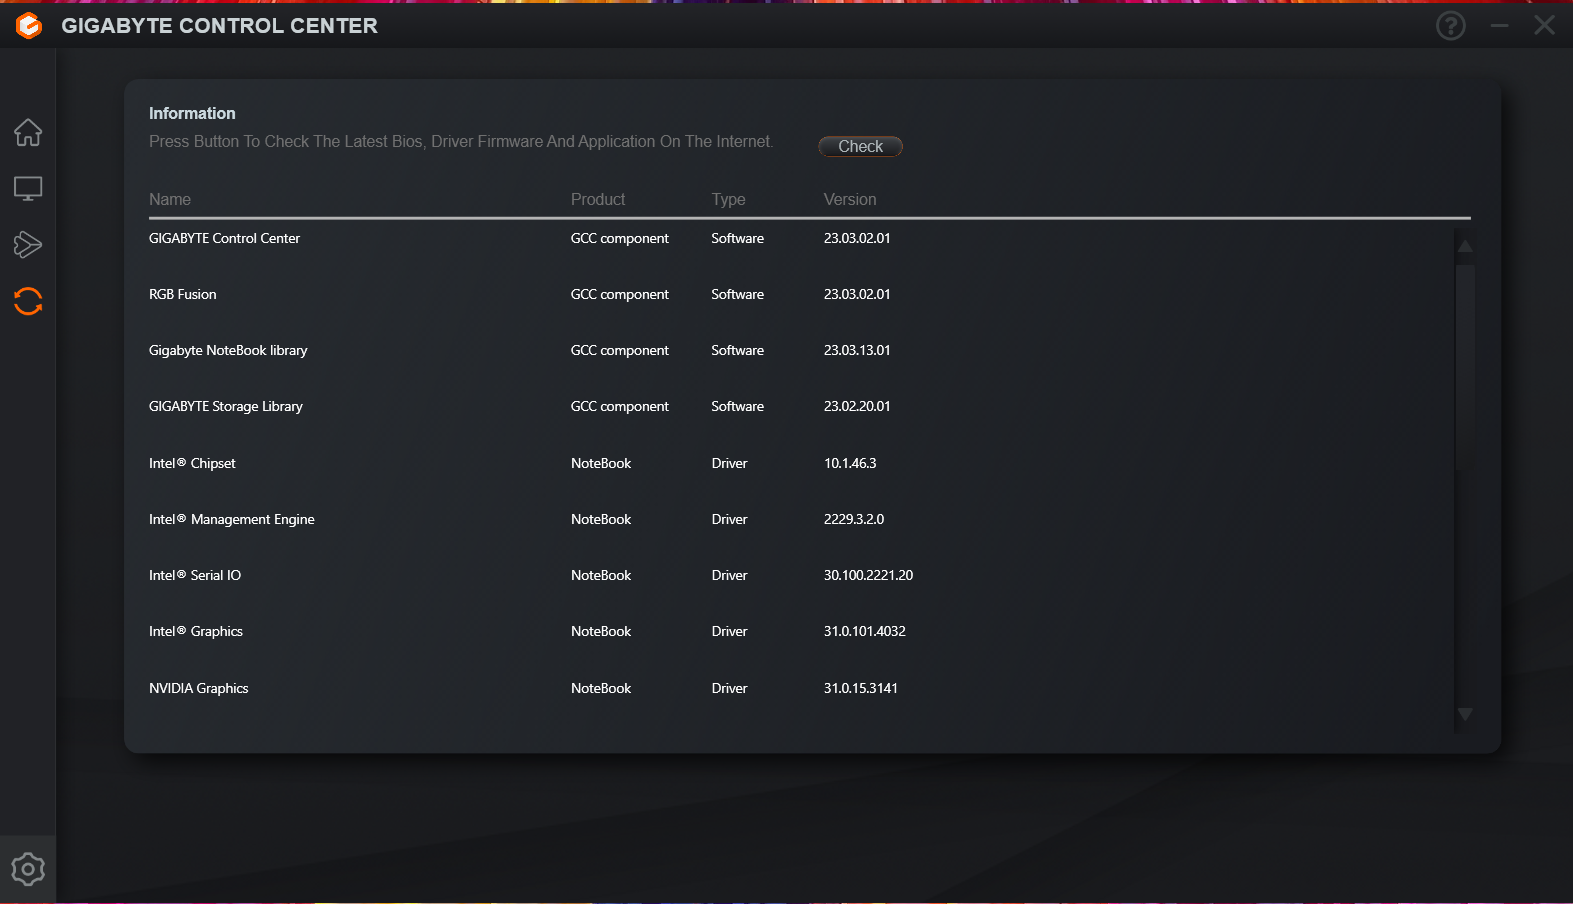
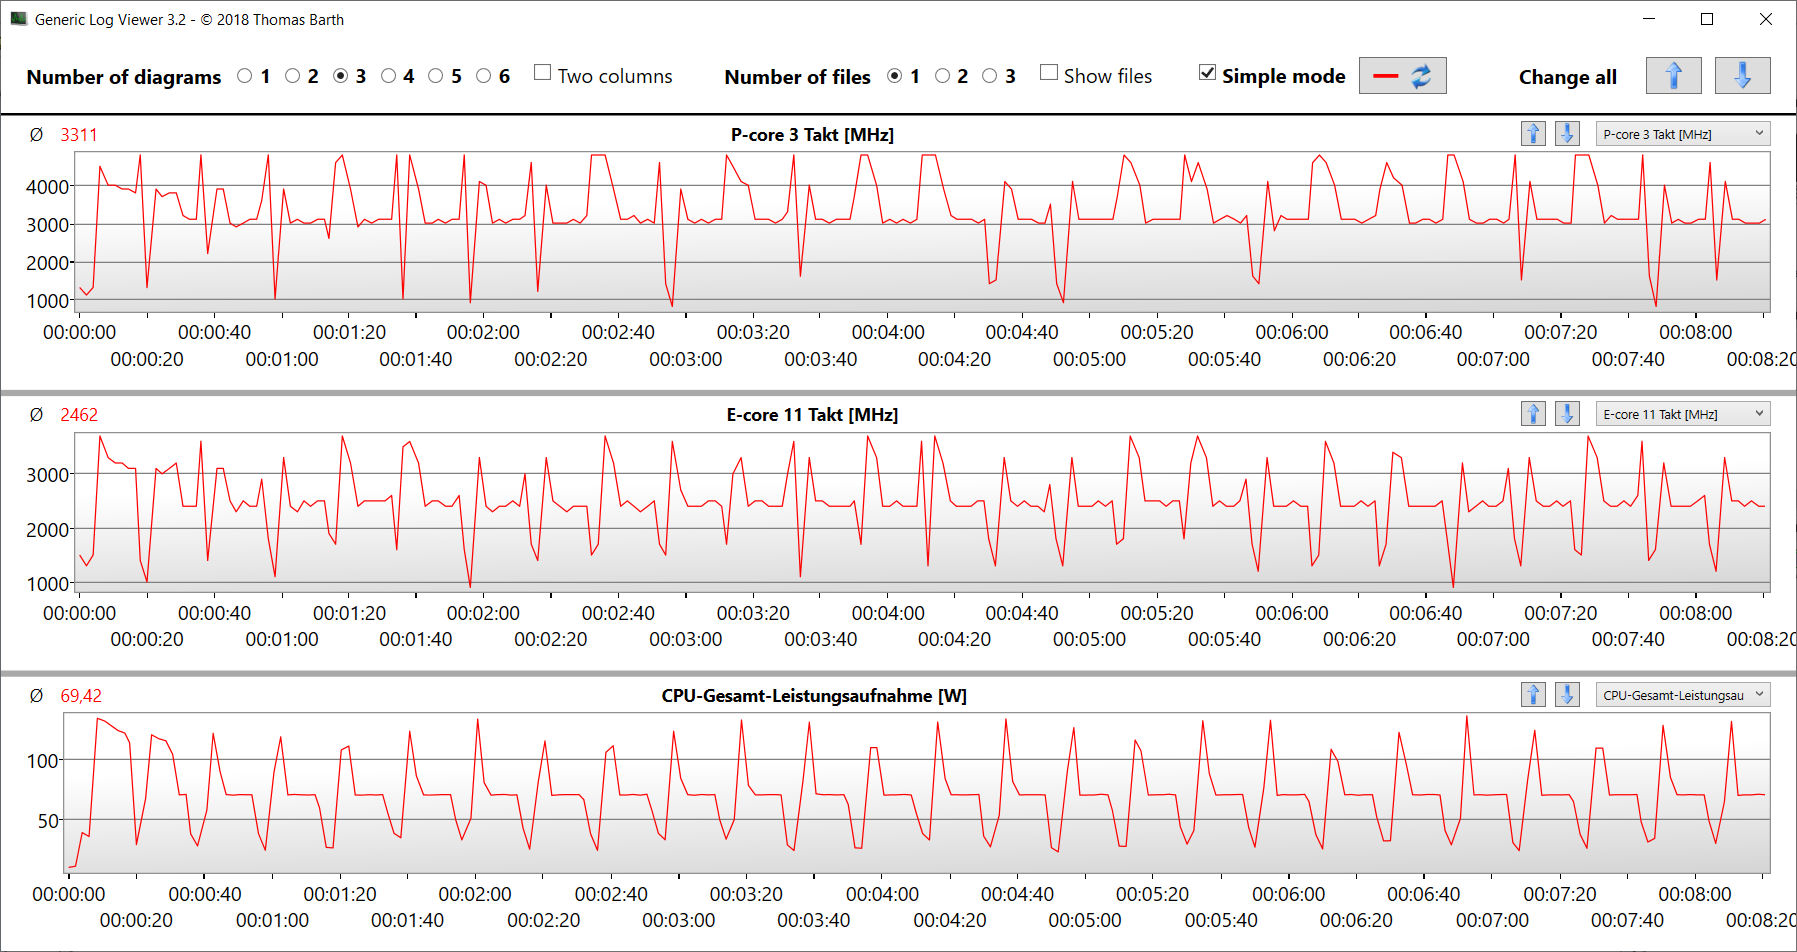
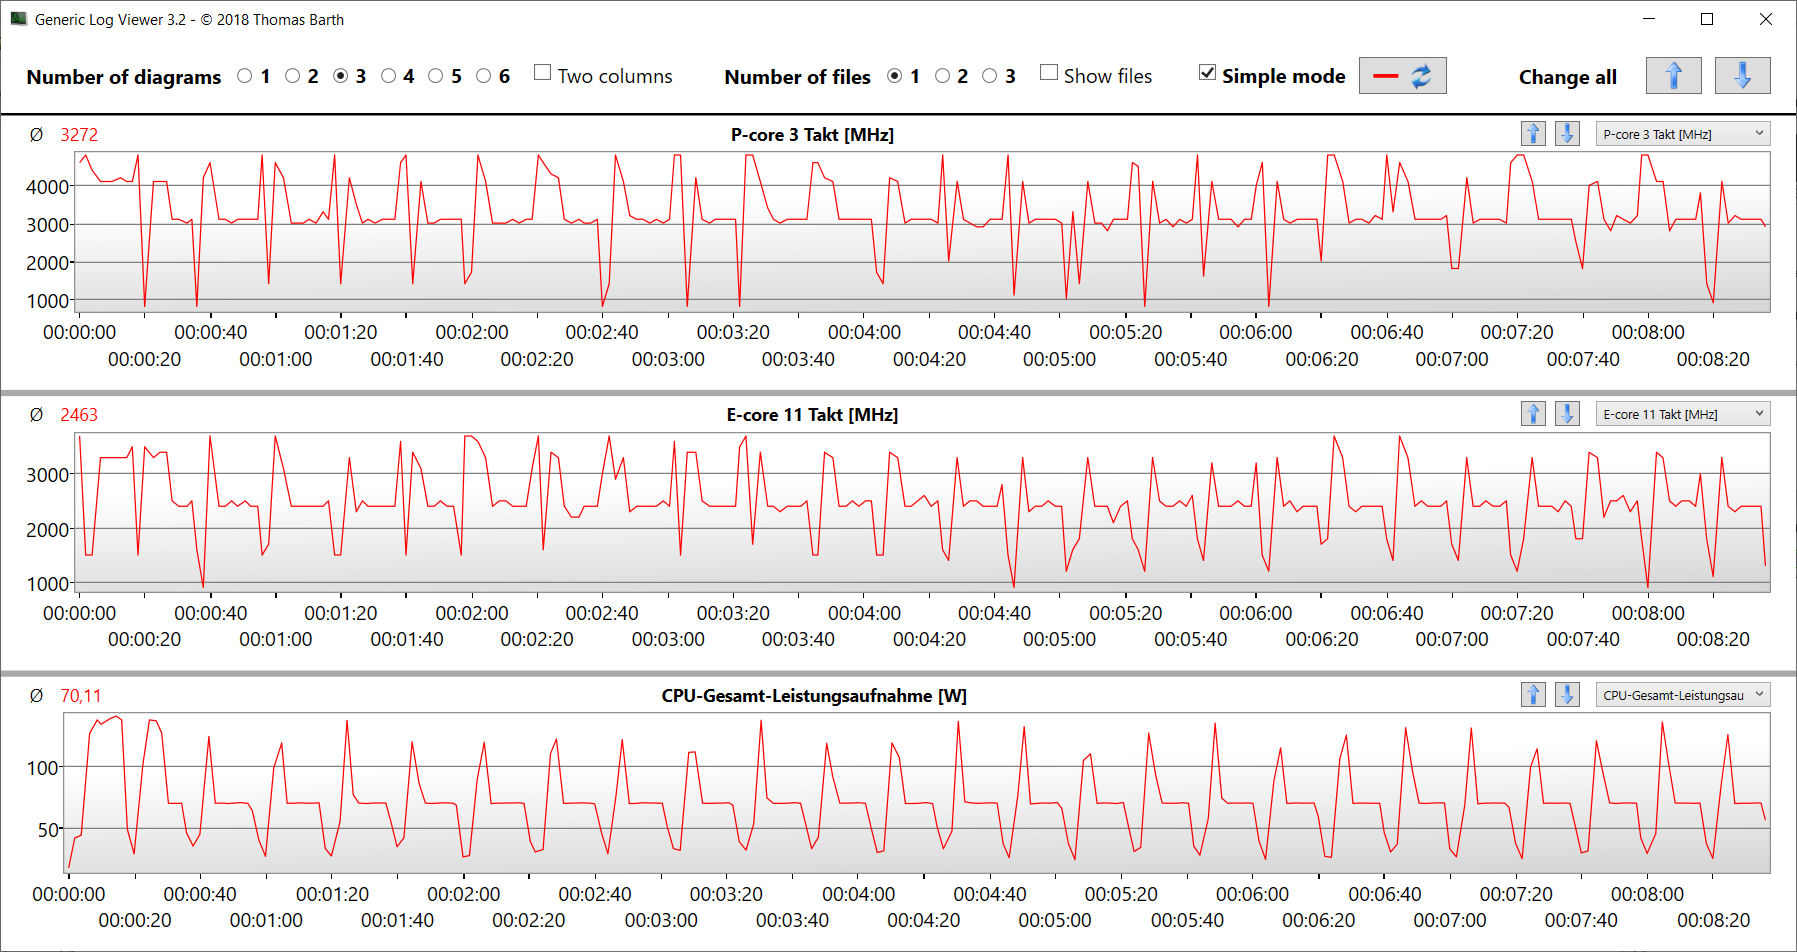
电脑的控制中心(技嘉控制中心)有所有常用的性能模式(见表)和一个卓越的AI提升功能,我们使用了这个功能。这意味着控制中心选择了最适合的配置文件--"游戏模式 "和 "创造者模式 "用于基准测试,"节能闲置模式 "用于电池测试。
"涡轮模式 "在某些情况下可以提供略微改善的性能--但这是有代价的:风扇不断地以全功率工作。使用 "会议模式",你可以达到最安静的工作水平--接近于完全无声。在这里,对日常使用更重要的单线程性能比多线程性能缩减的程度要小。在降低设置的情况下,甚至游戏也是可能的。
| 创造者模式 | 涡轮模式 | 游戏模式 | 会议模式 | 节能空闲模式 | |
|---|---|---|---|---|---|
| 功率限制1 | 70瓦 | 70瓦 | 55瓦 | 15瓦 | 15瓦 |
| 功率限制2 | 157瓦 | 157瓦 | 157瓦 | 30瓦 | 30瓦 |
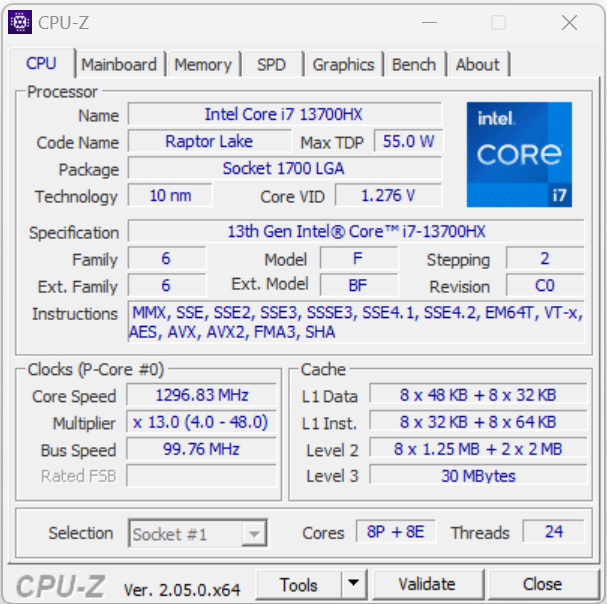
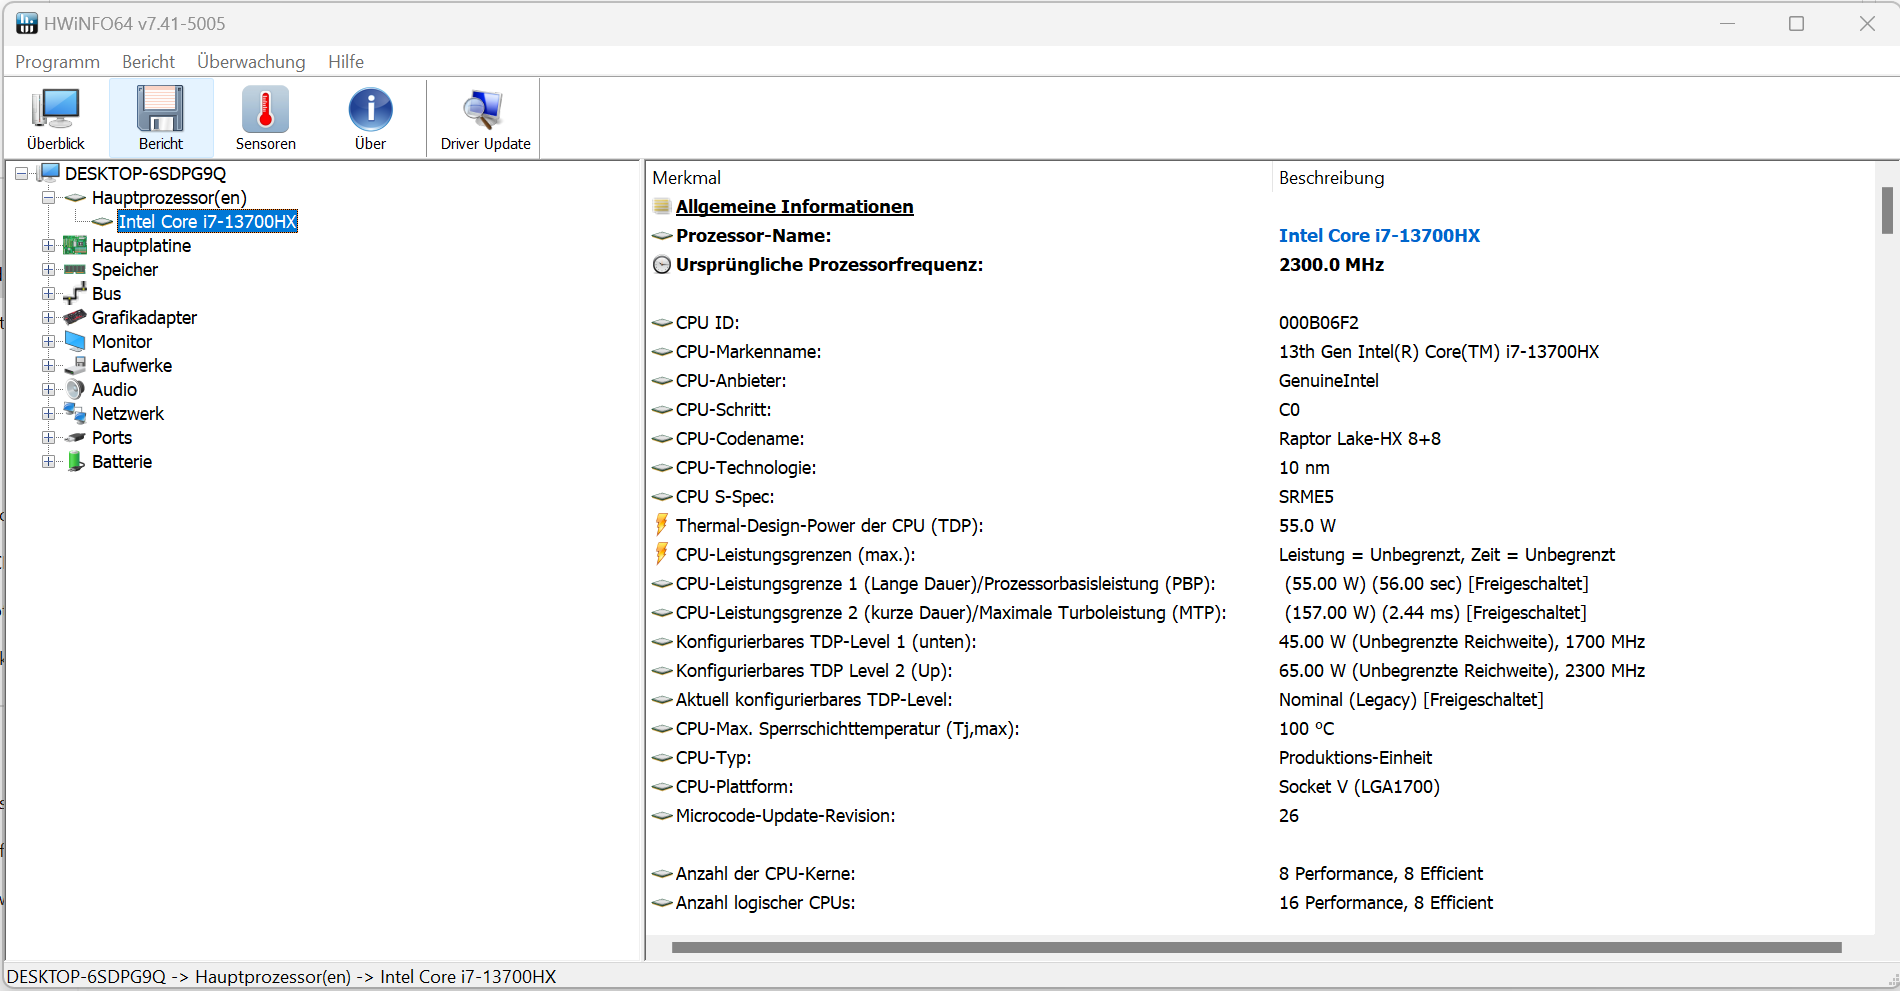
处理器
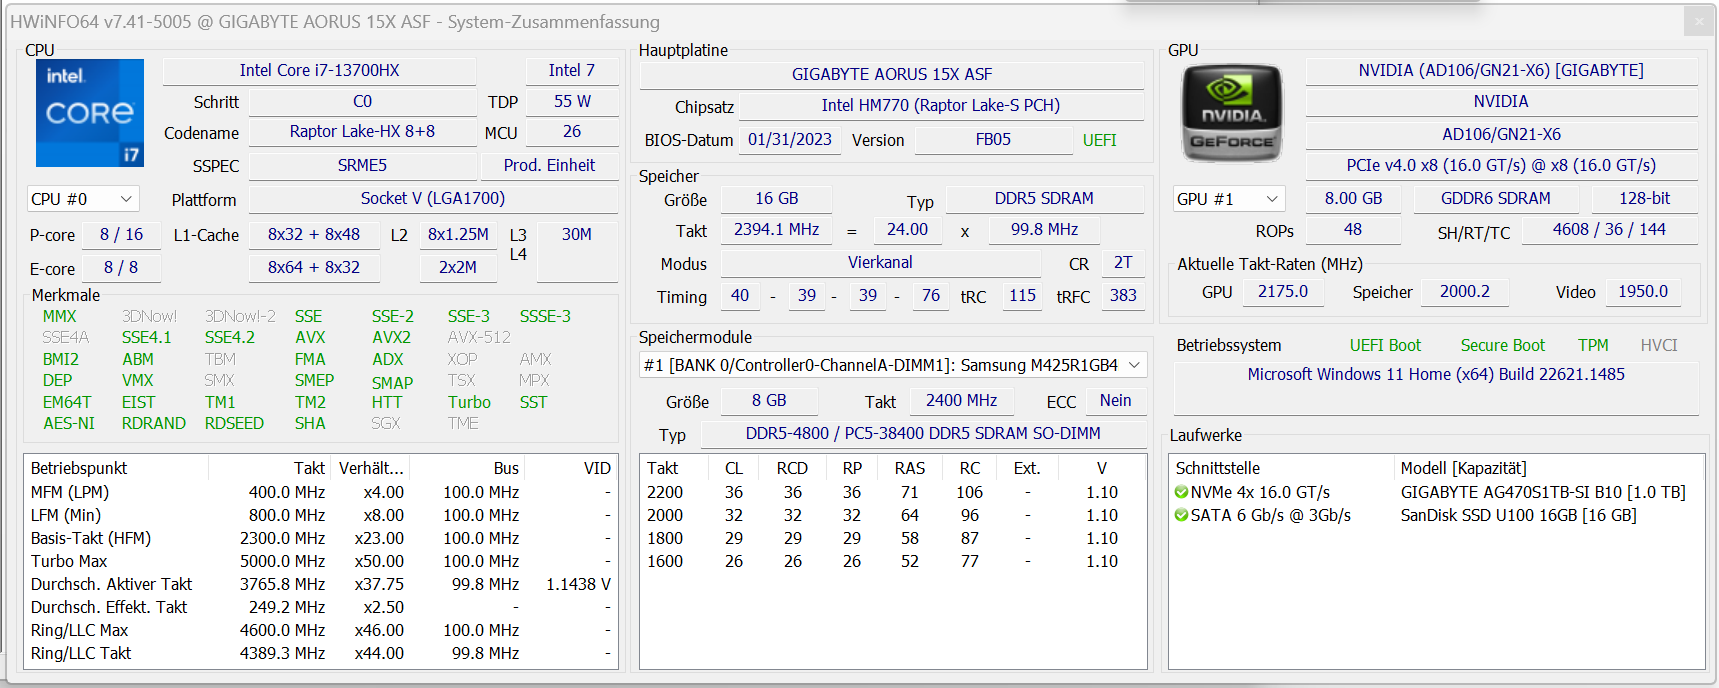
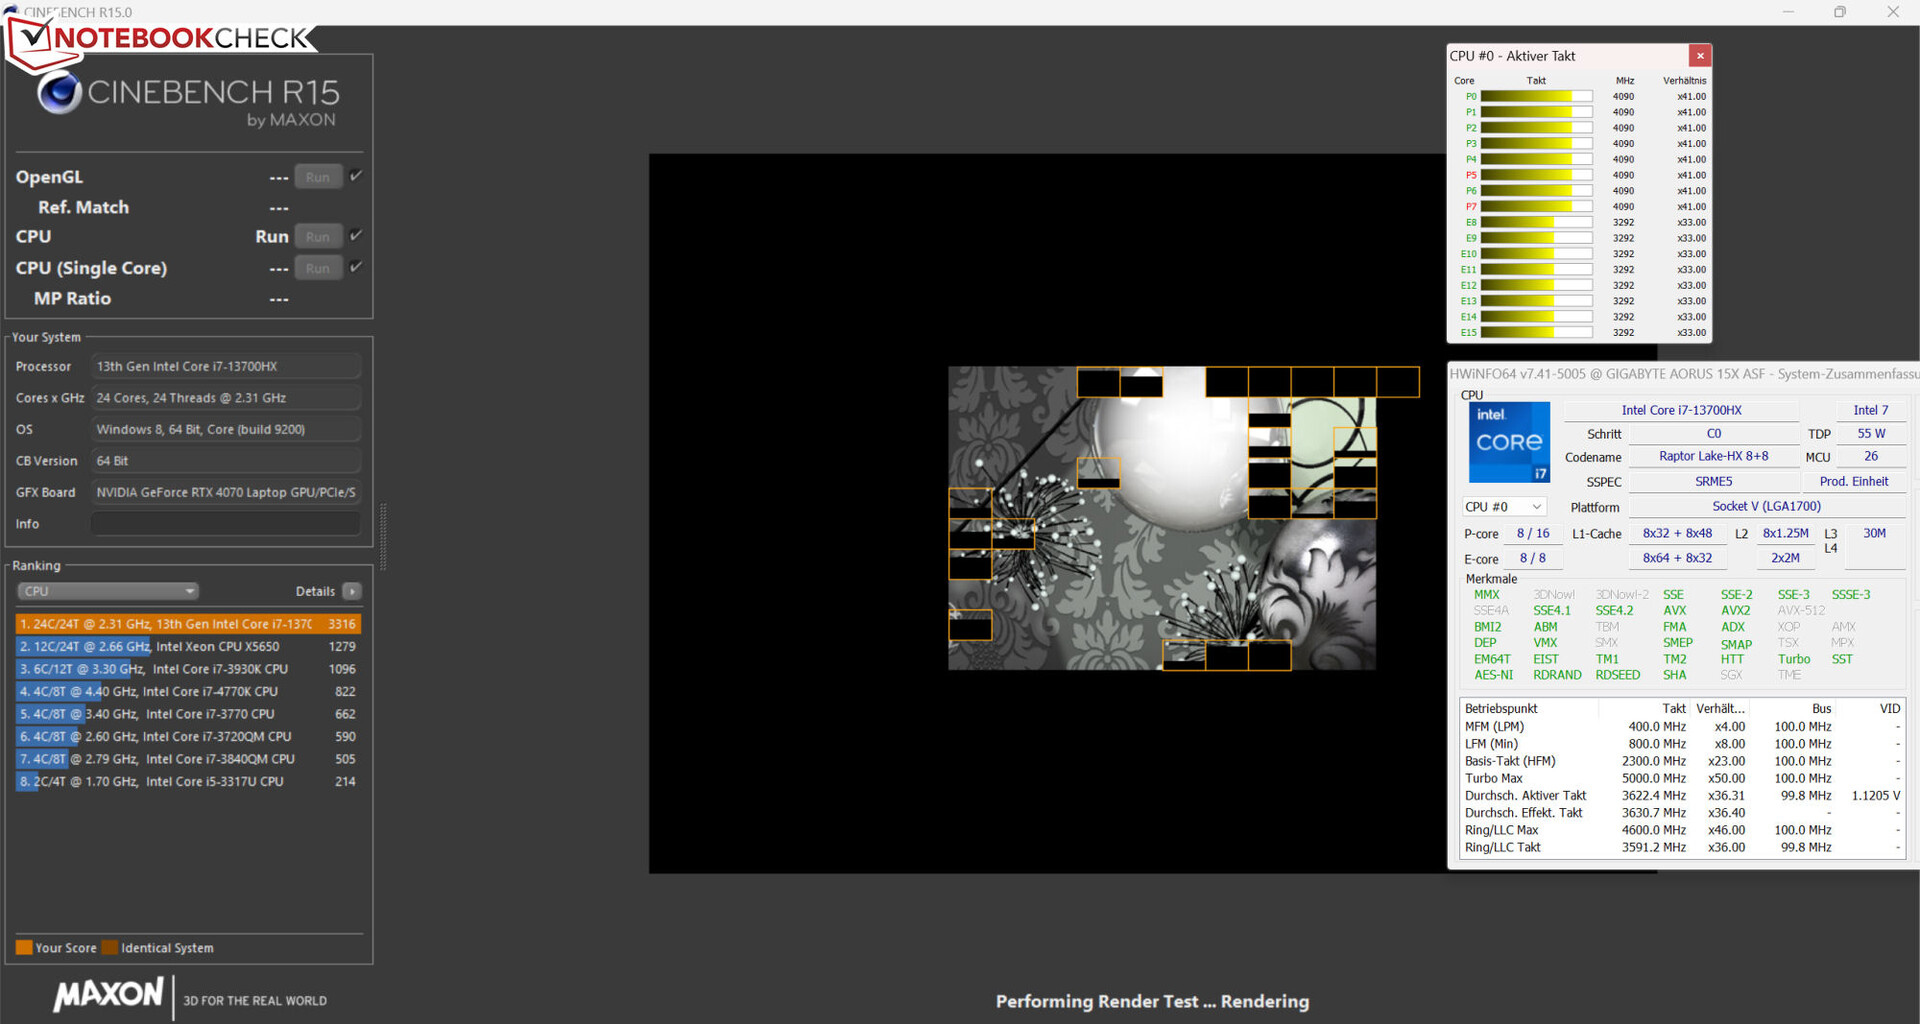
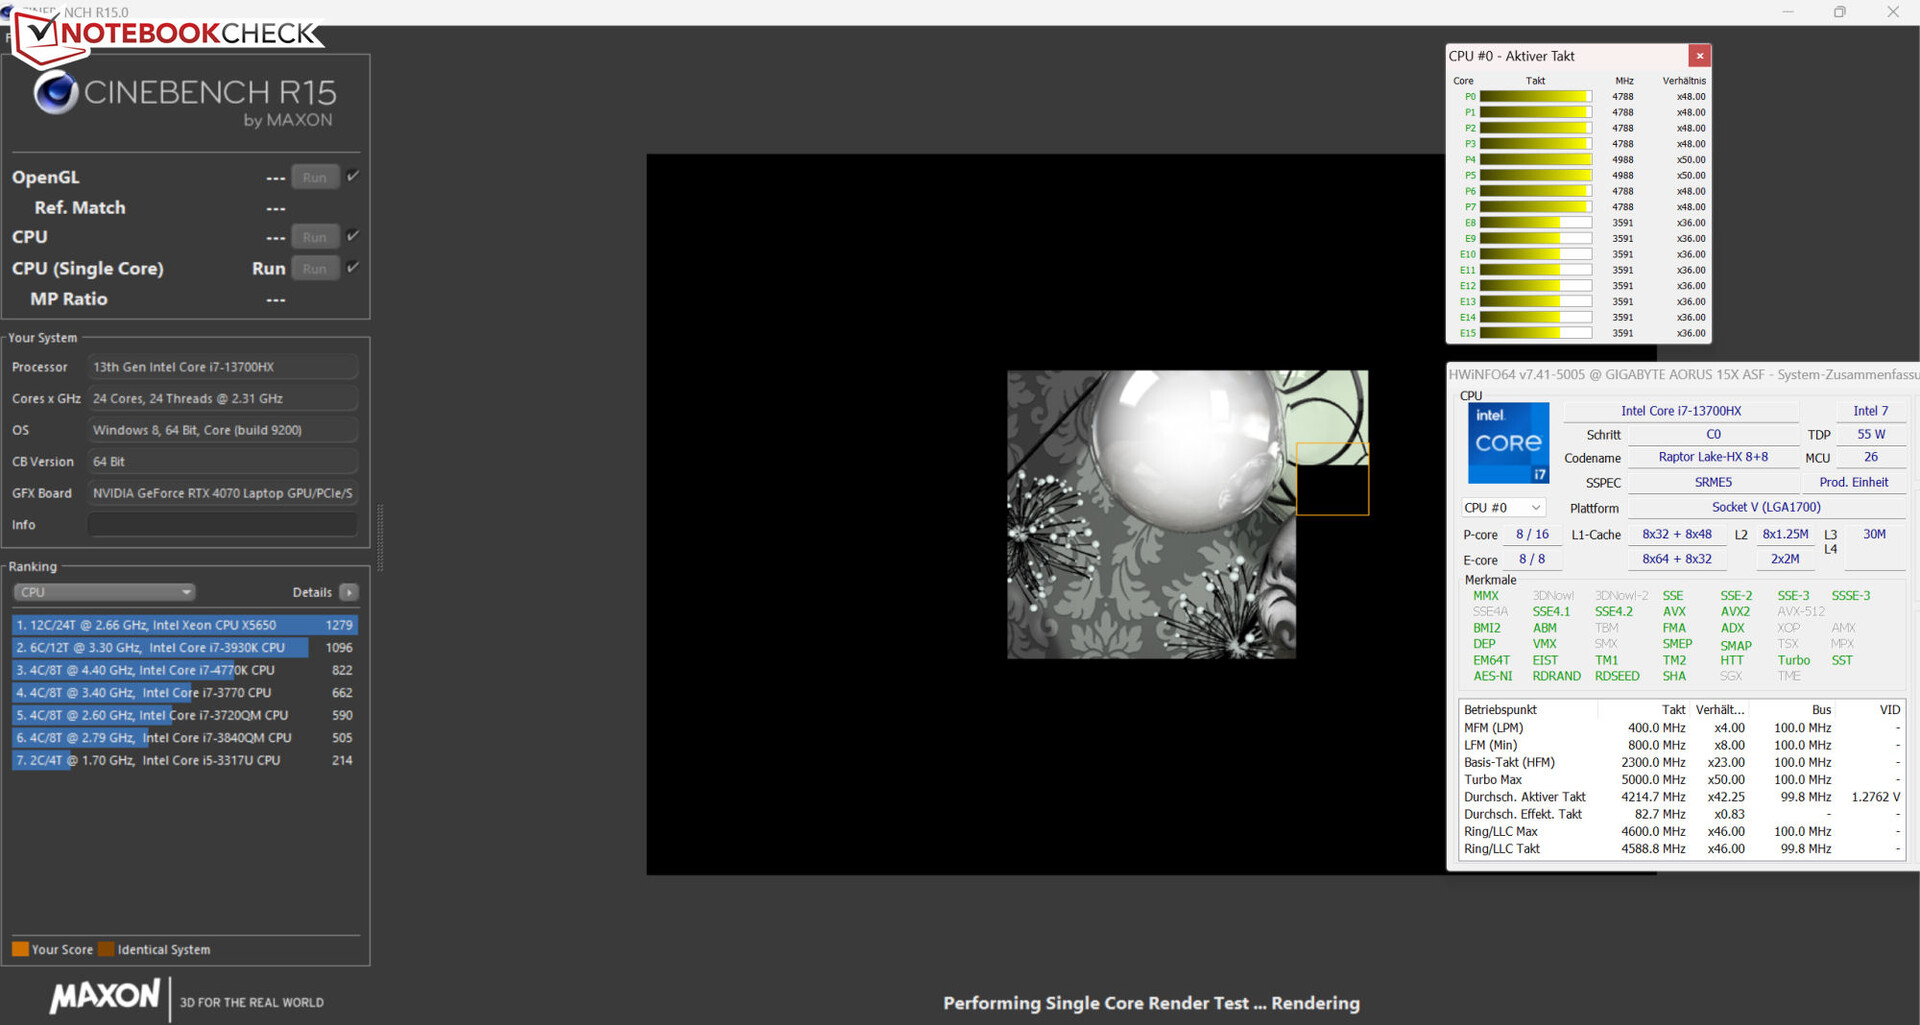
其酷睿-i7-13700HX(Raptor Lake)处理器由8个效率核心(无超线程,1.5至3.7GHz)和8个性能核心(超线程,2.1至5GHz)组成。总的来说,这加起来有24个后勤CPU核心。这些基准测试提供的结果与CPU确定的平均水平相当。
Cinebench R15基准的CPU测试是在连接到主电源时以高(多线程)或高到最大(单线程)的时钟速率运行。使用电池时,这些速率下降了--在单线程负载下明显比多线程负载更多。
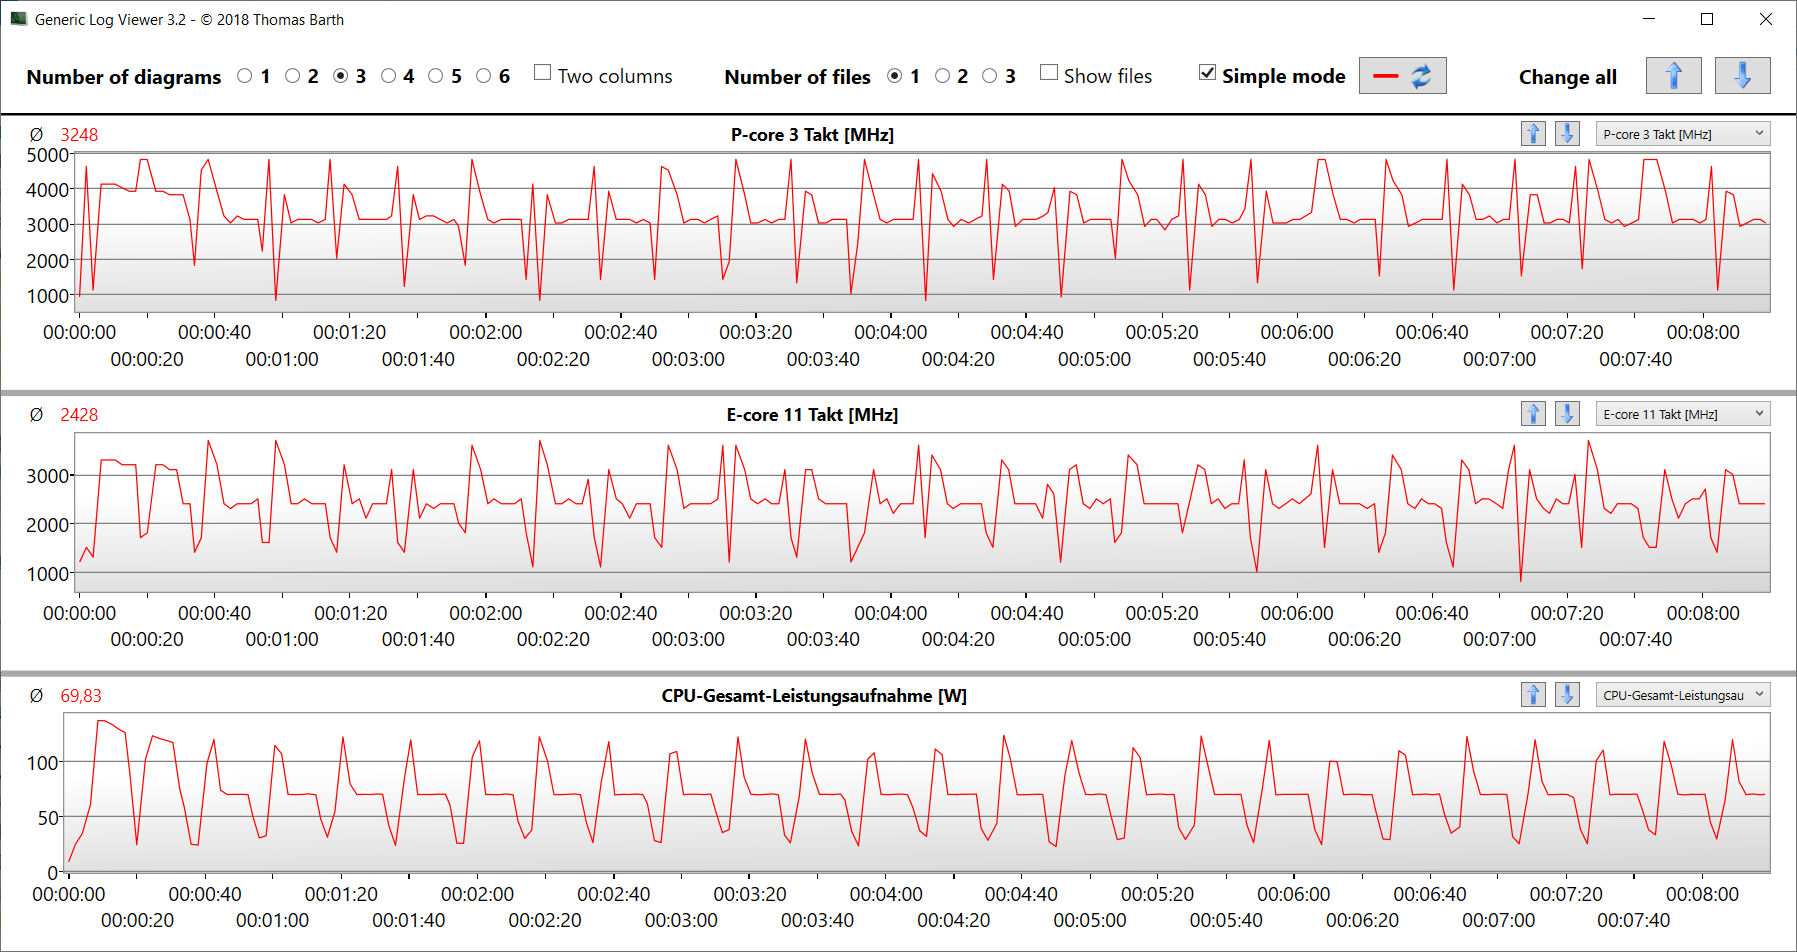
CB15的循环测试显示:CPU涡轮增压被利用,连续的多线程负载导致时钟速率从第一次到第三次运行时略有下降。
Cinebench R15 Multi Loop test
* ... smaller is better
AIDA64: FP32 Ray-Trace | FPU Julia | CPU SHA3 | CPU Queen | FPU SinJulia | FPU Mandel | CPU AES | CPU ZLib | FP64 Ray-Trace | CPU PhotoWorxx
| Performance rating | |
| Asus ROG Strix G17 G713PI | |
| Average of class Gaming | |
| Average Intel Core i7-13700HX | |
| Aorus 15X ASF | |
| Acer Predator Helios 300 (i7-12700H, RTX 3070 Ti) | |
| Razer Blade 15 OLED (Early 2022) | |
| MSI Katana 17 B13VFK | |
| AIDA64 / FP32 Ray-Trace | |
| Asus ROG Strix G17 G713PI | |
| Average of class Gaming (10227 - 85542, n=105, last 2 years) | |
| Average Intel Core i7-13700HX (14261 - 21999, n=11) | |
| Acer Predator Helios 300 (i7-12700H, RTX 3070 Ti) | |
| Aorus 15X ASF | |
| MSI Katana 17 B13VFK | |
| Razer Blade 15 OLED (Early 2022) | |
| AIDA64 / FPU Julia | |
| Asus ROG Strix G17 G713PI | |
| Average of class Gaming (51376 - 238426, n=105, last 2 years) | |
| Average Intel Core i7-13700HX (74636 - 109364, n=11) | |
| Acer Predator Helios 300 (i7-12700H, RTX 3070 Ti) | |
| Aorus 15X ASF | |
| Razer Blade 15 OLED (Early 2022) | |
| MSI Katana 17 B13VFK | |
| AIDA64 / CPU SHA3 | |
| Asus ROG Strix G17 G713PI | |
| Average of class Gaming (2180 - 10115, n=105, last 2 years) | |
| Average Intel Core i7-13700HX (3359 - 5053, n=11) | |
| Acer Predator Helios 300 (i7-12700H, RTX 3070 Ti) | |
| Aorus 15X ASF | |
| Razer Blade 15 OLED (Early 2022) | |
| MSI Katana 17 B13VFK | |
| AIDA64 / CPU Queen | |
| Asus ROG Strix G17 G713PI | |
| Average of class Gaming (49785 - 173351, n=90, last 2 years) | |
| Aorus 15X ASF | |
| Average Intel Core i7-13700HX (86532 - 114717, n=11) | |
| Razer Blade 15 OLED (Early 2022) | |
| Acer Predator Helios 300 (i7-12700H, RTX 3070 Ti) | |
| MSI Katana 17 B13VFK | |
| AIDA64 / FPU SinJulia | |
| Asus ROG Strix G17 G713PI | |
| Average of class Gaming (4424 - 33636, n=105, last 2 years) | |
| Average Intel Core i7-13700HX (9290 - 13519, n=11) | |
| Aorus 15X ASF | |
| Acer Predator Helios 300 (i7-12700H, RTX 3070 Ti) | |
| Razer Blade 15 OLED (Early 2022) | |
| MSI Katana 17 B13VFK | |
| AIDA64 / FPU Mandel | |
| Asus ROG Strix G17 G713PI | |
| Average of class Gaming (25115 - 128721, n=105, last 2 years) | |
| Average Intel Core i7-13700HX (35751 - 53484, n=11) | |
| Acer Predator Helios 300 (i7-12700H, RTX 3070 Ti) | |
| Aorus 15X ASF | |
| Razer Blade 15 OLED (Early 2022) | |
| MSI Katana 17 B13VFK | |
| AIDA64 / CPU AES | |
| Asus ROG Strix G17 G713PI | |
| Aorus 15X ASF | |
| Average Intel Core i7-13700HX (67846 - 182575, n=11) | |
| Average of class Gaming (39258 - 247074, n=105, last 2 years) | |
| Razer Blade 15 OLED (Early 2022) | |
| Acer Predator Helios 300 (i7-12700H, RTX 3070 Ti) | |
| MSI Katana 17 B13VFK | |
| AIDA64 / CPU ZLib | |
| Asus ROG Strix G17 G713PI | |
| Average of class Gaming (574 - 2531, n=105, last 2 years) | |
| Average Intel Core i7-13700HX (981 - 1451, n=11) | |
| Acer Predator Helios 300 (i7-12700H, RTX 3070 Ti) | |
| Aorus 15X ASF | |
| Razer Blade 15 OLED (Early 2022) | |
| MSI Katana 17 B13VFK | |
| AIDA64 / FP64 Ray-Trace | |
| Asus ROG Strix G17 G713PI | |
| Average of class Gaming (5509 - 45446, n=105, last 2 years) | |
| Average Intel Core i7-13700HX (7728 - 11837, n=11) | |
| Acer Predator Helios 300 (i7-12700H, RTX 3070 Ti) | |
| Aorus 15X ASF | |
| MSI Katana 17 B13VFK | |
| Razer Blade 15 OLED (Early 2022) | |
| AIDA64 / CPU PhotoWorxx | |
| Average of class Gaming (12271 - 89891, n=105, last 2 years) | |
| Acer Predator Helios 300 (i7-12700H, RTX 3070 Ti) | |
| Aorus 15X ASF | |
| Average Intel Core i7-13700HX (19678 - 42415, n=11) | |
| Razer Blade 15 OLED (Early 2022) | |
| Razer Blade 15 OLED (Early 2022) | |
| MSI Katana 17 B13VFK | |
| Asus ROG Strix G17 G713PI | |
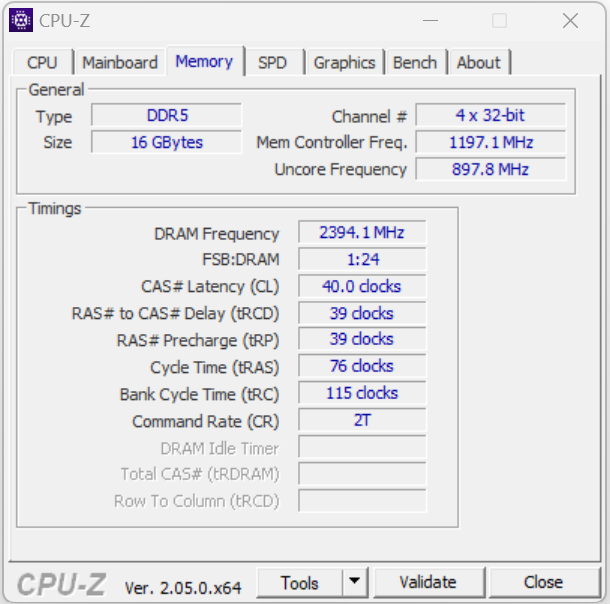
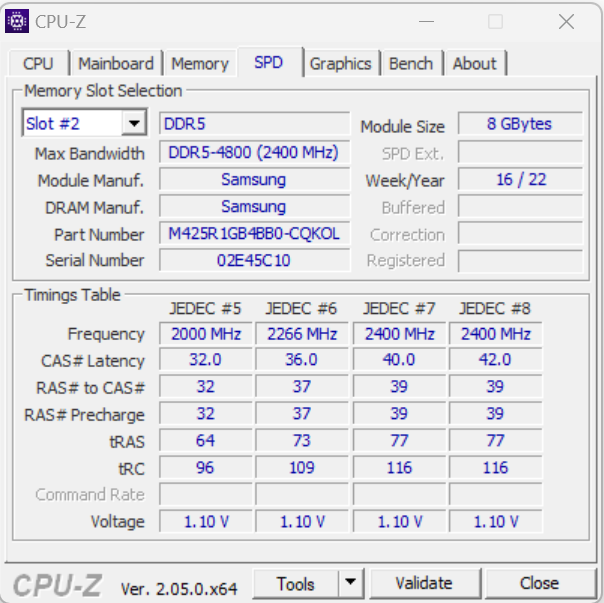
系统性能
规格表已经显示出:15X的用户不必担心性能不足的问题。平稳运行的系统为苛刻的任务做好了准备,如渲染或游戏--良好的PCMark结果证实了这一点。内存传输率没有显示出任何异常,对于DDR5-4800内存来说是正常水平。
CrossMark: Overall | Productivity | Creativity | Responsiveness
| PCMark 10 / Score | |
| Average of class Gaming (5828 - 12414, n=93, last 2 years) | |
| Acer Predator Helios 300 (i7-12700H, RTX 3070 Ti) | |
| Average Intel Core i7-13700HX, NVIDIA GeForce RTX 4070 Laptop GPU (7178 - 8486, n=4) | |
| Asus ROG Strix G17 G713PI | |
| Razer Blade 15 OLED (Early 2022) | |
| Aorus 15X ASF | |
| MSI Katana 17 B13VFK | |
| PCMark 10 / Essentials | |
| Asus ROG Strix G17 G713PI | |
| MSI Katana 17 B13VFK | |
| Aorus 15X ASF | |
| Acer Predator Helios 300 (i7-12700H, RTX 3070 Ti) | |
| Average of class Gaming (8810 - 11935, n=97, last 2 years) | |
| Average Intel Core i7-13700HX, NVIDIA GeForce RTX 4070 Laptop GPU (9679 - 11652, n=4) | |
| Razer Blade 15 OLED (Early 2022) | |
| PCMark 10 / Productivity | |
| Average of class Gaming (6845 - 25323, n=95, last 2 years) | |
| Asus ROG Strix G17 G713PI | |
| Razer Blade 15 OLED (Early 2022) | |
| Acer Predator Helios 300 (i7-12700H, RTX 3070 Ti) | |
| Average Intel Core i7-13700HX, NVIDIA GeForce RTX 4070 Laptop GPU (9236 - 10517, n=4) | |
| Aorus 15X ASF | |
| MSI Katana 17 B13VFK | |
| PCMark 10 / Digital Content Creation | |
| Average of class Gaming (7602 - 19954, n=95, last 2 years) | |
| Acer Predator Helios 300 (i7-12700H, RTX 3070 Ti) | |
| Average Intel Core i7-13700HX, NVIDIA GeForce RTX 4070 Laptop GPU (9731 - 13534, n=4) | |
| Razer Blade 15 OLED (Early 2022) | |
| MSI Katana 17 B13VFK | |
| Aorus 15X ASF | |
| Asus ROG Strix G17 G713PI | |
| CrossMark / Overall | |
| Aorus 15X ASF | |
| Asus ROG Strix G17 G713PI | |
| Average of class Gaming (1366 - 2409, n=94, last 2 years) | |
| Average Intel Core i7-13700HX, NVIDIA GeForce RTX 4070 Laptop GPU (1756 - 2065, n=3) | |
| Acer Predator Helios 300 (i7-12700H, RTX 3070 Ti) | |
| MSI Katana 17 B13VFK | |
| Razer Blade 15 OLED (Early 2022) | |
| CrossMark / Productivity | |
| Aorus 15X ASF | |
| Asus ROG Strix G17 G713PI | |
| Average of class Gaming (1386 - 2254, n=94, last 2 years) | |
| Average Intel Core i7-13700HX, NVIDIA GeForce RTX 4070 Laptop GPU (1731 - 1960, n=3) | |
| Acer Predator Helios 300 (i7-12700H, RTX 3070 Ti) | |
| MSI Katana 17 B13VFK | |
| Razer Blade 15 OLED (Early 2022) | |
| CrossMark / Creativity | |
| Asus ROG Strix G17 G713PI | |
| Average of class Gaming (1343 - 2786, n=94, last 2 years) | |
| Aorus 15X ASF | |
| Acer Predator Helios 300 (i7-12700H, RTX 3070 Ti) | |
| Average Intel Core i7-13700HX, NVIDIA GeForce RTX 4070 Laptop GPU (1797 - 2193, n=3) | |
| MSI Katana 17 B13VFK | |
| Razer Blade 15 OLED (Early 2022) | |
| CrossMark / Responsiveness | |
| Aorus 15X ASF | |
| Average Intel Core i7-13700HX, NVIDIA GeForce RTX 4070 Laptop GPU (1708 - 2016, n=3) | |
| MSI Katana 17 B13VFK | |
| Acer Predator Helios 300 (i7-12700H, RTX 3070 Ti) | |
| Average of class Gaming (1226 - 2334, n=94, last 2 years) | |
| Asus ROG Strix G17 G713PI | |
| Razer Blade 15 OLED (Early 2022) | |
| PCMark 8 Home Score Accelerated v2 | 4764 points | |
| PCMark 8 Work Score Accelerated v2 | 5976 points | |
| PCMark 10 Score | 7178 points | |
Help | ||
| AIDA64 / Memory Copy | |
| Average of class Gaming (21750 - 129946, n=105, last 2 years) | |
| Aorus 15X ASF | |
| Acer Predator Helios 300 (i7-12700H, RTX 3070 Ti) | |
| Razer Blade 15 OLED (Early 2022) | |
| Average Intel Core i7-13700HX (36125 - 63990, n=11) | |
| MSI Katana 17 B13VFK | |
| Asus ROG Strix G17 G713PI | |
| AIDA64 / Memory Read | |
| Average of class Gaming (22956 - 118858, n=105, last 2 years) | |
| Aorus 15X ASF | |
| MSI Katana 17 B13VFK | |
| Razer Blade 15 OLED (Early 2022) | |
| Average Intel Core i7-13700HX (36510 - 69729, n=11) | |
| Asus ROG Strix G17 G713PI | |
| Acer Predator Helios 300 (i7-12700H, RTX 3070 Ti) | |
| AIDA64 / Memory Write | |
| Average of class Gaming (22297 - 135096, n=105, last 2 years) | |
| Average Intel Core i7-13700HX (33598 - 85675, n=11) | |
| Asus ROG Strix G17 G713PI | |
| Razer Blade 15 OLED (Early 2022) | |
| Acer Predator Helios 300 (i7-12700H, RTX 3070 Ti) | |
| Aorus 15X ASF | |
| MSI Katana 17 B13VFK | |
| AIDA64 / Memory Latency | |
| Average of class Gaming (75.3 - 259, n=105, last 2 years) | |
| MSI Katana 17 B13VFK | |
| Razer Blade 15 OLED (Early 2022) | |
| Acer Predator Helios 300 (i7-12700H, RTX 3070 Ti) | |
| Average Intel Core i7-13700HX (81.5 - 97.9, n=11) | |
| Asus ROG Strix G17 G713PI | |
| Aorus 15X ASF | |
* ... smaller is better
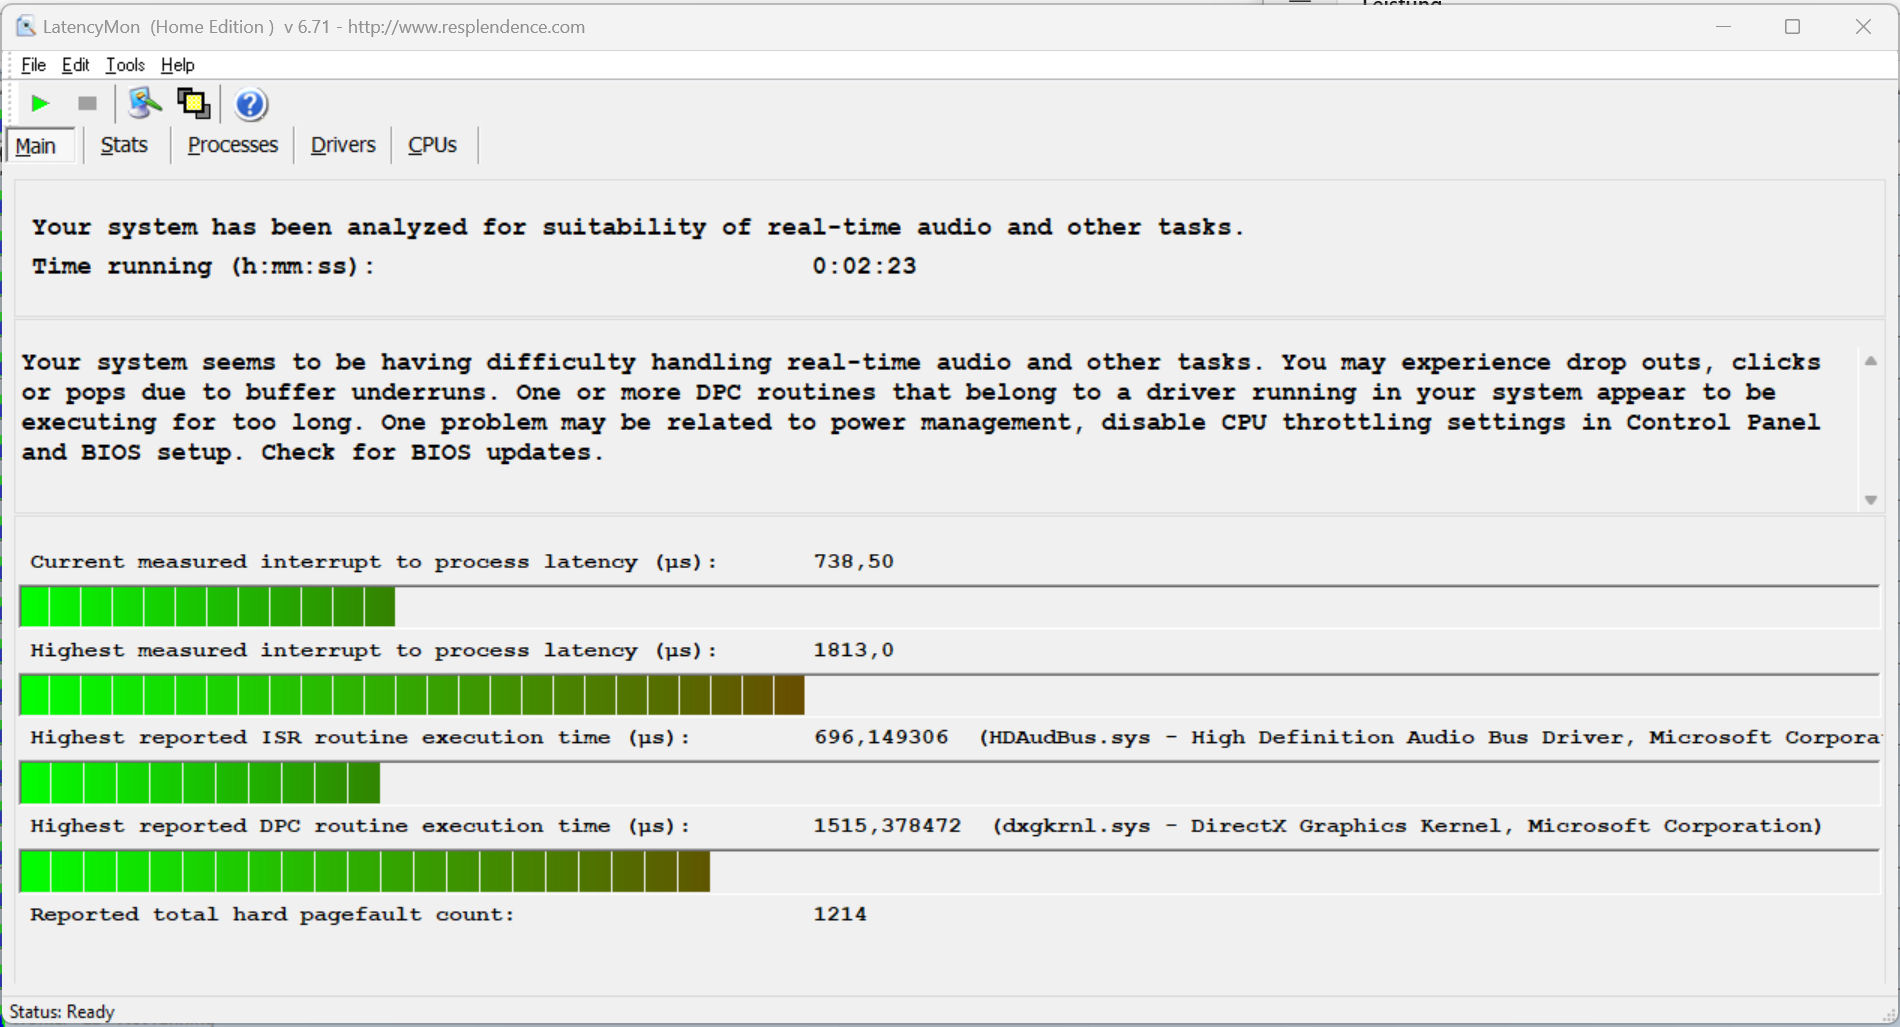
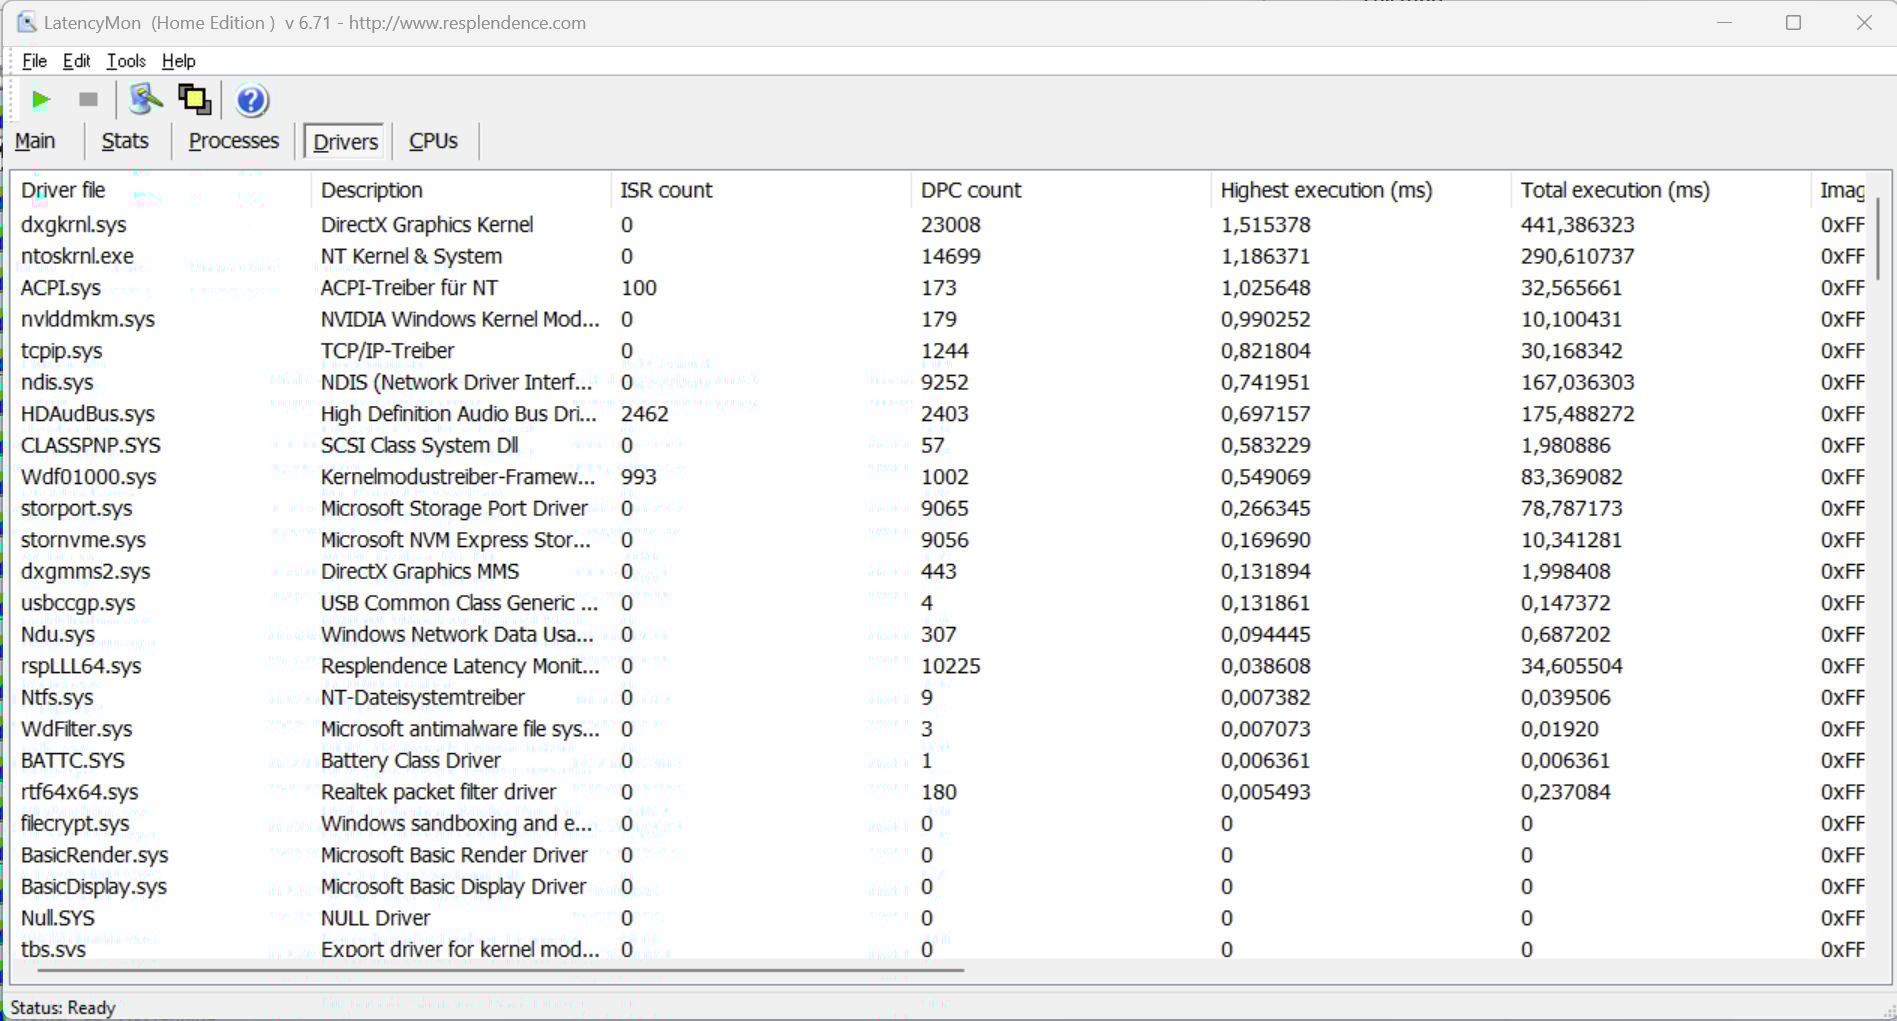
DPC延时
标准化的延迟监测测试(网络冲浪、4k视频播放、Prime95高负荷)发现了一些异常情况。这个系统似乎并不适合实时视频和音频编辑。未来的软件更新可能会带来一些改进--但也有可能使这个问题恶化。
| DPC Latencies / LatencyMon - interrupt to process latency (max), Web, Youtube, Prime95 | |
| MSI Katana 17 B13VFK | |
| Aorus 15X ASF | |
| Acer Predator Helios 300 (i7-12700H, RTX 3070 Ti) | |
| Asus ROG Strix G17 G713PI | |
| Razer Blade 15 OLED (Early 2022) | |
* ... smaller is better
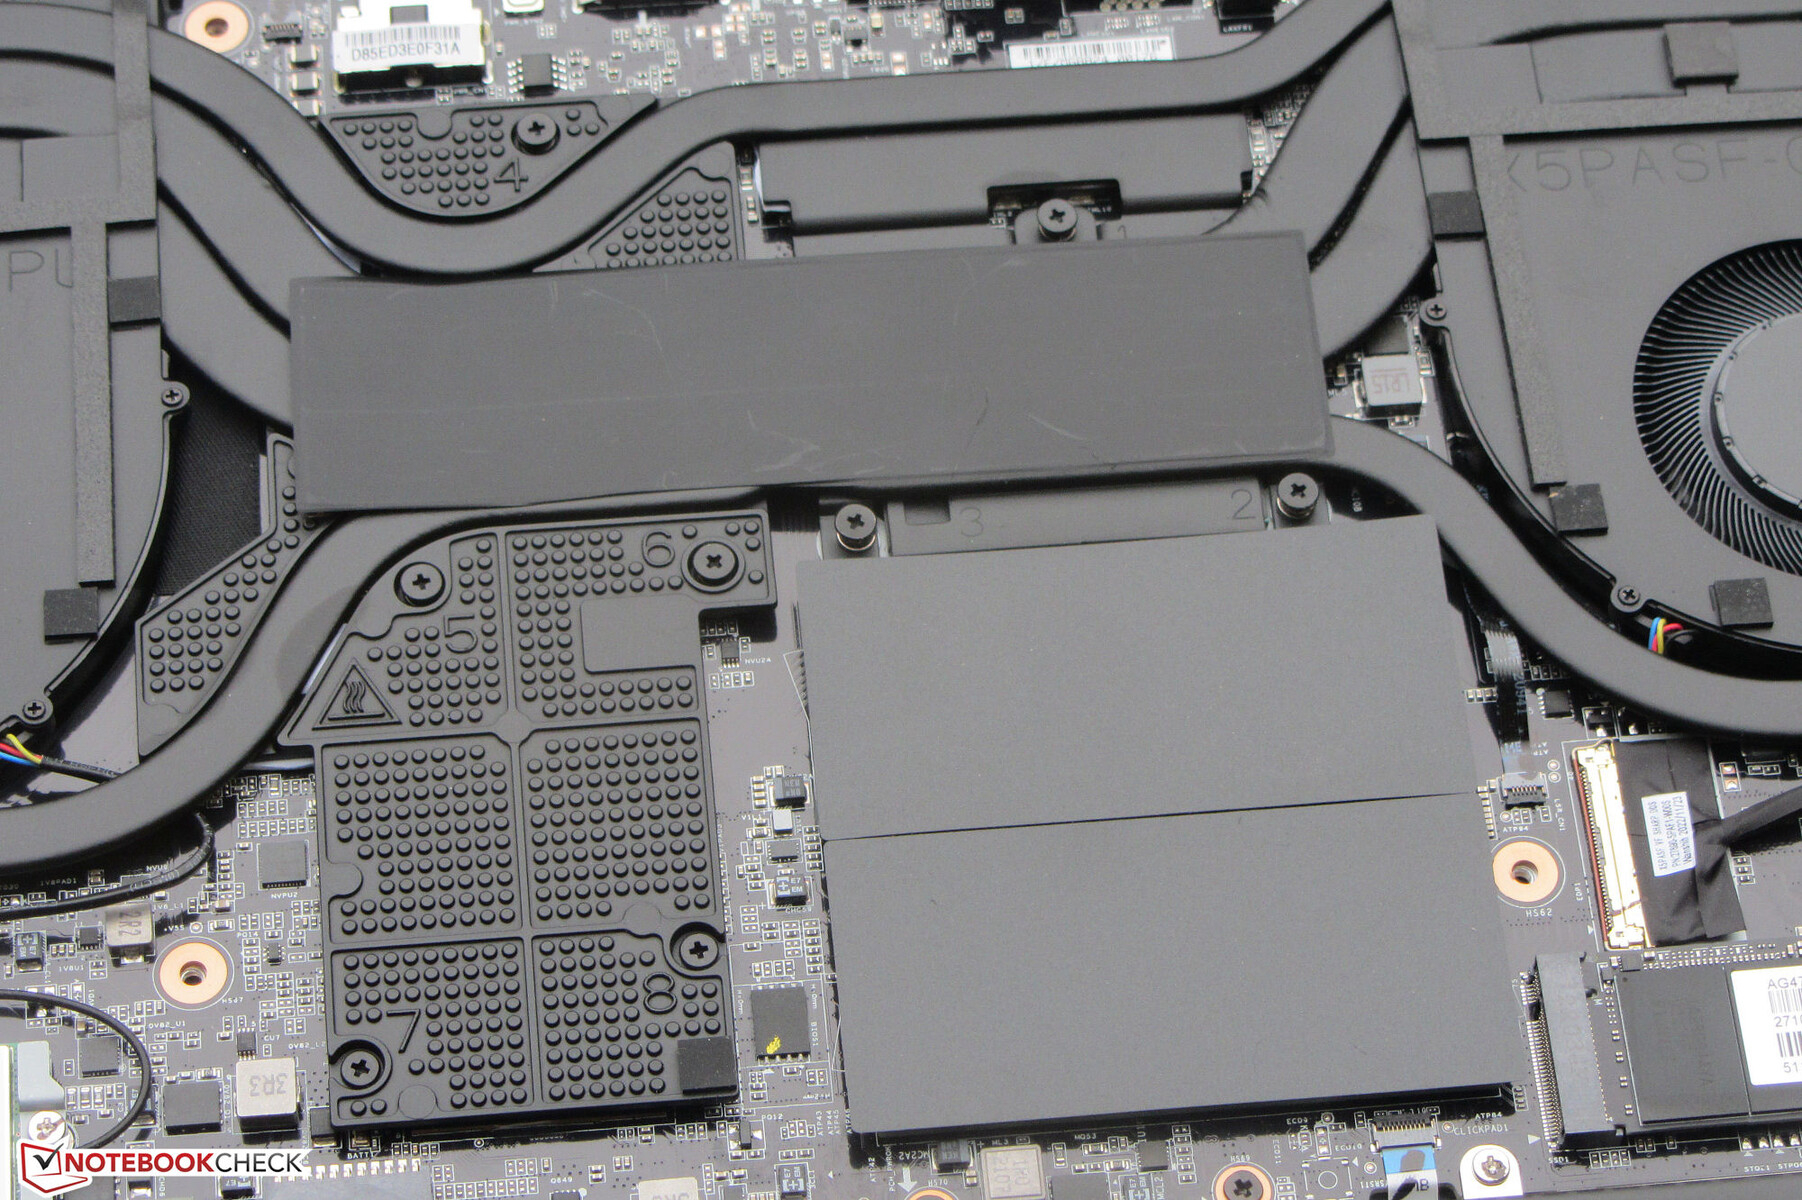
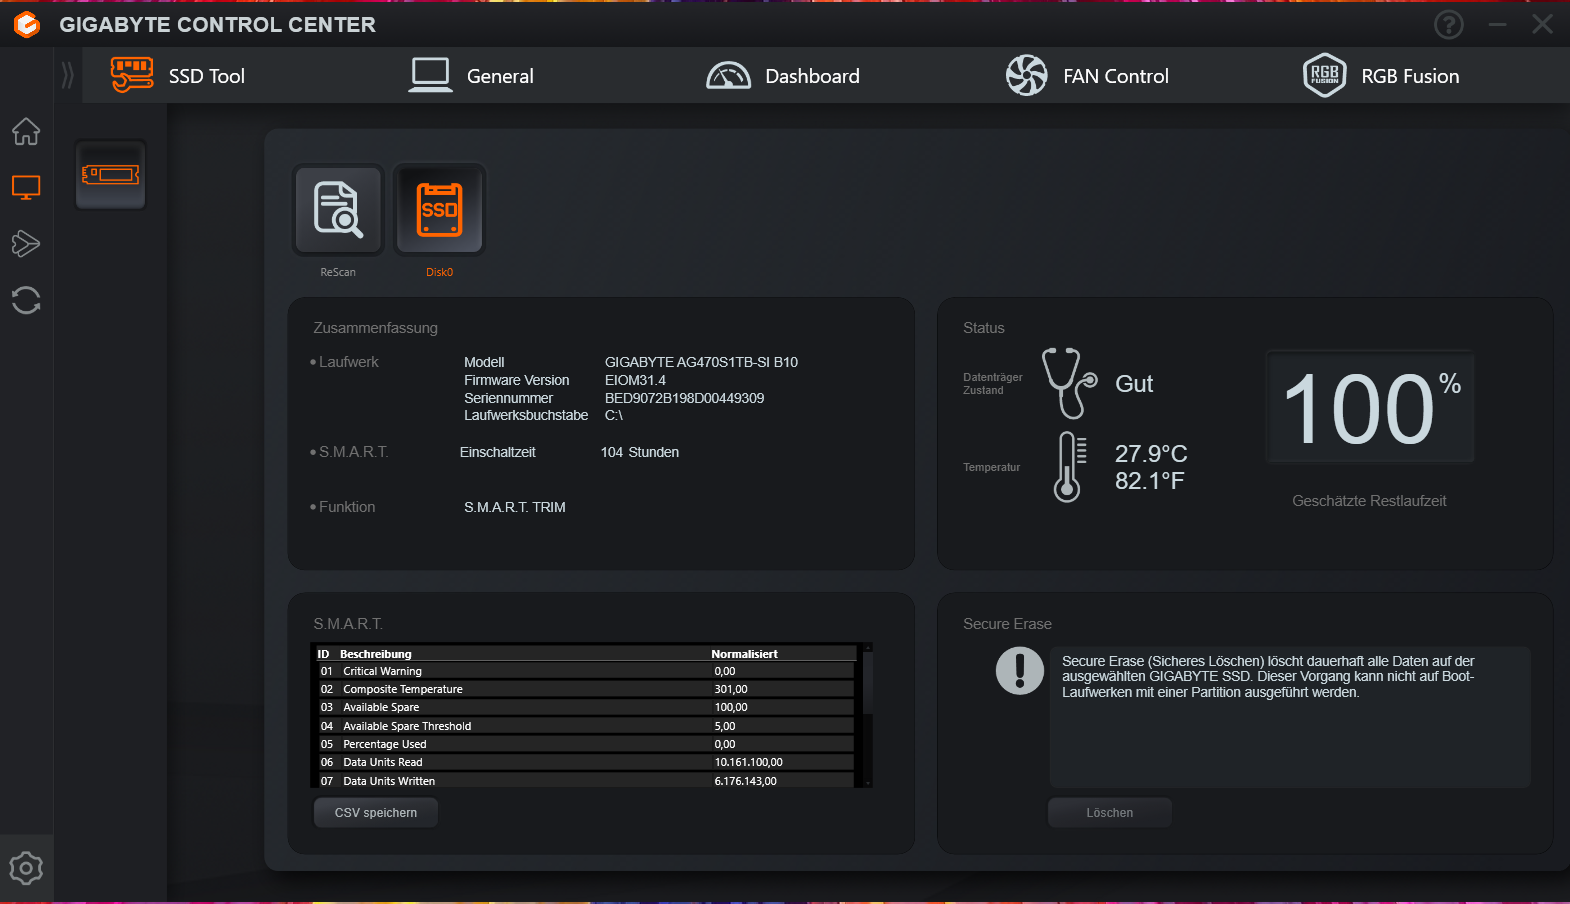
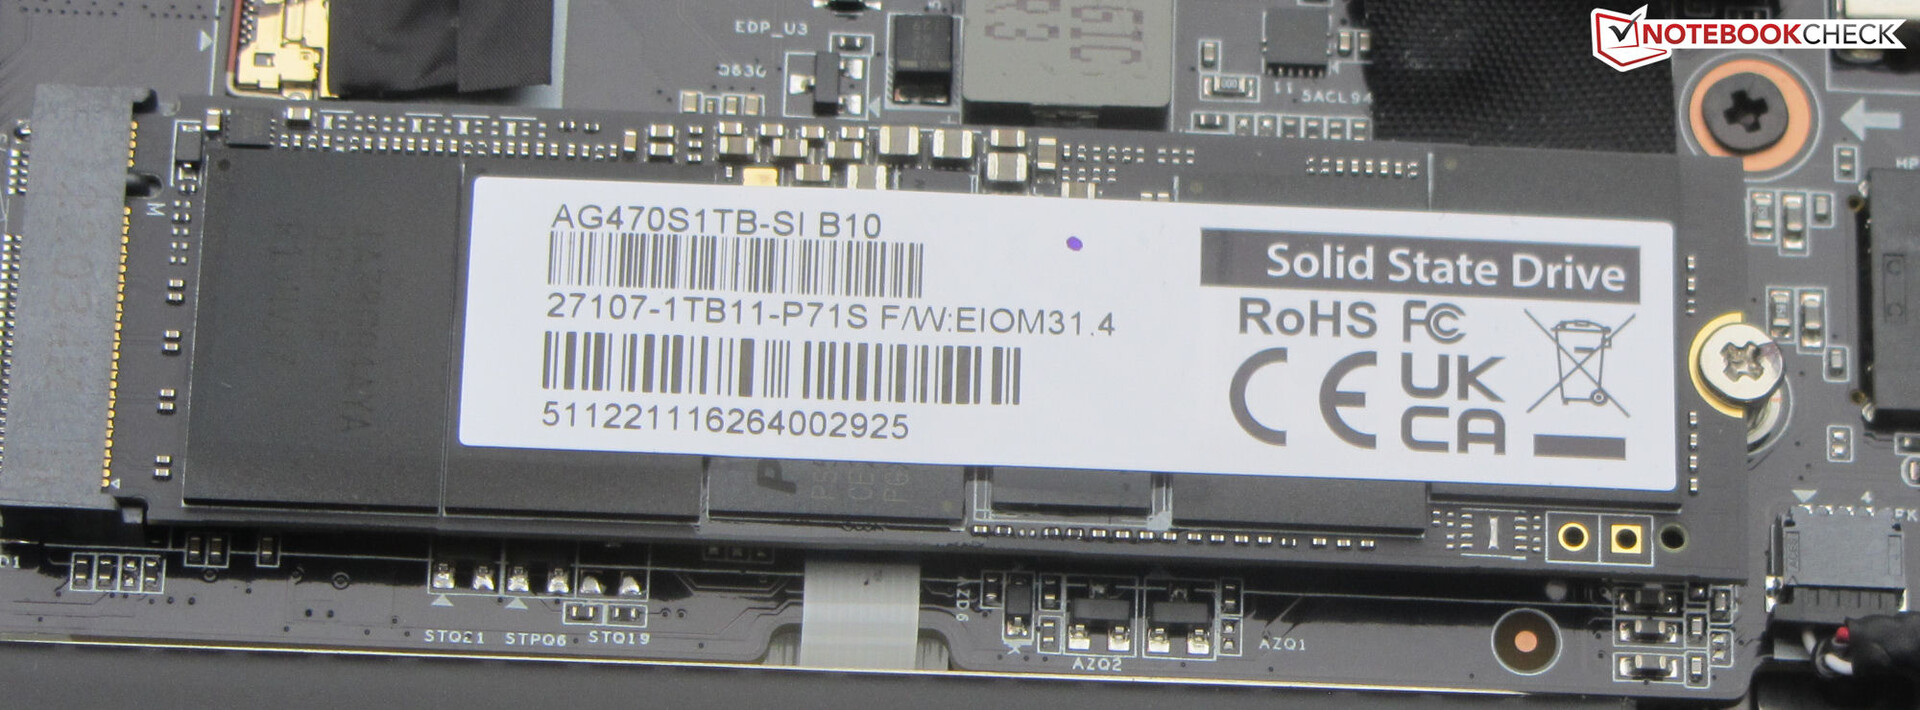
存储设备
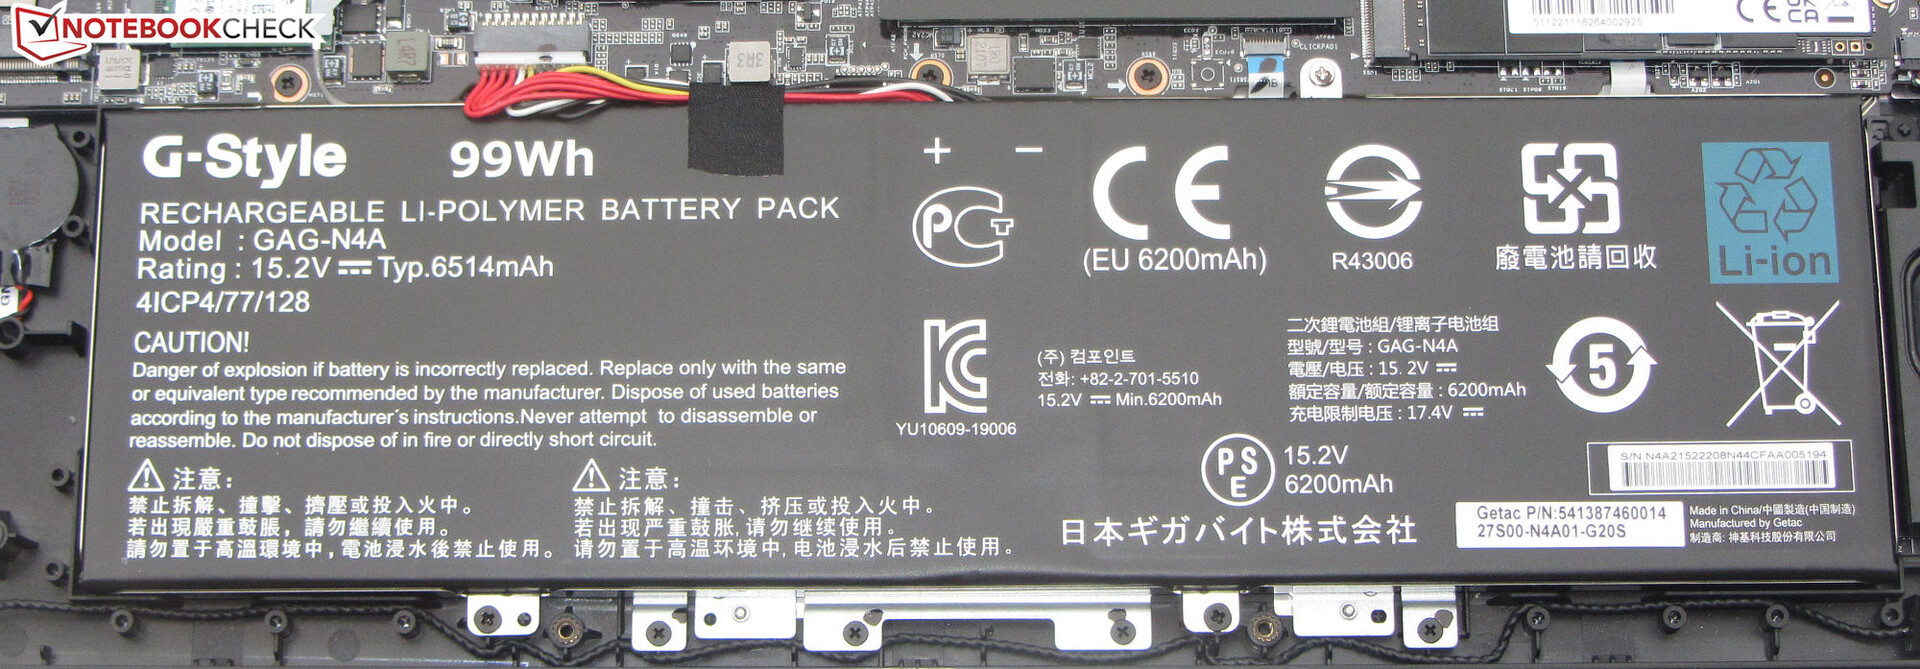
15X有空间容纳两个M.2-2280格式的PCIe-4固态硬盘--然而,笔记本电脑只包含一个。 安装的Gigabyte的PCIe-4型号(1TB)提供了非常好的传输速率。然而:在DiskSpd循环的后期,可以观察到偶尔的性能下降 - 可能是由于热节流。

* ... smaller is better
Reading continuous performance: DiskSpd Read Loop, Queue Depth 8
图形卡
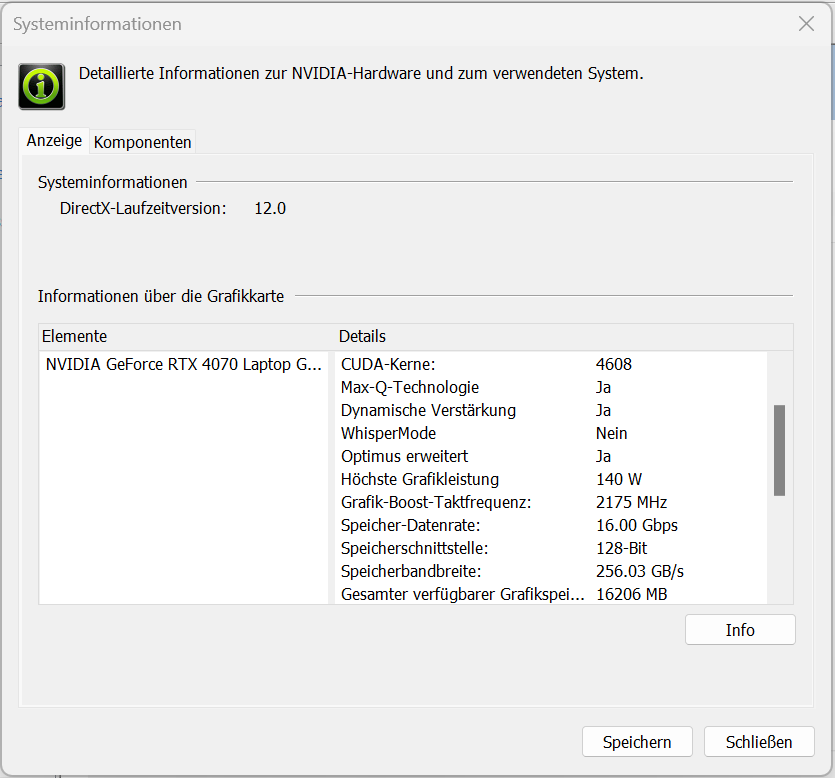
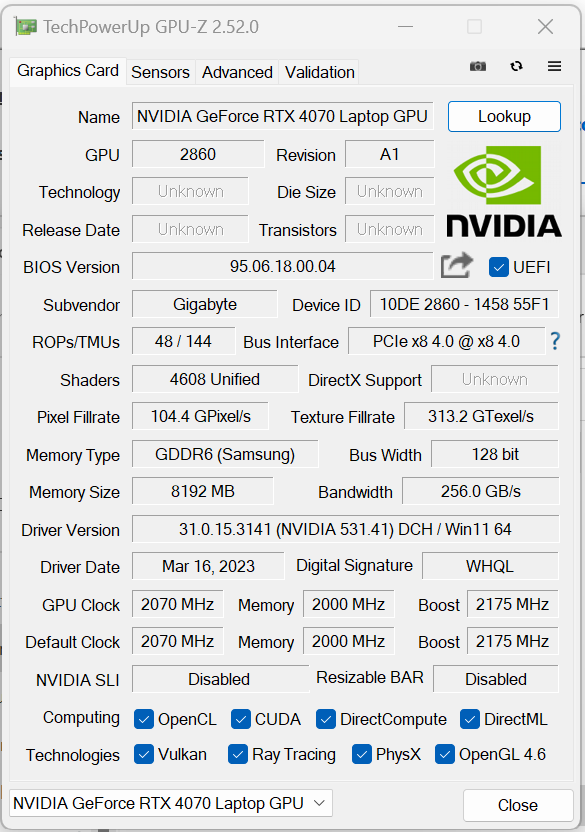
Aorus依靠的是一个GeForce-RTX-4070笔记本电脑的GPU,并给予它最大可能的TGP 140瓦(115瓦+25瓦动态提升)--根据测试,这并没有被完全利用。 Witcher 3测试。该GPU有4,608个着色器,128位宽总线和快速GDDR6内存(8,192 MB)。
基准测试结果高于之前RTX 4070的平均值。dGPU模式并没有带来任何改进。在dGPU和Optimus之间切换不需要重新启动--支持高级Optimus。


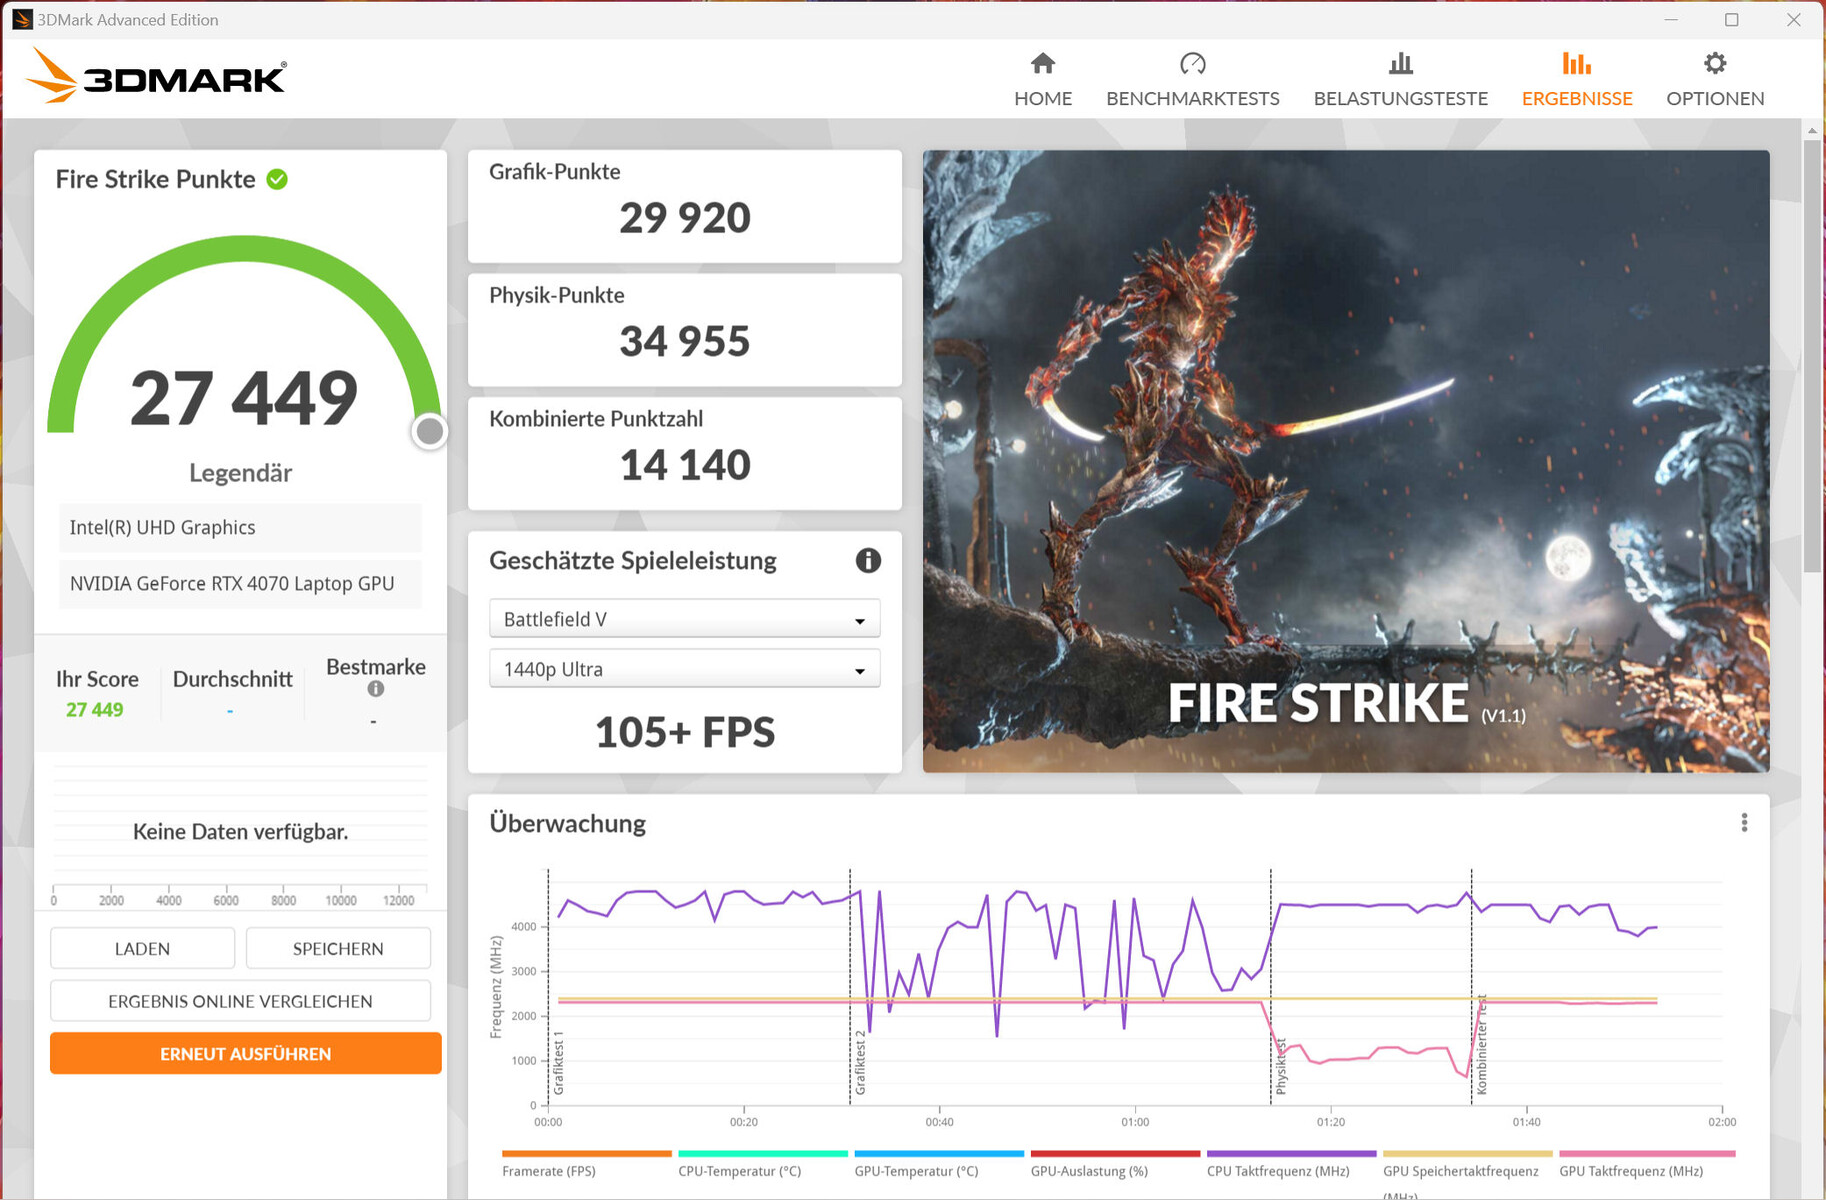
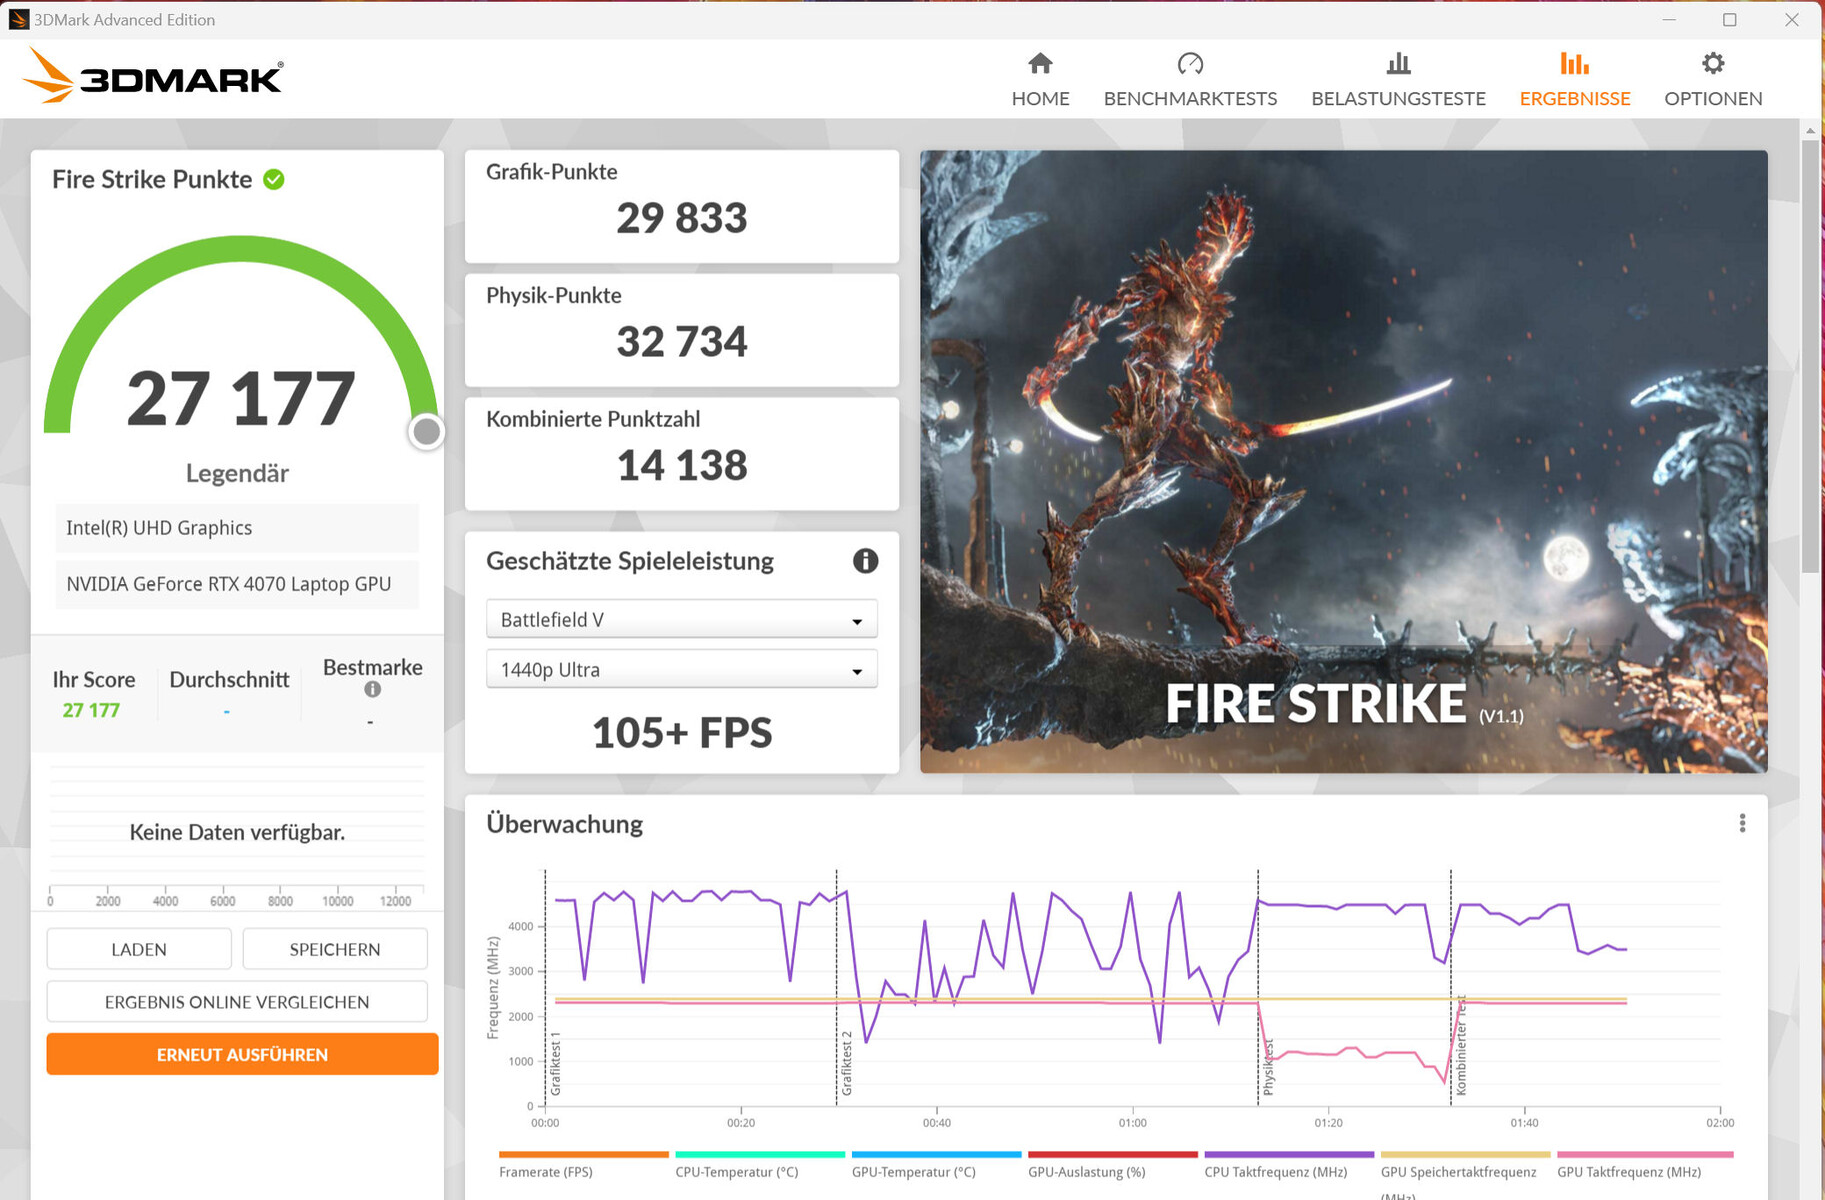
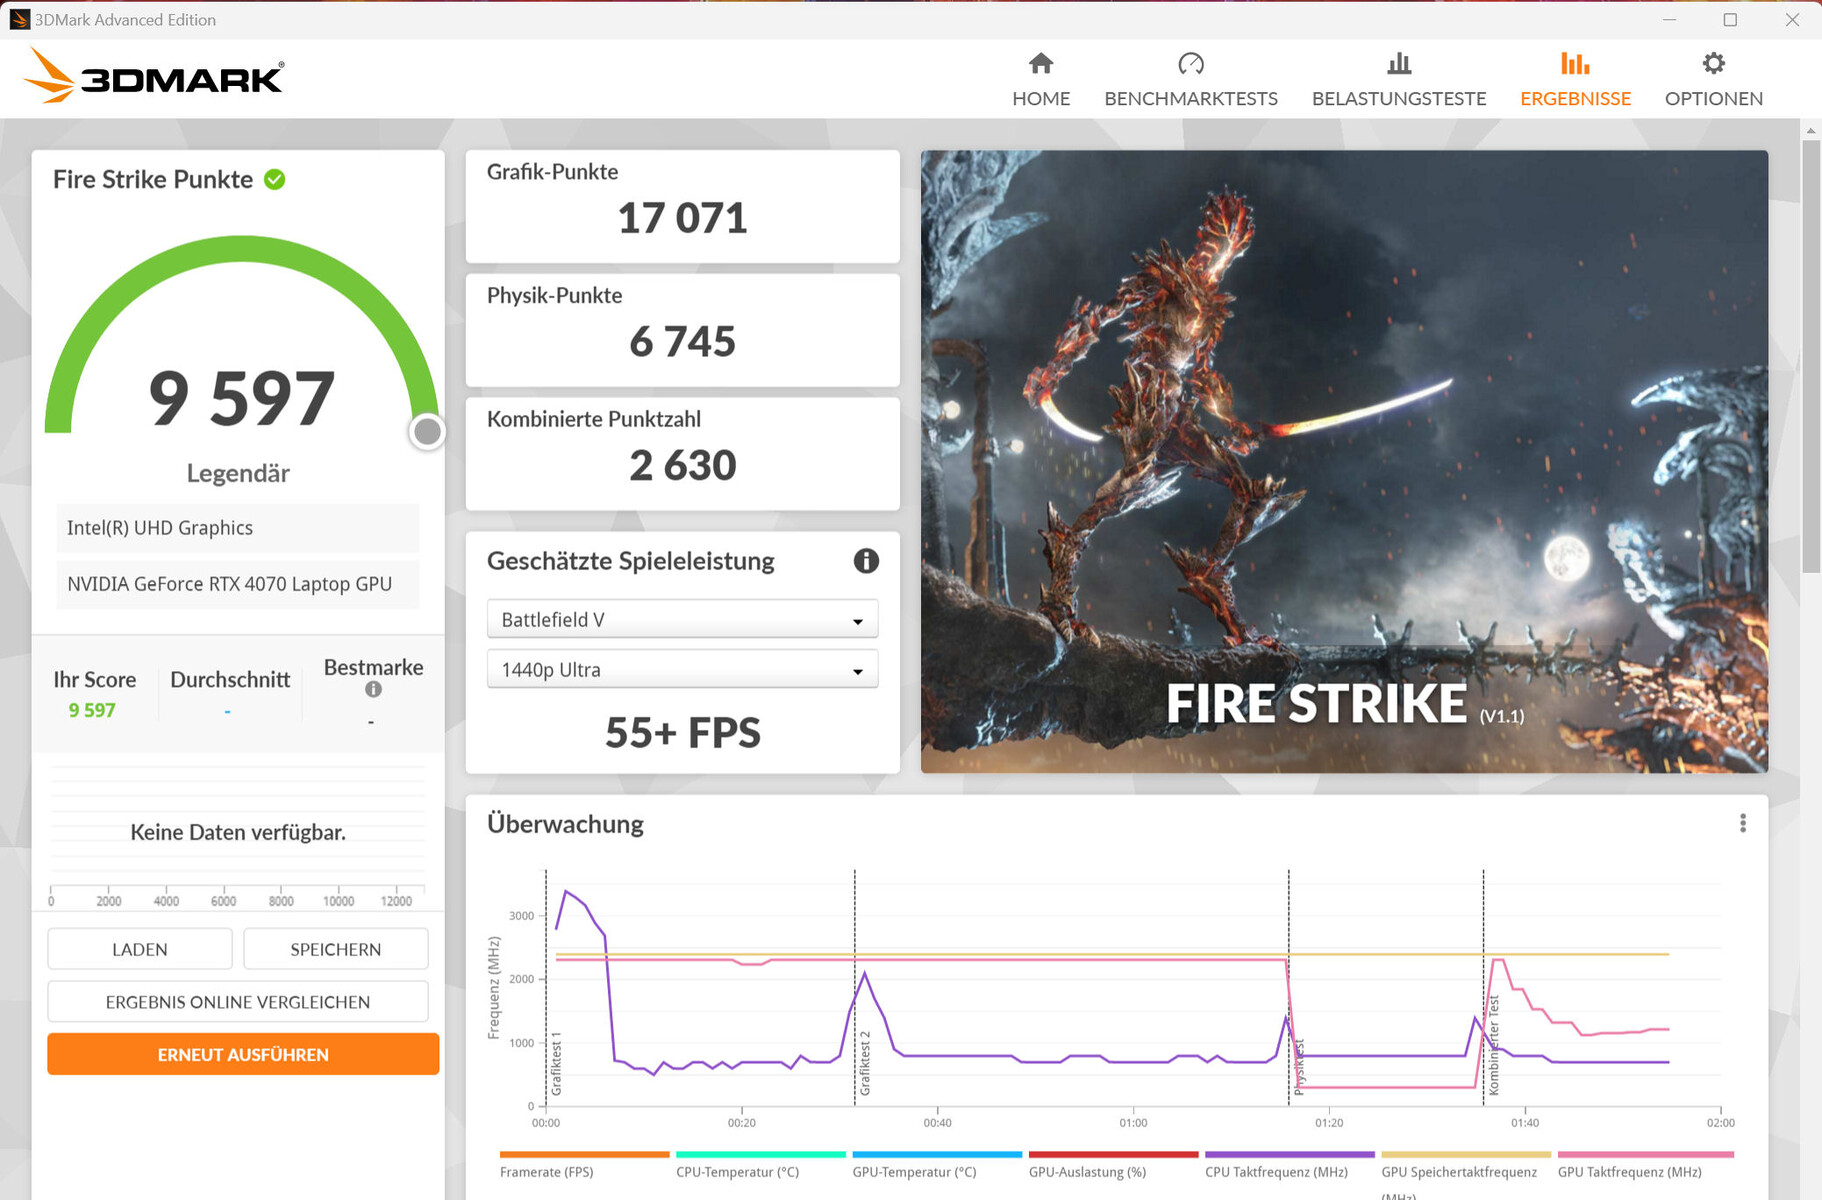
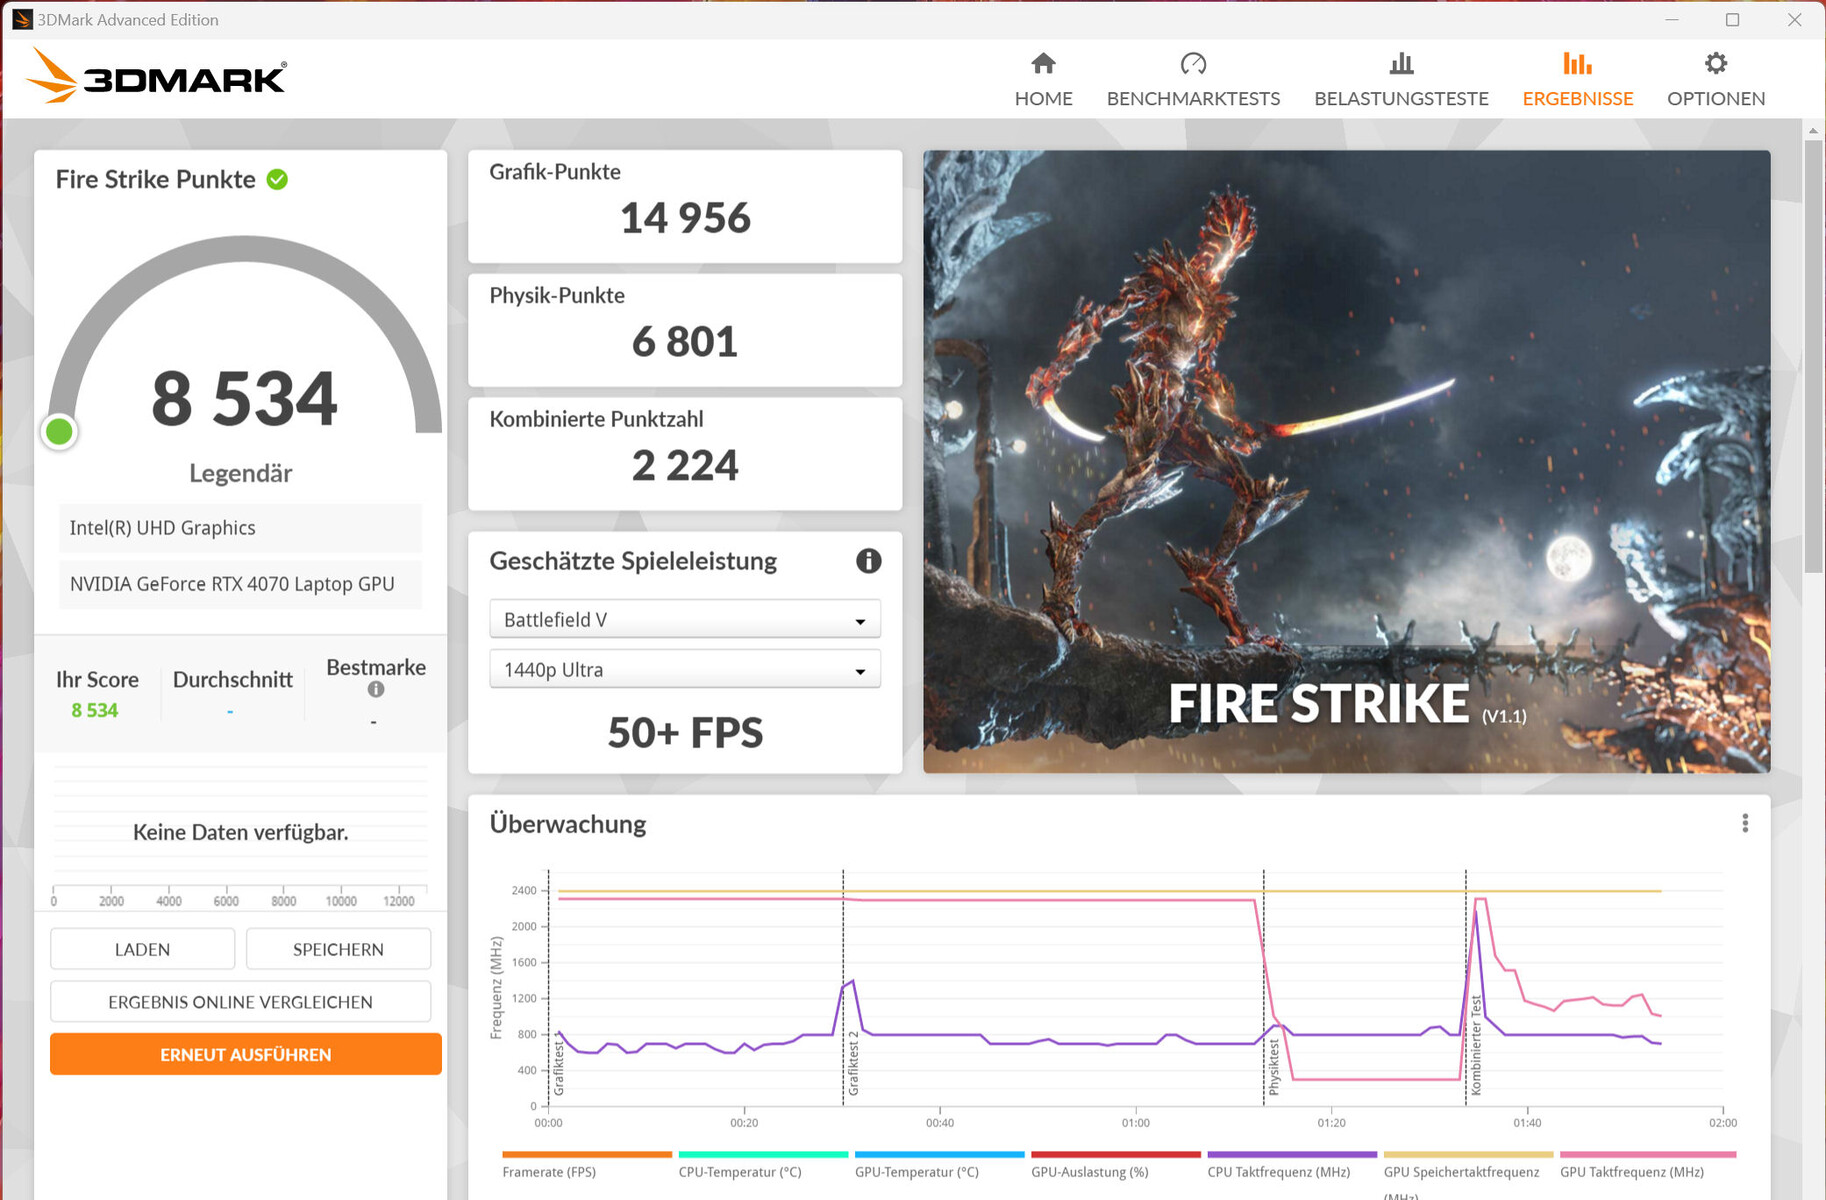
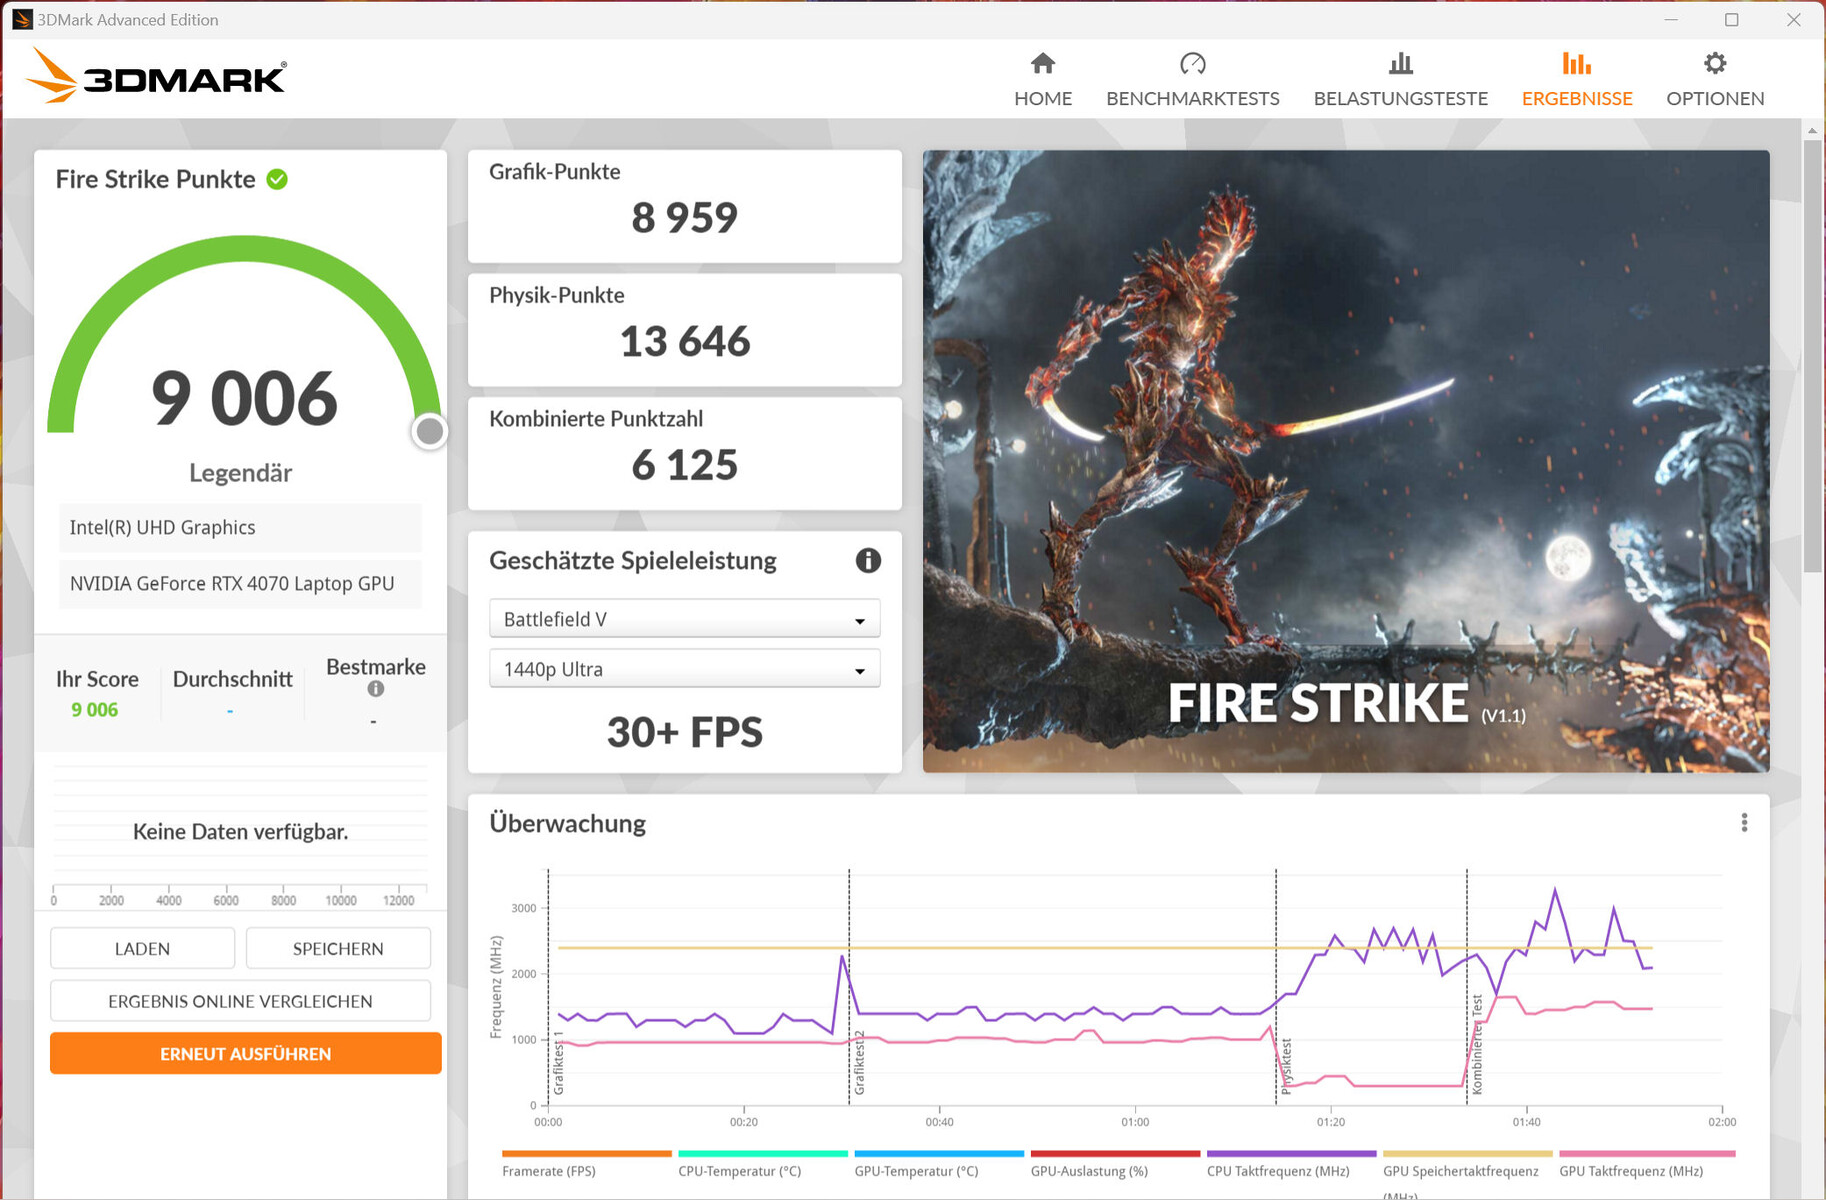

| 3DMark 06 Standard Score | 55615 points | |
| 3DMark 11 Performance | 34985 points | |
| 3DMark Cloud Gate Standard Score | 65819 points | |
| 3DMark Fire Strike Score | 27468 points | |
| 3DMark Time Spy Score | 12421 points | |
Help | ||
* ... smaller is better
游戏性能
这款笔记本电脑是为QHD游戏而设计的,在高至最高设置下。使用相应的显示器可以实现更高的分辨率--可能需要降低设置。我们测试的游戏的帧率与确定的RTX 4070平均水平相当。dGPU模式稍微增加了一些游戏的帧率。
| The Witcher 3 - 1920x1080 Ultra Graphics & Postprocessing (HBAO+) | |
| Average of class Gaming (104.7 - 240, n=7, last 2 years) | |
| Asus ROG Strix G17 G713PI | |
| Acer Predator Helios 300 (i7-12700H, RTX 3070 Ti) | |
| Aorus 15X ASF | |
| Average NVIDIA GeForce RTX 4070 Laptop GPU (69.8 - 133.7, n=57) | |
| MSI Katana 17 B13VFK | |
| Razer Blade 15 OLED (Early 2022) | |
为了检查帧率是否在较长的使用时间内保持一致,我们在全高清分辨率下使用最大质量设置运行了游戏TheWitcher 3约60分钟。游戏角色没有被移动。没有发现帧率的下降。
Witcher 3 FPS diagram
| low | med. | high | ultra | QHD | |
|---|---|---|---|---|---|
| GTA V (2015) | 185.1 | 185.9 | 180.2 | 117.8 | 88.8 |
| The Witcher 3 (2015) | 484.7 | 366.3 | 228.3 | 117 | |
| Dota 2 Reborn (2015) | 191.9 | 181.1 | 161.1 | 149.4 | |
| Final Fantasy XV Benchmark (2018) | 208 | 167.2 | 117.5 | 83.7 | |
| X-Plane 11.11 (2018) | 164.9 | 145.5 | 117.1 | ||
| Far Cry 5 (2018) | 183 | 157 | 151 | 141 | 111 |
| Strange Brigade (2018) | 537 | 300 | 235 | 201 | 133.2 |
| Flight Simulator 2020 (2020) | 158.8 | 117.2 | 82.5 | 64.8 | 50.1 |
| F1 22 (2022) | 256 | 251 | 193.7 | 78.7 | 52.2 |
| FIFA 23 (2022) | 166.2 | ||||
| Uncharted Legacy of Thieves Collection (2022) | 92.7 | 89.4 | 84.4 | 82.1 | 61 |
| The Callisto Protocol (2022) | 155.6 | 127.5 | 121.8 | 79.7 | 58.4 |
| Need for Speed Unbound (2022) | 118.1 | 112.1 | 101 | 89.1 | 77.7 |
| High On Life (2023) | 236 | 185.9 | 141.6 | 114 | 68.5 |
| Dead Space Remake (2023) | 100.9 | 95.7 | 85.3 | 82.4 | 53.1 |
| Returnal (2023) | 119 | 117 | 106 | 90 | 66 |
| Atomic Heart (2023) | 199.8 | 158.3 | 96.4 | 79 | 58.9 |
| Company of Heroes 3 (2023) | 228.9 | 205.1 | 159.7 | 157.5 | 115.1 |
| Sons of the Forest (2023) | 98.3 | 86.8 | 83.3 | 82.3 | 69.5 |
| Resident Evil 4 Remake (2023) | 185.9 | 133.5 | 120.8 | 86.7 | 61.5 |
| The Last of Us (2023) | 73.1 | 60.9 | 56.9 | 56 | 53.3 |
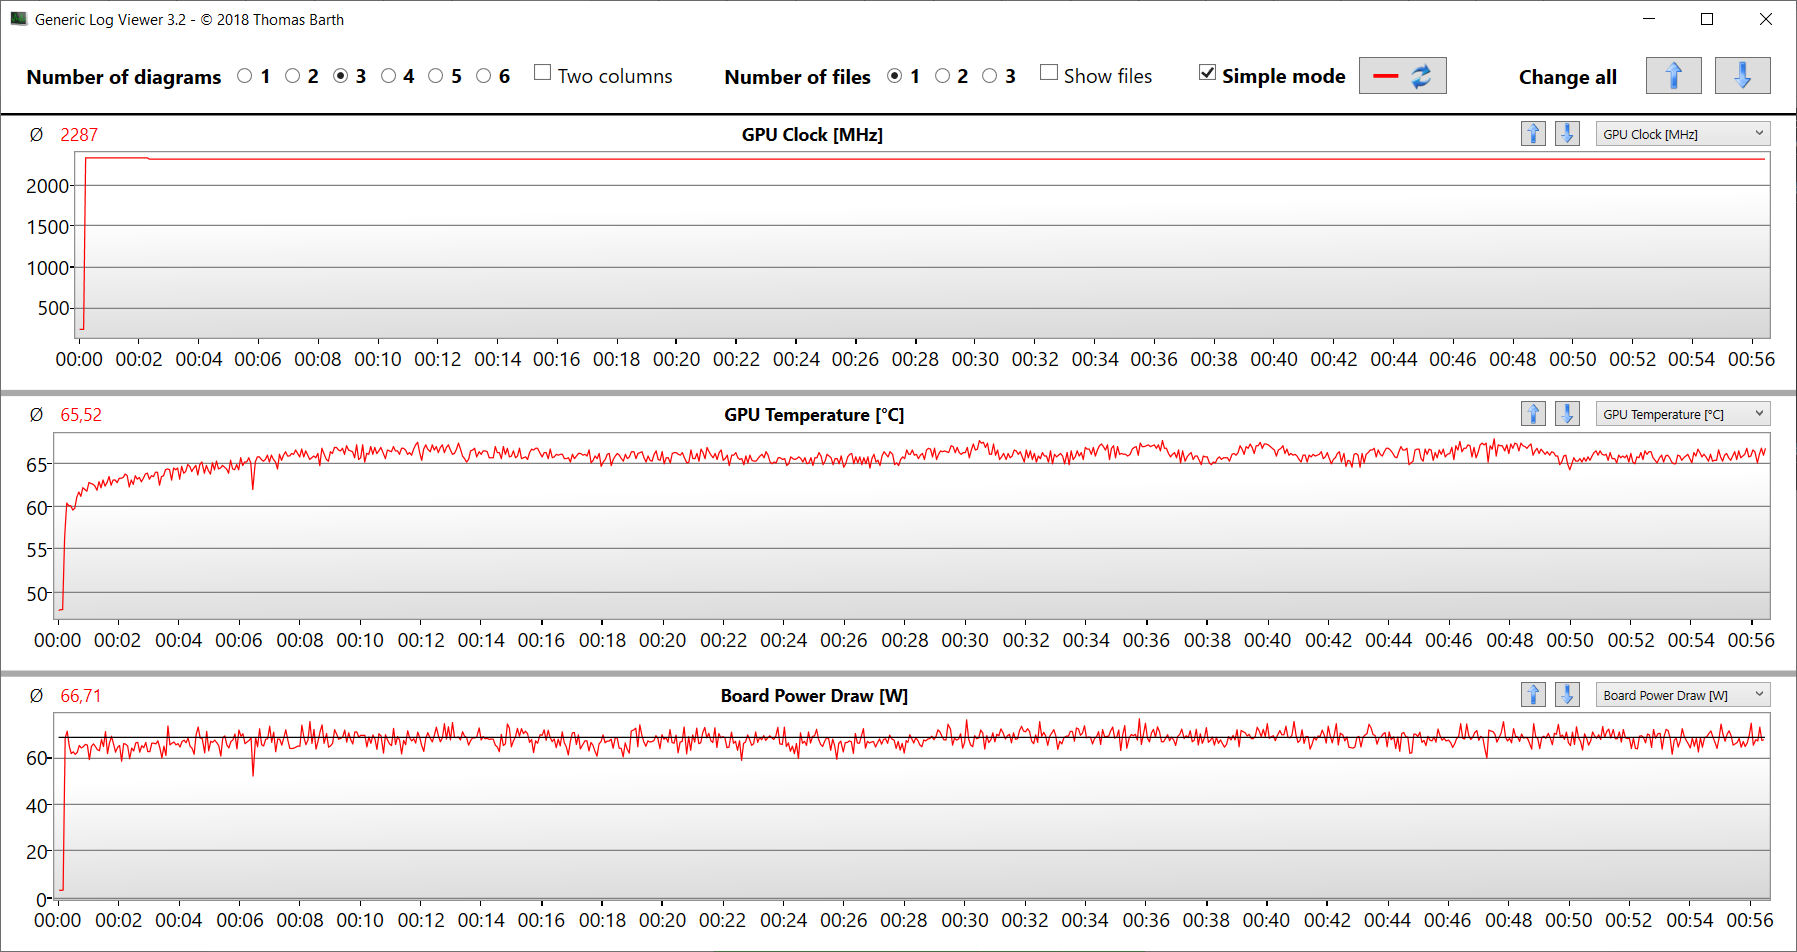
在降低音量时的游戏性能
在某种程度上,15X可以满足那些不希望太吵的游戏笔记本的用户的愿望。能源配置文件 "会议模式 "确保在降低处理能力的情况下整体降低操作音量。后者仍足以在中等至部分高设置下进行游戏。该 Witcher 3测试是在平均帧率为69 FPS,GPU TGP为67瓦的情况下进行的。
| 高清低 | FHD低 | FHD中 | FHD高 | FHD超 | |
|---|---|---|---|---|---|
| GTA V | - | 73.7 fps | 68.2 fps | 50.3 fps | 27.2 fps |
| Dota 2 Reborn | 87.1 fps | - | - | 61.8 fps | 52.7 fps |
| 最终幻想15》基准测试 | 56.7 fps | - | 49 fps | 40.7 fps | - |
| X-Plane 11.11 | 59.5 fps | - | 52.2 fps | 45.6 fps | - |
| 奇怪的旅 | 123.8 fps | - | 96.4 fps | 92.3 fps | 88.8 fps |
排放 - Aorus ASF可以安静地运行
噪声排放
这两个风扇通常在无负荷和日常使用时以低速工作(办公室、互联网)。然而,它们的转速也不是不可能的--高达38 dB(A)的水平是可能的。在负载情况下,它变得非常响亮,最高值为58 dB(A)(压力测试)和54 dB(A)(测试)。Witcher 3测试)。
Aorus 15X能够实现安静到几乎无声的操作。这需要使用能源配置文件 "会议模式 "或 "节能闲置模式"。随后电脑的性能降低,对于日常使用来说仍然绰绰有余,甚至可以在降低设置的情况下进行游戏。
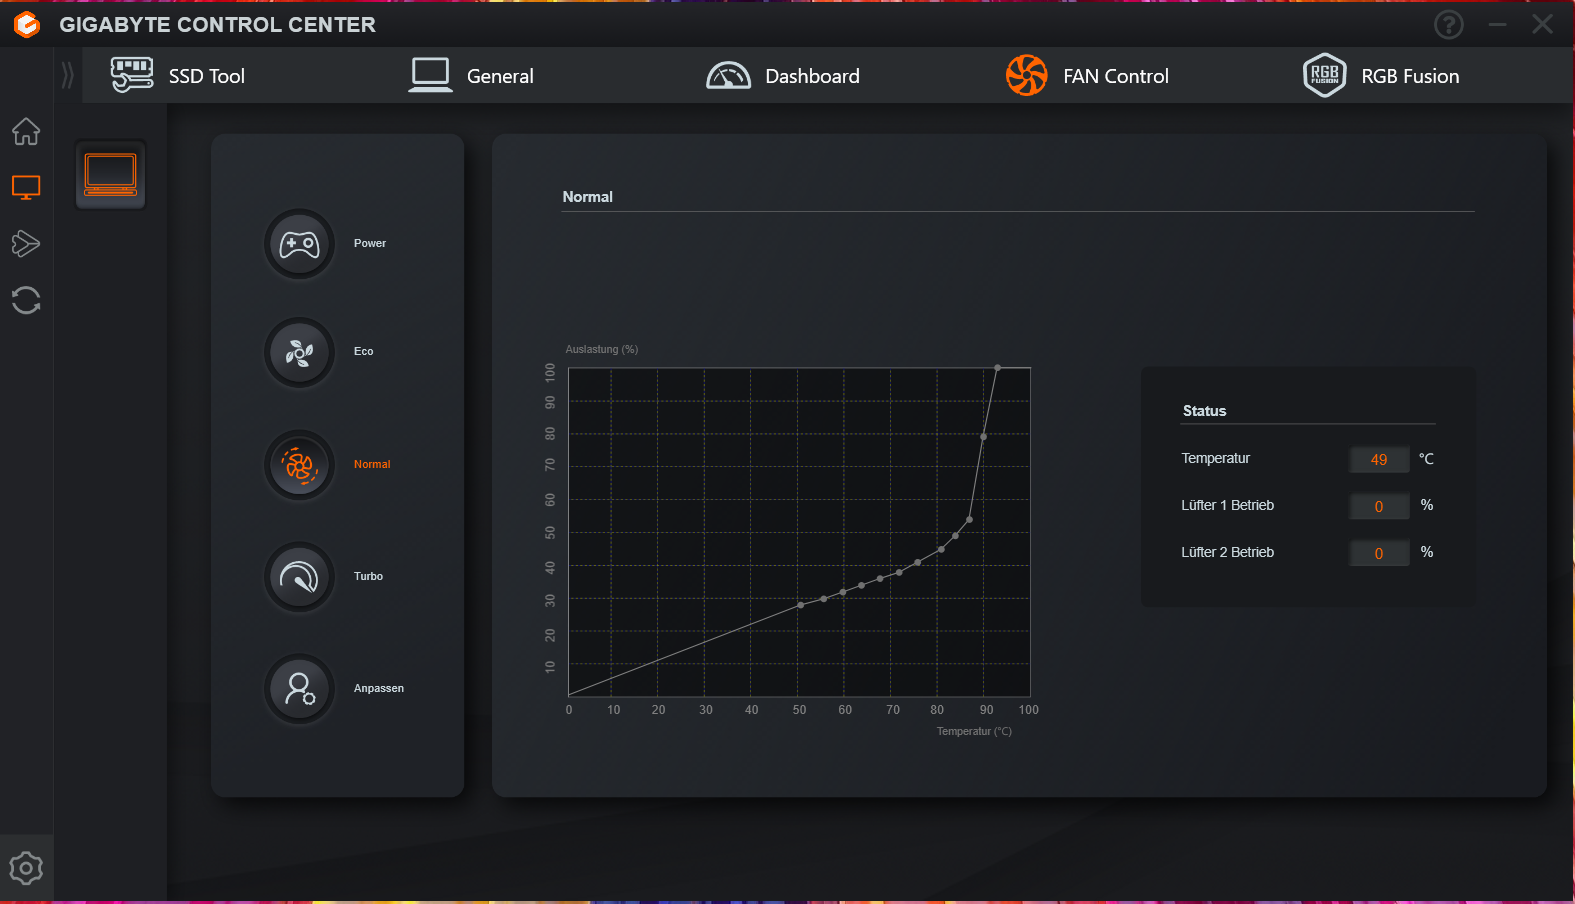
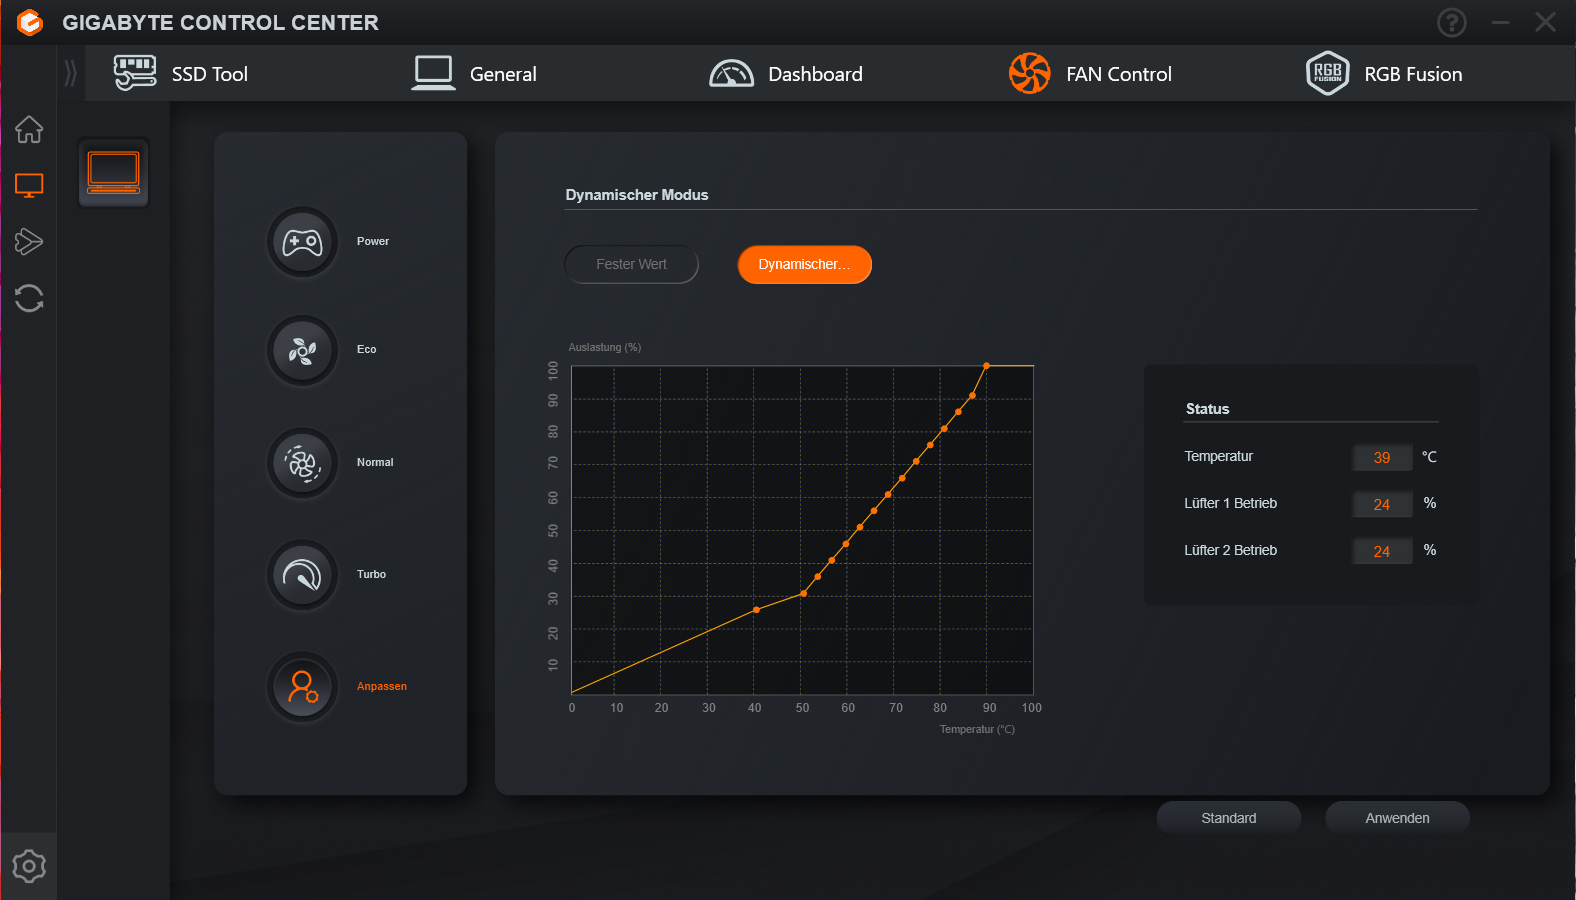
Gigabyte的控制中心可以让你控制风扇。有各种风扇配置文件可供选择,还可以创建单独的风扇曲线。
Noise level
| Idle |
| 28 / 29 / 36 dB(A) |
| Load |
| 50 / 58 dB(A) |
 | ||
30 dB silent 40 dB(A) audible 50 dB(A) loud |
||
min: | ||
| Aorus 15X ASF i7-13700HX, GeForce RTX 4070 Laptop GPU | Razer Blade 15 OLED (Early 2022) i9-12900H, GeForce RTX 3070 Ti Laptop GPU | MSI Katana 17 B13VFK i7-13620H, GeForce RTX 4060 Laptop GPU | Asus ROG Strix G17 G713PI R9 7945HX, GeForce RTX 4070 Laptop GPU | Acer Predator Helios 300 (i7-12700H, RTX 3070 Ti) i7-12700H, GeForce RTX 3070 Ti Laptop GPU | |
|---|---|---|---|---|---|
| Noise | 11% | 2% | 9% | 2% | |
| off / environment * (dB) | 25 | 26 -4% | 24.5 2% | 25 -0% | 23 8% |
| Idle Minimum * (dB) | 28 | 28 -0% | 24.5 12% | 26 7% | 23 18% |
| Idle Average * (dB) | 29 | 28 3% | 24.5 16% | 29 -0% | 25.92 11% |
| Idle Maximum * (dB) | 36 | 28 22% | 40 -11% | 30 17% | 40.67 -13% |
| Load Average * (dB) | 50 | 38.5 23% | 48.3 3% | 46 8% | 42.7 15% |
| Witcher 3 ultra * (dB) | 54 | 56 -4% | 46 15% | 62.48 -16% | |
| Load Maximum * (dB) | 58 | 43.9 24% | 59.1 -2% | 47 19% | 62.67 -8% |
* ... smaller is better
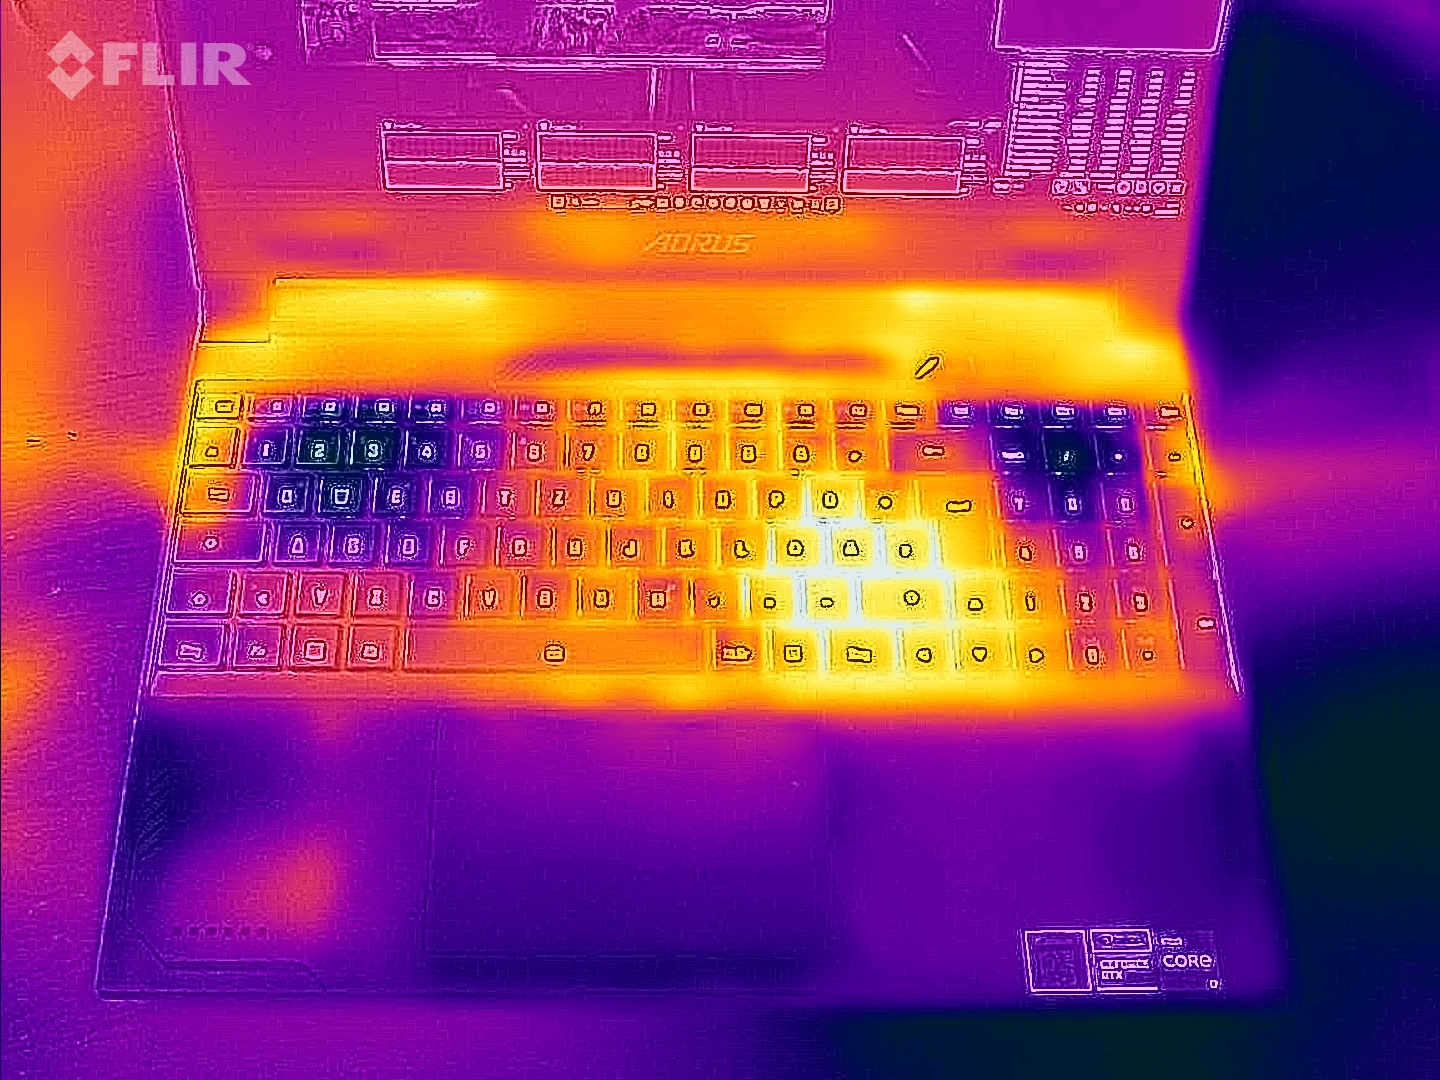
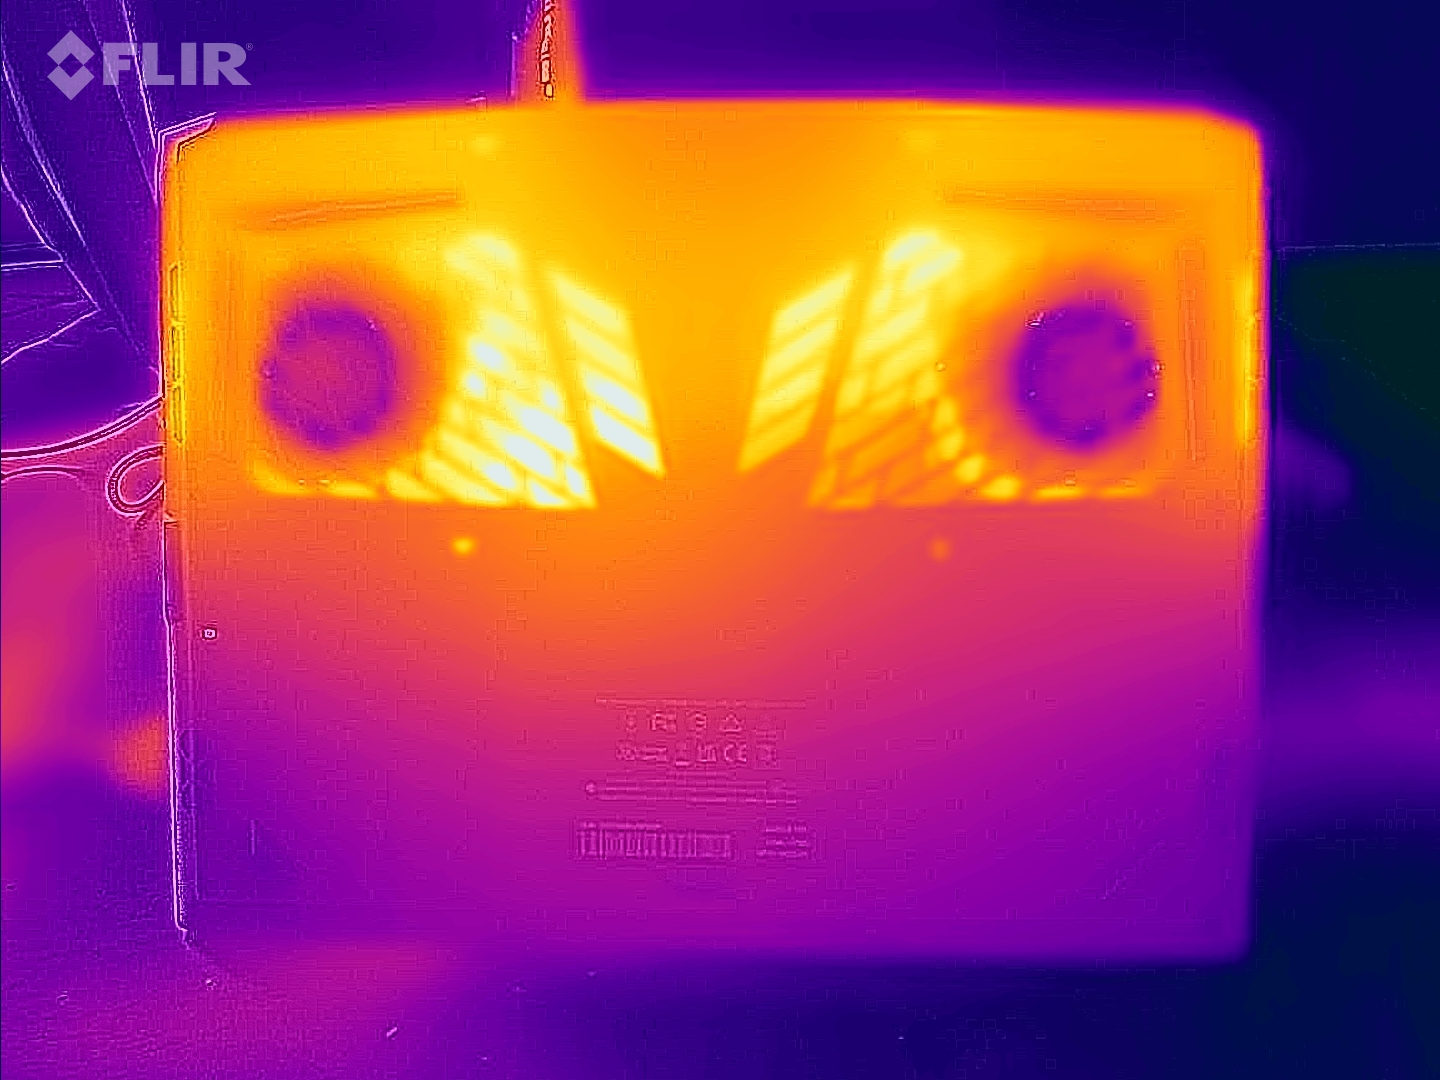
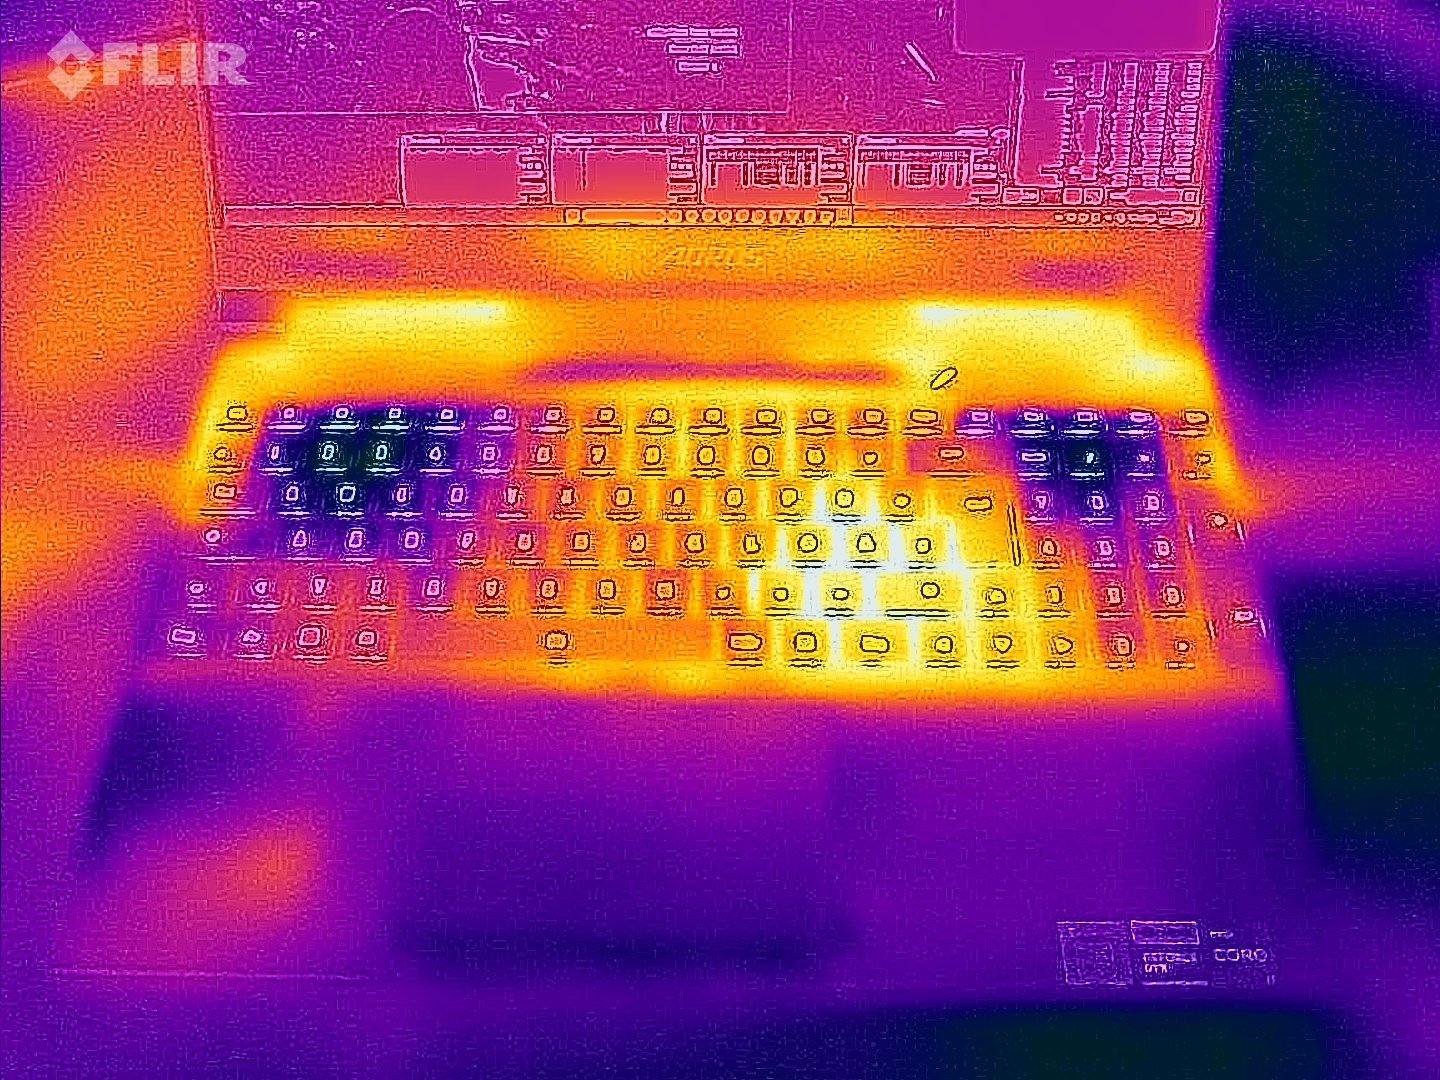
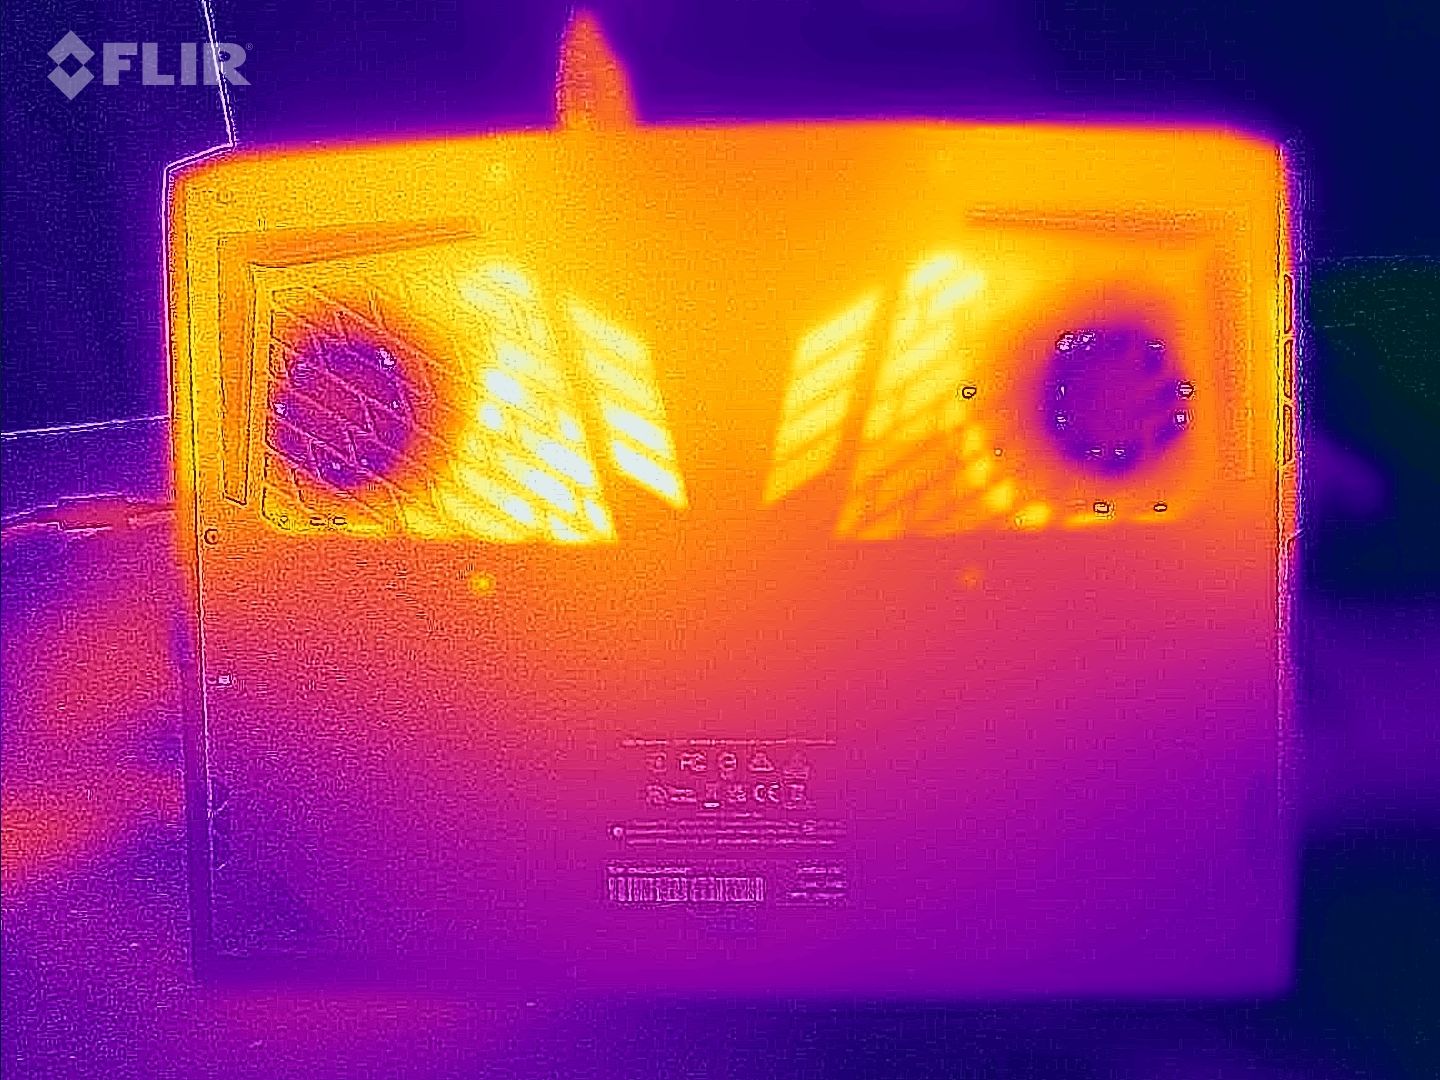
温度
在日常使用中(办公室、互联网),机箱温度保持在绿色区域内。在负载(压力测试、 Witcher 3测试),笔记本明显发热,但没有过度。CPU的温度并不令人担忧。
(±) The maximum temperature on the upper side is 42 °C / 108 F, compared to the average of 40.4 °C / 105 F, ranging from 21.2 to 68.8 °C for the class Gaming.
(-) The bottom heats up to a maximum of 51 °C / 124 F, compared to the average of 43.2 °C / 110 F
(+) In idle usage, the average temperature for the upper side is 25.7 °C / 78 F, compared to the device average of 33.9 °C / 93 F.
(±) Playing The Witcher 3, the average temperature for the upper side is 34.2 °C / 94 F, compared to the device average of 33.9 °C / 93 F.
(+) The palmrests and touchpad are cooler than skin temperature with a maximum of 28 °C / 82.4 F and are therefore cool to the touch.
(±) The average temperature of the palmrest area of similar devices was 28.8 °C / 83.8 F (+0.8 °C / 1.4 F).
| Aorus 15X ASF Intel Core i7-13700HX, NVIDIA GeForce RTX 4070 Laptop GPU | Razer Blade 15 OLED (Early 2022) Intel Core i9-12900H, NVIDIA GeForce RTX 3070 Ti Laptop GPU | MSI Katana 17 B13VFK Intel Core i7-13620H, NVIDIA GeForce RTX 4060 Laptop GPU | Asus ROG Strix G17 G713PI AMD Ryzen 9 7945HX, NVIDIA GeForce RTX 4070 Laptop GPU | Acer Predator Helios 300 (i7-12700H, RTX 3070 Ti) Intel Core i7-12700H, NVIDIA GeForce RTX 3070 Ti Laptop GPU | |
|---|---|---|---|---|---|
| Heat | -18% | -10% | -8% | -6% | |
| Maximum Upper Side * (°C) | 42 | 49.5 -18% | 41.6 1% | 42 -0% | 35 17% |
| Maximum Bottom * (°C) | 51 | 47.5 7% | 43.1 15% | 41 20% | 53 -4% |
| Idle Upper Side * (°C) | 27 | 33.4 -24% | 32 -19% | 33 -22% | 29 -7% |
| Idle Bottom * (°C) | 26 | 35 -35% | 35.8 -38% | 34 -31% | 34 -31% |
* ... smaller is better
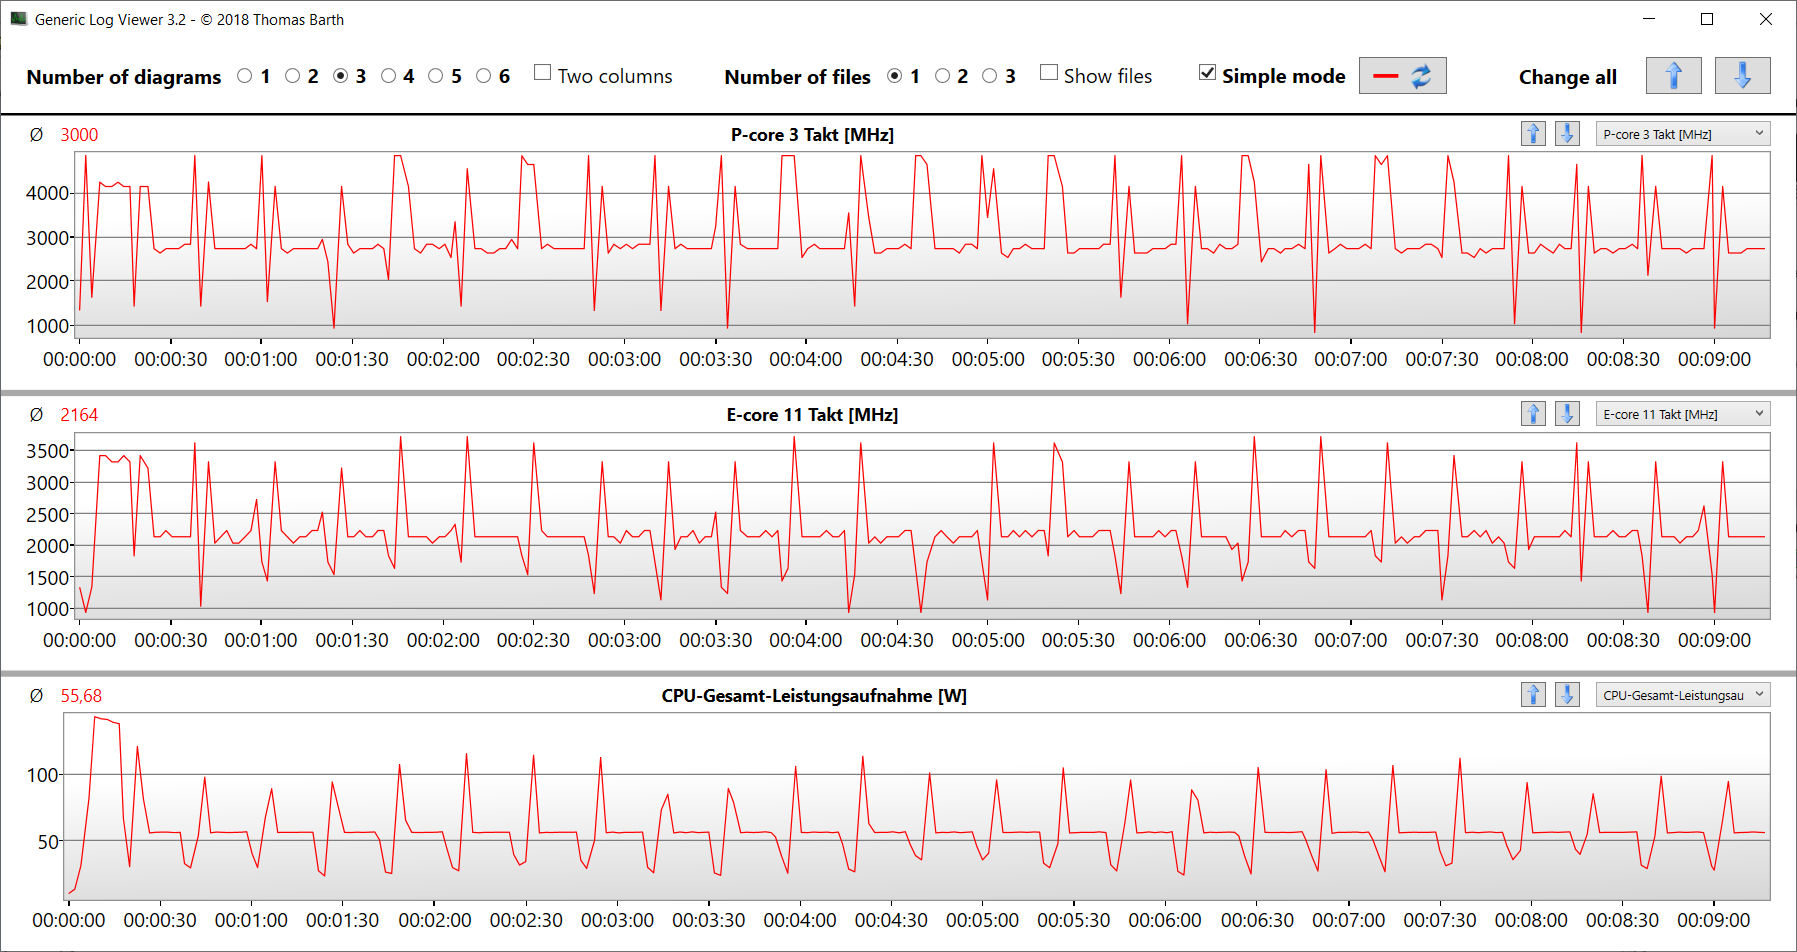
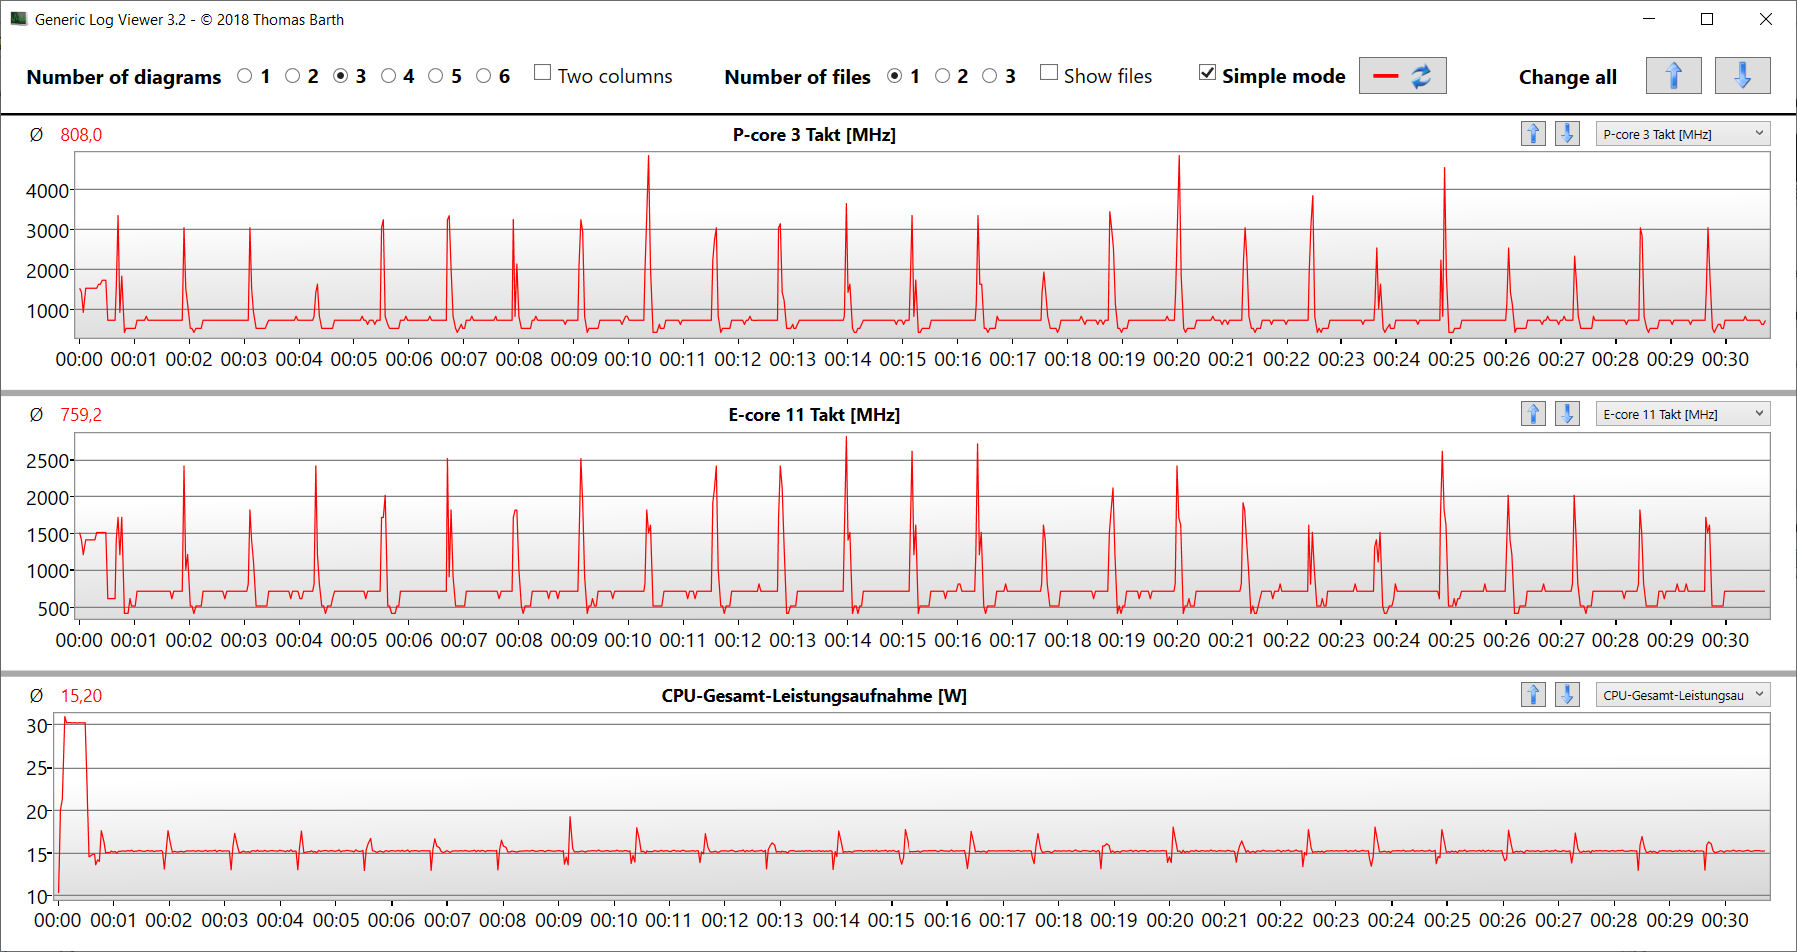
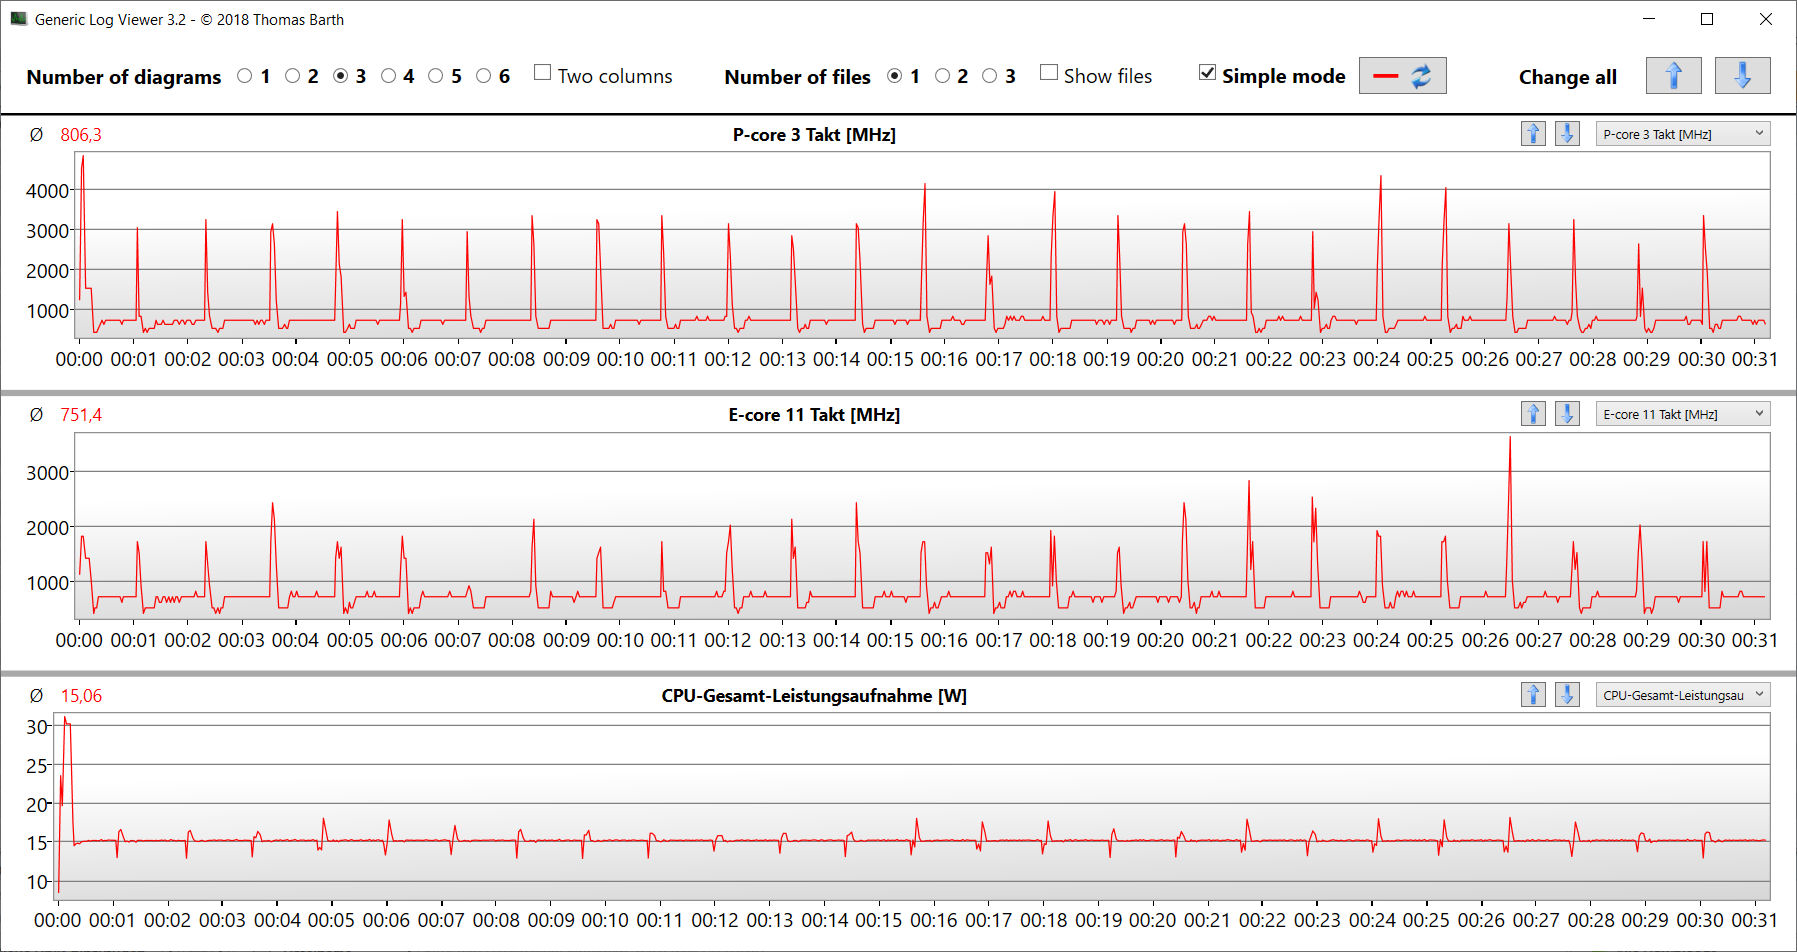
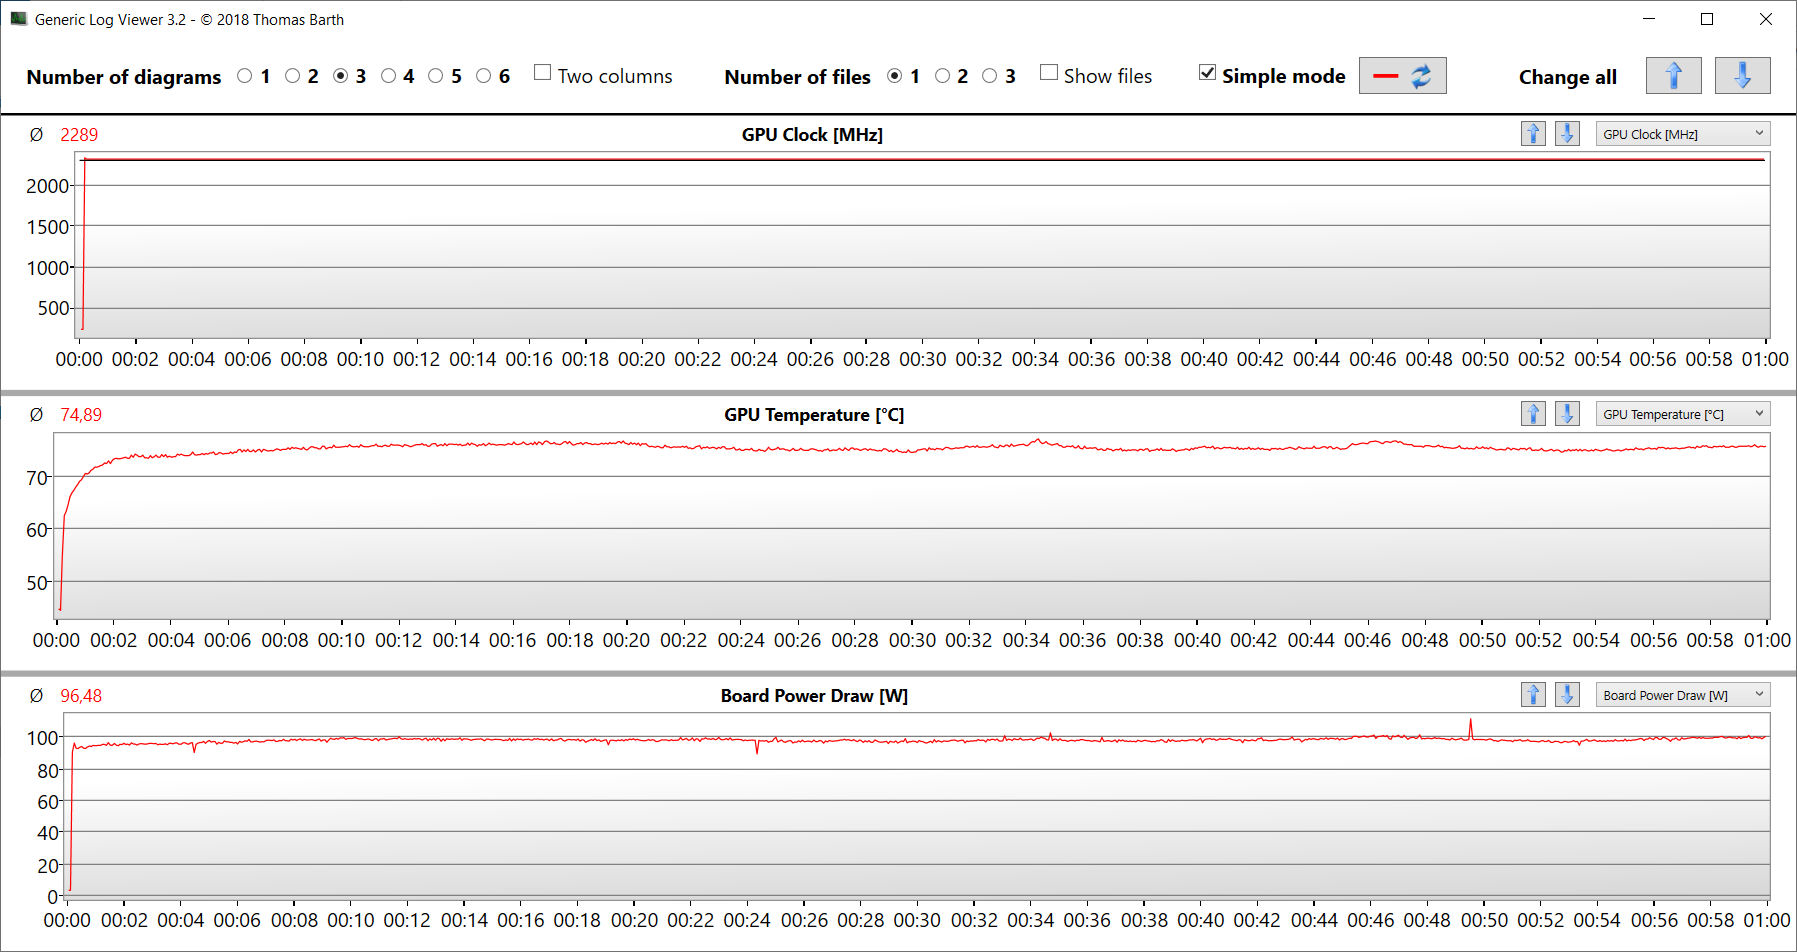
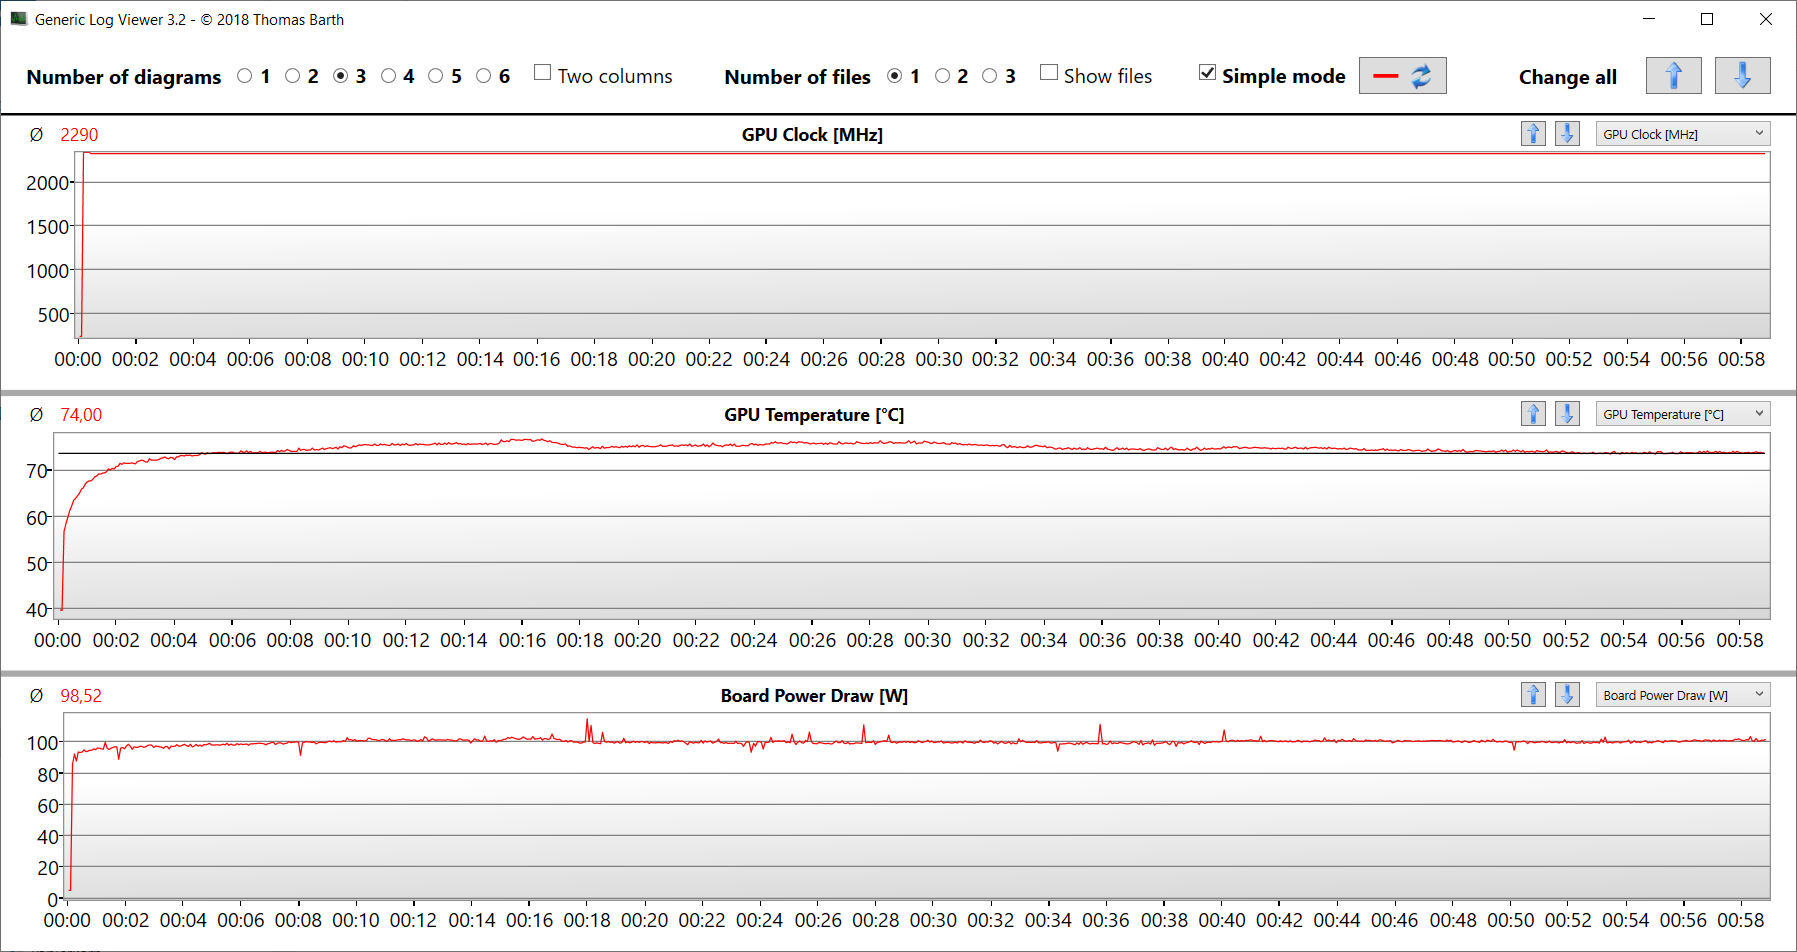
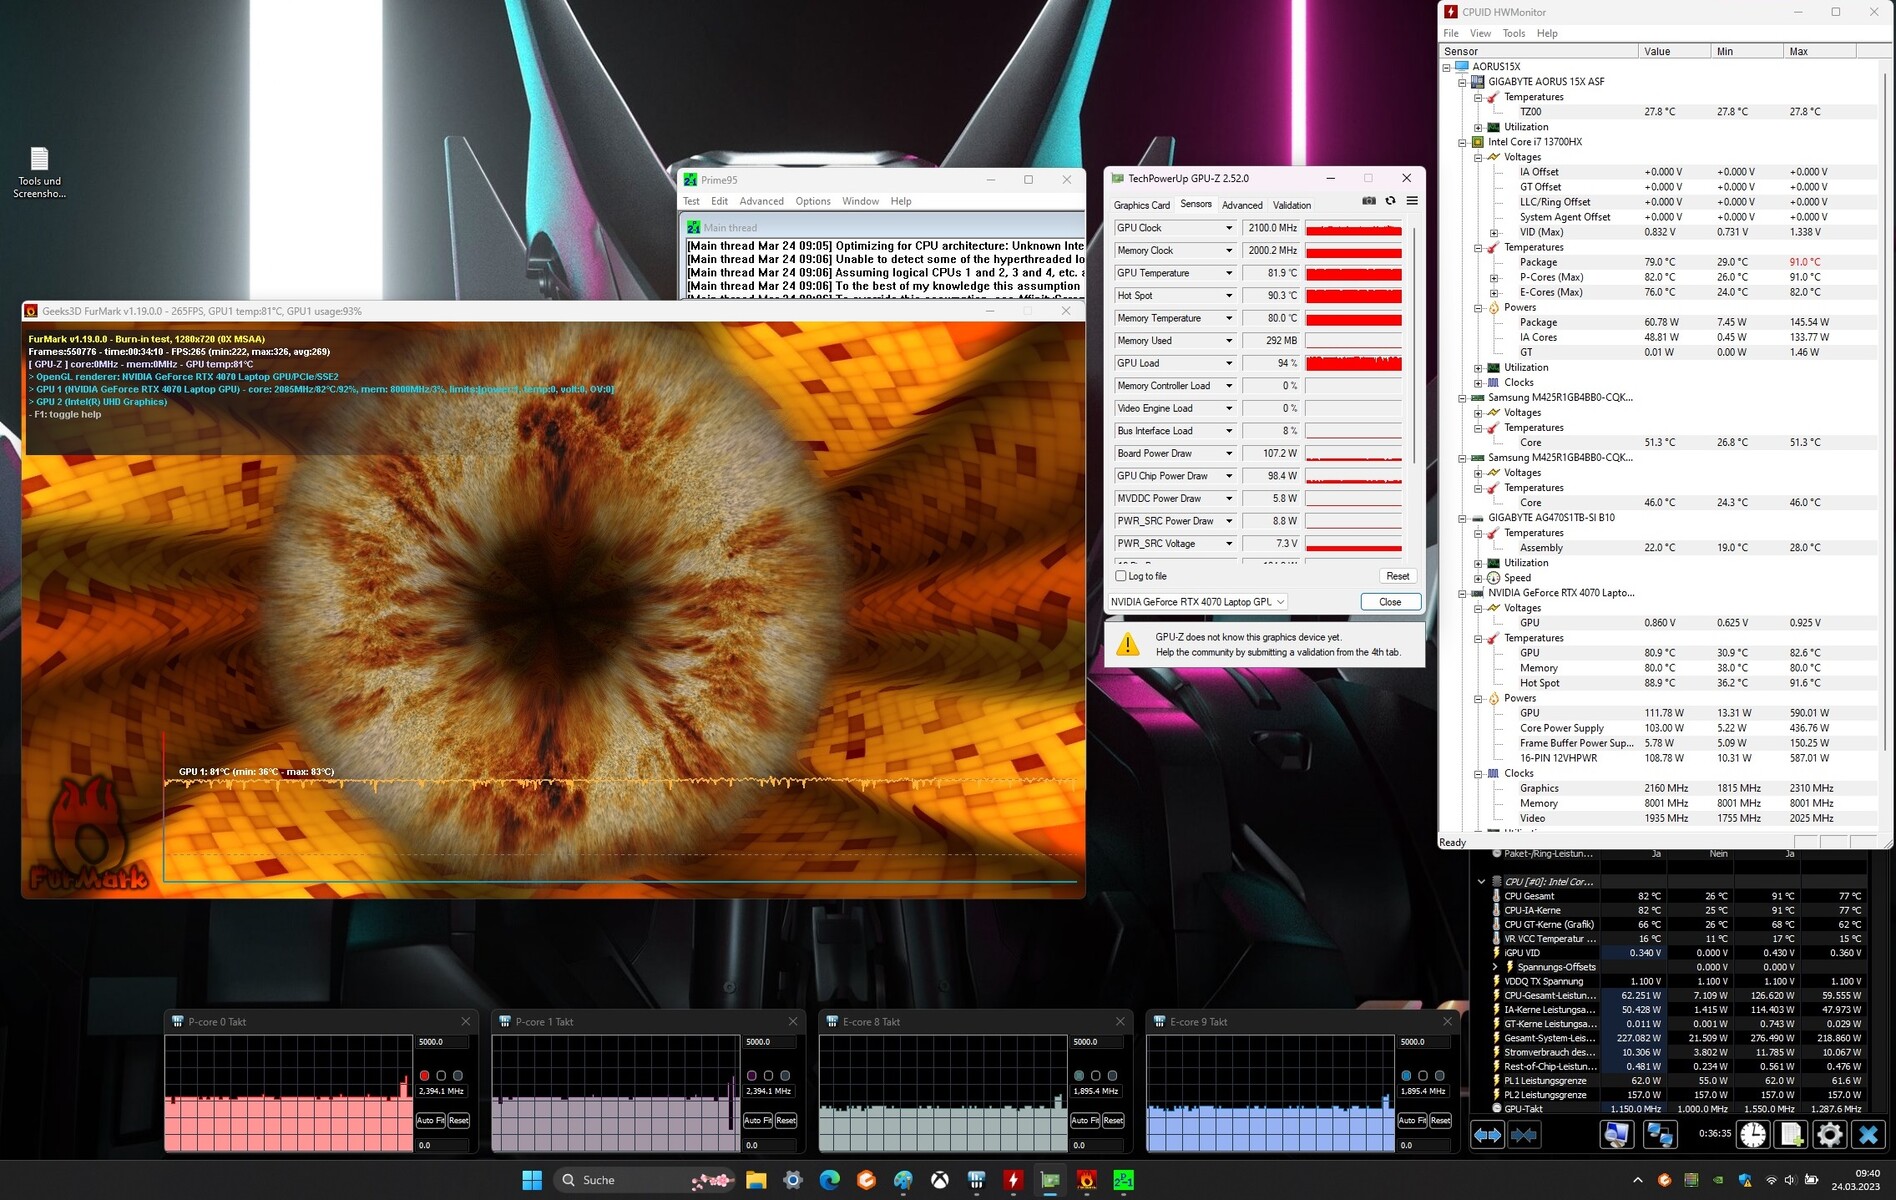
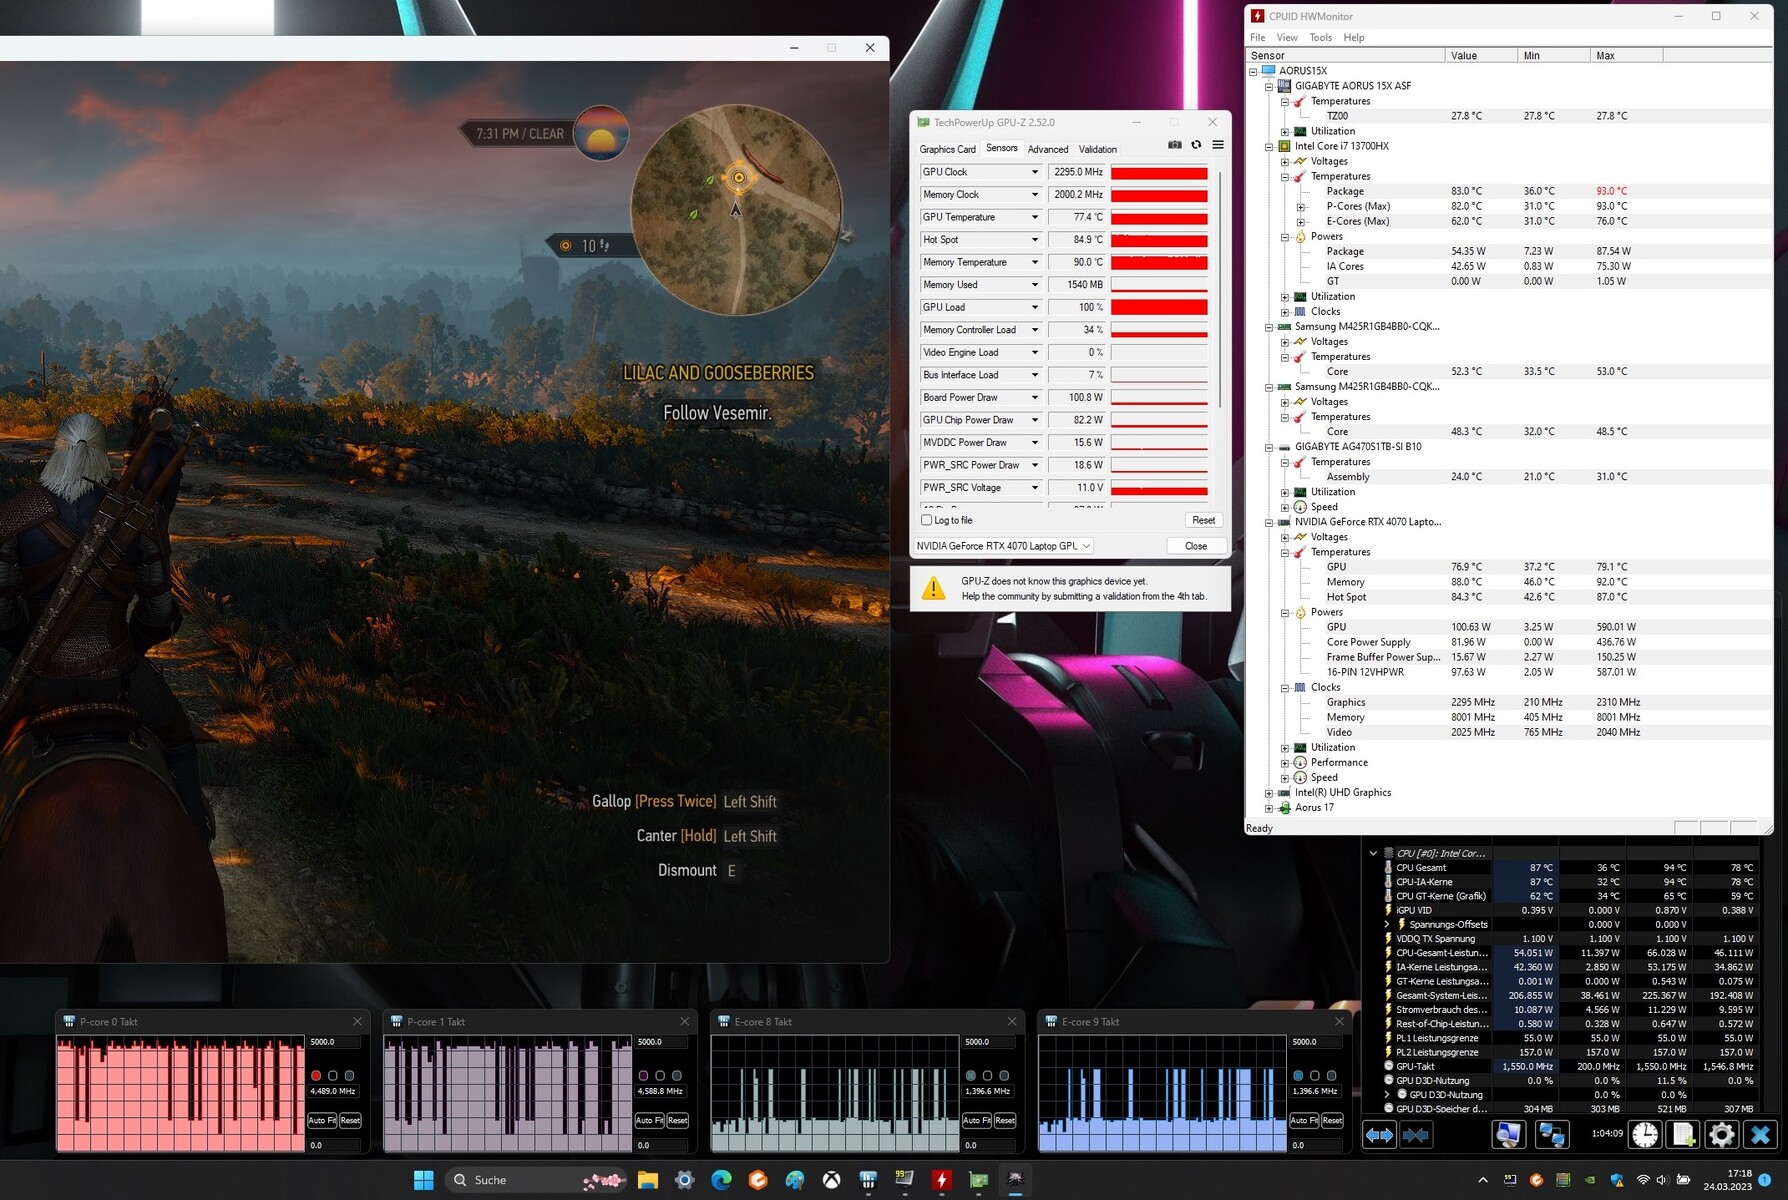
压力测试
压力测试(Prime95和Furmark连续使用)模拟了一种极端情况,以检查系统在最大负荷下的稳定性。
CPU(P:2.7至2.8GHz,E:2.1至2.2GHz)以中等时钟速率开始测试。在很短的时间后,时钟速率下降到大约2至2.5GHz(P-cores)和1.8至1.9GHz(E-cores)。GPU的时钟速率从2.4GHz降到2.1GHz。
发言人
立体声扬声器能产生体面的声音,但几乎没有任何低音。建议使用耳机或外部扬声器以获得更好的声音体验。
Aorus 15X ASF audio analysis
(+) | speakers can play relatively loud (83 dB)
Bass 100 - 315 Hz
(-) | nearly no bass - on average 27.3% lower than median
(-) | bass is not linear (15.1% delta to prev. frequency)
Mids 400 - 2000 Hz
(±) | higher mids - on average 5.8% higher than median
(+) | mids are linear (4.8% delta to prev. frequency)
Highs 2 - 16 kHz
(+) | balanced highs - only 3.1% away from median
(+) | highs are linear (6.3% delta to prev. frequency)
Overall 100 - 16.000 Hz
(±) | linearity of overall sound is average (20.1% difference to median)
Compared to same class
» 71% of all tested devices in this class were better, 6% similar, 23% worse
» The best had a delta of 6%, average was 18%, worst was 132%
Compared to all devices tested
» 52% of all tested devices were better, 8% similar, 40% worse
» The best had a delta of 4%, average was 23%, worst was 134%
Asus ROG Strix G17 G713PI audio analysis
(±) | speaker loudness is average but good (81 dB)
Bass 100 - 315 Hz
(+) | good bass - only 4.6% away from median
(+) | bass is linear (6.5% delta to prev. frequency)
Mids 400 - 2000 Hz
(+) | balanced mids - only 3.1% away from median
(+) | mids are linear (5.9% delta to prev. frequency)
Highs 2 - 16 kHz
(+) | balanced highs - only 3.5% away from median
(+) | highs are linear (6.8% delta to prev. frequency)
Overall 100 - 16.000 Hz
(+) | overall sound is linear (9.5% difference to median)
Compared to same class
» 3% of all tested devices in this class were better, 1% similar, 95% worse
» The best had a delta of 6%, average was 18%, worst was 132%
Compared to all devices tested
» 4% of all tested devices were better, 1% similar, 95% worse
» The best had a delta of 4%, average was 23%, worst was 134%
能源管理--Aorus电脑并不缺乏耐力
消耗功率
在能源消耗方面,技嘉笔记本电脑没有显示任何异常情况。对于所安装的硬件来说,这些比率处于正常水平。测试 Witcher 3测试和压力测试是在相对稳定的功耗下进行的。电源连接器(280瓦)的尺寸足够大。
| Off / Standby | |
| Idle | |
| Load |
|
Key:
min: | |
| Aorus 15X ASF i7-13700HX, GeForce RTX 4070 Laptop GPU | Razer Blade 15 OLED (Early 2022) i9-12900H, GeForce RTX 3070 Ti Laptop GPU | MSI Katana 17 B13VFK i7-13620H, GeForce RTX 4060 Laptop GPU | Asus ROG Strix G17 G713PI R9 7945HX, GeForce RTX 4070 Laptop GPU | Acer Predator Helios 300 (i7-12700H, RTX 3070 Ti) i7-12700H, GeForce RTX 3070 Ti Laptop GPU | Average NVIDIA GeForce RTX 4070 Laptop GPU | Average of class Gaming | |
|---|---|---|---|---|---|---|---|
| Power Consumption | -57% | 15% | -14% | -19% | -2% | -8% | |
| Idle Minimum * (Watt) | 11 | 31.6 -187% | 12.2 -11% | 15 -36% | 15 -36% | 13.2 ? -20% | 13 ? -18% |
| Idle Average * (Watt) | 16 | 33.3 -108% | 14.9 7% | 20 -25% | 20 -25% | 18.2 ? -14% | 19 ? -19% |
| Idle Maximum * (Watt) | 24 | 38.6 -61% | 15.8 34% | 29 -21% | 22.3 7% | 24.6 ? -3% | 24.6 ? -3% |
| Load Average * (Watt) | 104 | 149 -43% | 85.22 18% | 121 -16% | 133 -28% | 97 ? 7% | 110.7 ? -6% |
| Witcher 3 ultra * (Watt) | 185.4 | 149.6 19% | 151.1 19% | 179.8 3% | 231 -25% | ||
| Load Maximum * (Watt) | 272 | 160 41% | 212.8 22% | 246 10% | 290 -7% | 221 ? 19% | 259 ? 5% |
* ... smaller is better
Power consumption Witcher 3 / stress test
Power consumption with external monitor
运行时间
这款15.6英寸的设备在WLAN测试(通过脚本调用网站)和视频测试(循环播放短片Big Buck Bunny(H.264编码,FHD))中分别达到了8:09小时和7:52小时的运行时间。在这两项测试中,笔记本的节能功能被禁用,显示亮度被设置为大约150cd/m²。在视频测试中,无线模块也被禁用。
Aorus 15总体上提供了良好的电池运行时间--不仅仅是对于游戏笔记本。考虑到巨大的电池容量(99Wh),这些比率并不令人惊讶。尽管如此,技嘉的笔记本电脑在瓦特小时方面也是领先的。
| Aorus 15X ASF i7-13700HX, GeForce RTX 4070 Laptop GPU, 99 Wh | Razer Blade 15 OLED (Early 2022) i9-12900H, GeForce RTX 3070 Ti Laptop GPU, 80 Wh | MSI Katana 17 B13VFK i7-13620H, GeForce RTX 4060 Laptop GPU, 53.5 Wh | Asus ROG Strix G17 G713PI R9 7945HX, GeForce RTX 4070 Laptop GPU, 90 Wh | Acer Predator Helios 300 (i7-12700H, RTX 3070 Ti) i7-12700H, GeForce RTX 3070 Ti Laptop GPU, 90 Wh | Average of class Gaming | |
|---|---|---|---|---|---|---|
| Battery runtime | -26% | -58% | -54% | -21% | -15% | |
| Reader / Idle (h) | 11.3 | 6.7 -41% | 8.27 ? -27% | |||
| H.264 (h) | 7.9 | 5.9 -25% | 2.8 -65% | 5.9 -25% | 8.32 ? 5% | |
| WiFi v1.3 (h) | 8.2 | 4.6 -44% | 2.9 -65% | 4.3 -48% | 6 -27% | 7.11 ? -13% |
| Load (h) | 2 | 2.1 5% | 1 -50% | 1 -50% | 1.8 -10% | 1.502 ? -25% |
| Witcher 3 ultra (h) | 1.1 |
Pros
Cons
结论 - 一个全面的游戏笔记本电脑
虽然Aorus 15X是为高至最高设置的QHD游戏而设计的,但它在其他要求高的领域,如视频编辑和渲染方面也表现良好。该酷睿i7-13700HX和GeForce RTX 4070笔记本电脑提供必要的处理能力。一个超快的PCIe-4-SSD(1TB)确保了短的加载时间。
强大的,持久的,需要时安静的--Aorus 15X ASF可以满足对现代游戏笔记本电脑的许多要求。
CPU和GPU以持续的高时钟率工作。噪音和热量发展处于通常的高水平。然而,安静到完全无声的操作是可能的--处理能力大大降低。尽管如此,这仍然可以满足用户的日常使用需求,并允许在降低设置的情况下进行游戏。
哑光的QHD屏幕(15.6英寸,IPS,240赫兹)不需要被批评。一个Thunderbolt 4端口开辟了扩展选项(对接方案、外部GPU)。它还可以通过USB-C电源适配器(最低65瓦)为笔记本电脑供电--支持Power Delivery。电池运行时间约为8小时,完善了整体包装。
这款Razer Blade 15 OLED可以证明是该设备的一个可行的替代品。它提供的处理能力低于Aorus笔记本电脑,但由于其更紧凑的尺寸、更低的重量和高对比度的真彩OLED屏幕而获得了额外的分数。
价格和可用性
Aorus 15X ASF可以在亚马逊上以2,099美元的价格购买我们测试的设置。
Aorus 15X ASF
- 04/05/2023 v7 (old)
Sascha Mölck
Transparency
The selection of devices to be reviewed is made by our editorial team. The test sample was provided to the author as a loan by the manufacturer or retailer for the purpose of this review. The lender had no influence on this review, nor did the manufacturer receive a copy of this review before publication. There was no obligation to publish this review. As an independent media company, Notebookcheck is not subjected to the authority of manufacturers, retailers or publishers.
This is how Notebookcheck is testing
Every year, Notebookcheck independently reviews hundreds of laptops and smartphones using standardized procedures to ensure that all results are comparable. We have continuously developed our test methods for around 20 years and set industry standards in the process. In our test labs, high-quality measuring equipment is utilized by experienced technicians and editors. These tests involve a multi-stage validation process. Our complex rating system is based on hundreds of well-founded measurements and benchmarks, which maintains objectivity. Further information on our test methods can be found here.
Price comparison

