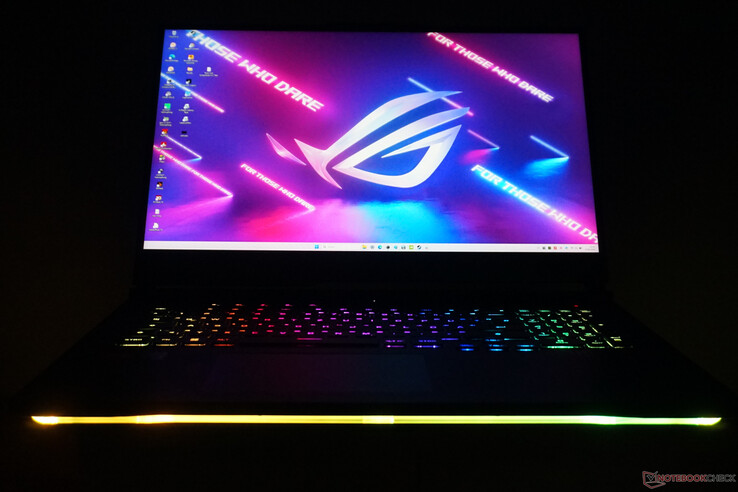
华硕ROG Strix G17 G713PI。游戏笔记本在新Ryzen 9的测试中给人留下深刻印象
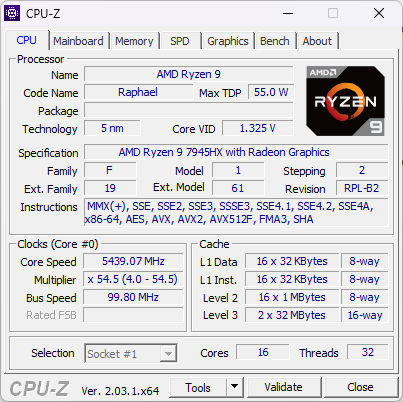
通过ROG Strix G17,华硕推出了一款游戏笔记本电脑,它的处理器应该会给人留下深刻印象。事实上,16个核心,32个线程,一个巨大的64MB L3缓存,以及Zen4架构的AMD Ryzen 9 7945HX至少听起来令人印象深刻。事实证明,这不仅适用于技术规格表,而且该CPU在我们的基准测试中也做得相当出色。
你还可以在RTX 4000系列的三个较小的移动图形芯片中进行选择,这都确保为本来简单的17英寸显示屏的240赫兹提供足够数量的帧。他们还将价格控制在可接受的范围内,ROG Strix的起价为2,000欧元(约合2,123美元)。除了令人信服的游戏性能和有价值的视觉效果外,还有一些较小的节省,不会破坏整体印象,对游戏性能的阻碍最多只有很小。
我们的G713PI-LL005W测试配置有32GB内存,NvidiaGeForce RTX 4070和1TB M.2 SSD,与稍大的 华硕ROG Strix G18和Razer Blade 18竞争,它们也配备了相同的 NvidiaGeForce RTX 4070和英特尔处理器。与上一代显卡的比较也应该是有趣的。我们的基准测试应该显示它能够在多大程度上超越配备了令人印象深刻的 华硕ROG Strix Scar 17 SE与RTX 3080 Ti或装备RTX 3080 Ti的华硕ROG Strix Scar 17 SE或Alienware m17 R5配有 AMD Radeon RX 6850M XT.
潜在的竞争对手比较
Rating | Date | Model | Weight | Height | Size | Resolution | Price |
|---|---|---|---|---|---|---|---|
| 88.4 % v7 (old) | 04 / 2023 | Asus ROG Strix G17 G713PI R9 7945HX, GeForce RTX 4070 Laptop GPU | 2.8 kg | 30.7 mm | 17.30" | 2560x1440 | |
| 87.4 % v7 (old) | 03 / 2023 | Asus ROG Strix G18 G814JI i7-13650HX, GeForce RTX 4070 Laptop GPU | 3 kg | 31 mm | 18.00" | 2560x1600 | |
| 91.4 % v7 (old) | 02 / 2023 | Razer Blade 18 RTX 4070 i9-13950HX, GeForce RTX 4070 Laptop GPU | 3 kg | 21.9 mm | 18.00" | 2560x1600 | |
| 86.9 % v7 (old) | 11 / 2022 | Asus ROG Strix Scar 17 SE G733CX-LL014W i9-12950HX, GeForce RTX 3080 Ti Laptop GPU | 2.9 kg | 28.3 mm | 17.30" | 2560x1440 | |
| 88 % v7 (old) | 04 / 2023 | Asus Zephyrus Duo 16 GX650PY-NM006W R9 7945HX, GeForce RTX 4090 Laptop GPU | 2.7 kg | 29.7 mm | 16.00" | 2560x1600 | |
| 86.1 % v7 (old) | 01 / 2023 | Alienware m17 R5 (R9 6900HX, RX 6850M XT) R9 6900HX, Radeon RX 6850M XT | 3.4 kg | 26.7 mm | 17.00" | 3840x2160 | |
| 88.4 % v7 (old) | 03 / 2023 | Asus ROG Strix G16 G614JZ i9-13980HX, GeForce RTX 4080 Laptop GPU | 2.4 kg | 30.4 mm | 16.00" | 2560x1600 |
机箱 - 坚固耐用的ROG Strix
这款游戏笔记本的巨大外壳显示出了出色的稳定性。尽管它的重量接近3公斤(约6.6磅),但我们无法检测到任何翘曲,尽管整个基本单元完全由塑料制成。相比之下,17.3英寸的大型显示屏被置于金属盖子中。整体结构显得相应地坚固,没有任何抱怨的理由。
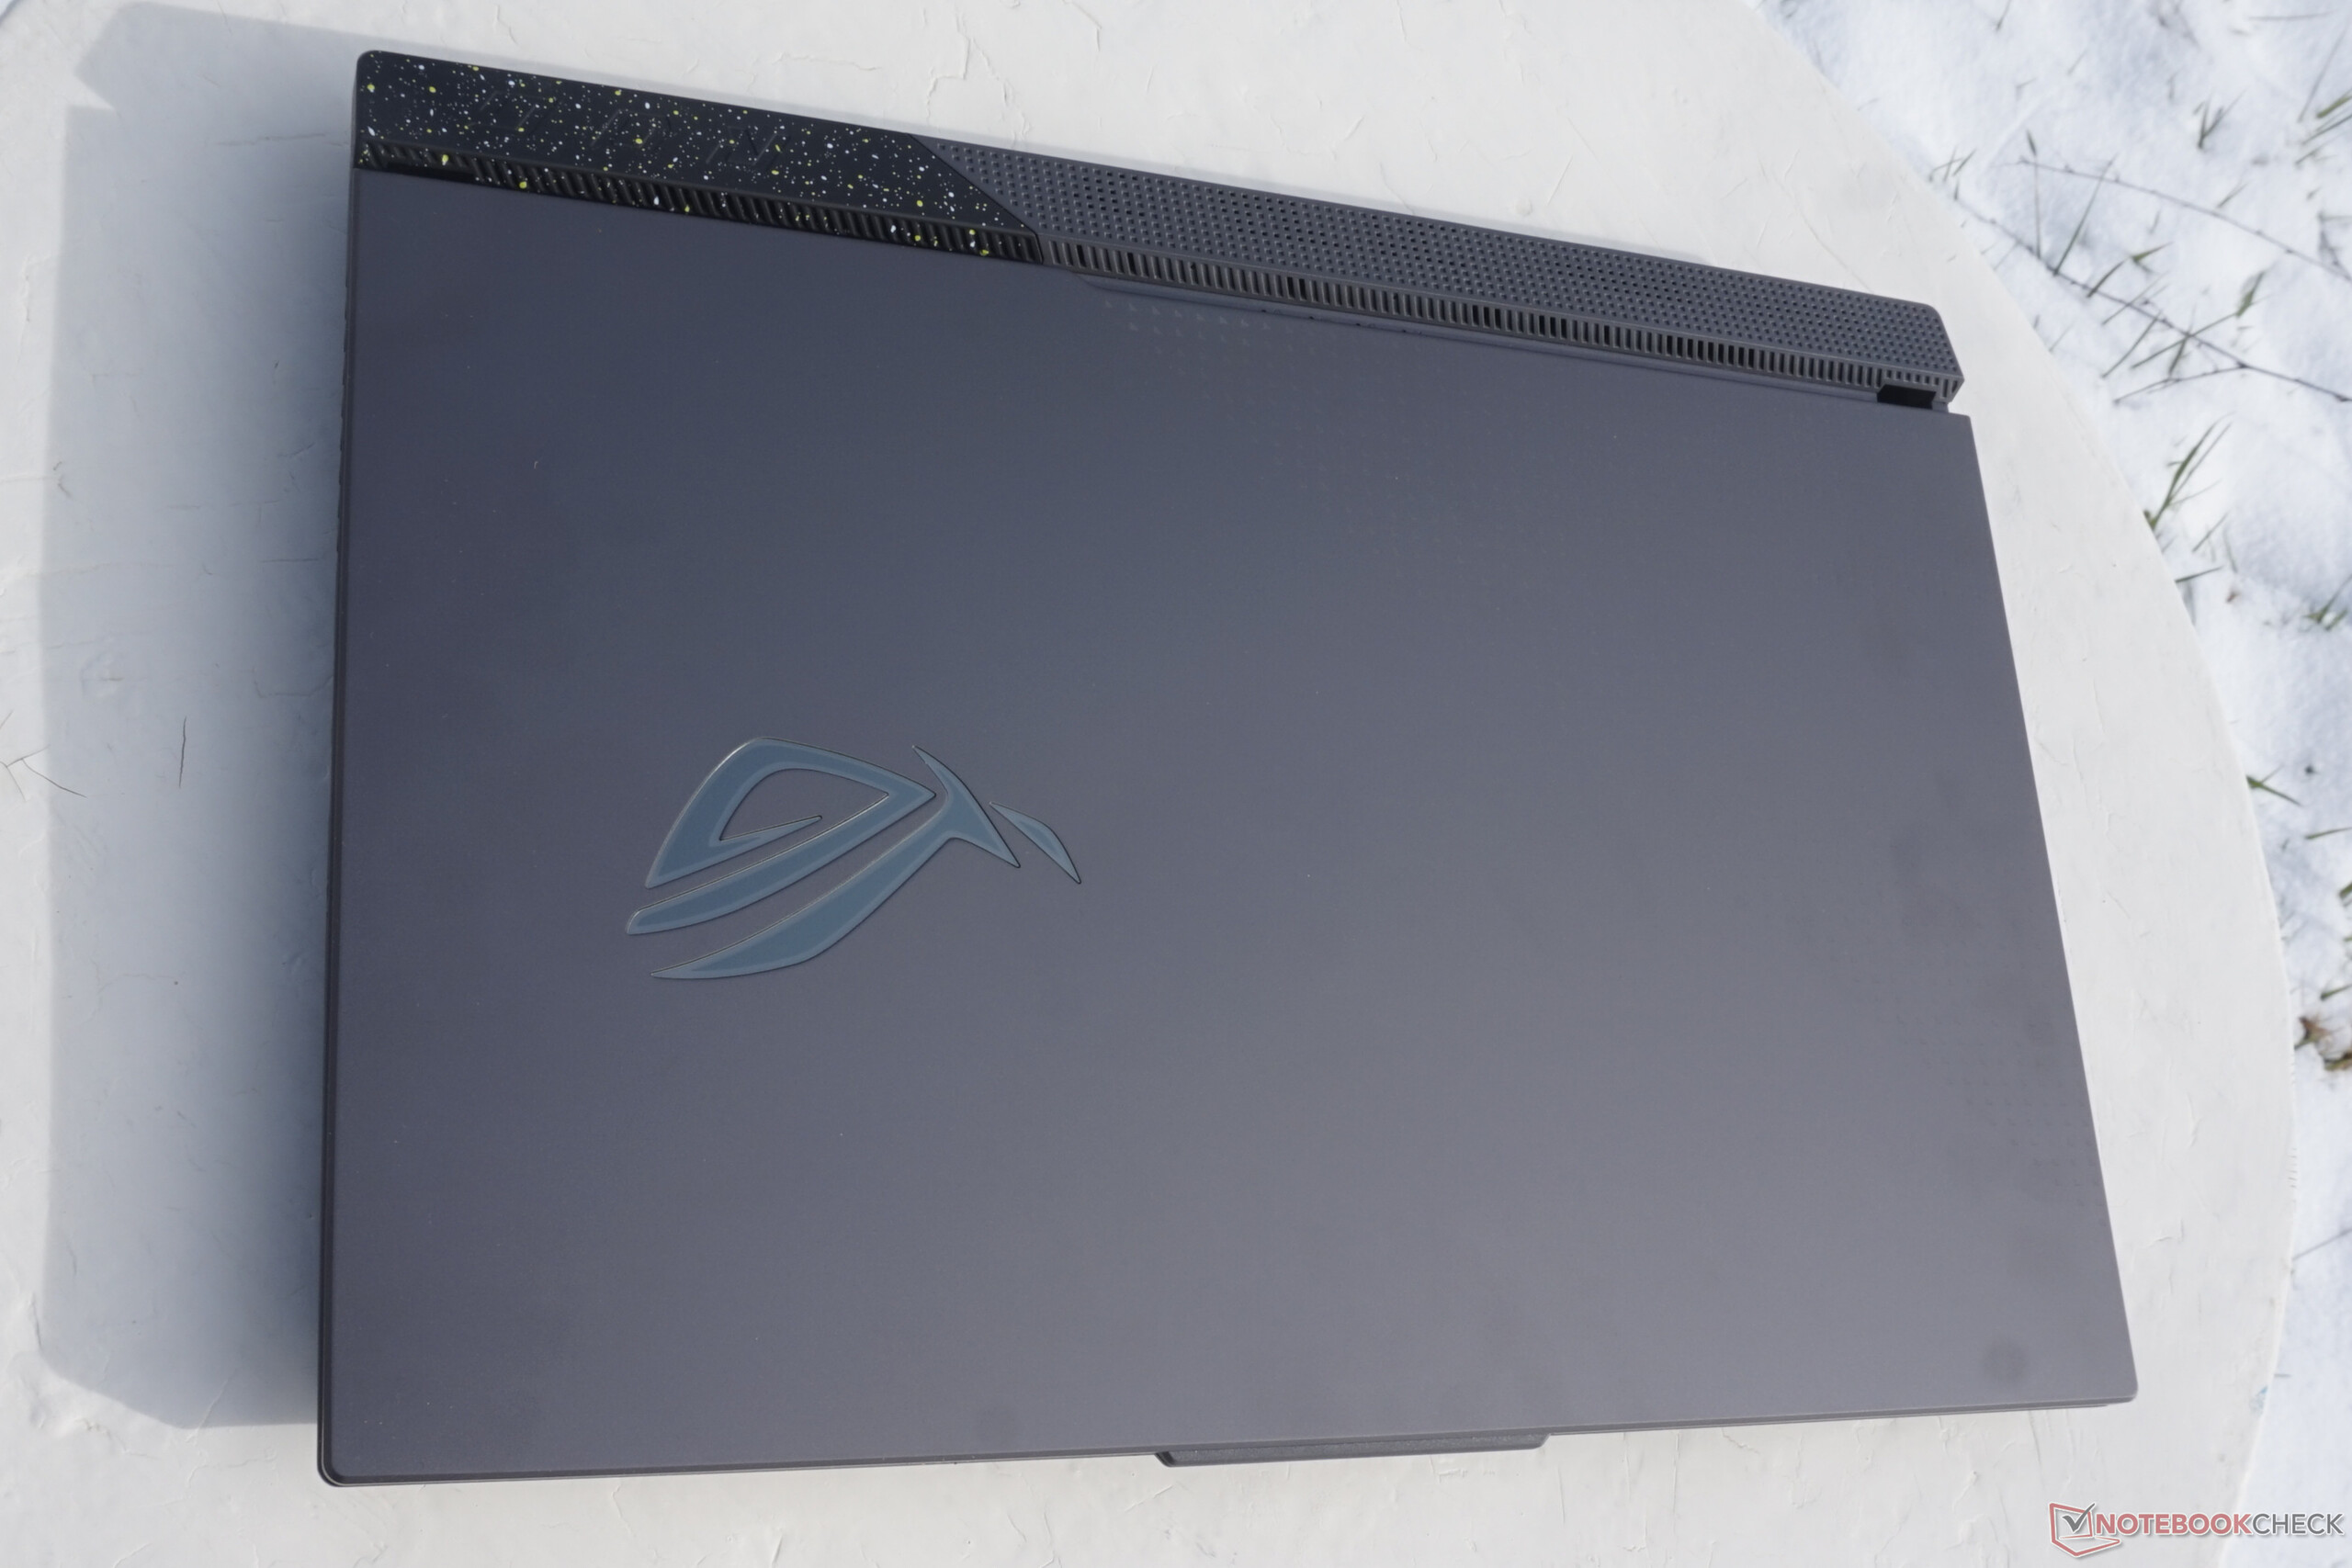
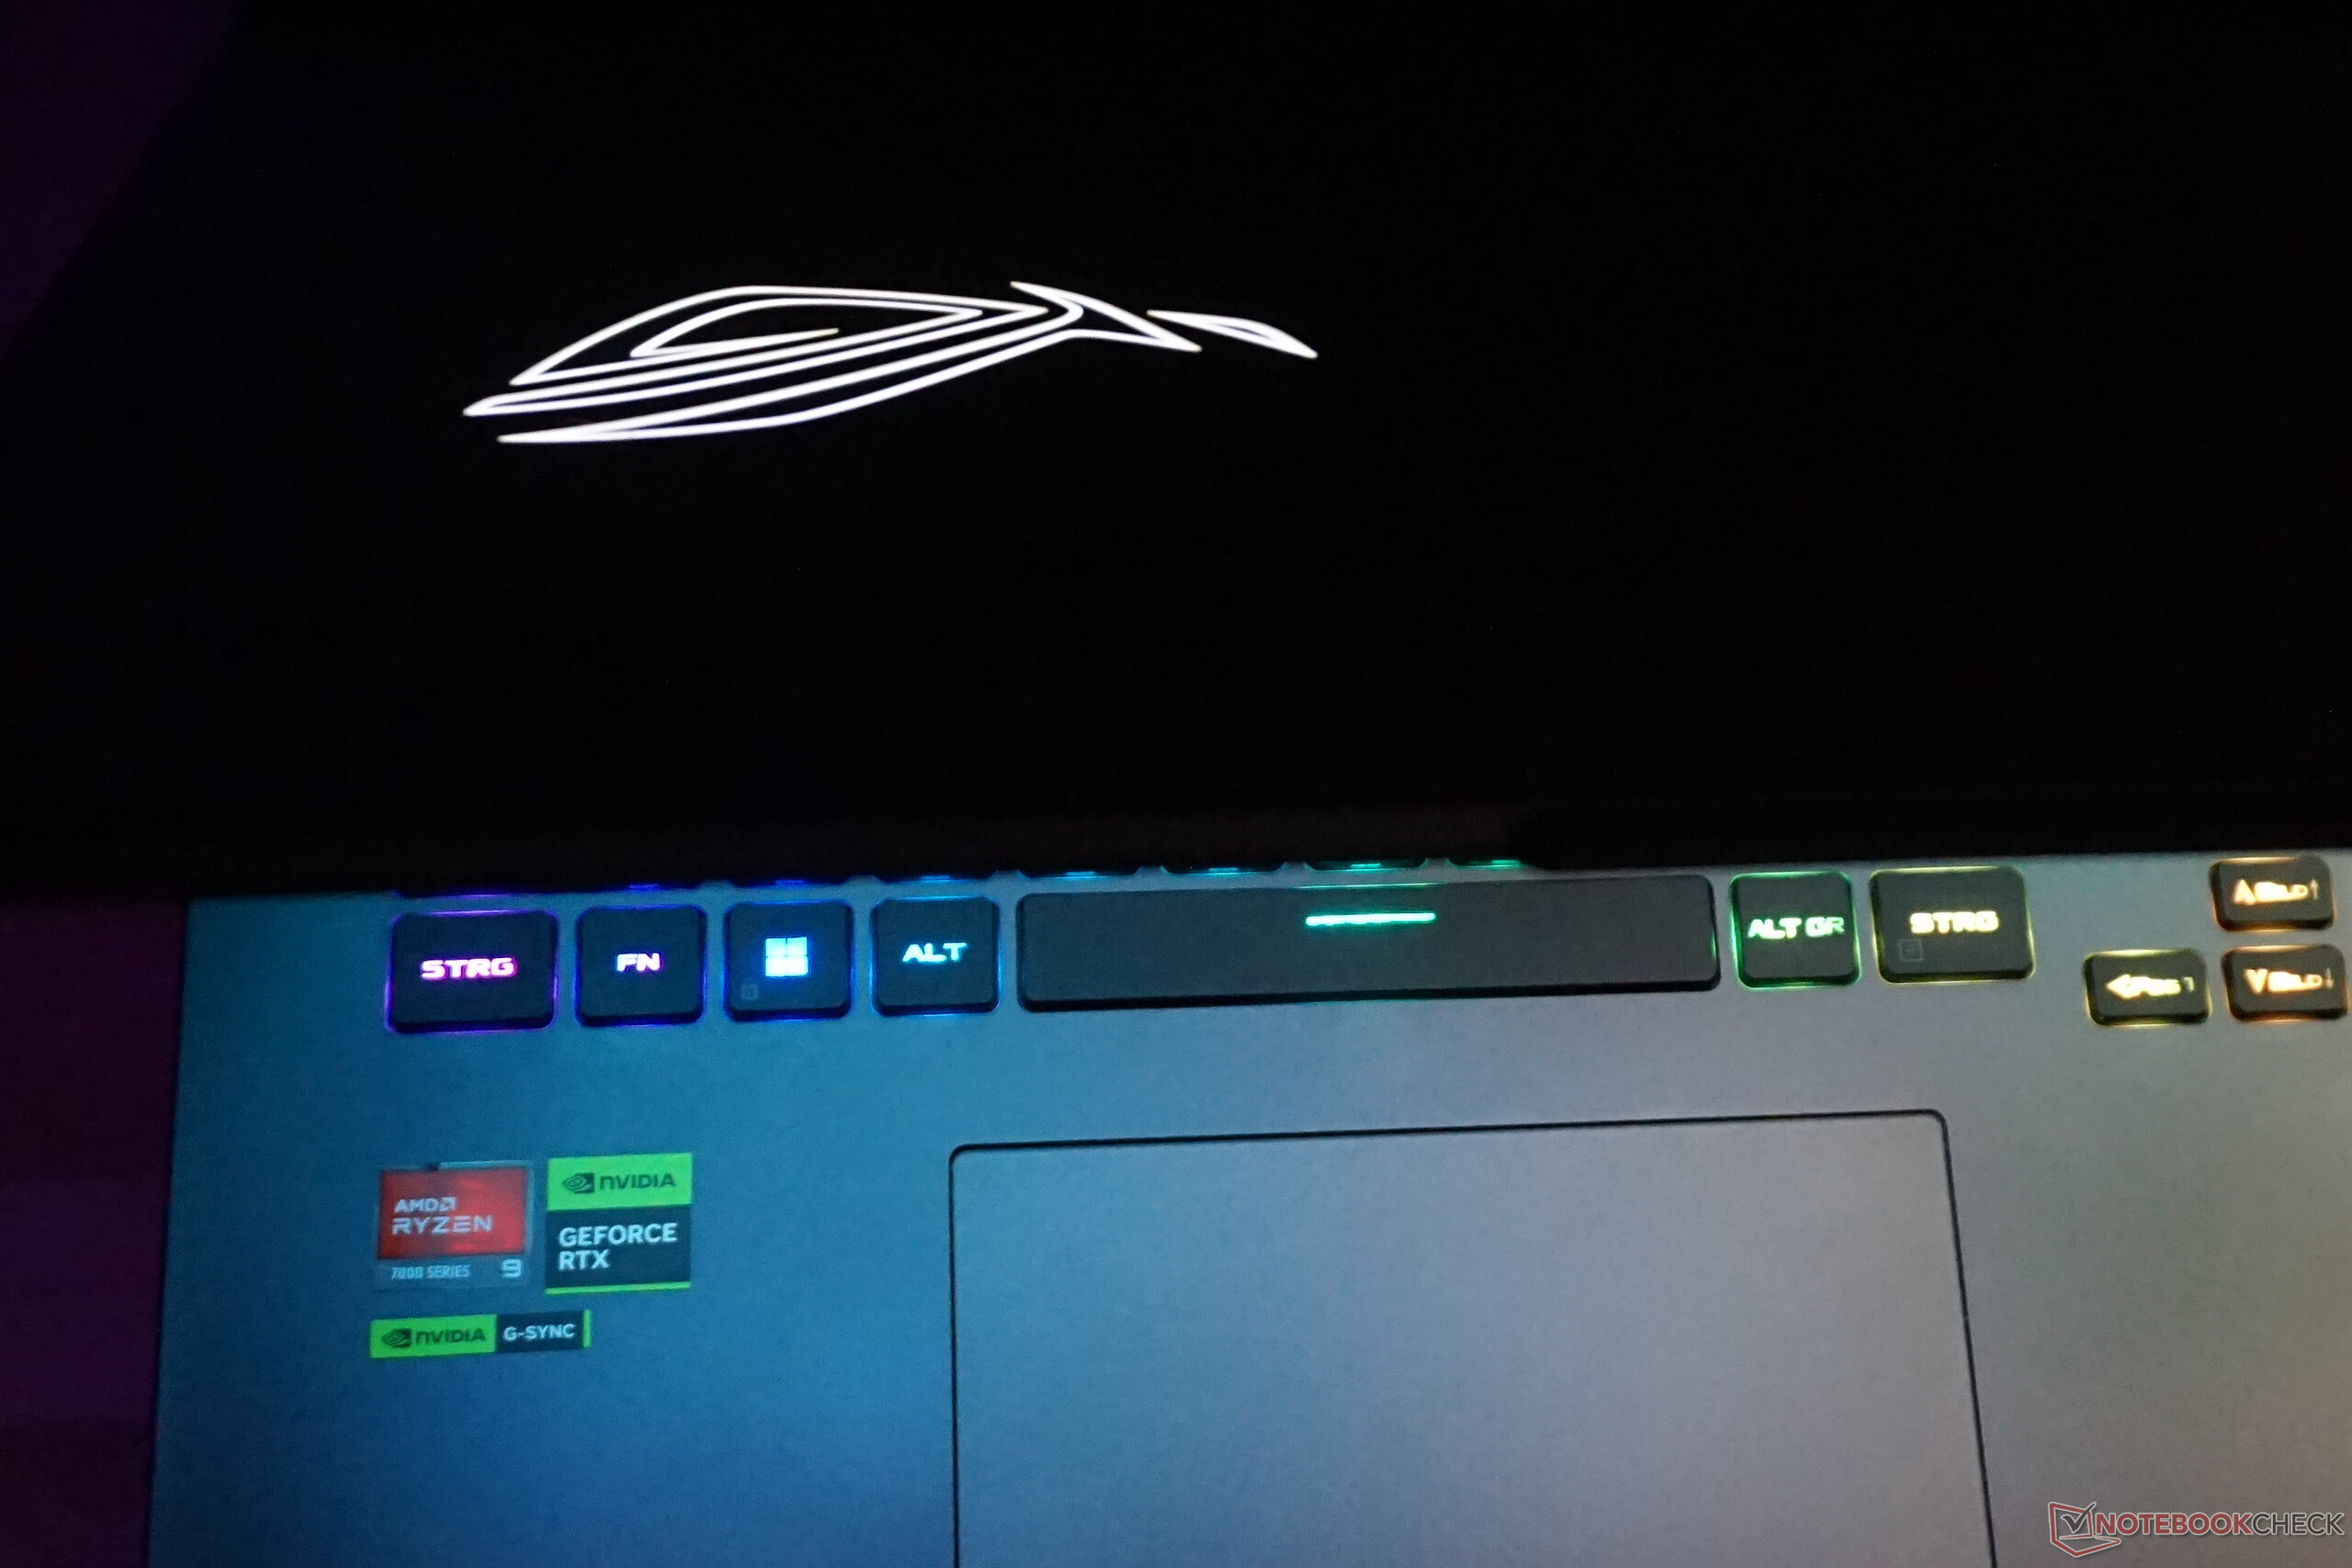
许多大大小小的点缀元素都很突出。盖子上有一个明亮的标志,始终保持白色的照明。底部还有一个可自由配置的RGB条,可以与RGB键盘一起或独立于RGB键盘进行照明。此外,机箱周围还有一些字母和标语。
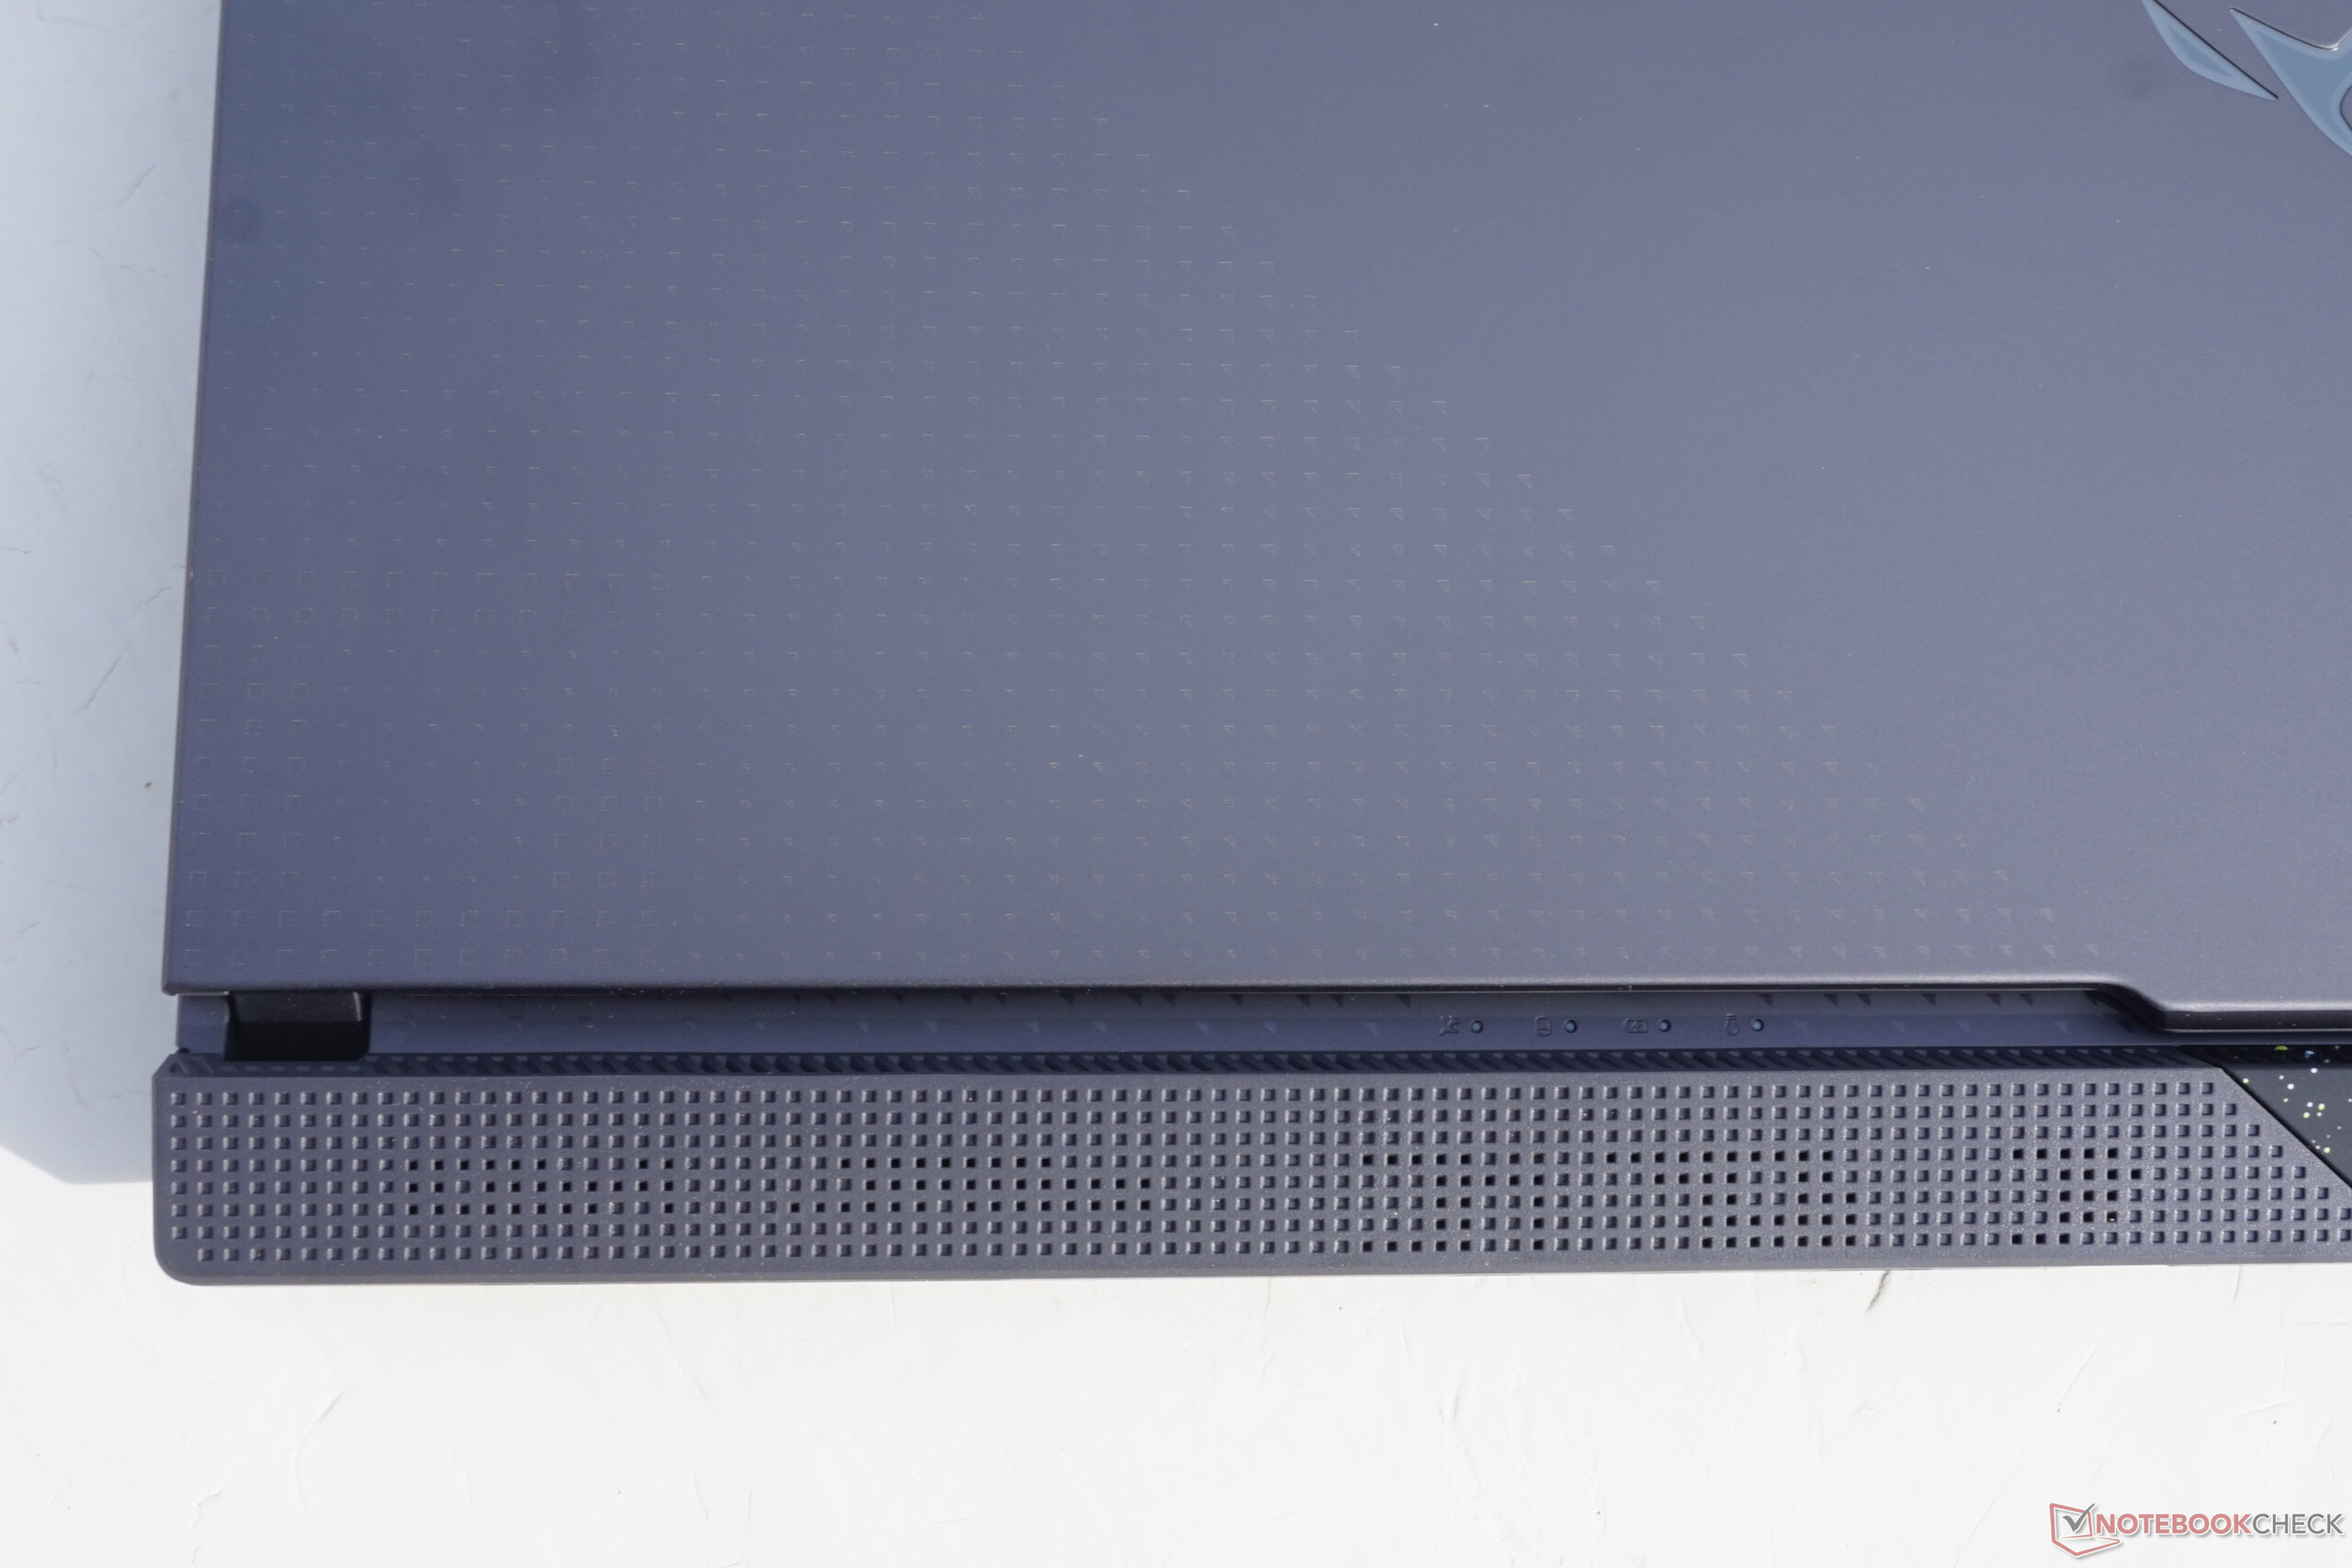
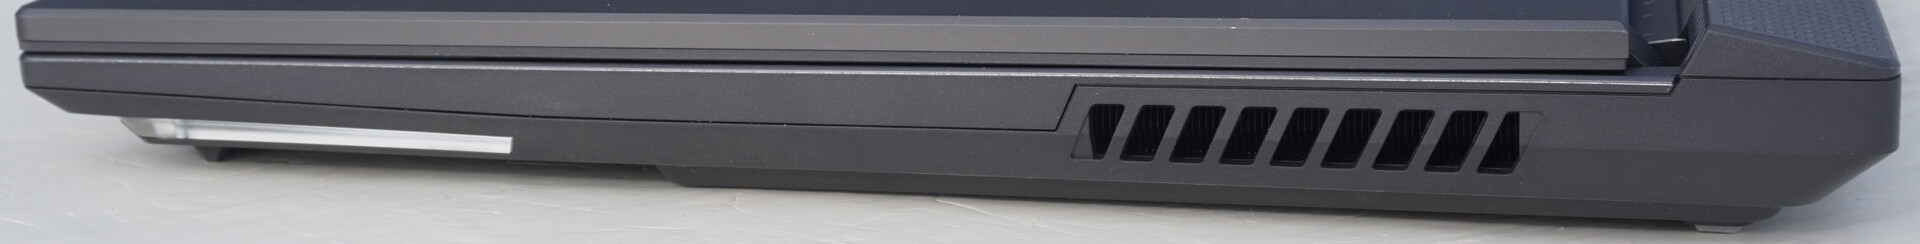
显示器与机箱背面的风扇通风口之间的距离很大,显得很有想法。当机箱关闭时,所有的状态LED灯仍然可见,风扇继续工作,没有任何阻碍,而你可以继续使用外部显示器和桌面键盘玩你的游戏。
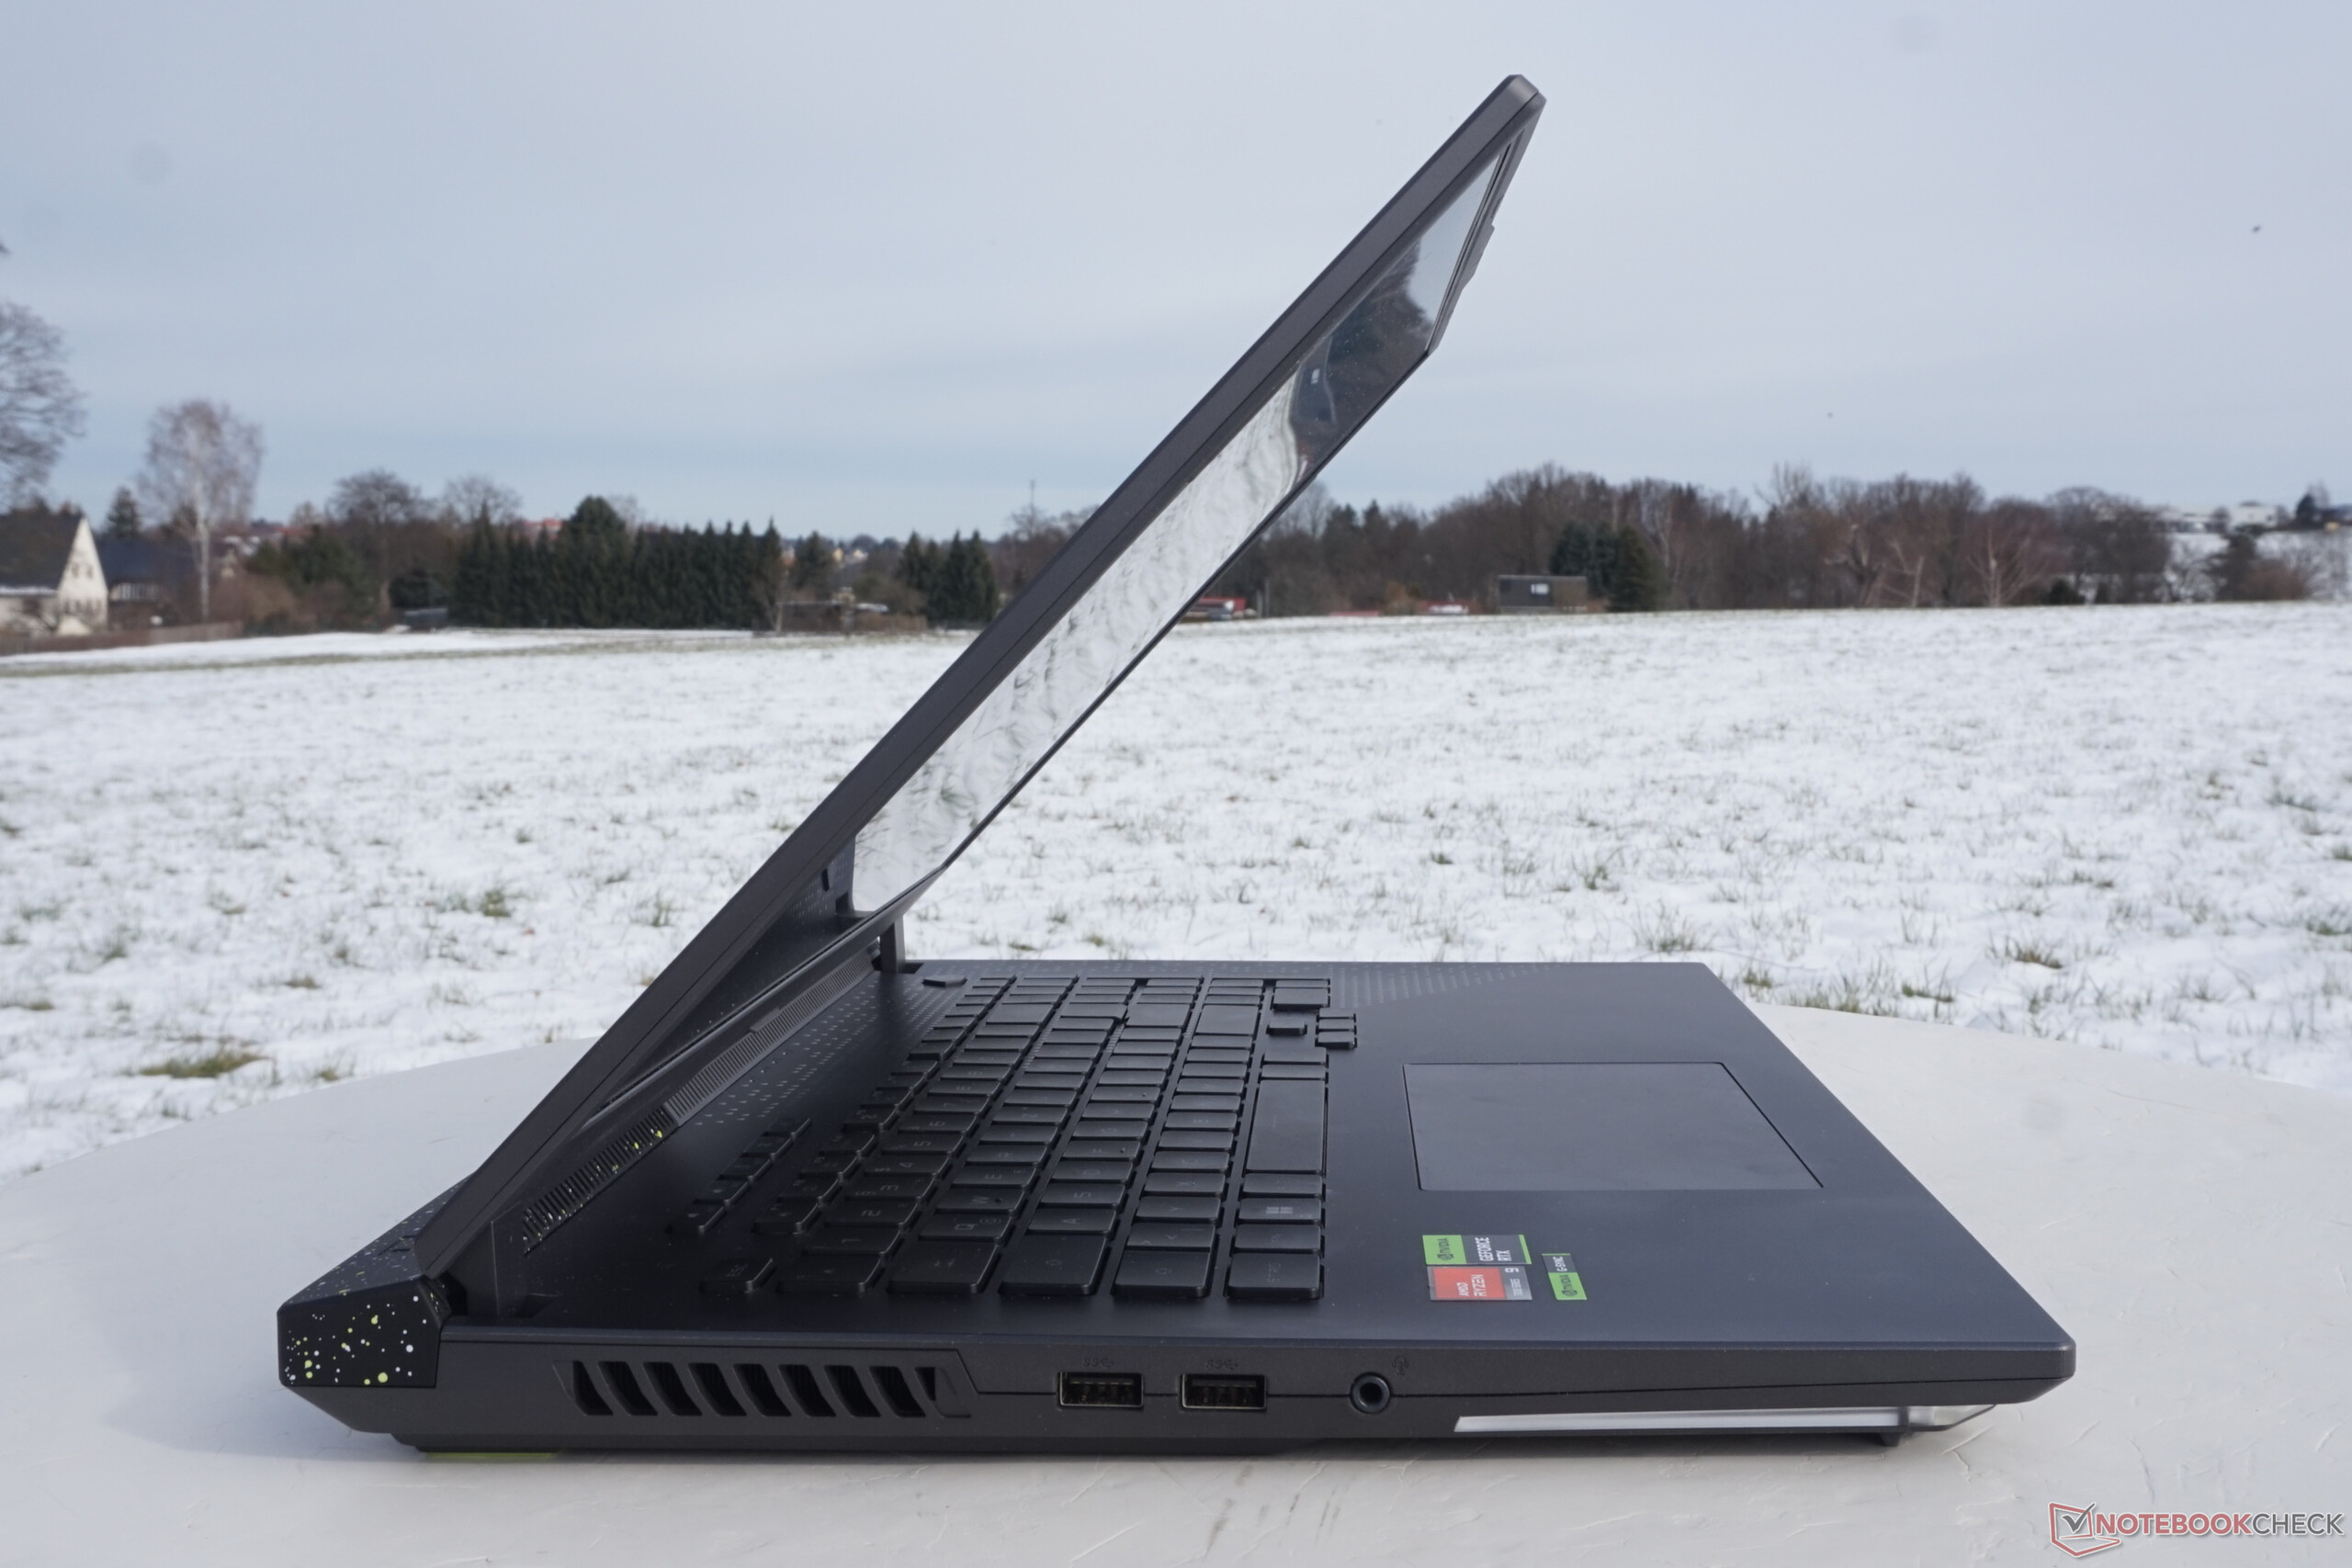
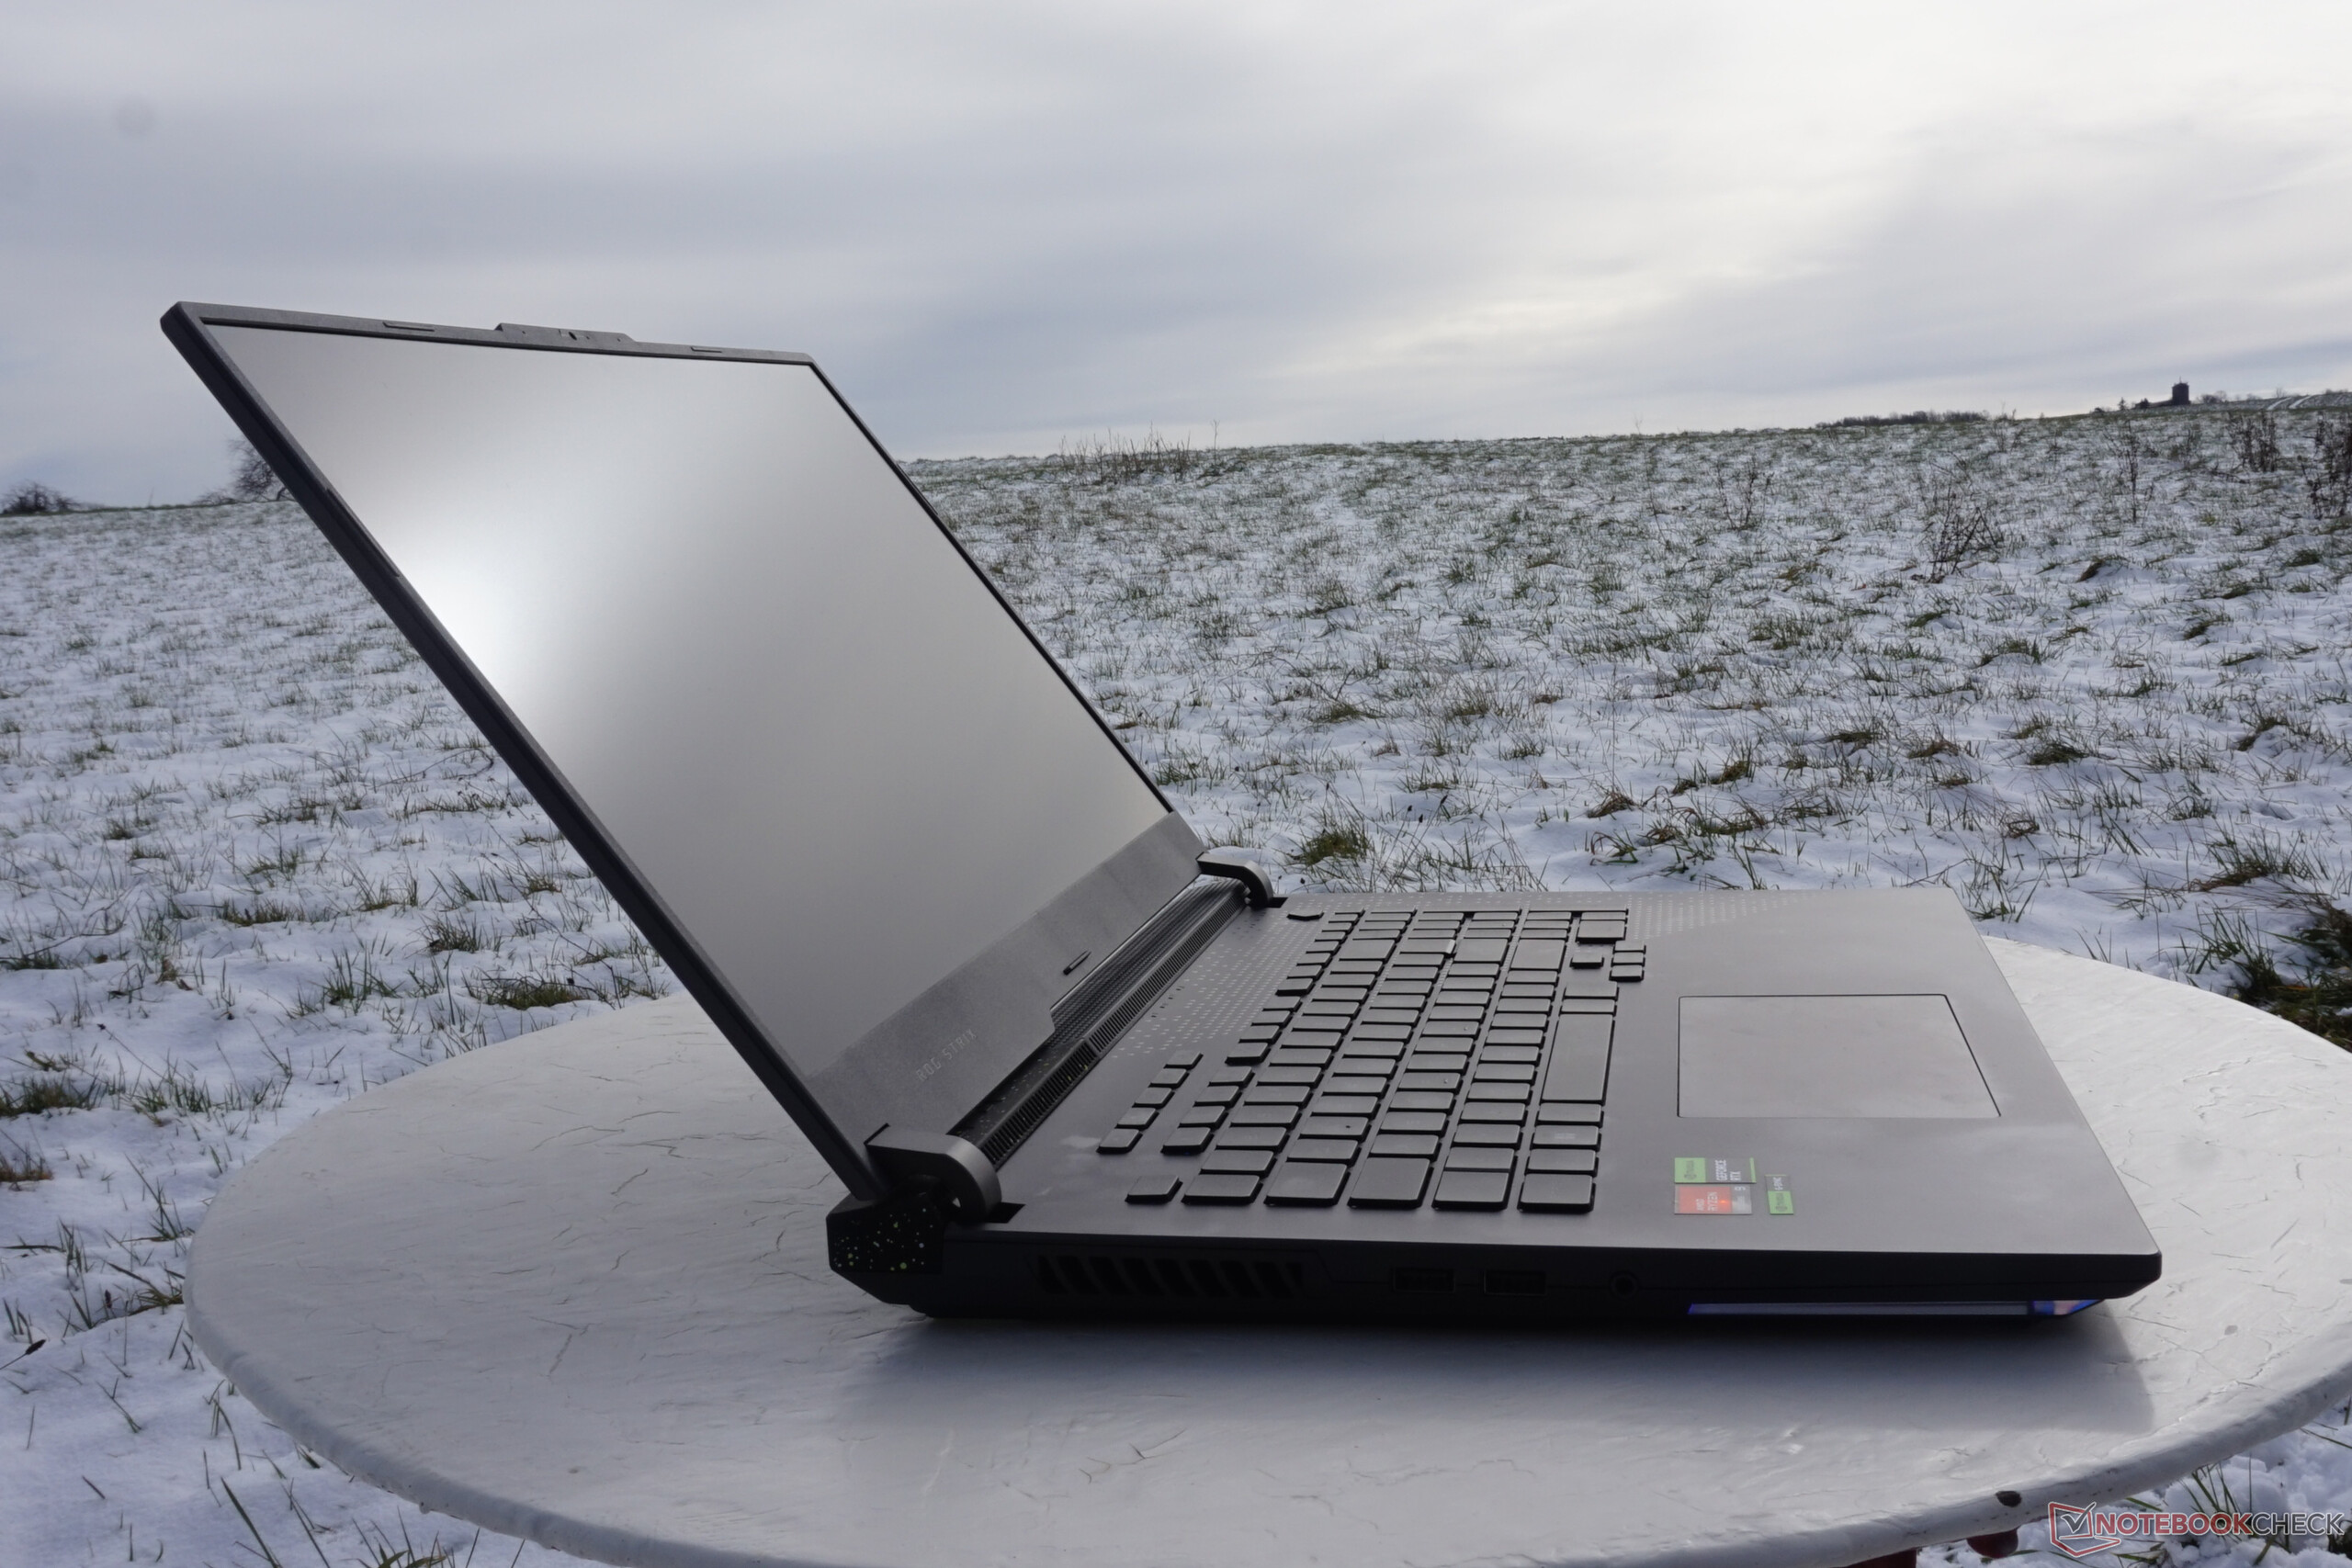
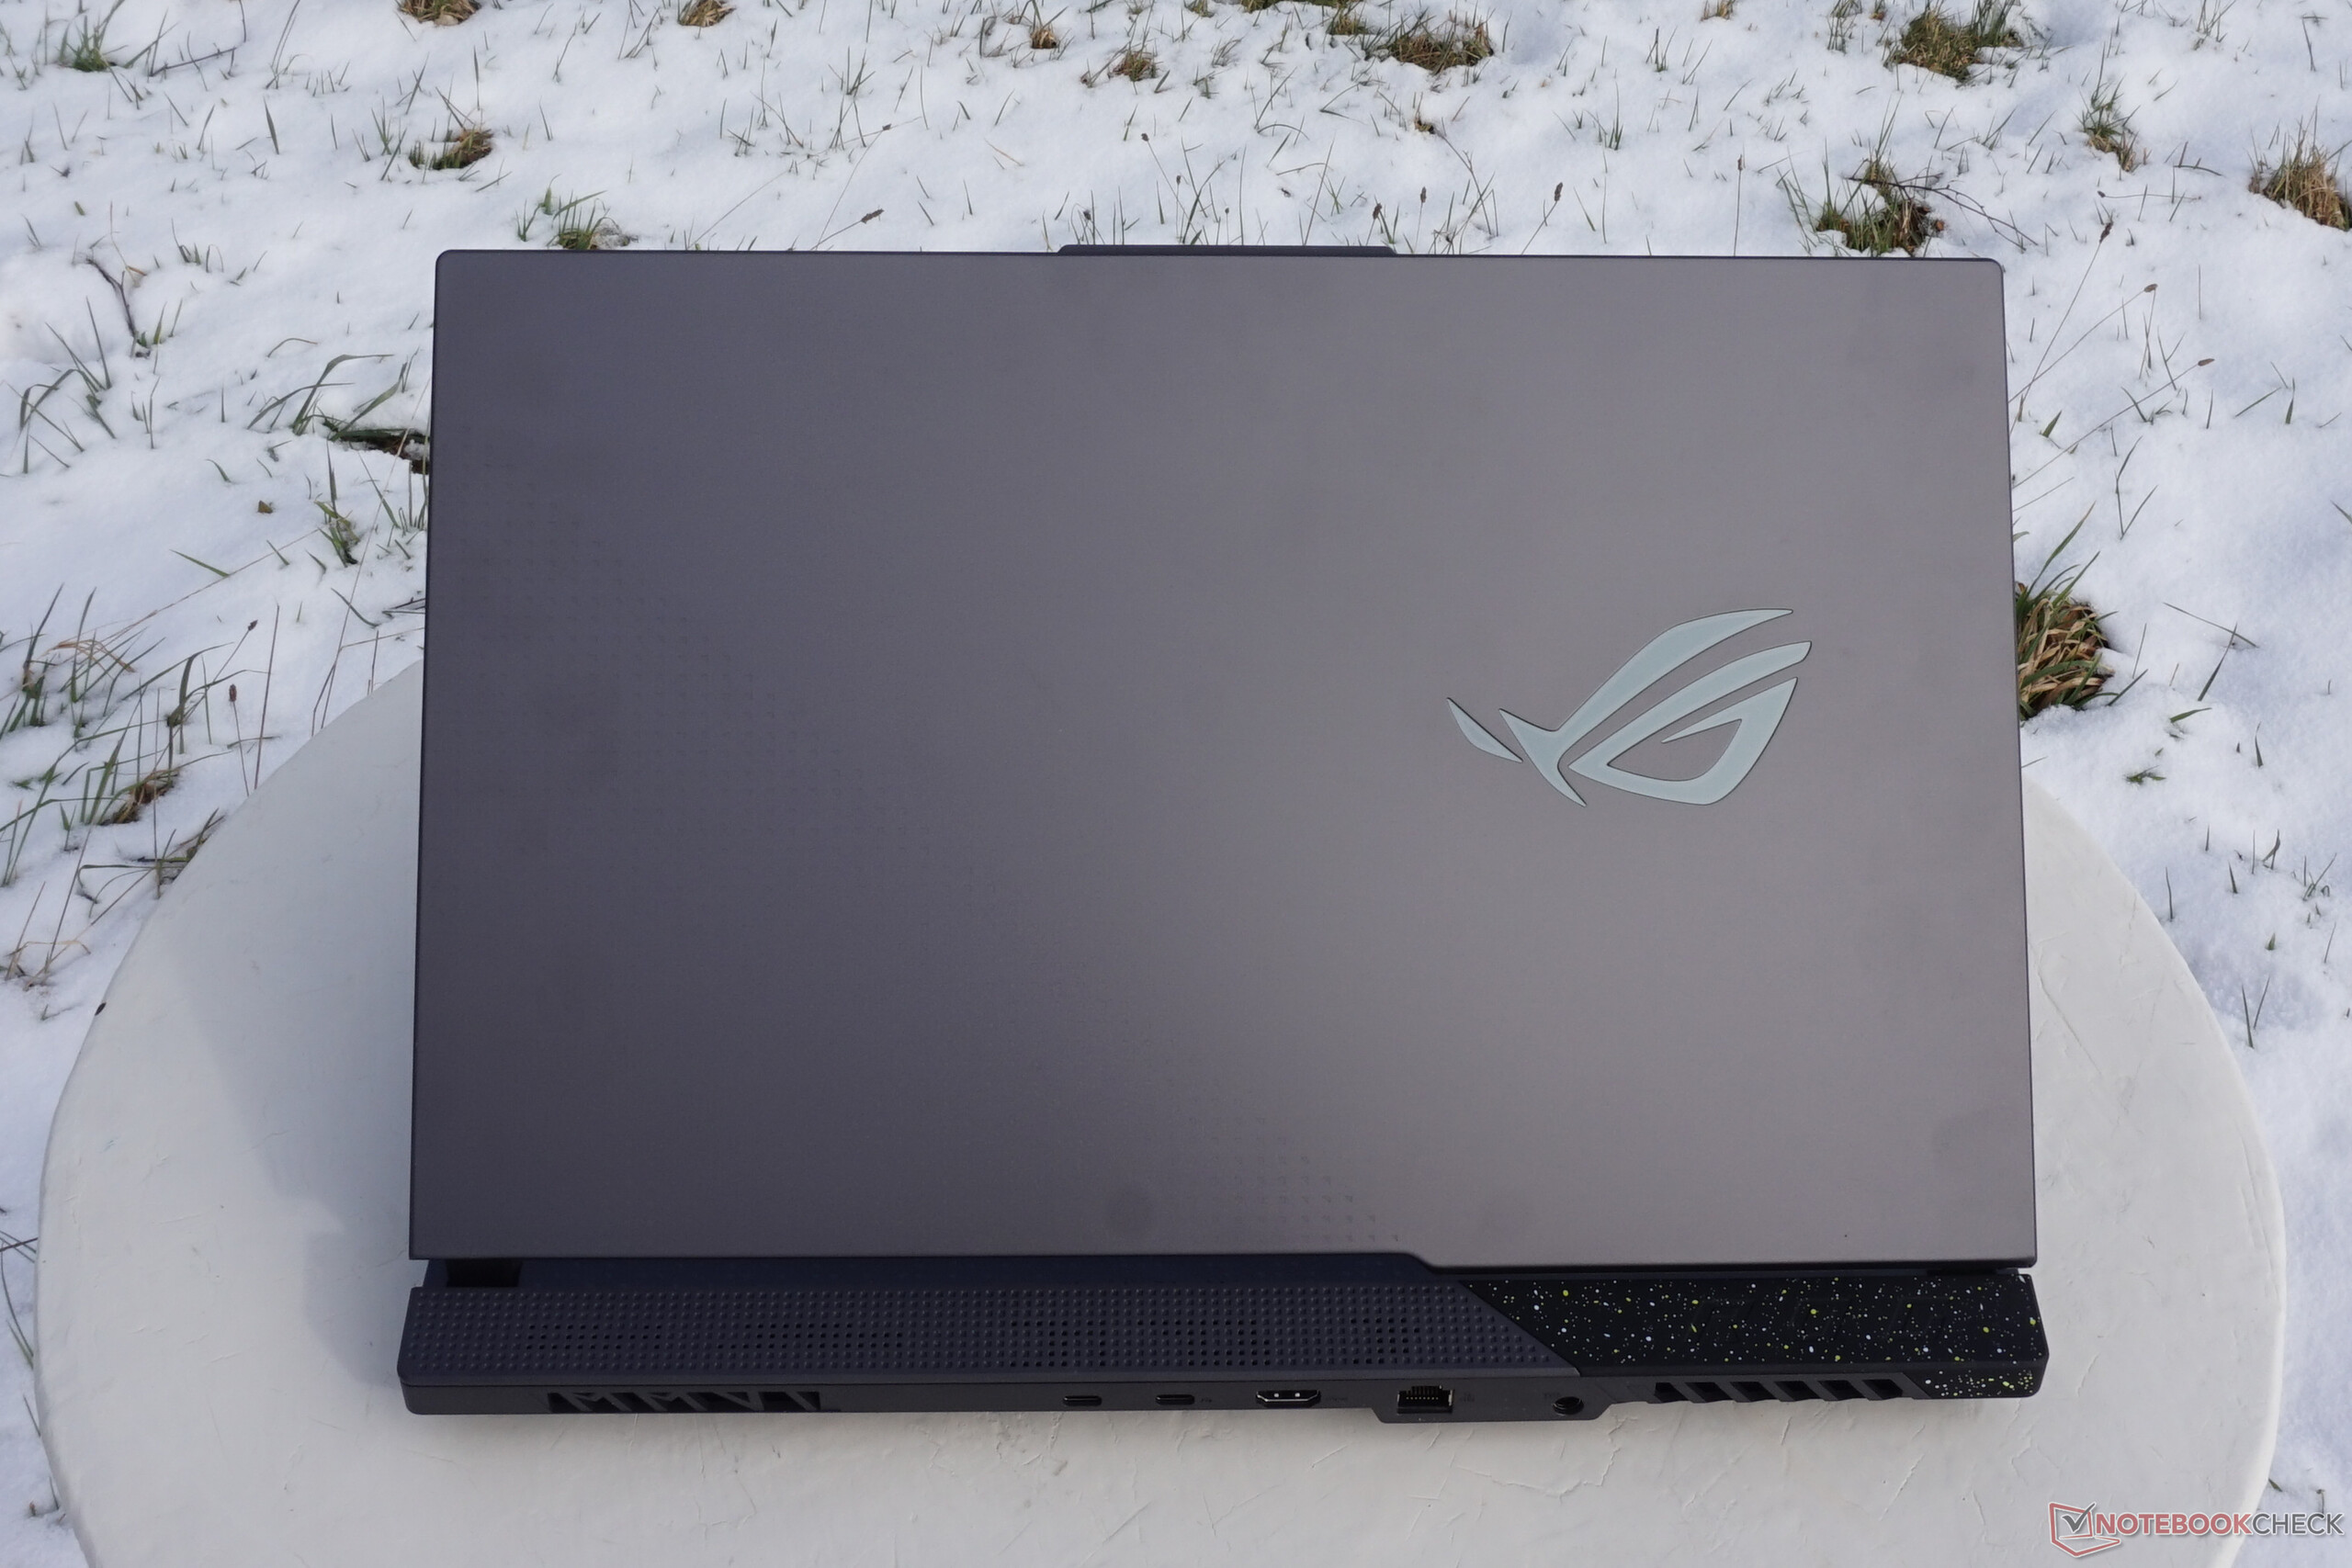
考虑到17英寸的显示屏,华硕ROG Strix是较大的笔记本电脑之一。与前一代的 ROG Strix Scar 17 SE,外壳厚度增加了近2毫米(约0.08英寸)。尽管有吸引人的5毫米(约0.2英寸)的纤细显示屏边框,但大面积的散热使其成为大型笔记本电脑。然而,竞争对手都在类似的尺寸范围内,近3公斤(约6.6磅)的重量也是如此。
连接设备--在游戏笔记本中没有什么特别之处
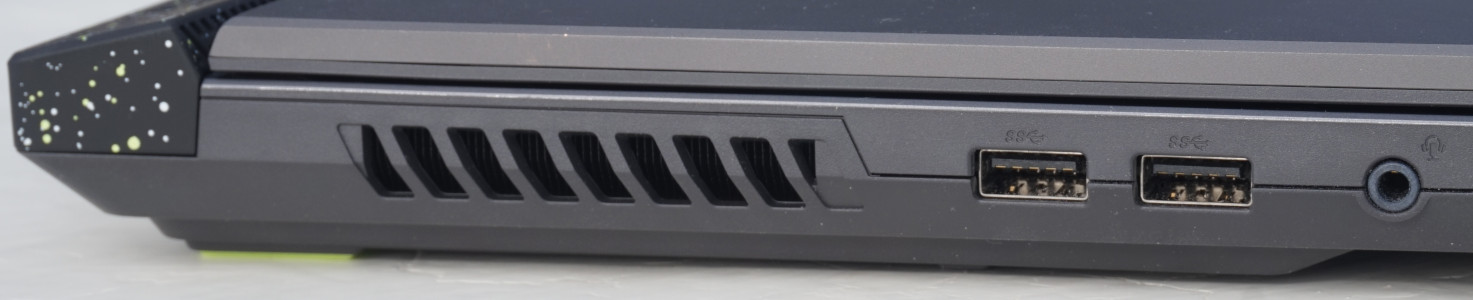
只有绝对必要的东西,然后也只有勉强足够的速度 - 连接设备非常有限。左侧仅有两个USB-A接口,允许你连接游戏鼠标、打印机等。此外,还有一个简单但足够的音频端口用于连接耳机。
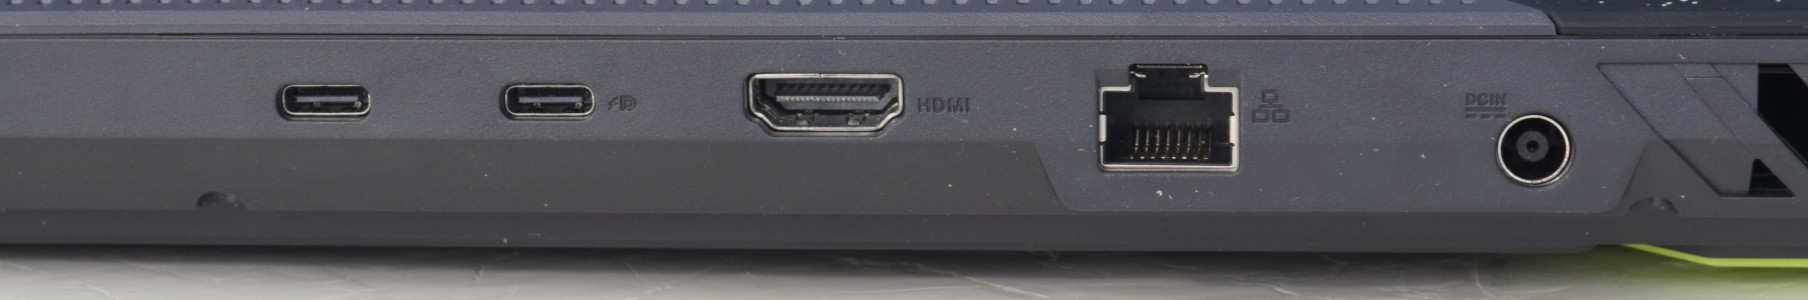
由于其余的连接都放在后面,你的桌子可以保持舒适的无杂物状态,尽管ROG Strix很少可以完全没有任何有线连接,我们将在下面展示。 两个USB-C连接几乎没有达到10Gbit/s,这只是勉强足够从外部SSD启动游戏。我们希望至少有一个USB端口提供两倍甚至四倍的速度。我们在LAN端口看到了类似的情况。虽然我们目前经常发现2.5G比特的端口,但华硕只提供1G比特。这已经足够了,但也不过如此。
至少有三个视频输出端口,但只有第一个USB-C端口支持G-Sync。虽然一台游戏笔记本不需要大量的连接,但现有的几个连接的传输率至少可以变高。
沟通
看看WLAN模块所达到的传输速率,可以帮助我们迅速忘记薄弱的LAN端口。华硕ROG Strix G17在这里能够超越所有的竞争对手,在我们对5-GHz范围的测量中名列前茅,令人印象深刻。至少在离路由器很近的地方,你可以得到远高于1Gbit/s的无线传输速率。此外,还支持Wi-Fi 6E,其大的通信范围确保在有许多不同的WLAN网络的地区减少干扰。
有了这一点,它属于大多数英特尔笔记本电脑的范围,同时大大超过了采用上一代CPU的AMD竞争对手。例如,Alienware m17 R5的发送和接收性能是Alienware m17 R5就慢了40%。
网络摄像头
小小的摄像头似乎有一个不幸的位置,因为当试图打开笔记本电脑时,手指往往会直接碰到摄像头的镜头。在高清分辨率下,图像显示的分辨率很弱,但即使在低光照条件下,仍然很容易辨认,即使它们看起来略有颗粒感。虽然这对于简单的视频通话来说应该是足够的,但如果你的对话伙伴使用全高清或更高的分辨率,质量差异就会立即显现出来。
麦克风的效果明显更好。我们没有注意到任何尖锐的声音或可听到的失真。录制的声音听起来很自然,从不同的方向和变化的距离均匀地登记。这些都是游戏内聊天的最佳必备条件。


维护
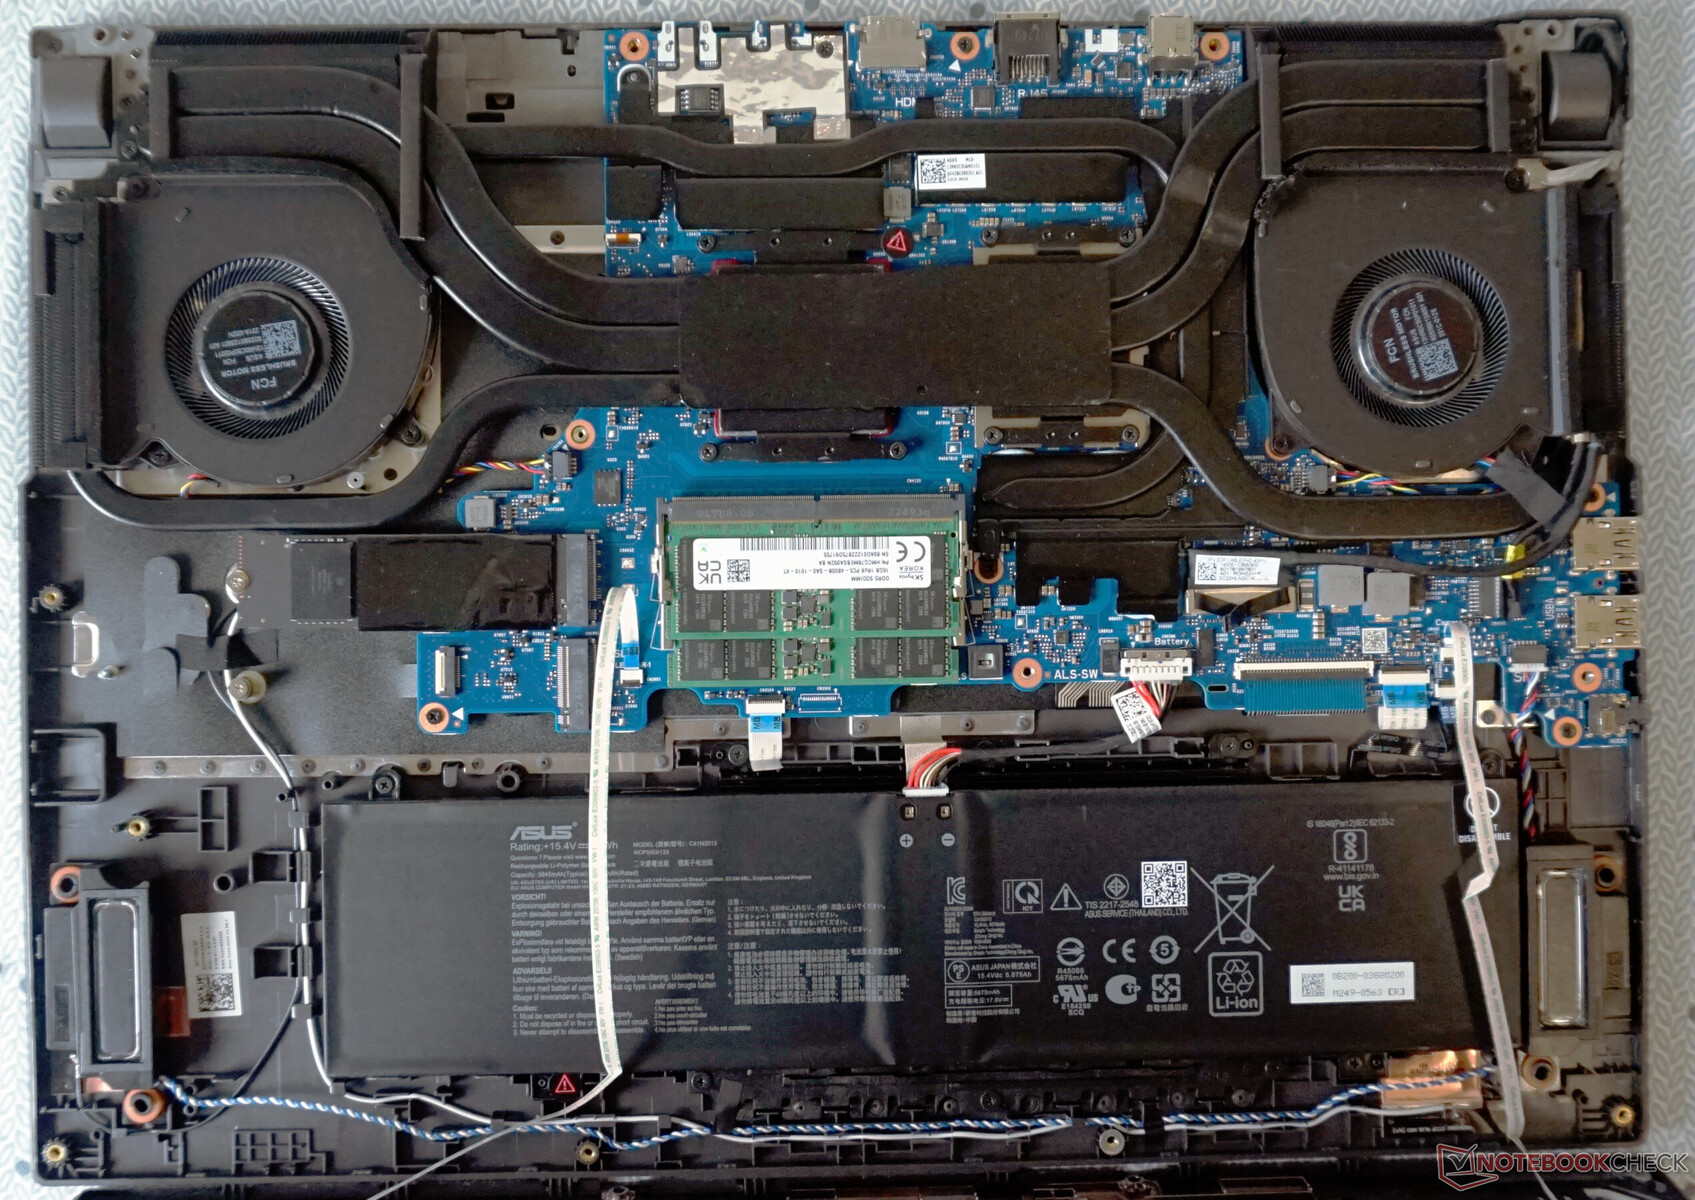
华硕让打开游戏笔记本变得很容易。在卸下11颗飞利浦螺丝后,你不需要很大的力气,只需要细腻的触感就可以卸下底板。
但要小心:由于RGB照明,底板与机箱之间有两条电缆连接。然而,这些电缆仍然被放置在那里,以便你可以在不拔掉电缆的情况下打开底板。
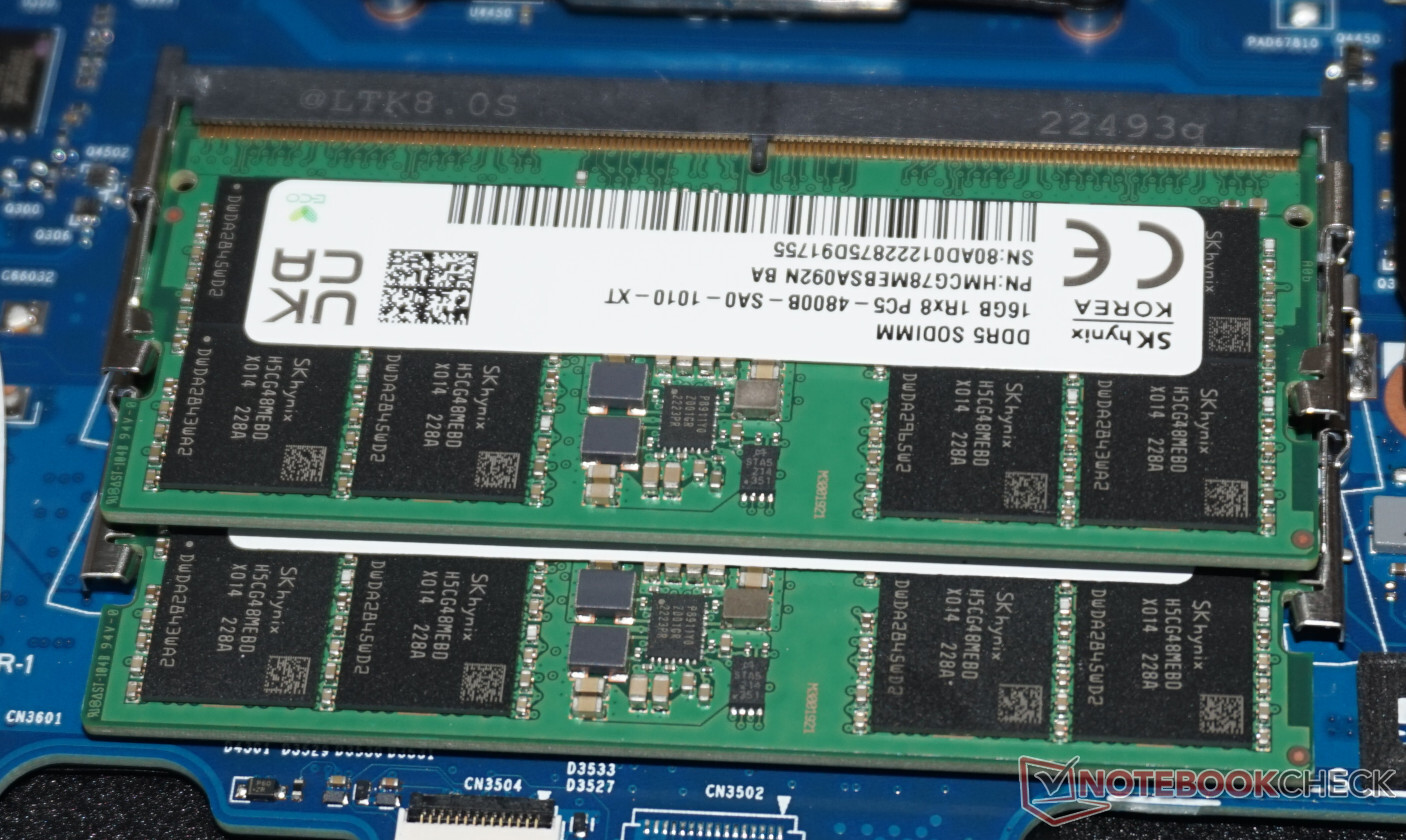
ROG Strix的内部安排合理,特别宽敞。有一个免费的插槽可以扩展存储,允许你非常简单地插入一个新的SSD。更换内存和WLAN模块(隐藏在SSD下面)也很容易。

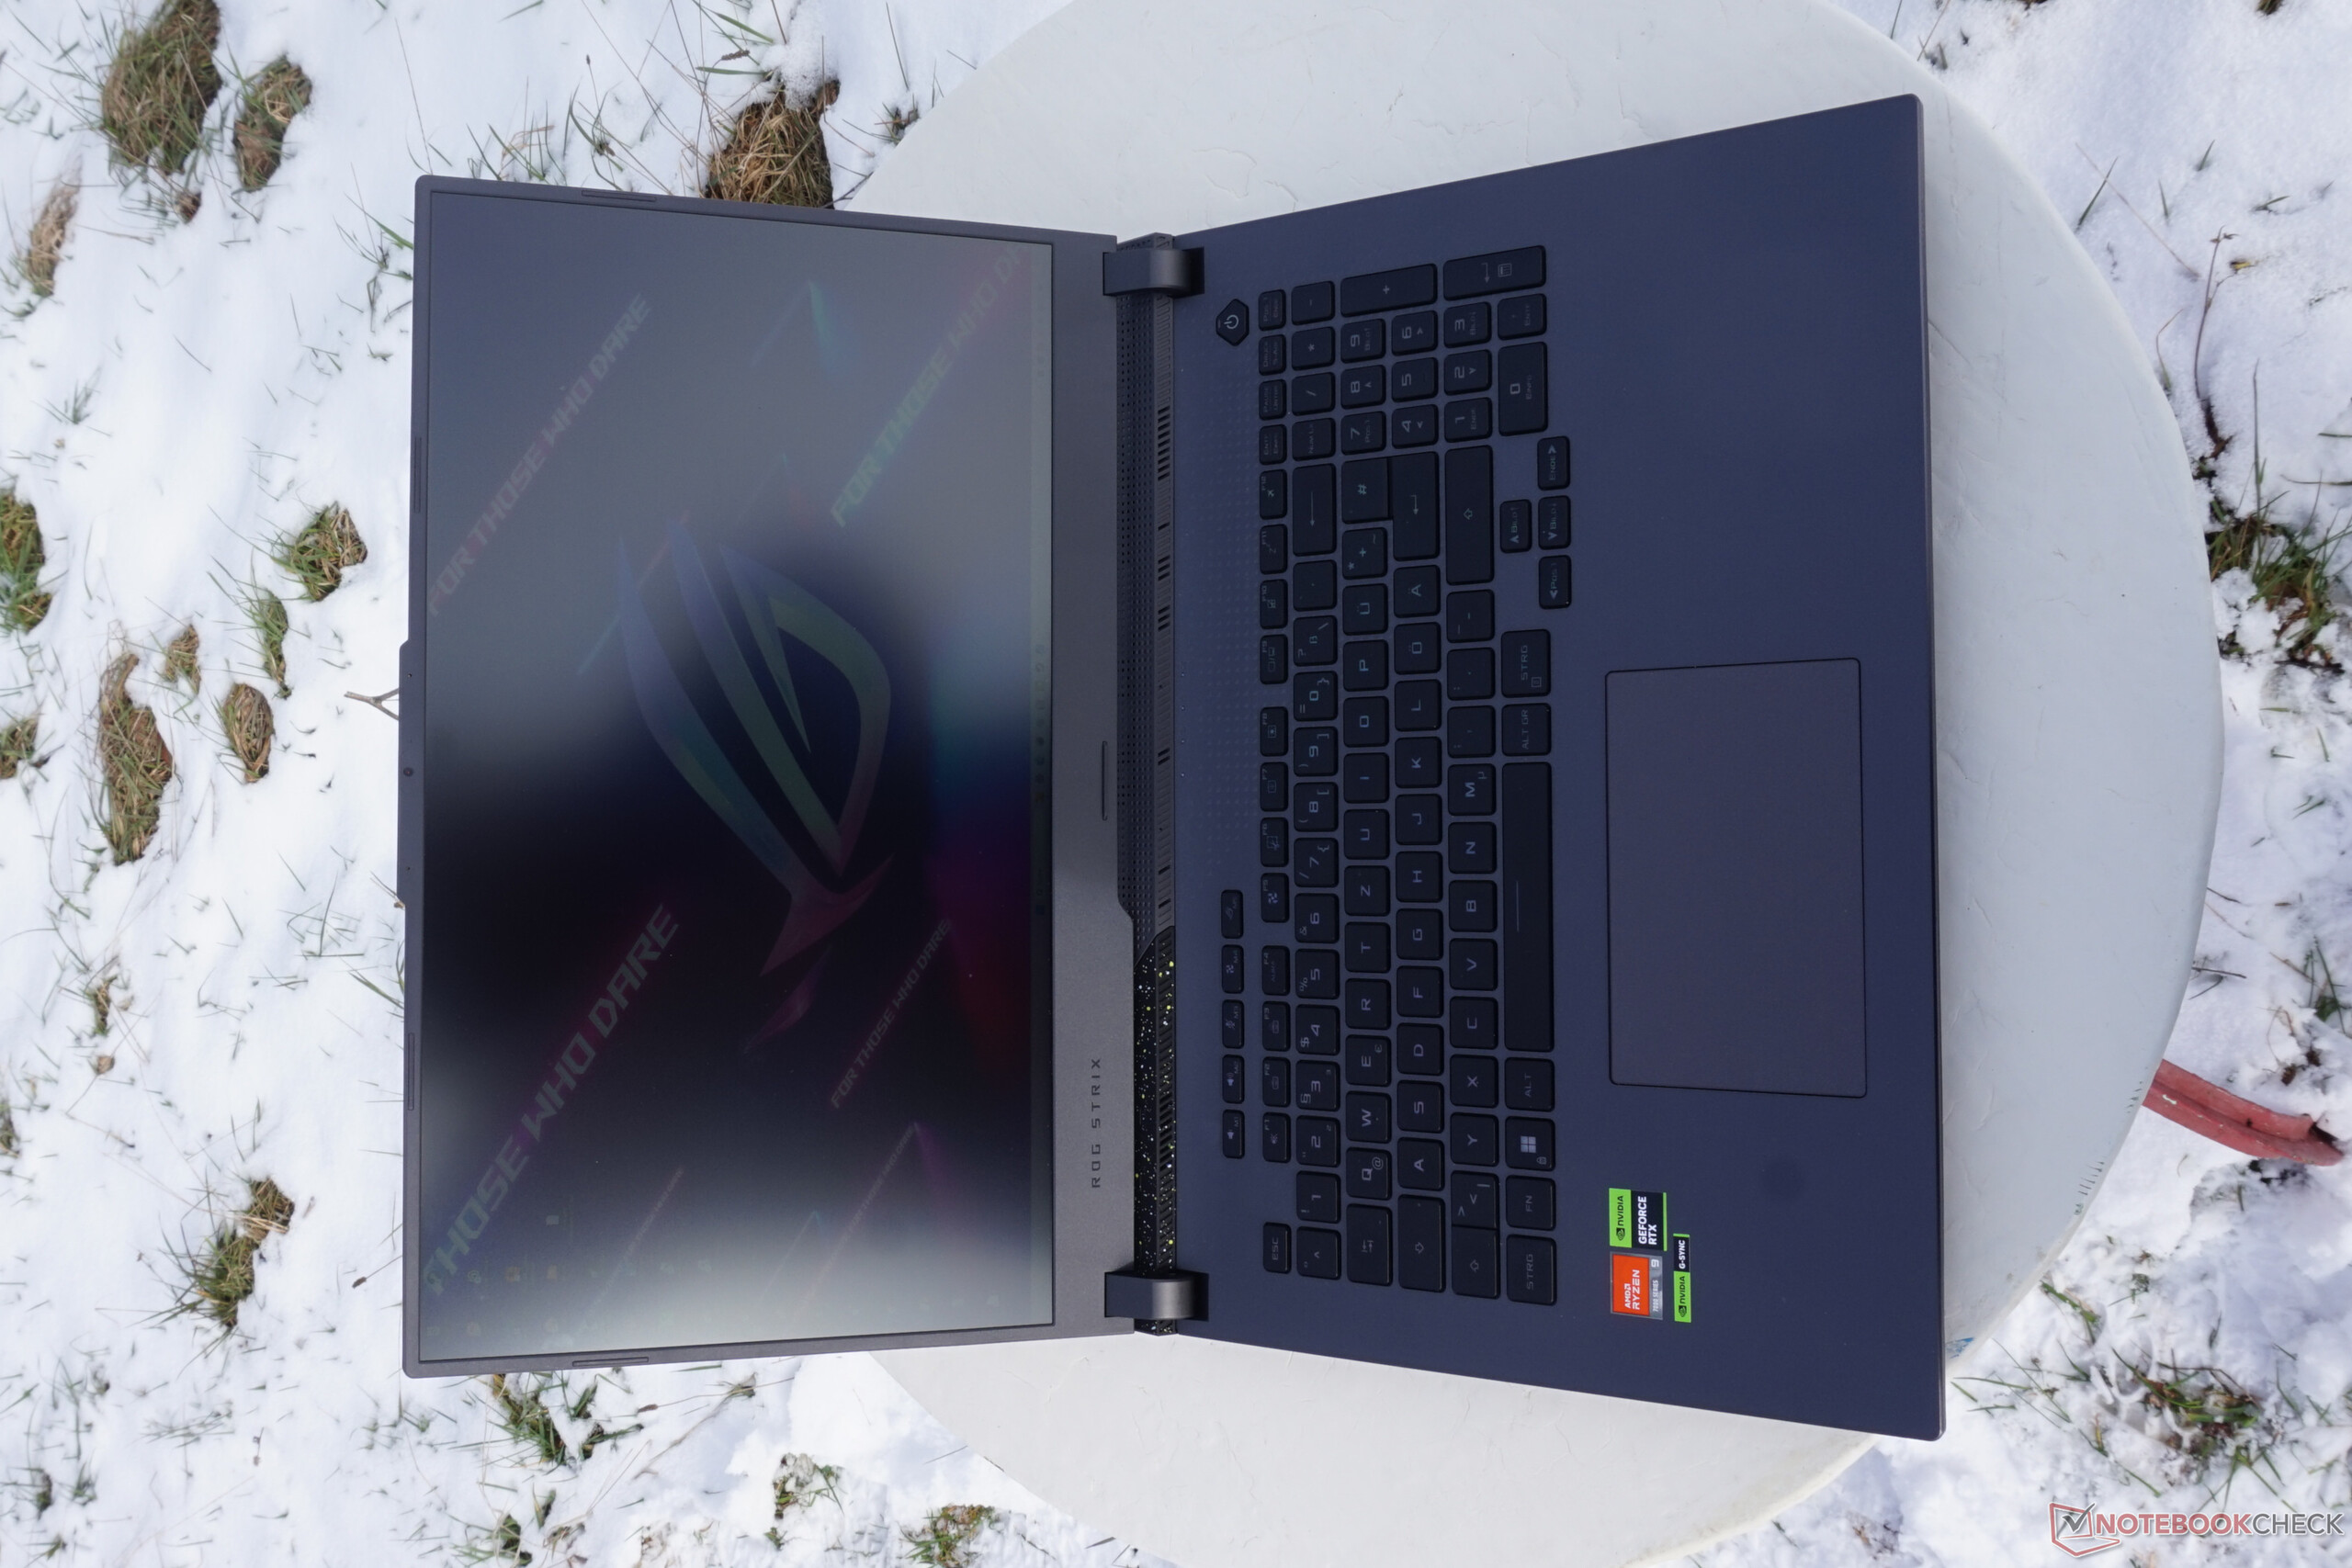
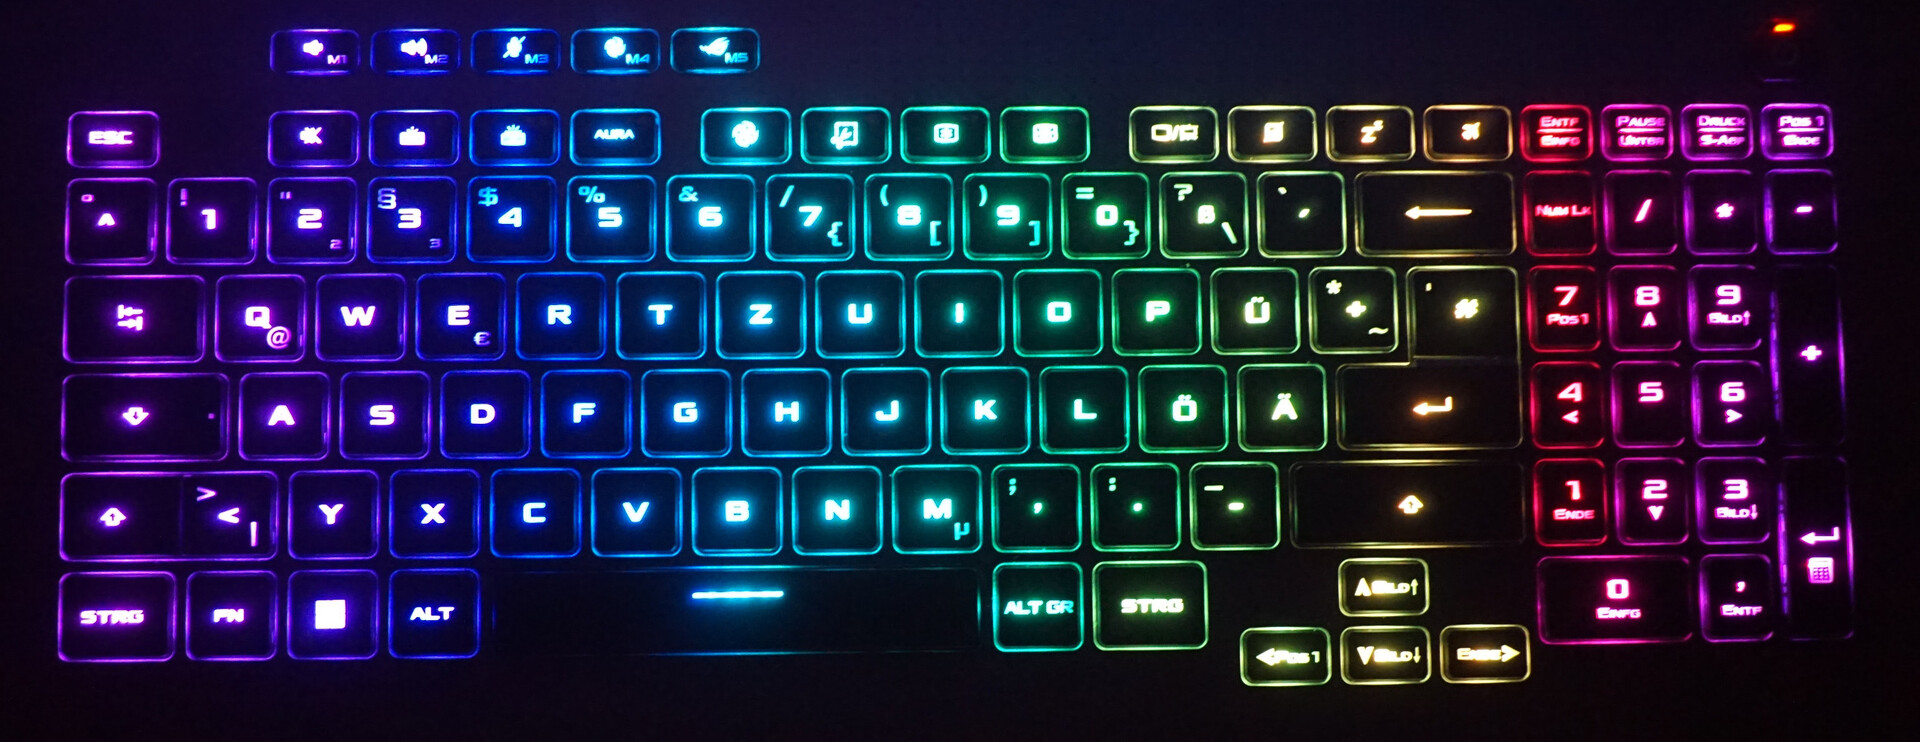
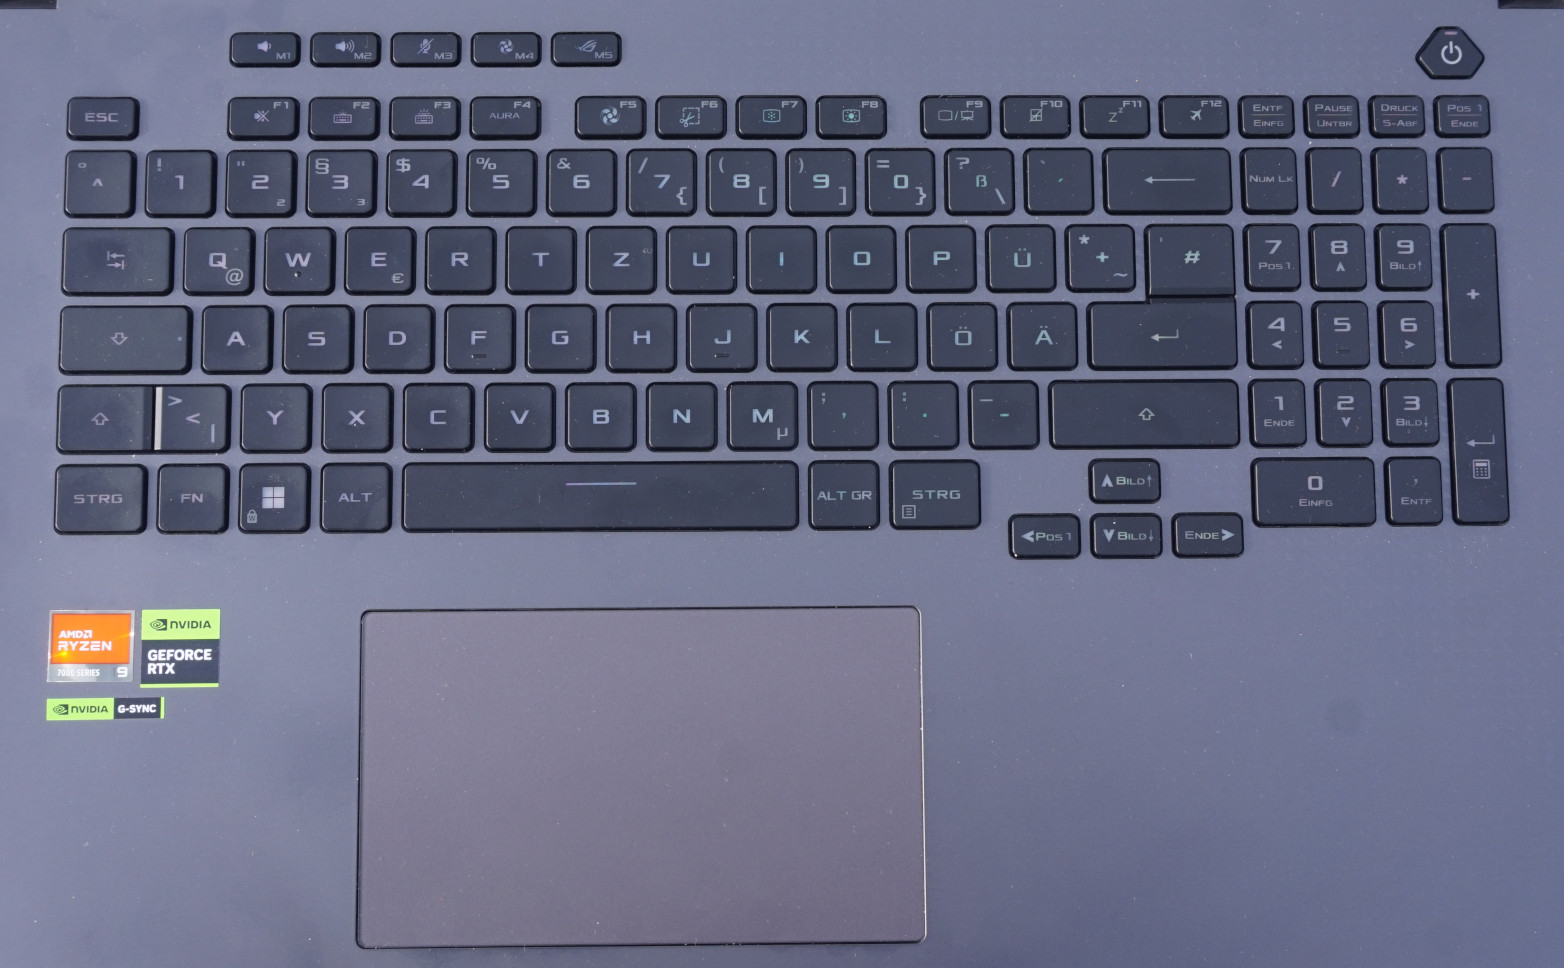
输入设备 - 专注于游戏的键盘
键盘呈现出非常适用于游戏的特点。除了全尺寸的数字块和确实默认为基本功能的F键之外,ROG Strix还提供了五个额外的按键,用于控制性能模式、音量和话筒。然而,你也可以用你自己的宏来配置它们。
近1.5毫米(约0.06英寸)的按键行程使打字非常舒适。我们也喜欢调整好的压力点。
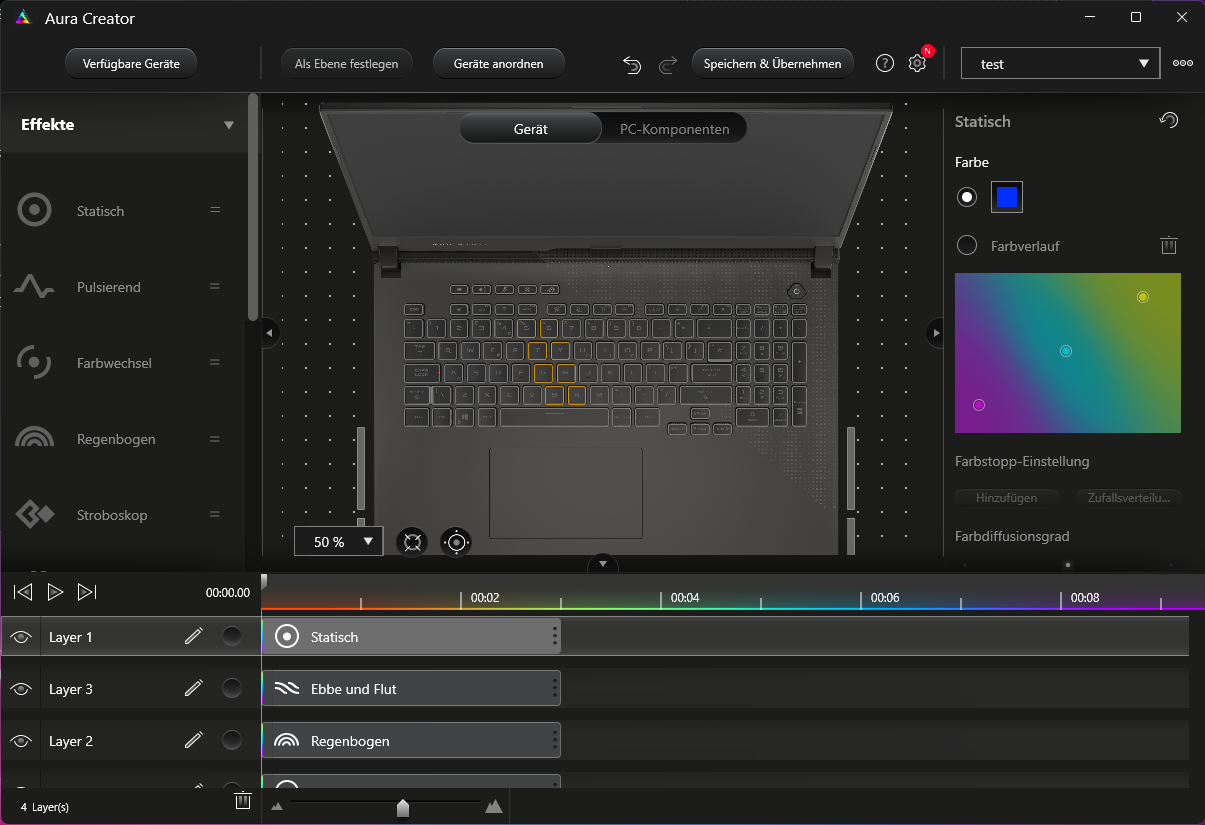
键盘的照明也没有什么需要改进的地方。从经典的彩虹效果到将单个按键与传感器数值、播放的音乐或显示屏上的颜色相连接,Aura Creator允许你对你能想到的任何行为进行编程,甚至对每个按键和底部的六个元素进行单独编程。通过相应的配件,你还可以将其扩展到整个桌面。
触摸板很大,其隐藏的按键反应准确,压力点调整得很好。但通常情况下,只要你连接了鼠标,这就不会有太大问题。
显示器 - 具有高帧率的游戏笔记本电脑

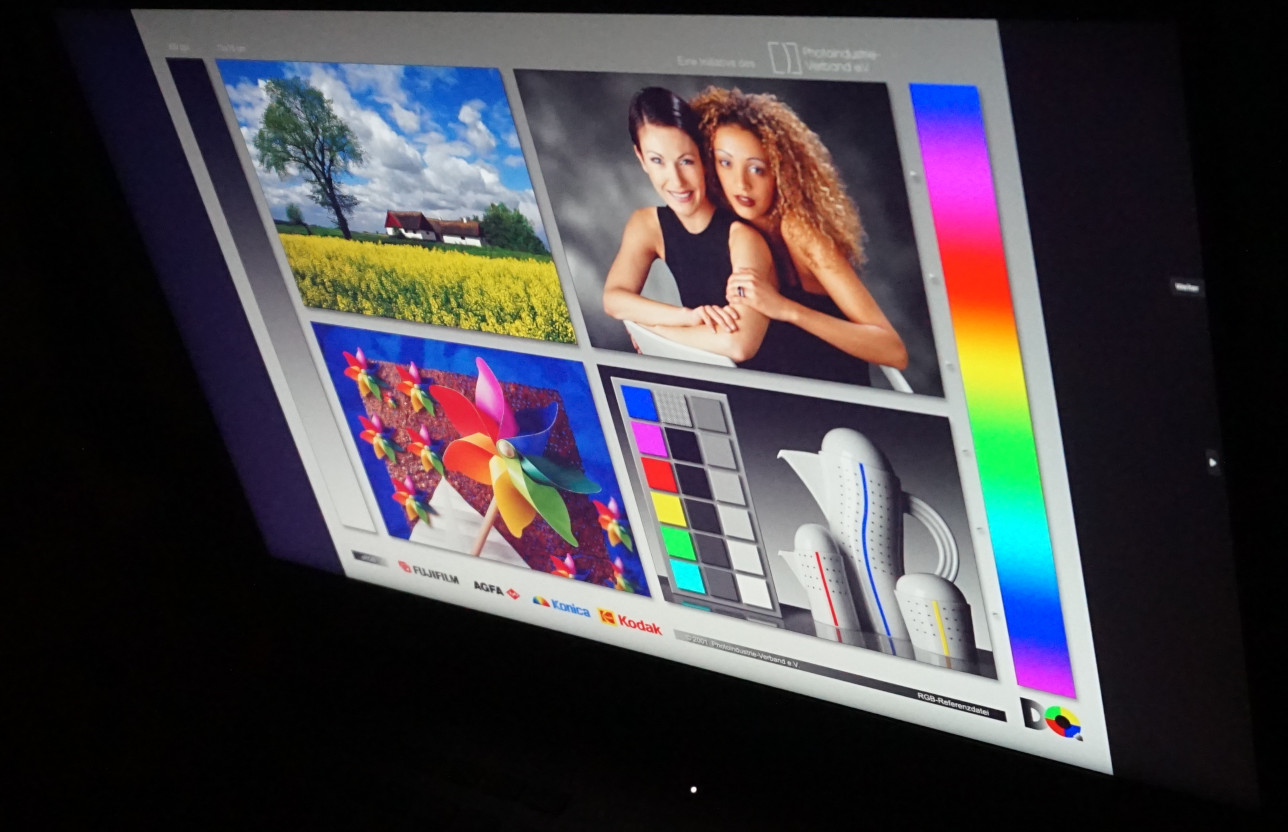
除了高刷新率和非常大的色彩空间覆盖,至少几乎完全覆盖了Display-P3,ROG Strix G17的显示屏提供了平均数值。有限的亮度和最多是平均的对比度并不特别吸引人。然而,竞争对手在这方面几乎没有任何优势。但是,如果这台游戏笔记本放在家里的桌子上,而你的周围又没有阳光充斥,那么无论如何这都不应该有什么问题。
另一方面,17英寸的大对角线、广泛的色彩空间、QHD分辨率,当然还有240-Hz的刷新率,在游戏时充分显示出它们的优势。
对于一些非常暗的图像,屏幕出血可能会成为一个障碍。我们的测试设备在左上角受到了影响,即使没有长时间曝光也是可见的。然而,只要图像或场景稍微亮一点,它就不再明显了。
| |||||||||||||||||||||||||
Brightness Distribution: 89 %
Center on Battery: 327 cd/m²
Contrast: 861:1 (Black: 0.38 cd/m²)
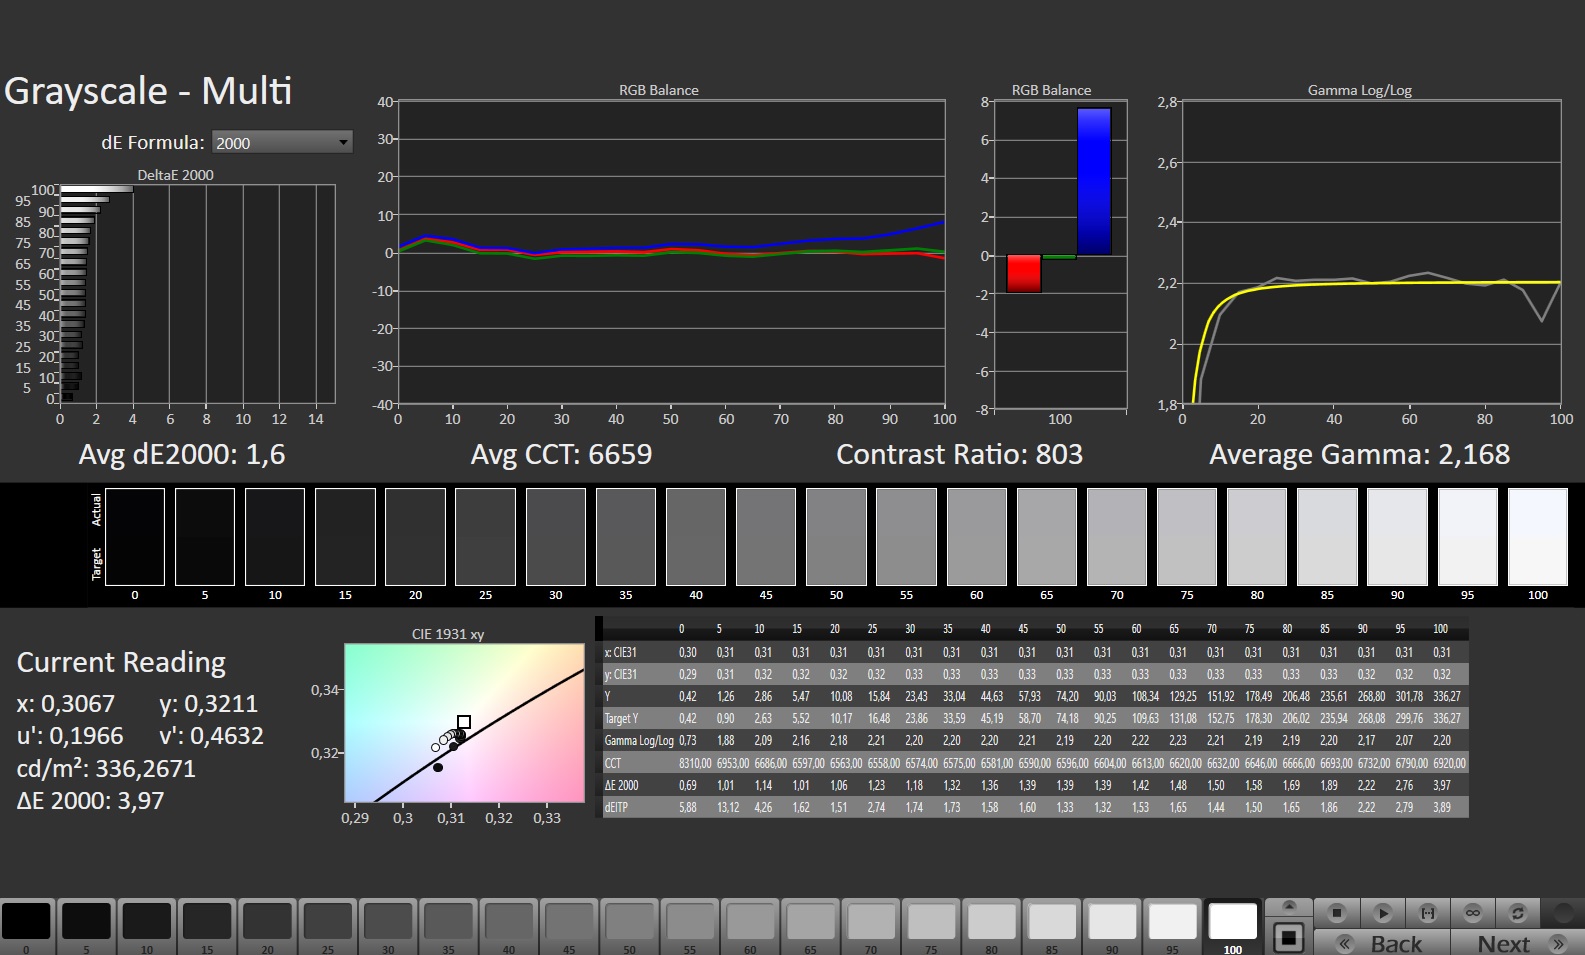
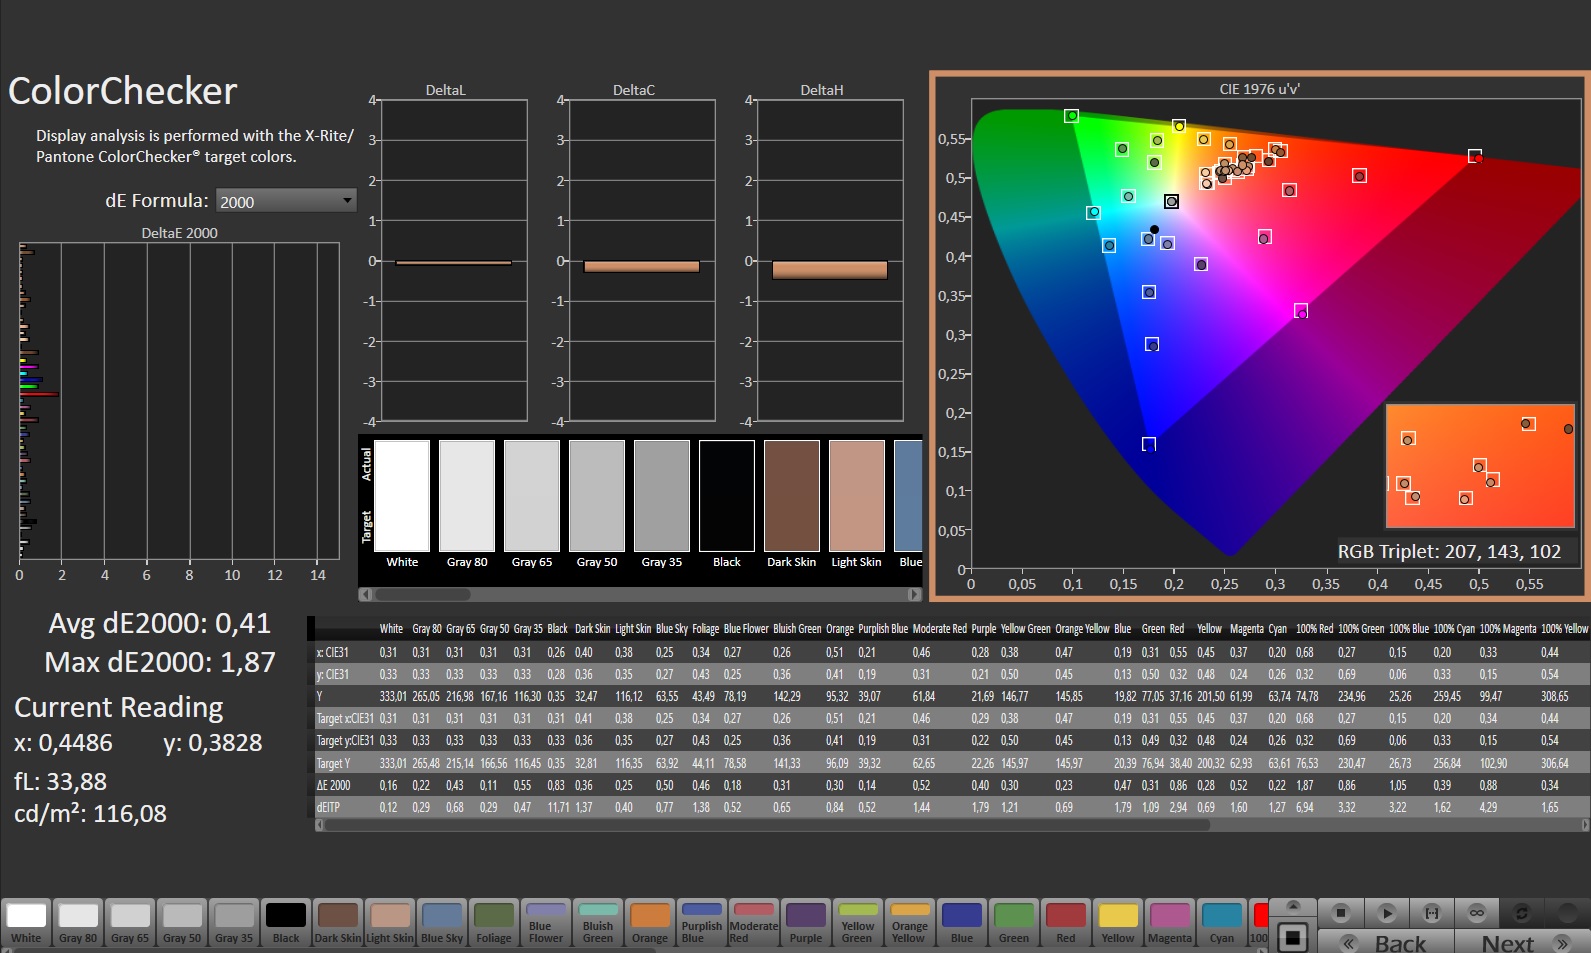
ΔE ColorChecker Calman: 1.01 | ∀{0.5-29.43 Ø4.71}
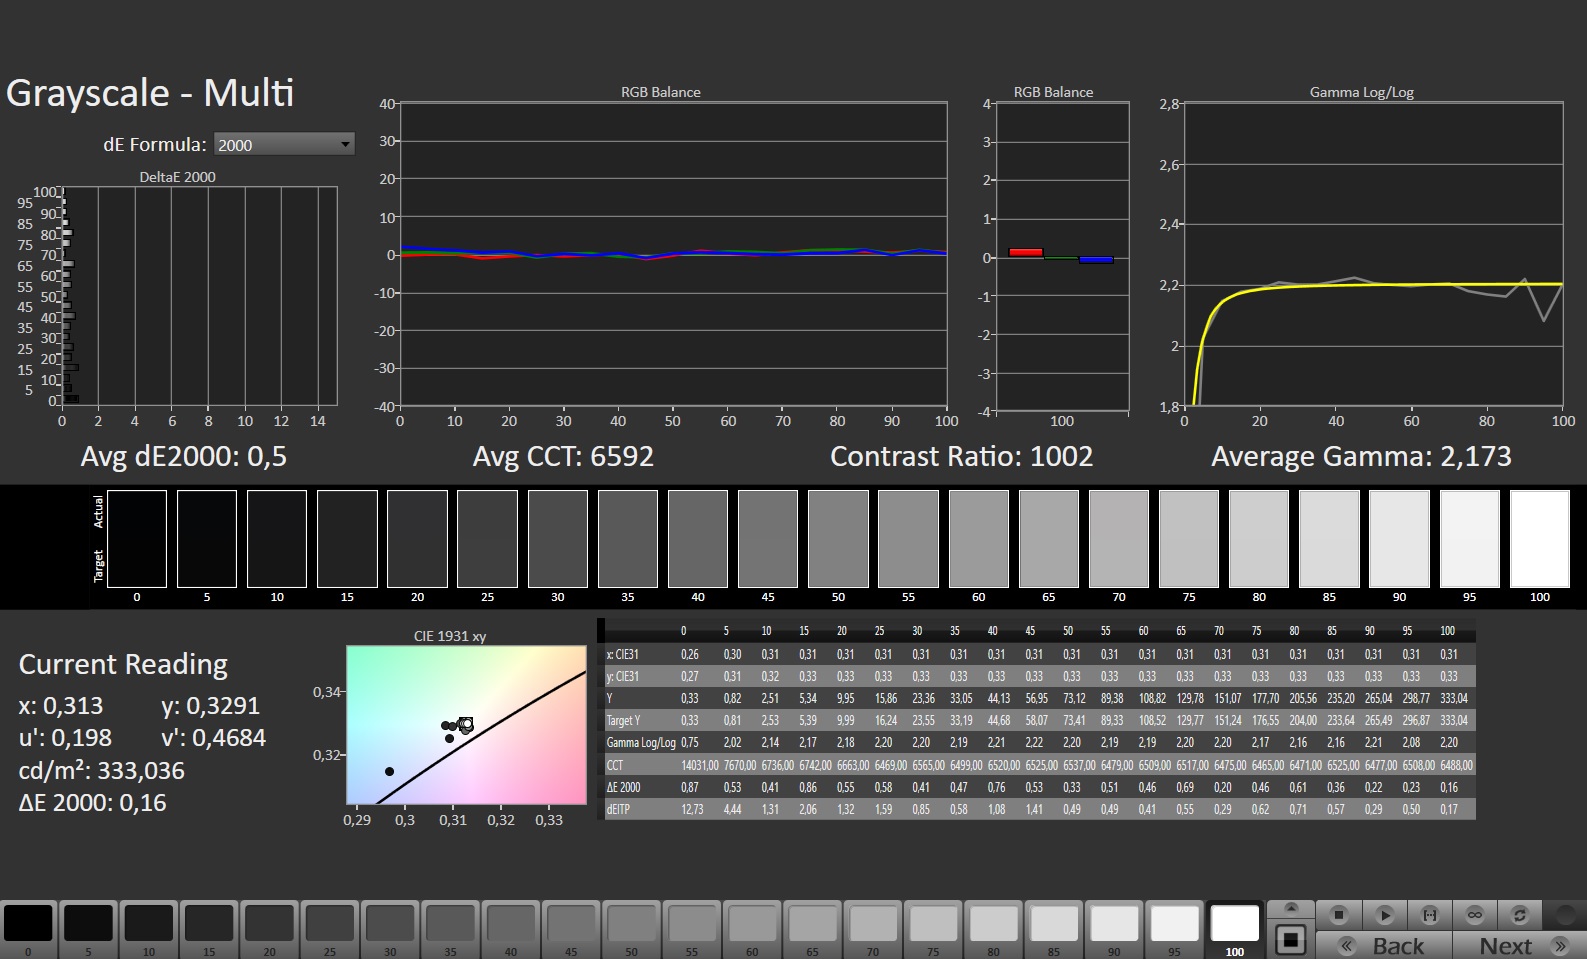
calibrated: 0.41
ΔE Greyscale Calman: 1.6 | ∀{0.09-98 Ø4.96}
85.9% AdobeRGB 1998 (Argyll 3D)
100% sRGB (Argyll 3D)
98.3% Display P3 (Argyll 3D)
Gamma: 2.168
CCT: 6659 K
| Asus ROG Strix G17 G713PI BOE0B69, IPS, 2560x1440, 17.3" | Asus ROG Strix G18 G814JI NE180QDM-NZ2 (BOE0B35), IPS, 2560x1600, 18" | Razer Blade 18 RTX 4070 AU Optronics B180QAN01.0, IPS, 2560x1600, 18" | Asus ROG Strix Scar 17 SE G733CX-LL014W NE173QHM-NZ2, IPS, 2560x1440, 17.3" | Asus Zephyrus Duo 16 GX650PY-NM006W NE160QDM-NM4, MiniLED, 2560x1600, 16" | Alienware m17 R5 (R9 6900HX, RX 6850M XT) AU Optronics AUODBA3, IPS, 3840x2160, 17" | Asus ROG Strix G16 G614JZ TL160ADMP03-0, IPS, 2560x1600, 16" | |
|---|---|---|---|---|---|---|---|
| Display | 0% | -1% | -1% | 2% | 1% | -1% | |
| Display P3 Coverage (%) | 98.3 | 98.1 0% | 96.9 -1% | 97.1 -1% | 99.4 1% | 97.2 -1% | 97 -1% |
| sRGB Coverage (%) | 100 | 99.9 0% | 99.8 0% | 99.9 0% | 100 0% | 99.6 0% | 99.9 0% |
| AdobeRGB 1998 Coverage (%) | 85.9 | 85.6 0% | 85.3 -1% | 84.8 -1% | 90.8 6% | 88.4 3% | 84.9 -1% |
| Response Times | -6% | 14% | -13% | -154% | -122% | 14% | |
| Response Time Grey 50% / Grey 80% * (ms) | 5.3 ? | 5.6 ? -6% | 4.2 ? 21% | 5.7 ? -8% | 15.2 ? -187% | 16.4 ? -209% | 5.1 ? 4% |
| Response Time Black / White * (ms) | 8.6 ? | 9 ? -5% | 8 ? 7% | 10.1 ? -17% | 19 ? -121% | 11.6 ? -35% | 6.6 ? 23% |
| PWM Frequency (Hz) | 12000 ? | ||||||
| Screen | -24% | -85% | 11% | 119% | -191% | -19% | |
| Brightness middle (cd/m²) | 327 | 471 44% | 549.6 68% | 320 -2% | 712 118% | 484 48% | 470 44% |
| Brightness (cd/m²) | 320 | 422 32% | 524 64% | 303 -5% | 703 120% | 449 40% | 459 43% |
| Brightness Distribution (%) | 89 | 83 -7% | 89 0% | 87 -2% | 95 7% | 87 -2% | 93 4% |
| Black Level * (cd/m²) | 0.38 | 0.47 -24% | 0.53 -39% | 0.3 21% | 0.07 82% | 0.55 -45% | 0.42 -11% |
| Contrast (:1) | 861 | 1002 16% | 1037 20% | 1067 24% | 10171 1081% | 880 2% | 1119 30% |
| Colorchecker dE 2000 * | 1.01 | 2.05 -103% | 3.32 -229% | 1.1 -9% | 1.7 -68% | 4.8 -375% | 1.86 -84% |
| Colorchecker dE 2000 max. * | 4.01 | 4.15 -3% | 6.63 -65% | 2.7 33% | 4 -0% | 7.48 -87% | 3.87 3% |
| Colorchecker dE 2000 calibrated * | 0.41 | 0.8 -95% | 2.7 -559% | 1.2 -193% | 4.74 -1056% | 0.93 -127% | |
| Greyscale dE 2000 * | 1.6 | 2.8 -75% | 2 -25% | 1.1 31% | 2.8 -75% | 5.5 -244% | 2.7 -69% |
| Gamma | 2.168 101% | 2.204 100% | 2.29 96% | 2.13 103% | 2.21 100% | 2.42 91% | 2.246 98% |
| CCT | 6659 98% | 7122 91% | 6319 103% | 6599 98% | 6978 93% | 6148 106% | 6711 97% |
| Total Average (Program / Settings) | -10% /
-16% | -24% /
-53% | -1% /
5% | -11% /
55% | -104% /
-140% | -2% /
-10% |
* ... smaller is better
即使不进行额外的校准,色彩显示也非常准确。用肉眼几乎看不出偏差。在校准之后,所有的偏差都会下降到可感知的限度以下。因此,该显示器也适用于图像处理。你可以从上面显示值区域的链接中下载相应的颜色配置文件。

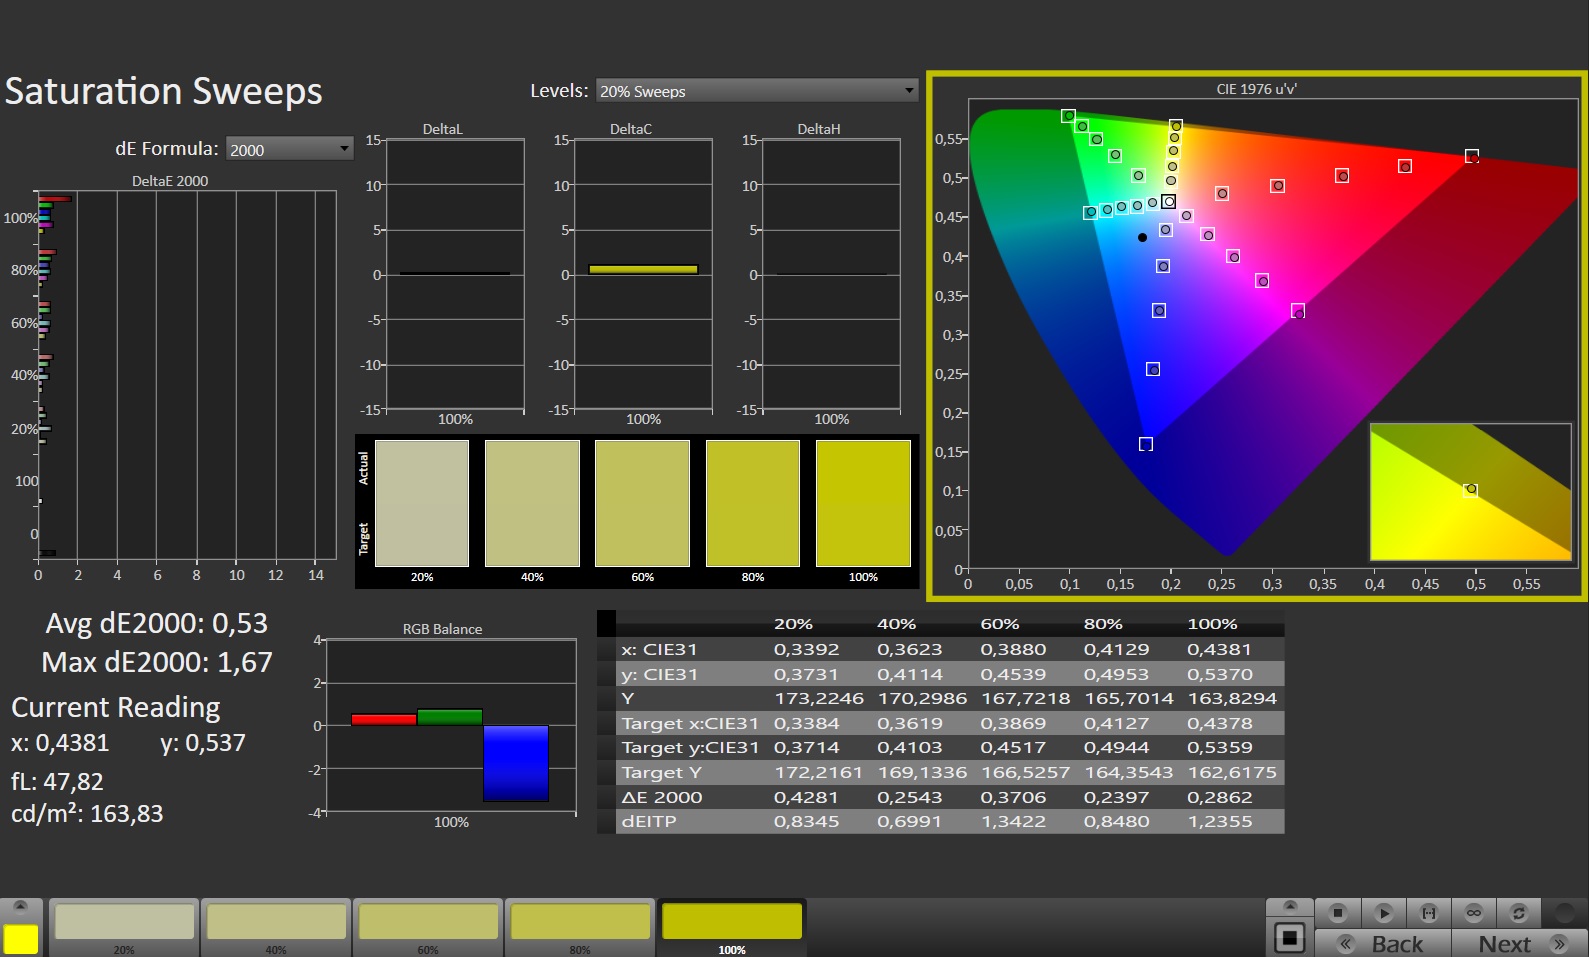
响应时间短,明显低于10毫秒,没有PWM闪烁,以及大的色彩空间,使得这款显示器非常适用于游戏笔记本电脑。
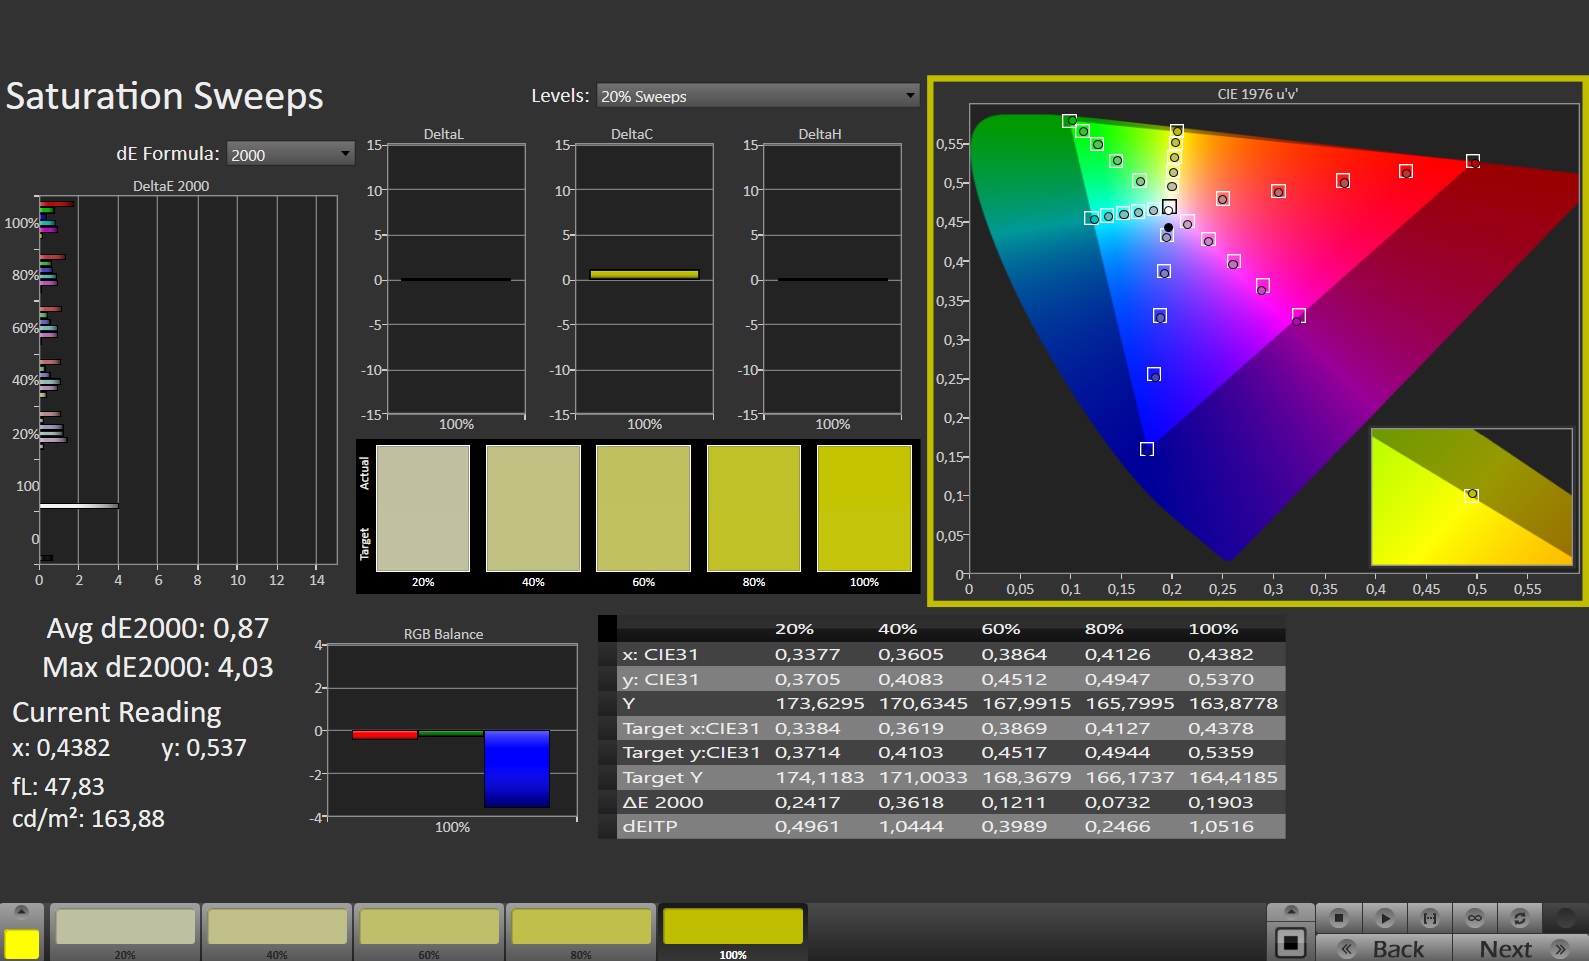
色彩再现也没有什么可抱怨的。我们对色彩再现的测量结果是几乎完美的100% sRGB,98% DCI-P3,以及至少86% AdobeRGB。除了相应的华丽的游戏序列,创作者也会得到他们需要的东西。只有在对图像处理有专业要求的情况下,你才需要使用一个完全覆盖AdobeRGB色彩空间的屏幕。

Display Response Times
| ↔ Response Time Black to White | ||
|---|---|---|
| 8.6 ms ... rise ↗ and fall ↘ combined | ↗ 3.7 ms rise |  |
| ↘ 4.9 ms fall | ||
| The screen shows fast response rates in our tests and should be suited for gaming. In comparison, all tested devices range from 0.1 (minimum) to 240 (maximum) ms. » 24 % of all devices are better. This means that the measured response time is better than the average of all tested devices (19.8 ms). | ||
| ↔ Response Time 50% Grey to 80% Grey | ||
| 5.3 ms ... rise ↗ and fall ↘ combined | ↗ 2.4 ms rise |  |
| ↘ 2.9 ms fall | ||
| The screen shows very fast response rates in our tests and should be very well suited for fast-paced gaming. In comparison, all tested devices range from 0.165 (minimum) to 636 (maximum) ms. » 18 % of all devices are better. This means that the measured response time is better than the average of all tested devices (31 ms). | ||
Screen Flickering / PWM (Pulse-Width Modulation)
| Screen flickering / PWM not detected |  | ||
In comparison: 52 % of all tested devices do not use PWM to dim the display. If PWM was detected, an average of 7747 (minimum: 5 - maximum: 343500) Hz was measured. | |||
相对较低的亮度和有限的对比度使其几乎不可能在户外使用笔记本电脑。在阳光充足的地方,即使有一点阴凉,特别是颜色也很难再辨认出来,即使你仍然可以阅读文字。

对于ROG Strix G17这样的游戏笔记本电脑来说,只有必要的视角稳定性。由于通常你几乎总是从正面直接看显示器,所以从明显陡峭于45°的角度看,任何黑色区域都被灰色的面纱覆盖,颜色也显得略微苍白,这一点应该不重要。


性能 - ROG Strix处于中上等水平
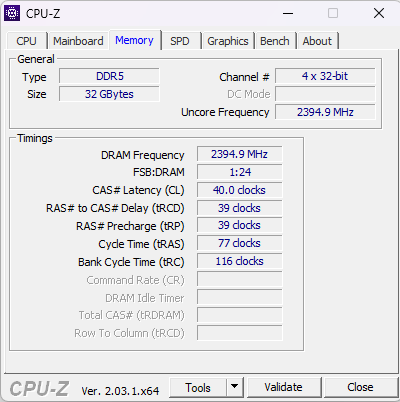
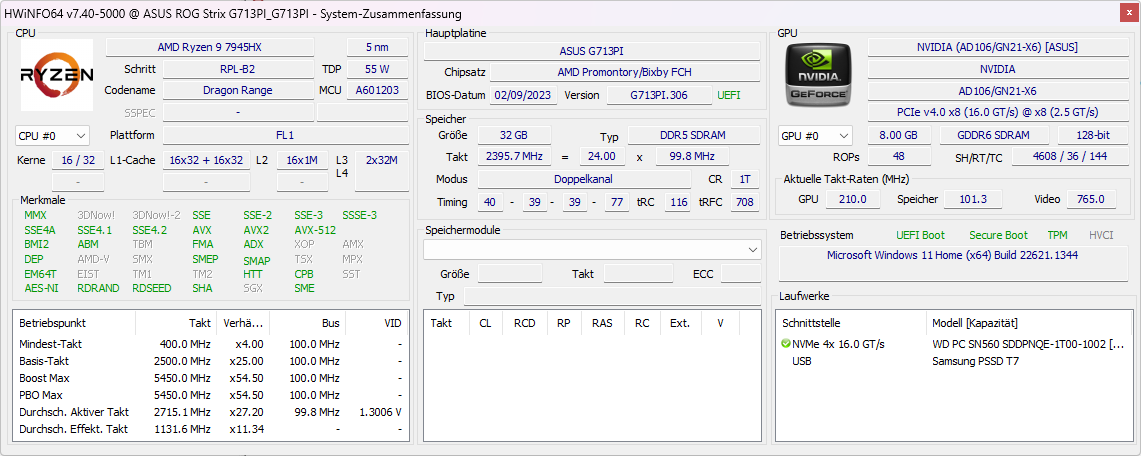
华硕ROG Strix G17只是勉强错过了在高端领域的位置,但这肯定不是CPU的错,它是目前最强大的模型之一。再加上我们的G713PI-LL005W测试装置中的32GB DDR5-RAM,这在高计算性能方面没有疑问。另一方面,显卡仍有一些改进的余地。
然而,RTX 4070应该仍然可以让你舒适地玩大多数游戏,甚至更复杂的游戏,在最高细节水平和全分辨率下。如果你想要尽可能高的帧率,你更有可能在全高清分辨率下实现这一目标。对于带有RTX 4060和RTX 4050的型号,你相应地要期待一些更多的妥协。
测试条件
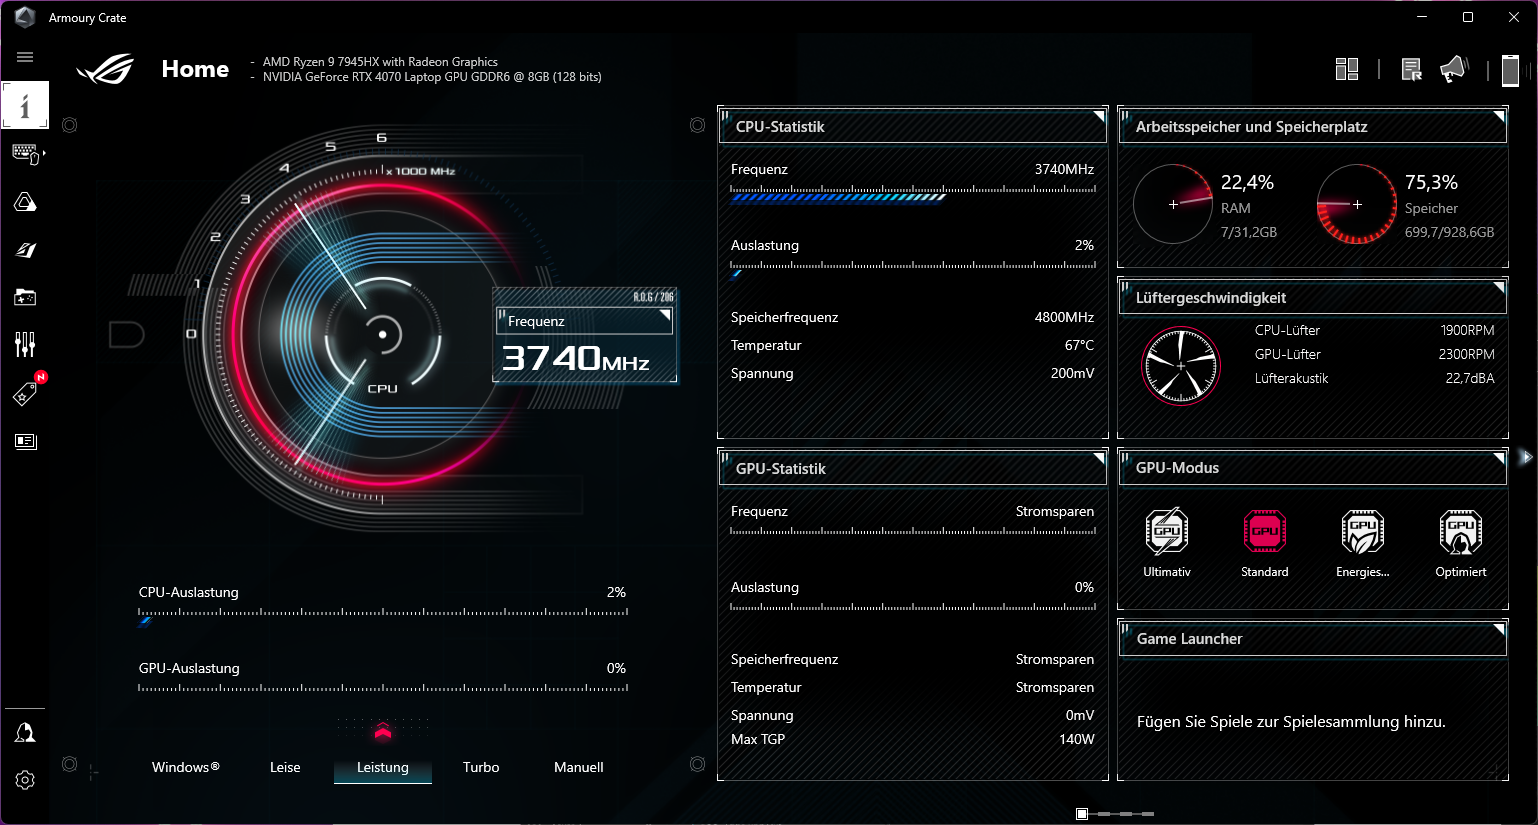
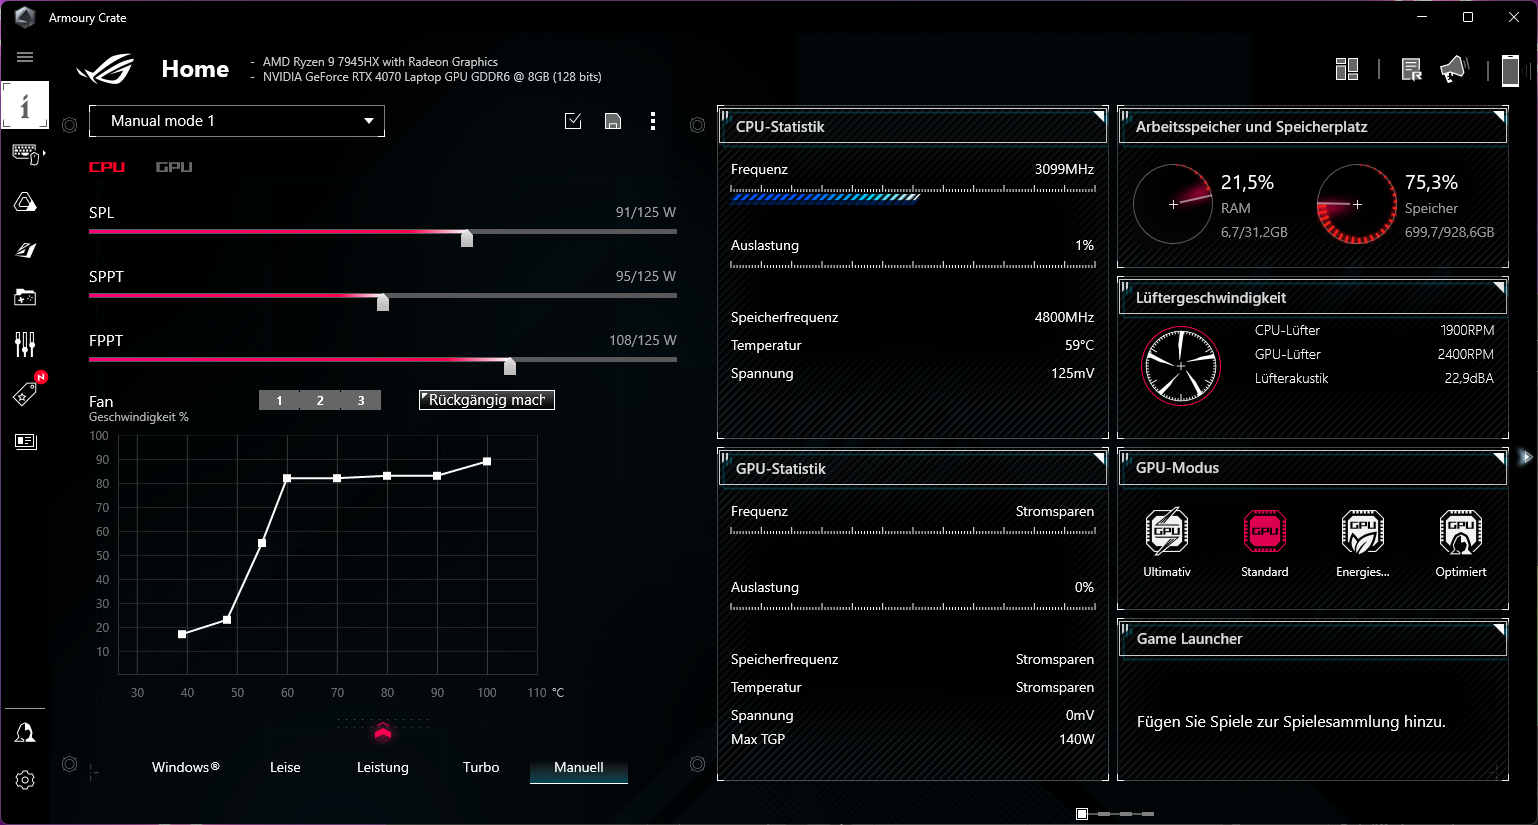
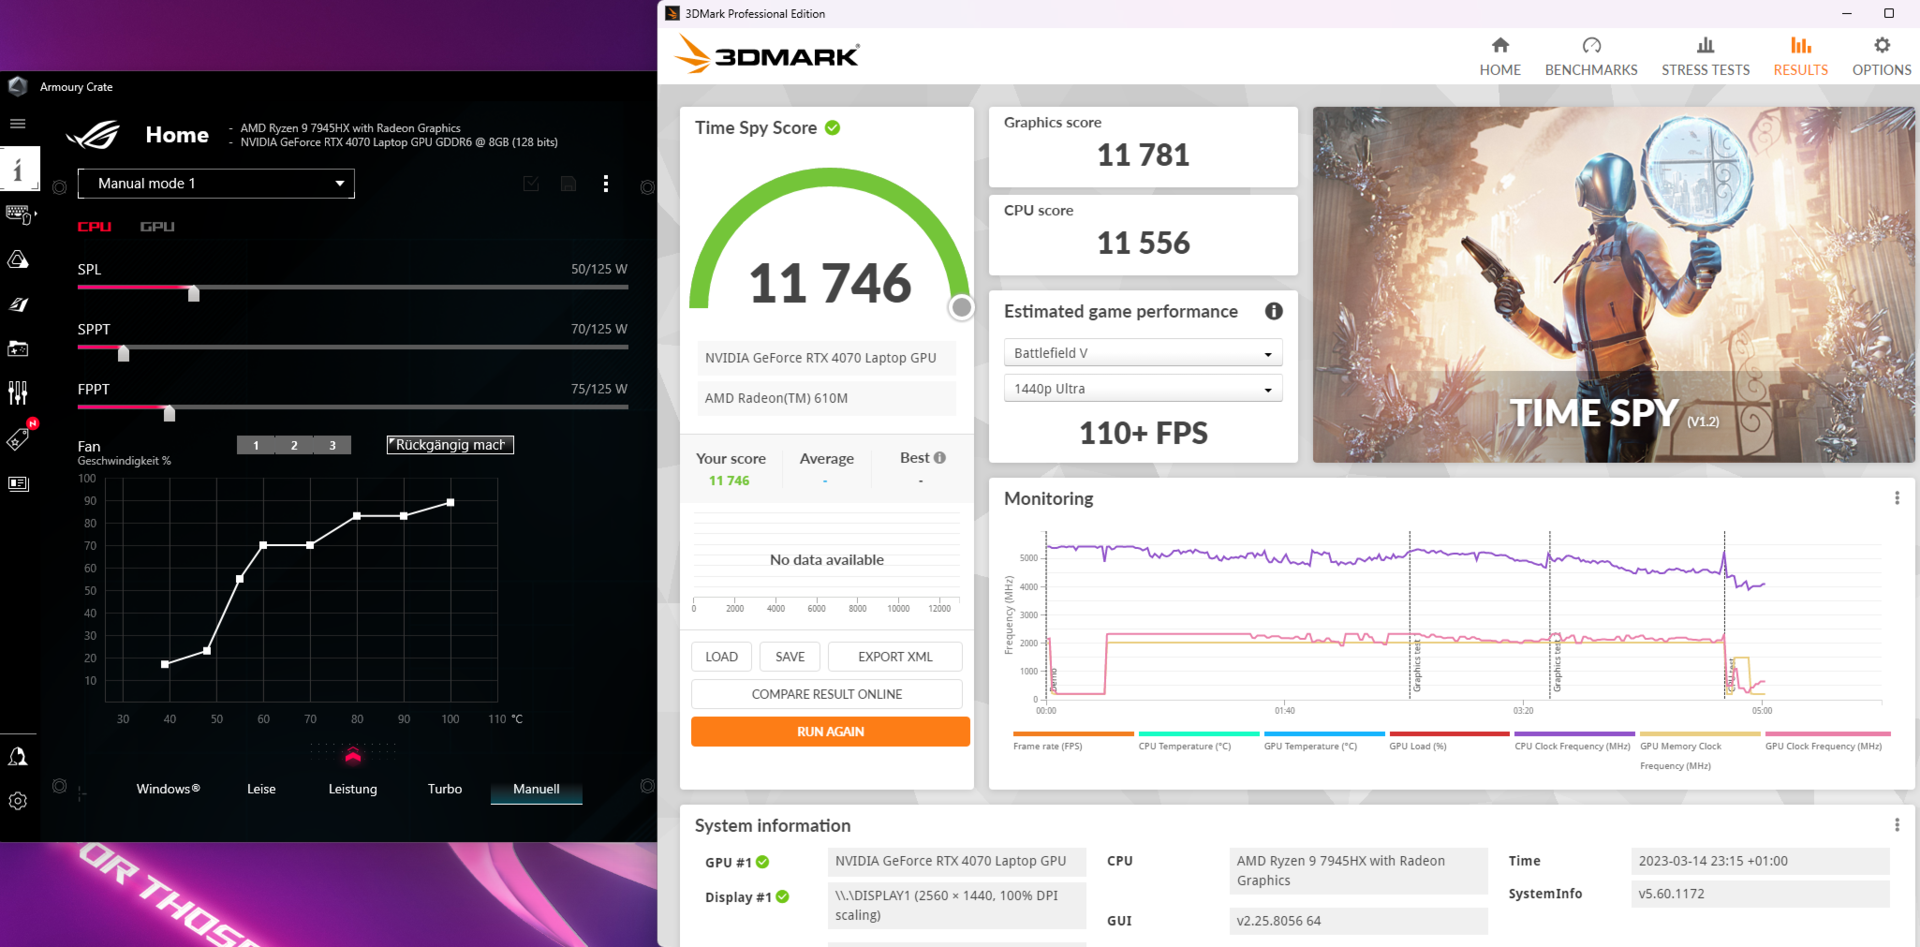
华硕在ROG Strix G17中包含了一系列的电源配置文件,为各种情况下的系统性能以及排放提供调整。使用手动设置选项,你可以进一步调整它们,甚至完全改变它们。
我们使用 "性能 "模式进行了所有的基准测试。根据华硕的说法,这种模式提供了高计算性能,同时至少限制了噪音的发展。为了进行比较,我们还包括在Cinebench-R15恒定负载测试中使用 "Turbo "模式的额外测量,以显示可能的最大性能。然而,如果不使用耳机或在高环境温度下,这种模式并不推荐自己。
该处理器在几乎所有情况下都以不同的功率限制运行,但功耗总是相当大,尽管它仍然适合高计算性能。
| PL2 | PL1 | |
| 性能模式 | 120 W | 90 W |
| 涡轮模式 | 125 W | 125 W |
| 静音模式 | 100 W | 65 W |
| 性能(电池) | 120 W | 60 W |
| 静音(电池) | 100 W | 40 W |
处理器
淘宝网AMD Ryzen 9 7945HX采用目前的Zen4架构,能够提供可观的性能值。仅仅是其16个内核和32个线程就确保了大量的性能储备,允许最高时钟速度达到5.4GHz。在缓存方面也不缺乏,16MB的二级缓存,特别是64MB的三级缓存确保了最低的加载时间。
我们在各种CPU基准测试中的性能评级显示了这在实践中意味着什么。AMD的Zen4处理器几乎在整个过程中都处于领先地位。只有在仅由单个计算核心执行的任务中,英特尔的CPU仍然领先。在Cinebench R15的持续负载测试中,7945HX在涡轮模式下能够超过 英特尔酷睿i9-13980HX(也是在Turbo模式下)超过约20%。在Cinebench R23中,这一数值至少还有5%。与AMD前一代Zen3架构的处理器相比,其性能差异更加显著。这款 AMD Ryzen 9 6900HX几乎没有达到一半的分数,与 英特尔酷睿i9-12950HX也没有做得更好。
功耗保持在大约相同的水平。借此,AMD能够实现其计算核心效率的巨大提高。目前你很难用任何移动处理器实现更高的性能。
你可以在我们的 "CPU基准列表 "中找到更多的性能数据和比较。 CPU基准测试列表.
Cinebench R15 Multi Constant Load Test
Cinebench R23: Multi Core | Single Core
Cinebench R20: CPU (Multi Core) | CPU (Single Core)
Cinebench R15: CPU Multi 64Bit | CPU Single 64Bit
Blender: v2.79 BMW27 CPU
7-Zip 18.03: 7z b 4 | 7z b 4 -mmt1
Geekbench 5.5: Multi-Core | Single-Core
HWBOT x265 Benchmark v2.2: 4k Preset
LibreOffice : 20 Documents To PDF
R Benchmark 2.5: Overall mean
| CPU Performance rating | |
| Average AMD Ryzen 9 7945HX | |
| Asus Zephyrus Duo 16 GX650PY-NM006W | |
| Asus ROG Strix G16 G614JZ | |
| Asus ROG Strix G17 G713PI | |
| Razer Blade 18 RTX 4070 | |
| Average of class Gaming | |
| Asus ROG Strix Scar 17 SE G733CX-LL014W | |
| Asus ROG Strix G18 G814JI | |
| Alienware m17 R5 (R9 6900HX, RX 6850M XT) | |
| Cinebench R23 / Multi Core | |
| Asus Zephyrus Duo 16 GX650PY-NM006W | |
| Average AMD Ryzen 9 7945HX (30783 - 34613, n=9) | |
| Asus ROG Strix G17 G713PI | |
| Asus ROG Strix G16 G614JZ | |
| Razer Blade 18 RTX 4070 | |
| Average of class Gaming (10488 - 42661, n=107, last 2 years) | |
| Asus ROG Strix G18 G814JI | |
| Asus ROG Strix Scar 17 SE G733CX-LL014W | |
| Alienware m17 R5 (R9 6900HX, RX 6850M XT) | |
| Cinebench R23 / Single Core | |
| Asus ROG Strix G16 G614JZ | |
| Razer Blade 18 RTX 4070 | |
| Average of class Gaming (1166 - 2415, n=107, last 2 years) | |
| Asus Zephyrus Duo 16 GX650PY-NM006W | |
| Average AMD Ryzen 9 7945HX (1861 - 1957, n=9) | |
| Asus ROG Strix Scar 17 SE G733CX-LL014W | |
| Asus ROG Strix G18 G814JI | |
| Asus ROG Strix G17 G713PI | |
| Alienware m17 R5 (R9 6900HX, RX 6850M XT) | |
| Cinebench R20 / CPU (Multi Core) | |
| Asus Zephyrus Duo 16 GX650PY-NM006W | |
| Average AMD Ryzen 9 7945HX (10025 - 13769, n=9) | |
| Asus ROG Strix G16 G614JZ | |
| Razer Blade 18 RTX 4070 | |
| Average of class Gaming (4029 - 16433, n=106, last 2 years) | |
| Asus ROG Strix G17 G713PI | |
| Asus ROG Strix G18 G814JI | |
| Asus ROG Strix Scar 17 SE G733CX-LL014W | |
| Alienware m17 R5 (R9 6900HX, RX 6850M XT) | |
| Cinebench R20 / CPU (Single Core) | |
| Asus ROG Strix G16 G614JZ | |
| Razer Blade 18 RTX 4070 | |
| Average of class Gaming (442 - 913, n=106, last 2 years) | |
| Asus Zephyrus Duo 16 GX650PY-NM006W | |
| Average AMD Ryzen 9 7945HX (712 - 760, n=9) | |
| Asus ROG Strix Scar 17 SE G733CX-LL014W | |
| Asus ROG Strix G18 G814JI | |
| Asus ROG Strix G17 G713PI | |
| Alienware m17 R5 (R9 6900HX, RX 6850M XT) | |
| Cinebench R15 / CPU Multi 64Bit | |
| Asus Zephyrus Duo 16 GX650PY-NM006W | |
| Average AMD Ryzen 9 7945HX (4998 - 5663, n=10) | |
| Asus ROG Strix G17 G713PI | |
| Asus ROG Strix G16 G614JZ | |
| Asus ROG Strix G16 G614JZ | |
| Razer Blade 18 RTX 4070 | |
| Average of class Gaming (1578 - 6330, n=105, last 2 years) | |
| Asus ROG Strix G18 G814JI | |
| Asus ROG Strix Scar 17 SE G733CX-LL014W | |
| Alienware m17 R5 (R9 6900HX, RX 6850M XT) | |
| Cinebench R15 / CPU Single 64Bit | |
| Asus Zephyrus Duo 16 GX650PY-NM006W | |
| Asus ROG Strix G16 G614JZ | |
| Asus ROG Strix G16 G614JZ | |
| Average AMD Ryzen 9 7945HX (290 - 311, n=10) | |
| Razer Blade 18 RTX 4070 | |
| Average of class Gaming (188.8 - 350, n=106, last 2 years) | |
| Asus ROG Strix G17 G713PI | |
| Asus ROG Strix G18 G814JI | |
| Asus ROG Strix Scar 17 SE G733CX-LL014W | |
| Alienware m17 R5 (R9 6900HX, RX 6850M XT) | |
| Blender / v2.79 BMW27 CPU | |
| Alienware m17 R5 (R9 6900HX, RX 6850M XT) | |
| Asus ROG Strix Scar 17 SE G733CX-LL014W | |
| Asus ROG Strix G18 G814JI | |
| Average of class Gaming (79 - 330, n=104, last 2 years) | |
| Razer Blade 18 RTX 4070 | |
| Asus ROG Strix G16 G614JZ | |
| Asus ROG Strix G17 G713PI | |
| Average AMD Ryzen 9 7945HX (87 - 100, n=9) | |
| Asus Zephyrus Duo 16 GX650PY-NM006W | |
| 7-Zip 18.03 / 7z b 4 | |
| Asus Zephyrus Duo 16 GX650PY-NM006W | |
| Average AMD Ryzen 9 7945HX (123364 - 140932, n=9) | |
| Asus ROG Strix G17 G713PI | |
| Razer Blade 18 RTX 4070 | |
| Asus ROG Strix G16 G614JZ | |
| Average of class Gaming (33491 - 148086, n=105, last 2 years) | |
| Asus ROG Strix G18 G814JI | |
| Asus ROG Strix Scar 17 SE G733CX-LL014W | |
| Alienware m17 R5 (R9 6900HX, RX 6850M XT) | |
| 7-Zip 18.03 / 7z b 4 -mmt1 | |
| Average AMD Ryzen 9 7945HX (7319 - 7711, n=9) | |
| Asus ROG Strix G17 G713PI | |
| Asus Zephyrus Duo 16 GX650PY-NM006W | |
| Asus ROG Strix G16 G614JZ | |
| Razer Blade 18 RTX 4070 | |
| Average of class Gaming (4199 - 7436, n=105, last 2 years) | |
| Asus ROG Strix Scar 17 SE G733CX-LL014W | |
| Asus ROG Strix G18 G814JI | |
| Alienware m17 R5 (R9 6900HX, RX 6850M XT) | |
| Geekbench 5.5 / Multi-Core | |
| Razer Blade 18 RTX 4070 | |
| Average AMD Ryzen 9 7945HX (18372 - 20394, n=9) | |
| Asus Zephyrus Duo 16 GX650PY-NM006W | |
| Asus ROG Strix G16 G614JZ | |
| Asus ROG Strix G17 G713PI | |
| Average of class Gaming (6460 - 28263, n=105, last 2 years) | |
| Asus ROG Strix Scar 17 SE G733CX-LL014W | |
| Asus ROG Strix G18 G814JI | |
| Alienware m17 R5 (R9 6900HX, RX 6850M XT) | |
| Geekbench 5.5 / Single-Core | |
| Asus Zephyrus Duo 16 GX650PY-NM006W | |
| Average AMD Ryzen 9 7945HX (1960 - 2158, n=9) | |
| Average of class Gaming (986 - 2474, n=105, last 2 years) | |
| Asus ROG Strix G17 G713PI | |
| Asus ROG Strix G16 G614JZ | |
| Razer Blade 18 RTX 4070 | |
| Asus ROG Strix Scar 17 SE G733CX-LL014W | |
| Asus ROG Strix G18 G814JI | |
| Alienware m17 R5 (R9 6900HX, RX 6850M XT) | |
| HWBOT x265 Benchmark v2.2 / 4k Preset | |
| Average AMD Ryzen 9 7945HX (33.8 - 37.6, n=8) | |
| Asus Zephyrus Duo 16 GX650PY-NM006W | |
| Asus ROG Strix G17 G713PI | |
| Razer Blade 18 RTX 4070 | |
| Asus ROG Strix G16 G614JZ | |
| Average of class Gaming (11.5 - 44.4, n=105, last 2 years) | |
| Asus ROG Strix G18 G814JI | |
| Asus ROG Strix Scar 17 SE G733CX-LL014W | |
| Alienware m17 R5 (R9 6900HX, RX 6850M XT) | |
| LibreOffice / 20 Documents To PDF | |
| Asus Zephyrus Duo 16 GX650PY-NM006W | |
| Asus ROG Strix G18 G814JI | |
| Alienware m17 R5 (R9 6900HX, RX 6850M XT) | |
| Average of class Gaming (33.2 - 88.8, n=105, last 2 years) | |
| Asus ROG Strix G16 G614JZ | |
| Asus ROG Strix G17 G713PI | |
| Average AMD Ryzen 9 7945HX (35.5 - 60.4, n=8) | |
| Razer Blade 18 RTX 4070 | |
| Asus ROG Strix Scar 17 SE G733CX-LL014W | |
| R Benchmark 2.5 / Overall mean | |
| Alienware m17 R5 (R9 6900HX, RX 6850M XT) | |
| Asus ROG Strix G18 G814JI | |
| Average of class Gaming (0.3439 - 0.759, n=106, last 2 years) | |
| Asus ROG Strix Scar 17 SE G733CX-LL014W | |
| Asus ROG Strix G17 G713PI | |
| Average AMD Ryzen 9 7945HX (0.3884 - 0.4159, n=8) | |
| Asus Zephyrus Duo 16 GX650PY-NM006W | |
| Razer Blade 18 RTX 4070 | |
| Asus ROG Strix G16 G614JZ | |
* ... smaller is better
AIDA64: FP32 Ray-Trace | FPU Julia | CPU SHA3 | CPU Queen | FPU SinJulia | FPU Mandel | CPU AES | CPU ZLib | FP64 Ray-Trace | CPU PhotoWorxx
| Performance rating | |
| Average AMD Ryzen 9 7945HX | |
| Asus ROG Strix G17 G713PI | |
| Razer Blade 18 RTX 4070 | |
| Asus ROG Strix G16 G614JZ | |
| Average of class Gaming | |
| Asus ROG Strix Scar 17 SE G733CX-LL014W | |
| Asus ROG Strix G18 G814JI | |
| AIDA64 / FP32 Ray-Trace | |
| Average AMD Ryzen 9 7945HX (50388 - 60169, n=7) | |
| Asus ROG Strix G17 G713PI | |
| Average of class Gaming (10227 - 85542, n=105, last 2 years) | |
| Asus ROG Strix G16 G614JZ | |
| Razer Blade 18 RTX 4070 | |
| Asus ROG Strix G18 G814JI | |
| Asus ROG Strix Scar 17 SE G733CX-LL014W | |
| AIDA64 / FPU Julia | |
| Asus ROG Strix G17 G713PI | |
| Average AMD Ryzen 9 7945HX (201874 - 252486, n=7) | |
| Average of class Gaming (51376 - 238426, n=105, last 2 years) | |
| Asus ROG Strix G16 G614JZ | |
| Razer Blade 18 RTX 4070 | |
| Asus ROG Strix G18 G814JI | |
| Asus ROG Strix Scar 17 SE G733CX-LL014W | |
| AIDA64 / CPU SHA3 | |
| Average AMD Ryzen 9 7945HX (8525 - 10389, n=7) | |
| Asus ROG Strix G17 G713PI | |
| Asus ROG Strix G16 G614JZ | |
| Average of class Gaming (2180 - 10115, n=105, last 2 years) | |
| Razer Blade 18 RTX 4070 | |
| Asus ROG Strix G18 G814JI | |
| Asus ROG Strix Scar 17 SE G733CX-LL014W | |
| AIDA64 / CPU Queen | |
| Average AMD Ryzen 9 7945HX (175041 - 200651, n=7) | |
| Asus ROG Strix G17 G713PI | |
| Asus ROG Strix G16 G614JZ | |
| Razer Blade 18 RTX 4070 | |
| Average of class Gaming (49785 - 173351, n=90, last 2 years) | |
| Asus ROG Strix G18 G814JI | |
| Asus ROG Strix Scar 17 SE G733CX-LL014W | |
| AIDA64 / FPU SinJulia | |
| Average AMD Ryzen 9 7945HX (28794 - 32988, n=7) | |
| Asus ROG Strix G17 G713PI | |
| Asus ROG Strix G16 G614JZ | |
| Razer Blade 18 RTX 4070 | |
| Average of class Gaming (4424 - 33636, n=105, last 2 years) | |
| Asus ROG Strix Scar 17 SE G733CX-LL014W | |
| Asus ROG Strix G18 G814JI | |
| AIDA64 / FPU Mandel | |
| Average AMD Ryzen 9 7945HX (105740 - 134044, n=7) | |
| Asus ROG Strix G17 G713PI | |
| Average of class Gaming (25115 - 128721, n=105, last 2 years) | |
| Asus ROG Strix G16 G614JZ | |
| Razer Blade 18 RTX 4070 | |
| Asus ROG Strix G18 G814JI | |
| Asus ROG Strix Scar 17 SE G733CX-LL014W | |
| AIDA64 / CPU AES | |
| Average AMD Ryzen 9 7945HX (126790 - 325960, n=7) | |
| Asus ROG Strix G17 G713PI | |
| Asus ROG Strix Scar 17 SE G733CX-LL014W | |
| Asus ROG Strix G16 G614JZ | |
| Razer Blade 18 RTX 4070 | |
| Average of class Gaming (39258 - 247074, n=105, last 2 years) | |
| Asus ROG Strix G18 G814JI | |
| AIDA64 / CPU ZLib | |
| Average AMD Ryzen 9 7945HX (2022 - 2409, n=7) | |
| Asus ROG Strix G17 G713PI | |
| Asus ROG Strix G16 G614JZ | |
| Razer Blade 18 RTX 4070 | |
| Average of class Gaming (574 - 2531, n=105, last 2 years) | |
| Asus ROG Strix G18 G814JI | |
| Asus ROG Strix Scar 17 SE G733CX-LL014W | |
| AIDA64 / FP64 Ray-Trace | |
| Average AMD Ryzen 9 7945HX (26875 - 31796, n=7) | |
| Asus ROG Strix G17 G713PI | |
| Average of class Gaming (5509 - 45446, n=105, last 2 years) | |
| Asus ROG Strix G16 G614JZ | |
| Razer Blade 18 RTX 4070 | |
| Asus ROG Strix G18 G814JI | |
| Asus ROG Strix Scar 17 SE G733CX-LL014W | |
| AIDA64 / CPU PhotoWorxx | |
| Razer Blade 18 RTX 4070 | |
| Average of class Gaming (12271 - 89891, n=105, last 2 years) | |
| Asus ROG Strix Scar 17 SE G733CX-LL014W | |
| Asus ROG Strix G18 G814JI | |
| Asus ROG Strix G16 G614JZ | |
| Average AMD Ryzen 9 7945HX (31421 - 40095, n=7) | |
| Asus ROG Strix G17 G713PI | |
系统性能
基本上,华硕ROG Strix的一切工作都很快。安装程序、删除和轻松地并行运行几个应用程序,对这款游戏笔记本电脑来说根本不构成任何问题。几乎没有任何等待时间,特别是由于处理器在整个过程中都在高水平运行。
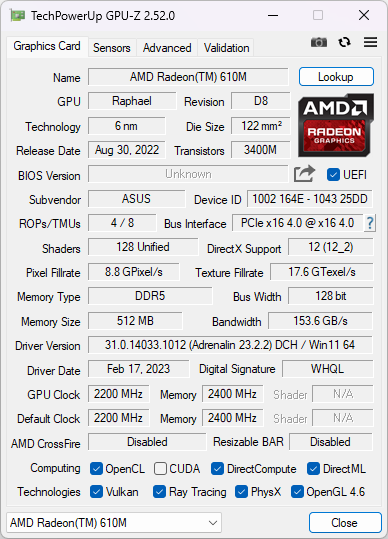
另一方面,在内部的 AMD Radeon 610M和NvidiaGeForce RTX 4070并非毫无问题。偶尔,在启动某些程序时,你会看到黑屏,而且不仅是在游戏时。激活Nvidia Optimus时也是这种情况。我们还必须注意到,dGPU被反复赋予一些任务,例如在冲浪时。这不必要地增加了功耗或减少了电池运行时的运行时间。
然而,我们应该希望一些额外的驱动程序更新能够纠正这些行为。但在那之前,通过Armoury Crate在主电源操作中关闭集成图形可能是明智之举。这将改善用户体验,特别是当经常在程序之间切换时。两个图形芯片之间的无摩擦合作会更好。
CrossMark: Overall | Productivity | Creativity | Responsiveness
| PCMark 10 / Score | |
| Asus Zephyrus Duo 16 GX650PY-NM006W | |
| Average of class Gaming (5828 - 12414, n=93, last 2 years) | |
| Average AMD Ryzen 9 7945HX, NVIDIA GeForce RTX 4070 Laptop GPU (7449 - 8334, n=2) | |
| Razer Blade 18 RTX 4070 | |
| Asus ROG Strix G17 G713PI | |
| Alienware m17 R5 (R9 6900HX, RX 6850M XT) | |
| Asus ROG Strix G16 G614JZ | |
| Asus ROG Strix Scar 17 SE G733CX-LL014W | |
| Asus ROG Strix G18 G814JI | |
| PCMark 10 / Essentials | |
| Asus Zephyrus Duo 16 GX650PY-NM006W | |
| Asus ROG Strix G16 G614JZ | |
| Razer Blade 18 RTX 4070 | |
| Average AMD Ryzen 9 7945HX, NVIDIA GeForce RTX 4070 Laptop GPU (11166 - 11364, n=2) | |
| Asus ROG Strix G17 G713PI | |
| Average of class Gaming (8810 - 11935, n=97, last 2 years) | |
| Asus ROG Strix Scar 17 SE G733CX-LL014W | |
| Alienware m17 R5 (R9 6900HX, RX 6850M XT) | |
| Asus ROG Strix G18 G814JI | |
| PCMark 10 / Productivity | |
| Asus Zephyrus Duo 16 GX650PY-NM006W | |
| Average of class Gaming (6845 - 25323, n=95, last 2 years) | |
| Asus ROG Strix G17 G713PI | |
| Average AMD Ryzen 9 7945HX, NVIDIA GeForce RTX 4070 Laptop GPU (10441 - 11087, n=2) | |
| Asus ROG Strix Scar 17 SE G733CX-LL014W | |
| Razer Blade 18 RTX 4070 | |
| Alienware m17 R5 (R9 6900HX, RX 6850M XT) | |
| Asus ROG Strix G18 G814JI | |
| Asus ROG Strix G16 G614JZ | |
| PCMark 10 / Digital Content Creation | |
| Asus Zephyrus Duo 16 GX650PY-NM006W | |
| Average of class Gaming (7602 - 19954, n=95, last 2 years) | |
| Alienware m17 R5 (R9 6900HX, RX 6850M XT) | |
| Average AMD Ryzen 9 7945HX, NVIDIA GeForce RTX 4070 Laptop GPU (9062 - 13239, n=2) | |
| Asus ROG Strix G16 G614JZ | |
| Razer Blade 18 RTX 4070 | |
| Asus ROG Strix Scar 17 SE G733CX-LL014W | |
| Asus ROG Strix G17 G713PI | |
| Asus ROG Strix G18 G814JI | |
| CrossMark / Overall | |
| Asus ROG Strix G16 G614JZ | |
| Razer Blade 18 RTX 4070 | |
| Asus ROG Strix Scar 17 SE G733CX-LL014W | |
| Asus Zephyrus Duo 16 GX650PY-NM006W | |
| Average AMD Ryzen 9 7945HX, NVIDIA GeForce RTX 4070 Laptop GPU (2037 - 2044, n=2) | |
| Asus ROG Strix G17 G713PI | |
| Average of class Gaming (1366 - 2409, n=94, last 2 years) | |
| Alienware m17 R5 (R9 6900HX, RX 6850M XT) | |
| CrossMark / Productivity | |
| Asus ROG Strix G16 G614JZ | |
| Razer Blade 18 RTX 4070 | |
| Asus ROG Strix Scar 17 SE G733CX-LL014W | |
| Asus Zephyrus Duo 16 GX650PY-NM006W | |
| Asus ROG Strix G17 G713PI | |
| Average AMD Ryzen 9 7945HX, NVIDIA GeForce RTX 4070 Laptop GPU (1909 - 1917, n=2) | |
| Average of class Gaming (1386 - 2254, n=94, last 2 years) | |
| Alienware m17 R5 (R9 6900HX, RX 6850M XT) | |
| CrossMark / Creativity | |
| Asus ROG Strix G16 G614JZ | |
| Razer Blade 18 RTX 4070 | |
| Asus Zephyrus Duo 16 GX650PY-NM006W | |
| Asus ROG Strix Scar 17 SE G733CX-LL014W | |
| Average AMD Ryzen 9 7945HX, NVIDIA GeForce RTX 4070 Laptop GPU (2313 - 2335, n=2) | |
| Asus ROG Strix G17 G713PI | |
| Average of class Gaming (1343 - 2786, n=94, last 2 years) | |
| Alienware m17 R5 (R9 6900HX, RX 6850M XT) | |
| CrossMark / Responsiveness | |
| Asus ROG Strix G16 G614JZ | |
| Asus ROG Strix Scar 17 SE G733CX-LL014W | |
| Razer Blade 18 RTX 4070 | |
| Average of class Gaming (1226 - 2334, n=94, last 2 years) | |
| Asus Zephyrus Duo 16 GX650PY-NM006W | |
| Average AMD Ryzen 9 7945HX, NVIDIA GeForce RTX 4070 Laptop GPU (1671 - 1682, n=2) | |
| Asus ROG Strix G17 G713PI | |
| Alienware m17 R5 (R9 6900HX, RX 6850M XT) | |
| PCMark 10 Score | 7449 points | |
Help | ||
| AIDA64 / Memory Copy | |
| Razer Blade 18 RTX 4070 | |
| Average of class Gaming (21750 - 129946, n=105, last 2 years) | |
| Asus ROG Strix G18 G814JI | |
| Asus ROG Strix Scar 17 SE G733CX-LL014W | |
| Asus ROG Strix G16 G614JZ | |
| Average AMD Ryzen 9 7945HX (48948 - 57953, n=7) | |
| Alienware m17 R5 (R9 6900HX, RX 6850M XT) | |
| Asus ROG Strix G17 G713PI | |
| AIDA64 / Memory Read | |
| Razer Blade 18 RTX 4070 | |
| Average of class Gaming (22956 - 118858, n=105, last 2 years) | |
| Asus ROG Strix G16 G614JZ | |
| Asus ROG Strix Scar 17 SE G733CX-LL014W | |
| Asus ROG Strix G18 G814JI | |
| Average AMD Ryzen 9 7945HX (56910 - 67753, n=7) | |
| Asus ROG Strix G17 G713PI | |
| Alienware m17 R5 (R9 6900HX, RX 6850M XT) | |
| AIDA64 / Memory Write | |
| Average of class Gaming (22297 - 135096, n=105, last 2 years) | |
| Razer Blade 18 RTX 4070 | |
| Asus ROG Strix Scar 17 SE G733CX-LL014W | |
| Average AMD Ryzen 9 7945HX (58602 - 70063, n=7) | |
| Asus ROG Strix G18 G814JI | |
| Asus ROG Strix G16 G614JZ | |
| Asus ROG Strix G17 G713PI | |
| Alienware m17 R5 (R9 6900HX, RX 6850M XT) | |
| AIDA64 / Memory Latency | |
| Average of class Gaming (75.3 - 259, n=105, last 2 years) | |
| Alienware m17 R5 (R9 6900HX, RX 6850M XT) | |
| Asus ROG Strix G16 G614JZ | |
| Asus ROG Strix G17 G713PI | |
| Asus ROG Strix Scar 17 SE G733CX-LL014W | |
| Razer Blade 18 RTX 4070 | |
| Average AMD Ryzen 9 7945HX (77.1 - 91.3, n=7) | |
| Asus ROG Strix G18 G814JI | |
* ... smaller is better
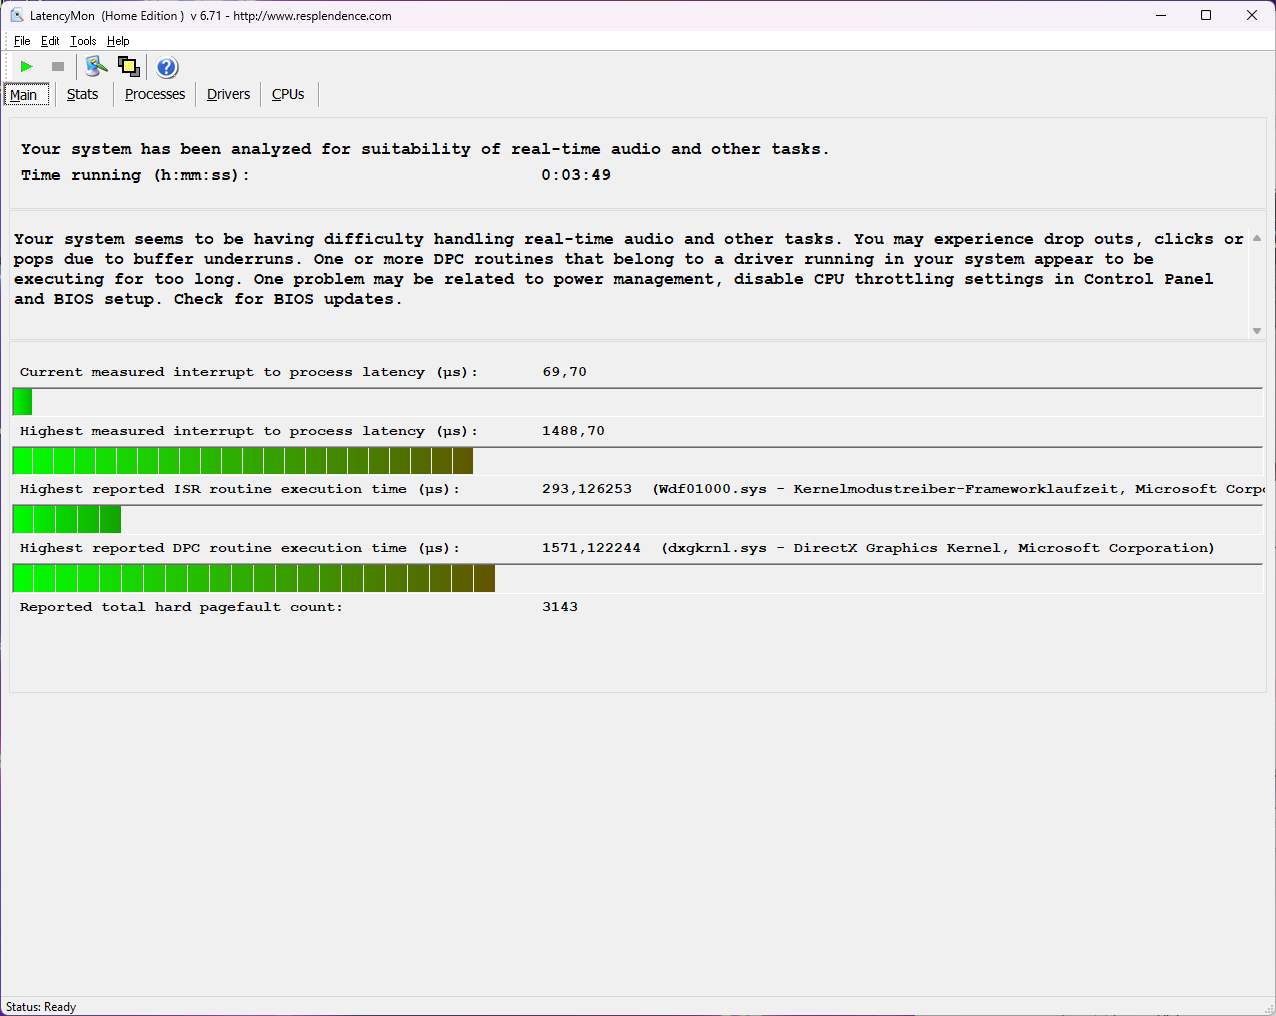
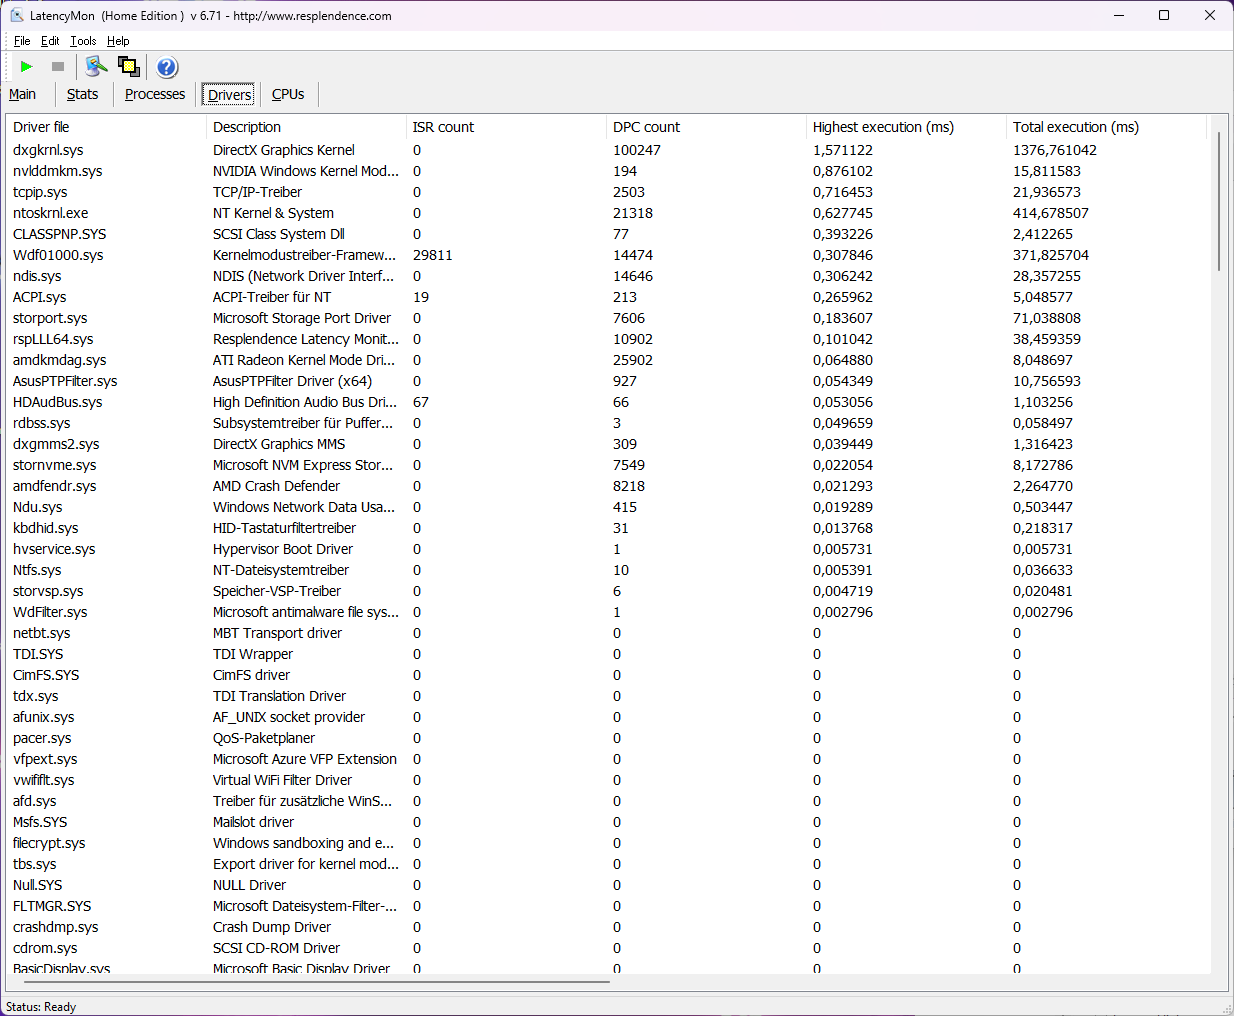
DPC延迟
对延迟的评估结果既不是特别好,也不是真的坏。然而,LatencyMon程序警告说,在实时音频处理方面可能存在一些问题。但无论如何,只有极少数笔记本电脑可以防止这种情况。
目前,Nvidia警告说其驱动程序存在延迟增加的问题。实际上,LatencyMon的驱动程序列表显示,只有那个特定的DirectX驱动程序是导致评估不理想的罪魁祸首。更新其他一些驱动程序也可能对结果产生积极或消极的影响。
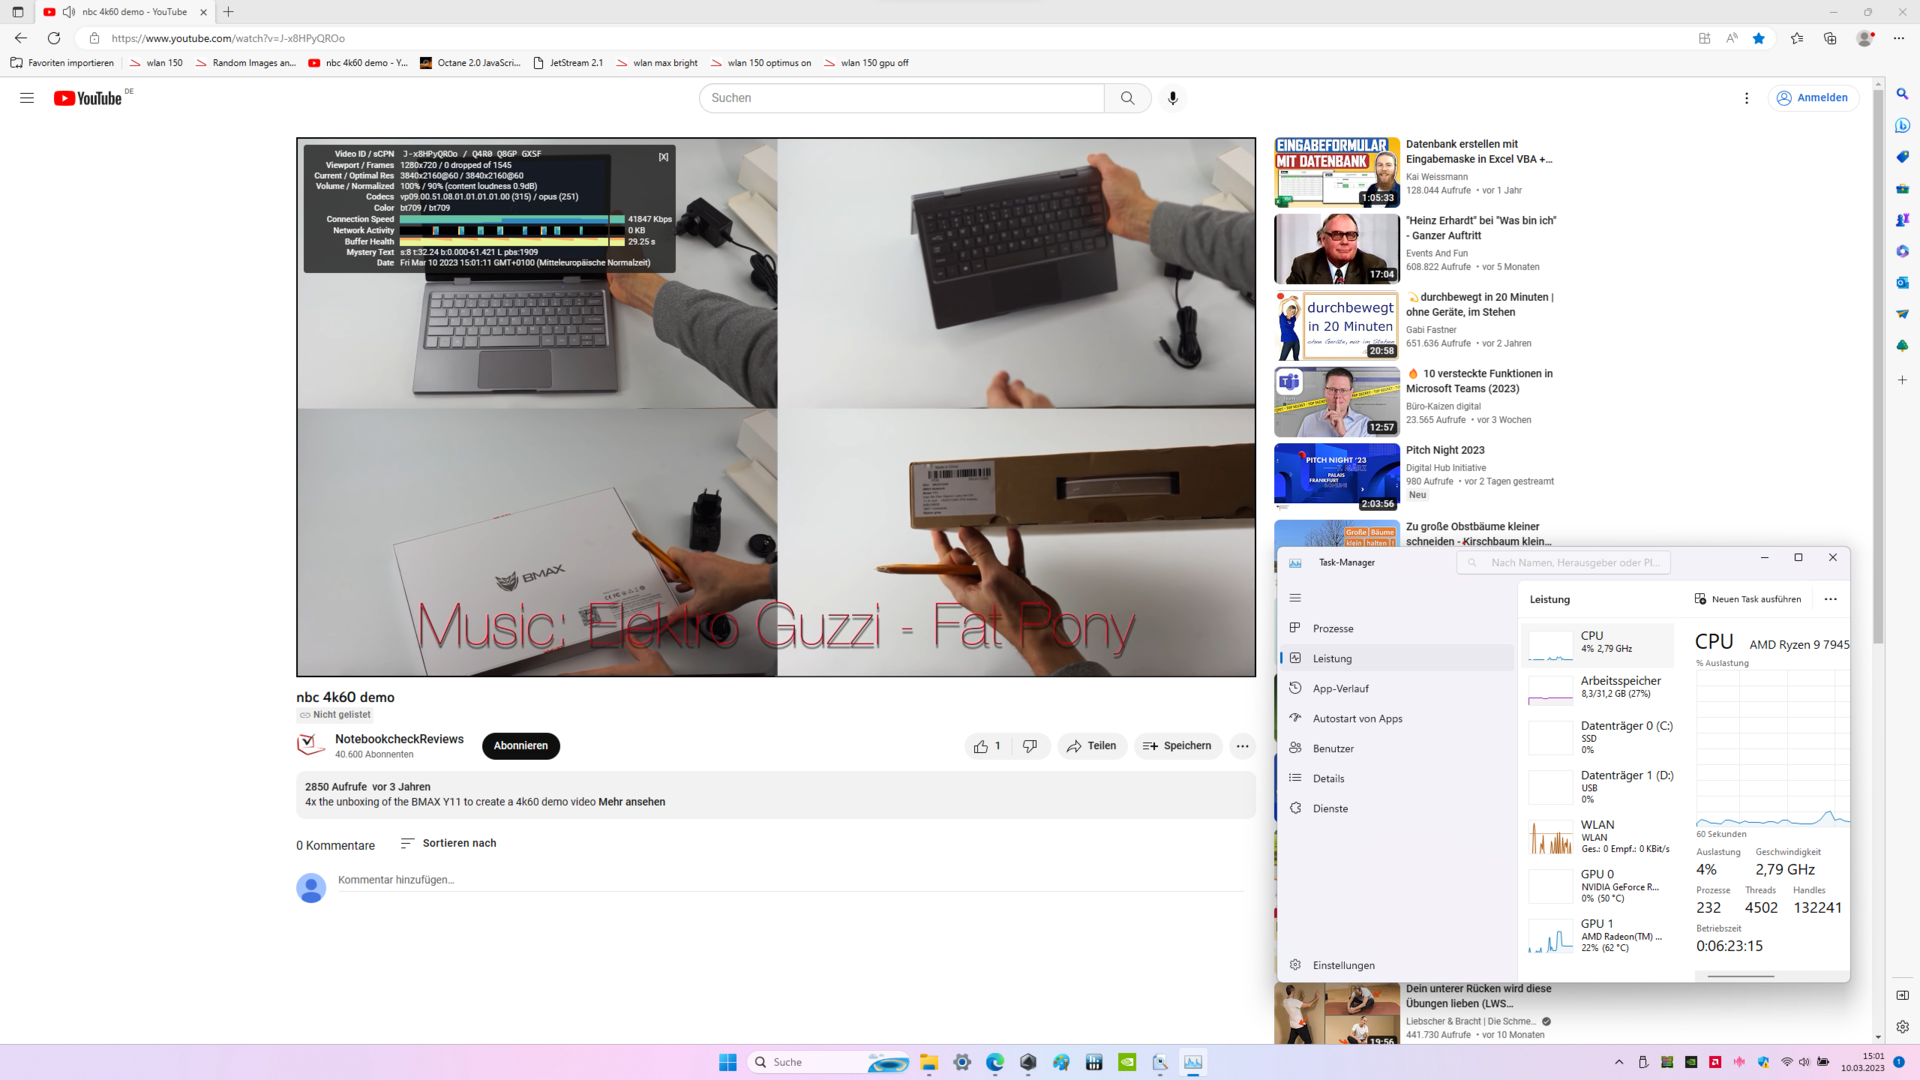
ROG Strix G17在4K视频流测试中表现非常好,但不太完美。CPU只被加载到4%,而且在视频再现中只有一个掉帧。
| DPC Latencies / LatencyMon - interrupt to process latency (max), Web, Youtube, Prime95 | |
| Asus Zephyrus Duo 16 GX650PY-NM006W | |
| Asus ROG Strix Scar 17 SE G733CX-LL014W | |
| Asus ROG Strix G16 G614JZ | |
| Asus ROG Strix G17 G713PI | |
| Alienware m17 R5 (R9 6900HX, RX 6850M XT) | |
| Razer Blade 18 RTX 4070 | |
| Asus ROG Strix G18 G814JI | |
* ... smaller is better
存储解决方案
这款固态硬盘原来有点弱。与竞争对手相比,它的读写性能无法跟上。但至少在恒定稳定传输率的测试中,结果是积极的,因为速度不需要因为高温而被节制。这里的一个负面例子是 华硕ROG Strix Scar 17带有M.2 SSD RAID,从长远来看,其极端传输率下降到SATA SSD的价值。
然而,在实际使用中,当游戏、渲染或冲浪时,固态硬盘略低的性能并没有明显的影响。

* ... smaller is better
Disk Throttling: DiskSpd Read Loop, Queue Depth 8
图形卡
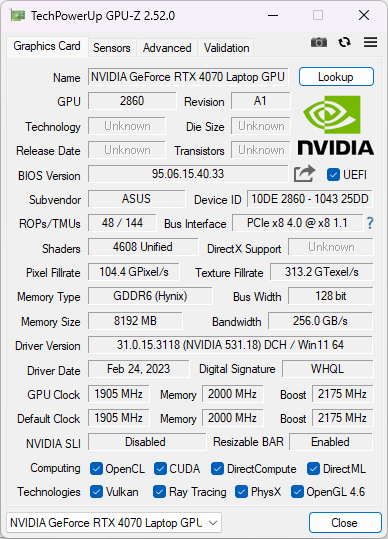
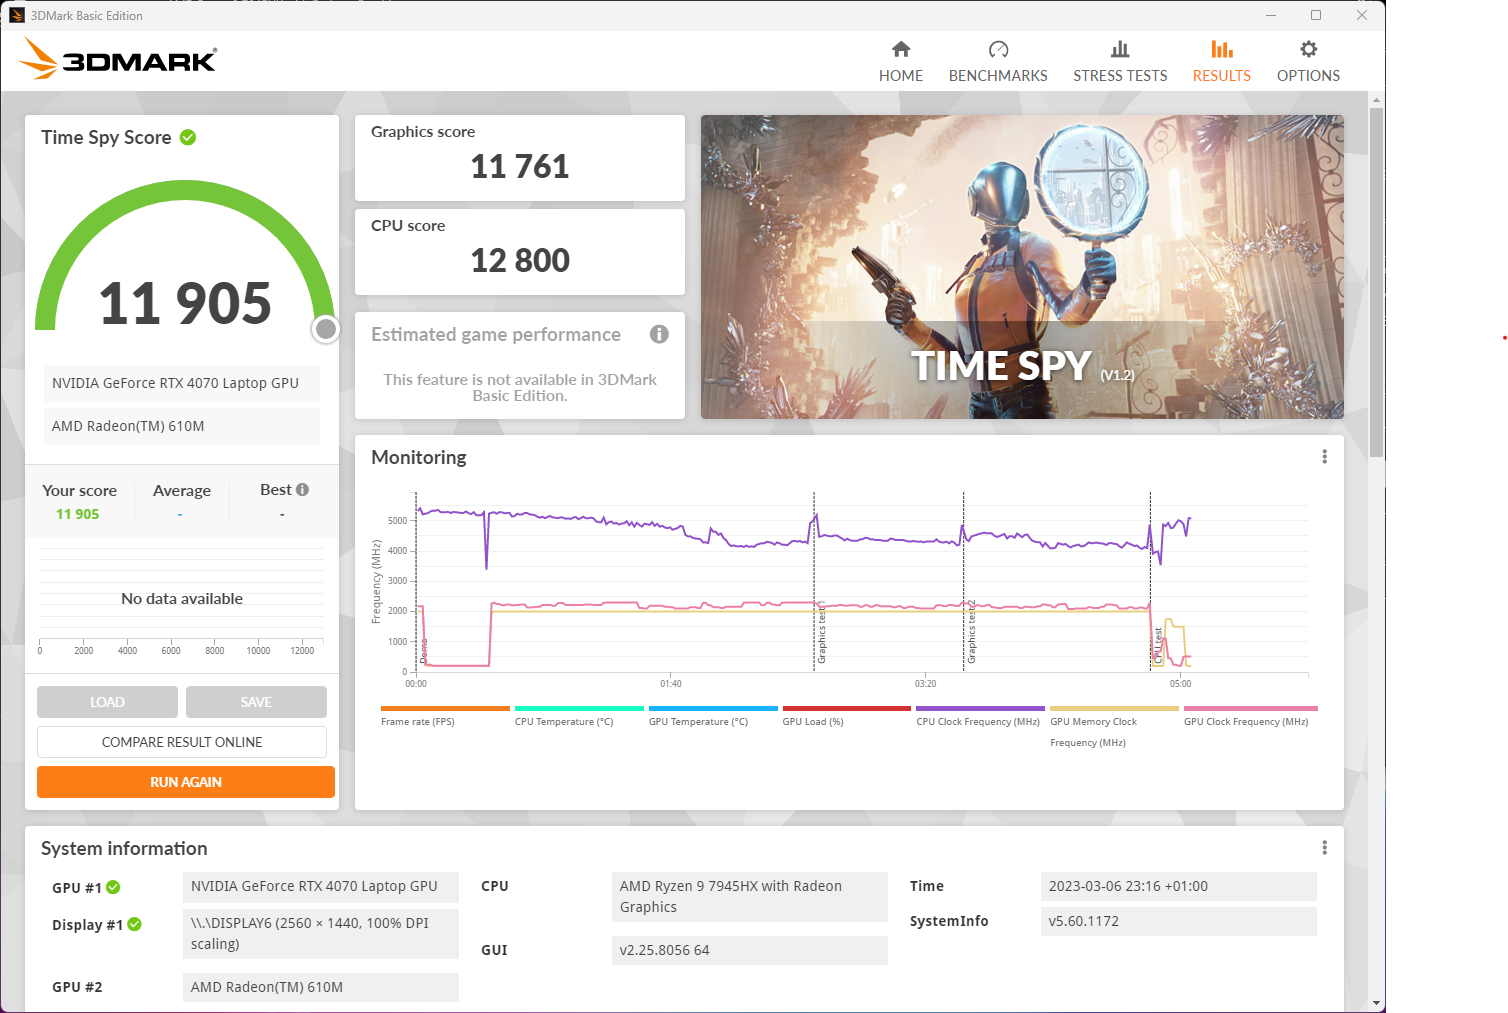
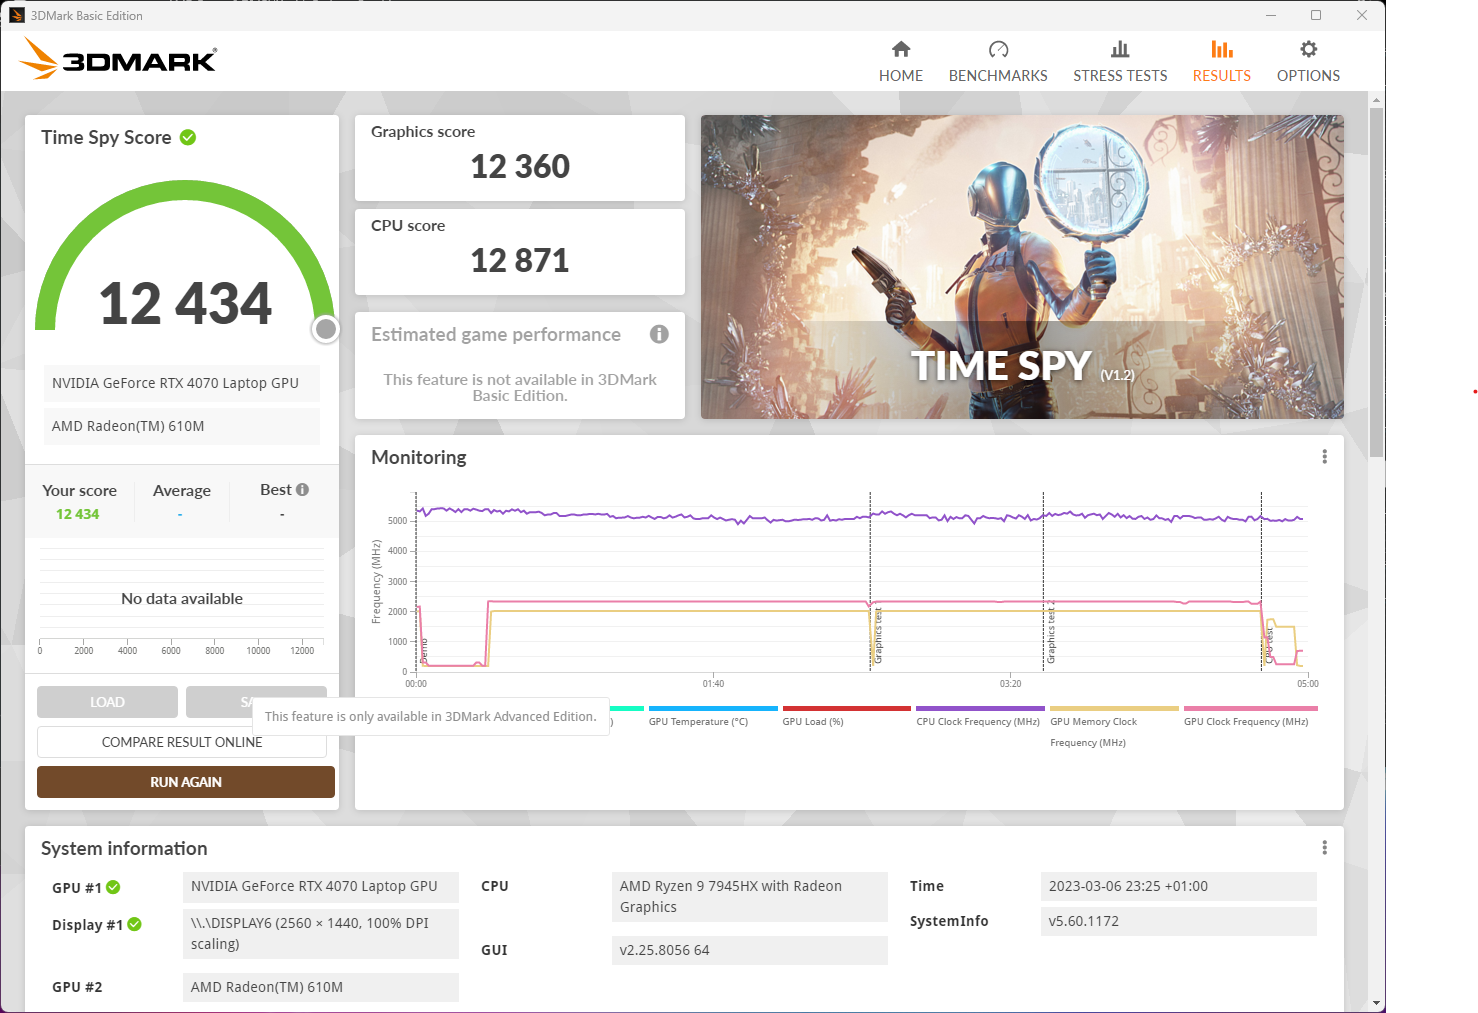
的NvidiaGeForce RTX 4070在ROG Strix G17中运行,制造商允许的最大功耗为115W。此外,另外25W可以从处理器转移,为GPU提供总共140W。华硕略微提高了时钟速度。该系统指定为2,225 MHz,而根据Nvidia的说法,2,175 MHz是可能的。这是一个略高于2%的增长,这几乎没有任何区别。
在我们的基准测试中,GPU的表现符合预期。它能够达到RTX 3080 Ti的水平,尽管在具体案例中,它能够多消耗35W的电力。因此,仍然需要注意的是,RTX-4000系列实现了明显的跳跃,不仅在性能方面,而且在效率方面。你可以在我们的GPU基准测试列表中找到我们收集的其他结果 。
| 3DMark 11 Performance | 34661 points | |
| 3DMark Cloud Gate Standard Score | 68557 points | |
| 3DMark Fire Strike Score | 28377 points | |
| 3DMark Time Spy Score | 11905 points | |
Help | ||
* ... smaller is better
游戏性能
即使是目前的游戏也可以在最大细节设置下以原生QHD分辨率流畅地玩。如果需要计算的像素数量像全高清分辨率那样减少一半,那么帧率几乎可以在整个过程中翻倍。
其结果是相当可观的。240赫兹的显示器使高帧率大放异彩,而从QHD到Full-HD的细节损失则容易承受。但高刷新率在每秒60帧时也有优势,因为输入延迟仍被大大降低。这意味着,即使在明显低于240帧的情况下,该显示器也总是能公正地完成其任务。
涡轮模式几乎没有带来任何改进(在Time-Spy基准测试中为5%),而噪音水平大幅增加。该系统在电池运行方面的表现也不算太差。虽然功耗大大降低,但仍达到主电源运行时性能的65%。
强大的处理器无法对这里的结果做出很大贡献。手动电源设置允许你将其功耗降低到最大75W和恒定50W,而不会因此导致更差的基准测试结果。 但这个程序其实是没有必要的,因为无论如何,CPU只允许在恒定负载下有明显较低的功耗。 如果在未来的某个时候有类似的型号,有一个较弱的处理器,它在游戏中的表现可能只差一点,所以相应地它可能是更好的选择。
| The Witcher 3 - 1920x1080 Ultra Graphics & Postprocessing (HBAO+) | |
| Average of class Gaming (104.7 - 240, n=6, last 2 years) | |
| Asus Zephyrus Duo 16 GX650PY-NM006W | |
| Asus ROG Strix G16 G614JZ | |
| Alienware m17 R5 (R9 6900HX, RX 6850M XT) | |
| Asus ROG Strix G17 G713PI | |
| Asus ROG Strix G18 G814JI | |
| Asus ROG Strix Scar 17 SE G733CX-LL014W | |
| Razer Blade 18 RTX 4070 | |
| Hogwarts Legacy | |
| 1920x1080 Ultra Preset AA:High T | |
| Asus ROG Strix G16 G614JZ | |
| Average of class Gaming (n=1last 2 years) | |
| Asus ROG Strix G17 G713PI | |
| Asus ROG Strix G18 G814JI | |
| Average NVIDIA GeForce RTX 4070 Laptop GPU (41 - 107, n=7) | |
| 2560x1440 Ultra Preset AA:High T | |
| Asus ROG Strix G16 G614JZ | |
| Average of class Gaming (n=1last 2 years) | |
| Asus ROG Strix G18 G814JI | |
| Average NVIDIA GeForce RTX 4070 Laptop GPU (35 - 71, n=7) | |
| Asus ROG Strix G17 G713PI | |
Witcher 3 ,在恒定负载测试中稳定地运行在一个较高的水平上。的数值是 华硕ROG Strix Scar 17SE与RTX 3080 Ti的数值几乎相同。同时,落后于 RTX 4090是非常大的,但这也是财务成本的问题。
The Witcher 3 FPS Chart
| low | med. | high | ultra | QHD DLSS | QHD FSR | QHD | 4K DLSS | 4K FSR | 4K | |
|---|---|---|---|---|---|---|---|---|---|---|
| GTA V (2015) | 178.1 | 114 | ||||||||
| The Witcher 3 (2015) | 216 | 121 | ||||||||
| Dota 2 Reborn (2015) | 169.8 | 163.4 | ||||||||
| Final Fantasy XV Benchmark (2018) | 114.3 | 83.3 | ||||||||
| X-Plane 11.11 (2018) | 128.5 | |||||||||
| Far Cry 5 (2018) | 141 | 132 | 114 | |||||||
| Strange Brigade (2018) | 249 | 210 | 138.1 | |||||||
| Cyberpunk 2077 1.6 (2022) | 86 | 83.3 | 53.1 | |||||||
| F1 22 (2022) | 195.2 | 76.6 | 48.4 | |||||||
| Hogwarts Legacy (2023) | 123 | 107 | 50 | |||||||
| Baldur's Gate 3 (2023) | 164.2 | 129.3 | 114.4 | 109.4 | 110.5 | 60 | 104.7 | 71.5 | 37.2 | |
| Cyberpunk 2077 (2023) | 154.7 | 123.7 | 100.4 | 87.5 | 58.6 | 49.1 | 21.2 | 20.3 | ||
| F1 24 (2024) | 284 | 269 | 220 | 77.4 | 76.1 | 77.3 | 47.7 | 27.3 | 36.3 | 21.3 |
| Star Wars Outlaws (2024) | 40.5 | 40.2 | 29.4 | 25.5 | 15.6 | |||||
| Space Marine 2 (2024) | 84 | 79.9 | 60.7 | 45.5 | 28.9 | |||||
| Call of Duty Black Ops 6 (2024) | 91 | 73 | 96 | 67 | 41 | 38 | 38 | |||
| Stalker 2 (2024) | 49.8 | 47.2 | 35.5 | 1.358 | 1.845 | |||||
| Indiana Jones and the Great Circle (2024) | 71.5 | 28.9 | 24.7 | 15.6 | ||||||
| Kingdom Come Deliverance 2 (2025) | 58.9 | 44.6 | 35.5 | 23.4 | ||||||
| Monster Hunter Wilds (2025) | 82.4 | 63.1 | 35.6 | 35.3 | 22.9 | 16.4 | 12.5 | |||
| Civilization 7 (2025) | 121.2 | 131.8 | 72.8 | 56.4 | 30.3 | |||||
| Assassin's Creed Shadows (2025) | 63 | 55 | 48 | 31 | 37 | 35 | 26 | 22 | 22 | 16 |
排放--这款游戏笔记本仍旧大部分是低调的
噪声水平
风扇的噪音原来是适中的。键盘 华硕Zephyrus Duo 16例如,可以明显地变得更响亮。然而,如果你打开Turbo模式,ROG Strix G17也会显示其响亮的一面。但是,在我们的测试中,我们没有注意到任何自发的嚎叫,当转速上升或突然的速度变化。
另一方面,我们确实注意到在我们的测试装置中存在一些线圈啸叫,尽管这仍然相对安静,并且在风扇打开时消失。当声音打开时,大多数人应该不会注意到它,但在非常安静的环境中,它很容易被听到。
Noise level
| Idle |
| 26 / 29 / 30 dB(A) |
| Load |
| 46 / 47 dB(A) |
 | ||
30 dB silent 40 dB(A) audible 50 dB(A) loud |
||
min: | ||
| Asus ROG Strix G17 G713PI R9 7945HX, GeForce RTX 4070 Laptop GPU | Asus ROG Strix G18 G814JI i7-13650HX, GeForce RTX 4070 Laptop GPU | Razer Blade 18 RTX 4070 i9-13950HX, GeForce RTX 4070 Laptop GPU | Asus ROG Strix Scar 17 SE G733CX-LL014W i9-12950HX, GeForce RTX 3080 Ti Laptop GPU | Asus Zephyrus Duo 16 GX650PY-NM006W R9 7945HX, GeForce RTX 4090 Laptop GPU | Alienware m17 R5 (R9 6900HX, RX 6850M XT) R9 6900HX, Radeon RX 6850M XT | Asus ROG Strix G16 G614JZ i9-13980HX, GeForce RTX 4080 Laptop GPU | |
|---|---|---|---|---|---|---|---|
| Noise | 3% | 6% | 13% | -7% | 7% | -3% | |
| off / environment * (dB) | 25 | 25 -0% | 23.5 6% | 23.9 4% | 23.9 4% | 23 8% | 25 -0% |
| Idle Minimum * (dB) | 26 | 26 -0% | 23.8 8% | 23.9 8% | 23.9 8% | 23 12% | 26 -0% |
| Idle Average * (dB) | 29 | 28 3% | 23.8 18% | 23.9 18% | 32.9 -13% | 28.11 3% | 28 3% |
| Idle Maximum * (dB) | 30 | 29 3% | 26.8 11% | 23.9 20% | 36.5 -22% | 28.11 6% | 30 -0% |
| Load Average * (dB) | 46 | 41 11% | 37.3 19% | 34.3 25% | 42.9 7% | 30.62 33% | 48 -4% |
| Witcher 3 ultra * (dB) | 46 | 44 4% | 48 -4% | 51.2 -11% | 49.75 -8% | 49 -7% | |
| Load Maximum * (dB) | 47 | 46 2% | 53.5 -14% | 45.9 2% | 56 -19% | 50.17 -7% | 52 -11% |
* ... smaller is better
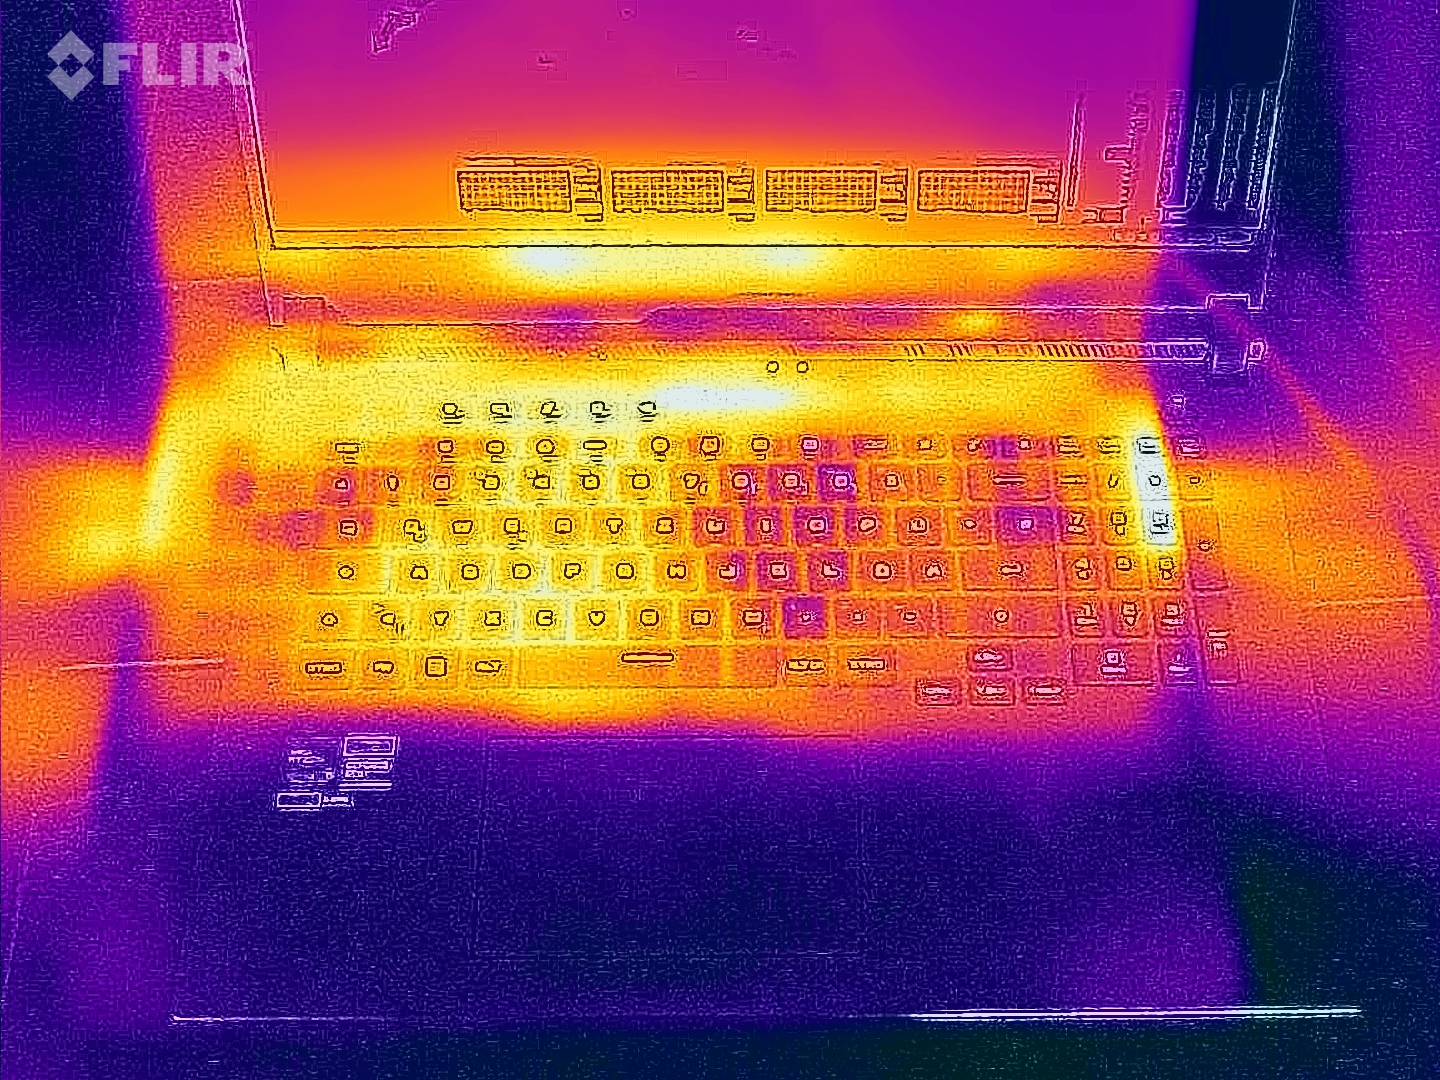
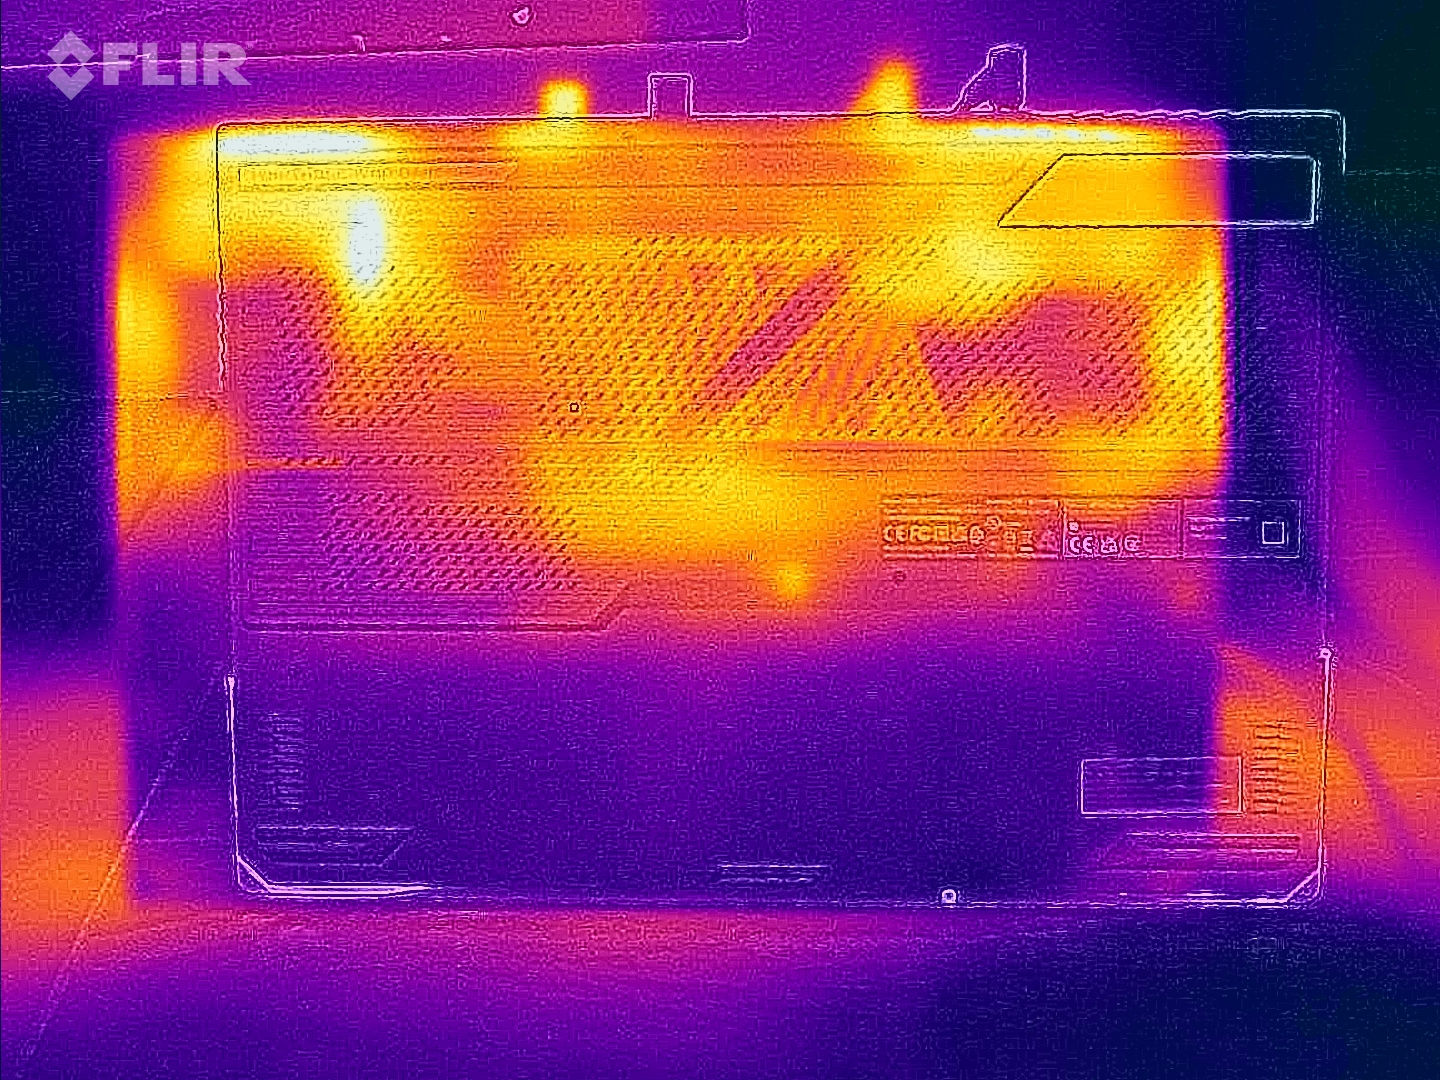
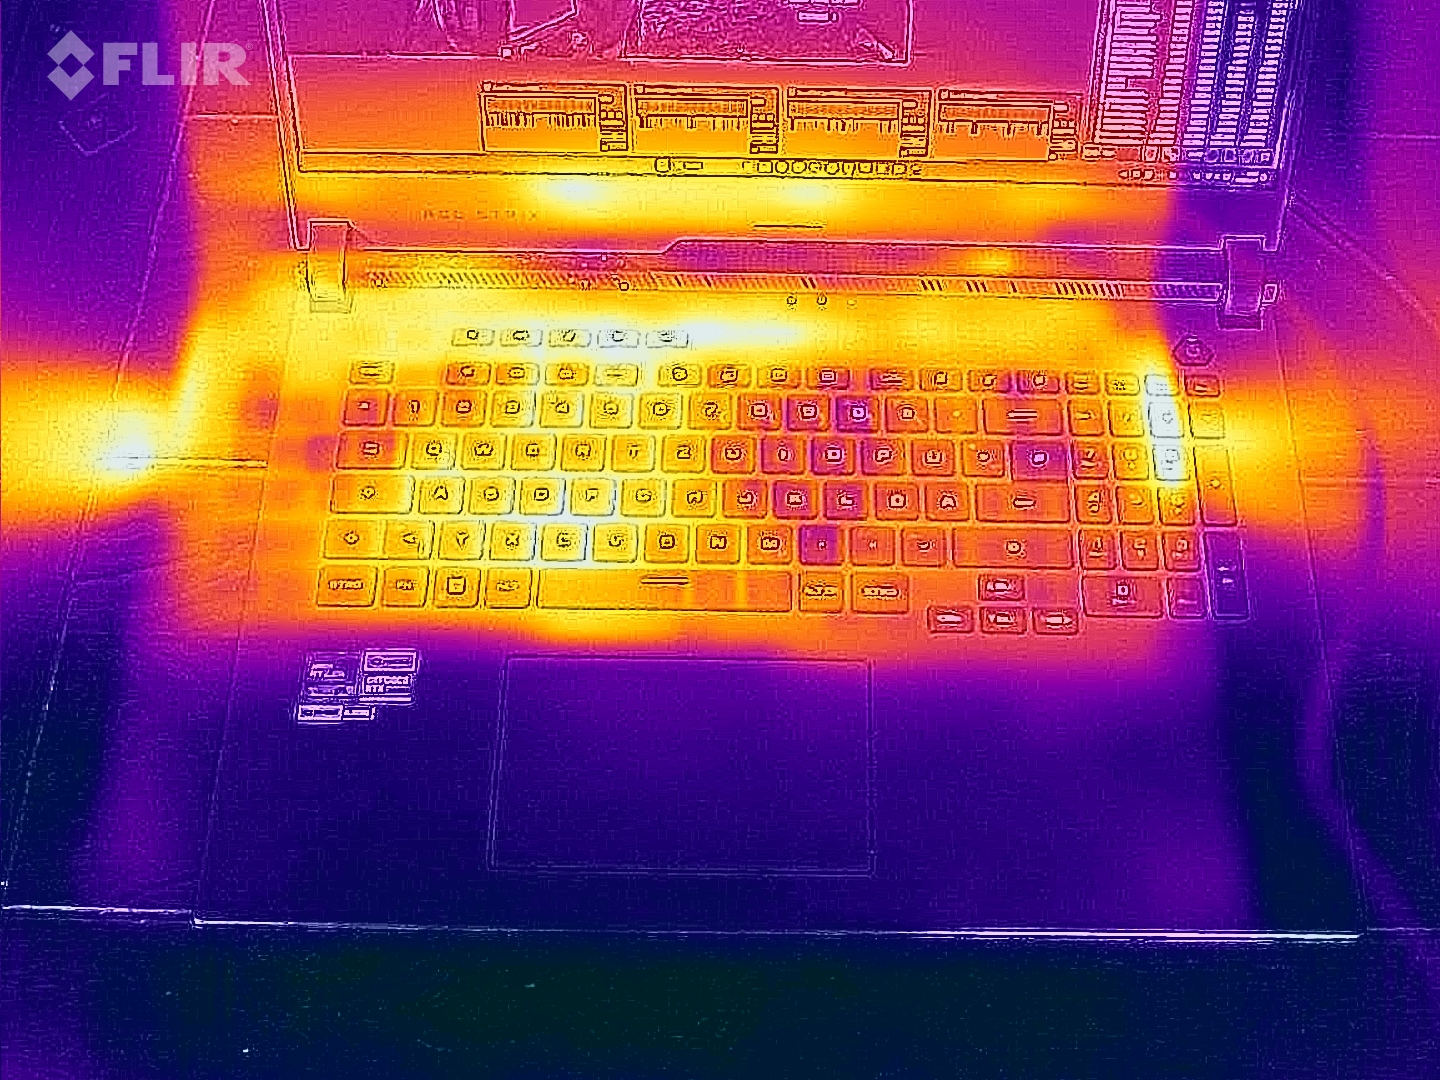
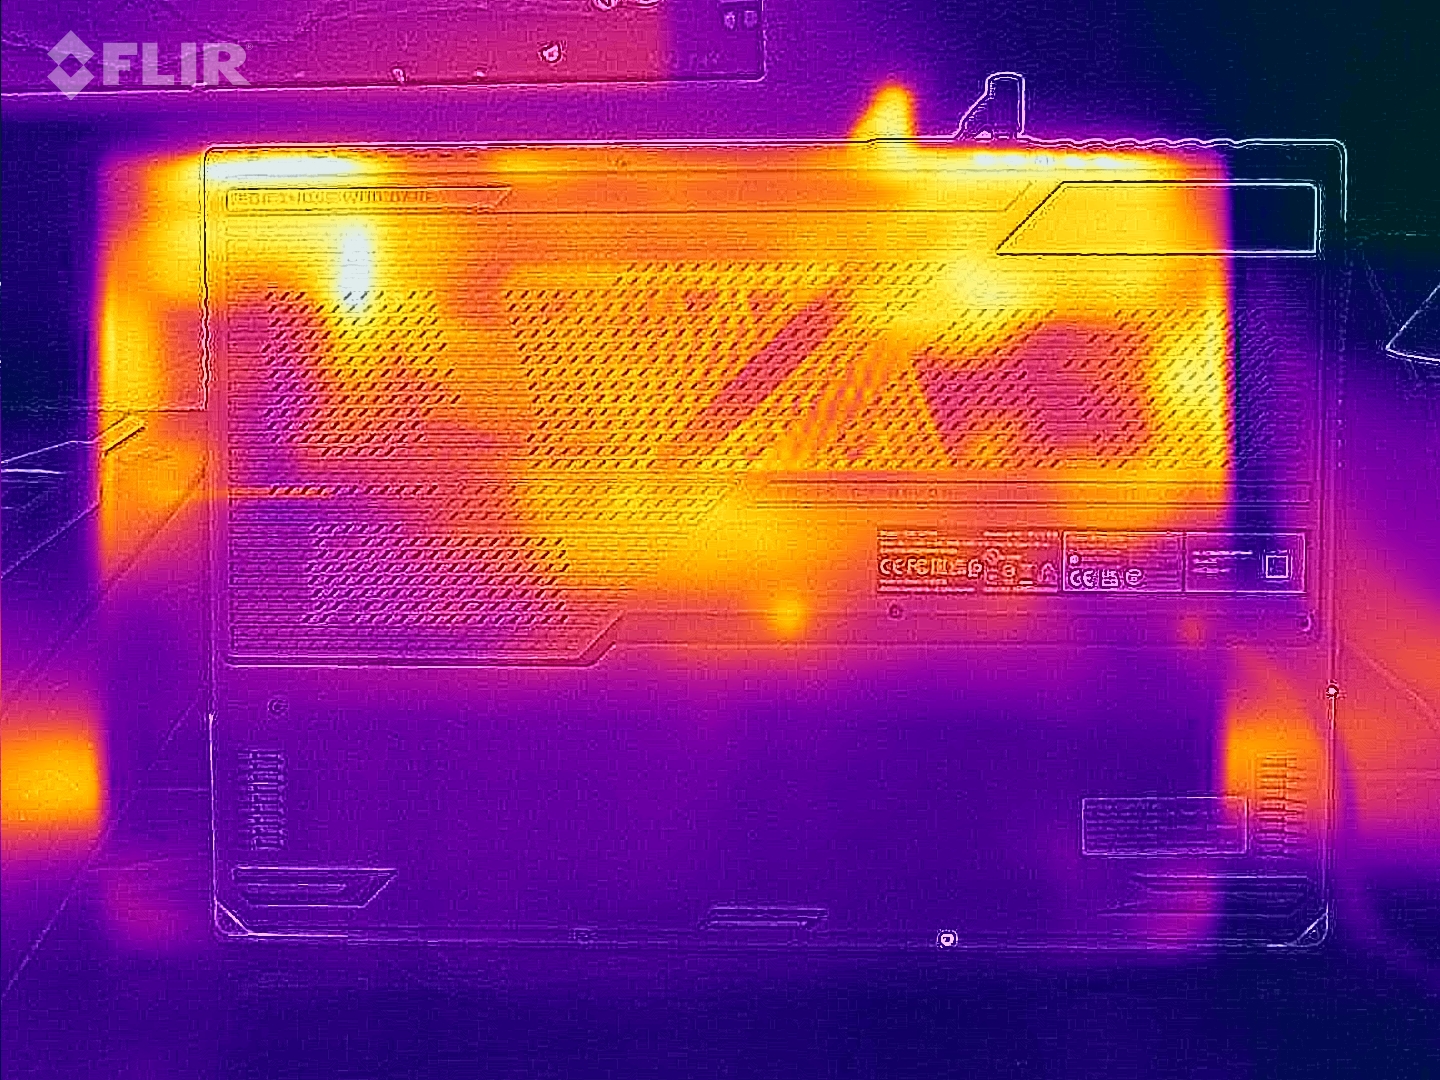
温度
游戏笔记本电脑几乎总是很热。只是冲浪就足以导致键盘区域的温度明显上升。
然而,在最高值中没有令人不舒服的惊喜。即使在负载情况下,表面温度也只略高于40℃(104°F),掌托甚至保持在30℃(86°F)以下。热量传递到机箱背面的工作非常成功。
(±) The maximum temperature on the upper side is 42 °C / 108 F, compared to the average of 40.4 °C / 105 F, ranging from 21.2 to 68.8 °C for the class Gaming.
(±) The bottom heats up to a maximum of 41 °C / 106 F, compared to the average of 43.2 °C / 110 F
(+) In idle usage, the average temperature for the upper side is 28.8 °C / 84 F, compared to the device average of 33.9 °C / 93 F.
(±) Playing The Witcher 3, the average temperature for the upper side is 36.6 °C / 98 F, compared to the device average of 33.9 °C / 93 F.
(+) The palmrests and touchpad are cooler than skin temperature with a maximum of 28 °C / 82.4 F and are therefore cool to the touch.
(±) The average temperature of the palmrest area of similar devices was 28.8 °C / 83.8 F (+0.8 °C / 1.4 F).
| Asus ROG Strix G17 G713PI AMD Ryzen 9 7945HX, NVIDIA GeForce RTX 4070 Laptop GPU | Asus ROG Strix G18 G814JI Intel Core i7-13650HX, NVIDIA GeForce RTX 4070 Laptop GPU | Razer Blade 18 RTX 4070 Intel Core i9-13950HX, NVIDIA GeForce RTX 4070 Laptop GPU | Asus ROG Strix Scar 17 SE G733CX-LL014W Intel Core i9-12950HX, NVIDIA GeForce RTX 3080 Ti Laptop GPU | Asus Zephyrus Duo 16 GX650PY-NM006W AMD Ryzen 9 7945HX, NVIDIA GeForce RTX 4090 Laptop GPU | Alienware m17 R5 (R9 6900HX, RX 6850M XT) AMD Ryzen 9 6900HX, AMD Radeon RX 6850M XT | Asus ROG Strix G16 G614JZ Intel Core i9-13980HX, NVIDIA GeForce RTX 4080 Laptop GPU | |
|---|---|---|---|---|---|---|---|
| Heat | 1% | 7% | -9% | 1% | -10% | -12% | |
| Maximum Upper Side * (°C) | 42 | 45 -7% | 39.2 7% | 48.8 -16% | 44.2 -5% | 53 -26% | 54 -29% |
| Maximum Bottom * (°C) | 41 | 47 -15% | 35.6 13% | 52.4 -28% | 46.8 -14% | 56 -37% | 55 -34% |
| Idle Upper Side * (°C) | 33 | 28 15% | 31.8 4% | 30.4 8% | 29.2 12% | 30 9% | 29 12% |
| Idle Bottom * (°C) | 34 | 31 9% | 33.2 2% | 34.1 -0% | 30.2 11% | 29 15% | 33 3% |
* ... smaller is better
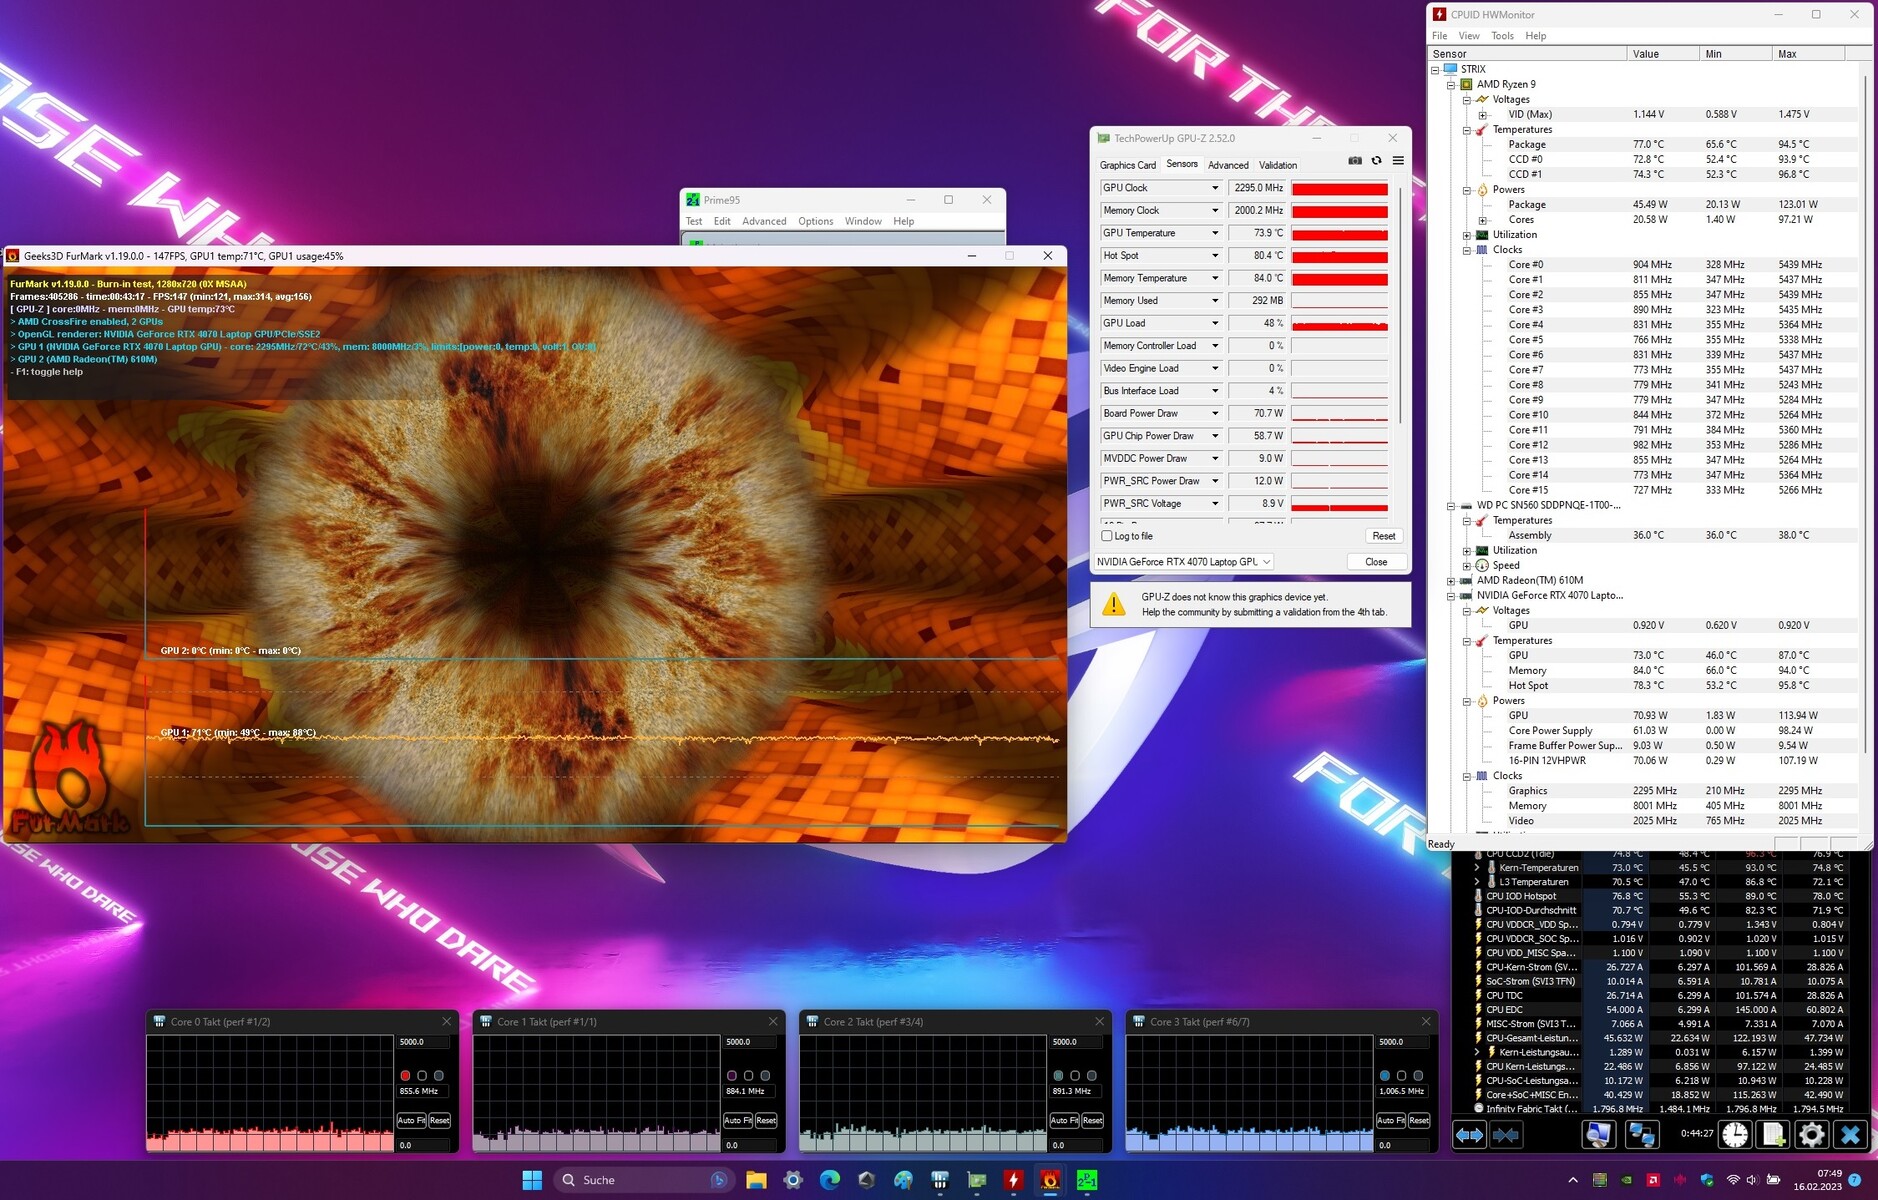
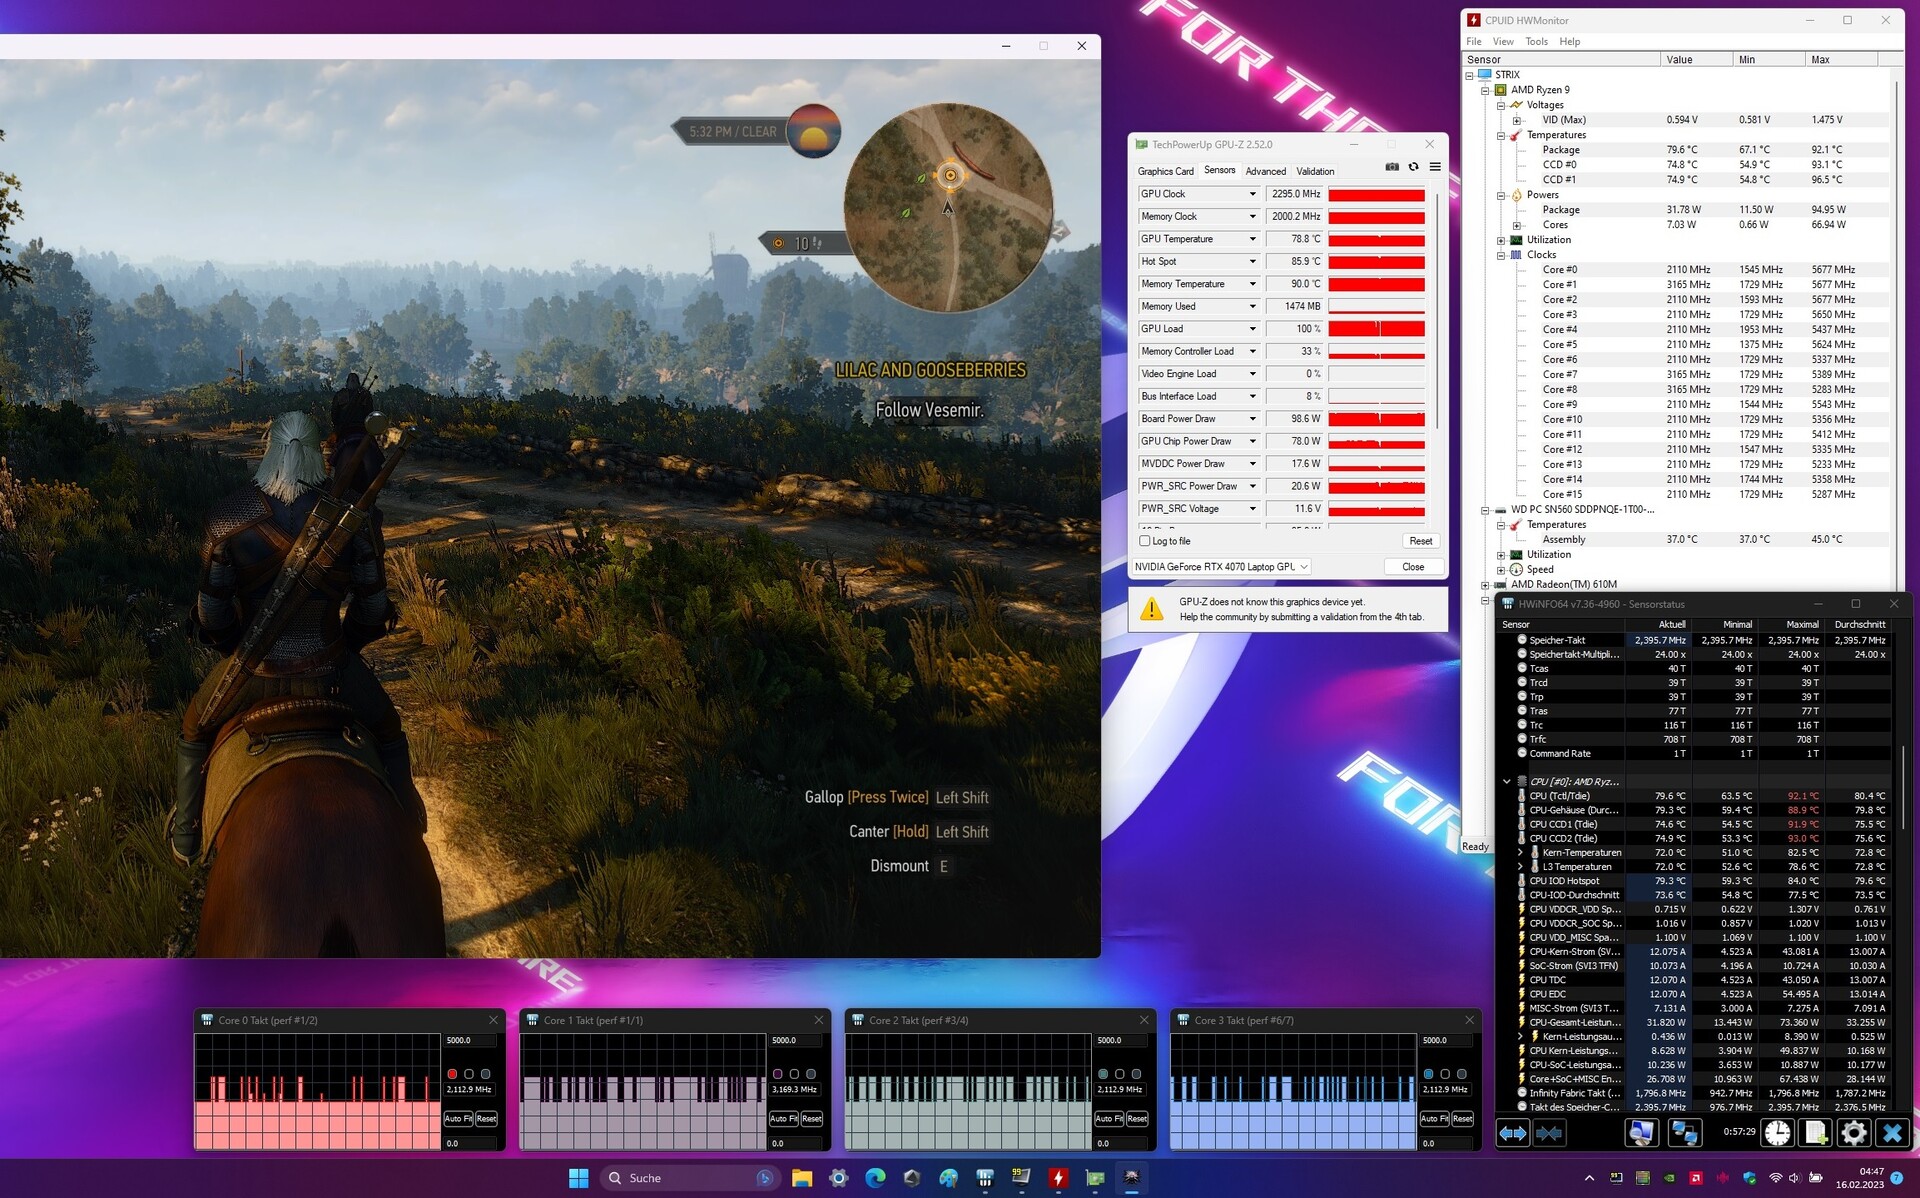
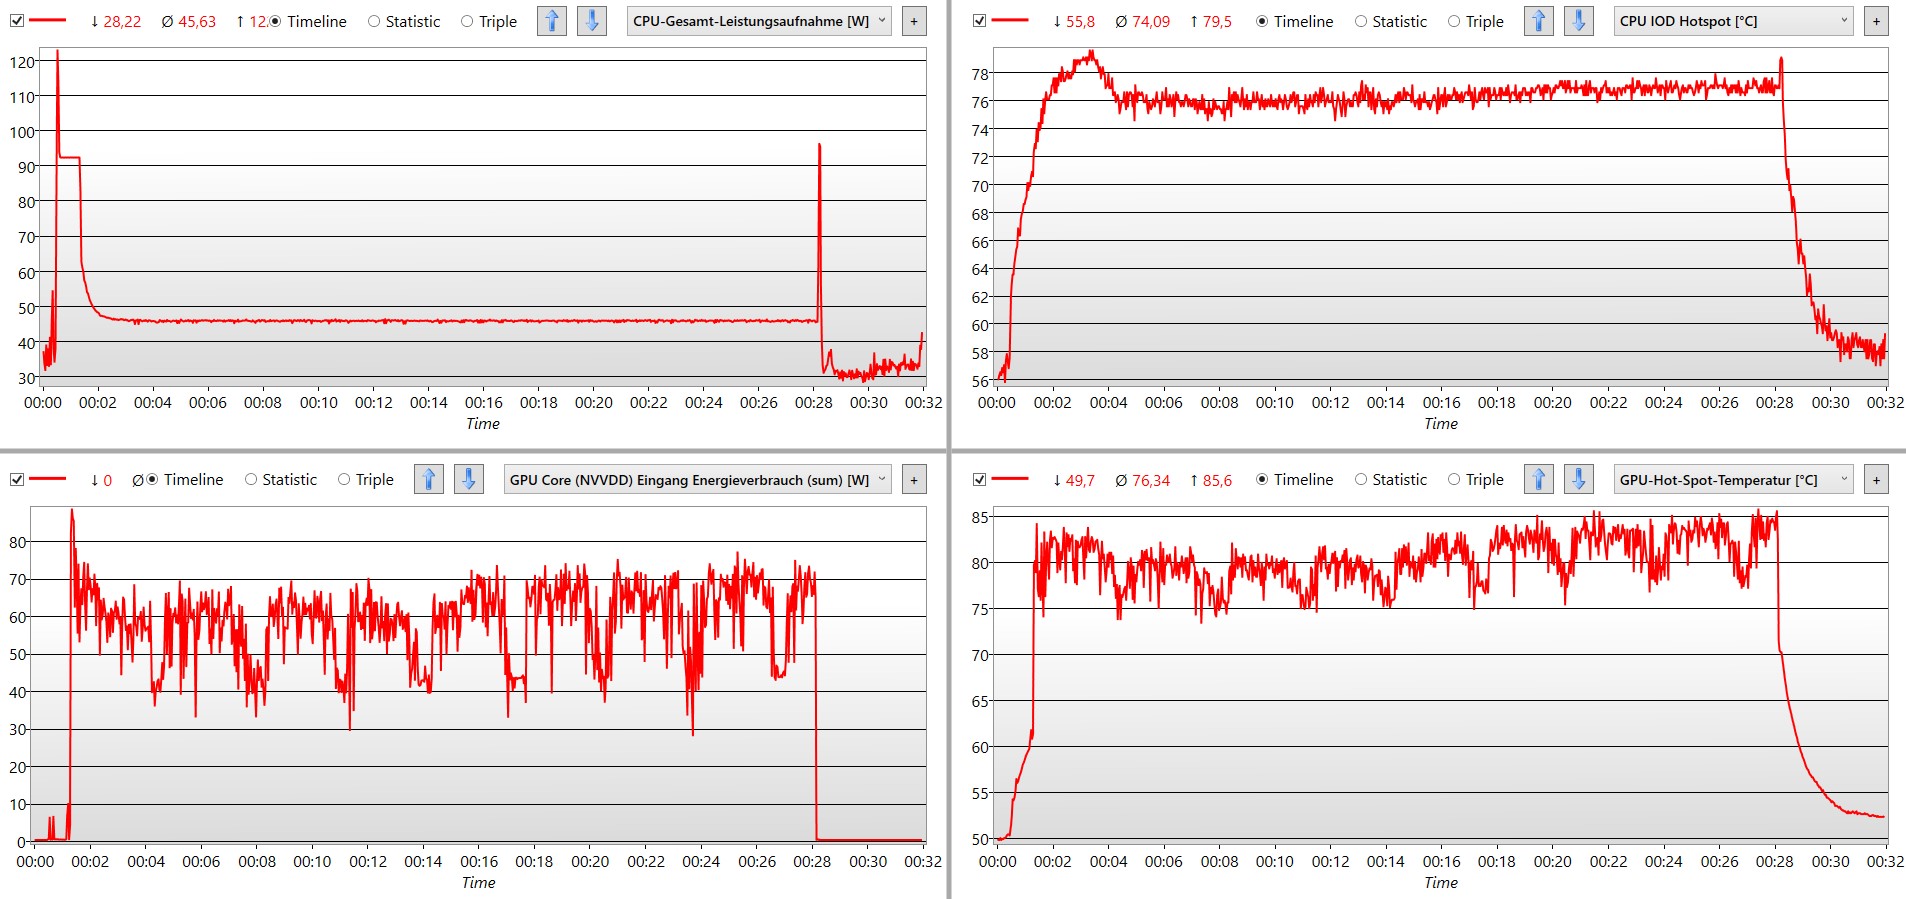
压力测试
仅仅1分钟后,CPU的功耗就急剧下降。之后,CPU和GPU的温度保持在70至80 °C(158 - 176 °F)左右,并能可靠地保持在这个水平。在恒定负载下,处理器和图形芯片的初始功耗一起从大约220瓦减少到几乎100瓦。
发言人
内置的扬声器听起来非常好,在整个频谱上没有显示任何弱点。它们甚至能产生特别令人印象深刻的低音。你还可以听到一些精细的细节。如果我们想在一个非常高的水平上抱怨,我们可以说,低中音缺乏一些冲力。
你可以用这些扬声器来听从摇滚到古典的音乐,看电影,当然也可以用来玩游戏。然而,在后者中,可听到的风扇可能会变得很烦人。对于一台笔记本电脑来说,其结果是显著的,在大多数情况下,其声音质量通常不是注定用于播放音乐。华硕用ROG Strix G17表明,这可以做得更好。
Asus ROG Strix G17 G713PI audio analysis
(±) | speaker loudness is average but good (81 dB)
Bass 100 - 315 Hz
(+) | good bass - only 4.6% away from median
(+) | bass is linear (6.5% delta to prev. frequency)
Mids 400 - 2000 Hz
(+) | balanced mids - only 3.1% away from median
(+) | mids are linear (5.9% delta to prev. frequency)
Highs 2 - 16 kHz
(+) | balanced highs - only 3.5% away from median
(+) | highs are linear (6.8% delta to prev. frequency)
Overall 100 - 16.000 Hz
(+) | overall sound is linear (9.5% difference to median)
Compared to same class
» 3% of all tested devices in this class were better, 1% similar, 95% worse
» The best had a delta of 6%, average was 18%, worst was 132%
Compared to all devices tested
» 4% of all tested devices were better, 1% similar, 95% worse
» The best had a delta of 4%, average was 23%, worst was 134%
Apple MacBook Pro 16 2021 M1 Pro audio analysis
(+) | speakers can play relatively loud (84.7 dB)
Bass 100 - 315 Hz
(+) | good bass - only 3.8% away from median
(+) | bass is linear (5.2% delta to prev. frequency)
Mids 400 - 2000 Hz
(+) | balanced mids - only 1.3% away from median
(+) | mids are linear (2.1% delta to prev. frequency)
Highs 2 - 16 kHz
(+) | balanced highs - only 1.9% away from median
(+) | highs are linear (2.7% delta to prev. frequency)
Overall 100 - 16.000 Hz
(+) | overall sound is linear (4.6% difference to median)
Compared to same class
» 0% of all tested devices in this class were better, 0% similar, 100% worse
» The best had a delta of 5%, average was 17%, worst was 45%
Compared to all devices tested
» 0% of all tested devices were better, 0% similar, 100% worse
» The best had a delta of 4%, average was 23%, worst was 134%
电源管理--ROG Strix总是具有较高的功耗
消耗功率
在任何时候,这款游戏笔记本电脑都是非常高效的。即使不执行任何明确的任务,它也会消耗近20W。功耗的峰值增加到约250W。
看一下华硕ROG Strix Scar 17 SE它在我们的性能测试中的表现也很有趣,尽管它的CPU和GPU已经不是很先进了。当运行《Witcher 3 》时,它也达到了几乎相同的帧数,但其耗电量却高出25%。因此,至少在更高的负载下,我们的ROG Strix G17测试装置是有效的。
| Off / Standby | |
| Idle | |
| Load |
|
Key:
min: | |
| Asus ROG Strix G17 G713PI R9 7945HX, GeForce RTX 4070 Laptop GPU | Asus ROG Strix G18 G814JI i7-13650HX, GeForce RTX 4070 Laptop GPU | Razer Blade 18 RTX 4070 i9-13950HX, GeForce RTX 4070 Laptop GPU | Asus ROG Strix Scar 17 SE G733CX-LL014W i9-12950HX, GeForce RTX 3080 Ti Laptop GPU | Alienware m17 R5 (R9 6900HX, RX 6850M XT) R9 6900HX, Radeon RX 6850M XT | Asus ROG Strix G16 G614JZ i9-13980HX, GeForce RTX 4080 Laptop GPU | Average of class Gaming | |
|---|---|---|---|---|---|---|---|
| Power Consumption | 15% | -39% | -20% | 10% | -4% | 8% | |
| Idle Minimum * (Watt) | 15 | 8 47% | 24.5 -63% | 19.3 -29% | 13 13% | 10 33% | 13 ? 13% |
| Idle Average * (Watt) | 20 | 15 25% | 34.1 -71% | 26.5 -33% | 16.5 17% | 16 20% | 18.7 ? 6% |
| Idle Maximum * (Watt) | 29 | 26 10% | 47.7 -64% | 27.1 7% | 17 41% | 27 7% | 24.3 ? 16% |
| Load Average * (Watt) | 121 | 102 16% | 140 -16% | 141 -17% | 93 23% | 129 -7% | 110.2 ? 9% |
| Witcher 3 ultra * (Watt) | 179.8 | 178.6 1% | 202 -12% | 225 -25% | 239 -33% | 247 -37% | |
| Load Maximum * (Watt) | 246 | 267 -9% | 261 -6% | 307.9 -25% | 251 -2% | 342 -39% | 258 ? -5% |
* ... smaller is better
Power Consumption The Witcher 3 / Stress Test
Power Consumption with External Monitor
电池寿命
长时间的电池运行绝对不是计划的一部分,尽管有90瓦时的大电池。ROG Strix G17甚至仍然低于该类游戏笔记本电脑的平均值,这已经很低了,在我们的WLAN测试中,在有限的显示亮度下,几乎没有持续4小时。
通过一些手动设置调整,可能会达到一半的可用运行时间。至少,华硕表明,更长的运行时间是有可能的。 ROG Strix G16的运行时间要长得多,因为它具有类似的功能,并提供相同的电池容量。
顺便说一下,打开dGPU并没有导致结果的明显改善。在这里使用的设置下,笔记本电脑的移动使用几乎没有任何意义,特别是它只能在飞行模式下播放全高清视频不到3小时。
| Asus ROG Strix G17 G713PI R9 7945HX, GeForce RTX 4070 Laptop GPU, 90 Wh | Asus ROG Strix G18 G814JI i7-13650HX, GeForce RTX 4070 Laptop GPU, 90 Wh | Razer Blade 18 RTX 4070 i9-13950HX, GeForce RTX 4070 Laptop GPU, 91.7 Wh | Asus ROG Strix Scar 17 SE G733CX-LL014W i9-12950HX, GeForce RTX 3080 Ti Laptop GPU, 90 Wh | Alienware m17 R5 (R9 6900HX, RX 6850M XT) R9 6900HX, Radeon RX 6850M XT, 97 Wh | Asus ROG Strix G16 G614JZ i9-13980HX, GeForce RTX 4080 Laptop GPU, 90 Wh | Average of class Gaming | |
|---|---|---|---|---|---|---|---|
| Battery runtime | 54% | 12% | -2% | 56% | 68% | 108% | |
| H.264 (h) | 2.8 | 4.9 75% | 8.64 ? 209% | ||||
| WiFi v1.3 (h) | 4.3 | 8.1 88% | 4 -7% | 4.2 -2% | 4.8 12% | 9.7 126% | 7.11 ? 65% |
| Witcher 3 ultra (h) | 1.1 | ||||||
| Load (h) | 1 | 1.2 20% | 1.3 30% | 1.8 80% | 1.1 10% | 1.502 ? 50% |
Pros
Cons
结论 - 一个全面的游戏包
从出色的CPU性能到扎实的游戏基准测试,都达到了RTX 3080 Ti的水平。 RTX 3080 TiROG Strix G17并没有显示出任何弱点。有了这一点,人们对新的 NvidiaGeForce RTX 4070的期望得到了满足。这款强大的中端芯片的计算能力达到了上一代高级显卡的水平(但由于只有8GB的VRAM,它不是很有前途)。得益于 R9 7945HX这款游戏笔记本电脑能够以其高计算性能发挥出最高水平。
显示器也符合这种性能。凭借其准确的色彩再现、QHD分辨率和240赫兹刷新率与系统性能相匹配,它看起来几乎是定制的。在桌面上使用时,微弱的亮度几乎没有任何区别。照明在视觉上也很吸引人。不需要花太多时间就能找到一个单独的照明选项,甚至可以提供一些系统状态的信息。
它的主要弱点在游戏时不会产生任何差异。这使得华硕ROG Strix G17成为一款自始至终都很成功的游戏笔记本电脑,但它也只应该以这种方式使用。
这款笔记本电脑的结构也显得很周全。对于游戏领域来说,风扇噪音和热量发展是适中的。由于有一个免费的固态硬盘插槽,而且内部的可访问性也不复杂,所以在执行维护任务或更换重要部件时没有任何障碍。
幸运的是,我们只在不影响游戏性能的领域发现了弱点。USB连接令人失望,因为最高10Gbit/s的速度仍然远远低于目前USB4的可能性(也不支持)。高清网络摄像头似乎不再是最新的了。此外,尽管有足够的电池容量,但电池寿命仍然低于平均水平,即使是游戏笔记本电脑。
尽管这降低了ROG Strix G17作为一个全能型产品的品质,但它并没有改变对玩当前游戏的适合性。相比之下, Razer Blade 18整体上看起来更合适,它提供了Thunderbolt 4,一个更明亮的显示屏,以及在其他方面具有可比性的性能和相同的图形芯片。同时,这也是更昂贵的,没有提供任何系统性能方面的收益,所以它真的只代表一个替代方案,如果你需要一个更多的笔记本电脑。
另一方面,如果华硕ROG Strix G17在未来可以使用稍小的处理器,这很可能是最接近的竞争对手,只要该系统几乎完全用于游戏。
价格和可用性
在美国,华硕ROG Strix G17 (2023) G713可从华硕网络商店购买,起价1799.99美元。.
Asus ROG Strix G17 G713PI
- 03/16/2023 v7 (old)
Mario Petzold
Transparency
The selection of devices to be reviewed is made by our editorial team. The test sample was provided to the author as a loan by the manufacturer or retailer for the purpose of this review. The lender had no influence on this review, nor did the manufacturer receive a copy of this review before publication. There was no obligation to publish this review. As an independent media company, Notebookcheck is not subjected to the authority of manufacturers, retailers or publishers.
This is how Notebookcheck is testing
Every year, Notebookcheck independently reviews hundreds of laptops and smartphones using standardized procedures to ensure that all results are comparable. We have continuously developed our test methods for around 20 years and set industry standards in the process. In our test labs, high-quality measuring equipment is utilized by experienced technicians and editors. These tests involve a multi-stage validation process. Our complex rating system is based on hundreds of well-founded measurements and benchmarks, which maintains objectivity. Further information on our test methods can be found here.
Price comparison

