华硕 ROG Zephyrus G16 2024 评测--配备 G-Sync OLED 和英特尔流星湖技术的游戏笔记本电脑
玩家共和国--这代表着华硕的游戏笔记本电脑。不过,在新款 ROG Zephyrus G16(以及尺寸更小的 G14)上,制造商略微改变了做法,旨在面向更多类型的客户。为此,它采用了更扁平、更优雅的机箱设计,但这限制了可安装的组件。因此,这款高端游戏/多媒体混合型笔记本电脑对于内容创作者或那些正在寻找时尚、功能强大设备的普通用户来说也很有吸引力。事实上,新款 Zephyrus G16 也是华硕迄今为止唯一一款使用英特尔全新流星湖处理器的 2024 游戏笔记本电脑。而较小的 ROG Zephyrus G14(评测即将发布)则使用了 AMD 的新 Ryzen 8000 处理器。
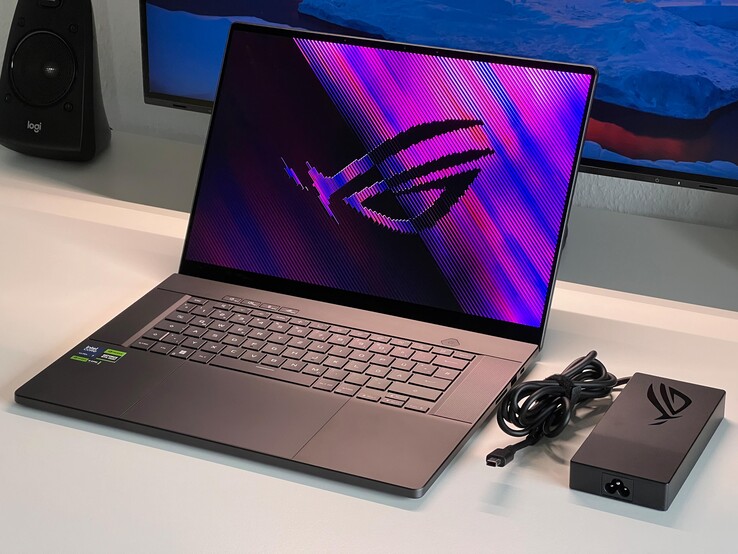
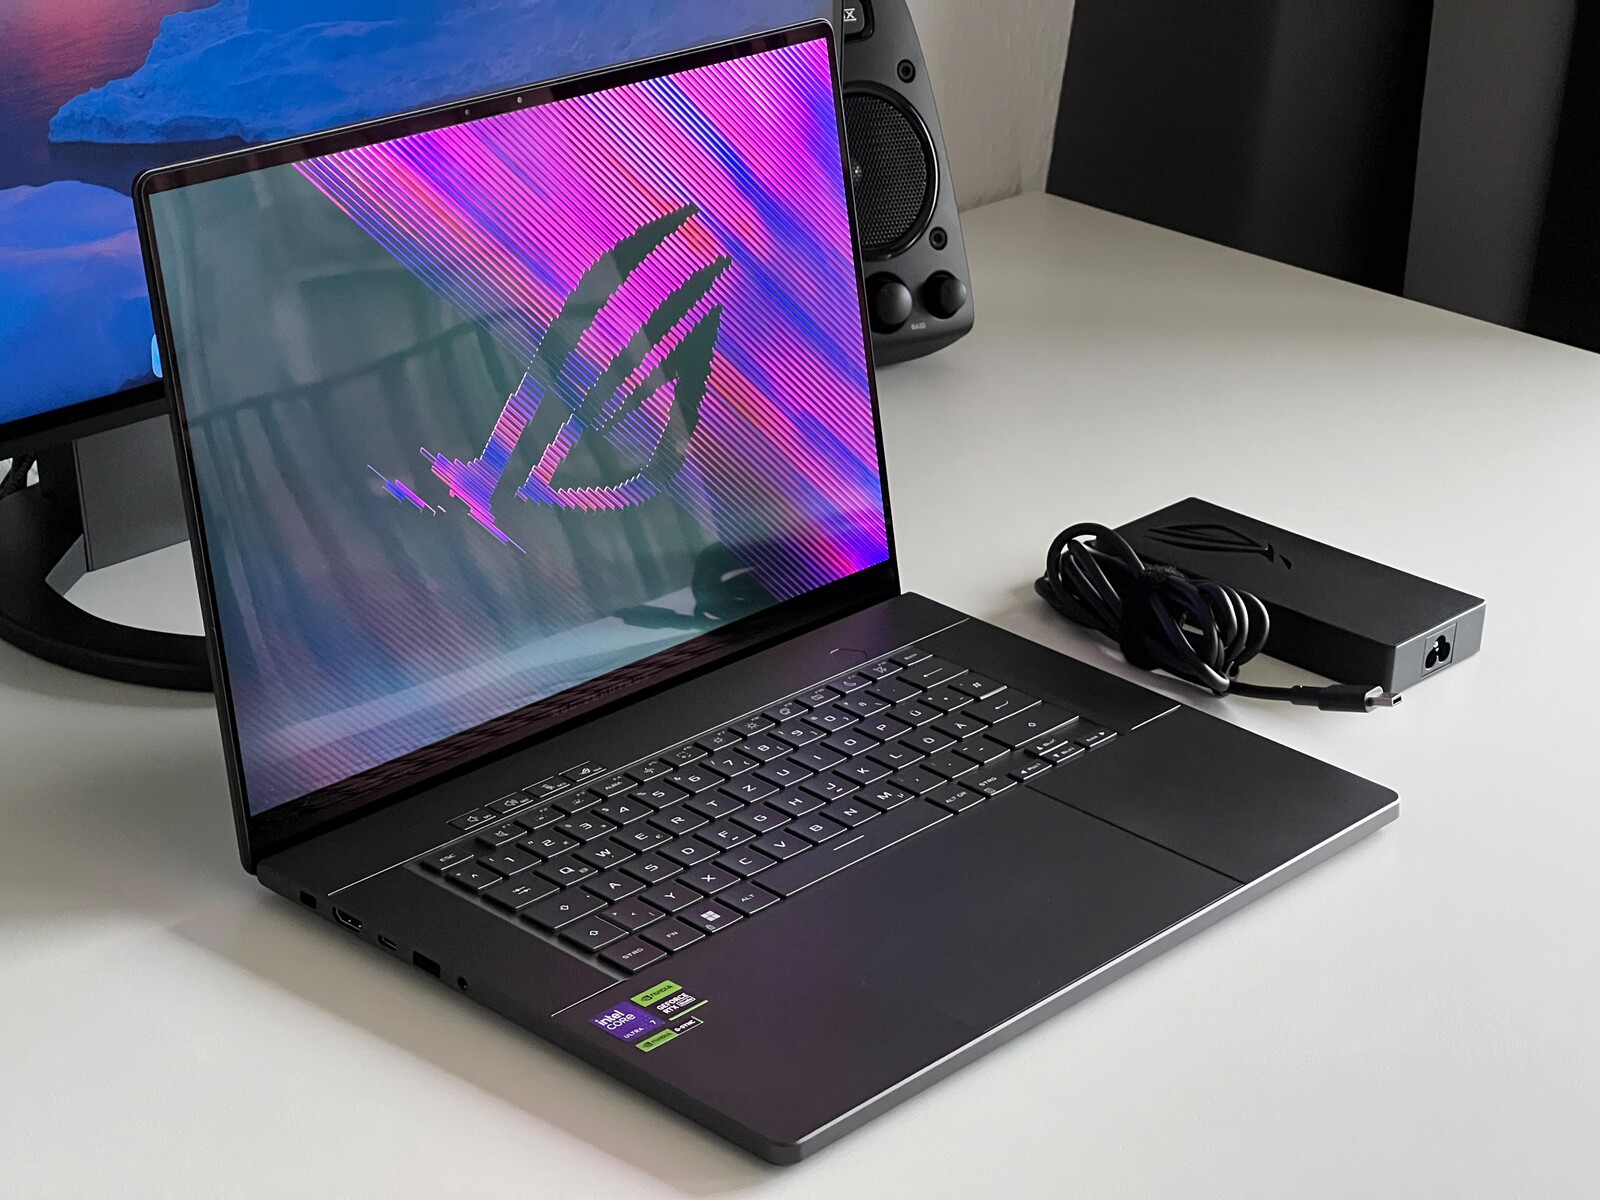
我们测试的 ROG Zephyrus G16 GU605M 并不是高端机型,因为除了新的 酷睿至尊 7 155H之外,它还配备了 GeForce RTX 4070 笔记本电脑.此外,它现在采用了三星的 OLED 显示屏,刷新率为 240 赫兹,并首次支持 G-Sync。此外,该笔记本电脑还安装了 16 GB 内存和 1 TB SSD。新款 G16 将于 2 月 15 日开始发售,售价为 2,899.99 美元起;目前我们还不能确定测试配置的 MRSP。
潜在的竞争对手比较
Rating | Date | Model | Weight | Height | Size | Resolution | Price |
|---|---|---|---|---|---|---|---|
| 92.3 % v7 (old) | 02 / 2024 | Asus ROG Zephyrus G16 2024 GU605M Ultra 7 155H, GeForce RTX 4070 Laptop GPU | 1.8 kg | 16.4 mm | 16.00" | 2560x1600 | |
| 88.4 % v7 (old) | 08 / 2023 | Lenovo Yoga Pro 9 16-IRP G8 i7-13705H, GeForce RTX 4060 Laptop GPU | 2.2 kg | 18.2 mm | 16.00" | 3200x2000 | |
| 91.2 % v7 (old) | 02 / 2023 | Razer Blade 16 Early 2023 i9-13950HX, GeForce RTX 4080 Laptop GPU | 2.4 kg | 21.99 mm | 16.00" | 2560x1600 | |
| 86.2 % v7 (old) | 03 / 2023 | Gigabyte AERO 16 OLED BSF i9-13900H, GeForce RTX 4070 Laptop GPU | 2.1 kg | 18 mm | 16.00" | 3840x2400 | |
| 88.6 % v7 (old) | 07 / 2023 | Schenker VISION 16 Pro (M23) i7-13700H, GeForce RTX 4070 Laptop GPU | 1.6 kg | 17.1 mm | 16.00" | 2560x1600 | |
| 88.8 % v7 (old) | 07 / 2023 | MSI Stealth 16 Studio A13VG i7-13700H, GeForce RTX 4070 Laptop GPU | 2 kg | 19.95 mm | 16.00" | 2560x1600 | |
| 93.2 % v7 (old) | 11 / 2023 | Apple MacBook Pro 16 2023 M3 Max Apple M3 Max 16-Core, M3 Max 40-Core GPU | 2.1 kg | 16.9 mm | 16.00" | 3456x2234 |
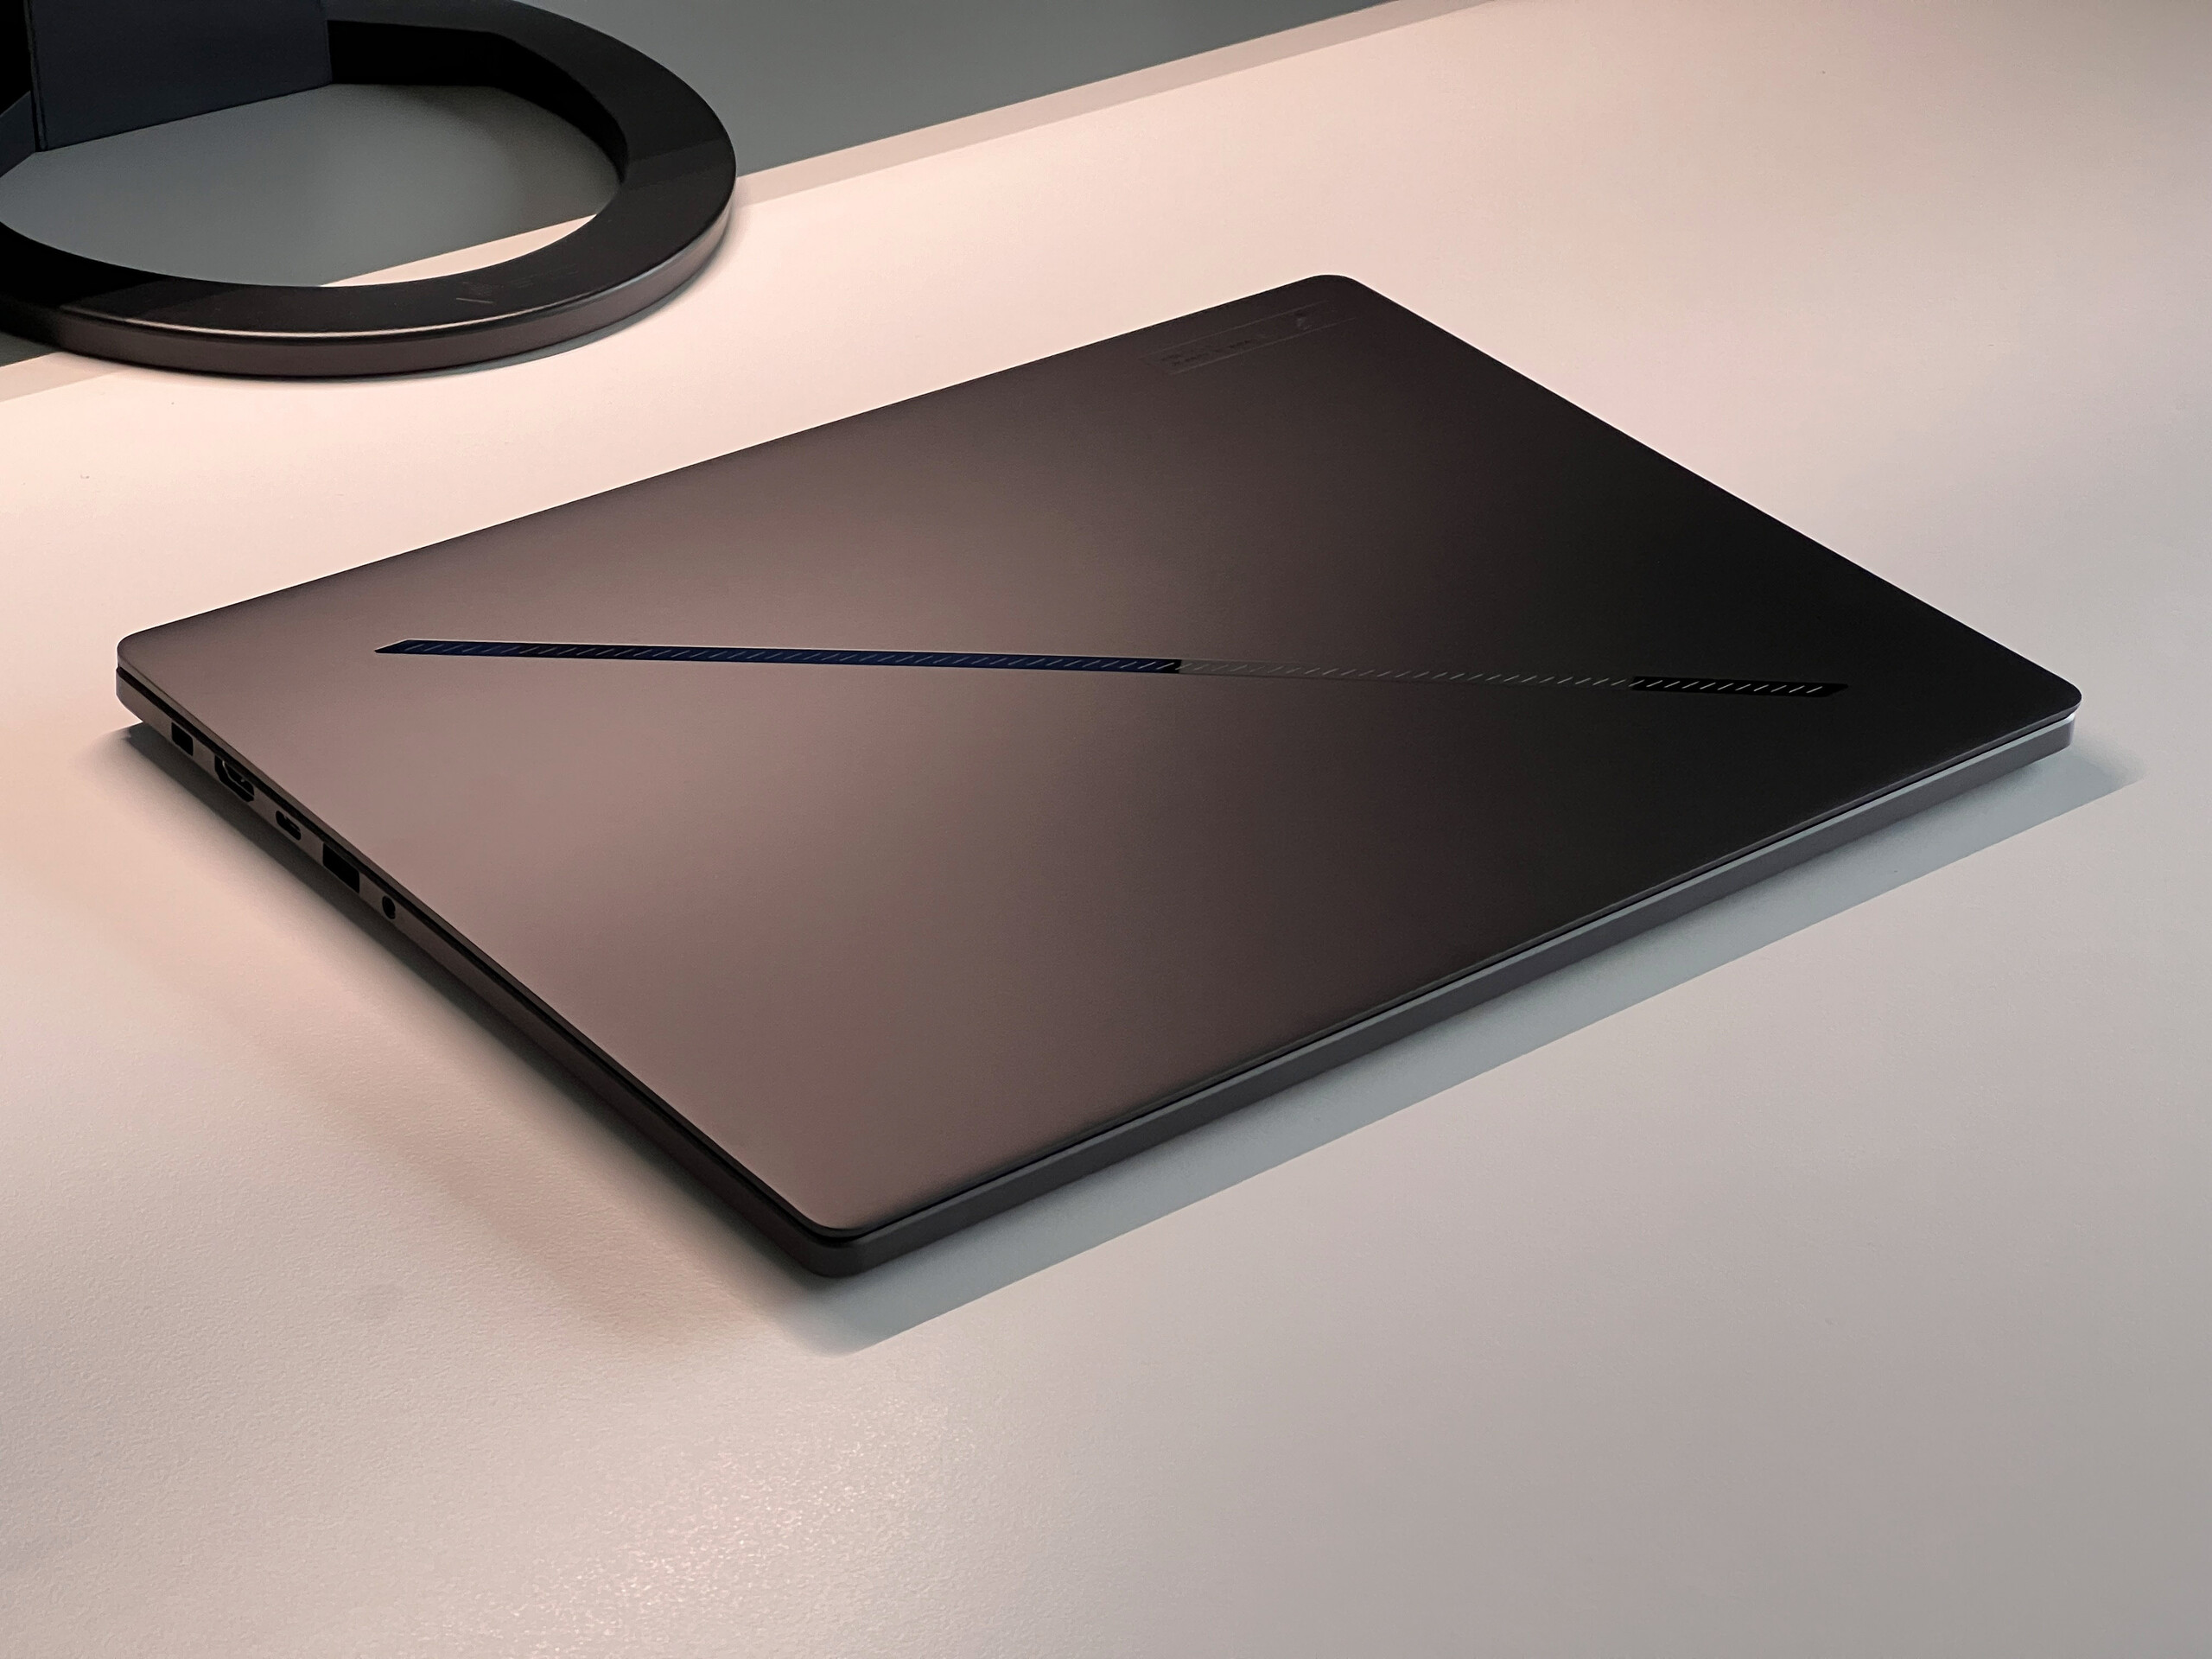
外壳 - Zephyrus 现在由铝制成
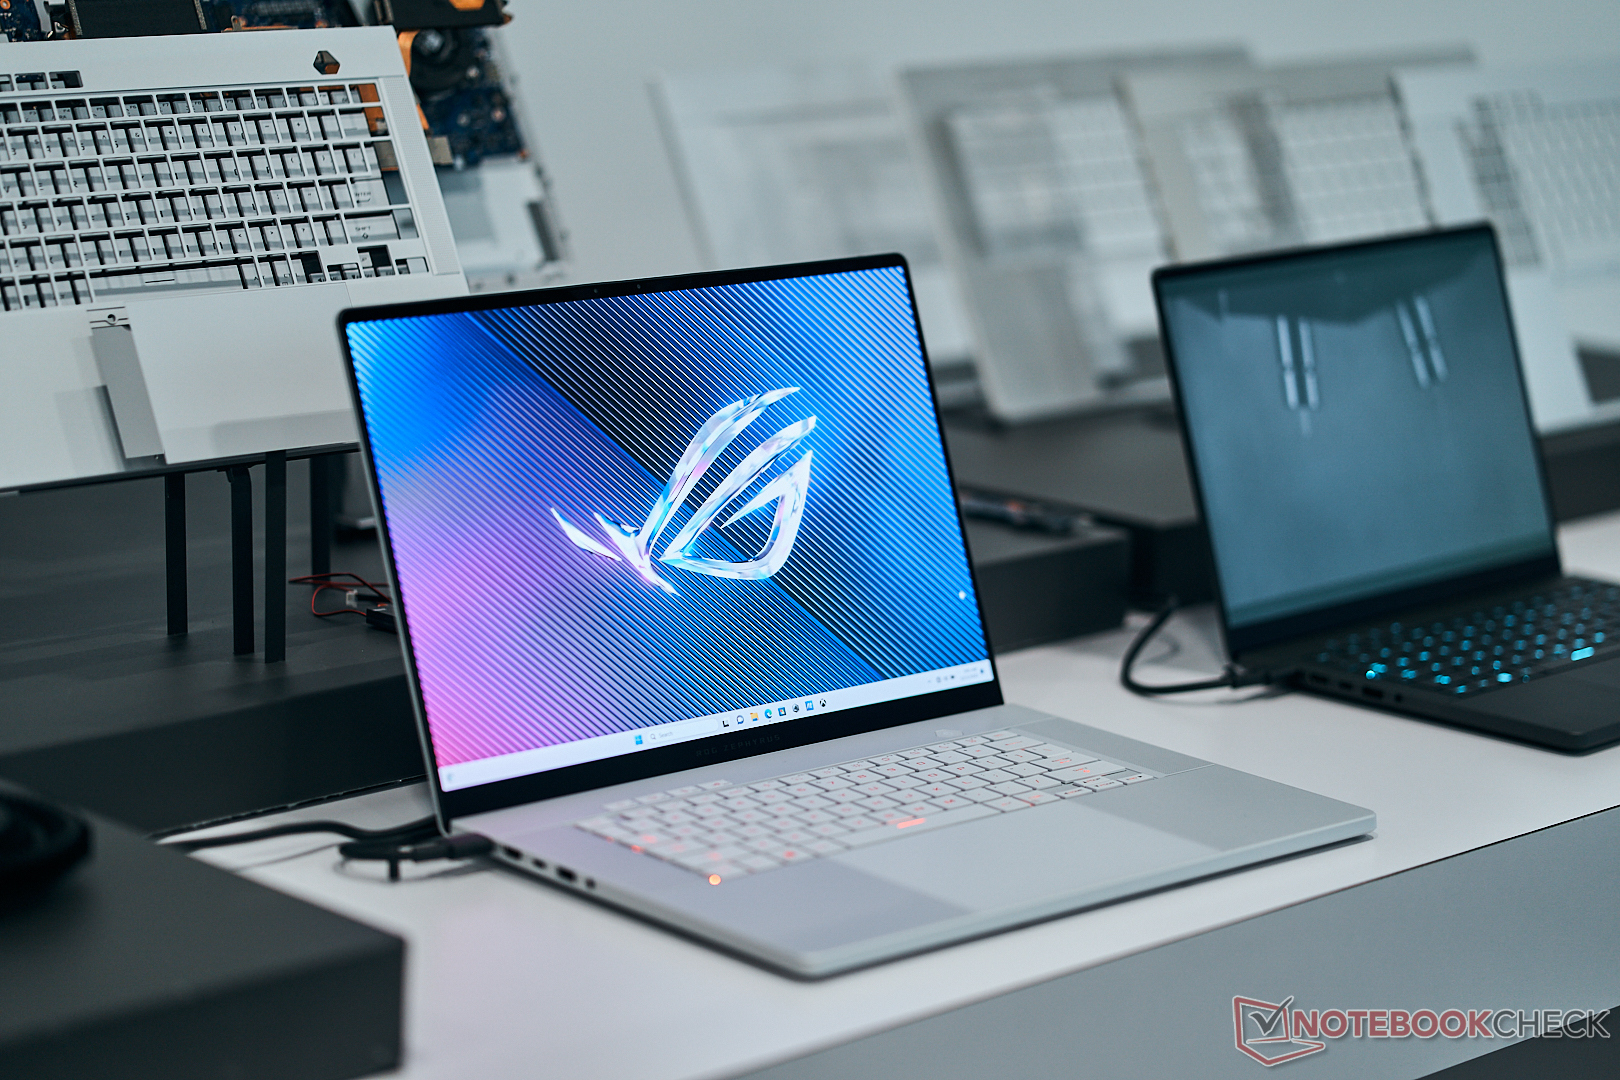
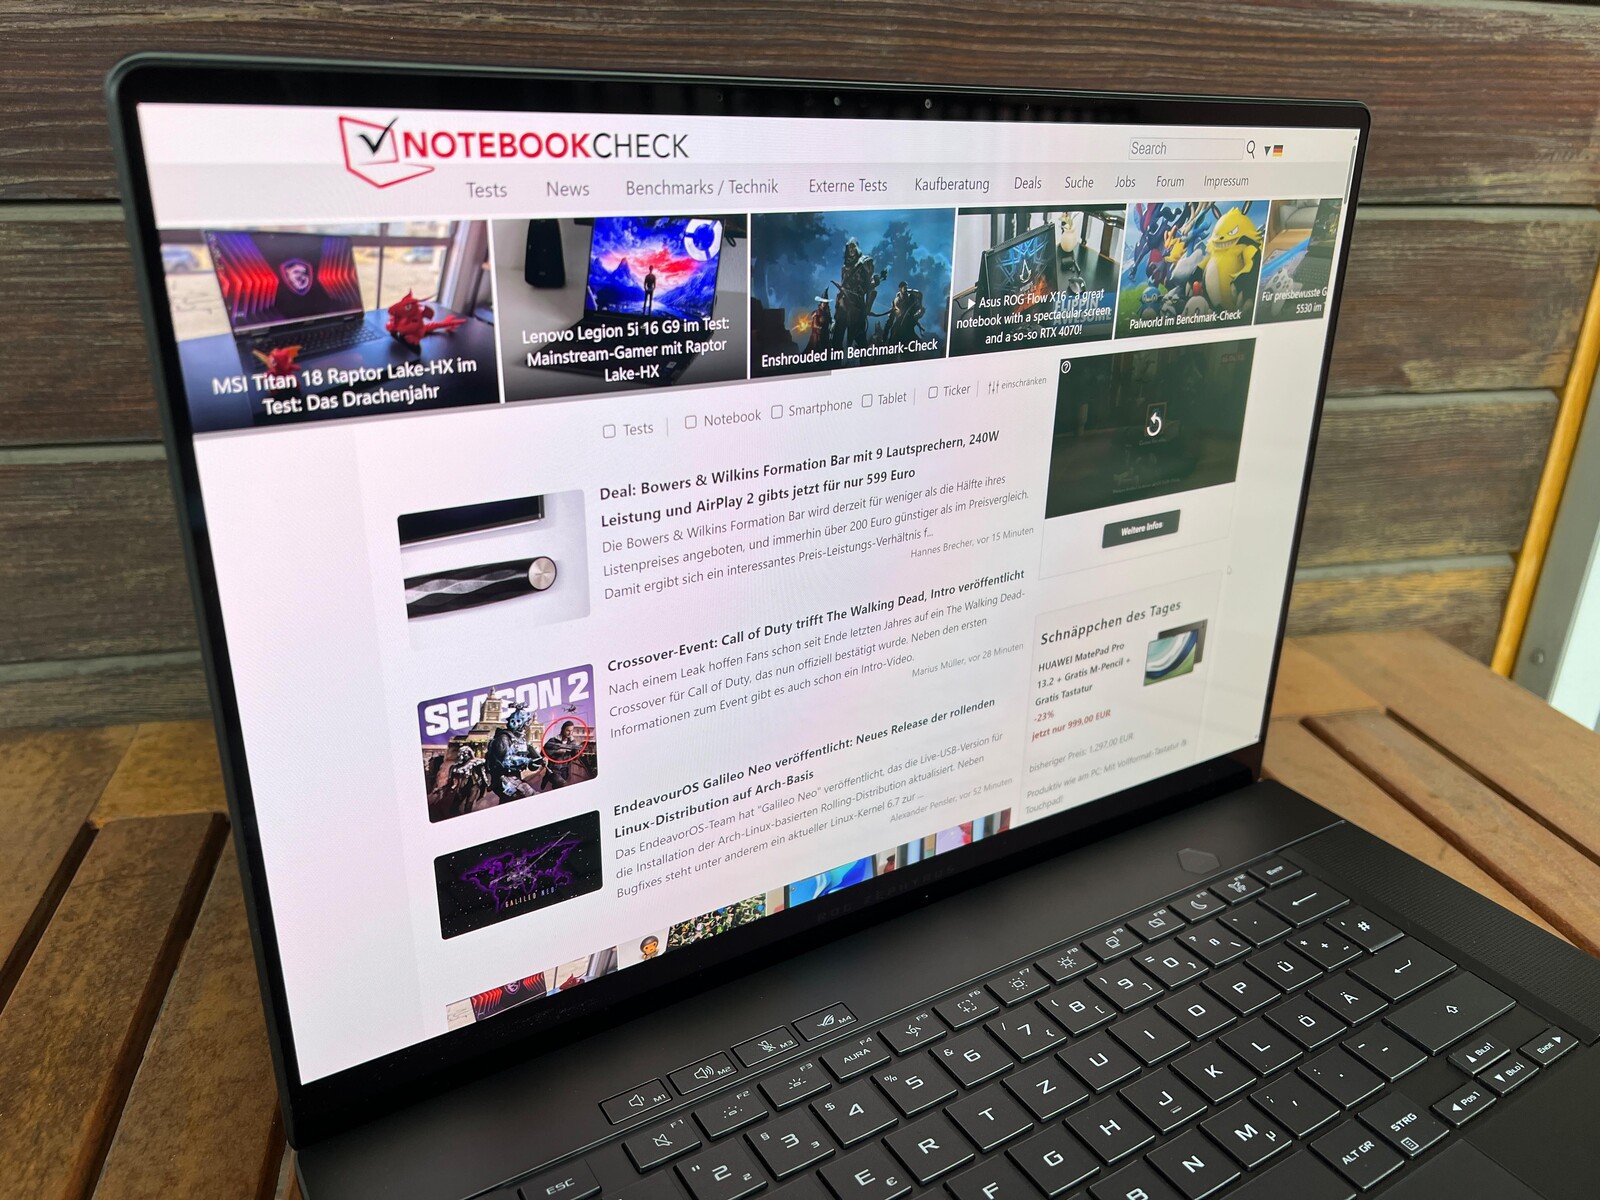
华硕新款 Zephyrus G16 采用优雅的铝制一体成型机身,第一眼看到它,你会立即联想到雷蛇刀锋 16 等设备。 雷蛇刀锋 16或 Apple MacBook Pro 16.操作这款笔记本电脑时,毫无疑问这是一款真正的高端设备。我们的测试设备是深灰色版本(日蚀灰),在去年年底的预览活动中,我们也有机会看到了白色版本(铂金白)。白色机型的指纹识别能力稍弱,但深灰色机型的指纹识别能力则更强一些。我们还在照片库中收录了几张白色机型的照片。
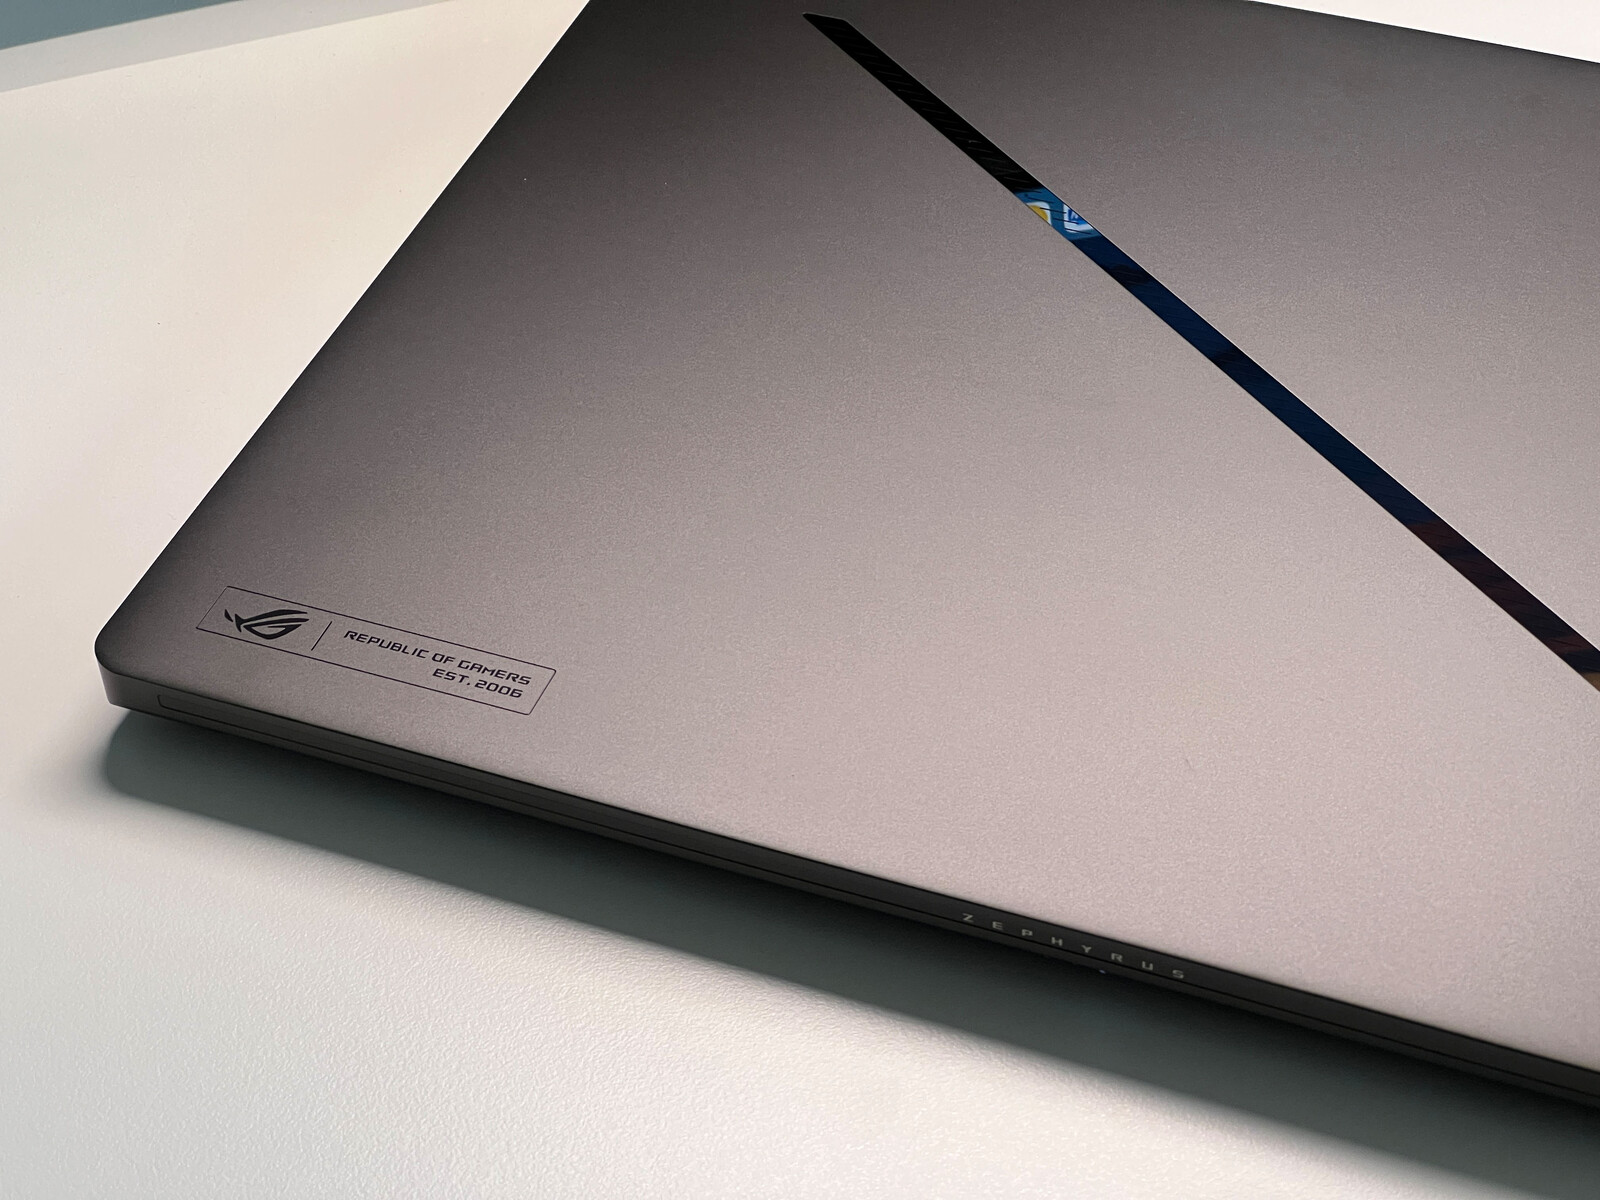
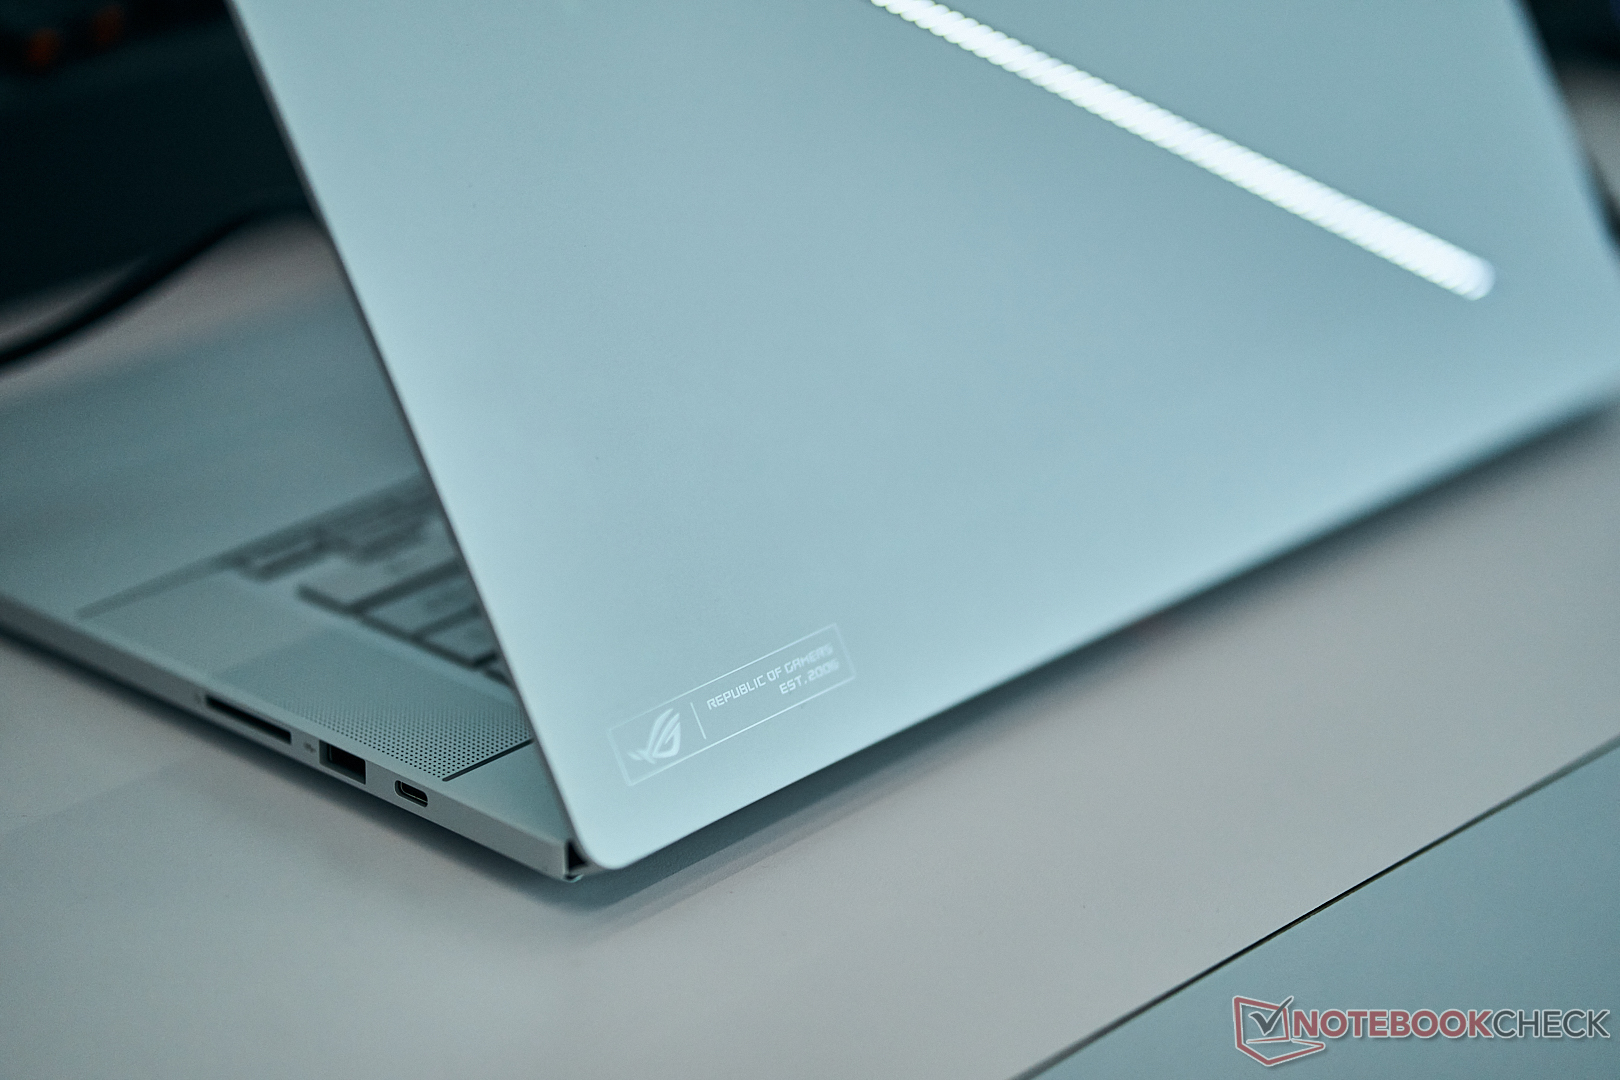
华硕放弃了新机盖子上的大量点阵显示屏,转而采用了由 28 颗微型 LED 和 7 个不同区域组成的薄型对角白色灯带(Slash Lighting)。它可以进行编程(例如作为通知灯),也可以完全关闭,以免引起过多关注。除键盘外,没有其他发光元件。
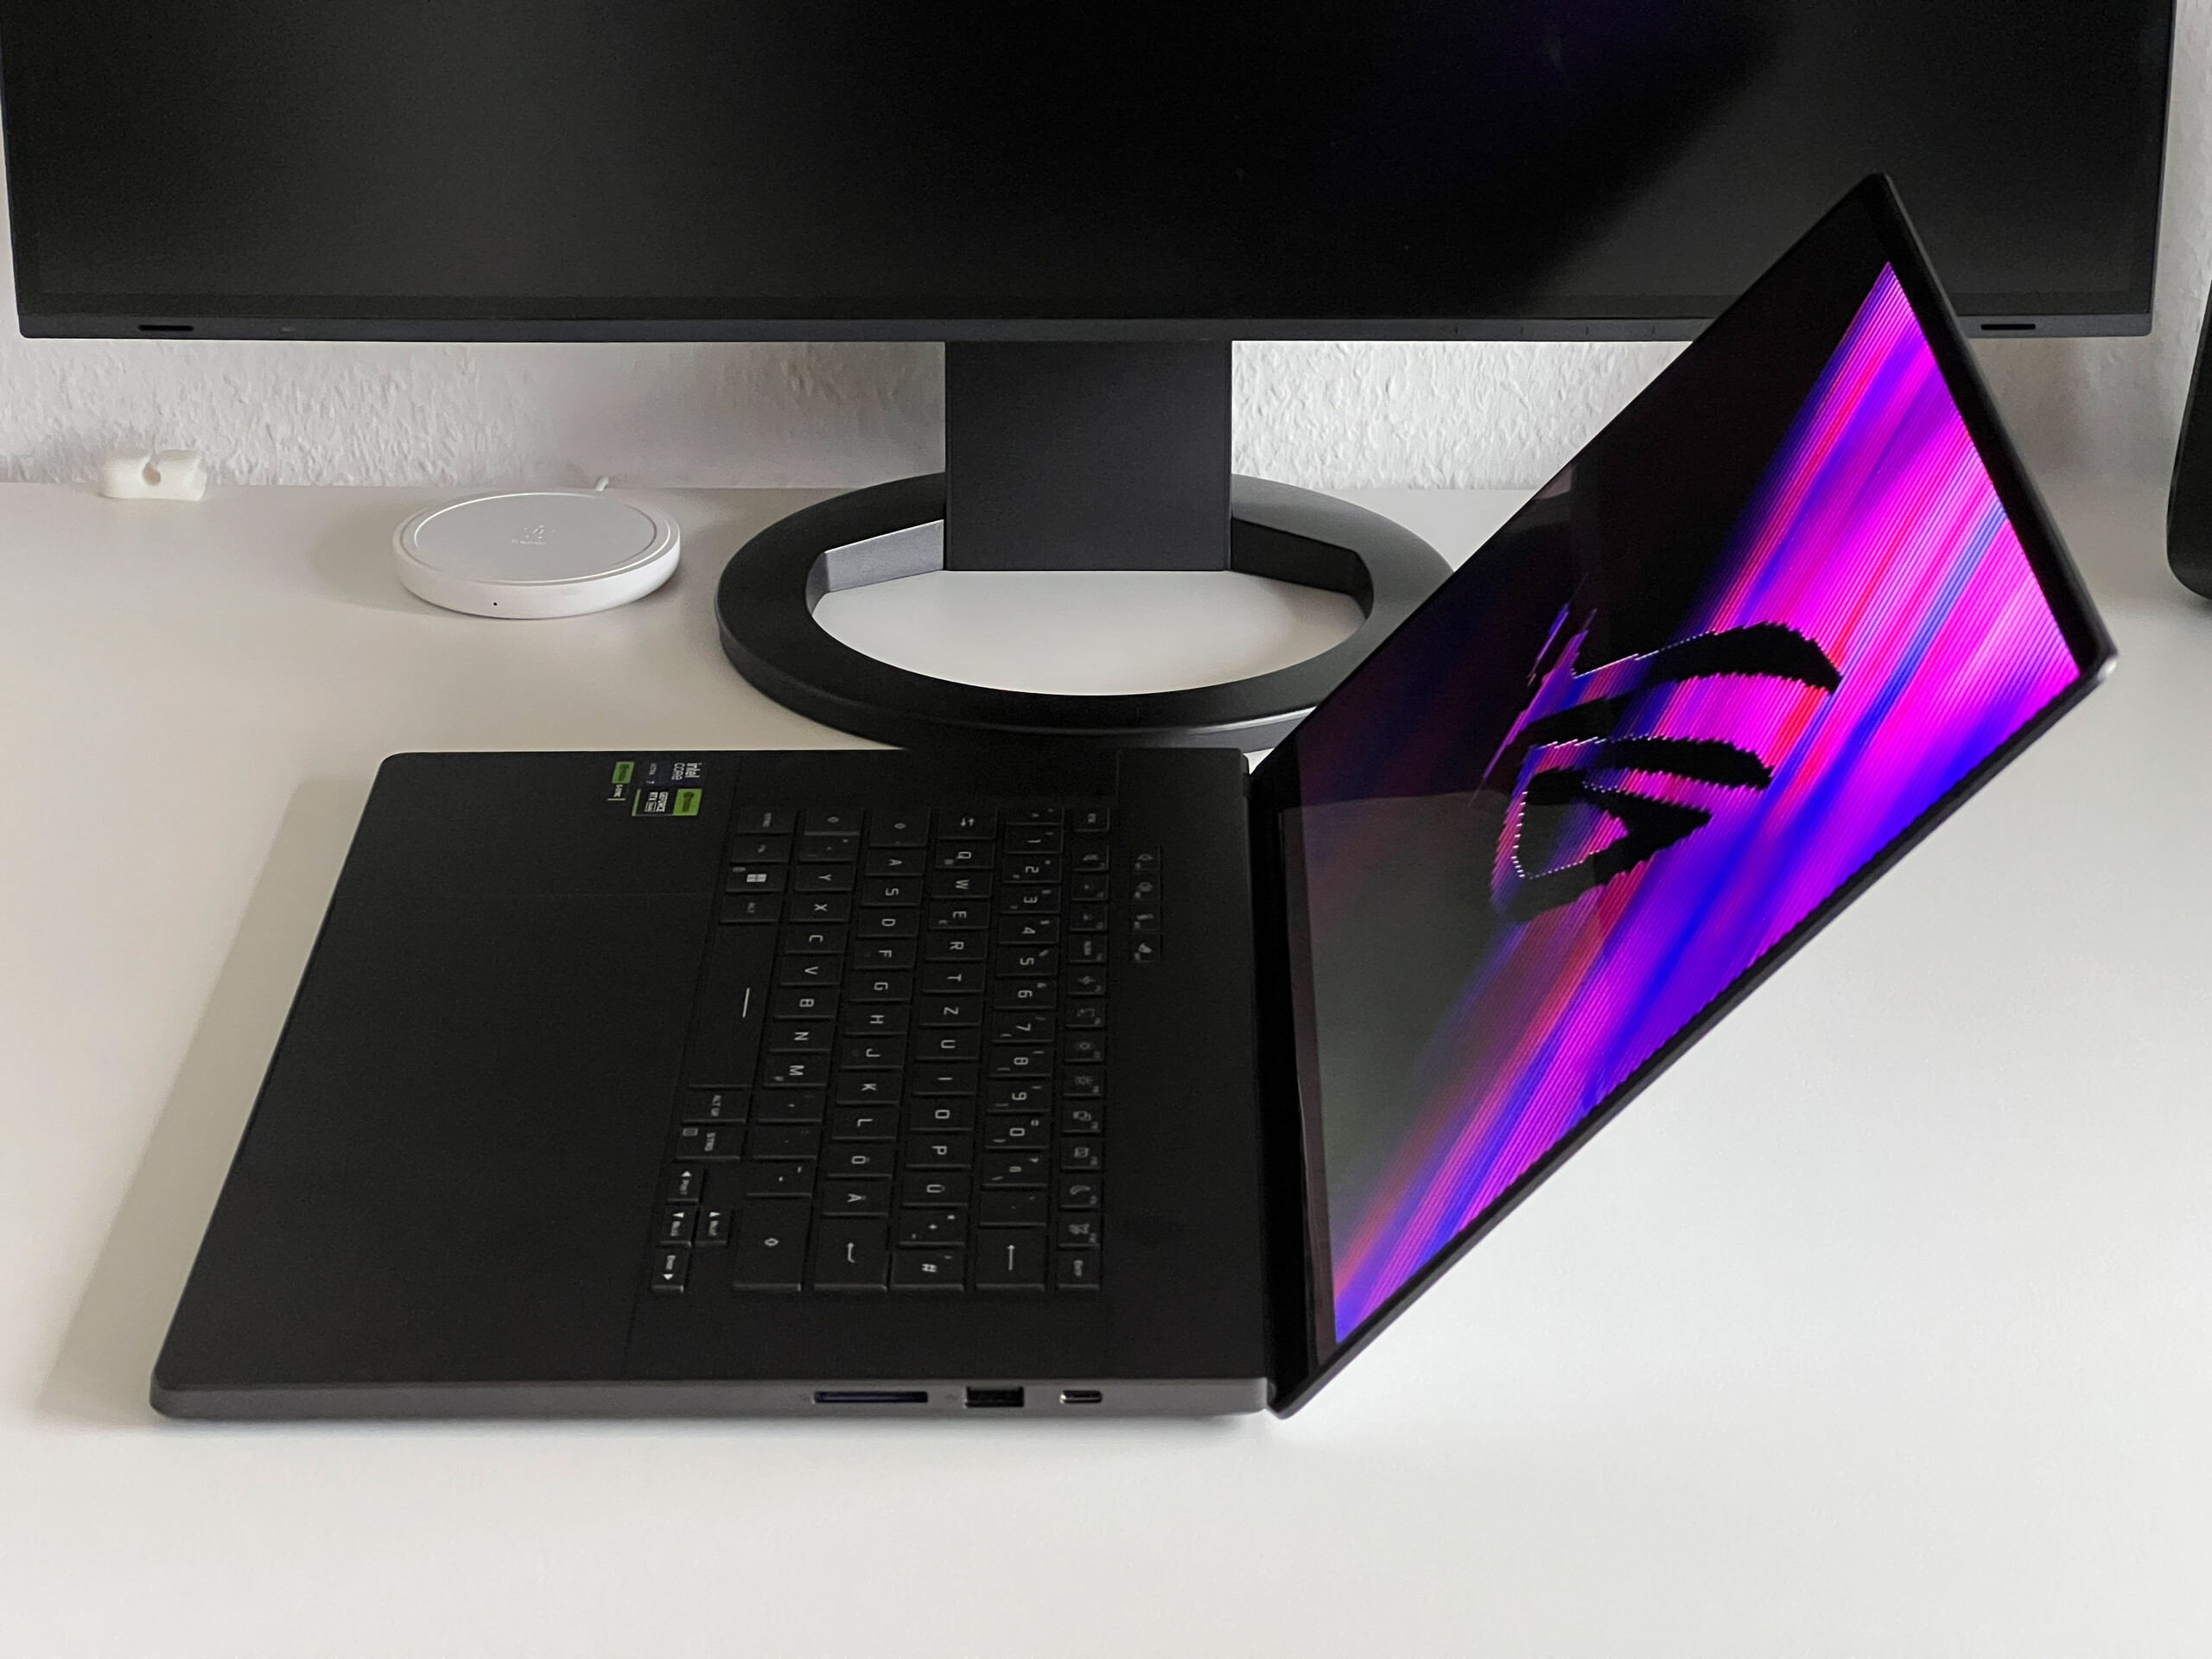
该设备的构造和稳定性令人震惊,键盘几乎无法按入,即使使用很大的压力也是如此。Zephyrus 也不会发出吱吱嘎嘎的声音。薄薄的显示屏盖子略显灵活,但我们也没有发现任何问题。不过,新的铰链设计将笔记本电脑的最大开启角度限制在 135 度。单手就能轻松打开盖子,但就我们的口味而言,铰链可以设置得更紧一些,因为当你调整角度时,它会晃动得很厉害。
新款 ROG Zephyrus G16 是我们对比领域中最紧凑的机型之一,它与 Vision 16 Pro和 MacBook Pro和 MacBook Pro 一样,其 16.4 毫米的机身也是最薄的机型之一。不过,需要指出的是,我们的测试设备是该系列中最薄的机型,因为 TFT 机型和 Vapor-Chamber 机型稍厚一些。它的重量也很轻,仅为 1.8 千克;200 瓦的电源则额外增加了 583 克。
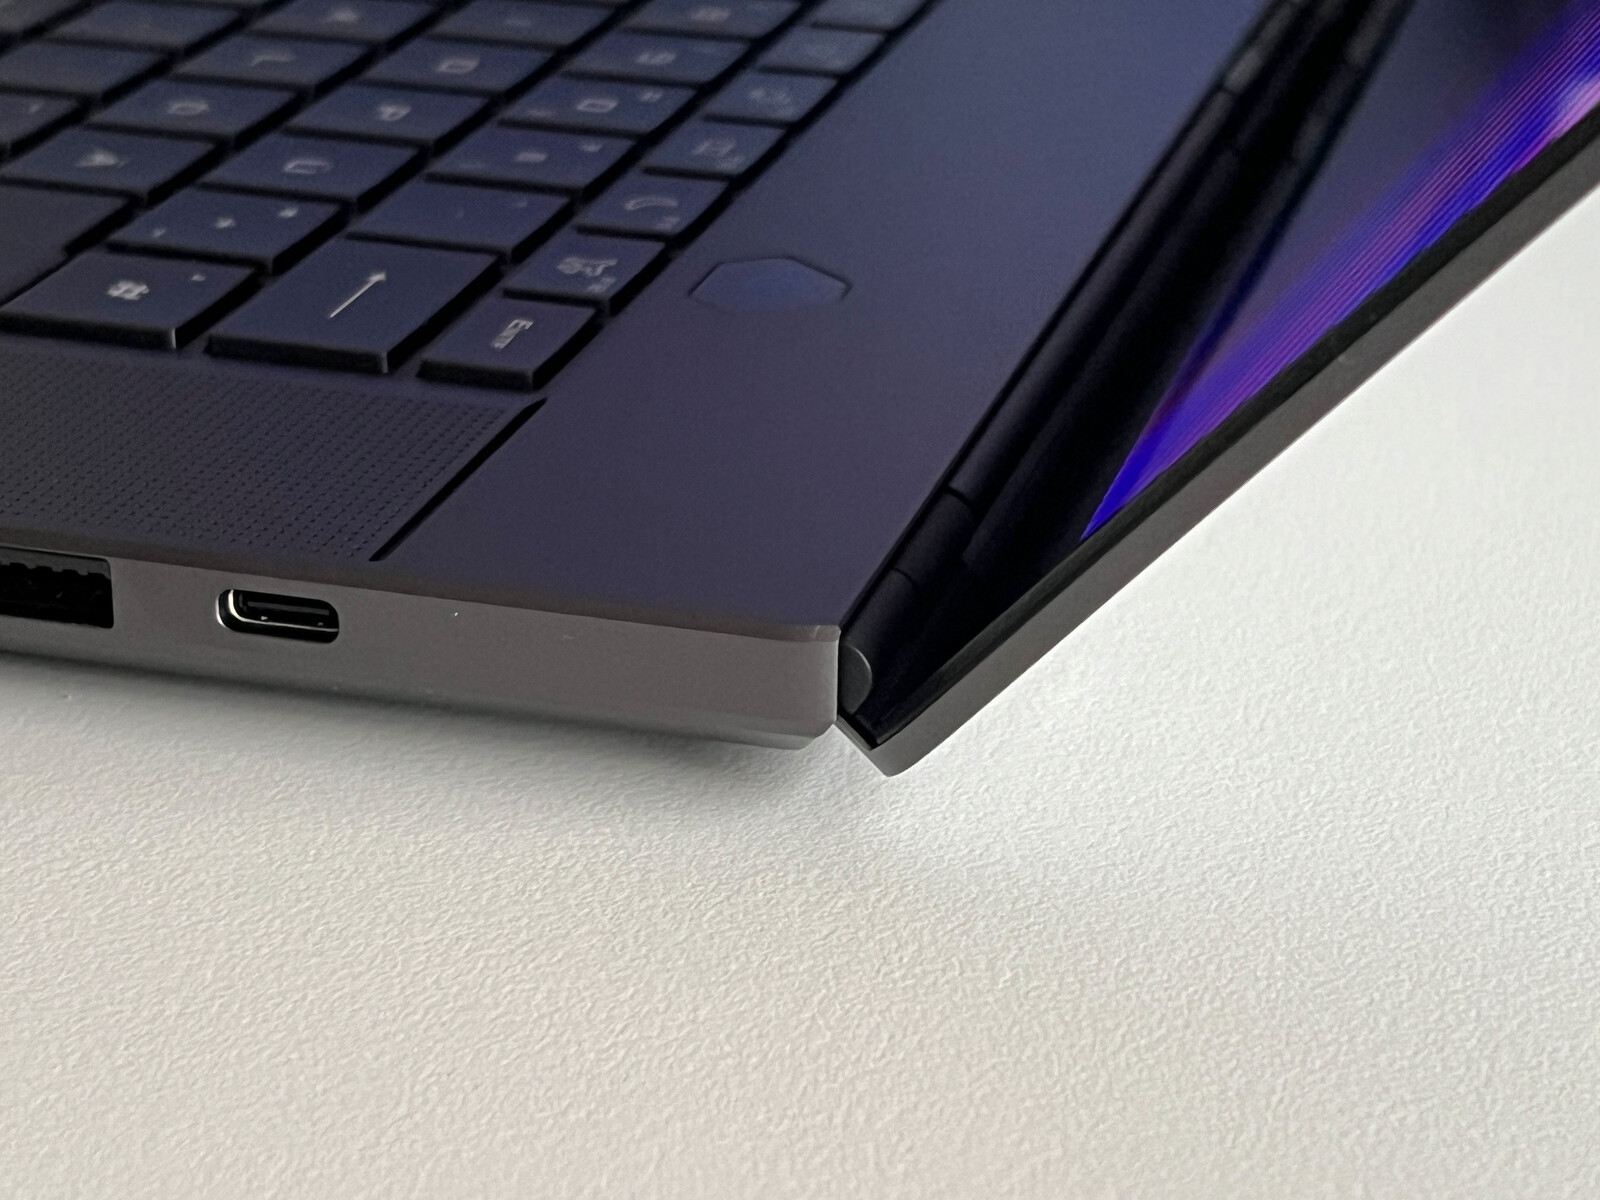
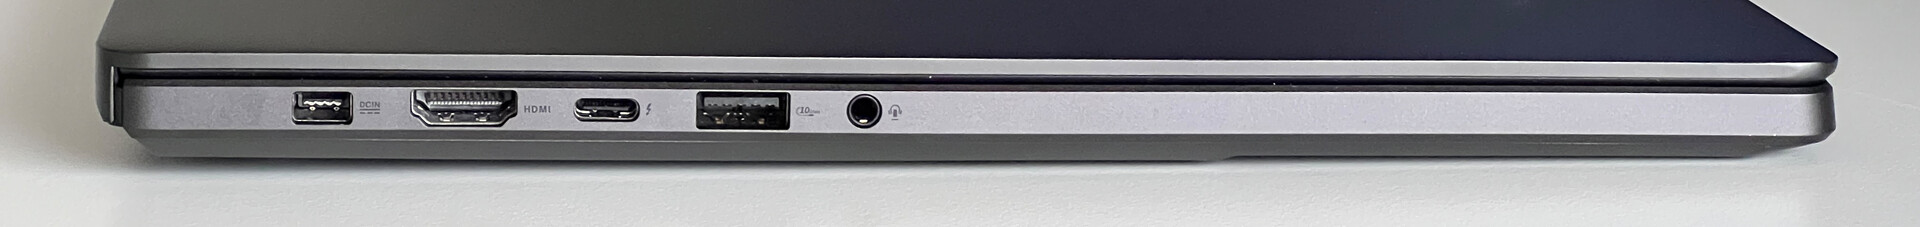
连接性 - Thunderbolt 和高速无线局域网
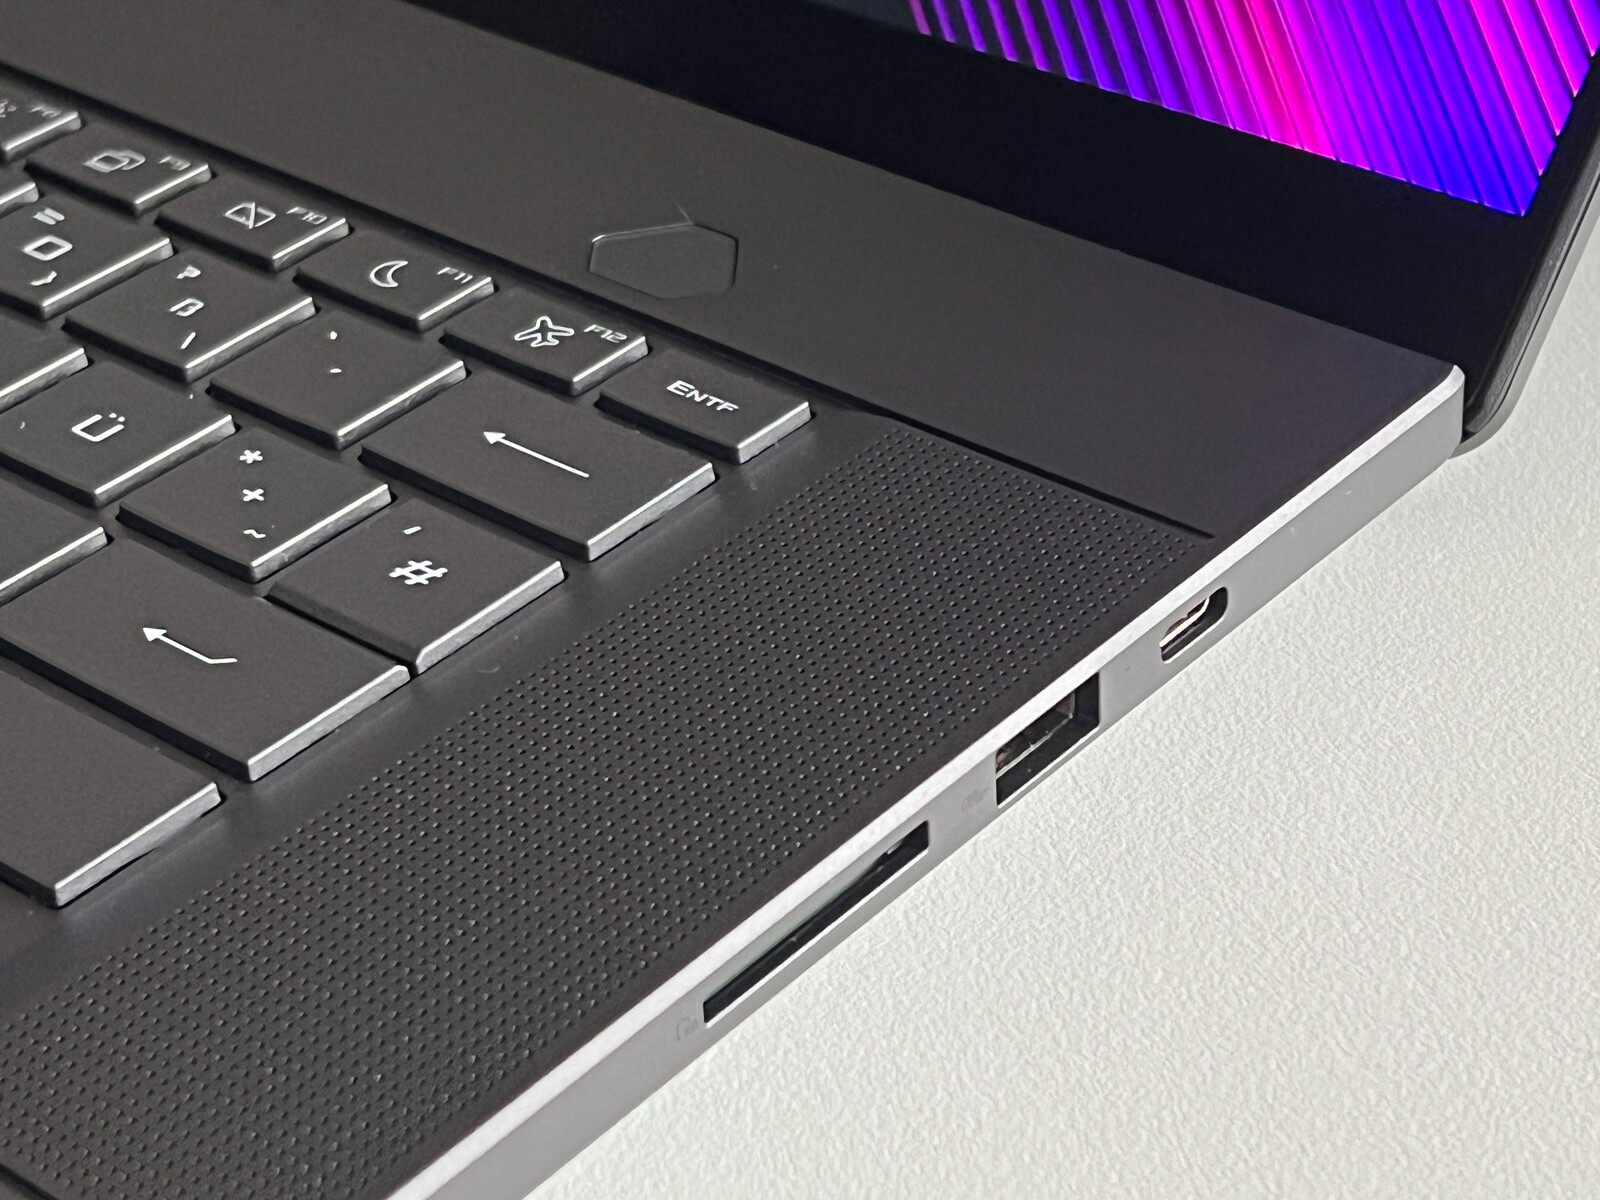
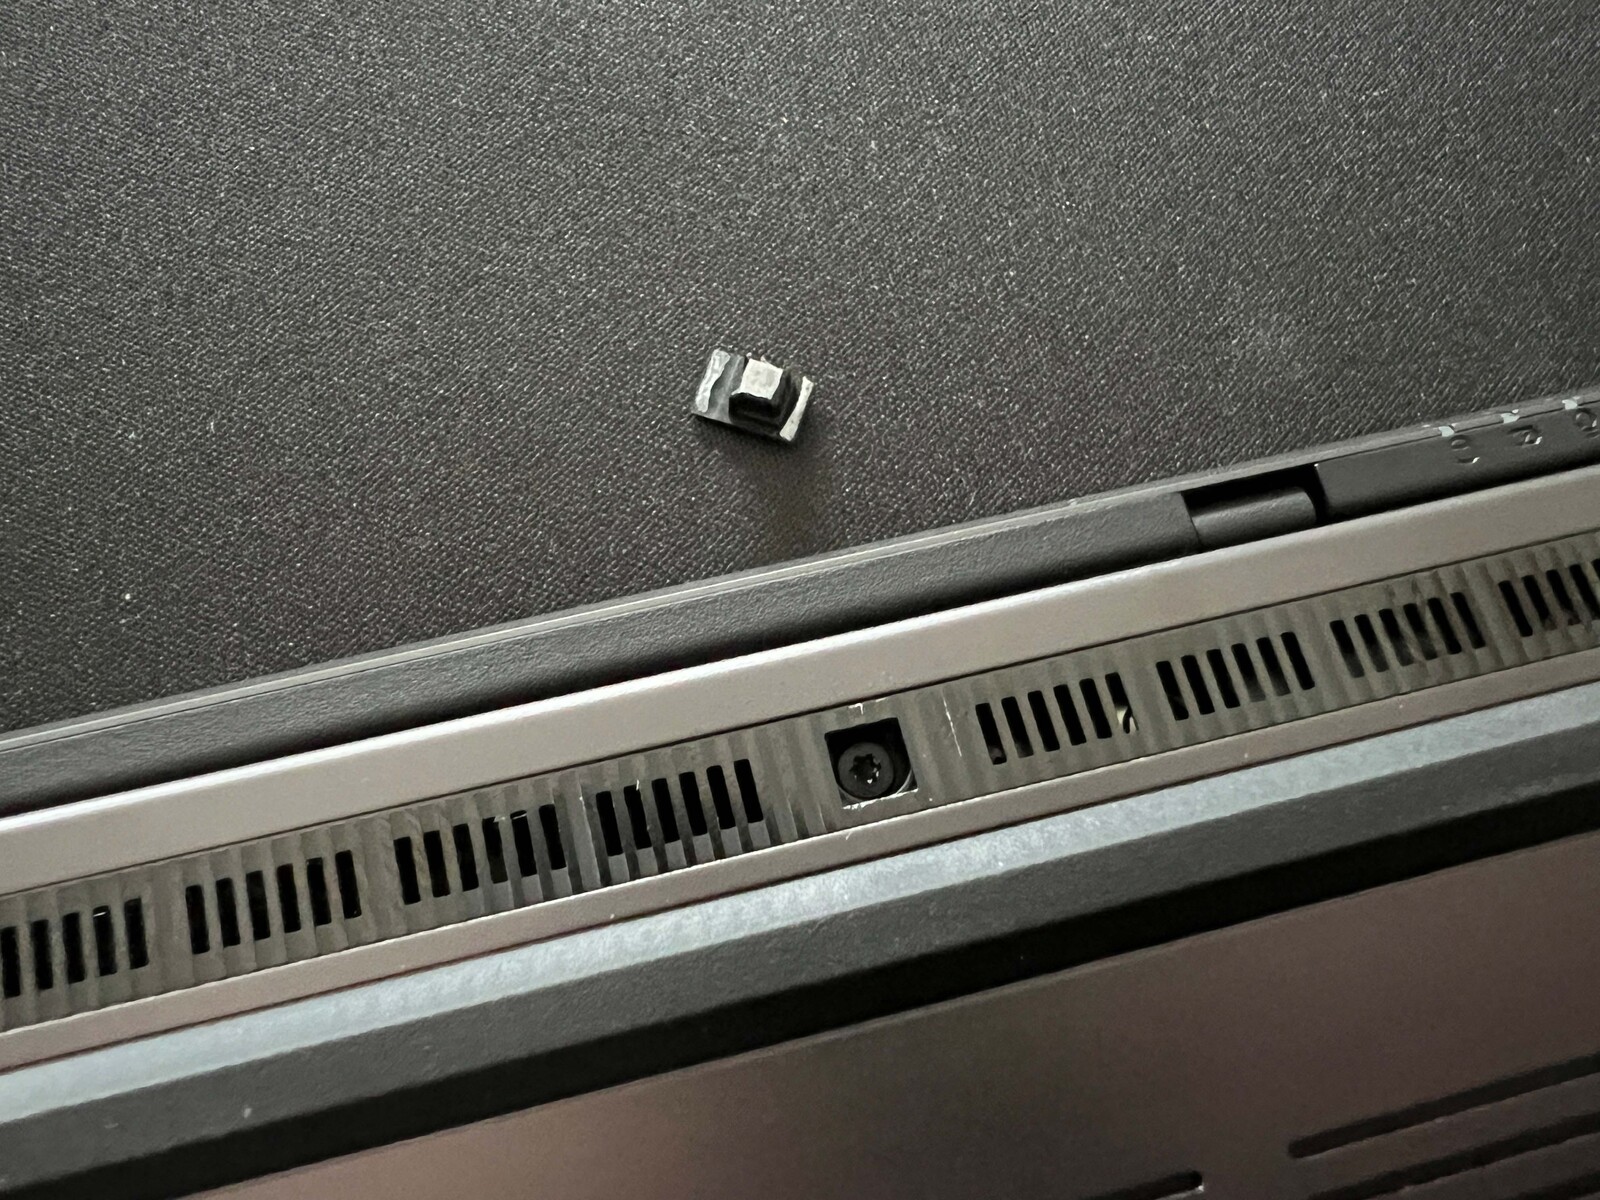
背面完全被散热占据,这也是端口分布在笔记本电脑两侧的原因。华硕现在使用了一个新的矩形电源接口,它被放置在机身背面的左侧。该设备配备了所有重要的连接端口,除了 USB-C,还有 USB-A、全 HDMI 输出和读卡器。两个 USB-C 端口都支持功率高达 100 瓦的 Power Delivery,左侧的端口支持 Thunderbolt 4。只是它没有以太网连接--如果需要,你必须使用 USB 适配器。
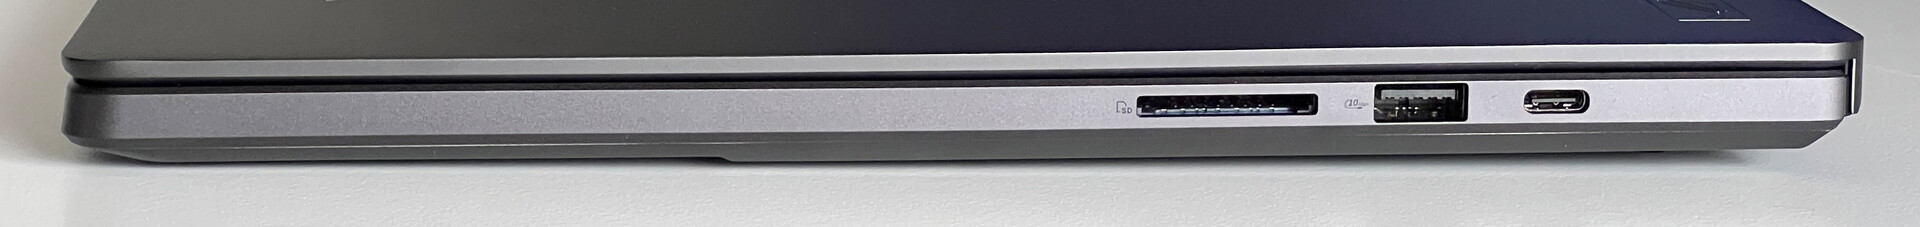
SD 读卡器
G16 右侧有一个全功能读卡器,插入的卡突出约 1.2 厘米。结合我们的参考卡(Angelbird AV Pro V60),它的传输速率约为 80-90 MB/s,这意味着测试设备的传输速率接近底部。
| SD Card Reader | |
| average JPG Copy Test (av. of 3 runs) | |
| Gigabyte AERO 16 OLED BSF | |
| Apple MacBook Pro 16 2023 M3 Max (Angelbird AV Pro V60) | |
| MSI Stealth 16 Studio A13VG | |
| Average of class Gaming (20.9 - 210, n=54, last 2 years) | |
| Razer Blade 16 Early 2023 (AV PRO microSD 128 GB V60) | |
| Asus ROG Zephyrus G16 2024 GU605M | |
| Lenovo Yoga Pro 9 16-IRP G8 (Angelibird AV Pro V60) | |
| Schenker VISION 16 Pro (M23) (Angelbird AV Pro V60) | |
| maximum AS SSD Seq Read Test (1GB) | |
| Apple MacBook Pro 16 2023 M3 Max (Angelbird AV Pro V60) | |
| Razer Blade 16 Early 2023 (AV PRO microSD 128 GB V60) | |
| Gigabyte AERO 16 OLED BSF | |
| MSI Stealth 16 Studio A13VG | |
| Average of class Gaming (25.5 - 261, n=51, last 2 years) | |
| Asus ROG Zephyrus G16 2024 GU605M | |
| Lenovo Yoga Pro 9 16-IRP G8 (Angelibird AV Pro V60) | |
| Schenker VISION 16 Pro (M23) (Angelbird AV Pro V60) | |
交流
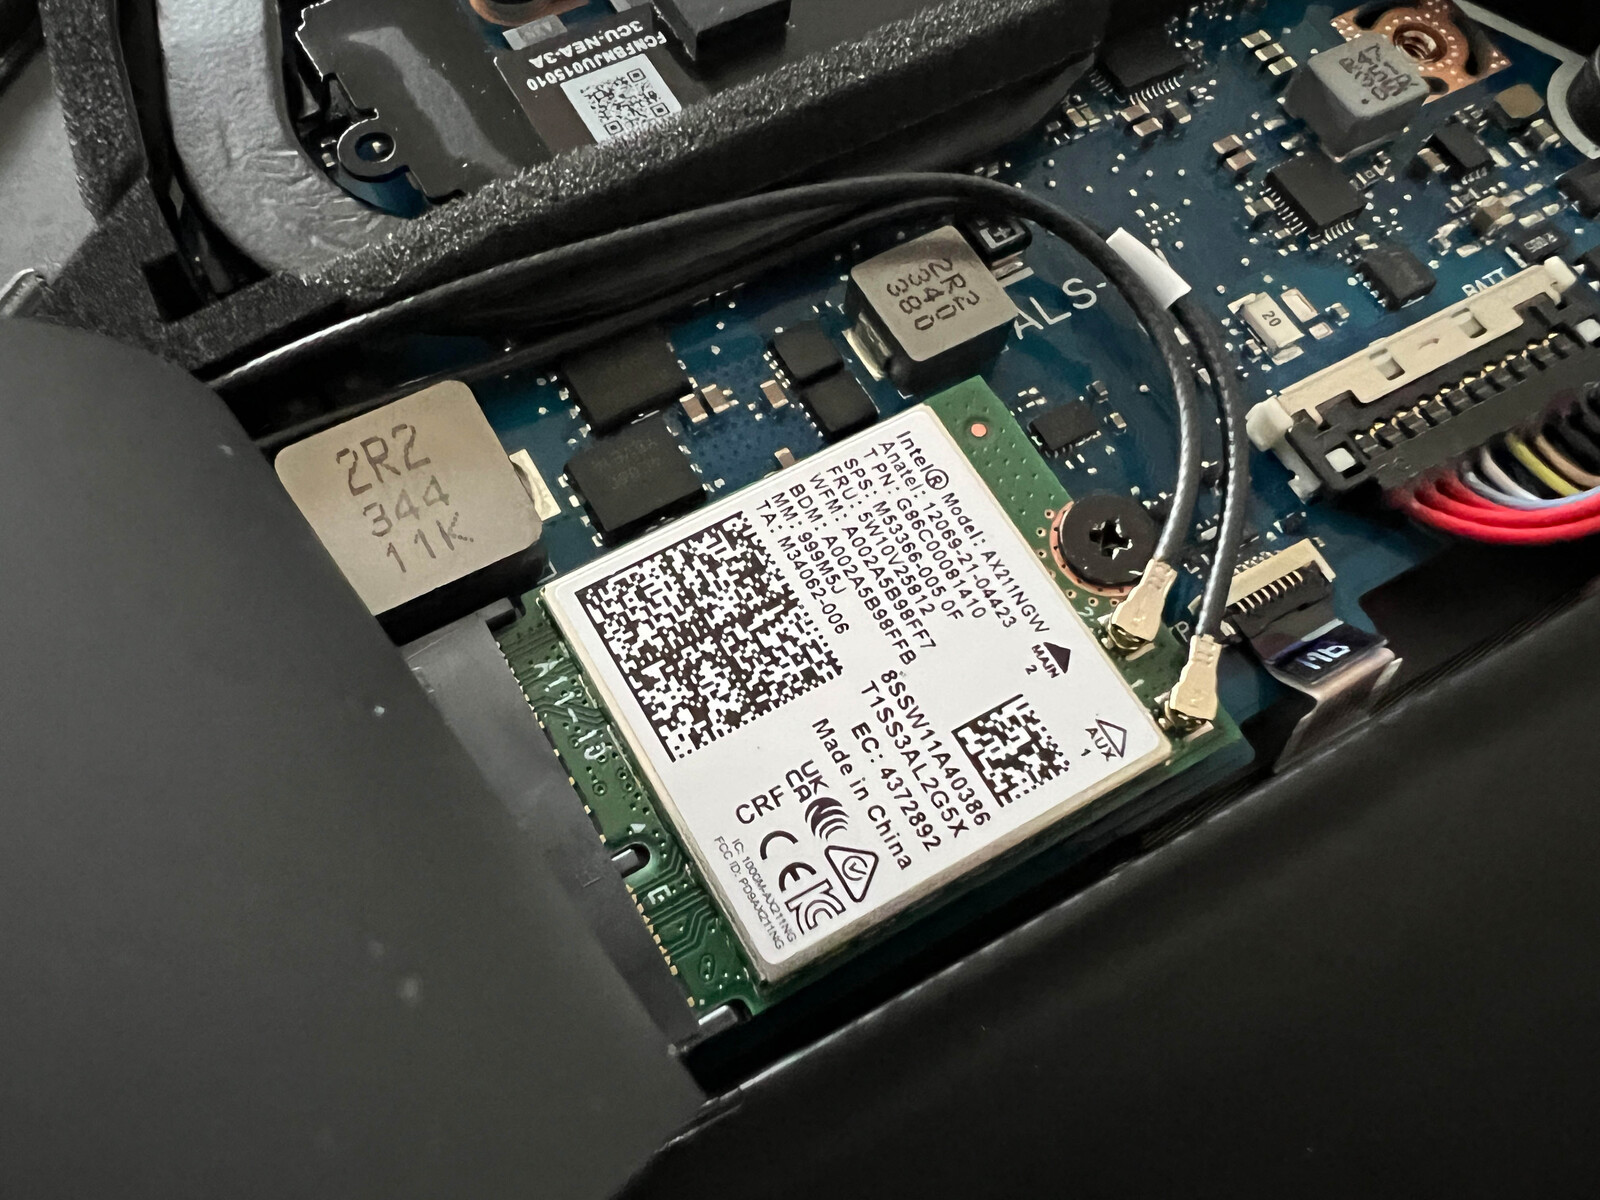
华硕放弃了 Wi-Fi 7,但即便如此,英特尔的 AX211 模块仍然是一款支持蓝牙 5.3 和 Wi-Fi 6E 的最新无线局域网适配器。与华硕的参考路由器相比,它的传输速率非常好且稳定,在测试期间,我们没有遇到任何信号质量问题。
| Networking | |
| Asus ROG Zephyrus G16 2024 GU605M | |
| iperf3 transmit AXE11000 | |
| iperf3 receive AXE11000 | |
| Lenovo Yoga Pro 9 16-IRP G8 | |
| iperf3 transmit AXE11000 | |
| iperf3 receive AXE11000 | |
| Razer Blade 16 Early 2023 | |
| iperf3 transmit AXE11000 | |
| iperf3 receive AXE11000 | |
| iperf3 transmit AXE11000 6GHz | |
| iperf3 receive AXE11000 6GHz | |
| Gigabyte AERO 16 OLED BSF | |
| iperf3 transmit AXE11000 6GHz | |
| iperf3 receive AXE11000 6GHz | |
| Schenker VISION 16 Pro (M23) | |
| iperf3 transmit AXE11000 | |
| iperf3 receive AXE11000 | |
| MSI Stealth 16 Studio A13VG | |
| iperf3 transmit AXE11000 | |
| iperf3 receive AXE11000 | |
| iperf3 transmit AXE11000 6GHz | |
| iperf3 receive AXE11000 6GHz | |
| Apple MacBook Pro 16 2023 M3 Max | |
| iperf3 transmit AXE11000 | |
| iperf3 receive AXE11000 | |
网络摄像头
安装在显示屏上边框的 1080p 网络摄像头可在光线充足的条件下拍摄出漂亮的照片,还支持面部跟踪和柔焦等功能。它还配备了一个额外的红外摄像头,可通过 Windows Hello 进行面部识别。


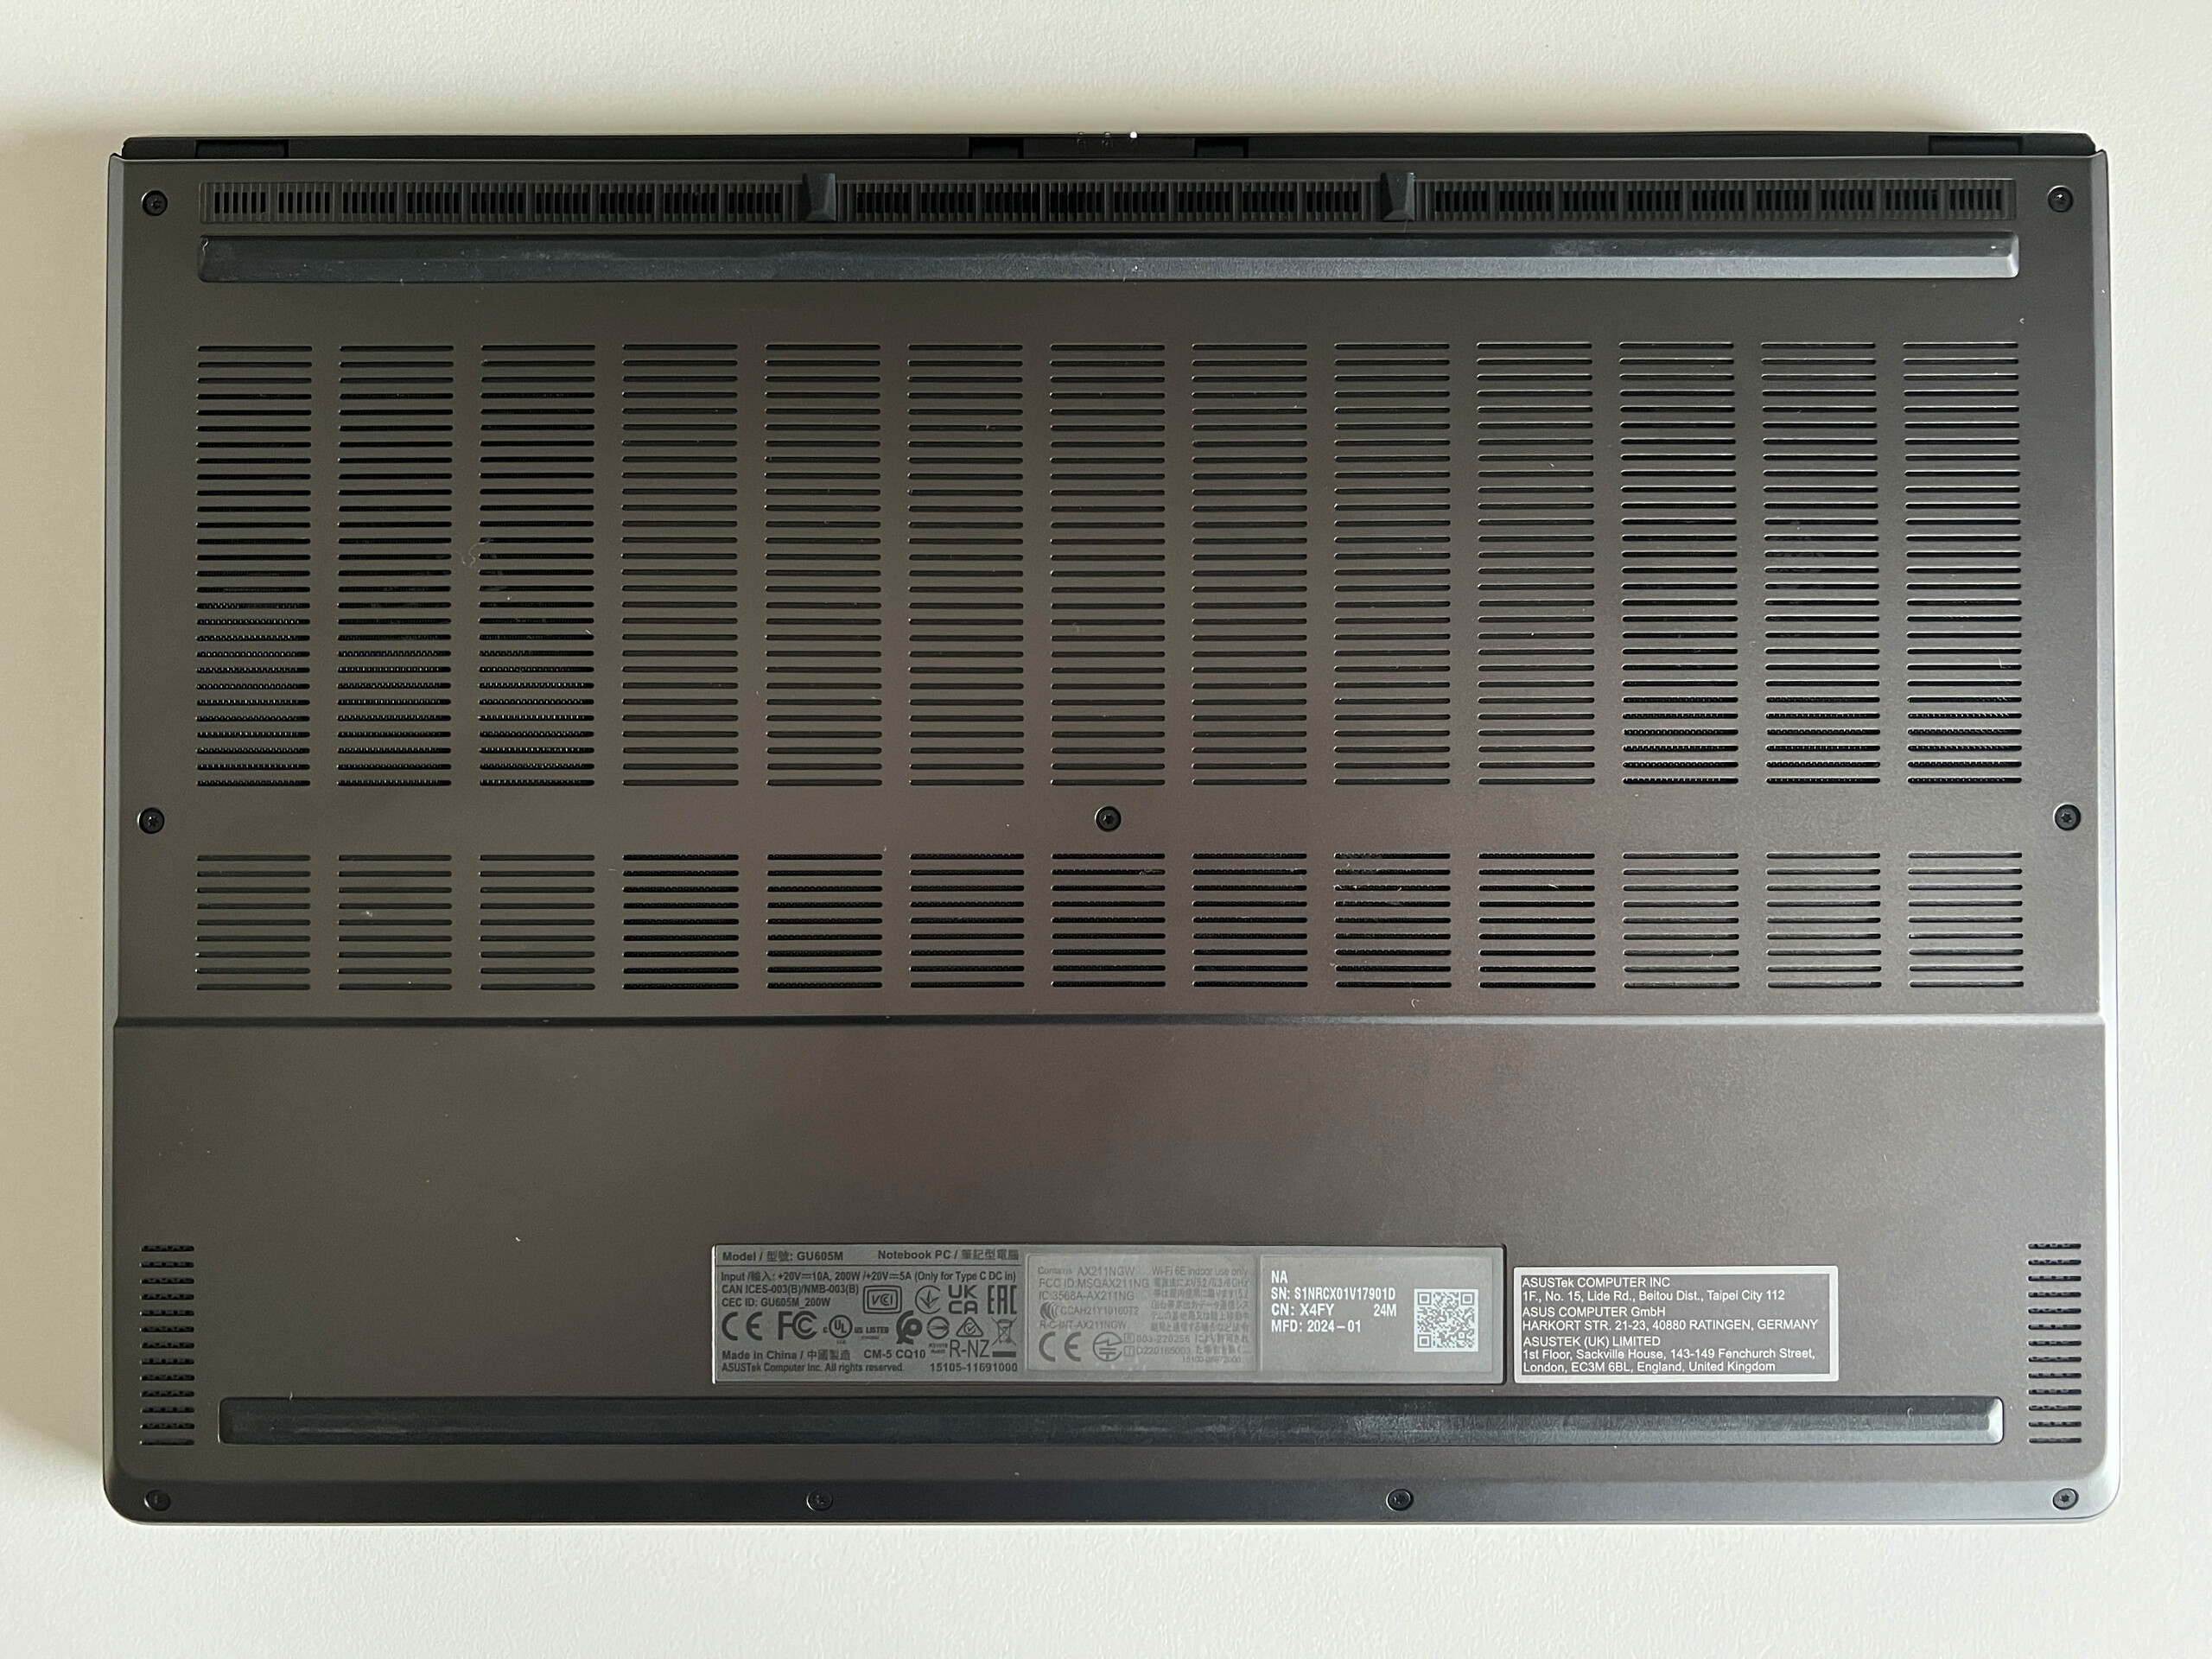
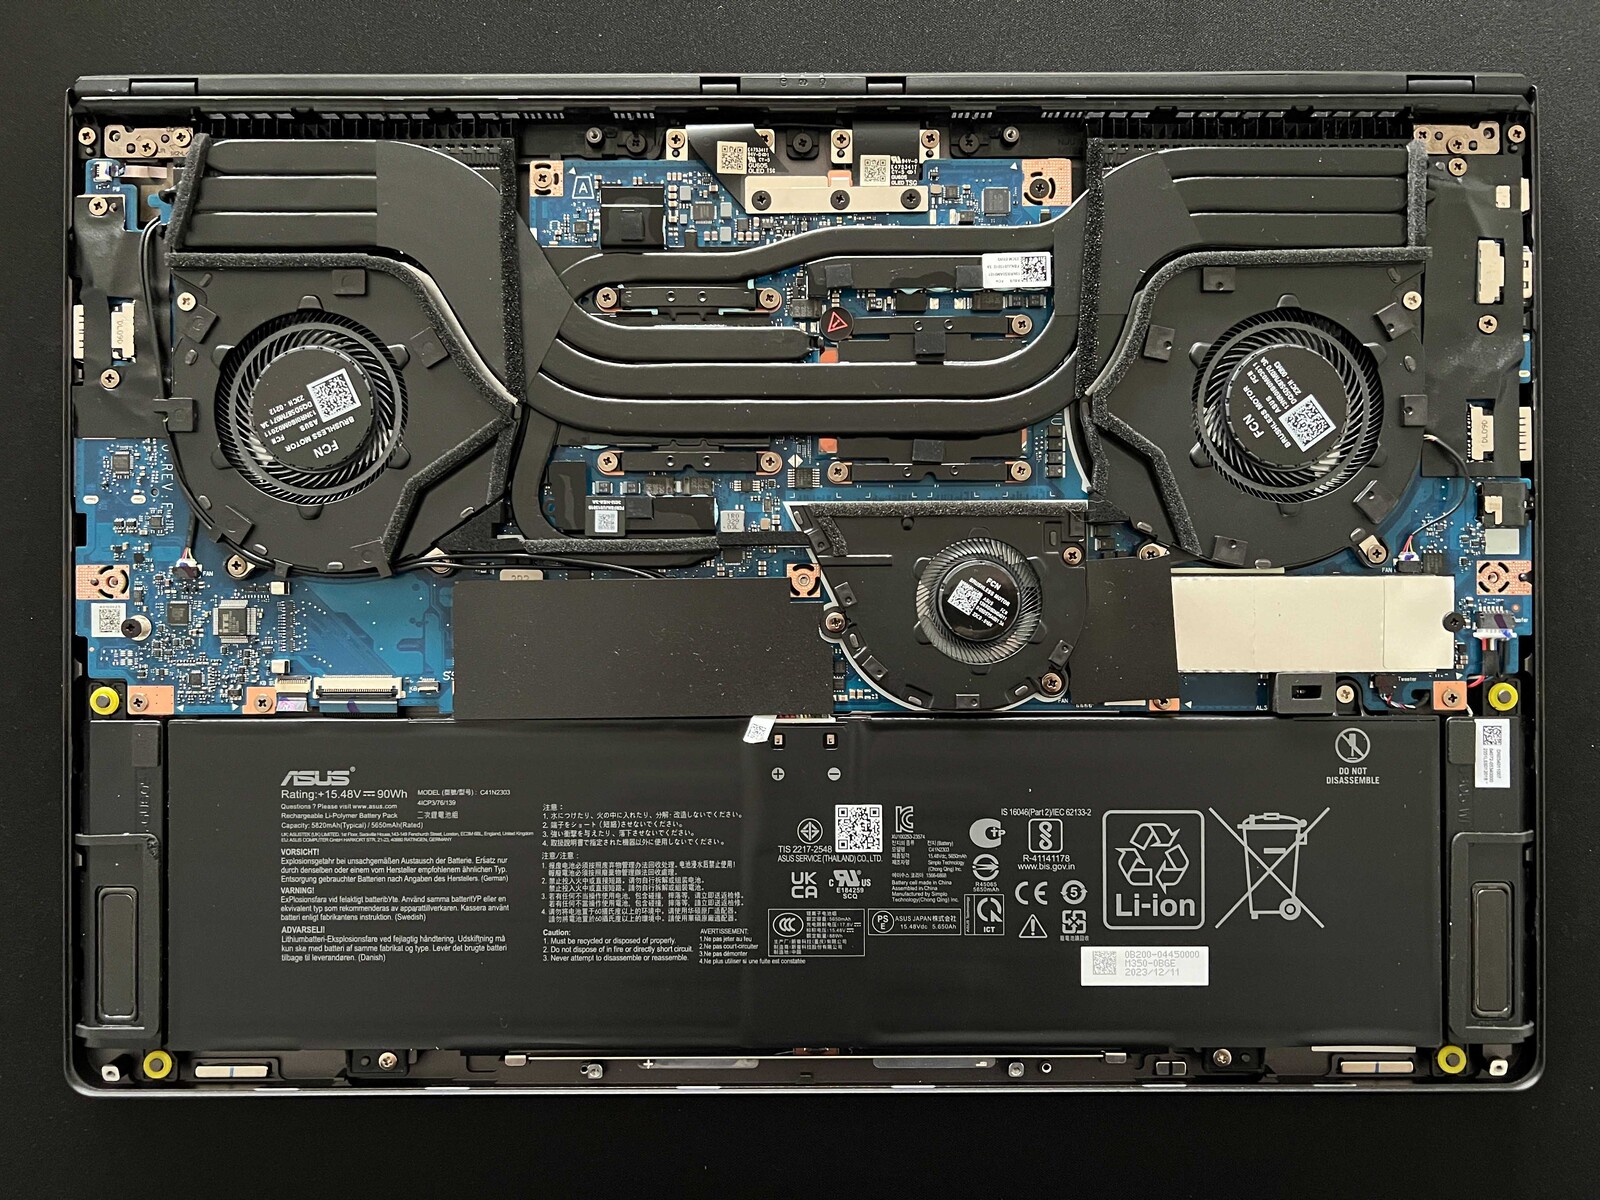
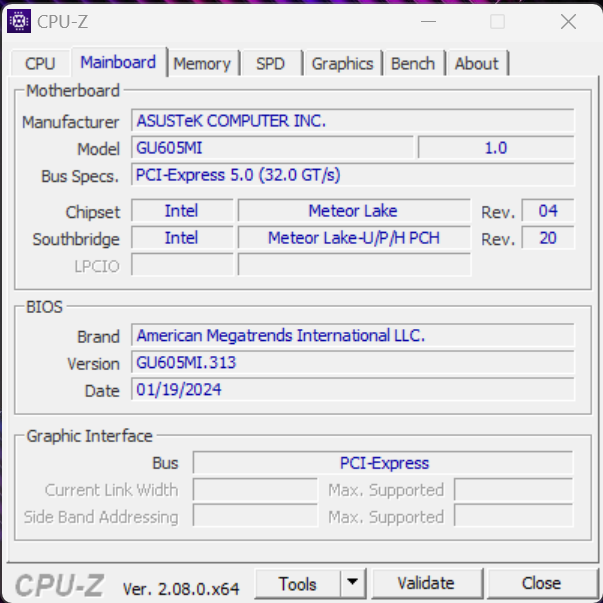
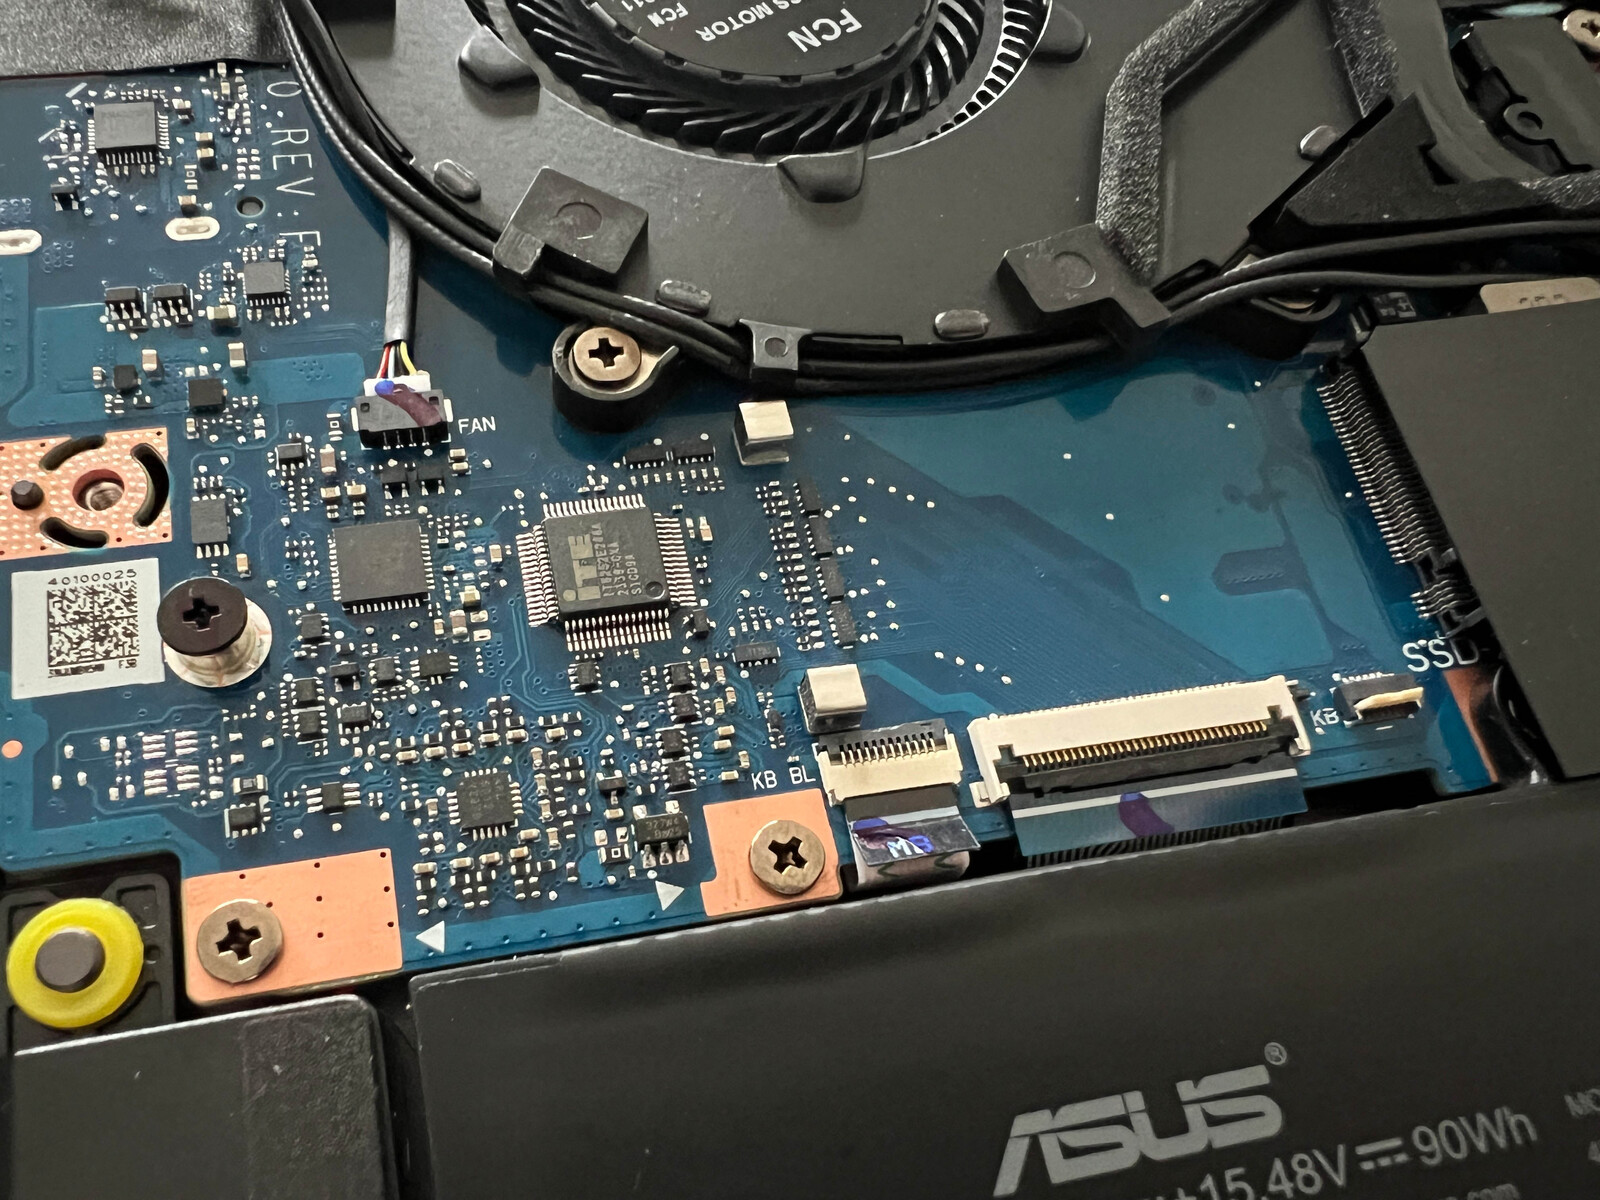
维护
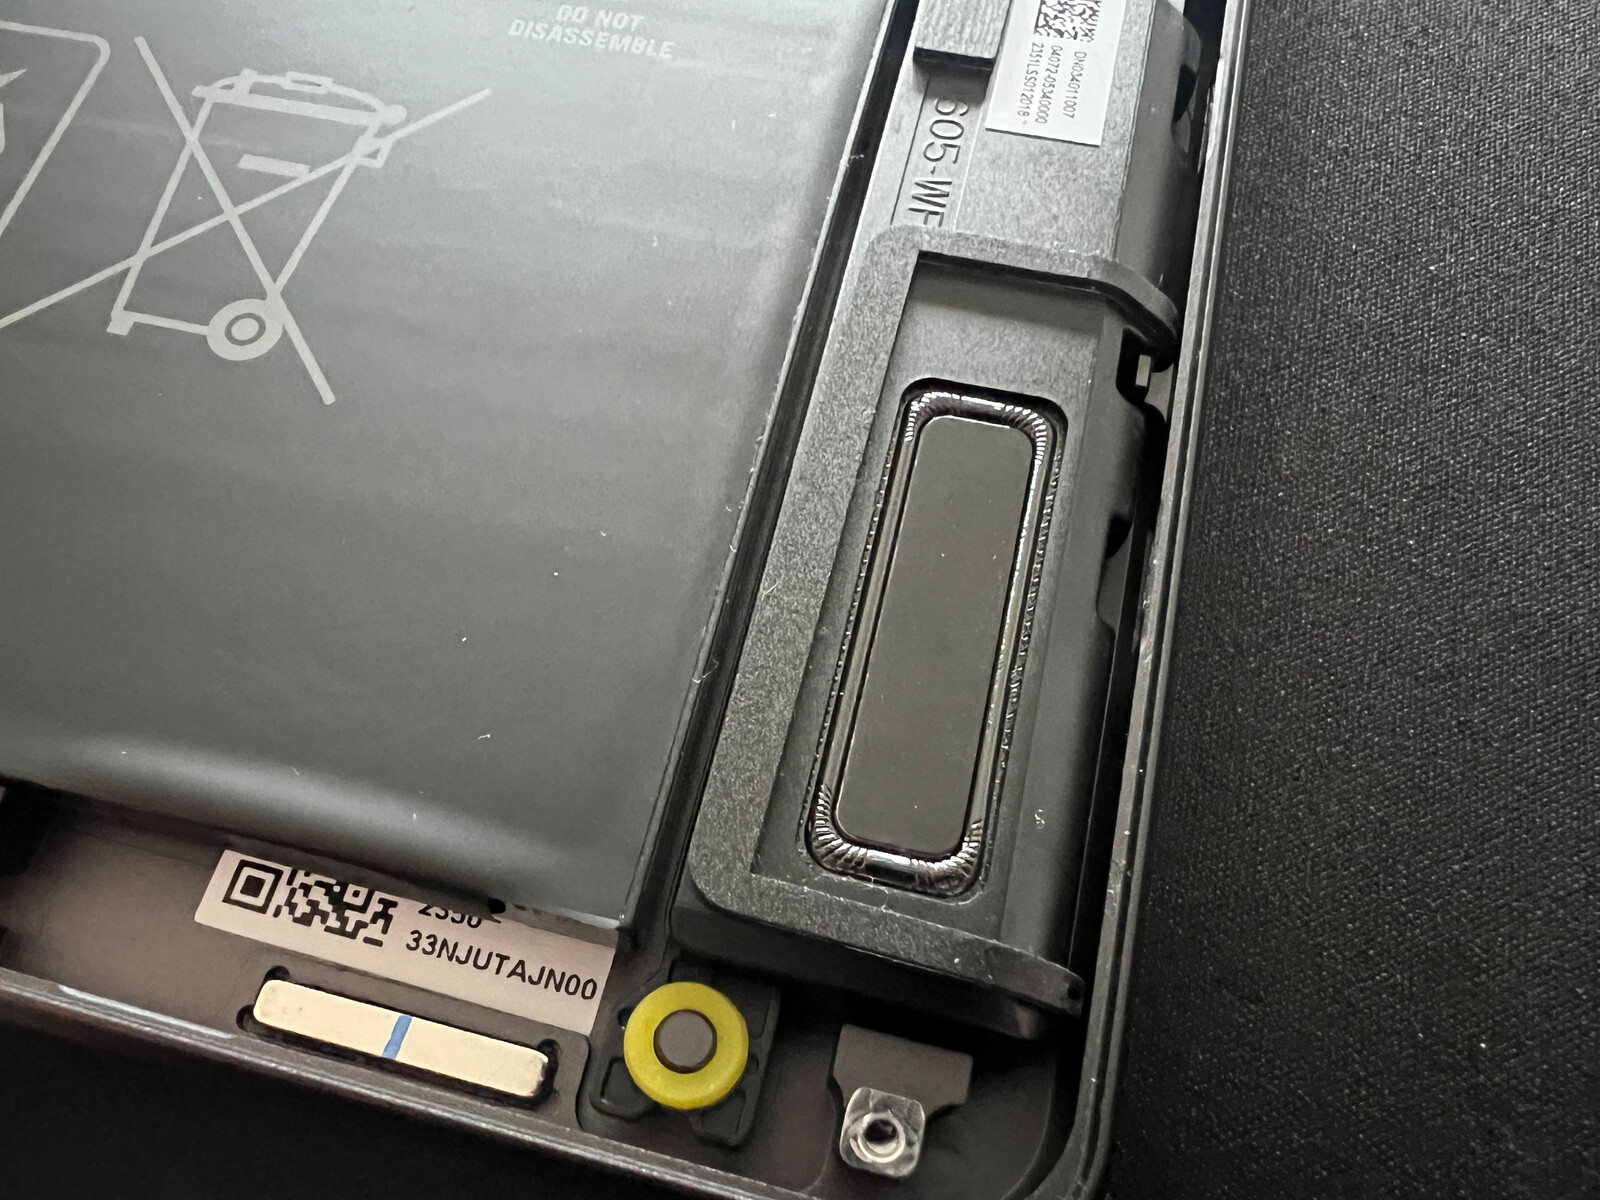
除了可见的螺钉外,还有两个螺钉隐藏在胶粘的橡胶套下。这就给查看元件带来了不必要的困难。不过,由于内存已被焊接在机身内部,因此无论如何都无法深入内部。另一方面,有两个固态硬盘插槽,如果需要,还可以更换 WLAN 模块和电池。你还可以进入风扇进行清洁。
输入设备 - 舒适的键盘和超大触摸板
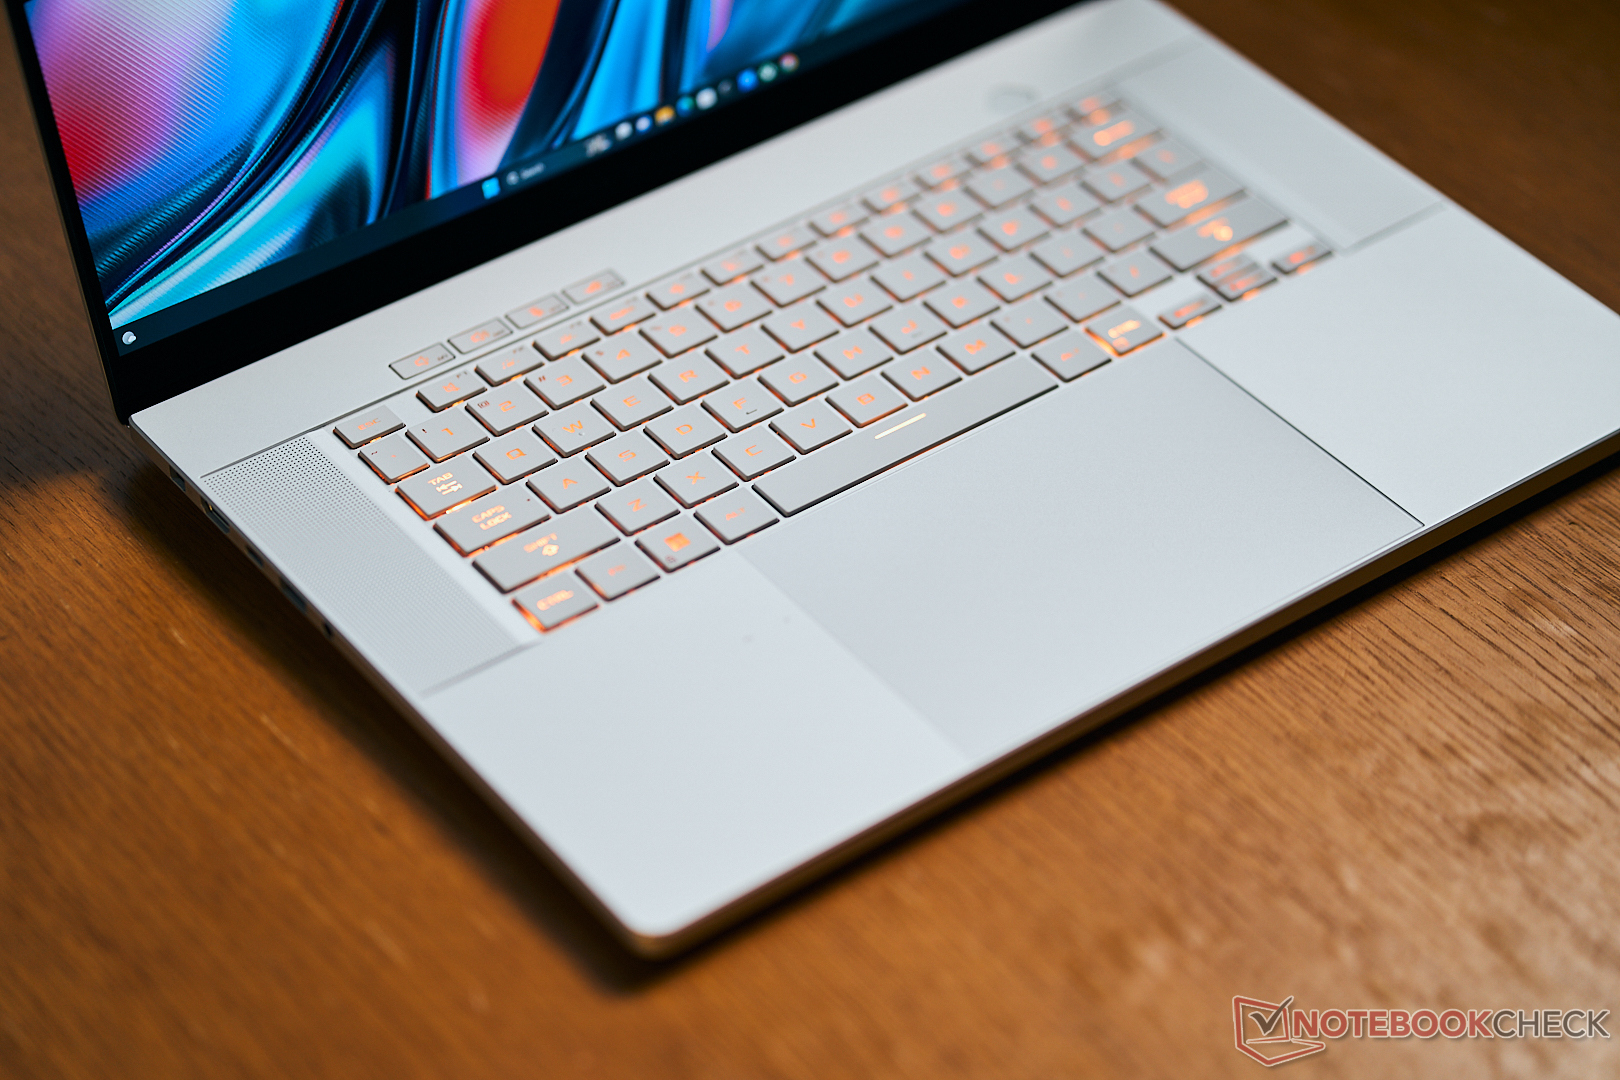
G16 采用背光键盘(一个 RGB 区域,3 个强度级别),没有专用的数字键盘。键盘布局并无特别之处,但你必须习惯单行回车键和小方向键,这对于游戏笔记本电脑来说并不理想。不过,键盘本身非常舒适,按键抬升高度为 1.7 毫米。日常使用时相当安静,你可以轻松地用它来书写较长的文字。
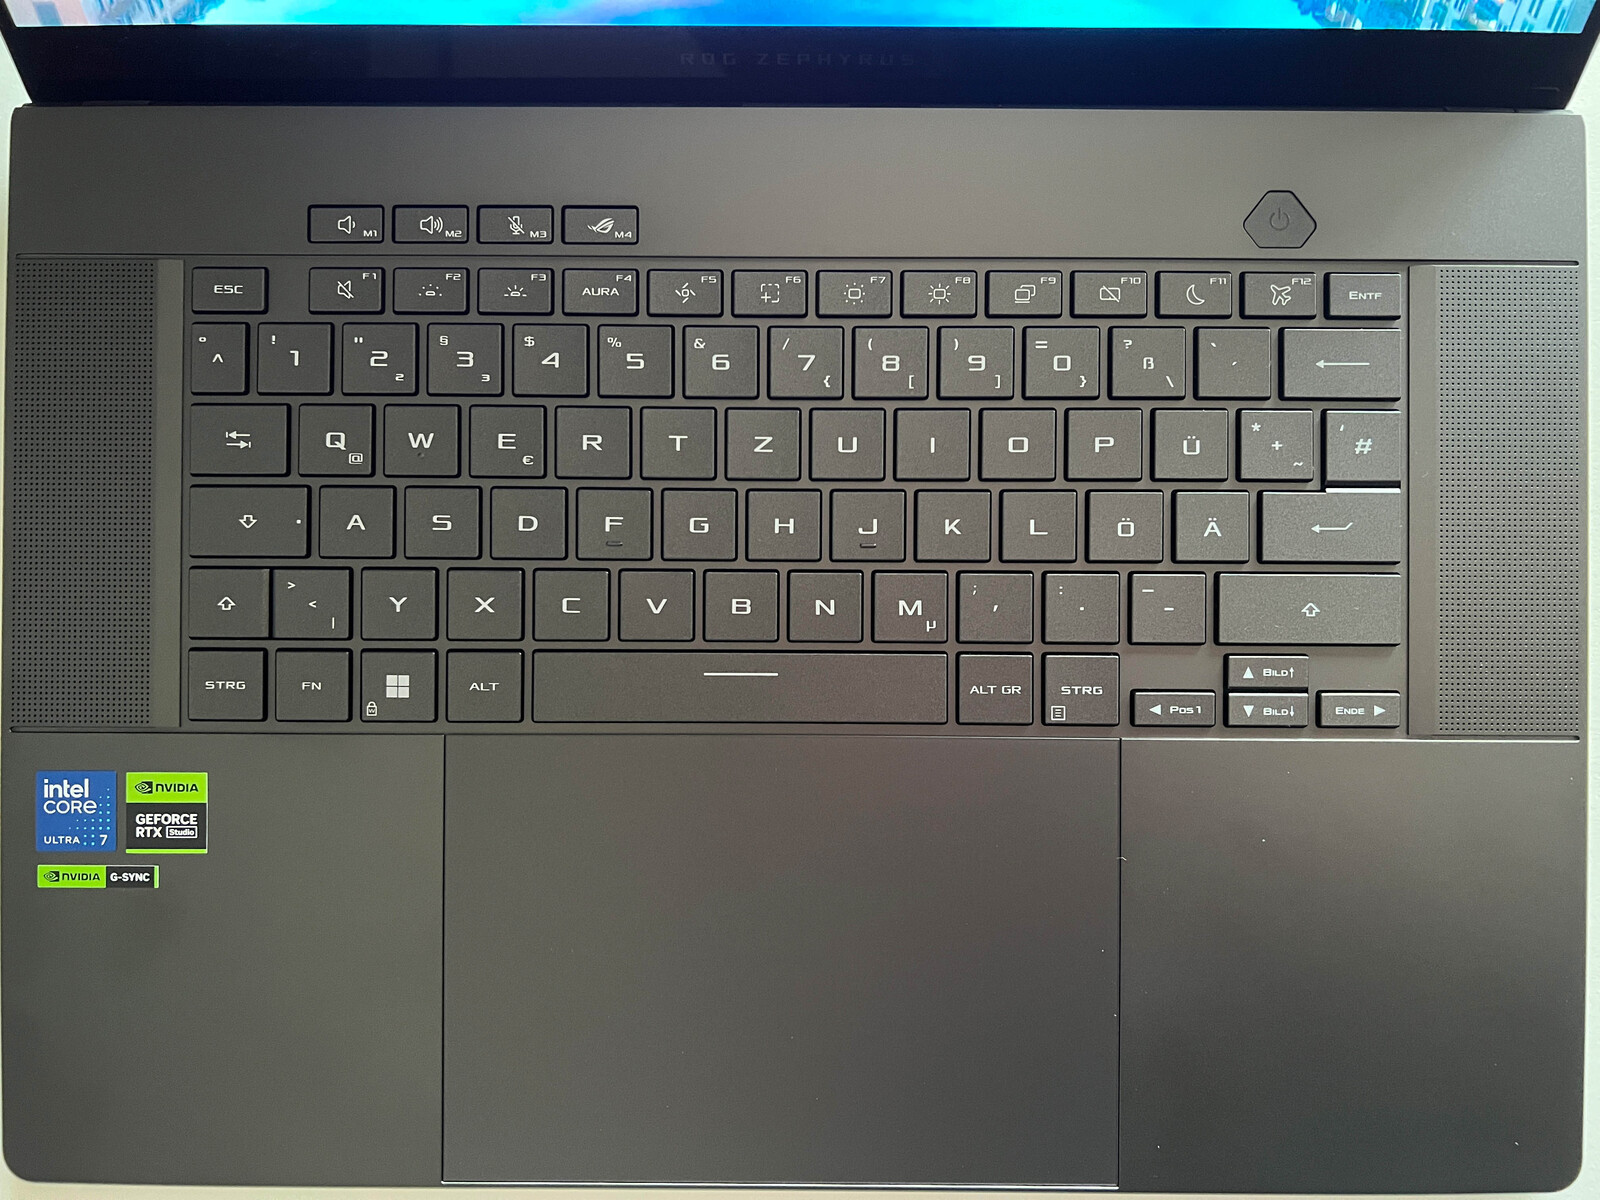

笔记本电脑的新触摸板非常大,尺寸为 15 x 9.9 厘米(比以前大 37%),比例为 16:10。触摸板表面光滑,操作起来手感极佳,咔哒咔哒的噪音也很低,给人一种高品质的感觉。
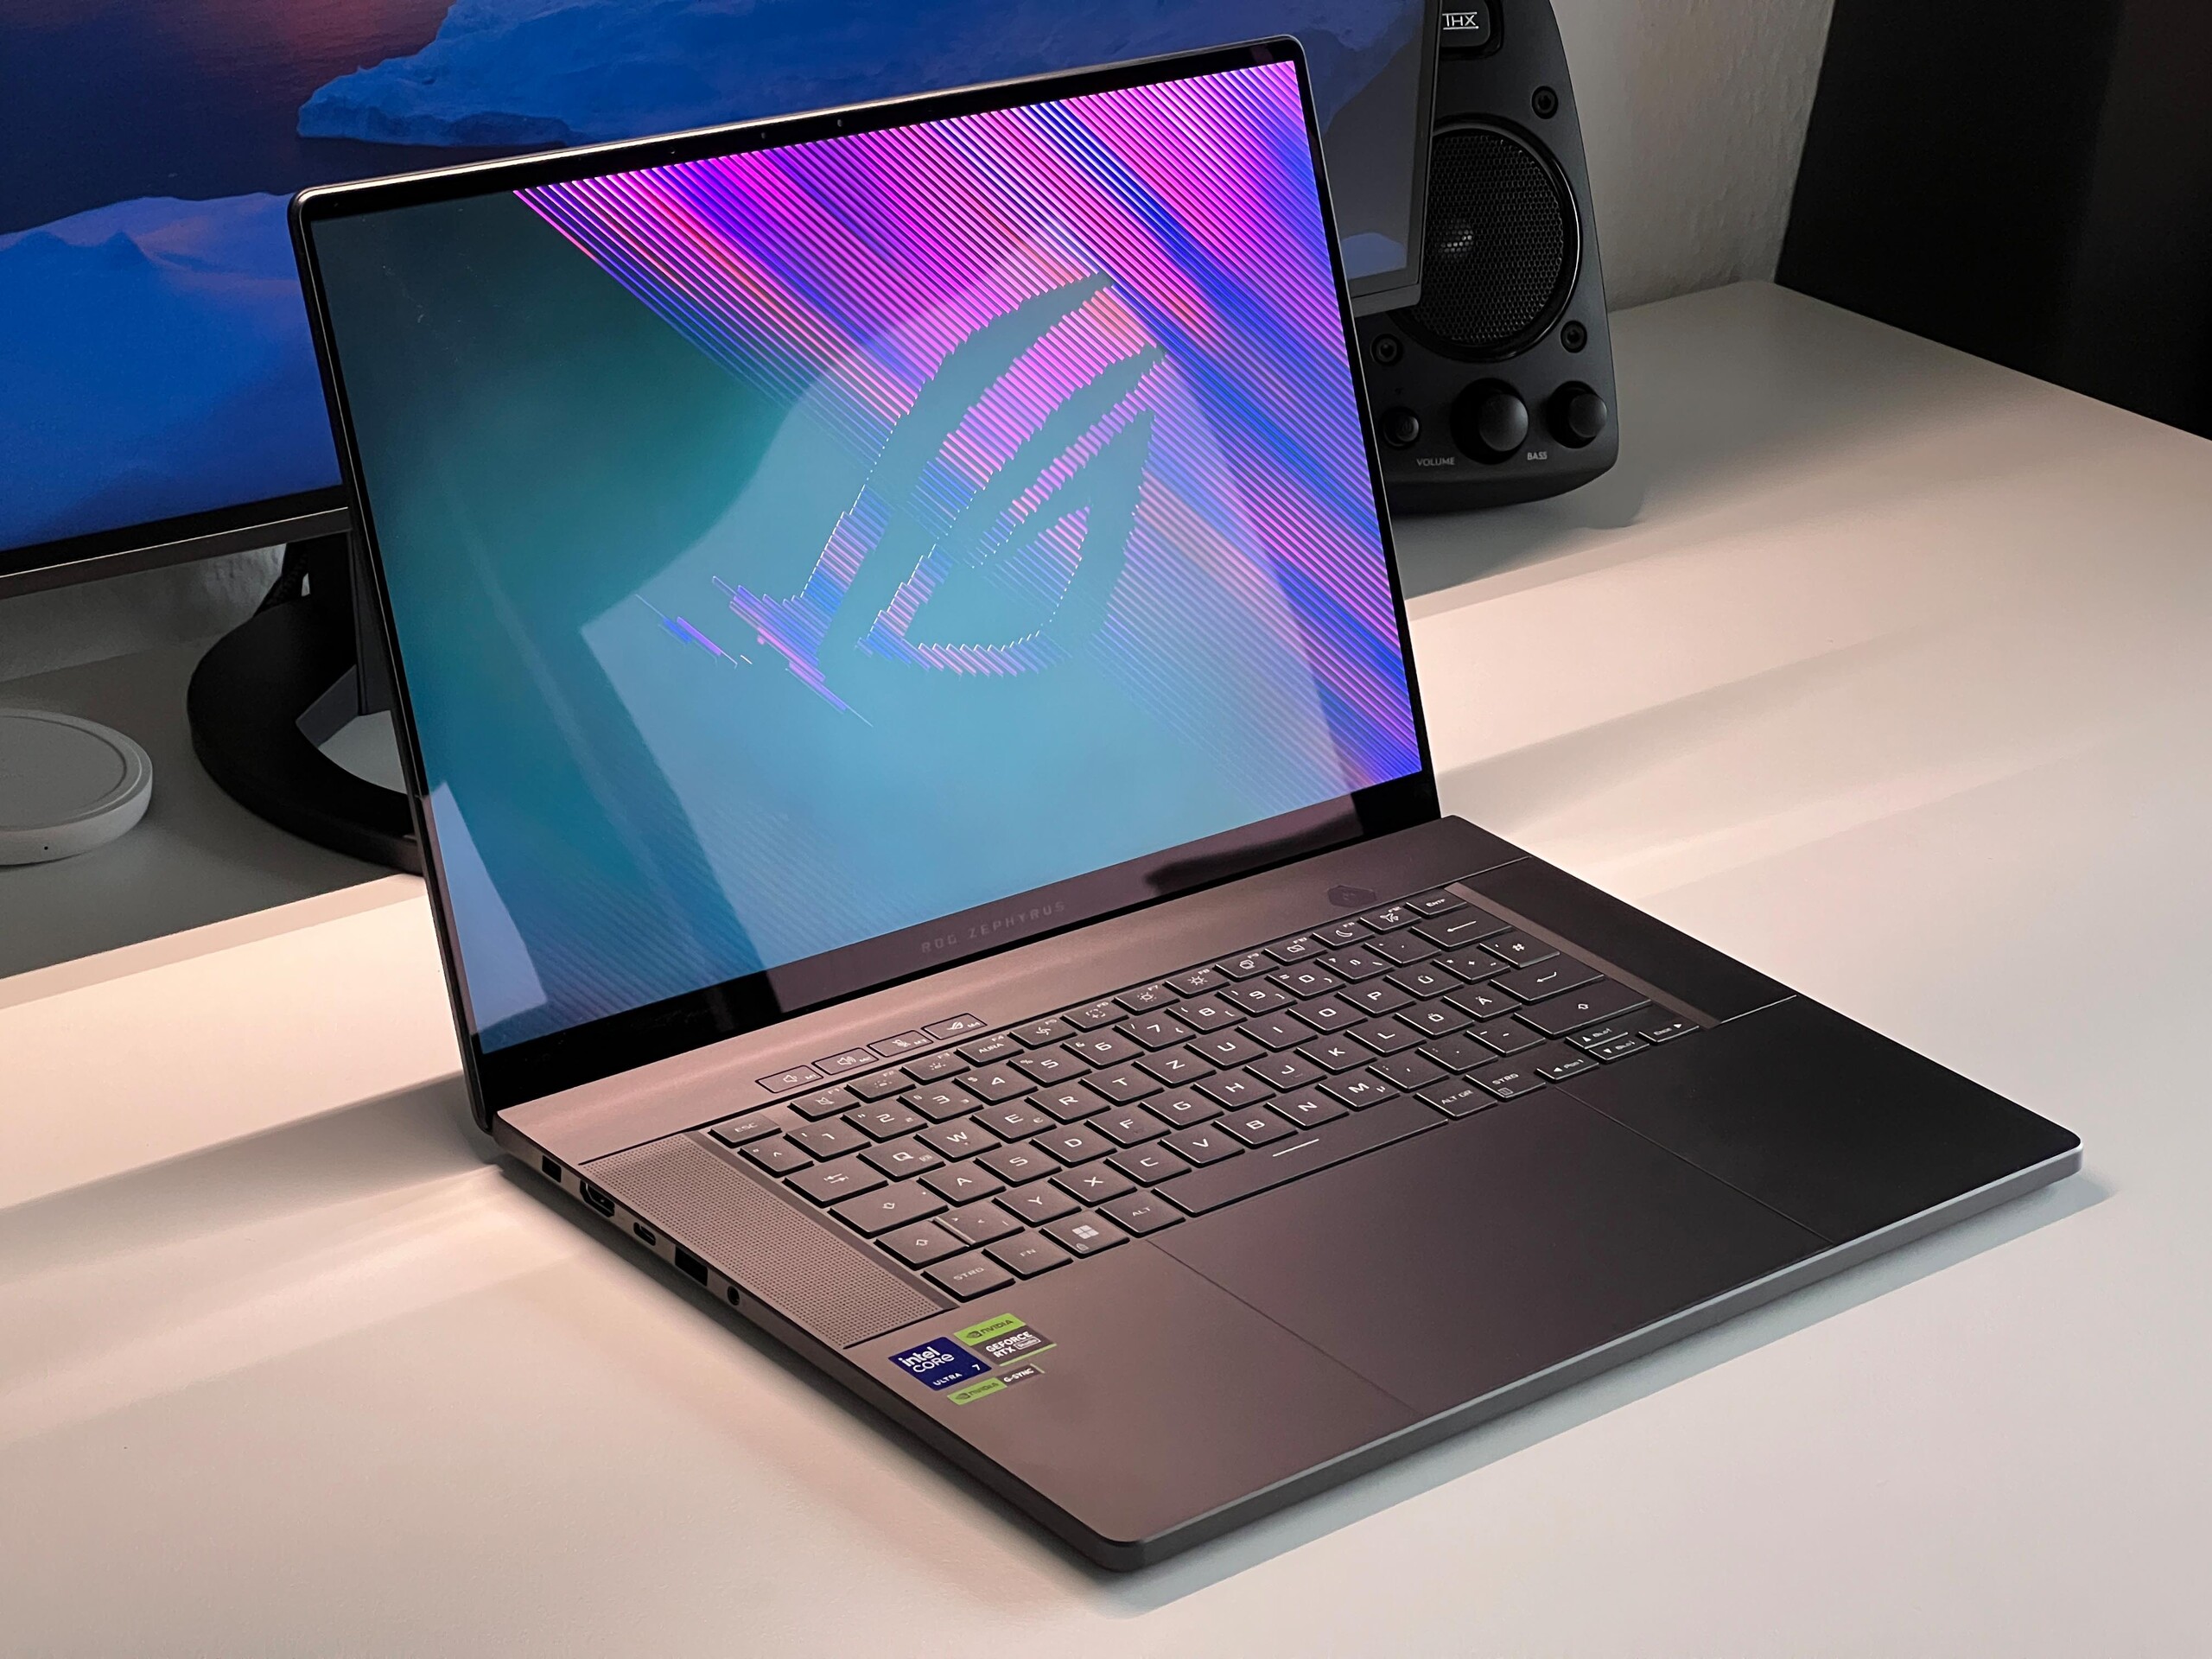
显示屏 - 华硕首款配备 G-Sync 技术的 240-Hz OLED 显示屏

新款 ROG Zephyrus G16 是首款配备支持 G-Sync 的 16 英寸 OLED 面板的笔记本电脑。此外,它的刷新率为 240 Hz,主观而言,三星反射式面板的画质令人震惊:内容清晰锐利,色彩超级鲜艳。得益于其快速的响应时间,OLED 也非常适合游戏。华硕没有安装亮度传感器。
在 SDR 模式下,它的平均亮度为 420 cd/m²,这是一个不错的结果。与 OLED 的典型特性一样,它的黑色值为 0,因此对比度极高。华硕宣称 HDR 最大亮度为 500 cd/m²,而我们测量的峰值为 455 cd/m²。在这方面,三星面板无法与其他 OLED 显示器相提并论,尤其是安装在Apple MacBook Pro 16 (最大 1600 cd/m²)上的迷你 LED 面板。此外,我们还必须继续批评 Windows 的 HDR 实施,因为它必须手动激活,随后色彩配置文件就无法正常工作了。目前,所有 Windows 设备都会受到影响。由于 OLED 面板的构造,它不会出现任何光晕效应。
| |||||||||||||||||||||||||
Brightness Distribution: 96 %
Center on Battery: 416 cd/m²
Contrast: ∞:1 (Black: 0 cd/m²)
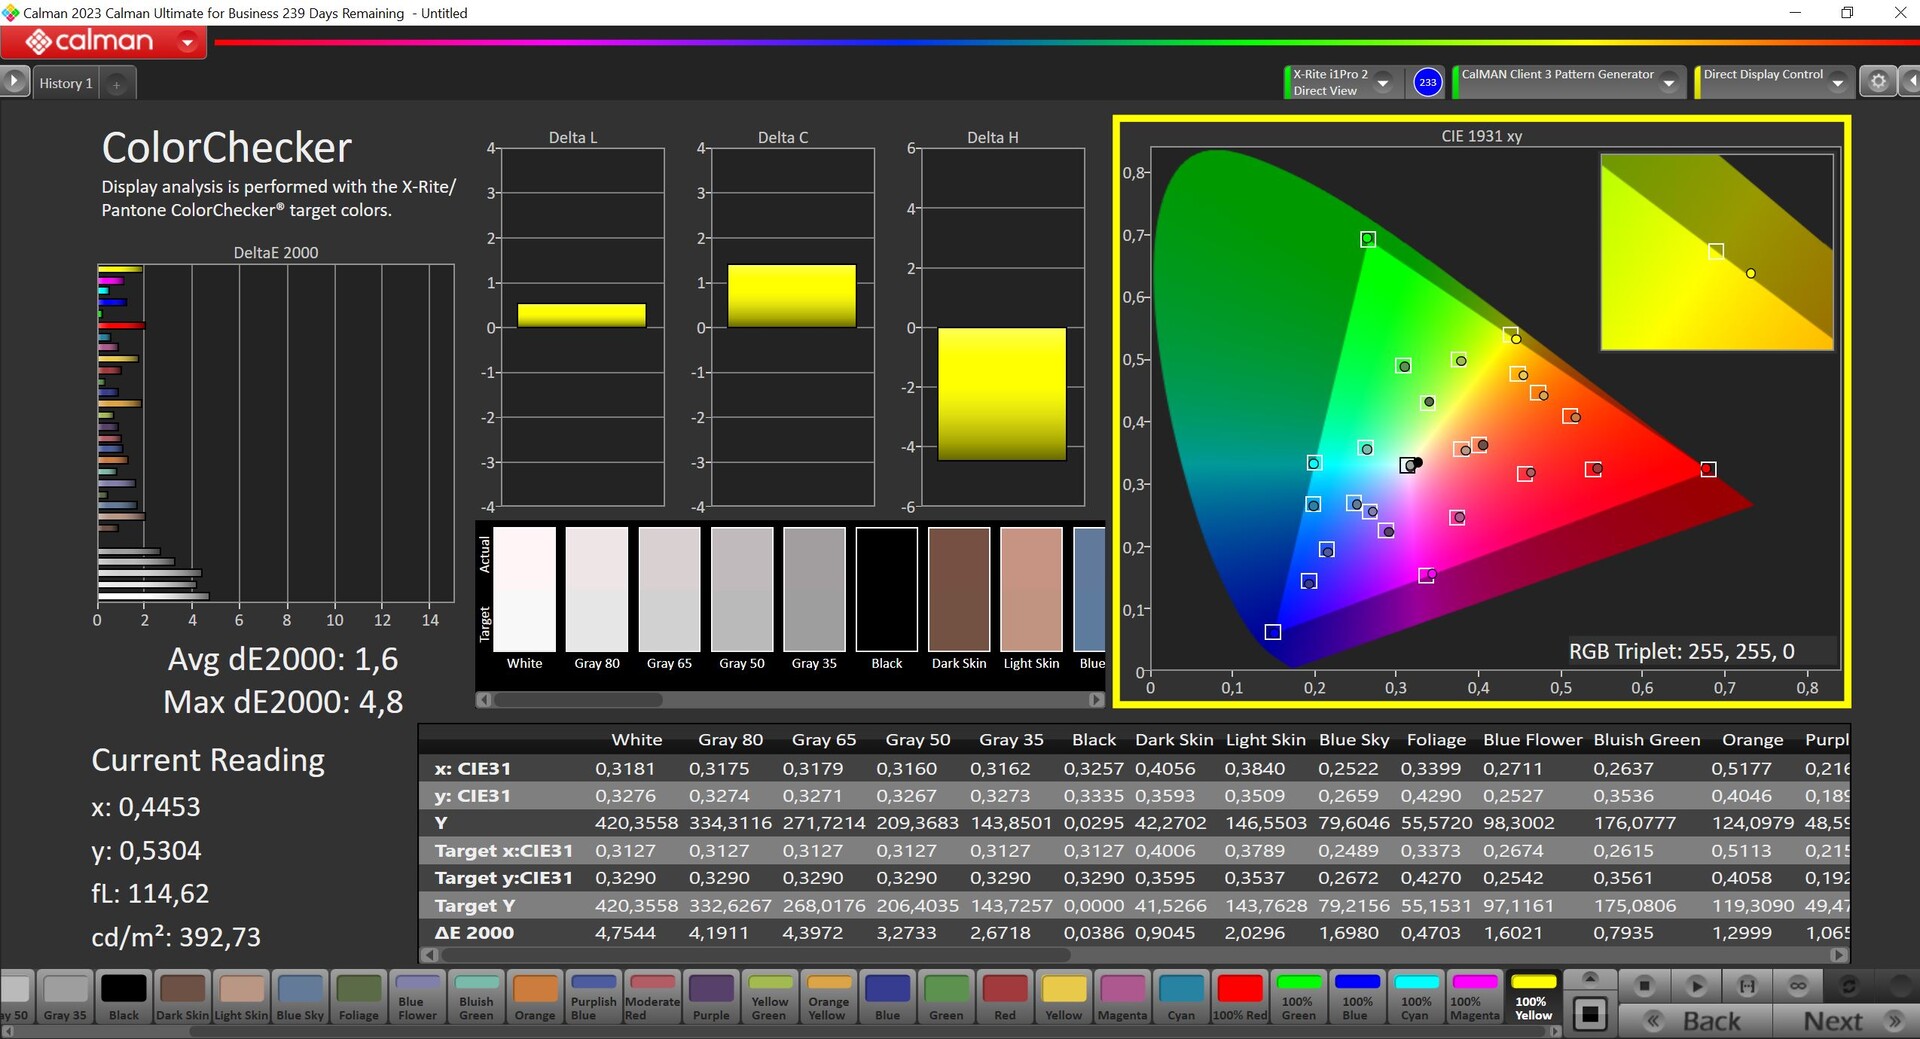
ΔE ColorChecker Calman: 1.6 | ∀{0.5-29.43 Ø4.72}
ΔE Greyscale Calman: 2.7 | ∀{0.09-98 Ø4.97}
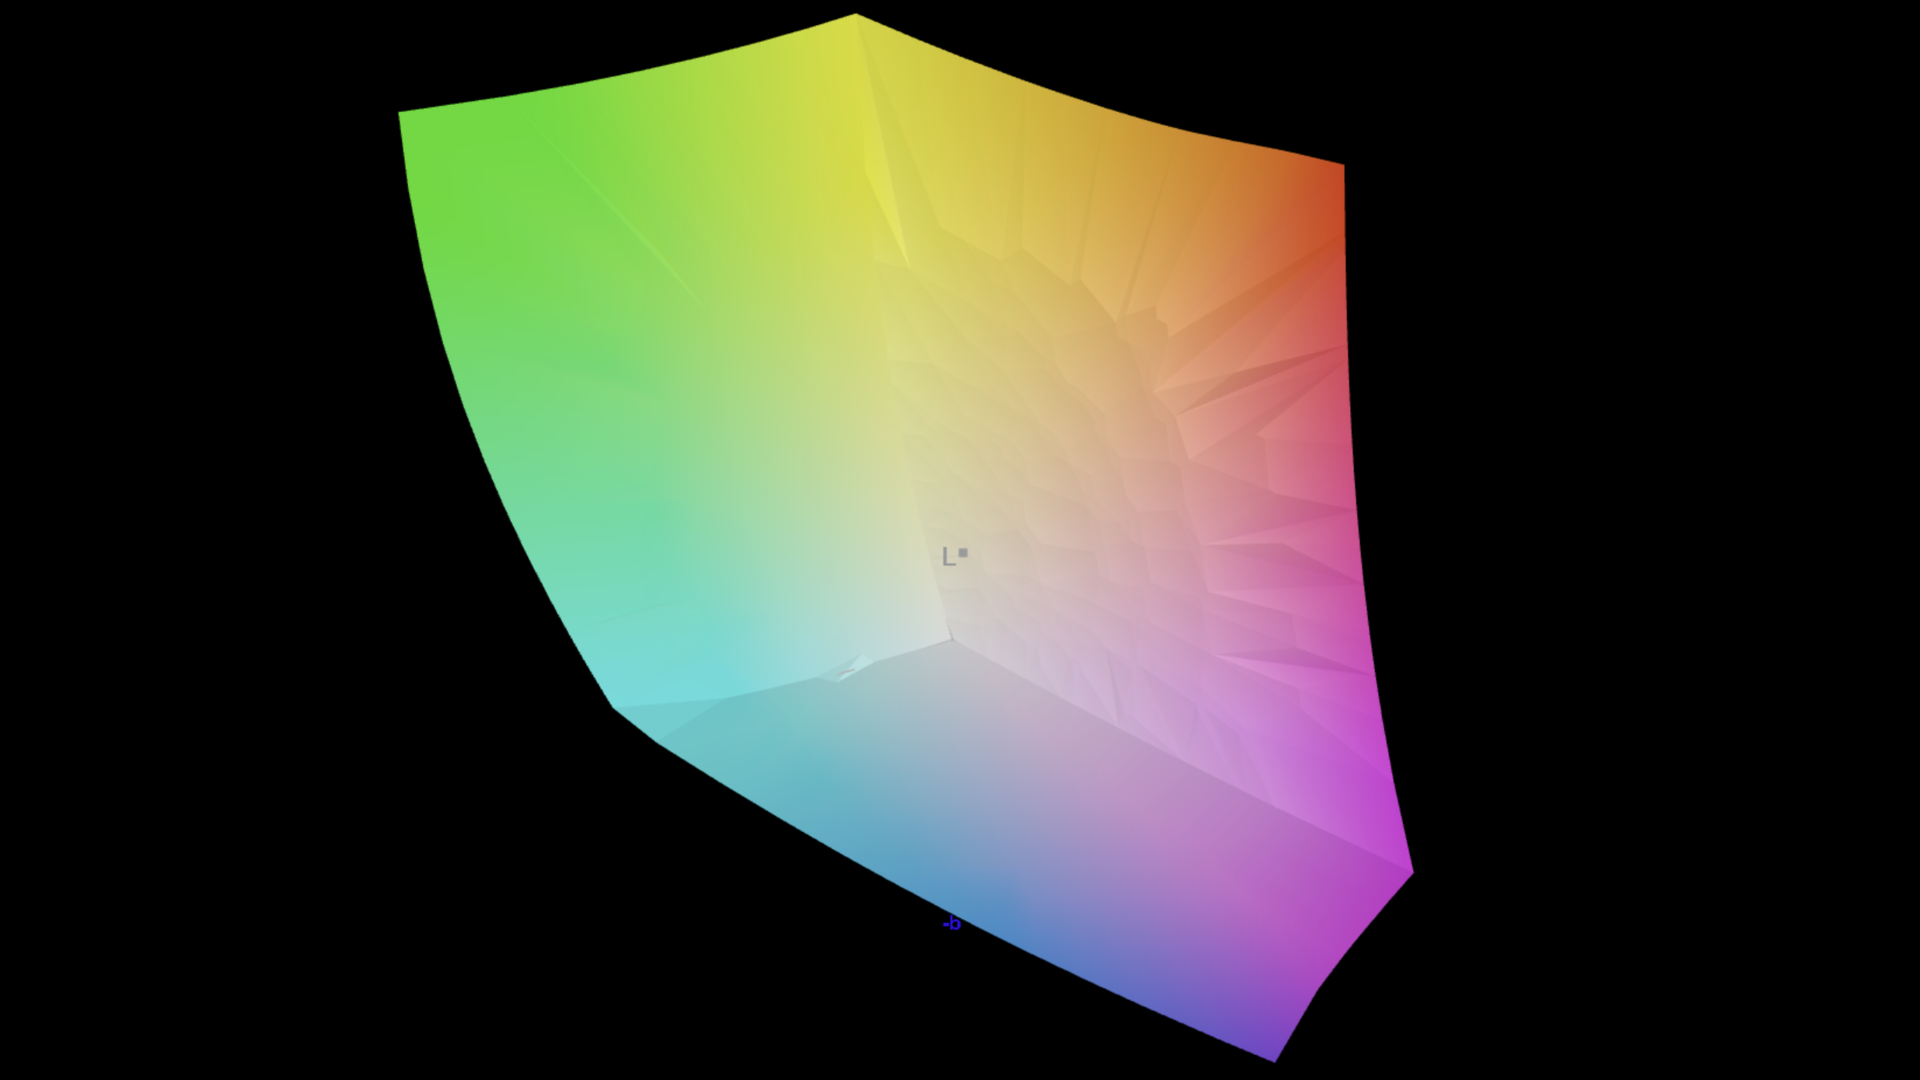
96.9% AdobeRGB 1998 (Argyll 3D)
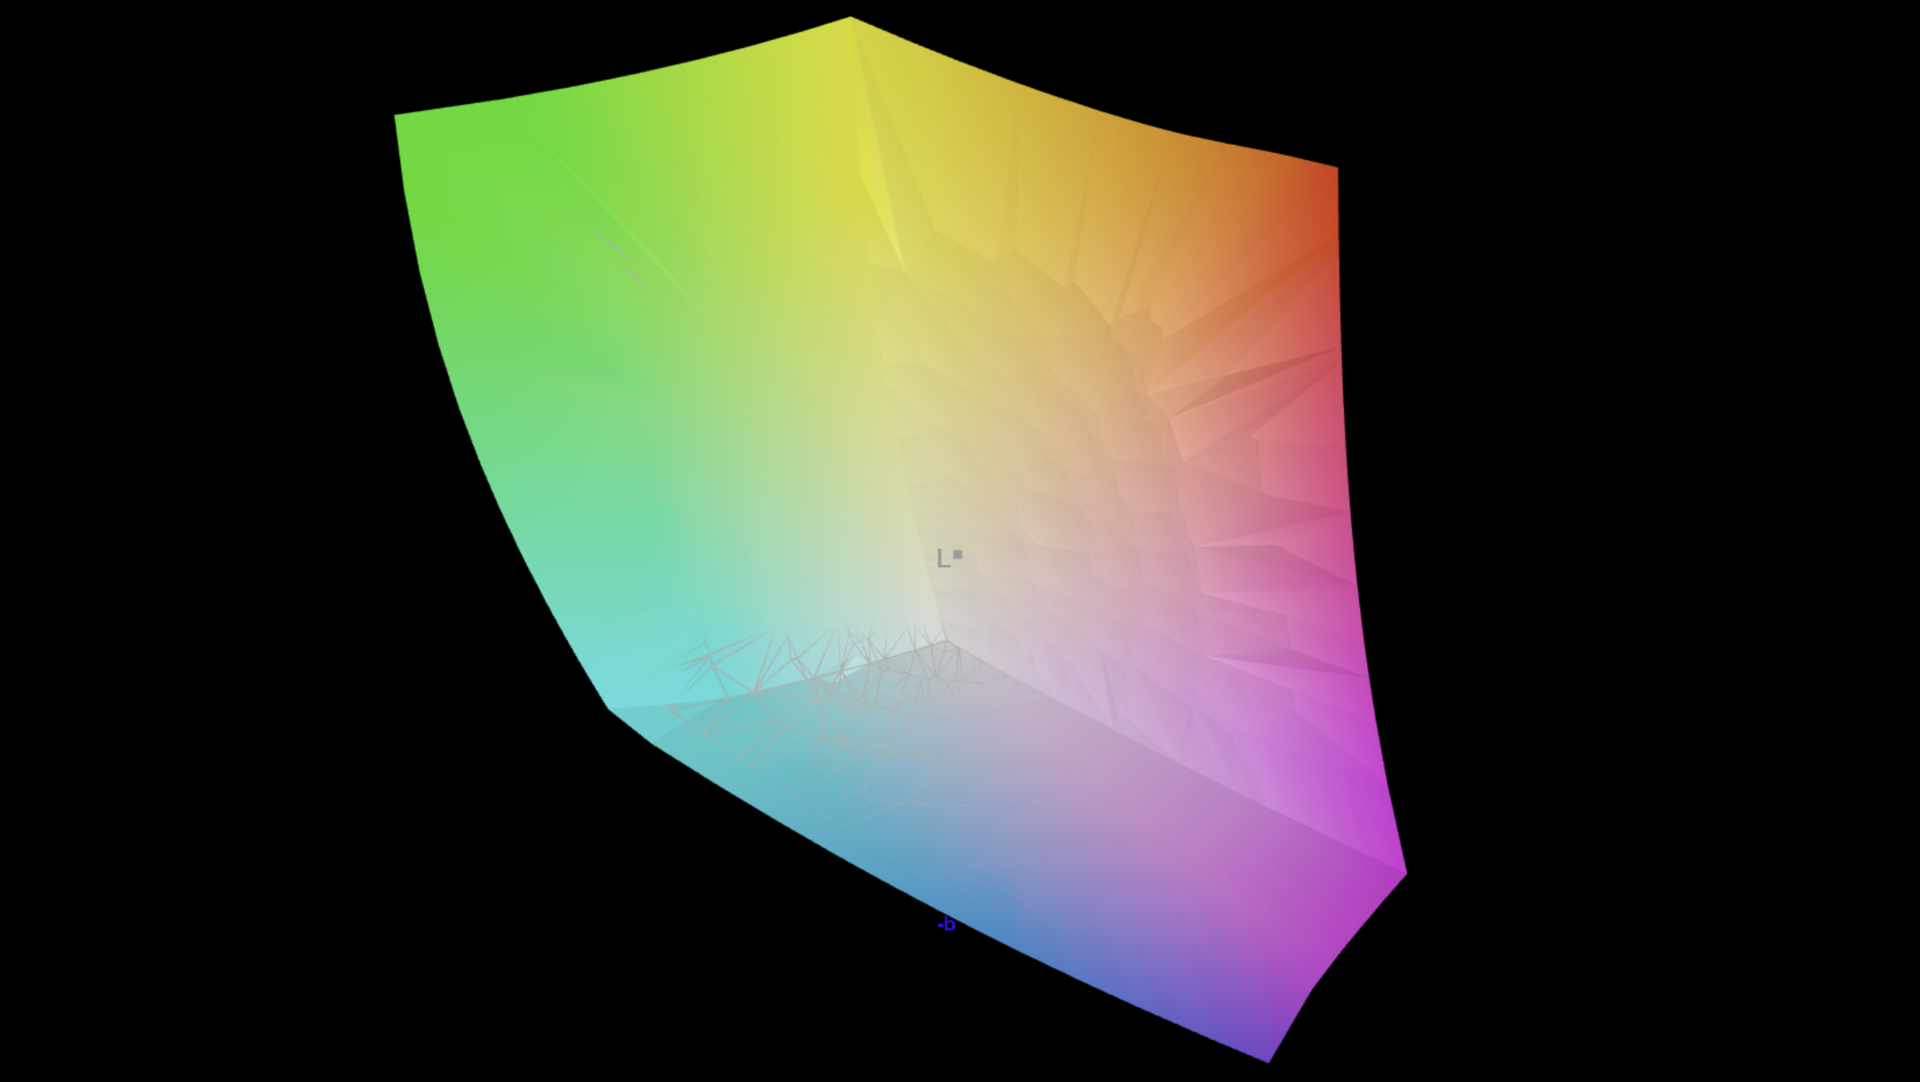
100% sRGB (Argyll 3D)
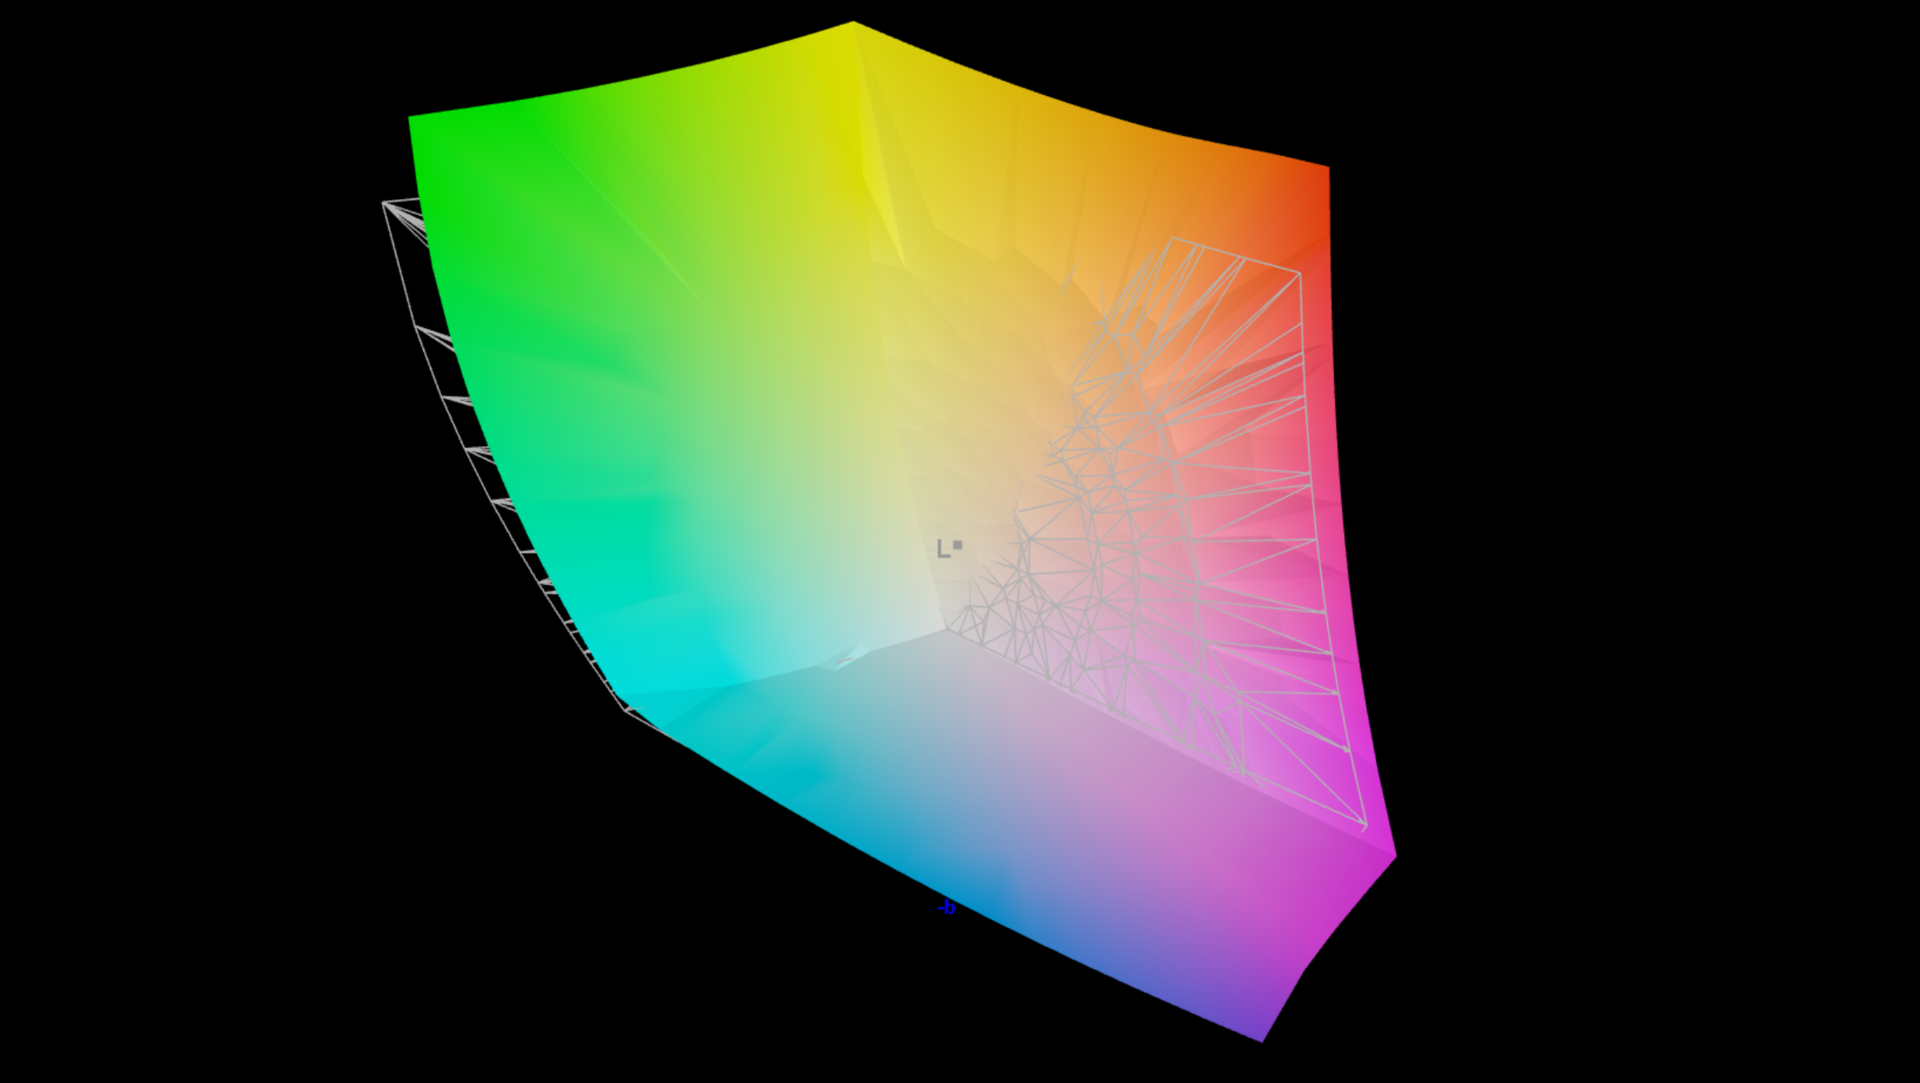
99.9% Display P3 (Argyll 3D)
Gamma: 2.16
CCT: 6331 K
| Asus ROG Zephyrus G16 2024 GU605M ATNA60DL01-0, OLED, 2560x1600, 16" | Lenovo Yoga Pro 9 16-IRP G8 LEN160-3.2K, Mini-LED, 3200x2000, 16" | Razer Blade 16 Early 2023 CSOT T3 MNG007DA4-1, IPS, 2560x1600, 16" | Gigabyte AERO 16 OLED BSF Samsung SDC4191 (ATNA60YV09-0, OLED, 3840x2400, 16" | Schenker VISION 16 Pro (M23) NE160QDM-NZ1, IPS, 2560x1600, 16" | MSI Stealth 16 Studio A13VG AUO26A9, IPS, 2560x1600, 16" | Apple MacBook Pro 16 2023 M3 Max Mini-LED, 3456x2234, 16" | |
|---|---|---|---|---|---|---|---|
| Display | -2% | -3% | -0% | -20% | -5% | -1% | |
| Display P3 Coverage (%) | 99.9 | 97 -3% | 98.5 -1% | 99.9 0% | 68.8 -31% | 96.4 -4% | 99.2 -1% |
| sRGB Coverage (%) | 100 | 99.8 0% | 100 0% | 100 0% | 98.8 -1% | 99.7 0% | |
| AdobeRGB 1998 Coverage (%) | 96.9 | 95.1 -2% | 89.7 -7% | 96.4 -1% | 70 -28% | 84.8 -12% | |
| Response Times | -4922% | -3800% | -751% | -4634% | -2020% | -23825% | |
| Response Time Grey 50% / Grey 80% * (ms) | 0.22 ? | 14 ? -6264% | 6.6 ? -2900% | 2 ? -809% | 13.7 ? -6127% | 4.4 ? -1900% | 66.9 ? -30309% |
| Response Time Black / White * (ms) | 0.25 ? | 9.2 ? -3580% | 12 ? -4700% | 1.98 ? -692% | 8.1 ? -3140% | 5.6 ? -2140% | 43.6 ? -17340% |
| PWM Frequency (Hz) | 960 ? | 5800 ? | 60 | 14877 | |||
| Screen | 16% | -55% | -19% | -84% | -69% | 19% | |
| Brightness middle (cd/m²) | 416 | 539 30% | 456.8 10% | 389.97 -6% | 384 -8% | 424 2% | 630 51% |
| Brightness (cd/m²) | 418 | 546 31% | 437 5% | 395 -6% | 371 -11% | 411 -2% | 604 44% |
| Brightness Distribution (%) | 96 | 96 0% | 83 -14% | 97 1% | 88 -8% | 88 -8% | 94 -2% |
| Black Level * (cd/m²) | 0.18 | 0.35 | 0.03 | 0.3 | 0.37 | ||
| Colorchecker dE 2000 * | 1.6 | 1.4 13% | 3.7 -131% | 2 -25% | 3.4 -113% | 3.04 -90% | 1.2 25% |
| Colorchecker dE 2000 max. * | 2.1 | 2.1 -0% | 6.42 -206% | 4.1 -95% | 9.2 -338% | 7.5 -257% | 2.8 -33% |
| Greyscale dE 2000 * | 2.7 | 2.2 19% | 2.6 4% | 2.23 17% | 3.4 -26% | 4.34 -61% | 1.9 30% |
| Gamma | 2.16 102% | 2.19 100% | 2.3 96% | 2.41 91% | 2.16 102% | 2.32 95% | 2.29 96% |
| CCT | 6331 103% | 6479 100% | 6108 106% | 6323 103% | 7462 87% | 6952 93% | 6812 95% |
| Contrast (:1) | 2994 | 1305 | 12999 | 1280 | 1146 | ||
| Colorchecker dE 2000 calibrated * | 0.66 | 1.68 | 1.3 | 3.04 | |||
| Total Average (Program / Settings) | -1636% /
-887% | -1286% /
-722% | -257% /
-147% | -1579% /
-894% | -698% /
-407% | -7936% /
-5282% |
* ... smaller is better
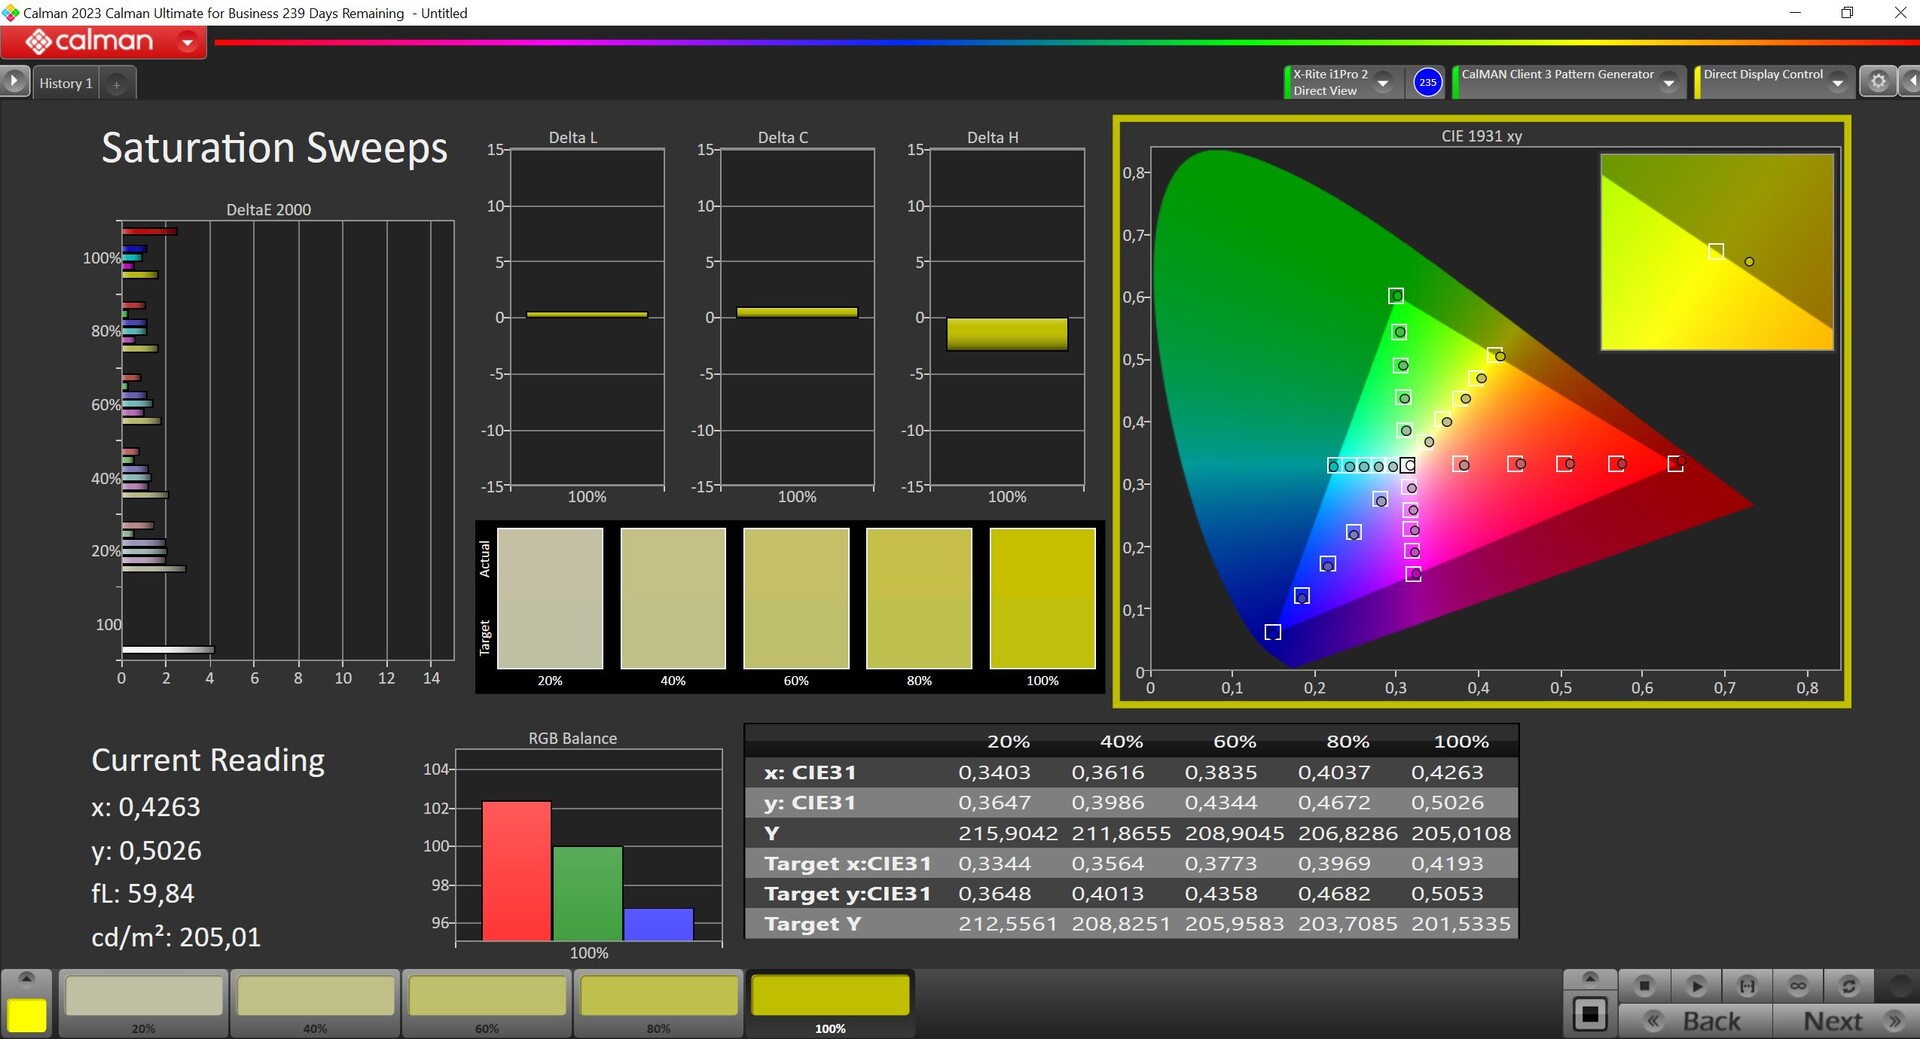
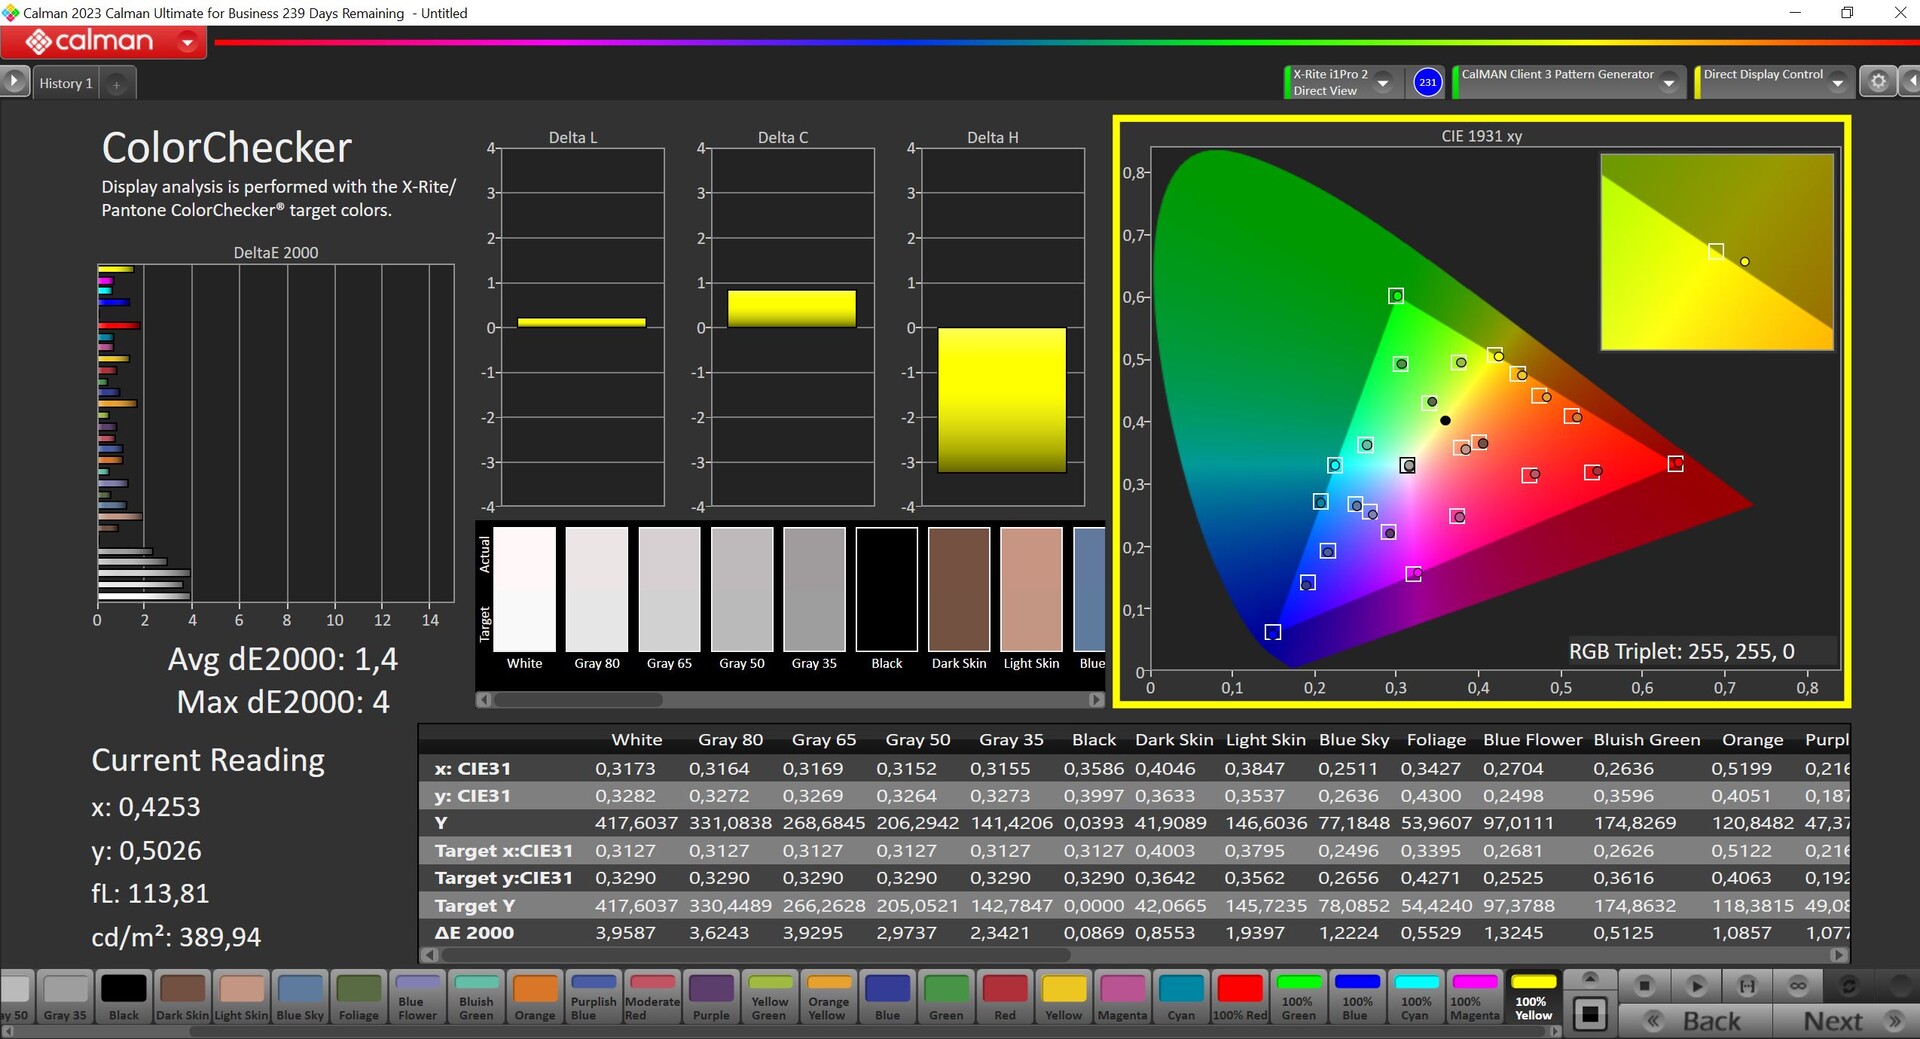
Armoury-Crate 软件提供了不同的色彩配置文件供您选择,我们使用专业的 CalMAN 软件(X-Rite i1 Pro2)对其进行了分析。预选的Native配置文件非常适合日常使用,但色彩有点过于饱和。为了确保最佳色彩准确度,您应该选择显示 P3 配置文件。灰阶可能仍会出现一些偏差(但不会有色差),不过,与 P3 参考相比,它的色彩准确度已经非常出色,所有颜色的偏差都低于重要的 3 值。
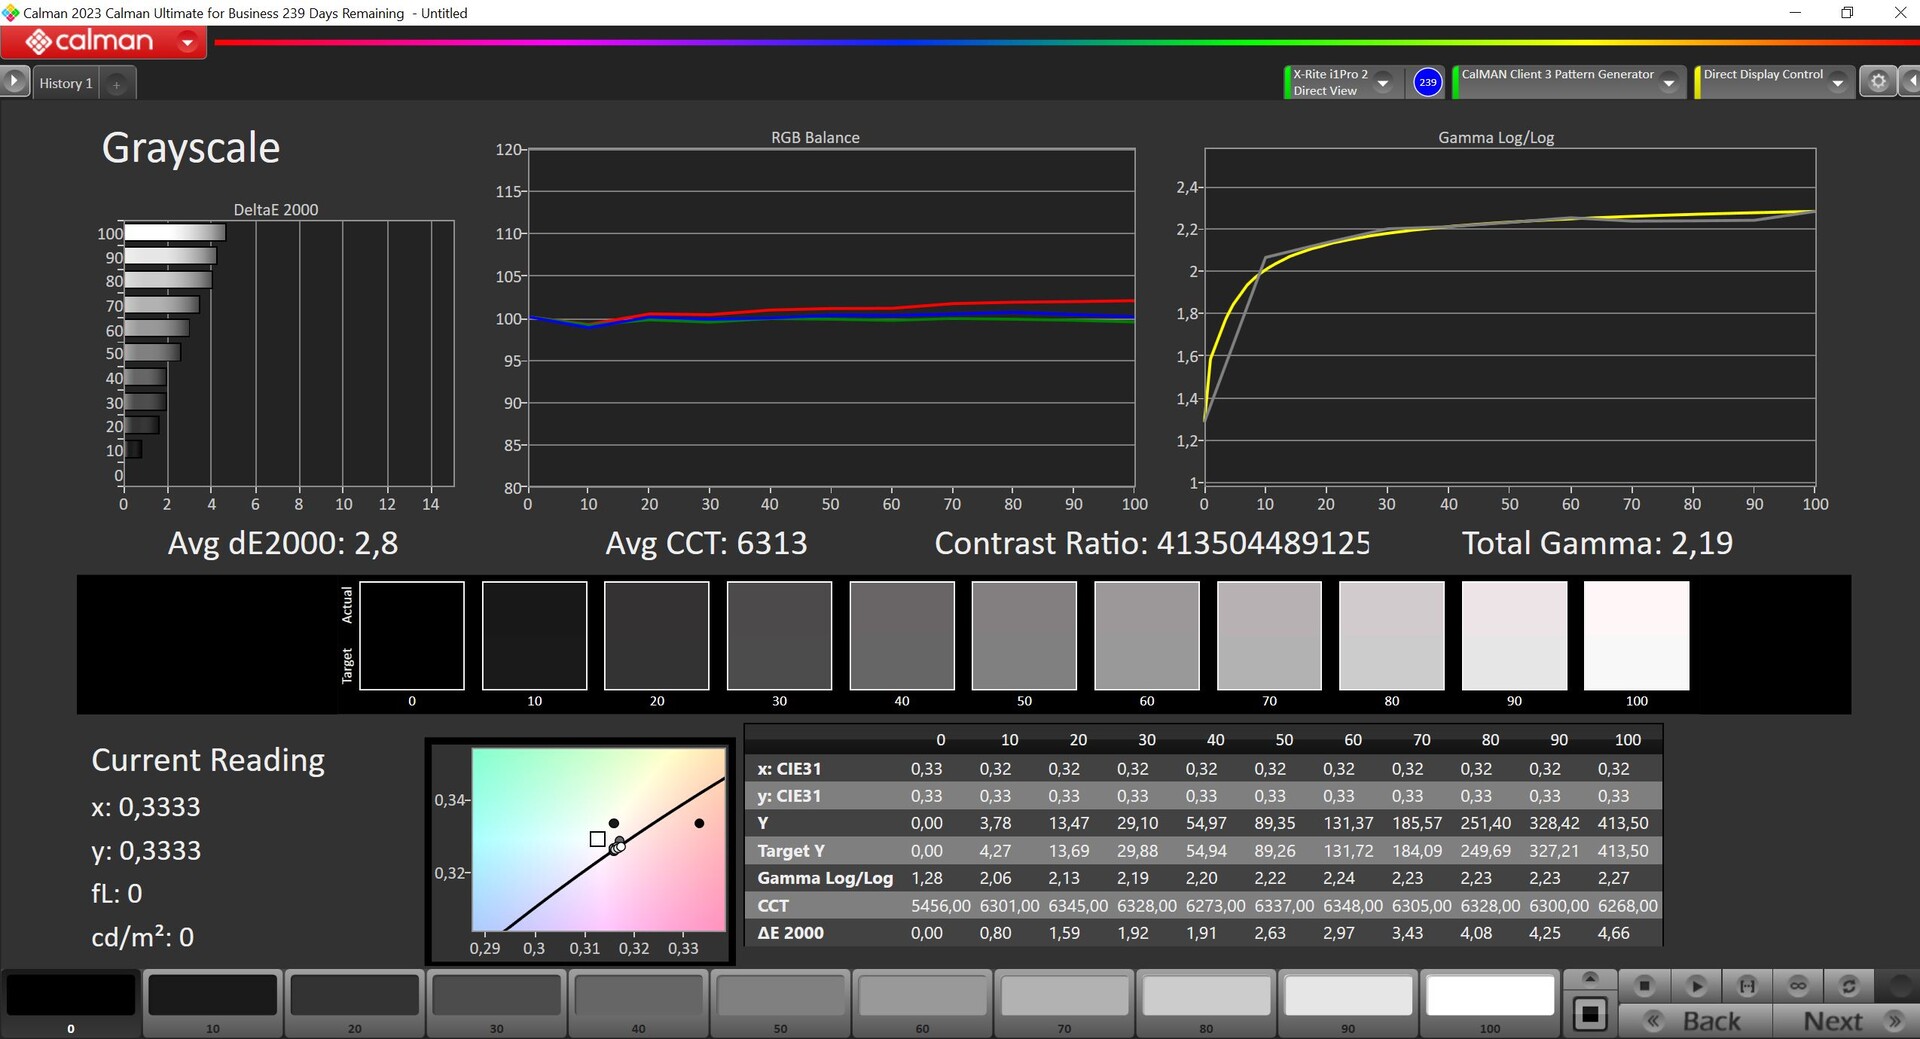

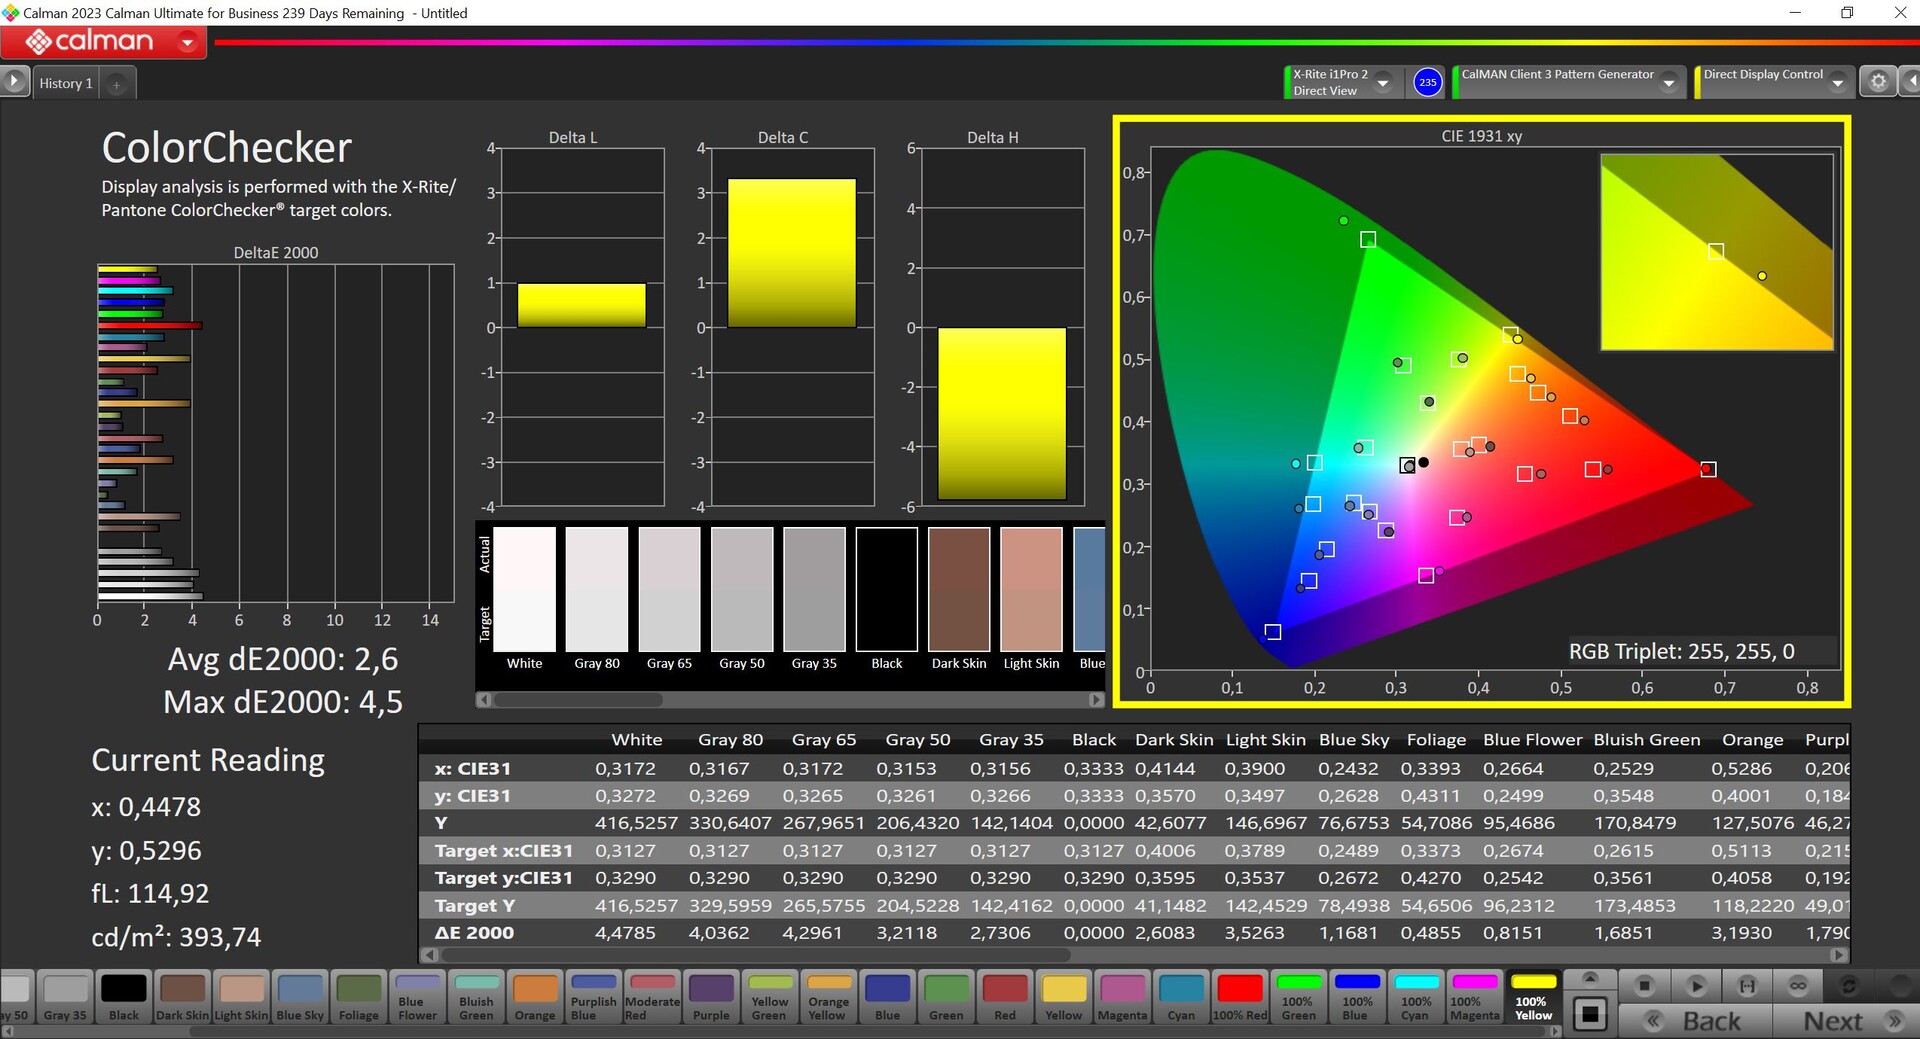
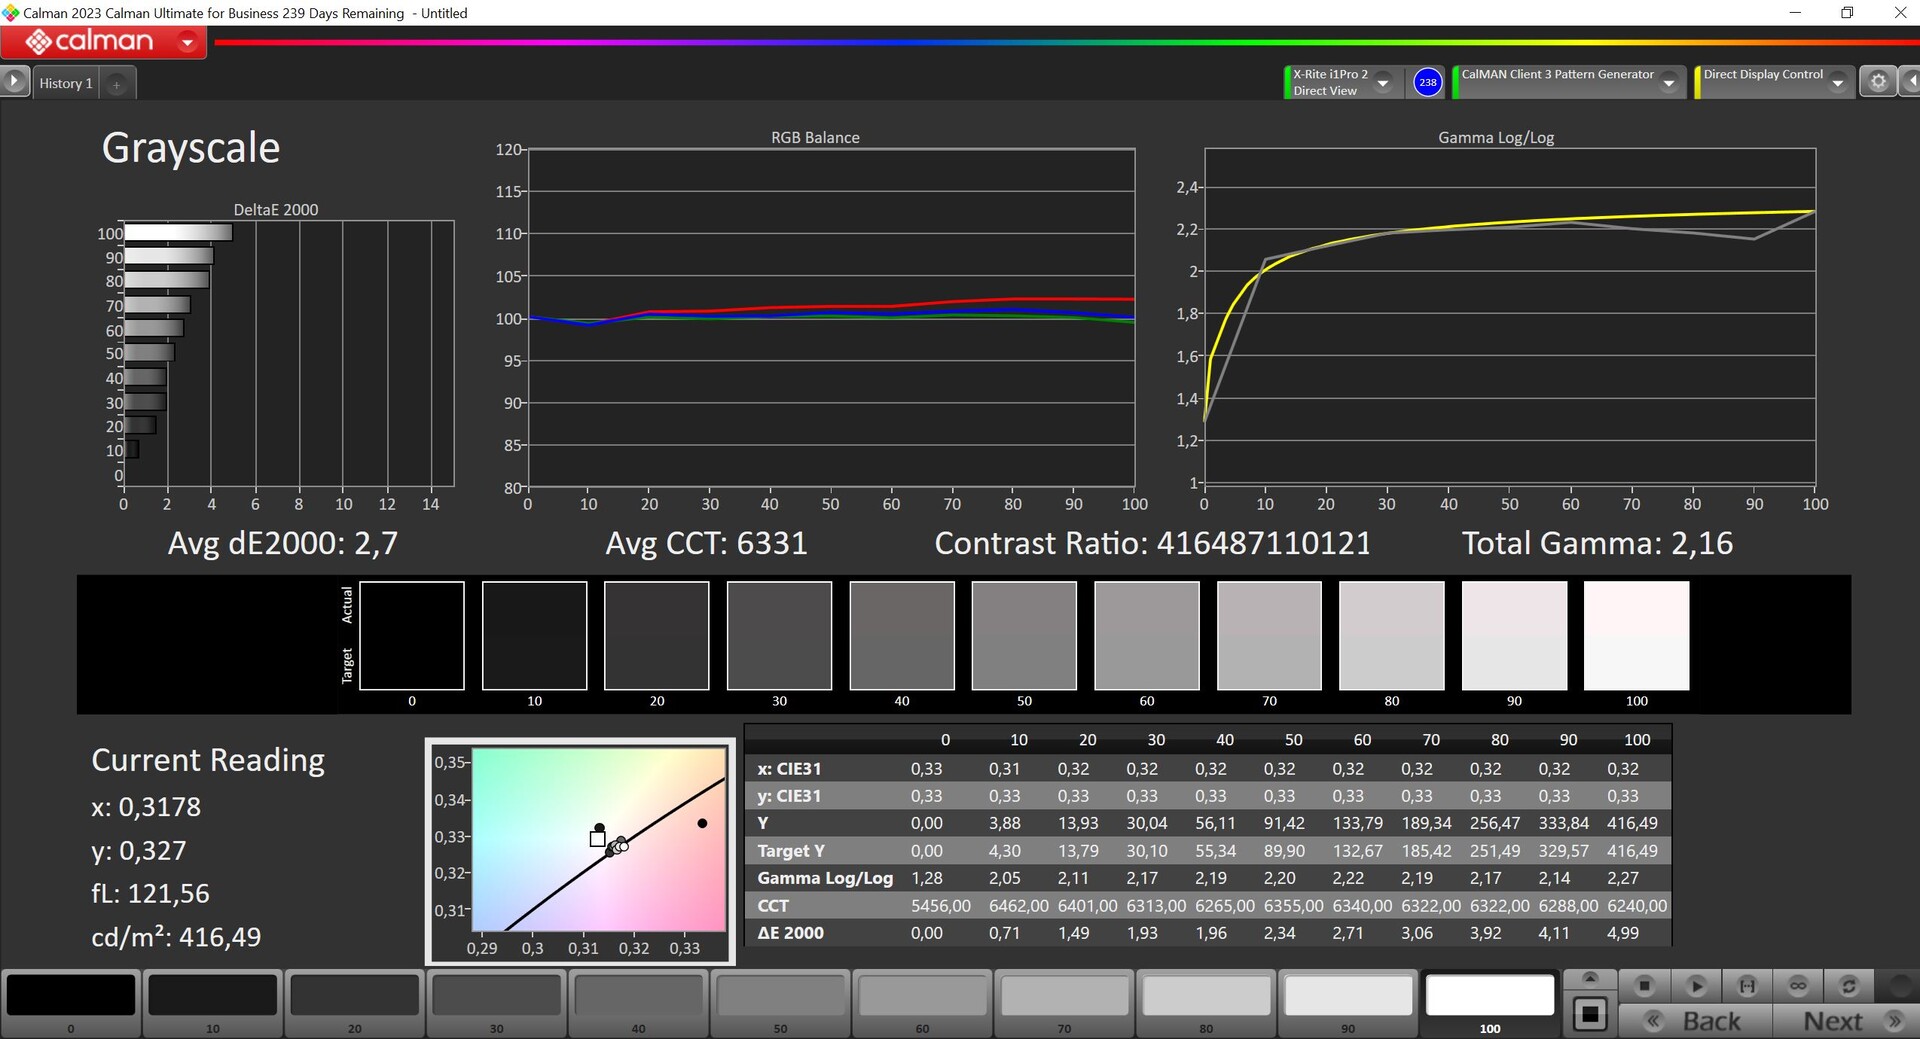
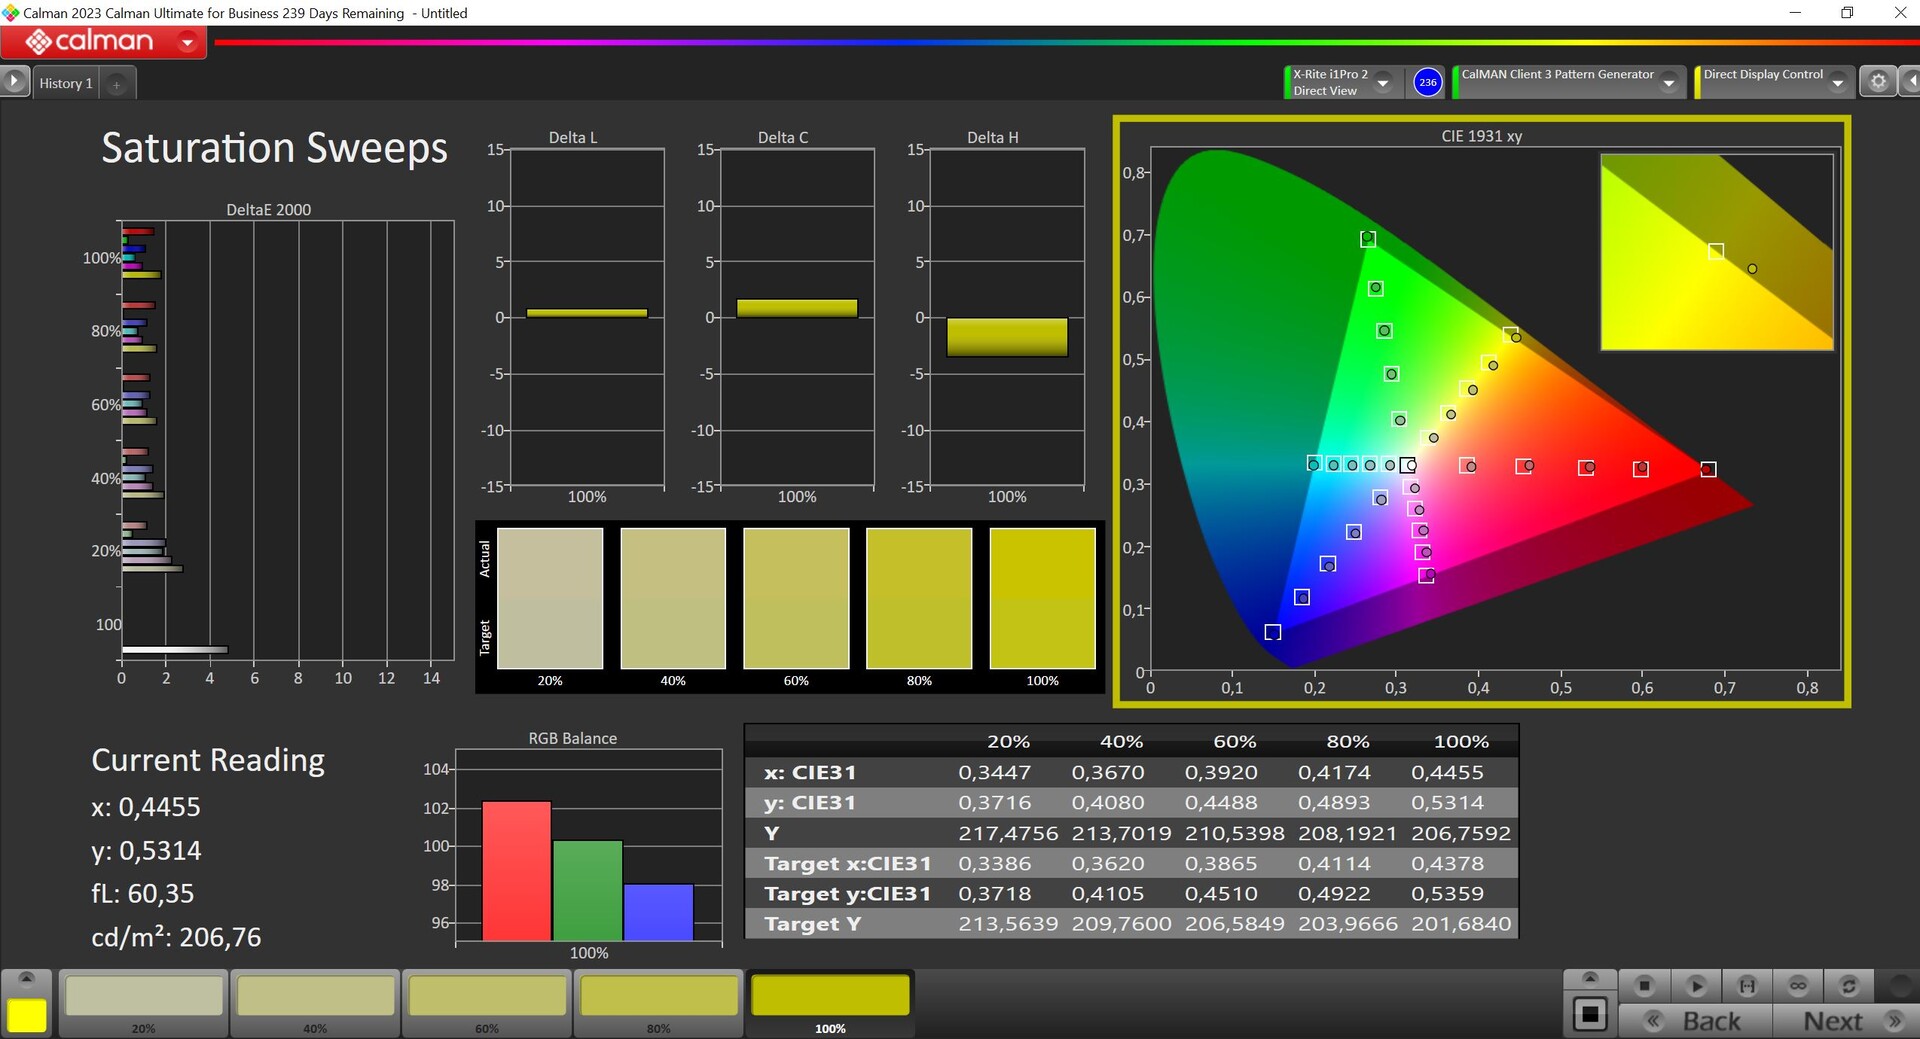
此外,我们还自行校准了显示屏,结果喜忧参半。虽然我们能略微改善灰度偏差,但这导致了更大的色彩偏差,总的来说,并没有真正改善情况。这就是我们不提供相应配置文件供下载的原因。该显示屏覆盖了整个 P3 色彩空间,但也具有非常精确的 sRGB 模式,以备您在较小的色彩空间中编辑照片或视频。

Display Response Times
| ↔ Response Time Black to White | ||
|---|---|---|
| 0.25 ms ... rise ↗ and fall ↘ combined | ↗ 0.13 ms rise | 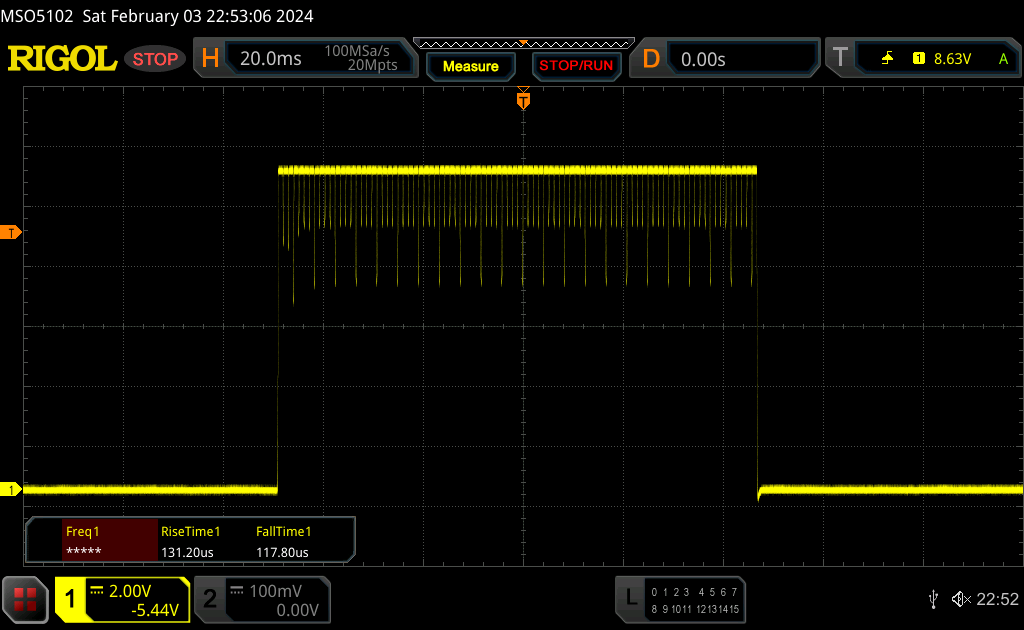 |
| ↘ 0.12 ms fall | ||
| The screen shows very fast response rates in our tests and should be very well suited for fast-paced gaming. In comparison, all tested devices range from 0.1 (minimum) to 240 (maximum) ms. » 0 % of all devices are better. This means that the measured response time is better than the average of all tested devices (19.8 ms). | ||
| ↔ Response Time 50% Grey to 80% Grey | ||
| 0.22 ms ... rise ↗ and fall ↘ combined | ↗ 0.11 ms rise | 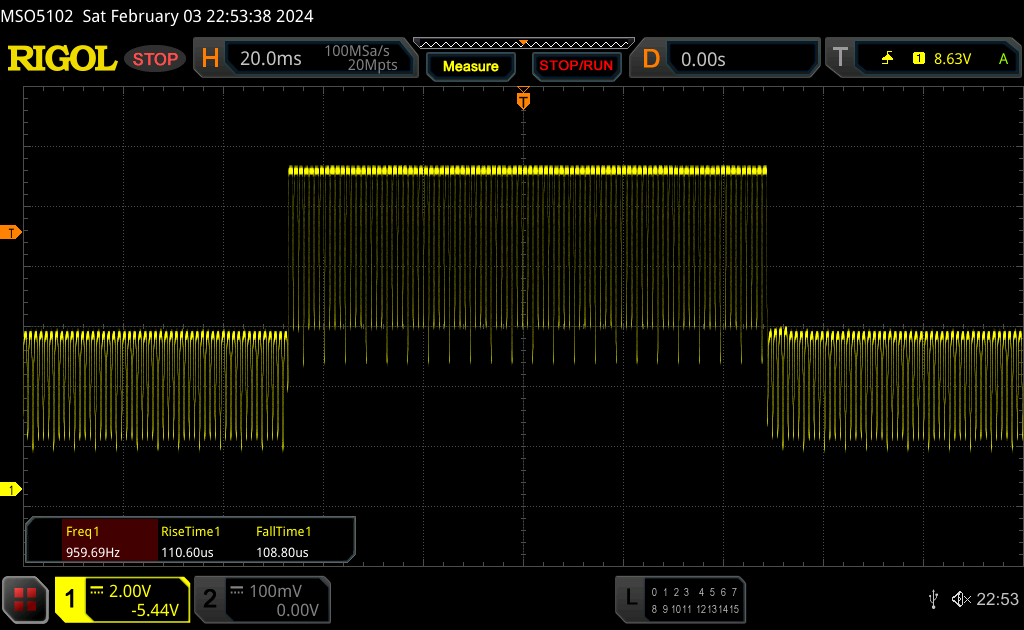 |
| ↘ 0.11 ms fall | ||
| The screen shows very fast response rates in our tests and should be very well suited for fast-paced gaming. In comparison, all tested devices range from 0.165 (minimum) to 636 (maximum) ms. » 0 % of all devices are better. This means that the measured response time is better than the average of all tested devices (31 ms). | ||
Screen Flickering / PWM (Pulse-Width Modulation)
| Screen flickering / PWM detected | 960 Hz | ≤ 60 % brightness setting | 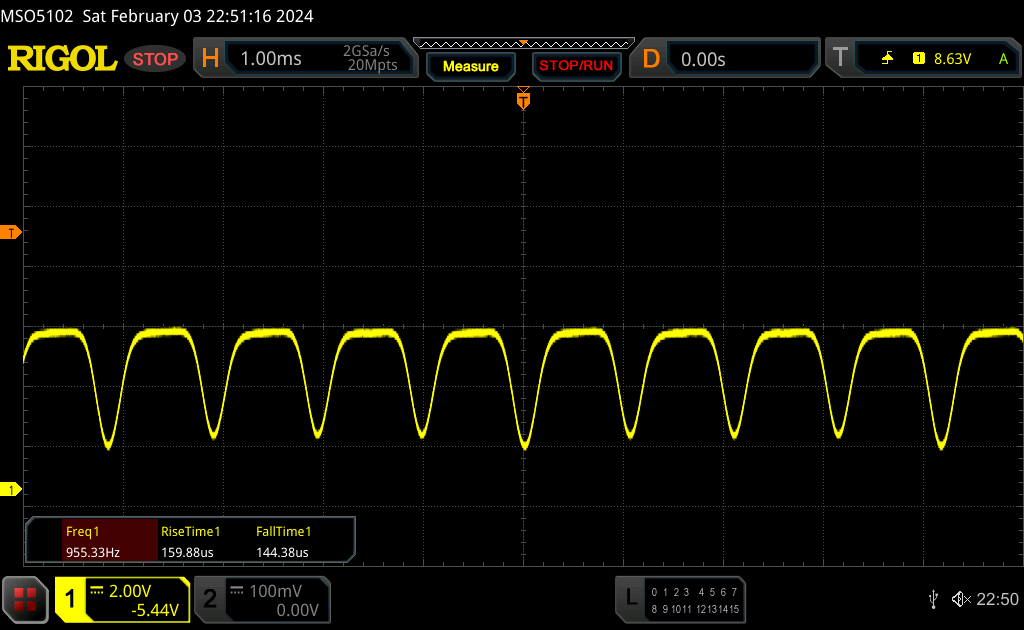 |
The display backlight flickers at 960 Hz (worst case, e.g., utilizing PWM) Flickering detected at a brightness setting of 60 % and below. There should be no flickering or PWM above this brightness setting. The frequency of 960 Hz is quite high, so most users sensitive to PWM should not notice any flickering. In comparison: 52 % of all tested devices do not use PWM to dim the display. If PWM was detected, an average of 7772 (minimum: 5 - maximum: 343500) Hz was measured. | |||
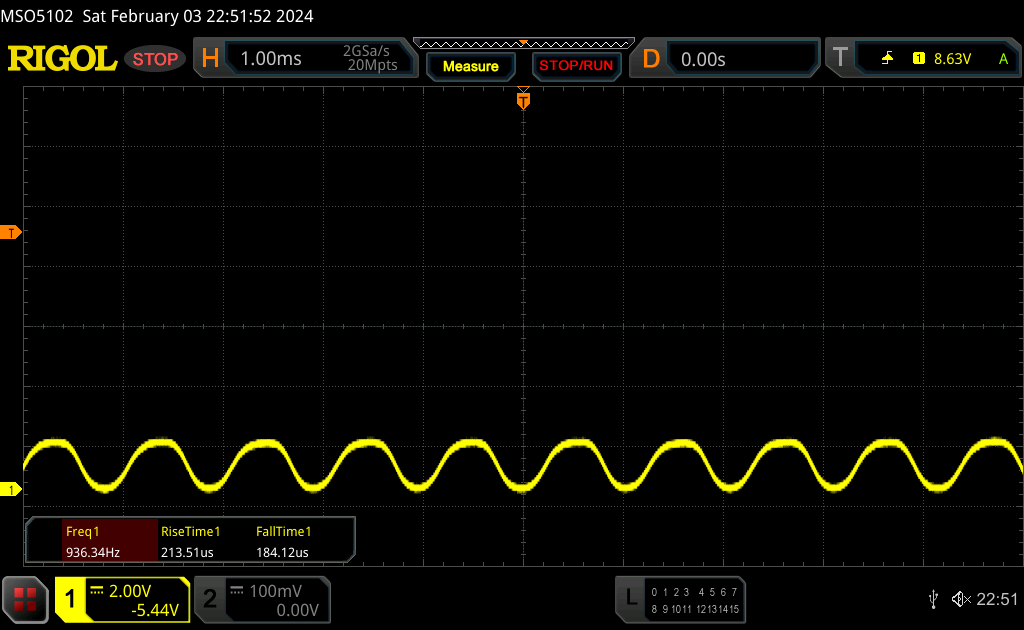
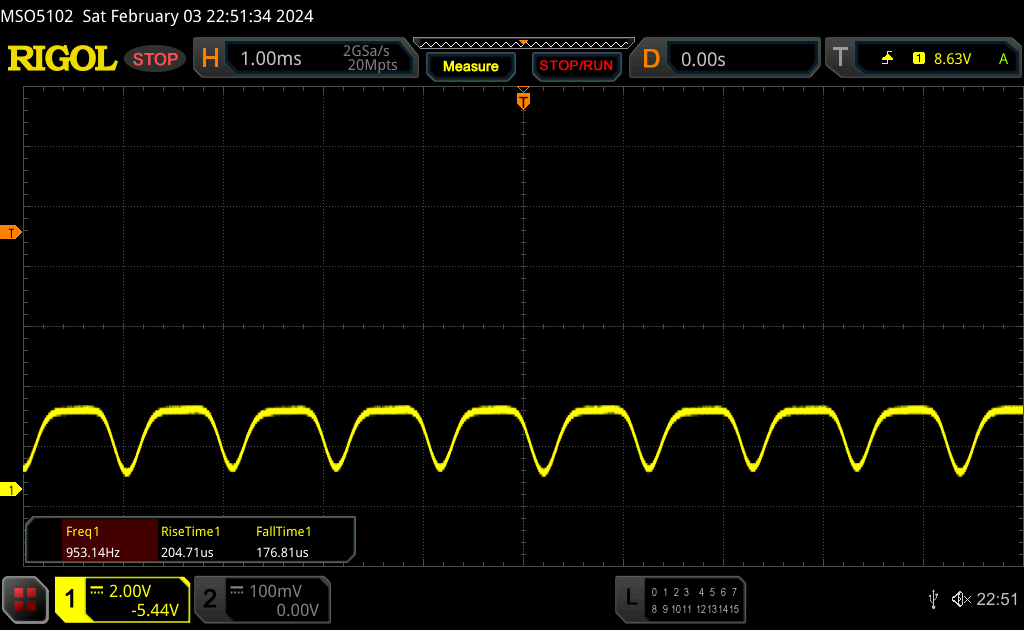
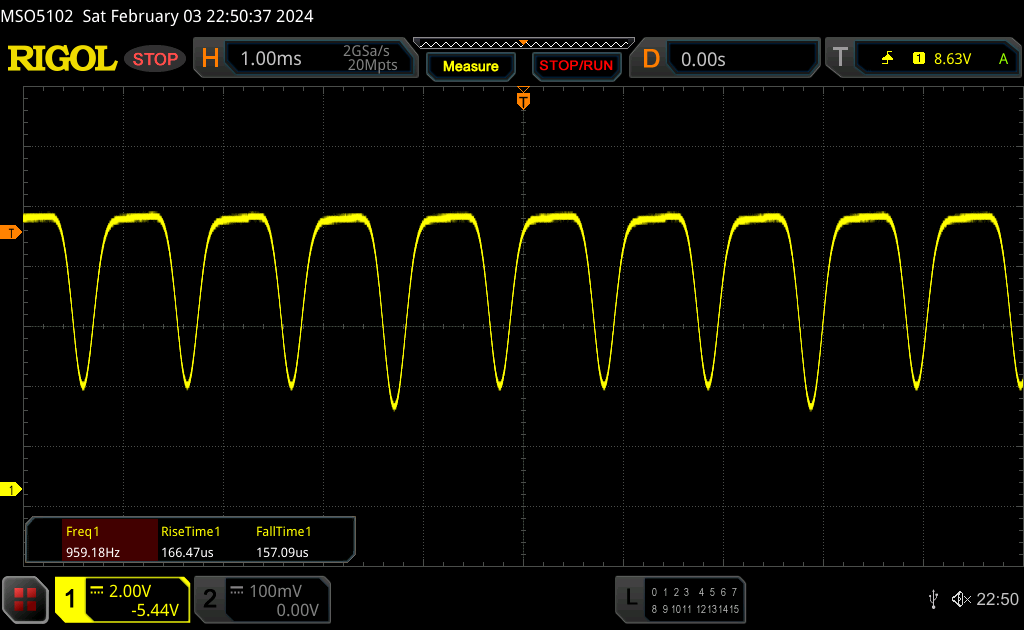
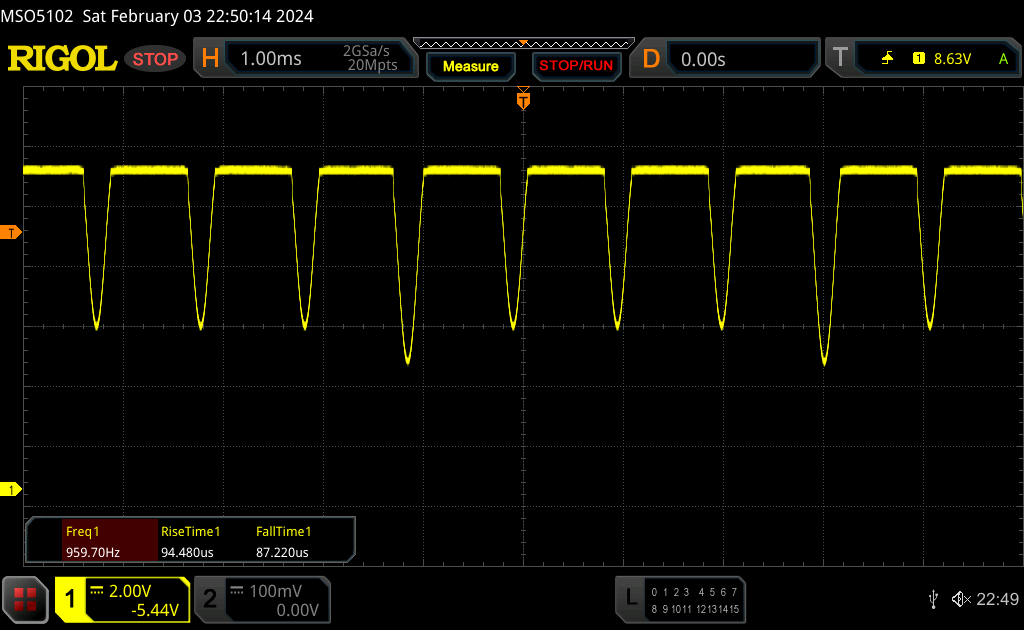
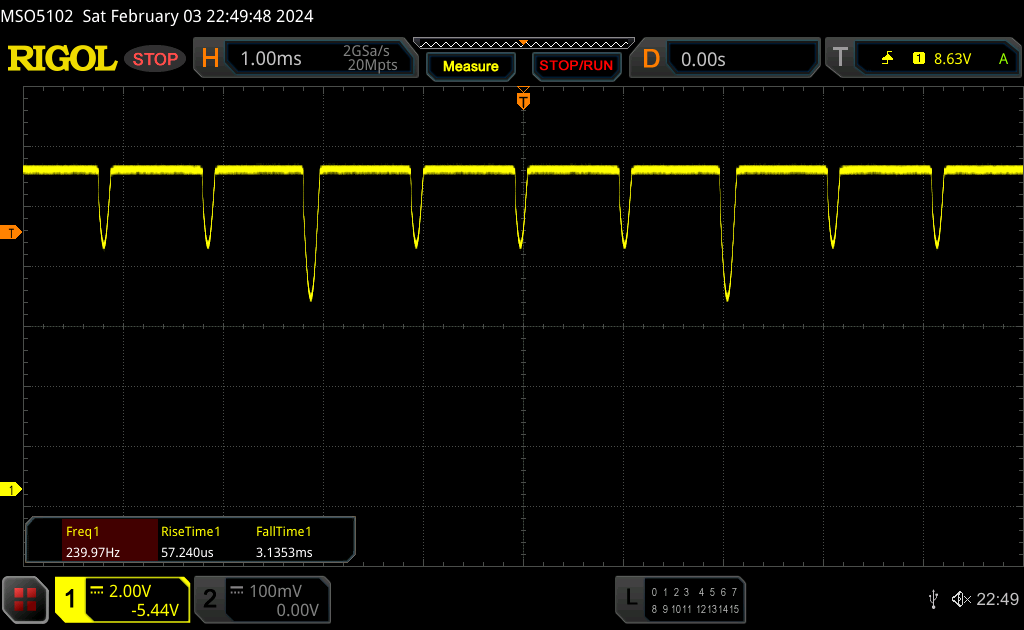
一般来说,新型 OLED 面板使用频率为 960 Hz 的 PWM 技术,但当亮度超过 60% 时,则使用危害较小的直流调光技术(频率为 240 Hz)。一旦亮度低于这个水平,就会弹出警告,说明直流调光不再可用。与华硕其他 OLED 笔记本电脑的情况一样,你可以通过软件调暗显示屏,从而继续使用直流调光。我们只是希望将这种控制与常规的亮度控制结合起来,以最大限度地提高舒适度。


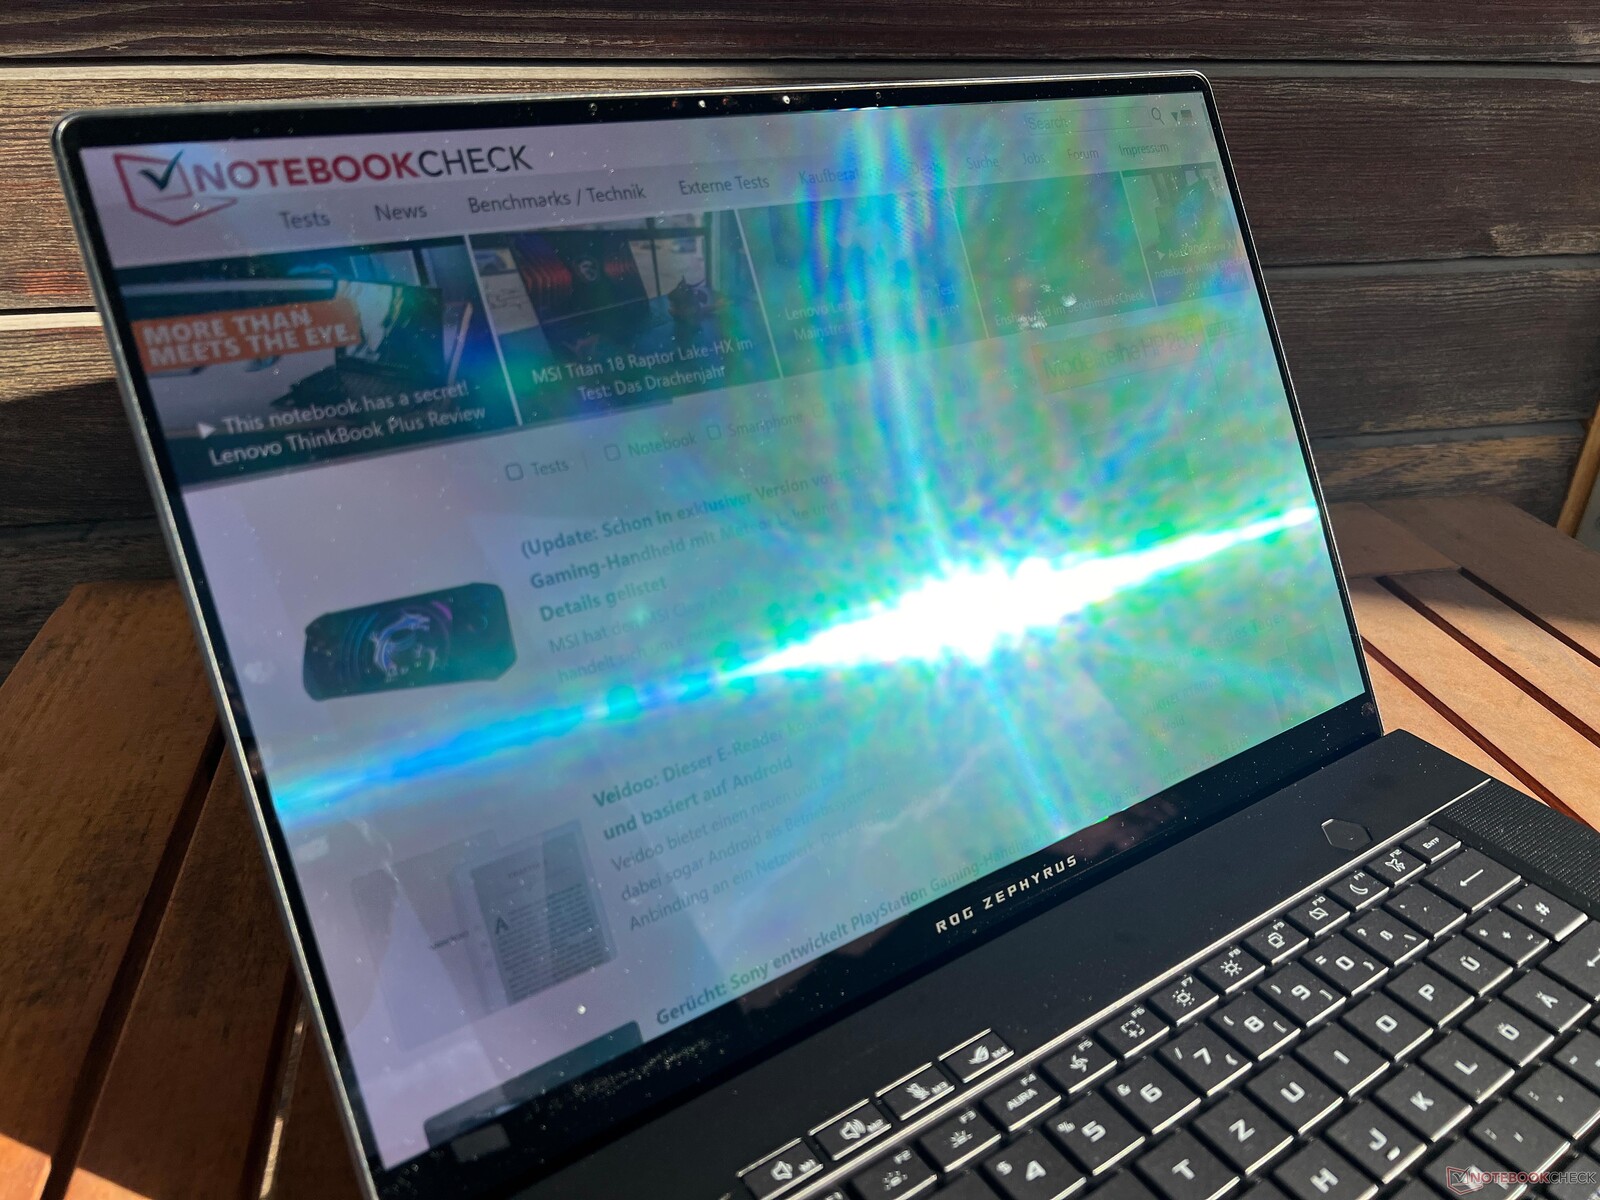
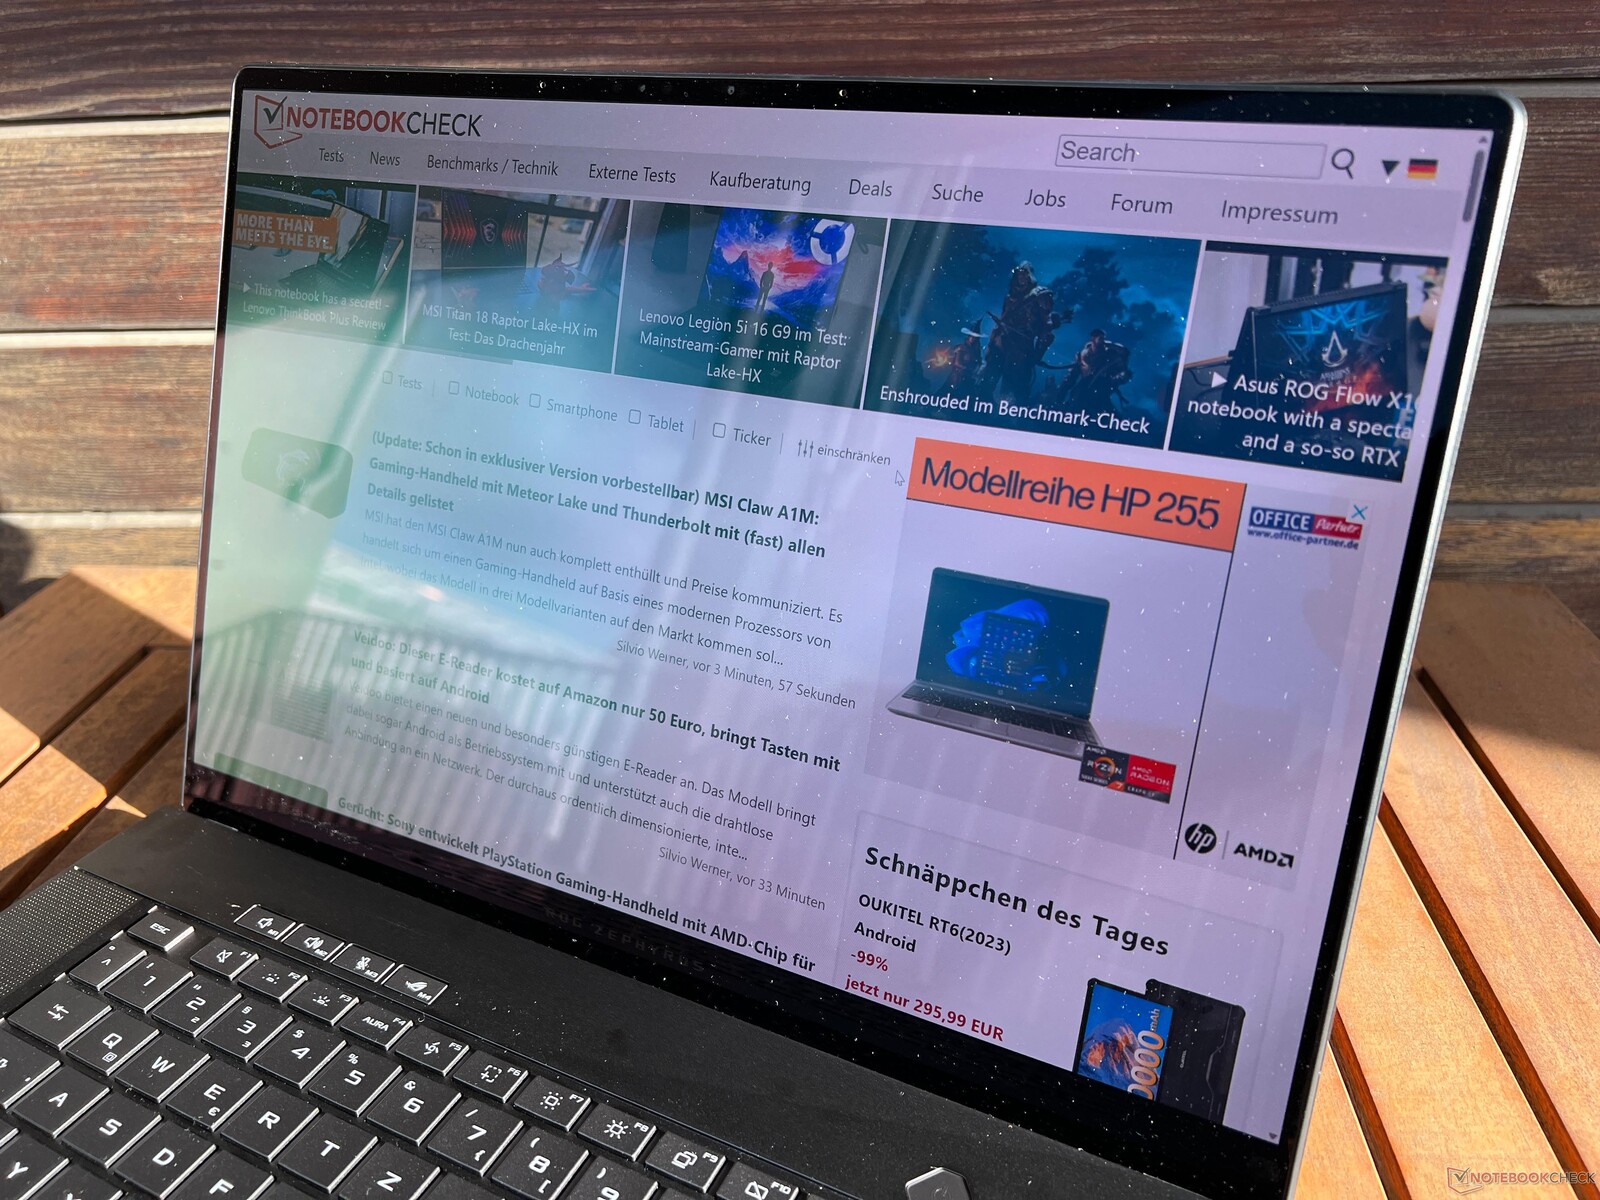
Zephyrus G16 的户外表现非常出色,即使在阳光明媚的日子里,只要避免阳光直射,也能使用得很好。它的视角稳定性很好,只有在偏离中心较大的情况下才会出现轻微的蓝色光泽,但这是 OLED 面板的典型现象。

性能 - 现在的 Zephyrus 带有流星湖
测试条件
在 Armoury-Crate 软件中,华硕提供了多种能耗配置文件以及手动模式,让您可以单独设置 GPU/CPU 性能。我们在下表中列出了这些能耗曲线的数值。但需要注意的是,这些数值仅适用于配备传统热管和三个风扇的 4070/4060/4050 笔记本电脑配置。而配备 RTX 4080/4090 笔记本电脑的功能更强大的机型则采用了带有两个风扇的 Vapor-Chamber 冷却系统,因此处理器和 GPU 的功耗更高(在所有配置文件中)。
| 能源概况 | CPU 负载 | CB R23 Multi | GPU 负载 | Time Spy 显卡 | 赛博朋克 2077 QHD Ultra | 风扇最大排放量 |
|---|---|---|---|---|---|---|
| 静音 | 60->45 瓦 | 15,869 分 | 65 瓦 | 9,042 分 | 32.6 fps | 41.5 dB(A) |
| 性能 | 70->50 瓦 | 17,133 分 | 80 瓦 | 10,989 分 | 43.7 帧/秒 | 46.4 分贝(A) |
| 涡轮 | 95->70 瓦 | 18,372 分 | 105 瓦 | 12,312 分 | 48.7 fps | 52.4 dB(A) |
经过多次测试,我们决定使用性能模式进行以下基准测试和测量。虽然您可能无法获得最高性能,但在玩游戏时,风扇仍然是可以忍受的,因为约 48 分贝(A)的噪音是难以忍受的。得益于其出色的扬声器,在选择性能模式时,你甚至可以不戴耳机玩游戏。即便如此,如果您需要尽可能高的性能,只需按下按钮就能轻松切换模式(不过,涡轮增压仅在连接电源时可用)。在执行简单任务时,应选择静音模式,否则几乎总能听到风扇的声音。
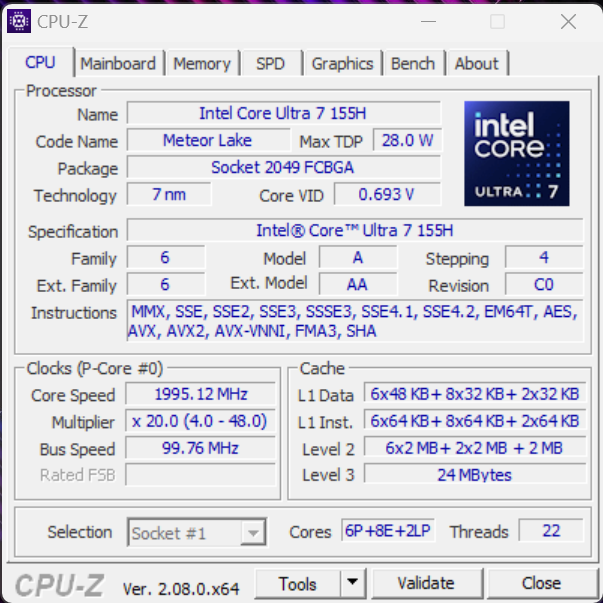
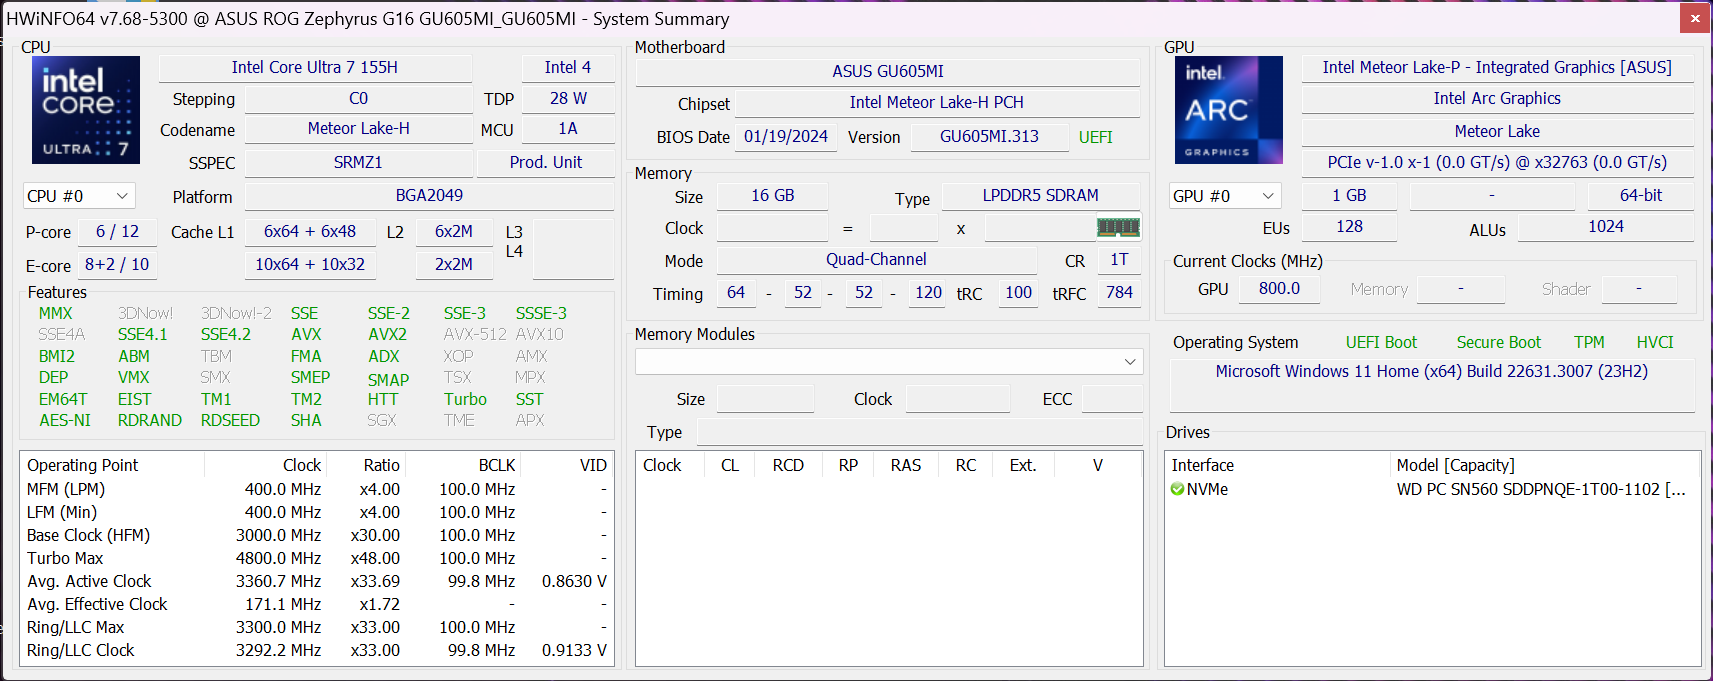
处理器 - Core Ultra 7 155H
我们已经对全新的流星湖一代 酷睿至尊 7 155H的分析文章。在 70/50 瓦的功率限制下,这款处理器的性能表现不错,但与老款 Raptor-Lake 芯片(如 酷睿 i7-13700H选择涡轮增压模式时也是如此。不过,它的单核性能稍弱,我们已经开始期待流星湖处理器与新款 Ryzen-8000 CPU 的较量了。总而言之,它的多核性能总体保持稳定。在电池使用中,CPU 性能保持不变。更多 CPU 基准测试 这里。
Cinebench R15 Multi continuous test
Cinebench R20: CPU (Multi Core) | CPU (Single Core)
Cinebench R15: CPU Multi 64Bit | CPU Single 64Bit
Blender: v2.79 BMW27 CPU
7-Zip 18.03: 7z b 4 | 7z b 4 -mmt1
Geekbench 6.7: Multi-Core | Single-Core
Geekbench 5.5: Multi-Core | Single-Core
HWBOT x265 Benchmark v2.2: 4k Preset
LibreOffice : 20 Documents To PDF
R Benchmark 2.5: Overall mean
| Cinebench R20 / CPU (Multi Core) | |
| Average of class Gaming (4029 - 16108, n=110, last 2 years) | |
| Razer Blade 16 Early 2023 | |
| MSI Stealth 16 Studio A13VG | |
| Lenovo Yoga Pro 9 16-IRP G8 | |
| Gigabyte AERO 16 OLED BSF | |
| Asus ROG Zephyrus G16 2024 GU605M | |
| Apple MacBook Pro 16 2023 M3 Max | |
| Schenker VISION 16 Pro (M23) | |
| Cinebench R20 / CPU (Single Core) | |
| Average of class Gaming (442 - 895, n=110, last 2 years) | |
| Razer Blade 16 Early 2023 | |
| Lenovo Yoga Pro 9 16-IRP G8 | |
| Schenker VISION 16 Pro (M23) | |
| MSI Stealth 16 Studio A13VG | |
| Asus ROG Zephyrus G16 2024 GU605M | |
| Gigabyte AERO 16 OLED BSF | |
| Apple MacBook Pro 16 2023 M3 Max | |
| Cinebench R15 / CPU Multi 64Bit | |
| Razer Blade 16 Early 2023 | |
| Average of class Gaming (1578 - 6271, n=109, last 2 years) | |
| Apple MacBook Pro 16 2023 M3 Max | |
| Lenovo Yoga Pro 9 16-IRP G8 | |
| Gigabyte AERO 16 OLED BSF | |
| MSI Stealth 16 Studio A13VG | |
| Asus ROG Zephyrus G16 2024 GU605M | |
| Schenker VISION 16 Pro (M23) | |
| Cinebench R15 / CPU Single 64Bit | |
| Average of class Gaming (188.8 - 343, n=110, last 2 years) | |
| Schenker VISION 16 Pro (M23) | |
| Razer Blade 16 Early 2023 | |
| Lenovo Yoga Pro 9 16-IRP G8 | |
| MSI Stealth 16 Studio A13VG | |
| Apple MacBook Pro 16 2023 M3 Max | |
| Asus ROG Zephyrus G16 2024 GU605M | |
| Gigabyte AERO 16 OLED BSF | |
| 7-Zip 18.03 / 7z b 4 -mmt1 | |
| Razer Blade 16 Early 2023 | |
| Average of class Gaming (4199 - 7436, n=109, last 2 years) | |
| Schenker VISION 16 Pro (M23) | |
| MSI Stealth 16 Studio A13VG | |
| Lenovo Yoga Pro 9 16-IRP G8 | |
| Gigabyte AERO 16 OLED BSF | |
| Asus ROG Zephyrus G16 2024 GU605M | |
| Geekbench 6.7 / Multi-Core | |
| Apple MacBook Pro 16 2023 M3 Max | |
| Razer Blade 16 Early 2023 | |
| Razer Blade 16 Early 2023 | |
| Razer Blade 16 Early 2023 | |
| Average of class Gaming (6625 - 22104, n=110, last 2 years) | |
| Lenovo Yoga Pro 9 16-IRP G8 | |
| Asus ROG Zephyrus G16 2024 GU605M | |
| Geekbench 6.7 / Single-Core | |
| Apple MacBook Pro 16 2023 M3 Max | |
| Razer Blade 16 Early 2023 | |
| Razer Blade 16 Early 2023 | |
| Razer Blade 16 Early 2023 | |
| Average of class Gaming (1490 - 3259, n=110, last 2 years) | |
| Lenovo Yoga Pro 9 16-IRP G8 | |
| Asus ROG Zephyrus G16 2024 GU605M | |
| HWBOT x265 Benchmark v2.2 / 4k Preset | |
| Razer Blade 16 Early 2023 | |
| Average of class Gaming (11.5 - 44.3, n=109, last 2 years) | |
| Lenovo Yoga Pro 9 16-IRP G8 | |
| Gigabyte AERO 16 OLED BSF | |
| Asus ROG Zephyrus G16 2024 GU605M | |
| MSI Stealth 16 Studio A13VG | |
| Schenker VISION 16 Pro (M23) | |
| LibreOffice / 20 Documents To PDF | |
| Gigabyte AERO 16 OLED BSF | |
| MSI Stealth 16 Studio A13VG | |
| Asus ROG Zephyrus G16 2024 GU605M | |
| Average of class Gaming (19 - 88.8, n=109, last 2 years) | |
| Lenovo Yoga Pro 9 16-IRP G8 | |
| Schenker VISION 16 Pro (M23) | |
| Razer Blade 16 Early 2023 | |
| R Benchmark 2.5 / Overall mean | |
| Gigabyte AERO 16 OLED BSF | |
| Asus ROG Zephyrus G16 2024 GU605M | |
| Lenovo Yoga Pro 9 16-IRP G8 | |
| MSI Stealth 16 Studio A13VG | |
| Schenker VISION 16 Pro (M23) | |
| Average of class Gaming (0.3439 - 0.759, n=110, last 2 years) | |
| Razer Blade 16 Early 2023 | |
* ... smaller is better
AIDA64: FP32 Ray-Trace | FPU Julia | CPU SHA3 | CPU Queen | FPU SinJulia | FPU Mandel | CPU AES | CPU ZLib | FP64 Ray-Trace | CPU PhotoWorxx
| Performance rating | |
| Average of class Gaming | |
| Razer Blade 16 Early 2023 | |
| Gigabyte AERO 16 OLED BSF | |
| Lenovo Yoga Pro 9 16-IRP G8 | |
| MSI Stealth 16 Studio A13VG | |
| Asus ROG Zephyrus G16 2024 GU605M | |
| Schenker VISION 16 Pro (M23) | |
| Average Intel Core Ultra 7 155H | |
| AIDA64 / FP32 Ray-Trace | |
| Average of class Gaming (10227 - 85542, n=108, last 2 years) | |
| Razer Blade 16 Early 2023 | |
| Razer Blade 16 Early 2023 | |
| Razer Blade 16 Early 2023 | |
| Gigabyte AERO 16 OLED BSF | |
| MSI Stealth 16 Studio A13VG | |
| Lenovo Yoga Pro 9 16-IRP G8 | |
| Asus ROG Zephyrus G16 2024 GU605M | |
| Schenker VISION 16 Pro (M23) | |
| Average Intel Core Ultra 7 155H (6670 - 18470, n=50) | |
| AIDA64 / FPU Julia | |
| Average of class Gaming (51376 - 238426, n=108, last 2 years) | |
| Razer Blade 16 Early 2023 | |
| Razer Blade 16 Early 2023 | |
| Razer Blade 16 Early 2023 | |
| Lenovo Yoga Pro 9 16-IRP G8 | |
| Gigabyte AERO 16 OLED BSF | |
| Asus ROG Zephyrus G16 2024 GU605M | |
| MSI Stealth 16 Studio A13VG | |
| Schenker VISION 16 Pro (M23) | |
| Average Intel Core Ultra 7 155H (40905 - 93181, n=50) | |
| AIDA64 / CPU SHA3 | |
| Razer Blade 16 Early 2023 | |
| Razer Blade 16 Early 2023 | |
| Razer Blade 16 Early 2023 | |
| Average of class Gaming (2180 - 9817, n=108, last 2 years) | |
| Lenovo Yoga Pro 9 16-IRP G8 | |
| Gigabyte AERO 16 OLED BSF | |
| MSI Stealth 16 Studio A13VG | |
| Asus ROG Zephyrus G16 2024 GU605M | |
| Average Intel Core Ultra 7 155H (1940 - 4436, n=50) | |
| Schenker VISION 16 Pro (M23) | |
| AIDA64 / CPU Queen | |
| Razer Blade 16 Early 2023 | |
| Razer Blade 16 Early 2023 | |
| Average of class Gaming (49785 - 173351, n=96, last 2 years) | |
| Lenovo Yoga Pro 9 16-IRP G8 | |
| MSI Stealth 16 Studio A13VG | |
| Schenker VISION 16 Pro (M23) | |
| Gigabyte AERO 16 OLED BSF | |
| Asus ROG Zephyrus G16 2024 GU605M | |
| Average Intel Core Ultra 7 155H (64698 - 94181, n=50) | |
| AIDA64 / FPU SinJulia | |
| Razer Blade 16 Early 2023 | |
| Razer Blade 16 Early 2023 | |
| Razer Blade 16 Early 2023 | |
| Average of class Gaming (4424 - 33636, n=108, last 2 years) | |
| Lenovo Yoga Pro 9 16-IRP G8 | |
| MSI Stealth 16 Studio A13VG | |
| Asus ROG Zephyrus G16 2024 GU605M | |
| Gigabyte AERO 16 OLED BSF | |
| Average Intel Core Ultra 7 155H (5639 - 10647, n=50) | |
| Schenker VISION 16 Pro (M23) | |
| AIDA64 / FPU Mandel | |
| Average of class Gaming (25115 - 128721, n=108, last 2 years) | |
| Razer Blade 16 Early 2023 | |
| Razer Blade 16 Early 2023 | |
| Razer Blade 16 Early 2023 | |
| Gigabyte AERO 16 OLED BSF | |
| MSI Stealth 16 Studio A13VG | |
| Lenovo Yoga Pro 9 16-IRP G8 | |
| Asus ROG Zephyrus G16 2024 GU605M | |
| Average Intel Core Ultra 7 155H (18236 - 47685, n=50) | |
| Schenker VISION 16 Pro (M23) | |
| AIDA64 / CPU AES | |
| Razer Blade 16 Early 2023 | |
| Razer Blade 16 Early 2023 | |
| Razer Blade 16 Early 2023 | |
| Gigabyte AERO 16 OLED BSF | |
| Average of class Gaming (39258 - 247074, n=108, last 2 years) | |
| Lenovo Yoga Pro 9 16-IRP G8 | |
| MSI Stealth 16 Studio A13VG | |
| Asus ROG Zephyrus G16 2024 GU605M | |
| Average Intel Core Ultra 7 155H (45713 - 152179, n=50) | |
| Schenker VISION 16 Pro (M23) | |
| AIDA64 / CPU ZLib | |
| Razer Blade 16 Early 2023 | |
| Razer Blade 16 Early 2023 | |
| Razer Blade 16 Early 2023 | |
| Average of class Gaming (574 - 2531, n=108, last 2 years) | |
| Lenovo Yoga Pro 9 16-IRP G8 | |
| Gigabyte AERO 16 OLED BSF | |
| Asus ROG Zephyrus G16 2024 GU605M | |
| MSI Stealth 16 Studio A13VG | |
| Average Intel Core Ultra 7 155H (557 - 1250, n=50) | |
| Schenker VISION 16 Pro (M23) | |
| AIDA64 / FP64 Ray-Trace | |
| Average of class Gaming (5509 - 45446, n=108, last 2 years) | |
| Razer Blade 16 Early 2023 | |
| Razer Blade 16 Early 2023 | |
| Razer Blade 16 Early 2023 | |
| Gigabyte AERO 16 OLED BSF | |
| MSI Stealth 16 Studio A13VG | |
| Lenovo Yoga Pro 9 16-IRP G8 | |
| Asus ROG Zephyrus G16 2024 GU605M | |
| Schenker VISION 16 Pro (M23) | |
| Average Intel Core Ultra 7 155H (3569 - 9802, n=50) | |
| AIDA64 / CPU PhotoWorxx | |
| Lenovo Yoga Pro 9 16-IRP G8 | |
| Razer Blade 16 Early 2023 | |
| Razer Blade 16 Early 2023 | |
| Razer Blade 16 Early 2023 | |
| Asus ROG Zephyrus G16 2024 GU605M | |
| Average Intel Core Ultra 7 155H (32719 - 54223, n=50) | |
| MSI Stealth 16 Studio A13VG | |
| Gigabyte AERO 16 OLED BSF | |
| Schenker VISION 16 Pro (M23) | |
| Average of class Gaming (12271 - 89891, n=108, last 2 years) | |
系统性能
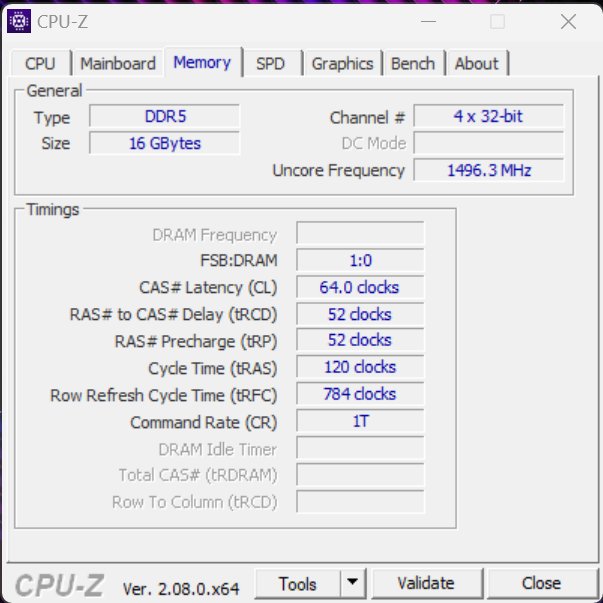
主观而言,这款笔记本电脑表现良好,只有在图形切换(如启动游戏)时,在 MUX 切换过程中会出现轻微卡顿,但这完全正常。竞争对手在合成测试中取得了更高的分数,但在日常使用中你可能不会注意到差异。它的内存基准测试结果非常出色,但它的内存不能扩展,16 GB 内存对于高端设备来说根本不够用。所有机型都应标配 32 GB。
CrossMark: Overall | Productivity | Creativity | Responsiveness
WebXPRT 3: Overall
WebXPRT 4: Overall
Mozilla Kraken 1.1: Total
| PCMark 10 / Score | |
| Average of class Gaming (5828 - 11574, n=96, last 2 years) | |
| Gigabyte AERO 16 OLED BSF | |
| Razer Blade 16 Early 2023 | |
| Average Intel Core Ultra 7 155H, NVIDIA GeForce RTX 4070 Laptop GPU (7084 - 7761, n=4) | |
| Schenker VISION 16 Pro (M23) | |
| MSI Stealth 16 Studio A13VG | |
| Lenovo Yoga Pro 9 16-IRP G8 | |
| Asus ROG Zephyrus G16 2024 GU605M | |
| PCMark 10 / Essentials | |
| Gigabyte AERO 16 OLED BSF | |
| Razer Blade 16 Early 2023 | |
| Lenovo Yoga Pro 9 16-IRP G8 | |
| Schenker VISION 16 Pro (M23) | |
| Average of class Gaming (8810 - 12600, n=100, last 2 years) | |
| MSI Stealth 16 Studio A13VG | |
| Average Intel Core Ultra 7 155H, NVIDIA GeForce RTX 4070 Laptop GPU (10038 - 10393, n=4) | |
| Asus ROG Zephyrus G16 2024 GU605M | |
| PCMark 10 / Productivity | |
| Average of class Gaming (6845 - 21327, n=98, last 2 years) | |
| Schenker VISION 16 Pro (M23) | |
| MSI Stealth 16 Studio A13VG | |
| Average Intel Core Ultra 7 155H, NVIDIA GeForce RTX 4070 Laptop GPU (9192 - 9518, n=4) | |
| Gigabyte AERO 16 OLED BSF | |
| Asus ROG Zephyrus G16 2024 GU605M | |
| Lenovo Yoga Pro 9 16-IRP G8 | |
| Razer Blade 16 Early 2023 | |
| PCMark 10 / Digital Content Creation | |
| Razer Blade 16 Early 2023 | |
| Average of class Gaming (7602 - 19657, n=98, last 2 years) | |
| Gigabyte AERO 16 OLED BSF | |
| Average Intel Core Ultra 7 155H, NVIDIA GeForce RTX 4070 Laptop GPU (10100 - 13035, n=4) | |
| MSI Stealth 16 Studio A13VG | |
| Lenovo Yoga Pro 9 16-IRP G8 | |
| Schenker VISION 16 Pro (M23) | |
| Asus ROG Zephyrus G16 2024 GU605M | |
| CrossMark / Overall | |
| Apple MacBook Pro 16 2023 M3 Max | |
| Average of class Gaming (1366 - 2409, n=96, last 2 years) | |
| Schenker VISION 16 Pro (M23) | |
| Gigabyte AERO 16 OLED BSF | |
| Lenovo Yoga Pro 9 16-IRP G8 | |
| MSI Stealth 16 Studio A13VG | |
| Average Intel Core Ultra 7 155H, NVIDIA GeForce RTX 4070 Laptop GPU (1687 - 1848, n=4) | |
| Asus ROG Zephyrus G16 2024 GU605M | |
| Razer Blade 16 Early 2023 | |
| CrossMark / Productivity | |
| Average of class Gaming (1386 - 2254, n=96, last 2 years) | |
| Apple MacBook Pro 16 2023 M3 Max | |
| Schenker VISION 16 Pro (M23) | |
| Gigabyte AERO 16 OLED BSF | |
| MSI Stealth 16 Studio A13VG | |
| Lenovo Yoga Pro 9 16-IRP G8 | |
| Average Intel Core Ultra 7 155H, NVIDIA GeForce RTX 4070 Laptop GPU (1589 - 1750, n=4) | |
| Asus ROG Zephyrus G16 2024 GU605M | |
| Razer Blade 16 Early 2023 | |
| CrossMark / Creativity | |
| Apple MacBook Pro 16 2023 M3 Max | |
| Average of class Gaming (1343 - 2729, n=96, last 2 years) | |
| Lenovo Yoga Pro 9 16-IRP G8 | |
| Schenker VISION 16 Pro (M23) | |
| Gigabyte AERO 16 OLED BSF | |
| Asus ROG Zephyrus G16 2024 GU605M | |
| MSI Stealth 16 Studio A13VG | |
| Average Intel Core Ultra 7 155H, NVIDIA GeForce RTX 4070 Laptop GPU (1860 - 2014, n=4) | |
| Razer Blade 16 Early 2023 | |
| CrossMark / Responsiveness | |
| Gigabyte AERO 16 OLED BSF | |
| Schenker VISION 16 Pro (M23) | |
| Average of class Gaming (1226 - 2334, n=96, last 2 years) | |
| MSI Stealth 16 Studio A13VG | |
| Average Intel Core Ultra 7 155H, NVIDIA GeForce RTX 4070 Laptop GPU (1424 - 1683, n=4) | |
| Lenovo Yoga Pro 9 16-IRP G8 | |
| Apple MacBook Pro 16 2023 M3 Max | |
| Asus ROG Zephyrus G16 2024 GU605M | |
| Razer Blade 16 Early 2023 | |
| WebXPRT 3 / Overall | |
| Apple MacBook Pro 16 2023 M3 Max | |
| Average of class Gaming (220 - 532, n=101, last 2 years) | |
| Schenker VISION 16 Pro (M23) | |
| Lenovo Yoga Pro 9 16-IRP G8 | |
| MSI Stealth 16 Studio A13VG | |
| Asus ROG Zephyrus G16 2024 GU605M | |
| Average Intel Core Ultra 7 155H, NVIDIA GeForce RTX 4070 Laptop GPU (264 - 294, n=4) | |
| Razer Blade 16 Early 2023 | |
| Gigabyte AERO 16 OLED BSF | |
| WebXPRT 4 / Overall | |
| Average of class Gaming (165 - 354, n=101, last 2 years) | |
| Razer Blade 16 Early 2023 | |
| Schenker VISION 16 Pro (M23) | |
| MSI Stealth 16 Studio A13VG | |
| Lenovo Yoga Pro 9 16-IRP G8 | |
| Asus ROG Zephyrus G16 2024 GU605M | |
| Average Intel Core Ultra 7 155H, NVIDIA GeForce RTX 4070 Laptop GPU (247 - 257, n=4) | |
| Gigabyte AERO 16 OLED BSF | |
| Mozilla Kraken 1.1 / Total | |
| Gigabyte AERO 16 OLED BSF | |
| Average Intel Core Ultra 7 155H, NVIDIA GeForce RTX 4070 Laptop GPU (546 - 568, n=3) | |
| Asus ROG Zephyrus G16 2024 GU605M | |
| MSI Stealth 16 Studio A13VG | |
| Lenovo Yoga Pro 9 16-IRP G8 | |
| Schenker VISION 16 Pro (M23) | |
| Razer Blade 16 Early 2023 | |
| Average of class Gaming (391 - 590, n=106, last 2 years) | |
| Apple MacBook Pro 16 2023 M3 Max | |
* ... smaller is better
| PCMark 10 Score | 7123 points | |
Help | ||
| AIDA64 / Memory Copy | |
| Asus ROG Zephyrus G16 2024 GU605M | |
| Average Intel Core Ultra 7 155H (62397 - 96791, n=50) | |
| Razer Blade 16 Early 2023 | |
| Razer Blade 16 Early 2023 | |
| Razer Blade 16 Early 2023 | |
| Lenovo Yoga Pro 9 16-IRP G8 | |
| Average of class Gaming (21750 - 129946, n=108, last 2 years) | |
| MSI Stealth 16 Studio A13VG | |
| Gigabyte AERO 16 OLED BSF | |
| Schenker VISION 16 Pro (M23) | |
| AIDA64 / Memory Read | |
| Razer Blade 16 Early 2023 | |
| Razer Blade 16 Early 2023 | |
| Razer Blade 16 Early 2023 | |
| Asus ROG Zephyrus G16 2024 GU605M | |
| Average Intel Core Ultra 7 155H (60544 - 90647, n=50) | |
| Lenovo Yoga Pro 9 16-IRP G8 | |
| MSI Stealth 16 Studio A13VG | |
| Average of class Gaming (22956 - 118858, n=108, last 2 years) | |
| Schenker VISION 16 Pro (M23) | |
| Gigabyte AERO 16 OLED BSF | |
| AIDA64 / Memory Write | |
| Lenovo Yoga Pro 9 16-IRP G8 | |
| Razer Blade 16 Early 2023 | |
| Razer Blade 16 Early 2023 | |
| Razer Blade 16 Early 2023 | |
| Average of class Gaming (22297 - 135096, n=108, last 2 years) | |
| Asus ROG Zephyrus G16 2024 GU605M | |
| Average Intel Core Ultra 7 155H (58692 - 93451, n=50) | |
| MSI Stealth 16 Studio A13VG | |
| Gigabyte AERO 16 OLED BSF | |
| Schenker VISION 16 Pro (M23) | |
| AIDA64 / Memory Latency | |
| Average Intel Core Ultra 7 155H (116.2 - 233, n=50) | |
| Asus ROG Zephyrus G16 2024 GU605M | |
| Lenovo Yoga Pro 9 16-IRP G8 | |
| Average of class Gaming (75.3 - 259, n=108, last 2 years) | |
| Razer Blade 16 Early 2023 | |
| Razer Blade 16 Early 2023 | |
| Razer Blade 16 Early 2023 | |
| Gigabyte AERO 16 OLED BSF | |
| MSI Stealth 16 Studio A13VG | |
| Schenker VISION 16 Pro (M23) | |
* ... smaller is better
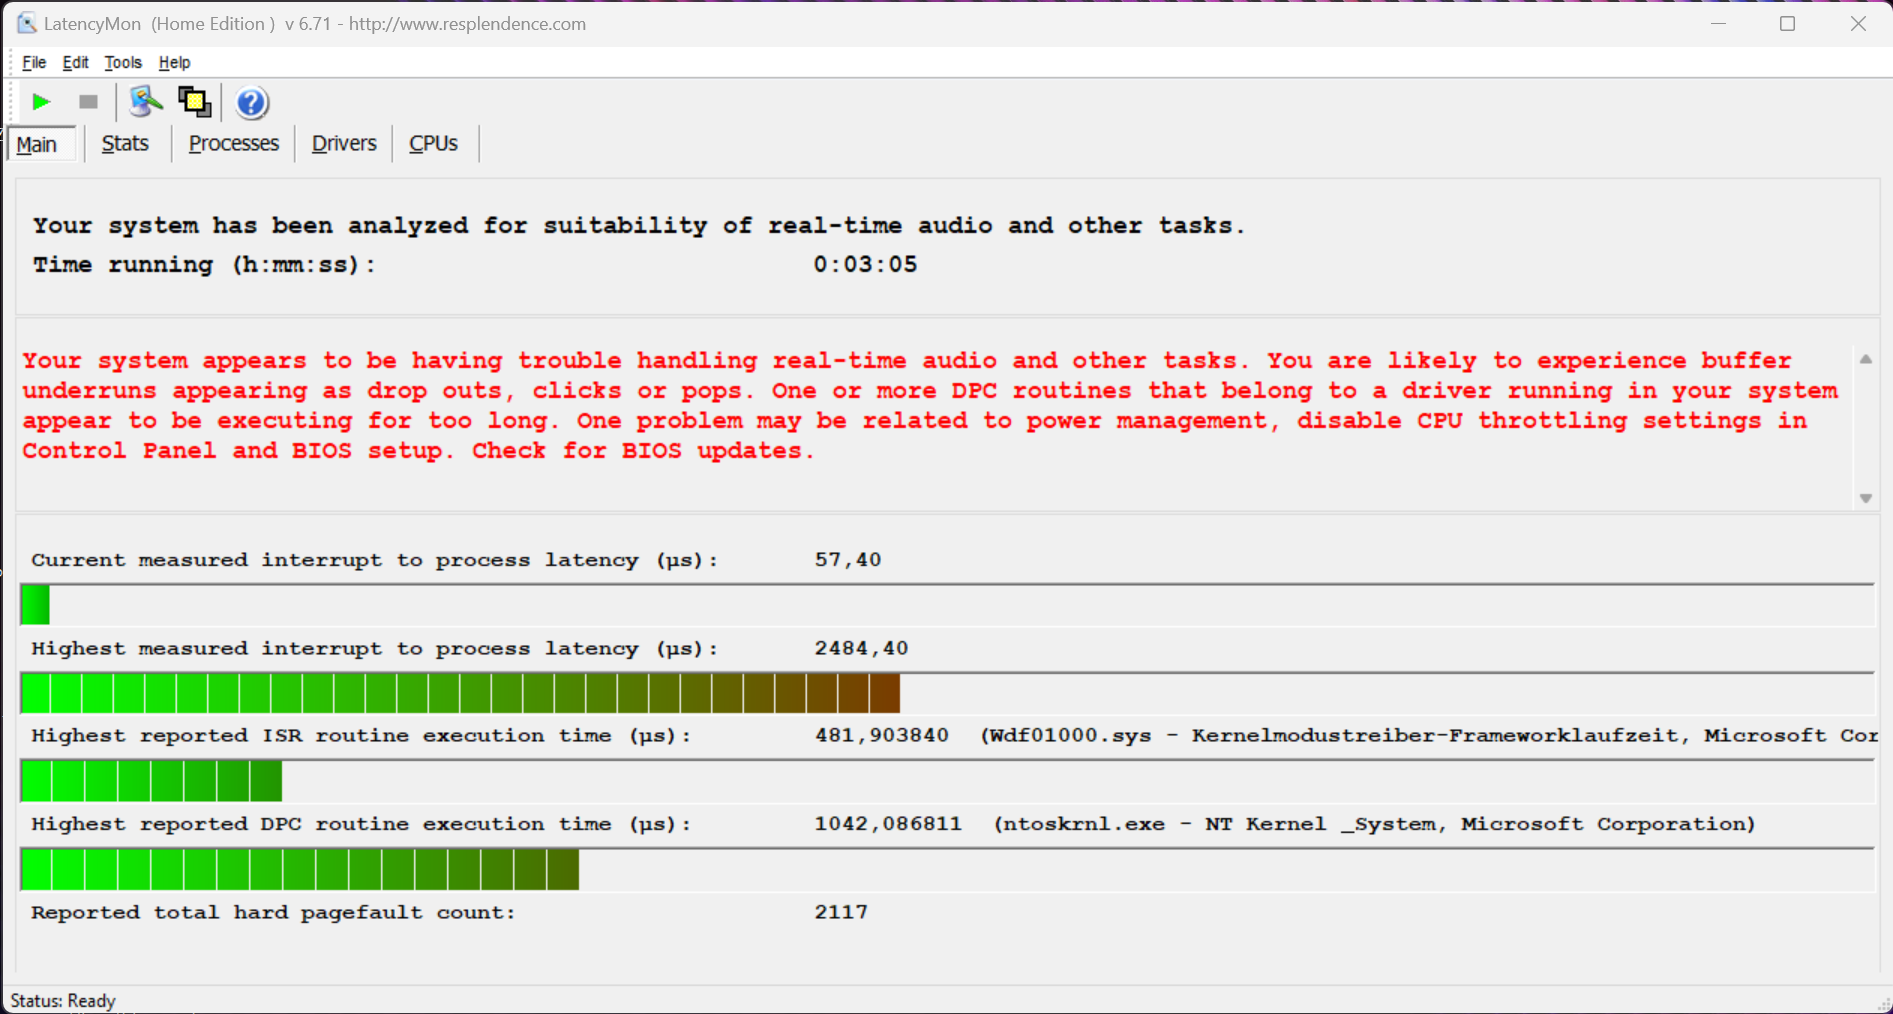
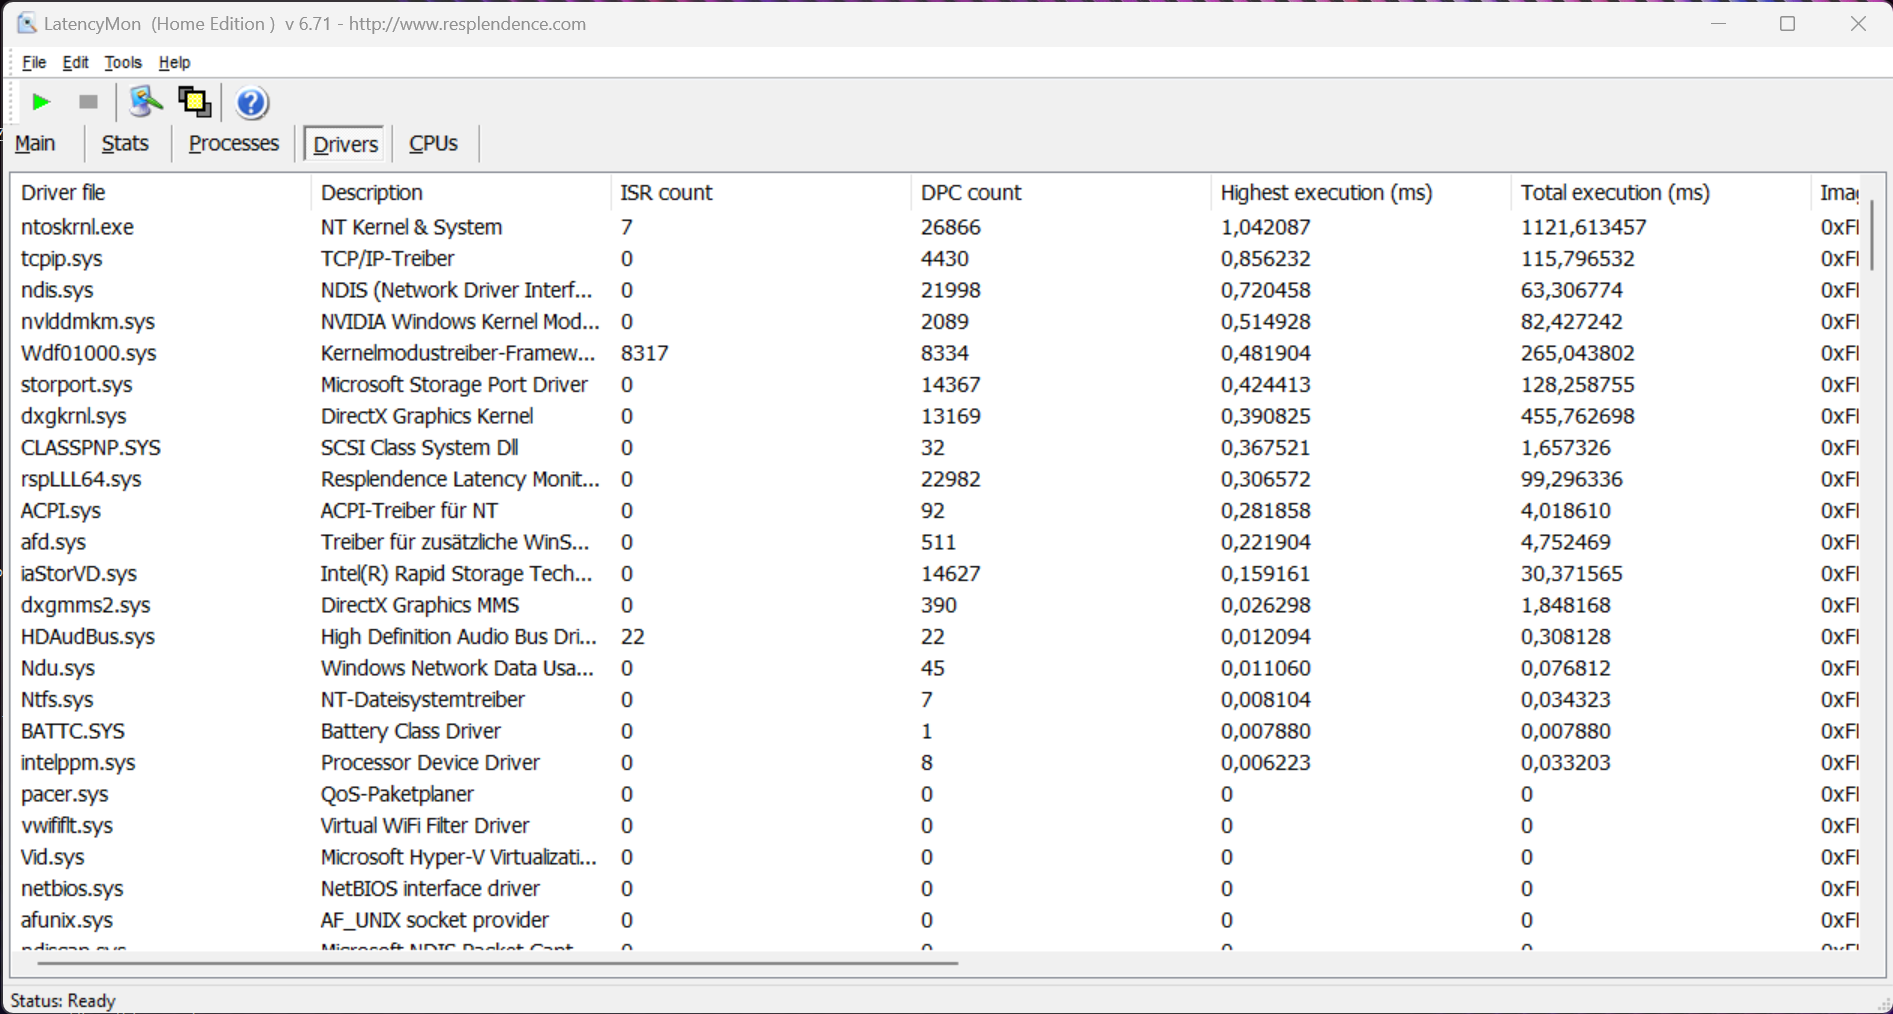
DPC 延迟
在我们的标准化延迟测试(网上冲浪、4K YouTube 播放、CPU 负载)中,使用当前 BIOS 版本的测试设备在使用实时音频应用程序时显示出轻微的限制。
| DPC Latencies / LatencyMon - interrupt to process latency (max), Web, Youtube, Prime95 | |
| MSI Stealth 16 Studio A13VG | |
| Lenovo Yoga Pro 9 16-IRP G8 | |
| Asus ROG Zephyrus G16 2024 GU605M | |
| Razer Blade 16 Early 2023 | |
| Gigabyte AERO 16 OLED BSF | |
| Schenker VISION 16 Pro (M23) | |
* ... smaller is better
存储设备
新款 G16 有两个 M.2-2280 插槽,通过 PCIe 4.0 连接。我们的测试设备中安装了 1 TB 版本的西部数据 SN560,虽然它的传输速率高达 5 GB/s,但并不是市场上最快的硬盘之一。至少,即使在长期负载的情况下,它的性能也能保持稳定。出厂时,用户有 855 GB 的可用空间。更多固态硬盘基准测试 这里。

* ... smaller is better
Reading continuous performance: DiskSpd Read Loop, Queue Depth 8
图形卡
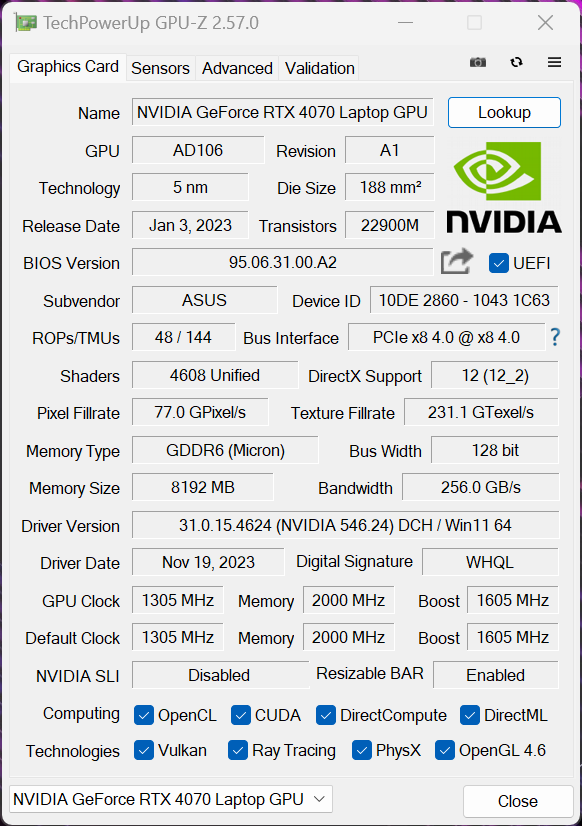
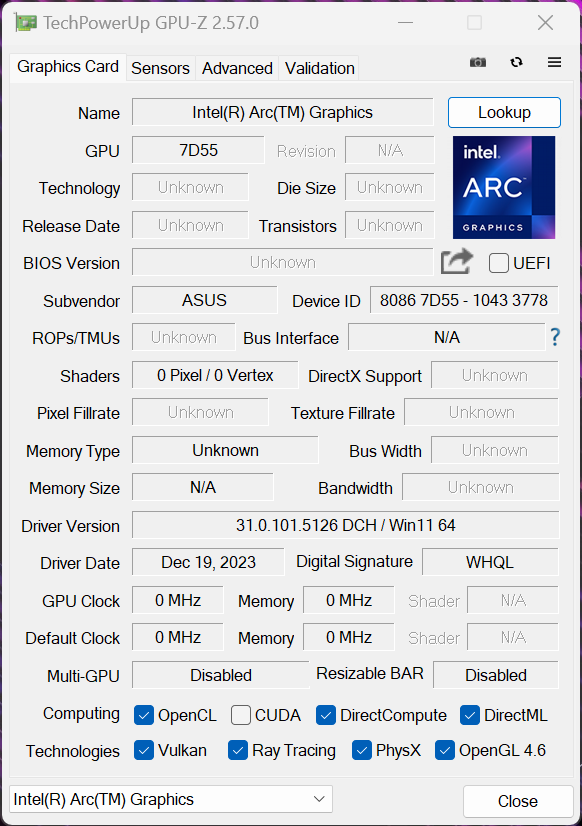
笔记本电脑 GeForce RTX 4070 笔记本电脑拥有 8GB 内存,在性能模式下,最大运行功耗为 80 瓦。要获得高达 105 瓦的全性能,必须选择涡轮增压模式。Zephyrus G16 具有带高级 Optimus 的 MUX 开关,因此切换到 dGPU 时无需重启系统。新款 Meteor-Lake 处理器的 Arc iGPU 与旧款 Iris Xe Graphics G7 相比,性能有了大幅提升,但由于 G16 配备了专用的 Nvidia GPU,这一点并不太重要。
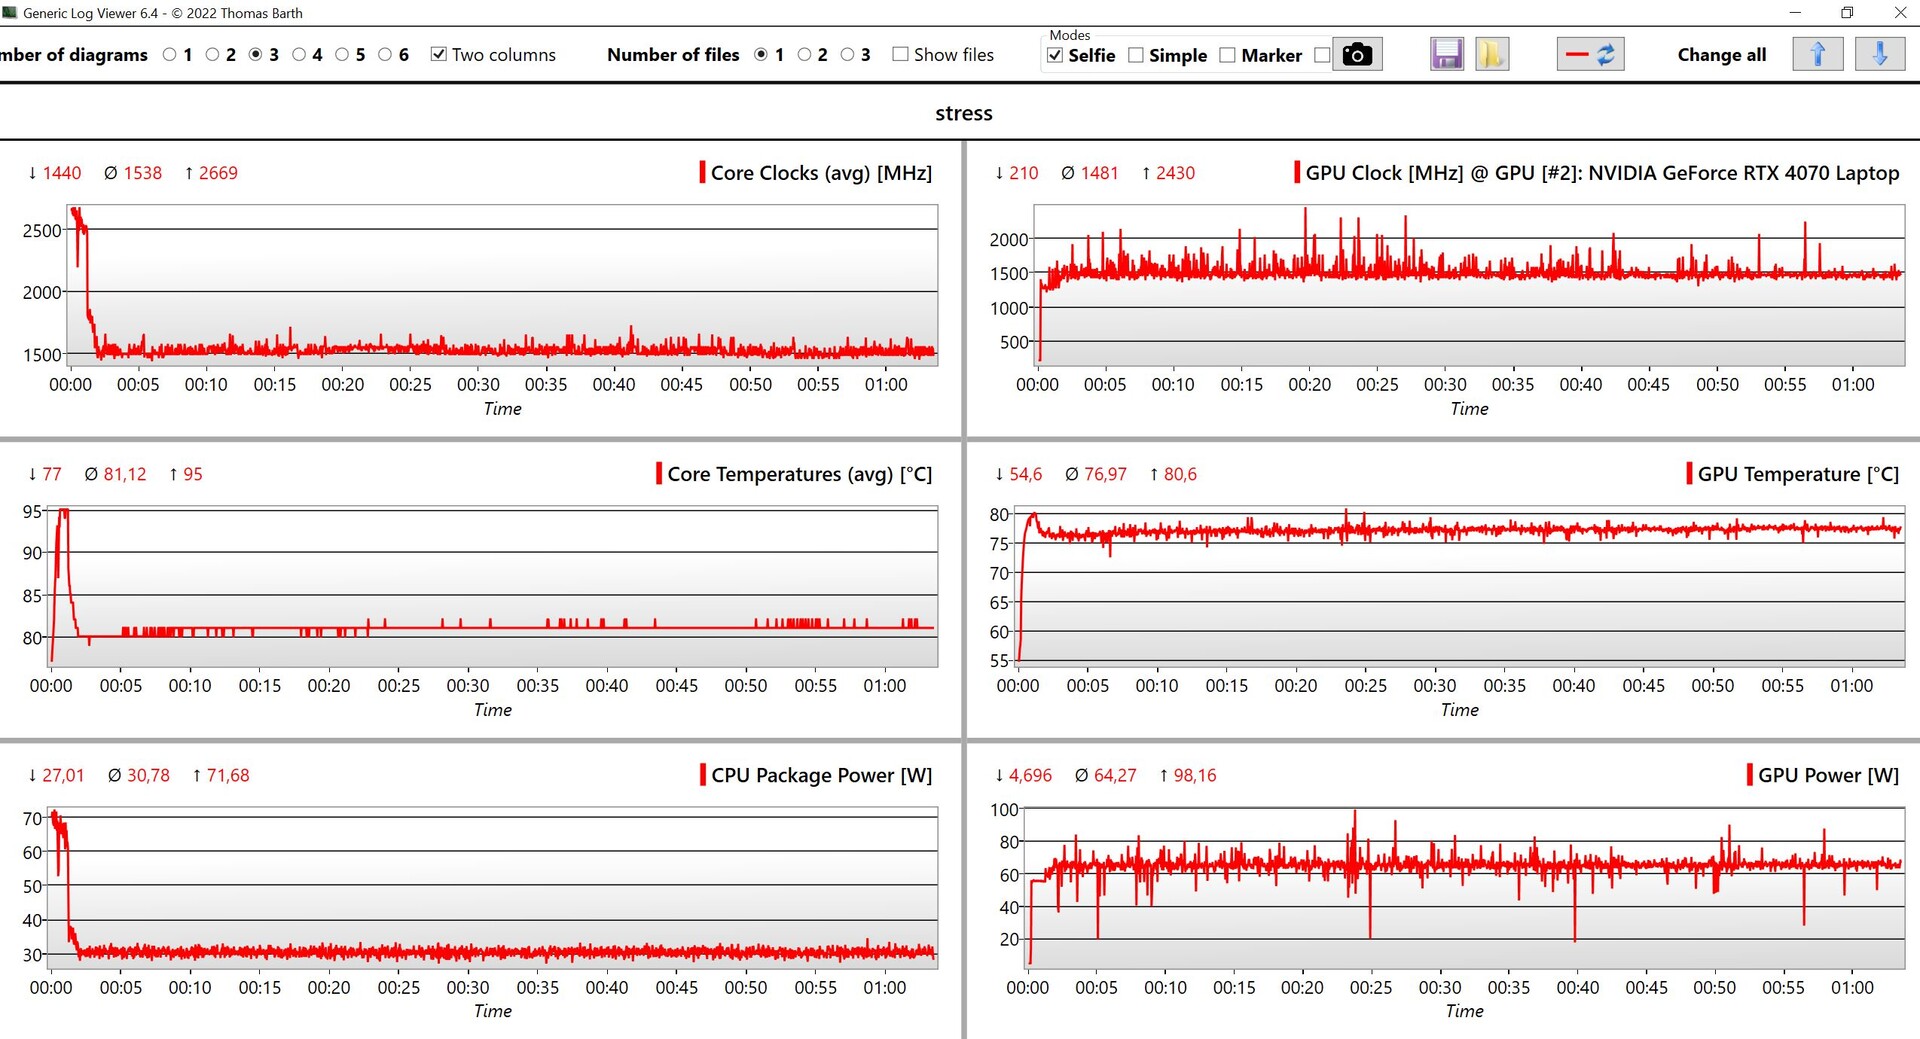
其基准测试结果尚可,使用涡轮增压模式可以获得更好的性能(这也将缩小与对比设备的差距)。在永久负载下,GPU 的功耗仅为 42 瓦,这就是为什么 GPU 性能最终会降低 27%。更多 GPU 基准测试请访问。
| 3DMark 11 Performance | 31273 points | |
| 3DMark Fire Strike Score | 23302 points | |
| 3DMark Time Spy Score | 10850 points | |
Help | ||
| Blender / v3.3 Classroom OPTIX/RTX | |
| Lenovo Yoga Pro 9 16-IRP G8 | |
| MSI Stealth 16 Studio A13VG | |
| Schenker VISION 16 Pro (M23) | |
| Asus ROG Zephyrus G16 2024 GU605M | |
| Average NVIDIA GeForce RTX 4070 Laptop GPU (18 - 30, n=68) | |
| Gigabyte AERO 16 OLED BSF | |
| Average of class Gaming (9 - 32, n=110, last 2 years) | |
| Razer Blade 16 Early 2023 | |
| Blender / v3.3 Classroom CUDA | |
| Lenovo Yoga Pro 9 16-IRP G8 | |
| MSI Stealth 16 Studio A13VG | |
| Schenker VISION 16 Pro (M23) | |
| Average NVIDIA GeForce RTX 4070 Laptop GPU (32 - 50, n=67) | |
| Average of class Gaming (15 - 233, n=111, last 2 years) | |
| Gigabyte AERO 16 OLED BSF | |
| Asus ROG Zephyrus G16 2024 GU605M | |
| Razer Blade 16 Early 2023 | |
| Blender / v3.3 Classroom CPU | |
| Schenker VISION 16 Pro (M23) | |
| Asus ROG Zephyrus G16 2024 GU605M | |
| Lenovo Yoga Pro 9 16-IRP G8 | |
| Gigabyte AERO 16 OLED BSF | |
| MSI Stealth 16 Studio A13VG | |
| Average NVIDIA GeForce RTX 4070 Laptop GPU (158 - 440, n=67) | |
| Average of class Gaming (122 - 565, n=106, last 2 years) | |
| Razer Blade 16 Early 2023 | |
| Apple MacBook Pro 16 2023 M3 Max | |
| Blender / v3.3 Classroom METAL | |
| Apple MacBook Pro 16 2023 M3 Max | |
* ... smaller is better
游戏性能
尽管新款 ROG Zephyrus G16 不再是一款硬核游戏笔记本电脑,但其游戏性能自然仍是一个非常重要的方面--新款机型当然不会让人失望。它的 RTX 4070 笔记本电脑的性能加上流星湖处理器,足以流畅运行当前的游戏。结合出色的 OLED 面板,这款笔记本电脑可提供非凡的游戏体验。只有要求极其苛刻的游戏或光线追踪才可能需要使用升频技术,如果游戏支持这些技术的话。此外,即使在长时间的游戏过程中,它的游戏性能也能保持完全稳定。
| The Witcher 3 - 1920x1080 Ultra Graphics & Postprocessing (HBAO+) | |
| Razer Blade 16 Early 2023 | |
| Average of class Gaming (95 - 240, n=8, last 2 years) | |
| MSI Stealth 16 Studio A13VG | |
| Gigabyte AERO 16 OLED BSF | |
| Schenker VISION 16 Pro (M23) | |
| Asus ROG Zephyrus G16 2024 GU605M | |
| Lenovo Yoga Pro 9 16-IRP G8 | |
| Final Fantasy XV Benchmark - 1920x1080 High Quality | |
| Razer Blade 16 Early 2023 | |
| Average of class Gaming (41 - 215, n=100, last 2 years) | |
| Gigabyte AERO 16 OLED BSF | |
| MSI Stealth 16 Studio A13VG | |
| Schenker VISION 16 Pro (M23) | |
| Asus ROG Zephyrus G16 2024 GU605M | |
| Lenovo Yoga Pro 9 16-IRP G8 | |
| Call of Duty Modern Warfare 3 2023 | |
| 1920x1080 Extreme Preset | |
| Average NVIDIA GeForce RTX 4070 Laptop GPU (92 - 120, n=7) | |
| Asus ROG Zephyrus G16 2024 GU605M | |
| Average of class Gaming (27 - 95, n=3, last 2 years) | |
| 2560x1440 Extreme Preset | |
| Average NVIDIA GeForce RTX 4070 Laptop GPU (64 - 83, n=6) | |
| Asus ROG Zephyrus G16 2024 GU605M | |
| Average of class Gaming (54 - 66, n=2, last 2 years) | |
| Avatar Frontiers of Pandora | |
| 1920x1080 Ultra Preset AA:T | |
| Average of class Gaming (n=1last 2 years) | |
| Average NVIDIA GeForce RTX 4070 Laptop GPU (49 - 62, n=9) | |
| Asus ROG Zephyrus G16 2024 GU605M | |
| 2560x1440 Ultra Preset AA:T | |
| Average of class Gaming (n=1last 2 years) | |
| Average NVIDIA GeForce RTX 4070 Laptop GPU (32 - 42, n=9) | |
| Asus ROG Zephyrus G16 2024 GU605M | |
我们还注意到不同的能量模式对几款 QHD 分辨率和最高细节的游戏的影响。正如您所看到的,虽然存在一些差异,但这些差异并不大。即使在静音模式下,你通常仍能很好地运行这些游戏(尤其是在稍微降低分辨率或使用 DLSS 的情况下)--在实际操作中,你应该多尝试不同的设置。
| 能量曲线 | 《孤岛惊魂 5》 | Witcher 3 | 《赛博朋克 2077》 | 《现代战争 3》 | 《阿凡达》 | 《星球大战绝地求生 |
|---|---|---|---|---|---|---|
| 安静 | 87 fps | 68.5 fps | 32.6 fps | 49 fps | 23 fps | 29.8 fps |
| 性能 | 94 fps | 82.4 fps | 43.7 fps | 64 fps | 32 fps | 39.5 fps |
| Turbo | 105 fps | 83.9 fps | 48.7 fps | 66 fps | 34 fps | 42.5 fps |
Witcher 3 FPS diagram
| low | med. | high | ultra | QHD | |
|---|---|---|---|---|---|
| GTA V (2015) | 166.5 | 98.8 | 79.6 | ||
| The Witcher 3 (2015) | 221 | 98.6 | 82.4 | ||
| Dota 2 Reborn (2015) | 162.3 | 146.8 | 140.7 | 131.6 | |
| Final Fantasy XV Benchmark (2018) | 131.8 | 100.8 | 76.3 | ||
| X-Plane 11.11 (2018) | 119.9 | 106.3 | 81.2 | ||
| Far Cry 5 (2018) | 147 | 126 | 121 | 112 | 94 |
| Strange Brigade (2018) | 211 | 129.3 | 123.4 | ||
| F1 2021 (2021) | 294 | 270 | 220 | 123.1 | 95.2 |
| F1 22 (2022) | 192.9 | 199.7 | 168.1 | 65.6 | 44.3 |
| Star Wars Jedi Survivor (2023) | 78.7 | 69.9 | 65.1 | 61.5 | 39.5 |
| F1 23 (2023) | 195.2 | 193.8 | 165.4 | 55.8 | 36 |
| Cyberpunk 2077 (2023) | 96.4 | 90 | 77 | 69 | 43.7 |
| Call of Duty Modern Warfare 3 2023 (2023) | 143 | 130 | 101 | 94 | 64 |
| Avatar Frontiers of Pandora (2023) | 81 | 75 | 66 | 49 | 32 |
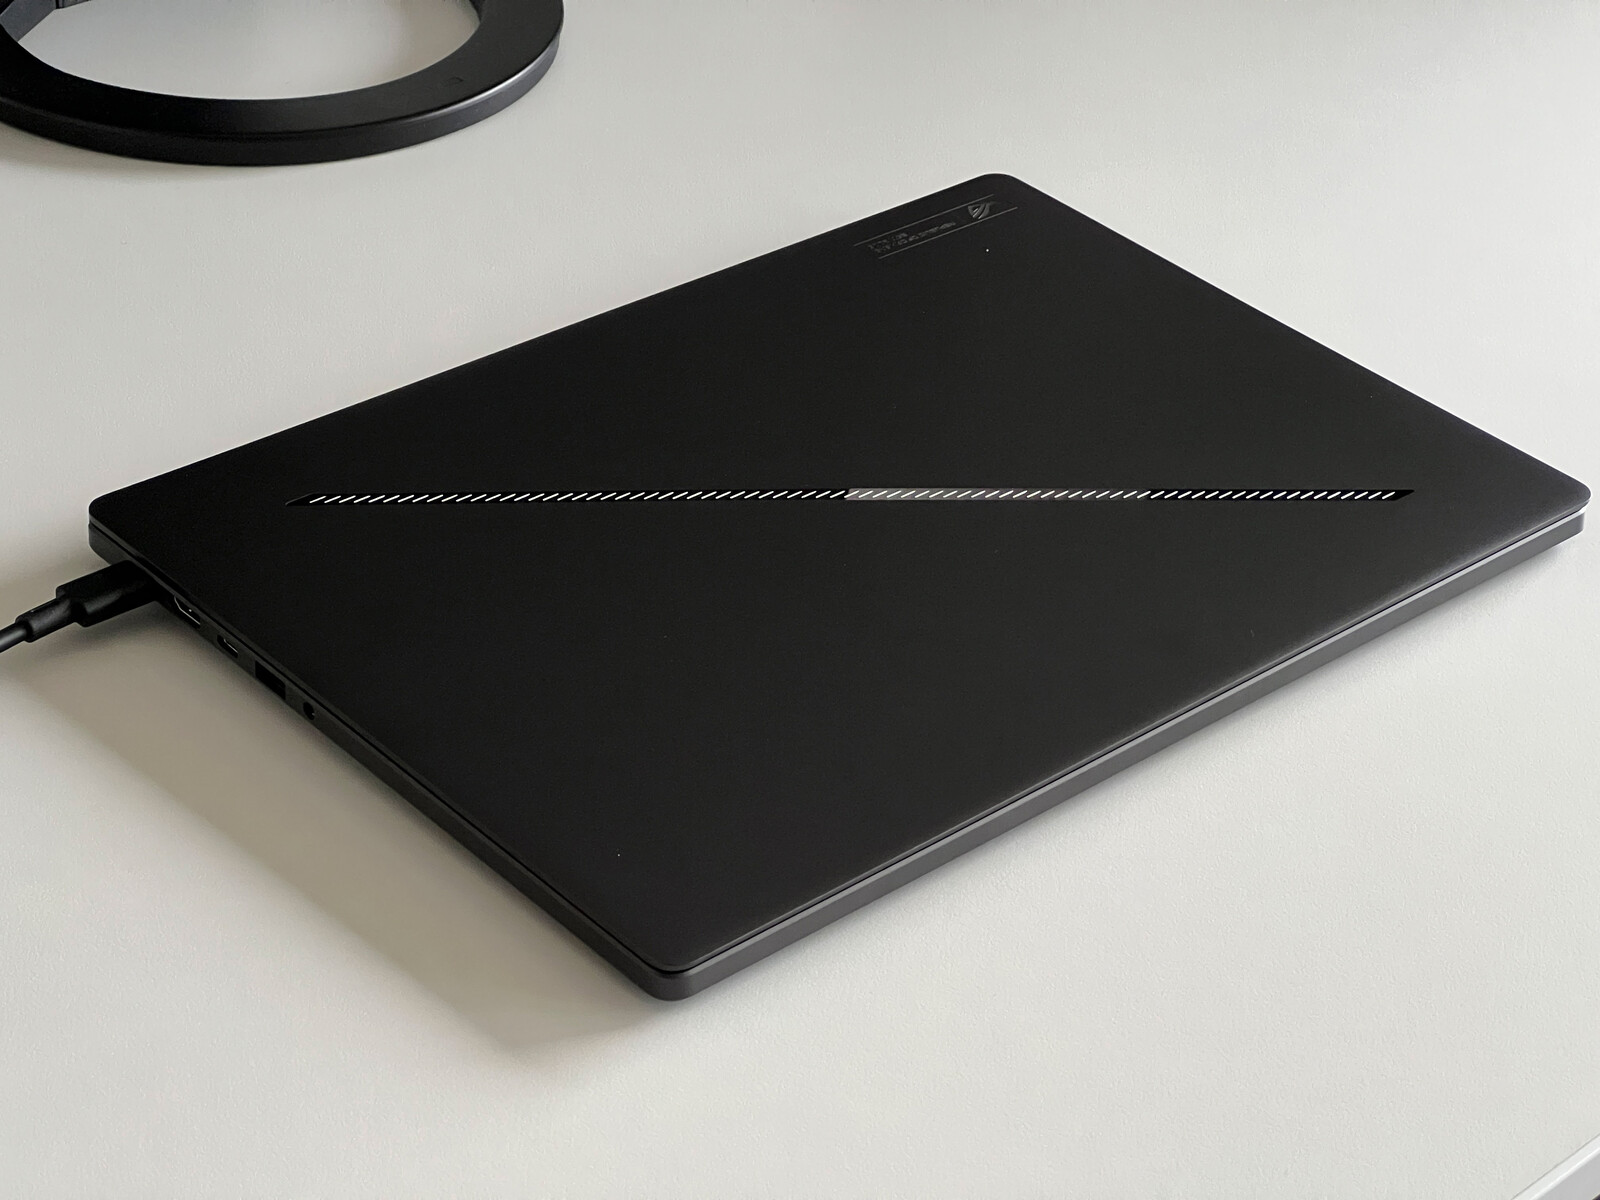
排放 - 带有第三个风扇的 ROG G16
噪音排放
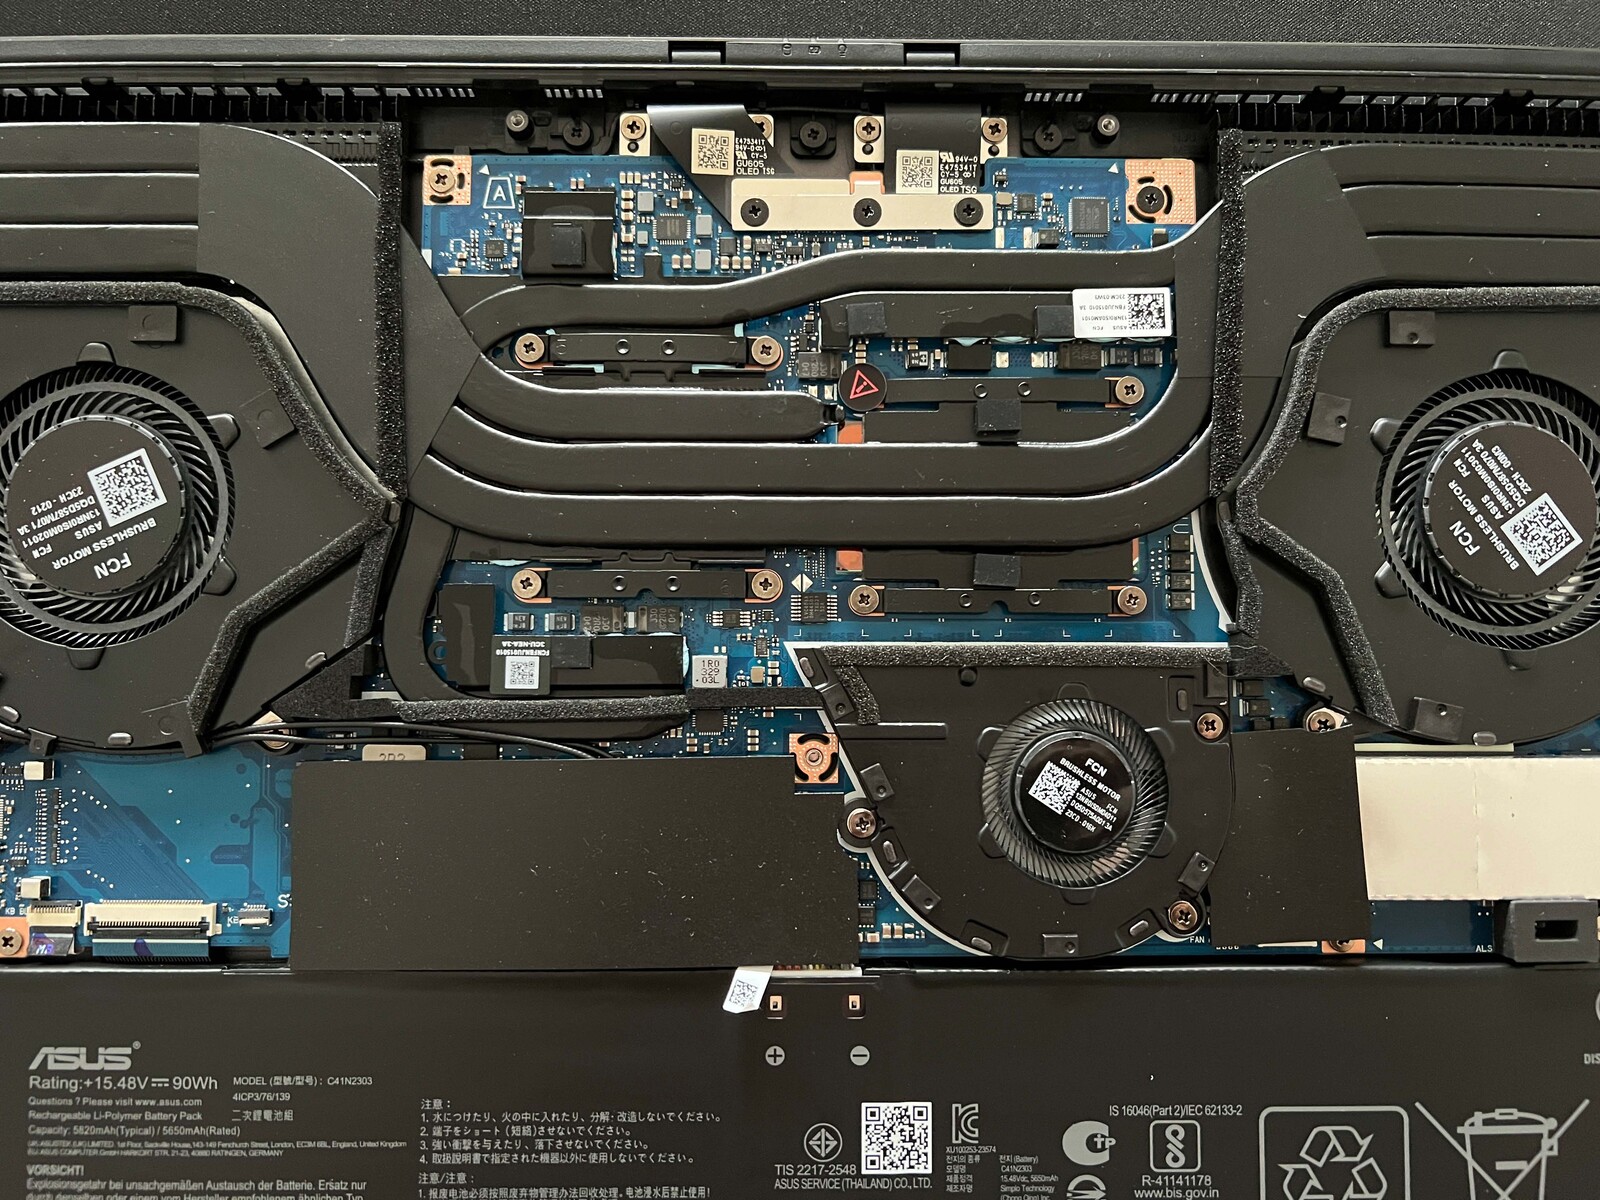
如前所述,配备 RTX 4050/4060/4070 笔记本电脑的机型使用的是传统的热管冷却装置,带有第三个机箱风扇。该风扇通过底部吸入新鲜空气,并将其导向 GPU。但问题是,这个小风扇的转速非常高,运行速度非常快,因此非常明显。总的来说,新款 Zephyrus G16 绝不是一款静音笔记本电脑,即使在日常工作中也是如此,因为风扇很快就会启动。即使在使用静音模式时也是如此。在负载情况下,使用性能模式时很快就会达到约 46 dB(A),虽然听起来很明显,但仍然可以忍受。反过来,从 48 dB(A) 左右开始,风扇发出的噪音会让人很不舒服,因为会有额外的嗡嗡声,因此我们不建议使用涡轮增压模式(最大 52.4 dB(A))。下表显示了使用不同能量曲线时的噪音排放汇总。我们没有注意到测试设备发出任何额外的电子噪音。这些测试结果并不代表配备 RTX 4080/4090 笔记本电脑的机型,因为这些机型使用了两个风扇,包括一个蒸汽腔。我们将尽快测试其中一款机型。
| 能耗曲线 | 3DMark 06 | Witcher 3 | 赛博朋克 2077 自由魅影 | 压力测试 |
|---|---|---|---|---|
| 静音 | 30.4 dB(A) | 38 dB(A) | 41.5 dB(A) | 41.5 dB(A) |
| 性能 | 34.2 dB(A) | 46.4 dB(A) | 46.4 dB(A) | 46.4 dB(A) |
| 涡轮 | 41.5 dB(A) | 52.4 dB(A) | 52.4 dB(A) | 52.4 dB(A) |
Noise level
| Idle |
| 23.9 / 27.8 / 30.1 dB(A) |
| Load |
| 34.2 / 46.4 dB(A) |
 | ||
30 dB silent 40 dB(A) audible 50 dB(A) loud |
||
min: | ||
| Asus ROG Zephyrus G16 2024 GU605M GeForce RTX 4070 Laptop GPU, Ultra 7 155H, WD PC SN560 SDDPNQE-1T00 | Lenovo Yoga Pro 9 16-IRP G8 GeForce RTX 4060 Laptop GPU, i7-13705H, Samsung PM9A1 MZVL21T0HCLR | Razer Blade 16 Early 2023 GeForce RTX 4080 Laptop GPU, i9-13950HX, SSSTC CA6-8D1024 | Gigabyte AERO 16 OLED BSF GeForce RTX 4070 Laptop GPU, i9-13900H, Gigabyte AG470S1TB-SI B10 | Schenker VISION 16 Pro (M23) GeForce RTX 4070 Laptop GPU, i7-13700H, Samsung 990 Pro 1 TB | MSI Stealth 16 Studio A13VG GeForce RTX 4070 Laptop GPU, i7-13700H, Micron 3400 2TB MTFDKBA2T0TFH | Apple MacBook Pro 16 2023 M3 Max M3 Max 40-Core GPU, Apple M3 Max 16-Core, Apple SSD AP8192Z | |
|---|---|---|---|---|---|---|---|
| Noise | -5% | 2% | -11% | -12% | 4% | 5% | |
| off / environment * (dB) | 23.9 | 24.7 -3% | 23 4% | 23 4% | 25.9 -8% | 24 -0% | 23.7 1% |
| Idle Minimum * (dB) | 23.9 | 24.7 -3% | 23 4% | 23 4% | 25.9 -8% | 24 -0% | 23.7 1% |
| Idle Average * (dB) | 27.8 | 26.2 6% | 23 17% | 23 17% | 25.9 7% | 24 14% | 23.7 15% |
| Idle Maximum * (dB) | 30.1 | 26.2 13% | 23.6 22% | 33.64 -12% | 32 -6% | 24 20% | 23.7 21% |
| Load Average * (dB) | 34.2 | 39.7 -16% | 39 -14% | 51.49 -51% | 47.2 -38% | 34.81 -2% | 40.8 -19% |
| Witcher 3 ultra * (dB) | 46.4 | 53.2 -15% | 51.6 -11% | 55.27 -19% | 53.1 -14% | 44.05 5% | 42.8 8% |
| Load Maximum * (dB) | 46.4 | 53.2 -15% | 51.3 -11% | 55.24 -19% | 53.1 -14% | 51.57 -11% | 42.8 8% |
* ... smaller is better
温度
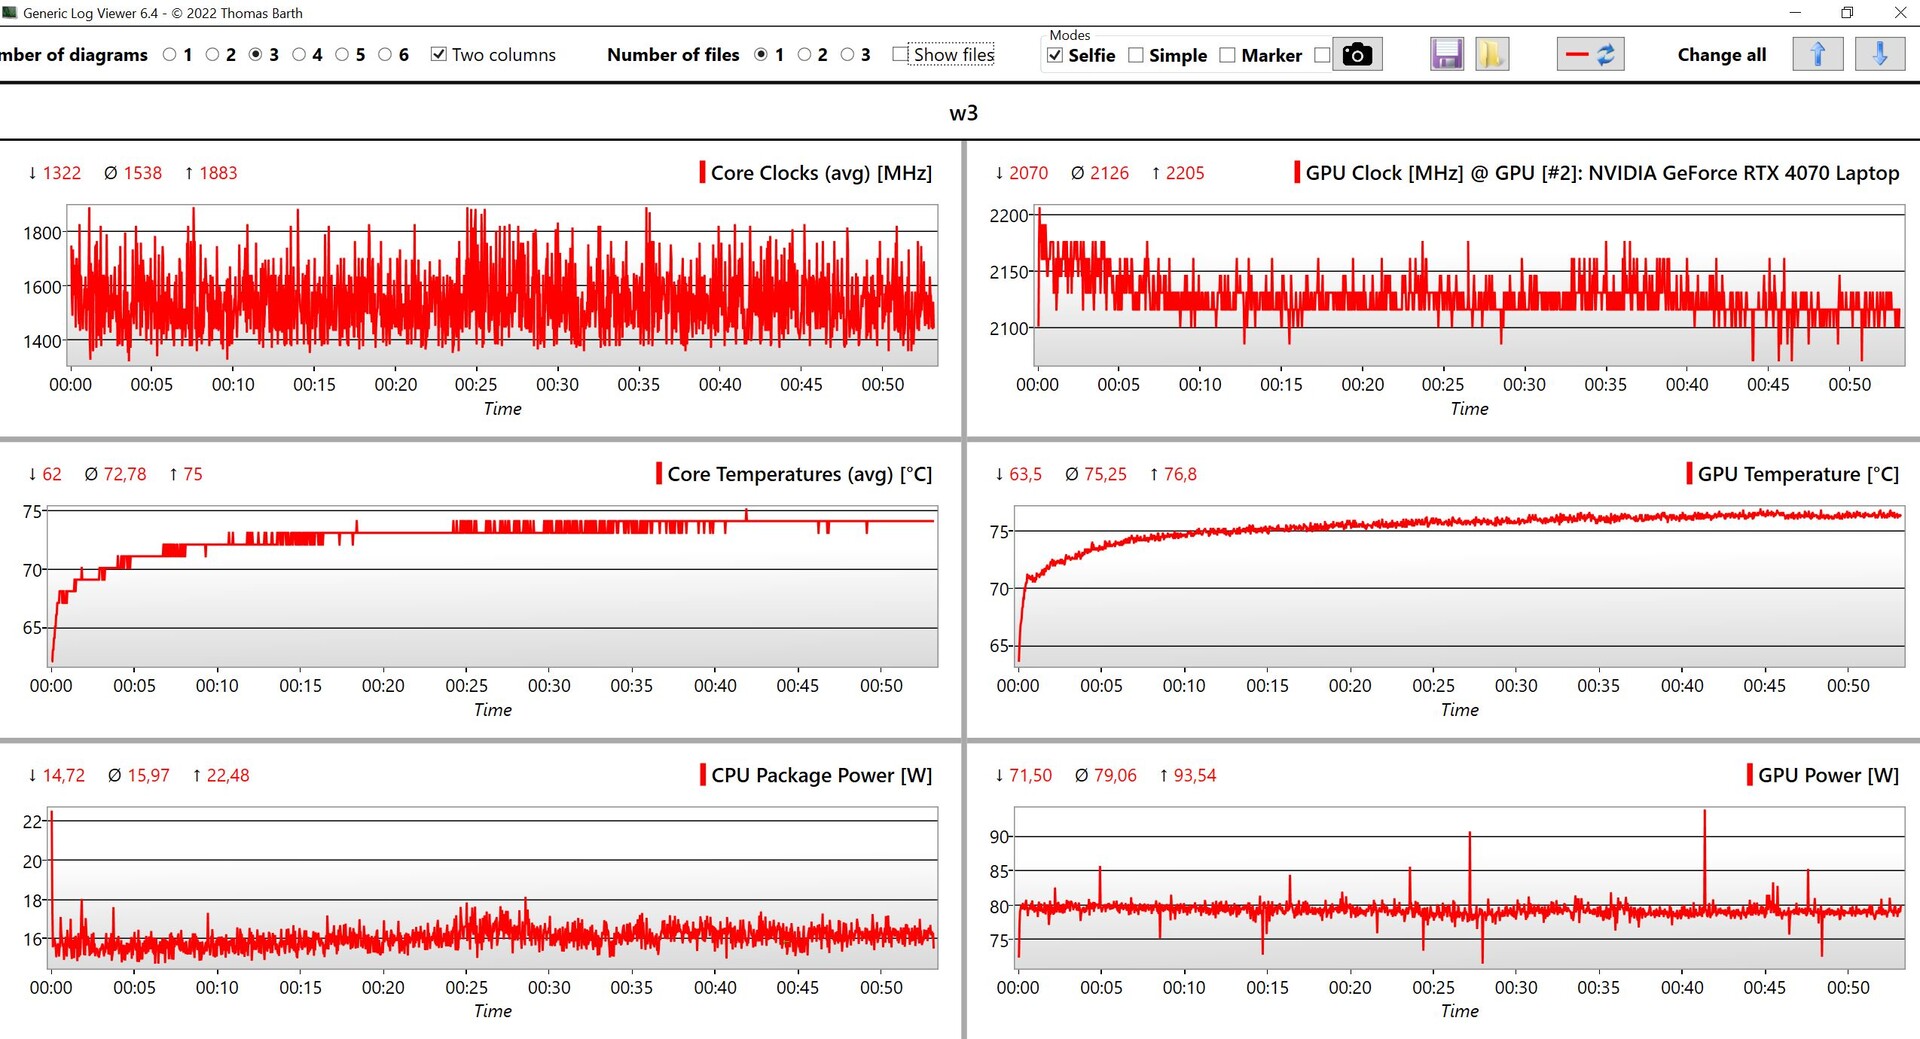
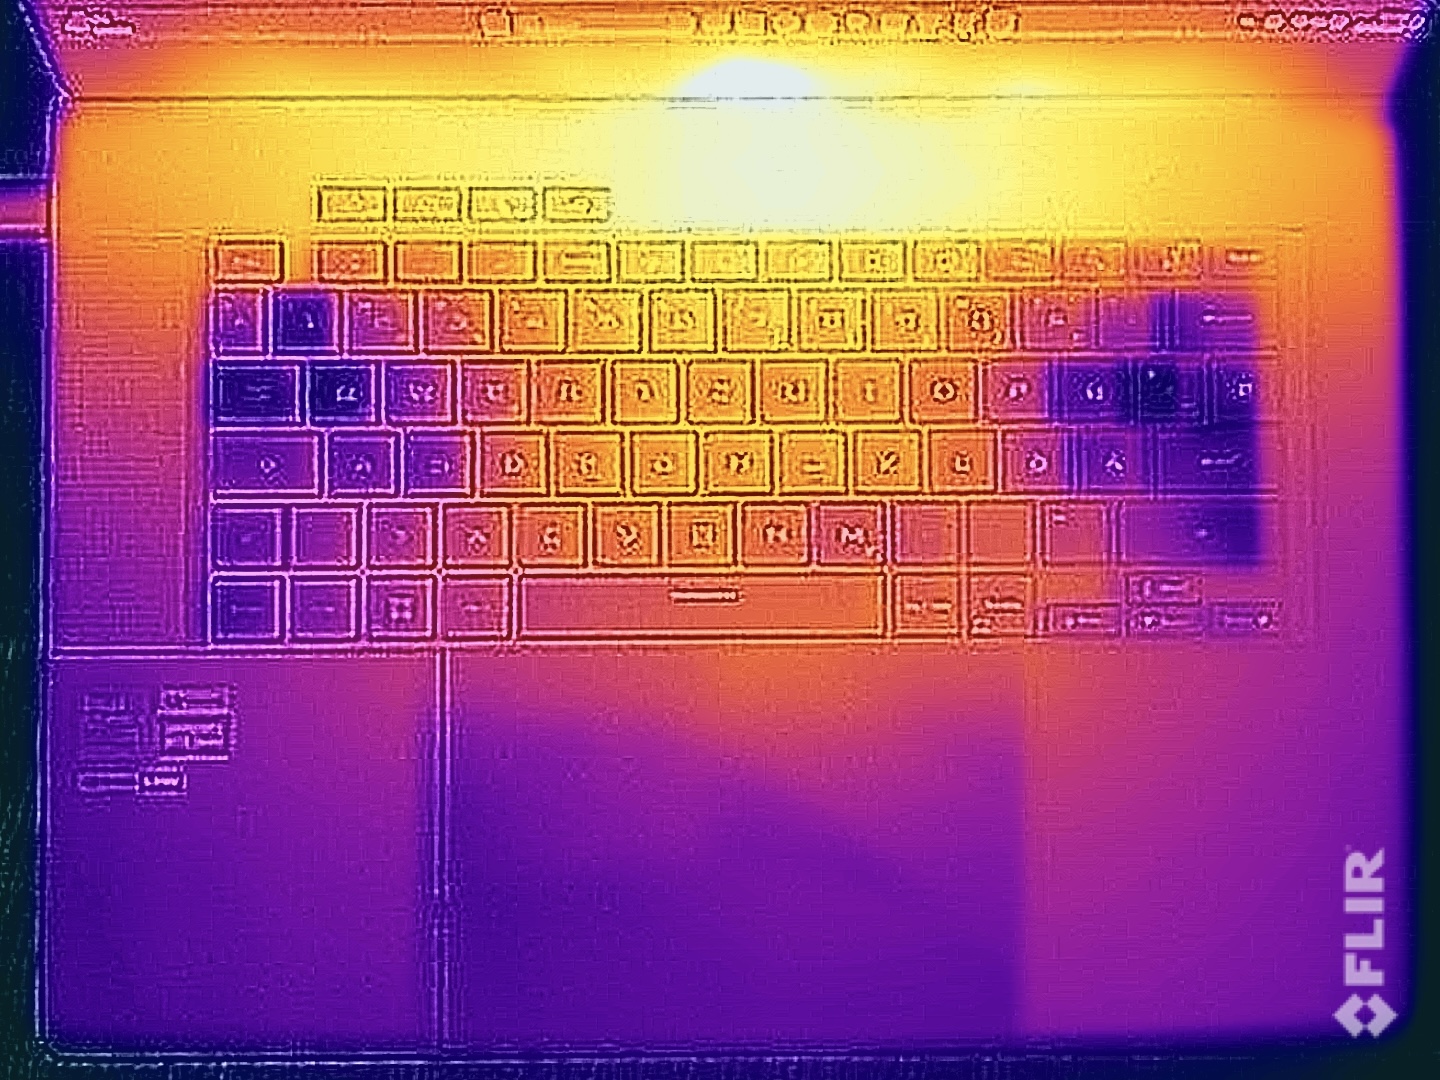
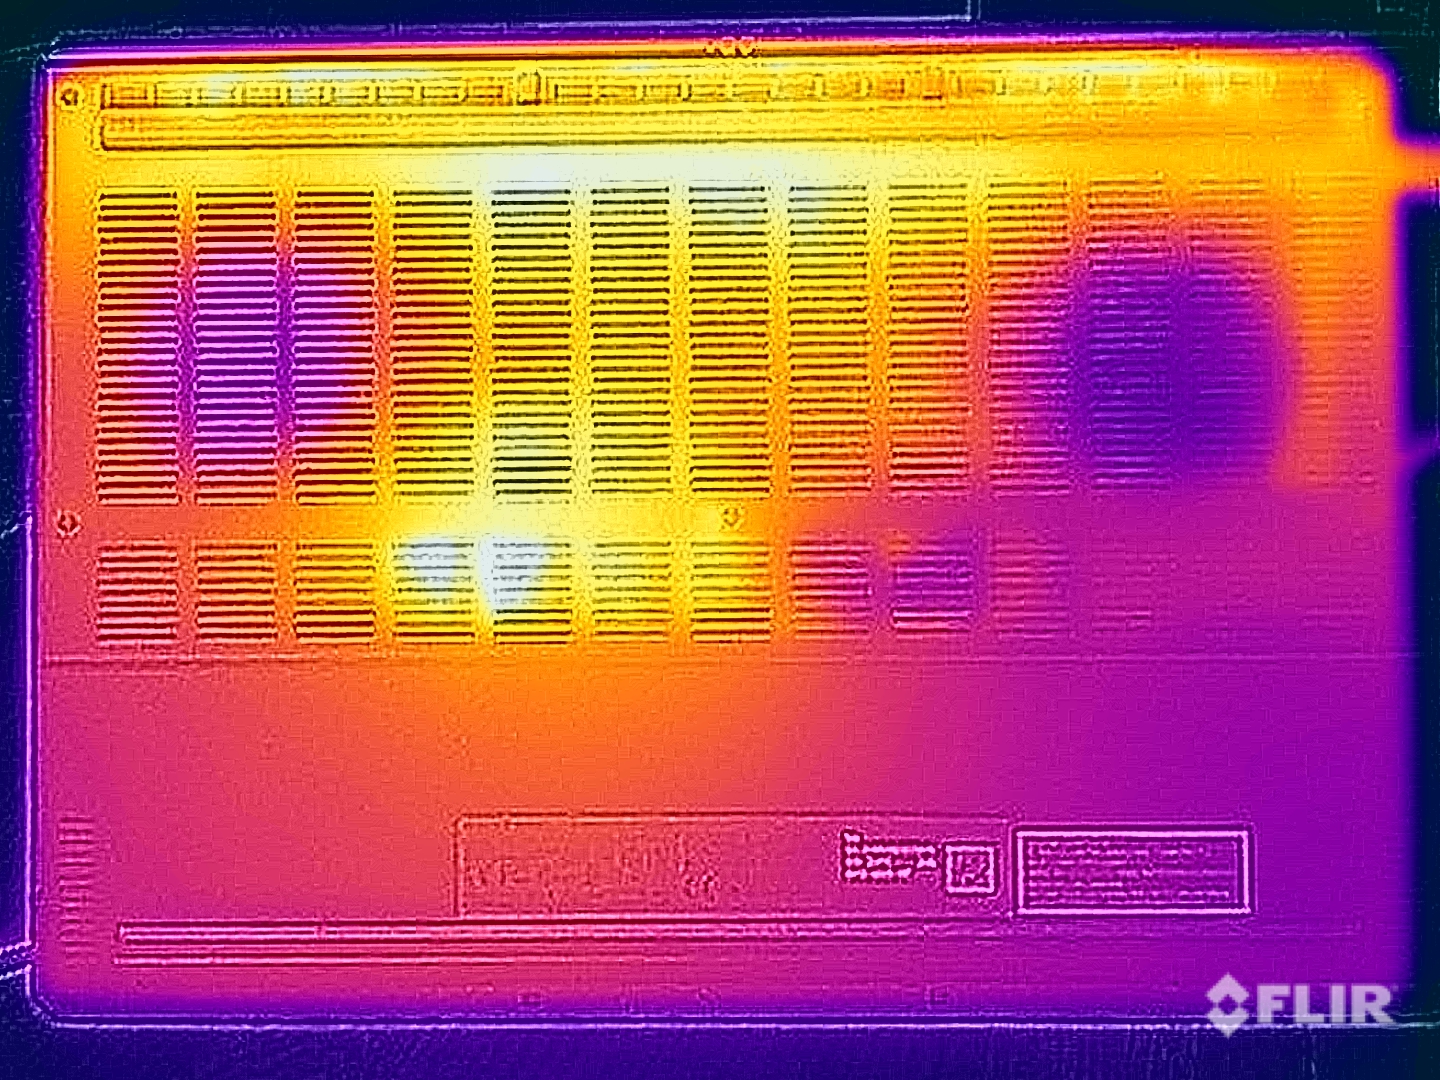
尽管外壳很薄,但 Zephyrus G16 的温度测试结果还是不错的。在执行简单任务时,设备几乎不会发热。在负载情况下,我们在底座顶部测得的温度高达 50 °C,但仅限于键盘上方区域。键盘本身的温度较低,在操作笔记本电脑时不会受到任何限制。在底部,我们测得的温度约为 45-48 °C,因此在这种情况下不要将它放在大腿上。
在压力测试中,CPU 的平衡功耗为 30 瓦,GPU 为 65 瓦,这与华硕提供的配置文件性能完全一致。在静音模式下,我们测得的功率为 30/45 瓦,而在涡轮增压模式下,我们测得的功率为 35+85 瓦。
(-) The maximum temperature on the upper side is 50.3 °C / 123 F, compared to the average of 40.4 °C / 105 F, ranging from 21.2 to 68.8 °C for the class Gaming.
(-) The bottom heats up to a maximum of 48 °C / 118 F, compared to the average of 43.2 °C / 110 F
(+) In idle usage, the average temperature for the upper side is 26.6 °C / 80 F, compared to the device average of 33.9 °C / 93 F.
(±) Playing The Witcher 3, the average temperature for the upper side is 38 °C / 100 F, compared to the device average of 33.9 °C / 93 F.
(+) The palmrests and touchpad are reaching skin temperature as a maximum (32.4 °C / 90.3 F) and are therefore not hot.
(-) The average temperature of the palmrest area of similar devices was 28.8 °C / 83.8 F (-3.6 °C / -6.5 F).
| Asus ROG Zephyrus G16 2024 GU605M Intel Core Ultra 7 155H, NVIDIA GeForce RTX 4070 Laptop GPU | Lenovo Yoga Pro 9 16-IRP G8 Intel Core i7-13705H, NVIDIA GeForce RTX 4060 Laptop GPU | Razer Blade 16 Early 2023 Intel Core i9-13950HX, NVIDIA GeForce RTX 4080 Laptop GPU | Gigabyte AERO 16 OLED BSF Intel Core i9-13900H, NVIDIA GeForce RTX 4070 Laptop GPU | Schenker VISION 16 Pro (M23) Intel Core i7-13700H, NVIDIA GeForce RTX 4070 Laptop GPU | MSI Stealth 16 Studio A13VG Intel Core i7-13700H, NVIDIA GeForce RTX 4070 Laptop GPU | Apple MacBook Pro 16 2023 M3 Max Apple M3 Max 16-Core, Apple M3 Max 40-Core GPU | |
|---|---|---|---|---|---|---|---|
| Heat | 7% | 6% | 16% | 3% | -27% | 18% | |
| Maximum Upper Side * (°C) | 50.3 | 41.6 17% | 40 20% | 41 18% | 46.7 7% | 60 -19% | 42.3 16% |
| Maximum Bottom * (°C) | 48 | 50 -4% | 37.6 22% | 47 2% | 54.1 -13% | 61 -27% | 42 12% |
| Idle Upper Side * (°C) | 28.8 | 26.8 7% | 32.4 -13% | 23 20% | 26.5 8% | 38.2 -33% | 22.5 22% |
| Idle Bottom * (°C) | 29.8 | 27.9 6% | 31.4 -5% | 23 23% | 26.8 10% | 37.7 -27% | 22.9 23% |
* ... smaller is better
发言人
华硕在 ROG Zephyrus G16 上安装了一套带有 6 个模块(4 个低音扬声器,每个 2 瓦;2 个高音扬声器,每个 2 瓦)的音响系统。效果非常出色,与 MacBook Pro 16差不多。多媒体竞争对手,如出色的 联想 Yoga Pro 9 16华硕在这方面也不落下风。它的音效非常强大,空间感很强,各模块的声音可以非常响亮,而且不会太失真。这意味着,即使使用性能模式,你仍然可以轻松地通过扬声器播放声音。总而言之,它的表现非常出色。
Asus ROG Zephyrus G16 2024 GU605M audio analysis
(+) | speakers can play relatively loud (83.3 dB)
Bass 100 - 315 Hz
(+) | good bass - only 3.8% away from median
(±) | linearity of bass is average (8.1% delta to prev. frequency)
Mids 400 - 2000 Hz
(+) | balanced mids - only 3.5% away from median
(+) | mids are linear (2.4% delta to prev. frequency)
Highs 2 - 16 kHz
(+) | balanced highs - only 2.2% away from median
(+) | highs are linear (3.7% delta to prev. frequency)
Overall 100 - 16.000 Hz
(+) | overall sound is linear (7.3% difference to median)
Compared to same class
» 1% of all tested devices in this class were better, 0% similar, 99% worse
» The best had a delta of 6%, average was 18%, worst was 132%
Compared to all devices tested
» 1% of all tested devices were better, 0% similar, 99% worse
» The best had a delta of 4%, average was 24%, worst was 134%
Lenovo Yoga Pro 9 16-IRP G8 audio analysis
(±) | speaker loudness is average but good (80.5 dB)
Bass 100 - 315 Hz
(+) | good bass - only 4.9% away from median
(±) | linearity of bass is average (9.1% delta to prev. frequency)
Mids 400 - 2000 Hz
(+) | balanced mids - only 3.2% away from median
(+) | mids are linear (6.5% delta to prev. frequency)
Highs 2 - 16 kHz
(+) | balanced highs - only 2.9% away from median
(+) | highs are linear (3% delta to prev. frequency)
Overall 100 - 16.000 Hz
(+) | overall sound is linear (8.4% difference to median)
Compared to same class
» 9% of all tested devices in this class were better, 2% similar, 89% worse
» The best had a delta of 5%, average was 17%, worst was 45%
Compared to all devices tested
» 2% of all tested devices were better, 1% similar, 97% worse
» The best had a delta of 4%, average was 24%, worst was 134%
Apple MacBook Pro 16 2023 M3 Max audio analysis
(+) | speakers can play relatively loud (84.3 dB)
Bass 100 - 315 Hz
(±) | reduced bass - on average 5% lower than median
(+) | bass is linear (5.6% delta to prev. frequency)
Mids 400 - 2000 Hz
(+) | balanced mids - only 1.2% away from median
(+) | mids are linear (3.1% delta to prev. frequency)
Highs 2 - 16 kHz
(+) | balanced highs - only 2.4% away from median
(+) | highs are linear (2.4% delta to prev. frequency)
Overall 100 - 16.000 Hz
(+) | overall sound is linear (5.3% difference to median)
Compared to same class
» 1% of all tested devices in this class were better, 1% similar, 98% worse
» The best had a delta of 5%, average was 17%, worst was 45%
Compared to all devices tested
» 0% of all tested devices were better, 0% similar, 100% worse
» The best had a delta of 4%, average was 24%, worst was 134%
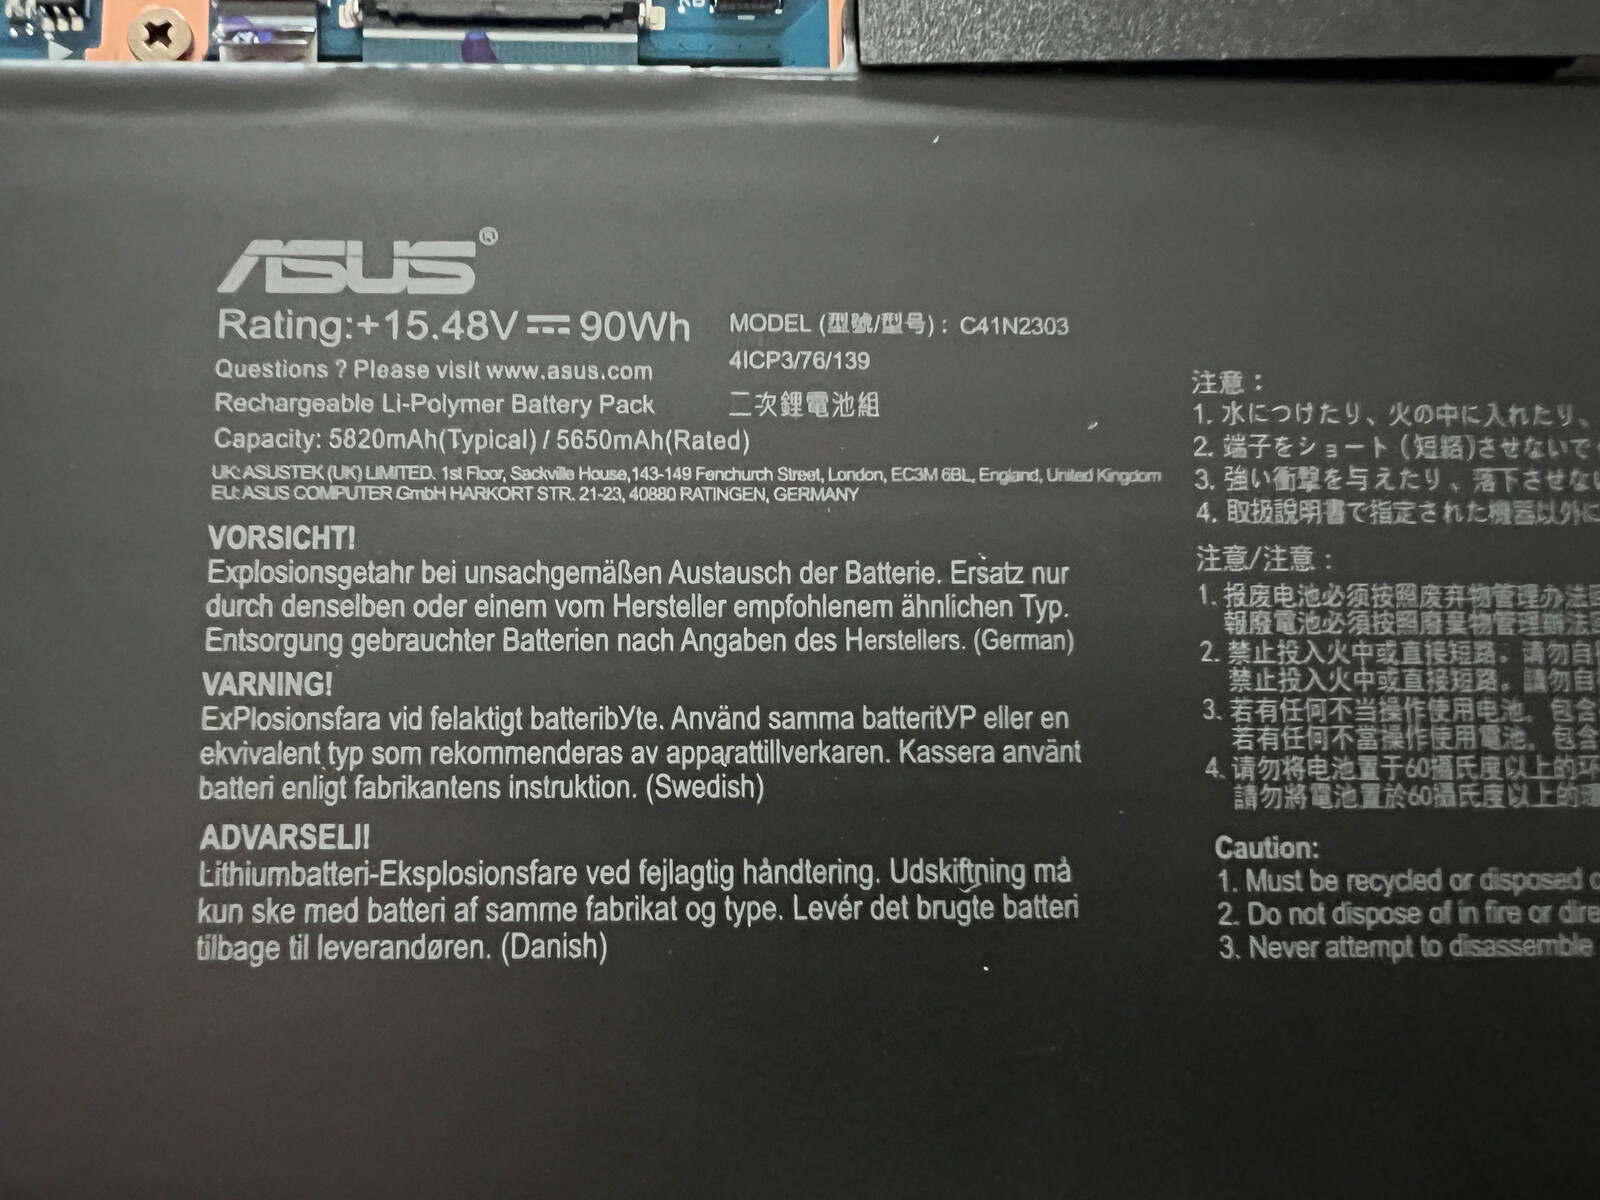
电源管理 - 90 瓦时的电池可提供出色的运行时间
耗电量
笔记本电脑的功耗测量结果并不那么令人吃惊,尽管测试设备在空闲测量期间特别受益于深色标准壁纸。与 OLED 显示屏的典型情况一样,耗电量因显示的内容而异,浅色图像耗电量更大。在游戏过程中,我们注意到耗电量为 120 瓦,而在压力测试中,它的耗电量在短时间内达到了 170 瓦,但很快又平衡到了 165 瓦。因此,我们可以肯定地说,200 瓦的电源绰绰有余;配备 RTX 4080/4090 笔记本电脑的配置提供了更强劲的 240 瓦电源。
| Off / Standby | |
| Idle | |
| Load |
|
Key:
min: | |
| Asus ROG Zephyrus G16 2024 GU605M Ultra 7 155H, GeForce RTX 4070 Laptop GPU, WD PC SN560 SDDPNQE-1T00, OLED, 2560x1600, 16" | Lenovo Yoga Pro 9 16-IRP G8 i7-13705H, GeForce RTX 4060 Laptop GPU, Samsung PM9A1 MZVL21T0HCLR, Mini-LED, 3200x2000, 16" | Razer Blade 16 Early 2023 i9-13950HX, GeForce RTX 4080 Laptop GPU, SSSTC CA6-8D1024, IPS, 2560x1600, 16" | Gigabyte AERO 16 OLED BSF i9-13900H, GeForce RTX 4070 Laptop GPU, Gigabyte AG470S1TB-SI B10, OLED, 3840x2400, 16" | Schenker VISION 16 Pro (M23) i7-13700H, GeForce RTX 4070 Laptop GPU, Samsung 990 Pro 1 TB, IPS, 2560x1600, 16" | MSI Stealth 16 Studio A13VG i7-13700H, GeForce RTX 4070 Laptop GPU, Micron 3400 2TB MTFDKBA2T0TFH, IPS, 2560x1600, 16" | Apple MacBook Pro 16 2023 M3 Max Apple M3 Max 16-Core, M3 Max 40-Core GPU, Apple SSD AP8192Z, Mini-LED, 3456x2234, 16" | Average NVIDIA GeForce RTX 4070 Laptop GPU | Average of class Gaming | |
|---|---|---|---|---|---|---|---|---|---|
| Power Consumption | -41% | -113% | -31% | -5% | -32% | -5% | -53% | -60% | |
| Idle Minimum * (Watt) | 8.3 | 10.9 -31% | 15.2 -83% | 11.8 -42% | 8.6 -4% | 11 -33% | 5.2 37% | 13.2 ? -59% | 13.1 ? -58% |
| Idle Average * (Watt) | 12.5 | 22.6 -81% | 22.8 -82% | 16.1 -29% | 12 4% | 18 -44% | 16.9 -35% | 18.2 ? -46% | 18.8 ? -50% |
| Idle Maximum * (Watt) | 12.8 | 23.5 -84% | 49.8 -289% | 17 -33% | 12.4 3% | 19 -48% | 17.2 -34% | 24.6 ? -92% | 24.4 ? -91% |
| Load Average * (Watt) | 71.3 | 84.6 -19% | 121.2 -70% | 100.6 -41% | 80 -12% | 91 -28% | 90.5 -27% | 97 ? -36% | 108.5 ? -52% |
| Witcher 3 ultra * (Watt) | 127.5 | 159.5 -25% | 242 -90% | 158 -24% | 147.7 -16% | 130 -2% | 109 15% | ||
| Load Maximum * (Watt) | 169.1 | 177.3 -5% | 273.7 -62% | 192 -14% | 173.1 -2% | 228 -35% | 145.2 14% | 221 ? -31% | 254 ? -50% |
* ... smaller is better
Power consumption Witcher 3 / stress test
Power consumption with external monitor
运行时间
华硕笔记本电脑配备了 90 瓦时的大容量电池,与 Windows 对比设备相比,它的总运行时间非常出色。 MacBook Pro 16遥遥领先。在 Armoury Crate 软件中,刷新率被设置为电池模式下的 60 Hz,这也是我们使用这些值进行比较的原因(我们将很快添加 240 Hz 的值)。在 WLAN 测试中,由于许多网站的亮度较高,对于 OLED 面板来说往往不是最佳状态,我们注意到在 150 cd/m²(最大亮度的 57%)下的运行时间为 07:15 小时,在全亮度下的运行时间为 05:45 小时。在 150 cd/m² 的视频测试中,其 11 小时多一点的成绩要好得多。看来新的 Arc iGPU(或其视频解码器)在这方面的运行效率非常高,因为其他 Meteor-Lake 测试设备的良好运行时间在视频测试中也非常突出(例如 Zenbook 14 OLED 或 Spectre x360 14--评测即将发布)。如果以最大亮度播放 HDR 视频,其运行时间约为 7.5 小时,但这自然也与 HDR 亮度有限有关。在设备开启的情况下,充满一次电需要 112 分钟,其中约 35 分钟后可获得 60% 的电量,50 分钟后可获得 80% 的电量。
| Asus ROG Zephyrus G16 2024 GU605M Ultra 7 155H, GeForce RTX 4070 Laptop GPU, 90 Wh | Lenovo Yoga Pro 9 16-IRP G8 i7-13705H, GeForce RTX 4060 Laptop GPU, 75 Wh | Razer Blade 16 Early 2023 i9-13950HX, GeForce RTX 4080 Laptop GPU, 95.2 Wh | Gigabyte AERO 16 OLED BSF i9-13900H, GeForce RTX 4070 Laptop GPU, 88 Wh | Schenker VISION 16 Pro (M23) i7-13700H, GeForce RTX 4070 Laptop GPU, 80 Wh | MSI Stealth 16 Studio A13VG i7-13700H, GeForce RTX 4070 Laptop GPU, 99.9 Wh | Apple MacBook Pro 16 2023 M3 Max Apple M3 Max 16-Core, M3 Max 40-Core GPU, 99.6 Wh | Average of class Gaming | |
|---|---|---|---|---|---|---|---|---|
| Battery runtime | -29% | 1% | 15% | -5% | 25% | 70% | -2% | |
| H.264 (h) | 11.2 | 7.5 -33% | 7.4 -34% | 7.8 -30% | 7.7 -31% | 20.4 82% | 8.26 ? -26% | |
| WiFi v1.3 (h) | 7.3 | 6.4 -12% | 6.1 -16% | 7.5 3% | 7.8 7% | 7.8 7% | 16.7 129% | 6.98 ? -4% |
| Load (h) | 1.2 | 0.7 -42% | 1.4 17% | 2.1 75% | 1.3 8% | 2.4 100% | 1.2 0% | 1.47 ? 23% |
Pros
Cons
结论 - 全新 ROG Zephyrus G16 是一款出色的游戏/多媒体混合型产品
华硕调整了新款 ROG Zephyrus G16 的设计理念,旨在吸引更多的用户。在我们看来,该制造商的这一做法是成功的,因为其新推出的 2024 机型是一款品质极高、小巧轻便的 16 英寸笔记本电脑,配备了铝合金外壳、令人印象深刻的扬声器、出色的输入设备和出色的 OLED 面板。由于最大亮度有限,OLED 面板在 HDR 功能方面无法与竞争对手相提并论。即便如此,电影和游戏在 240-Hz OLED 屏幕上看起来还是很不错的,游戏玩家也会对它的快速响应时间和 G-Sync 支持感到满意。此外,华硕还是唯一一家提供软件解决方案的厂商,可以在不触及潜在有害 PWM 区域的情况下对显示屏进行调光。
虽然新的 Meteor-Lake 处理器与旧的 Raptor-Lake 处理器相比并没有真正提高性能,而且其单核性能实际上更差,但其组件的性能也不错。新移动处理器的实际优势--新的 Arc iGPU--在这种情况下并没有带来多少优势,因为设备中安装了专用的 Nvidia GPU。
优质轻巧的铝制外壳、出色的 OLED 显示屏和出色的扬声器:得益于其强大的硬件,新款 ROG Zephyrus G16 当然仍能描绘当前的游戏,但华硕的 2024 机型更倾向于高端多媒体。因此,即使你没有任何游戏方面的野心,新款 Zephyrus G16 依然值得一看。
我们最大的问题在于笔记本电脑的散热,因为 G16 只有在最罕见的情况下才能保持真正的静音,此外,其附加系统风扇的转速也非常高。同样令人遗憾的是,只有配备 RTX 4080/4090 的两个版本的笔记本电脑才能享受到更强大的 Vapor-Chamber 冷却系统,这将导致完全不同的风扇行为,CPU 也将从更高的功率限制中获益。该设备的焊接式内存是另一个缺点,尤其是考虑到我们的测试样品仅安装了 16 GB 内存。对于近 3000 美元的起售价,华硕确实应该标配 32 GB 内存。
新款 ROG Zephyrus G16 最大的竞争对手肯定是Razer Blade 16 ,我们对新款 2024(同样采用三星 OLED)的评测即将发布。说到多媒体设备,Lenovo Yoga Pro 9i 16 或Apple MacBook Pro 16 是其最大的竞争对手,不过,这些设备只能提供有限的游戏功能。
价格和供应情况
新款 ROG Zephyrus G16 将于 2024 年 2 月 15 日开始发售,个别配置已经上市。价格从$2,899.99 美元起。.
Asus ROG Zephyrus G16 2024 GU605M
- 02/04/2024 v7 (old)
Andreas Osthoff
Transparency
The selection of devices to be reviewed is made by our editorial team. The test sample was provided to the author as a loan by the manufacturer or retailer for the purpose of this review. The lender had no influence on this review, nor did the manufacturer receive a copy of this review before publication. There was no obligation to publish this review. As an independent media company, Notebookcheck is not subjected to the authority of manufacturers, retailers or publishers.
This is how Notebookcheck is testing
Every year, Notebookcheck independently reviews hundreds of laptops and smartphones using standardized procedures to ensure that all results are comparable. We have continuously developed our test methods for around 20 years and set industry standards in the process. In our test labs, high-quality measuring equipment is utilized by experienced technicians and editors. These tests involve a multi-stage validation process. Our complex rating system is based on hundreds of well-founded measurements and benchmarks, which maintains objectivity. Further information on our test methods can be found here.
Price comparison

