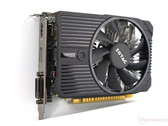
Notebookcheck Logo

NVIDIA GeForce GTX 1050 (Desktop)

NVIDIA GeForce GTX 1050 (Desktop)

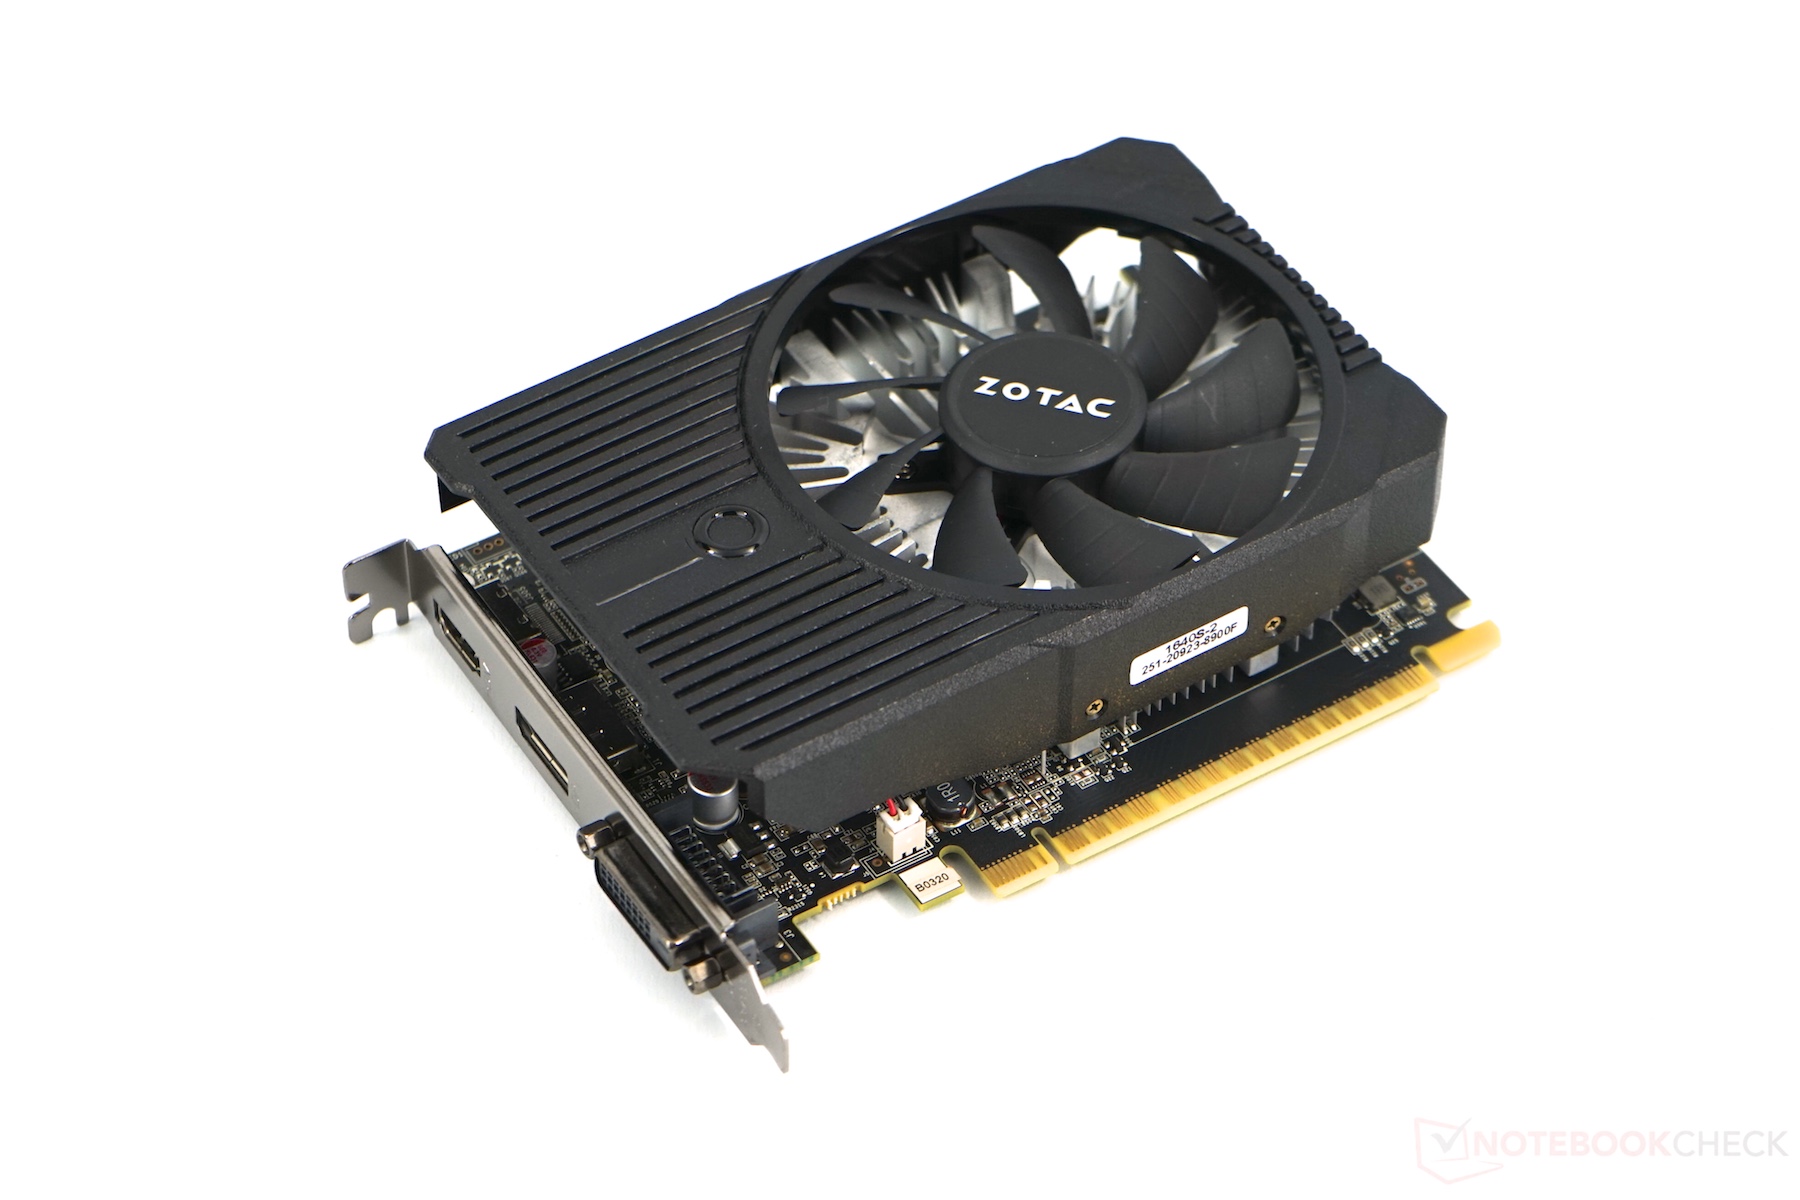
GeForce GTX 1050是英伟达基于帕斯卡架构桌面式芯片的入门级显卡。它使用和GTX 1050 Ti相同的GP107芯片,但只有640个着色器而非768个。该芯片采用14纳米制程技术(1060和更高端的帕斯卡架构芯片采用16个纳米制程技术由TSCM制造)由三星制造。它的性能和规格应类似将稍晚发布(2017年初)的GTX 1050笔记本电脑版。相比于GTX 1050 Ti,1050搭配了较少的着色器(640而非768),只有2 GB GDDR5显存(而非1050 Ti的4 GB)。

1050 GTX在游戏测试中相比2 GB显存版Radeon RX 460约快30%。RX 460的4 GB版本相比应较慢约10%,较老的GTX 950应该可以达到和新的GTX 1050相似的性能水平。因此,GTX 1050应该可以在高细节设置(但不是最高设置)和1080p分辨率流畅运行游戏。

GeForce GTX 1000 Series

GeForce GTX 1080 Ti 3584 @ 1.48 - 1.6 GHz352 Bit @ 11000 MHz
GeForce GTX 1080 SLI (Laptop) 5120 @ 1.56 - 1.73 GHz256 Bit @ 10000 MHz
GeForce GTX 1070 SLI (Desktop) 3840 @ 1.51 - 1.68 GHz256 Bit @ 8000 MHz
GeForce GTX 1070 SLI (Laptop) 4096 @ 1.44 - 1.65 GHz256 Bit @ 8000 MHz
GeForce GTX 1080 (Desktop) 2560 @ 1.61 - 1.73 GHz256 Bit @ 10000 MHz
GeForce GTX 1080 Mobile 2560 @ 1.57 - 1.73 GHz256 Bit @ 10000 MHz
GeForce GTX 1070 Ti (Desktop) 2432 @ 1.61 - 1.68 GHz256 Bit @ 8000 MHz
GeForce GTX 1070 (Desktop) 1920 @ 1.51 - 1.68 GHz256 Bit @ 8000 MHz
GeForce GTX 1080 Max-Q 2560 @ 1.1 - 1.28 GHz256 Bit @ 10000 MHz
GeForce GTX 1070 Mobile 2048 @ 1.44 - 1.65 GHz256 Bit @ 8000 MHz
GeForce GTX 1070 Max-Q 2048 @ 1.1 - 1.27 GHz256 Bit @ 8000 MHz
GeForce GTX 1060 (Desktop) 1280 @ 1.51 - 1.71 GHz192 Bit @ 8000 MHz
GeForce GTX 1060 Mobile 1280 @ 1.4 - 1.67 GHz192 Bit @ 8000 MHz
GeForce GTX 1060 Max-Q 1280 @ 1.06 - 1.34 GHz192 Bit @ 8000 MHz
GeForce GTX 1050 Ti Mobile 768 @ 1.49 - 1.62 GHz128 Bit @ 7000 MHz
GeForce GTX 1050 Ti (Desktop) 768 @ 1.29 - 1.39 GHz128 Bit @ 7008 MHz
GeForce GTX 1050 Ti Max-Q 768 @ 1.15 - 1.29 GHz128 Bit @ 7000 MHz
GeForce GTX 1050 (Desktop) 640 @ 1.35 - 1.46 GHz128 Bit @ 7008 MHz
GeForce GTX 1050 Mobile 640 @ 1.35 - 1.49 GHz128 Bit @ 7000 MHz
GeForce GTX 1050 Max-Q 640 @ 1 - 1.14 GHz128 Bit @ 7000 MHz
GeForce GT 1030 (Desktop) 384 @ 1.23 - 1.67 GHz64 Bit @ 6000 MHz
CodenameN17P-G1
ArchitecturePascal
Pipelines640 - unified
Core Speed1354 - 1455 (Boost) MHz
Memory Speed7008 MHz
Memory Bus Width128 Bit
Memory TypeGDDR5
Max. Amount of Memory2048 MB
Shared Memoryno
APIDirectX 12_1, OpenGL 4.5
technology14 nm
FeaturesMulti-Projection, VR Ready, G-SYNC, Vulkan, Multi Monitor
Date of Announcement25.10.2016

Benchmarks

3DMark - 3DMark Time Spy Score
1984 Points (6%)
3DMark - 3DMark Time Spy Graphics
1797 Points (5%)
112 -94%
...
1494 -17%
AMD Radeon Pro 560X
1614 -10%
NVIDIA GeForce GTX 1050 Max-Q
1615 -10%
1672 -7%
1724 -4%
1731 -4%
Intel Iris Xe MAX Graphics
1735 -3%
AMD Radeon RX 560X (Laptop)
1788 -1%
1796 0%
NVIDIA GeForce GTX 1050 (Desktop)
1797
1810 1%
NVIDIA T500 Laptop GPU
1814 1%
1890 5%
2021 12%
NVIDIA Quadro P2000
2046 14%
NVIDIA Quadro P2000 Max-Q
2049 14%
AMD Radeon Pro WX Vega M GL
2062 15%
2068 15%
2070 15%
...
36485 1930%
0%
100%
3DMark - 3DMark Ice Storm Unlimited Graphics
349683 Points (40%)
3DMark - 3DMark Cloud Gate Score
21461 Points (23%)
3DMark - 3DMark Cloud Gate Graphics
40922 Points (11%)
3DMark - 3DMark Fire Strike Standard Score
6122 Points (11%)
3DMark - 3DMark Fire Strike Standard Graphics
6797 Points (8%)
3DMark 11 - 3DM11 Performance Score
8817 Points (12%)
3DMark 11 - 3DM11 Performance GPU
8571 Points (7%)
171.8 -98%
...
Intel Iris Xe MAX Graphics
8133 -5%
NVIDIA Quadro P2000 Max-Q
8148 -5%
NVIDIA Quadro M3000M
8289 -3%
AMD Radeon RX 560 (Laptop)
8323 -3%
NVIDIA GeForce GTX 950
8351 -3%
NVIDIA Quadro P2000
8387 -2%
8415 -2%
AMD Radeon R7 370
8519 -1%
8553 0%
NVIDIA GeForce GTX 1050 (Desktop)
8571
8597 0%
AMD Radeon R9 M395
8656 1%
NVIDIA T600
8694 1%
NVIDIA GeForce GTX 1050 Ti Max-Q
8781 2%
AMD Radeon R9 M295X
8851 3%
NVIDIA GeForce GTX 590
9167 7%
9448 10%
9453 10%
NVIDIA GeForce GTX 770M SLI
9569 12%
...
106023 1137%
0%
100%
3DMark Vantage
3DM Vant. Perf. total +
3DMark Vantage - 3DM Vant. Perf. total
32463 Points (9%)
3DM Vant. Perf. GPU no PhysX +
3DMark Vantage - 3DM Vant. Perf. GPU no PhysX
32494 Points (18%)
ATI Radeon HD 3200
62 -100%
...
NVIDIA Quadro P2000 Max-Q
30786 -5%
31181 -4%
NVIDIA Quadro P2000
31451 -3%
NVIDIA GeForce GTX 590
31597 -3%
31800 -2%
NVIDIA GeForce GTX 960
32171 -1%
NVIDIA GeForce GTX 1050 Ti Mobile
32349 0%
32473 0%
32473 0%
NVIDIA GeForce GTX 1050 (Desktop)
32494
33025 2%
33179 2%
33321 3%
33740 4%
33810 4%
34450 6%
34680 7%
34951 8%
35209 8%
...
170928 426%
0%
100%
3DMark 2001SE - 3DMark 2001 - Standard
96234 Points (100%)
3DMark 06 3DMark 06 - Standard 1280x1024 +
3DMark 06
min: 28000     avg: 30921     median: 29795 (39%)     max: 36095 Points
Unigine Valley 1.0 - Unigine Valley 1.0 DX
37.6 fps (12%)
Unigine Heaven 3.0 - Unigine Heaven 3.0 DX 11
88.3 fps (29%)
SPECviewperf 12
specvp12 sw-03 +
SPECviewperf 12 - specvp12 sw-03
37.8 fps (9%)
specvp12 snx-02 +
SPECviewperf 12 - specvp12 snx-02
4.7 fps (1%)
specvp12 showcase-01 +
SPECviewperf 12 - specvp12 showcase-01
29.3 fps (6%)
specvp12 mediacal-01 +
SPECviewperf 12 - specvp12 mediacal-01
17.5 fps (4%)
specvp12 maya-04 +
SPECviewperf 12 - specvp12 maya-04
57.8 fps (16%)
specvp12 energy-01 +
SPECviewperf 12 - specvp12 energy-01
0.8 fps (1%)
specvp12 creo-01 +
SPECviewperf 12 - specvp12 creo-01
18.2 fps (7%)
specvp12 catia-04 +
SPECviewperf 12 - specvp12 catia-04
28.2 fps (5%)
Cinebench R15
Cinebench R15 OpenGL 64 Bit +
Cinebench R15 - Cinebench R15 OpenGL 64 Bit
min: 109     avg: 132     median: 132 (8%)     max: 155 fps
Cinebench R15 OpenGL Ref. Match 64 Bit +
Cinebench R15 - Cinebench R15 OpenGL Ref. Match 64 Bit
99.6 % (100%)
GFXBench - GFXBench Car Chase Offscreen
137.6 fps (15%)
GFXBench 3.1 - GFXBench Manhattan ES 3.1 Offscreen
200 fps (4%)
GFXBench 3.0 - GFXBench 3.0 Manhattan Offscreen
268 fps (16%)
GFXBench (DX / GLBenchmark) 2.7
GFXBench T-Rex HD Offscreen C24Z16 +
GFXBench (DX / GLBenchmark) 2.7 - GFXBench T-Rex HD Offscreen C24Z16
472 fps (4%)
Basemark GPU 1.2 - Basemark GPU 1.2 Vulkan Official Medium Offscreen 1080
105 fps (1%)
LuxMark v2.0 64Bit - LuxMark v2.0 Room GPU
1037 Samples/s (5%)
LuxMark v2.0 64Bit - LuxMark v2.0 Sala GPU
1864 Samples/s (3%)
ComputeMark v2.1 - ComputeMark v2.1 Result
4749 points (5%)
Power Consumption - The Witcher 3 Power Consumption - external Monitor *
155 Watt (22%)
Power Consumption - Witcher 3 ultra Power Efficiency - external Monitor
0.2 fps per Watt (13%)
- Range of benchmark values for this graphics card
- Average benchmark values for this graphics card
* Smaller numbers mean a higher performance

Game Benchmarks

The following benchmarks stem from our benchmarks of review laptops. The performance depends on the used graphics memory, clock rate, processor, system settings, drivers, and operating systems. So the results don't have to be representative for all laptops with this GPU. For detailed information on the benchmark results, click on the fps number.

Cyberpunk 2077 2.0 Phantom Liberty

Cyberpunk 2077 2.0 Phantom Liberty

2023
low 1920x1080
10.7  fps    + Compare
med. 1920x1080
6 6 ~ 6 fps    + Compare
» The benchmarks indicate that the game is not playable in the tested settings.
Additional Benchmarks
Low Preset (FSR off) 1280x720
15.1
Steam Deck 1280x720
6.2
F1 22

F1 22

2022
low 1920x1080
55.3  fps    + Compare
med. 1920x1080
48.5  fps    + Compare
high 1920x1080
31.6  fps    + Compare
» With all tested laptops playable in detail settings med..
Additional Benchmarks
Ultra Low Preset 16xAF TAA 1280x720
123.7
med. 1920x1080
16.4  fps    + Compare + 📈 Graph
high 1920x1080
13.2  fps    + Compare + 📈 Graph
QHD 2560x1440
9.6  fps    + Compare + 📈 Graph
» The benchmarks indicate that the game is not playable in the tested settings.
Additional Benchmarks
Low Quality 1280x720
31.7
med. 1920x1080
18.3  fps    + Compare + 📈 Graph
» The benchmarks indicate that the game is not playable in the tested settings.
Additional Benchmarks
Low Preset 1280x720
49
low 1280x720
0 (!)  fps    + Compare
low 1280x720
32.1  fps    + Compare + 📈 Graph
» The benchmarks indicate that the game is not playable in the tested settings.
low 1280x720
47.1  fps    + Compare
med. 1920x1080
19.2  fps    + Compare
high 1920x1080
12.1  fps    + Compare
ultra 1920x1080
5.5  fps    + Compare
» With all tested laptops playable in detail settings low.
F1 2020

F1 2020

2020
low 1280x720
133  fps    + Compare
med. 1920x1080
62  fps    + Compare
high 1920x1080
40.8  fps    + Compare
ultra 1920x1080
25.9  fps    + Compare
» With all tested laptops playable in detail settings high.
low 1280x720
177  fps    + Compare
med. 1920x1080
62.2  fps    + Compare
high 1920x1080
38.2  fps    + Compare
ultra 1920x1080
30.7  fps    + Compare
QHD 2560x1440
19  fps    + Compare
» With all tested laptops playable in detail settings high.
low 1280x720
52.5  fps    + Compare
med. 1920x1080
39.3  fps    + Compare
high 1920x1080
31.3  fps    + Compare
ultra 1920x1080
28.2  fps    + Compare
» With all tested laptops playable in detail settings med..
low 1280x720
115  fps    + Compare
med. 1920x1080
63.9  fps    + Compare
high 1920x1080
50.5  fps    + Compare
ultra 1920x1080
29.9  fps    + Compare
QHD 2560x1440
19.8  fps    + Compare
» With all tested laptops playable in detail settings high.
low 1280x720
65  fps    + Compare
med. 1920x1080
30.5  fps    + Compare
high 1920x1080
18.5  fps    + Compare
ultra 1920x1080
0 (!)  fps    + Compare
» With all tested laptops playable in detail settings low.
low 1280x720
56.6  fps    + Compare
med. 1920x1080
33.9  fps    + Compare
high 1920x1080
30.7  fps    + Compare
ultra 1920x1080
17.1  fps    + Compare
» With all tested laptops playable in detail settings low.
FIFA 20

FIFA 20

2019
low 1280x720
196  fps    + Compare
med. 1920x1080
167  fps    + Compare
high 1920x1080
154  fps    + Compare
ultra 1920x1080
124  fps    + Compare
QHD 2560x1440
95  fps    + Compare
4K 3840x2160
54.1  fps    + Compare
» With all tested laptops playable in detail settings ultra.
low 1280x720
98  fps    + Compare
med. 1920x1080
40.1  fps    + Compare
high 1920x1080
25  fps    + Compare
ultra 1920x1080
18.4  fps    + Compare
4K 3840x2160
2.1  fps    + Compare
» With all tested laptops playable in detail settings med..
Control

Control

2019
low 1280x720
75  fps    + Compare
med. 1920x1080
23.6  fps    + Compare
high 1920x1080
15.8  fps    + Compare
» With all tested laptops playable in detail settings low.
F1 2019

F1 2019

2019
low 1280x720
166  fps    + Compare
med. 1920x1080
71  fps    + Compare
high 1920x1080
60  fps    + Compare
ultra 1920x1080
33.4  fps    + Compare
QHD 2560x1440
25.7  fps    + Compare
» With all tested laptops playable in detail settings high.
low 1280x720
143  fps    + Compare
med. 1920x1080
43.3  fps    + Compare
high 1920x1080
22.5  fps    + Compare
ultra 1920x1080
15  fps    + Compare
QHD 2560x1440
6.3  fps    + Compare
4K 3840x2160
1  fps    + Compare
» With all tested laptops playable in detail settings med..
low 1280x720
124  fps    + Compare + 📈 Graph
med. 1920x1080
43.2  fps    + Compare + 📈 Graph
high 1920x1080
33  fps    + Compare + 📈 Graph
ultra 1920x1080
24.4  fps    + Compare + 📈 Graph
QHD 2560x1440
15.1  fps    + Compare + 📈 Graph
4K 3840x2160
6  fps    + Compare + 📈 Graph
» With all tested laptops playable in detail settings med..
low 1280x720
134  fps    + Compare
med. 1920x1080
56.9  fps    + Compare
high 1920x1080
45  fps    + Compare
ultra 1920x1080
22.1  fps    + Compare
QHD 2560x1440
20.5  fps    + Compare
» With all tested laptops playable in detail settings high.
Anthem

Anthem

2019
low 1280x720
67  fps    + Compare
med. 1920x1080
36.7  fps    + Compare
high 1920x1080
30.5  fps    + Compare
ultra 1920x1080
28.3  fps    + Compare
QHD 2560x1440
16.5  fps    + Compare
» With all tested laptops playable in detail settings med..
low 1280x720
77  fps    + Compare
med. 1920x1080
41  fps    + Compare
high 1920x1080
38  fps    + Compare
ultra 1920x1080
35  fps    + Compare
QHD 2560x1440
25  fps    + Compare
4K 3840x2160
11  fps    + Compare
» With all tested laptops playable in detail settings high.
low 1280x720
35.5  fps    + Compare
med. 1920x1080
20.5  fps    + Compare
high 1920x1080
16  fps    + Compare
ultra 1920x1080
13  fps    + Compare
» With all tested laptops playable in detail settings low.
low 1280x720
108  fps    + Compare
med. 1920x1080
45.6  fps    + Compare
high 1920x1080
37  fps    + Compare
ultra 1920x1080
36.7  fps    + Compare
4K 3840x2160
12  fps    + Compare
» With all tested laptops playable in detail settings ultra.
ultra 1920x1080
32.2  fps    + Compare
» The benchmarks indicate that the game is not playable in the tested settings.
ultra 1920x1080
44.6  fps    + Compare
» With all tested laptops playable in detail settings ultra.
low 1280x720
124  fps    + Compare
med. 1920x1080
55.6  fps    + Compare
high 1920x1080
43.1  fps    + Compare
ultra 1920x1080
36.3  fps    + Compare
QHD 2560x1440
27.1  fps    + Compare
» With all tested laptops playable in detail settings ultra.
ultra 1920x1080
52.3  fps    + Compare
» With all tested laptops playable in detail settings ultra.
ultra 1920x1080
38.2  fps    + Compare
» With all tested laptops playable in detail settings ultra.
Hitman 2

Hitman 2

2018
ultra 1920x1080
29.2  fps    + Compare
» The benchmarks indicate that the game is not playable in the tested settings.
med. 1920x1080
43.3  fps    + Compare
high 1920x1080
36.1  fps    + Compare
ultra 1920x1080
32.9  fps    + Compare
» With all tested laptops playable in detail settings high.
low 1280x720
71  fps    + Compare
med. 1920x1080
38  fps    + Compare
high 1920x1080
26  fps    + Compare
ultra 1920x1080
15  fps    + Compare
» With all tested laptops playable in detail settings med..
high 1920x1080
49  fps    + Compare
ultra 1920x1080
34  fps    + Compare
» With all tested laptops playable in detail settings high.
FIFA 19

FIFA 19

2018
ultra 1920x1080
95  fps    + Compare
4K 3840x2160
33.8  fps    + Compare
» With all tested laptops playable in detail settings ultra.
low 1280x720
61  fps    + Compare
med. 1920x1080
27  fps    + Compare
high 1920x1080
25 27 ~ 26 fps    + Compare
ultra 1920x1080
22 23 ~ 23 fps    + Compare
» With all tested laptops playable in detail settings low.
Strange Brigade

Strange Brigade

2018
low 1280x720
149  fps    + Compare
med. 1920x1080
53.2  fps    + Compare
high 1920x1080
34.7  fps    + Compare
ultra 1920x1080
31.3  fps    + Compare
QHD 2560x1440
18.4  fps    + Compare
4K 3840x2160
11.1  fps    + Compare
» With all tested laptops playable in detail settings med..
F1 2018

F1 2018

2018
low 1280x720
64  fps    + Compare
med. 1920x1080
52  fps    + Compare
high 1920x1080
36 54.1 ~ 45 fps    + Compare
ultra 1920x1080
24 32.9 ~ 28 fps    + Compare
4K 3840x2160
13.4  fps    + Compare
» With all tested laptops playable in detail settings high.
low 1280x720
72.6  fps    + Compare
med. 1920x1080
65.2  fps    + Compare
high 1920x1080
56.1  fps    + Compare
» With all tested laptops playable in detail settings high.
high 1920x1080
32.5  fps    + Compare
ultra 1920x1080
22.9  fps    + Compare
» The benchmarks indicate that the game is not playable in the tested settings.
low 1280x720
54  fps    + Compare
med. 1920x1080
26.2  fps    + Compare
high 1920x1080
15.5  fps    + Compare
4K 3840x2160
3  fps    + Compare
» With all tested laptops playable in detail settings low.
Fortnite

Fortnite

2018
high 1920x1080
53.3  fps    + Compare
ultra 1920x1080
42  fps    + Compare
» With all tested laptops playable in detail settings ultra.
Prey

Prey

2017
high 1920x1080
71  fps    + Compare
ultra 1920x1080
67  fps    + Compare
» With all tested laptops playable in detail settings ultra.
med. 1920x1080
41.5  fps    + Compare
high 1920x1080
26.5  fps    + Compare
» With all tested laptops playable in detail settings med..
med. 1920x1080
47.1  fps    + Compare
high 1920x1080
24.3  fps    + Compare
ultra 1920x1080
19.9  fps    + Compare
» With all tested laptops playable in detail settings med..
low 1280x720
62.2  fps    + Compare
med. 1920x1080
31.7  fps    + Compare
high 1920x1080
29.2  fps    + Compare
ultra 1920x1080
13.8  fps    + Compare
» With all tested laptops playable in detail settings low.
For Honor

For Honor

2017
low 1280x720
142.2  fps    + Compare
med. 1920x1080
55.8 64.5 ~ 60 fps    + Compare
high 1920x1080
53 53.2 ~ 53 fps    + Compare
ultra 1920x1080
40.5 42.8 ~ 42 fps    + Compare
4K 3840x2160
13.5  fps    + Compare
» With all tested laptops playable in detail settings ultra.
high 1920x1080
59.3  fps    + Compare
ultra 1920x1080
47.5  fps    + Compare
4K 3840x2160
13.9  fps    + Compare
» With all tested laptops playable in detail settings ultra.
med. 1366x768
78  fps    + Compare
high 1920x1080
35.4  fps    + Compare
ultra 1920x1080
20  fps    + Compare
» With all tested laptops playable in detail settings high.
med. 1366x768
80  fps    + Compare
high 1920x1080
37.3  fps    + Compare
ultra 1920x1080
33.7  fps    + Compare
» With all tested laptops playable in detail settings high.
ultra 1920x1080
55.4  fps    + Compare
» With all tested laptops playable in detail settings ultra.
high 1920x1080
52.9  fps    + Compare
ultra 1920x1080
45.7  fps    + Compare
4K 3840x2160
15.6  fps    + Compare
» With all tested laptops playable in detail settings ultra.
ultra 1920x1080
103  fps    + Compare
4K 3840x2160
46.3  fps    + Compare
» With all tested laptops playable in detail settings ultra.
low 1280x720
104  fps    + Compare
med. 1366x768
71 113 ~ 92 fps    + Compare
high 1920x1080
38.5 42.6 ~ 41 fps    + Compare
ultra 1920x1080
35.2 39 ~ 37 fps    + Compare
4K 3840x2160
13.9  fps    + Compare
» With all tested laptops playable in detail settings ultra.
high 1920x1080
48  fps    + Compare
ultra 1920x1080
40.2  fps    + Compare
4K 3840x2160
31.5  fps    + Compare
» With all tested laptops playable in detail settings ultra.
Mafia 3

Mafia 3

2016
med. 1366x768
41.1  fps    + Compare
high 1920x1080
26.1  fps    + Compare
» With all tested laptops playable in detail settings med..
FIFA 17

FIFA 17

2016
ultra 1920x1080
157  fps    + Compare
4K 3840x2160
61  fps    + Compare
» With all tested laptops playable in detail settings ultra.
low 1280x720
86  fps    + Compare
med. 1366x768
63.1  fps    + Compare
high 1920x1080
33.6  fps    + Compare
ultra 1920x1080
12 21.4 ~ 17 fps    + Compare
4K 3840x2160
9  fps    + Compare
» With all tested laptops playable in detail settings med..
Overwatch

Overwatch

2016
high 1920x1080
108  fps    + Compare
ultra 1920x1080
63  fps    + Compare
4K 3840x2160
33.1  fps    + Compare
» With all tested laptops playable in detail settings ultra.
Doom

Doom

2016
high 1920x1080
54  fps    + Compare
ultra 1920x1080
46.5  fps    + Compare
4K 3840x2160
18.3  fps    + Compare
» With all tested laptops playable in detail settings ultra.
med. 1920x1080
37.4  fps    + Compare
high 1920x1080
33.2  fps    + Compare
4K 3840x2160
3.5  fps    + Compare
» With all tested laptops playable in detail settings med..
med. 1366x768
44.7  fps    + Compare
high 1920x1080
21.6  fps    + Compare
ultra 1920x1080
18.9  fps    + Compare
» With all tested laptops playable in detail settings med..
high 1920x1080
39.2  fps    + Compare
ultra 1920x1080
30.3  fps    + Compare
4K 3840x2160
14.1  fps    + Compare
» With all tested laptops playable in detail settings high.
low 1280x720
125  fps    + Compare
med. 1920x1080
57  fps    + Compare
high 1920x1080
51  fps    + Compare
ultra 1920x1080
38  fps    + Compare
4K 3840x2160
15  fps    + Compare
» With all tested laptops playable in detail settings ultra.
XCOM 2

XCOM 2

2016
med. 1920x1080
54.9  fps    + Compare
high 1920x1080
33.2  fps    + Compare
ultra 1920x1080
14.5  fps    + Compare
» With all tested laptops playable in detail settings med..
low 1024x768
94.1  fps    + Compare
med. 1366x768
53.5  fps    + Compare
high 1920x1080
32.9 40.6 43.8 ~ 39 fps    + Compare
ultra 1920x1080
28.9 36.9 ~ 33 fps    + Compare
4K 3840x2160
15.6  fps    + Compare
» With most tested laptops playable in detail settings high.
low 1024x768
247  fps    + Compare
med. 1366x768
155  fps    + Compare
high 1920x1080
82.4  fps    + Compare
ultra 1920x1080
65.9  fps    + Compare
4K 3840x2160
20.3  fps    + Compare
» With all tested laptops playable in detail settings ultra.
high 1920x1080
44.1  fps    + Compare
ultra 1920x1080
16.5  fps    + Compare
» With all tested laptops playable in detail settings high.
Fallout 4

Fallout 4

2015
ultra 1920x1080
41.1  fps    + Compare
» With all tested laptops playable in detail settings ultra.
Anno 2205

Anno 2205

2015
high 1920x1080
54.3  fps    + Compare
ultra 1920x1080
17  fps    + Compare
4K 3840x2160
19.6  fps    + Compare
» With all tested laptops playable in detail settings high.
ultra 1920x1080
100  fps    + Compare
4K 3840 x 2160
31.9  fps    + Compare
» With all tested laptops playable in detail settings ultra.
Mad Max

Mad Max

2015
ultra 1920x1080
69  fps    + Compare
4K 3840x2160
24.1  fps    + Compare
» With all tested laptops playable in detail settings ultra.
low 1280x720
111 148 ~ 130 fps    + Compare
med. 1366x768
107 136 ~ 122 fps    + Compare
high 1920x1080
100 124 156 ~ 127 fps    + Compare
ultra 1920x1080
96.4 112 139 ~ 116 fps    + Compare
4K 3840x2160
47.4  fps    + Compare
» With all tested laptops playable in detail settings ultra.
low 1024x768
81.7 131 ~ 106 fps    + Compare
med. 1366x768
50.3 77.9 ~ 64 fps    + Compare
high 1920x1080
31.7 43.7 ~ 38 fps    + Compare
ultra 1920x1080
16.4 24.1 ~ 20 fps    + Compare
4K 3840x2160
15.3  fps    + Compare
» With most tested laptops playable in detail settings high.
ultra 1920x1080
76  fps    + Compare
4K 3840x2160
49.8  fps    + Compare
» With all tested laptops playable in detail settings ultra.
GTA V

GTA V

2015
low 1024x768
176  fps    + Compare
med. 1366x768
170  fps    + Compare
high 1920x1080
78.6  fps    + Compare
ultra 1920x1080
25.7 28.5 ~ 27 fps    + Compare
QHD 2560x1440
7.3  fps    + Compare
4K 3840x2160
23.8  fps    + Compare
» With all tested laptops playable in detail settings high.
Additional Benchmarks
Normal/Off 4xAF 1920x1080
165
Lowest Settings possible 1920x1080
172
ultra 1920x1080
75.2  fps    + Compare
» With all tested laptops playable in detail settings ultra.
ultra 1920x1080
44.9  fps    + Compare
» With all tested laptops playable in detail settings ultra.
ultra 1920x1080
54  fps    + Compare
4K 3840x2160
24  fps    + Compare
» With all tested laptops playable in detail settings ultra.
Dota 2

Dota 2

2013
low 1024x768
116.4  fps    + Compare
med. 1366x768
101  fps    + Compare
ultra 1920x1080
82.3  fps    + Compare
» With all tested laptops playable in detail settings ultra.
ultra 1920x1080
49  fps    + Compare
» With all tested laptops playable in detail settings ultra.
low 1280x720
203.7  fps    + Compare
med. 1366x768
145.2  fps    + Compare
high 1366x768
127.9  fps    + Compare
ultra 1920x1080
54.8 71.6 ~ 63 fps    + Compare
» With all tested laptops playable in detail settings ultra.
Crysis 3

Crysis 3

2013
ultra 1920x1080
31.9  fps    + Compare
» The benchmarks indicate that the game is not playable in the tested settings.
ultra 1920x1080
250  fps    + Compare
» With all tested laptops playable in detail settings ultra.
lowmed.highultraQHD4K
Cyberpunk 2077 2.0 Phantom Liberty10.76
F1 2255.348.531.6
Dying Light 216.413.29.56
God of War18.3
Guardians of the Galaxy
Cyberpunk 2077 1.032.1
Flight Simulator 202047.119.212.15.5
F1 20201336240.825.9
Gears Tactics17762.238.230.719
Doom Eternal52.539.331.328.2
Escape from Tarkov11563.950.529.919.8
Red Dead Redemption 26530.518.5
Call of Duty Modern Warfare 201956.633.930.717.1
FIFA 201961671541249554.1
Borderlands 39840.12518.42.1
Control7523.615.8
F1 2019166716033.425.7
Total War: Three Kingdoms14343.322.5156.31
The Division 212443.23324.415.16
Dirt Rally 2.013456.94522.120.5
Anthem6736.730.528.316.5
Far Cry New Dawn774138352511
Metro Exodus35.520.51613
Apex Legends10845.63736.712
Just Cause 432.2
Darksiders III44.6
Battlefield V12455.643.136.327.1
Farming Simulator 1952.3
Fallout 7638.2
Hitman 229.2
Call of Duty Black Ops 443.336.132.9
Assassin´s Creed Odyssey71382615
Forza Horizon 44934
FIFA 199533.8
Shadow of the Tomb Raider61272623
Strange Brigade14953.234.731.318.411.1
F1 20186452452813.4
X-Plane 11.1172.665.256.1
Kingdom Come: Deliverance32.522.9
Final Fantasy XV Benchmark5426.215.53
Fortnite53.342
Prey7167
Warhammer 40.000: Dawn of War III41.526.5
Mass Effect Andromeda47.124.319.9
Ghost Recon Wildlands62.231.729.213.8
For Honor142.260534213.5
Resident Evil 759.347.513.9
Watch Dogs 27835.420
Dishonored 28037.333.7
Call of Duty Infinite Warfare55.4
Titanfall 252.945.715.6
Farming Simulator 1710346.3
Battlefield 110492413713.9
Civilization VI4840.231.5
Mafia 341.126.1
FIFA 1715761
Deus Ex Mankind Divided8663.133.6179
Overwatch1086333.1
Doom5446.518.3
Ashes of the Singularity37.433.23.5
Hitman 201644.721.618.9
The Division39.230.314.1
Far Cry Primal12557513815
XCOM 254.933.214.5
Rise of the Tomb Raider94.153.5393315.6
Rainbow Six Siege24715582.465.920.3
Assassin's Creed Syndicate44.116.5
Fallout 441.1
Anno 220554.31719.6
World of Warships10031.9
Mad Max6924.1
Dota 2 Reborn13012212711647.4
The Witcher 310664382015.3
Dirt Rally7649.8
GTA V17617078.6277.3323.8
Alien: Isolation75.2
Middle-earth: Shadow of Mordor44.9
Battlefield 45424
Dota 2116.410182.3
Metro: Last Light49
BioShock Infinite203.7145.2127.963
Crysis 331.9
Counter-Strike: GO250
< 30 fps
< 60 fps
< 120 fps
≥ 120 fps
1
7
17
15
8
25
12
5
15
36
5
3
26
29
12
3
12

1
24
8
1

For more games that might be playable and a list of all games and graphics cards visit our Gaming List

v1.26
log 26. 04:39:12

#0 no ids found in url (should be separated by "_") +0s ... 0s

#1 not redirecting to Ajax server +0s ... 0s

#2 did not recreate cache, as it is less than 5 days old! Created at Thu, 25 Apr 2024 05:40:10 +0200 +0.001s ... 0.001s

#3 no comparison url found in template nbc.compare_page_1 needed +0.038s ... 0.039s

#4 no comparison url found in template nbc.compare_page_1 needed +0s ... 0.039s

#5 no comparison url found in template nbc.compare_page_1 needed +0s ... 0.039s

#6 no comparison url found in template nbc.compare_page_1 needed +0s ... 0.04s

#7 no comparison url found in template nbc.compare_page_1 needed +0s ... 0.04s

#8 no comparison url found in template nbc.compare_page_1 needed +0s ... 0.04s

#9 no comparison url found in template nbc.compare_page_1 needed +0s ... 0.04s

#10 no comparison url found in template nbc.compare_page_1 needed +0s ... 0.04s

#11 no comparison url found in template nbc.compare_page_1 needed +0s ... 0.041s

#12 no comparison url found in template nbc.compare_page_1 needed +0s ... 0.041s

#13 no comparison url found in template nbc.compare_page_1 needed +0s ... 0.041s

#14 no comparison url found in template nbc.compare_page_1 needed +0s ... 0.041s

#15 no comparison url found in template nbc.compare_page_1 needed +0s ... 0.042s

#16 no comparison url found in template nbc.compare_page_1 needed +0s ... 0.042s

#17 no comparison url found in template nbc.compare_page_1 needed +0s ... 0.042s

#18 no comparison url found in template nbc.compare_page_1 needed +0s ... 0.042s

#19 no comparison url found in template nbc.compare_page_1 needed +0s ... 0.042s

#20 no comparison url found in template nbc.compare_page_1 needed +0s ... 0.042s

#21 no comparison url found in template nbc.compare_page_1 needed +0s ... 0.042s

#22 no comparison url found in template nbc.compare_page_1 needed +0s ... 0.043s

#23 composed specs +0s ... 0.043s

#24 did output specs +0s ... 0.043s

#25 start showIntegratedCPUs +0s ... 0.043s

#26 getting avg benchmarks for device 7583 +0.013s ... 0.056s

#27 got single benchmarks 7583 +0.016s ... 0.072s

#28 got avg benchmarks for devices +0s ... 0.072s

#29 min, max, avg, median took s +0.6s ... 0.673s

#30 before gaming benchmark output +0s ... 0.673s

#31 Got 294 rows for game benchmarks. +0.019s ... 0.692s

#32 composed SQL query for gamebenchmarks +0s ... 0.692s

#33 got data and put it in $dataArray +0.054s ... 0.746s

#34 benchmarks composed for output. +2.271s ... 3.017s

#35 no comparison url found in template nbc.compare_page_1 needed +0.006s ... 3.023s

#36 return log +0s ... 3.023s

Please share our article, every link counts!

» Comparison of GPUs
Detailed list of all laptop GPUs sorted by class and performance.

» Benchmark List
Sort and restrict laptop GPUs based on performance in synthetic benchmarks.

» Notebook Gaming List
Playable games for each graphics card and their average FPS results.

Class 1

NVIDIA RTX A6000 Desktop
Radeon Pro W6800 Desktop
NVIDIA Titan RTX Desktop
GeForce RTX 3070 Ti Desktop
Radeon RX 6750 XT Desktop
Radeon RX 6700 XT Desktop
NVIDIA GeForce RTX 3060 Ti Desktop
Radeon RX 6650 XT Desktop
GeForce RTX 2080 (Desktop) Desktop

Class 2

NVIDIA GeForce RTX 3060 Desktop
Titan X Pascal Desktop
Radeon VII Desktop
Radeon RX 5700 XT (Desktop) Desktop
GeForce GTX 1080 (Desktop) Desktop
GeForce RTX 2060 Super (Desktop) Desktop
Radeon RX 5700 (Desktop) Desktop
GeForce RTX 2060 (Desktop) Desktop
RX Vega 64 Desktop
RX Vega 56 Desktop
Radeon RX 5600 XT (Desktop) Desktop
Pro Vega 56 Desktop
GeForce GTX 1660 Ti (Desktop) Desktop
GeForce GTX 1660 Super (Desktop) Desktop
GeForce GTX 1660 (Desktop) Desktop
GeForce GTX 1650 Super (Desktop) Desktop
Radeon R9 Fury Desktop
Radeon R9 Nano Desktop
Radeon RX 580 Desktop
GeForce GTX 1060 (Desktop) Desktop
Radeon RX 570 Desktop
Radeon RX 480 Desktop
Arc A380 Desktop
GeForce GTX 970 Desktop

Class 3

GeForce GTX 960 Desktop
Radeon R7 370 Desktop
GeForce GTX 950 Desktop
T600 Desktop
UHD Graphics 32EUs
UHD Graphics 750
FirePro W4100 Desktop
FirePro W2100 Desktop

Class 4

UHD Graphics 730

* Approximate position of the graphics adapter

> Notebookcheck中文版(NBC中国) > FAQ / 小提示/ 技术参数 > 移动显示芯片——基准测试成绩列表 > NVIDIA GeForce GTX 1050 (Desktop)
Klaus Hinum (Update: 2017-04- 1)