华硕ROG Strix G18 G814JI笔记本电脑回顾。18英寸游戏机的光与影

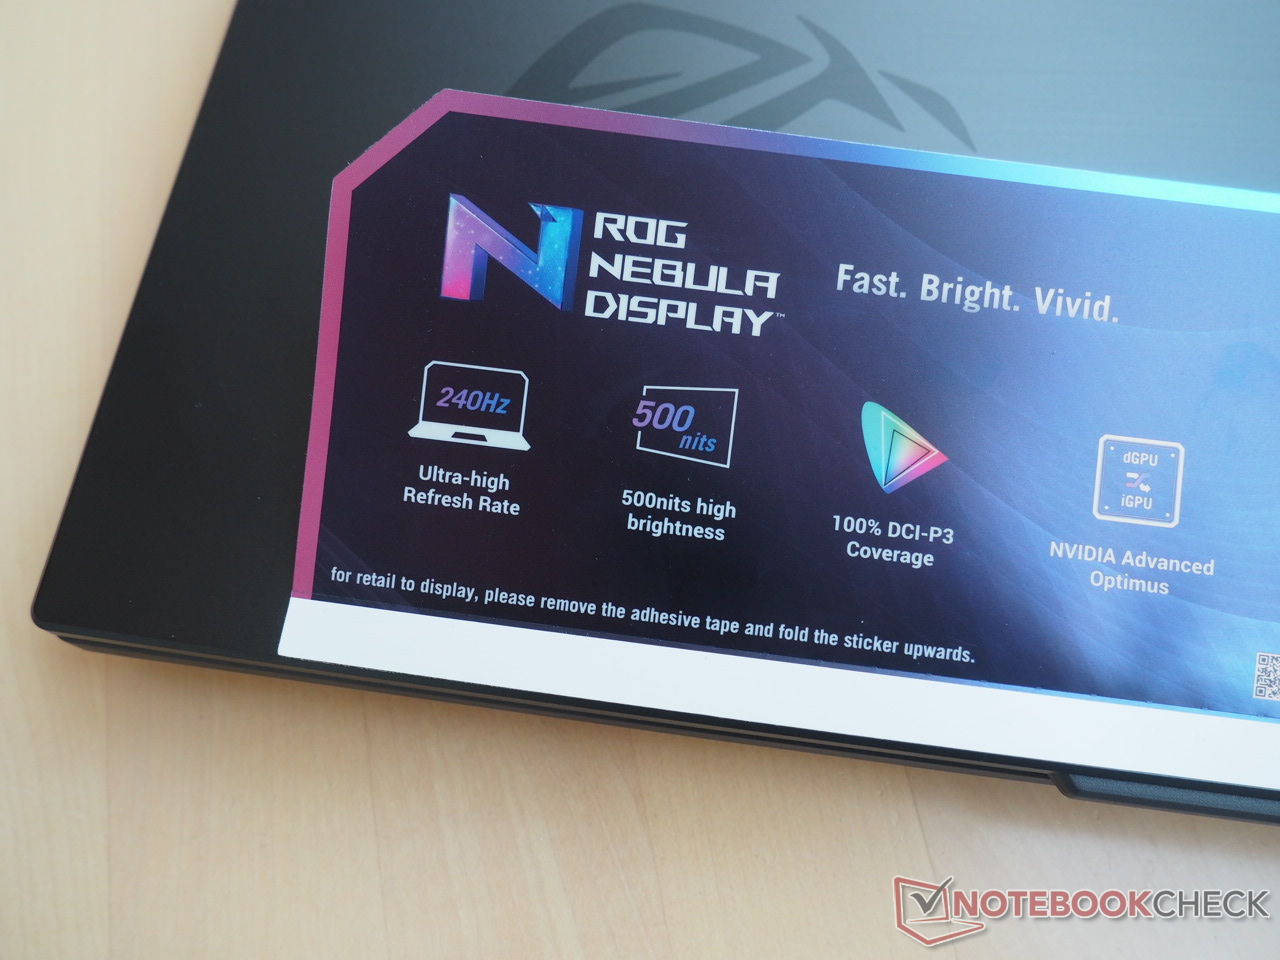
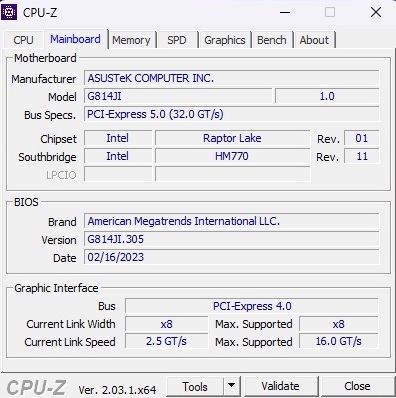
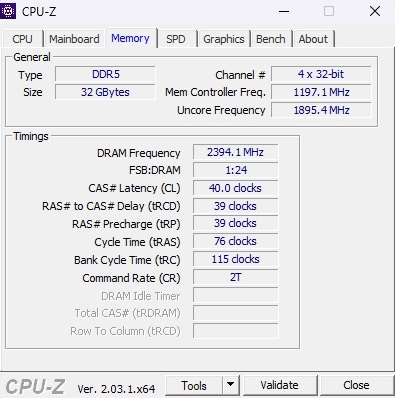
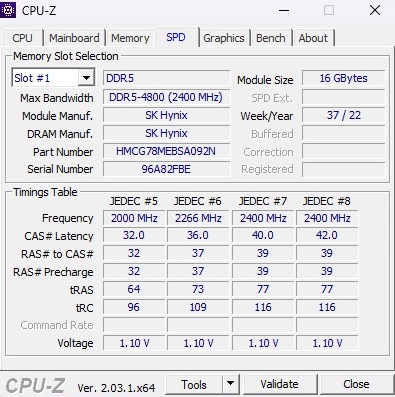
ROG Strix, ROG Strix Scar....,往往很难跟踪华硕的产品系列。在最近审查了Strix Scar 18 G834JY搭配 酷睿i9-13980HX和 GeForce RTX 4090厂商现在向我们展示了价格便宜得多但性能较差的Strix G18 G814JI,配备了一个酷睿i7-13650HX和 GeForce RTX 4070.其他功能包括2 x 16 GB DDR5-4800的双通道内存和1 TB NVMe SSD。关于2560 x 1600像素的WQXGA显示屏,华硕已经抛出了一些功能和流行语,如240赫兹,500尼特,100%DCI-P3,3毫秒响应时间,G-Sync和Pantone认证,顺便说一句,这不仅是针对游戏玩家,也是针对创作者。该设备(在本次审查时不可用)可以以2300美元的价格买到。一个更便宜的选择是基于RTX 4060的G814JV。后面的是G814JU,它不得不用一个GeForce RTX 4050.然而,无论你考虑哪种型号,目前的游戏笔记本都非常昂贵,这就是为什么你应该在决定购买哪种型号之前仔细考虑。
Strix G18的竞争对手主要是其他18英寸游戏笔记本电脑,如 Razer Blade 18,其审查版本配备了RTX 4070。除此以外,与旧版显卡相比,性能差异特别有趣。出于这个原因,该表包括 技嘉A7 X1(RTX 3070@140瓦)、联想Legion 5 Pro 16ARH7H(RTX 3070 Ti@150瓦)、笔记本电脑(RTX 3080@165瓦)和微星突袭者GE77 HX 12UHS(RTX 3080 Ti@175瓦),所有这些--与Strix G18(175瓦)一样--都被指定为高TGP。
潜在的竞争对手比较
Rating | Date | Model | Weight | Height | Size | Resolution | Price |
|---|---|---|---|---|---|---|---|
| 87.4 % v7 (old) | 03 / 2023 | Asus ROG Strix G18 G814JI i7-13650HX, GeForce RTX 4070 Laptop GPU | 3 kg | 31 mm | 18.00" | 2560x1600 | |
| 91.4 % v7 (old) | 02 / 2023 | Razer Blade 18 RTX 4070 i9-13950HX, GeForce RTX 4070 Laptop GPU | 3 kg | 21.9 mm | 18.00" | 2560x1600 | |
| 83.2 % v7 (old) | 10 / 2021 | Gigabyte A7 X1 R9 5900HX, GeForce RTX 3070 Laptop GPU | 2.5 kg | 34 mm | 17.30" | 1920x1080 | |
| 87.7 % v7 (old) | 10 / 2022 | Lenovo Legion 5 Pro 16ARH7H RTX 3070 Ti R7 6800H, GeForce RTX 3070 Ti Laptop GPU | 2.6 kg | 26.6 mm | 16.00" | 2560x1600 | |
| 89 % v7 (old) | 09 / 2021 | Alienware x17 RTX 3080 P48E i7-11800H, GeForce RTX 3080 Laptop GPU | 3.2 kg | 21.4 mm | 17.30" | 3840x2160 | |
| 86.8 % v7 (old) | 07 / 2022 | MSI Raider GE77 HX 12UHS i9-12900HX, GeForce RTX 3080 Ti Laptop GPU | 3.1 kg | 25.9 mm | 17.30" | 3840x2160 |
案例
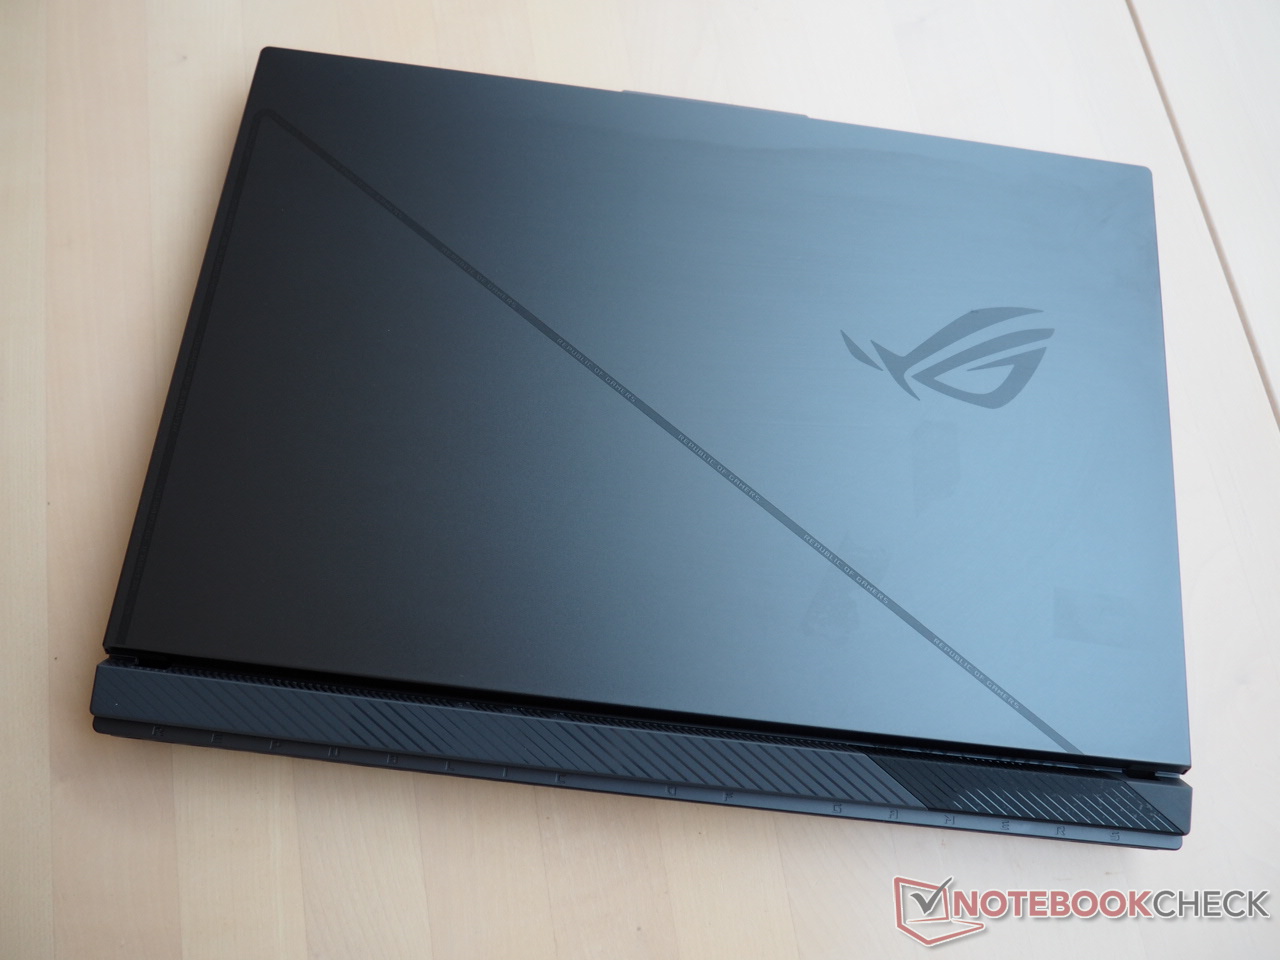
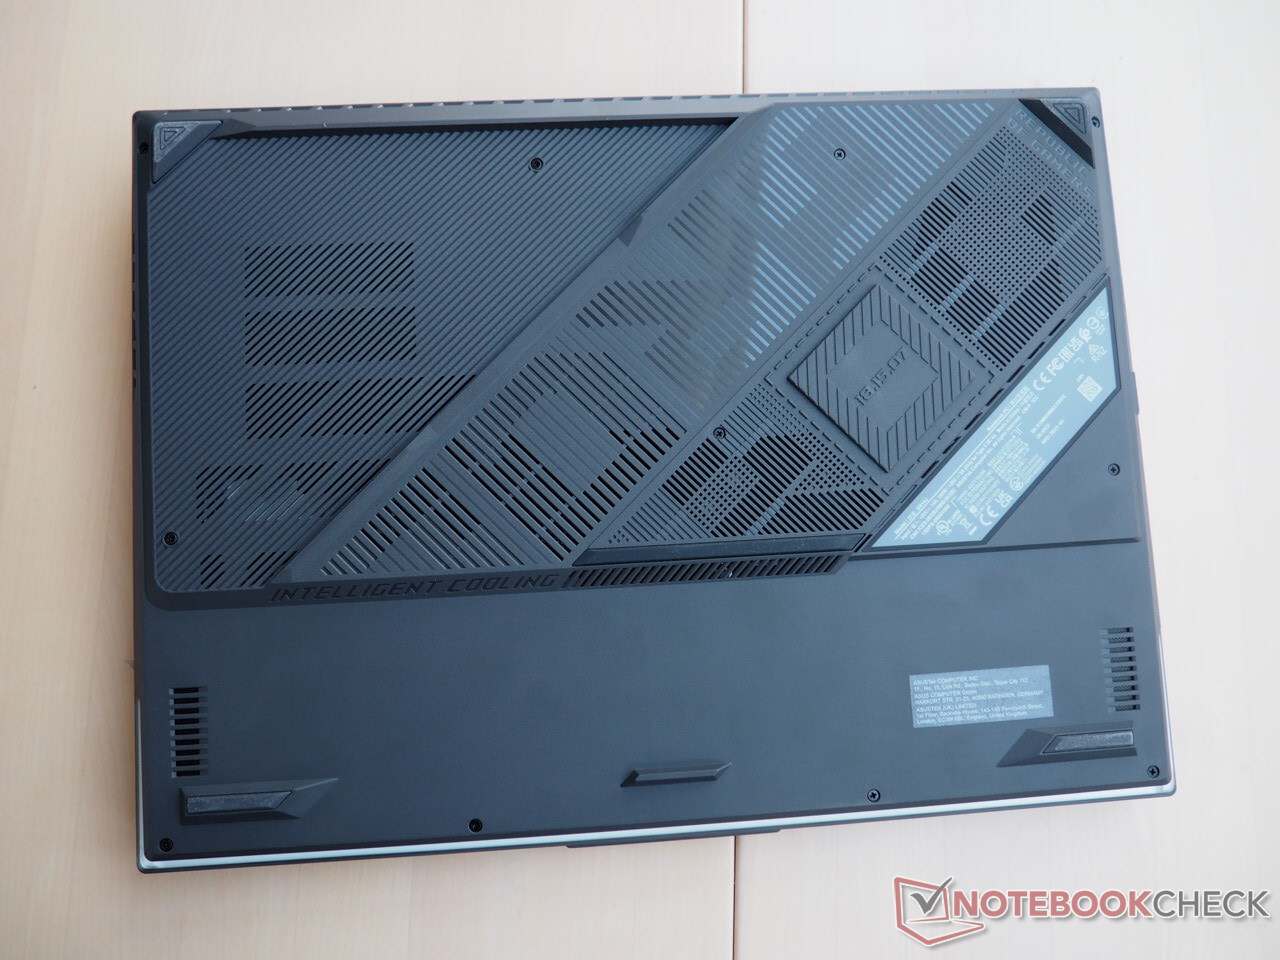
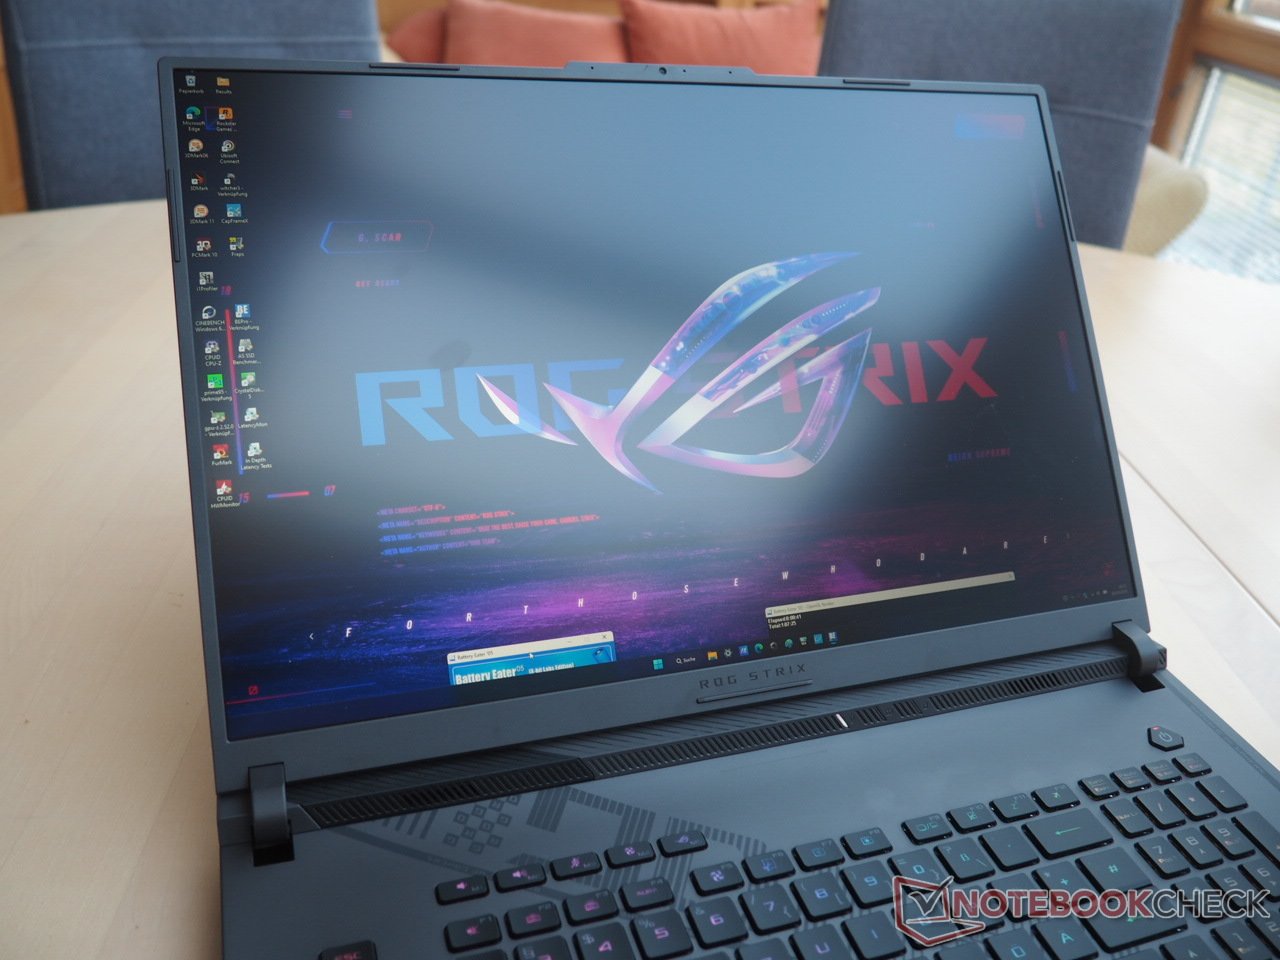
这款机箱的设计借鉴了Strix Scar 18,而 "普通 "的Strix G18则没有部分透明的表面。坚固的盖子由金属组成,看起来非常不显眼,除了ROG标志和窄条纹外,许多设计元素都可以在塑料底座上找到。从视觉的角度来看,即使是在机箱的底座上,通常不会见光,制造商从视觉上来说,已经有点疯狂了。然而,如果在制造质量上投入更多的资源,情况会更好。在某些部分,如方向键区域,底座单元会有明显的弯曲,至少在施加很大压力时是这样。最重要的是,外壳很快就会出现响声,这对设备的高级感产生了负面影响--特别是考虑到价格。
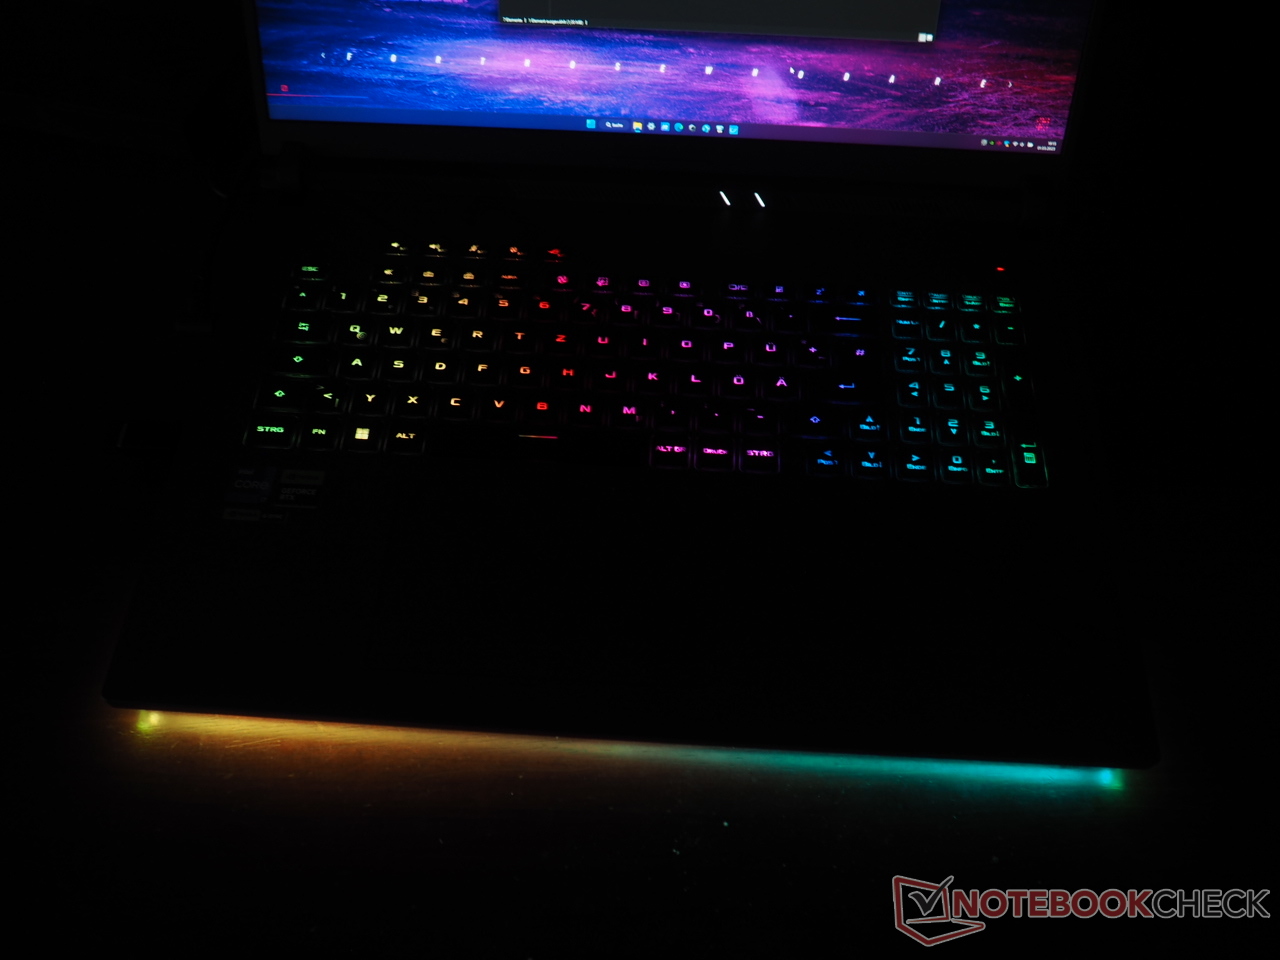
否则,就不能对机箱提出批评。完成度不高,铰链也做得很好,尽管最大开启角度可以更大一些。为了吸引游戏观众,华硕不仅仅局限于RGB键盘,还在机箱前部设计了一个看起来很聪明的LED灯条(见照片库)。
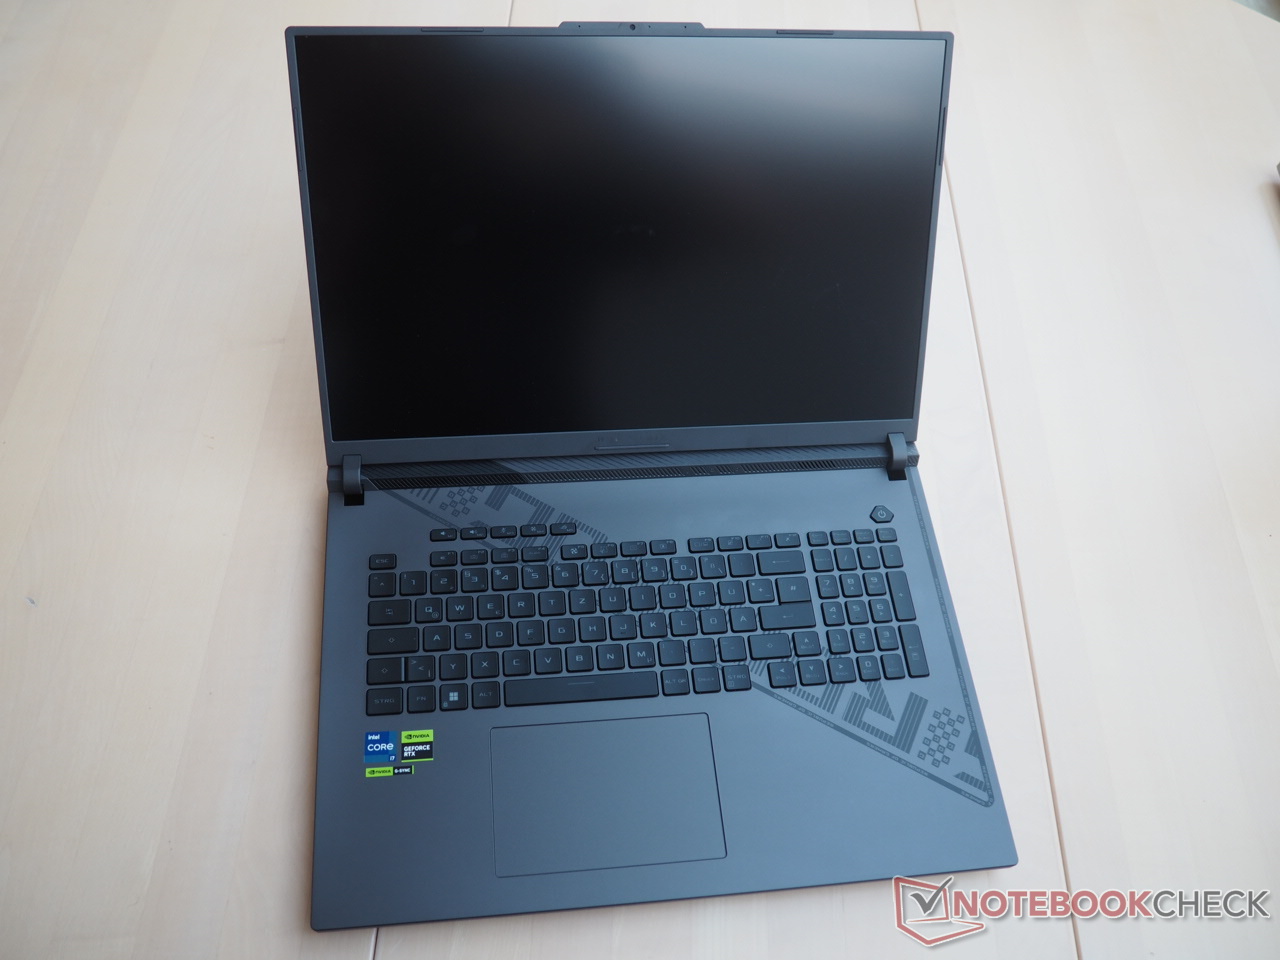
当然,作为一台18英寸的笔记本电脑,Strix G18显得相当笨重,但由于采用了纤细的边框设计和16:10的格式,显示器的框架令人愉悦地纤细。然而,与Razer Blade 18相比,华硕的机器更深,此外,大约有1厘米厚。然而,当涉及到重量时,竞争对手并没有好多少。3公斤的重量并不容易拖动。
特点
端口
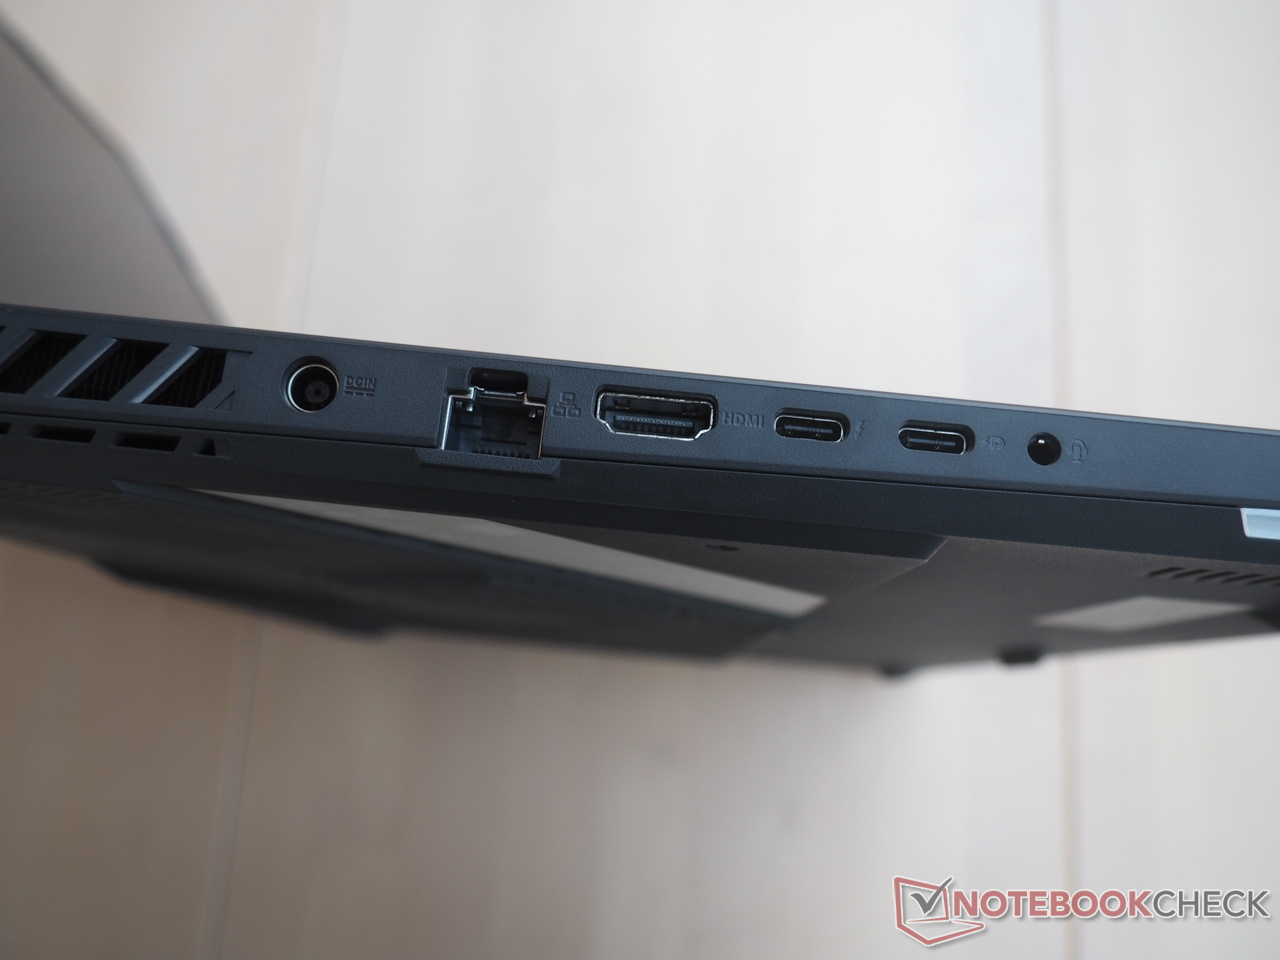
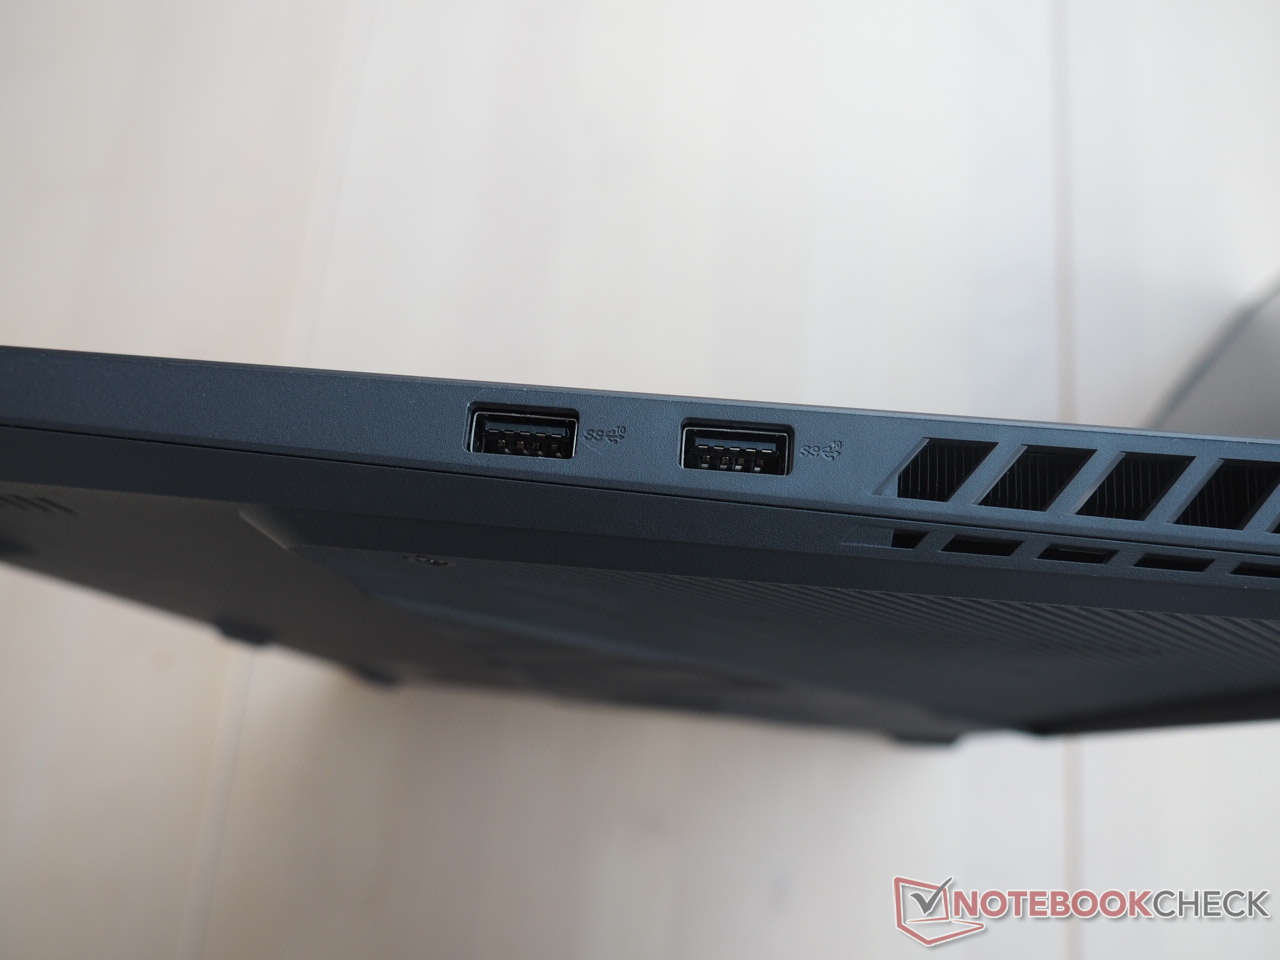
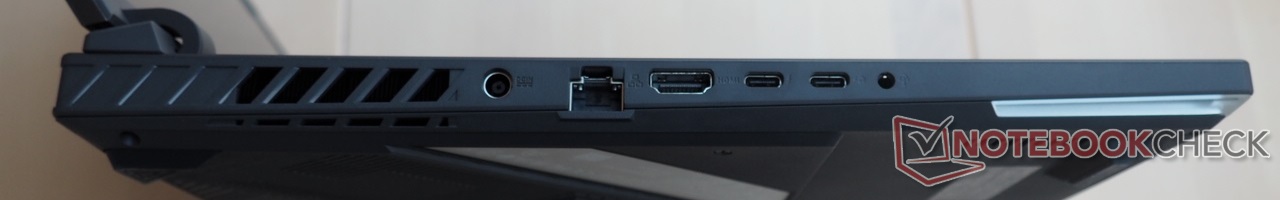
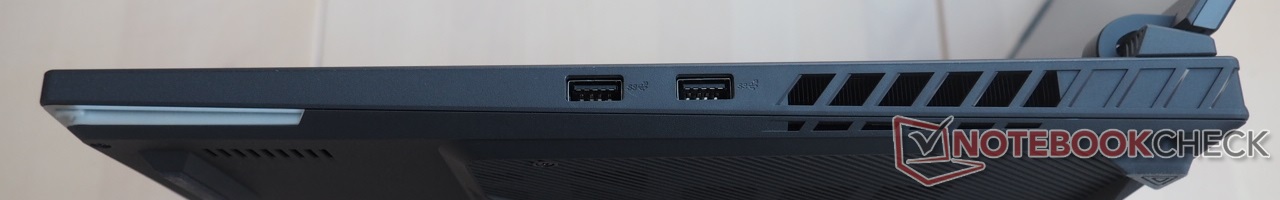
如果你不考虑没有读卡器的问题,端口的选择是令人印象深刻的。从左侧开始,你可以找到电源插座,一个RJ45端口,一个HDMI 2.1输出,一个组合音频插孔,以及两个USB-C端口(1个USB 3.2 Gen2,1个USB 4),包括Power Delivery和DisplayPort支持。在右侧,我们有两个经典的A型端口,是根据3.2-Gen2标准设计的。由于这些端口位于侧面的中间区域,这可能会导致与外部鼠标连接时活动受限。
沟通
WiFi性能证明了它高于平均水平。我们的标准化WiFi测试是在离参考路由器一米的地方进行的,G18在发送和接收数据时都达到了约1600 Mbit/s。这代表了一个很好的结果,比Razer Blade 18--尽管有相同的WiFi模块-Modul(Intel AX211)--多出100 Mbit。
网络摄像头
网络摄像头的质量只足以达到中游水平。虽然图像清晰度比一些竞争对手好一点,但它并没有真正设法给人留下深刻印象(同样适用于色彩空间)。


辅料
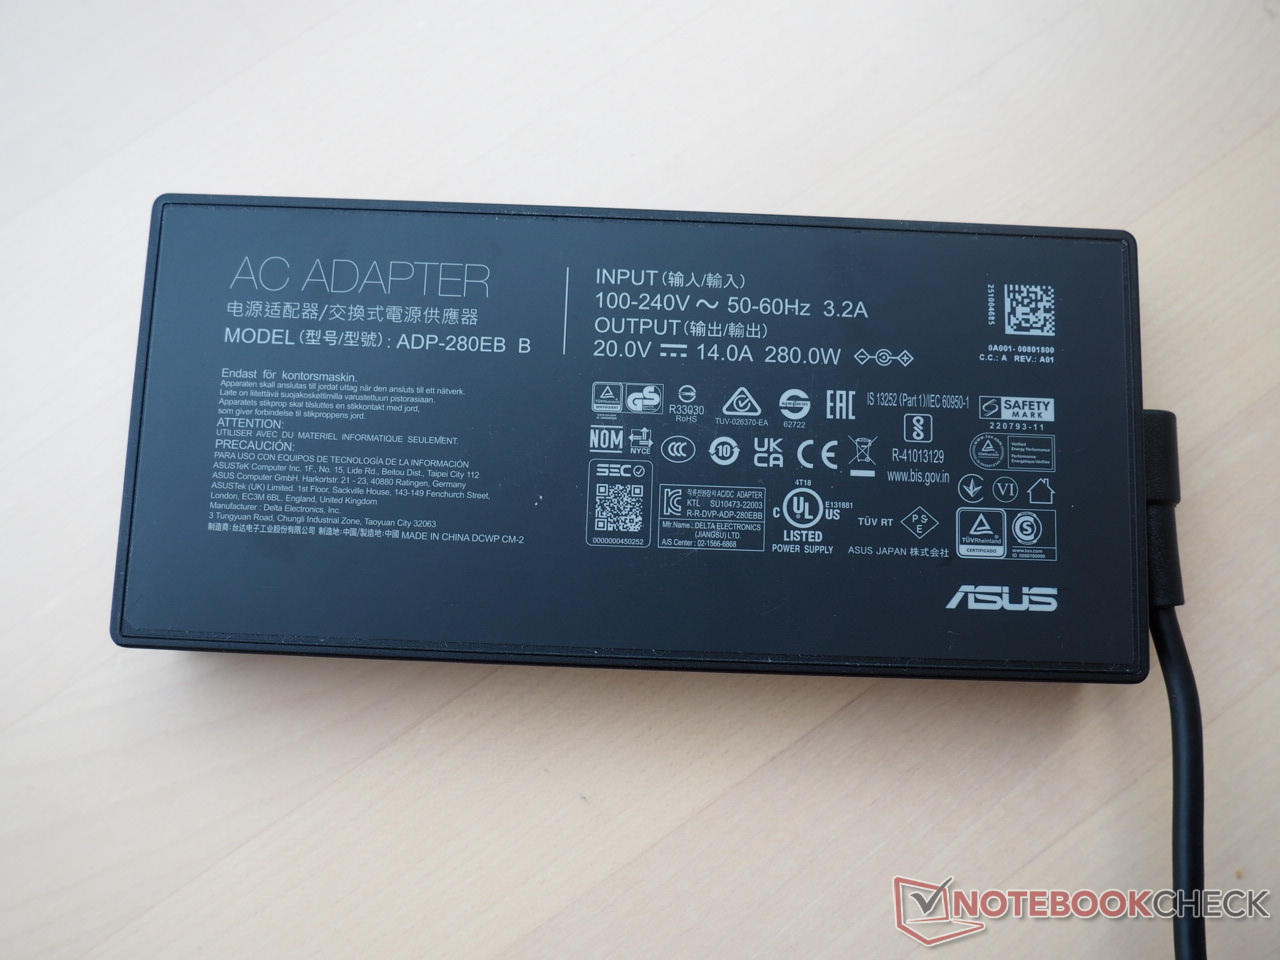
除了一些信息手册外,该设备还配有一个650克、280瓦的电源装置,尺寸为18 x 8 x 2.5厘米。
维护
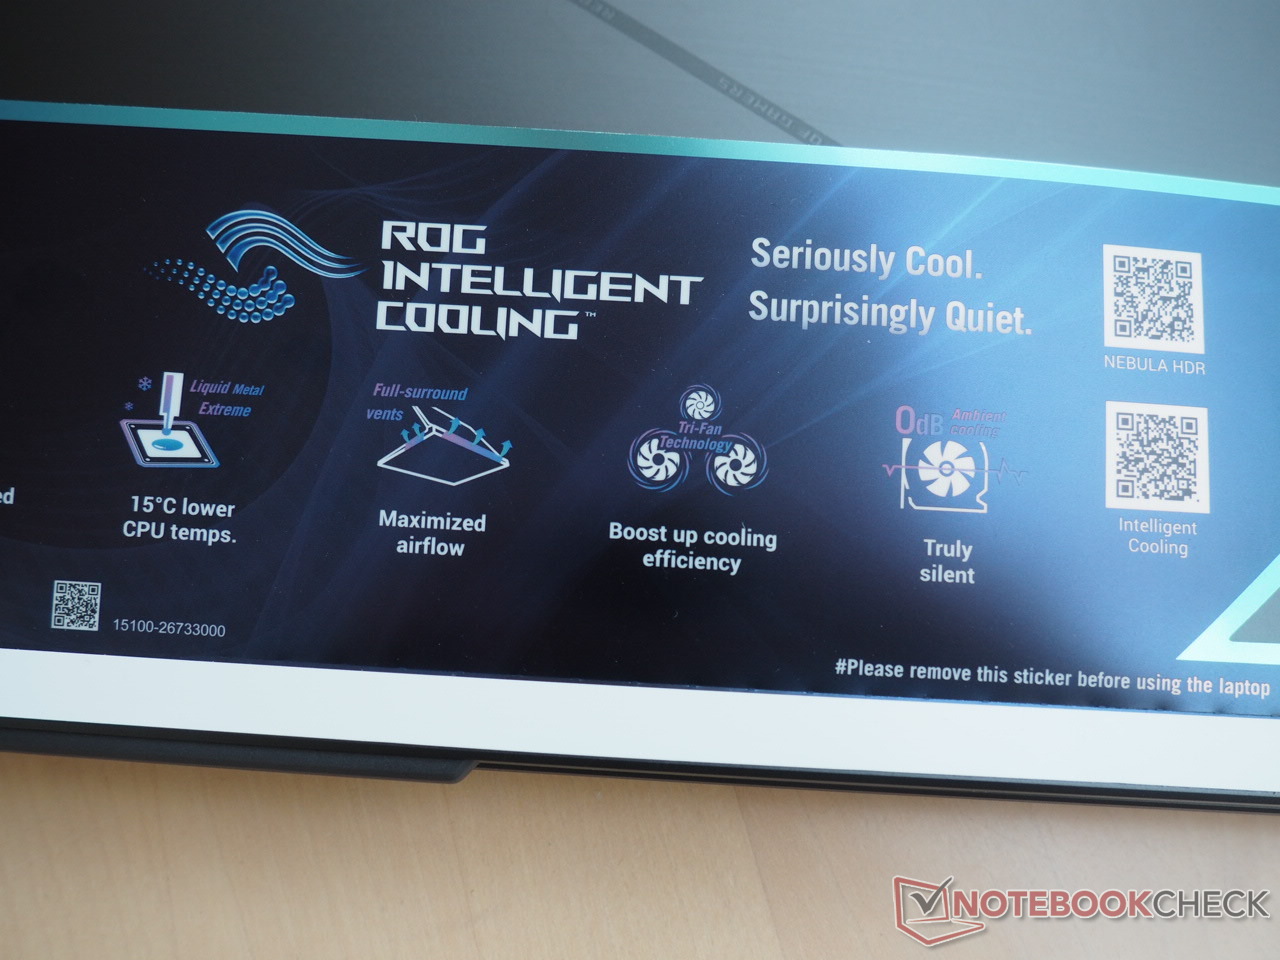
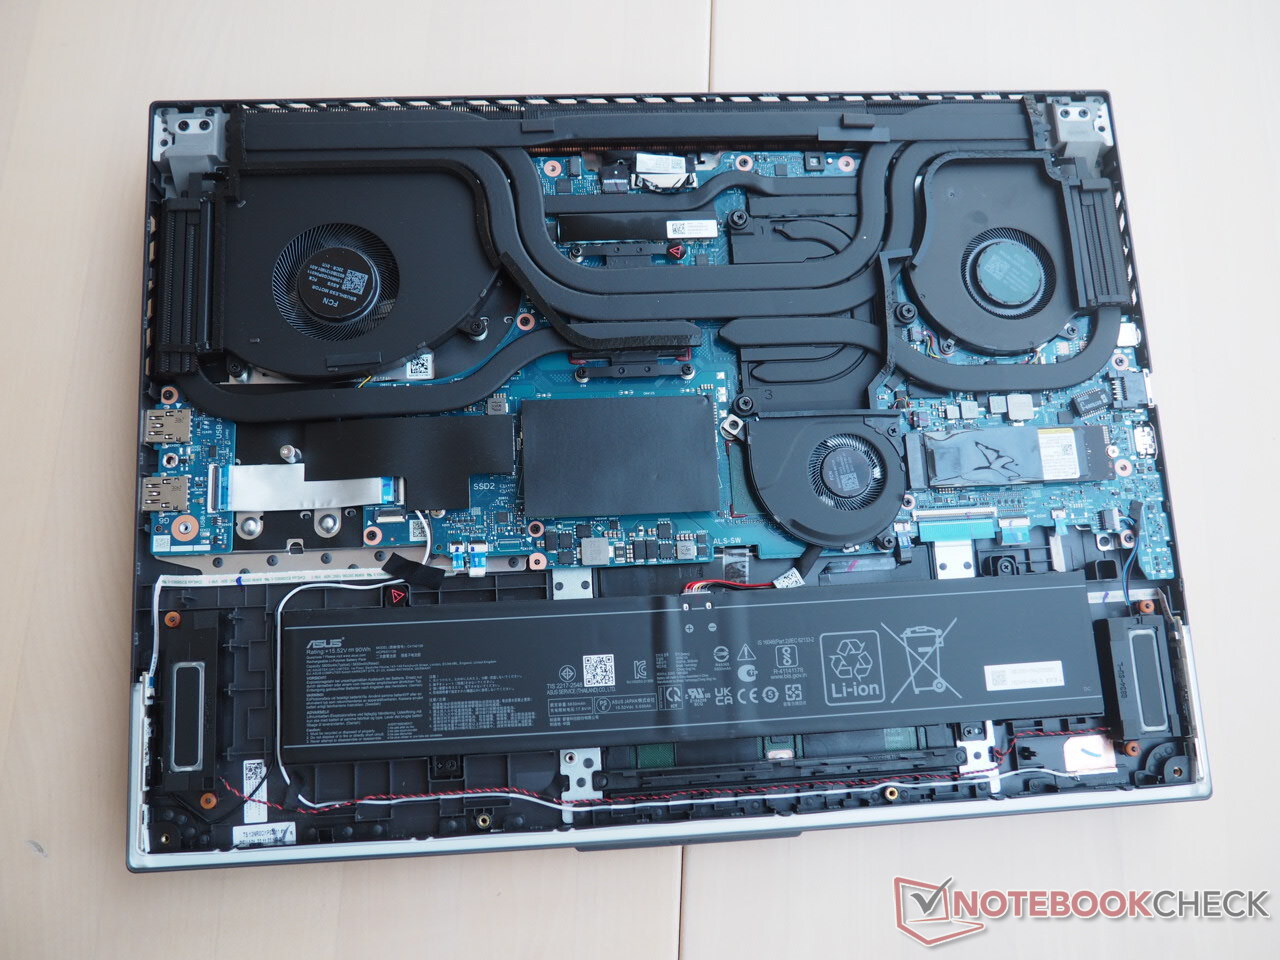
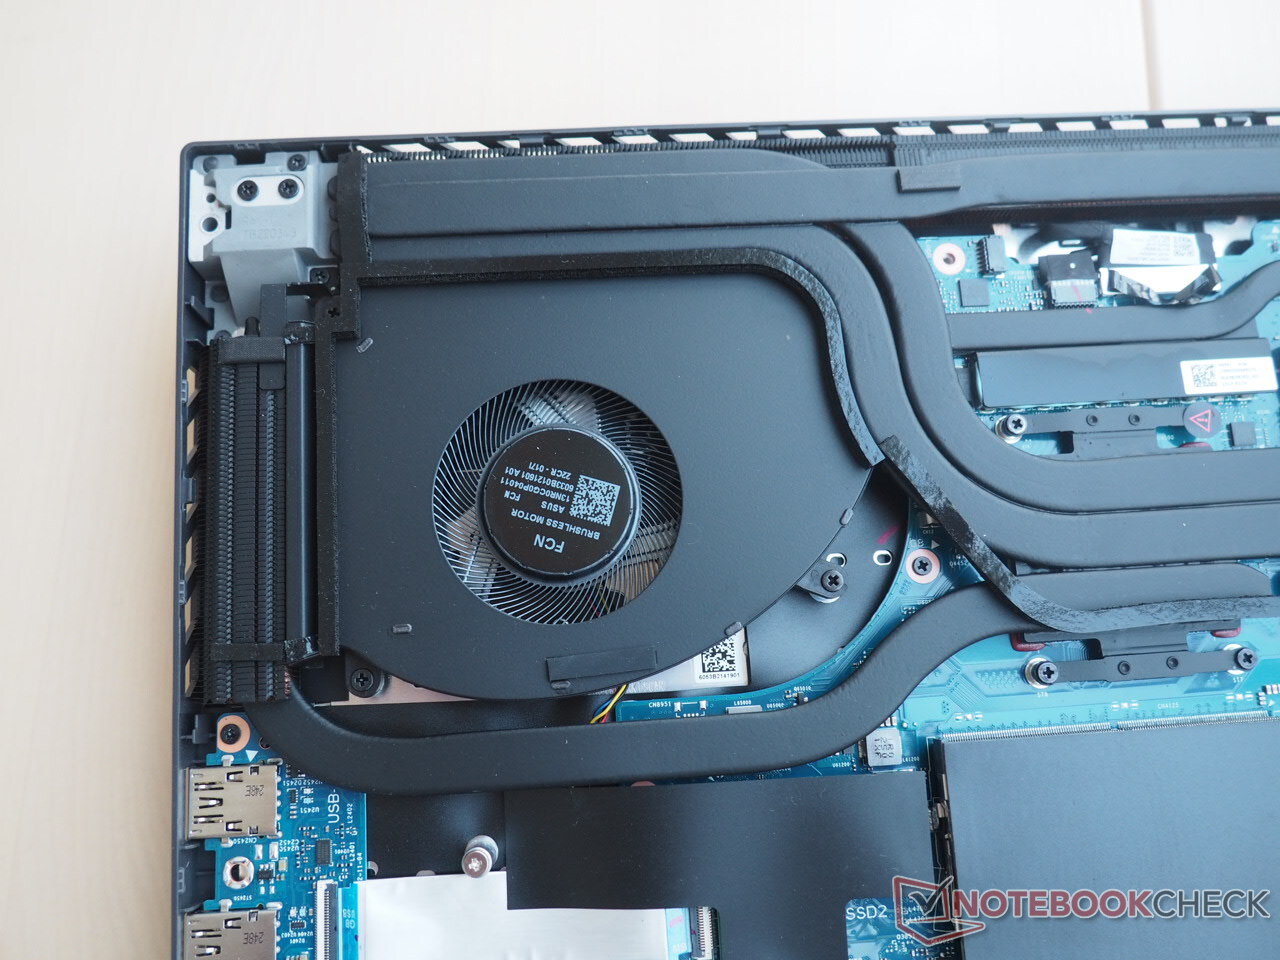
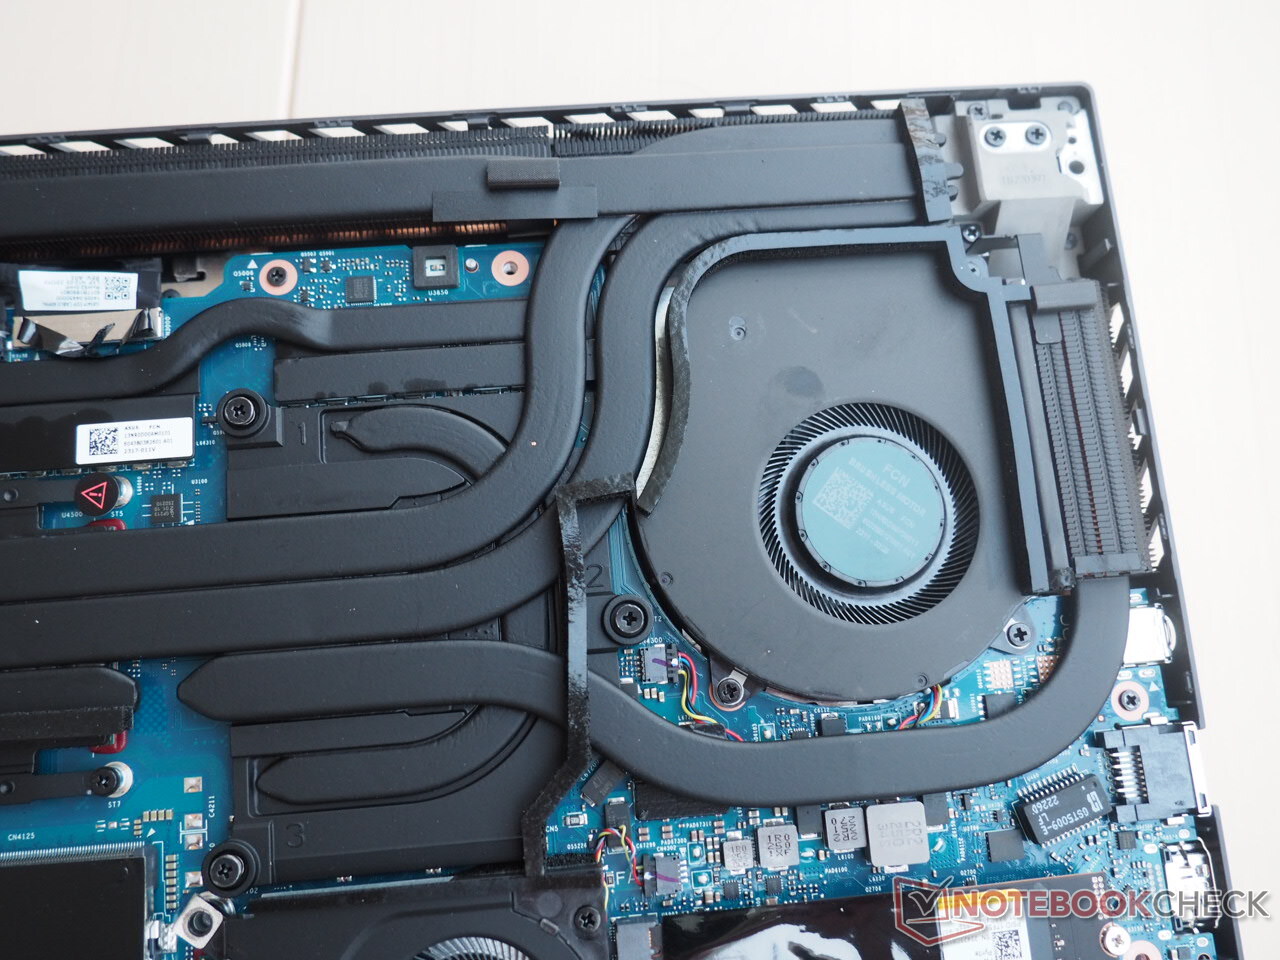
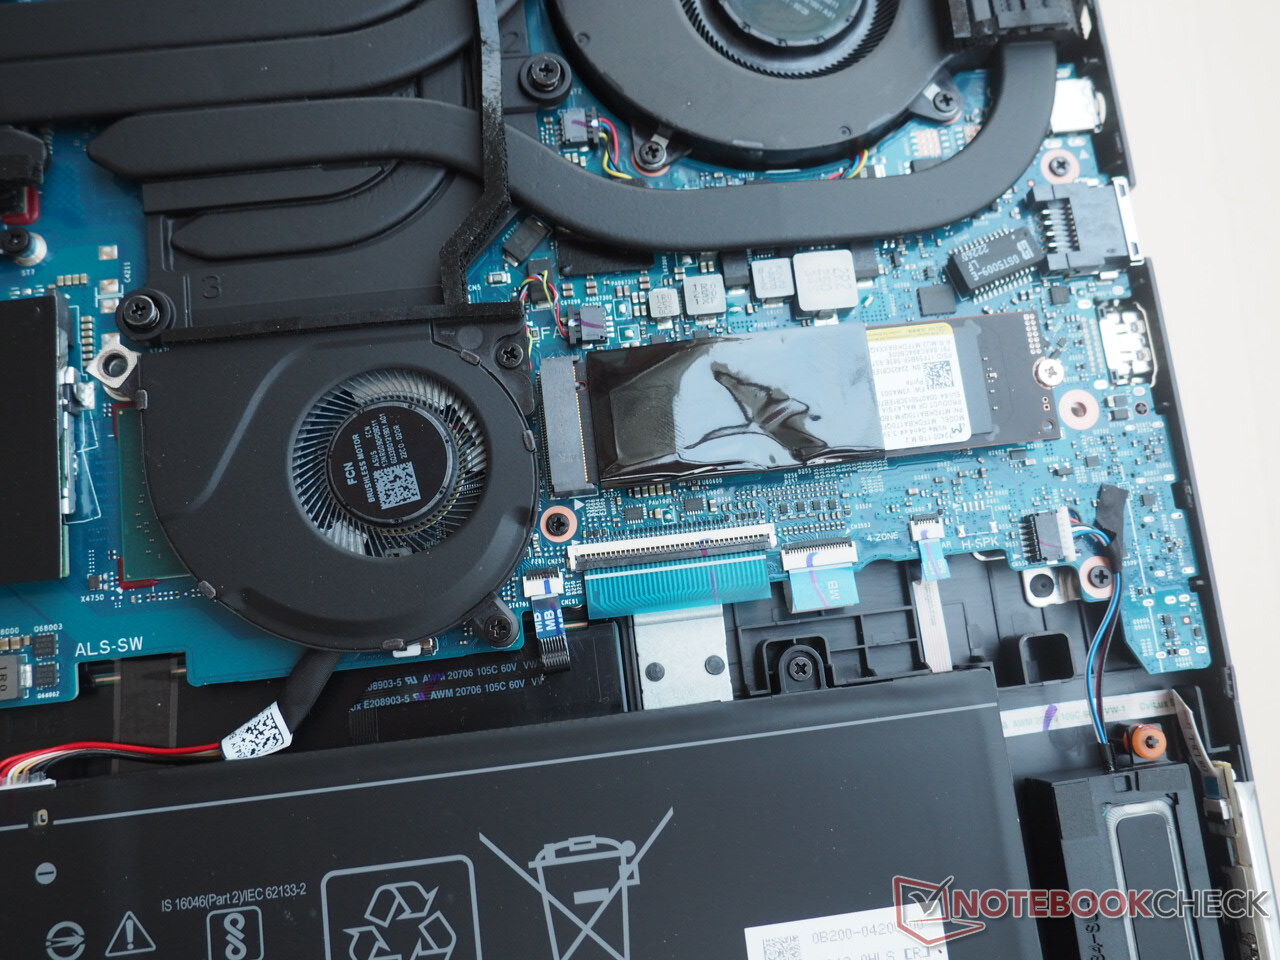
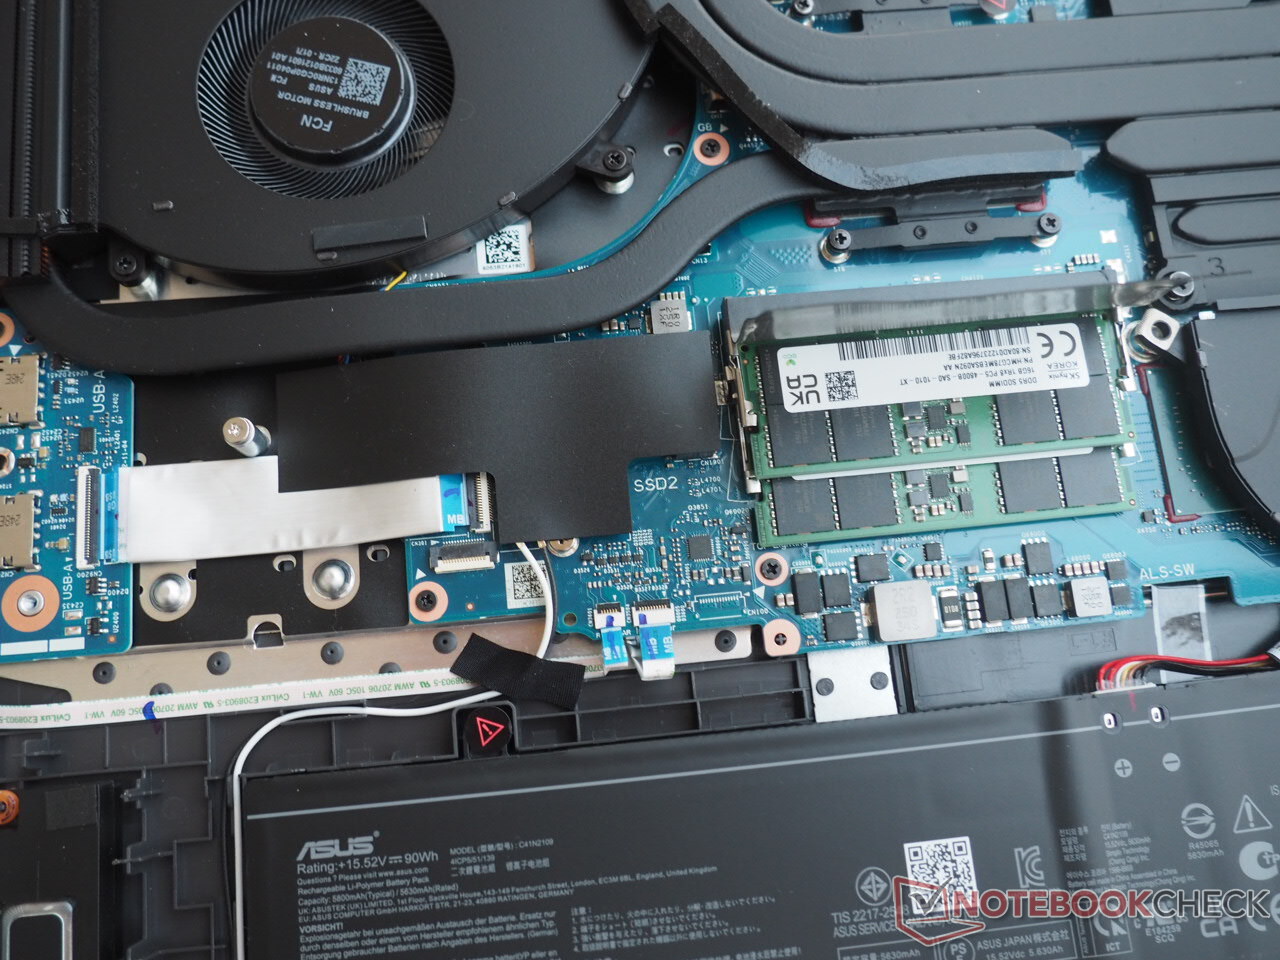
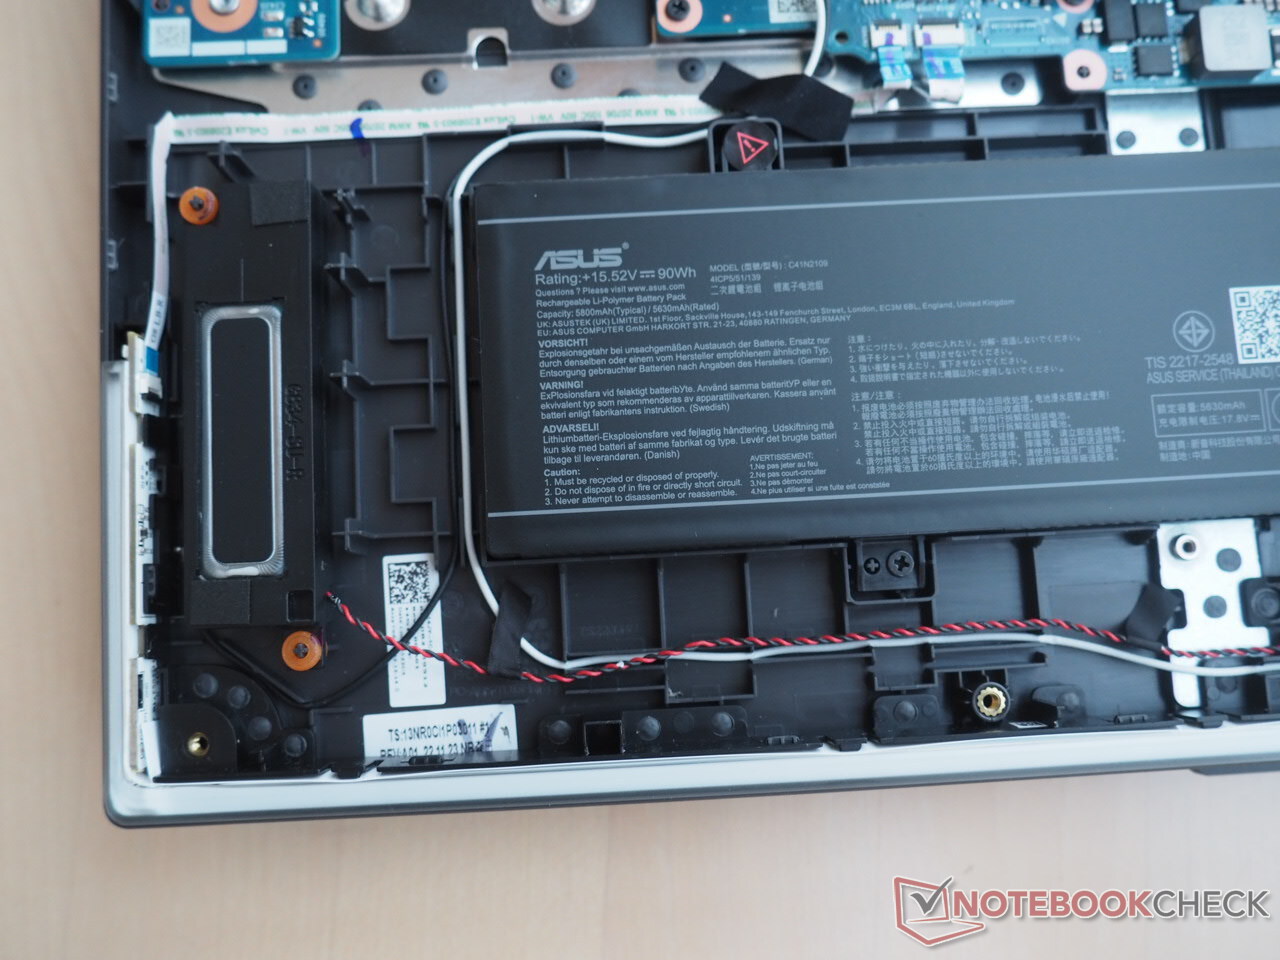
像往常一样,必须卸下一些十字头螺钉,并将底板撬出位置,以便进入设备的内部。后者比许多竞争对手要容易一些,因为卸下一个角上的螺丝可以稍微抬起机箱,从而创造一个良好的打开角度。扫一眼引擎盖下,可以看到一个广泛的冷却系统,有多个复杂的热管,两个大风扇和一个小风扇(华硕也使用液态金属)。此外,还有两个用于内存的SO-DIMM插槽(占用)和两个用于SSD的M.2插槽(1个空闲)。掌托区的两侧是长长的电池。
输入设备
键盘
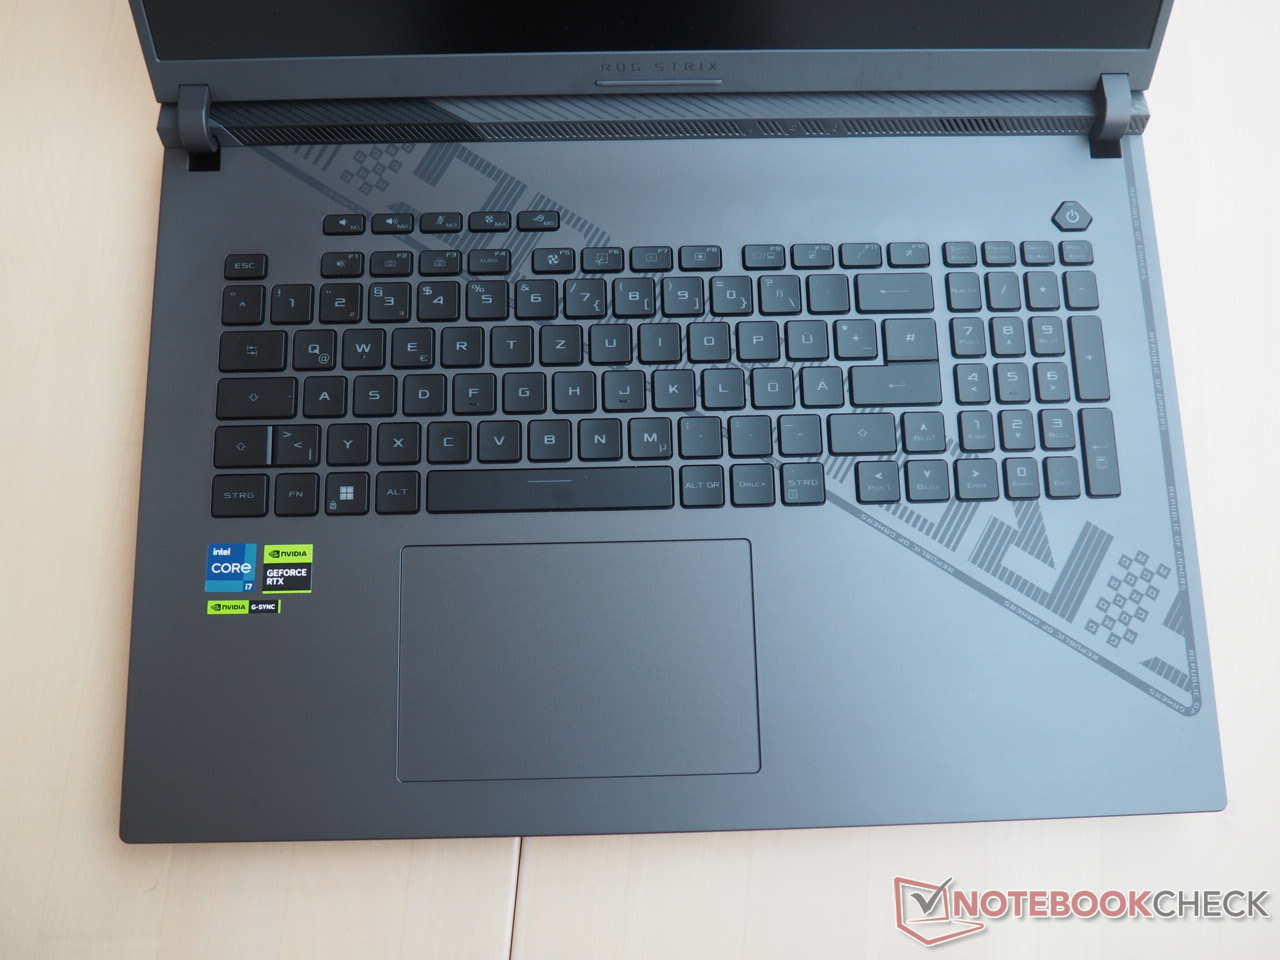
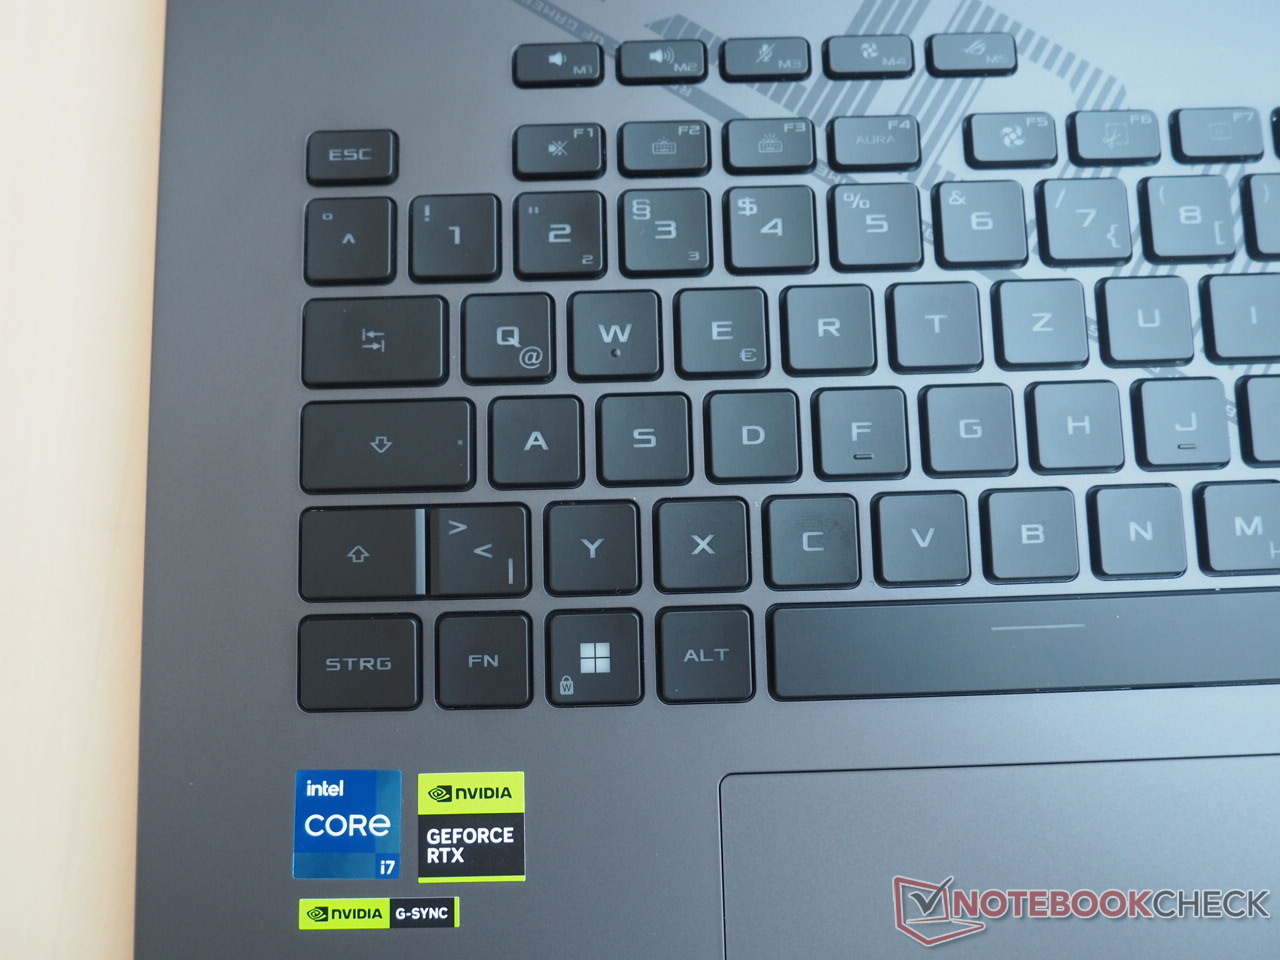
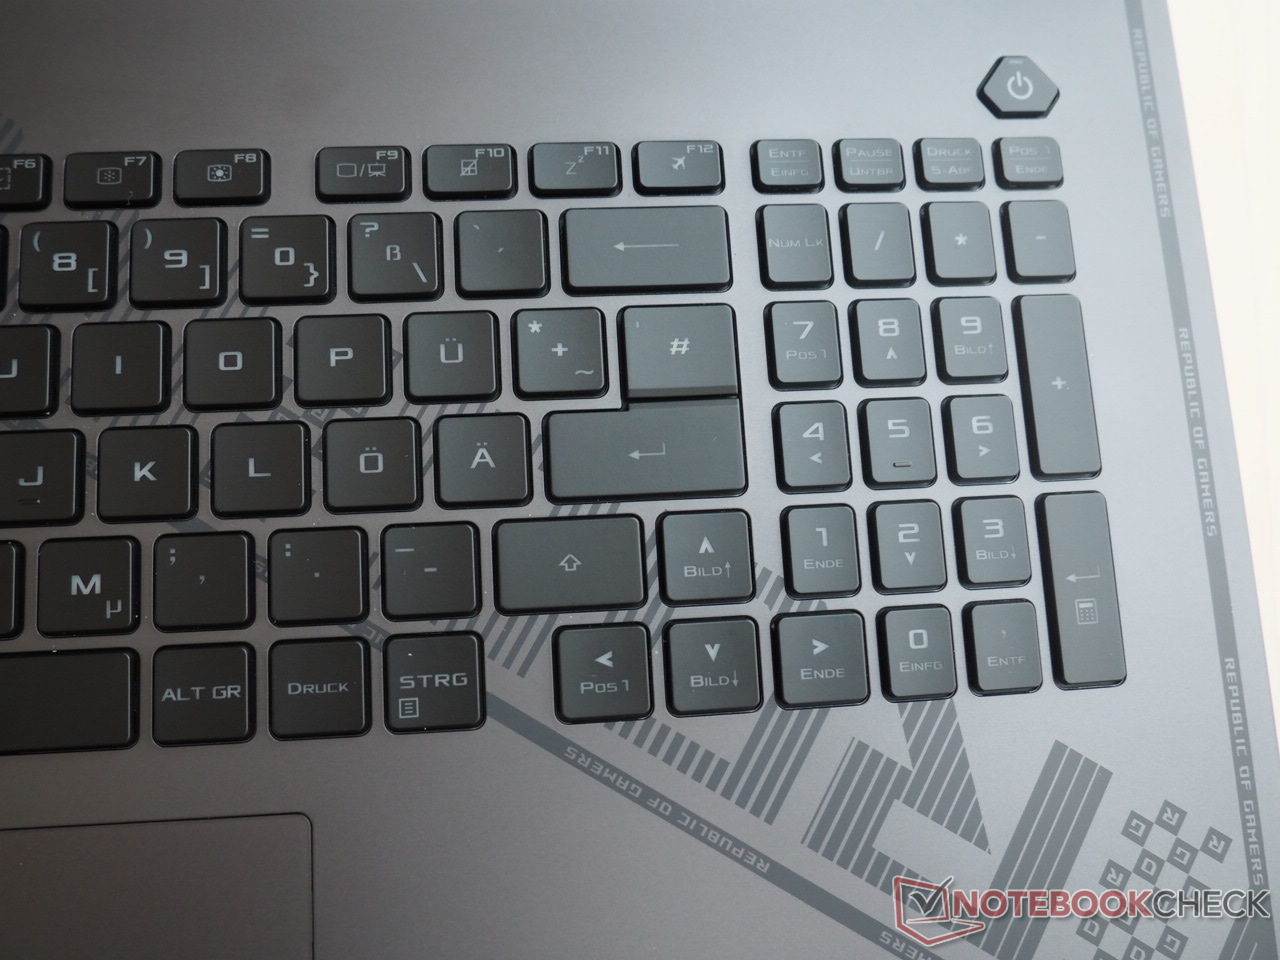
关于键盘,我们有不同的感受。例如,虽然方向键(与许多其他笔记本电脑不同)尺寸不错,但考虑到18英寸的格式,数字键盘键和F行可以更大。这种布局不太可能吸引所有人。例如,德国用户不得不使用单行的回车键。一些按键组合,如Del/Insert,也是相当不利的。
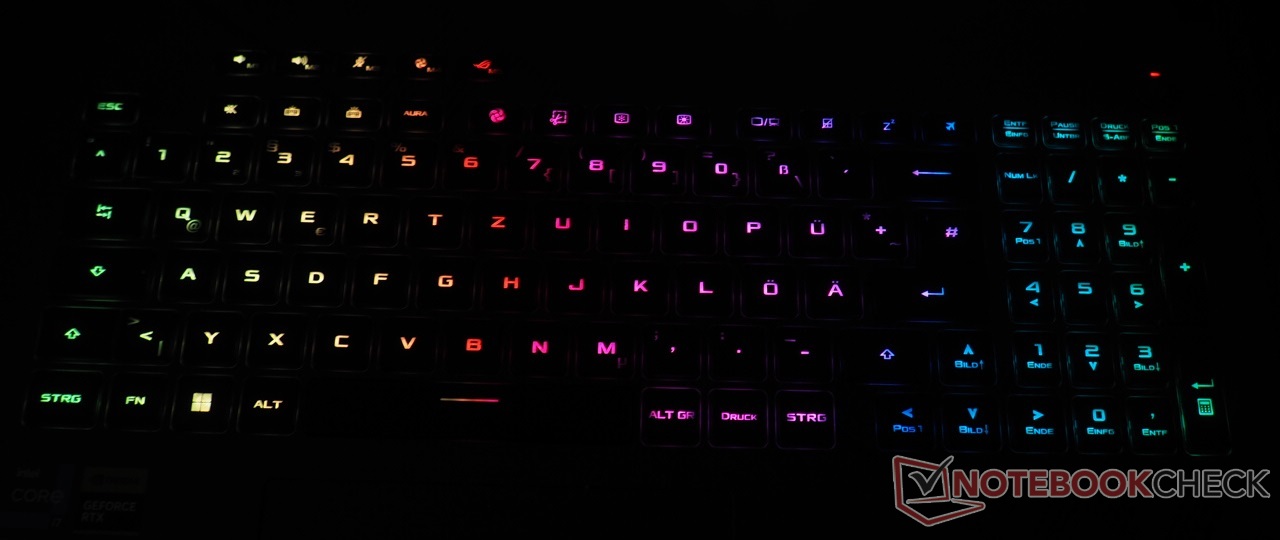
打字体验也是如此。虽然这在很大程度上是可以接受的--由于基本单元具有良好的稳定性--但它可以更明确一点(有点糊糊的反馈),特别是与一些游戏笔记本电脑中的机械键盘相比。实用的特殊按键和良好的单键RGB照明被授予了加分,它享有各种模式和多级定制。
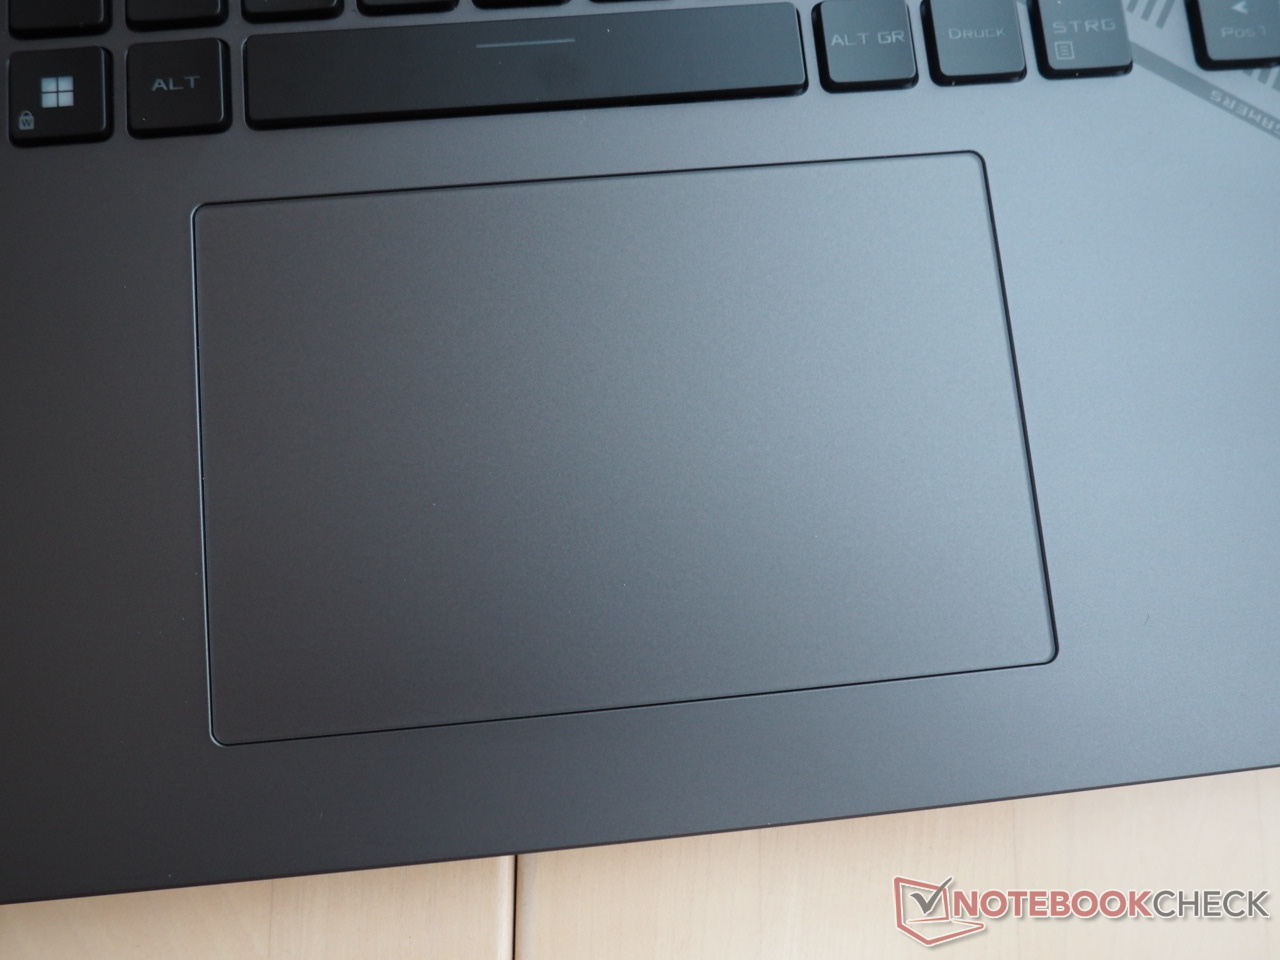
触摸板
在某种程度上,触摸板也受到了次优机箱稳定性的影响。与机箱类似,它有时相当吱吱作响,在这个价位上不应该是这样的情况。除此以外,这款替代鼠标给人留下了一流的印象。由于其光滑的表面和宽大的尺寸(13 x 8.5厘米),诸如滚动一长串图像的输入很容易处理,特别是由于精确度很高。
显示
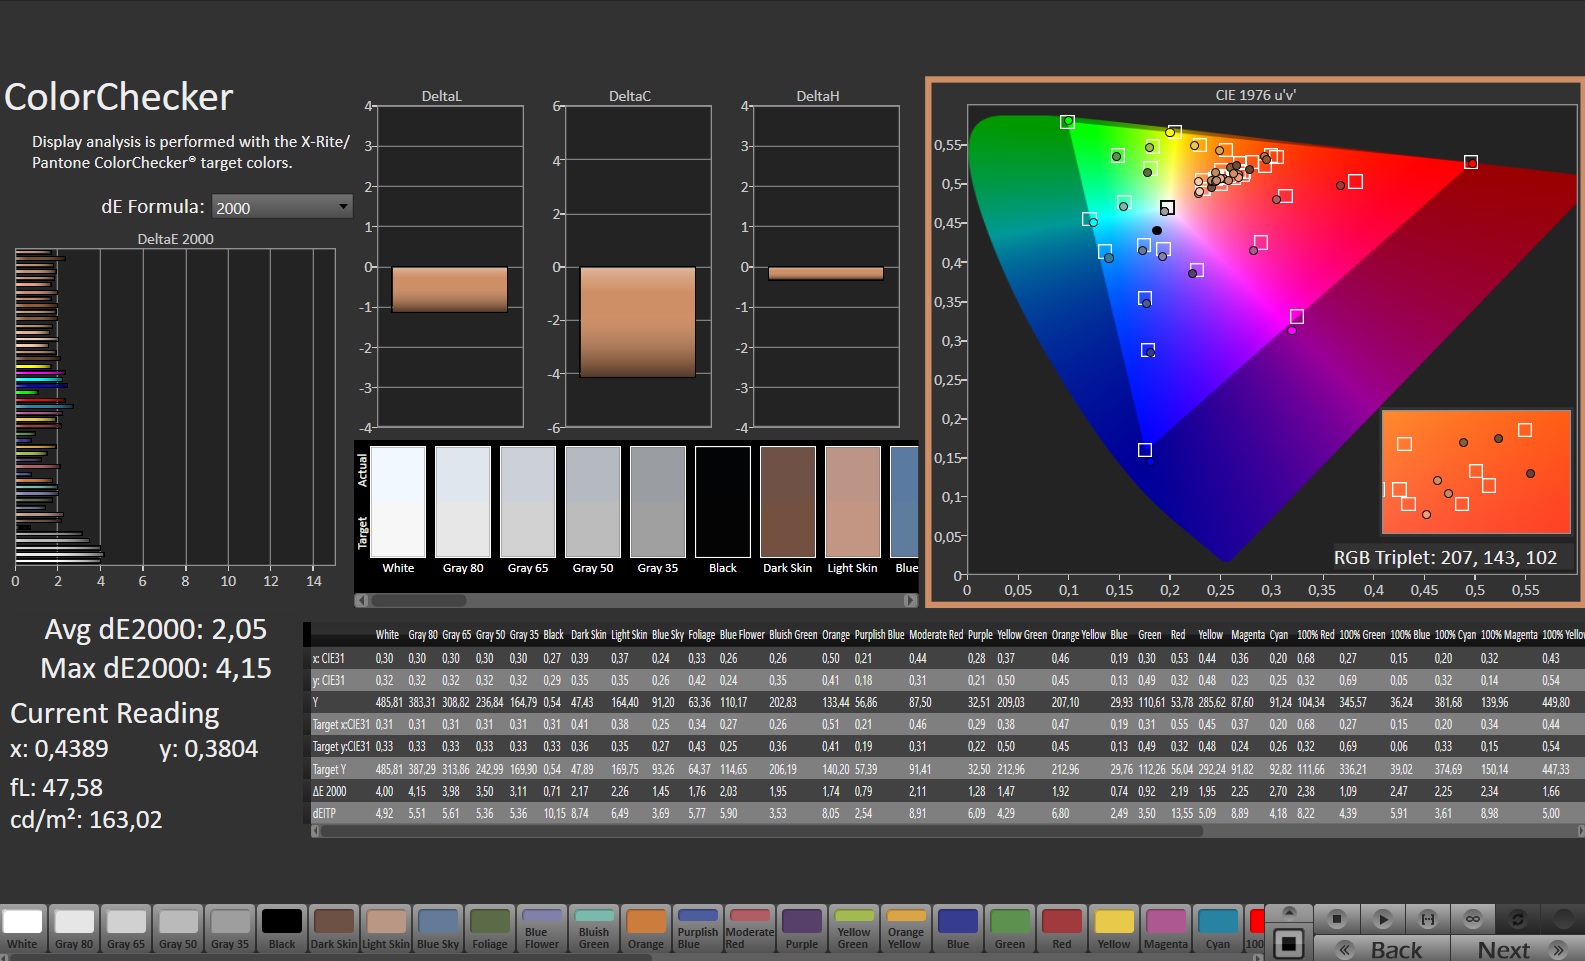
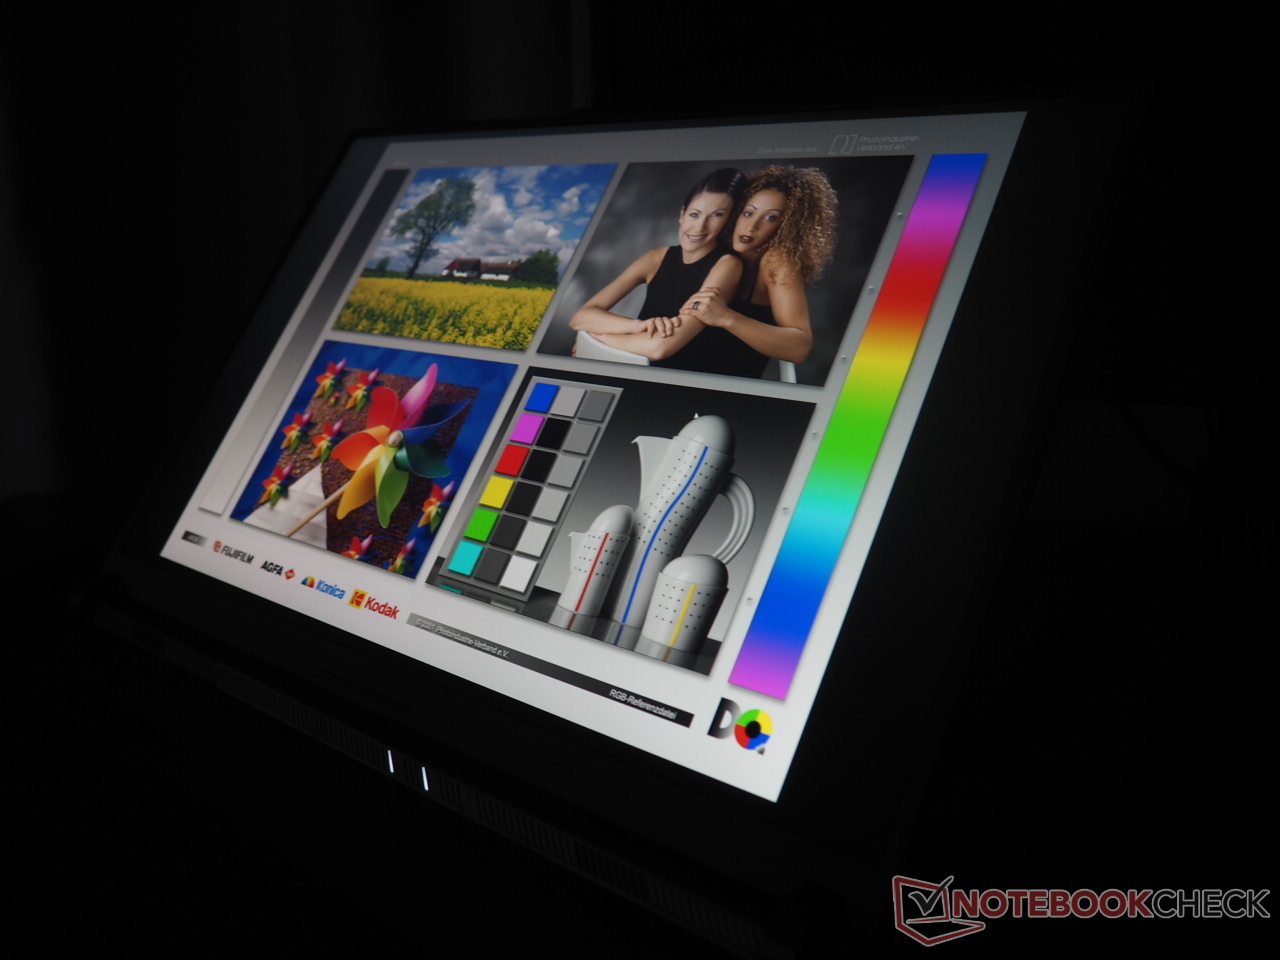
G18的最大亮点之一是良好的显示效果。虽然面板没有达到华硕宣传的500尼特--这可能与预校准有关--但平均420cd/m²的亮度对于IPs面板来说还是不错的,可以偶尔在户外使用。
| |||||||||||||||||||||||||
Brightness Distribution: 83 %
Center on Battery: 471 cd/m²
Contrast: 1002:1 (Black: 0.47 cd/m²)
ΔE ColorChecker Calman: 2.05 | ∀{0.5-29.43 Ø4.71}
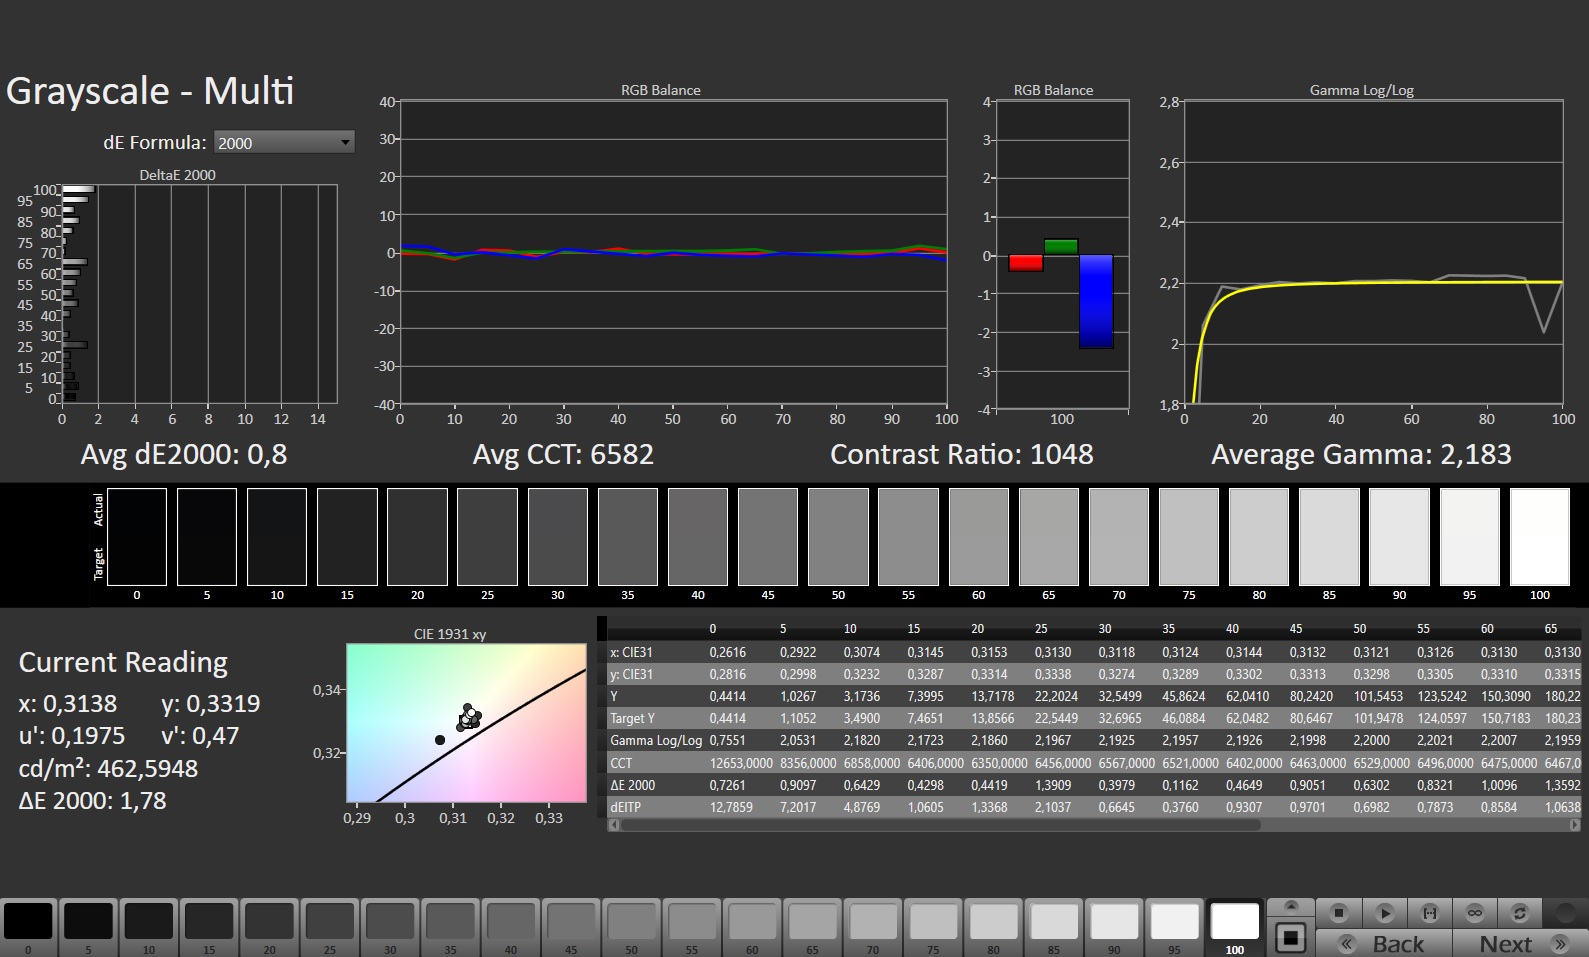
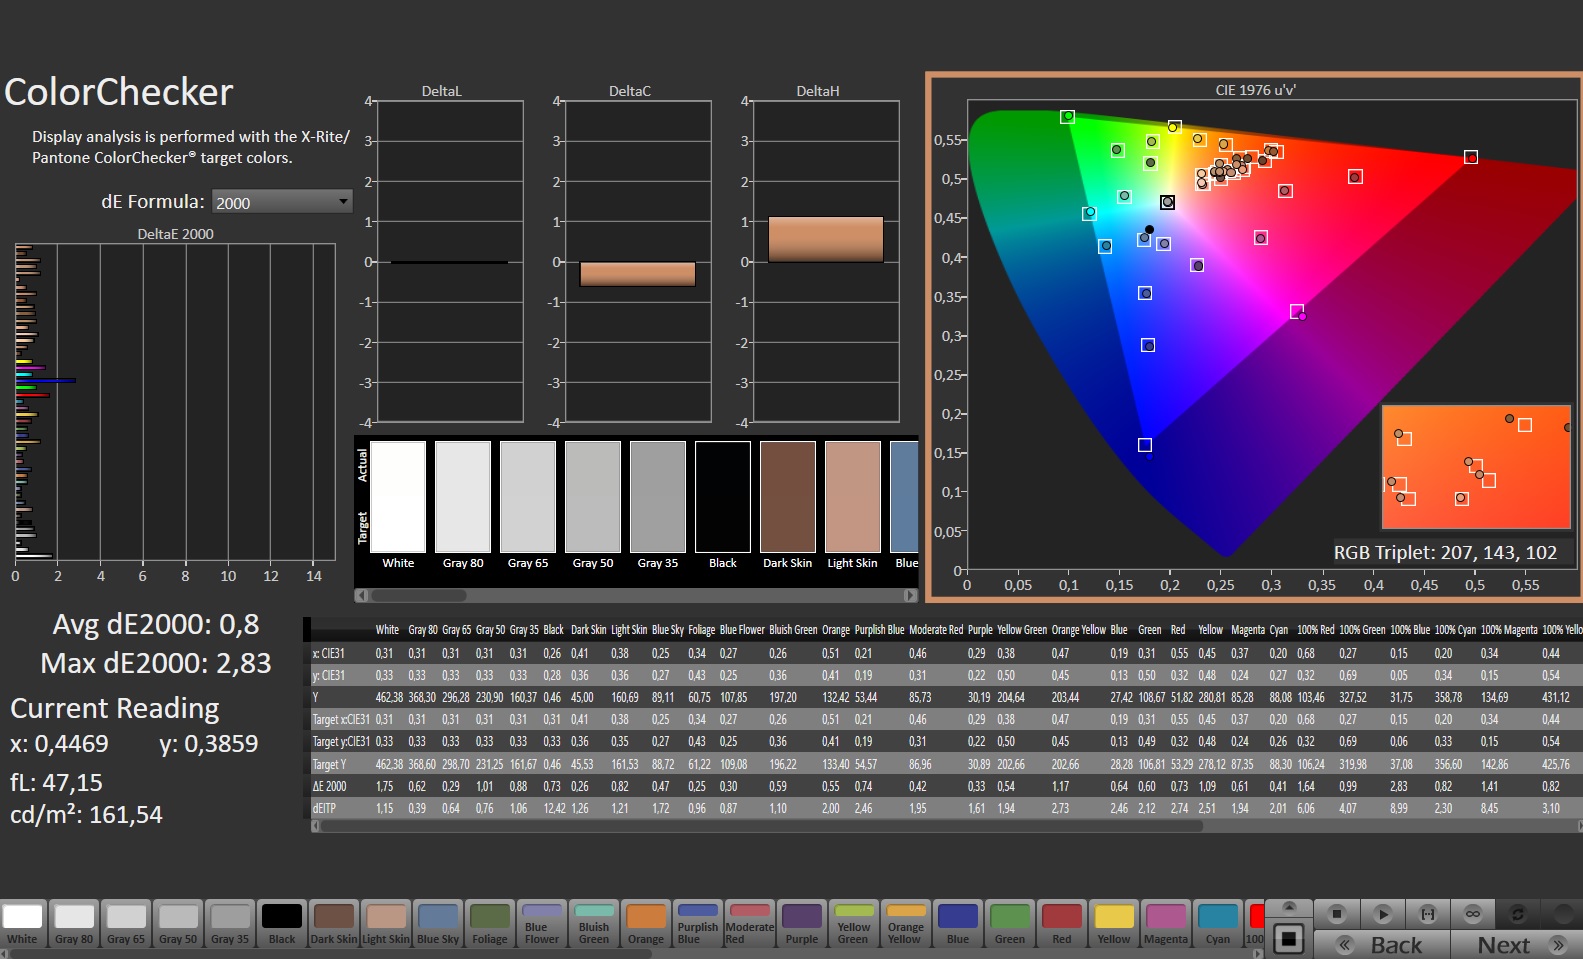
calibrated: 0.8
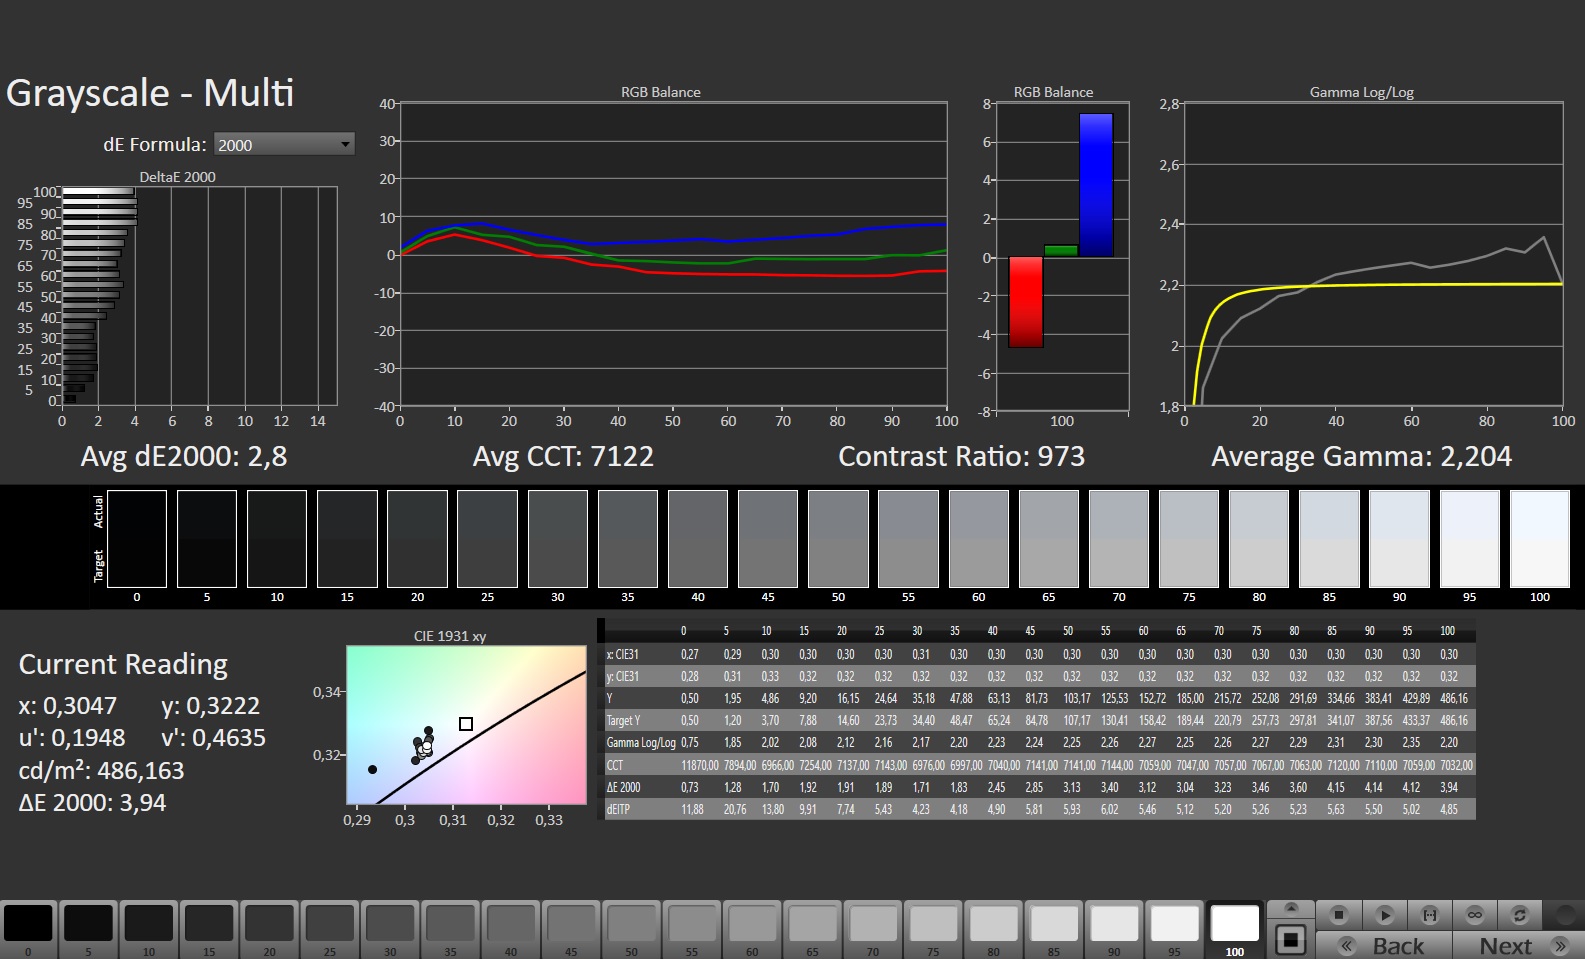
ΔE Greyscale Calman: 2.8 | ∀{0.09-98 Ø4.96}
85.6% AdobeRGB 1998 (Argyll 3D)
99.9% sRGB (Argyll 3D)
98.1% Display P3 (Argyll 3D)
Gamma: 2.204
CCT: 7122 K
| Asus ROG Strix G18 G814JI NE180QDM-NZ2 (BOE0B35), IPS, 2560x1600, 18" | Razer Blade 18 RTX 4070 AU Optronics B180QAN01.0, IPS, 2560x1600, 18" | Gigabyte A7 X1 AU Optronics AUO8E8D, IPS, 1920x1080, 17.3" | Lenovo Legion 5 Pro 16ARH7H RTX 3070 Ti BOE CQ NE160QDM-NY1, IPS, 2560x1600, 16" | Alienware x17 RTX 3080 P48E AU Optronics B173ZAN, IPS, 3840x2160, 17.3" | MSI Raider GE77 HX 12UHS AU Optronics B173ZAN06.1, IPS, 3840x2160, 17.3" | |
|---|---|---|---|---|---|---|
| Display | -0% | -24% | -18% | 2% | -1% | |
| Display P3 Coverage (%) | 98.1 | 96.9 -1% | 61.5 -37% | 67.3 -31% | 88.3 -10% | 96.6 -2% |
| sRGB Coverage (%) | 99.9 | 99.8 0% | 90.9 -9% | 96.1 -4% | 100 0% | 99.8 0% |
| AdobeRGB 1998 Coverage (%) | 85.6 | 85.3 0% | 63.2 -26% | 69.5 -19% | 100 17% | 85.8 0% |
| Response Times | 18% | -103% | -91% | -87% | 17% | |
| Response Time Grey 50% / Grey 80% * (ms) | 5.6 ? | 4.2 ? 25% | 16 ? -186% | 14.4 ? -157% | 14.4 ? -157% | 5.8 ? -4% |
| Response Time Black / White * (ms) | 9 ? | 8 ? 11% | 10.8 ? -20% | 11.2 ? -24% | 10.4 ? -16% | 5.6 ? 38% |
| PWM Frequency (Hz) | ||||||
| Screen | -33% | -50% | 1% | -19% | -47% | |
| Brightness middle (cd/m²) | 471 | 549.6 17% | 325 -31% | 522.8 11% | 438.7 -7% | 381 -19% |
| Brightness (cd/m²) | 422 | 524 24% | 318 -25% | 503 19% | 435 3% | 371 -12% |
| Brightness Distribution (%) | 83 | 89 7% | 95 14% | 84 1% | 91 10% | 84 1% |
| Black Level * (cd/m²) | 0.47 | 0.53 -13% | 0.29 38% | 0.41 13% | 0.48 -2% | 0.52 -11% |
| Contrast (:1) | 1002 | 1037 3% | 1121 12% | 1275 27% | 914 -9% | 733 -27% |
| Colorchecker dE 2000 * | 2.05 | 3.32 -62% | 4.33 -111% | 2.47 -20% | 4.34 -112% | |
| Colorchecker dE 2000 max. * | 4.15 | 6.63 -60% | 8.6 -107% | 6.56 -58% | 7.3 -76% | |
| Colorchecker dE 2000 calibrated * | 0.8 | 2.7 -238% | 1.95 -144% | 0.61 24% | 0.72 10% | 2.53 -216% |
| Greyscale dE 2000 * | 2.8 | 2 29% | 5.5 -96% | 3 -7% | 2.4 14% | |
| Gamma | 2.204 100% | 2.29 96% | 2.142 103% | 2.27 97% | 2.09 105% | |
| CCT | 7122 91% | 6319 103% | 7893 82% | 6719 97% | 6413 101% | |
| Total Average (Program / Settings) | -5% /
-18% | -59% /
-52% | -36% /
-16% | -35% /
-24% | -10% /
-23% |
* ... smaller is better
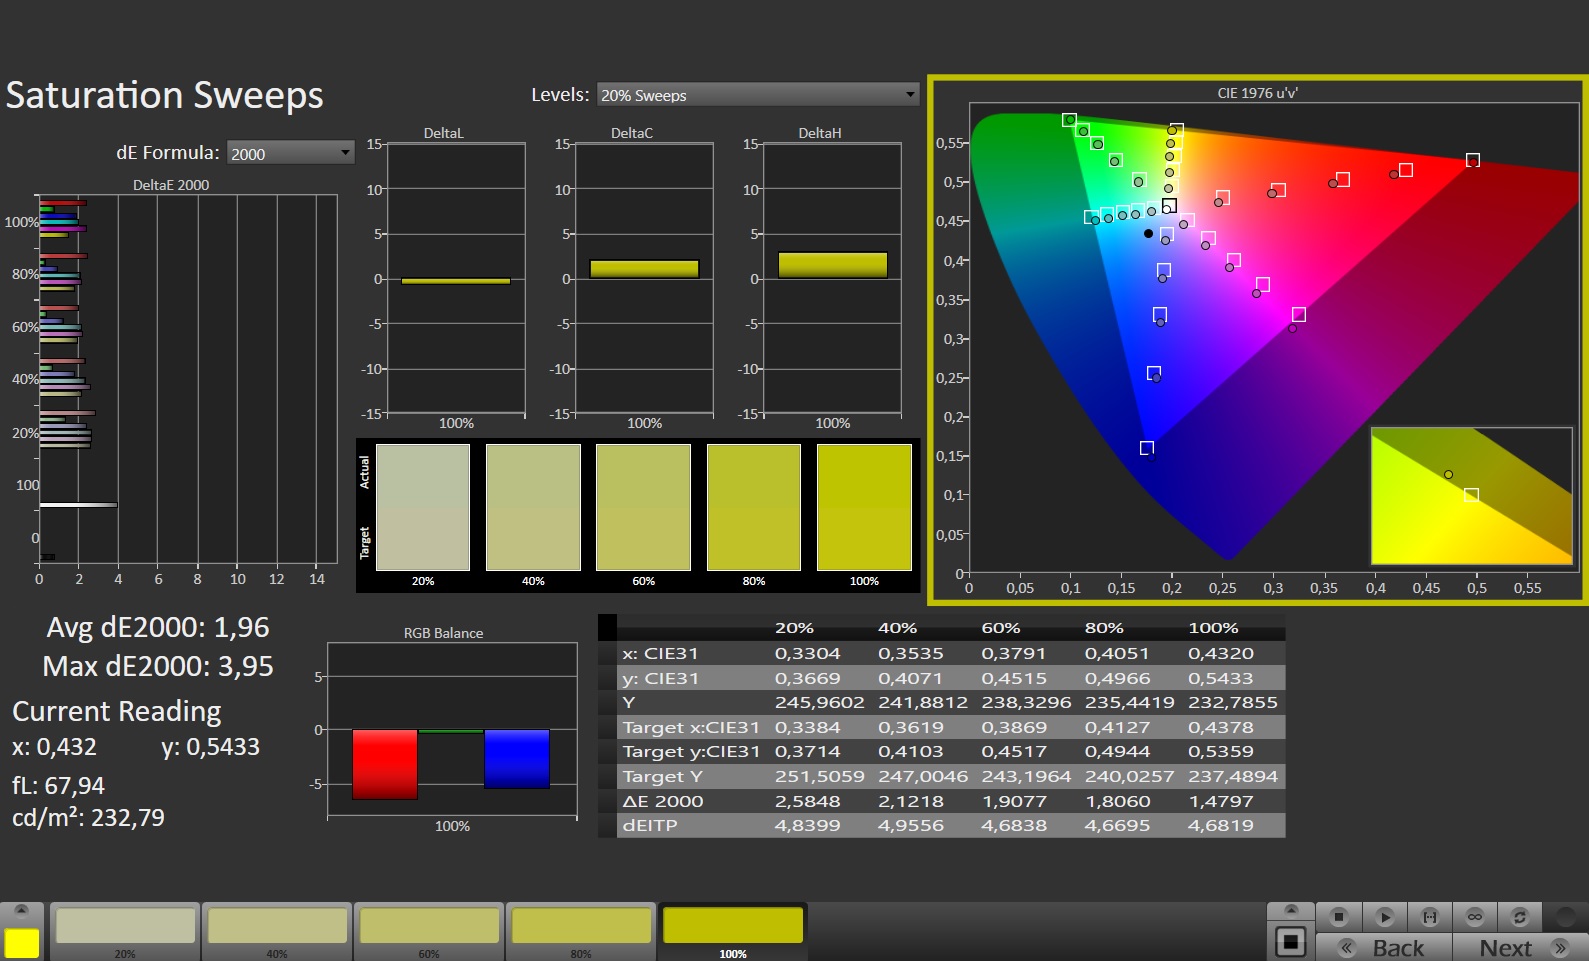
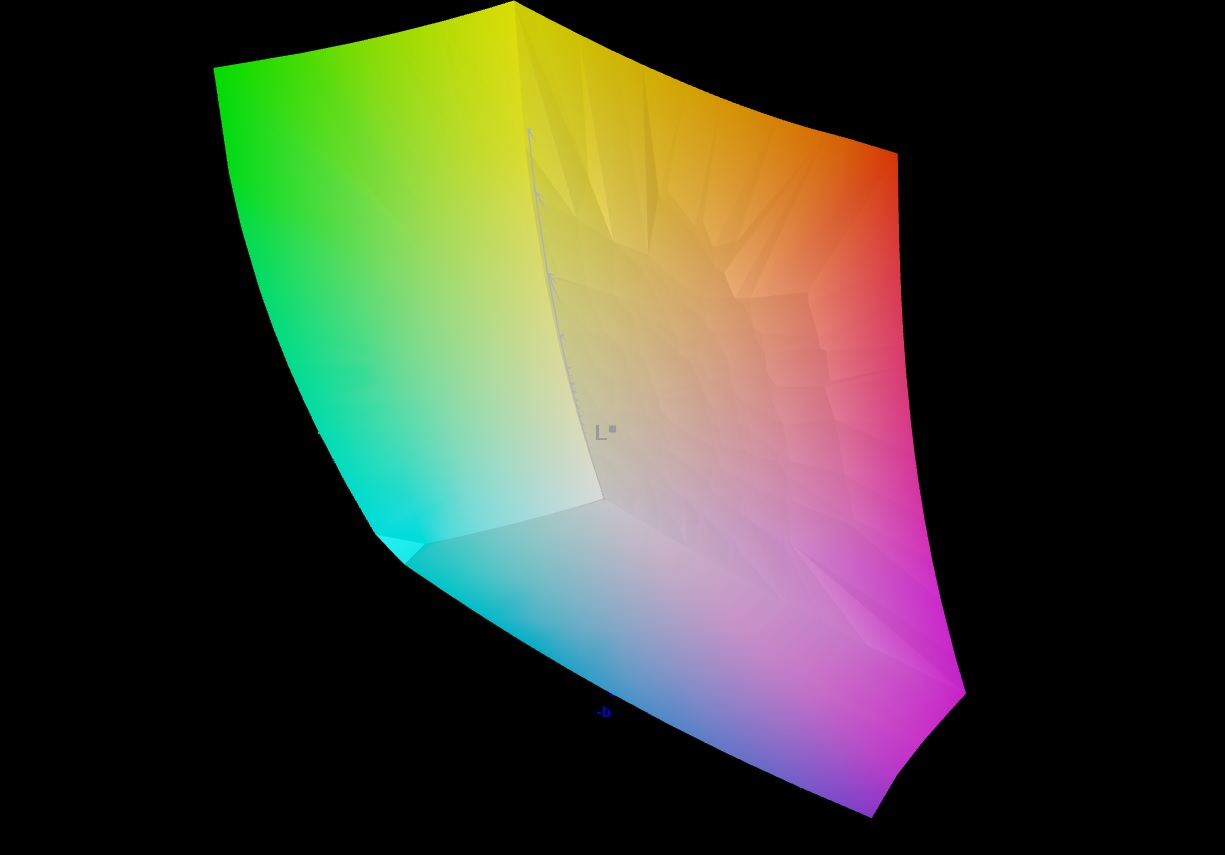
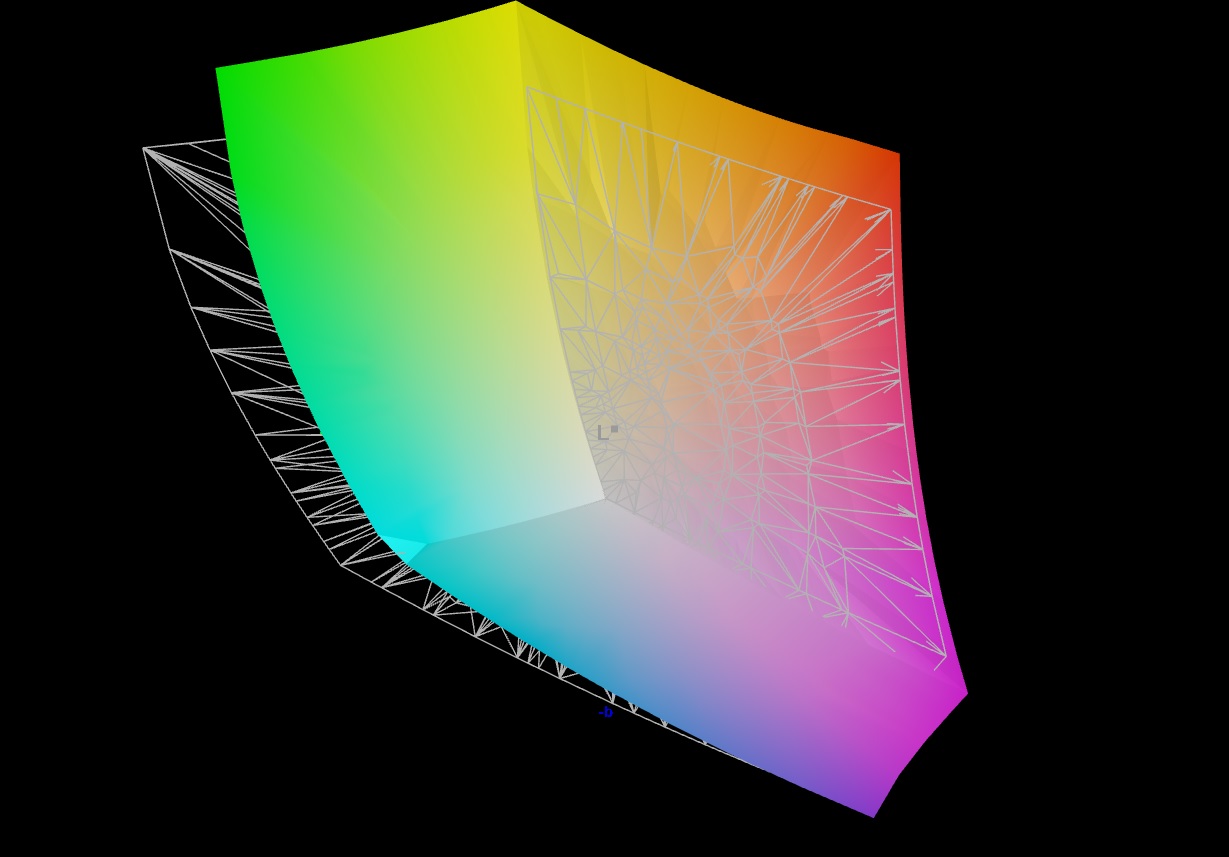
专业用户会对笔记本电脑的色彩空间感到满意。根据我们的测量,G18能够处理100%的sRGB、98%的P3和86%的AdobeRGB--总之,结果令人印象深刻。在色彩重现方面也几乎没有任何需要批评的地方。开箱即用,其数值处于理想范围(DeltaE小于3),从而确保了非常自然的色彩。
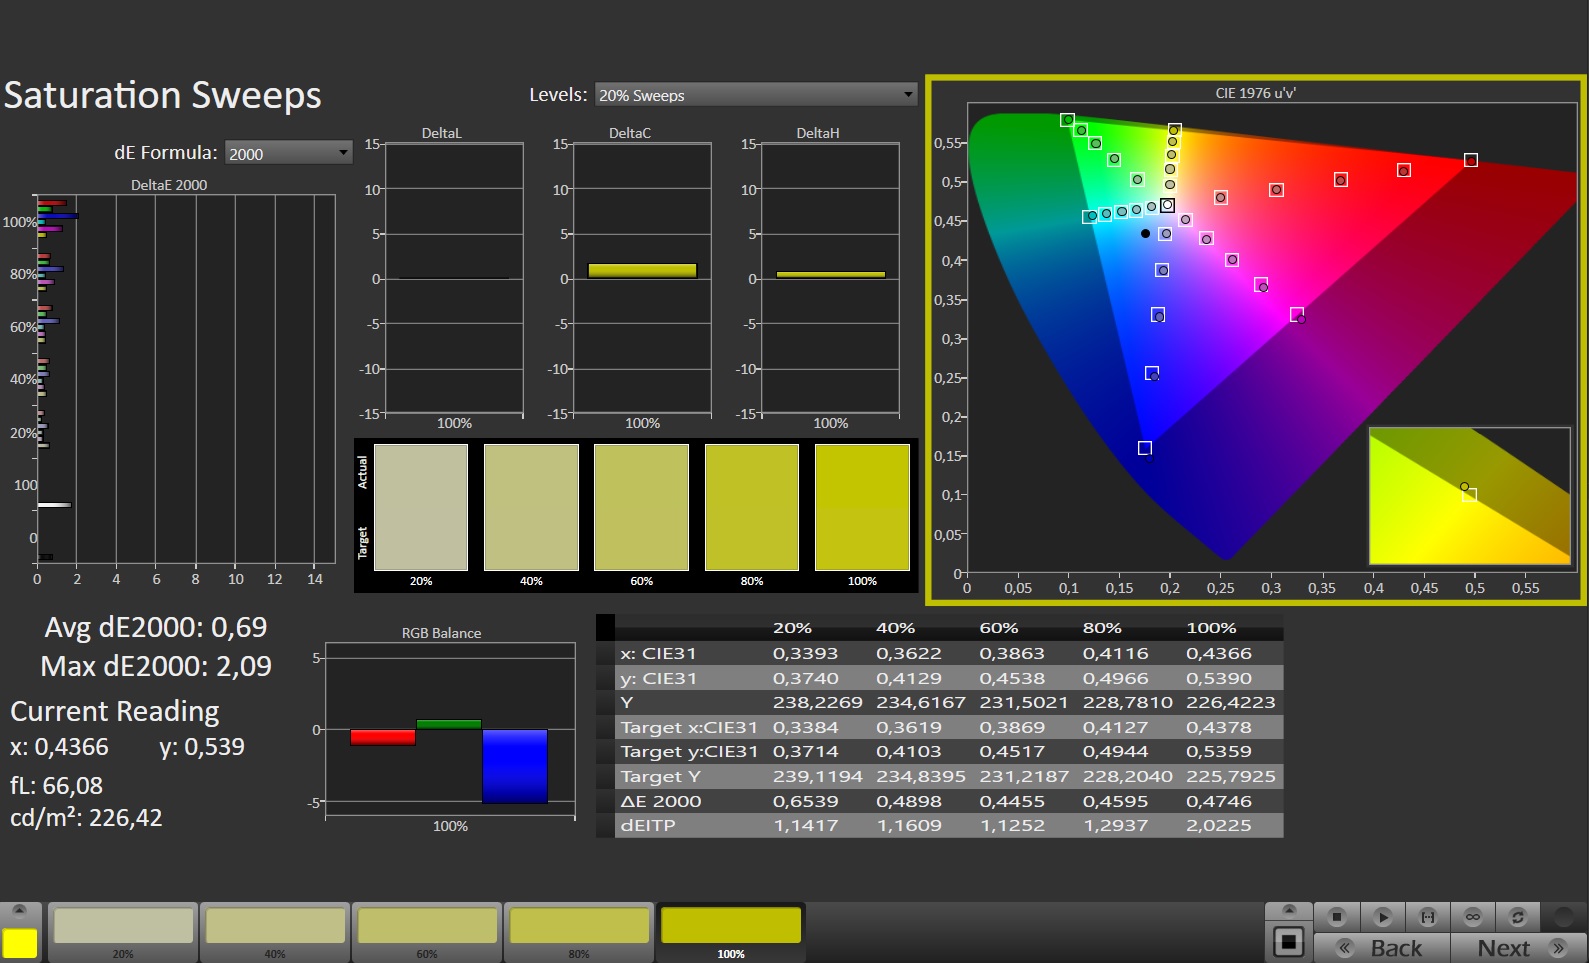
然而,不仅是创作者,而且游戏玩家也得到了他们的钱:由于响应时间短(低于10毫秒),G18甚至很适合节奏更快的游戏。我们没有发现任何显示闪烁(如PWM)。

另一方面,评测设备在屏幕出血方面有困难,特别是在面板的角落。然而,这并不是在任何情况下都能注意到的。对比度(约1.000:1)和黑色水平(0.47 cd/m²)也不太完美,Blade 18在这方面的得分也差不多。相比之下,可视角度相当好,是典型的IPS面板。
Display Response Times
| ↔ Response Time Black to White | ||
|---|---|---|
| 9 ms ... rise ↗ and fall ↘ combined | ↗ 4 ms rise | 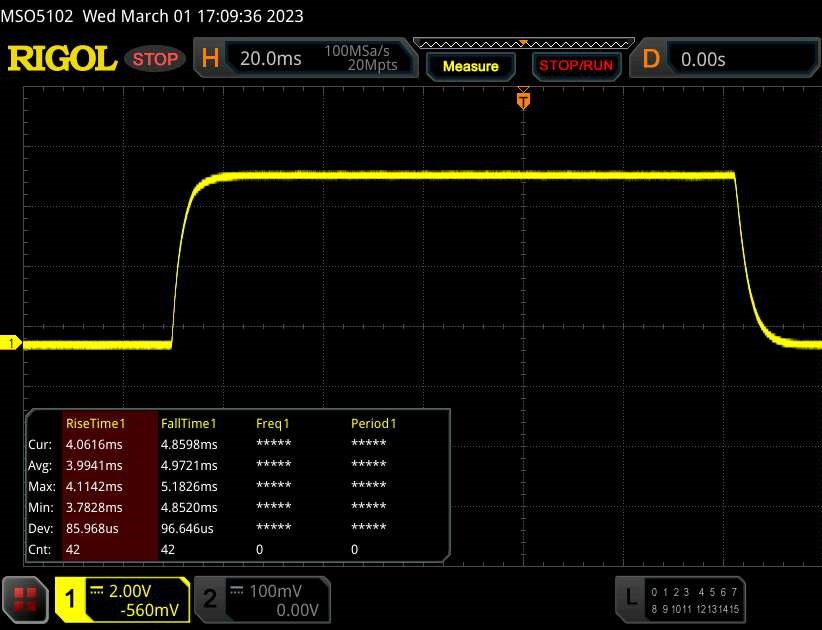 |
| ↘ 5 ms fall | ||
| The screen shows fast response rates in our tests and should be suited for gaming. In comparison, all tested devices range from 0.1 (minimum) to 240 (maximum) ms. » 25 % of all devices are better. This means that the measured response time is better than the average of all tested devices (19.8 ms). | ||
| ↔ Response Time 50% Grey to 80% Grey | ||
| 5.6 ms ... rise ↗ and fall ↘ combined | ↗ 2.7 ms rise | 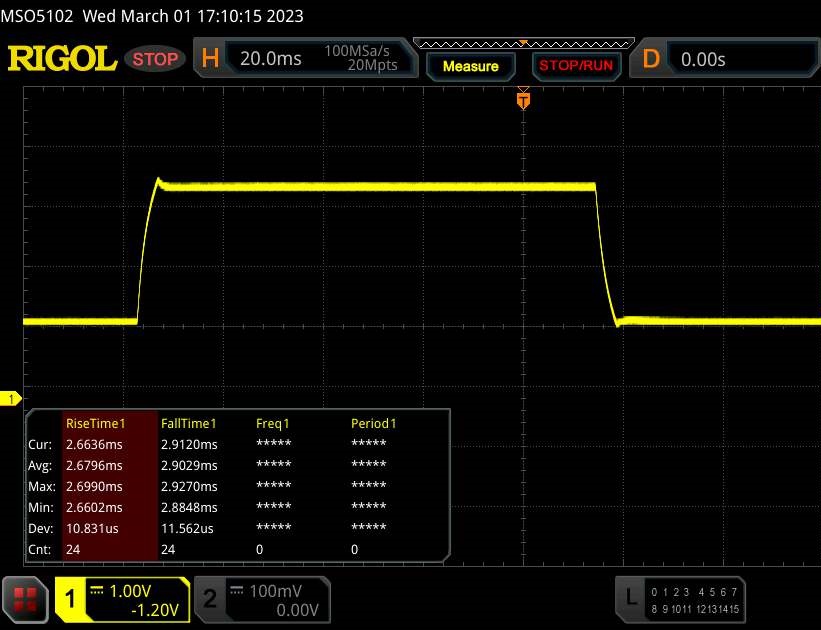 |
| ↘ 2.9 ms fall | ||
| The screen shows very fast response rates in our tests and should be very well suited for fast-paced gaming. In comparison, all tested devices range from 0.165 (minimum) to 636 (maximum) ms. » 18 % of all devices are better. This means that the measured response time is better than the average of all tested devices (31 ms). | ||
Screen Flickering / PWM (Pulse-Width Modulation)
| Screen flickering / PWM not detected | 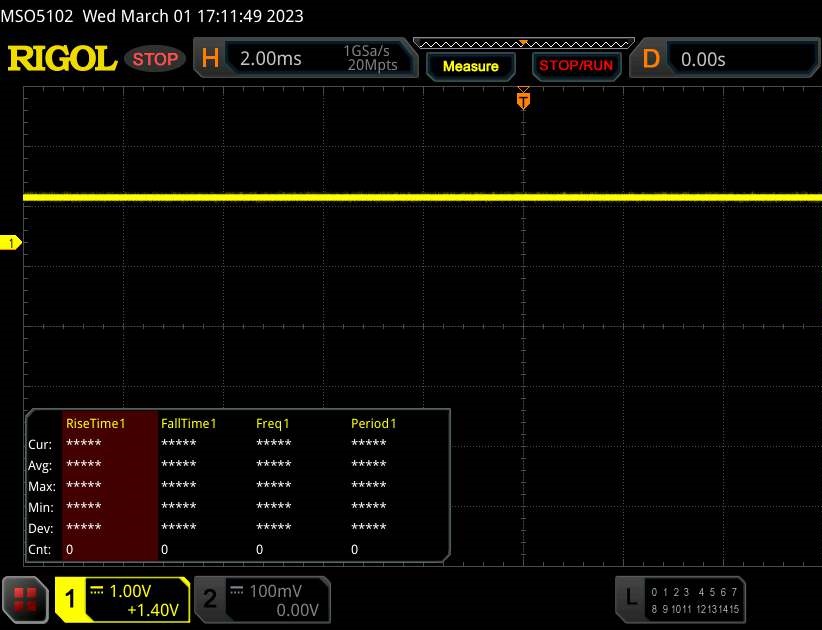 | ||
In comparison: 52 % of all tested devices do not use PWM to dim the display. If PWM was detected, an average of 7757 (minimum: 5 - maximum: 343500) Hz was measured. | |||
业绩
根据不同的规格,Strix G18可以被看作是一款中档或低档的笔记本电脑,32GB的内存可能足以满足未来一年的需求。如果固态硬盘的存储容量达不到要求,该设备可以很容易地用第二个M.2驱动器进行升级。
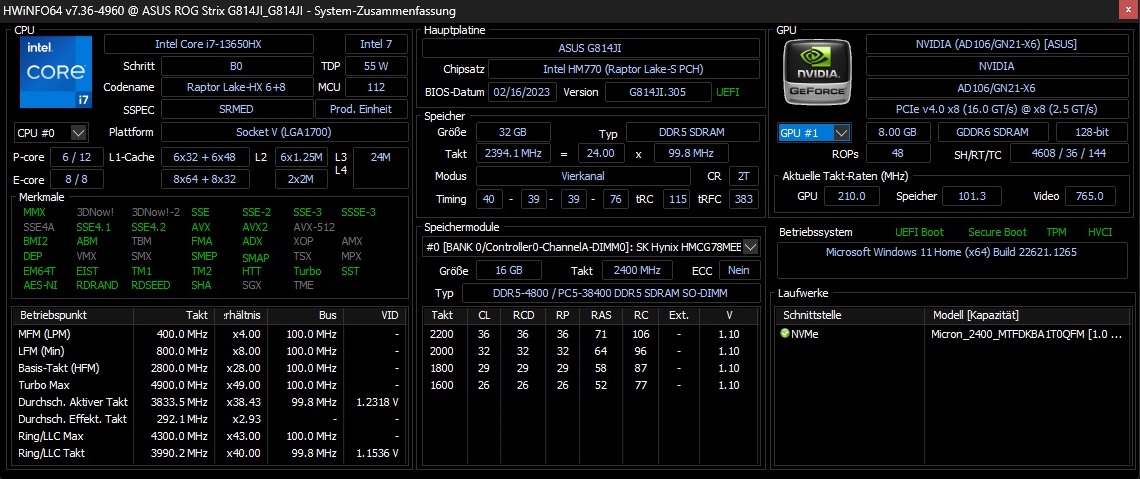
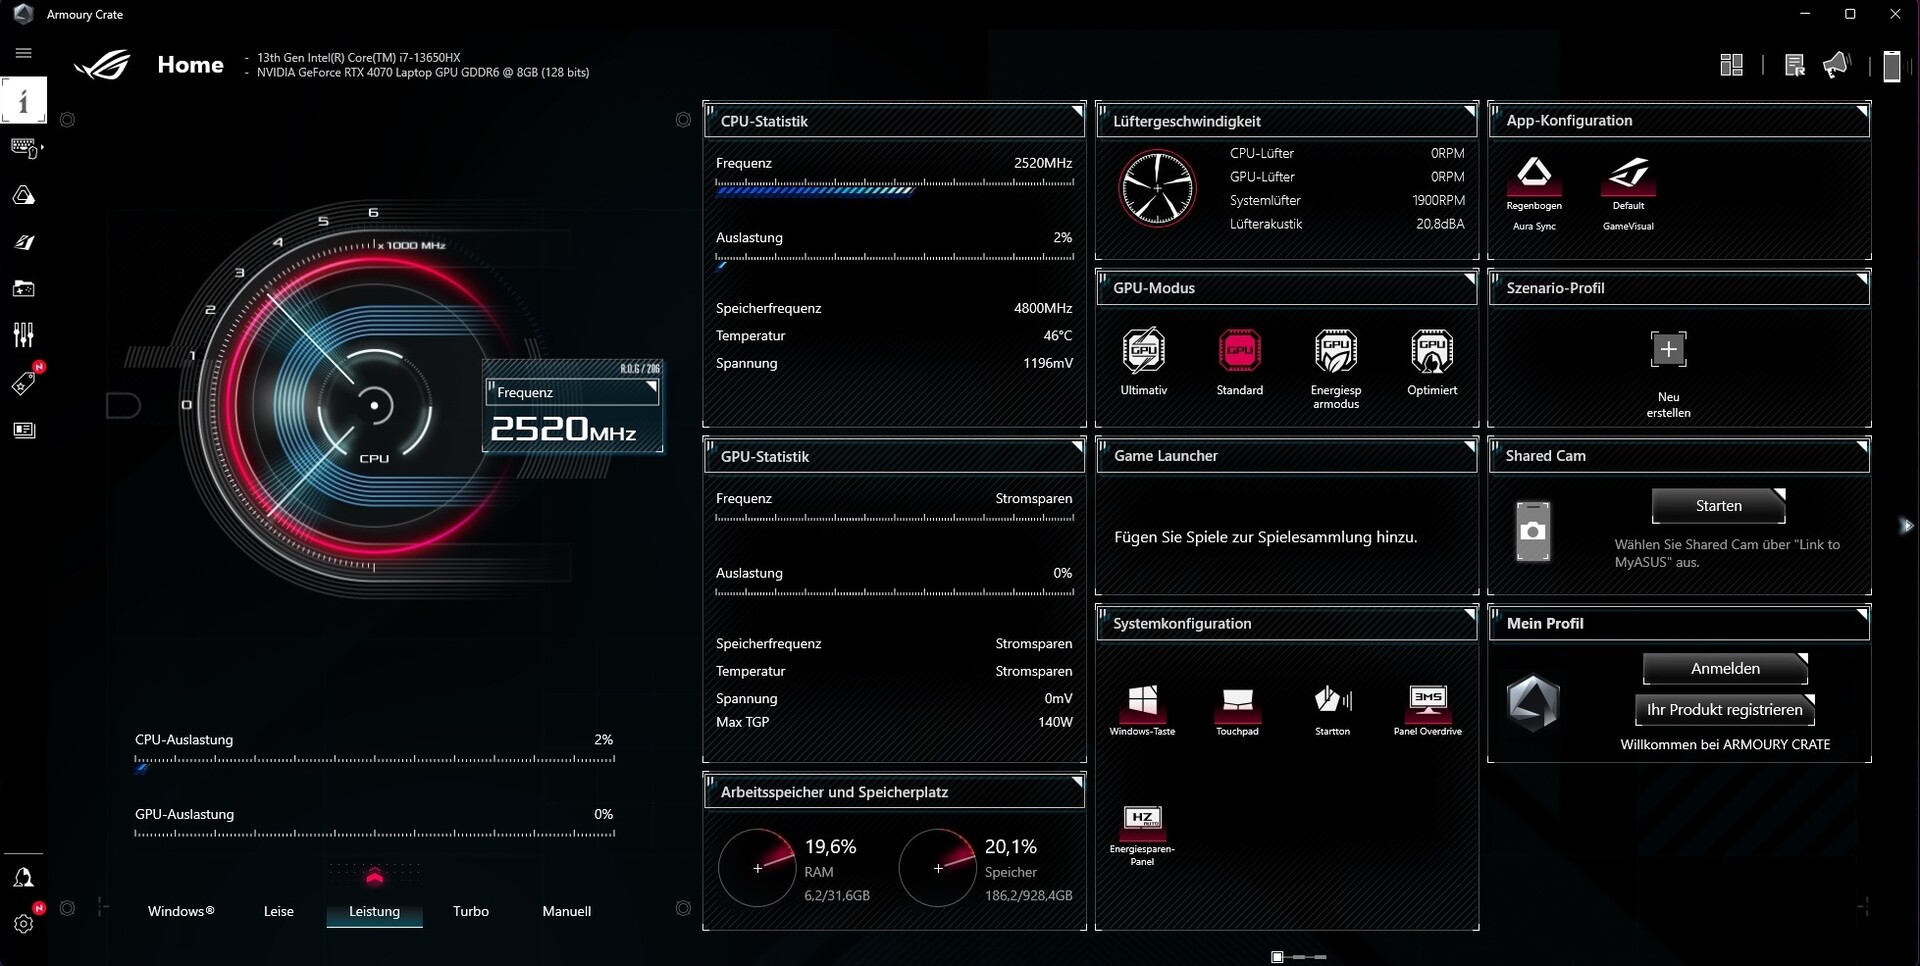
测试条件
许多参数可以在强大但也相当杂乱和混乱的Armoury Crate中设置。我们的测量是使用GPU的 "标准"(主动图形切换)和 "性能 "模式进行的。很奇怪。使用 "安静 "或 "涡轮 "模式,风扇的行为发生了变化,但在TheWitcher 3 测试中的性能保持不变。这表明这里存在问题或错误。
| 静音模式 | 性能模式 | 涡轮模式 | |
| CPU PL1 (HWiNFO) | 80 W | 110 W | 170 W |
| CPU PL2 (HWiNFO) | 100 W | 120 W | 175 W |
| 噪音 (Witcher 3) | 38 - 40 dB(A) | 42 - 44 dB(A) | 51 dB(A) |
| 性能 (Witcher 3) | ~120 FPS | ~120 FPS | ~120 FPS |
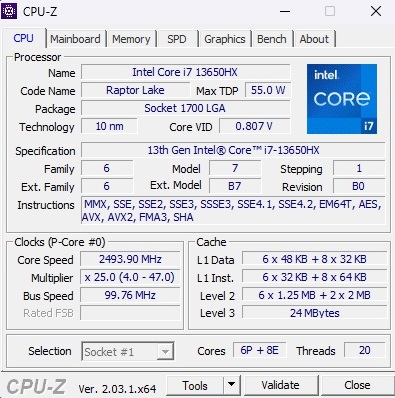
处理器
酷睿i7-13650HX来自英特尔全新的Raptor Lake系列,基本TDP为55瓦。14个可用的核心分为6个包括超线程的性能核心和8个不含超线程的效率核心,总共可以有20个线程。根据核心的类型,时钟速度可以有很大的变化,性能变体的时钟速度可以达到4.9GHz。
尽管i7-13650HX的性能比Core i7-12900HX低10%左右,比Core i9-13950HX低20%左右。 酷睿i9-13950HX在基准测试过程中,这些支持多达24个线程。在竞争的笔记本电脑中发现的通常明显较老的CPU--(Ryzen 7 6800H, Ryzen 9 5900HX& 酷睿i7-11800H)--通常被抛在后面。
Cinebench R15 Multi Continuous Test
* ... smaller is better
AIDA64: FP32 Ray-Trace | FPU Julia | CPU SHA3 | CPU Queen | FPU SinJulia | FPU Mandel | CPU AES | CPU ZLib | FP64 Ray-Trace | CPU PhotoWorxx
| Performance rating | |
| Average of class Gaming | |
| Razer Blade 18 RTX 4070 | |
| MSI Raider GE77 HX 12UHS | |
| Asus ROG Strix G18 G814JI | |
| Lenovo Legion 5 Pro 16ARH7H RTX 3070 Ti | |
| Average Intel Core i7-13650HX | |
| Gigabyte A7 X1 | |
| Alienware x17 RTX 3080 P48E -9! | |
| AIDA64 / FP32 Ray-Trace | |
| Average of class Gaming (10227 - 85542, n=105, last 2 years) | |
| Razer Blade 18 RTX 4070 | |
| Asus ROG Strix G18 G814JI | |
| MSI Raider GE77 HX 12UHS | |
| Average Intel Core i7-13650HX (13404 - 20012, n=5) | |
| Lenovo Legion 5 Pro 16ARH7H RTX 3070 Ti | |
| Gigabyte A7 X1 | |
| AIDA64 / FPU Julia | |
| Average of class Gaming (51376 - 238426, n=105, last 2 years) | |
| Razer Blade 18 RTX 4070 | |
| MSI Raider GE77 HX 12UHS | |
| Lenovo Legion 5 Pro 16ARH7H RTX 3070 Ti | |
| Asus ROG Strix G18 G814JI | |
| Gigabyte A7 X1 | |
| Average Intel Core i7-13650HX (68241 - 97317, n=5) | |
| AIDA64 / CPU SHA3 | |
| Average of class Gaming (2180 - 10115, n=105, last 2 years) | |
| Razer Blade 18 RTX 4070 | |
| MSI Raider GE77 HX 12UHS | |
| Asus ROG Strix G18 G814JI | |
| Average Intel Core i7-13650HX (3127 - 4487, n=5) | |
| Lenovo Legion 5 Pro 16ARH7H RTX 3070 Ti | |
| Gigabyte A7 X1 | |
| AIDA64 / CPU Queen | |
| Razer Blade 18 RTX 4070 | |
| Average of class Gaming (49785 - 173351, n=90, last 2 years) | |
| Asus ROG Strix G18 G814JI | |
| Average Intel Core i7-13650HX (108627 - 110589, n=5) | |
| Lenovo Legion 5 Pro 16ARH7H RTX 3070 Ti | |
| MSI Raider GE77 HX 12UHS | |
| Gigabyte A7 X1 | |
| AIDA64 / FPU SinJulia | |
| Razer Blade 18 RTX 4070 | |
| Average of class Gaming (4424 - 33636, n=105, last 2 years) | |
| MSI Raider GE77 HX 12UHS | |
| Lenovo Legion 5 Pro 16ARH7H RTX 3070 Ti | |
| Gigabyte A7 X1 | |
| Asus ROG Strix G18 G814JI | |
| Average Intel Core i7-13650HX (9134 - 10887, n=5) | |
| AIDA64 / FPU Mandel | |
| Average of class Gaming (25115 - 128721, n=105, last 2 years) | |
| Razer Blade 18 RTX 4070 | |
| Lenovo Legion 5 Pro 16ARH7H RTX 3070 Ti | |
| MSI Raider GE77 HX 12UHS | |
| Gigabyte A7 X1 | |
| Asus ROG Strix G18 G814JI | |
| Average Intel Core i7-13650HX (33391 - 48323, n=5) | |
| AIDA64 / CPU AES | |
| MSI Raider GE77 HX 12UHS | |
| Lenovo Legion 5 Pro 16ARH7H RTX 3070 Ti | |
| Gigabyte A7 X1 | |
| Razer Blade 18 RTX 4070 | |
| Average of class Gaming (39258 - 247074, n=105, last 2 years) | |
| Asus ROG Strix G18 G814JI | |
| Average Intel Core i7-13650HX (64436 - 85343, n=5) | |
| AIDA64 / CPU ZLib | |
| Razer Blade 18 RTX 4070 | |
| Average of class Gaming (574 - 2531, n=105, last 2 years) | |
| MSI Raider GE77 HX 12UHS | |
| Asus ROG Strix G18 G814JI | |
| Average Intel Core i7-13650HX (1136 - 1285, n=5) | |
| Lenovo Legion 5 Pro 16ARH7H RTX 3070 Ti | |
| Gigabyte A7 X1 | |
| Alienware x17 RTX 3080 P48E | |
| AIDA64 / FP64 Ray-Trace | |
| Average of class Gaming (5509 - 45446, n=105, last 2 years) | |
| Razer Blade 18 RTX 4070 | |
| Asus ROG Strix G18 G814JI | |
| MSI Raider GE77 HX 12UHS | |
| Average Intel Core i7-13650HX (7270 - 10900, n=5) | |
| Lenovo Legion 5 Pro 16ARH7H RTX 3070 Ti | |
| Gigabyte A7 X1 | |
| AIDA64 / CPU PhotoWorxx | |
| Razer Blade 18 RTX 4070 | |
| MSI Raider GE77 HX 12UHS | |
| Average of class Gaming (12271 - 89891, n=105, last 2 years) | |
| Asus ROG Strix G18 G814JI | |
| Average Intel Core i7-13650HX (36170 - 43289, n=5) | |
| Lenovo Legion 5 Pro 16ARH7H RTX 3070 Ti | |
| Gigabyte A7 X1 | |
系统性能
华硕应该在系统性能上下功夫。类似于最近审查的 TUF Gaming A16当打开程序时,图形切换会导致恼人的冻结,有时会持续几秒钟。由于SSD性能也不能完全跟上竞争,PCMark 10基准测试只能确保最后一名。Razer Blade 18的鼻子在前面,几乎占了20%。
CrossMark: Overall | Productivity | Creativity | Responsiveness
| PCMark 10 / Score | |
| Average of class Gaming (5828 - 12414, n=93, last 2 years) | |
| Razer Blade 18 RTX 4070 | |
| Lenovo Legion 5 Pro 16ARH7H RTX 3070 Ti | |
| Alienware x17 RTX 3080 P48E | |
| MSI Raider GE77 HX 12UHS | |
| Gigabyte A7 X1 | |
| Asus ROG Strix G18 G814JI | |
| Average Intel Core i7-13650HX, NVIDIA GeForce RTX 4070 Laptop GPU (n=1) | |
| PCMark 10 / Essentials | |
| Razer Blade 18 RTX 4070 | |
| Average of class Gaming (8810 - 11935, n=97, last 2 years) | |
| Lenovo Legion 5 Pro 16ARH7H RTX 3070 Ti | |
| Alienware x17 RTX 3080 P48E | |
| Gigabyte A7 X1 | |
| Asus ROG Strix G18 G814JI | |
| Average Intel Core i7-13650HX, NVIDIA GeForce RTX 4070 Laptop GPU (n=1) | |
| MSI Raider GE77 HX 12UHS | |
| PCMark 10 / Productivity | |
| Average of class Gaming (6845 - 25323, n=95, last 2 years) | |
| Alienware x17 RTX 3080 P48E | |
| MSI Raider GE77 HX 12UHS | |
| Razer Blade 18 RTX 4070 | |
| Lenovo Legion 5 Pro 16ARH7H RTX 3070 Ti | |
| Gigabyte A7 X1 | |
| Asus ROG Strix G18 G814JI | |
| Average Intel Core i7-13650HX, NVIDIA GeForce RTX 4070 Laptop GPU (n=1) | |
| PCMark 10 / Digital Content Creation | |
| Average of class Gaming (7602 - 19954, n=95, last 2 years) | |
| Lenovo Legion 5 Pro 16ARH7H RTX 3070 Ti | |
| Alienware x17 RTX 3080 P48E | |
| Razer Blade 18 RTX 4070 | |
| MSI Raider GE77 HX 12UHS | |
| Gigabyte A7 X1 | |
| Asus ROG Strix G18 G814JI | |
| Average Intel Core i7-13650HX, NVIDIA GeForce RTX 4070 Laptop GPU (n=1) | |
| CrossMark / Overall | |
| MSI Raider GE77 HX 12UHS | |
| Razer Blade 18 RTX 4070 | |
| Average of class Gaming (1366 - 2409, n=94, last 2 years) | |
| Lenovo Legion 5 Pro 16ARH7H RTX 3070 Ti | |
| CrossMark / Productivity | |
| MSI Raider GE77 HX 12UHS | |
| Razer Blade 18 RTX 4070 | |
| Average of class Gaming (1386 - 2254, n=94, last 2 years) | |
| Lenovo Legion 5 Pro 16ARH7H RTX 3070 Ti | |
| CrossMark / Creativity | |
| Razer Blade 18 RTX 4070 | |
| MSI Raider GE77 HX 12UHS | |
| Average of class Gaming (1343 - 2786, n=94, last 2 years) | |
| Lenovo Legion 5 Pro 16ARH7H RTX 3070 Ti | |
| CrossMark / Responsiveness | |
| MSI Raider GE77 HX 12UHS | |
| Razer Blade 18 RTX 4070 | |
| Average of class Gaming (1226 - 2334, n=94, last 2 years) | |
| Lenovo Legion 5 Pro 16ARH7H RTX 3070 Ti | |
| PCMark 10 Score | 6404 points | |
Help | ||
| AIDA64 / Memory Copy | |
| Razer Blade 18 RTX 4070 | |
| Average of class Gaming (21750 - 129946, n=105, last 2 years) | |
| MSI Raider GE77 HX 12UHS | |
| Asus ROG Strix G18 G814JI | |
| Average Intel Core i7-13650HX (59266 - 66372, n=5) | |
| Lenovo Legion 5 Pro 16ARH7H RTX 3070 Ti | |
| Gigabyte A7 X1 | |
| AIDA64 / Memory Read | |
| Razer Blade 18 RTX 4070 | |
| Average of class Gaming (22956 - 118858, n=105, last 2 years) | |
| MSI Raider GE77 HX 12UHS | |
| Average Intel Core i7-13650HX (67305 - 71022, n=5) | |
| Asus ROG Strix G18 G814JI | |
| Lenovo Legion 5 Pro 16ARH7H RTX 3070 Ti | |
| Gigabyte A7 X1 | |
| AIDA64 / Memory Write | |
| Average of class Gaming (22297 - 135096, n=105, last 2 years) | |
| Razer Blade 18 RTX 4070 | |
| MSI Raider GE77 HX 12UHS | |
| Average Intel Core i7-13650HX (58028 - 68225, n=5) | |
| Asus ROG Strix G18 G814JI | |
| Lenovo Legion 5 Pro 16ARH7H RTX 3070 Ti | |
| Gigabyte A7 X1 | |
| AIDA64 / Memory Latency | |
| Average of class Gaming (75.3 - 259, n=105, last 2 years) | |
| Average Intel Core i7-13650HX (83.7 - 90.8, n=5) | |
| Lenovo Legion 5 Pro 16ARH7H RTX 3070 Ti | |
| Razer Blade 18 RTX 4070 | |
| MSI Raider GE77 HX 12UHS | |
| Asus ROG Strix G18 G814JI | |
| Gigabyte A7 X1 | |
| Alienware x17 RTX 3080 P48E | |
* ... smaller is better
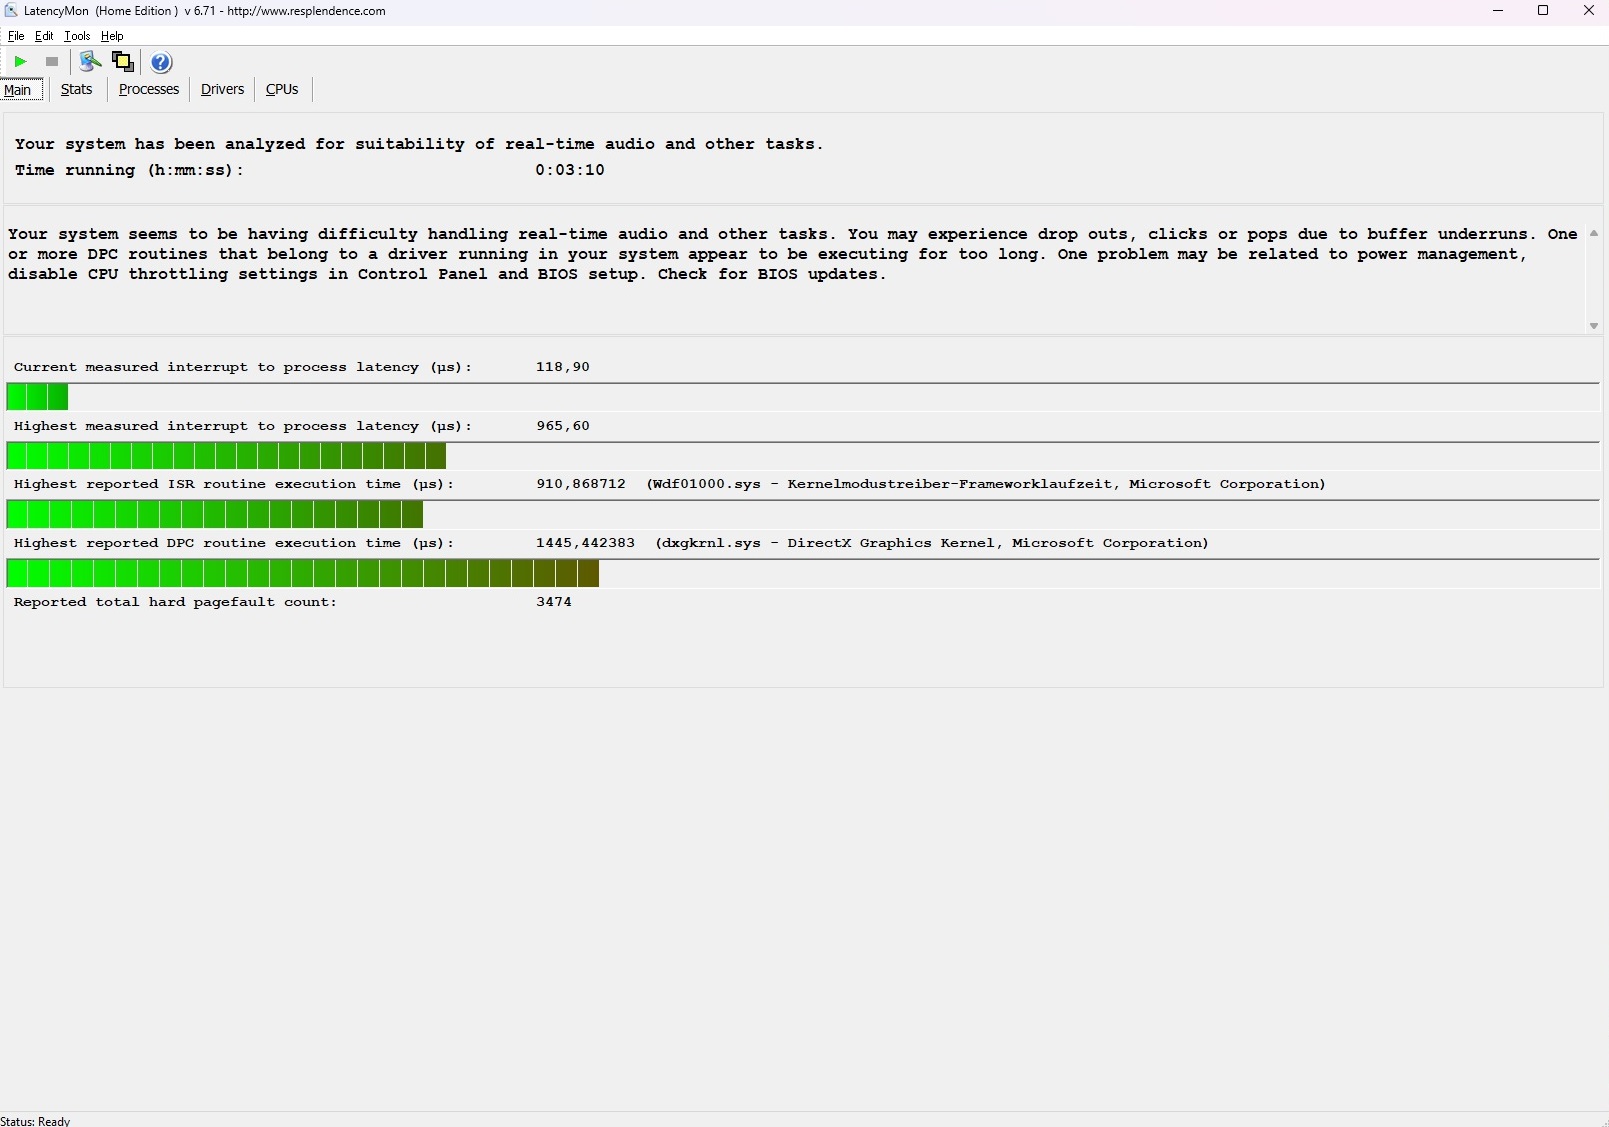
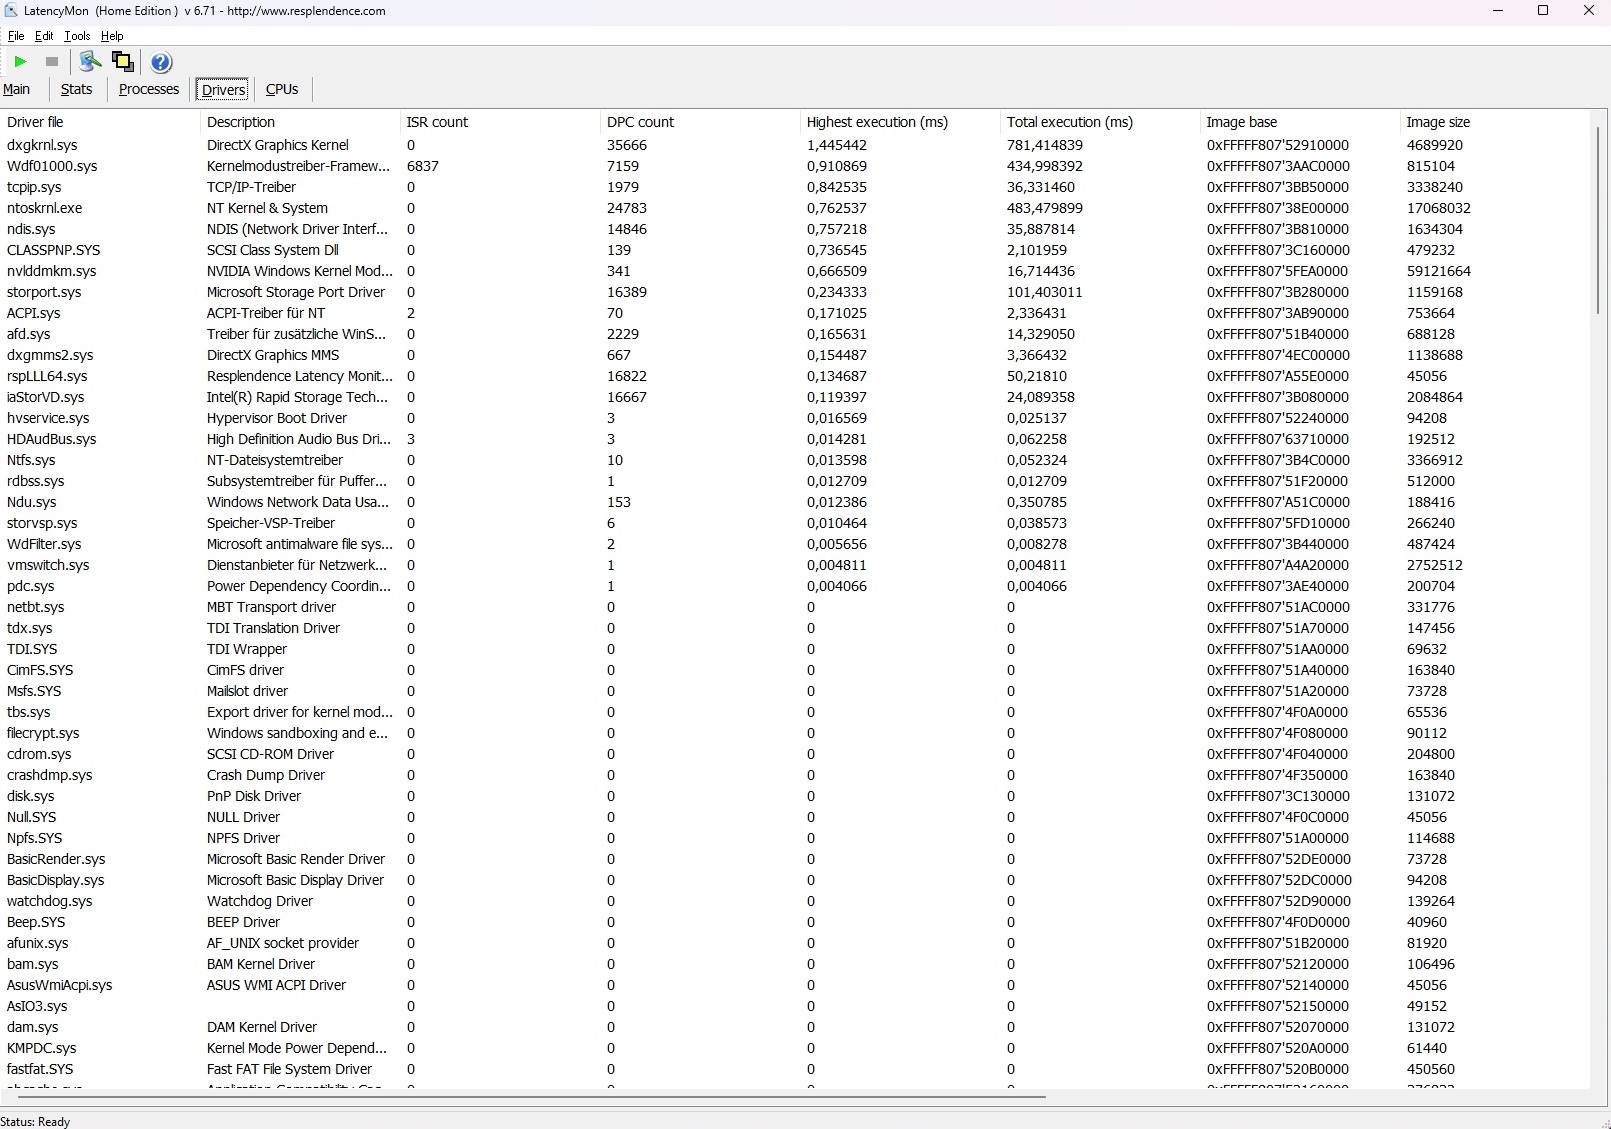
DPC延迟
在延迟方面,G18的表现令人满意,处于中间位置。尽管结果很好,但LatencyMon工具显示,在实时处理音频内容等方面可能存在问题。这是影响许多笔记本电脑的问题,但只与特定用户群有关。
| DPC Latencies / LatencyMon - interrupt to process latency (max), Web, Youtube, Prime95 | |
| Alienware x17 RTX 3080 P48E | |
| MSI Raider GE77 HX 12UHS | |
| Razer Blade 18 RTX 4070 | |
| Asus ROG Strix G18 G814JI | |
| Gigabyte A7 X1 | |
| Lenovo Legion 5 Pro 16ARH7H RTX 3070 Ti | |
* ... smaller is better
大容量存储
审查配置是由1TB美光固态硬盘驱动的。尽管所提供的性能(在AS SSD基准中约3800 MB/s的读取和2300 MB/s的写入速度)并不差,但竞争的SSD大多具有优势。只有技嘉A7 X1能够在这个领域与G18区分开来。

* ... smaller is better
Continuous Performance Read: DiskSpd Read Loop, Queue Depth 8
图形卡
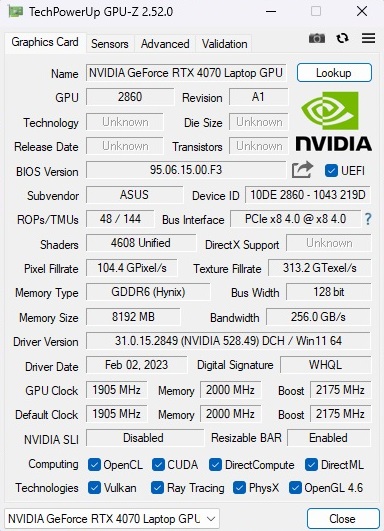
在GeForce RTX 4070 Ti在桌面领域不得不忍受大量的批评(太贵了,而且提供的性能规格有问题)之后,移动GeForce RTX 4070被热切期待。
直接进入正题。再一次,Nvidia没有做出最好的决定。RTX 4070这个名字听起来像是适当的高端产品,但由于这类系统价格昂贵,其规格往往只够一个典型的中端设备使用。同样,在2023年,8GB的VRAM和128位内存接口一样微不足道。此外,4608个着色器单元更类似于RTX 4060(3072)而不是RTX 4080(7424),这与更强大的模型相比有相当大的差距。当涉及到3DMark GPU得分时,RTX 4070几乎不比RTX 3070快,有时甚至比RTX 3070 Ti慢。总而言之,它与RTX 3080处于一个相当的水平(也适用于Blade 18)。
| 3DMark 06 Standard Score | 54916 points | |
| 3DMark 11 Performance | 34117 points | |
| 3DMark Cloud Gate Standard Score | 65577 points | |
| 3DMark Fire Strike Score | 25633 points | |
| 3DMark Time Spy Score | 12364 points | |
Help | ||
* ... smaller is better
游戏性能
日常游戏中的情况看起来更好。我们的性能评级(FHD/Ultra与许多标准游戏)显示,与RTX 3070有近30%的差距,与RTX 3070 Ti有近10%的优势。在游戏方面,RTX 4070被置于RTX 3080和RTX 3080 Ti之间。你可以看到该设备在更高的分辨率(QHD/UHD)和激活光线追踪的情况下的表现,在第二个表格中列出了三个较新的游戏例子。 要想获得更详细的比较,请看看我们的 游戏列表.
| The Witcher 3 - 1920x1080 Ultra Graphics & Postprocessing (HBAO+) | |
| Average of class Gaming (104.7 - 240, n=7, last 2 years) | |
| MSI Raider GE77 HX 12UHS | |
| Asus ROG Strix G18 G814JI | |
| Lenovo Legion 5 Pro 16ARH7H RTX 3070 Ti | |
| Razer Blade 18 RTX 4070 | |
| Alienware x17 RTX 3080 P48E | |
| Gigabyte A7 X1 | |
| Final Fantasy XV Benchmark - 1920x1080 High Quality | |
| Average of class Gaming (41 - 215, n=95, last 2 years) | |
| MSI Raider GE77 HX 12UHS | |
| Lenovo Legion 5 Pro 16ARH7H RTX 3070 Ti | |
| Asus ROG Strix G18 G814JI | |
| Razer Blade 18 RTX 4070 | |
| Alienware x17 RTX 3080 P48E | |
| Strange Brigade - 1920x1080 ultra AA:ultra AF:16 | |
| Average of class Gaming (76.3 - 458, n=87, last 2 years) | |
| Lenovo Legion 5 Pro 16ARH7H RTX 3070 Ti | |
| MSI Raider GE77 HX 12UHS | |
| Asus ROG Strix G18 G814JI | |
| Razer Blade 18 RTX 4070 | |
| Alienware x17 RTX 3080 P48E | |
| Gigabyte A7 X1 | |
| Dota 2 Reborn - 1920x1080 ultra (3/3) best looking | |
| Razer Blade 18 RTX 4070 | |
| MSI Raider GE77 HX 12UHS | |
| Asus ROG Strix G18 G814JI | |
| Average of class Gaming (84.8 - 248, n=107, last 2 years) | |
| Alienware x17 RTX 3080 P48E | |
| Lenovo Legion 5 Pro 16ARH7H RTX 3070 Ti | |
| Gigabyte A7 X1 | |
| Resident Evil Village | |
| 1920x1080 Ray Tracing Preset | |
| MSI GE76 Raider | |
| Asus ROG Strix G18 G814JI | |
| Lenovo Legion 7 16ACHg6 | |
| Medion Erazer Beast X20 | |
| 2560x1440 Max Preset | |
| MSI GE76 Raider | |
| Asus ROG Strix G18 G814JI | |
| Lenovo Legion 7 16ACHg6 | |
| Medion Erazer Beast X20 | |
| 3840x2160 Max Preset | |
| MSI GE76 Raider | |
| Asus ROG Strix G18 G814JI | |
| Guardians of the Galaxy | |
| 1920x1080 Ultra Preset + Ultra Ray-Tracing | |
| MSI GE76 Raider | |
| XMG Neo 15 @165 W TGP | |
| Asus ROG Strix G18 G814JI | |
| XMG Neo 17 @140 W TGP | |
| 2560x1440 Ultra Preset | |
| MSI GE76 Raider | |
| XMG Neo 15 @165 W TGP | |
| Asus ROG Strix G18 G814JI | |
| XMG Neo 17 @140 W TGP | |
| 3840x2160 Ultra Preset | |
| MSI GE76 Raider | |
| XMG Neo 15 @165 W TGP | |
| Asus ROG Strix G18 G814JI | |
| XMG Neo 17 @140 W TGP | |
| Ghostwire Tokyo | |
| 1920x1080 Highest Settings + Maximum Ray Tracing | |
| Asus ROG Strix G18 G814JI | |
| Medion Erazer Beast X30 | |
| XMG Neo 15 @165 W TGP | |
| XMG Neo 17 @140 W TGP | |
| 2560x1440 Highest Settings | |
| Asus ROG Strix G18 G814JI | |
| Medion Erazer Beast X30 | |
| XMG Neo 15 @165 W TGP | |
| XMG Neo 17 @140 W TGP | |
| 3840x2160 Highest Settings | |
| Asus ROG Strix G18 G814JI | |
| XMG Neo 15 @165 W TGP | |
| XMG Neo 17 @140 W TGP | |
基本上,GeForce RTX 4070是QHD笔记本电脑的一个非常好的显卡。设置为2560 x 1440像素(G18也能出色地管理原生2560 x 1600像素),即使在最大设置下,Ada Lovelace GPU通常能达到60fps以上。只有优化不佳的游戏,如 瘟疫物语安魂曲才会降到这个水平以下。相比之下,在4K时,RTX 4070(没有DLSS)只能提供有限的适用性。在要求更高的游戏中,超过60帧是个例外,而不是常规。
为了看看图形性能是否能在较长时间内保持稳定,我们测试了TheWitcher 3 60分钟。其结果是。正如在CPU的Cinebench循环中看到的,性能相对稳定。
Witcher 3 FPS Diagram
| low | med. | high | ultra | QHD | 4K | |
|---|---|---|---|---|---|---|
| GTA V (2015) | 182.5 | 178.3 | 117.2 | |||
| The Witcher 3 (2015) | 379 | 237 | 119 | |||
| Dota 2 Reborn (2015) | 173.2 | 164.4 | 154.7 | |||
| Final Fantasy XV Benchmark (2018) | 162.3 | 115.5 | ||||
| X-Plane 11.11 (2018) | 145.8 | 112.6 | ||||
| Far Cry 5 (2018) | 163 | 154 | 144 | |||
| Strange Brigade (2018) | 309 | 245 | 209 | |||
| Outriders (2021) | 165.3 | 145.2 | 129.4 | 90 | 46.3 | |
| Resident Evil Village (2021) | 220 | 212 | 189.7 | 128.6 | 62.7 | |
| Days Gone (2021) | 173.2 | 154.7 | 119.2 | 83.8 | 45 | |
| Deathloop (2021) | 139.9 | 129.8 | 106.3 | 65.4 | 37.4 | |
| Back 4 Blood (2021) | 252 | 221 | 209 | 129.4 | 73.7 | |
| Guardians of the Galaxy (2021) | 148 | 147 | 144 | 108 | 60 | |
| Riders Republic (2021) | 160 | 135 | 121 | 87 | 49 | |
| Farming Simulator 22 (2021) | 203 | 148.2 | 138.9 | 137 | 94.1 | |
| Halo Infinite (2021) | 172.7 | 149.1 | 140.6 | 102.5 | 57.5 | |
| Elden Ring (2022) | 59.6 | 59.5 | 59.5 | 59.5 | 45 | |
| Elex 2 (2022) | 118.7 | 118.2 | 112.9 | 78.9 | 40 | |
| Ghostwire Tokyo (2022) | 172.7 | 171.7 | 165.9 | 108.7 | 52.3 | |
| Vampire Bloodhunt (2022) | 212 | 199.9 | 195.7 | 148.6 | 78.5 | |
| The Quarry (2022) | 146 | 122.1 | 98 | 68.2 | 28.7 | |
| A Plague Tale Requiem (2022) | 74.6 | 65.6 | 57.5 | 40.9 | 23 | |
| Need for Speed Unbound (2022) | 131.1 | 110.1 | 97.2 | 67.7 | 36.2 | |
| High On Life (2023) | 178 | 131.6 | 108.5 | 64.5 | 25.7 | |
| Hogwarts Legacy (2023) | 142.7 | 121.2 | 101.2 | 71 | 27.7 | |
| Returnal (2023) | 115 | 104 | 88 | 66 | 39 | |
| Company of Heroes 3 (2023) | 186 | 155 | 150 | 107 | 63 |
排放
噪声排放
噪声排放在很大程度上取决于Armoury Crate的选择模式。在Witcher 3 ,我们的测量设备在 "安静 "模式下记录了8至40 dB(A),在 "性能 "模式下记录了42至44 dB(A)--对于一台游戏笔记本来说是可以接受的水平。在 "涡轮增压 "模式下,事情变得很响亮,在游戏时风扇发出51分贝(A)的声音。在空闲运行时,风扇要么完全关闭,要么以近30分贝(A)的相当体面的水平运行。
烦人。Strix G18在几乎所有的负载范围内都要处理线圈啸叫的问题。许多其他笔记本电脑也显示出这个问题,但不是在这个强度或频率水平。
Noise level
| Idle |
| 26 / 28 / 29 dB(A) |
| Load |
| 41 / 46 dB(A) |
 | ||
30 dB silent 40 dB(A) audible 50 dB(A) loud |
||
min: | ||
| Asus ROG Strix G18 G814JI i7-13650HX, GeForce RTX 4070 Laptop GPU | Razer Blade 18 RTX 4070 i9-13950HX, GeForce RTX 4070 Laptop GPU | Gigabyte A7 X1 R9 5900HX, GeForce RTX 3070 Laptop GPU | Lenovo Legion 5 Pro 16ARH7H RTX 3070 Ti R7 6800H, GeForce RTX 3070 Ti Laptop GPU | Alienware x17 RTX 3080 P48E i7-11800H, GeForce RTX 3080 Laptop GPU | MSI Raider GE77 HX 12UHS i9-12900HX, GeForce RTX 3080 Ti Laptop GPU | |
|---|---|---|---|---|---|---|
| Noise | 3% | -17% | -6% | 1% | -22% | |
| off / environment * (dB) | 25 | 23.5 6% | 24 4% | 23.5 6% | 24.9 -0% | 26 -4% |
| Idle Minimum * (dB) | 26 | 23.8 8% | 25 4% | 23.7 9% | 24.9 4% | 26 -0% |
| Idle Average * (dB) | 28 | 23.8 15% | 29 -4% | 31.1 -11% | 24.9 11% | 34 -21% |
| Idle Maximum * (dB) | 29 | 26.8 8% | 35 -21% | 32.2 -11% | 29.6 -2% | 46 -59% |
| Load Average * (dB) | 41 | 37.3 9% | 58 -41% | 38.4 6% | 31.1 24% | 50 -22% |
| Witcher 3 ultra * (dB) | 44 | 48 -9% | 57 -30% | 54.8 -25% | 49.7 -13% | 55 -25% |
| Load Maximum * (dB) | 46 | 53.5 -16% | 59 -28% | 54.8 -19% | 54.8 -19% | 57 -24% |
* ... smaller is better
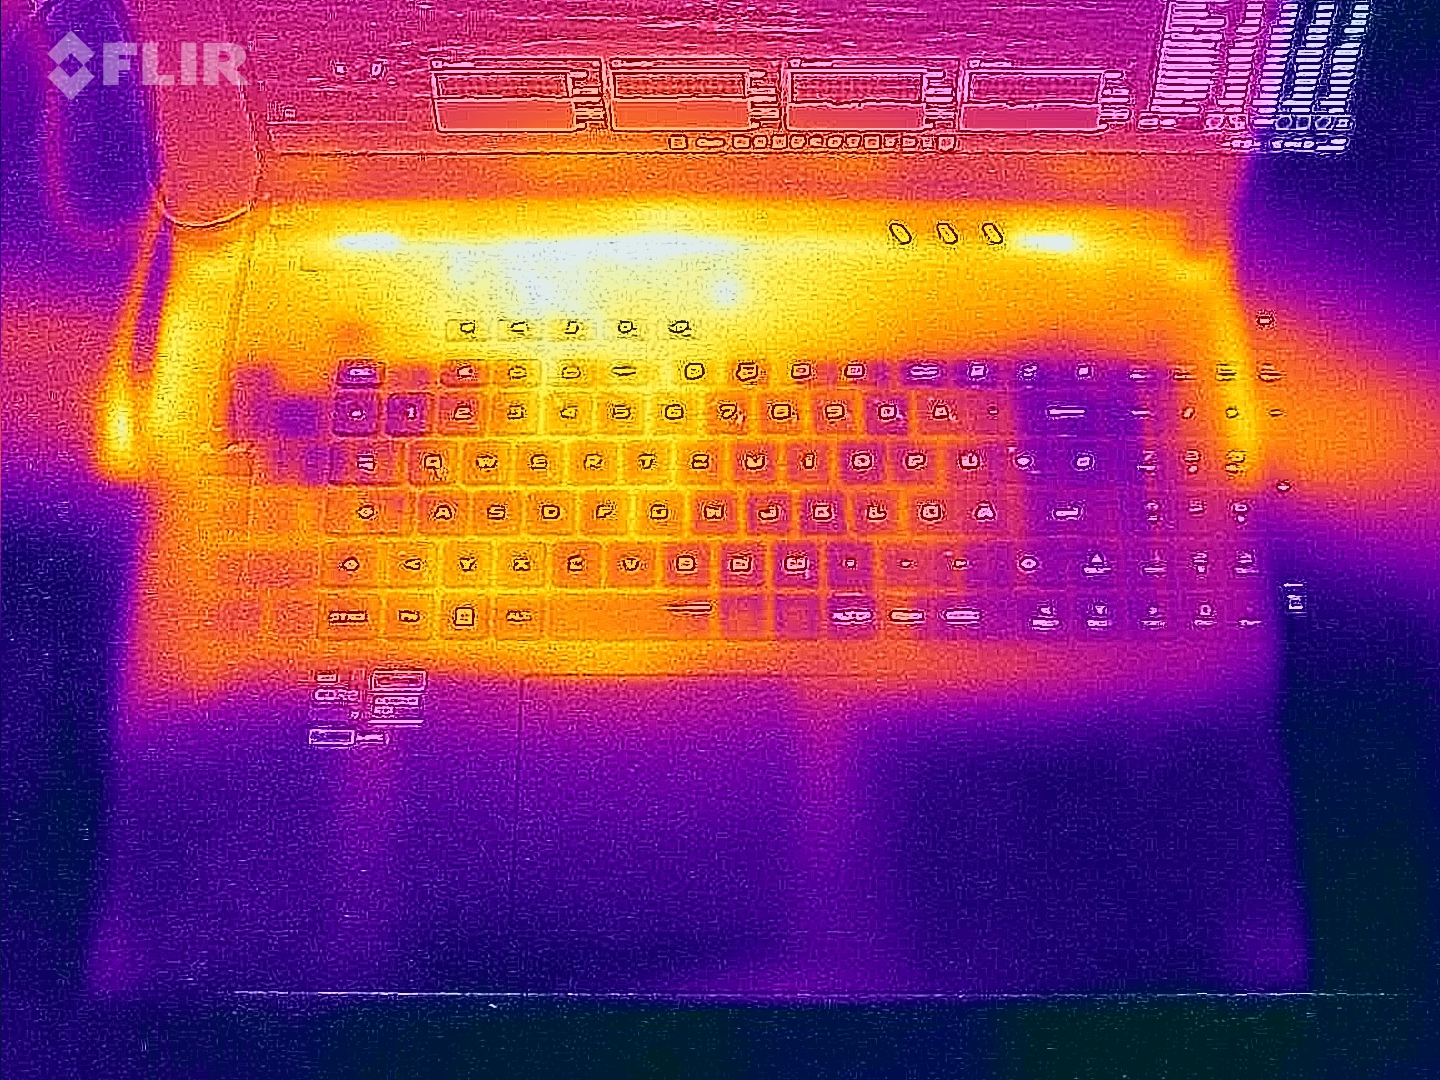
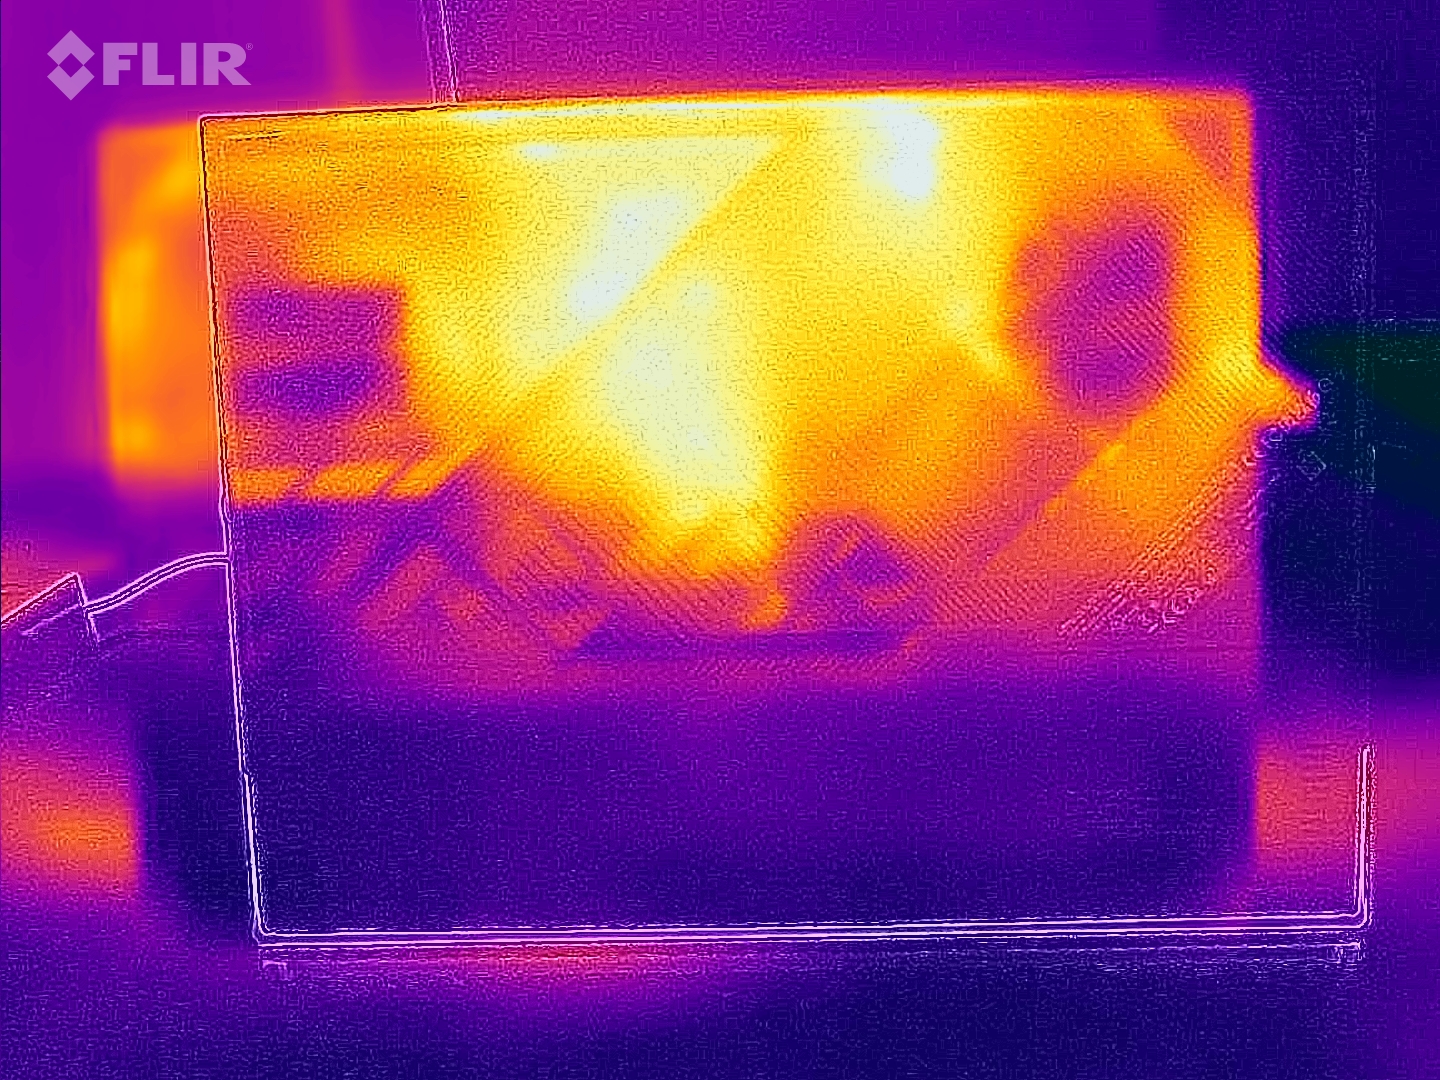
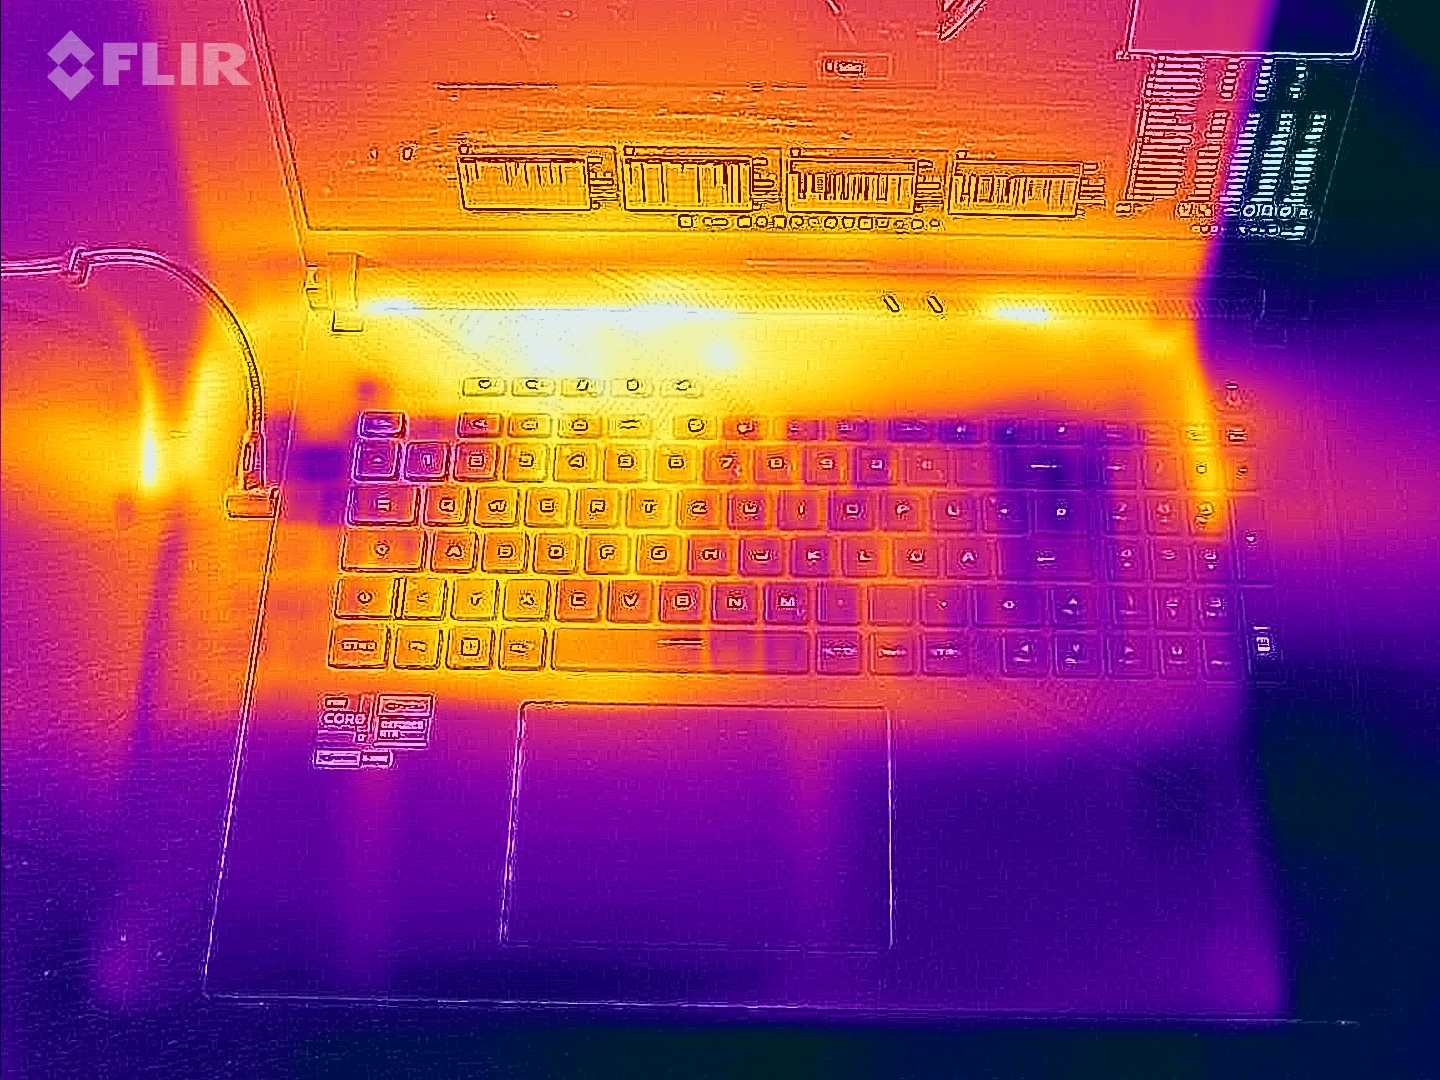
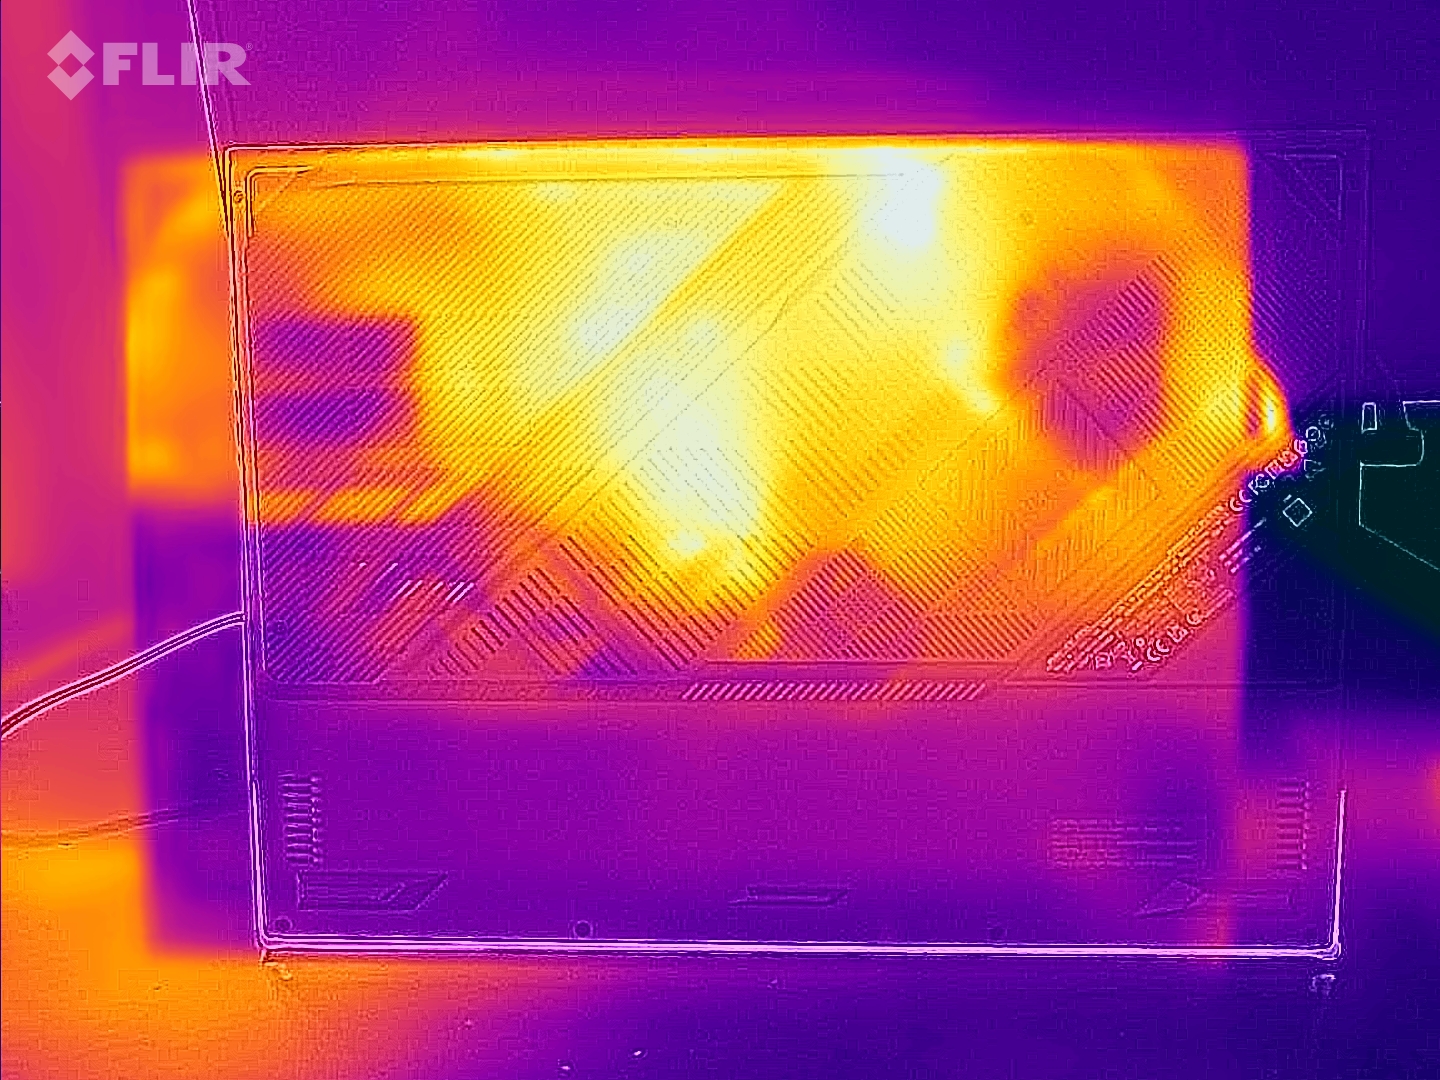
温度
当涉及到温度时,没有异常值。虽然G18在空闲使用时比Blade 18略低,但在负载情况下,它变得有些热。该设备顶部的最高温度为45°C,底座的最高温度为47°C,这是可以接受的。
(±) The maximum temperature on the upper side is 45 °C / 113 F, compared to the average of 40.4 °C / 105 F, ranging from 21.2 to 68.8 °C for the class Gaming.
(-) The bottom heats up to a maximum of 47 °C / 117 F, compared to the average of 43.2 °C / 110 F
(+) In idle usage, the average temperature for the upper side is 27 °C / 81 F, compared to the device average of 33.9 °C / 93 F.
(±) Playing The Witcher 3, the average temperature for the upper side is 36.8 °C / 98 F, compared to the device average of 33.9 °C / 93 F.
(+) The palmrests and touchpad are reaching skin temperature as a maximum (32 °C / 89.6 F) and are therefore not hot.
(-) The average temperature of the palmrest area of similar devices was 28.8 °C / 83.8 F (-3.2 °C / -5.8 F).
| Asus ROG Strix G18 G814JI i7-13650HX, GeForce RTX 4070 Laptop GPU | Razer Blade 18 RTX 4070 i9-13950HX, GeForce RTX 4070 Laptop GPU | Gigabyte A7 X1 R9 5900HX, GeForce RTX 3070 Laptop GPU | Lenovo Legion 5 Pro 16ARH7H RTX 3070 Ti R7 6800H, GeForce RTX 3070 Ti Laptop GPU | Alienware x17 RTX 3080 P48E i7-11800H, GeForce RTX 3080 Laptop GPU | MSI Raider GE77 HX 12UHS i9-12900HX, GeForce RTX 3080 Ti Laptop GPU | |
|---|---|---|---|---|---|---|
| Heat | 4% | 1% | -5% | -17% | -29% | |
| Maximum Upper Side * (°C) | 45 | 39.2 13% | 44 2% | 43.8 3% | 58.4 -30% | 53 -18% |
| Maximum Bottom * (°C) | 47 | 35.6 24% | 49 -4% | 53 -13% | 49 -4% | 58 -23% |
| Idle Upper Side * (°C) | 28 | 31.8 -14% | 27 4% | 30 -7% | 33.6 -20% | 38 -36% |
| Idle Bottom * (°C) | 31 | 33.2 -7% | 30 3% | 31.8 -3% | 34.6 -12% | 43 -39% |
* ... smaller is better
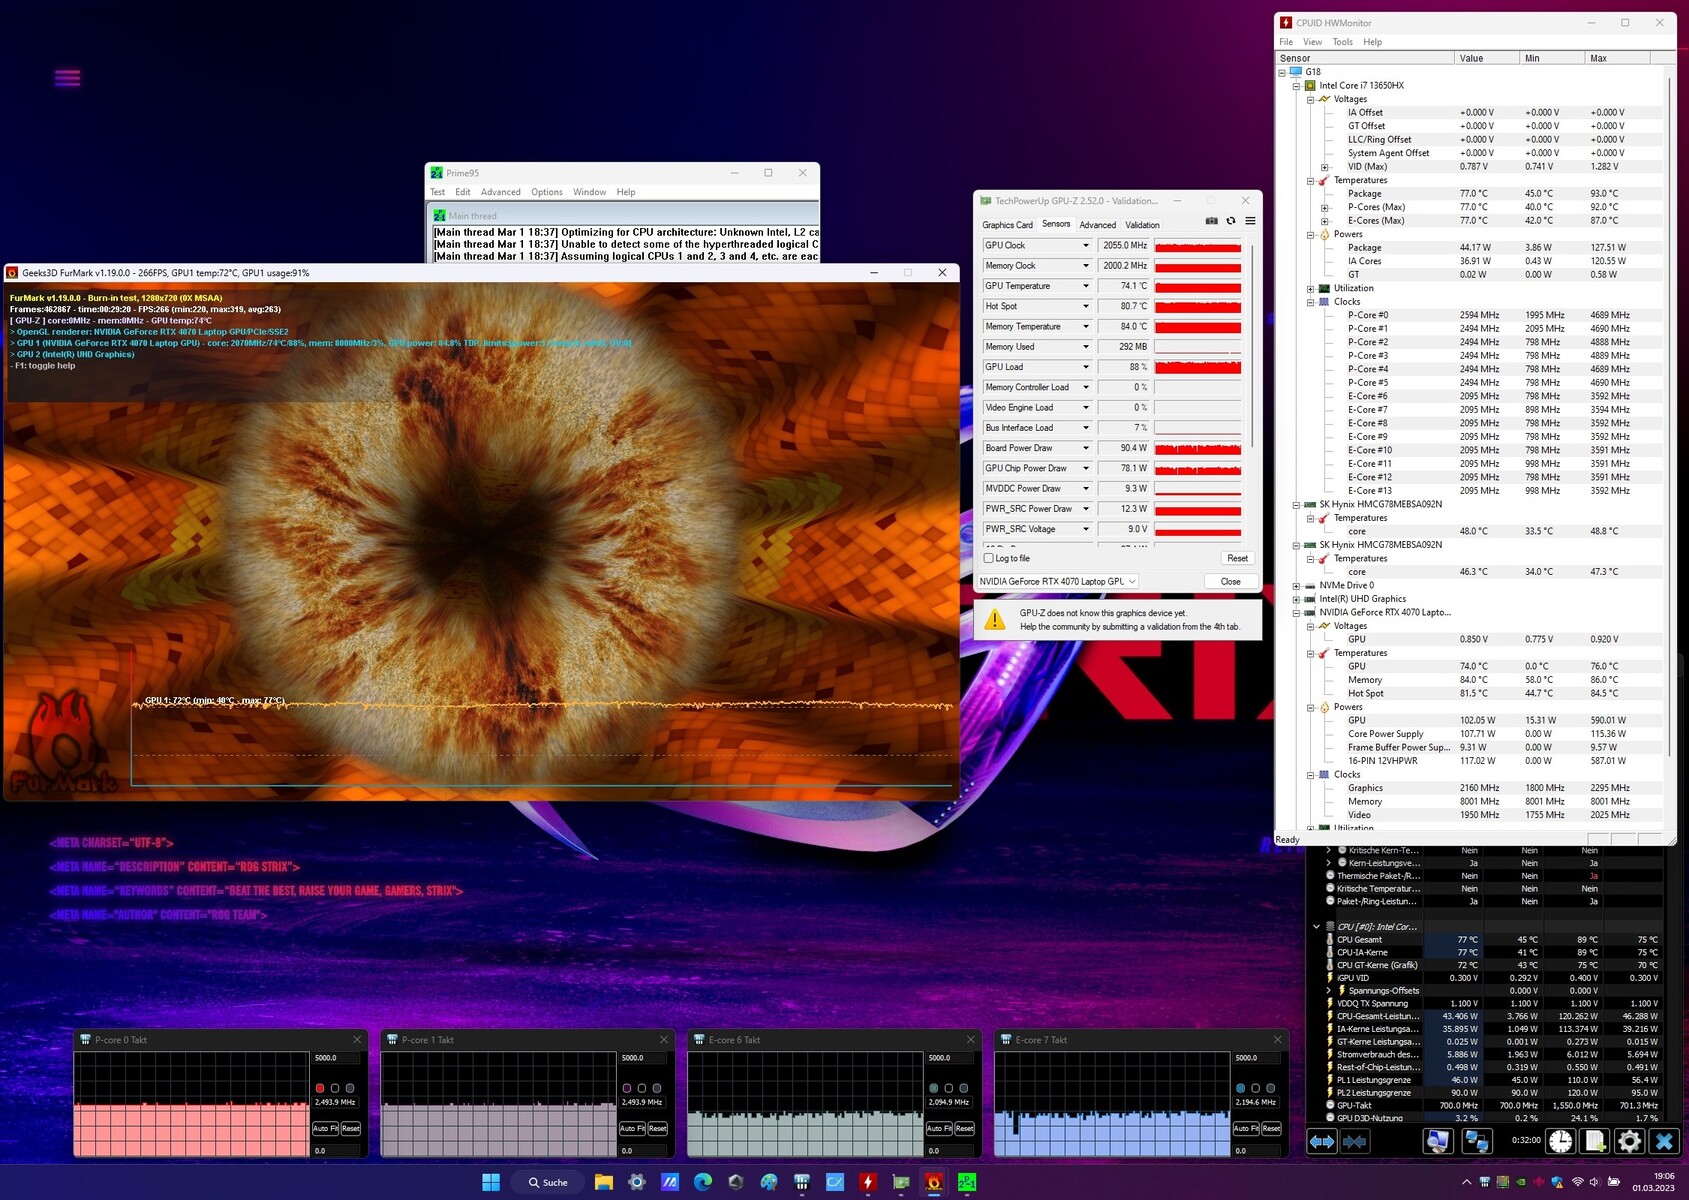
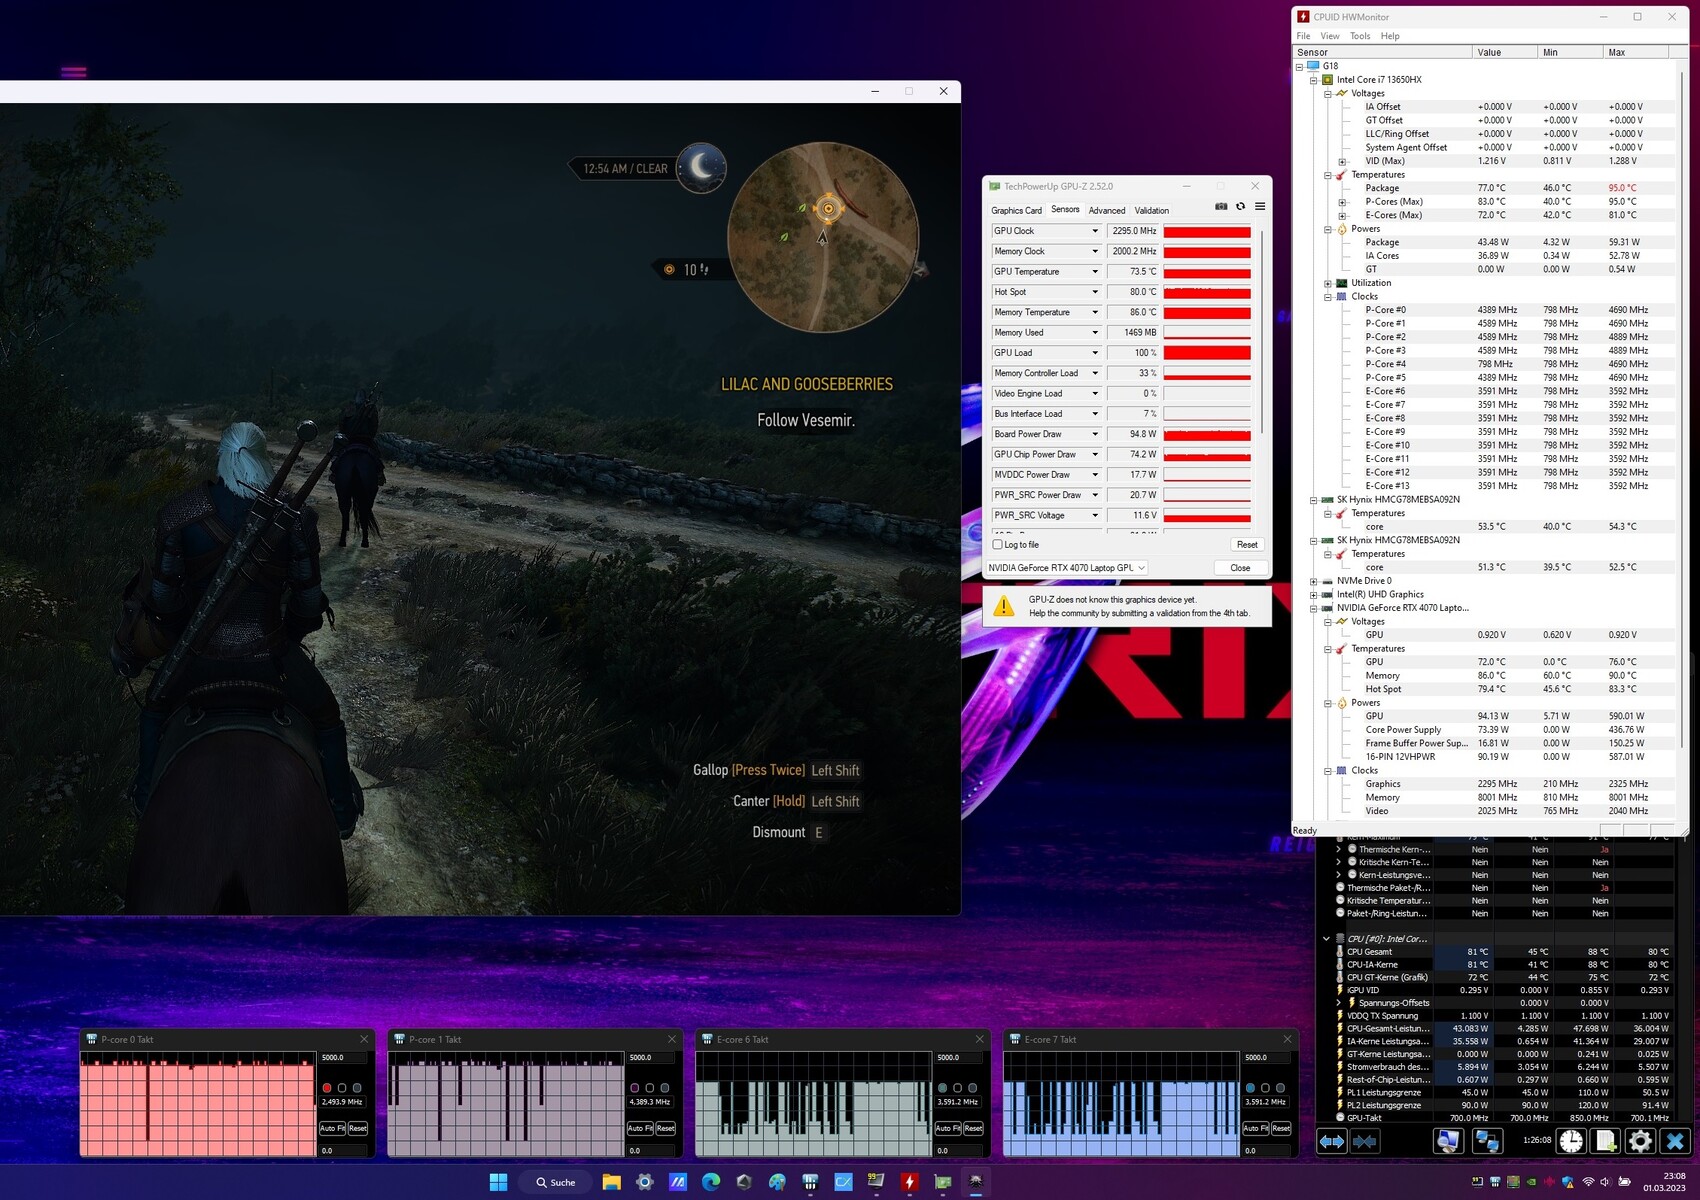
压力测试
当选择 "性能 "模式时,没有一个组件被过度征用。在压力测试中,使用Furmark和Prime95工具以及TheWitcher 3 ,Core i7-13650HX平均达到77℃--一个中等的数值。RTX 4070达到了约74℃。
发言人
声音质量相当令人印象深刻。无论在哪个频率范围内,2.0系统都没有显示出任何明显的弱点,尽管在我们的音频分析中,Razer Blade 18的声音稍好。作为回报,G18提供了一个略高的最大音量,高达88 dB(A)。通过这种方式,较大的房间可以充满声音,而不需要外部扬声器。
Asus ROG Strix G18 G814JI audio analysis
(+) | speakers can play relatively loud (88 dB)
Bass 100 - 315 Hz
(±) | reduced bass - on average 10.2% lower than median
(+) | bass is linear (5.6% delta to prev. frequency)
Mids 400 - 2000 Hz
(+) | balanced mids - only 3.8% away from median
(+) | mids are linear (4% delta to prev. frequency)
Highs 2 - 16 kHz
(+) | balanced highs - only 2.8% away from median
(±) | linearity of highs is average (7% delta to prev. frequency)
Overall 100 - 16.000 Hz
(+) | overall sound is linear (11.5% difference to median)
Compared to same class
» 10% of all tested devices in this class were better, 3% similar, 87% worse
» The best had a delta of 6%, average was 18%, worst was 132%
Compared to all devices tested
» 8% of all tested devices were better, 2% similar, 90% worse
» The best had a delta of 4%, average was 23%, worst was 134%
Razer Blade 18 RTX 4070 audio analysis
(+) | speakers can play relatively loud (85.7 dB)
Bass 100 - 315 Hz
(±) | reduced bass - on average 7.5% lower than median
(±) | linearity of bass is average (9.2% delta to prev. frequency)
Mids 400 - 2000 Hz
(+) | balanced mids - only 3.5% away from median
(+) | mids are linear (4.1% delta to prev. frequency)
Highs 2 - 16 kHz
(+) | balanced highs - only 4.8% away from median
(+) | highs are linear (3.8% delta to prev. frequency)
Overall 100 - 16.000 Hz
(+) | overall sound is linear (9.2% difference to median)
Compared to same class
» 3% of all tested devices in this class were better, 1% similar, 96% worse
» The best had a delta of 6%, average was 18%, worst was 132%
Compared to all devices tested
» 3% of all tested devices were better, 1% similar, 96% worse
» The best had a delta of 4%, average was 23%, worst was 134%
能源管理
消耗功率
在图形开关激活的空闲操作中,这台18英寸笔记本电脑的耗电量非常小。8到26瓦的水平对于一台游戏笔记本来说是完全可以接受的。在负载情况下,这一消耗数字从102(3DMark 06的平均得分)攀升到267瓦(最大压力测试值)。所提供的280瓦的电源装置也是一个很好的尺寸。当游戏时,你可以估计到大约180瓦,这比Blade 18少一些,尽管3D性能相当(采用Core i9-13950HX,Razer机器有一个更强大、更饥饿的CPU)。
| Off / Standby | |
| Idle | |
| Load |
|
Key:
min: | |
| Asus ROG Strix G18 G814JI i7-13650HX, GeForce RTX 4070 Laptop GPU | Razer Blade 18 RTX 4070 i9-13950HX, GeForce RTX 4070 Laptop GPU | Gigabyte A7 X1 R9 5900HX, GeForce RTX 3070 Laptop GPU | Lenovo Legion 5 Pro 16ARH7H RTX 3070 Ti R7 6800H, GeForce RTX 3070 Ti Laptop GPU | Alienware x17 RTX 3080 P48E i7-11800H, GeForce RTX 3080 Laptop GPU | MSI Raider GE77 HX 12UHS i9-12900HX, GeForce RTX 3080 Ti Laptop GPU | Average of class Gaming | |
|---|---|---|---|---|---|---|---|
| Power Consumption | -77% | -6% | -17% | -35% | -35% | -18% | |
| Idle Minimum * (Watt) | 8 | 24.5 -206% | 12 -50% | 9.7 -21% | 10.2 -27% | 13 -63% | 13 ? -63% |
| Idle Average * (Watt) | 15 | 34.1 -127% | 14 7% | 14.8 1% | 21.2 -41% | 19 -27% | 19 ? -27% |
| Idle Maximum * (Watt) | 26 | 47.7 -83% | 19 27% | 45.8 -76% | 48.4 -86% | 29 -12% | 24.6 ? 5% |
| Load Average * (Watt) | 102 | 140 -37% | 118 -16% | 87.2 15% | 118.7 -16% | 143 -40% | 110.7 ? -9% |
| Witcher 3 ultra * (Watt) | 178.6 | 202 -13% | 205 -15% | 209 -17% | 249 -39% | 247 -38% | |
| Load Maximum * (Watt) | 267 | 261 2% | 229 14% | 275.3 -3% | 262 2% | 352 -32% | 259 ? 3% |
* ... smaller is better
Power consumption Witcher 3 / stress test
Power consumption with an external monitor
电池寿命
只要你不要求G18运行3D应用程序,电池寿命对于一台游戏笔记本电脑来说是令人惊讶的好。在最低亮度下空闲使用近12小时,在150cd/m²的降低显示亮度下上网约8小时,G18将竞争对手甩在后面,尽管他们大多提供80至100Wh的电池(G18拥有90Wh)。
| Asus ROG Strix G18 G814JI i7-13650HX, GeForce RTX 4070 Laptop GPU, 90 Wh | Razer Blade 18 RTX 4070 i9-13950HX, GeForce RTX 4070 Laptop GPU, 91.7 Wh | Gigabyte A7 X1 R9 5900HX, GeForce RTX 3070 Laptop GPU, 48.96 Wh | Lenovo Legion 5 Pro 16ARH7H RTX 3070 Ti R7 6800H, GeForce RTX 3070 Ti Laptop GPU, 80 Wh | Alienware x17 RTX 3080 P48E i7-11800H, GeForce RTX 3080 Laptop GPU, 87 Wh | MSI Raider GE77 HX 12UHS i9-12900HX, GeForce RTX 3080 Ti Laptop GPU, 99.99 Wh | Average of class Gaming | |
|---|---|---|---|---|---|---|---|
| Battery runtime | -28% | -21% | -46% | -33% | 6% | -5% | |
| Reader / Idle (h) | 11.7 | 7 -40% | 7 -40% | 9.8 -16% | 8.27 ? -29% | ||
| WiFi v1.3 (h) | 8.1 | 4 -51% | 4.7 -42% | 4.4 -46% | 5.9 -27% | 5.4 -33% | 7.11 ? -12% |
| Load (h) | 1.2 | 1.3 8% | 1.2 0% | 0.8 -33% | 2 67% | 1.502 ? 25% | |
| H.264 (h) | 6.5 | 8.32 ? |
Pros
Cons
判决书
凭借ROG Strix G18 G814JI,华硕在仍然相当新的18英寸笔记本电脑领域做出了几乎一致的良好亮相。
基本单元的机箱在稳定性方面显示出一些弱点,这对输入设备的感知质量有影响(机箱往往会有一点响声)。然而,由于慷慨的端口功能(包括Thunderbolt 4),引人注目的设计和广泛的照明(键盘,前面的LED灯带),玩家得到一个合适的游戏平台。
尽管华硕已经决定不采用迷你LED或OLED显示屏,(后者的技术也有其缺点),但我们喜欢其图像质量。亮度和响应时间,以及色彩空间和色彩准确性,没有理由躲避竞争。此外,G18还因其相对较长的电池寿命而值得称道。
对(3D)性能的评价有些分歧。虽然Core i7-13650HX ,但显卡提出了一些问题。
我们不可能完全理解Nvidia在移动版的RTX 4070。规格(8GB VRAM,128位接口,......)既不是最新的,也没有对得起购买价格。它不仅对老一代产品的领先优势往往很小,而且最终用户的成本也急剧增加(例如,比较。RTX 3070 Ti笔记本电脑).
因此,正在寻找笔记本电脑的游戏玩家也许应该看看上一代产品,甚至可以用带有RTX4080的设备来对待自己。RTX 4080.
如果它绝对是一个18英寸的机器,一个更好的选择是在评论中多次提到的一个设备,即Razer Blade 18.
价格和可用性
华硕ROG Strix G18 G814JI-N6051W配备酷睿i7-13650HX,GeForce RTX 4070和WQXGA显示屏,目前在各网上商店尚未有售。
Asus ROG Strix G18 G814JI
- 03/07/2023 v7 (old)
Florian Glaser
Transparency
The selection of devices to be reviewed is made by our editorial team. The test sample was provided to the author as a loan by the manufacturer or retailer for the purpose of this review. The lender had no influence on this review, nor did the manufacturer receive a copy of this review before publication. There was no obligation to publish this review. As an independent media company, Notebookcheck is not subjected to the authority of manufacturers, retailers or publishers.
This is how Notebookcheck is testing
Every year, Notebookcheck independently reviews hundreds of laptops and smartphones using standardized procedures to ensure that all results are comparable. We have continuously developed our test methods for around 20 years and set industry standards in the process. In our test labs, high-quality measuring equipment is utilized by experienced technicians and editors. These tests involve a multi-stage validation process. Our complex rating system is based on hundreds of well-founded measurements and benchmarks, which maintains objectivity. Further information on our test methods can be found here.
Price comparison

