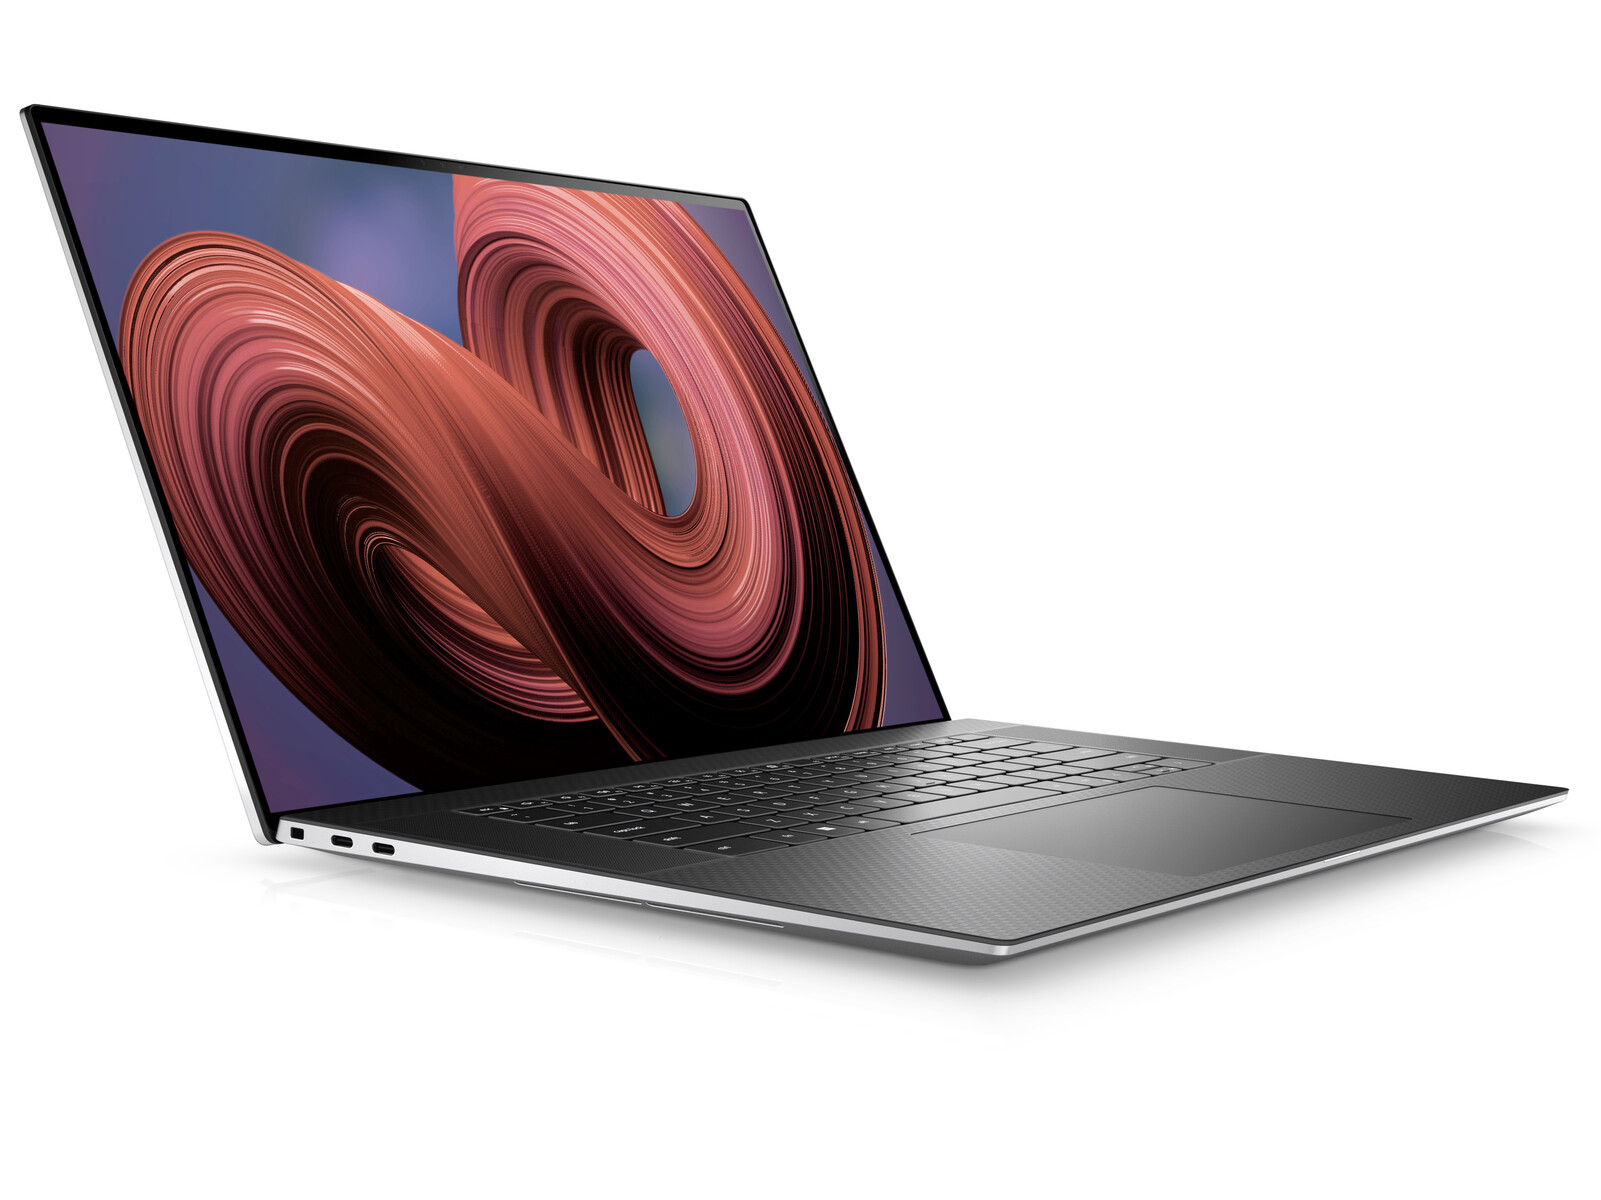
戴尔XPS 17 9730笔记本电脑回顾: GeForce RTX 4070多媒体怪物

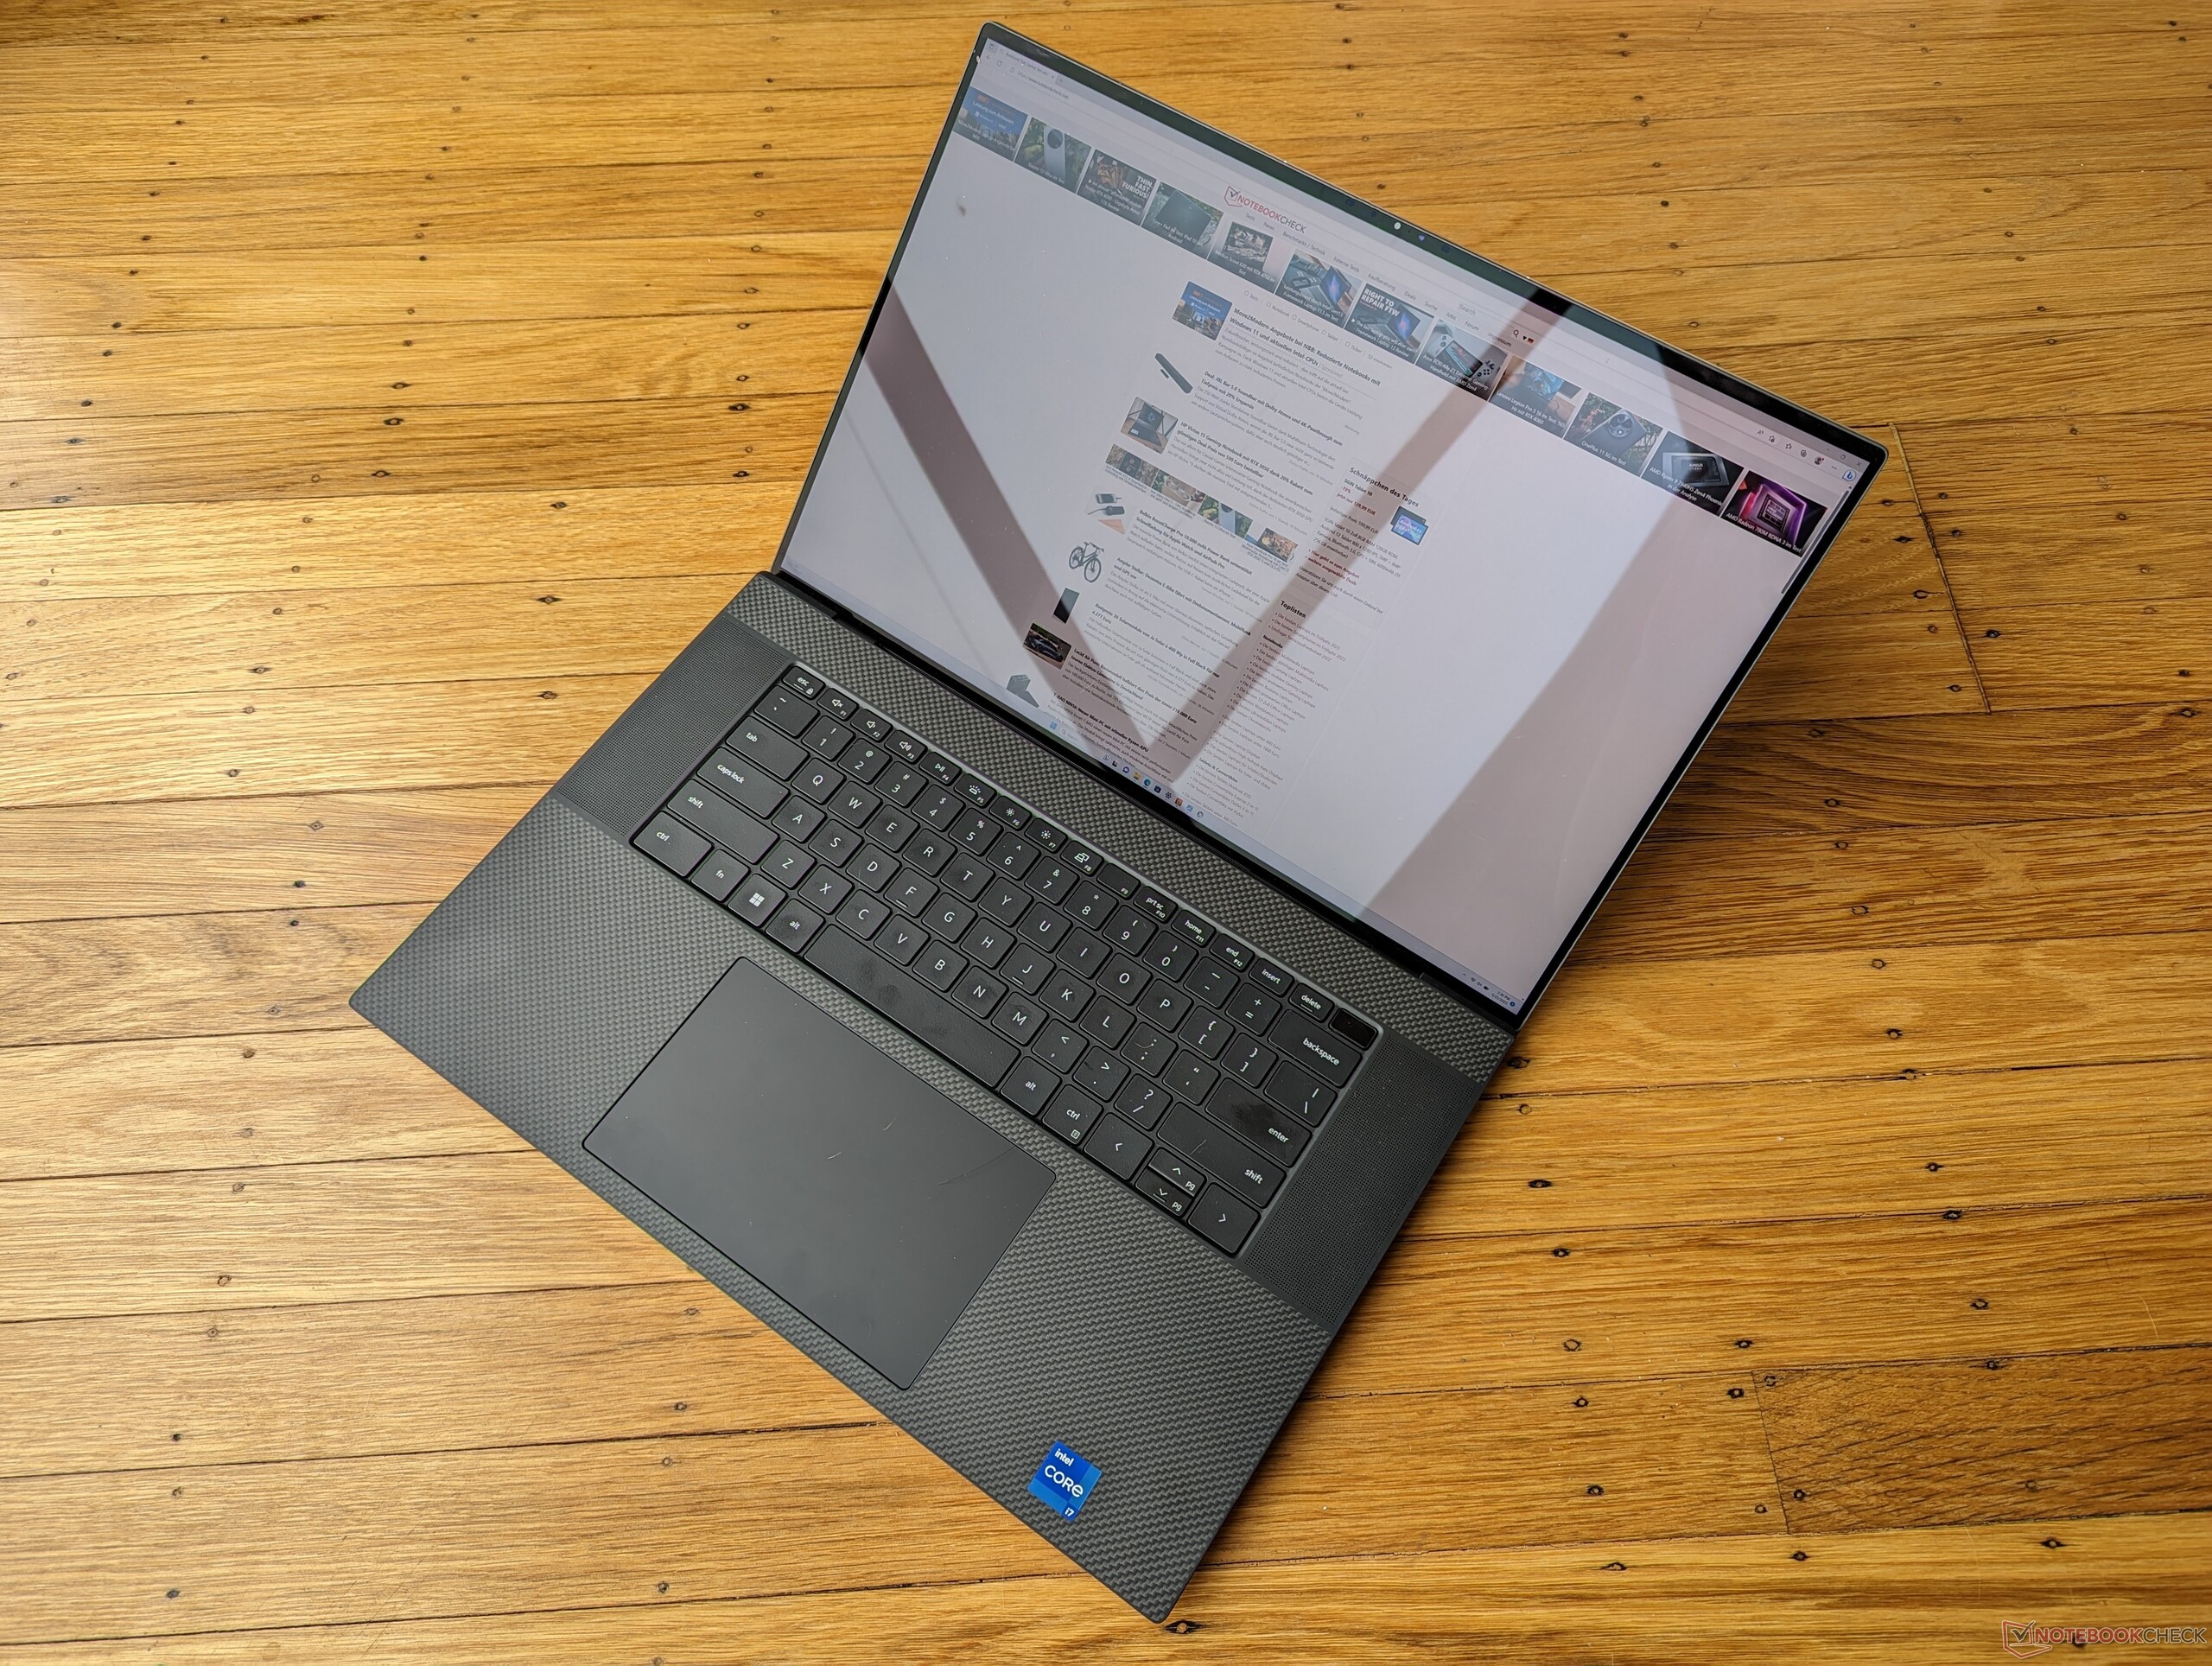
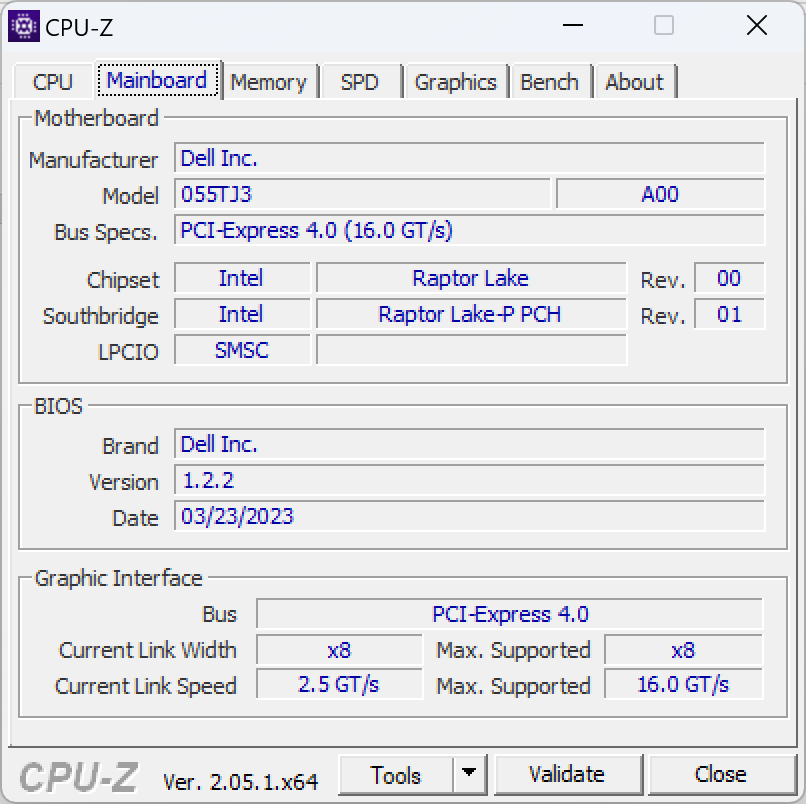
2023年的XPS 17 9730是原2020年XPS 17 9700的第四次迭代。 最初的2020年XPS 17 9700设计。它是一次内部更新,采用第13代英特尔猛禽湖-H处理器和英伟达爱立信GPU,分别取代去年的第12代阿尔德湖-H和安培选项。否则没有重大的表面变化,因此我们建议查看我们对 原来的XPS 17 9700以了解更多关于该笔记本电脑的物理特性。任何未来的重新设计都可能从最近的XPS 13 Plus系列中获得灵感。 最近的XPS 13 Plus系列.
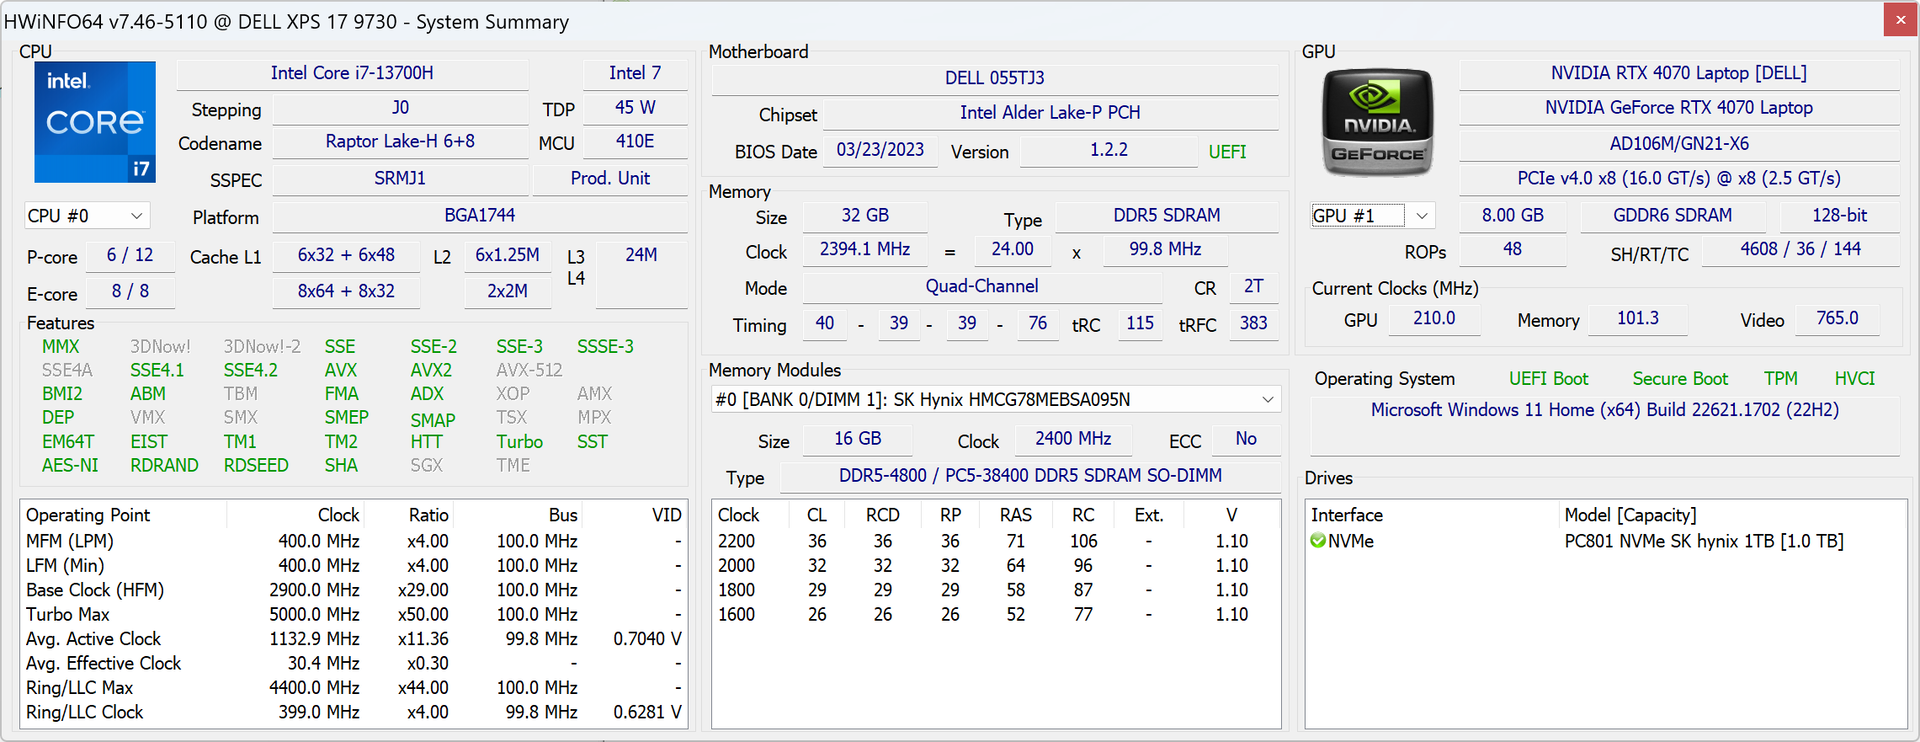
我们审查的具体配置是一个更高端的SKU,配备酷睿i7-13700H,GeForce RTX 4070,以及UHD+ 2400p光面触摸屏,零售价约为3500美元。其他SKU可使用RTX 4050、RTX 4060、RTX 4080、酷睿i9-13900H或1200p亚光显示屏代替。有趣的是,所有配置都必须配备独立显卡,而以前的XPS 17型号有更便宜的集成UHD或Iris Xe选项。
这一领域的竞争者包括其他旗舰级17英寸多媒体笔记本电脑,如 LG Gram 17, HP Envy 17,微星创造者Z17,或16英寸Apple MacBook Pro 16.
更多戴尔评论:
潜在的竞争对手比较
Rating | Date | Model | Weight | Height | Size | Resolution | Price |
|---|---|---|---|---|---|---|---|
| 90 % v7 (old) | 05 / 2023 | Dell XPS 17 9730 RTX 4070 i7-13700H, GeForce RTX 4070 Laptop GPU | 2.5 kg | 19.5 mm | 17.00" | 3840x2400 | |
| 88.8 % v7 (old) | 06 / 2022 | Dell XPS 17 9720 RTX 3060 i7-12700H, GeForce RTX 3060 Laptop GPU | 2.5 kg | 19.5 mm | 17.00" | 3840x2400 | |
| 86.4 % v7 (old) | 05 / 2023 | LG Gram 17 (2023) i7-1360P, Iris Xe G7 96EUs | 1.4 kg | 17.8 mm | 17.00" | 2560x1600 | |
| 86.3 % v7 (old) | 04 / 2023 | HP Envy 17-cr0079ng i7-1255U, GeForce RTX 2050 Mobile | 2.6 kg | 19.6 mm | 17.30" | 3840x2160 | |
| 83.8 % v7 (old) | 09 / 2022 | MSI Creator Z17 A12UGST-054 i9-12900H, GeForce RTX 3070 Ti Laptop GPU | 2.5 kg | 19 mm | 17.00" | 2560x1600 | |
| 93.7 % v7 (old) | 03 / 2023 | Apple MacBook Pro 16 2023 M2 Max M2 Max, M2 Max 38-Core GPU | 2.2 kg | 16.8 mm | 16.20" | 3456x2234 |
案例--连续三年的相同设计
SD卡阅读器
| SD Card Reader | |
| average JPG Copy Test (av. of 3 runs) | |
| Dell XPS 17 9720 RTX 3060 (Toshiba Exceria Pro SDXC 64 GB UHS-II) | |
| Dell XPS 17 9730 RTX 4070 (Toshiba Exceria Pro SDXC 64 GB UHS-II) | |
| Apple MacBook Pro 16 2023 M2 Max (Angelbird AV Pro V60) | |
| MSI Creator Z17 A12UGST-054 (AV Pro SD microSD 128 GB V60) | |
| HP Envy 17-cr0079ng (AV Pro SD microSD 128 GB V60) | |
| LG Gram 17 (2023) (AV Pro SD microSD 128 GB V60) | |
| maximum AS SSD Seq Read Test (1GB) | |
| Apple MacBook Pro 16 2023 M2 Max (Angelbird AV Pro V60) | |
| Dell XPS 17 9730 RTX 4070 (Toshiba Exceria Pro SDXC 64 GB UHS-II) | |
| Dell XPS 17 9720 RTX 3060 (Toshiba Exceria Pro SDXC 64 GB UHS-II) | |
| LG Gram 17 (2023) (AV Pro SD microSD 128 GB V60) | |
| MSI Creator Z17 A12UGST-054 (AV Pro SD microSD 128 GB V60) | |
| HP Envy 17-cr0079ng (AV Pro SD microSD 128 GB V60) | |
通讯 - 无Wi-Fi 6E
XPS 15和XPS 17仍然是最近记忆中唯一配备Wi-Fi 6E无线局域网模块的笔记本电脑,但不 支持Wi-Fi 6E连接。因此,你将无法连接到任何6GHz Wi-Fi网络。对于大多数用户来说,这不应该是一个主要问题,但对于一台售价超过3500美元的笔记本电脑来说,这还是令人失望的。
| Networking | |
| iperf3 transmit AXE11000 | |
| LG Gram 17 (2023) | |
| Dell XPS 17 9720 RTX 3060 | |
| HP Envy 17-cr0079ng | |
| Dell XPS 17 9730 RTX 4070 | |
| iperf3 receive AXE11000 | |
| LG Gram 17 (2023) | |
| HP Envy 17-cr0079ng | |
| Dell XPS 17 9720 RTX 3060 | |
| Dell XPS 17 9730 RTX 4070 | |
| iperf3 transmit AXE11000 6GHz | |
| Apple MacBook Pro 16 2023 M2 Max | |
| LG Gram 17 (2023) | |
| HP Envy 17-cr0079ng | |
| MSI Creator Z17 A12UGST-054 | |
| iperf3 receive AXE11000 6GHz | |
| Apple MacBook Pro 16 2023 M2 Max | |
| MSI Creator Z17 A12UGST-054 | |
| HP Envy 17-cr0079ng | |
| LG Gram 17 (2023) | |
网络摄像头 - 只有720p
XPS 15和XPS 17可能是唯一仍然使用低分辨率的100万像素或720p网络摄像头和没有隐私快门的旗舰笔记本电脑。像联想、惠普、华硕和其他竞争厂商已经转向200万像素甚至 8MP的解决方案.戴尔表示,XPS设计的超窄显示屏边框限制了网络摄像头传感器的质量。


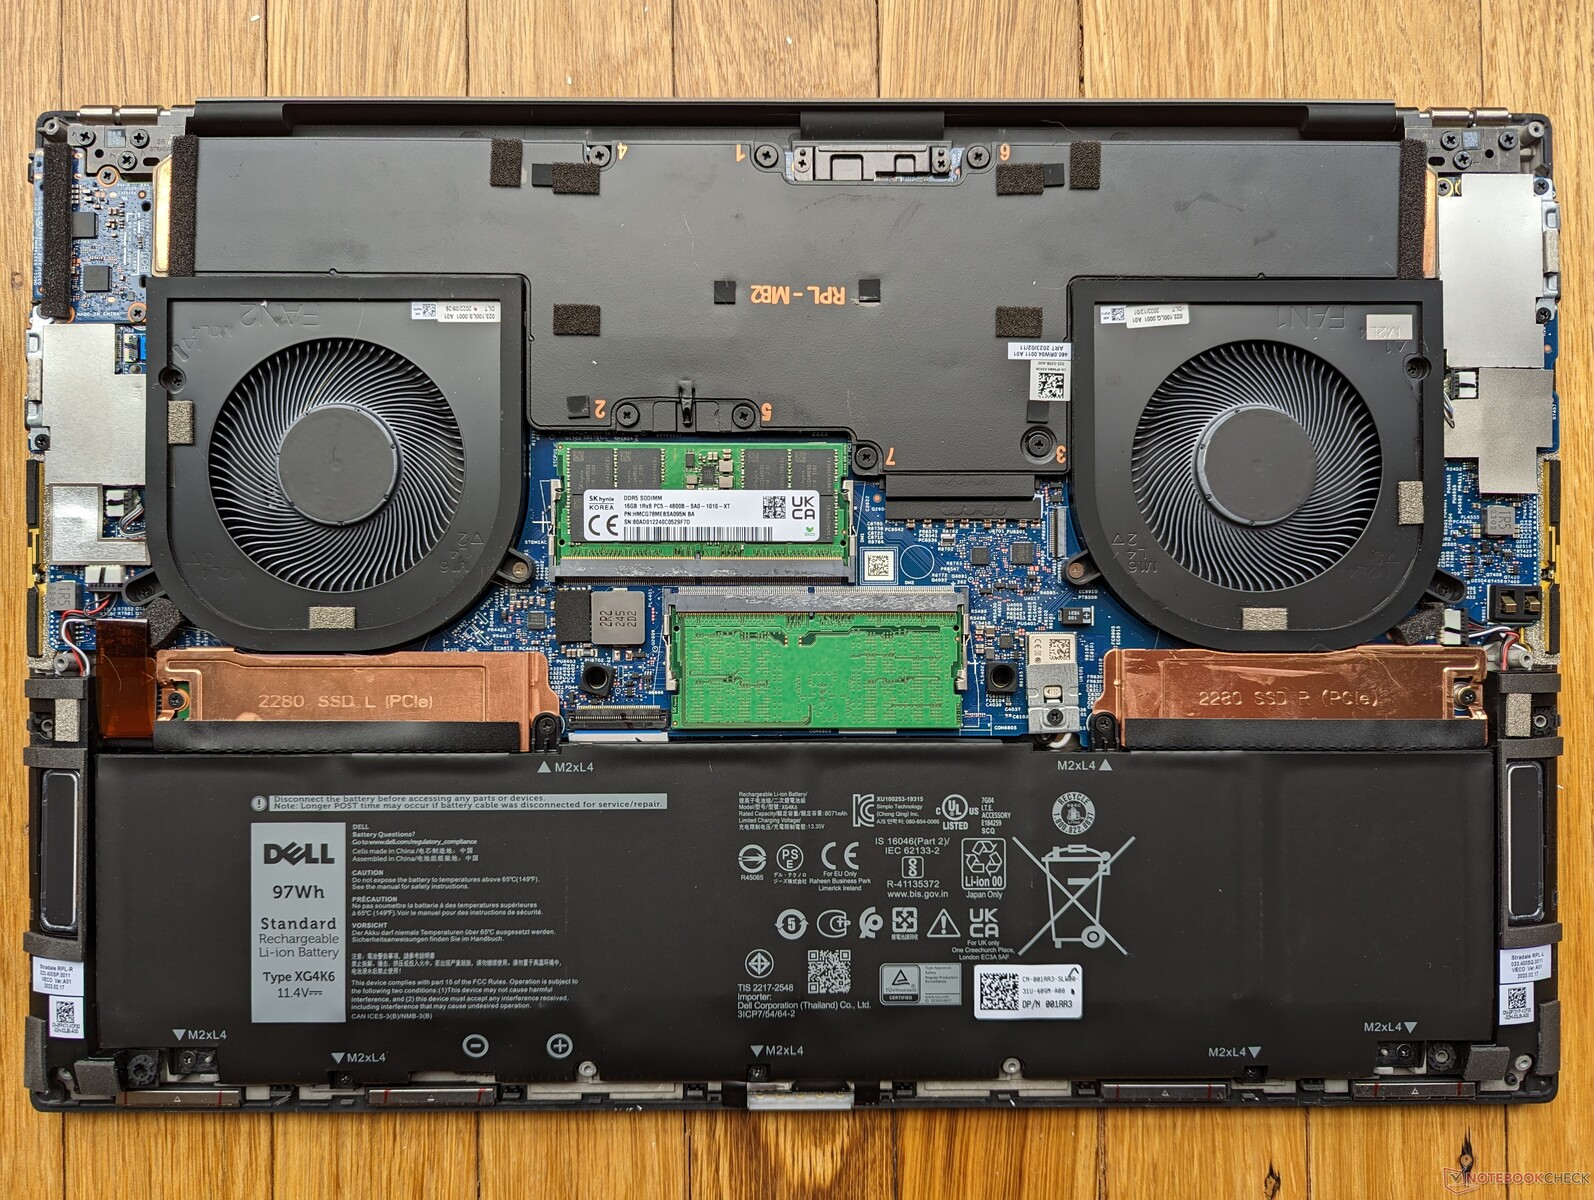
维护
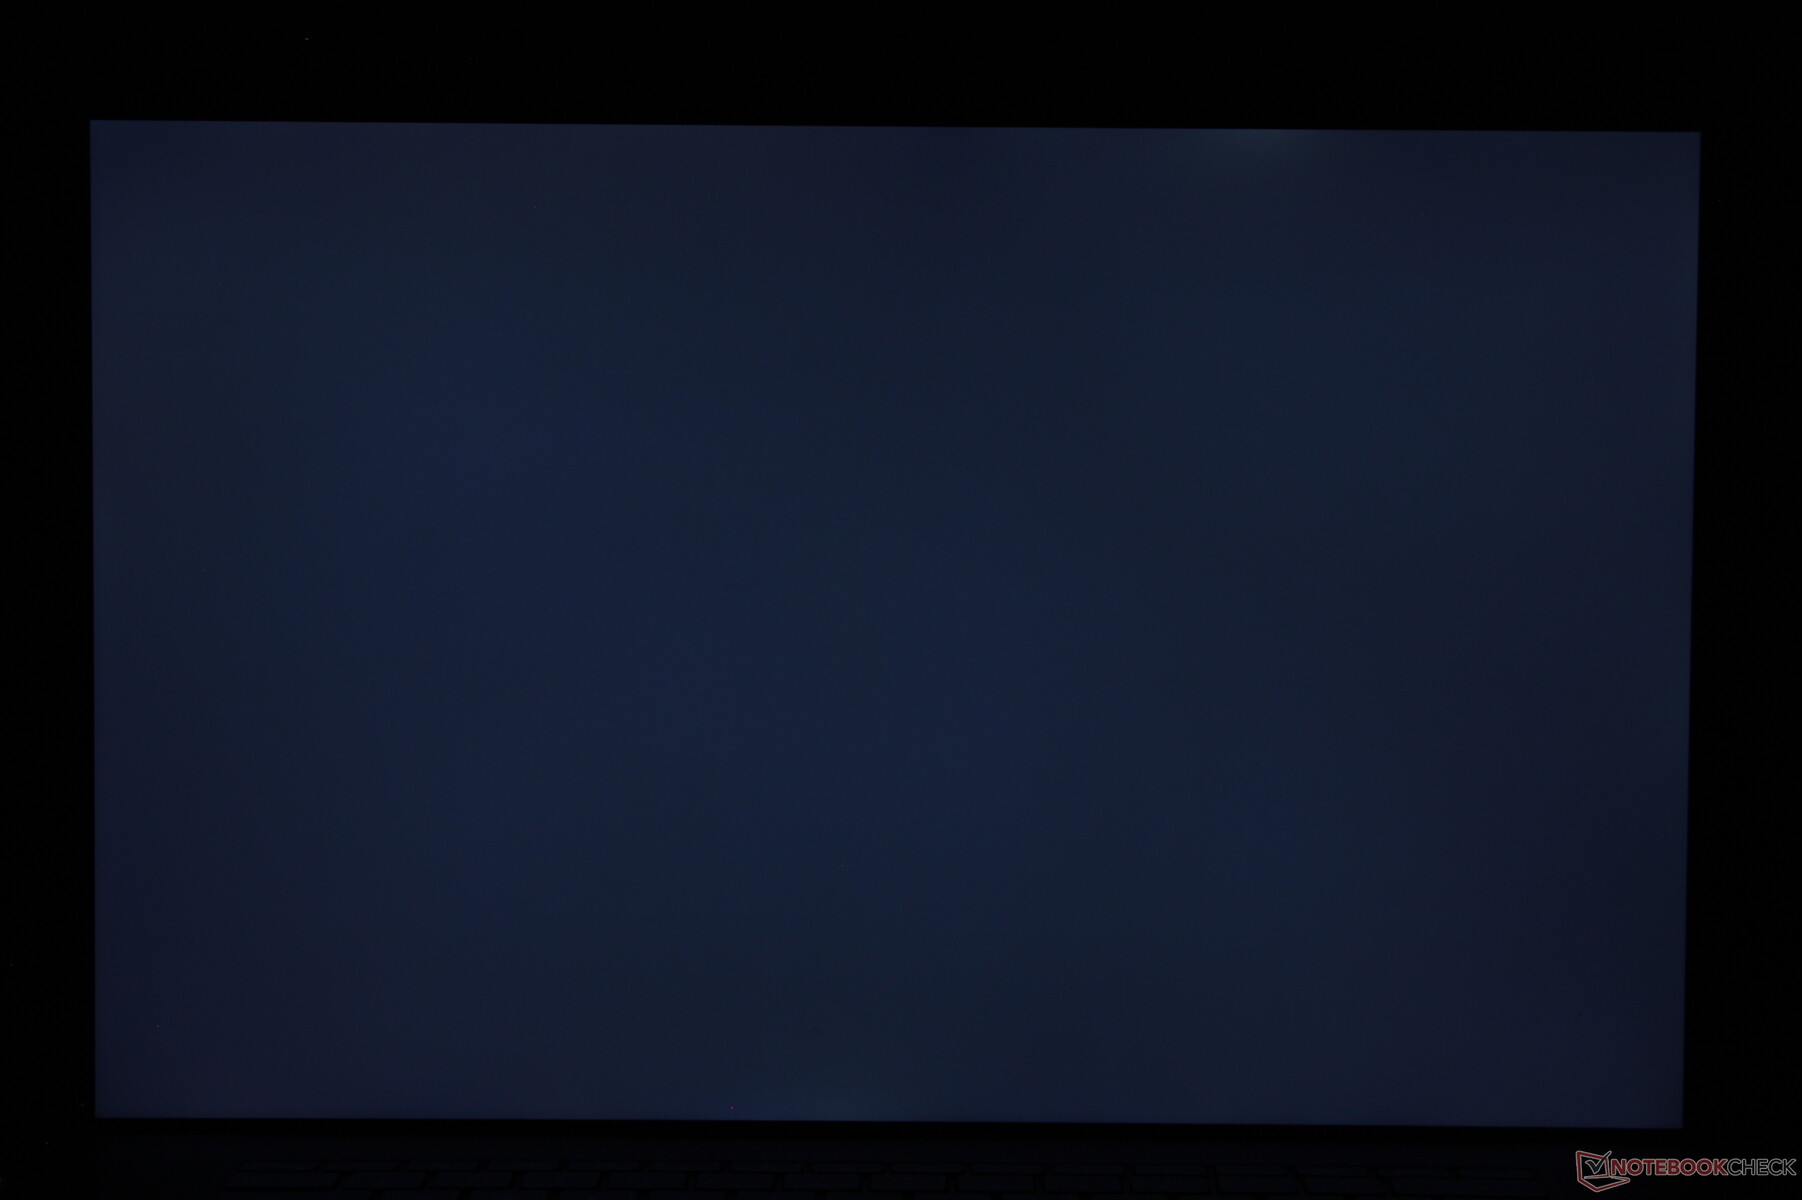
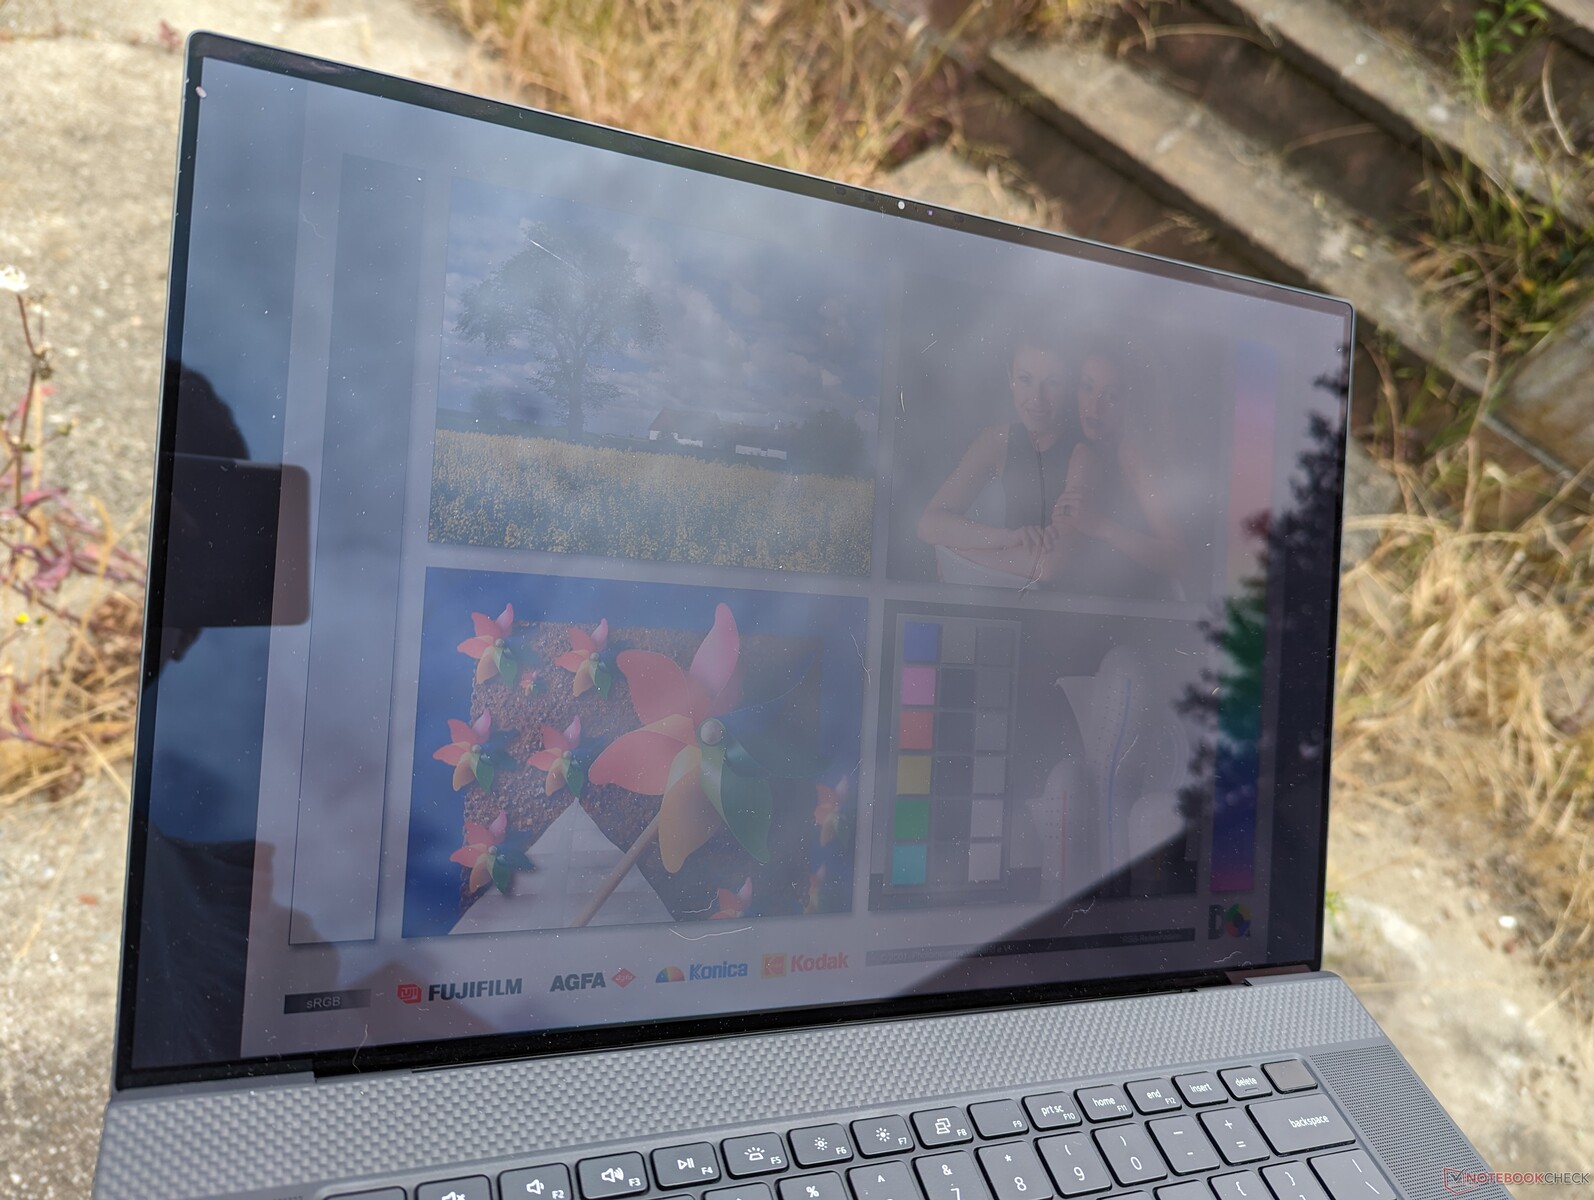
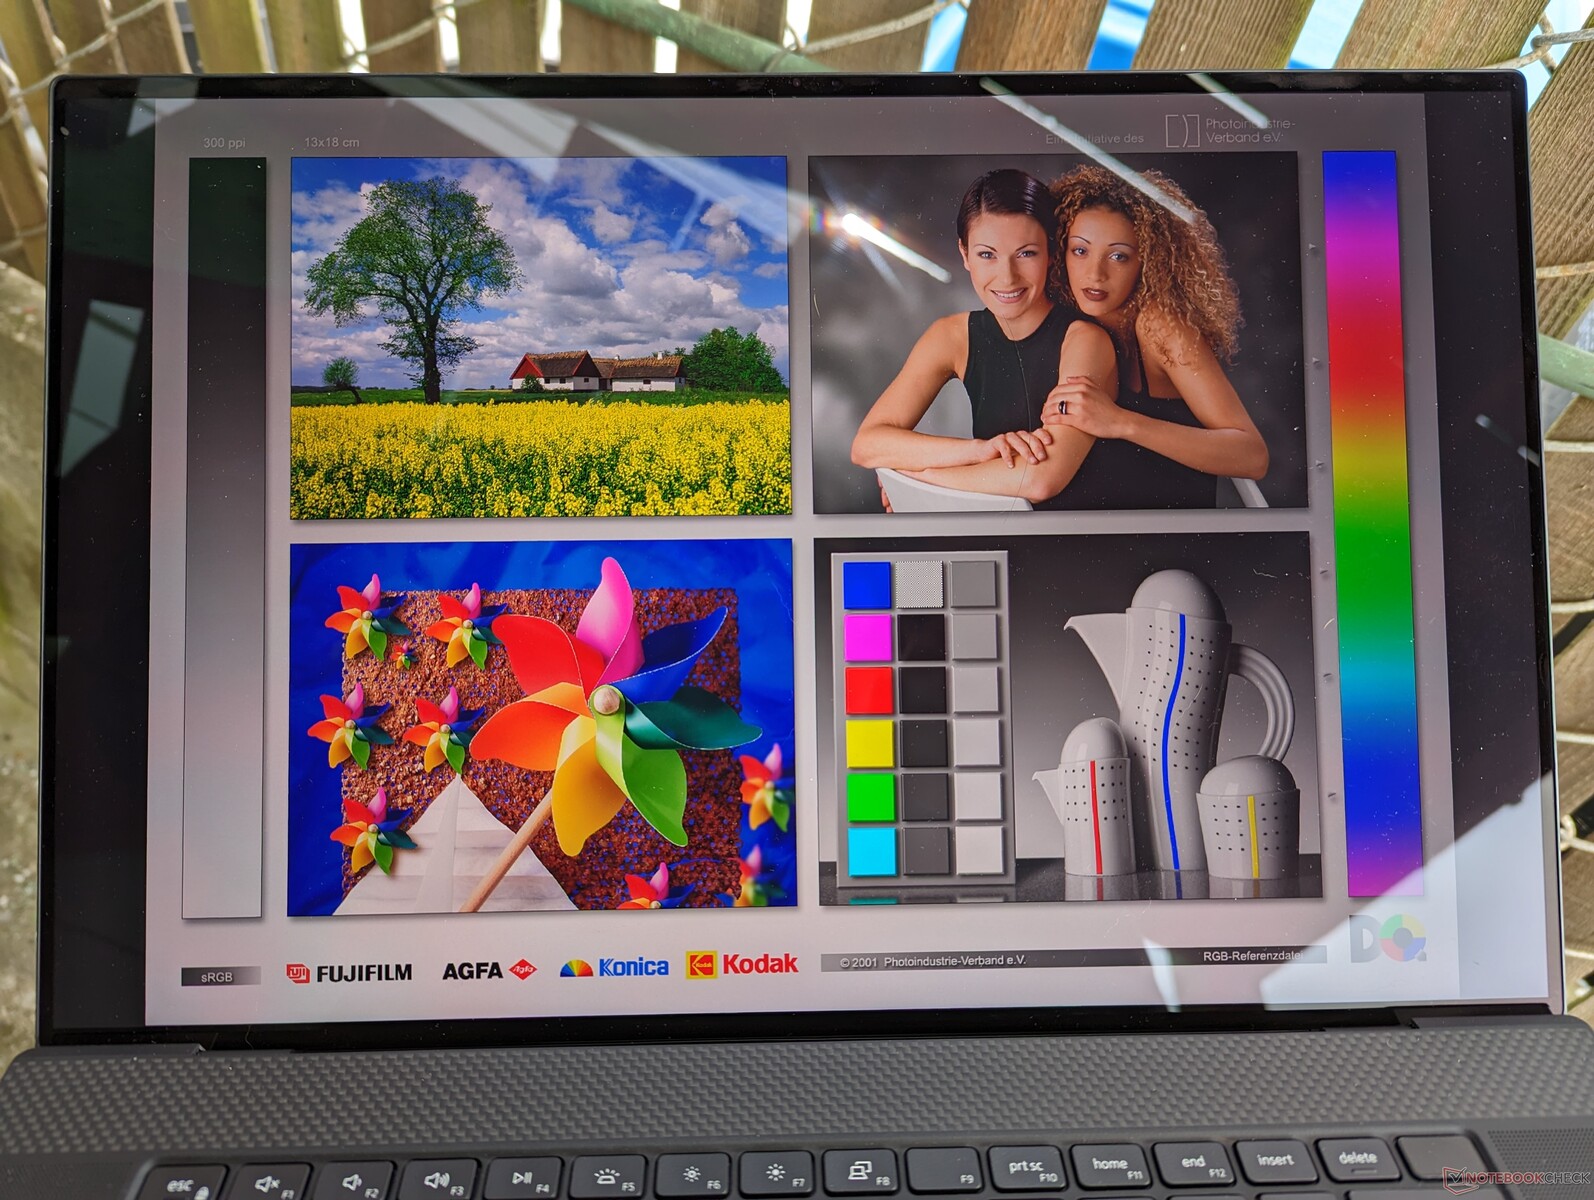
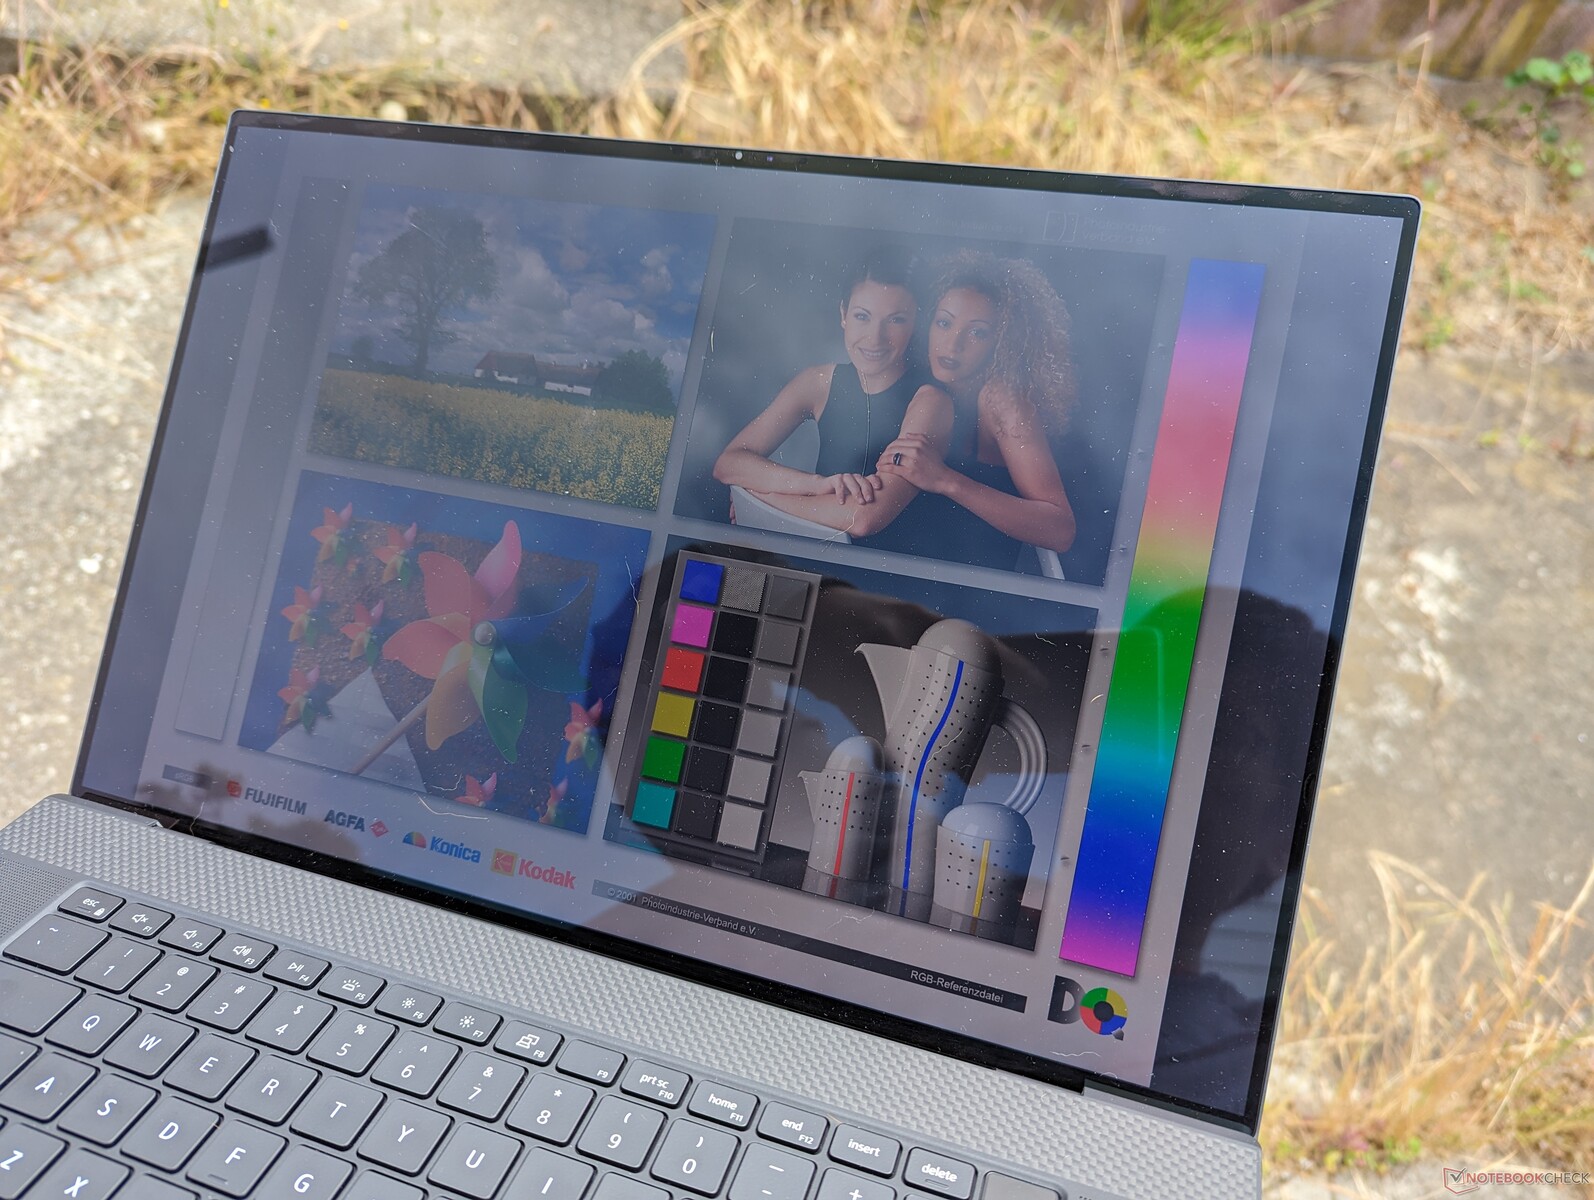
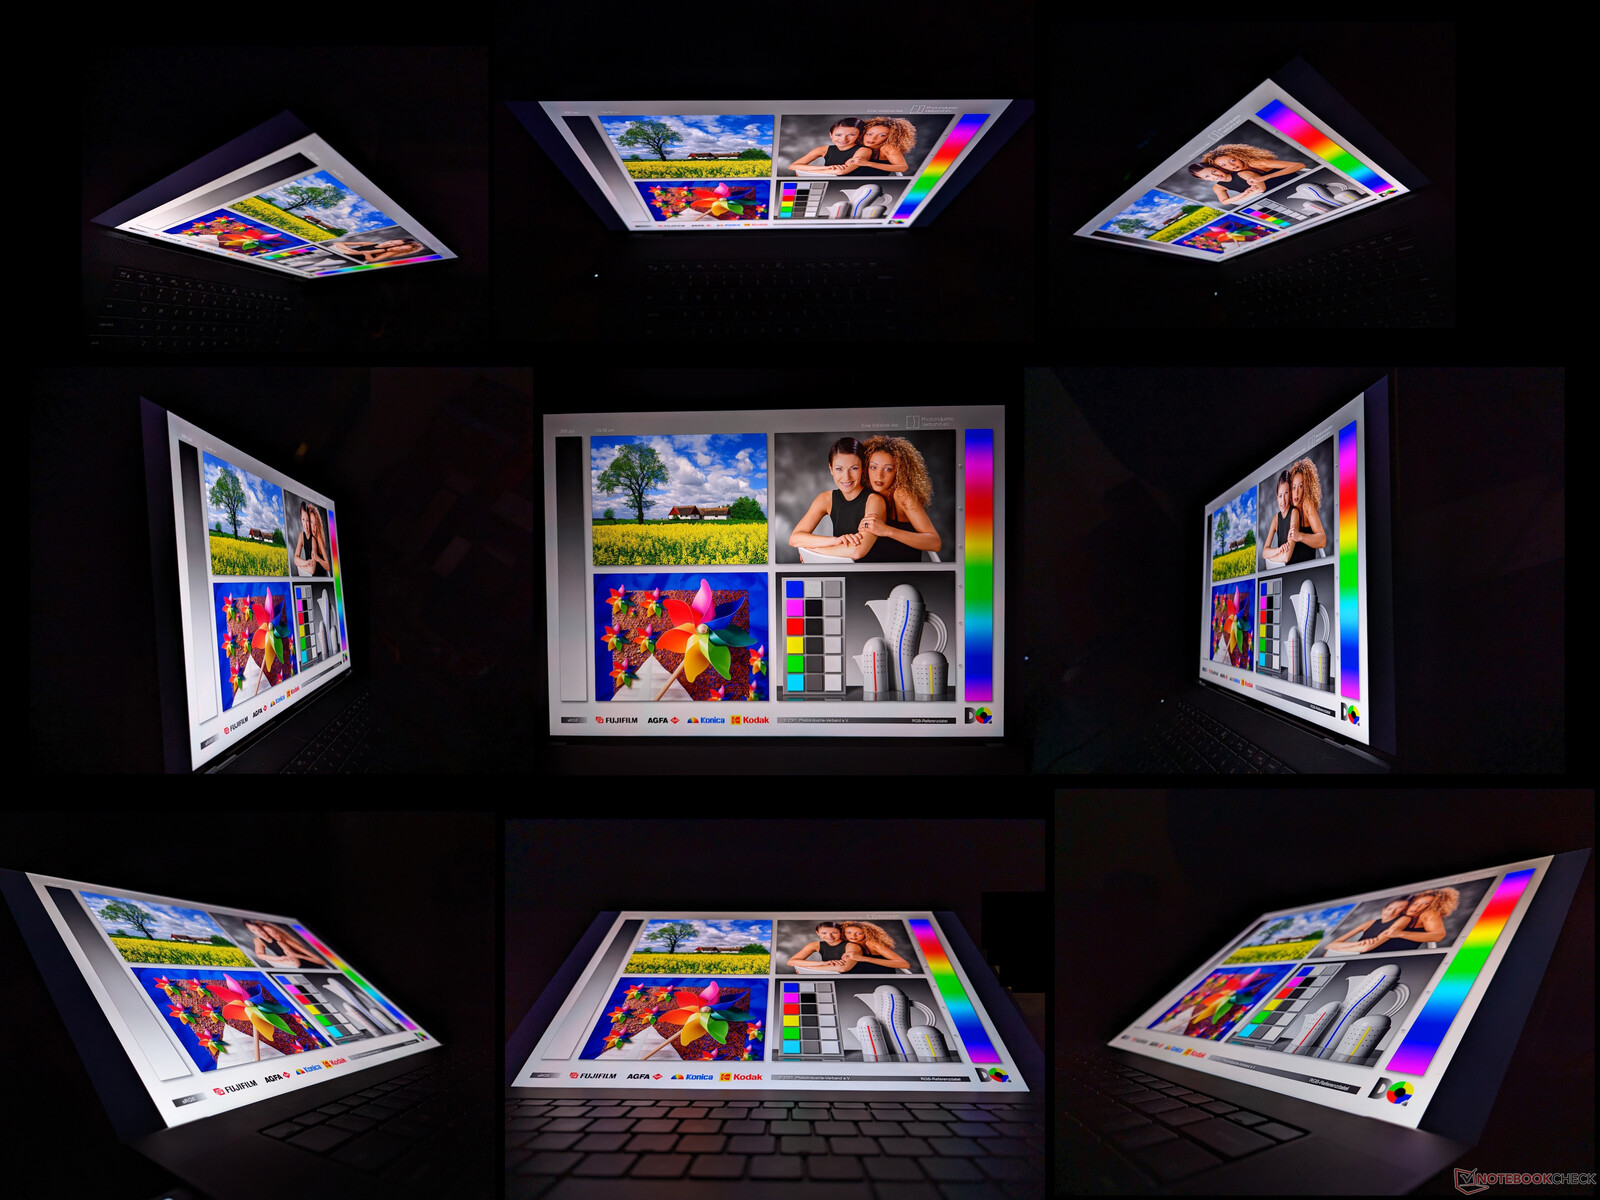
显示屏 - 仍然很好,但没有120赫兹选项
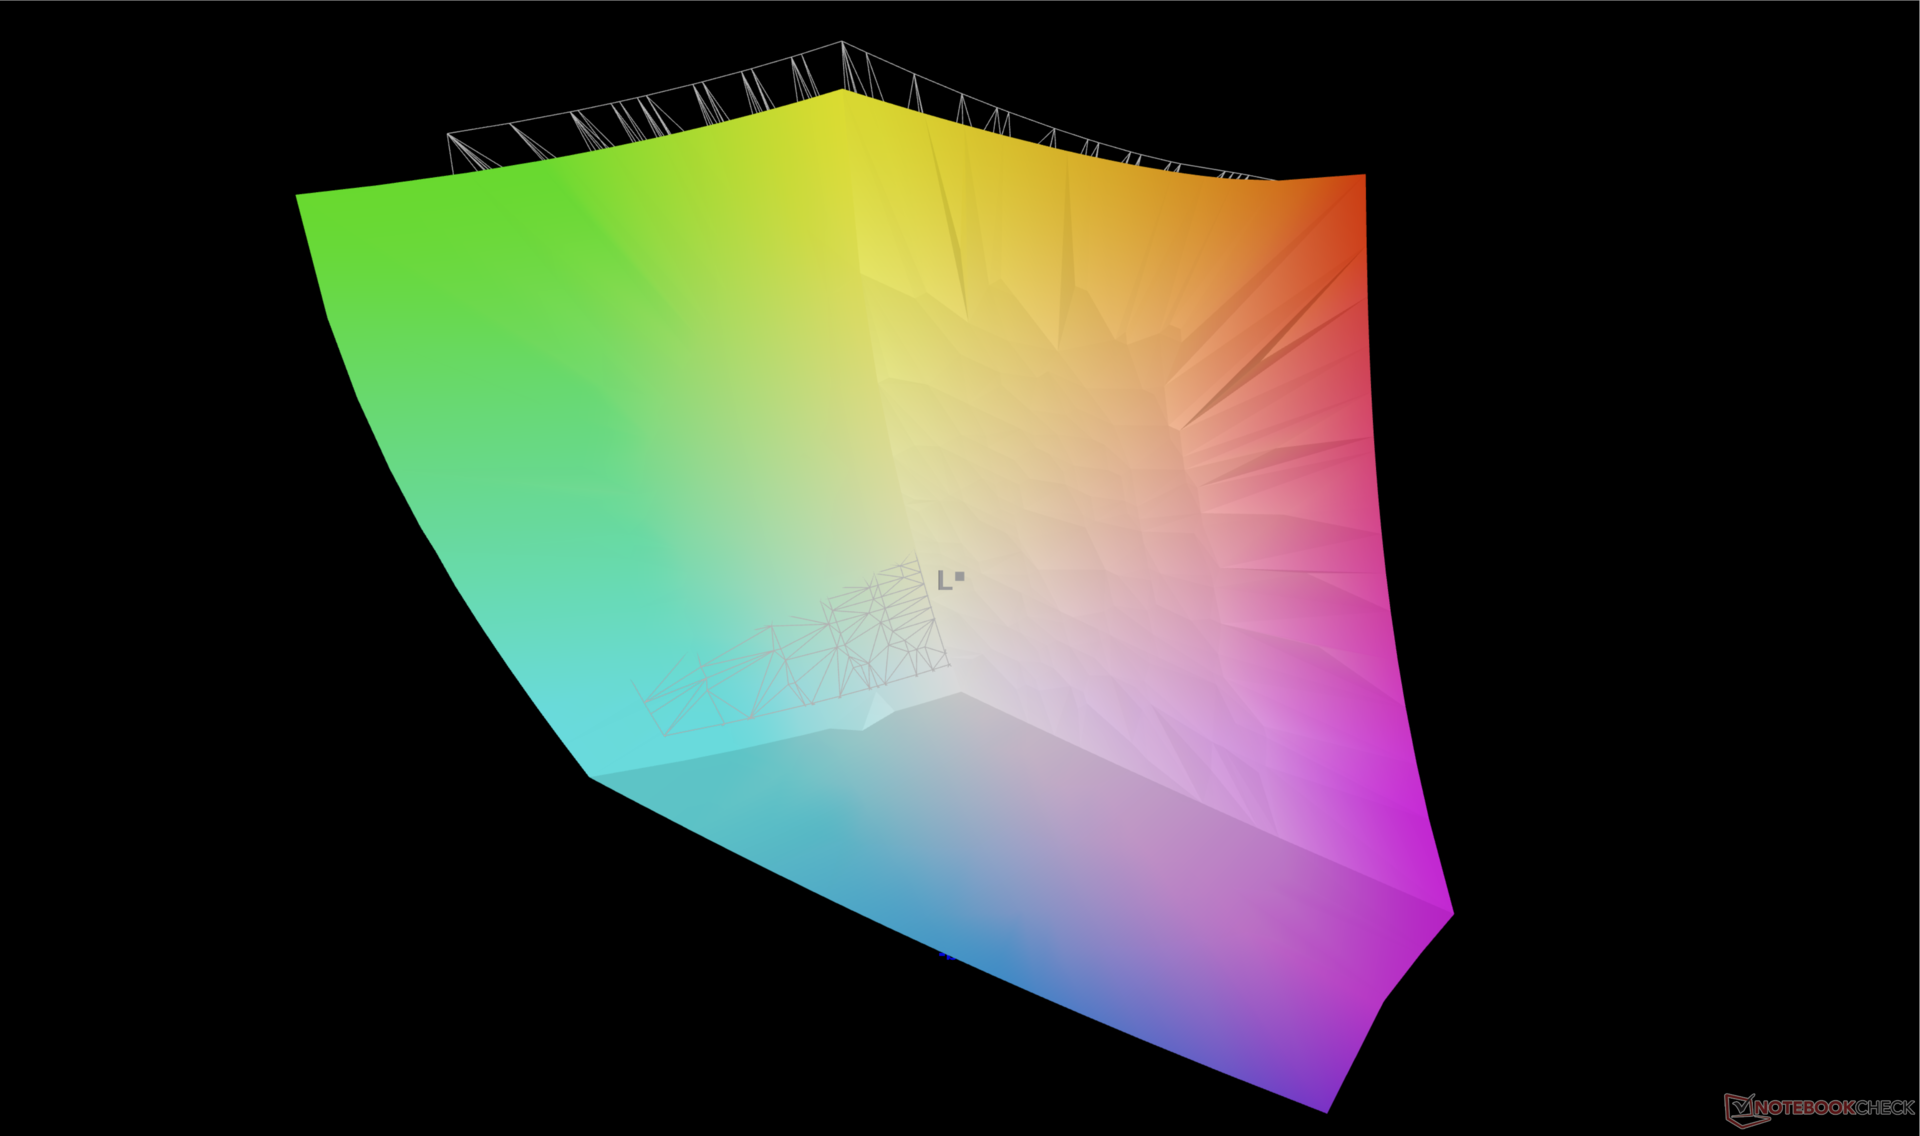
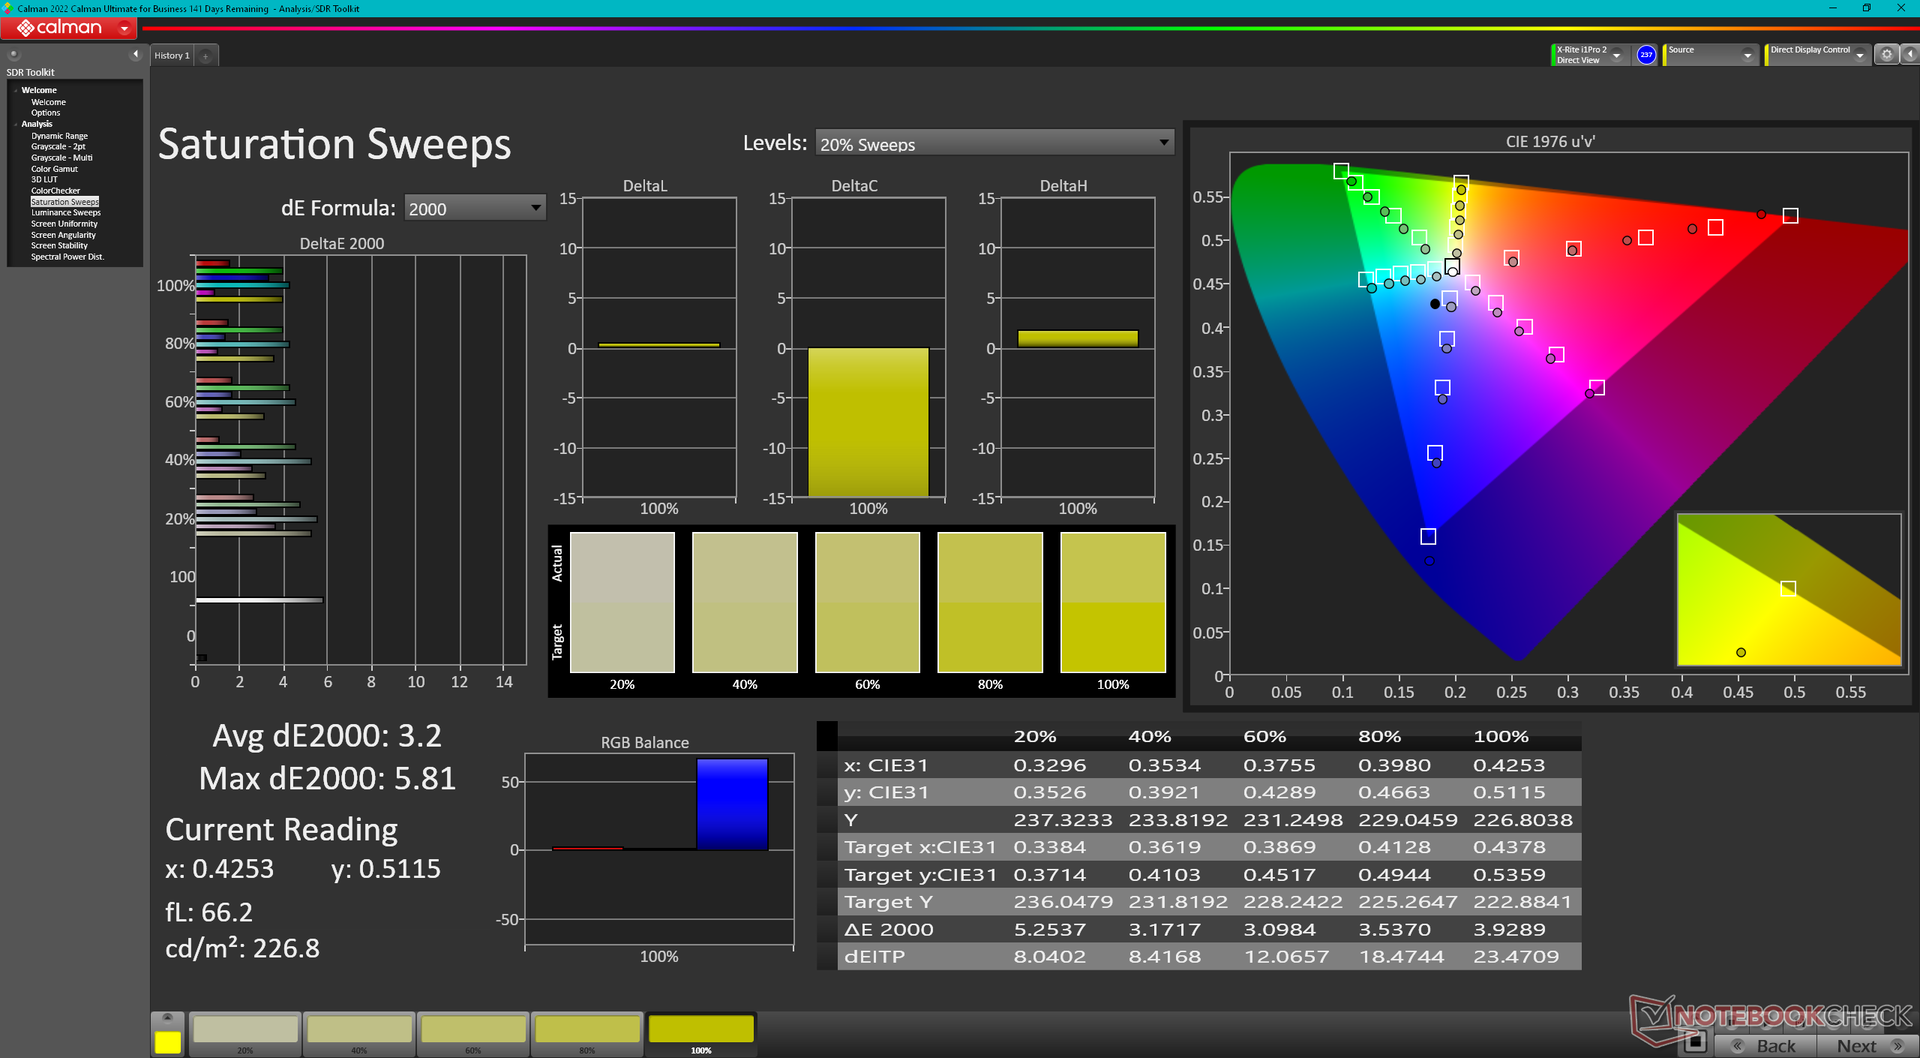
戴尔从最初的2020年型号开始,就一直为其XPS 17系列使用完全相同的17.0英寸夏普LQ170R1 IPS触摸屏面板。因此,从那时起,视觉体验一直保持不变,我们建议查看我们现有的关于 9720, 9710, 或 9700 型号,以了解更多关于显示器的信息。虽然宽广的DCI-P3色彩、良好的最大亮度、锐利的UHD+分辨率和良好的1500:1对比度至今仍然很棒,但60赫兹的刷新率开始显示其年龄,因为90赫兹或更快的面板在其他多媒体笔记本电脑上变得很常见,如 华硕ZenBook 14或 联想超薄7i.

| |||||||||||||||||||||||||
Brightness Distribution: 85 %
Center on Battery: 457.4 cd/m²
Contrast: 1475:1 (Black: 0.31 cd/m²)
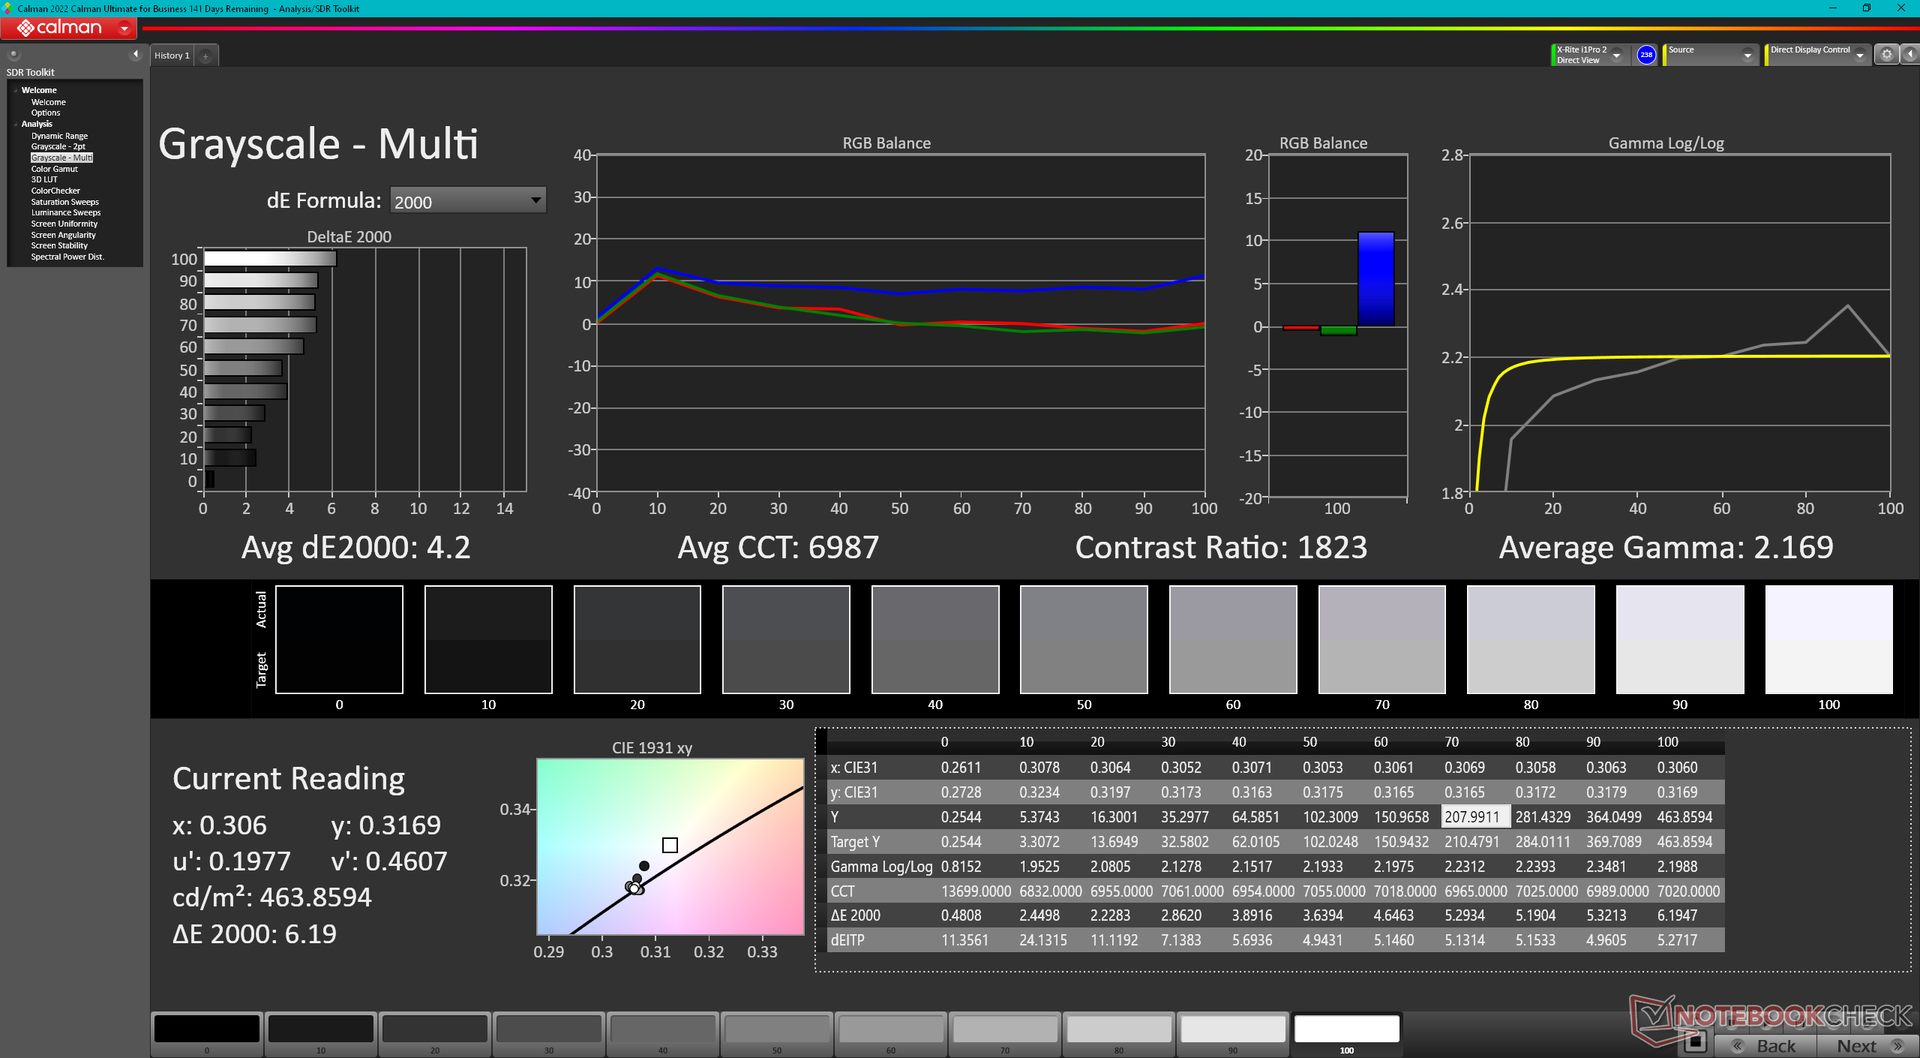
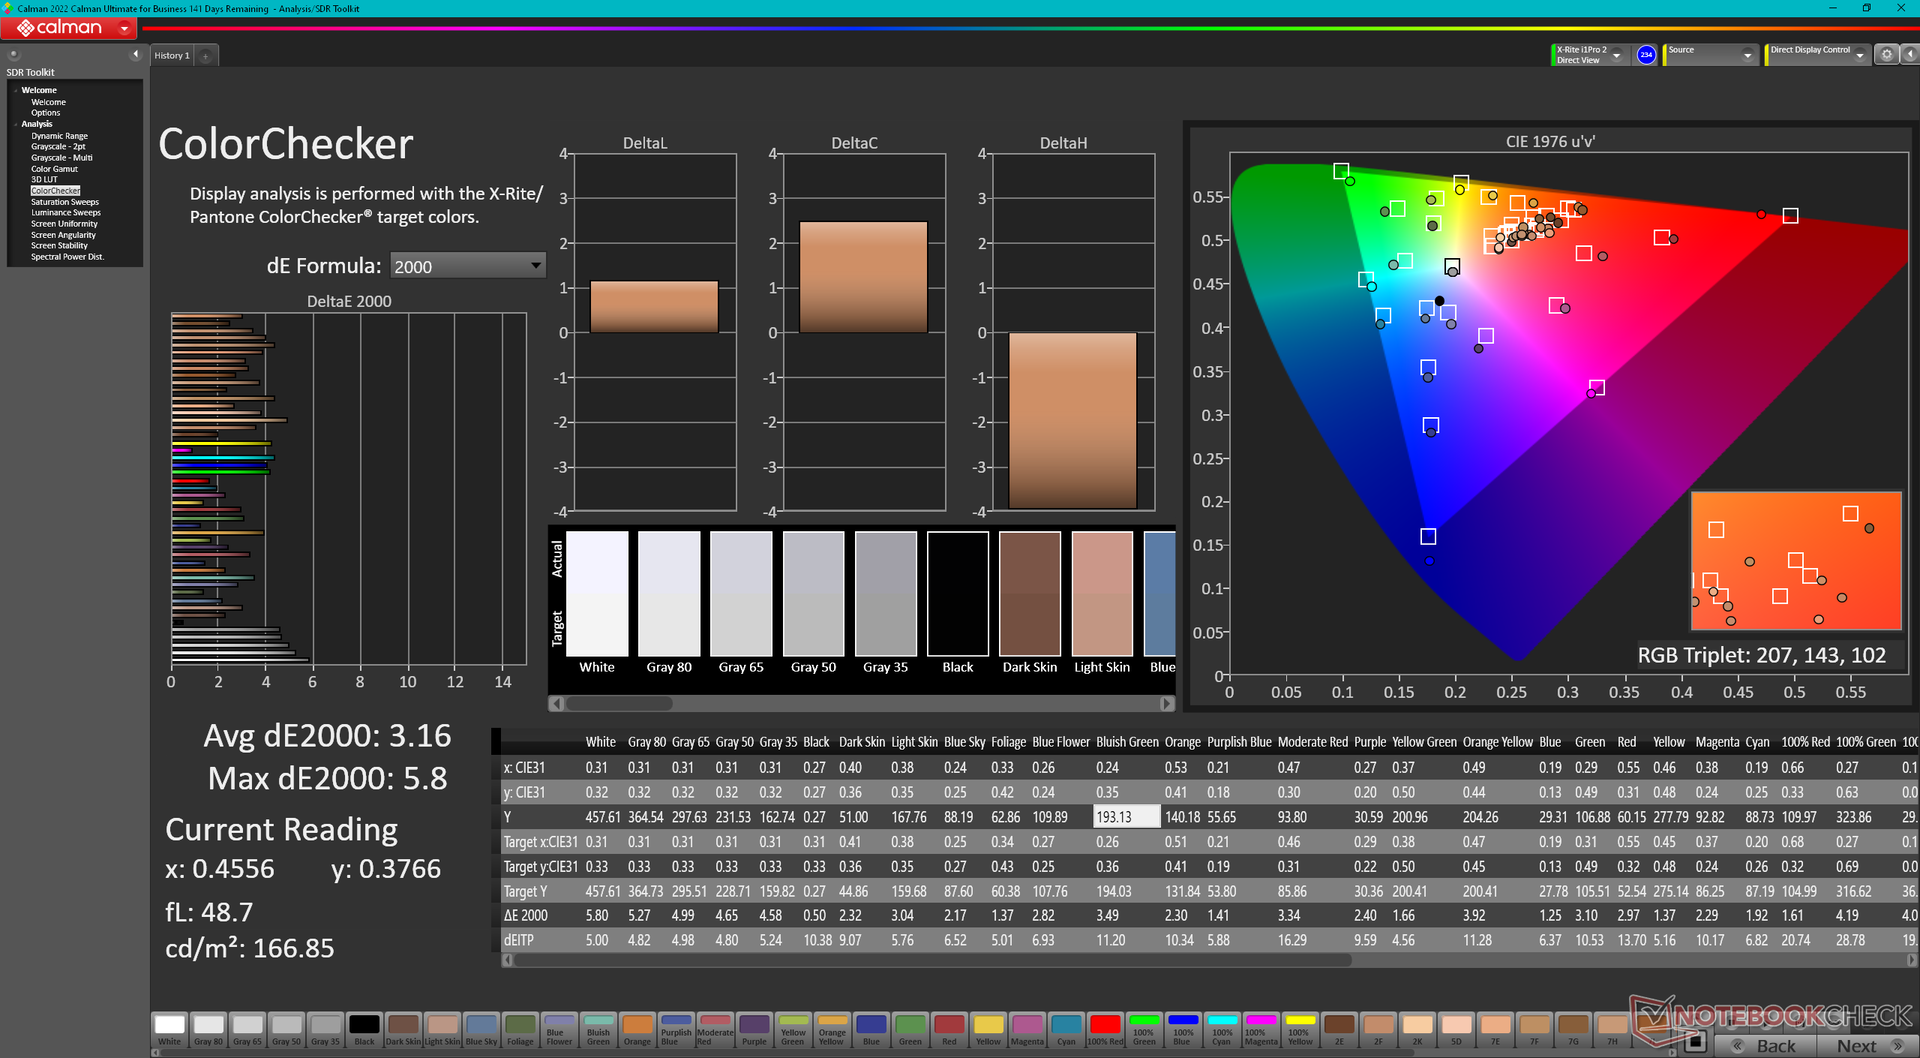
ΔE ColorChecker Calman: 3.16 | ∀{0.5-29.43 Ø4.71}
ΔE Greyscale Calman: 4.2 | ∀{0.09-98 Ø4.96}
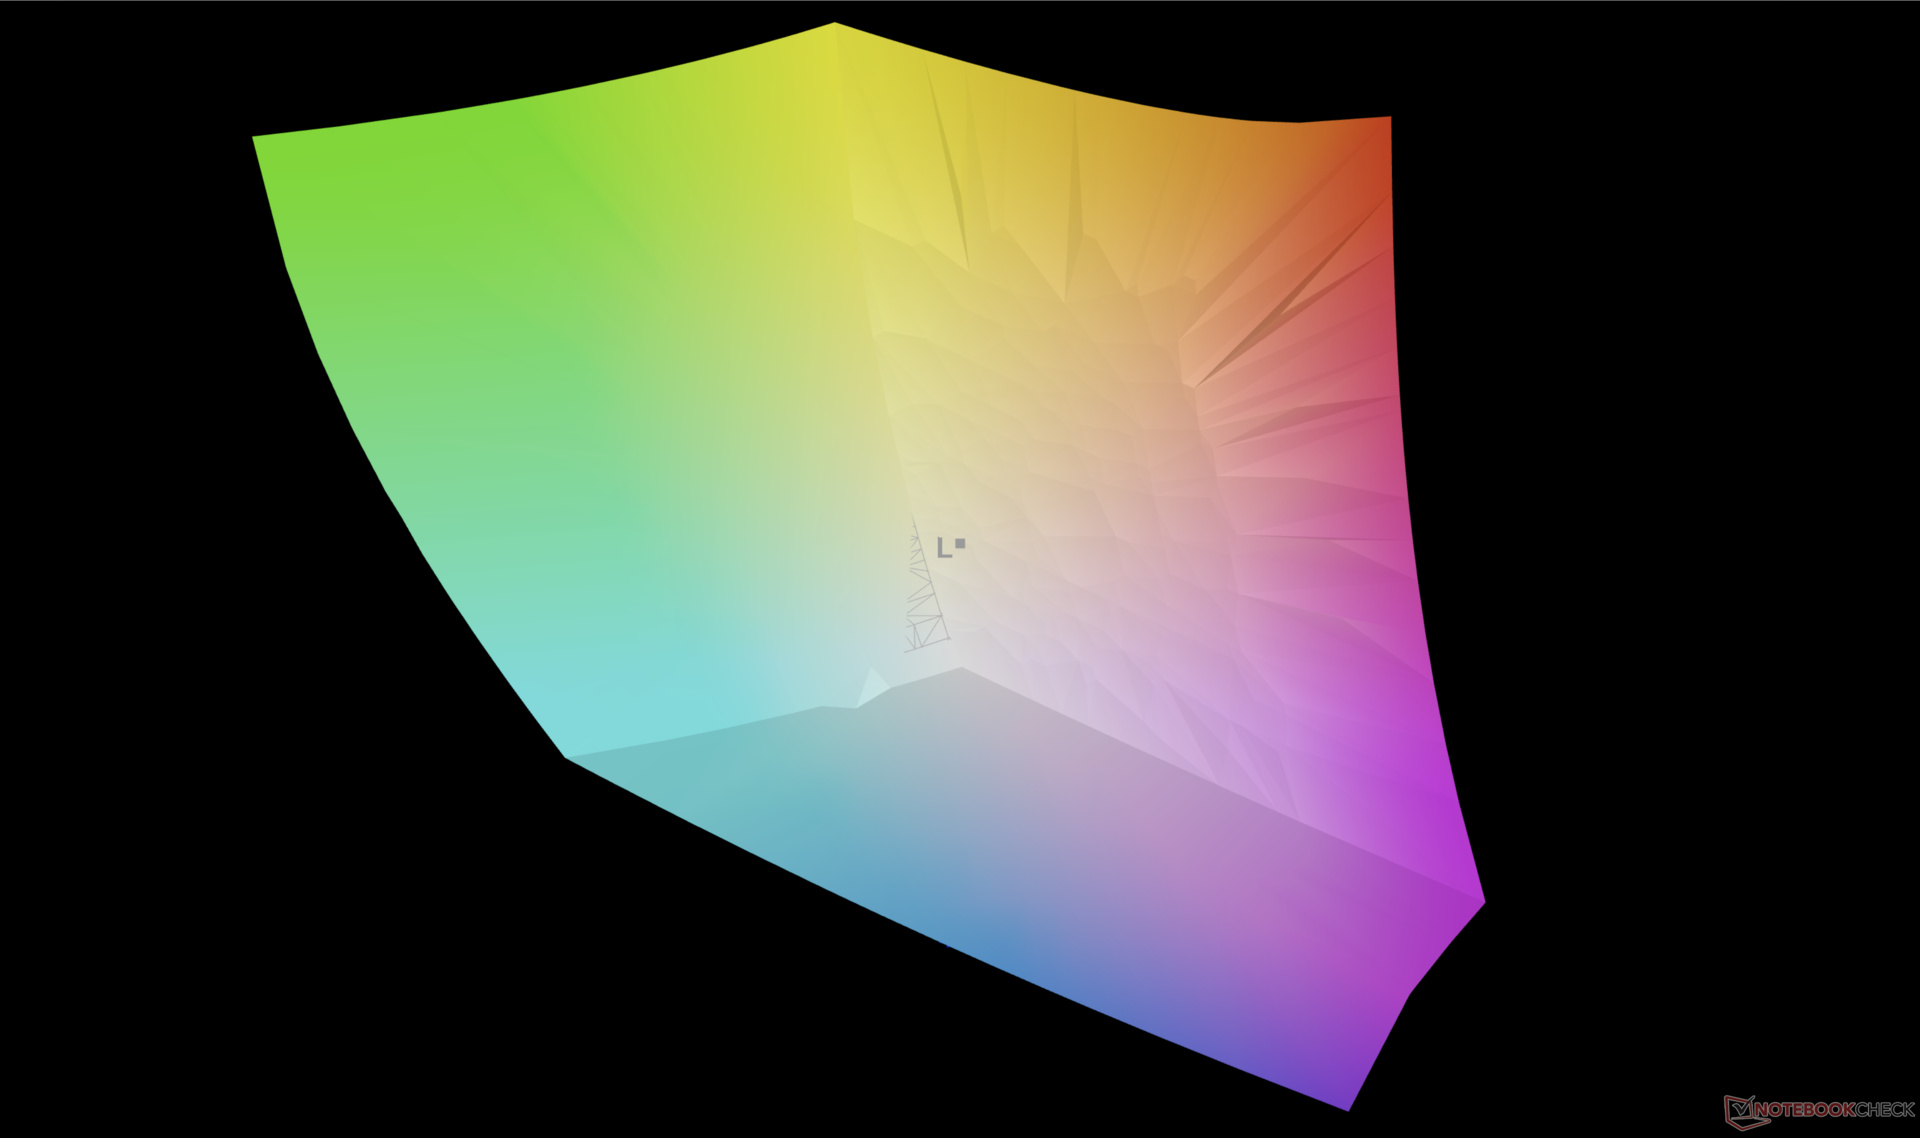
100% AdobeRGB 1998 (Argyll 3D)
100% sRGB (Argyll 3D)
95.2% Display P3 (Argyll 3D)
Gamma: 2.17
CCT: 6987 K
| Dell XPS 17 9730 RTX 4070 10-point capacitive, Sharp LQ170R1, 3840x2400, 17" | Dell XPS 17 9720 RTX 3060 Sharp LQ170R1, IPS, 3840x2400, 17" | LG Gram 17 (2023) LG Display LP170WQ1-SPF2, IPS, 2560x1600, 17" | HP Envy 17-cr0079ng BOE0A66, IPS, 3840x2160, 17.3" | MSI Creator Z17 A12UGST-054 AUO3C9B (B170QAN01.0), IPS, 2560x1600, 17" | Apple MacBook Pro 16 2023 M2 Max Mini-LED, 3456x2234, 16.2" | |
|---|---|---|---|---|---|---|
| Display | -6% | -4% | -3% | -3% | -2% | |
| Display P3 Coverage (%) | 95.2 | 92.9 -2% | 97 2% | 98.31 3% | 98.9 4% | 99 4% |
| sRGB Coverage (%) | 100 | 100 0% | 99.8 0% | 100 0% | 99.9 0% | 100 0% |
| AdobeRGB 1998 Coverage (%) | 100 | 85.3 -15% | 84.9 -15% | 87.03 -13% | 86.4 -14% | 88.5 -11% |
| Response Times | -16% | 80% | 88% | 79% | -70% | |
| Response Time Grey 50% / Grey 80% * (ms) | 42.9 ? | 51.2 ? -19% | 2 ? 95% | 1 98% | 11 ? 74% | 80.5 ? -88% |
| Response Time Black / White * (ms) | 31.3 ? | 35.2 ? -12% | 11 ? 65% | 7 ? 78% | 5 ? 84% | 47.2 ? -51% |
| PWM Frequency (Hz) | 14880 ? | |||||
| Screen | -30% | -6% | 9% | -13% | 4294% | |
| Brightness middle (cd/m²) | 457.4 | 512.7 12% | 405 -11% | 390 -15% | 444 -3% | 504 10% |
| Brightness (cd/m²) | 430 | 463 8% | 363 -16% | 385 -10% | 415 -3% | 487 13% |
| Brightness Distribution (%) | 85 | 85 0% | 82 -4% | 86 1% | 88 4% | 94 11% |
| Black Level * (cd/m²) | 0.31 | 0.32 -3% | 0.225 27% | 0.395 -27% | 0.7 -126% | 0.001 100% |
| Contrast (:1) | 1475 | 1602 9% | 1800 22% | 987 -33% | 634 -57% | 504000 34069% |
| Colorchecker dE 2000 * | 3.16 | 5.98 -89% | 3.35 -6% | 1.66 47% | 2.48 22% | 1.5 53% |
| Colorchecker dE 2000 max. * | 5.8 | 12.09 -108% | 7.96 -37% | 2.9 50% | 3.52 39% | 3.3 43% |
| Greyscale dE 2000 * | 4.2 | 7.2 -71% | 5.28 -26% | 1.83 56% | 3.33 21% | 2.1 50% |
| Gamma | 2.17 101% | 2.54 87% | 2.43 91% | 2.25 98% | 2.33 94% | 2.25 98% |
| CCT | 6987 93% | 6914 94% | 7424 88% | 6727 97% | 6230 104% | 6882 94% |
| Colorchecker dE 2000 calibrated * | 1.34 | 1.16 | 2.91 | |||
| Total Average (Program / Settings) | -17% /
-22% | 23% /
7% | 31% /
18% | 21% /
3% | 1407% /
2631% |
* ... smaller is better
Display Response Times
| ↔ Response Time Black to White | ||
|---|---|---|
| 31.3 ms ... rise ↗ and fall ↘ combined | ↗ 16.9 ms rise | 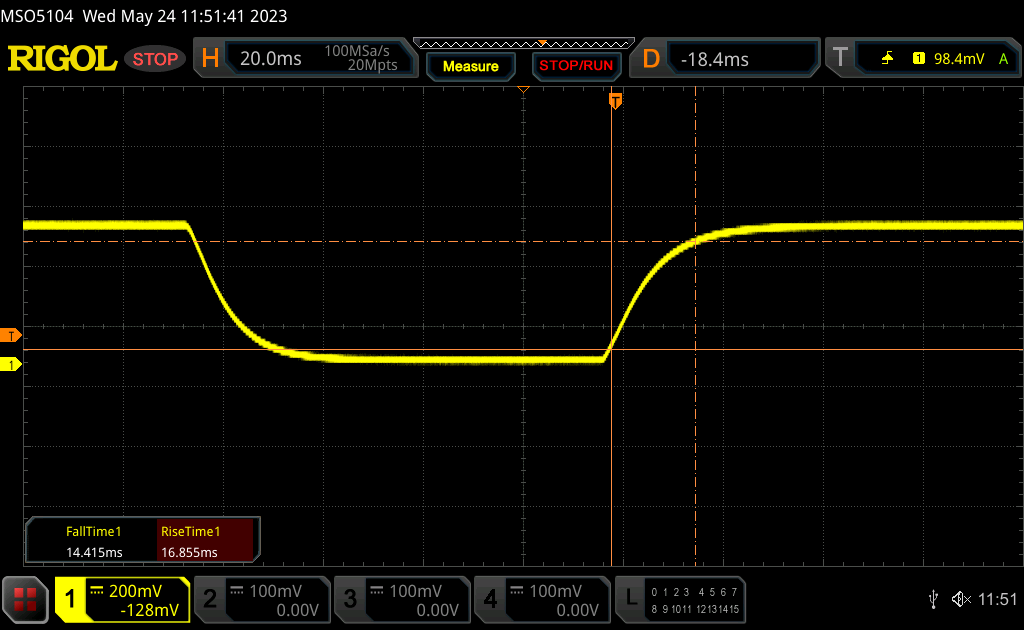 |
| ↘ 14.4 ms fall | ||
| The screen shows slow response rates in our tests and will be unsatisfactory for gamers. In comparison, all tested devices range from 0.1 (minimum) to 240 (maximum) ms. » 85 % of all devices are better. This means that the measured response time is worse than the average of all tested devices (19.8 ms). | ||
| ↔ Response Time 50% Grey to 80% Grey | ||
| 42.9 ms ... rise ↗ and fall ↘ combined | ↗ 19.9 ms rise | 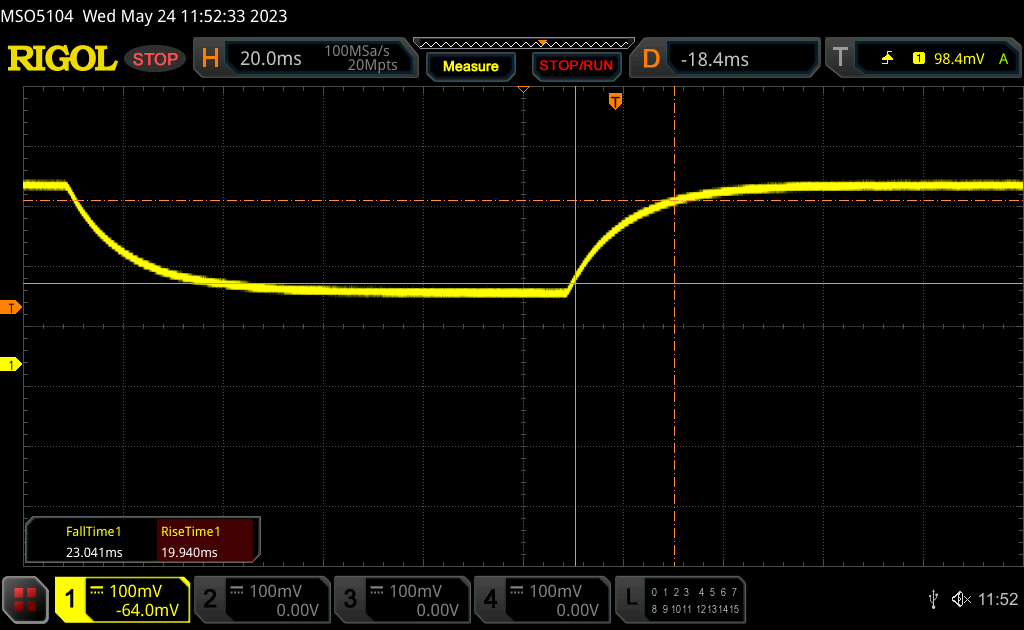 |
| ↘ 23 ms fall | ||
| The screen shows slow response rates in our tests and will be unsatisfactory for gamers. In comparison, all tested devices range from 0.165 (minimum) to 636 (maximum) ms. » 71 % of all devices are better. This means that the measured response time is worse than the average of all tested devices (30.9 ms). | ||
Screen Flickering / PWM (Pulse-Width Modulation)
| Screen flickering / PWM not detected | 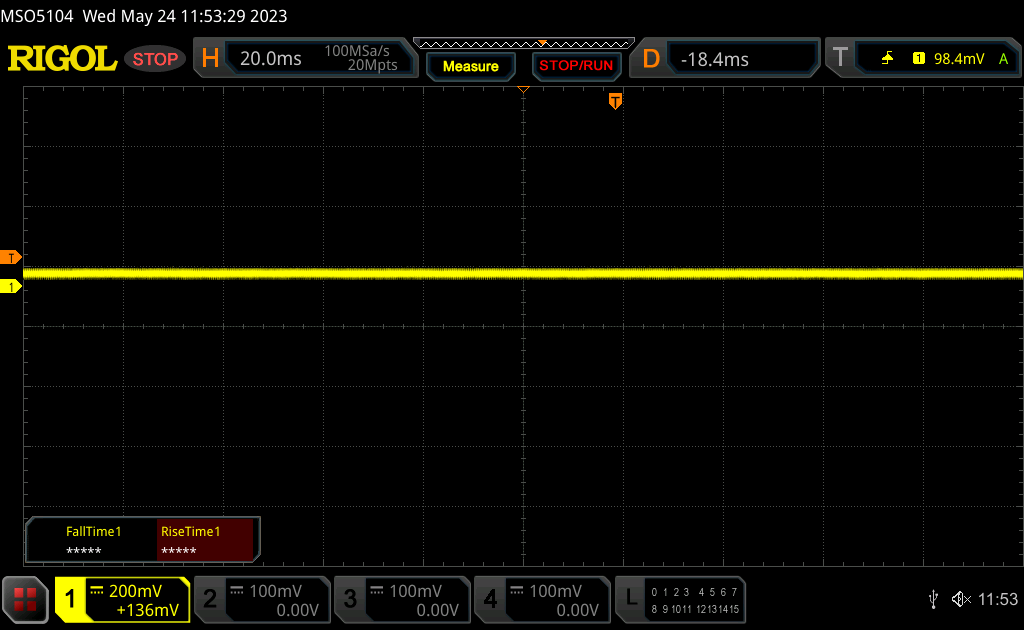 | ||
In comparison: 52 % of all tested devices do not use PWM to dim the display. If PWM was detected, an average of 7741 (minimum: 5 - maximum: 343500) Hz was measured. | |||
性能--第13代英特尔+Nvidia Ada Lovelace
测试条件
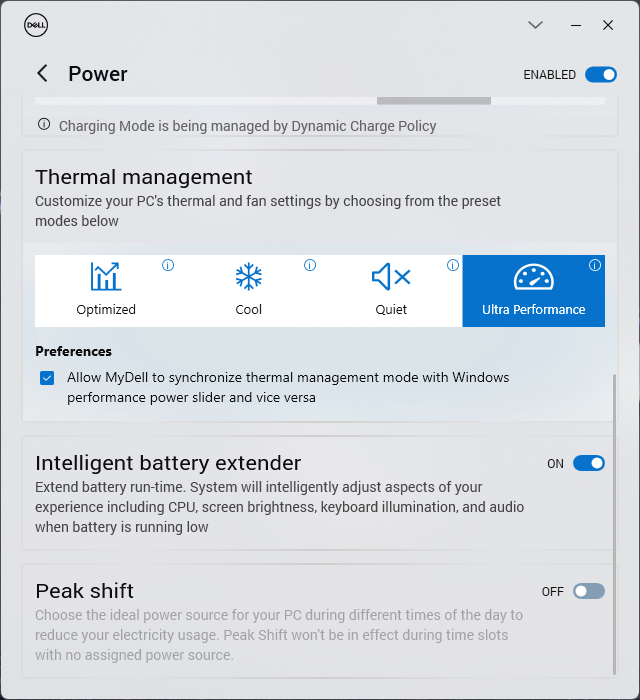
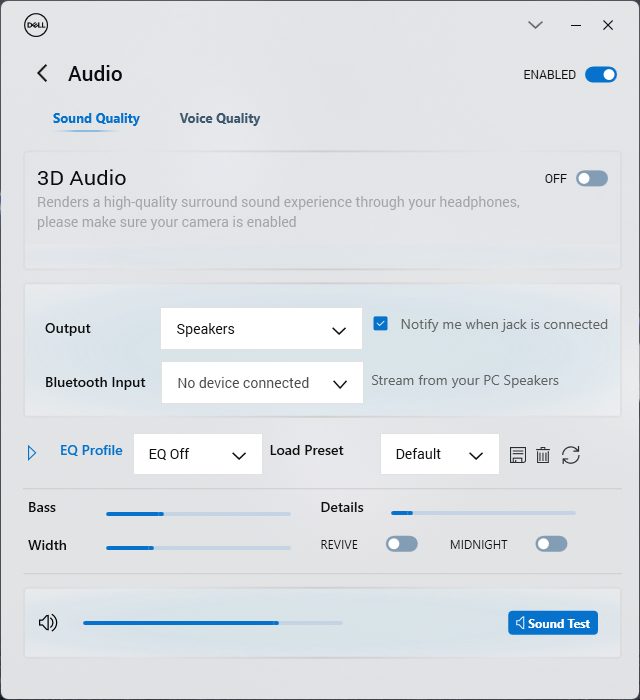
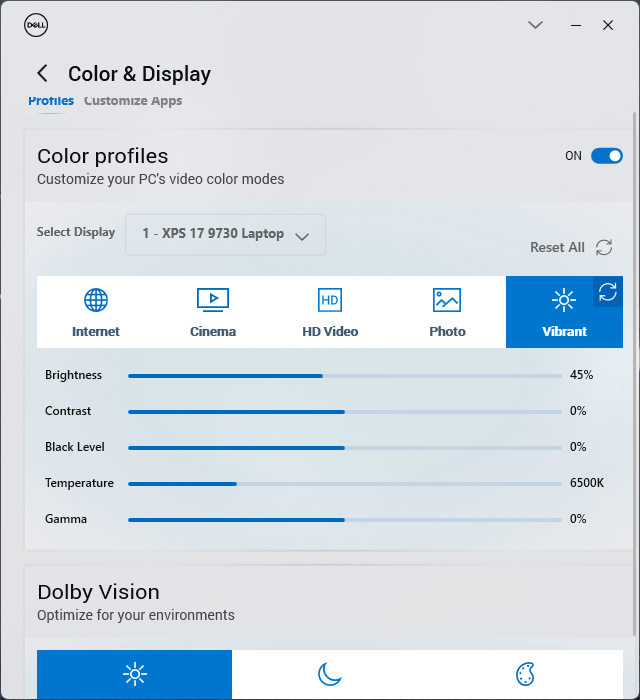
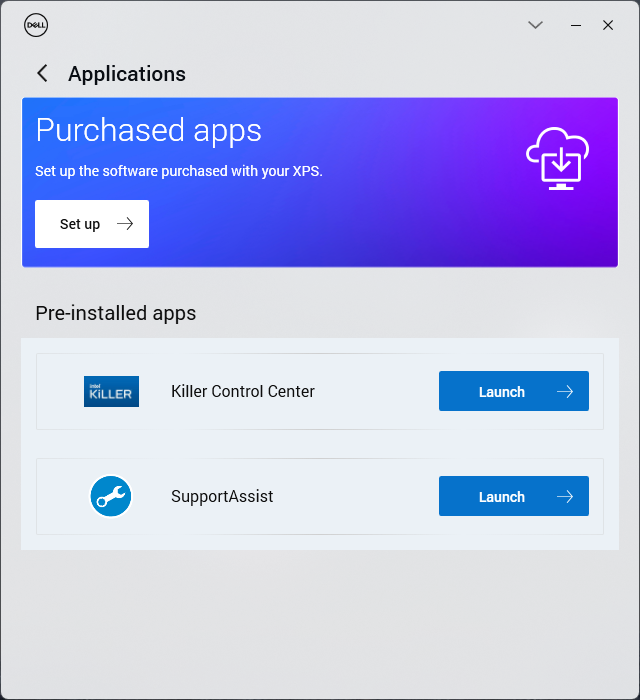
在运行以下任何基准测试之前,我们通过MyDell软件将我们的设备设置为性能模式。戴尔的电源配置文件设置与Windows的电源配置文件设置方便地同步,这与大多数其他笔记本电脑不同。
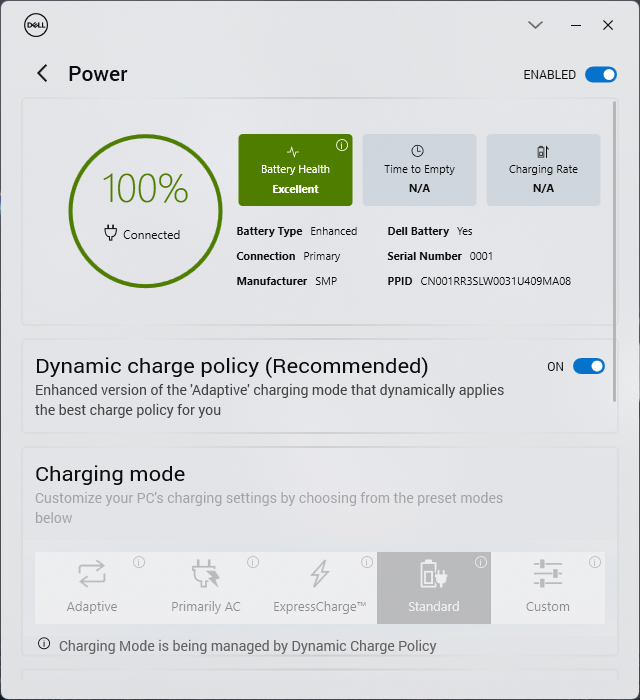
建议用户熟悉MyDell,因为它是调整音频、颜色、电源和其他预装戴尔应用程序(如SupportAssist)的中央枢纽。戴尔再次重新设计了MyDell用户界面,使其与同一家制造商的许多商用笔记本电脑所配备的戴尔优化软件更加相似。令人讨厌的是,应用程序的窗口非常小,而且不能被最大化。
Optimus的标准配置是在iGPU和dGPU之间自动切换。没有对高级优化或MUX的支持。
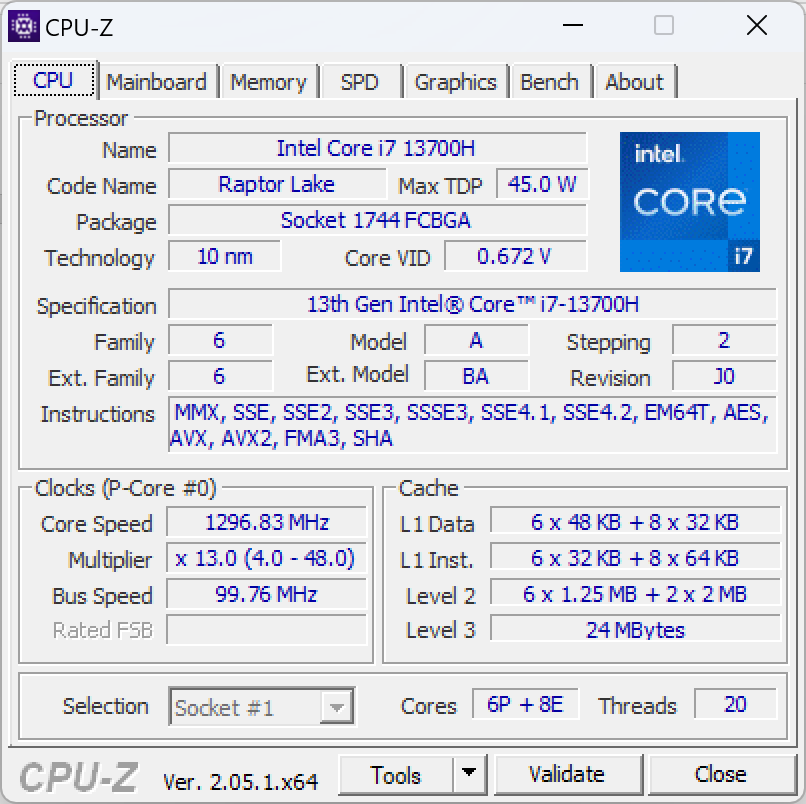
处理器
芯片 酷睿i7-13700HXPS 17的性能非常好,其基准测试结果略高于我们数据库中配备相同处理器的大多数其他笔记本电脑,包括最近的 XPS 15 9530.特别是Turbo Boost令人印象深刻,比Core i7-12700H有25%的性能优势。 酷睿i7-12700H在去年的 XPS 17 9720模型。
然而,有一个值得注意的问题需要牢记。正如我们在循环运行CineBench R15 xT时的下图所示,CPU Turbo Boost并不是无限的。在运行9或10次后,性能将下降约25%,这与其他大多数采用H系列CPU的笔记本电脑相比,是比较陡峭的。如果考虑到这种节流,酷睿i7-13700H的性能实际上与酷睿i7-12700H几乎相同。因此,当短时间内需要高性能时,如启动程序、编辑图像或编码短视频时,酷睿i7-13700H的性能最佳。否则,与去年的酷睿i7-12700H相比,它只是提供了微小的性能优势。
升级到 酷睿i9-13900H选项预计将提高多线程性能约10%至20%,根据我们对微星Stealth 17 Studio.然而,单线程性能将保持不变,甚至比酷睿i9稍微慢一些。
Cinebench R15 Multi Loop
Cinebench R23: Multi Core | Single Core
Cinebench R20: CPU (Multi Core) | CPU (Single Core)
Cinebench R15: CPU Multi 64Bit | CPU Single 64Bit
Blender: v2.79 BMW27 CPU
7-Zip 18.03: 7z b 4 | 7z b 4 -mmt1
Geekbench 5.5: Multi-Core | Single-Core
HWBOT x265 Benchmark v2.2: 4k Preset
LibreOffice : 20 Documents To PDF
R Benchmark 2.5: Overall mean
* ... smaller is better
AIDA64: FP32 Ray-Trace | FPU Julia | CPU SHA3 | CPU Queen | FPU SinJulia | FPU Mandel | CPU AES | CPU ZLib | FP64 Ray-Trace | CPU PhotoWorxx
| Performance rating | |
| Dell XPS 17 9730 RTX 4070 | |
| Average Intel Core i7-13700H | |
| MSI Creator Z17 A12UGST-054 | |
| Dell XPS 17 9720 RTX 3060 | |
| LG Gram 17 (2023) | |
| HP Envy 17-cr0079ng | |
| AIDA64 / FP32 Ray-Trace | |
| Dell XPS 17 9730 RTX 4070 | |
| Average Intel Core i7-13700H (4986 - 18908, n=29) | |
| LG Gram 17 (2023) | |
| MSI Creator Z17 A12UGST-054 | |
| HP Envy 17-cr0079ng | |
| Dell XPS 17 9720 RTX 3060 | |
| AIDA64 / FPU Julia | |
| Dell XPS 17 9730 RTX 4070 | |
| Average Intel Core i7-13700H (25360 - 92359, n=29) | |
| HP Envy 17-cr0079ng | |
| LG Gram 17 (2023) | |
| MSI Creator Z17 A12UGST-054 | |
| Dell XPS 17 9720 RTX 3060 | |
| AIDA64 / CPU SHA3 | |
| Dell XPS 17 9730 RTX 4070 | |
| Average Intel Core i7-13700H (1339 - 4224, n=29) | |
| MSI Creator Z17 A12UGST-054 | |
| Dell XPS 17 9720 RTX 3060 | |
| HP Envy 17-cr0079ng | |
| LG Gram 17 (2023) | |
| AIDA64 / CPU Queen | |
| MSI Creator Z17 A12UGST-054 | |
| Dell XPS 17 9720 RTX 3060 | |
| Dell XPS 17 9730 RTX 4070 | |
| Average Intel Core i7-13700H (59324 - 107159, n=29) | |
| LG Gram 17 (2023) | |
| HP Envy 17-cr0079ng | |
| AIDA64 / FPU SinJulia | |
| Dell XPS 17 9730 RTX 4070 | |
| MSI Creator Z17 A12UGST-054 | |
| Dell XPS 17 9720 RTX 3060 | |
| Average Intel Core i7-13700H (4800 - 11050, n=29) | |
| LG Gram 17 (2023) | |
| HP Envy 17-cr0079ng | |
| AIDA64 / FPU Mandel | |
| Dell XPS 17 9730 RTX 4070 | |
| Average Intel Core i7-13700H (12321 - 45118, n=29) | |
| MSI Creator Z17 A12UGST-054 | |
| LG Gram 17 (2023) | |
| Dell XPS 17 9720 RTX 3060 | |
| HP Envy 17-cr0079ng | |
| AIDA64 / CPU AES | |
| MSI Creator Z17 A12UGST-054 | |
| Dell XPS 17 9720 RTX 3060 | |
| Average Intel Core i7-13700H (28769 - 151254, n=29) | |
| Dell XPS 17 9730 RTX 4070 | |
| LG Gram 17 (2023) | |
| HP Envy 17-cr0079ng | |
| AIDA64 / CPU ZLib | |
| Dell XPS 17 9730 RTX 4070 | |
| MSI Creator Z17 A12UGST-054 | |
| Average Intel Core i7-13700H (389 - 1215, n=29) | |
| Dell XPS 17 9720 RTX 3060 | |
| HP Envy 17-cr0079ng | |
| LG Gram 17 (2023) | |
| AIDA64 / FP64 Ray-Trace | |
| Dell XPS 17 9730 RTX 4070 | |
| Average Intel Core i7-13700H (2540 - 10135, n=29) | |
| LG Gram 17 (2023) | |
| MSI Creator Z17 A12UGST-054 | |
| Dell XPS 17 9720 RTX 3060 | |
| HP Envy 17-cr0079ng | |
| AIDA64 / CPU PhotoWorxx | |
| LG Gram 17 (2023) | |
| Dell XPS 17 9730 RTX 4070 | |
| Dell XPS 17 9720 RTX 3060 | |
| Average Intel Core i7-13700H (12872 - 52727, n=29) | |
| MSI Creator Z17 A12UGST-054 | |
| HP Envy 17-cr0079ng | |
系统性能
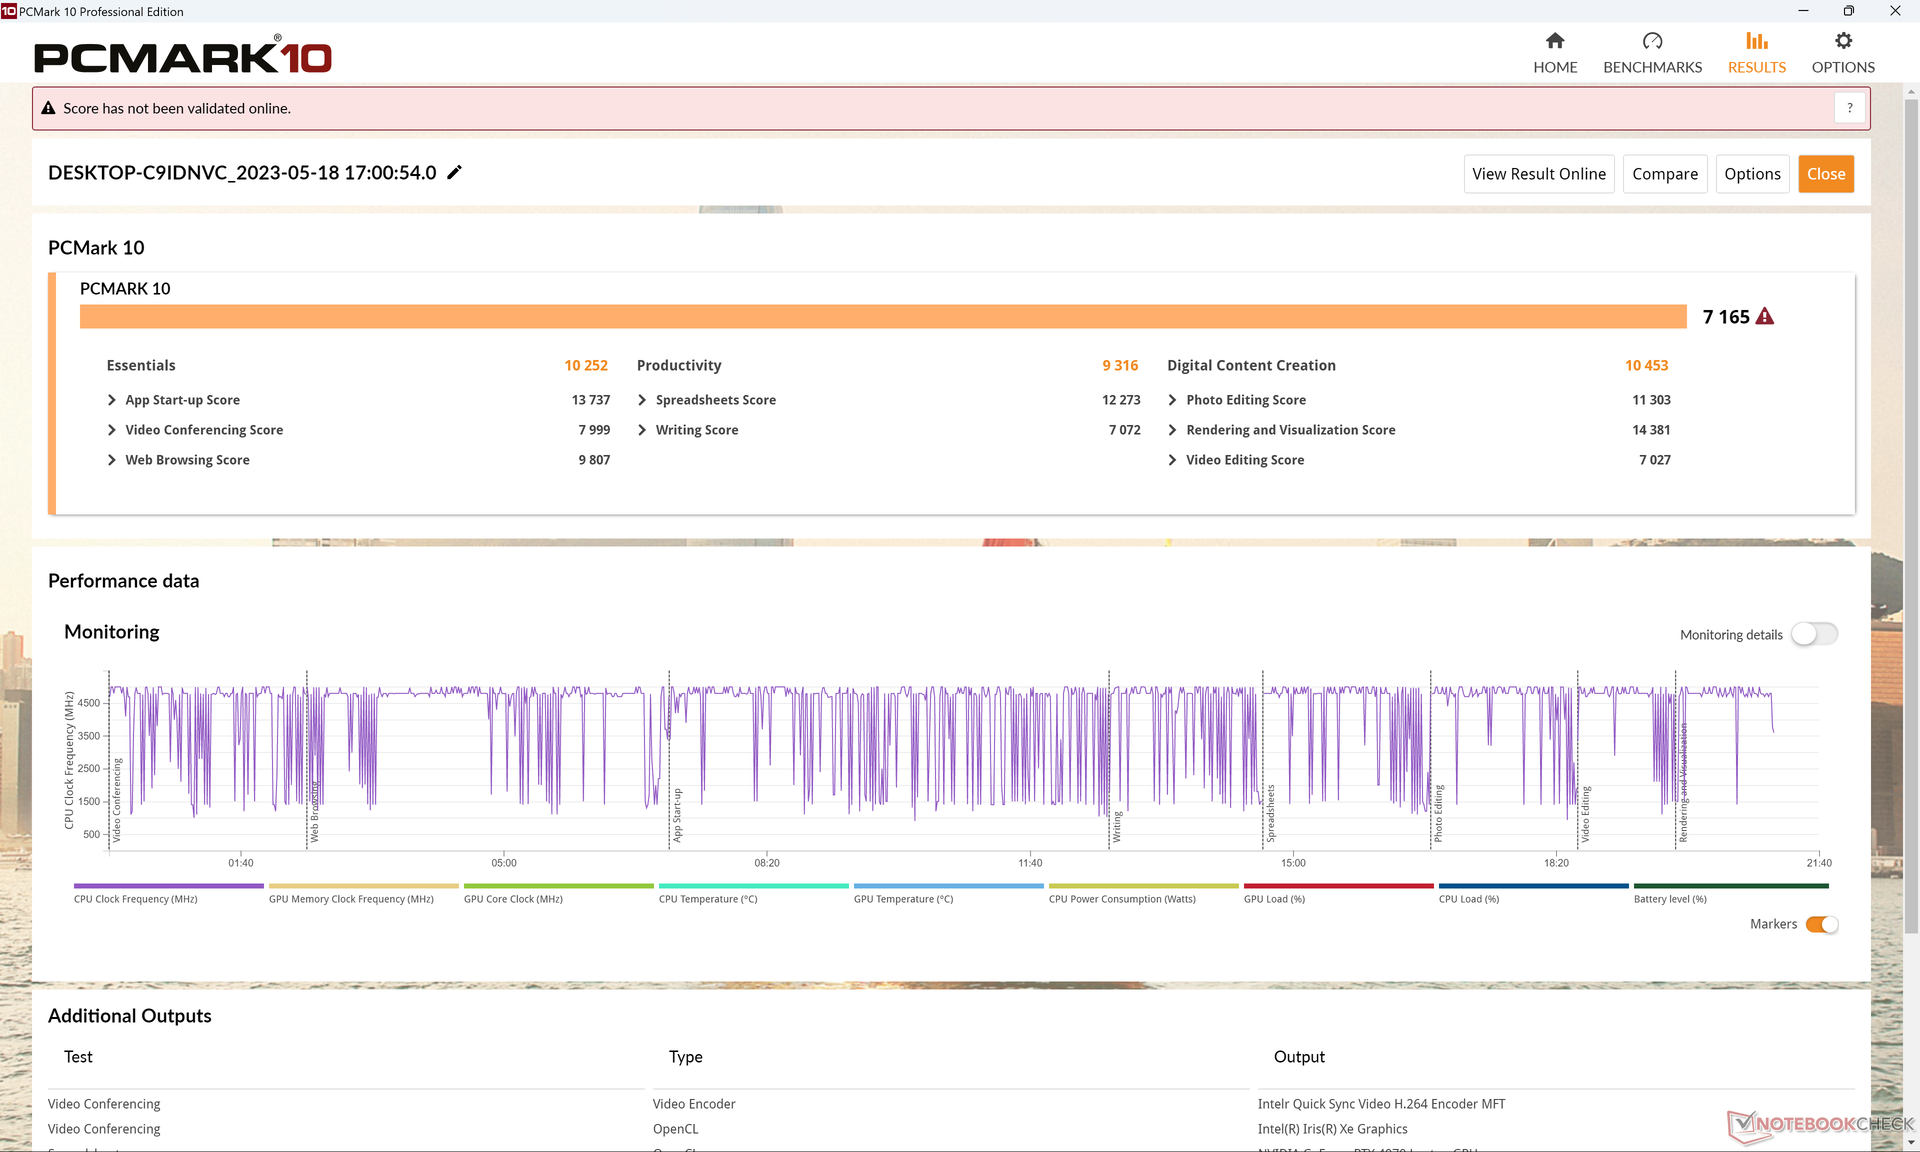
PCMark得分几乎与去年的XPS 17 9720相同,尽管同比性能有所提高。这表明,日常工作负荷和轻度办公活动在最新机型上没有明显的速度。如果你的工作负载主要包括网页浏览、电子表格和文字处理,那么配备RTX 4050的较小的XPS 17配置可能比我们的RTX 4070配置更合适。
CrossMark: Overall | Productivity | Creativity | Responsiveness
| PCMark 10 / Score | |
| Average Intel Core i7-13700H, NVIDIA GeForce RTX 4070 Laptop GPU (7158 - 7956, n=8) | |
| Dell XPS 17 9720 RTX 3060 | |
| Dell XPS 17 9730 RTX 4070 | |
| MSI Creator Z17 A12UGST-054 | |
| HP Envy 17-cr0079ng | |
| LG Gram 17 (2023) | |
| PCMark 10 / Essentials | |
| LG Gram 17 (2023) | |
| Dell XPS 17 9720 RTX 3060 | |
| Average Intel Core i7-13700H, NVIDIA GeForce RTX 4070 Laptop GPU (10252 - 11449, n=8) | |
| HP Envy 17-cr0079ng | |
| MSI Creator Z17 A12UGST-054 | |
| Dell XPS 17 9730 RTX 4070 | |
| PCMark 10 / Productivity | |
| Average Intel Core i7-13700H, NVIDIA GeForce RTX 4070 Laptop GPU (8501 - 10769, n=8) | |
| MSI Creator Z17 A12UGST-054 | |
| Dell XPS 17 9720 RTX 3060 | |
| Dell XPS 17 9730 RTX 4070 | |
| HP Envy 17-cr0079ng | |
| LG Gram 17 (2023) | |
| PCMark 10 / Digital Content Creation | |
| Average Intel Core i7-13700H, NVIDIA GeForce RTX 4070 Laptop GPU (10358 - 12908, n=8) | |
| Dell XPS 17 9730 RTX 4070 | |
| Dell XPS 17 9720 RTX 3060 | |
| MSI Creator Z17 A12UGST-054 | |
| HP Envy 17-cr0079ng | |
| LG Gram 17 (2023) | |
| CrossMark / Overall | |
| MSI Creator Z17 A12UGST-054 | |
| Apple MacBook Pro 16 2023 M2 Max | |
| Average Intel Core i7-13700H, NVIDIA GeForce RTX 4070 Laptop GPU (1768 - 2073, n=6) | |
| Dell XPS 17 9720 RTX 3060 | |
| Dell XPS 17 9730 RTX 4070 | |
| LG Gram 17 (2023) | |
| HP Envy 17-cr0079ng | |
| CrossMark / Productivity | |
| MSI Creator Z17 A12UGST-054 | |
| Average Intel Core i7-13700H, NVIDIA GeForce RTX 4070 Laptop GPU (1645 - 2006, n=6) | |
| Dell XPS 17 9720 RTX 3060 | |
| Dell XPS 17 9730 RTX 4070 | |
| Apple MacBook Pro 16 2023 M2 Max | |
| LG Gram 17 (2023) | |
| HP Envy 17-cr0079ng | |
| CrossMark / Creativity | |
| Apple MacBook Pro 16 2023 M2 Max | |
| MSI Creator Z17 A12UGST-054 | |
| Dell XPS 17 9720 RTX 3060 | |
| Average Intel Core i7-13700H, NVIDIA GeForce RTX 4070 Laptop GPU (1936 - 2137, n=6) | |
| Dell XPS 17 9730 RTX 4070 | |
| LG Gram 17 (2023) | |
| HP Envy 17-cr0079ng | |
| CrossMark / Responsiveness | |
| MSI Creator Z17 A12UGST-054 | |
| Average Intel Core i7-13700H, NVIDIA GeForce RTX 4070 Laptop GPU (1451 - 2202, n=6) | |
| Dell XPS 17 9720 RTX 3060 | |
| Dell XPS 17 9730 RTX 4070 | |
| LG Gram 17 (2023) | |
| Apple MacBook Pro 16 2023 M2 Max | |
| HP Envy 17-cr0079ng | |
| PCMark 10 Score | 7165 points | |
Help | ||
| AIDA64 / Memory Copy | |
| LG Gram 17 (2023) | |
| Dell XPS 17 9730 RTX 4070 | |
| Dell XPS 17 9720 RTX 3060 | |
| MSI Creator Z17 A12UGST-054 | |
| Average Intel Core i7-13700H (24334 - 78081, n=29) | |
| HP Envy 17-cr0079ng | |
| AIDA64 / Memory Read | |
| Dell XPS 17 9730 RTX 4070 | |
| Dell XPS 17 9720 RTX 3060 | |
| MSI Creator Z17 A12UGST-054 | |
| Average Intel Core i7-13700H (23681 - 79656, n=29) | |
| LG Gram 17 (2023) | |
| HP Envy 17-cr0079ng | |
| AIDA64 / Memory Write | |
| LG Gram 17 (2023) | |
| Dell XPS 17 9730 RTX 4070 | |
| Average Intel Core i7-13700H (22986 - 99898, n=29) | |
| MSI Creator Z17 A12UGST-054 | |
| Dell XPS 17 9720 RTX 3060 | |
| HP Envy 17-cr0079ng | |
| AIDA64 / Memory Latency | |
| LG Gram 17 (2023) | |
| MSI Creator Z17 A12UGST-054 | |
| Dell XPS 17 9730 RTX 4070 | |
| Average Intel Core i7-13700H (82.4 - 136.8, n=29) | |
| Dell XPS 17 9720 RTX 3060 | |
| HP Envy 17-cr0079ng | |
* ... smaller is better
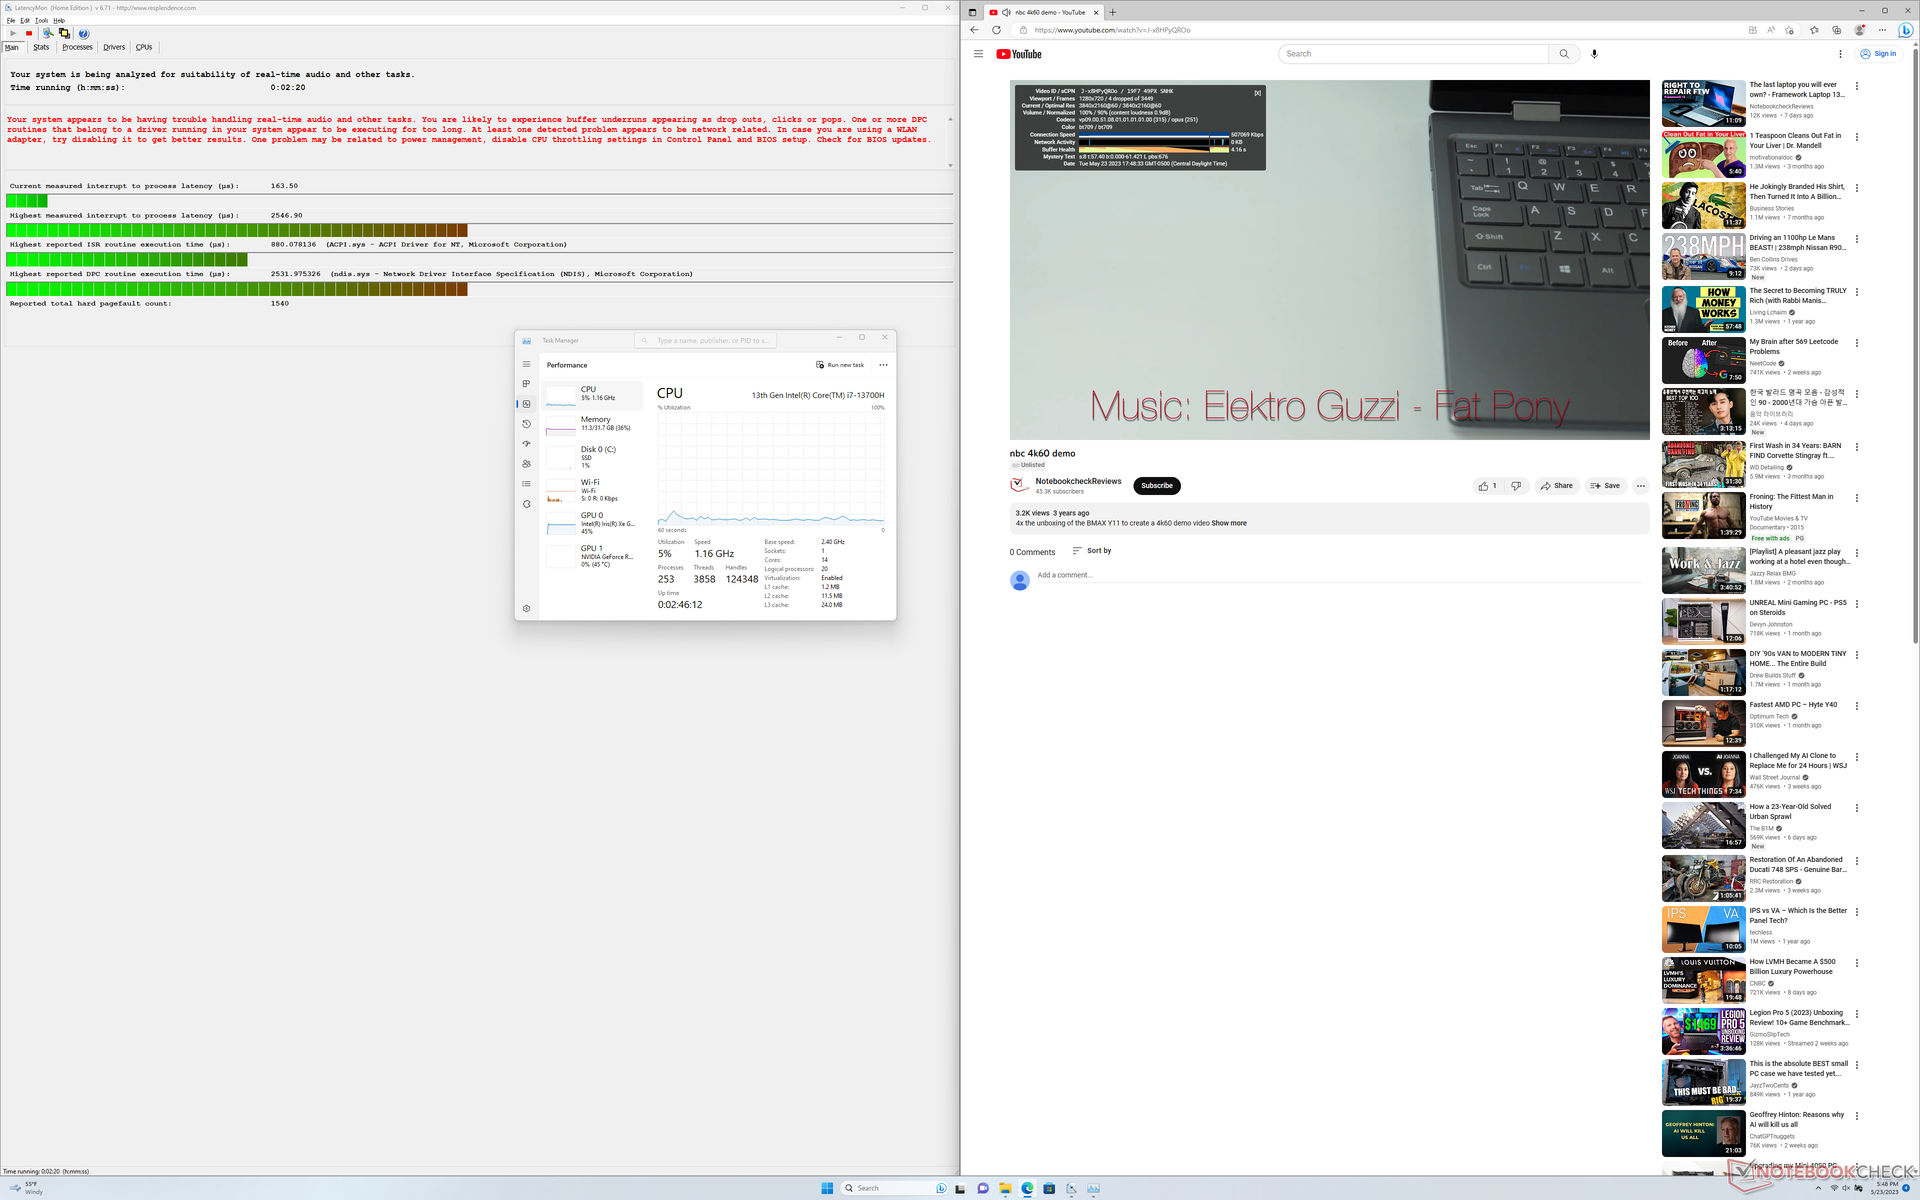
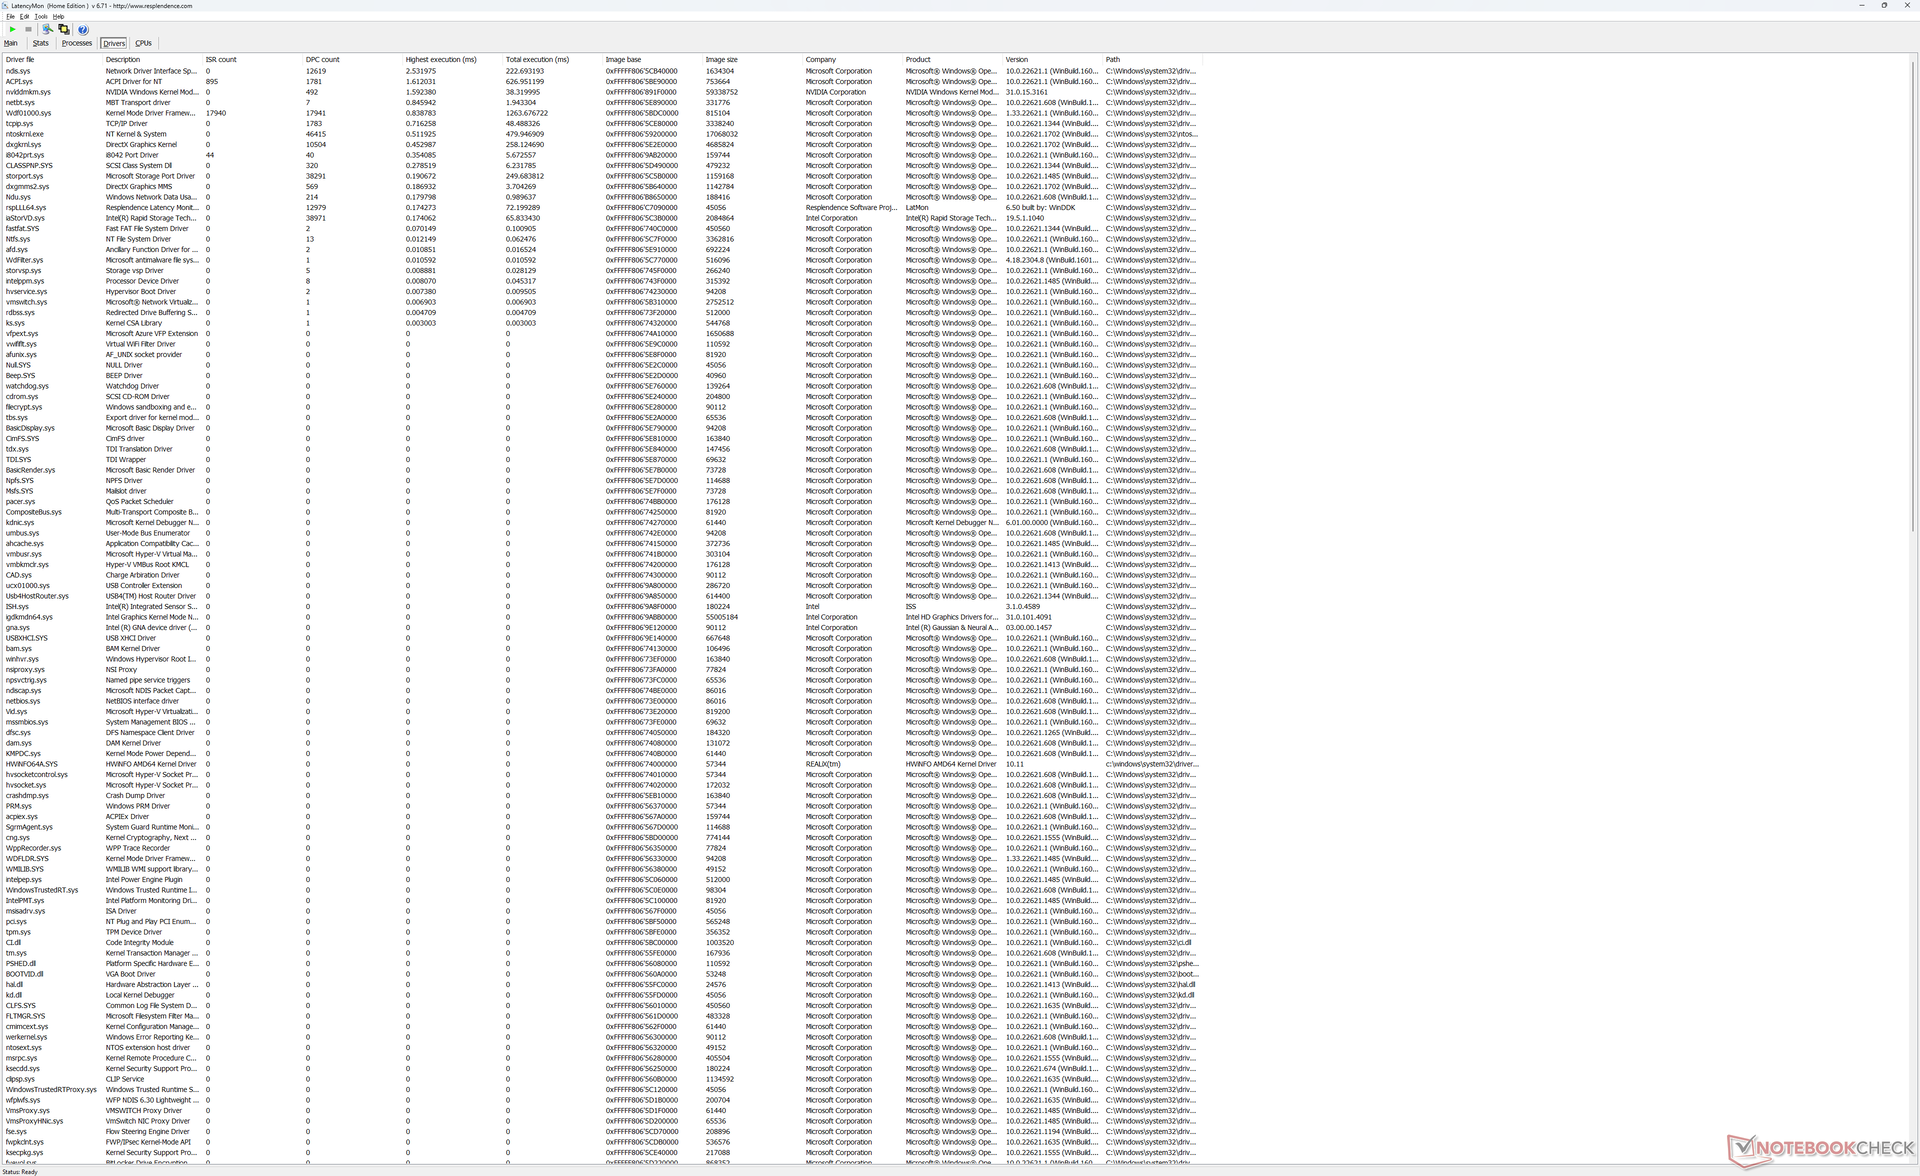
DPC延时
LatencyMon显示,在打开我们主页的多个浏览器标签时,即使经过多次重试,也会出现DPC问题。考虑到我们在最近的XPS 15 9530上没有遇到任何问题,结果是令人失望的。 XPS 15 9530或去年的XPS 17 9720上没有遇到任何问题。
4K视频在60FPS下的播放是完美的,除了开始时总是会掉4帧。有趣的是,这个问题也会出现在XPS 15 9530上。
| DPC Latencies / LatencyMon - interrupt to process latency (max), Web, Youtube, Prime95 | |
| HP Envy 17-cr0079ng | |
| Dell XPS 17 9730 RTX 4070 | |
| LG Gram 17 (2023) | |
| MSI Creator Z17 A12UGST-054 | |
| Dell XPS 15 9530 RTX 4070 | |
| Dell XPS 17 9720 RTX 3060 | |
* ... smaller is better
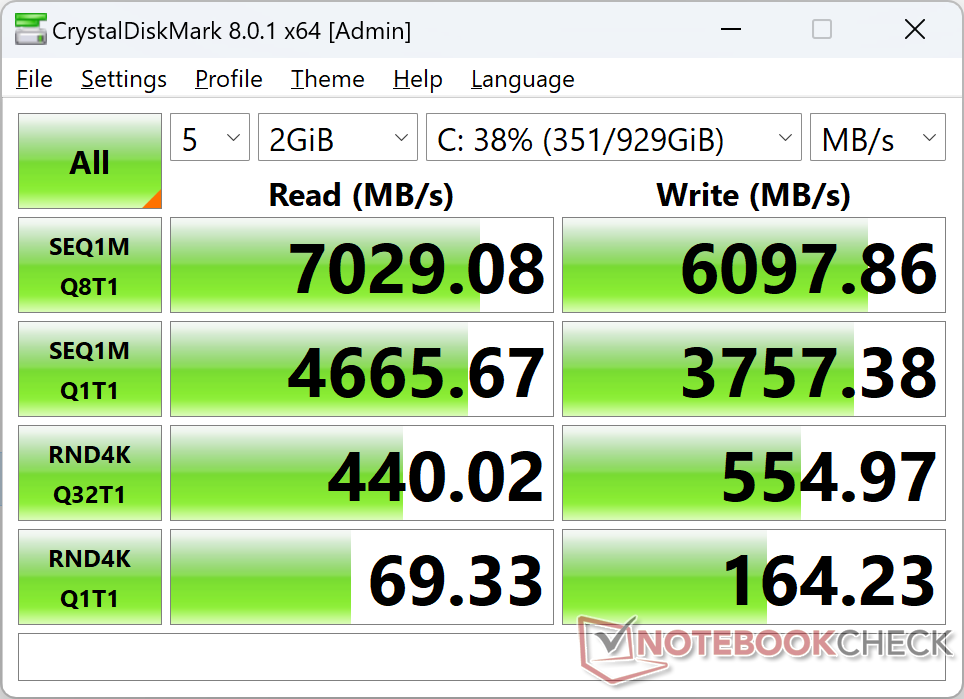
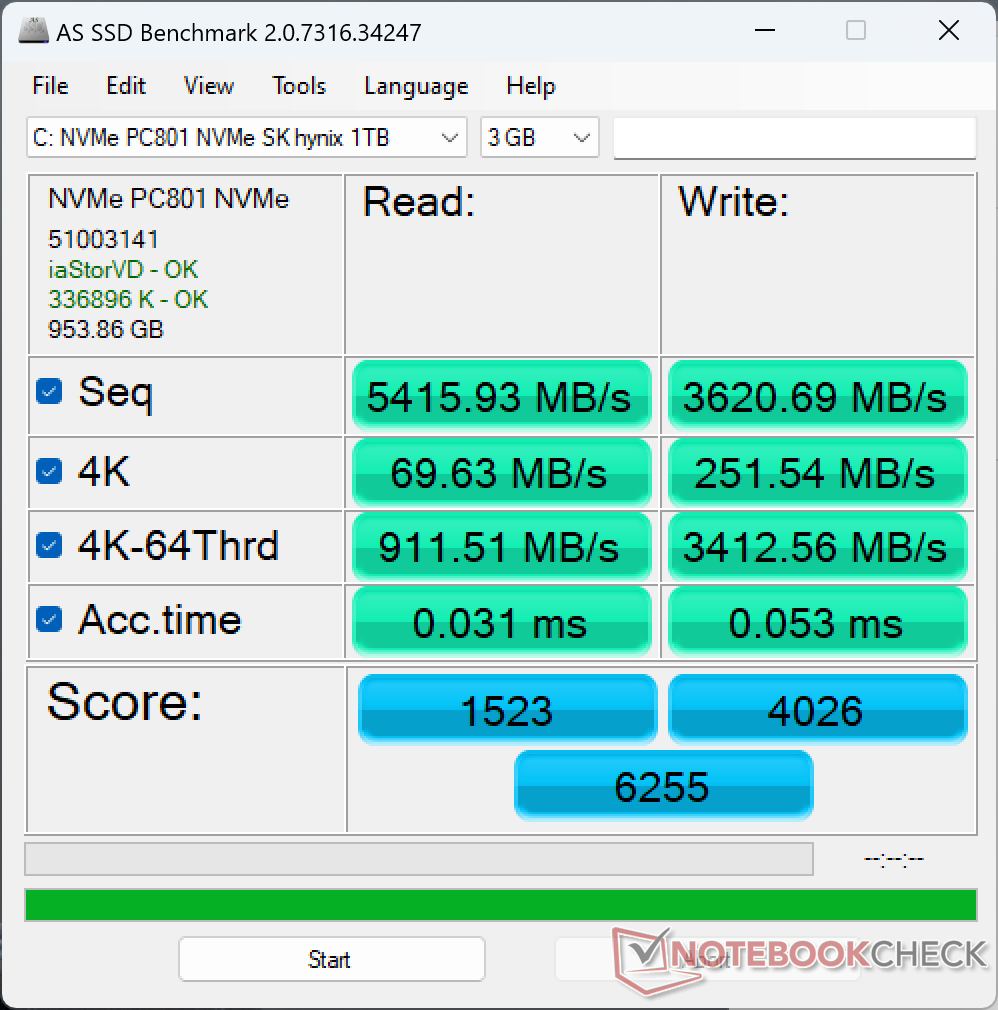
存储设备
XPS设备可能配备三星、美光、西部数据或SK海力士的固态硬盘。在我们的特定案例中,我们的测试设备配备了 SK Hynix PC801PCIe4 x4 NVMe SSD。性能非常好,可与三星PM9A1相媲美,在压力下传输率没有下降。
如果需要,可以安装第二个M.2固态硬盘。两个M.2插槽中的每一个都有一个散热器,以帮助冷却驱动器。

| Drive Performance rating - Percent | |
| LG Gram 17 (2023) | |
| MSI Creator Z17 A12UGST-054 | |
| Dell XPS 17 9730 RTX 4070 | |
| Dell XPS 17 9720 RTX 3060 | |
| HP Envy 17-cr0079ng | |
* ... smaller is better
Disk Throttling: DiskSpd Read Loop, Queue Depth 8
GPU性能--比XPS 15 9530快得多
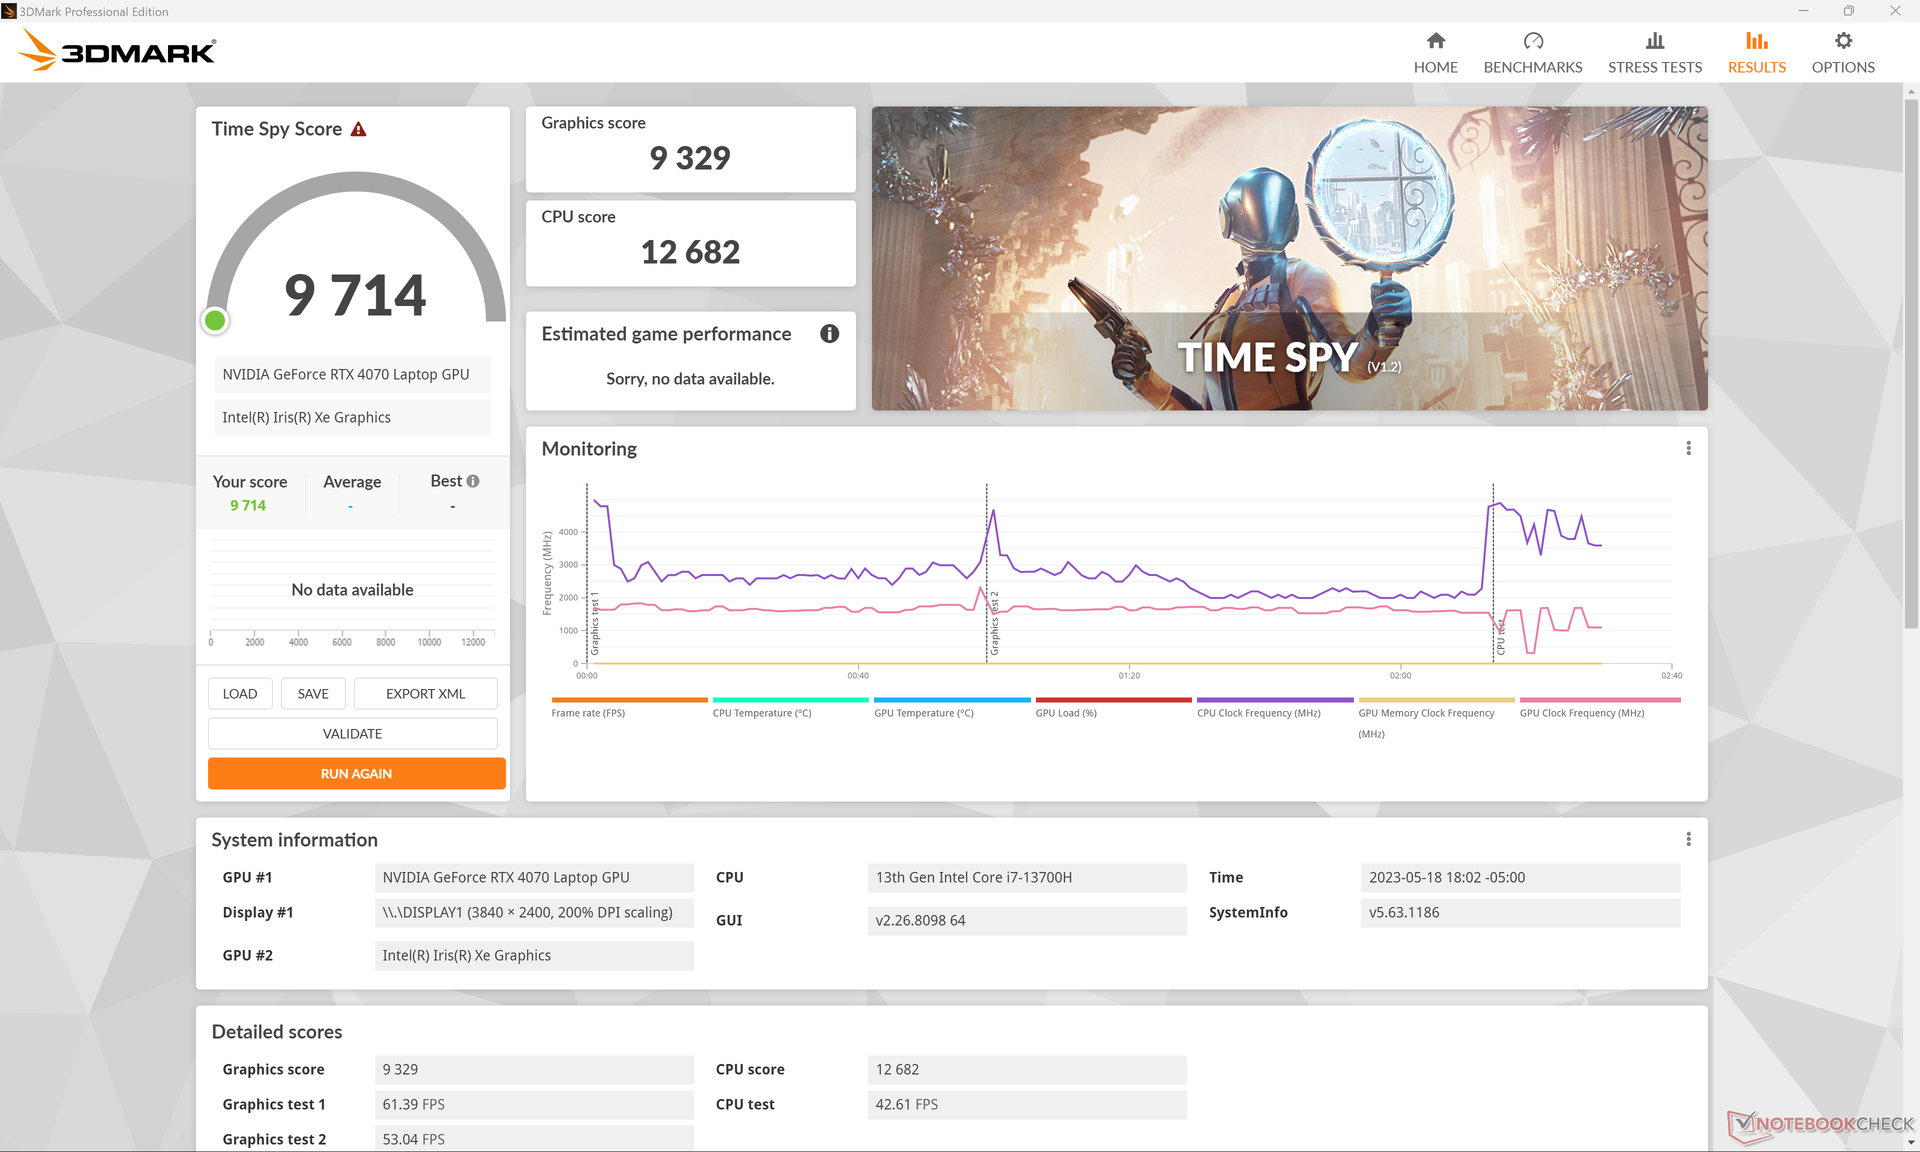
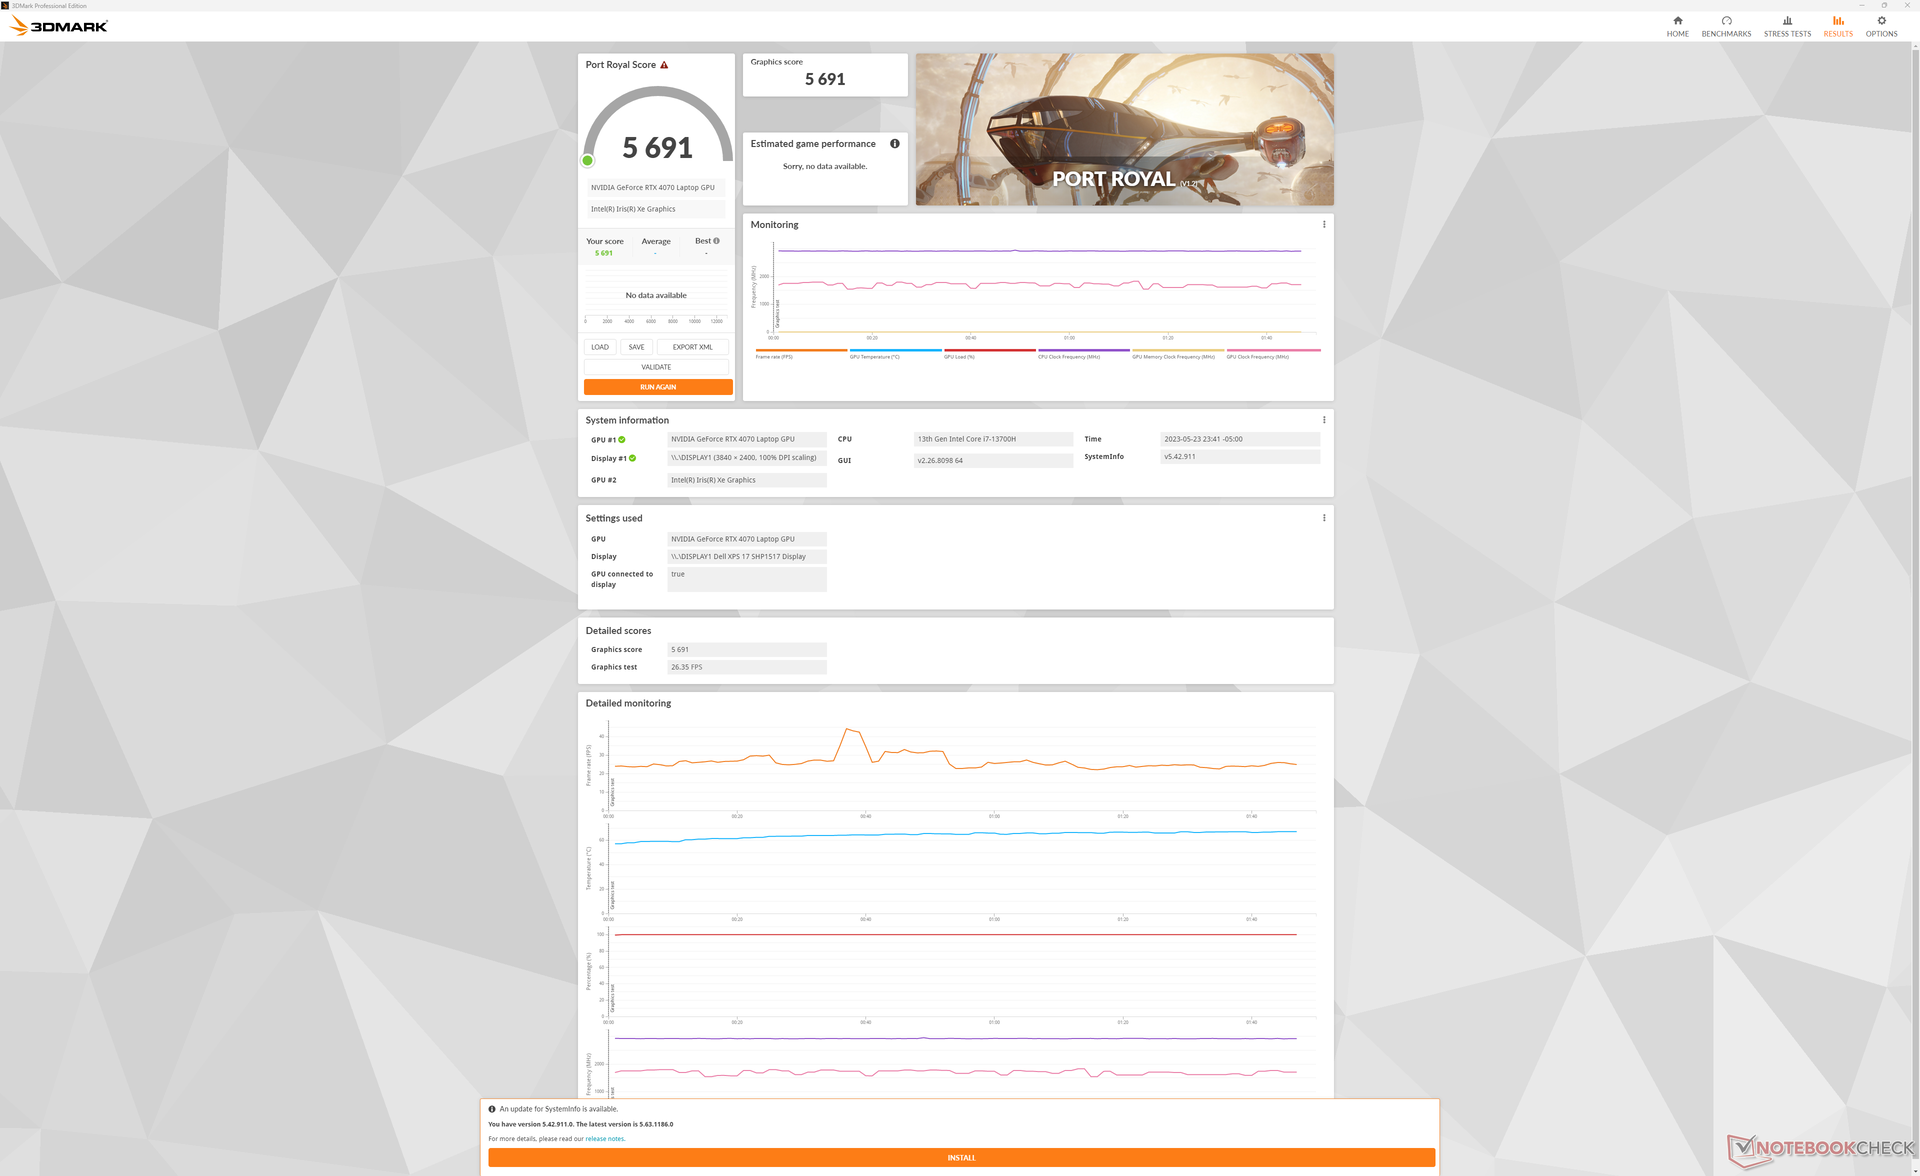
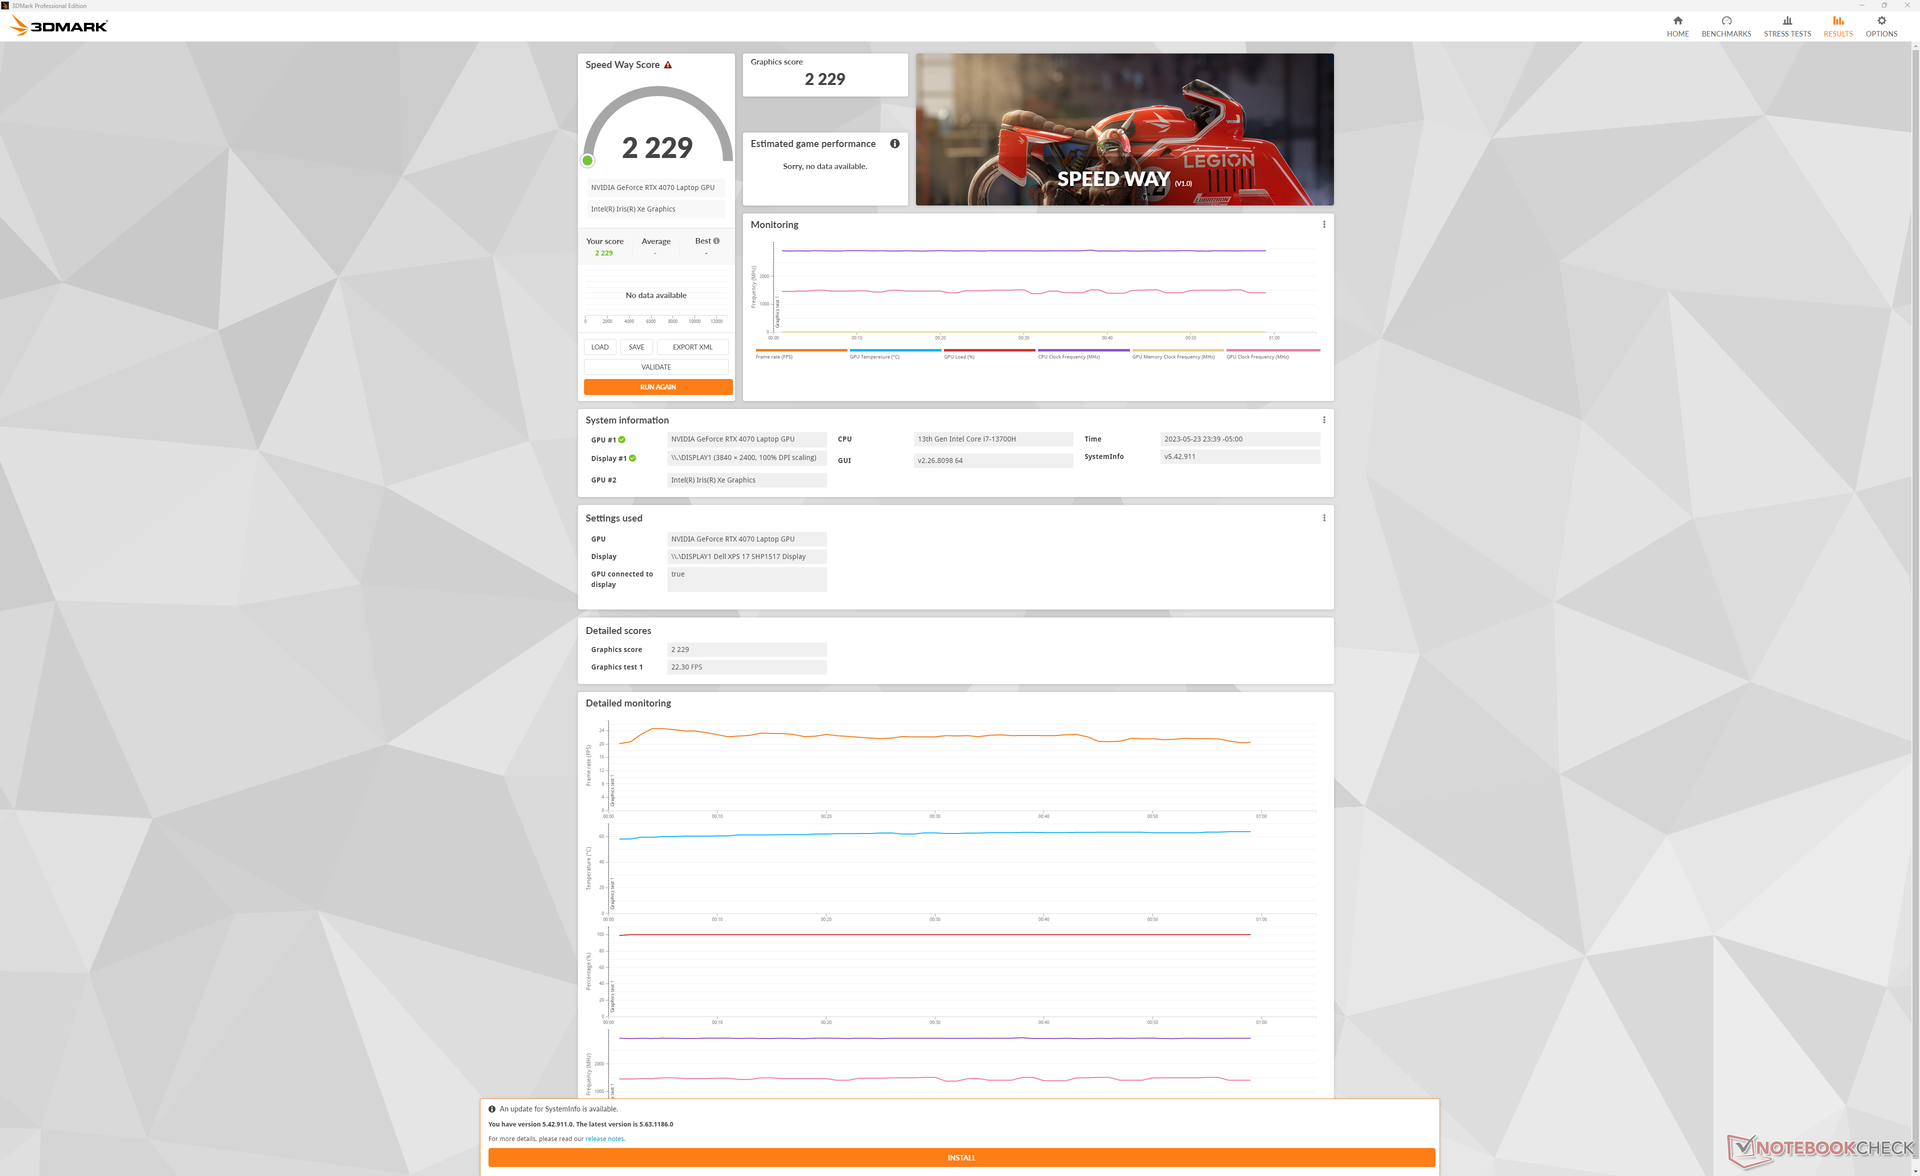
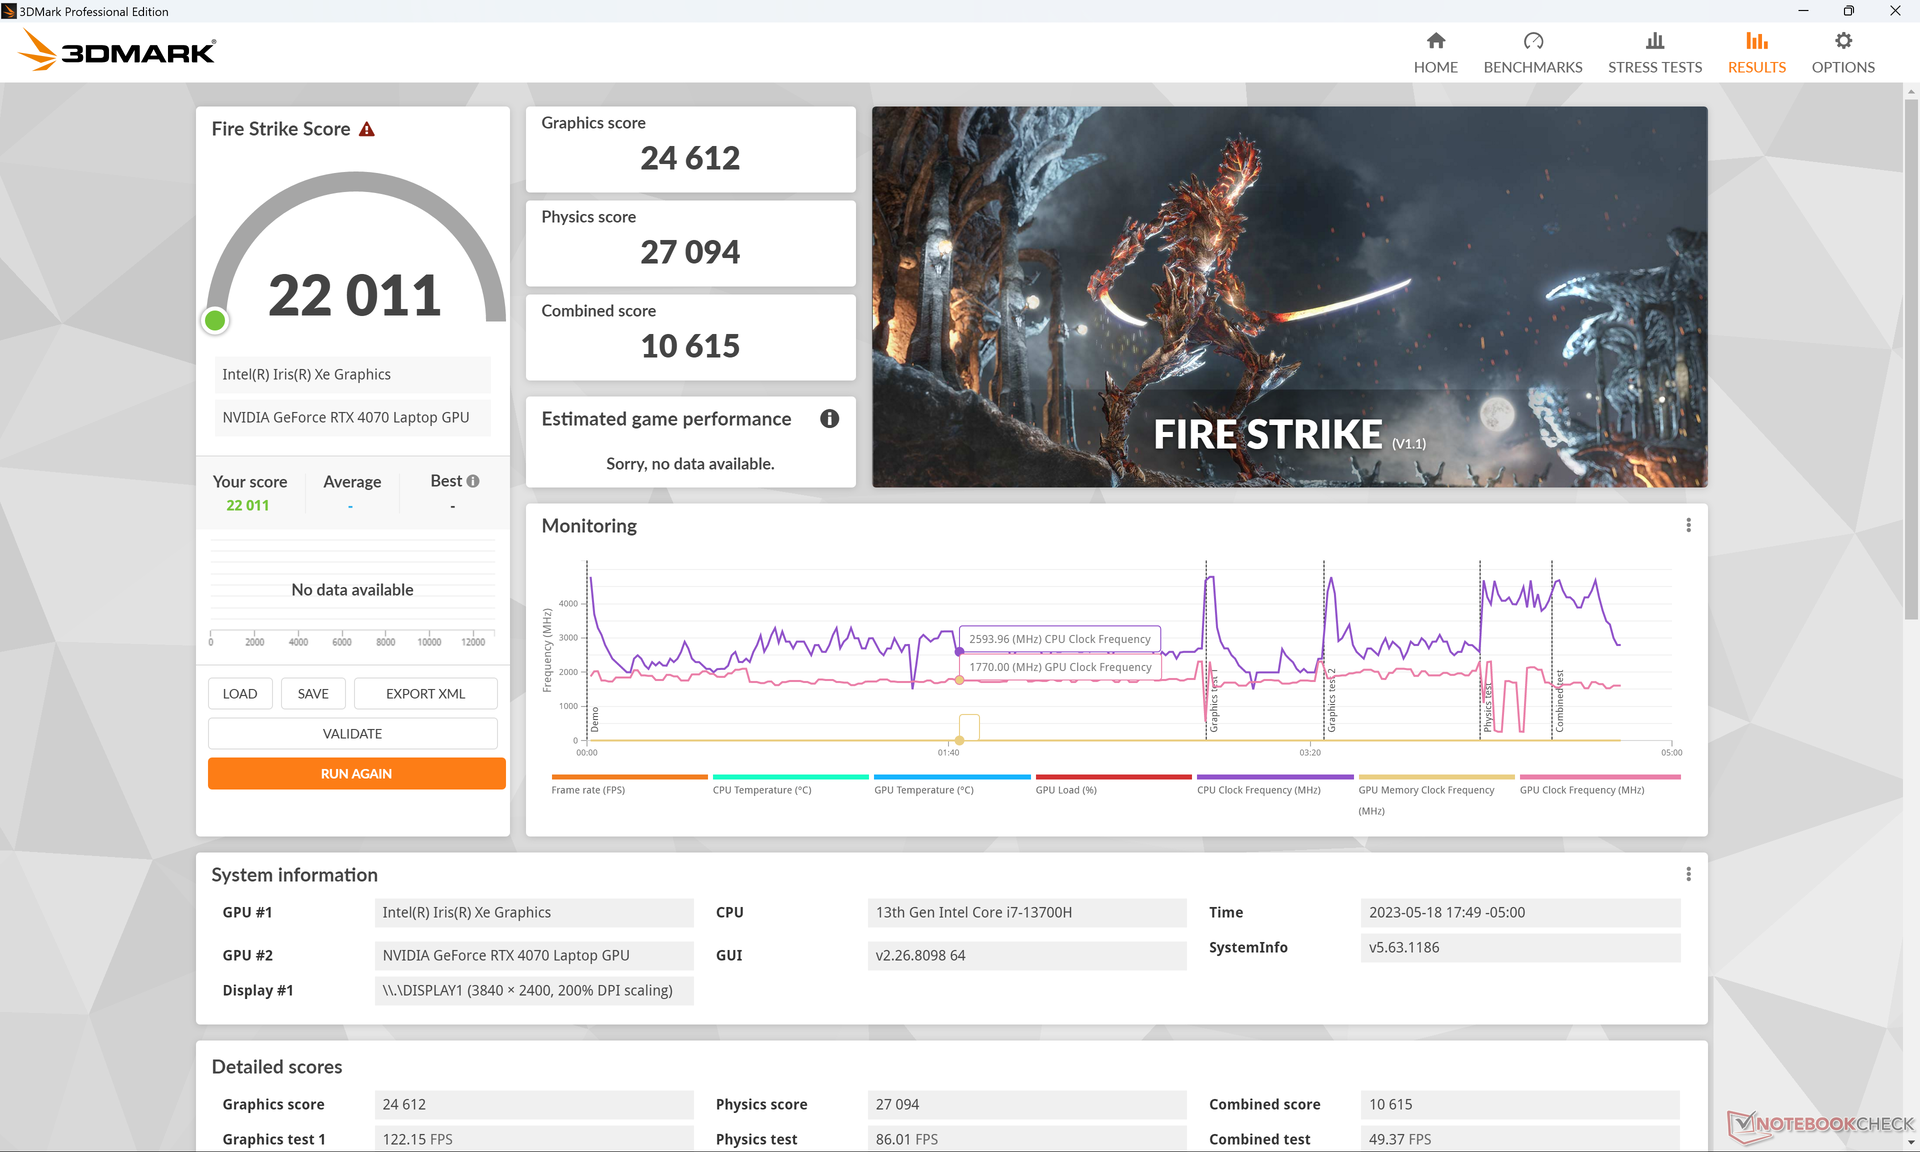
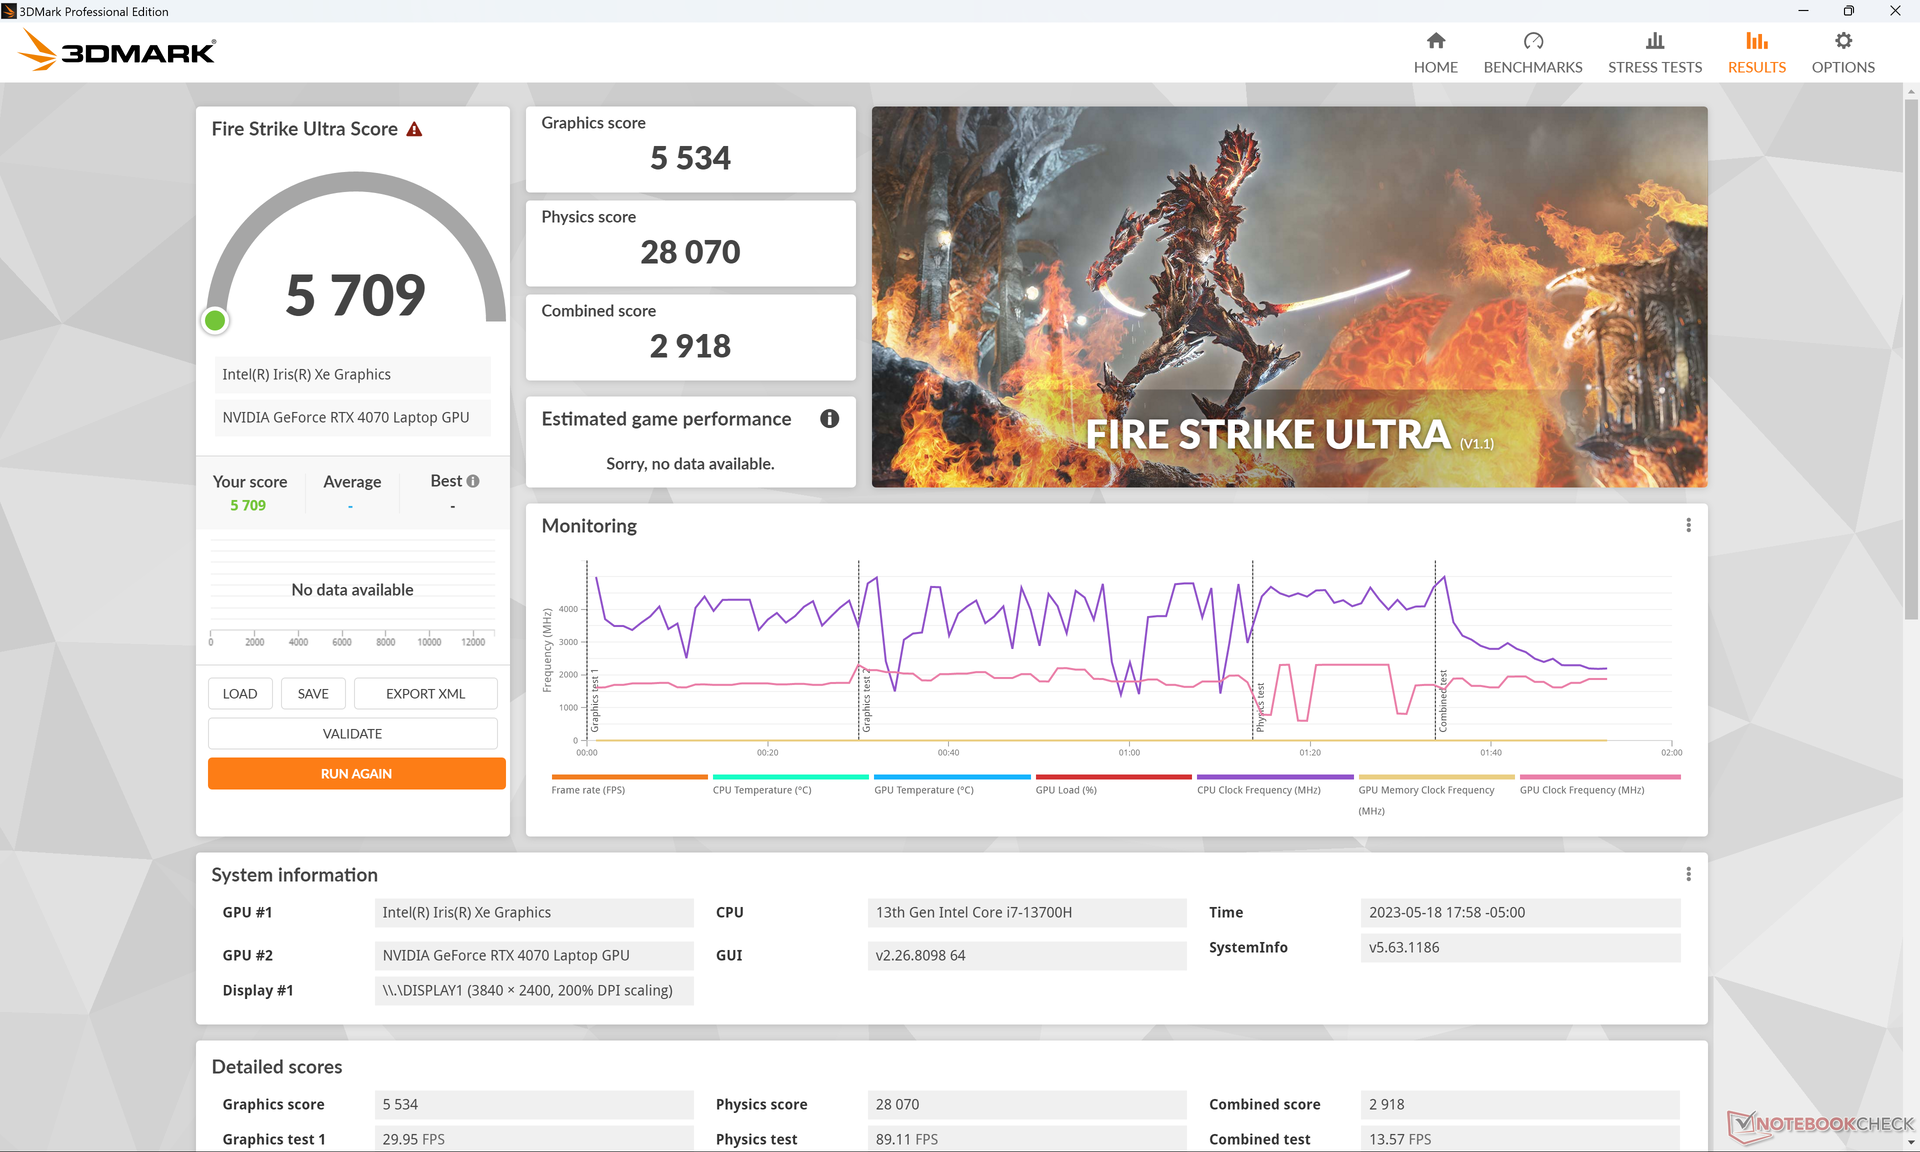
的 移动GeForce RTX 4070这一看似微小的变化却带来了天壤之别,与XPS 15相比,XPS 17 9730的DirectX和光线追踪基准测试的3DMark得分快了50%至60%。性能提升是如此之大,以至于XPS 17中的RTX 4070只比配备相同GPU的普通游戏笔记本电脑落后10%至15%。这就是我们希望从XPS 15 9530中看到的性能范围。
与XPS 15的相同GPU相比,Blender的GPU加速也得到了提升。它的性能增加了20%,使XPS 17与其他大多数RTX 4070笔记本电脑保持一致。
戴尔为XPS 17提供了更高的RTX 4080选项,但我们完全预计,由于有限的130W USB-C电源,与大多数其他RTX 4080笔记本电脑相比,它的表现会很差。微星MSI Stealth 17 Studio例如,提供RTX 4080,尽管有一个能力更强的240瓦交流适配器。
在XPS 17 9730之前,XPS 17系列的最高GPU选项是 RTX 3060.与该配置相比,我们的RTX 4070可以分别提供20%和30%的内容创作和图形性能速度。
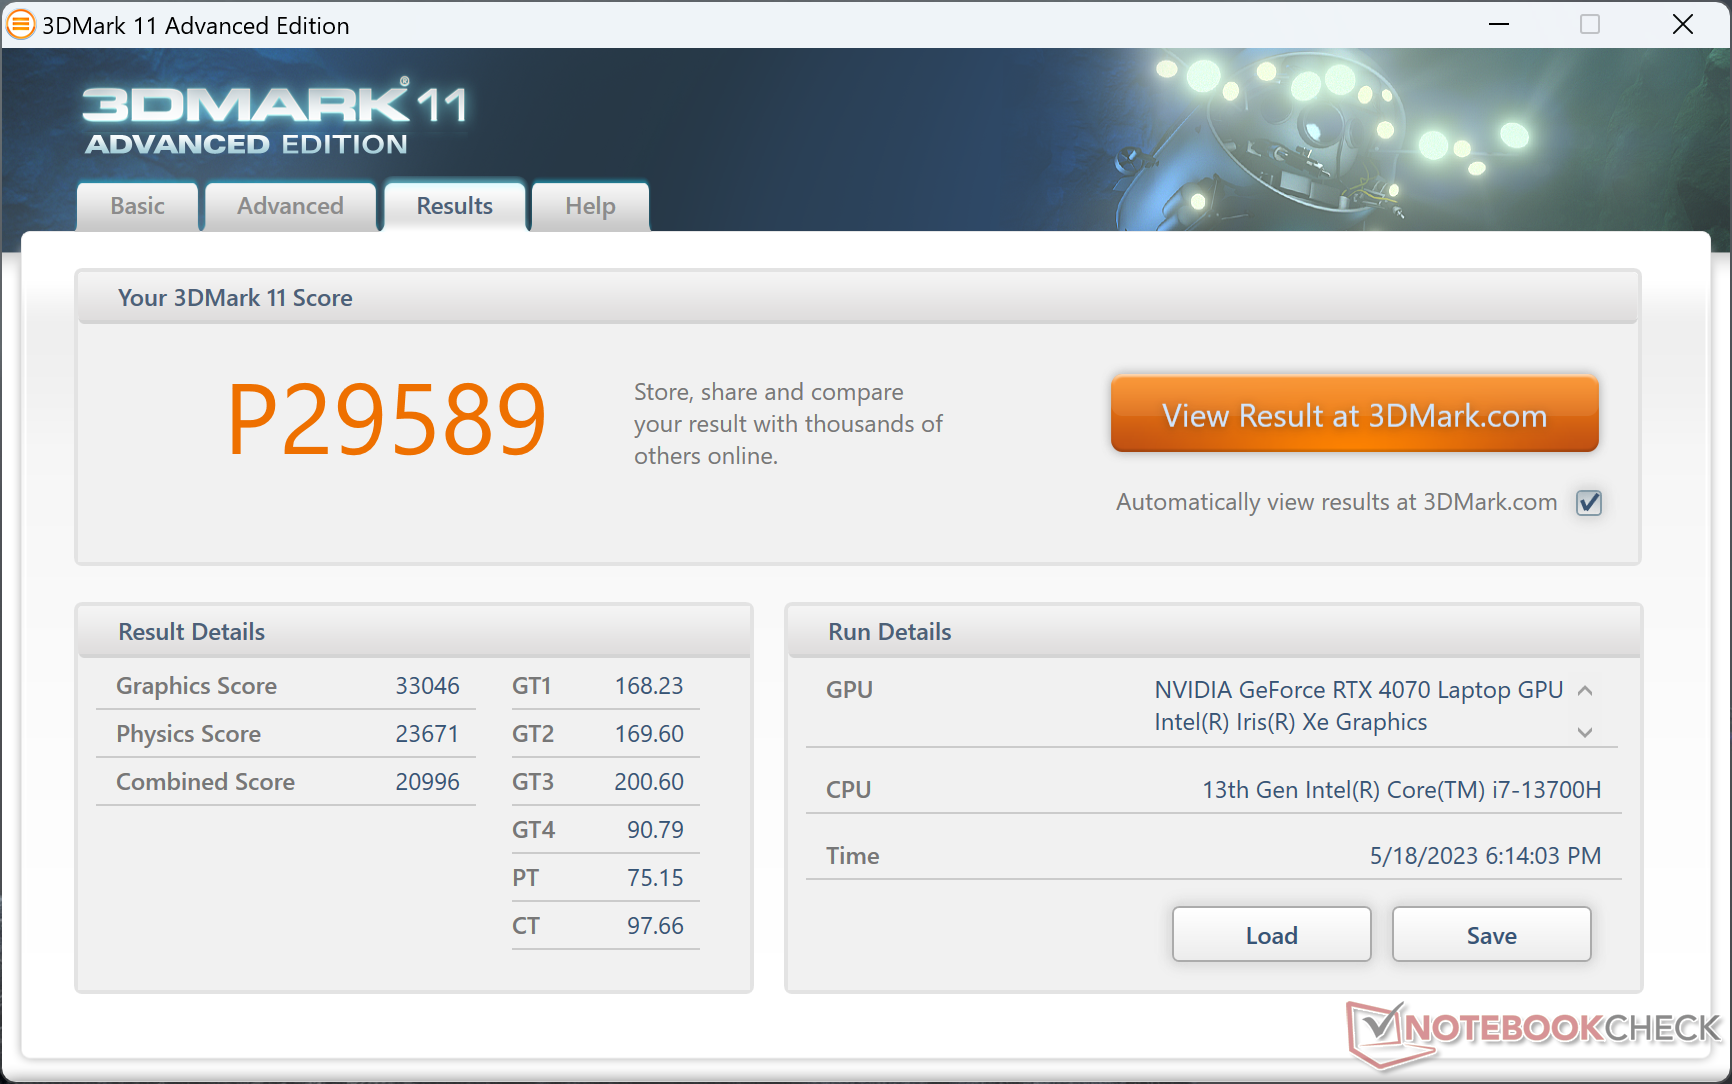
| 3DMark 11 Performance | 29589 points | |
| 3DMark Fire Strike Score | 22011 points | |
| 3DMark Time Spy Score | 9714 points | |
Help | ||
* ... smaller is better
游戏性能
该系统作为辅助游戏机运行良好。由于70W RTX 4070并不像XPS 15中的40W版本那样动力不足,XPS 17能够以QHD分辨率和60FPS的中高设置运行最新游戏。4K UHD在大多数情况下仍然遥不可及,但GPU可以很好地与外部FHD或QHD显示器搭配,用于游戏。
也许阻碍XPS 17成为 "合适的 "游戏笔记本电脑的两个显著因素是其相对较慢的显示响应时间和缺乏对内部显示器的G-Sync支持。因此,在XPS 17上进行游戏时,掉帧、屏幕撕裂和重影现象比较普遍。当然,通过简单地在外部显示器上进行游戏,可以避免很多这种情况。
| Returnal | |
| 1280x720 Low Preset | |
| Aorus 17X AZF | |
| Average NVIDIA GeForce RTX 4070 Laptop GPU (126 - 150, n=5) | |
| 1920x1080 Low Preset | |
| Aorus 17X AZF | |
| Average NVIDIA GeForce RTX 4070 Laptop GPU (65 - 119, n=11) | |
| Dell XPS 17 9730 RTX 4070 | |
| 1920x1080 Medium Preset | |
| Aorus 17X AZF | |
| Average NVIDIA GeForce RTX 4070 Laptop GPU (69 - 117, n=12) | |
| Dell XPS 17 9730 RTX 4070 | |
| 1920x1080 High Preset | |
| Aorus 17X AZF | |
| Average NVIDIA GeForce RTX 4070 Laptop GPU (64 - 106, n=12) | |
| Dell XPS 17 9730 RTX 4070 | |
| 1920x1080 Epic Preset | |
| Aorus 17X AZF | |
| Average NVIDIA GeForce RTX 4070 Laptop GPU (54 - 90, n=12) | |
| Dell XPS 17 9730 RTX 4070 | |
| 2560x1440 Epic Preset | |
| Aorus 17X AZF | |
| Average NVIDIA GeForce RTX 4070 Laptop GPU (39 - 66, n=12) | |
| Dell XPS 17 9730 RTX 4070 | |
| 3840x2160 Epic Preset | |
| Aorus 17X AZF | |
| Average NVIDIA GeForce RTX 4070 Laptop GPU (21 - 39, n=8) | |
| Dell XPS 17 9730 RTX 4070 | |
| Tiny Tina's Wonderlands | |
| 1920x1080 Low Preset (DX12) | |
| Aorus 17X AZF | |
| Average NVIDIA GeForce RTX 4070 Laptop GPU (98.1 - 283, n=15) | |
| Dell XPS 17 9730 RTX 4070 | |
| 1920x1080 Medium Preset (DX12) | |
| Aorus 17X AZF | |
| Average NVIDIA GeForce RTX 4070 Laptop GPU (92.5 - 231, n=15) | |
| Dell XPS 17 9730 RTX 4070 | |
| 1920x1080 High Preset (DX12) | |
| Aorus 17X AZF | |
| Average NVIDIA GeForce RTX 4070 Laptop GPU (74.3 - 151.4, n=15) | |
| Dell XPS 17 9730 RTX 4070 | |
| 1920x1080 Badass Preset (DX12) | |
| Aorus 17X AZF | |
| Average NVIDIA GeForce RTX 4070 Laptop GPU (58.6 - 115.9, n=18) | |
| Dell XPS 17 9730 RTX 4070 | |
| 2560x1440 Badass Preset (DX12) | |
| Aorus 17X AZF | |
| Average NVIDIA GeForce RTX 4070 Laptop GPU (49.8 - 79.5, n=17) | |
| Dell XPS 17 9730 RTX 4070 | |
| 3840x2160 Badass Preset (DX12) | |
| Aorus 17X AZF | |
| Average NVIDIA GeForce RTX 4070 Laptop GPU (28.3 - 39.7, n=13) | |
| Dell XPS 17 9730 RTX 4070 | |
Witcher 3 FPS Chart
| low | med. | high | ultra | QHD | 4K | |
|---|---|---|---|---|---|---|
| GTA V (2015) | 186.6 | 182.5 | 167.9 | 102.7 | 75.5 | 76.9 |
| The Witcher 3 (2015) | 415.2 | 297.6 | 181.4 | 96.2 | 59 | |
| Dota 2 Reborn (2015) | 193.5 | 174.5 | 165.9 | 156.9 | 108 | |
| Final Fantasy XV Benchmark (2018) | 174.8 | 128.3 | 94.7 | 69.9 | 38.2 | |
| X-Plane 11.11 (2018) | 154.6 | 133.1 | 106.4 | 90 | ||
| Strange Brigade (2018) | 431 | 238 | 192 | 165.4 | 113.6 | 61.7 |
| Cyberpunk 2077 1.6 (2022) | 102.1 | 99.4 | 85.6 | 71 | 43 | 18.7 |
| Tiny Tina's Wonderlands (2022) | 183.5 | 153.3 | 104.9 | 82.4 | 55.7 | 28.3 |
| F1 22 (2022) | 206 | 196.4 | 158.2 | 60.7 | 39.4 | 18.8 |
| Returnal (2023) | 72 | 71 | 67 | 59 | 41 | 21 |
排放
系统噪音 - 只有在需要时才会响亮
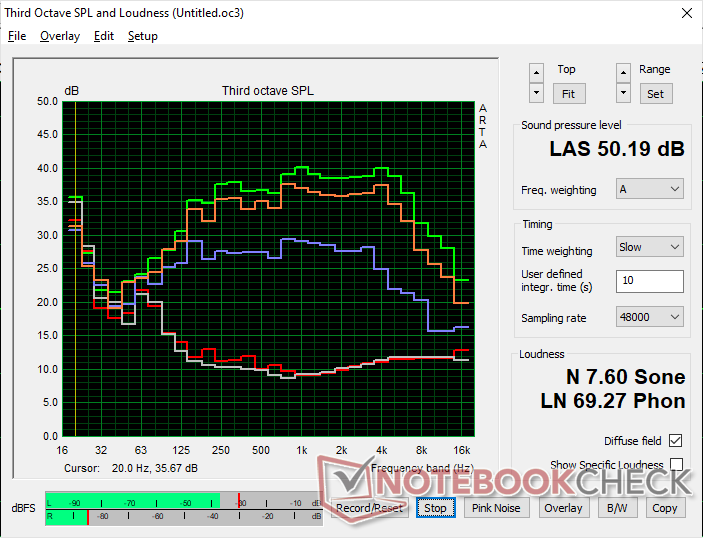
尽管性能有所提高,但风扇噪音并没有急剧变化。在浏览网页或流媒体视频时,XPS 17通常徘徊在几乎听不到的25.6 dB(A)左右,而沉默的背景为22.7 dB(A)。然而,如果运行非常苛刻的负载,如游戏,风扇噪音将开始接近一些游戏笔记本的水平,高达50分贝(A)。毕竟,XPS机型提供了游戏级的规格。
Noise level
| Idle |
| 22.8 / 22.8 / 22.8 dB(A) |
| Load |
| 38.9 / 50.2 dB(A) |
 | ||
30 dB silent 40 dB(A) audible 50 dB(A) loud |
||
min: | ||
| Dell XPS 17 9730 RTX 4070 GeForce RTX 4070 Laptop GPU, i7-13700H, SK hynix PC801 HFS001TEJ9X101N | Dell XPS 17 9720 RTX 3060 GeForce RTX 3060 Laptop GPU, i7-12700H, Samsung PM9A1 MZVL21T0HCLR | LG Gram 17 (2023) Iris Xe G7 96EUs, i7-1360P, Samsung PM9A1 MZVL21T0HCLR | HP Envy 17-cr0079ng GeForce RTX 2050 Mobile, i7-1255U, Samsung PM991a MZVLQ1T0HBLB | MSI Creator Z17 A12UGST-054 GeForce RTX 3070 Ti Laptop GPU, i9-12900H, Micron 3400 1TB MTFDKBA1T0TFH | Apple MacBook Pro 16 2023 M2 Max M2 Max 38-Core GPU, M2 Max, Apple SSD AP2048Z | |
|---|---|---|---|---|---|---|
| Noise | -4% | -11% | -16% | -28% | 4% | |
| off / environment * (dB) | 22.7 | 23.8 -5% | 25.2 -11% | 26.5 -17% | 26 -15% | 23.9 -5% |
| Idle Minimum * (dB) | 22.8 | 24.1 -6% | 25.2 -11% | 28.5 -25% | 31.8 -39% | 23.9 -5% |
| Idle Average * (dB) | 22.8 | 24.1 -6% | 25.7 -13% | 28.5 -25% | 31.8 -39% | 23.9 -5% |
| Idle Maximum * (dB) | 22.8 | 24.1 -6% | 29.3 -29% | 29.7 -30% | 31.8 -39% | 23.9 -5% |
| Load Average * (dB) | 38.9 | 43.2 -11% | 44.4 -14% | 39.5 -2% | 53.9 -39% | 36.6 6% |
| Witcher 3 ultra * (dB) | 47.4 | 48 -1% | 53.9 -14% | 35.1 26% | ||
| Load Maximum * (dB) | 50.2 | 48 4% | 45.2 10% | 48 4% | 54.9 -9% | 43.2 14% |
* ... smaller is better
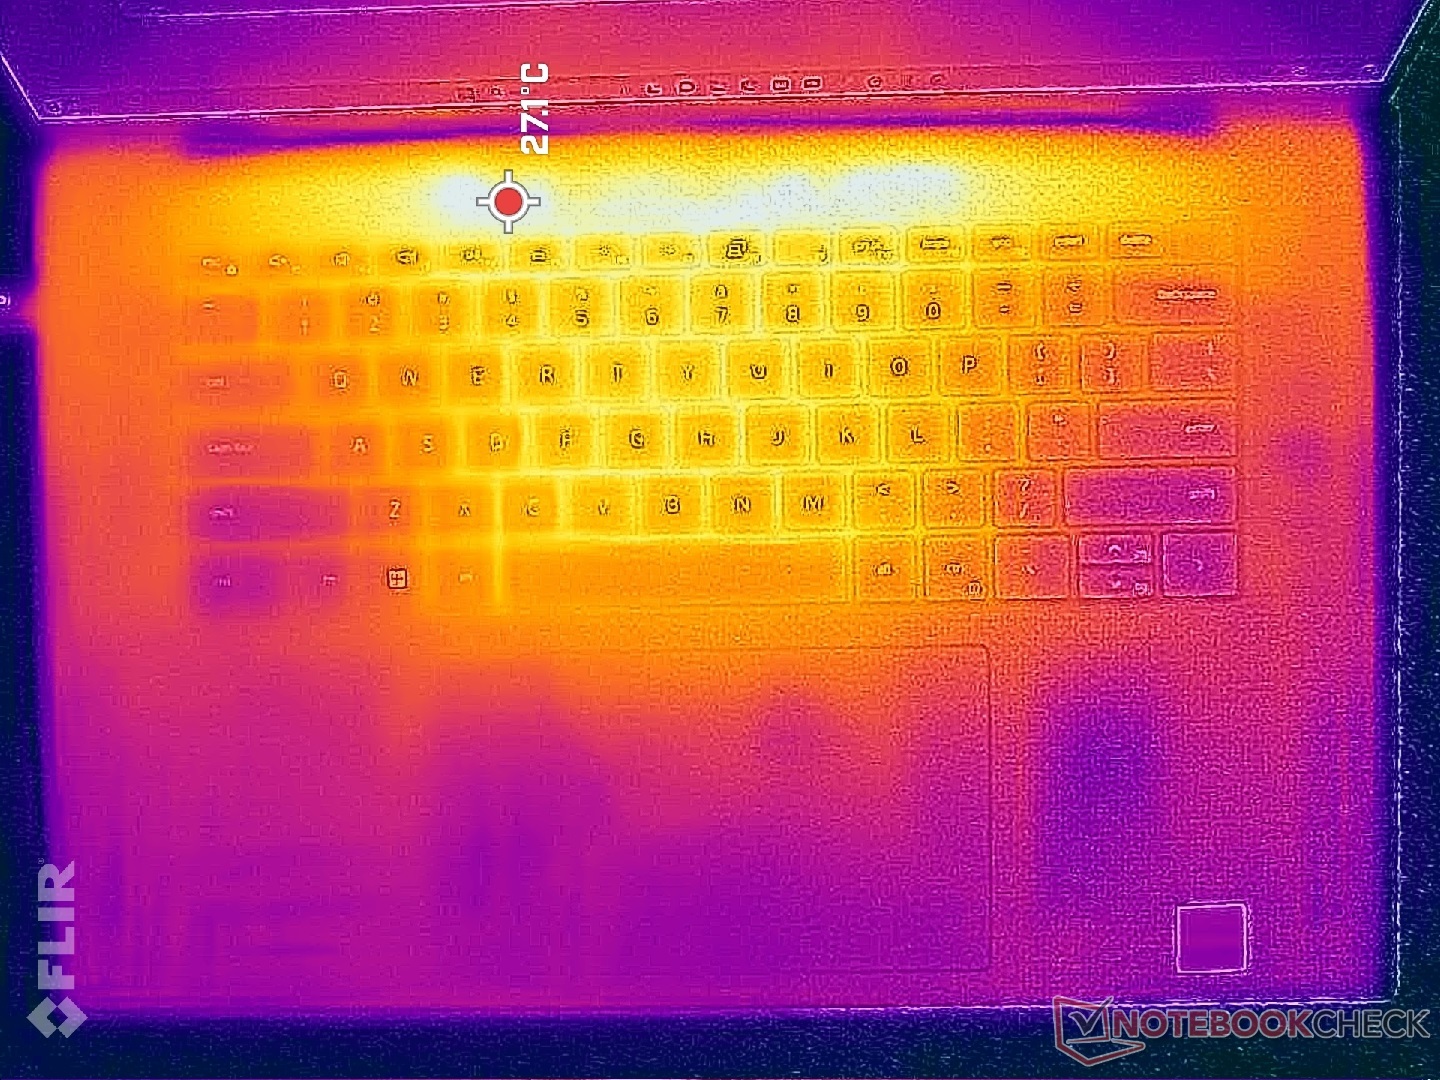
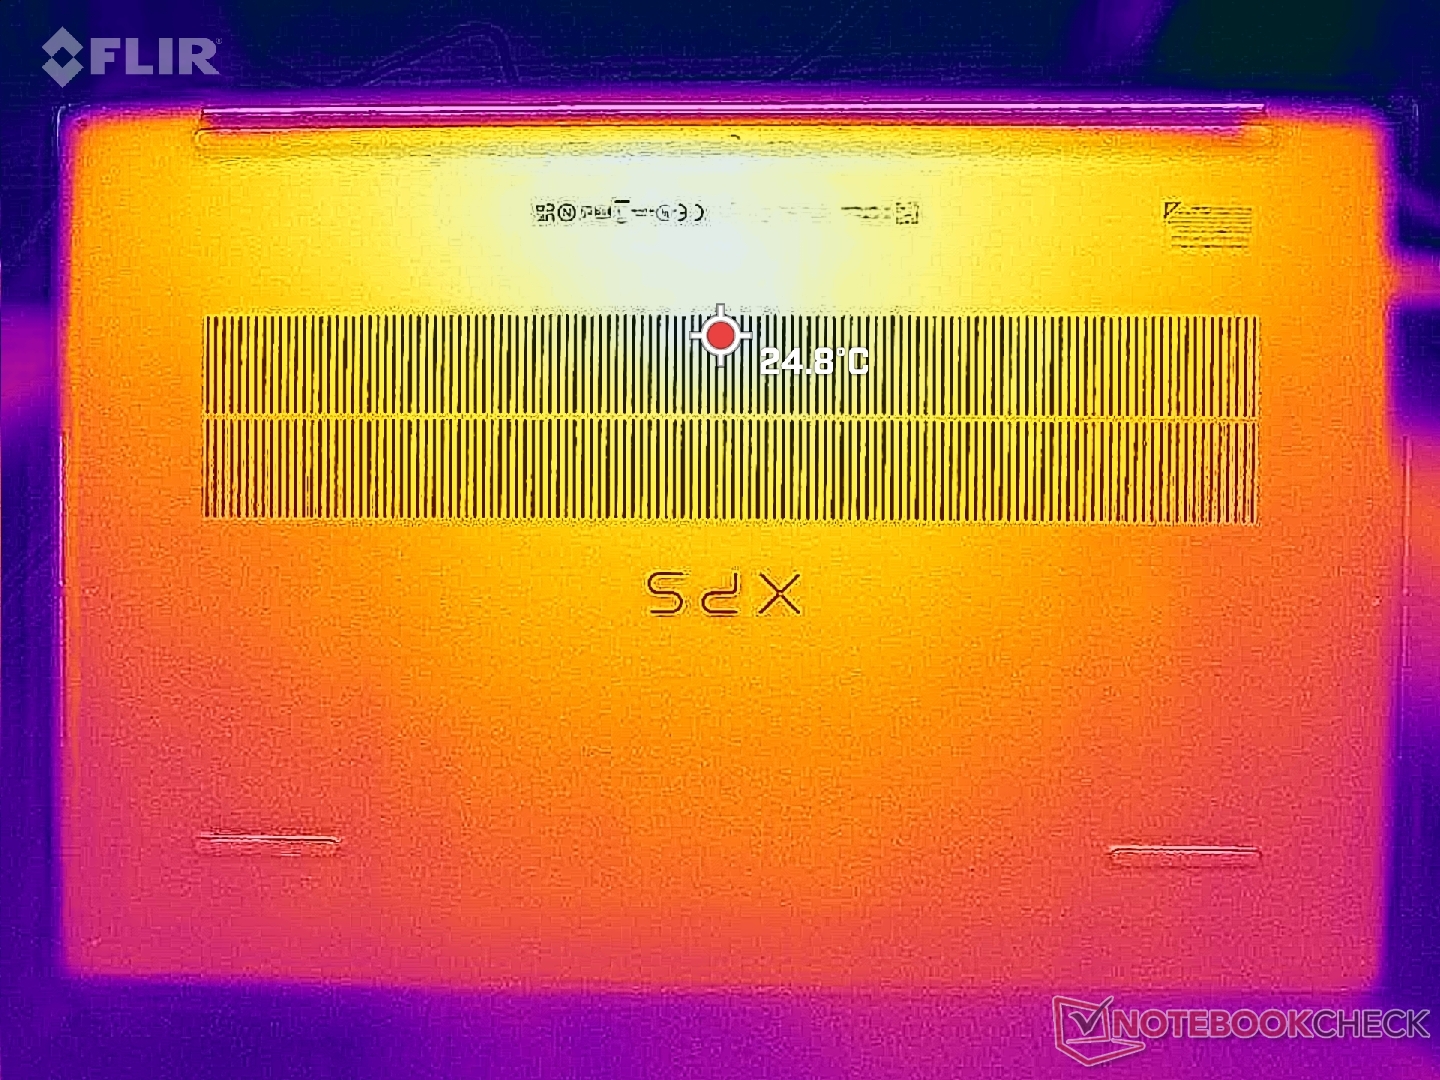
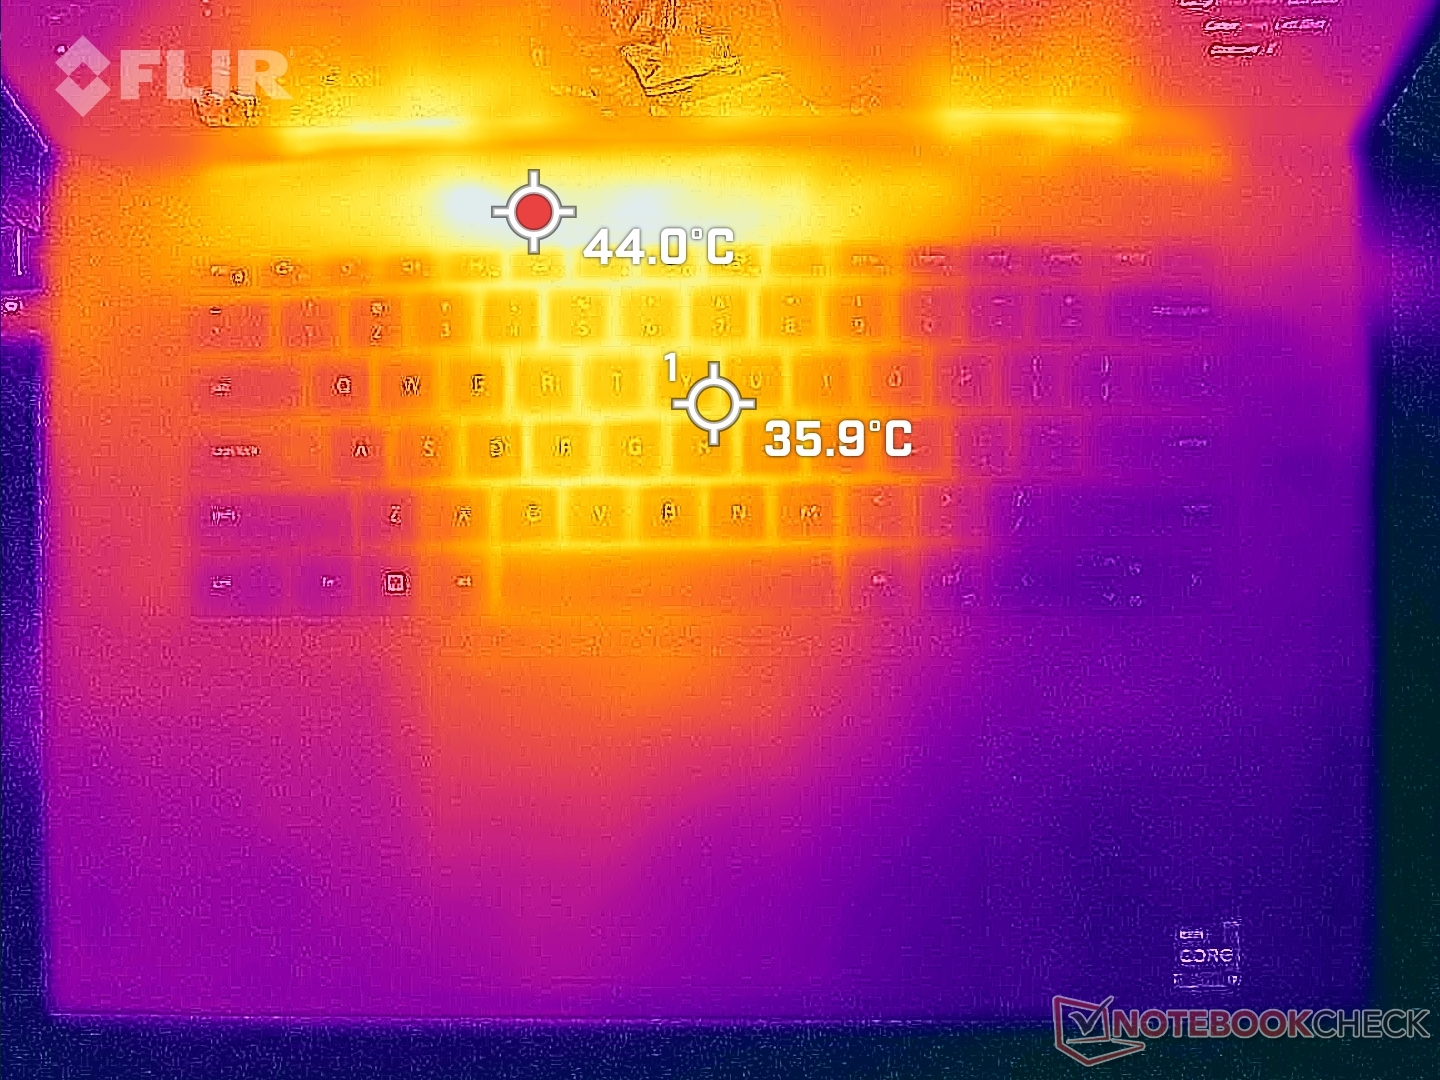
温度
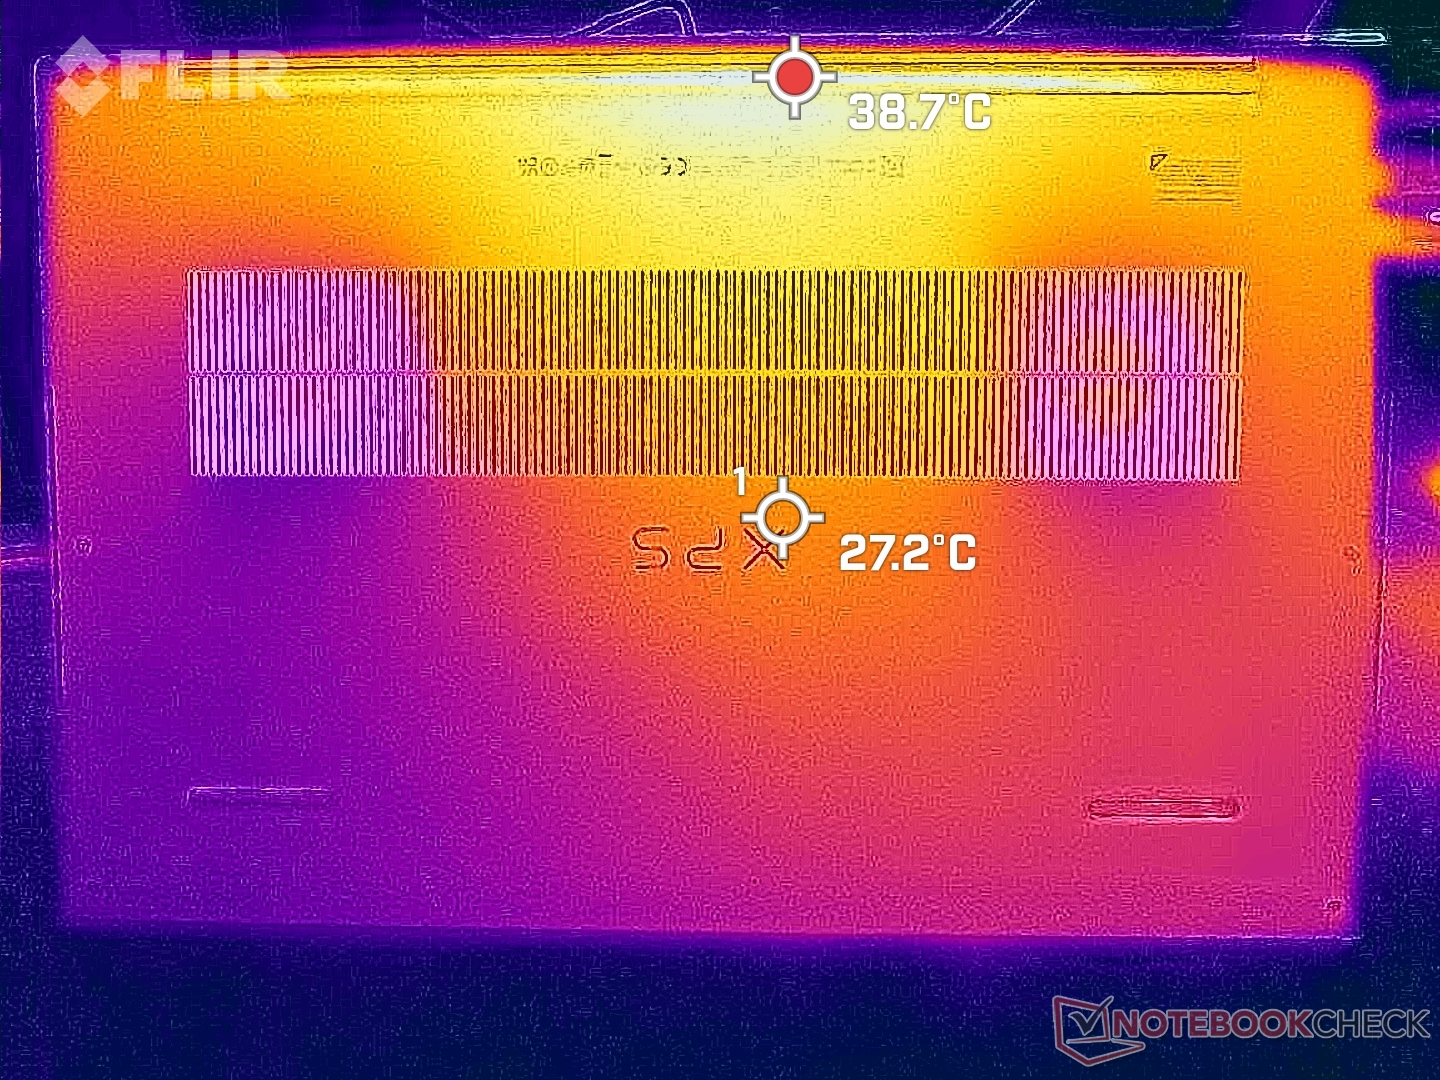
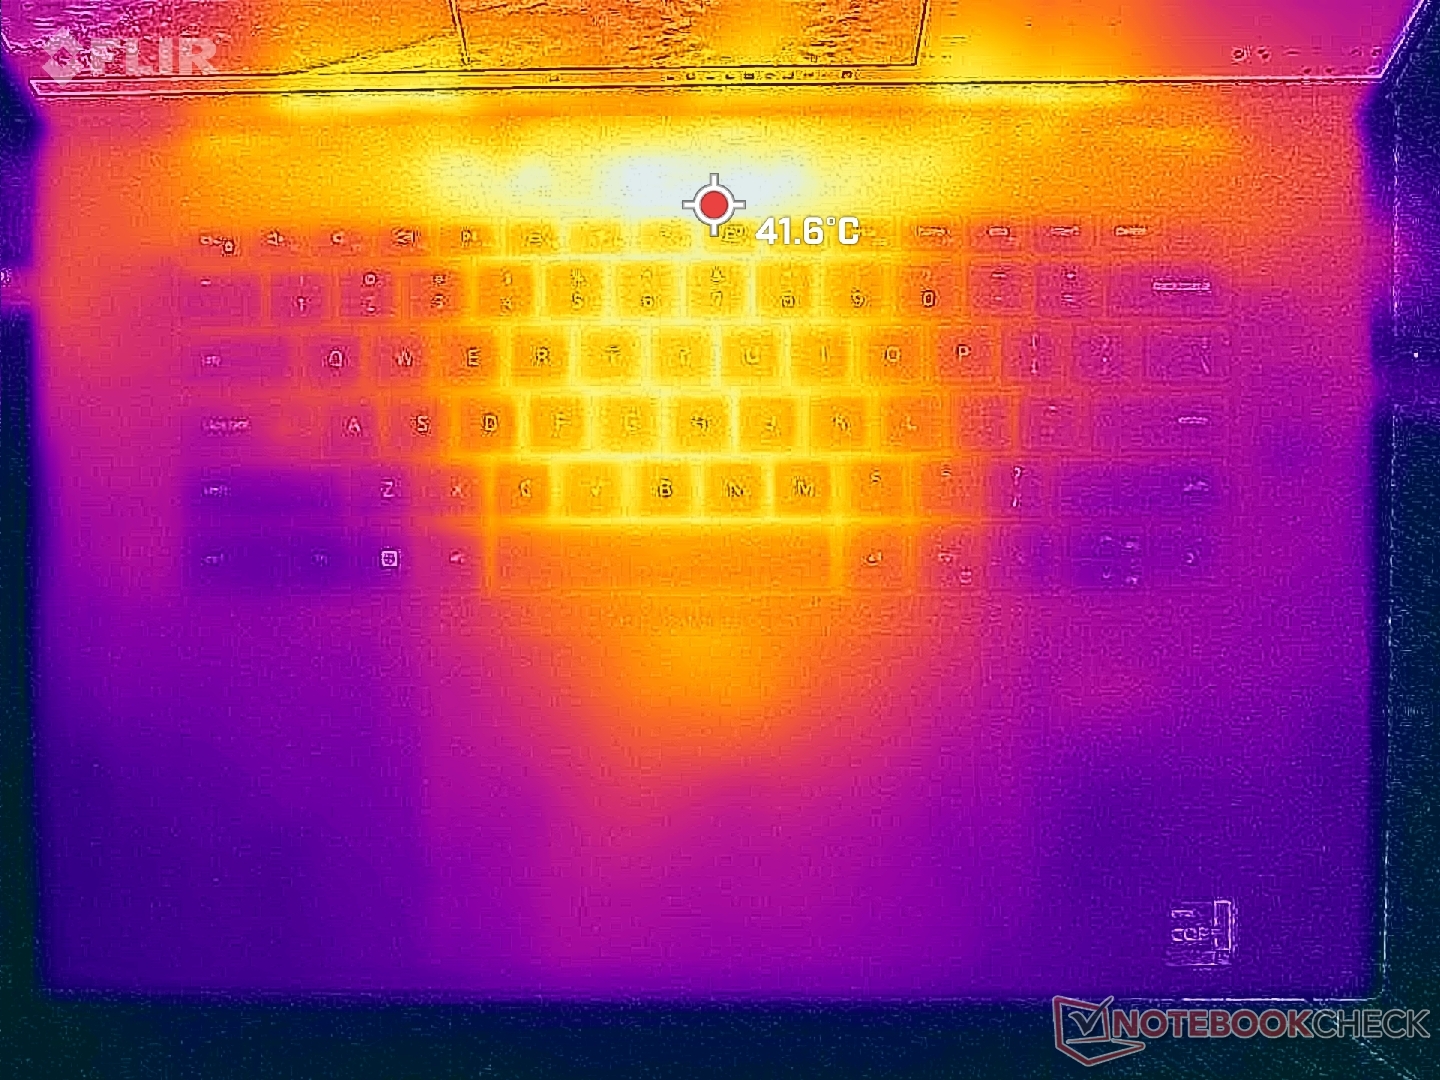
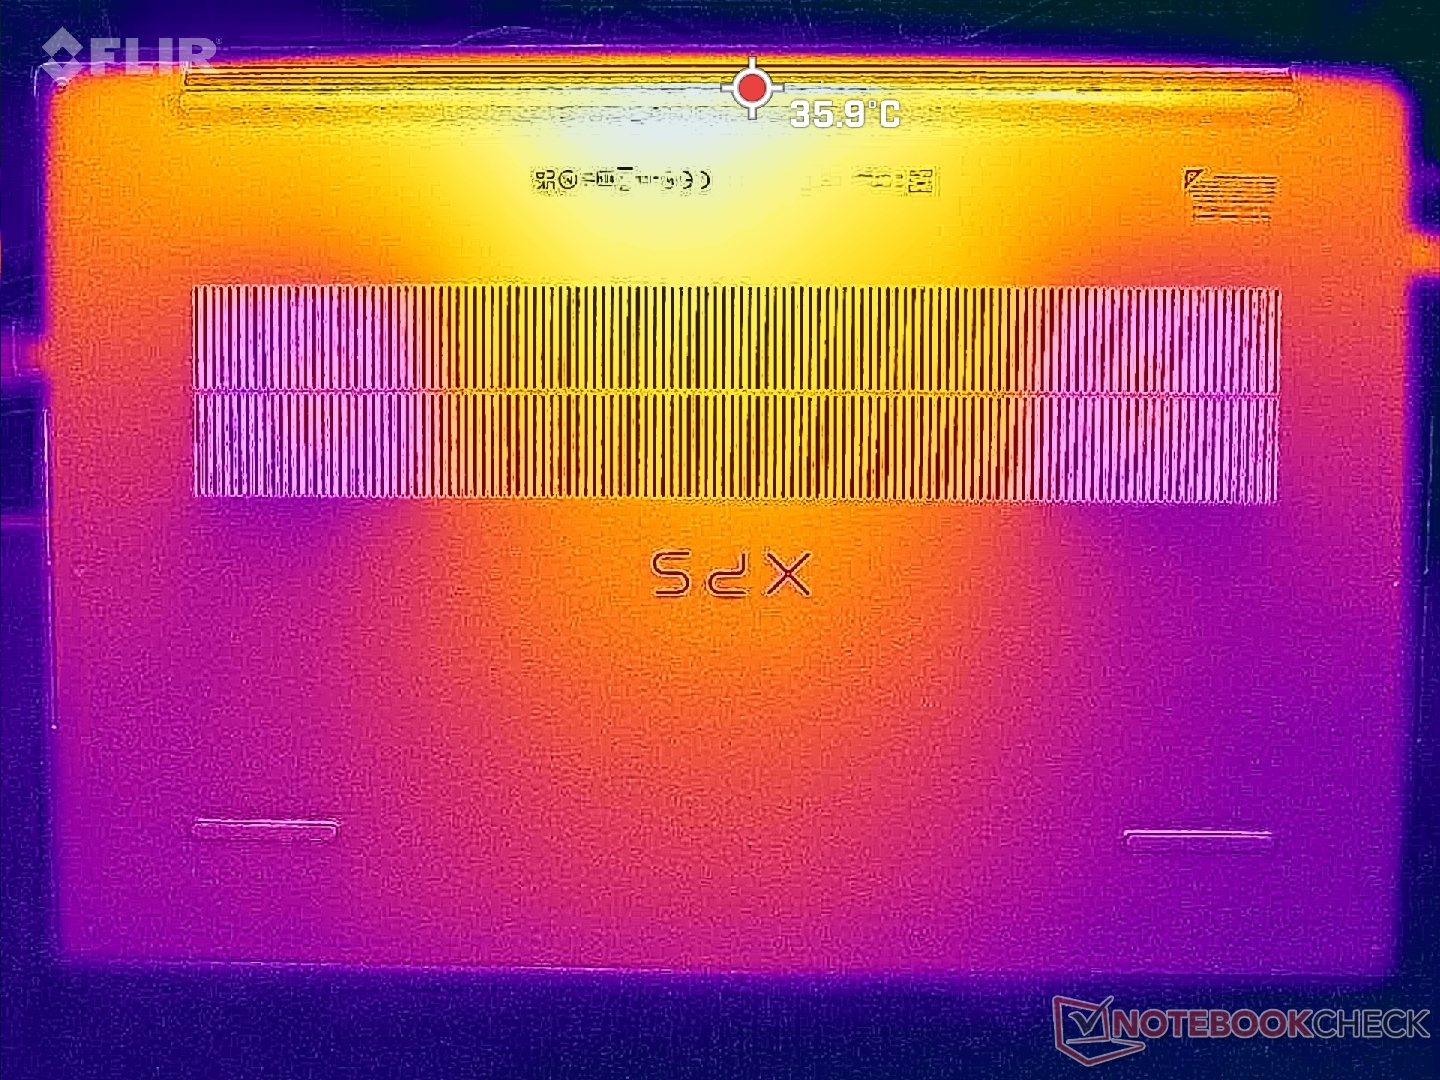
与其他采用类似酷睿H系列CPU和GeForce RTX GPU的笔记本电脑相比,表面温度比预期的要低。竞争者微星创造者Z17例如,它的热点温度高达60多摄氏度,而我们的戴尔在运行类似的重负荷时,温度只有43摄氏度。戴尔的表面温度较低,这可归因于蒸汽室冷却器、GORE隔热材料和一般较低的功率包络。
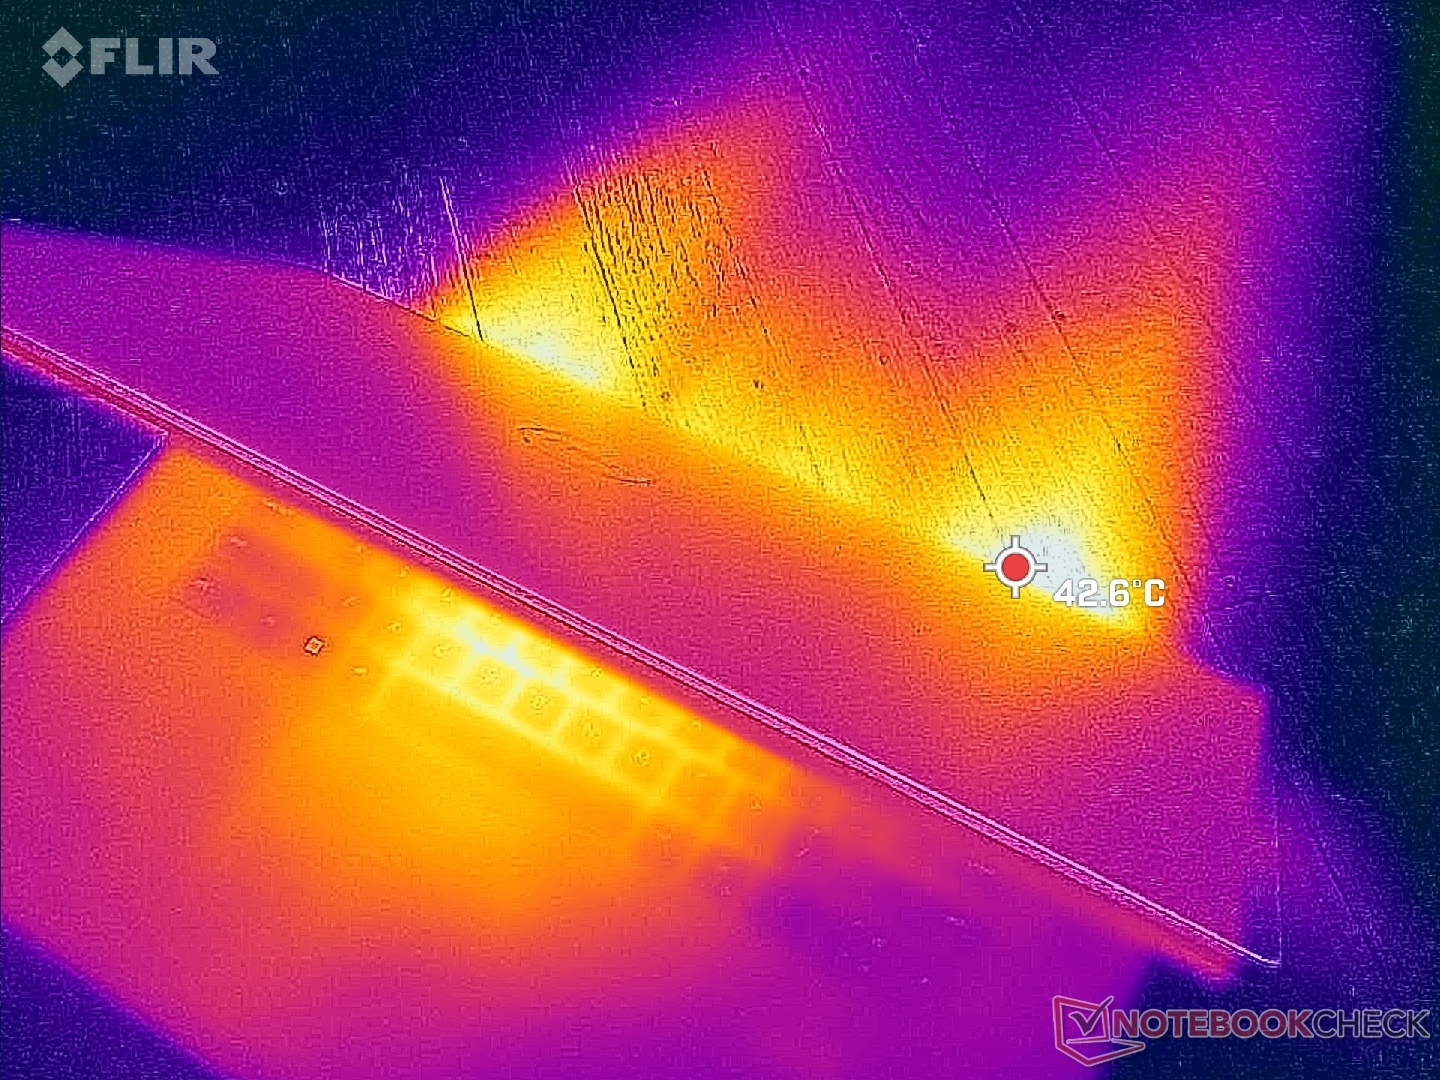
(±) The maximum temperature on the upper side is 43.2 °C / 110 F, compared to the average of 36.8 °C / 98 F, ranging from 21 to 71 °C for the class Multimedia.
(+) The bottom heats up to a maximum of 31.8 °C / 89 F, compared to the average of 39.1 °C / 102 F
(+) In idle usage, the average temperature for the upper side is 28.2 °C / 83 F, compared to the device average of 31.3 °C / 88 F.
(±) Playing The Witcher 3, the average temperature for the upper side is 33.7 °C / 93 F, compared to the device average of 31.3 °C / 88 F.
(+) The palmrests and touchpad are cooler than skin temperature with a maximum of 31 °C / 87.8 F and are therefore cool to the touch.
(-) The average temperature of the palmrest area of similar devices was 28.7 °C / 83.7 F (-2.3 °C / -4.1 F).
| Dell XPS 17 9730 RTX 4070 Intel Core i7-13700H, NVIDIA GeForce RTX 4070 Laptop GPU | Dell XPS 17 9720 RTX 3060 Intel Core i7-12700H, NVIDIA GeForce RTX 3060 Laptop GPU | LG Gram 17 (2023) Intel Core i7-1360P, Intel Iris Xe Graphics G7 96EUs | HP Envy 17-cr0079ng Intel Core i7-1255U, NVIDIA GeForce RTX 2050 Mobile | MSI Creator Z17 A12UGST-054 Intel Core i9-12900H, NVIDIA GeForce RTX 3070 Ti Laptop GPU | Apple MacBook Pro 16 2023 M2 Max Apple M2 Max, Apple M2 Max 38-Core GPU | |
|---|---|---|---|---|---|---|
| Heat | -19% | -7% | -3% | -37% | 5% | |
| Maximum Upper Side * (°C) | 43.2 | 51.8 -20% | 43.9 -2% | 47.1 -9% | 63.9 -48% | 44.2 -2% |
| Maximum Bottom * (°C) | 31.8 | 44.2 -39% | 45.5 -43% | 43.8 -38% | 68 -114% | 42.9 -35% |
| Idle Upper Side * (°C) | 32.8 | 34.8 -6% | 28.4 13% | 25.2 23% | 28.3 14% | 22.4 32% |
| Idle Bottom * (°C) | 29.8 | 33.2 -11% | 28.2 5% | 25.9 13% | 30.2 -1% | 22.3 25% |
* ... smaller is better
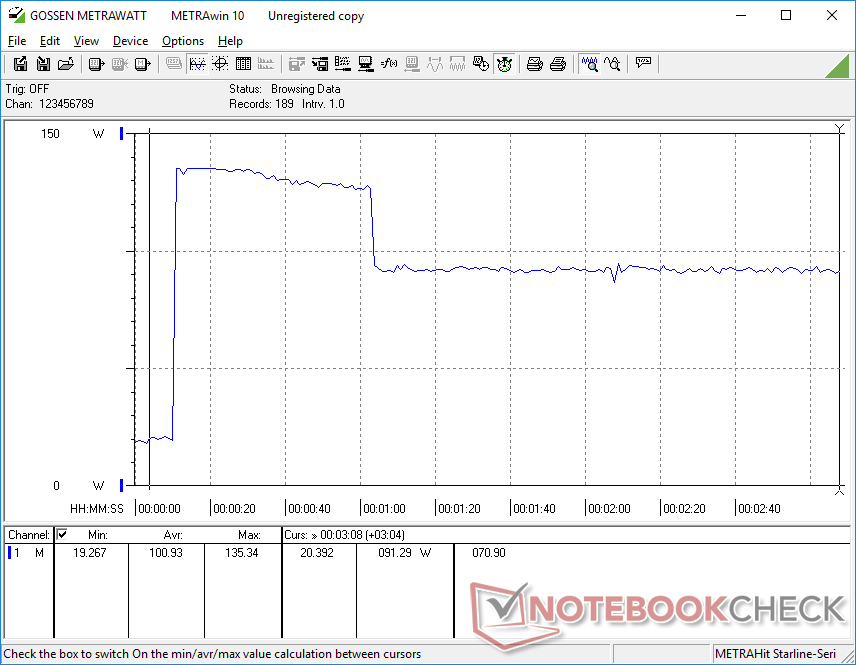
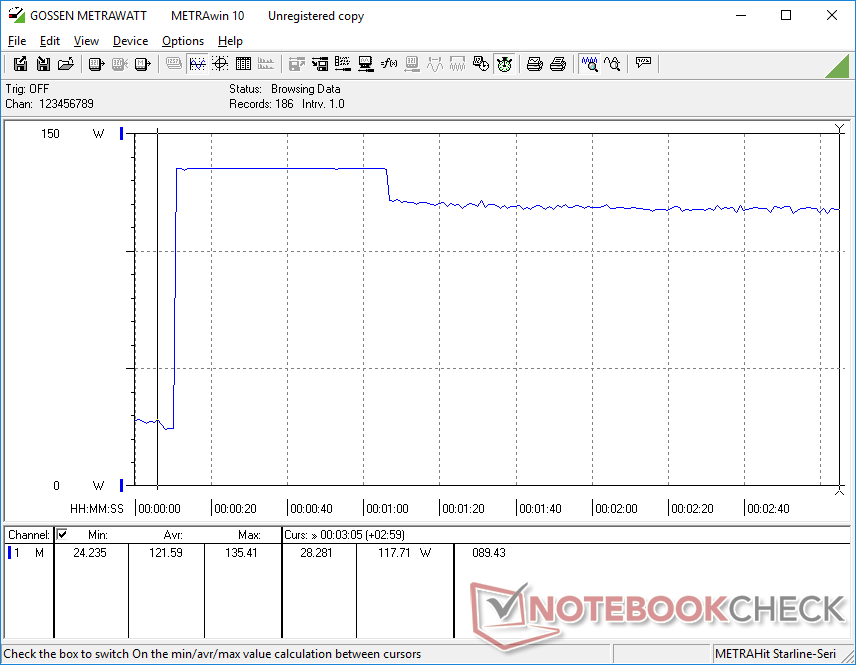
压力测试
当运行Prime95对CPU施加压力时,时钟速率和封装功率将分别飙升至4.1 GHz和122 W,仅持续几秒钟。然后,处理器将稳步下降到3.4 GHz和80 W,然后在短短几分钟后最终下降到2.6 GHz和55 W。最终的稳定功耗为55瓦,与我们在去年的 XPS 19 9720这将解释它们在考虑到上述节流因素后的类似处理器性能。在测试的前几分钟,当Turbo Boost最活跃时,核心温度会非常高,达到95℃至100℃,然后下降并稳定在74℃。
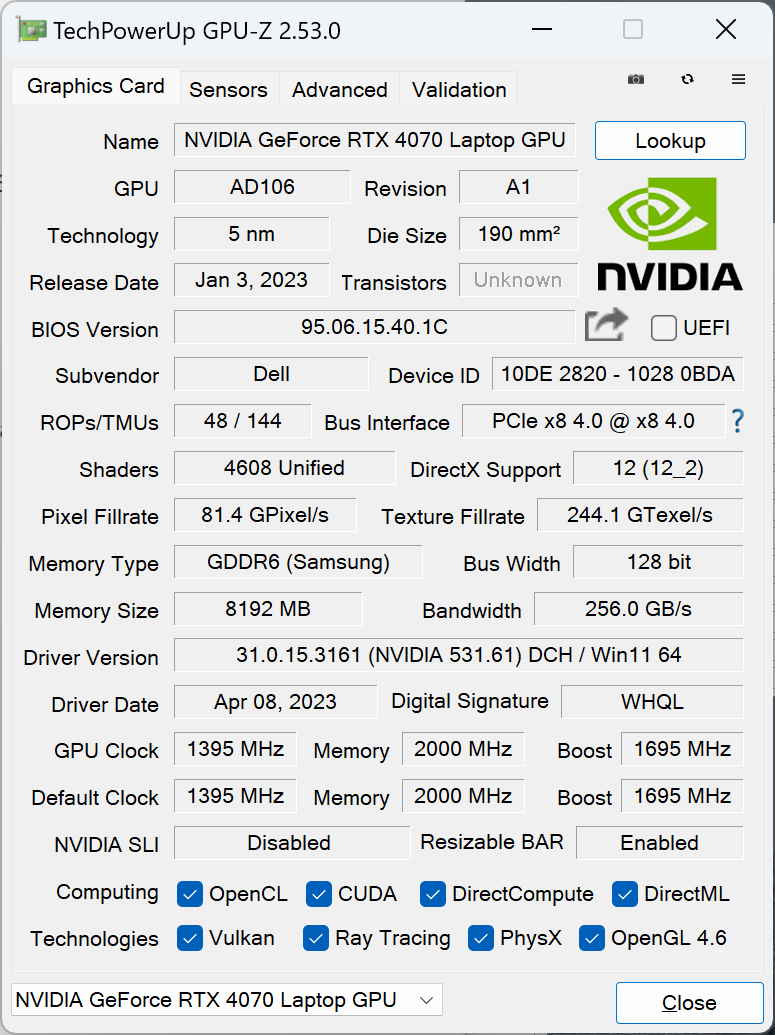
运行时的GPU时钟速率和温度 Witcher 3将分别稳定在2115 MHz和67 C,后者与我们去年在搭载RTX 3060的XPS 17 9720上观察到的情况一致。有趣的是,GPU-Z将报告一个较低的电路板功耗为52W,而WiYNFO将报告70W,如我们下面的截图所示。尽管如此,这两个数值似乎都很稳定。
使用电池电源运行限制了性能。在电池上进行的Fire Strike 测试将返回物理和图形分数,分别为24847和21172分,而在电源上则为27094和24612分。
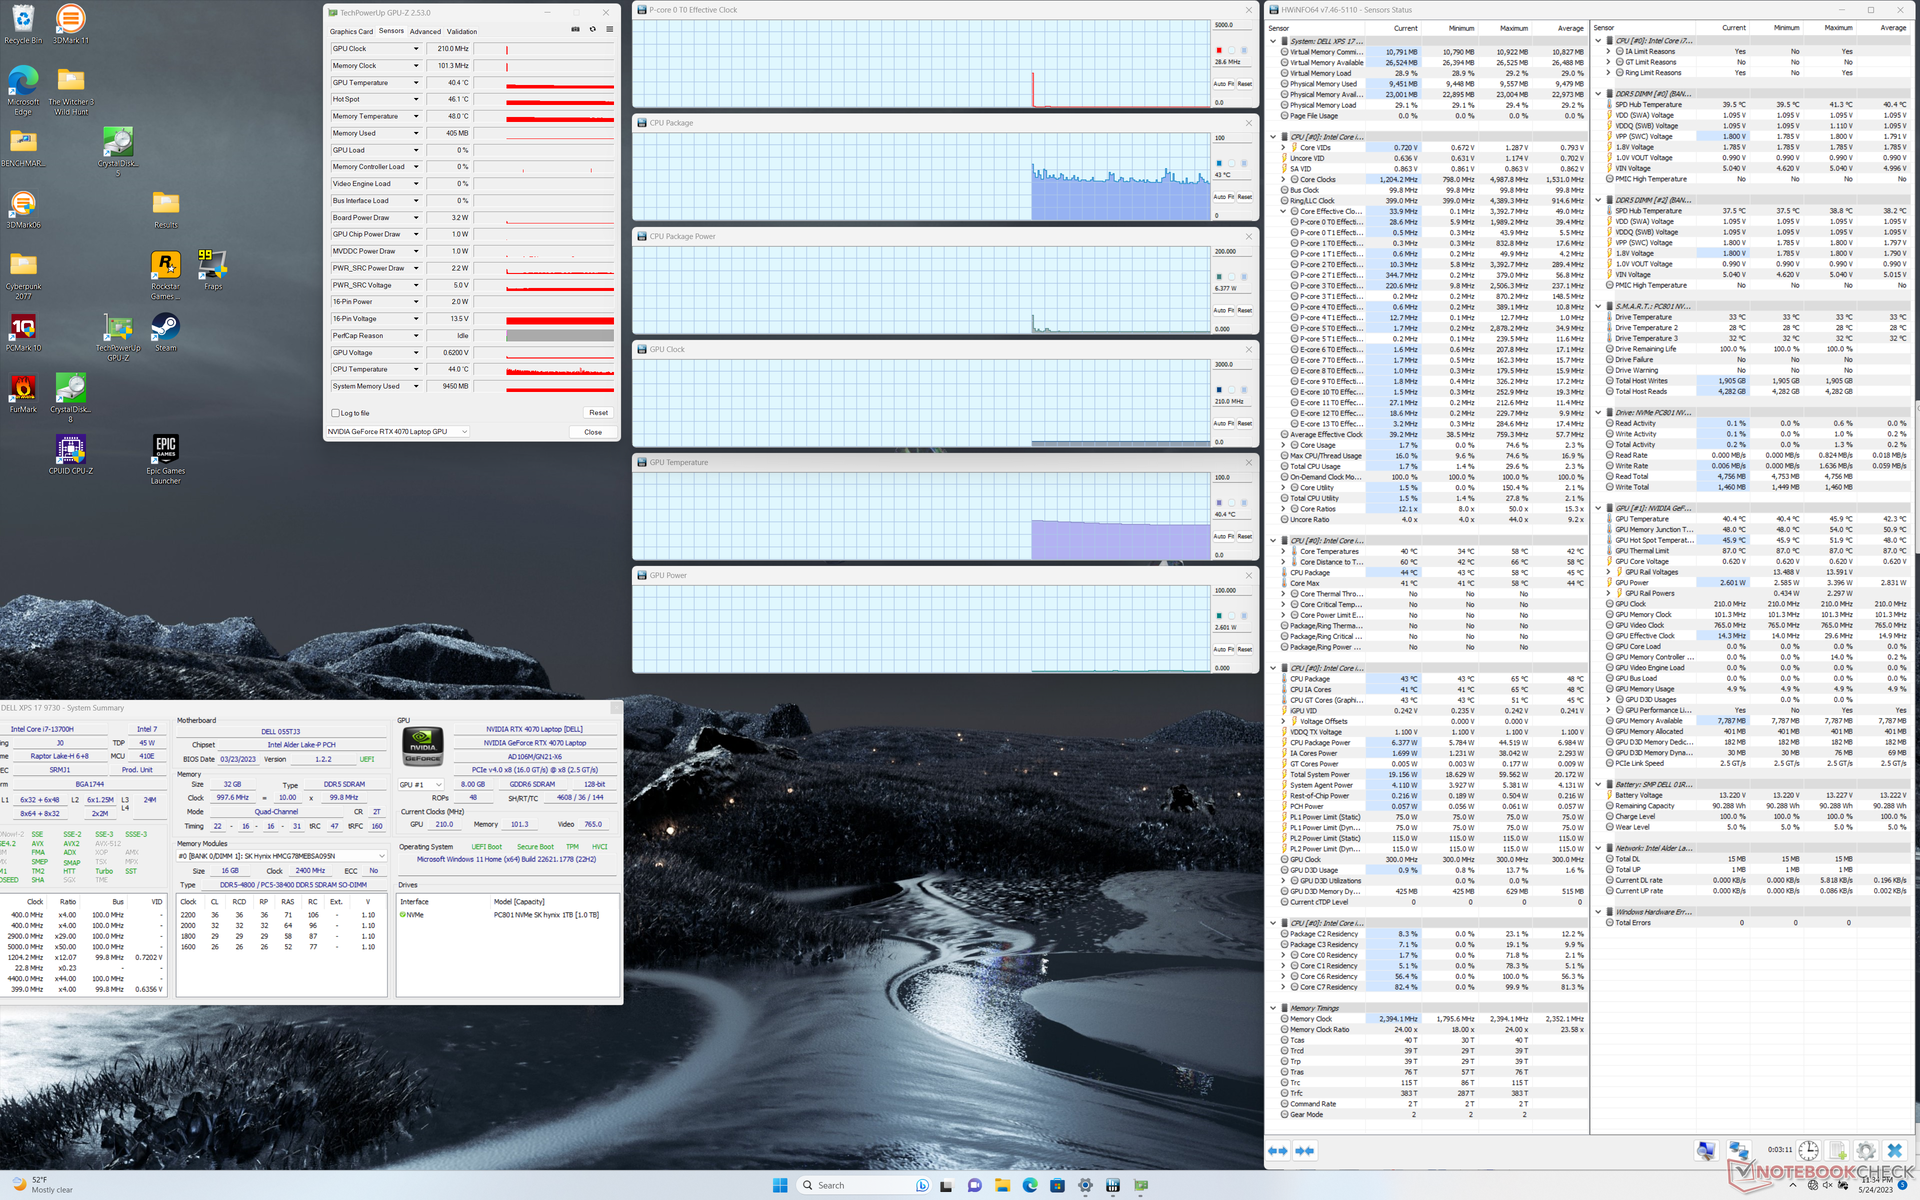
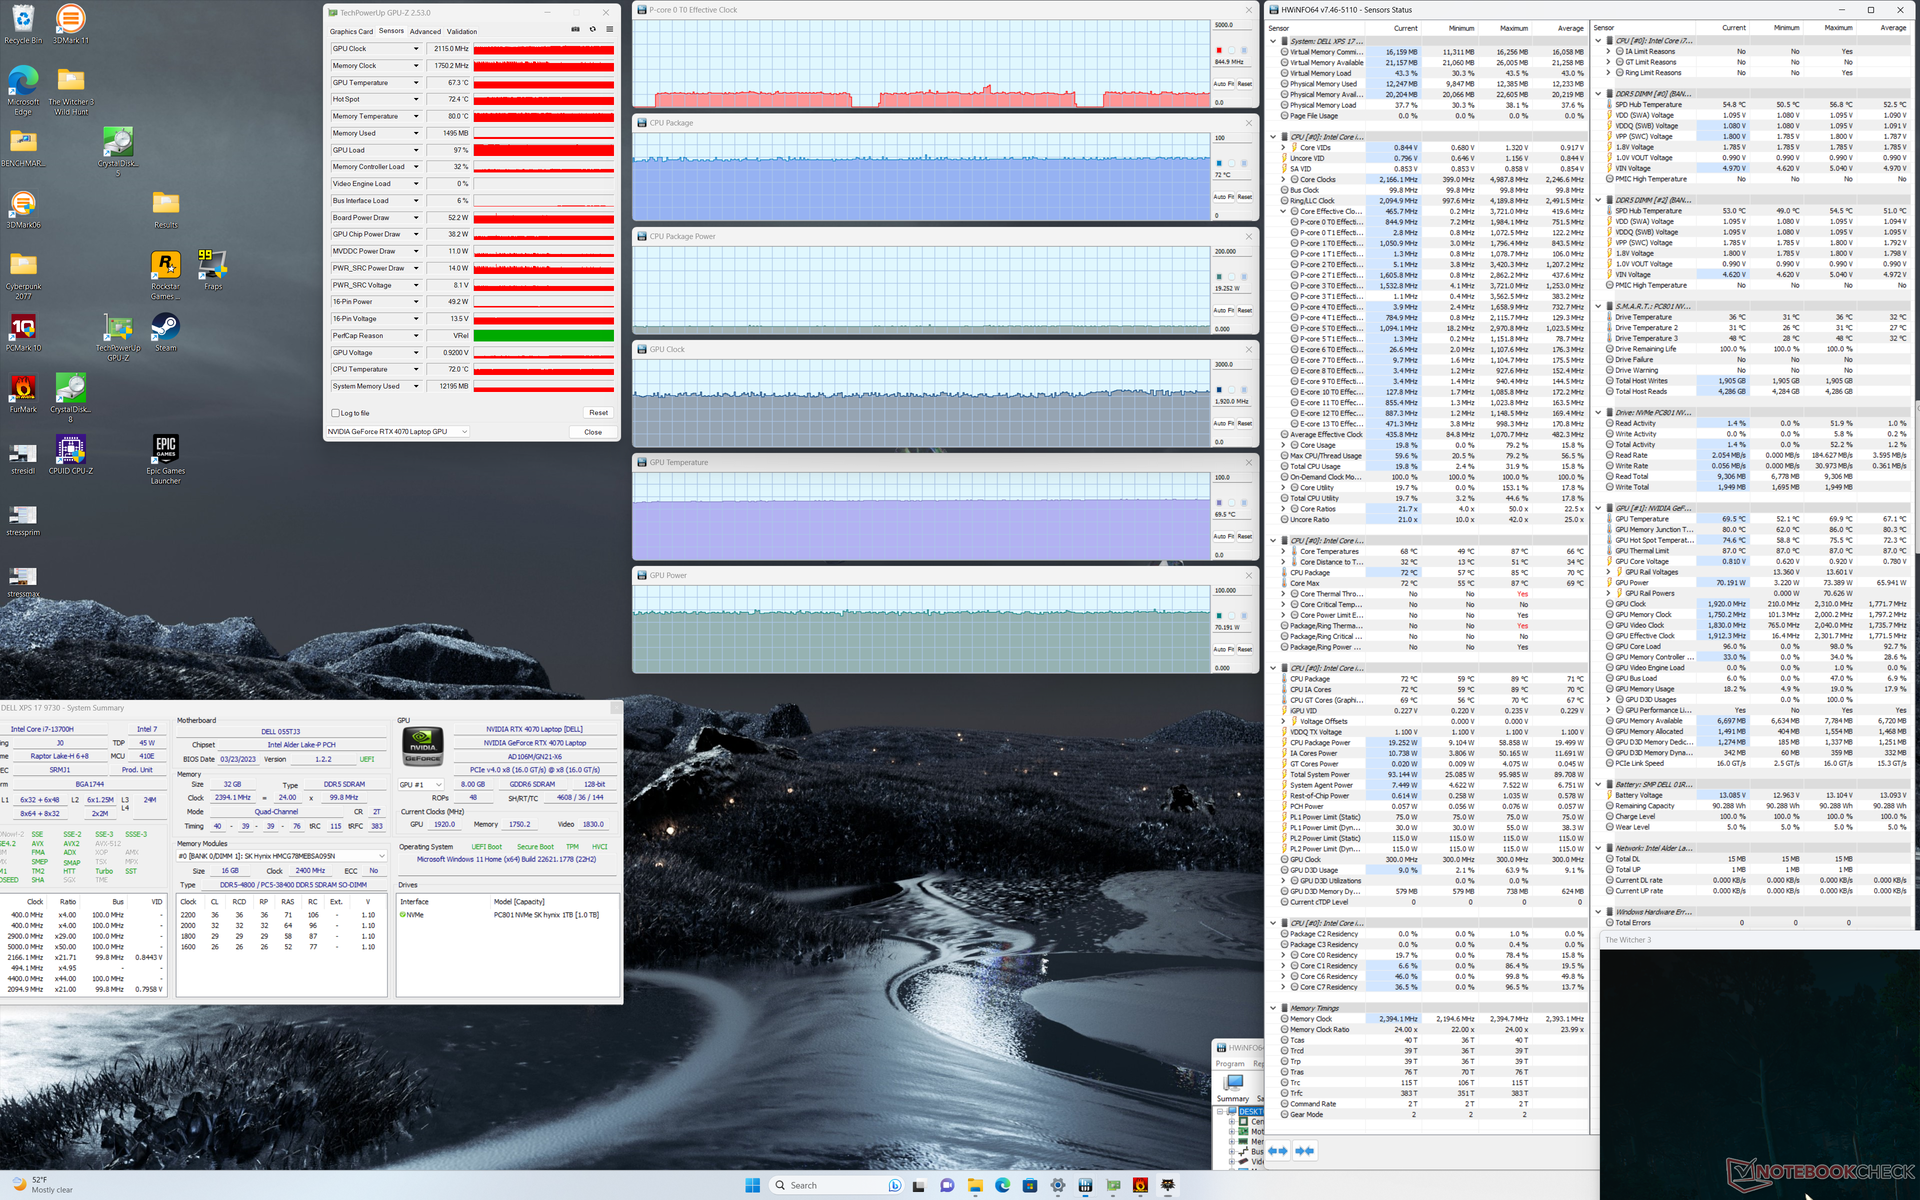
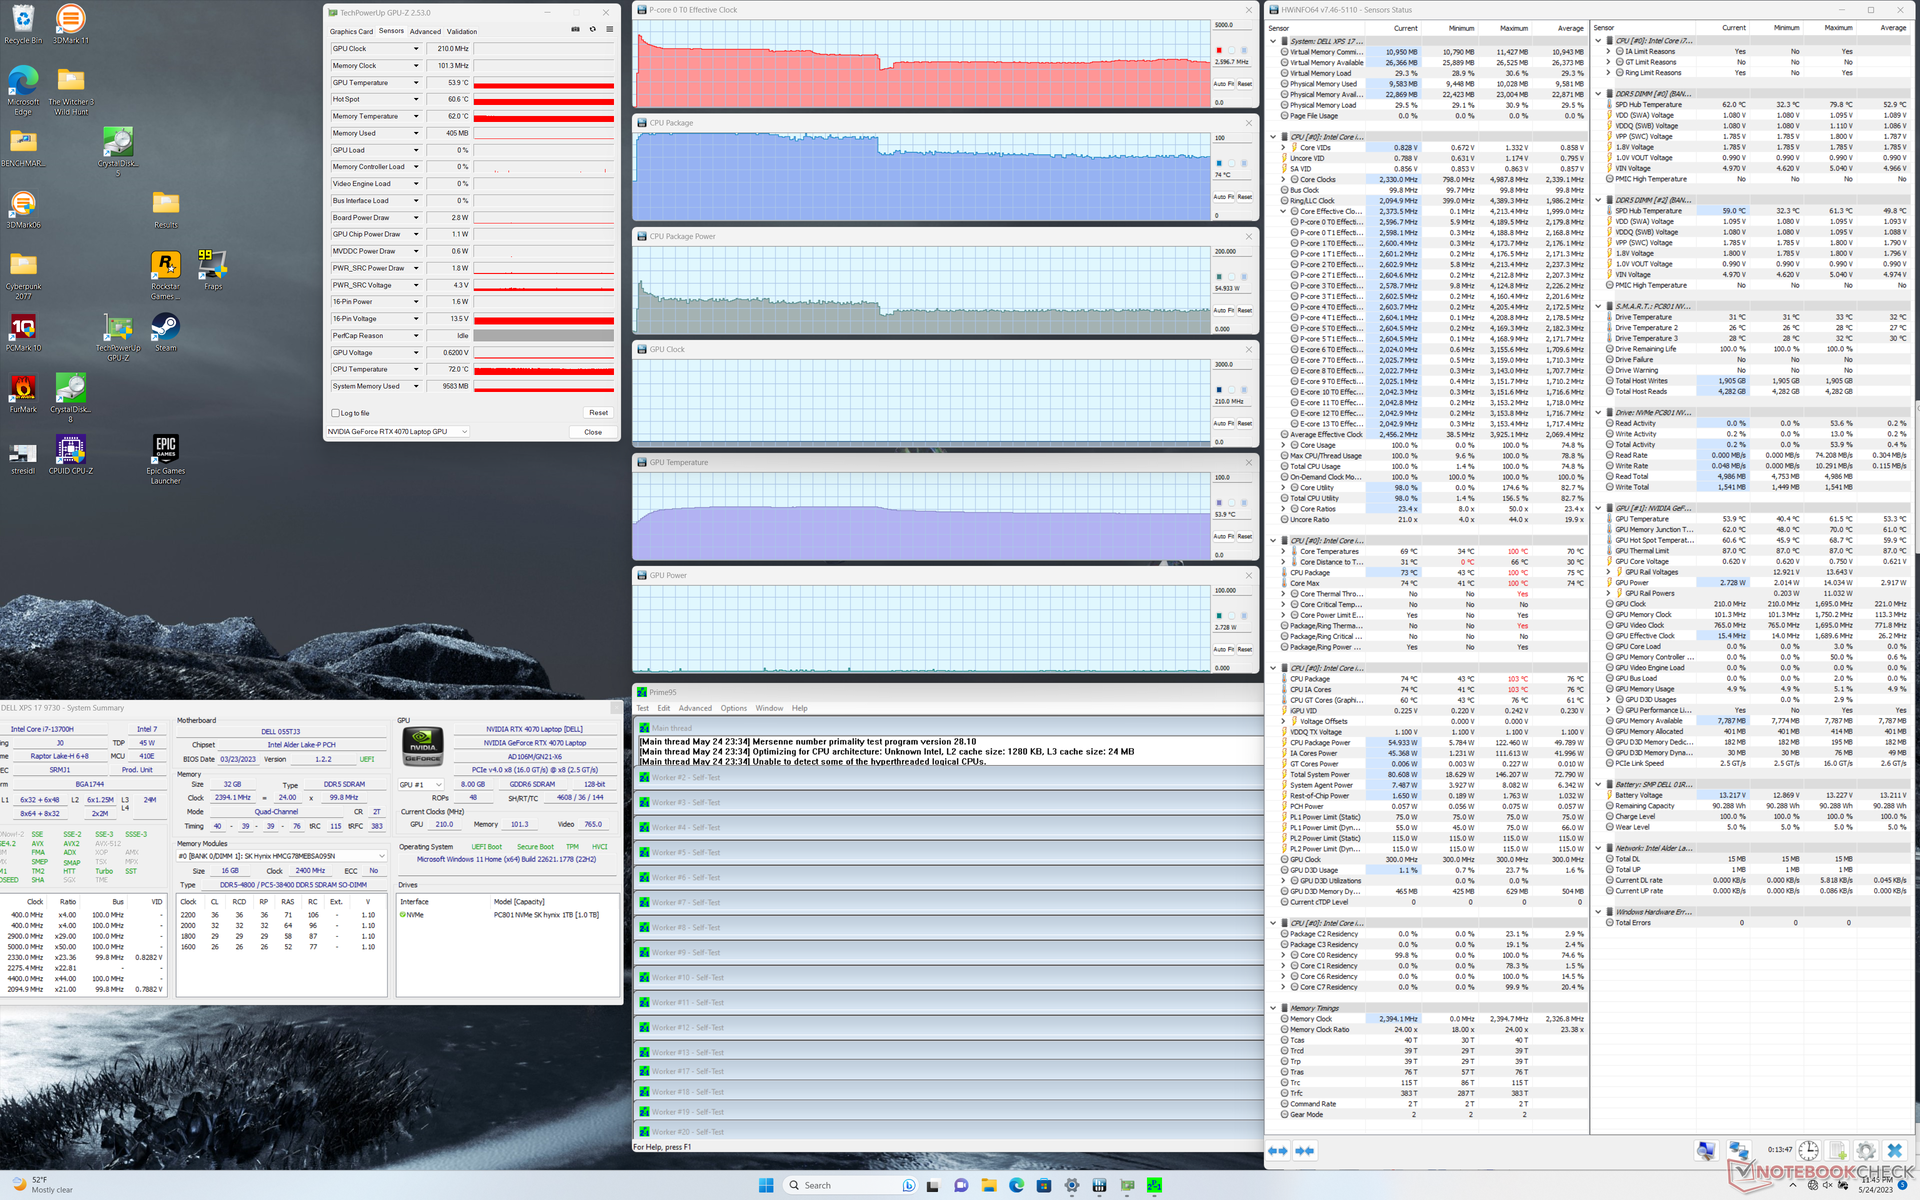
| CPU时钟(GHz) | GPU时钟(MHz) | CPU平均温度(℃) | GPU平均温度(℃) | |
| 系统空闲 | -- | -- | 43 | 40 |
| Prime95压力 | 2.6 | -- | 74 | 54 |
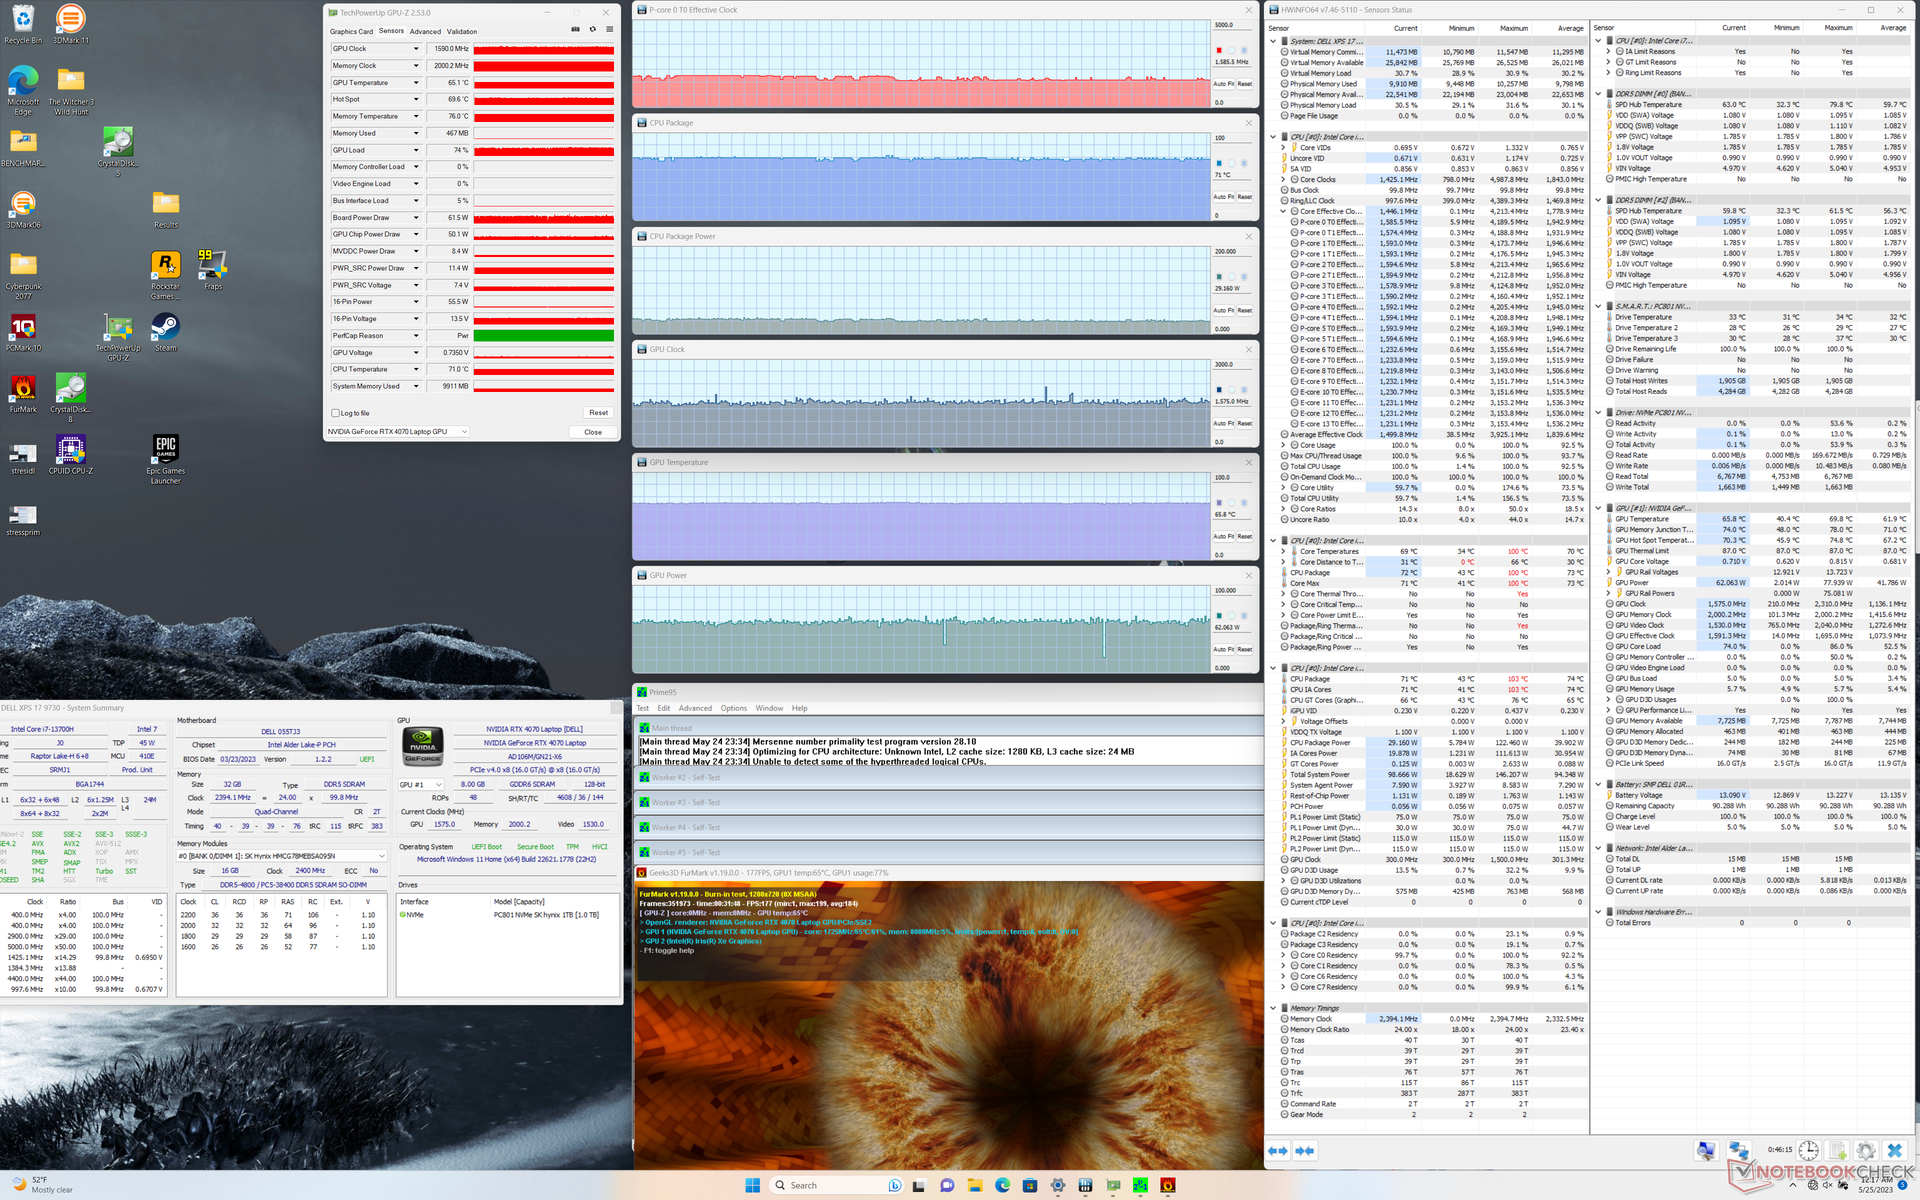
| Prime95 + FurMark 压力 | 1.6 | 1590 | 71 | 65 |
| Witcher 3 应力 | 0.8 | 2115 | 72 | 67 |
发言人
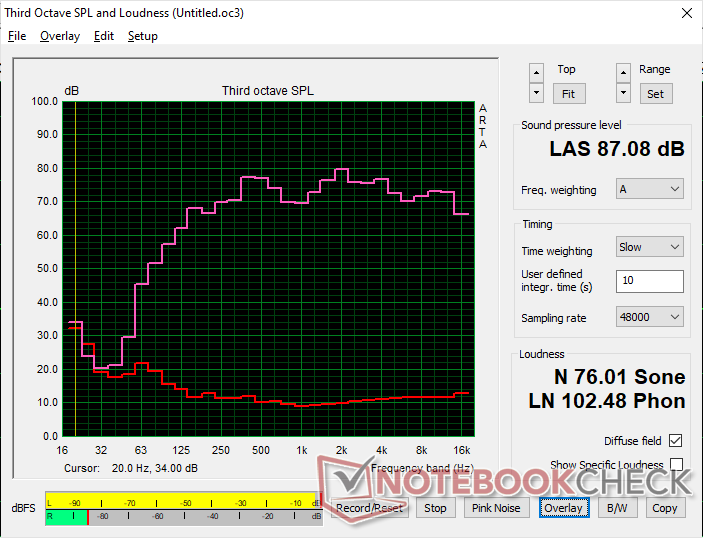
Dell XPS 17 9730 RTX 4070 audio analysis
(+) | speakers can play relatively loud (87.1 dB)
Bass 100 - 315 Hz
(±) | reduced bass - on average 7.2% lower than median
(+) | bass is linear (5.9% delta to prev. frequency)
Mids 400 - 2000 Hz
(+) | balanced mids - only 3.3% away from median
(+) | mids are linear (5.1% delta to prev. frequency)
Highs 2 - 16 kHz
(+) | balanced highs - only 1.9% away from median
(+) | highs are linear (3.4% delta to prev. frequency)
Overall 100 - 16.000 Hz
(+) | overall sound is linear (7% difference to median)
Compared to same class
» 5% of all tested devices in this class were better, 1% similar, 94% worse
» The best had a delta of 5%, average was 17%, worst was 45%
Compared to all devices tested
» 1% of all tested devices were better, 0% similar, 99% worse
» The best had a delta of 4%, average was 23%, worst was 134%
Apple MacBook Pro 16 2021 M1 Pro audio analysis
(+) | speakers can play relatively loud (84.7 dB)
Bass 100 - 315 Hz
(+) | good bass - only 3.8% away from median
(+) | bass is linear (5.2% delta to prev. frequency)
Mids 400 - 2000 Hz
(+) | balanced mids - only 1.3% away from median
(+) | mids are linear (2.1% delta to prev. frequency)
Highs 2 - 16 kHz
(+) | balanced highs - only 1.9% away from median
(+) | highs are linear (2.7% delta to prev. frequency)
Overall 100 - 16.000 Hz
(+) | overall sound is linear (4.6% difference to median)
Compared to same class
» 0% of all tested devices in this class were better, 0% similar, 100% worse
» The best had a delta of 5%, average was 17%, worst was 45%
Compared to all devices tested
» 0% of all tested devices were better, 0% similar, 100% worse
» The best had a delta of 4%, average was 23%, worst was 134%
能源管理--USB-C在工作中的应用
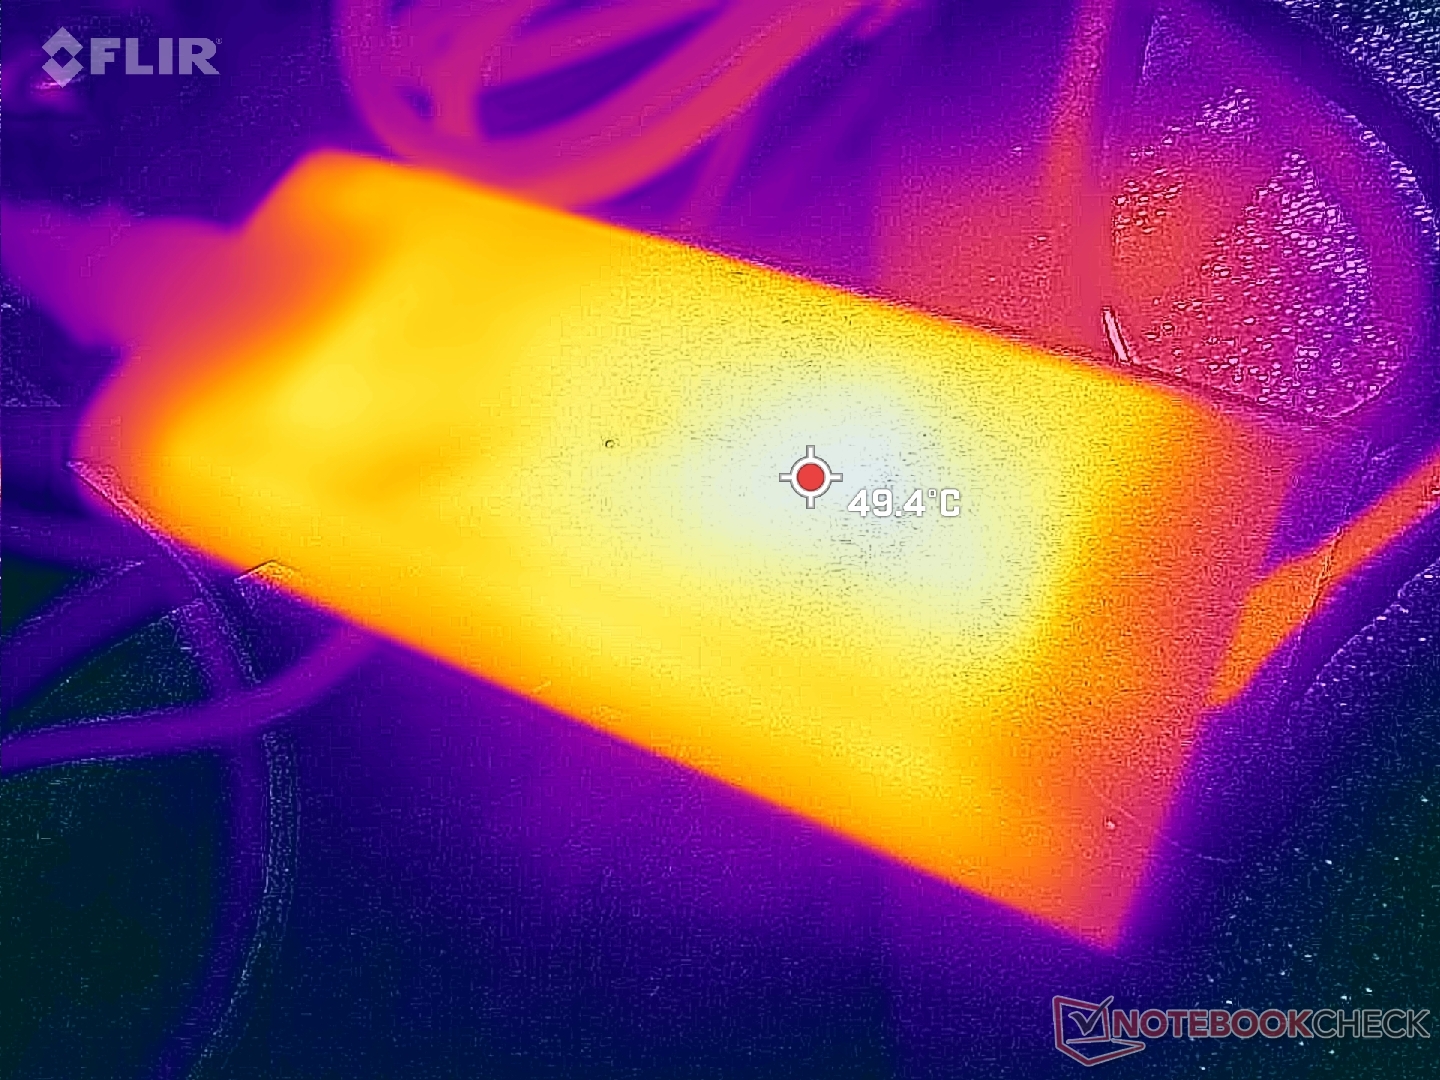
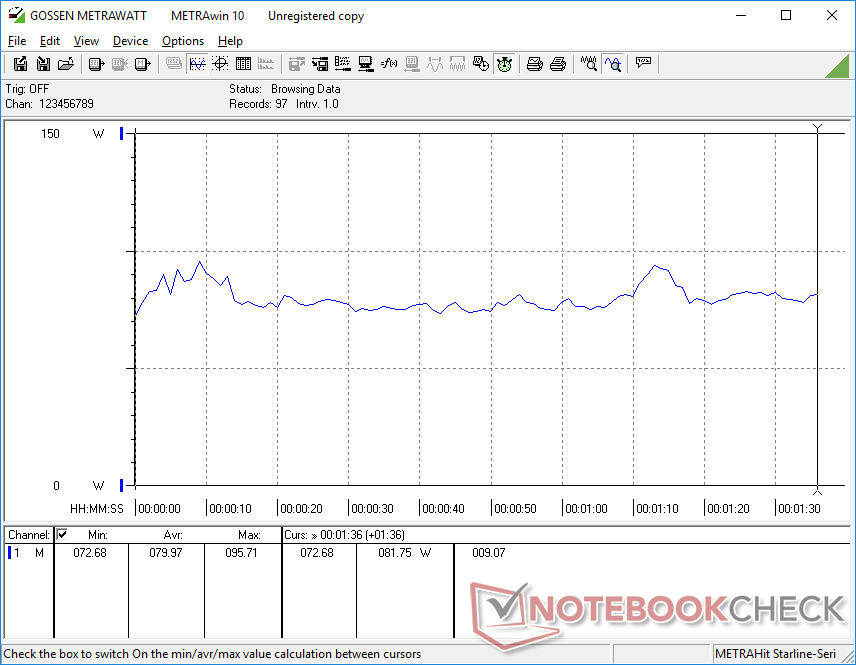
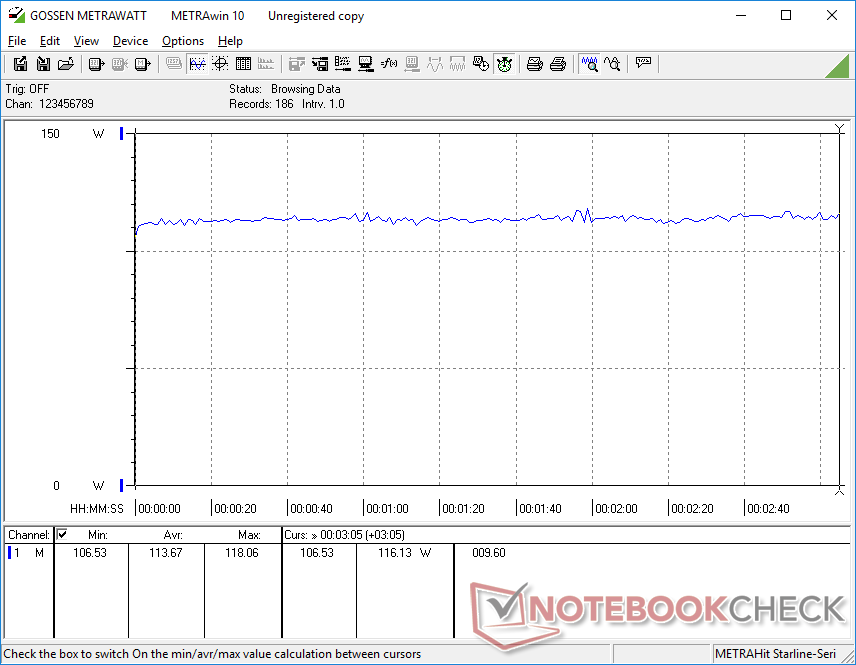
功耗 - 130瓦够吗?
由于迄今为止所有的XPS 17型号都配备了相同的130 W USB-C交流适配器,因此功耗与旧版XPS 17 9720相比没有发生大的变化。与其他配备H系列CPU和GeForce RTX GPU的笔记本电脑相比,戴尔的130瓦适配器在尺寸和输出方面都是最小的之一。这个小型适配器放弃了更高的性能和更快的充电速度,而选择了便携性。
即便如此,阿达-洛夫拉斯相对于安培的更高的每瓦性能仍然使XPS 17 9730在相同的电源包络下比去年的型号表现更好。运行 Witcher 3例如,在XPS 17 9720和9730上都消耗约114瓦,尽管后者的图形性能快30%。如上所述,CPU的功耗也会更稳定,因为它比Core i7-12700H的Turbo Boost可持续性更长。戴尔肯定一直在尽力优化CPU和GPU,以适应有限的电力预算。
| Off / Standby | |
| Idle | |
| Load |
|
Key:
min: | |
| Dell XPS 17 9730 RTX 4070 i7-13700H, GeForce RTX 4070 Laptop GPU, SK hynix PC801 HFS001TEJ9X101N, Sharp LQ170R1, 3840x2400, 17" | Dell XPS 17 9720 RTX 3060 i7-12700H, GeForce RTX 3060 Laptop GPU, Samsung PM9A1 MZVL21T0HCLR, IPS, 3840x2400, 17" | LG Gram 17 (2023) i7-1360P, Iris Xe G7 96EUs, Samsung PM9A1 MZVL21T0HCLR, IPS, 2560x1600, 17" | HP Envy 17-cr0079ng i7-1255U, GeForce RTX 2050 Mobile, Samsung PM991a MZVLQ1T0HBLB, IPS, 3840x2160, 17.3" | MSI Creator Z17 A12UGST-054 i9-12900H, GeForce RTX 3070 Ti Laptop GPU, Micron 3400 1TB MTFDKBA1T0TFH, IPS, 2560x1600, 17" | Apple MacBook Pro 16 2023 M2 Max M2 Max, M2 Max 38-Core GPU, Apple SSD AP2048Z, Mini-LED, 3456x2234, 16.2" | |
|---|---|---|---|---|---|---|
| Power Consumption | 6% | 59% | 34% | -79% | 16% | |
| Idle Minimum * (Watt) | 15 | 5.9 61% | 2.2 85% | 5.8 61% | 34.6 -131% | 5.2 65% |
| Idle Average * (Watt) | 23.6 | 15.8 33% | 8.9 62% | 14.3 39% | 43 -82% | 16.5 30% |
| Idle Maximum * (Watt) | 24.3 | 26.7 -10% | 11 55% | 18.4 24% | 44.9 -85% | 16.8 31% |
| Load Average * (Watt) | 80 | 117.4 -47% | 53 34% | 70 12% | 145 -81% | 113 -41% |
| Witcher 3 ultra * (Watt) | 113.7 | 114.8 -1% | 42.5 63% | 69.4 39% | 152.4 -34% | 92 19% |
| Load Maximum * (Watt) | 135.4 | 136.6 -1% | 64 53% | 93 31% | 220 -62% | 145 -7% |
* ... smaller is better
Power Consumption Witcher 3 / Stresstest
Power Consumption external Monitor
电池寿命 - 寿命长,充电慢
WLAN运行时间比去年的XPS 17 9720长了约一个小时,实际浏览使用时间共10小时。很高兴看到,尽管整体性能逐年提高,但电池寿命并没有受到影响。
从空电到满电的充电速度很慢,约为2至2.5小时,而大多数其他笔记本电脑的充电时间为1.5小时。请记住,由于有限的130瓦交流适配器,如果运行像游戏这样的高要求负载,充电会更慢。
值得注意的是,当连接到主电源并运行游戏或其他高要求负载时,电池不会慢慢耗尽。这个问题是 原先的XPS 9700所特有的并从XPS 17 9710开始解决。
| Dell XPS 17 9730 RTX 4070 i7-13700H, GeForce RTX 4070 Laptop GPU, 97 Wh | Dell XPS 17 9720 RTX 3060 i7-12700H, GeForce RTX 3060 Laptop GPU, 97 Wh | LG Gram 17 (2023) i7-1360P, Iris Xe G7 96EUs, 80 Wh | HP Envy 17-cr0079ng i7-1255U, GeForce RTX 2050 Mobile, 55 Wh | MSI Creator Z17 A12UGST-054 i9-12900H, GeForce RTX 3070 Ti Laptop GPU, 90 Wh | Apple MacBook Pro 16 2023 M2 Max M2 Max, M2 Max 38-Core GPU, 99.6 Wh | |
|---|---|---|---|---|---|---|
| Battery runtime | -11% | 63% | -4% | 28% | 24% | |
| Reader / Idle (h) | 19.1 | 25.7 35% | ||||
| WiFi v1.3 (h) | 10 | 8.7 -13% | 12.8 28% | 4.7 -53% | 5.5 -45% | 14.8 48% |
| Load (h) | 1.1 | 1 -9% | 2.5 127% | 1.6 45% | 2.2 100% | 1.1 0% |
| H.264 (h) | 14.5 | 5.5 | 5.5 | 18.7 |
Pros
Cons
结论 - 平衡和优化
有句话说,你不应该在第一代产品或设计上跃跃欲试,因为潜在的问题或疙瘩需要被磨平。最初的 最初的XPS 17 9700例如,有电池耗尽问题,帧率稳定性问题,以及CPU Turbo Boost性能较弱。经过整整三年的不断优化,最新的XPS 17 9730已经直接解决了所有这些缺点,成为一个更容易推荐的产品。功耗不再是一个问题,帧率稳定,Turbo Boost更持久,更稳定。
XPS 17 9730将高性能与有限的130W电源预算平衡得比 XPS 15 9530.当配备完全相同的Core i7 CPU和GeForce RTX 4070 GPU时,我们的XPS 17将比其较小的兄弟姐妹分别多出10%至15%和50%至60%。特别是GPU的提升是巨大的,仅仅是因为XPS 17的TGP目标更高。如果你在XPS 15和XPS 17之间犹豫不决,而且图形性能是最重要的,那么XPS 17显然是赢家。
XPS 17 9730的性能、便携性、显示效果和游戏潜力可以满足大多数家庭和办公室用户。尽管如此,三年前的设计的某些方面正在变得过时。
该机型的缺点也不容忽视。对于一台3000多美元的笔记本电脑来说,没有隐私快门的100万像素网络摄像头和不支持Wi-Fi 6E在这个价格范围内是令人尴尬的。当OLED和更高刷新率的面板现在很普遍时,60赫兹的IPS显示屏也在变得陈旧。130瓦的交流适配器感觉更像是一堵砖墙,阻碍了XPS 17系列实现更快的充电速度和更高的TGP目标。毫无疑问,有很多东西可以改进,但考虑到薄的设计,至少性能方面处于一个舒适的水平。
价格和可用性
XPS 17 9730还没有通过经销商广泛提供。为了获得最多配置选项和立即发货,我们建议直接从戴尔购买。最低端的SKU价格为2450美元起,如果配置齐全,价格可达4300-5100美元。
Dell XPS 17 9730 RTX 4070
- 05/27/2023 v7 (old)
Allen Ngo
Transparency
The selection of devices to be reviewed is made by our editorial team. The test sample was provided to the author as a loan by the manufacturer or retailer for the purpose of this review. The lender had no influence on this review, nor did the manufacturer receive a copy of this review before publication. There was no obligation to publish this review. As an independent media company, Notebookcheck is not subjected to the authority of manufacturers, retailers or publishers.
This is how Notebookcheck is testing
Every year, Notebookcheck independently reviews hundreds of laptops and smartphones using standardized procedures to ensure that all results are comparable. We have continuously developed our test methods for around 20 years and set industry standards in the process. In our test labs, high-quality measuring equipment is utilized by experienced technicians and editors. These tests involve a multi-stage validation process. Our complex rating system is based on hundreds of well-founded measurements and benchmarks, which maintains objectivity. Further information on our test methods can be found here.
Price comparison

