Notebookcheck Logo

Intel Core i9-13950HX

Intel i9-13950HX

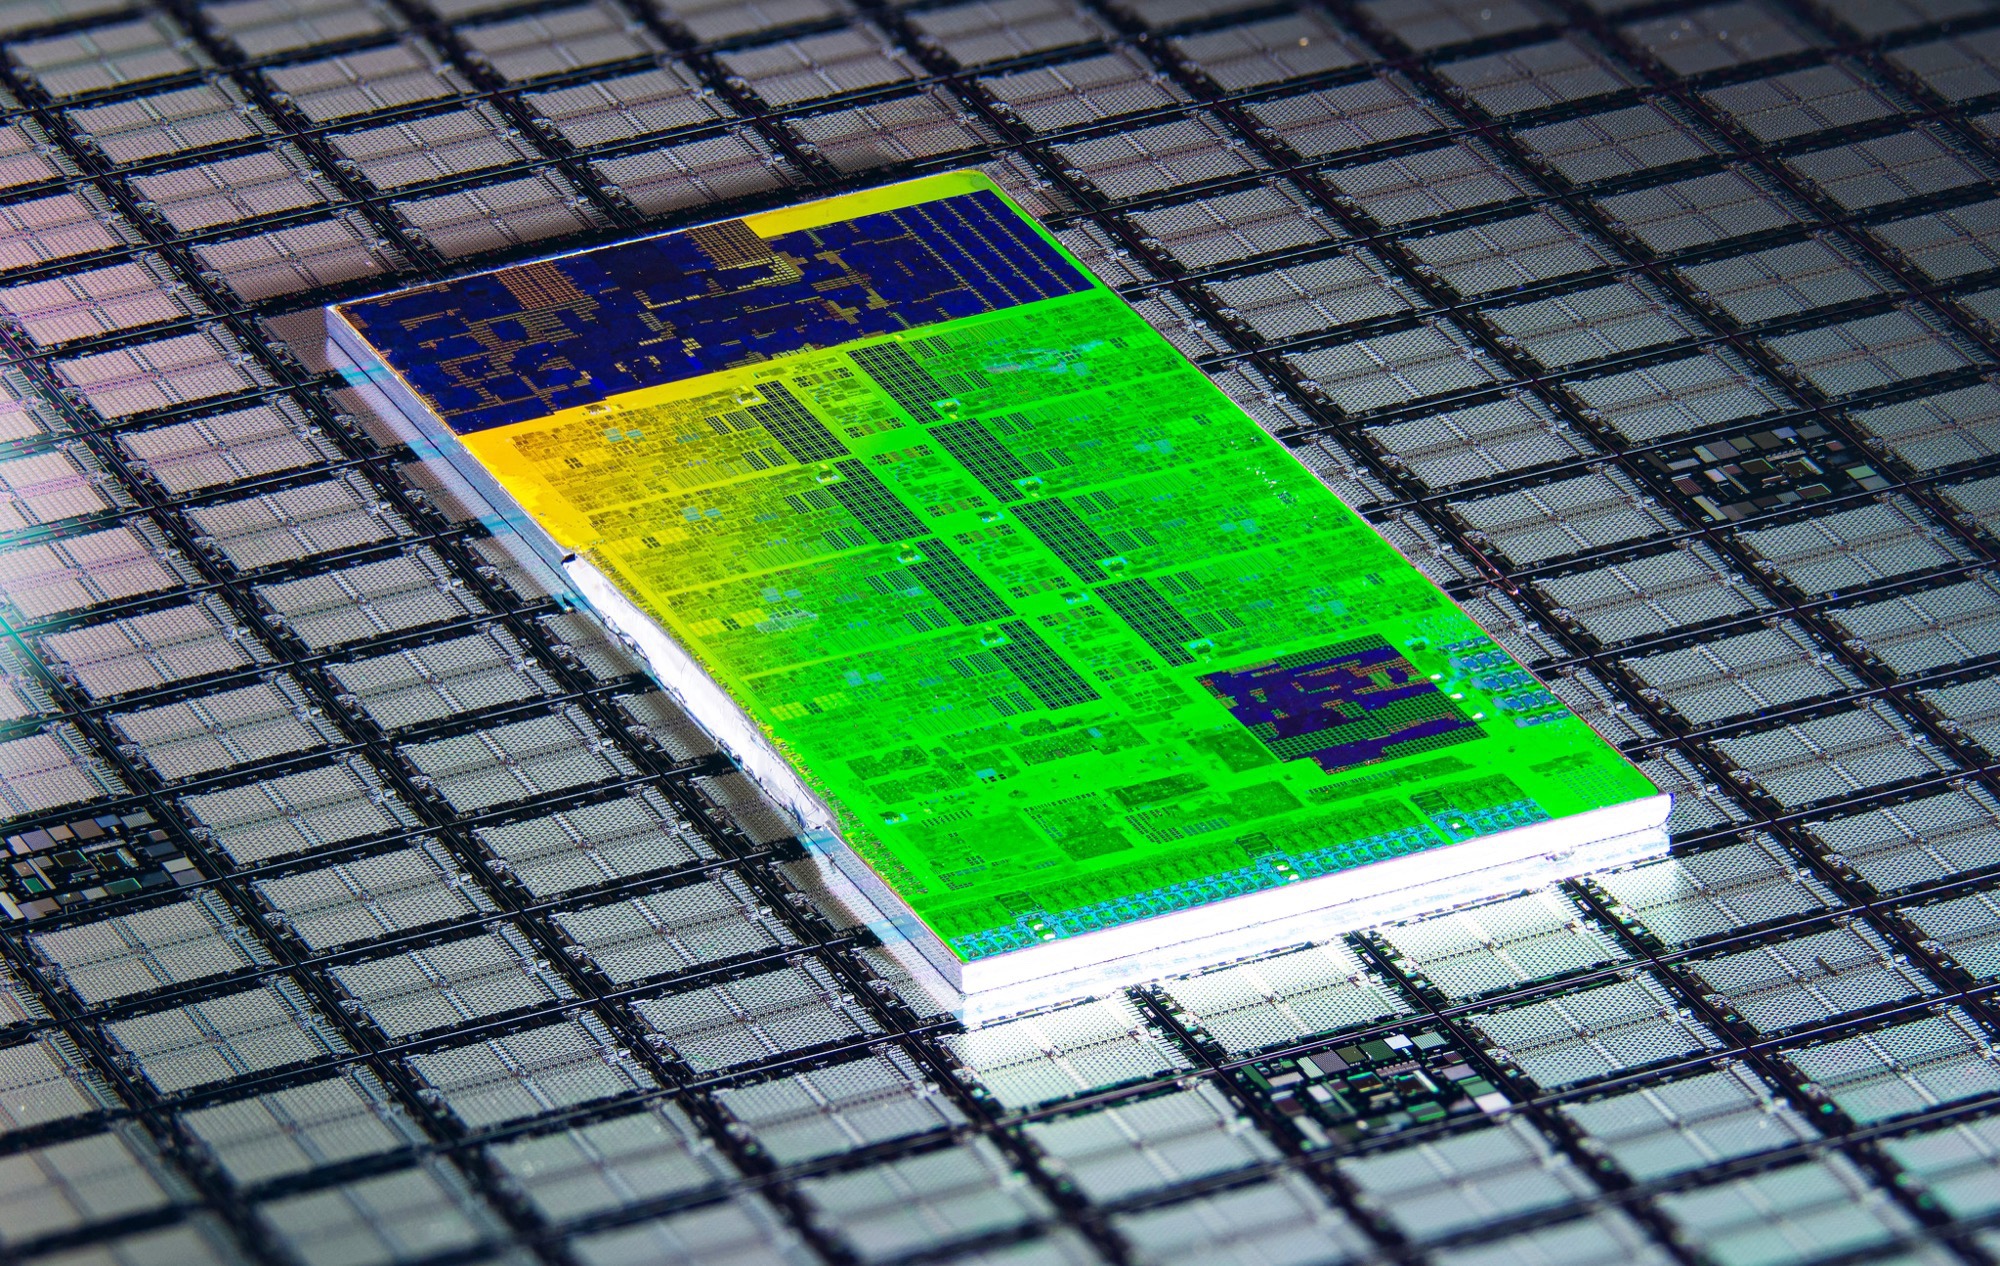
英特尔酷睿 i9-13950HX是 Raptor Lake-HX 系列中的一款快速高端移动处理器。它于 2023 年初发布,基于台式机 酷睿 i9-13000K的基础上,增加了 24 个内核和 32 个线程。其中,8 个快速 Raptor Cove 性能内核(P-cores)主频为 2.2 至 5.5 GHz(单核心,全核心提升 4.9 GHz),带超线程技术;16 个 Gracemont 效率内核(不带超线程技术)主频为 1.6 至 4 GHz。13950HX 与 酷睿 i9-13980HX13950HX 与酷睿 i9-13980HX 非常相似,但支持 vPro Enterprise,P 核心的提升频率降低了 100 MHz。

与 Alder Lake 相比,Raptor Lake改进了 P 核心(Raptor Cove 微架构),缓存更大,E 核心(与 Gracemont 微架构相同)更多。此外,该芯片还支持更快的 DDR5 内存(13980HX 最高可达 5600 MHz)。

性能

我们数据库中 13950HX 的平均性能与 i9-13980HXi9-13900HX相同,同时明显快于 Ryzen 9 7845HX就多线程基准测试成绩而言。截至 2023 年中期,这是一款非常非常快的芯片。

得益于其强大的散热解决方案和 145 W 的 CPU 长期功耗限制,MSI Ge78hx 13V 可以为您的电脑提供超乎寻常的性能。 msi ge78hx 13vh-070us是我们所知的最快的 13950HX 笔记本电脑之一。

功耗

该芯片的 "最低保证 "功耗为 45 W,而其 Turbo 功耗不应超过 157 W。英特尔建议将 "基本 "功耗设置为 55 W,但笔记本电脑制造商实际上并没有义务这样做。大多数人会选择更高的值,以获得更好的性能。

这款 i9 系列处理器采用英特尔第四代 10 纳米工艺制造,市场上称为英特尔 7,平均能效(截至 2023 年初)。

SeriesIntel Raptor Lake-HX
CodenameRaptor Lake-HX

Series: Raptor Lake-HX Raptor Lake-HX

Intel Core i9-13980HX1.6 - 5.6 GHz24 / 32 cores36 MB L3
Intel Core i9-13950HX « 1.6 - 5.5 GHz24 / 32 cores36 MB L3
Intel Core i9-13900HX1.6 - 5.4 GHz24 / 32 cores36 MB L3
Intel Core i7-13850HX1.5 - 5.3 GHz20 / 28 cores30 MB L3
Intel Core i7-13700HX1.5 - 5 GHz16 / 24 cores30 MB L3
Intel Core i7-13650HX1.9 - 4.9 GHz14 / 20 cores24 MB L3
Intel Core i5-13600HX1.9 - 4.8 GHz14 / 20 cores24 MB L3
Intel Core i5-13500HX1.8 - 4.7 GHz14 / 20 cores24 MB L3
Intel Core i5-13450HX1.8 - 4.6 GHz10 / 16 cores20 MB L3
Clock Rate1600 - 5500 MHz
Level 2 Cache32 MB
Level 3 Cache36 MB
Number of Cores / Threads24 / 32
8 x 5.5 GHz Intel Raptor Cove P-Core
16 x 4.0 GHz Intel Gracemont E-Core
Power Consumption (TDP = Thermal Design Power)55 Watt
Manufacturing Technology10 nm
Die Size257 mm2
Max. Temperature100 °C
SocketBGA1964
FeaturesDDR4-3200/DDR5-5600 RAM, PCIe 5, Thr. Director, DL Boost, GNA, vPro Enterp., MMX, SSE, SSE2, SSE3, SSSE3, SSE4.1, SSE4.2, AVX, AVX2, BMI2, ABM, FMA, ADX, SMEP, SMAP, EIST, TM1, TM2, HT, Turbo, SST, AES-NI, RDRAND, RDSEED, SHA, TME
GPUIntel UHD Graphics 770 ( - 1650 MHz)
64 Bit64 Bit support
Architecturex86
Announcement Date01/04/2023
Product Link (external)ark.intel.com

Benchmarks

Performance Rating - CB R15 + R20 + 7-Zip + X265 + Blender + 3DM11 CPU
53.4 pt (74%)
Cinebench R23 - Cinebench R23 Multi Core
min: 24560     avg: 29352     median: 28681 (27%)     max: 33277 Points
Cinebench R23 - Cinebench R23 Single Core
min: 1952     avg: 2067     median: 2096 (89%)     max: 2113 Points
Cinebench R20 - Cinebench R20 CPU (Single Core)
min: 742     avg: 788     median: 801 (89%)     max: 816 Points
Cinebench R20 - Cinebench R20 CPU (Multi Core)
min: 8697     avg: 10973     median: 10919 (27%)     max: 12648 Points
Cinebench R15 - Cinebench R15 CPU Multi 64 Bit
min: 3625     avg: 4565     median: 4529 (29%)     max: 5227 Points
02655307951060132515901855212023852650291531803445371039754240450547705035Tooltip
Cinebench R15 - Cinebench R15 CPU Single 64 Bit
min: 274     avg: 292.9     median: 297 (89%)     max: 303 Points
Cinebench R11.5 - Cinebench R11.5 CPU Multi 64 Bit
60 Points (78%)
Cinebench R11.5 - Cinebench R11.5 CPU Single 64 Bit
3.6 Points (89%)
Cinebench R10 - Cinebench R10 Rend. Single (32bit)
11424 points (69%)
Cinebench R10 - Cinebench R10 Rend. Multi (32bit)
80693 points (58%)
7-Zip 18.03 - 7-Zip 18.03 Multli Thread 4 runs
min: 99351     avg: 115415     median: 116665 (67%)     max: 127295 MIPS
7-Zip 18.03 - 7-Zip 18.03 Single Thread 4 runs
min: 6445     avg: 6775     median: 6754 (81%)     max: 7064 MIPS
HWBOT x265 Benchmark v2.2 - HWBOT x265 4k Preset
min: 26     avg: 30.7     median: 31 (54%)     max: 34.5 fps
051015202530354045Tooltip
Blender - Blender 3.3 Classroom CPU *
min: 175     avg: 203.1     median: 196 (2%)     max: 254 Seconds
Blender - Blender 2.79 BMW27 CPU *
min: 100     avg: 112.4     median: 111 (1%)     max: 137 Seconds
R Benchmark 2.5 - R Benchmark 2.5 *
min: 0.3823     avg: 0.4     median: 0.4 (9%)     max: 0.4121 sec
3DMark 06 - CPU - 3DMark 06 - CPU
19311 Points (41%)
Super Pi mod 1.5 XS 1M - Super Pi mod 1.5 XS 1M *
6.2 s (1%)
Super Pi Mod 1.5 XS 32M - Super Pi mod 1.5 XS 32M *
322.8 s (1%)
3DMark Vantage - 3DM Vant. Perf. CPU no Physx
79200 Points (69%)
3DMark 11 - 3DM11 Performance Physics
min: 19337     avg: 23708     median: 23960 (65%)     max: 27078 Points
3DMark - 3DMark Ice Storm Physics
81602 Points (66%)
3DMark - 3DMark Ice Storm Extreme Physics
77857 Points (63%)
3DMark - 3DMark Ice Storm Unlimited Physics
81621 Points (69%)
3DMark - 3DMark Cloud Gate Physics
16332 Points (41%)
3DMark - 3DMark Fire Strike Standard Physics
min: 31279     avg: 37843     median: 39372 (70%)     max: 42199 Points
3DMark - 3DMark Time Spy CPU
min: 13744     avg: 15379     median: 14805 (62%)     max: 18867 Points
Geekbench 6.2 - Geekbench 6.2 Single-Core
min: 2890     avg: 2920     median: 2919.5 (89%)     max: 2949 points
Geekbench 6.2 - Geekbench 6.2 Multi-Core
min: 15878     avg: 16928     median: 16927.5 (67%)     max: 17977 points
Geekbench 5.5 - Geekbench 5.1 - 5.4 64 Bit Single-Core
min: 1805     avg: 2013     median: 2043 (86%)     max: 2097 points
Geekbench 5.5 - Geekbench 5.1 - 5.4 64 Bit Multi-Core
min: 16776     avg: 19501     median: 20036 (36%)     max: 21853 points
Geekbench 5.0 - Geekbench 5.0 64 Bit Single-Core
min: 1856     avg: 1979     median: 2006 (9%)     max: 2048 points
Geekbench 5.0 - Geekbench 5.0 64 Bit Multi-Core
min: 16846     avg: 18847     median: 18486.5 (58%)     max: 21567 points
Mozilla Kraken 1.1 - Kraken 1.1 Total Score *
min: 451     avg: 466.6     median: 468 (1%)     max: 478 ms
Octane V2 - Octane V2 Total Score
103911 Points (93%)
WebXPRT 4 - WebXPRT 4 Score
min: 279     avg: 290.9     median: 291 (84%)     max: 302 Points
WebXPRT 3 - WebXPRT 3 Score
min: 266     avg: 306.3     median: 318.5 (66%)     max: 346 Points
CrossMark - CrossMark Overall
min: 1592     avg: 1950     median: 1964 (75%)     max: 2139 Points
Power Consumption - Prime95 Power Consumption - external Monitor *
min: 134.5     avg: 188.3     median: 205 (35%)     max: 223 Watt
0153045607590105120135150165180195210225240255Tooltip
Power Consumption - Cinebench R15 Multi Power Consumption - external Monitor *
min: 145     avg: 212.8     median: 204 (37%)     max: 259 Watt
0153045607590105120135150165180195210225240255Tooltip
Power Consumption - Idle Power Consumption - external Monitor *
min: 14.2     avg: 20     median: 15.5 (10%)     max: 35 Watt
0510152025303540Tooltip
Power Consumption - Idle Power Consumption 150cd 1min *
min: 15     avg: 18.5     median: 17 (19%)     max: 27.1 Watt
0510152025Tooltip
Power Consumption - Cinebench R15 Multi Power Efficiency - external Monitor
min: 18.8     avg: 21.5     median: 21.4 (16%)     max: 25 Points per Watt
- Range of benchmark values for this graphics card
- Average benchmark values for this graphics card
* Smaller numbers mean a higher performance

v1.26
log 26. 17:02:50

#0 no ids found in url (should be separated by "_") +0s ... 0s

#1 not redirecting to Ajax server +0s ... 0s

#2 did not recreate cache, as it is less than 5 days old! Created at Thu, 25 Apr 2024 05:38:32 +0200 +0.001s ... 0.001s

#3 no comparison url found in template nbc.compare_page_2 needed +0.018s ... 0.019s

#4 no comparison url found in template nbc.compare_page_2 needed +0s ... 0.02s

#5 no comparison url found in template nbc.compare_page_2 needed +0s ... 0.02s

#6 no comparison url found in template nbc.compare_page_2 needed +0s ... 0.02s

#7 no comparison url found in template nbc.compare_page_2 needed +0s ... 0.02s

#8 no comparison url found in template nbc.compare_page_2 needed +0s ... 0.021s

#9 no comparison url found in template nbc.compare_page_2 needed +0s ... 0.021s

#10 no comparison url found in template nbc.compare_page_2 needed +0s ... 0.021s

#11 composed specs +0.001s ... 0.022s

#12 did output specs +0s ... 0.022s

#13 getting avg benchmarks for device 14671 +0.015s ... 0.037s

#14 got single benchmarks 14671 +0.033s ... 0.07s

#15 got avg benchmarks for devices +0s ... 0.07s

#16 min, max, avg, median took s +0.699s ... 0.77s

#17 no comparison url found in template nbc.compare_page_2 needed +0s ... 0.77s

#18 return log +0s ... 0.77s

Reviews for the Intel Core i9-13950HX processor

微星 Raider GE68 HX 13VF 笔记本电脑评测:彻底改变设计

微星 Raider GE68 HX 13VF 笔记本电脑评测:彻底改变设计

微星将 17 英寸 GE78 的设计加倍运用到更小的 16 英寸 GE68 上。新的外观可能并不适合所有人,但其性能令人钦佩,CPU 和 GPU 是今年所有游戏笔记本电脑中速度最快的。...
Intel Core i9-13950HX | NVIDIA GeForce RTX 4060 Laptop GPU | 16.00" | 2.7 kg
惠普 ZBook Fury 16 G10 移动工作站评测:100 瓦 Nvidia RTX 5000 Ada

惠普 ZBook Fury 16 G10 移动工作站评测:100 瓦 Nvidia RTX 5000 Ada

从外观上看变化不大,但 Raptor Lake-HX 和 Nvidia RTX Ada 在内部的升级意义重大,非常值得那些希望在不久的将来进行升级的强大用户使用。...
Intel Core i9-13950HX | NVIDIA RTX 5000 Ada Generation Laptop GPU | 16.00" | 2.6 kg
雷蛇刀锋16早期2023与RTX 4090评测

Razer Blade 16 Early 2023 RTX 4090评论:酷睿i9-13950HX巨兽,全球首款双模迷你LED UHD+显示屏

Razer Blade 16 Early 2023是为对旗舰型16:10 16英寸游戏笔记本电脑感兴趣的玩家提供的新产品。刀锋16配备了桌面级的英特尔猛禽湖-HX酷睿i9-13950HX,175瓦的英伟达GeForce RTX 4090笔记本GPU,以及世界上第一个双模式迷你LED显示屏,它试图在今年挑战一些最强大的巨...
Intel Core i9-13950HX | NVIDIA GeForce RTX 4090 Laptop GPU | 16.00" | 2.5 kg
MSI Raider GE78 HX 13VH笔记本电脑评测。13代酷睿i9-13950HX和GeForce RTX 4080的升级版

MSI Raider GE78 HX 13VH笔记本电脑评测。13代酷睿i9-13950HX和GeForce RTX 4080的升级版

你是否已经厌倦了这些天所有的简约笔记本设计?微星在其最新的GE78上进行了新的尝试,将复古的美学与最新的技术混合在一起,形成了一个更加醒目的机箱。...
Intel Core i9-13950HX | NVIDIA GeForce RTX 4080 Laptop GPU | 17.00" | 3 kg
Razer Blade 18笔记本电脑回顾。比许多17英寸游戏笔记本更小

Razer Blade 18笔记本电脑回顾。比许多17英寸游戏笔记本更小

宽敞的18英寸Blade 18在市场上被作为台式机的替代品,没有台式机的外形因素。然而,你必须真正重视大屏幕,因为性能和功能与更小、更便携的Blade 16几乎没有区别。...
Intel Core i9-13950HX | NVIDIA GeForce RTX 4070 Laptop GPU | 18.00" | 3 kg

MSI Titan GT77 HX 13VI: NVIDIA GeForce RTX 4090 Laptop GPU, 17.30", 3.5 kg
  Review » Nvidia Ada RTX 40笔记本GPU分析:175W RTX 4090笔记本GPU在性能和功率效率方面超过了350W RTX 3090

Razer Blade 16 Early 2023: NVIDIA GeForce RTX 4080 Laptop GPU, 16.00", 2.4 kg
  Review » Nvidia Ada RTX 40笔记本GPU分析:175W RTX 4090笔记本GPU在性能和功率效率方面超过了350W RTX 3090

MSI Titan GT77 HX 13VI: NVIDIA GeForce RTX 4090 Laptop GPU, 17.30", 3.5 kg
  Review » 微星Titan GT77 HX 13V评测--带RTX 4090和Core i9-13950HX的终极游戏笔记本电脑

Razer Blade 16 Early 2023: NVIDIA GeForce RTX 4080 Laptop GPU, 16.00", 2.4 kg
  Review » 移动GeForce RTX 4080首次亮相。Razer Blade 16 Early 2023笔记本电脑评测

HP ZBook Fury 16 G10: NVIDIA RTX 5000 Ada Generation Laptop GPU, 16.00", 2.6 kg
  External Review » HP ZBook Fury 16 G10

MSI Vector GP68 HX 13VH: NVIDIA GeForce RTX 4080 Laptop GPU, 16.00", 2.7 kg
  External Review » MSI Vector GP68 HX 13VH

MSI Raider GE68 HX 13VF: NVIDIA GeForce RTX 4060 Laptop GPU, 16.00", 2.7 kg
  External Review » MSI Raider GE68 HX 13VF

Razer Blade 16 Early 2023 RTX 4060: NVIDIA GeForce RTX 4060, 16.00", 2.5 kg
  External Review » Razer Blade 16 Early 2023 RTX 4060

MSI Creator Z17 HX Studio A13VGT: NVIDIA GeForce RTX 4070 Laptop GPU, 17.00", 2.5 kg
  External Review » MSI Creator Z17 HX Studio A13VGT

Razer Blade 18 2023 RTX 4060: NVIDIA GeForce RTX 4060 Laptop GPU, 18.00", 3.2 kg
  External Review » Razer Blade 18 2023 RTX 4060

Razer Blade 16 Early 2023 RTX 4070: NVIDIA GeForce RTX 4070 Laptop GPU, 16.00", 2.5 kg
  External Review » Razer Blade 16 Early 2023 RTX 4070

MSI Raider GE68 HX 13VG: NVIDIA GeForce RTX 4070 Laptop GPU, 15.60", 2.7 kg
  External Review » MSI Raider GE68 HX 13VG

MSI GE78HX 13VH-070US: NVIDIA GeForce RTX 4080 Laptop GPU, 17.00", 3 kg
  External Review » MSI GE78HX 13VH-070US

Razer Blade 18 2023, RTX 4080: NVIDIA GeForce RTX 4080 Laptop GPU, 18.00", 3.2 kg
  External Review » Razer Blade 18 2023, RTX 4080

Razer Blade 18 2023, RTX 4090: NVIDIA GeForce RTX 4090 Laptop GPU, 18.00", 3.2 kg
  External Review » Razer Blade 18 2023, RTX 4090

MSI Titan GT77 HX 13VI: NVIDIA GeForce RTX 4090 Laptop GPU, 17.30", 3.5 kg
  External Review » MSI Titan GT77 HX 13VI

Razer Blade 16 Early 2023 RTX 4090: NVIDIA GeForce RTX 4090 Laptop GPU, 16.00", 2.5 kg
  External Review » Razer Blade 16 Early 2023 RTX 4090

Razer Blade 18 RTX 4070: NVIDIA GeForce RTX 4070 Laptop GPU, 18.00", 3 kg
  External Review » Razer Blade 18 RTX 4070

Razer Blade 16 Early 2023: NVIDIA GeForce RTX 4080 Laptop GPU, 16.00", 2.4 kg
  External Review » Razer Blade 16 Early 2023

   » 移动GeForce RTX 4080比桌面RTX 4080慢35%,这对消费者来说可能是个问题

Please share our article, every link counts!

»移动处理器 对比
所有移动处理器的对比


»移动处理器 基准测试
所有已有笔记本电脑中使用的处理器的基准测试成绩 (桌面处理器或移动处理器)

Other CPUs of the series Raptor Lake-HX

» Intel Core i9-14900HX
   24x 1.6 GHz - 5.8 GHz
» Intel Core i9-13980HX
   24x 1.6 GHz - 5.6 GHz
» Intel Core i9-13950HX
   24x 1.6 GHz - 5.5 GHz
» Intel Core i9-13900HX
   24x 1.6 GHz - 5.4 GHz
» Intel Core i7-14700HX
   20x 3.9 GHz - 5.5 GHz
» Intel Core i7-13850HX
   20x 1.5 GHz - 5.3 GHz
» Intel Core i7-14650HX
   16x 1.6 GHz - 5.2 GHz
» Intel Core i7-13700HX
   16x 1.5 GHz - 5 GHz
» Intel Core i5-14500HX
   14x 1.8 GHz - 5 GHz
» Intel Core i7-13650HX
   14x 1.9 GHz - 4.9 GHz
» Intel Core i5-13600HX
   14x 1.9 GHz - 4.8 GHz
» Intel Core i5-13500HX
   14x 1.8 GHz - 4.7 GHz
» Intel Core i5-14450HX
   10x 1.8 GHz - 4.8 GHz
» Intel Core i5-13450HX
   10x 1.8 GHz - 4.6 GHz

Surrounding CPUs

+ AMD Ryzen 9 7945HX3D
   16x 2.3 GHz - 5.4 GHz
+ AMD Ryzen 9 7945HX
   16x 2.5 GHz - 5.4 GHz
+ Intel Core i9-14900HX
   24x 1.6 GHz - 5.8 GHz
+ Intel Core i9-13980HX
   24x 1.6 GHz - 5.6 GHz
» Intel Core i9-13950HX
   24x 1.6 GHz - 5.5 GHz
- Intel Core i9-13900HX
   24x 1.6 GHz - 5.4 GHz
- AMD Ryzen 9 7940HX
   16x 2.4 GHz - 5.2 GHz
- AMD Ryzen 9 7845HX
   12x 3 GHz - 5.2 GHz
- Intel Core i7-14700HX
   20x 3.9 GHz - 5.5 GHz
- AMD Ryzen 9 7840HX
   12x 2.9 GHz - 5.1 GHz
> Notebookcheck中文版(NBC中国) > FAQ / 小提示/ 技术参数 > 移动处理器 —— 基准测试成绩列表 > Intel Raptor Lake-HX i9-13950HX 笔记本处理器
Klaus Hinum (Update: 2023-11-26)