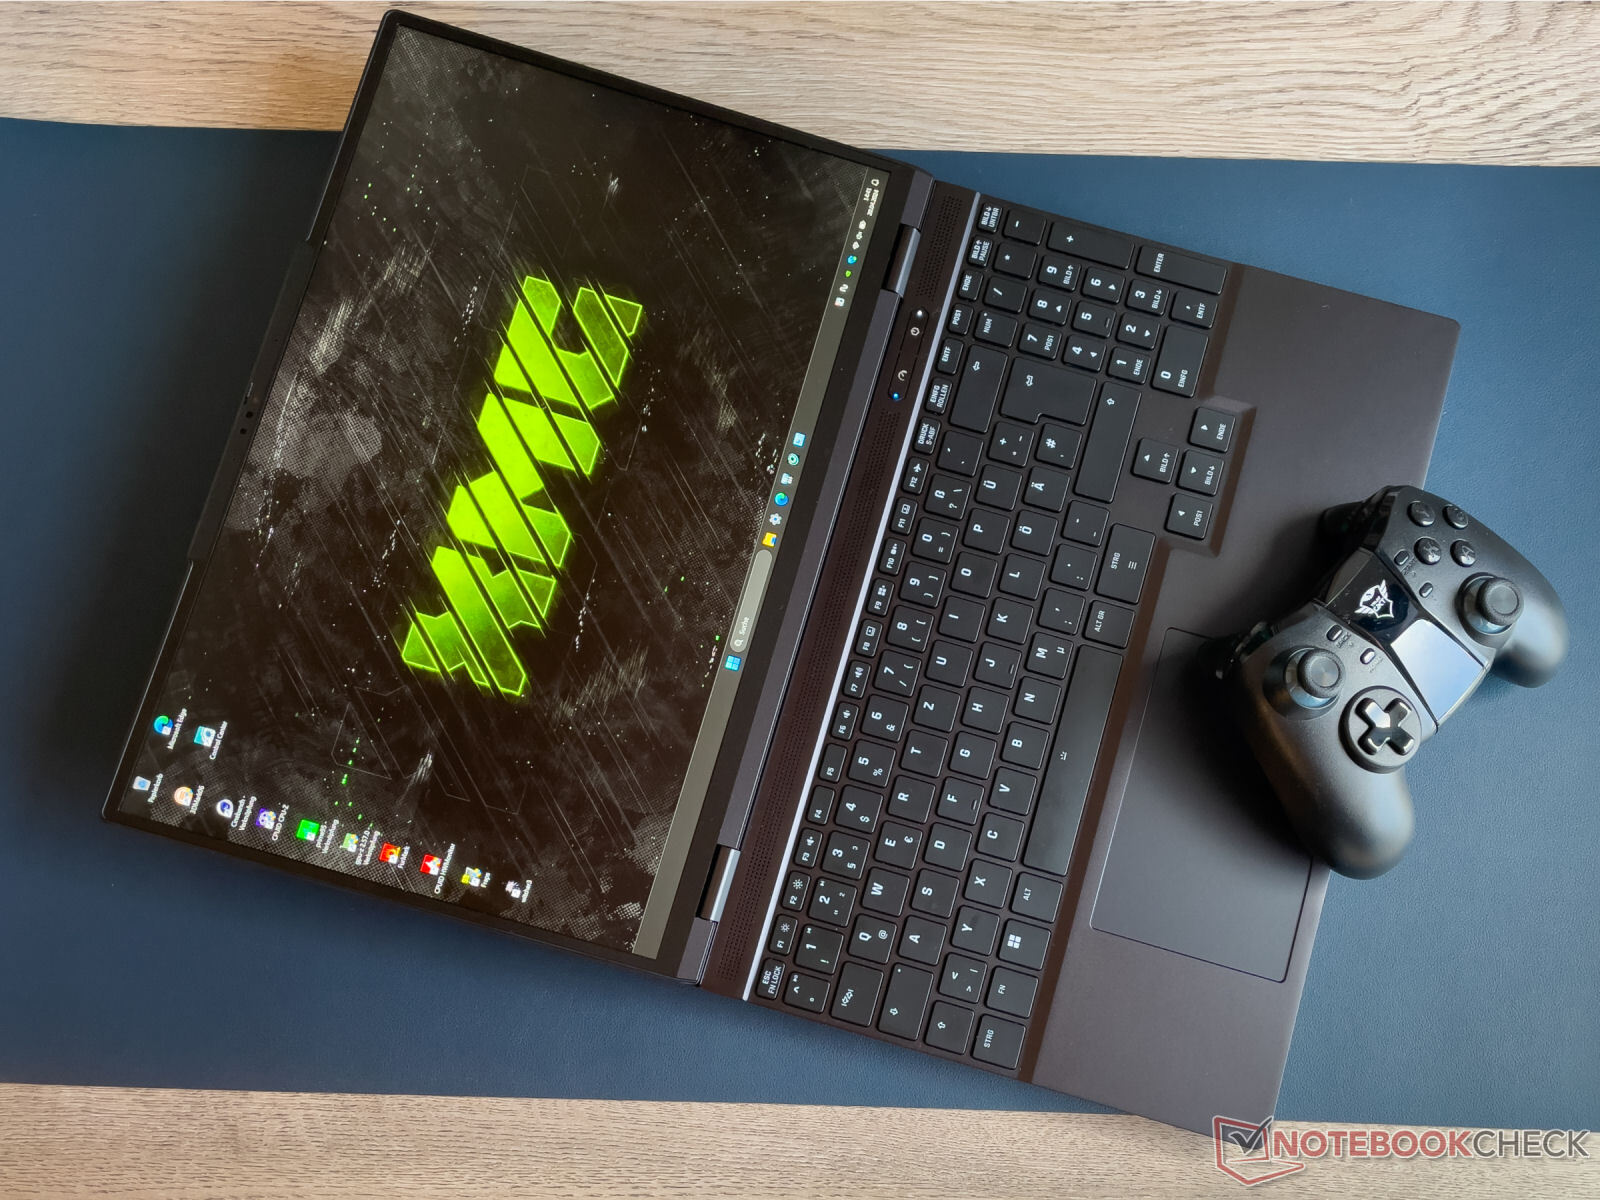
XMG Fusion 15(提前 24 天)评测:专为游戏玩家和创作者打造的紧凑型 RTX 4070 笔记本电脑
XMG Fusion 15(早期 24)是一款面向游戏玩家和创作者的 15.3 英寸笔记本电脑,基于同方的裸机(GM5IX7A)。Raptor Lake、Ada Lovelace 和 32 GB 内存为这款笔记本电脑提供了流媒体、渲染和游戏功能。目前这款产品的售价约为 2,500 美元。竞争对手包括 Aorus 16X (2024), Alienware m16 R2, HP Omen Transcend 16和 联想Legion Pro 5 16IRX9.
潜在的竞争对手比较
Rating | Date | Model | Weight | Height | Size | Resolution | Price |
|---|---|---|---|---|---|---|---|
| 88.9 % v7 (old) | 05 / 2024 | Schenker XMG Fusion 15 (Early 24) i9-14900HX, GeForce RTX 4070 Laptop GPU | 2.1 kg | 21.9 mm | 15.30" | 2560x1600 | |
| 87.4 % v7 (old) | 04 / 2024 | Aorus 16X 2024 i9-14900HX, GeForce RTX 4070 Laptop GPU | 2.3 kg | 20 mm | 16.00" | 2560x1600 | |
| 90.2 % v7 (old) | 03 / 2024 | Alienware m16 R2 Ultra 7 155H, GeForce RTX 4070 Laptop GPU | 2.5 kg | 23.5 mm | 16.00" | 2560x1600 | |
| 88.4 % v7 (old) | 02 / 2024 | HP Omen Transcend 16-u1095ng i9-14900HX, GeForce RTX 4070 Laptop GPU | 2.3 kg | 20 mm | 16.00" | 2560x1600 | |
| 89.3 % v7 (old) | 04 / 2024 | Lenovo Legion Pro 5 16IRX9 i9-14900HX, GeForce RTX 4070 Laptop GPU | 2.5 kg | 26.95 mm | 16.00" | 2560x1600 |
外壳 - XMG 笔记本电脑配有铝制外壳
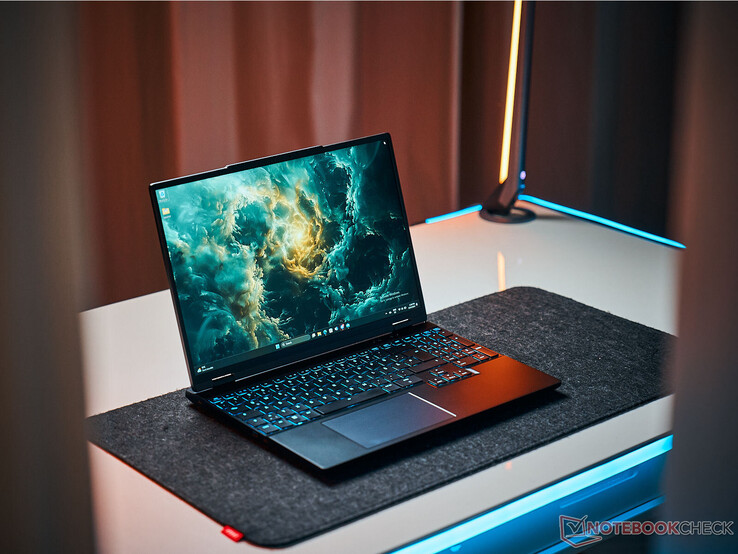
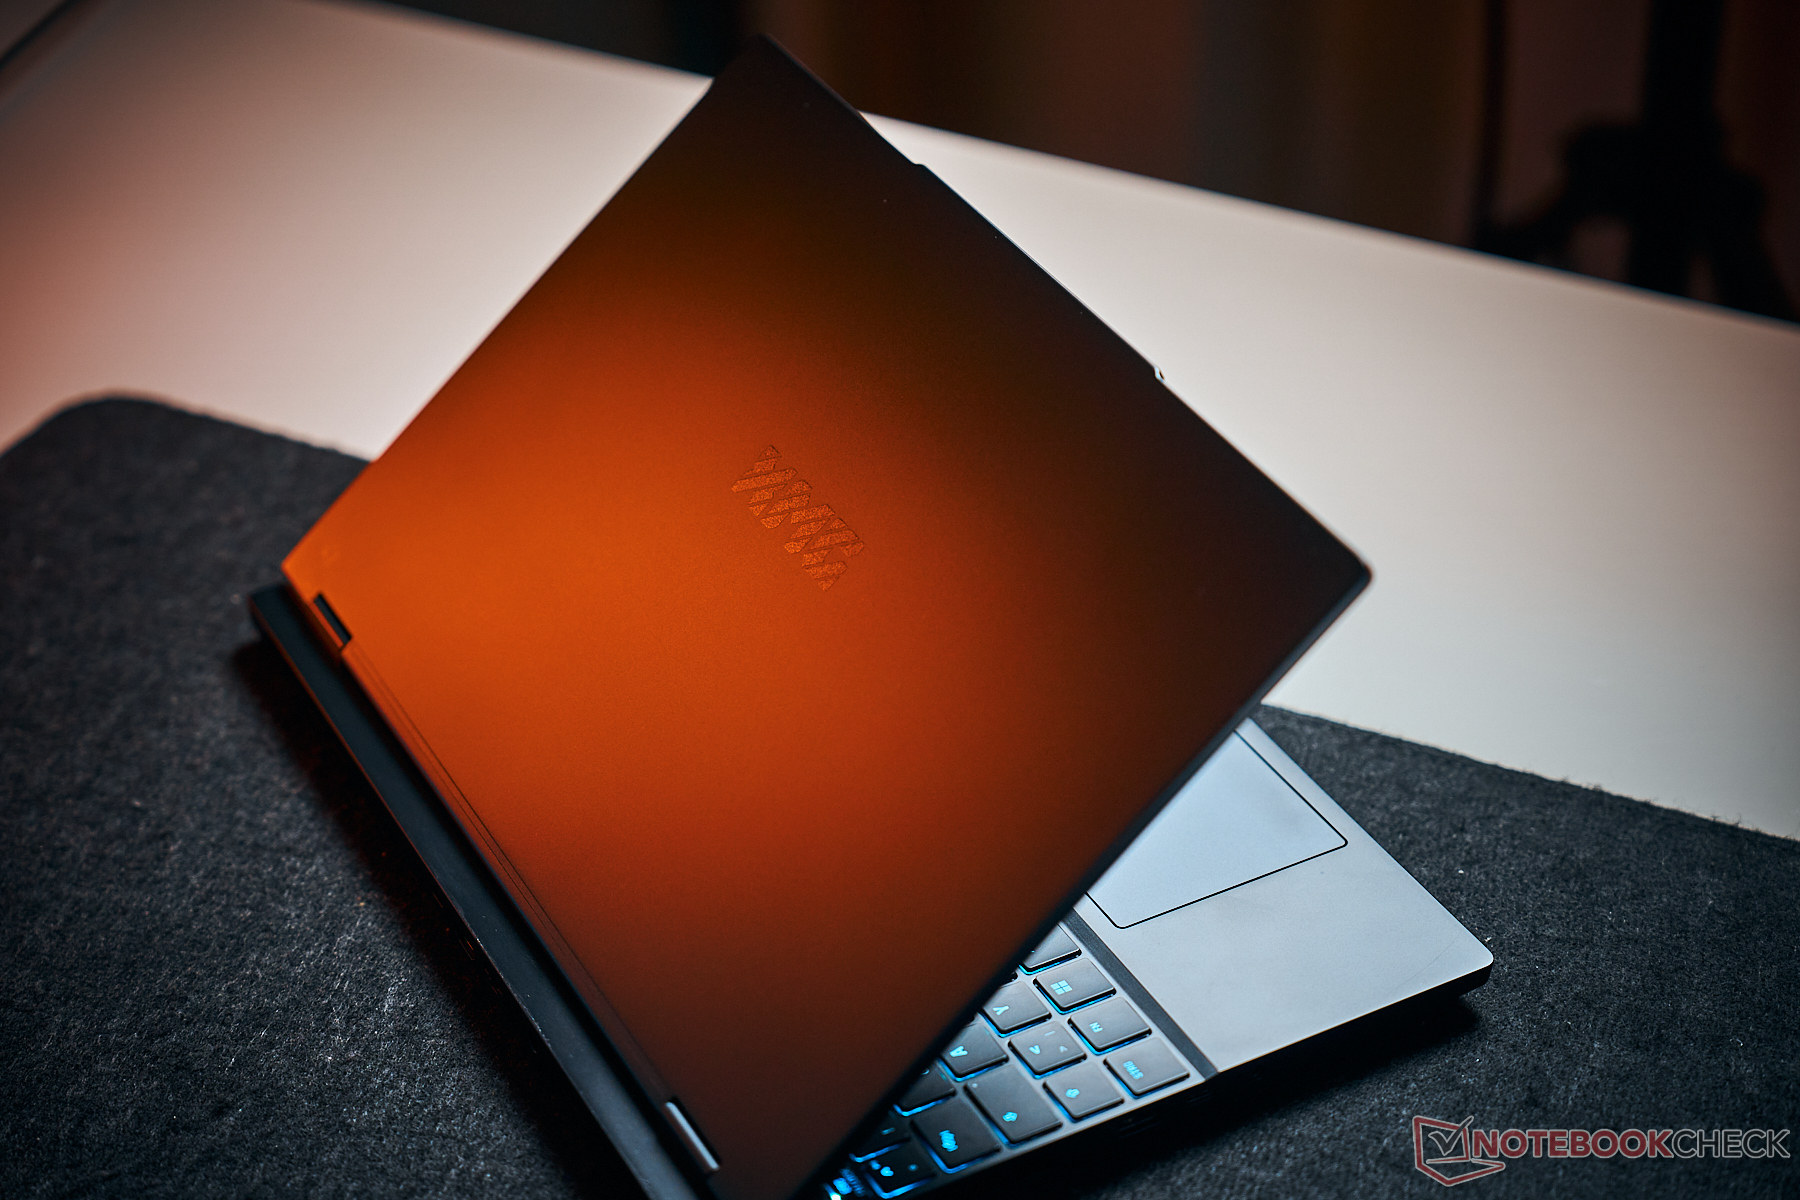
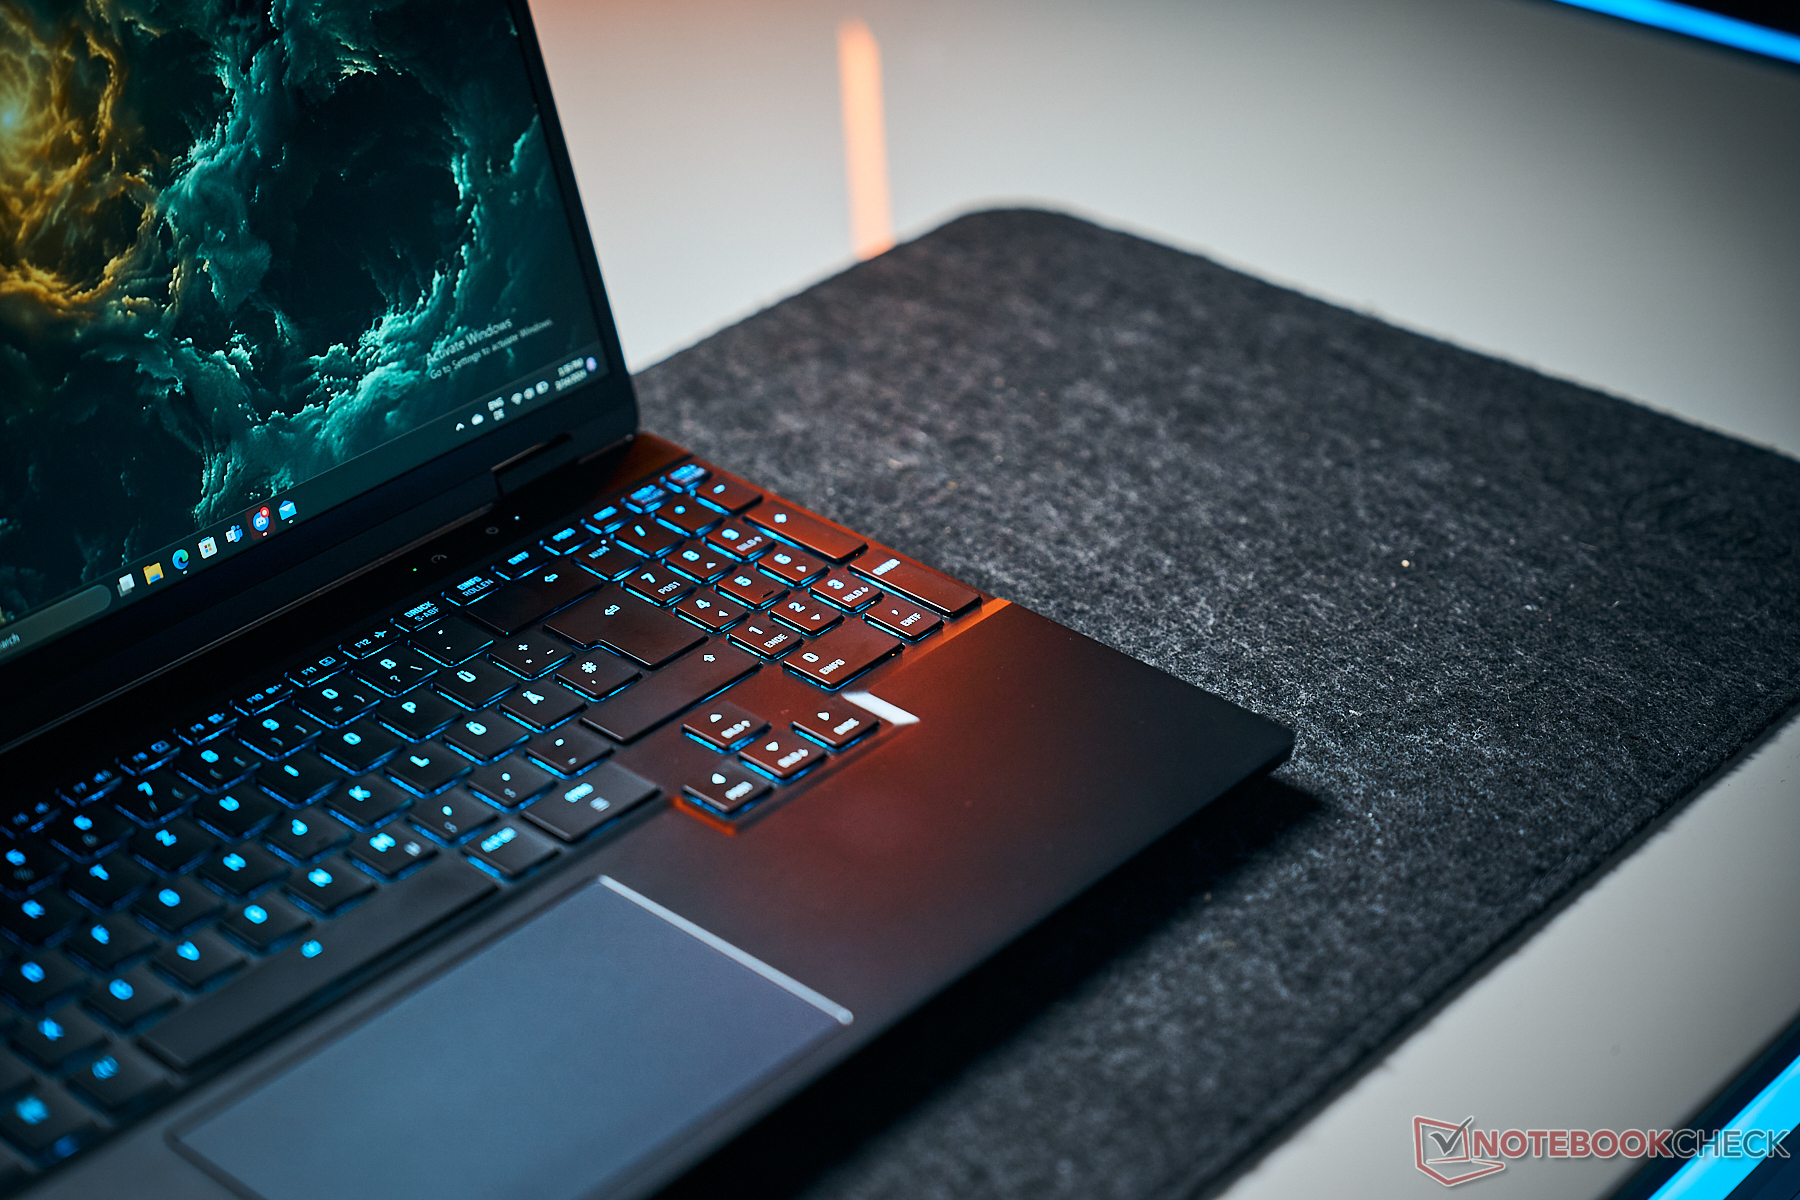
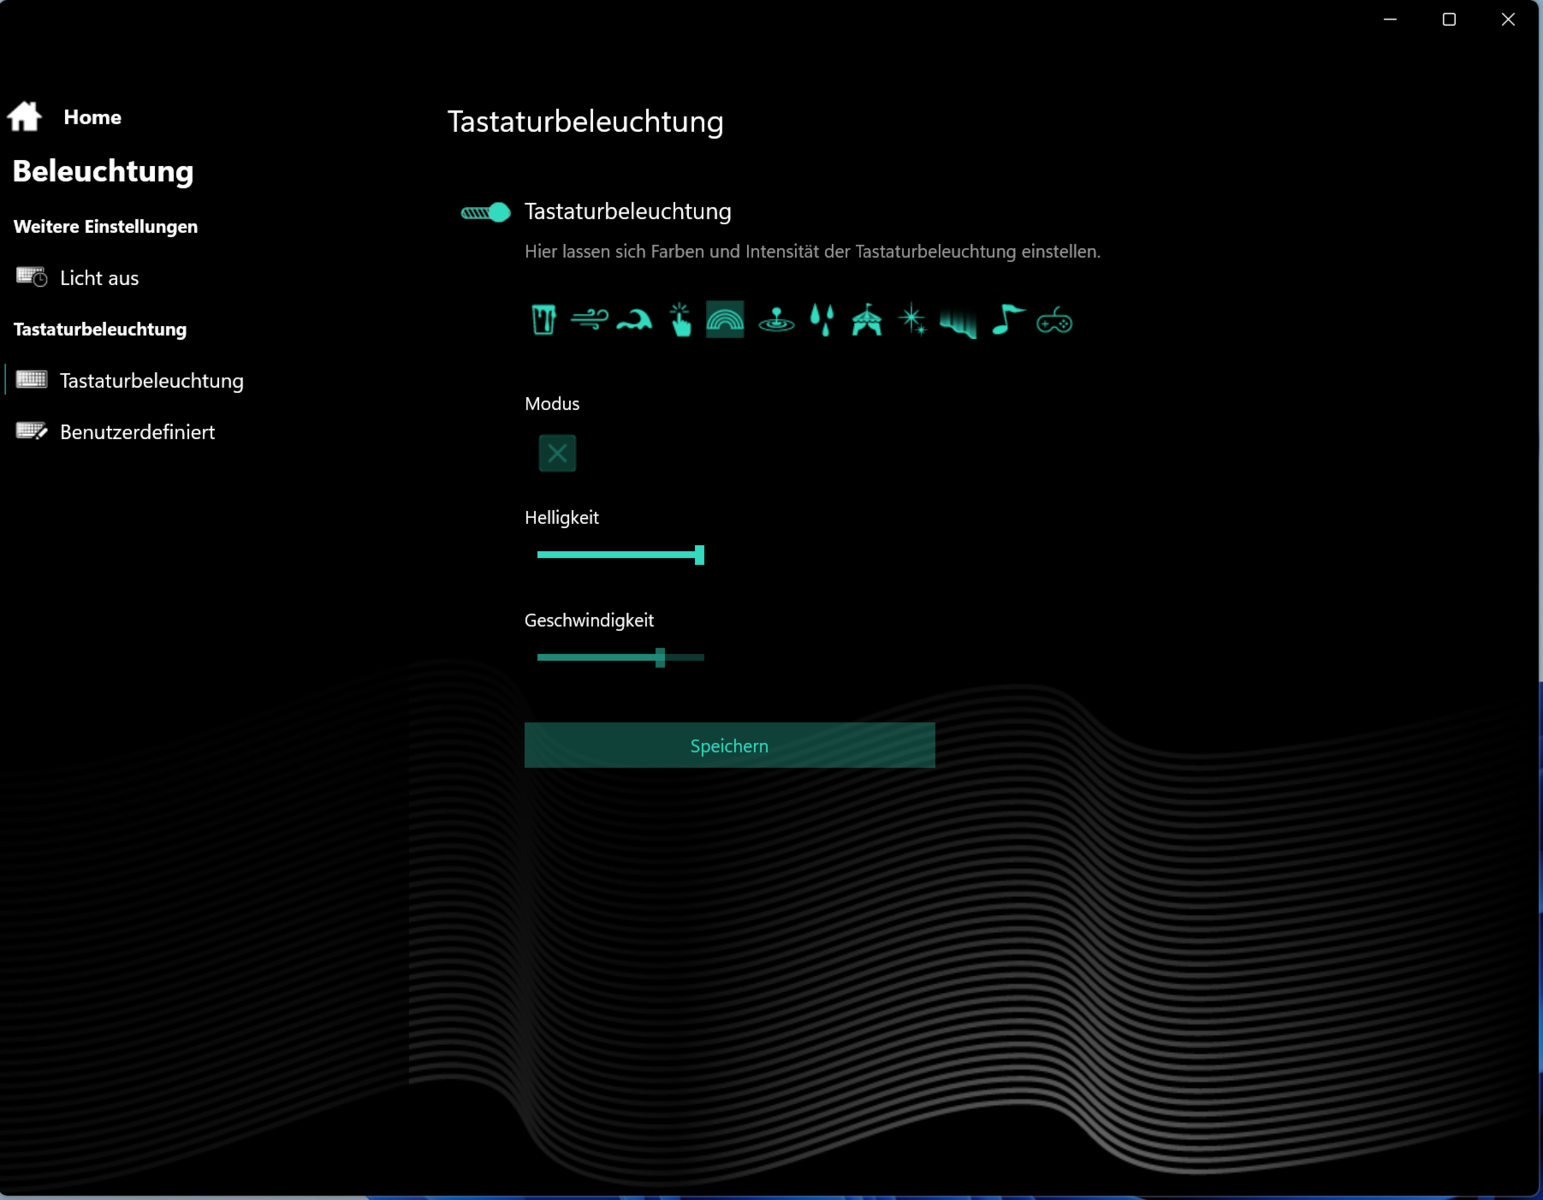
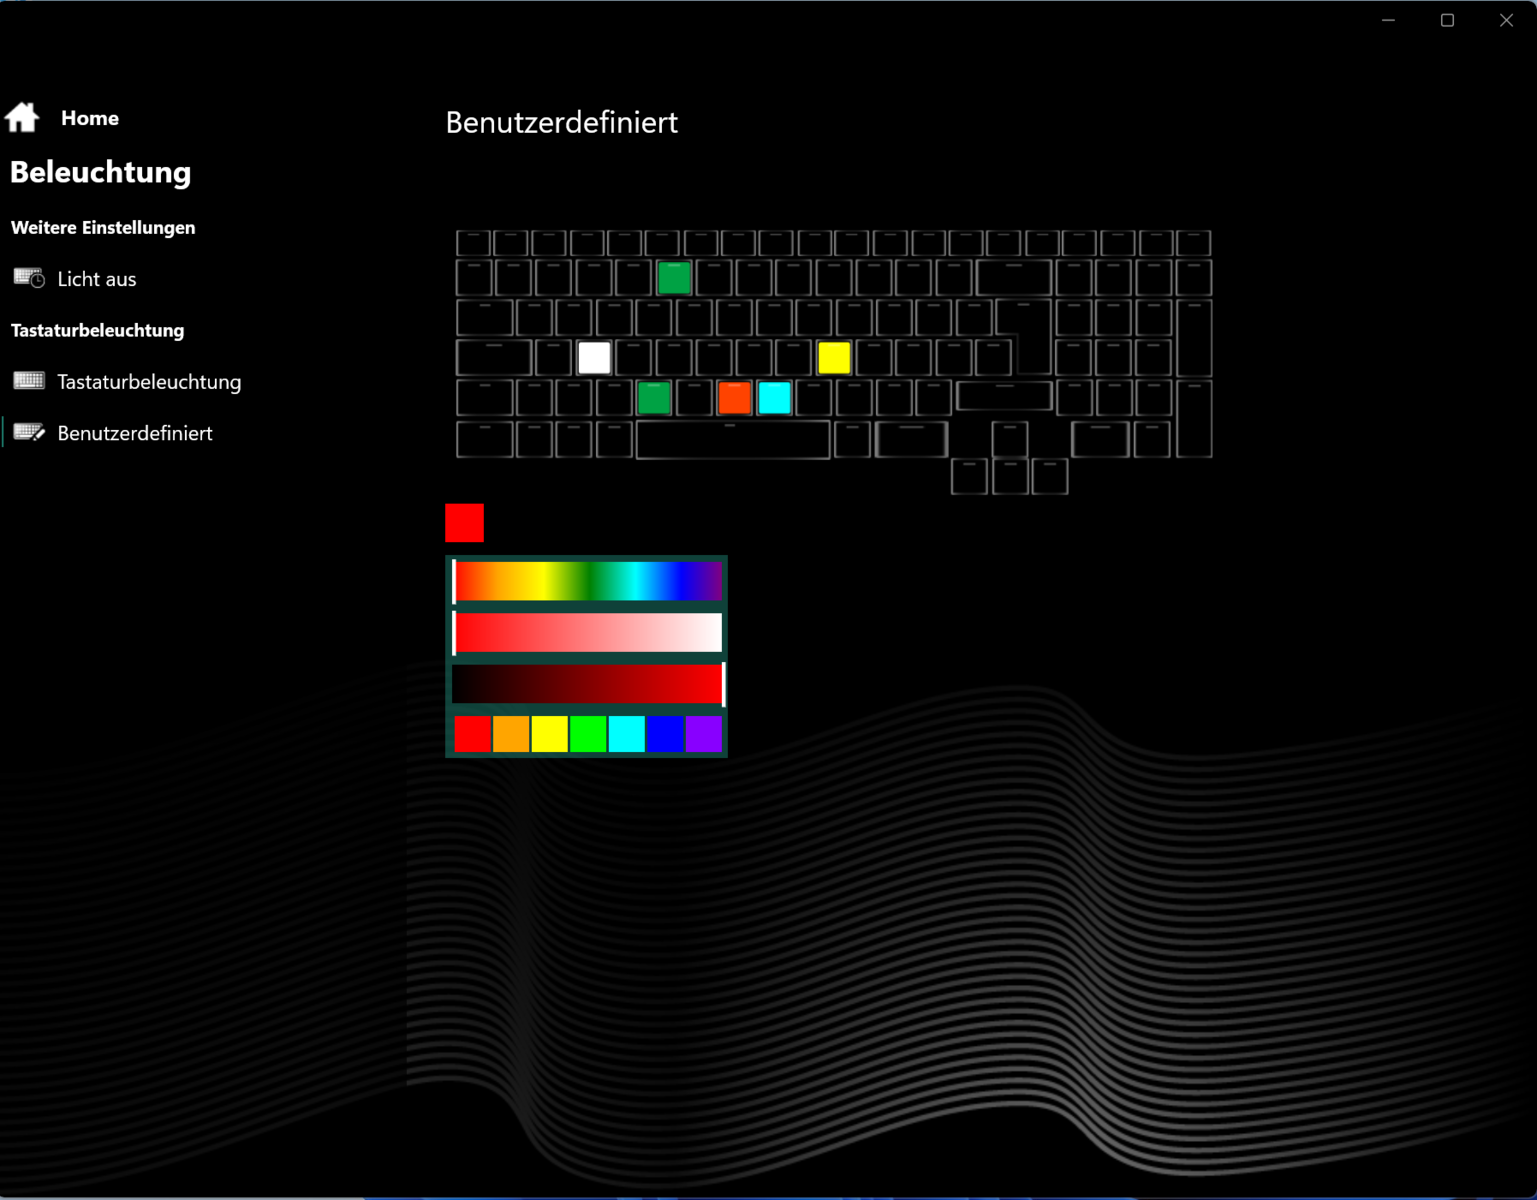
申克采用了光滑的哑光黑色铝制外壳,表面光滑。这款笔记本电脑没有任何引人注目的设计元素或 LED 灯带,只有键盘背光(RGB)为设备增添了几分色彩。在专业环境中,这款笔记本电脑几乎不会引人注目。
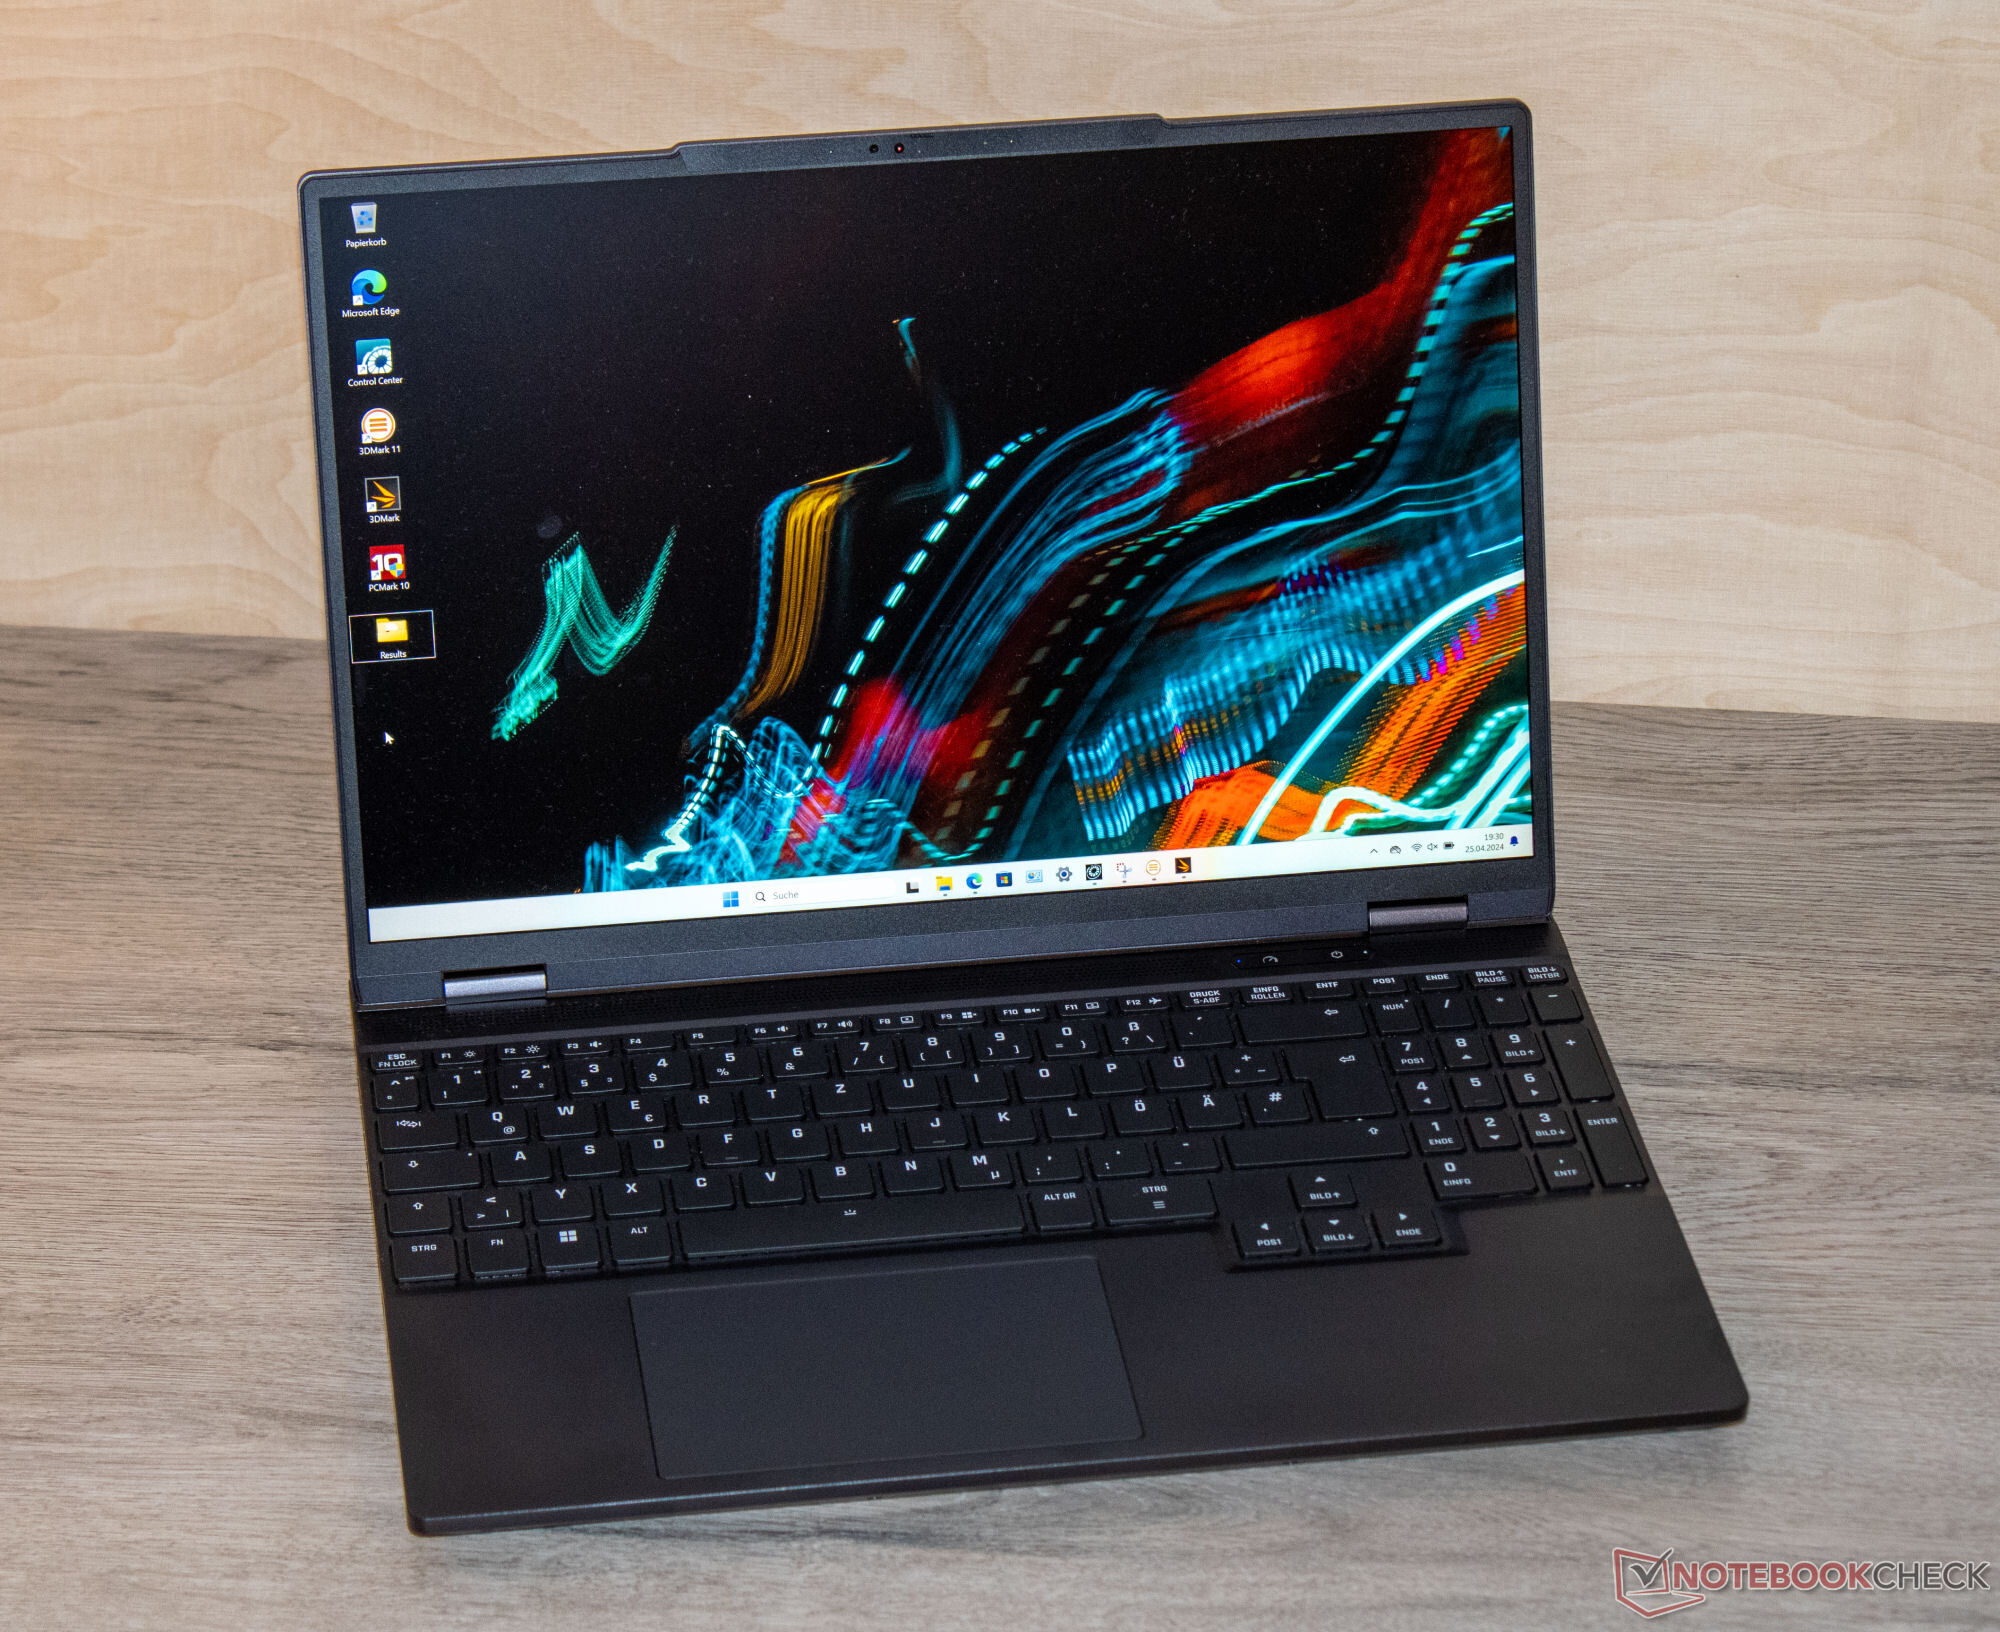
我们注意到没有任何材料突出,所有缝隙都完全吻合。底座和盖子可以轻微扭动,但这并不奇怪。按压盖子的背面也不会产生任何画面变化。坚硬的铰链允许最大打开角度为 180 度。单手即可打开。
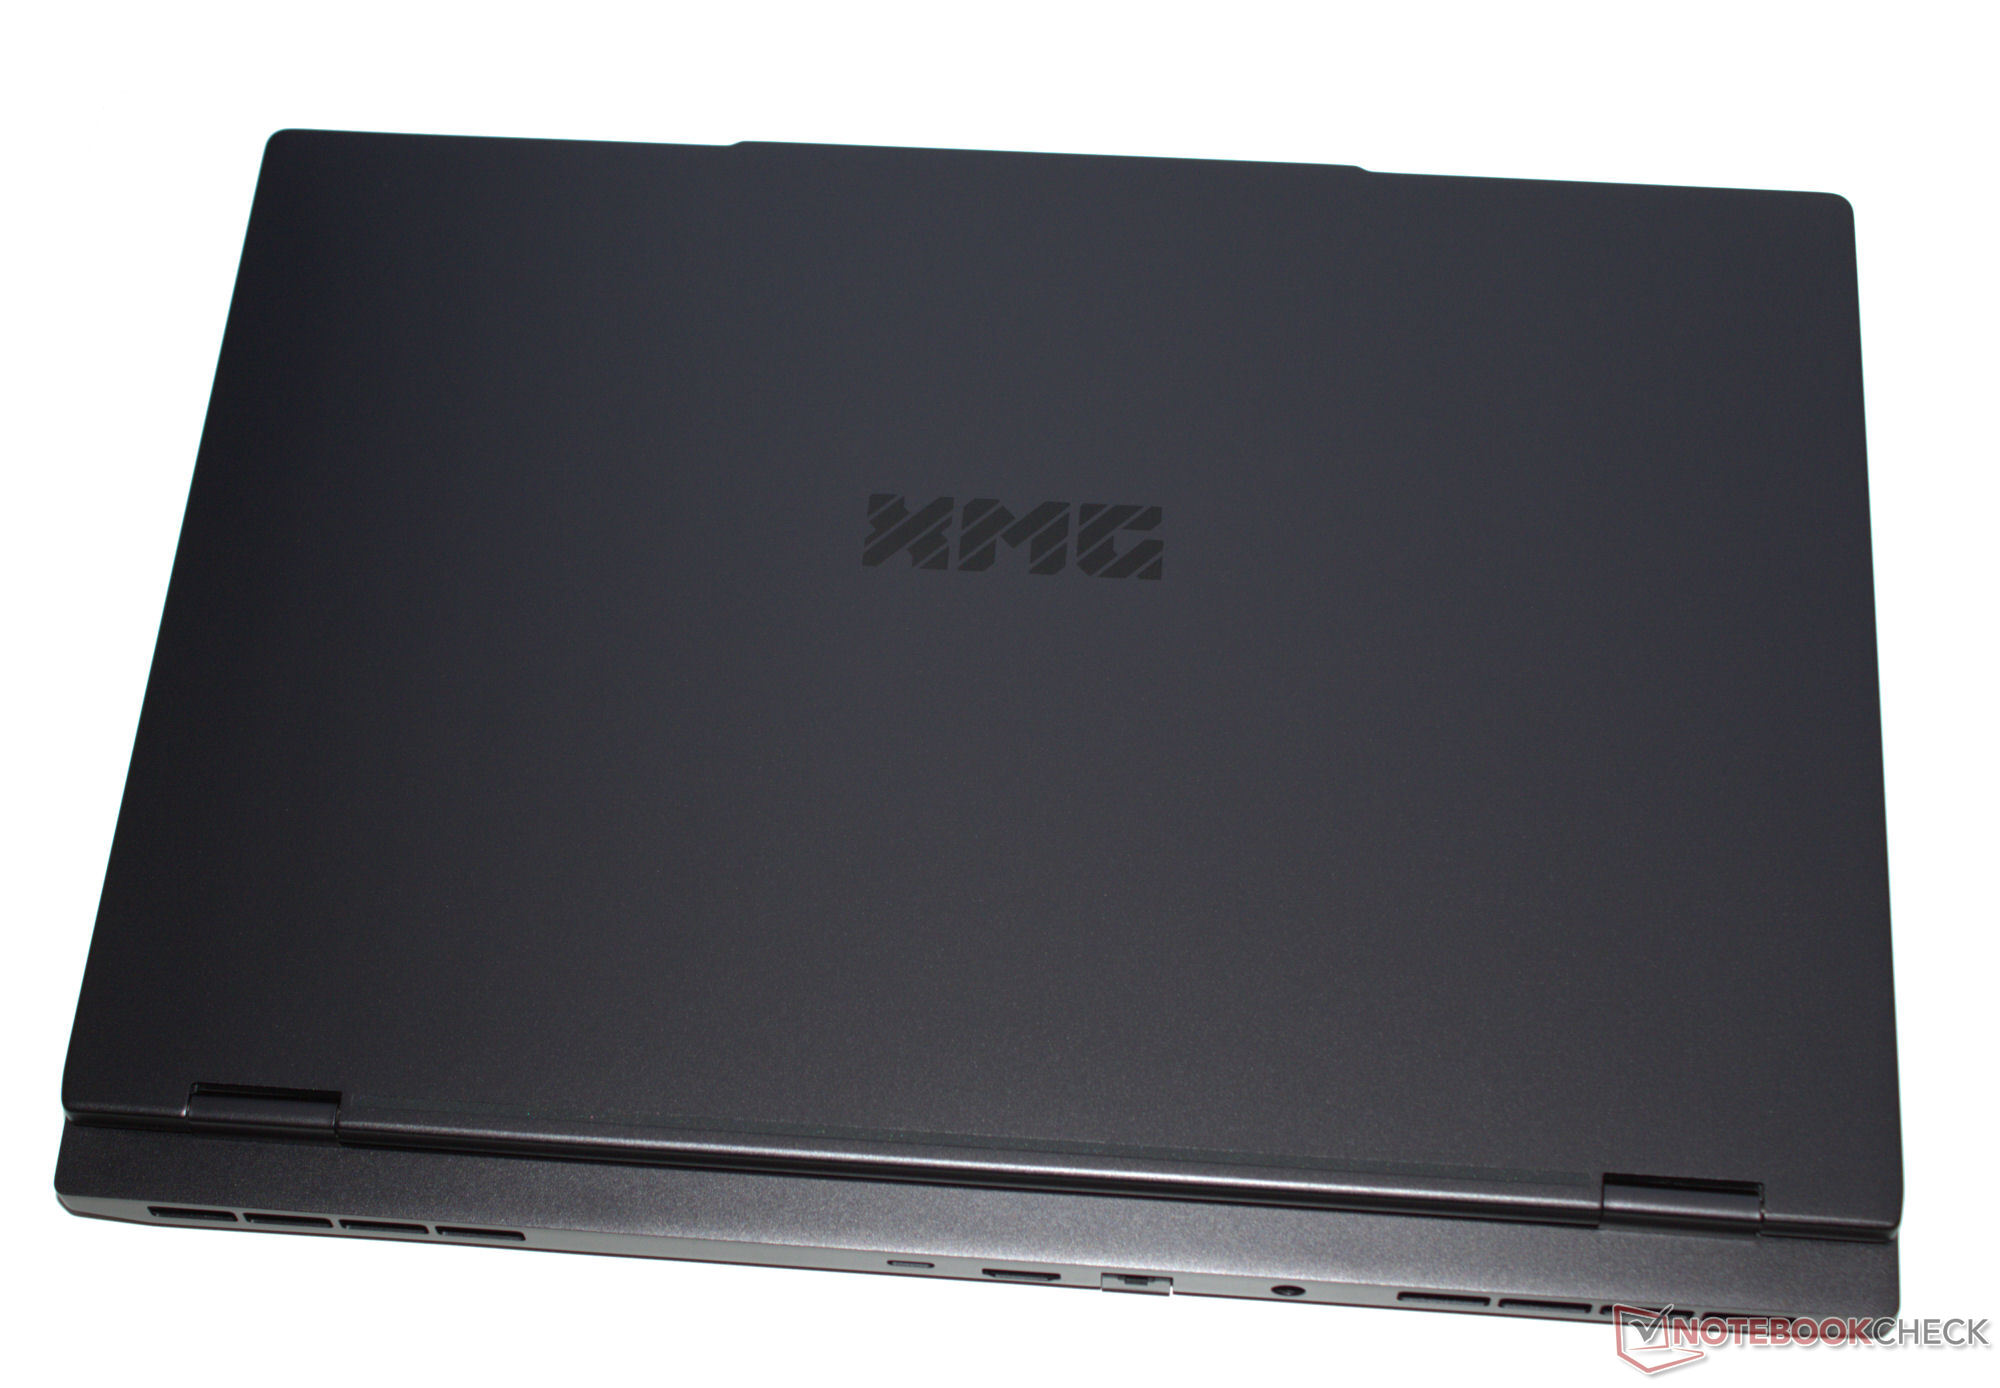
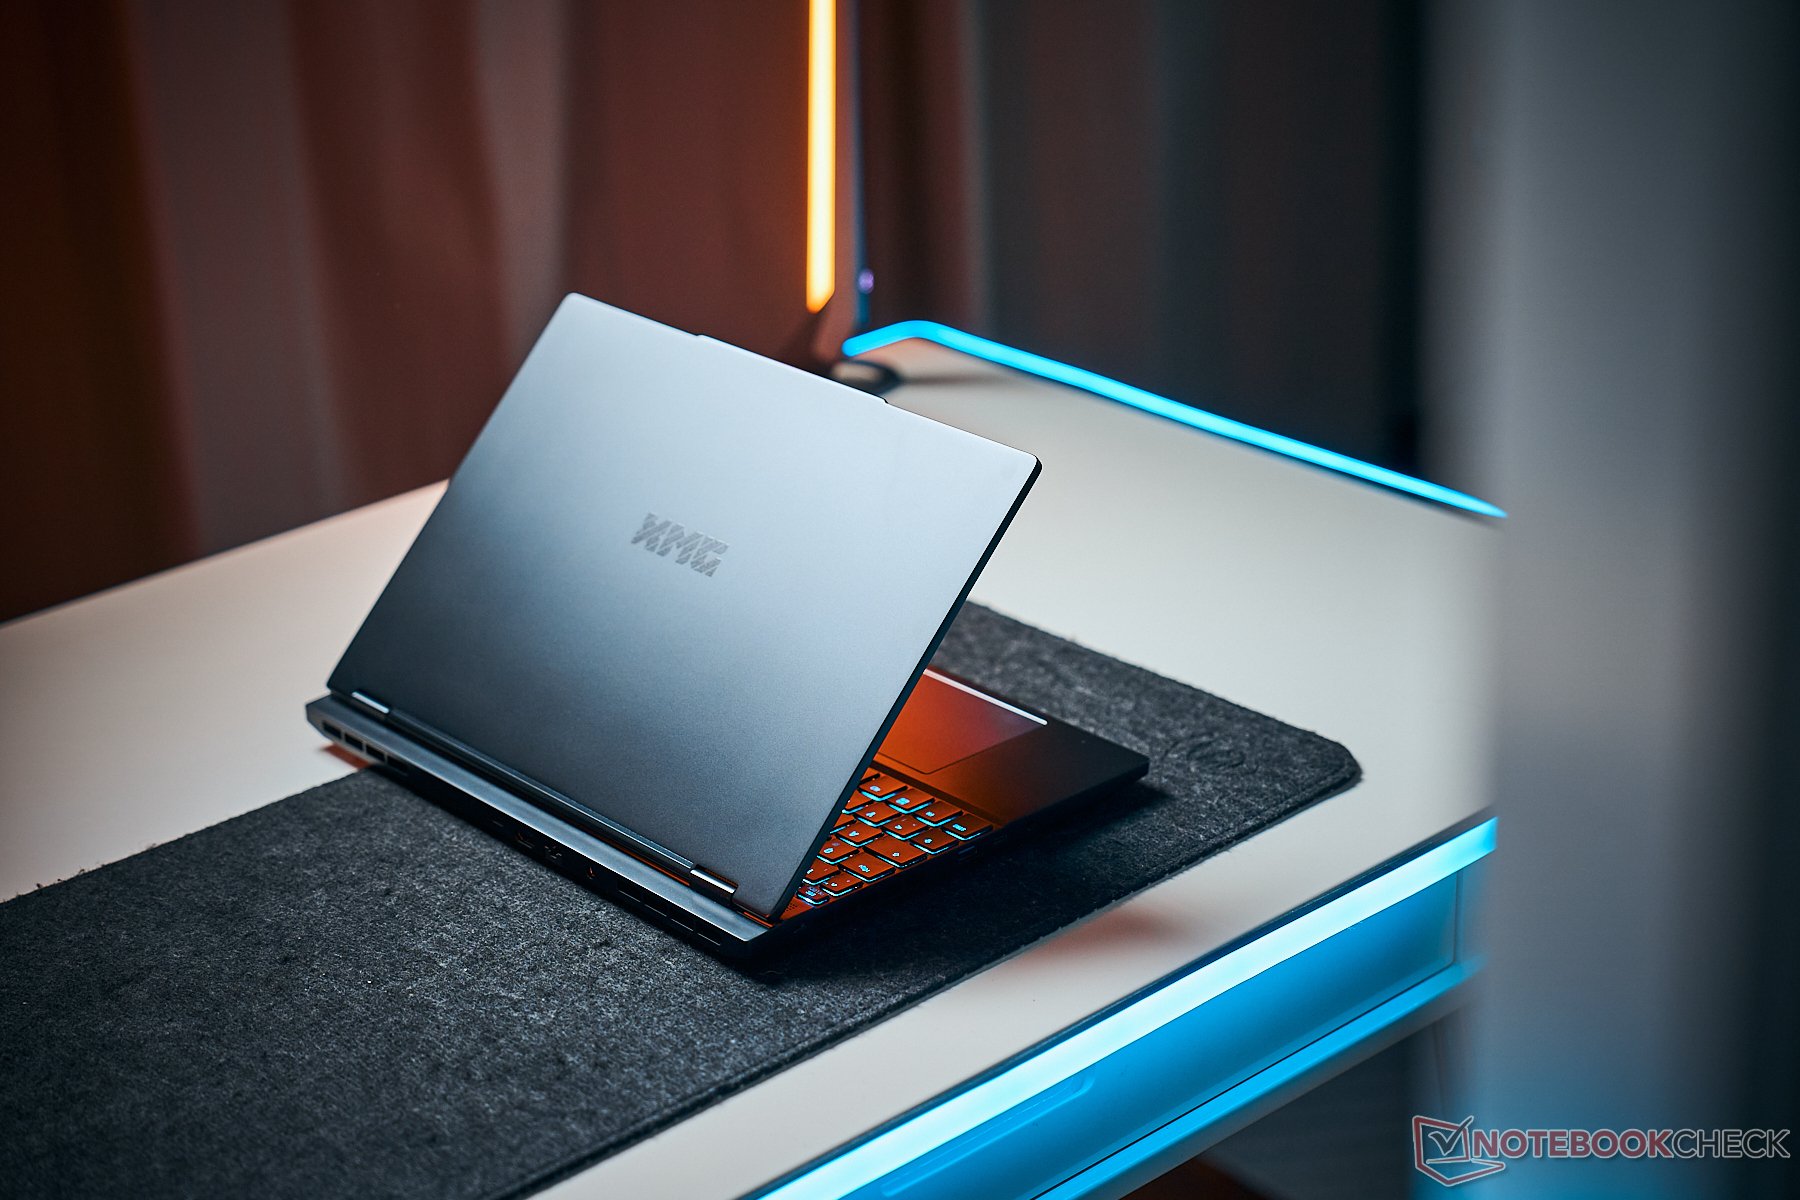
毫不奇怪:在同类产品中,Fusion 是最小巧的设备,显示屏最小。同时,它也是所有设备中最轻巧的。
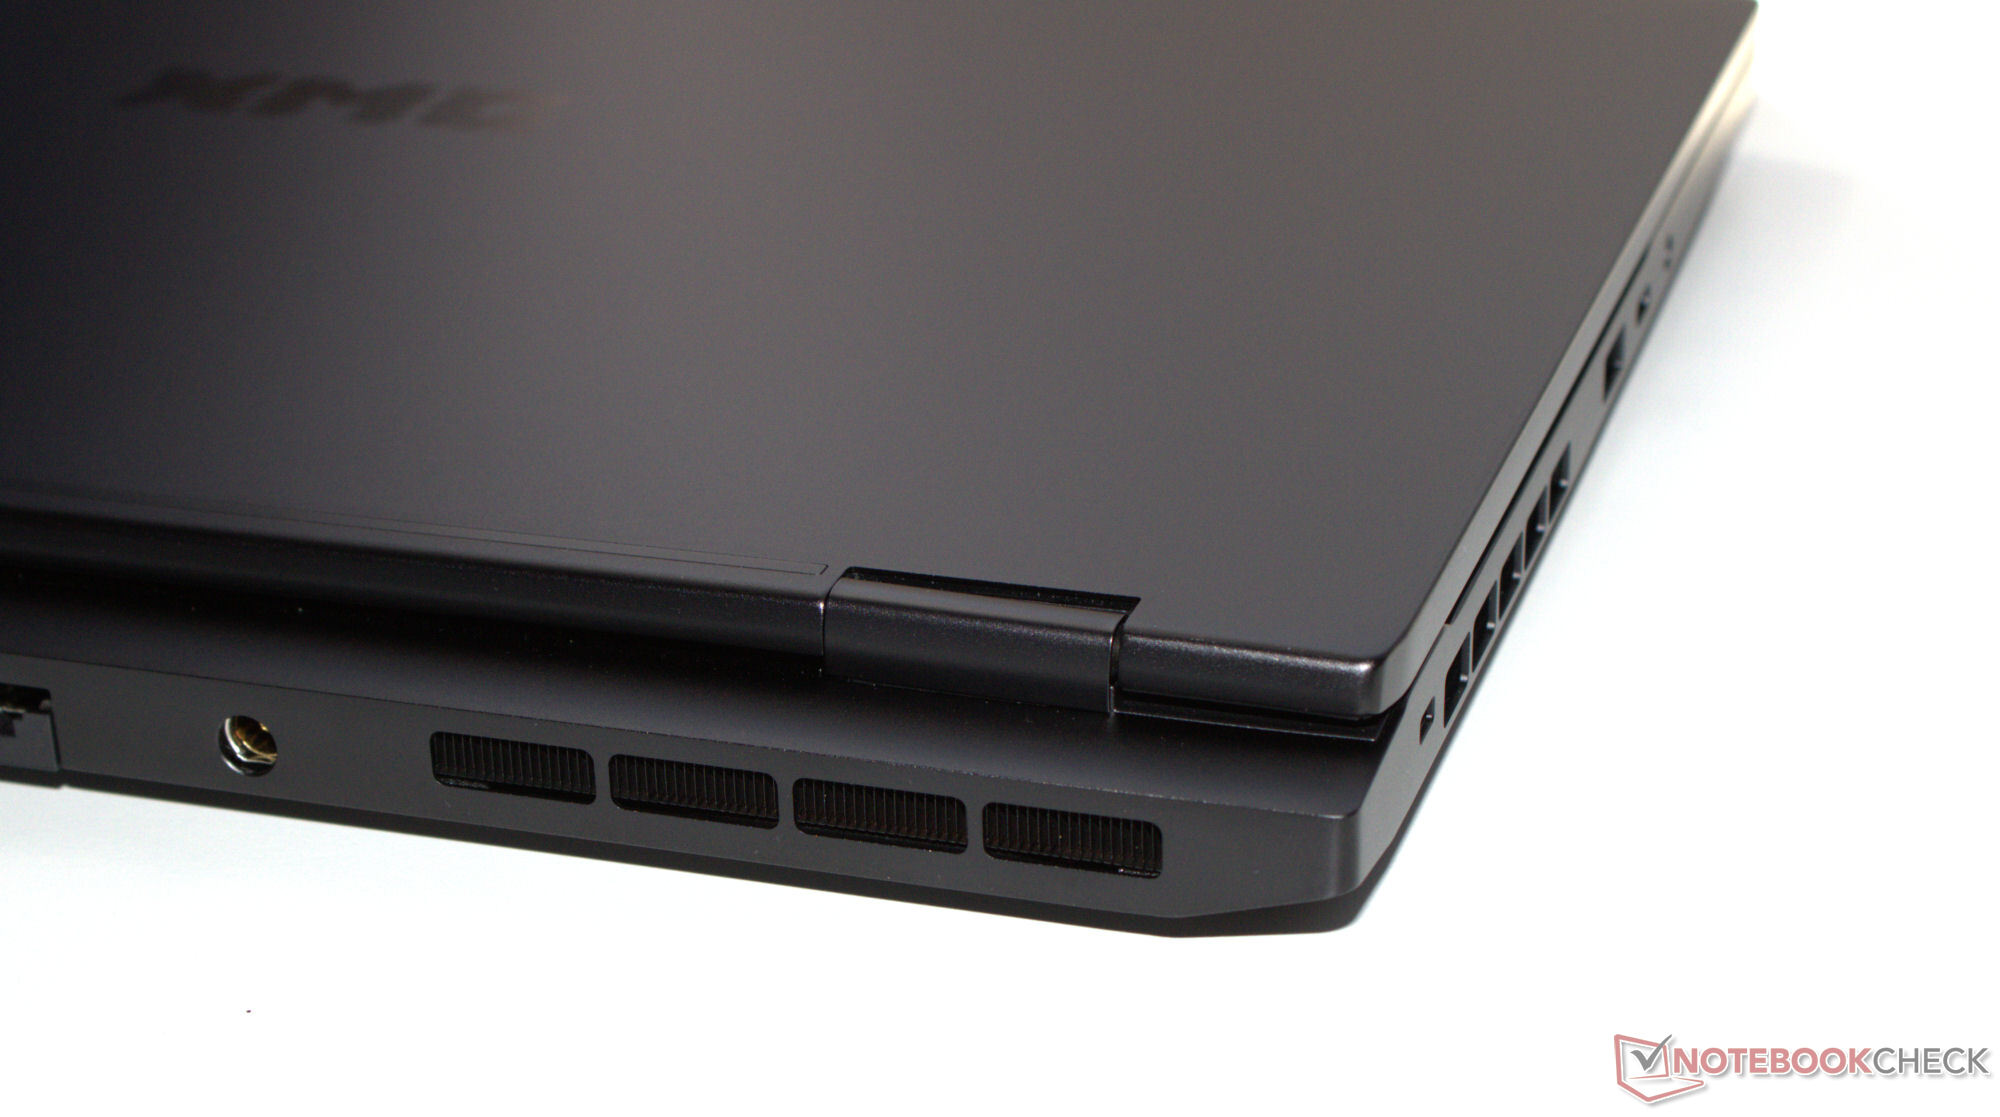
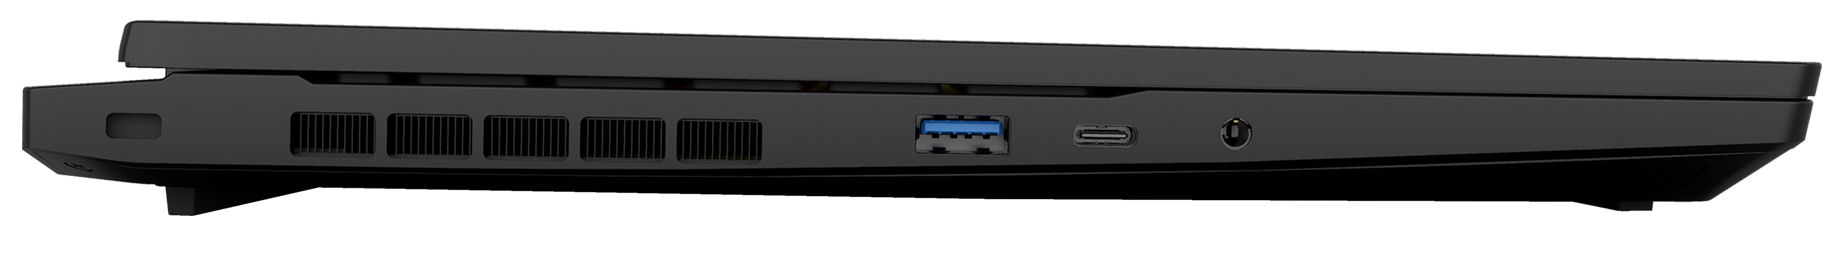
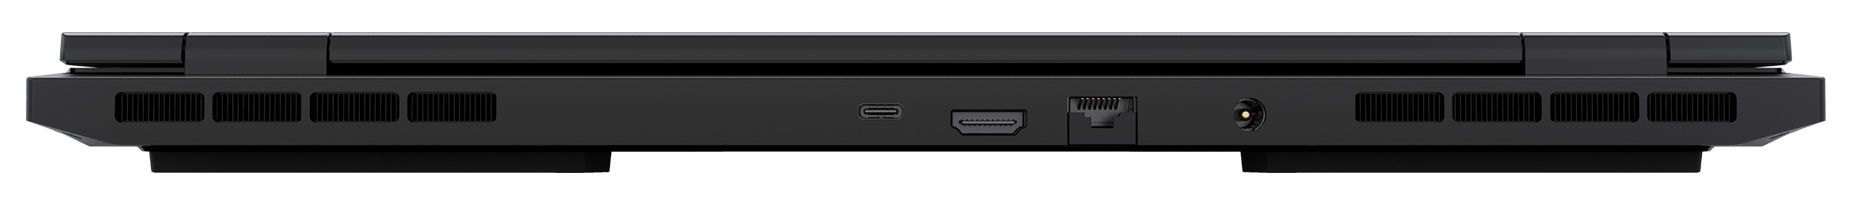
连接性 - 配备 Thunderbolt 4 的 Fusion 15
Fusion 配备三个 USB-A 端口(USB 3.2 Gen 1)和两个 USB-C 端口(1 个 USB 3.2 Gen 1、1 个 Thunderbolt 4)。TB4 端口支持 Power Delivery 并可输出 DisplayPort 信号。笔记本电脑总共有两个视频输出接口(1 个 HDMI 接口,1 个 DP 接口)。一个音频插孔和一个千兆以太网端口完善了其连接选项。视频输出和电源连接位于设备背面。相应的电缆将从背面伸出,因此不会碍事。
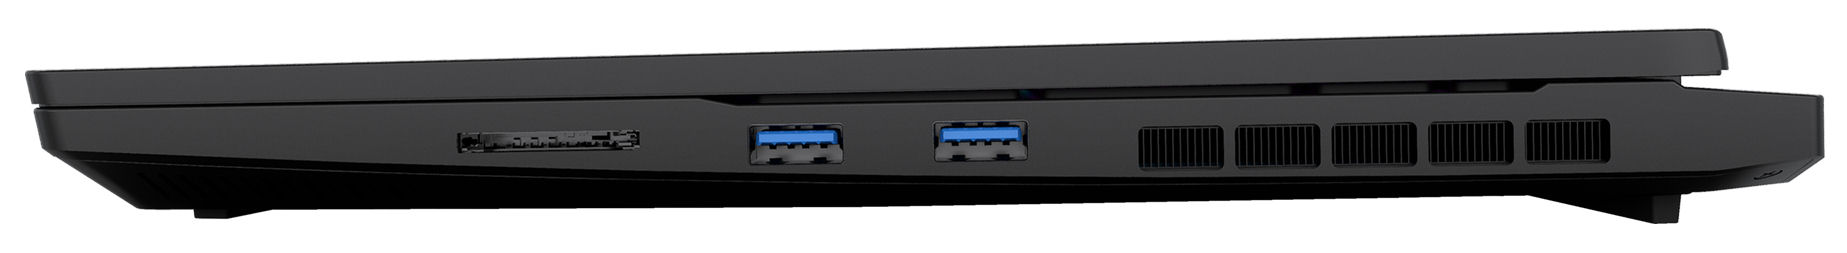
SD 读卡器
SD 读卡器(参考卡:AV PRO microSD 128 GB V60)的传输速率为 81 MB/s(传输 250 张 jpg 图像,每张 5 MB)和 82 MB/s(复制大数据块),速度一般。竞争对手大多提供速度更快的读卡器。
| SD Card Reader | |
| average JPG Copy Test (av. of 3 runs) | |
| Aorus 16X 2024 (AV PRO microSD 128 GB V60) | |
| Average of class Gaming (20.9 - 210, n=54, last 2 years) | |
| Schenker XMG Fusion 15 (Early 24) (AV PRO microSD 128 GB V60) | |
| Alienware m16 R2 (AV PRO microSD 128 GB V60) | |
| maximum AS SSD Seq Read Test (1GB) | |
| Alienware m16 R2 (AV PRO microSD 128 GB V60) | |
| Aorus 16X 2024 (AV PRO microSD 128 GB V60) | |
| Average of class Gaming (25.5 - 261, n=51, last 2 years) | |
| Schenker XMG Fusion 15 (Early 24) (AV PRO microSD 128 GB V60) | |
交流
Fusion 采用了 WiFi 6E 芯片(英特尔 AX211),在最佳情况下(附近没有 WiFi 设备,笔记本电脑和服务器之间距离较近),数据传输率非常高。有线连接由 Motorcomm 公司的千兆以太网控制器(YT6801)负责,这是我们以前从未遇到过的制造商。
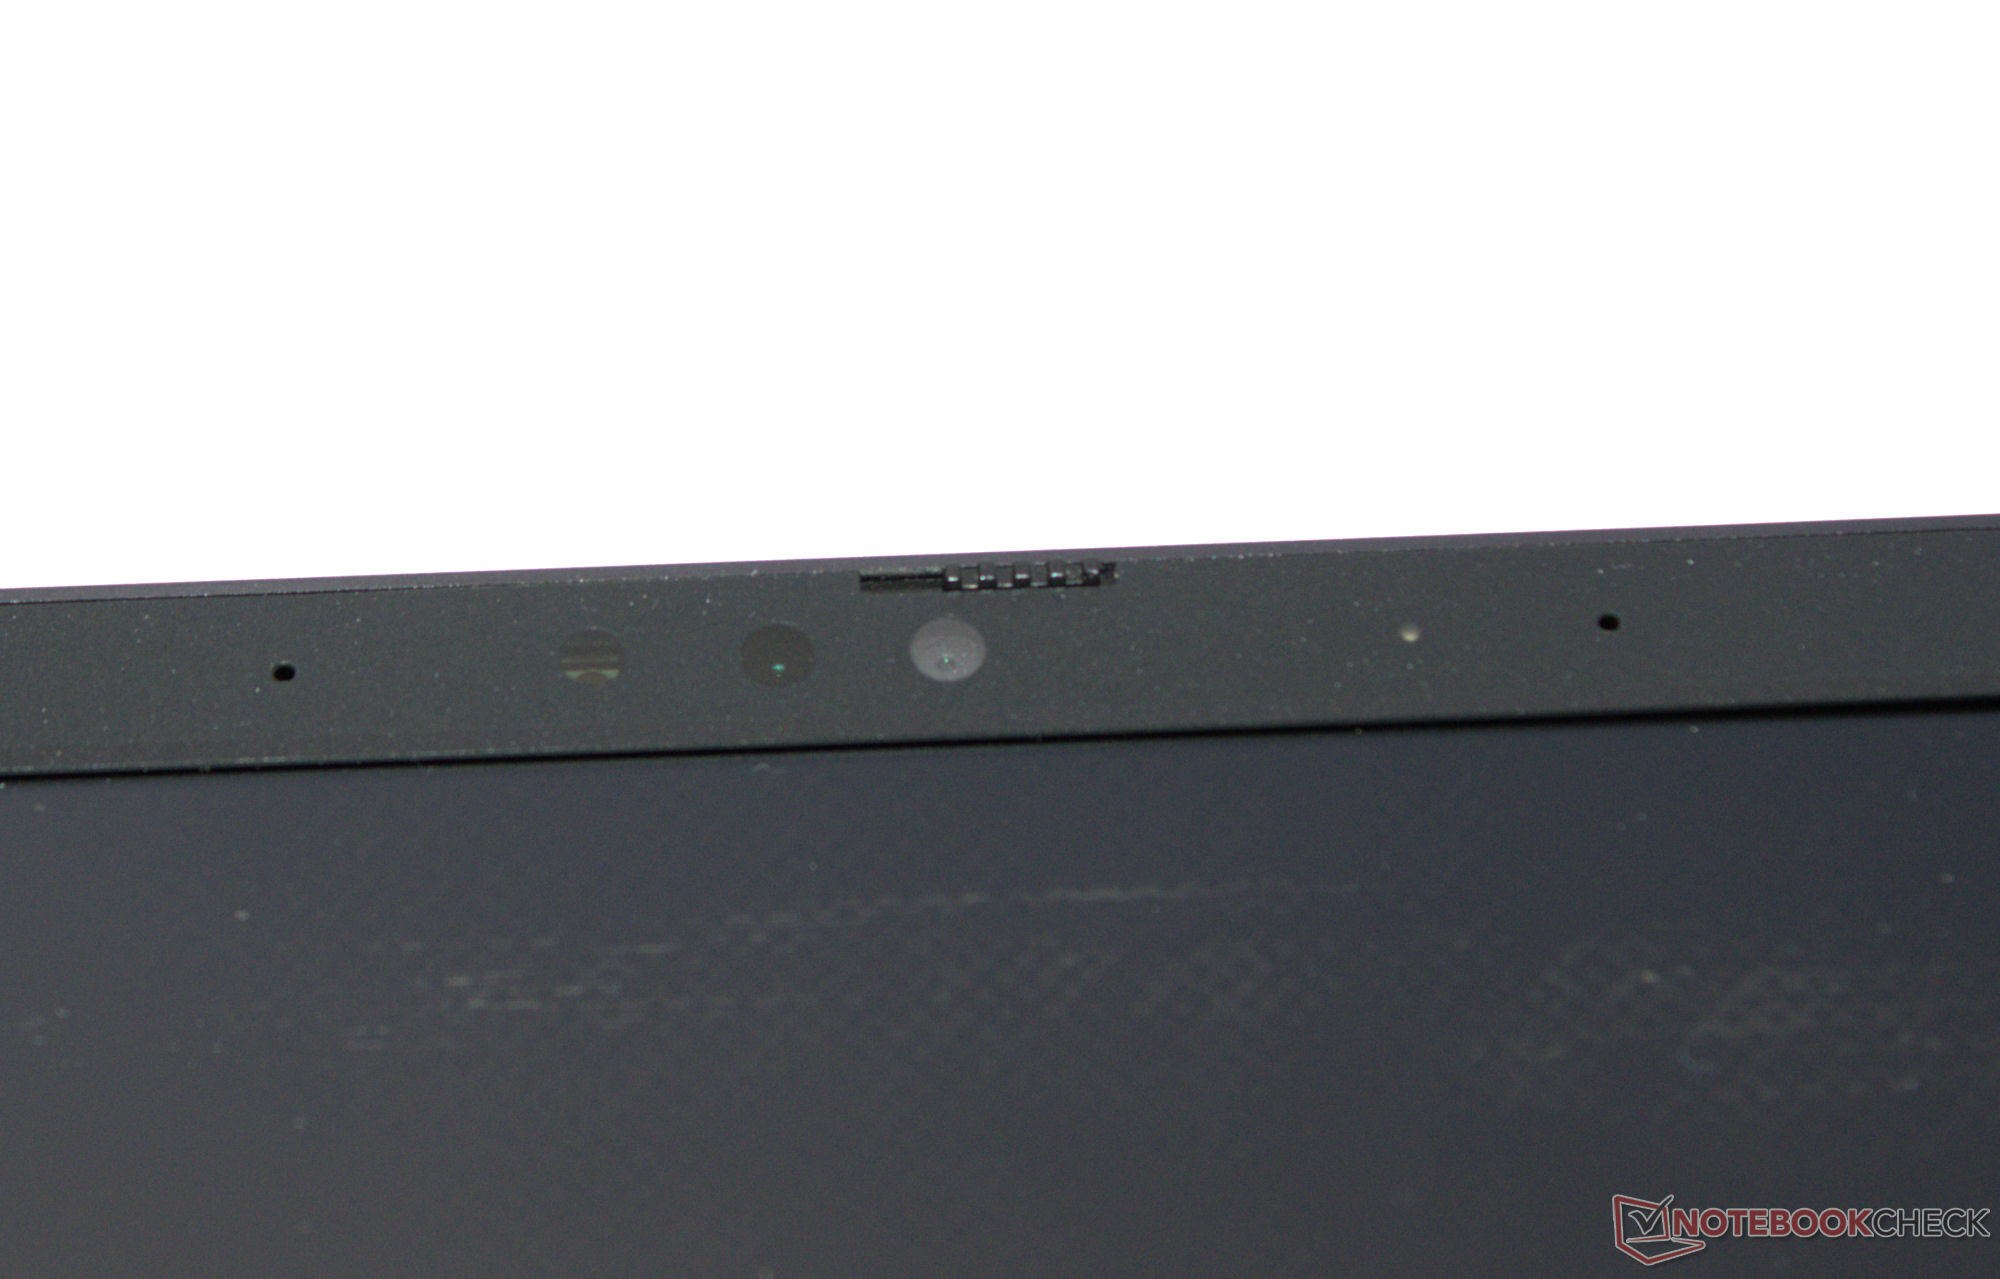
网络摄像头
它的网络摄像头(210 万像素)质量一般。在色彩准确度方面,该机表现不佳:偏差约为 9,未达到目标值(DeltaE<3)。不过,它支持 Windows Hello。此外,它还配有一个机械盖。

 GeForce RTX 4070 Laptop GPU, i9-14900HX, Samsung 990 Pro 1 TB")
 GeForce RTX 4070 Laptop GPU, i9-14900HX, Samsung 990 Pro 1 TB")
配件
笔记本电脑随附 U 盘(驱动程序、手册)、贴纸和鼠标垫。
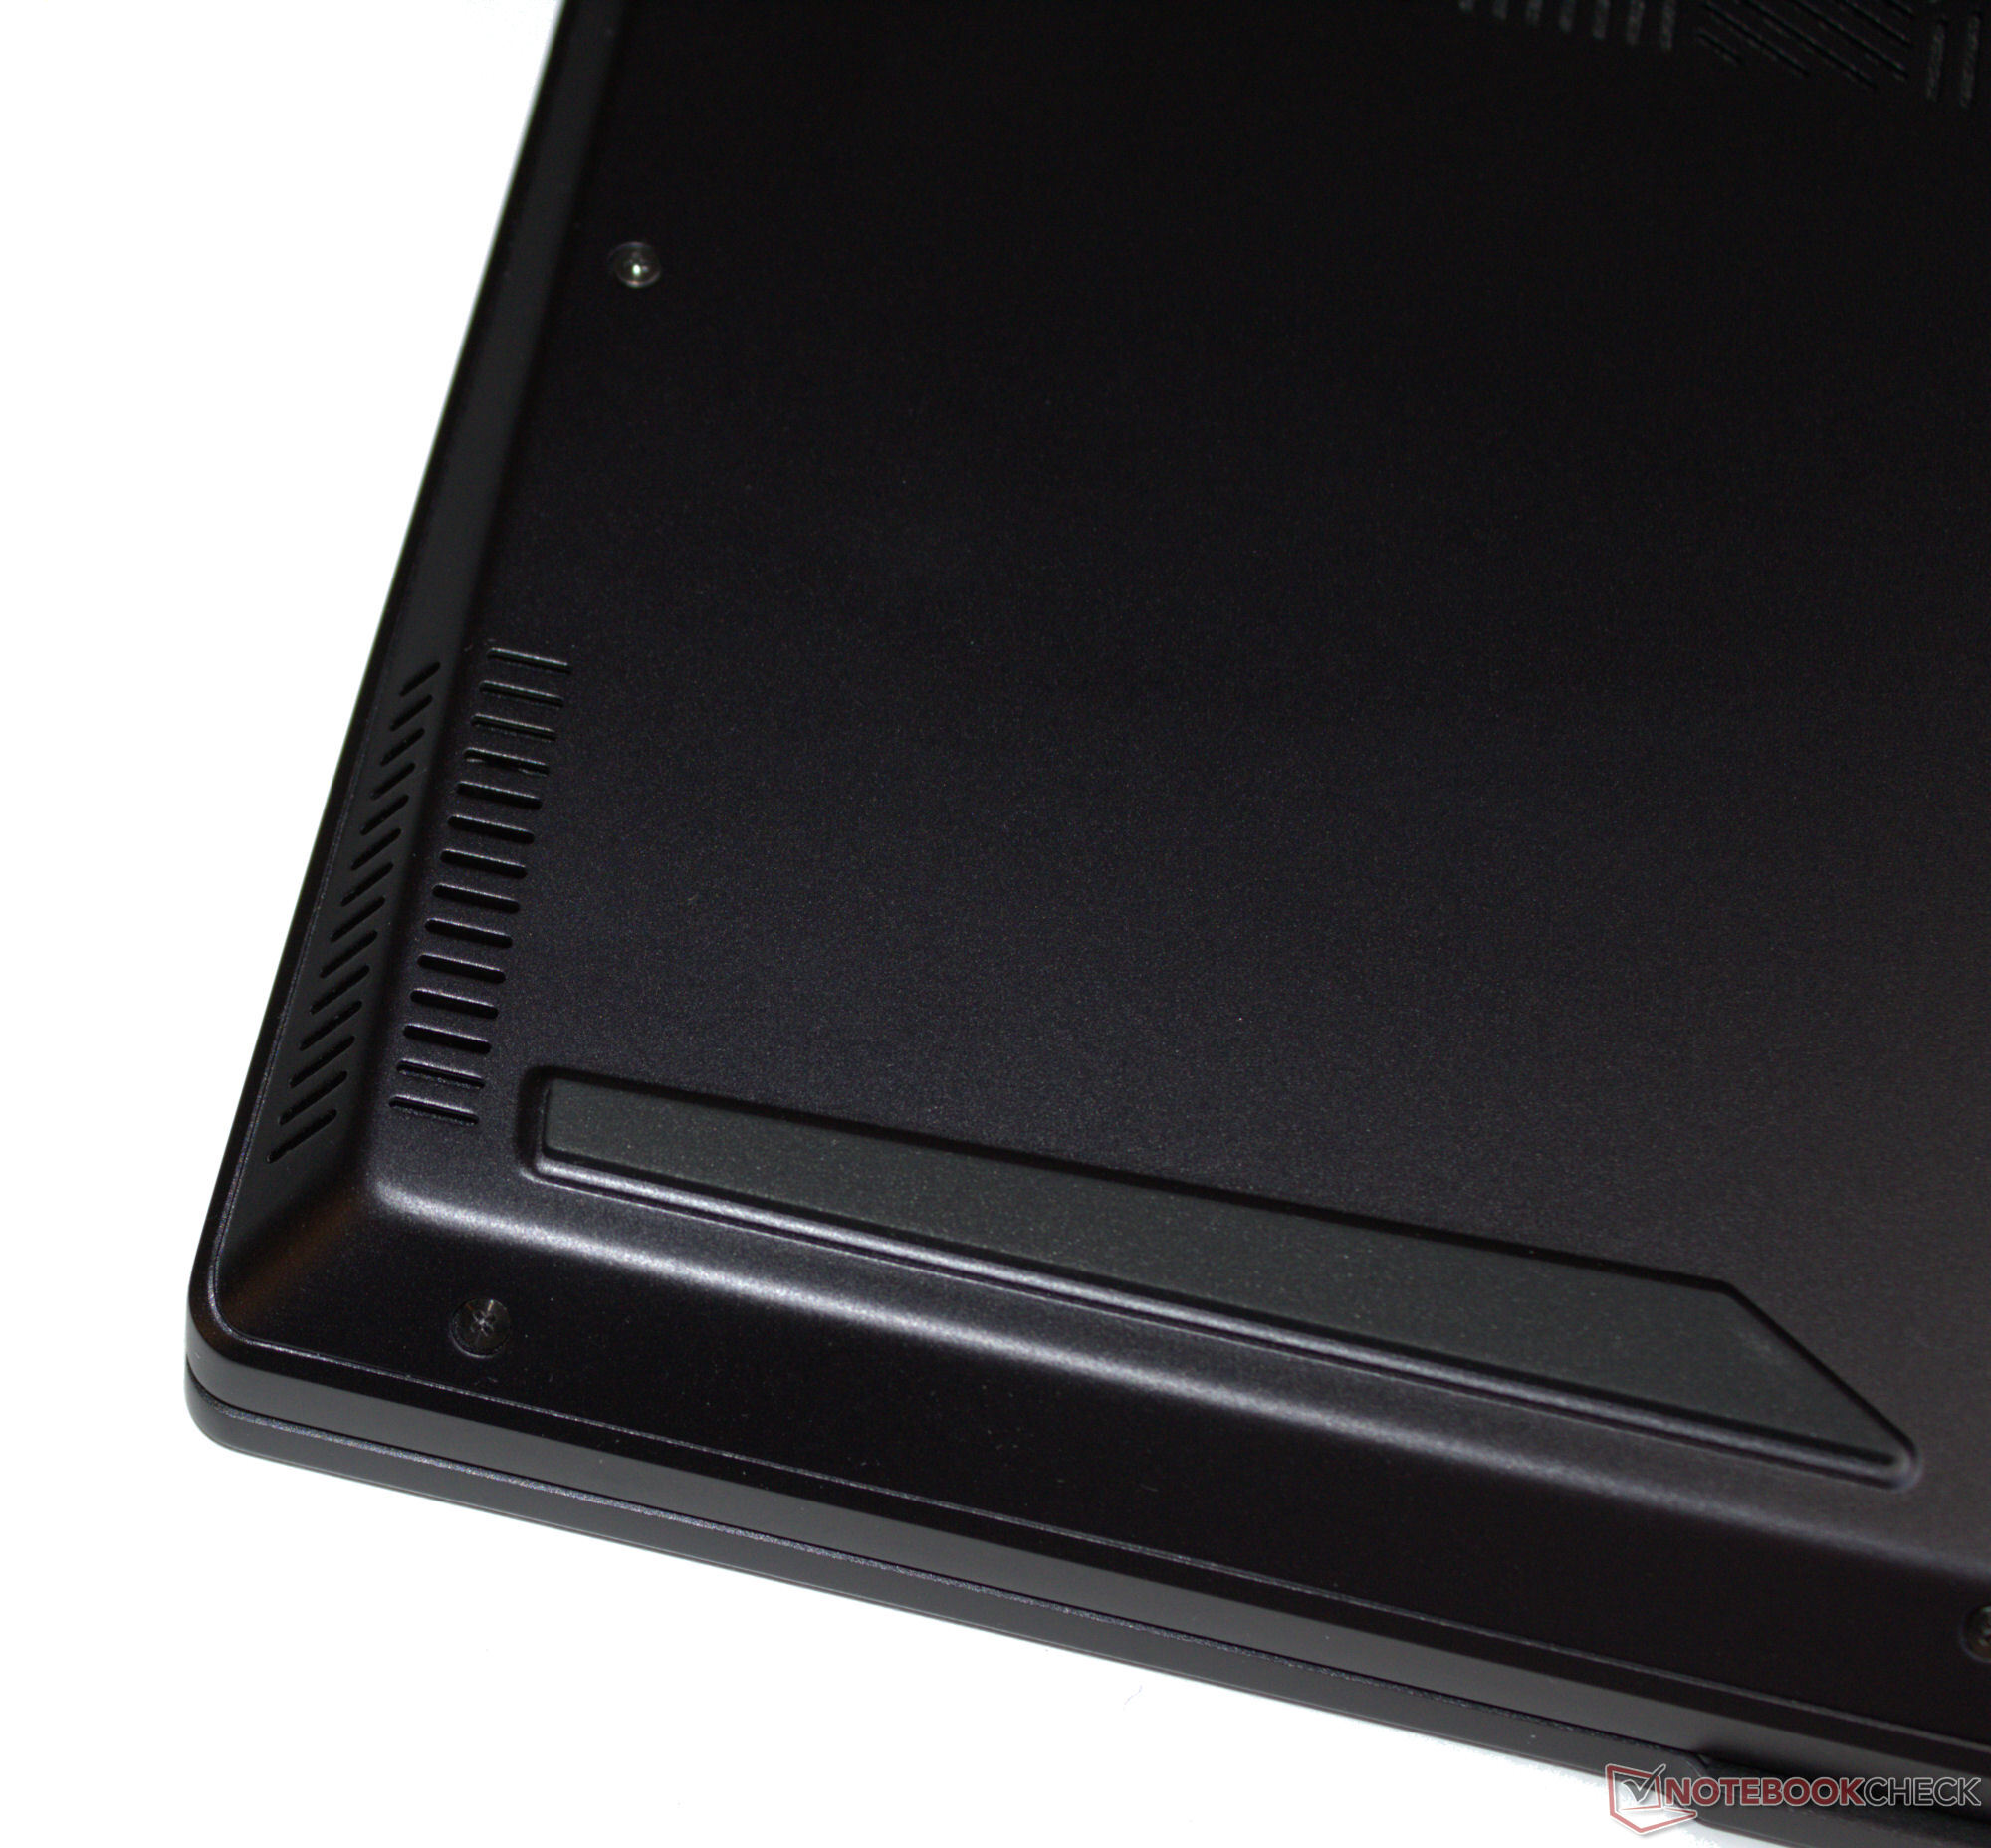
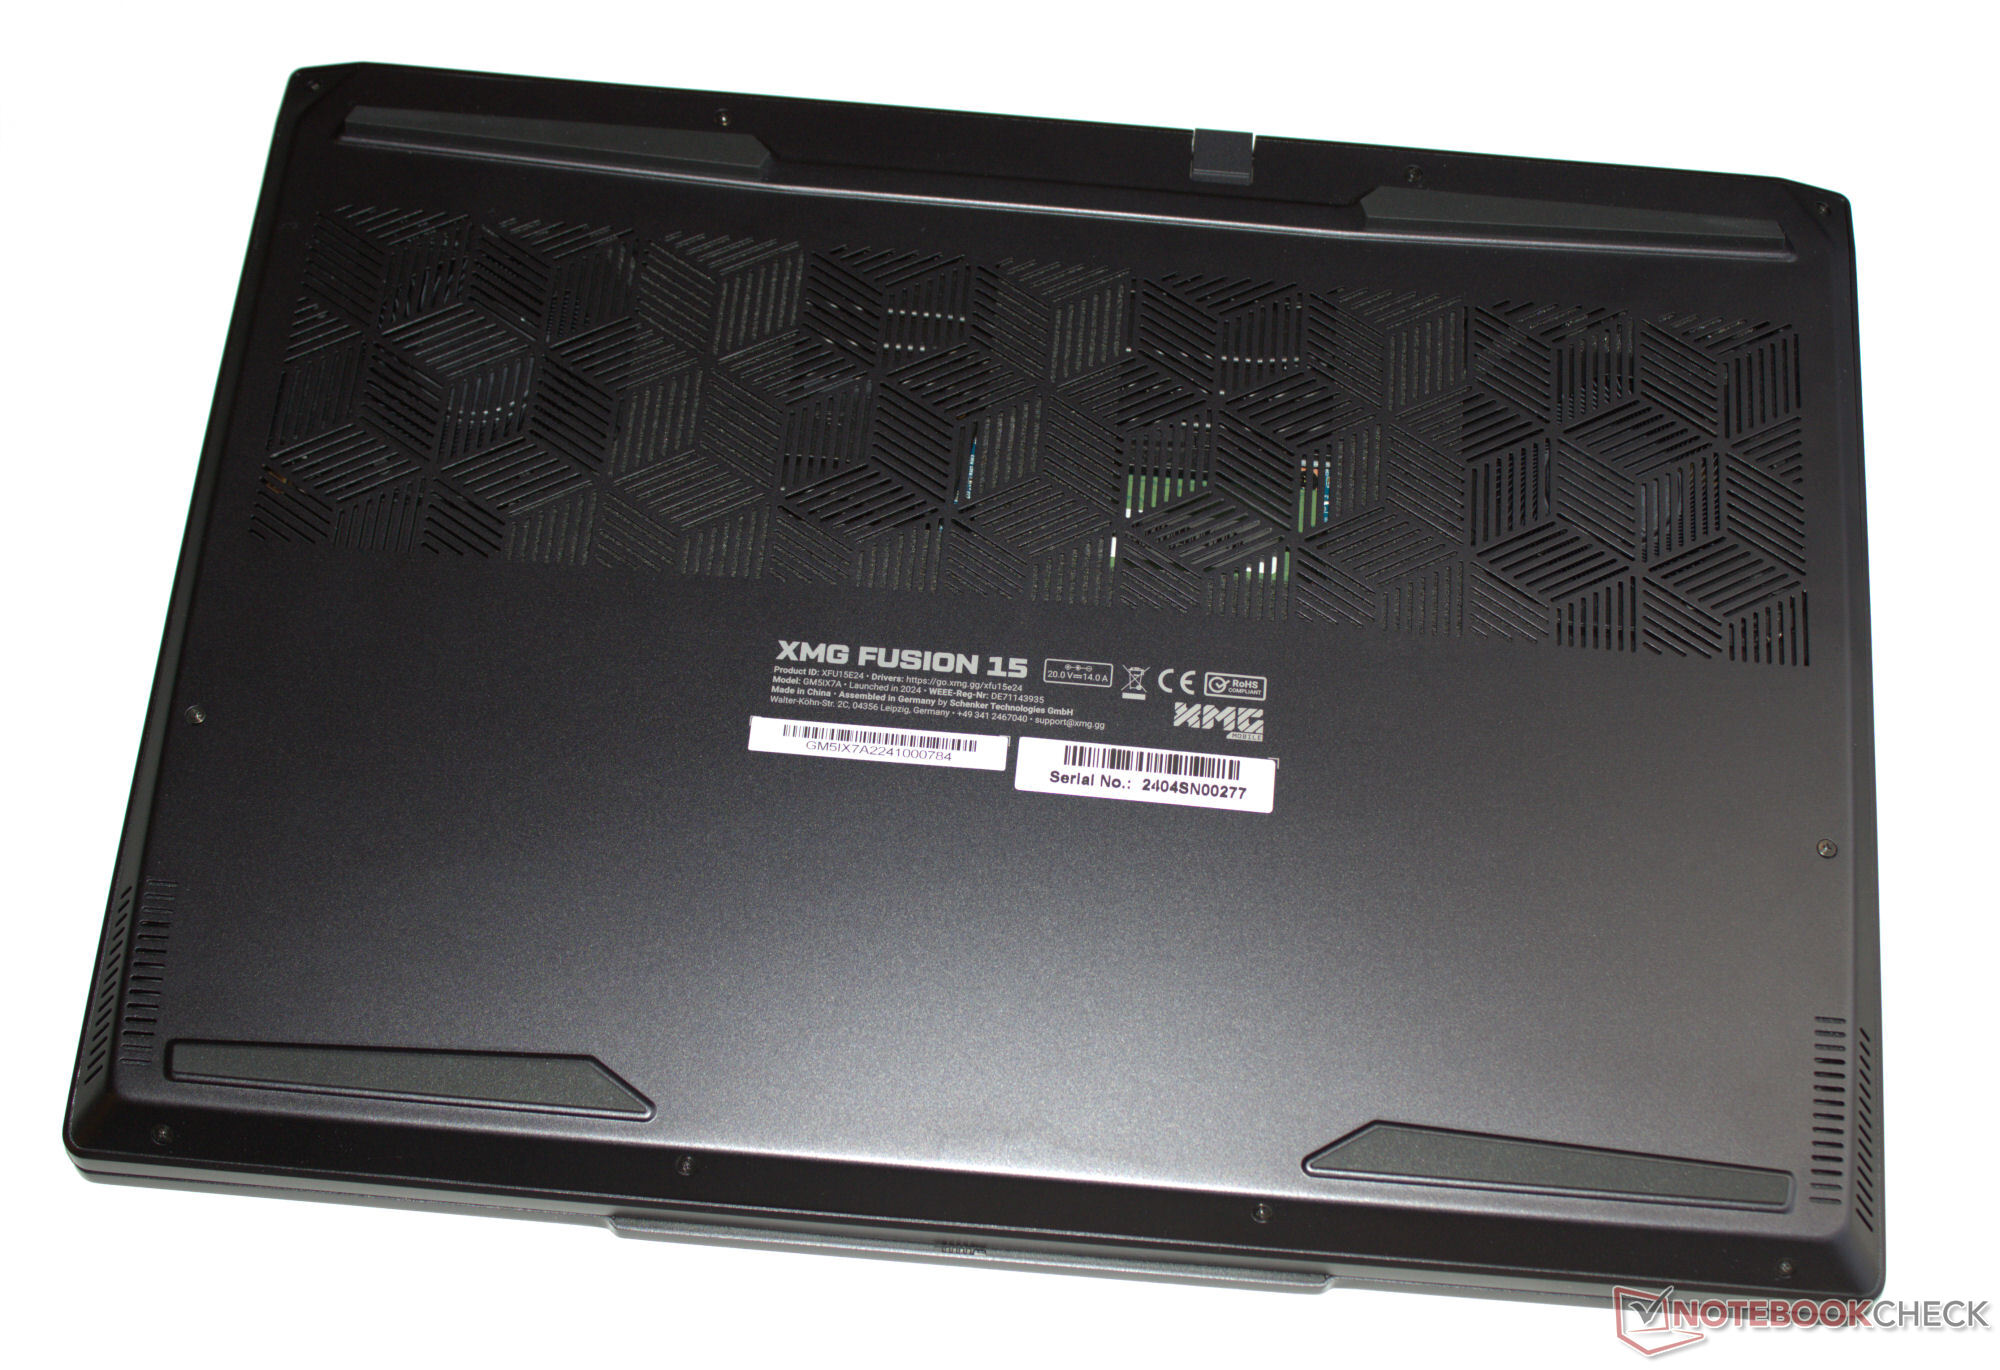
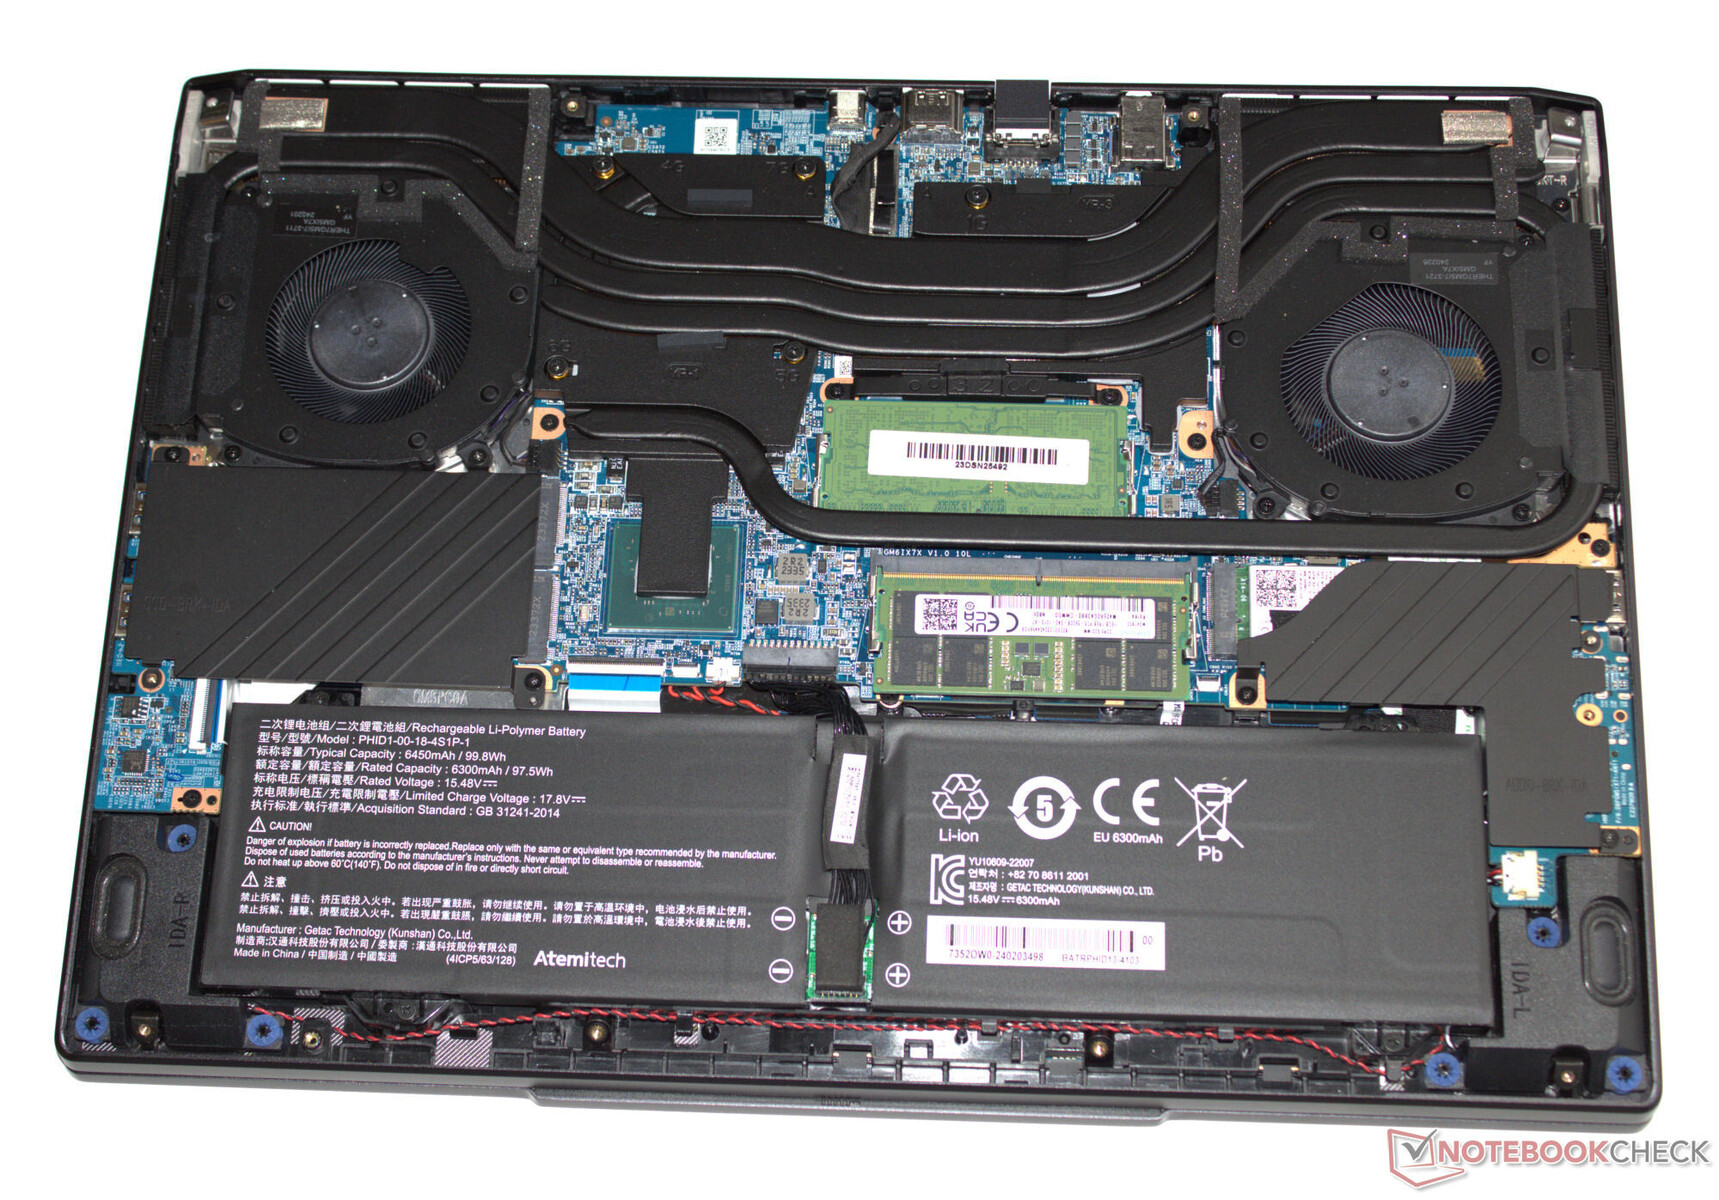
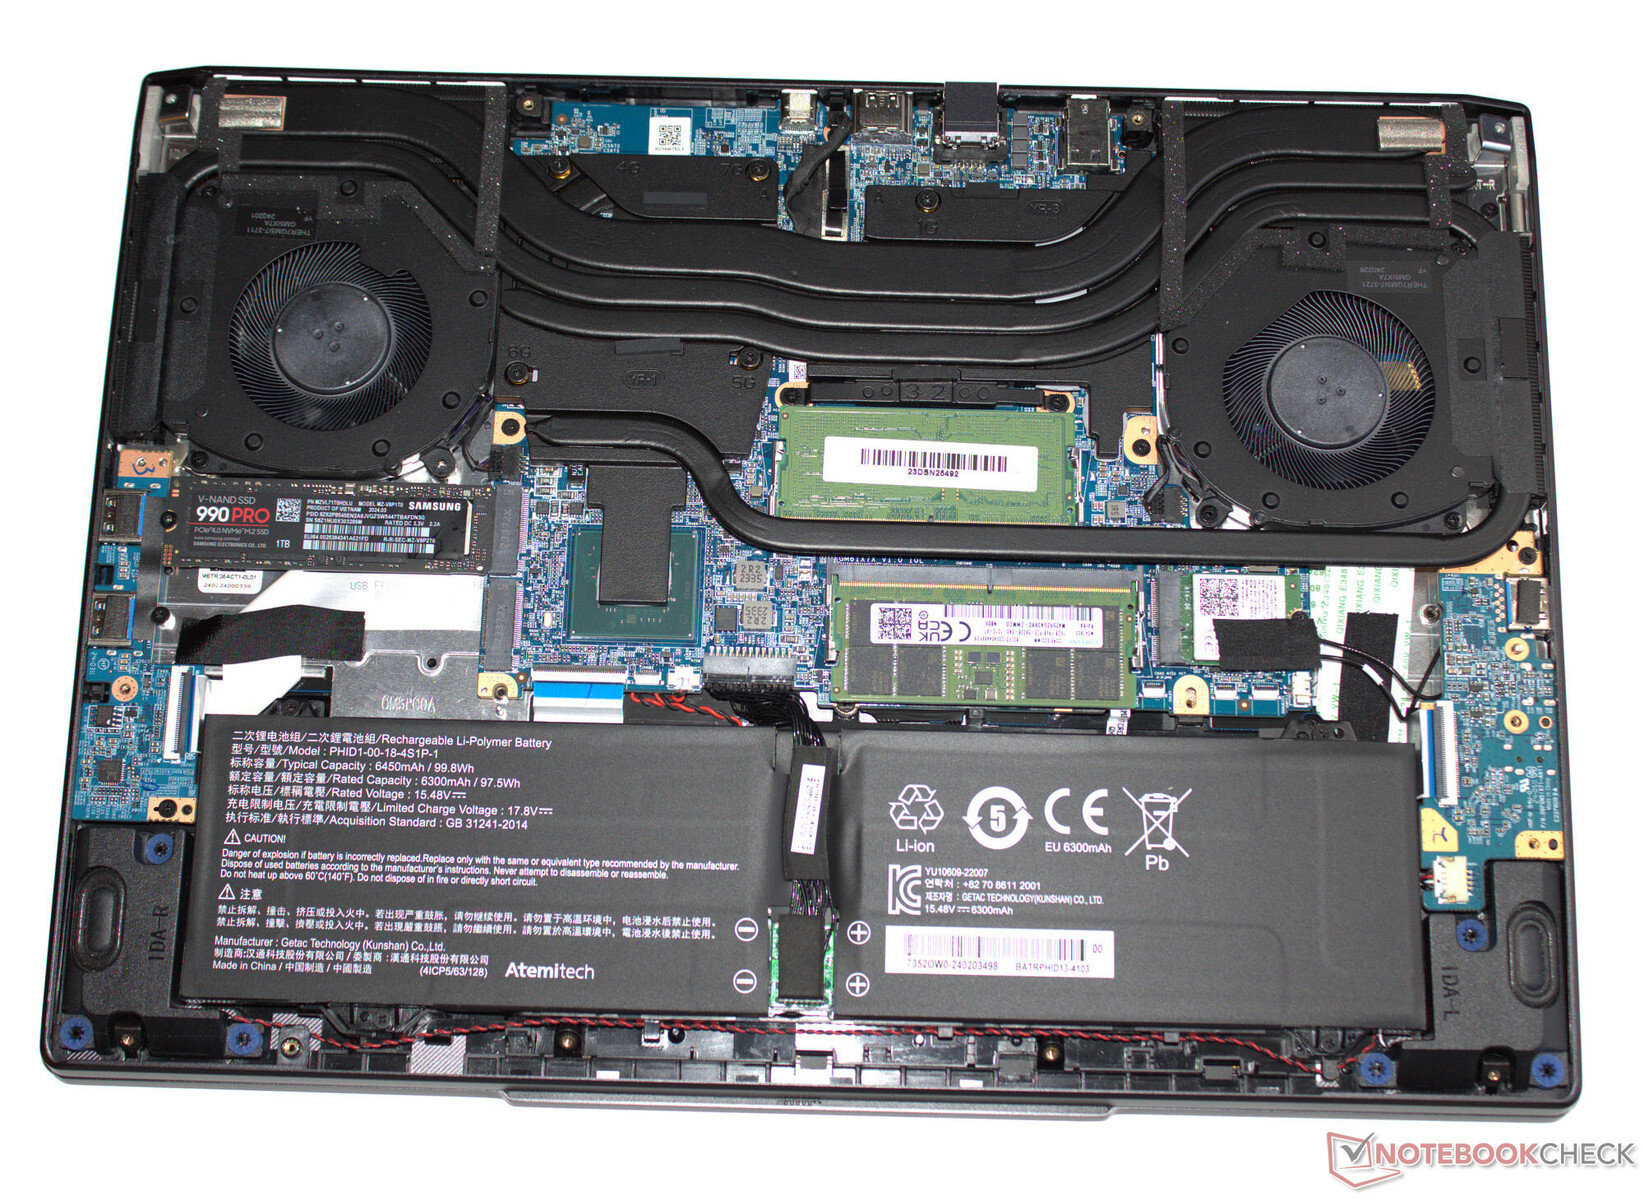
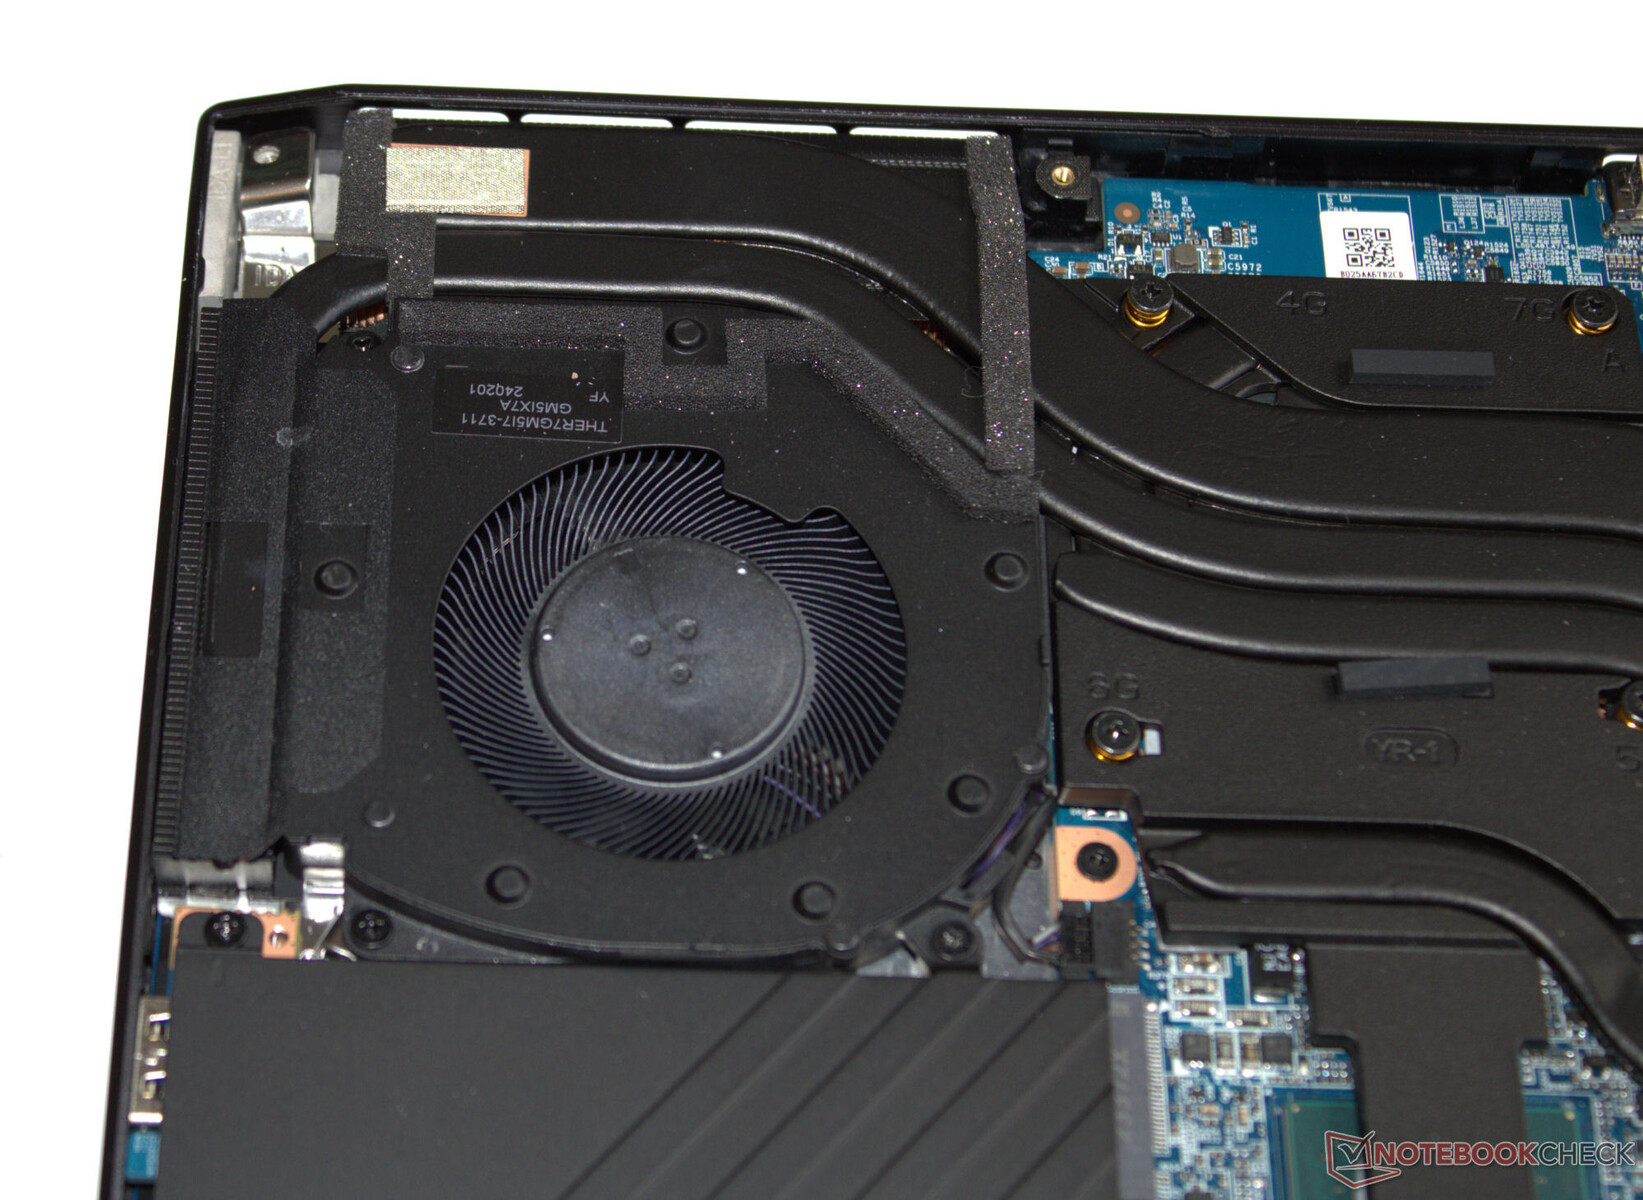
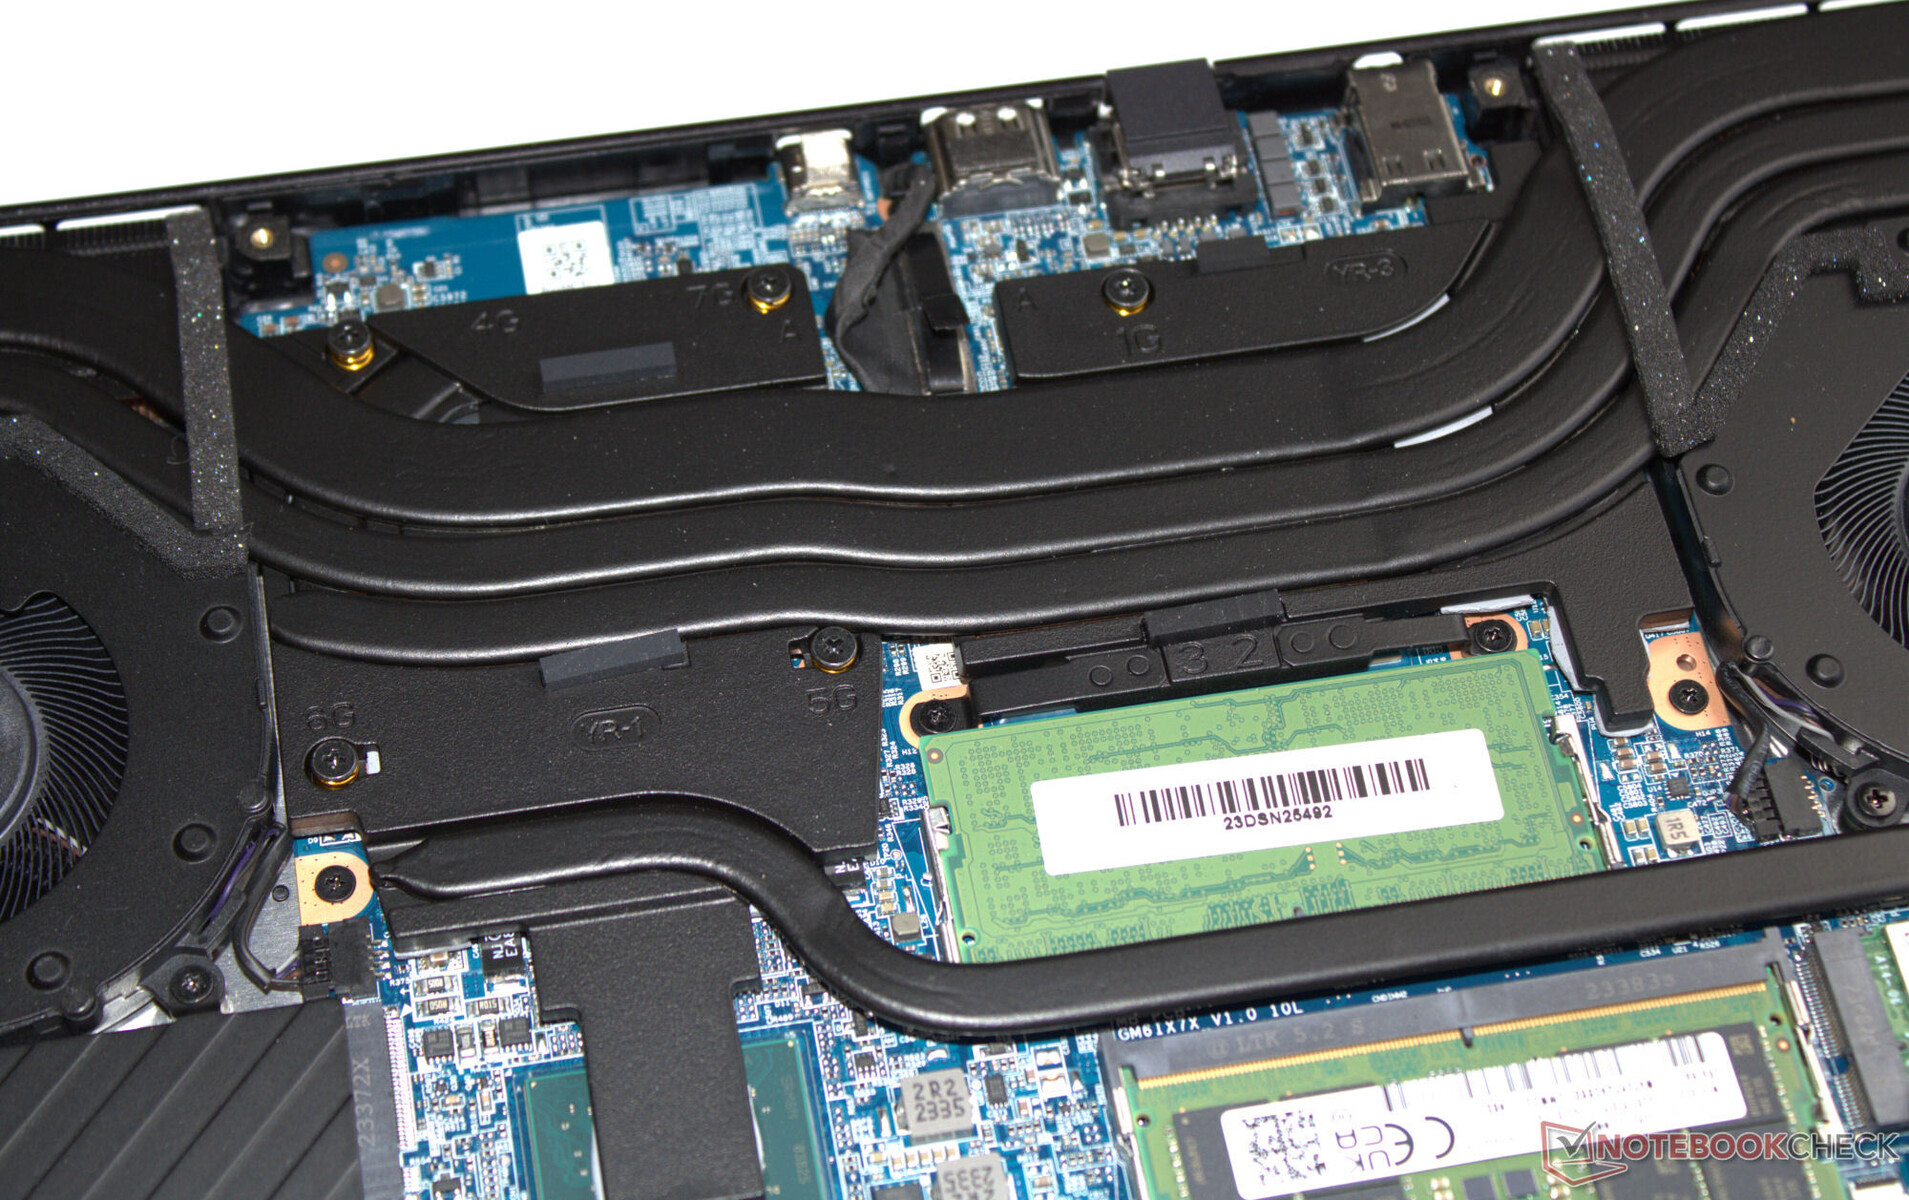
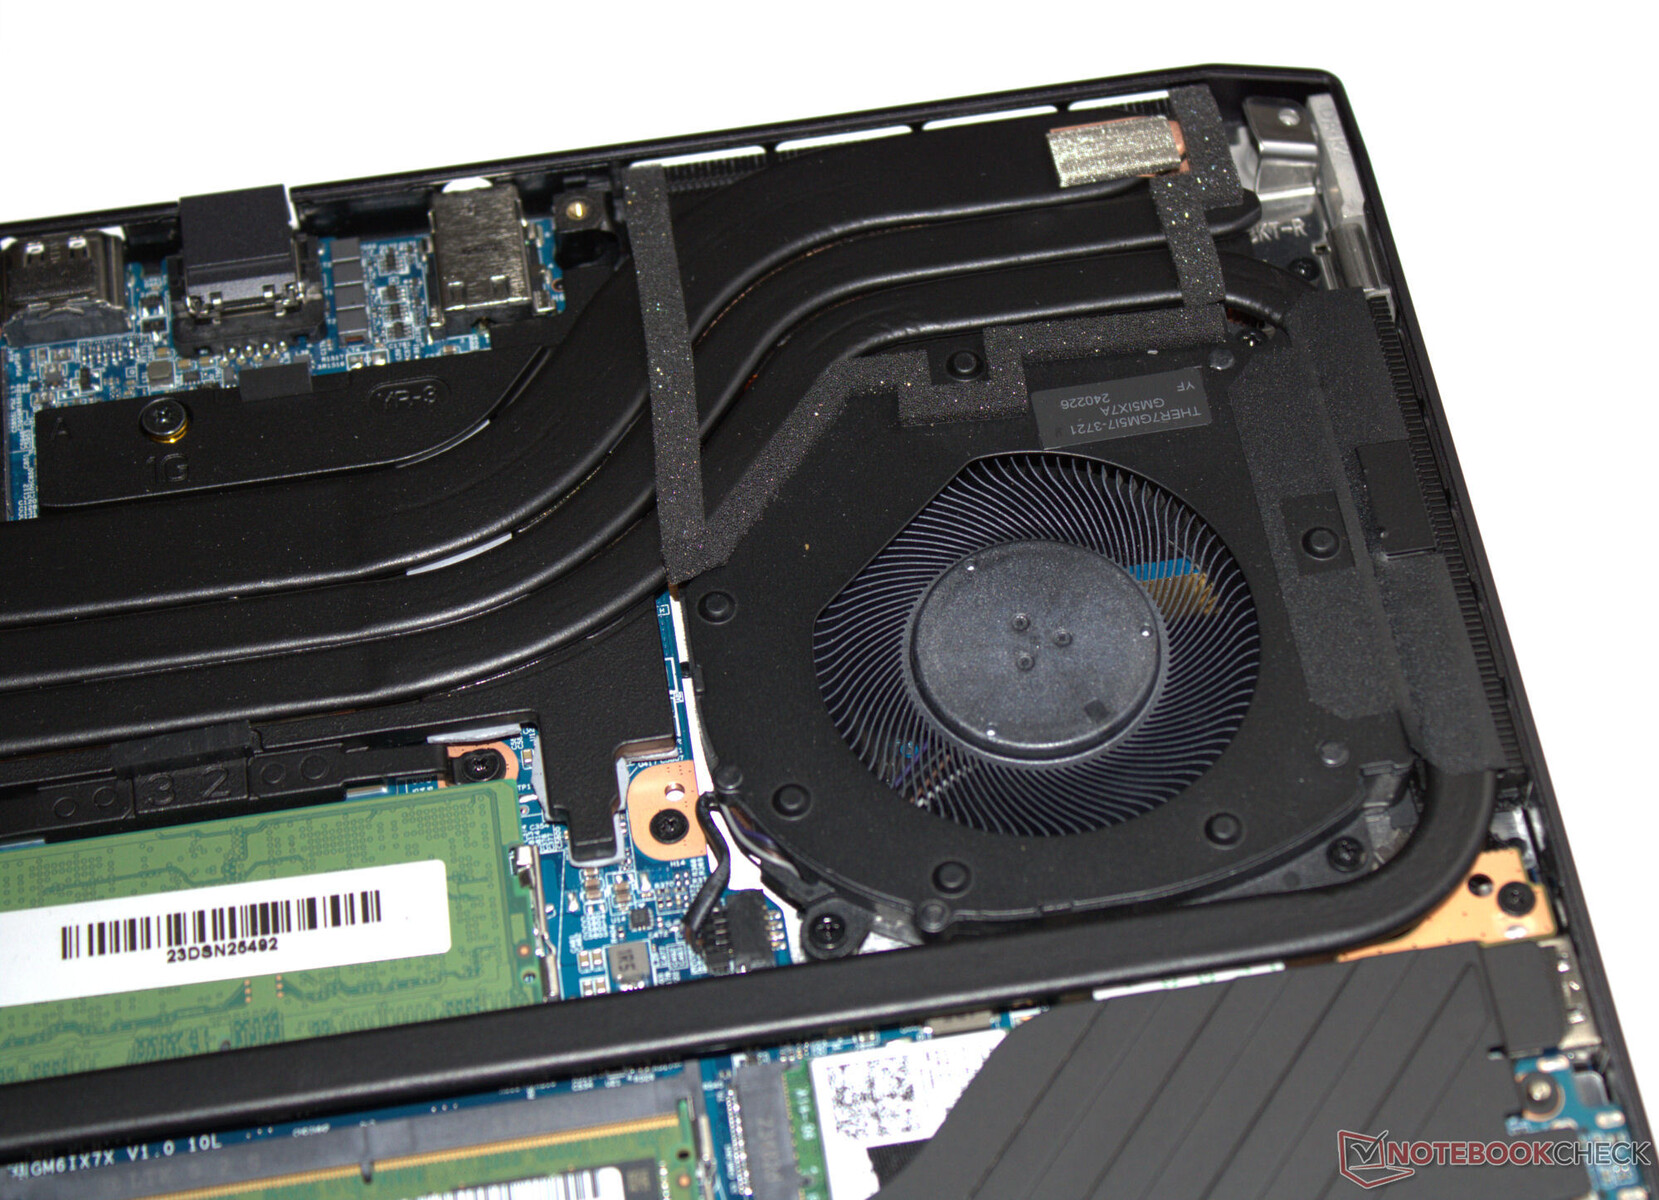
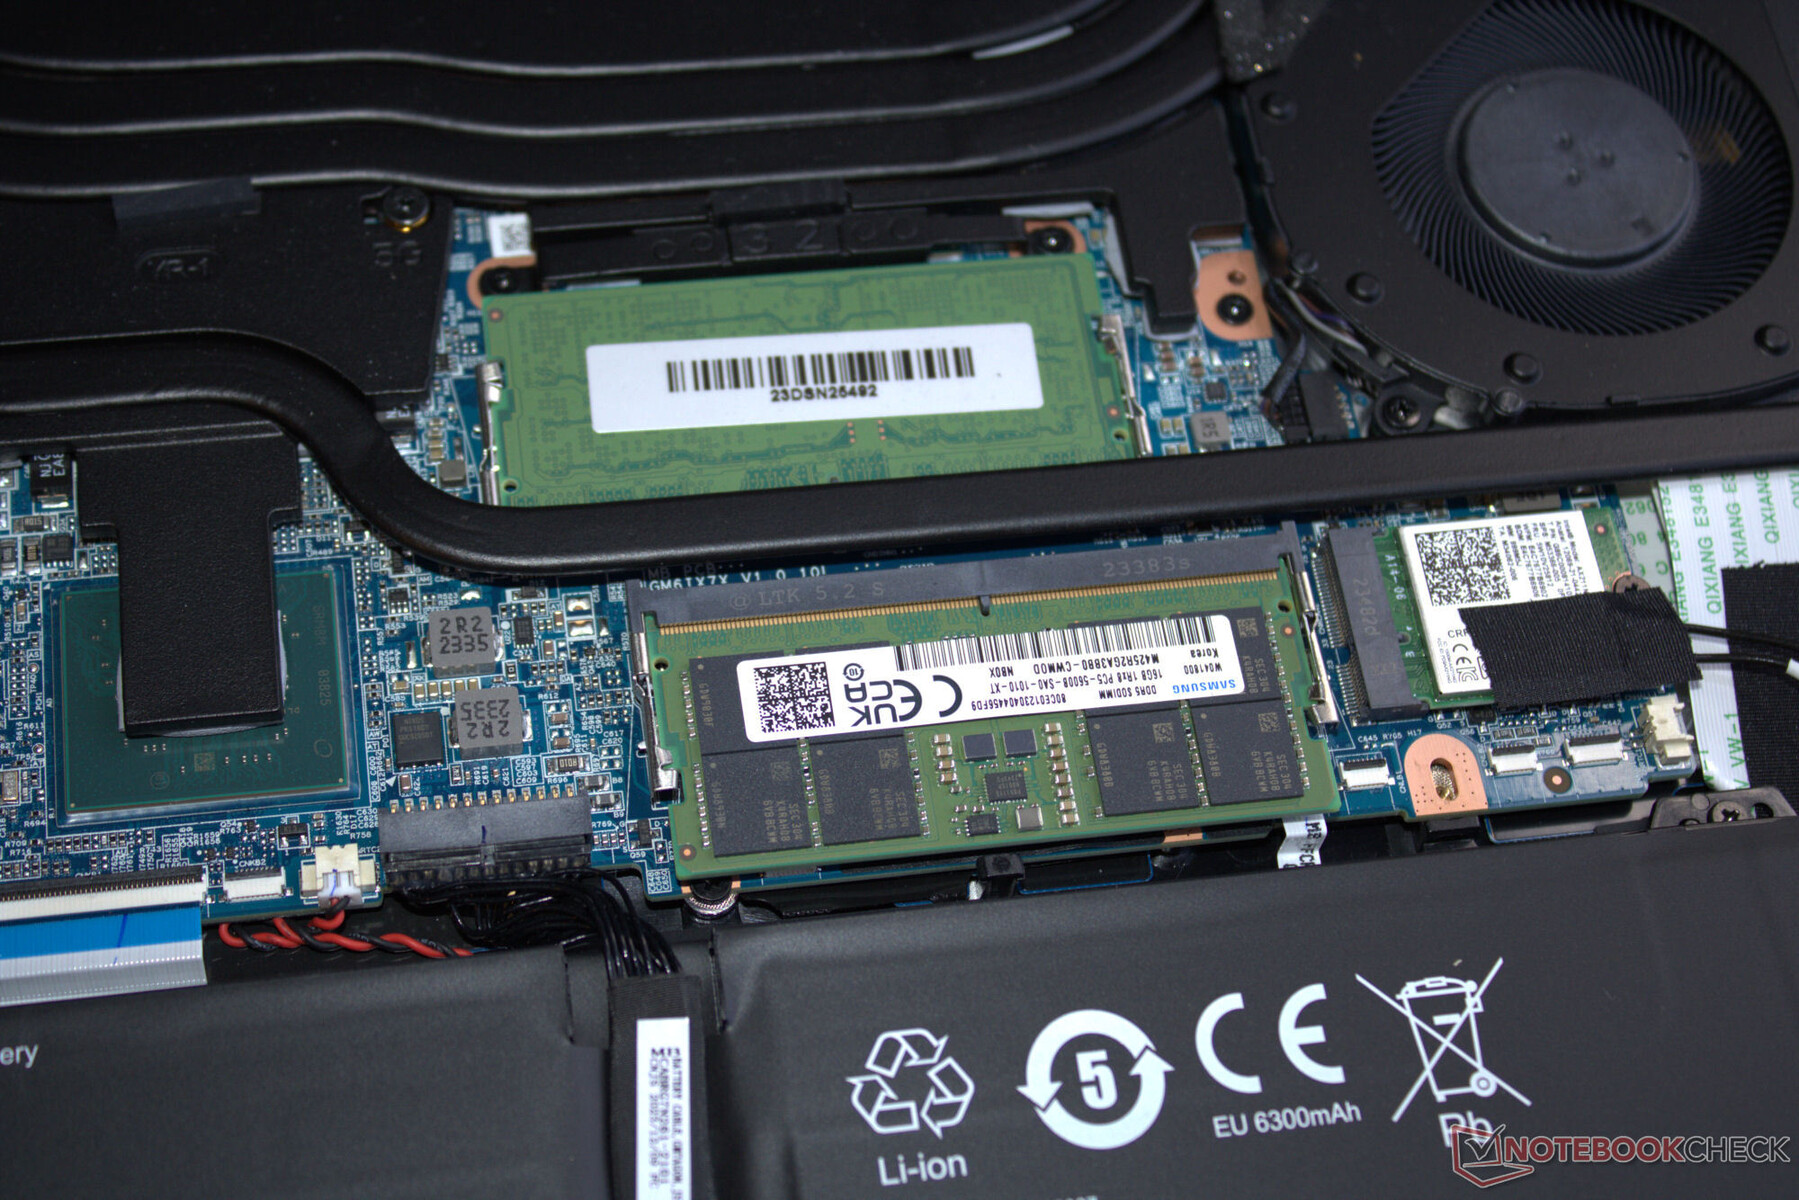
维护
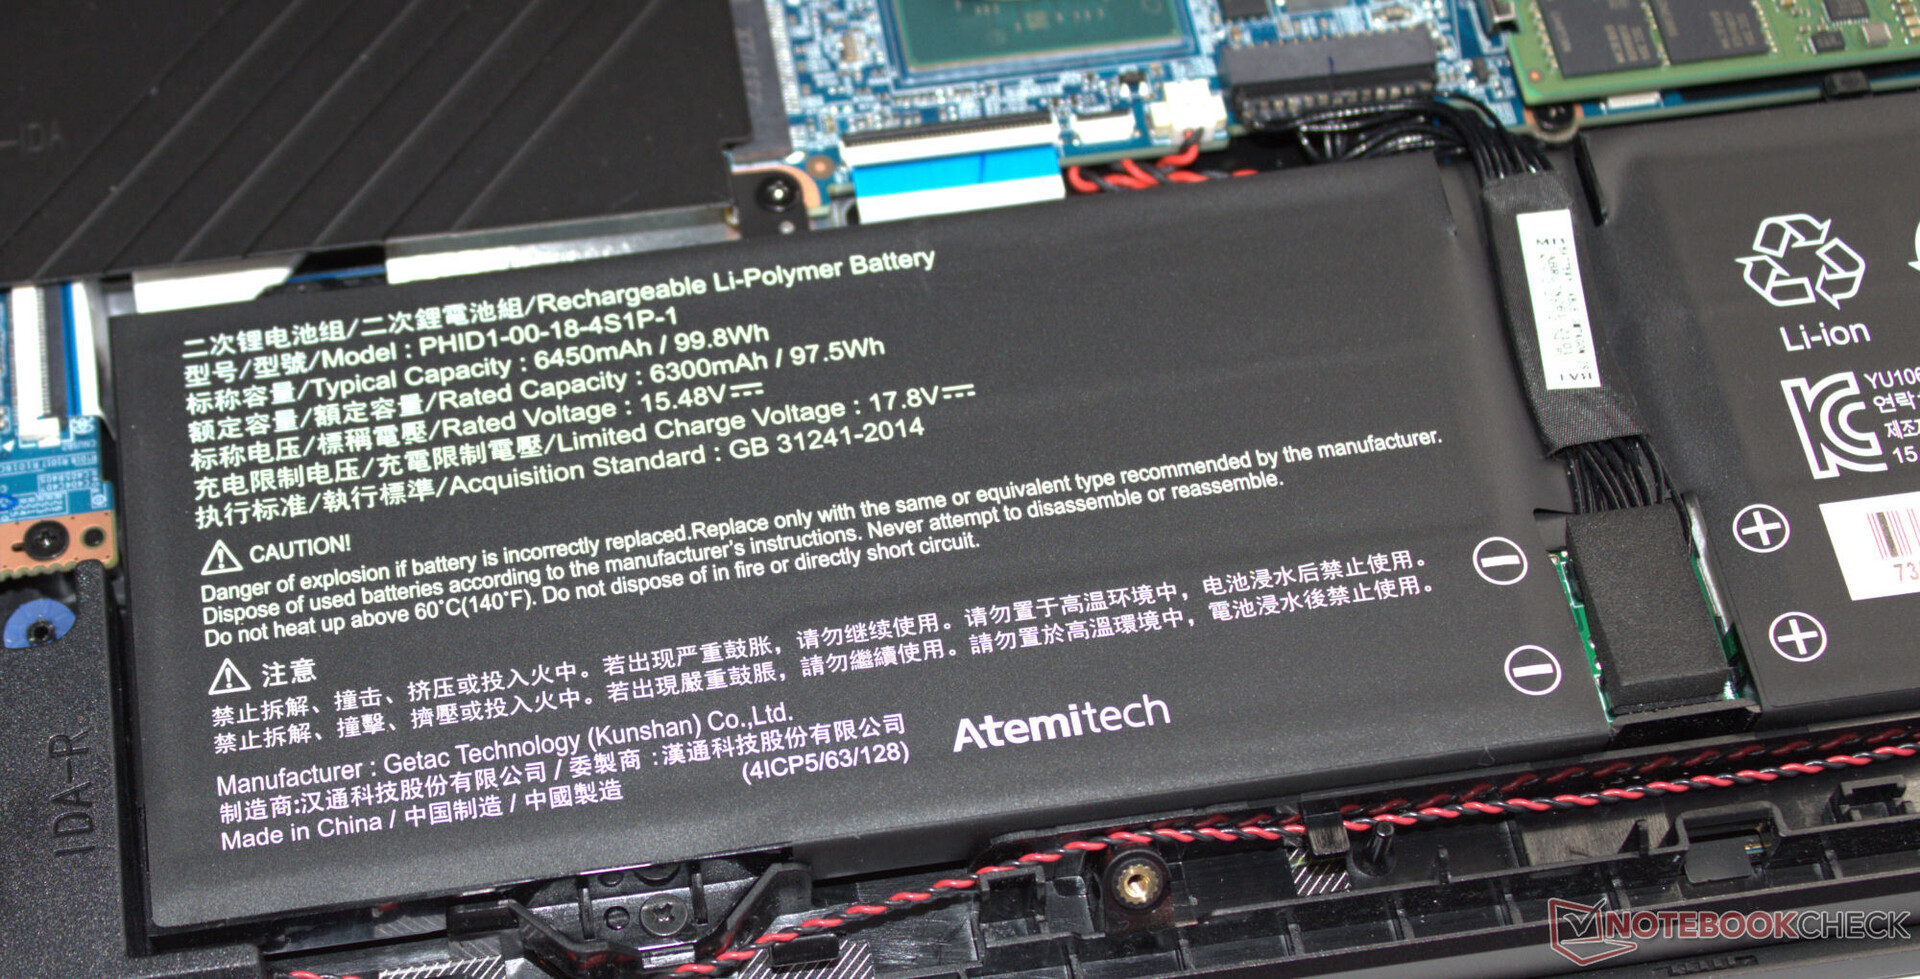
拧下设备底部的所有螺丝后,就可以非常轻松地取下底壳部分--你可能只需要一个拨子弹或一个平铲来协助操作。随后,您可以访问内存组(两个都占用)、固态硬盘(PCIe 4,M.2-2280)、第二个固态硬盘插槽(PCIe 4,M.2-2280)、WLAN 模块、风扇、BIOS 电池和笔记本电池。
保修
该设备的基本保修期为两年,包括取货服务和 6 个月的快速维修服务(48 小时内维修)。您可以付费将保修期延长至 36 个月。
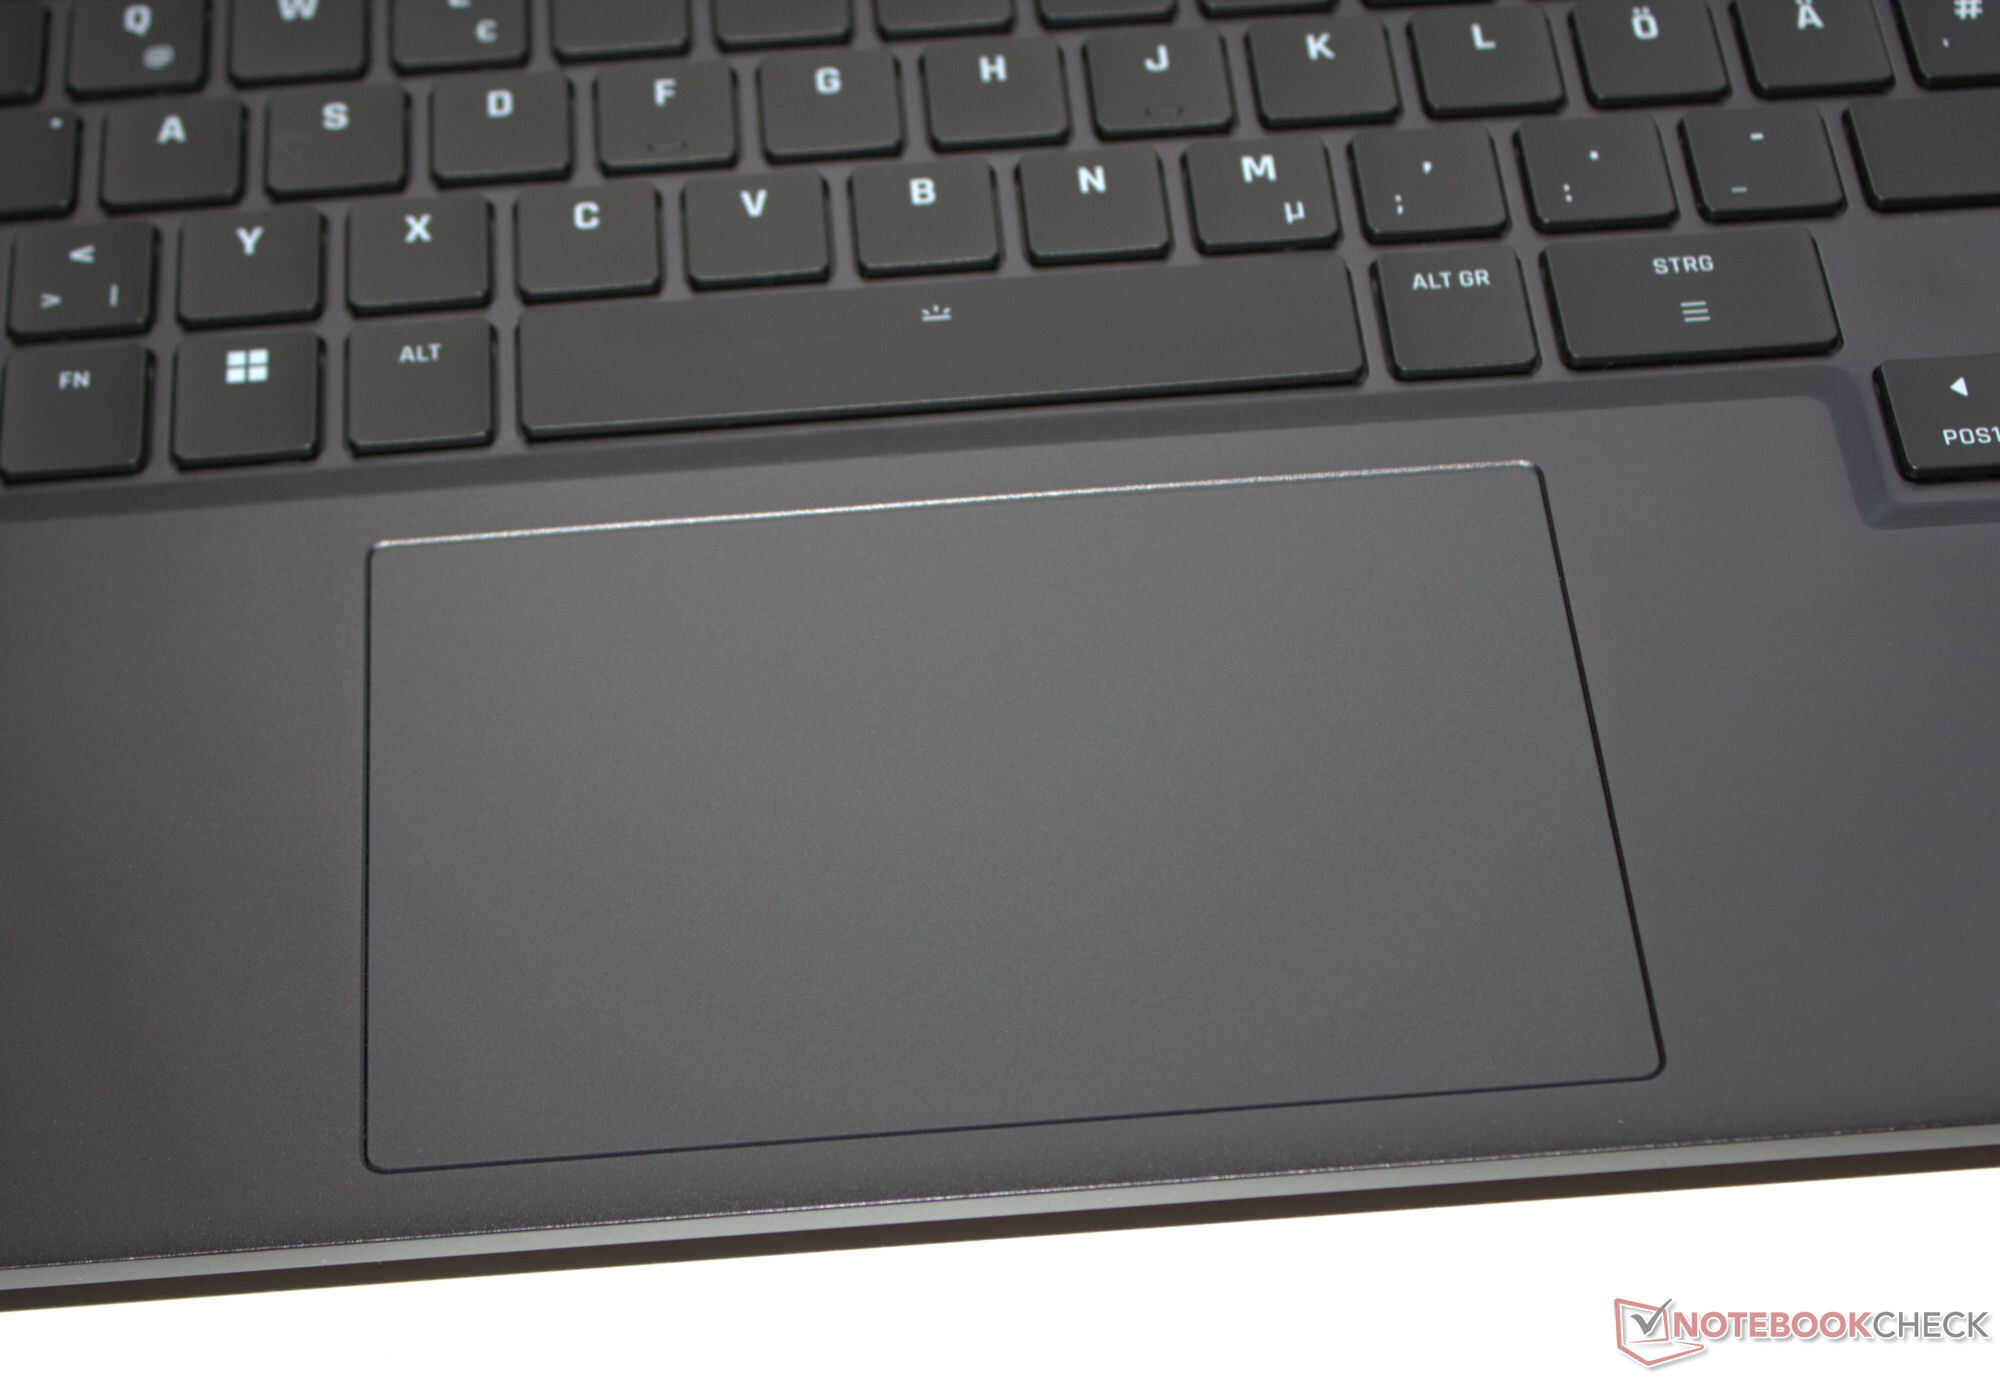
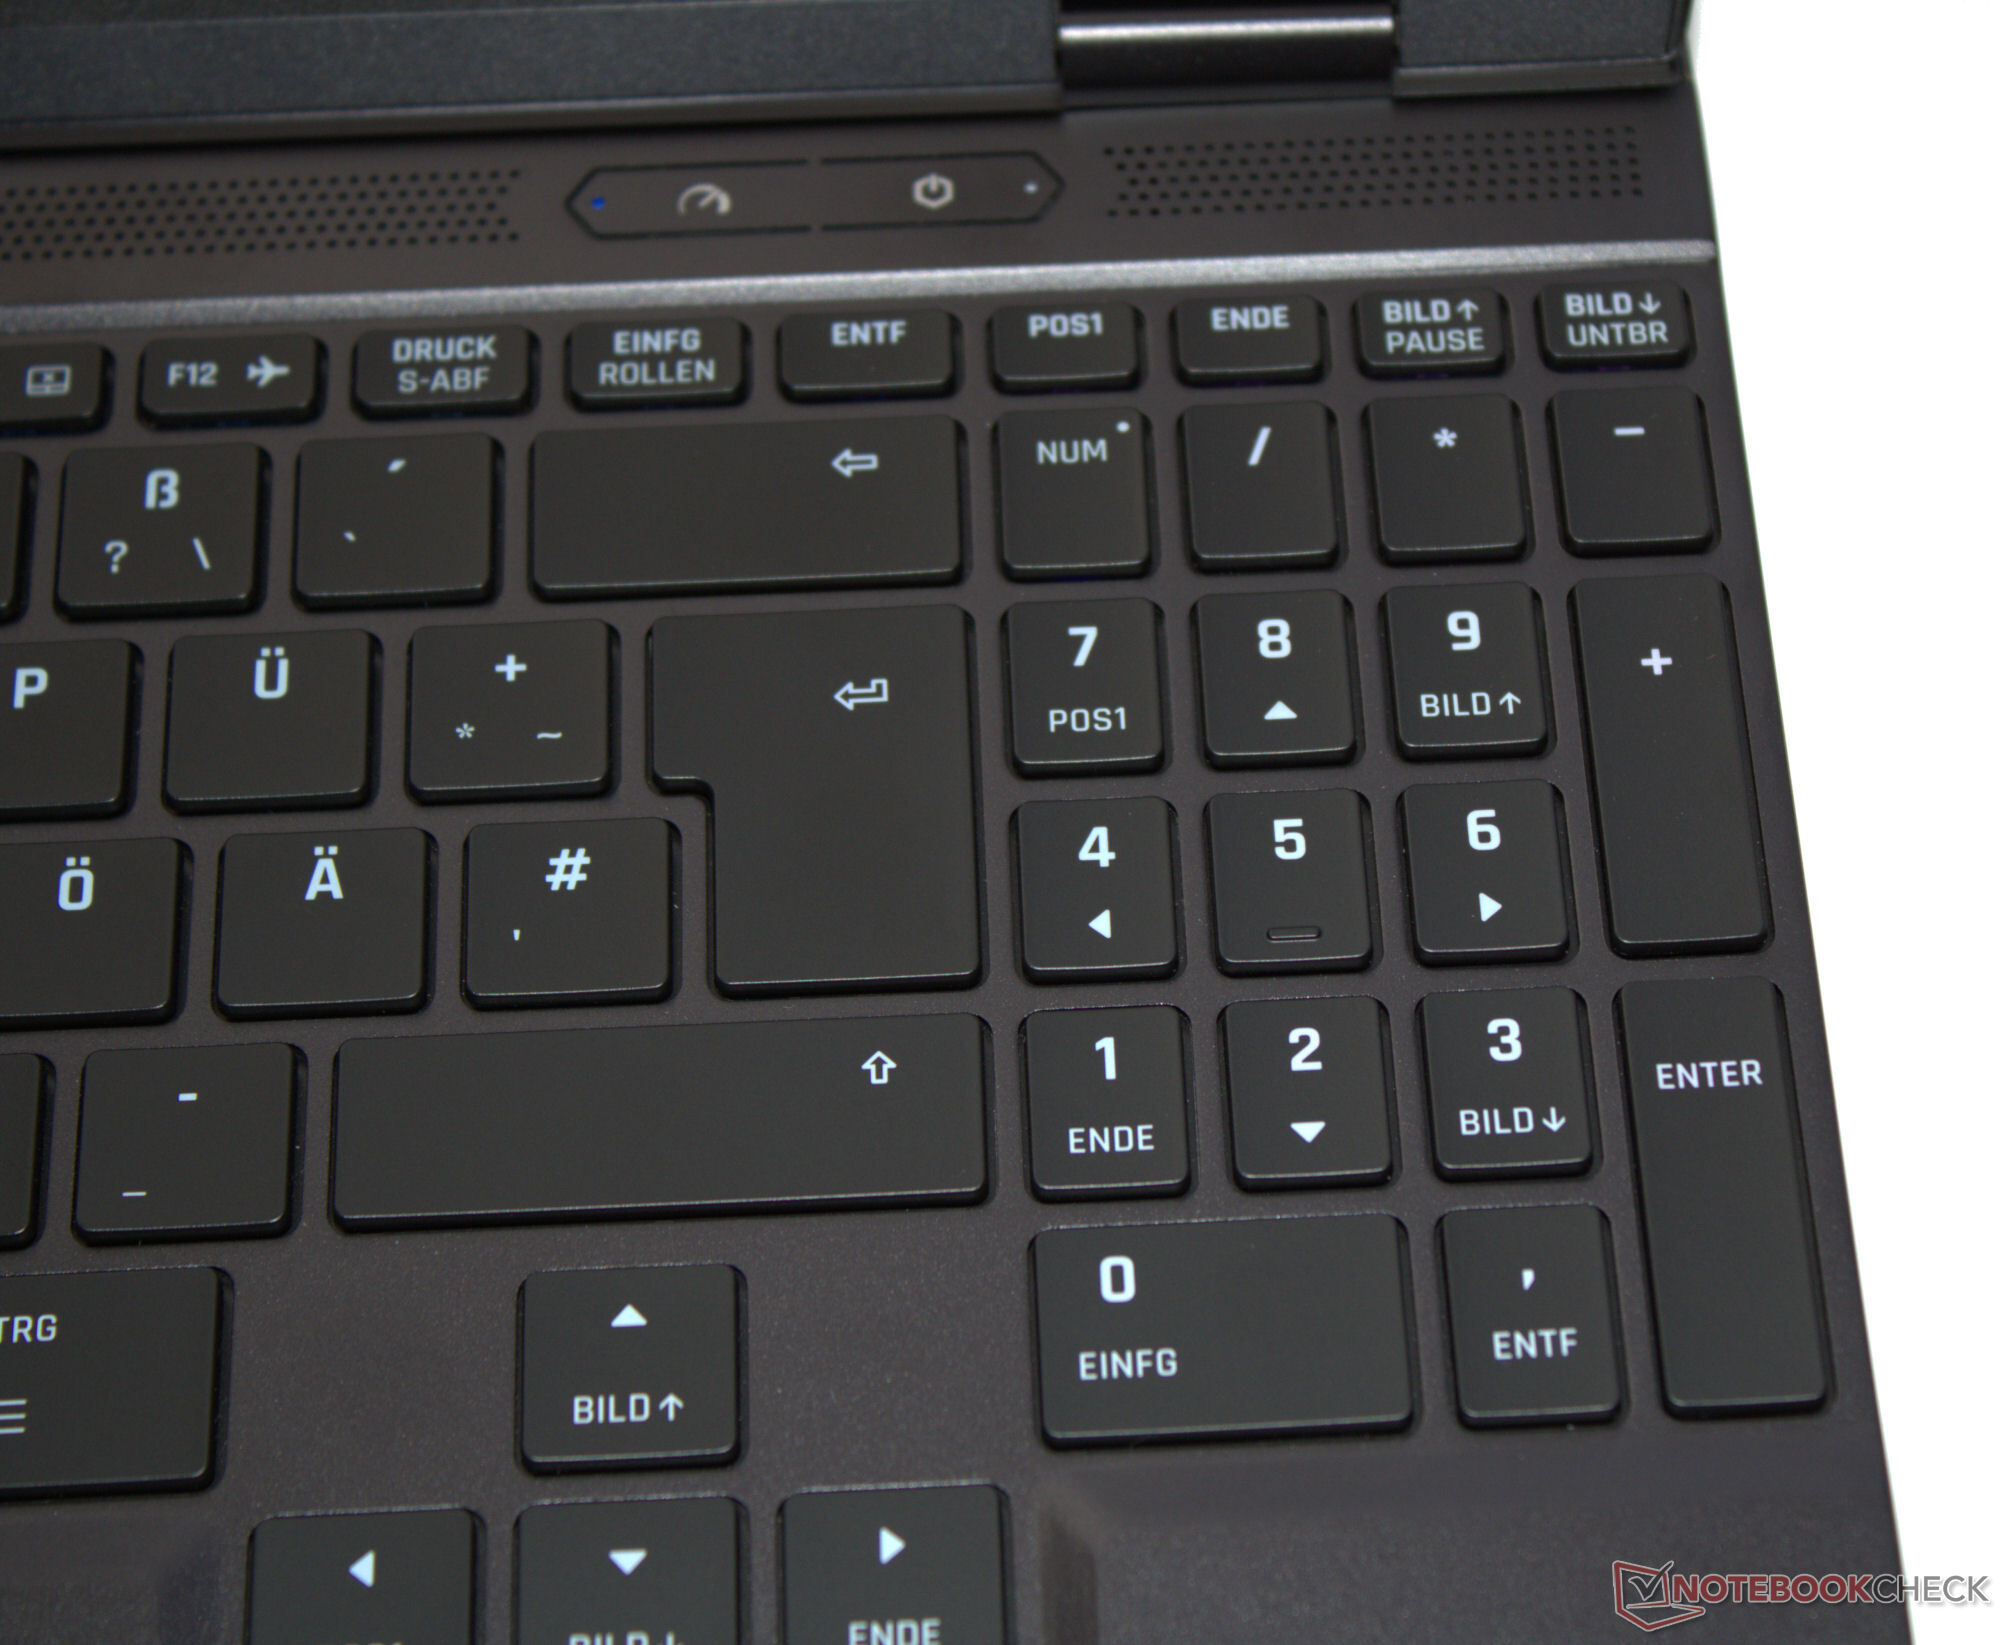
输入设备 - 单键 RGB 背光
键盘
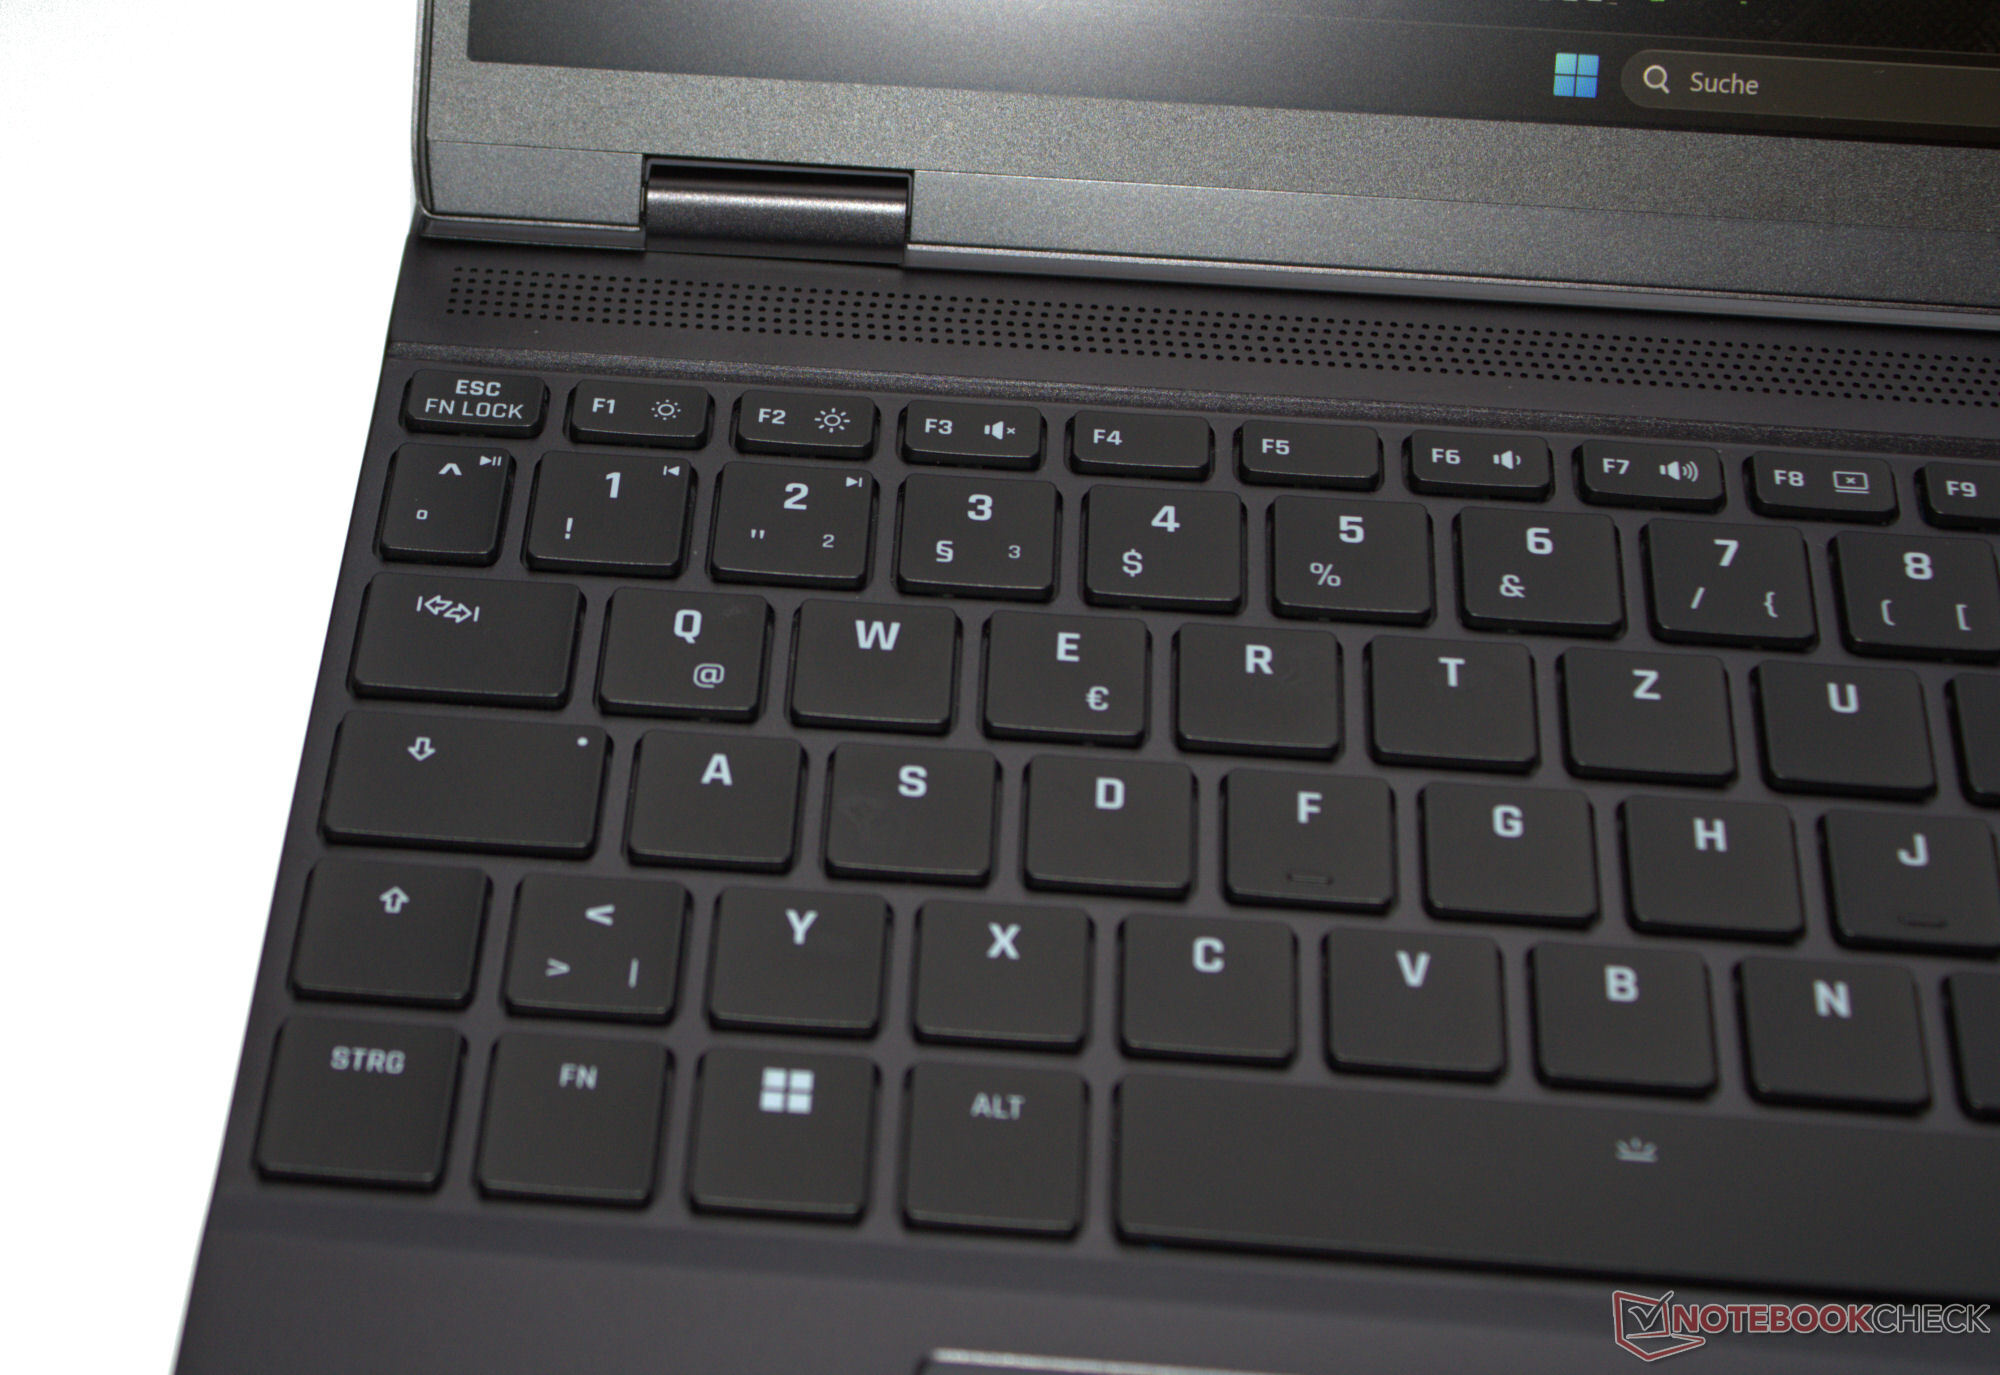
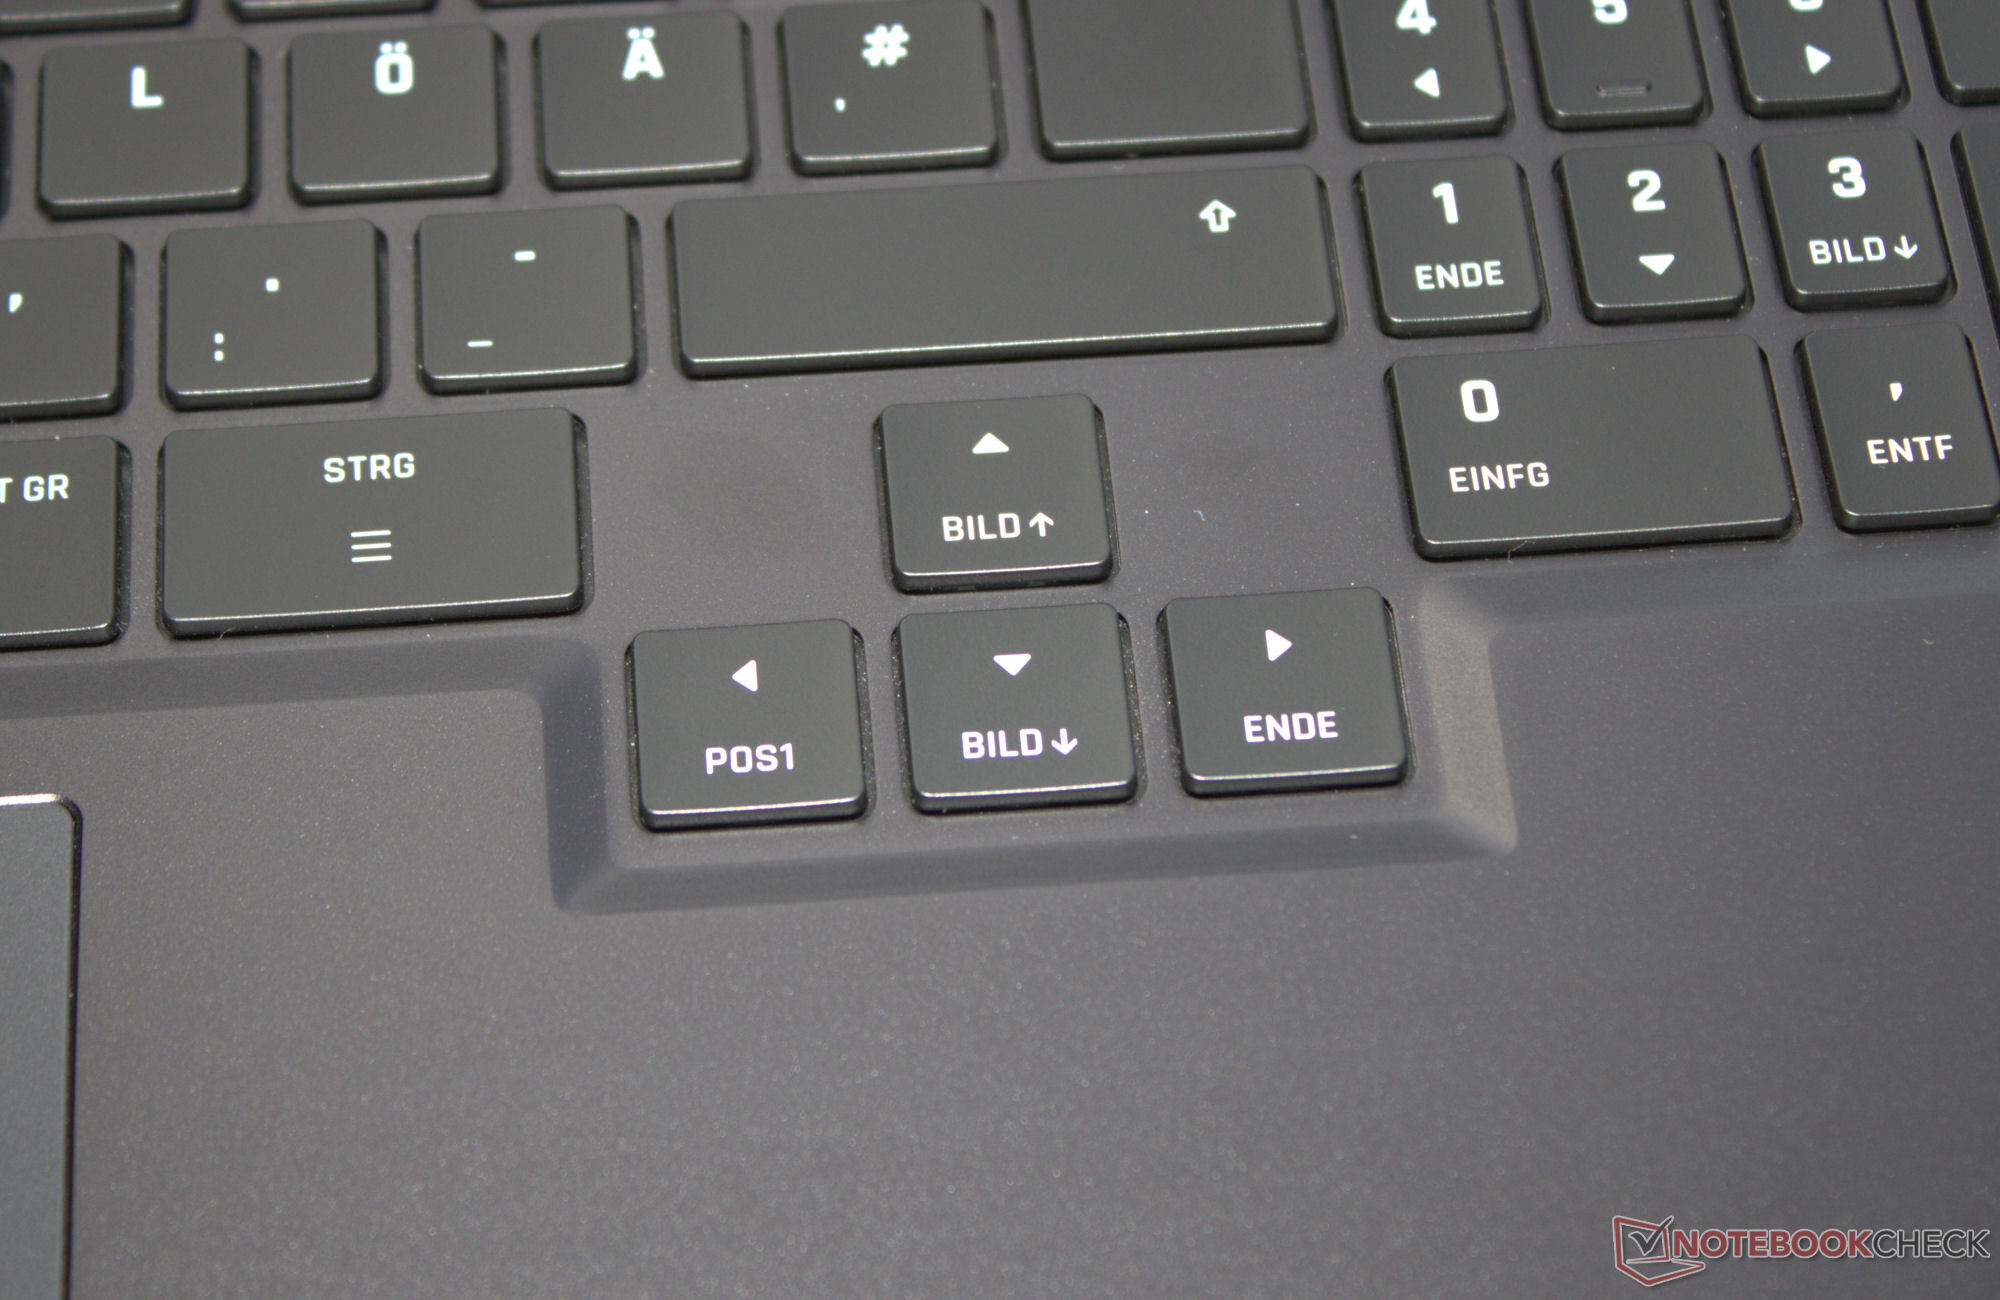
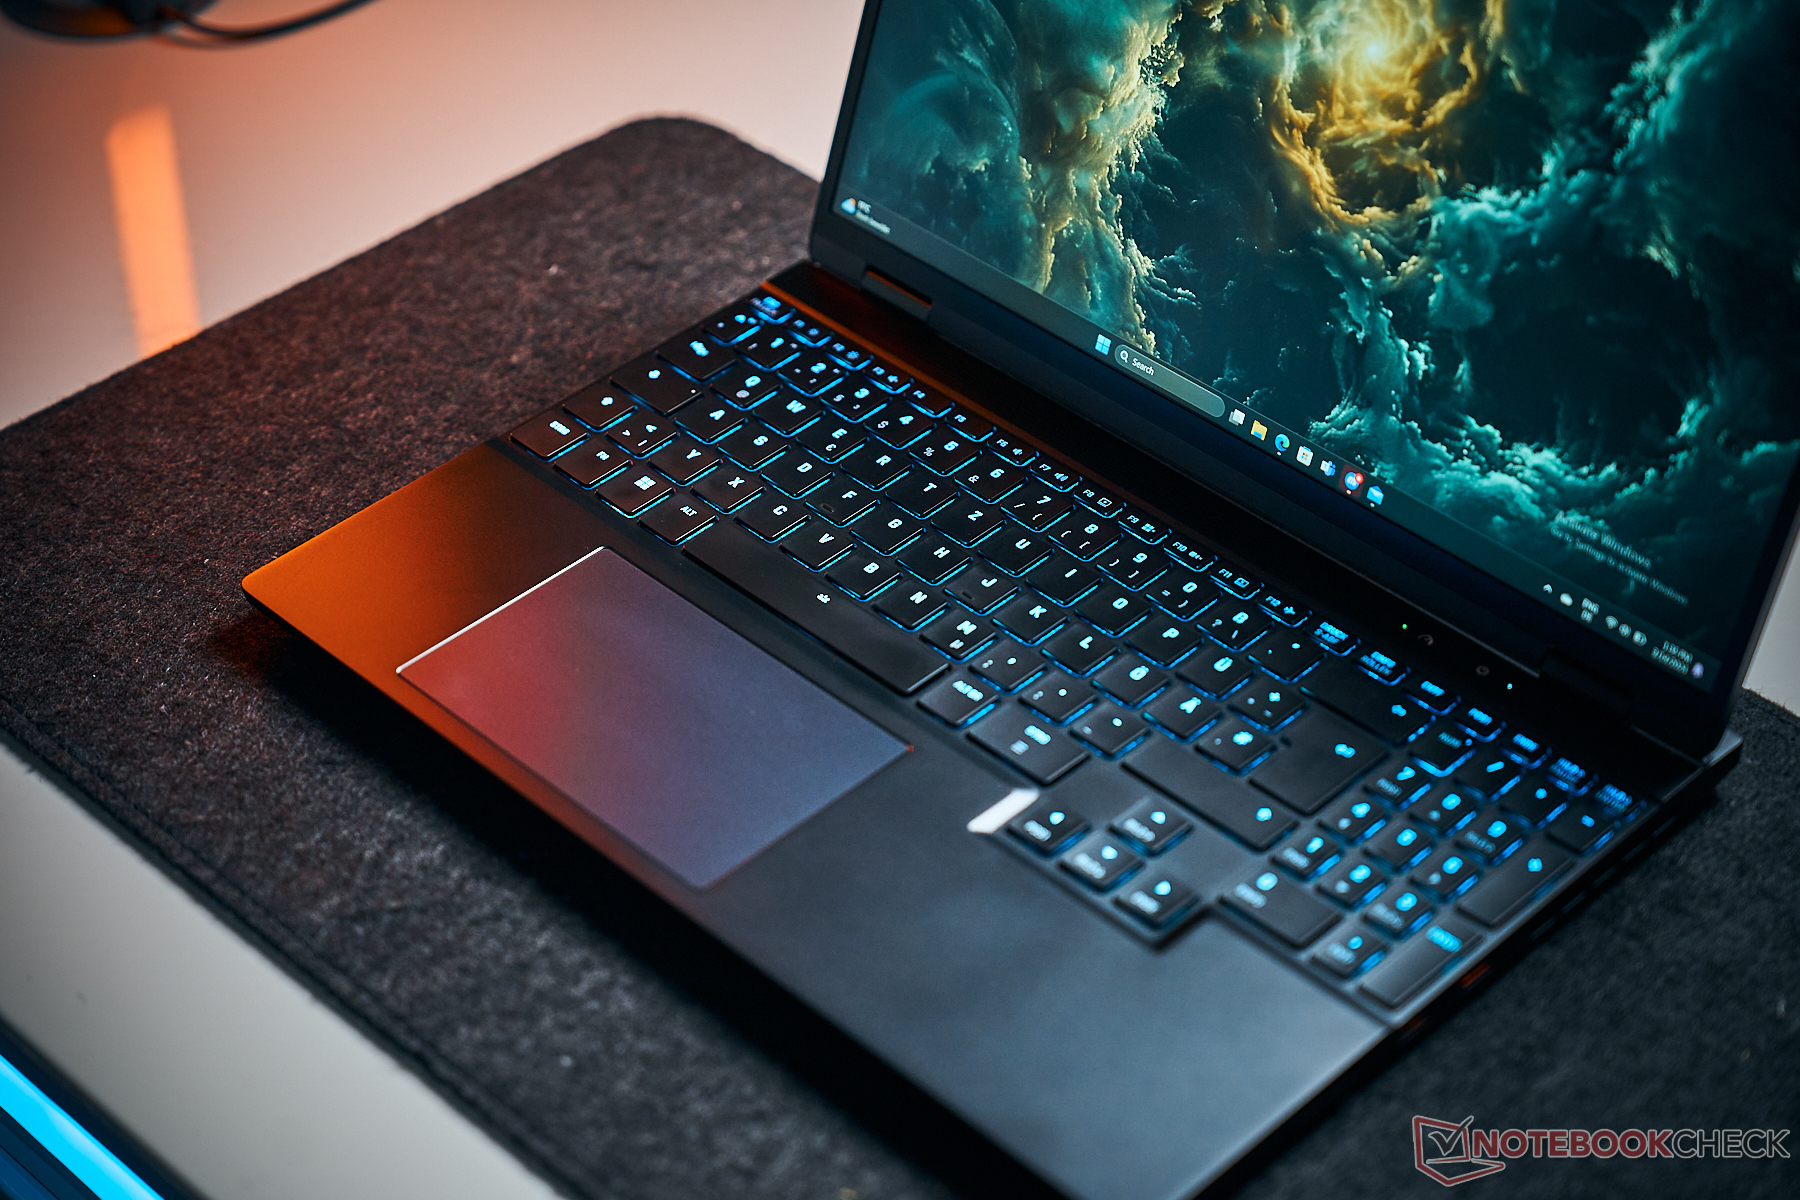
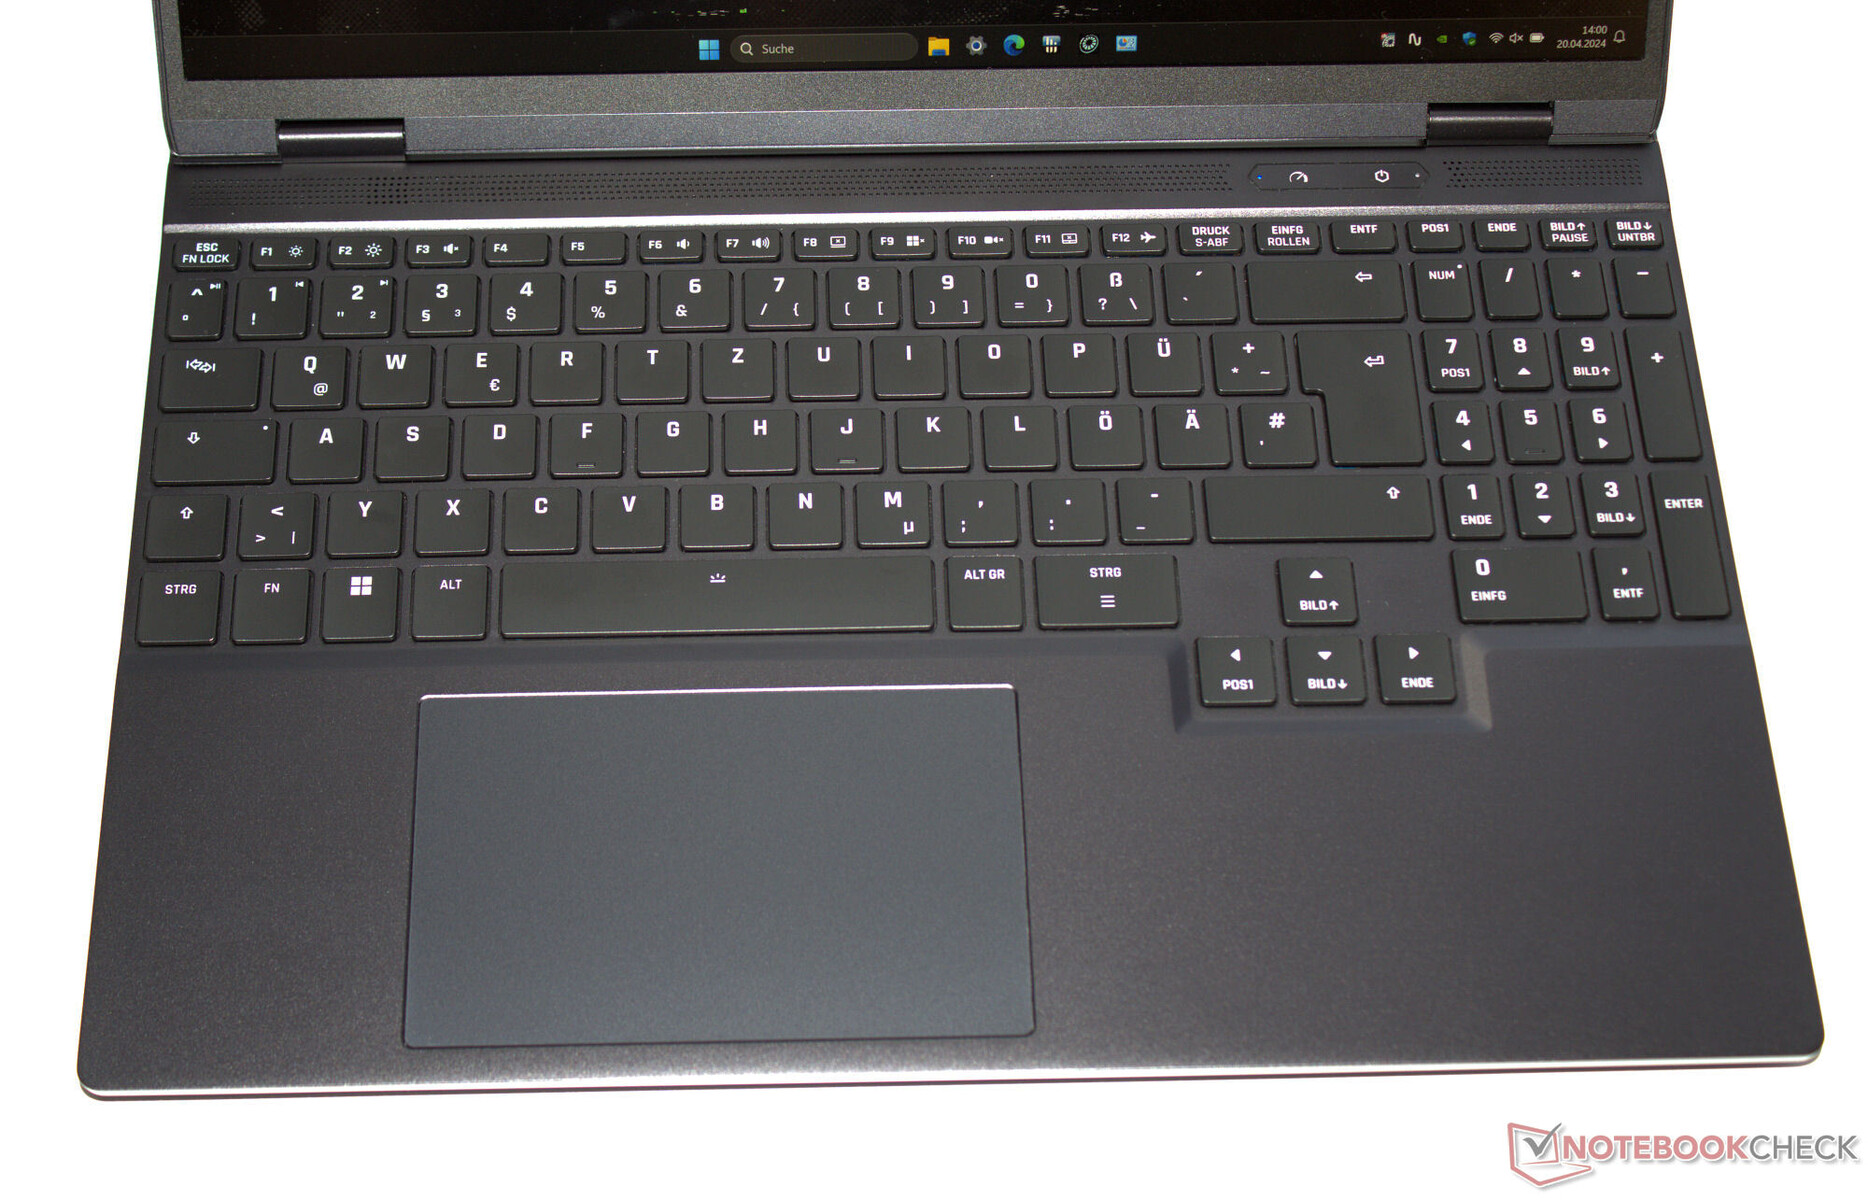
这款 Chiclet 键盘的按键(四级 RGB 背光)键程适中,按压点清晰。按键的阻力可以更小一些,但这是个人喜好的问题。键盘在键入时会有轻微的晃动,但在我们的测试过程中并不令人讨厌。正面:四个方向键不仅大小合适,而且与其他按键分开。
触摸板
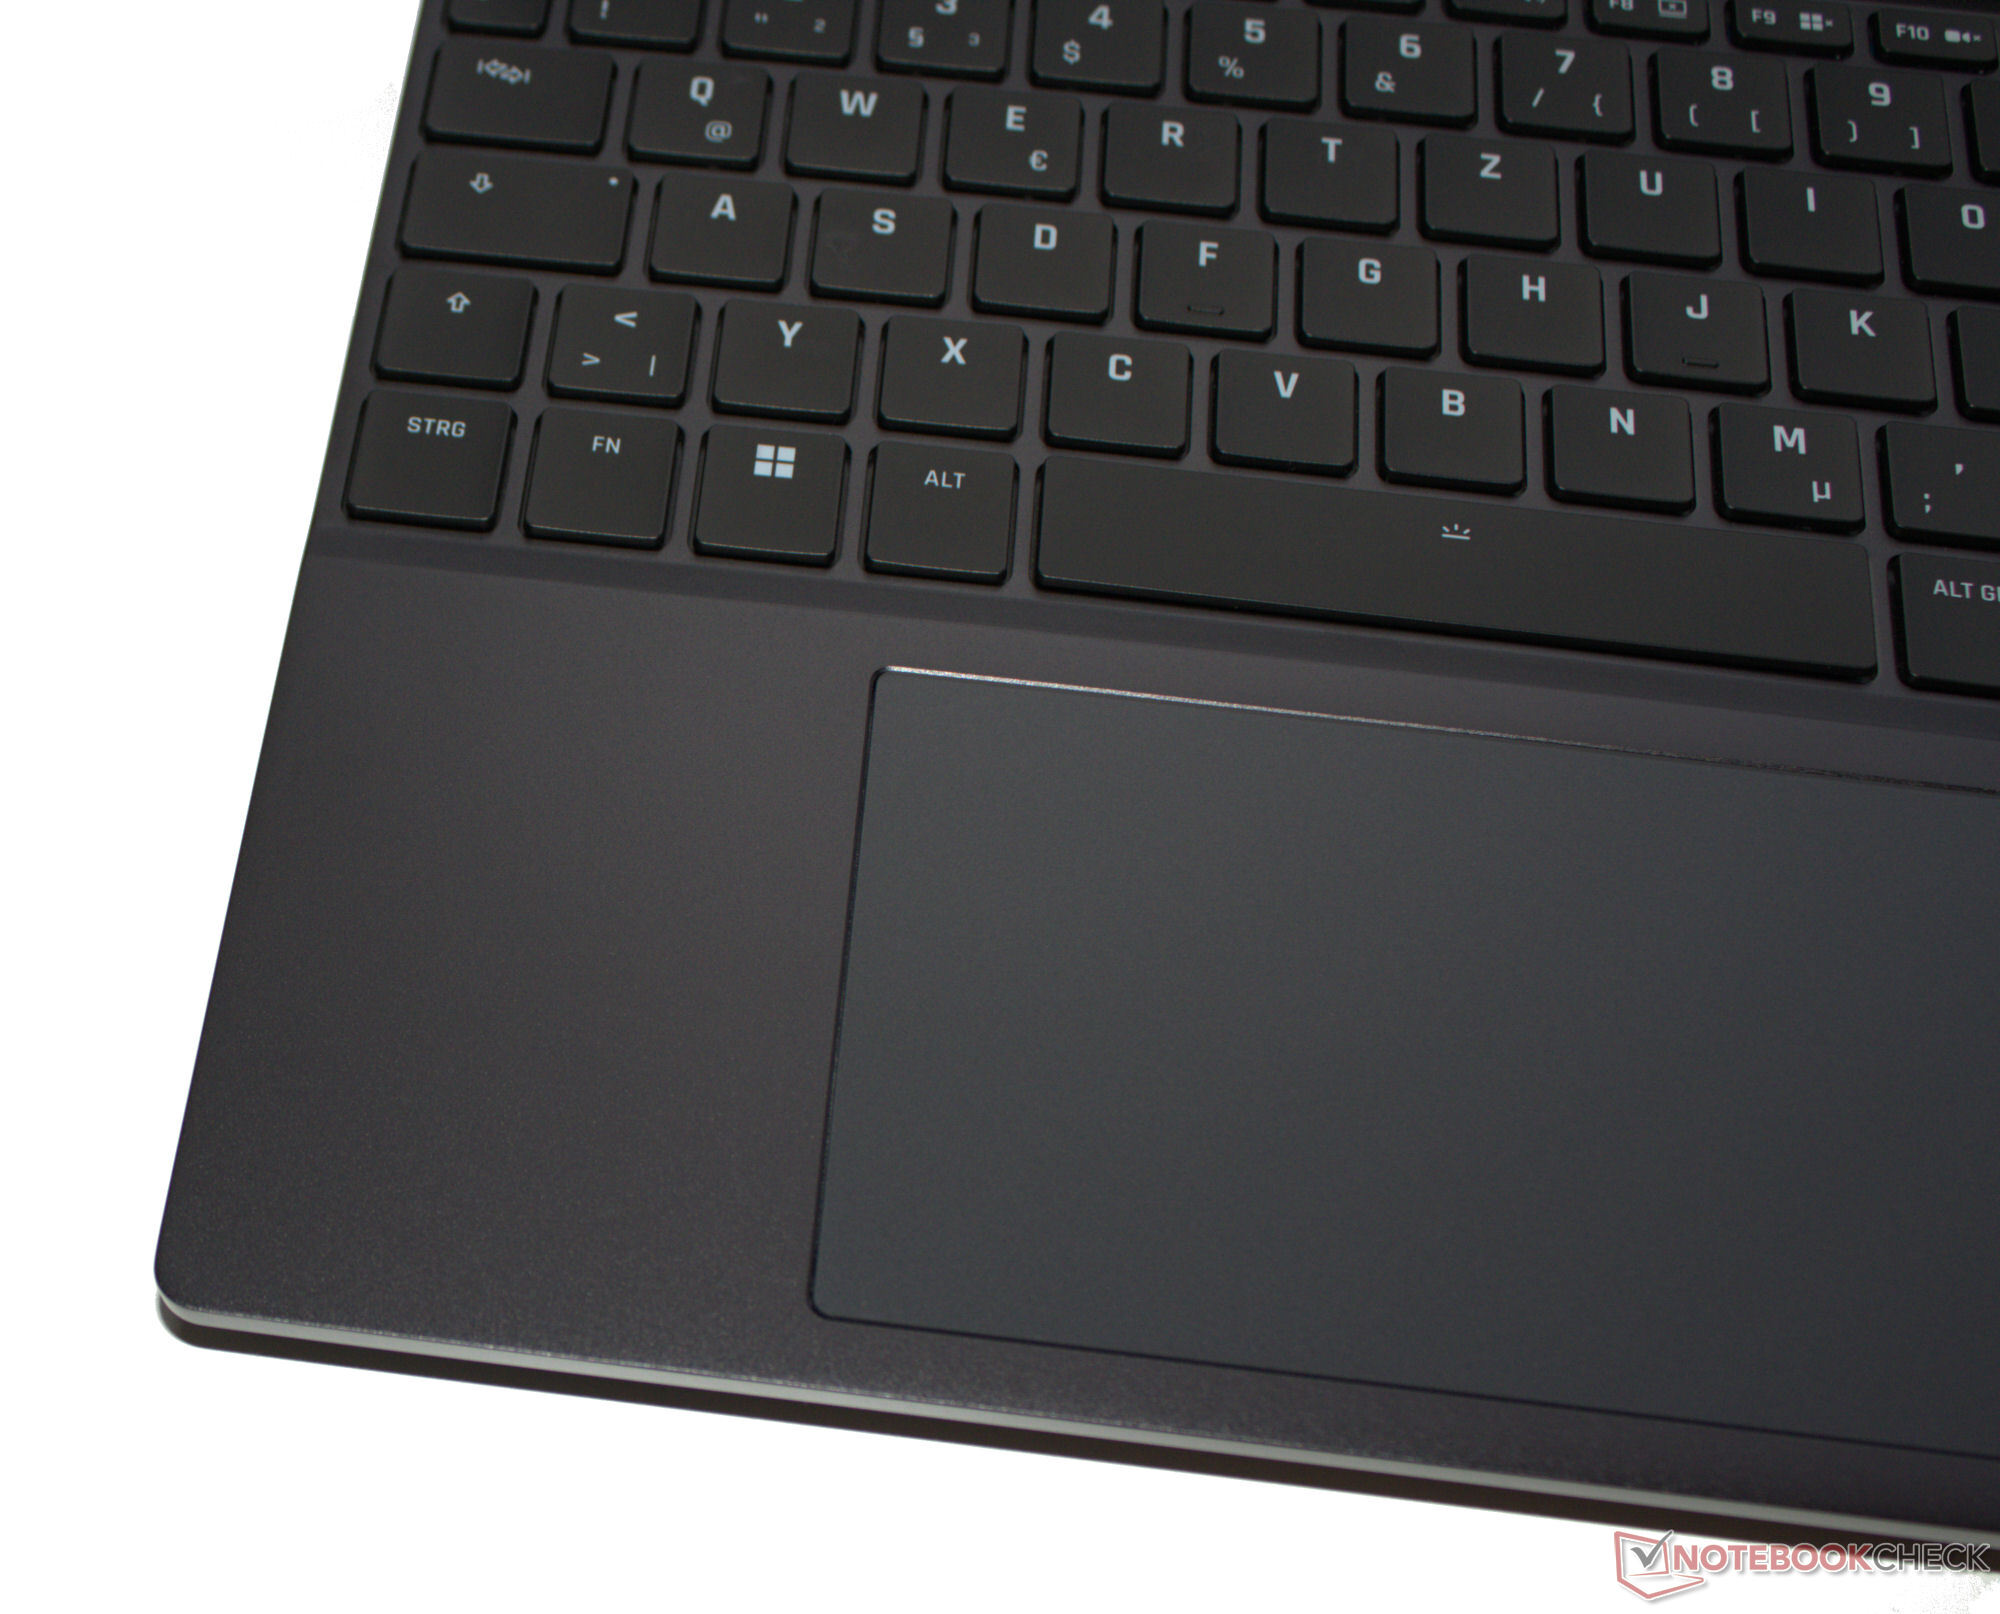
多点触摸点击板(约 12.3 x 7.8 厘米)取代了鼠标,光滑的表面便于手指滑动。它的特点是提升距离短,压力点清晰。
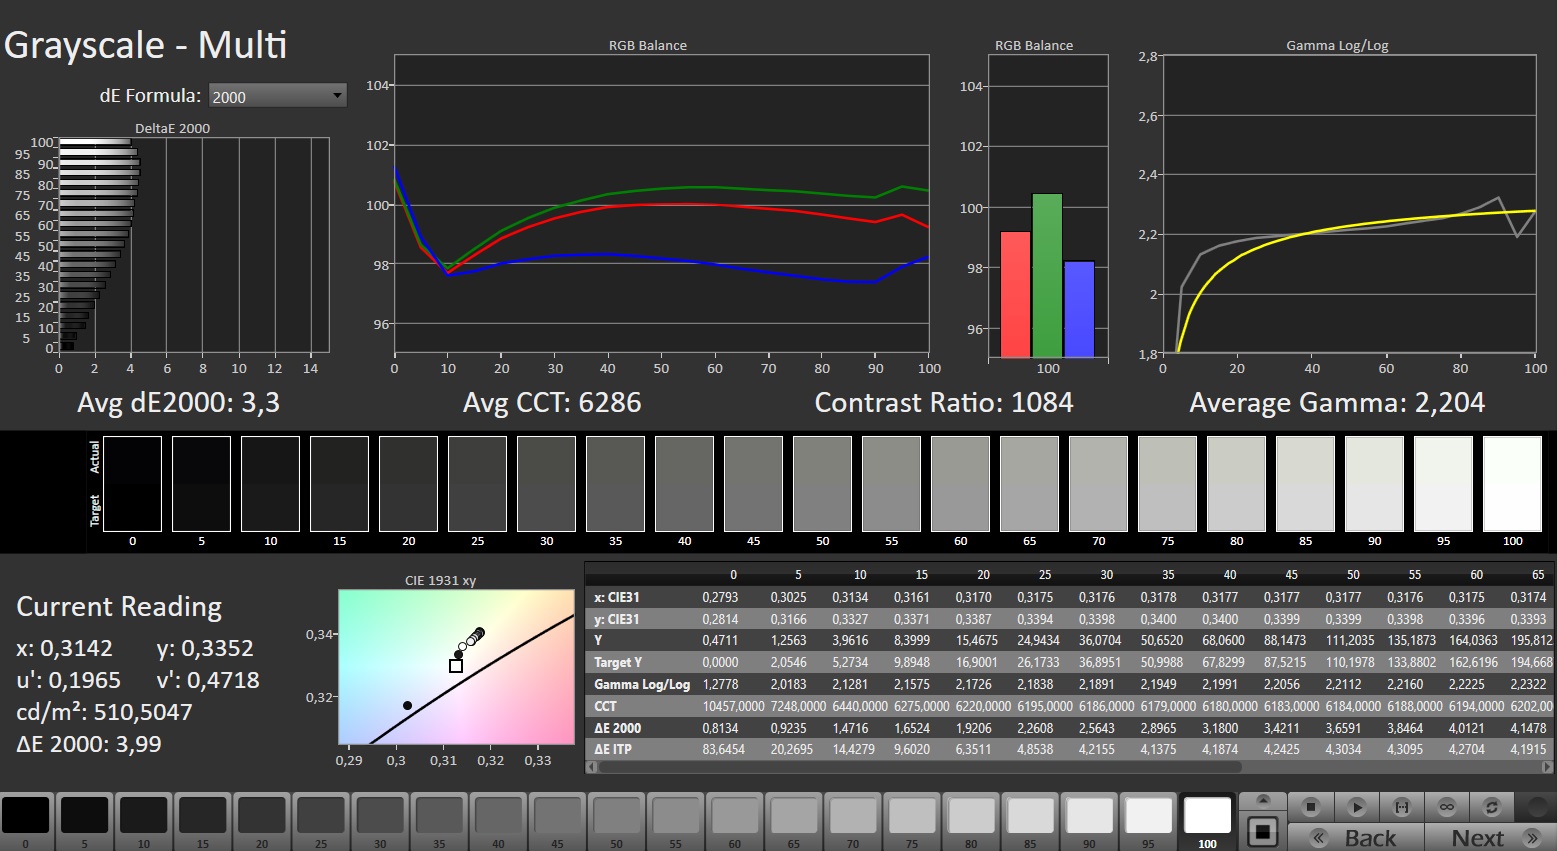
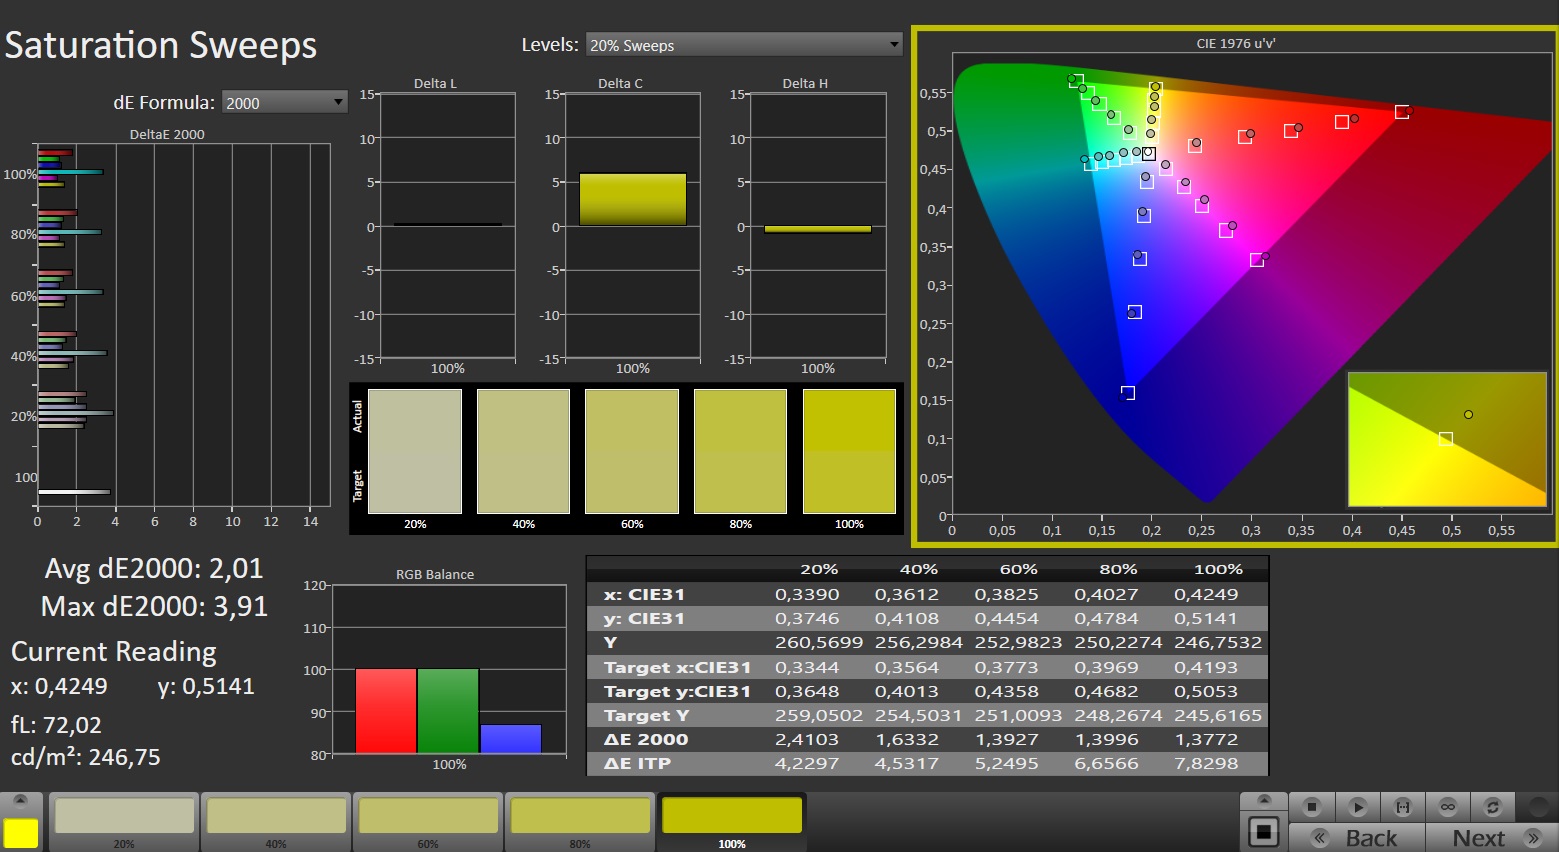
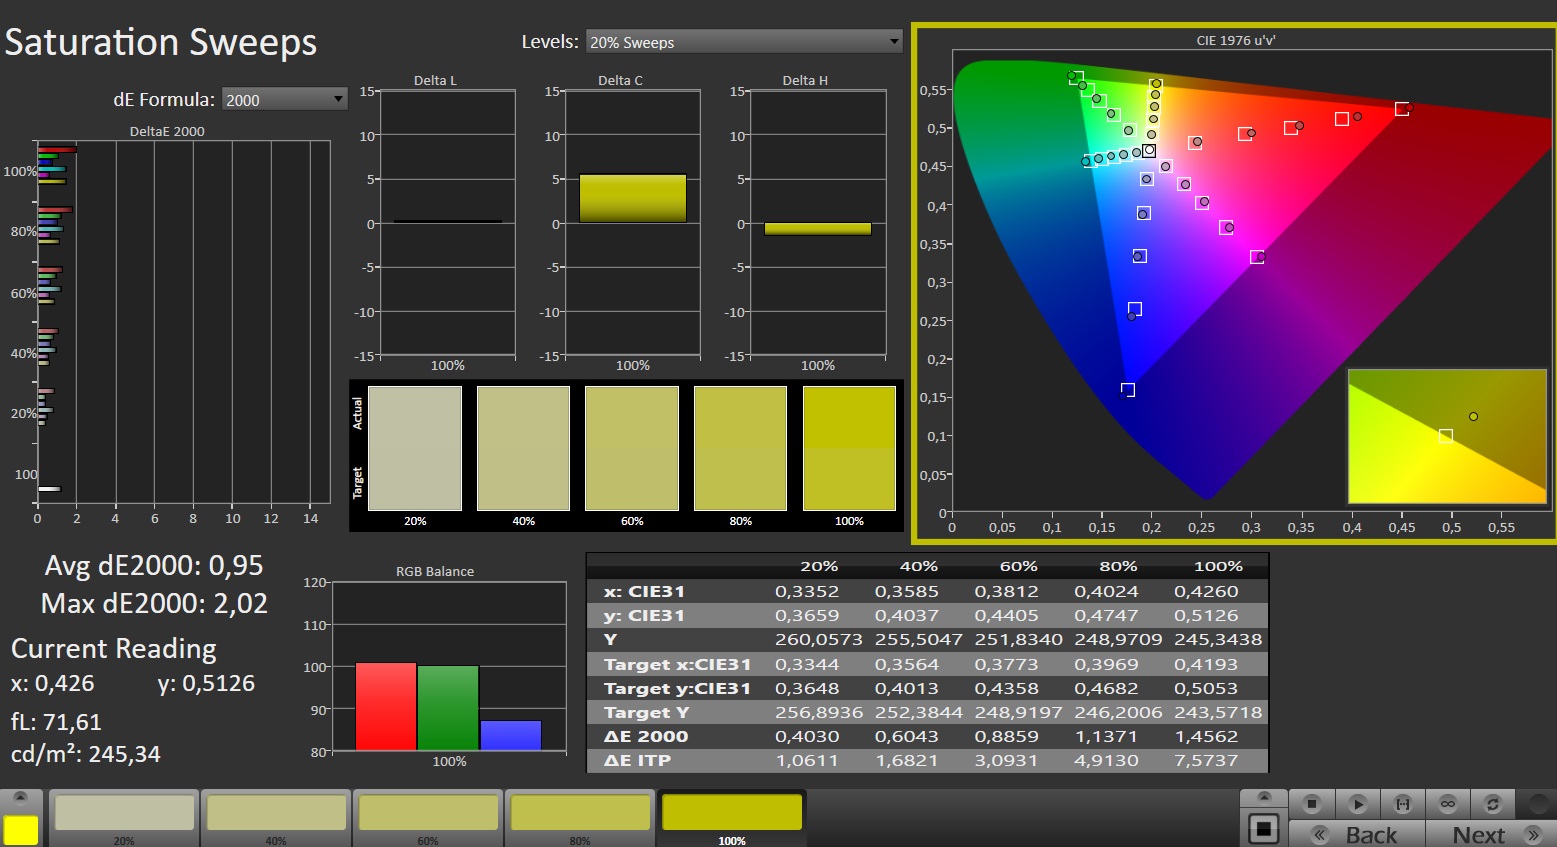
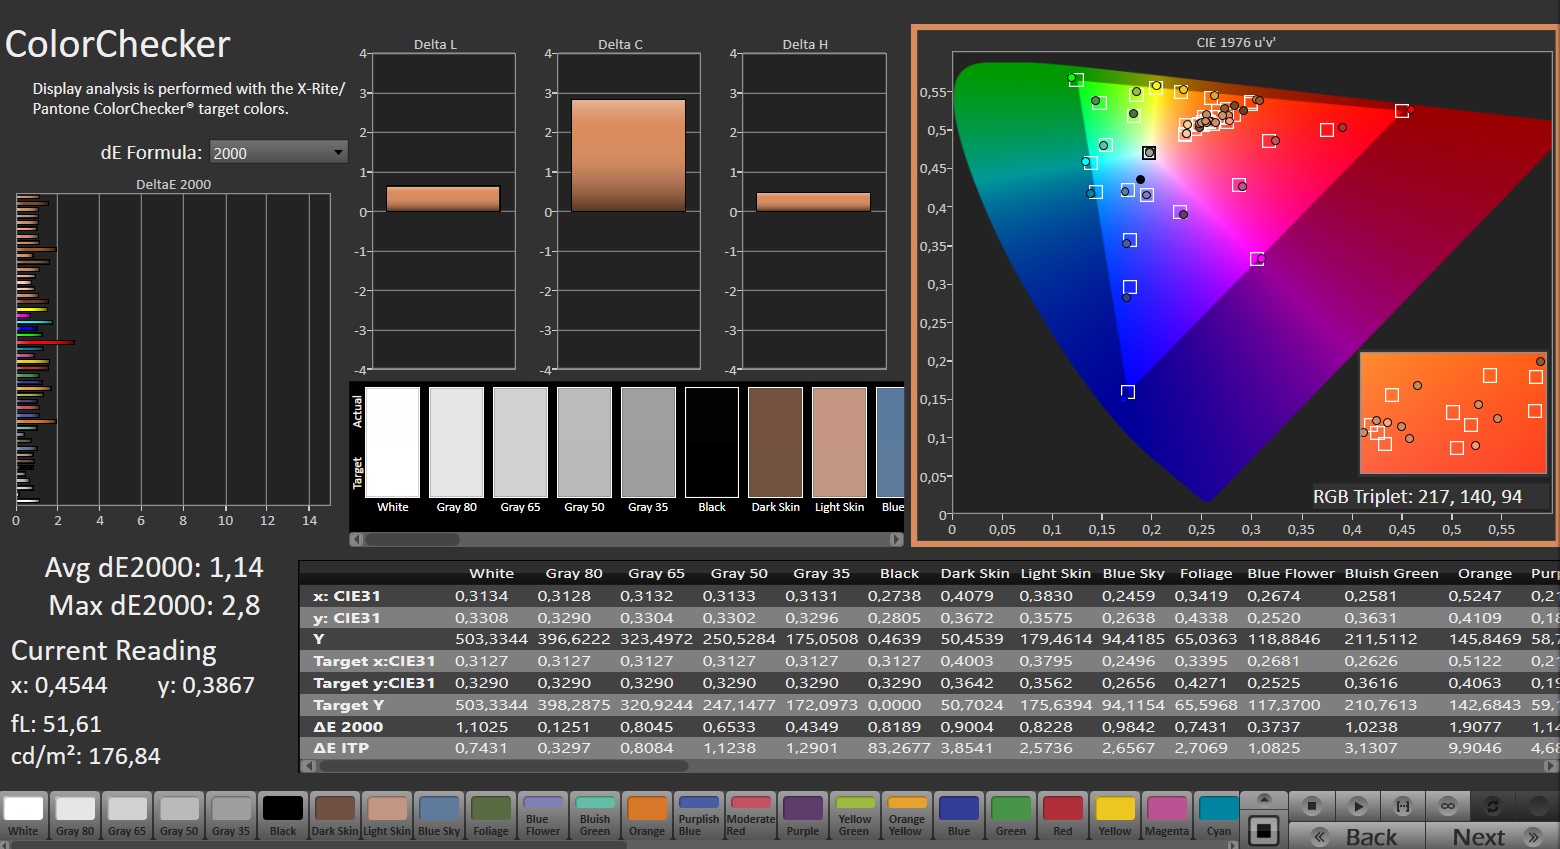
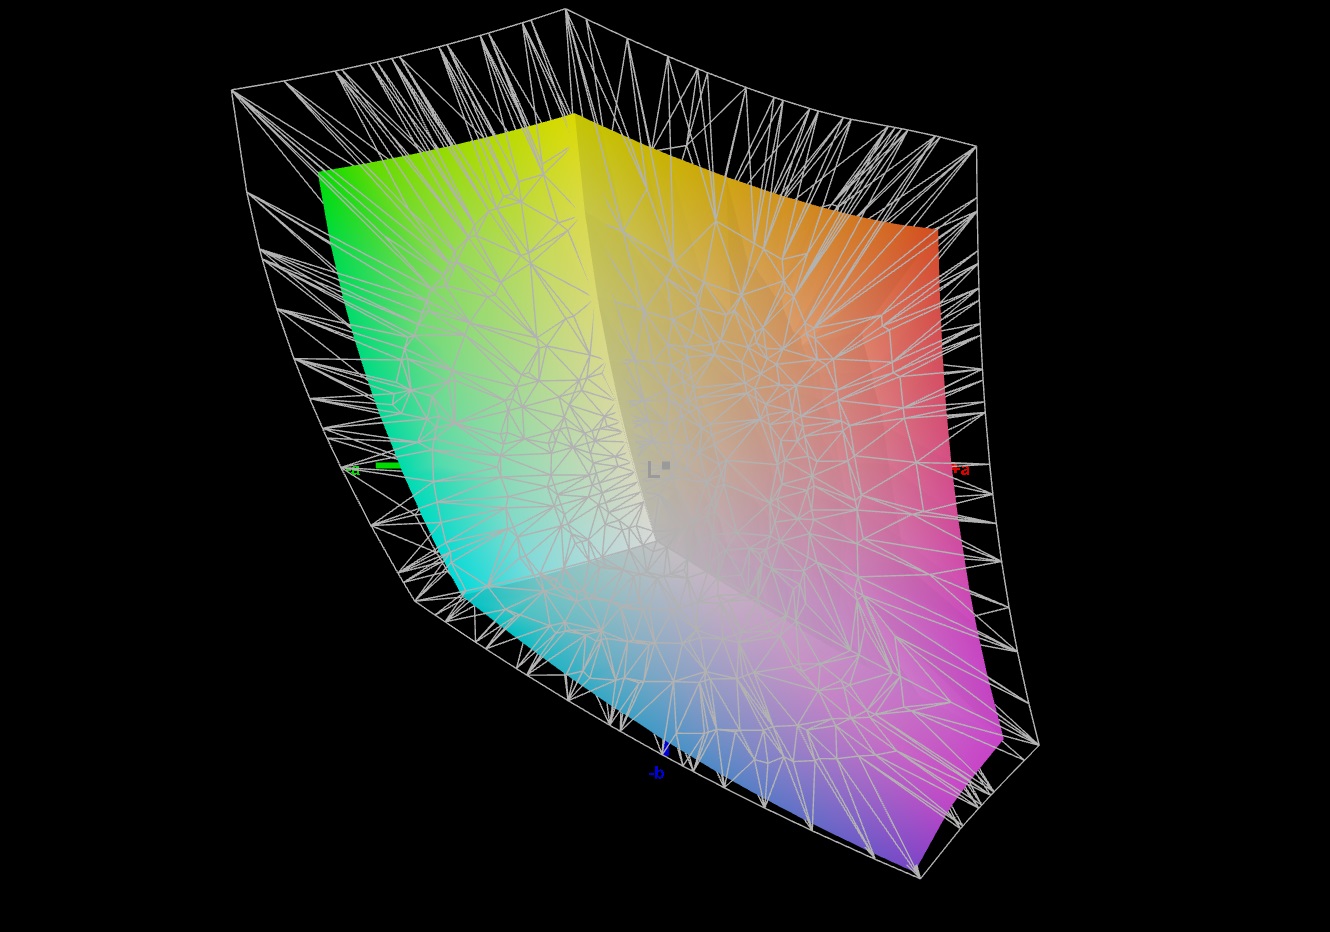
显示屏 - sRGB 覆盖范围的明亮面板
申克为 Fusion 配备了长宽比为 16:10 的 15.3 英寸屏幕(2560 x 1600 像素)。240-Hz 的哑光面板具有自适应同步、无 PWM 闪烁、响应时间短和亮度高的特点。不提供替代显示器。

| |||||||||||||||||||||||||
Brightness Distribution: 89 %
Center on Battery: 491 cd/m²
Contrast: 1045:1 (Black: 0.47 cd/m²)
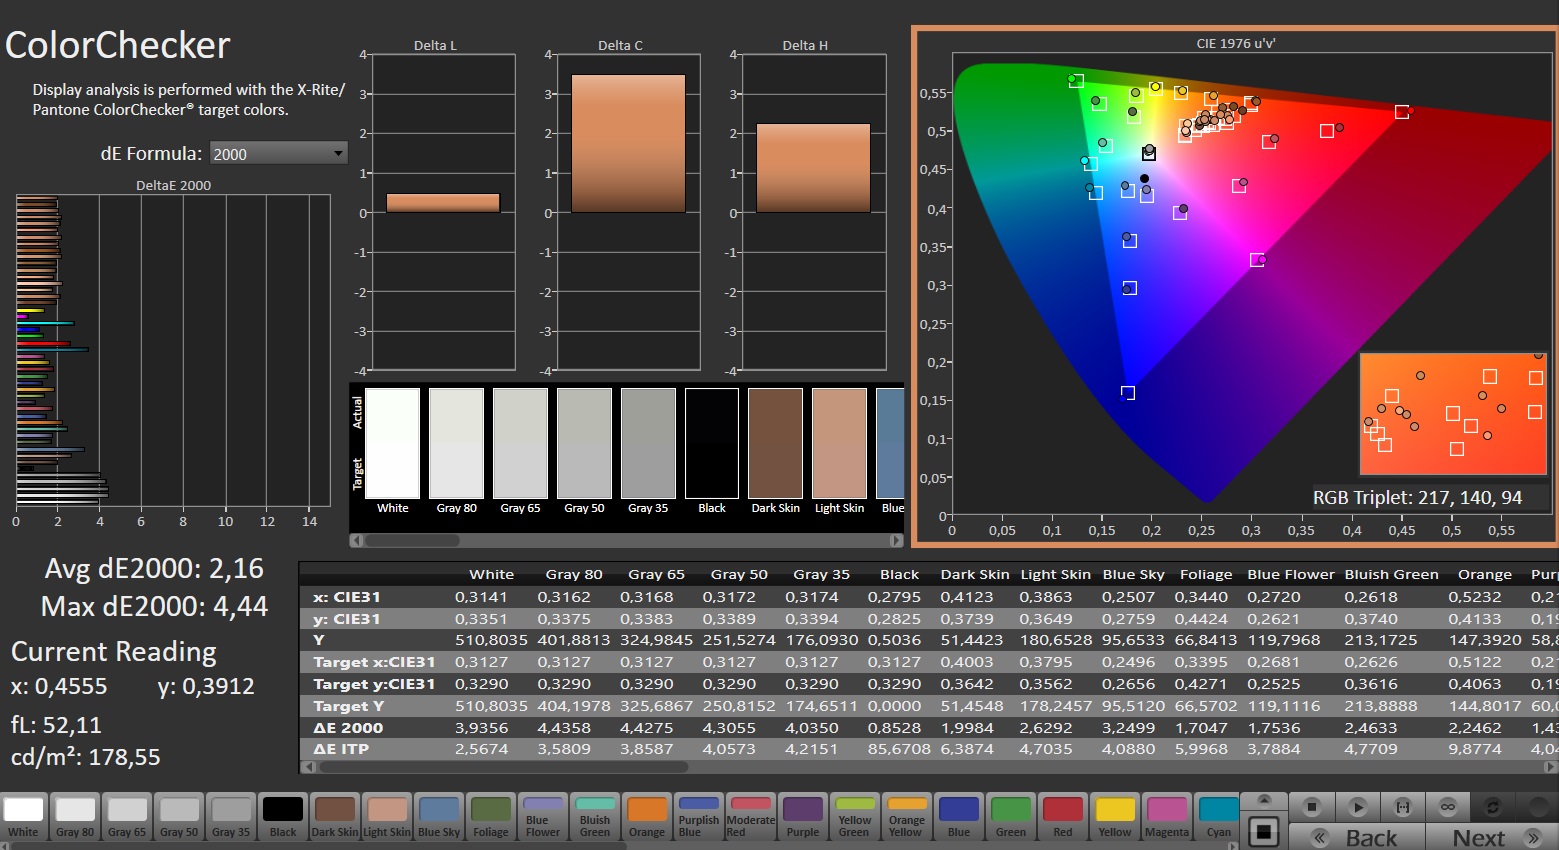
ΔE ColorChecker Calman: 2.16 | ∀{0.5-29.43 Ø4.71}
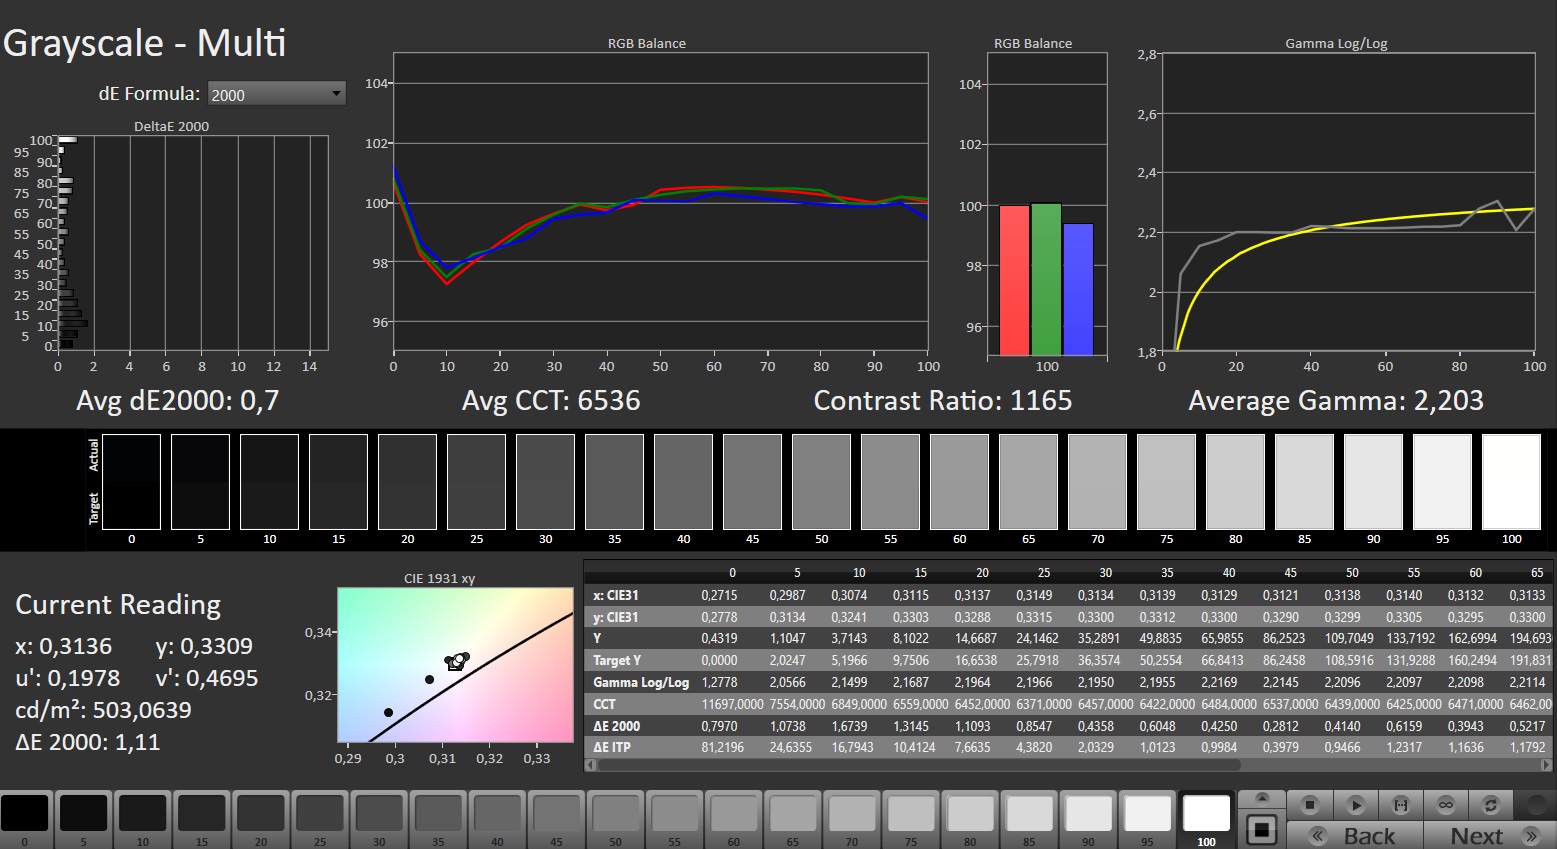
calibrated: 1.14
ΔE Greyscale Calman: 3.3 | ∀{0.09-98 Ø4.96}
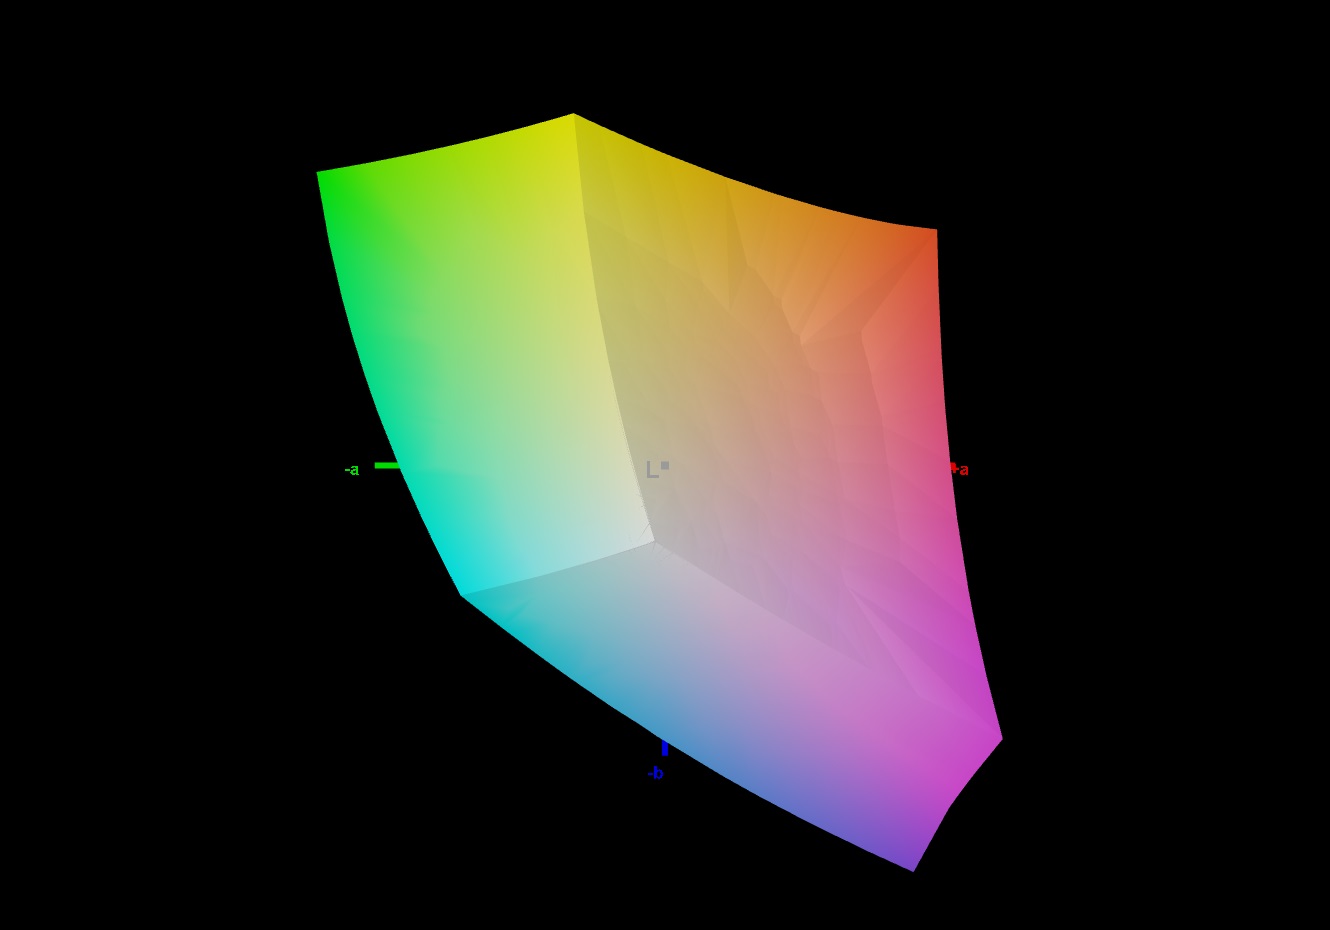
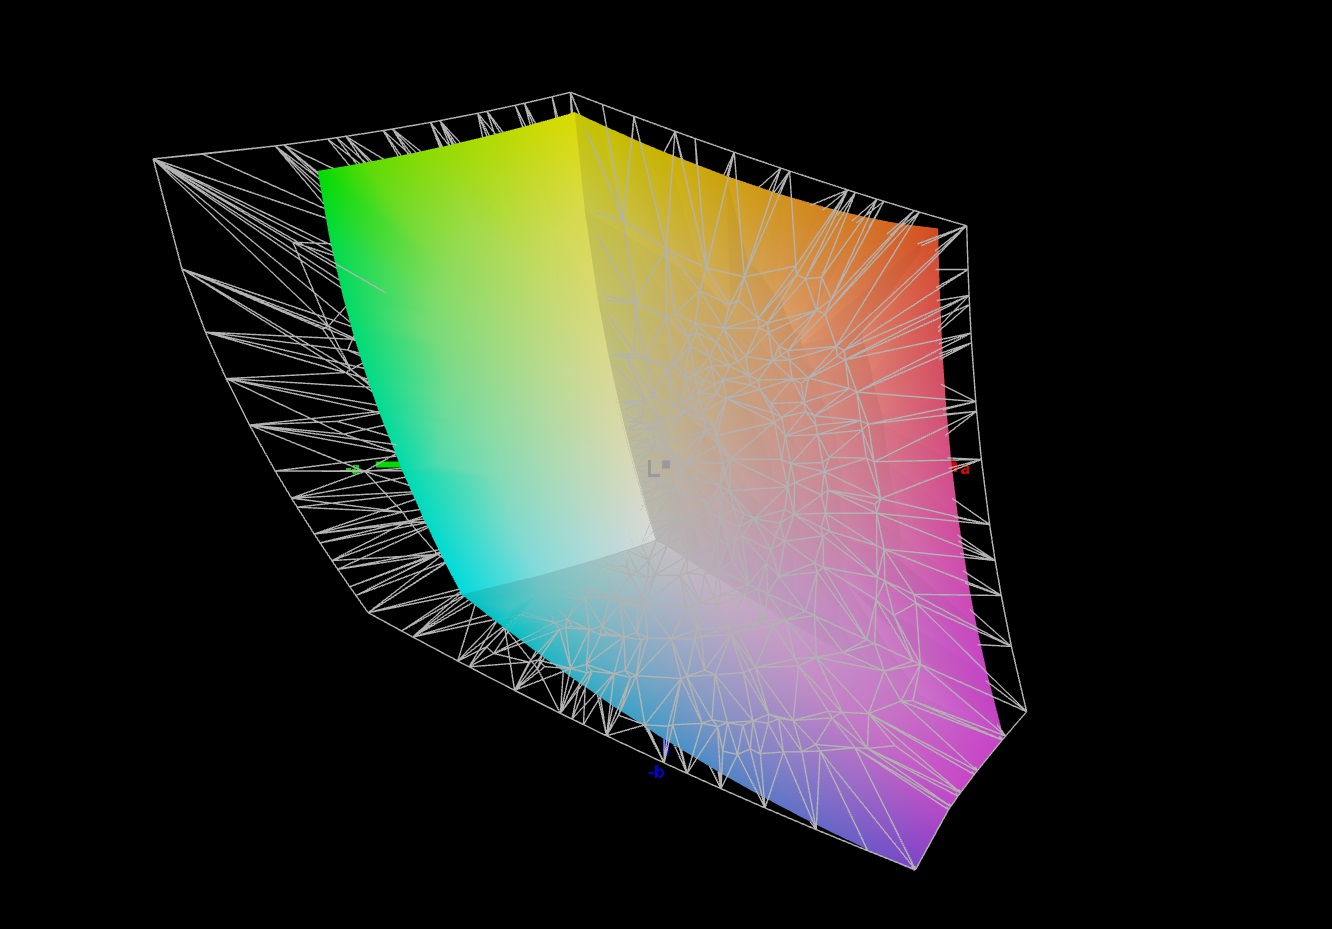
75% AdobeRGB 1998 (Argyll 3D)
100% sRGB (Argyll 3D)
73.5% Display P3 (Argyll 3D)
Gamma: 2.204
CCT: 6286 K
| Schenker XMG Fusion 15 (Early 24) BOE NJ NE153QDM-NZ1, IPS, 2560x1600, 15.3" | Aorus 16X 2024 BOE CQ NE160QDM-NY1, IPS, 2560x1600, 16" | Alienware m16 R2 BOE NE16NYH, IPS, 2560x1600, 16" | HP Omen Transcend 16-u1095ng ATNA60DL02-0 (SDC41A4), OLED, 2560x1600, 16" | Lenovo Legion Pro 5 16IRX9 BOE NE160QDM-NYC, IPS, 2560x1600, 16" | |
|---|---|---|---|---|---|
| Display | -7% | -3% | 22% | -5% | |
| Display P3 Coverage (%) | 73.5 | 67.2 -9% | 71 -3% | 99.8 36% | 69.3 -6% |
| sRGB Coverage (%) | 100 | 96.7 -3% | 100 0% | 100 0% | 99.4 -1% |
| AdobeRGB 1998 Coverage (%) | 75 | 69.3 -8% | 71.4 -5% | 97 29% | 70.1 -7% |
| Response Times | -27% | -41% | 96% | -105% | |
| Response Time Grey 50% / Grey 80% * (ms) | 5 ? | 7.5 ? -50% | 5.7 ? -14% | 0.2 ? 96% | 11.9 ? -138% |
| Response Time Black / White * (ms) | 5.2 ? | 5.4 ? -4% | 8.7 ? -67% | 0.2 ? 96% | 8.9 ? -71% |
| PWM Frequency (Hz) | 120 ? | ||||
| Screen | -1% | 11% | 182% | 17% | |
| Brightness middle (cd/m²) | 491 | 542 10% | 345.8 -30% | 390 -21% | 384 -22% |
| Brightness (cd/m²) | 460 | 504 10% | 337 -27% | 392 -15% | 366 -20% |
| Brightness Distribution (%) | 89 | 86 -3% | 87 -2% | 98 10% | 91 2% |
| Black Level * (cd/m²) | 0.47 | 0.45 4% | 0.3 36% | 0.02 96% | 0.35 26% |
| Contrast (:1) | 1045 | 1204 15% | 1153 10% | 19500 1766% | 1097 5% |
| Colorchecker dE 2000 * | 2.16 | 2.73 -26% | 1.99 8% | 1.94 10% | 0.97 55% |
| Colorchecker dE 2000 max. * | 4.44 | 5.29 -19% | 3.52 21% | 4.26 4% | 3.57 20% |
| Colorchecker dE 2000 calibrated * | 1.14 | 1.32 -16% | 0.62 46% | 4.21 -269% | 0.77 32% |
| Greyscale dE 2000 * | 3.3 | 2.9 12% | 2.1 36% | 1.5 55% | 1.5 55% |
| Gamma | 2.204 100% | 2.192 100% | 2.32 95% | 2.221 99% | 2.24 98% |
| CCT | 6286 103% | 6173 105% | 6369 102% | 6395 102% | 6709 97% |
| Total Average (Program / Settings) | -12% /
-6% | -11% /
1% | 100% /
135% | -31% /
-5% |
* ... smaller is better
显示器开箱即显示出良好的色彩显示效果:偏差约为 2.2,达到了目标值(DeltaE < 3)。对显示器进行校准后,偏差降低到 1.14,灰阶色调更加均衡。面板能够完全覆盖 sRGB 色彩空间,但不能覆盖 AdobeRGB 或 DCI P3 色彩空间。这与大多数竞争对手的屏幕并无不同。
Display Response Times
| ↔ Response Time Black to White | ||
|---|---|---|
| 5.2 ms ... rise ↗ and fall ↘ combined | ↗ 1.5 ms rise | 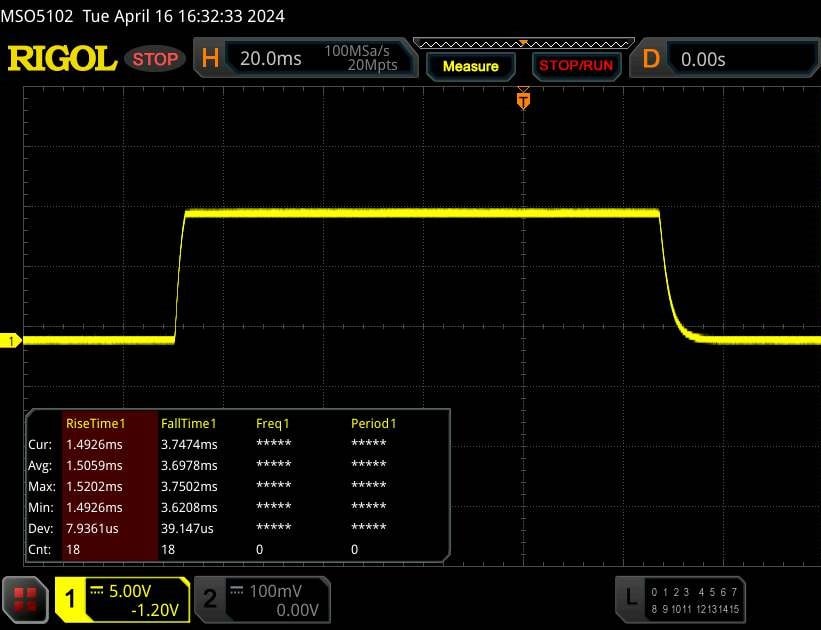 |
| ↘ 3.7 ms fall | ||
| The screen shows very fast response rates in our tests and should be very well suited for fast-paced gaming. In comparison, all tested devices range from 0.1 (minimum) to 240 (maximum) ms. » 18 % of all devices are better. This means that the measured response time is better than the average of all tested devices (19.8 ms). | ||
| ↔ Response Time 50% Grey to 80% Grey | ||
| 5 ms ... rise ↗ and fall ↘ combined | ↗ 2.3 ms rise | 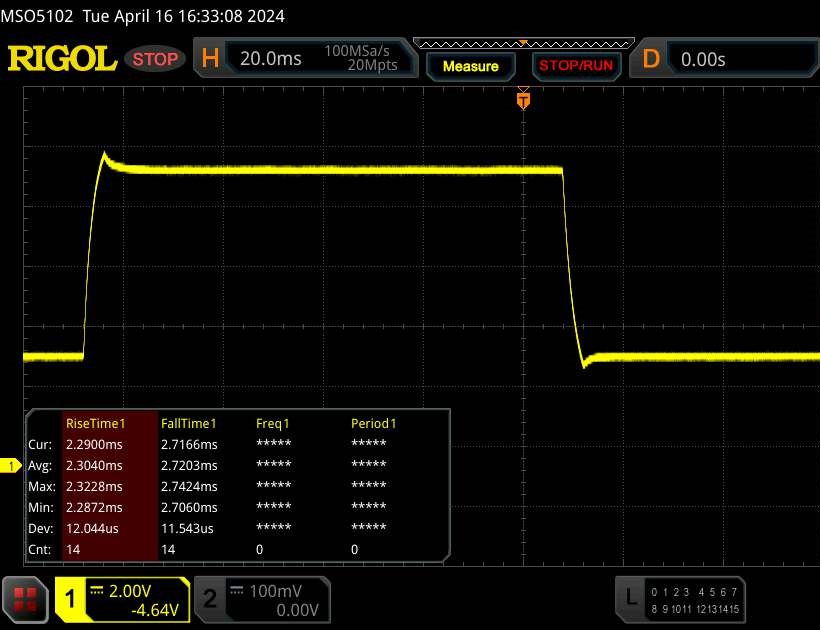 |
| ↘ 2.7 ms fall | ||
| The screen shows very fast response rates in our tests and should be very well suited for fast-paced gaming. In comparison, all tested devices range from 0.165 (minimum) to 636 (maximum) ms. » 17 % of all devices are better. This means that the measured response time is better than the average of all tested devices (31 ms). | ||
Screen Flickering / PWM (Pulse-Width Modulation)
| Screen flickering / PWM not detected | 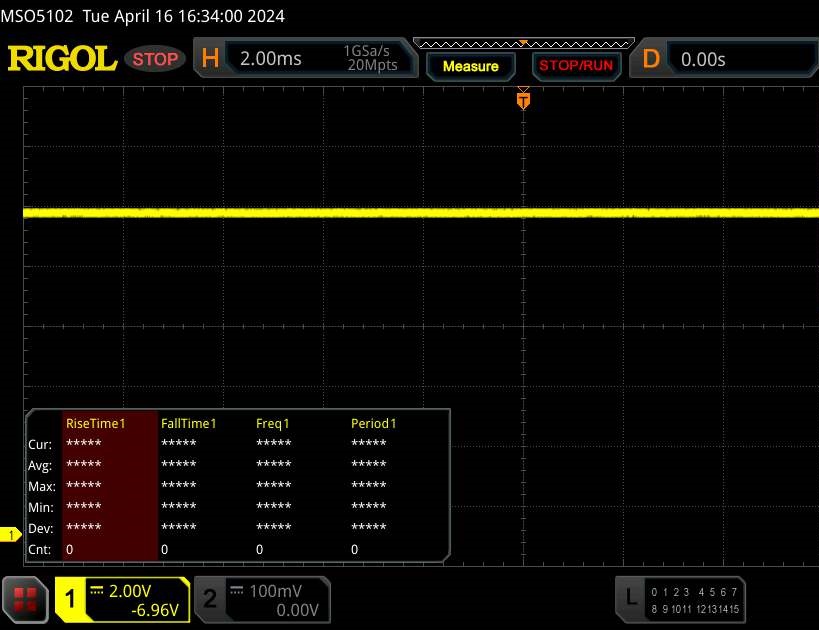 | ||
In comparison: 52 % of all tested devices do not use PWM to dim the display. If PWM was detected, an average of 7757 (minimum: 5 - maximum: 343500) Hz was measured. | |||
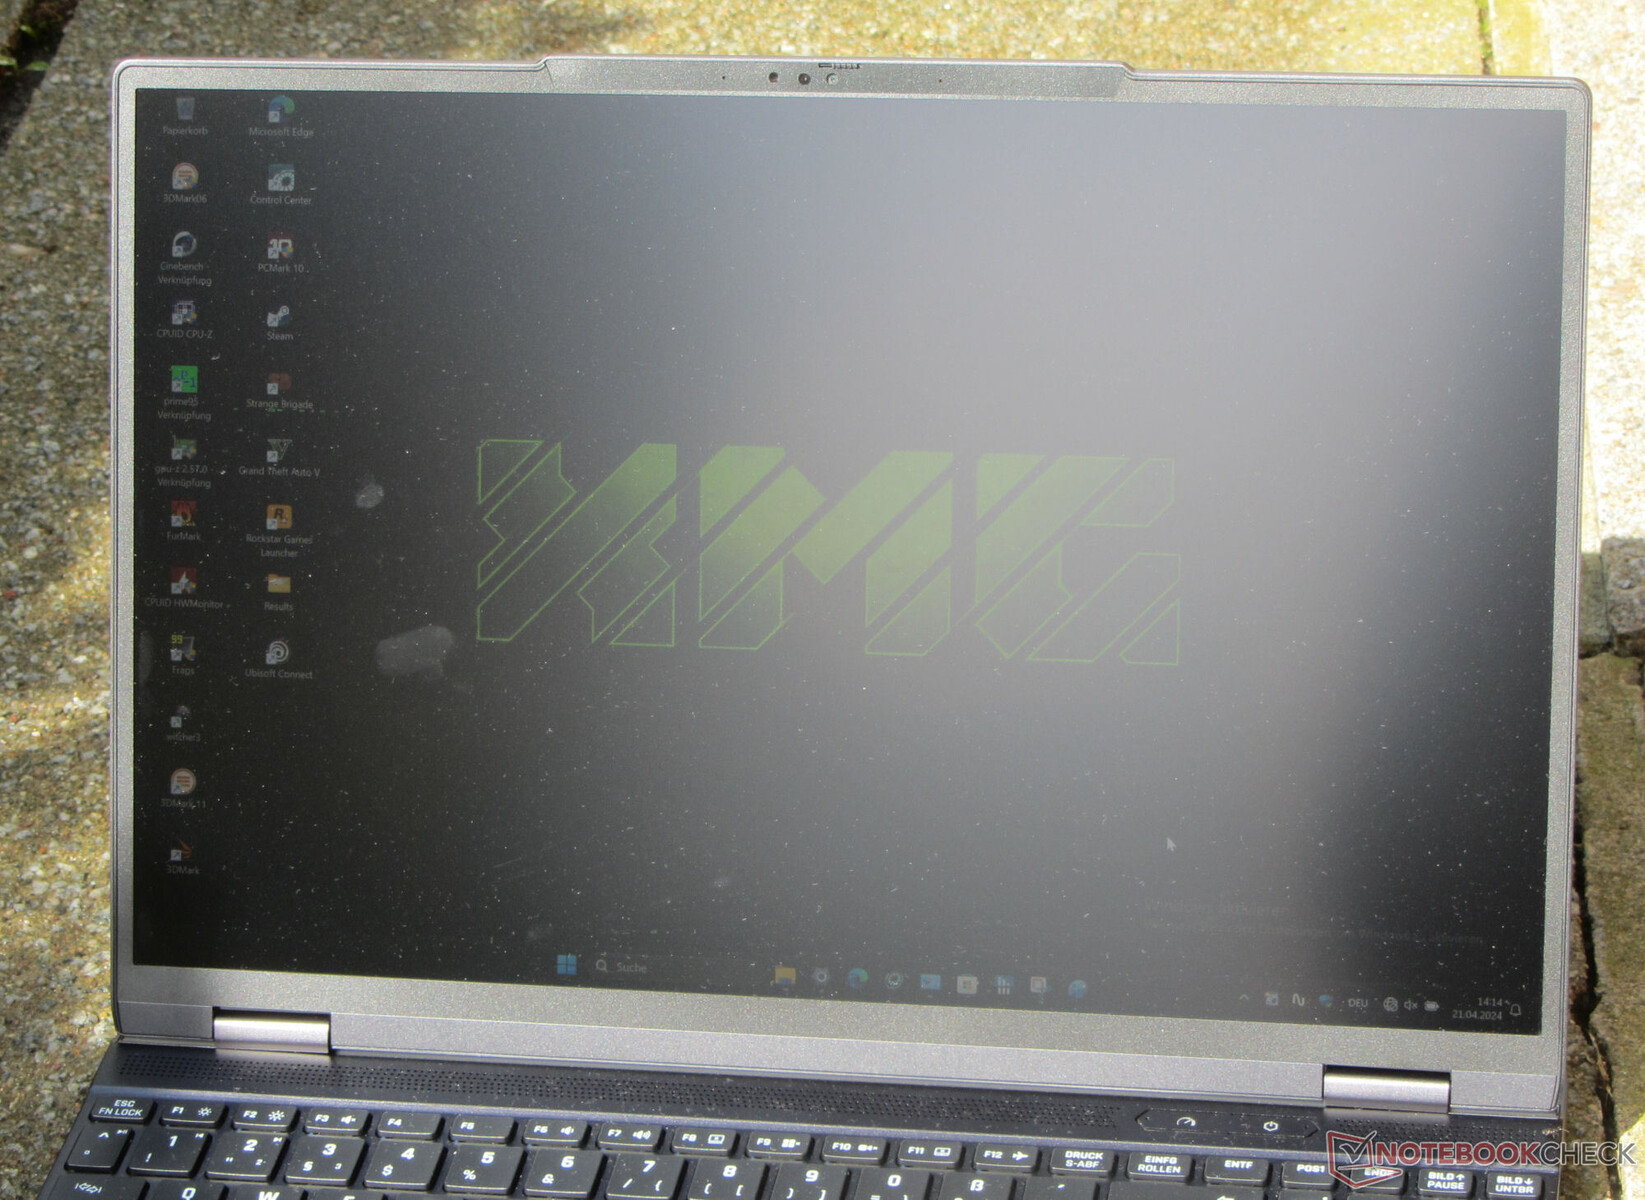
该设备的可视角度稳定的 IPS 面板在任何角度都清晰易读。在室外,只要阳光不是太强烈,你就可以阅读显示屏上的内容。

性能 - Raptor Lake 和 Ada Lovelace 为笔记本电脑提供动力
功能强大、结构紧凑的 XMG Fusion 15(早期 24)面向游戏玩家和创作者。Raptor Lake 和 Ada Lovelace 提供了必要的性能。该笔记本电脑可通过Schenker 在线商店进行个性化配置。.目前的型号价格约为 2,500 美元。更便宜的型号起价约为 1,700 美元。
测试条件
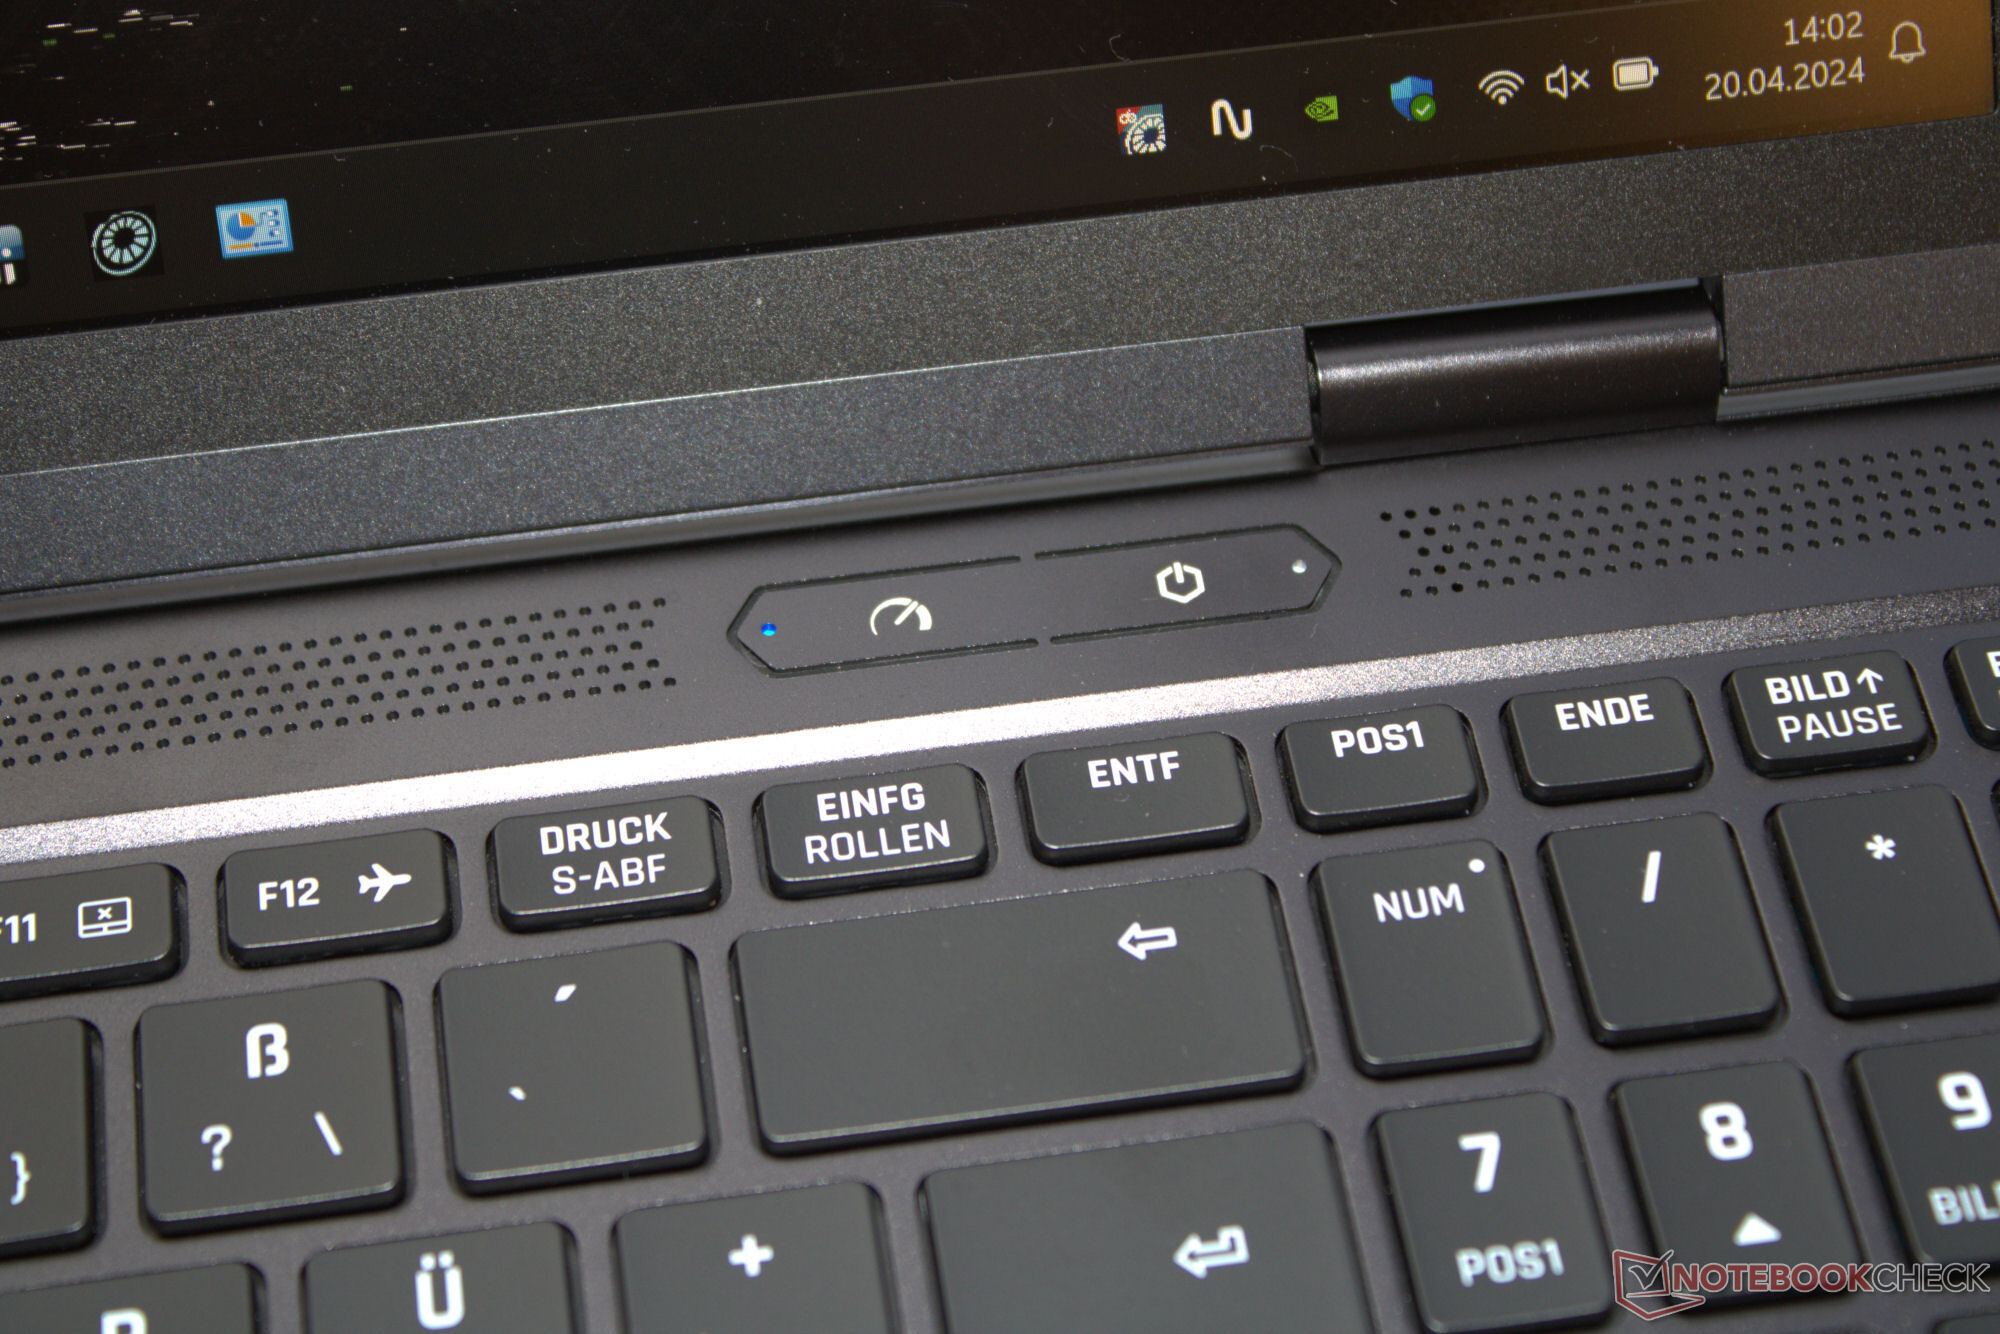
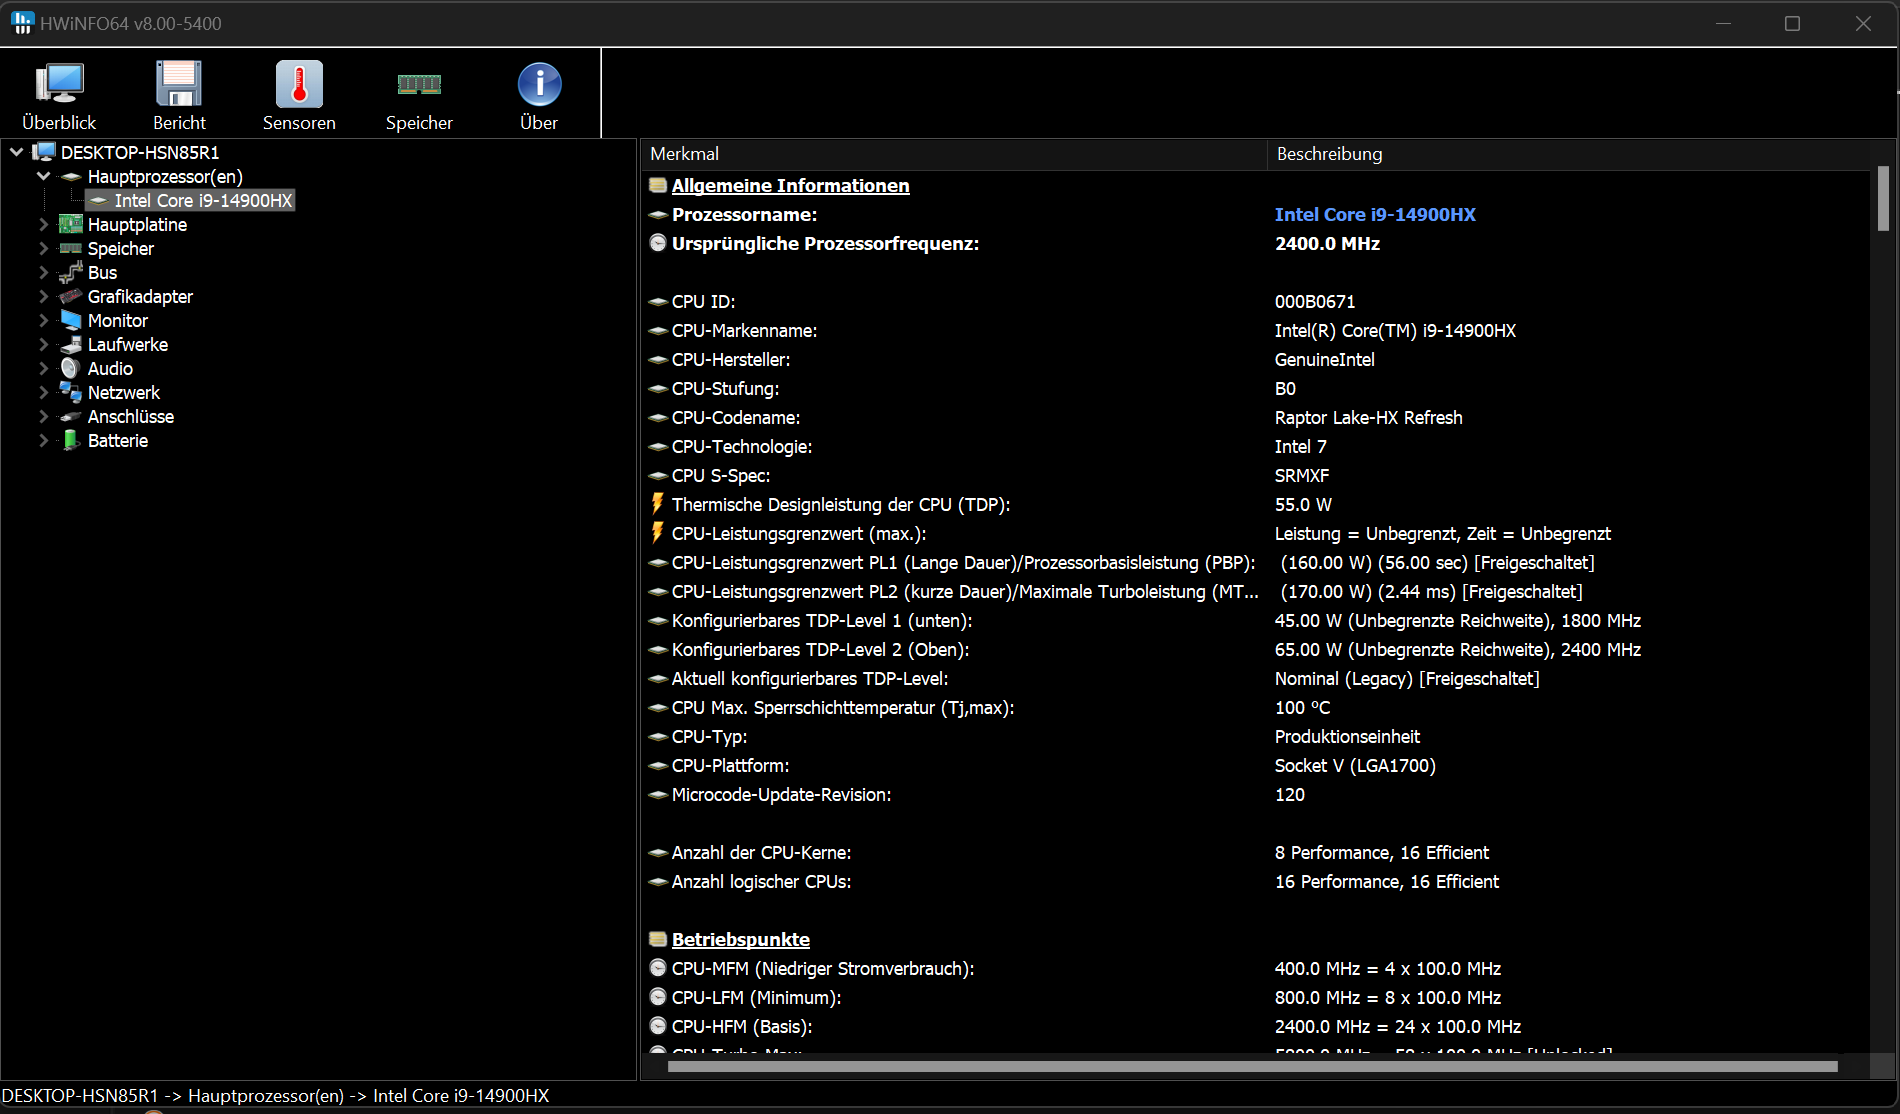
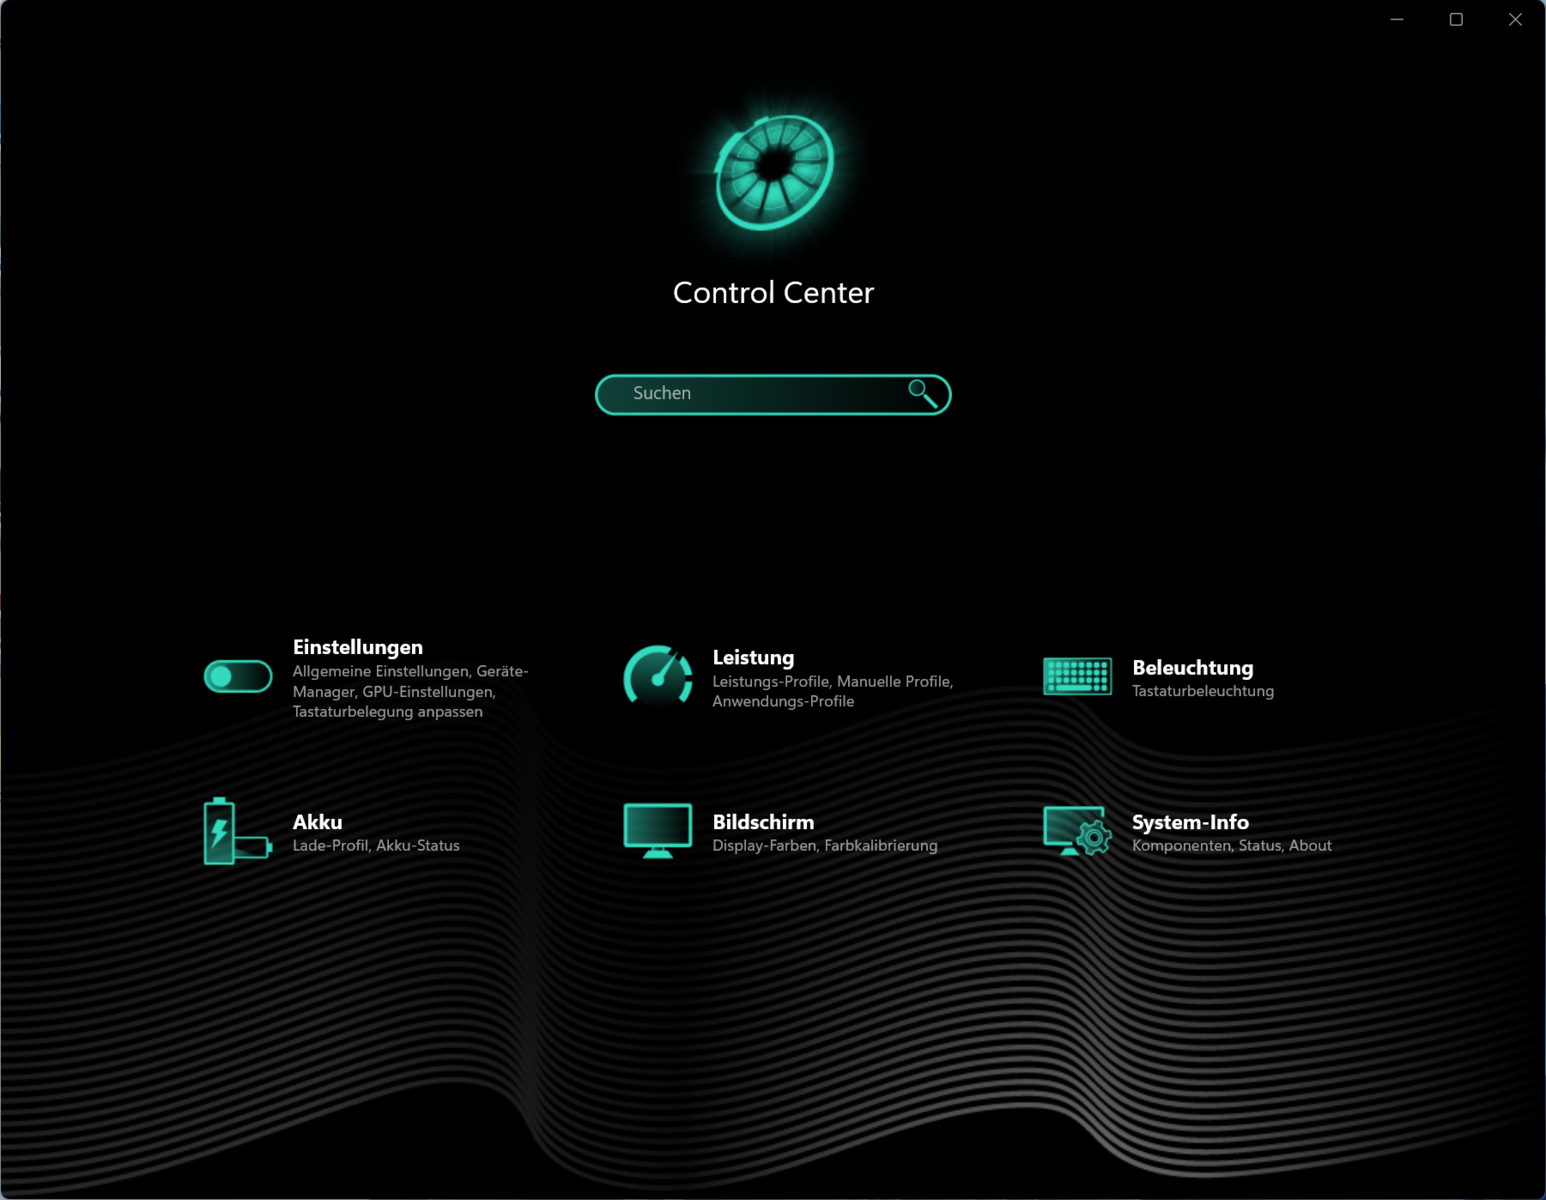
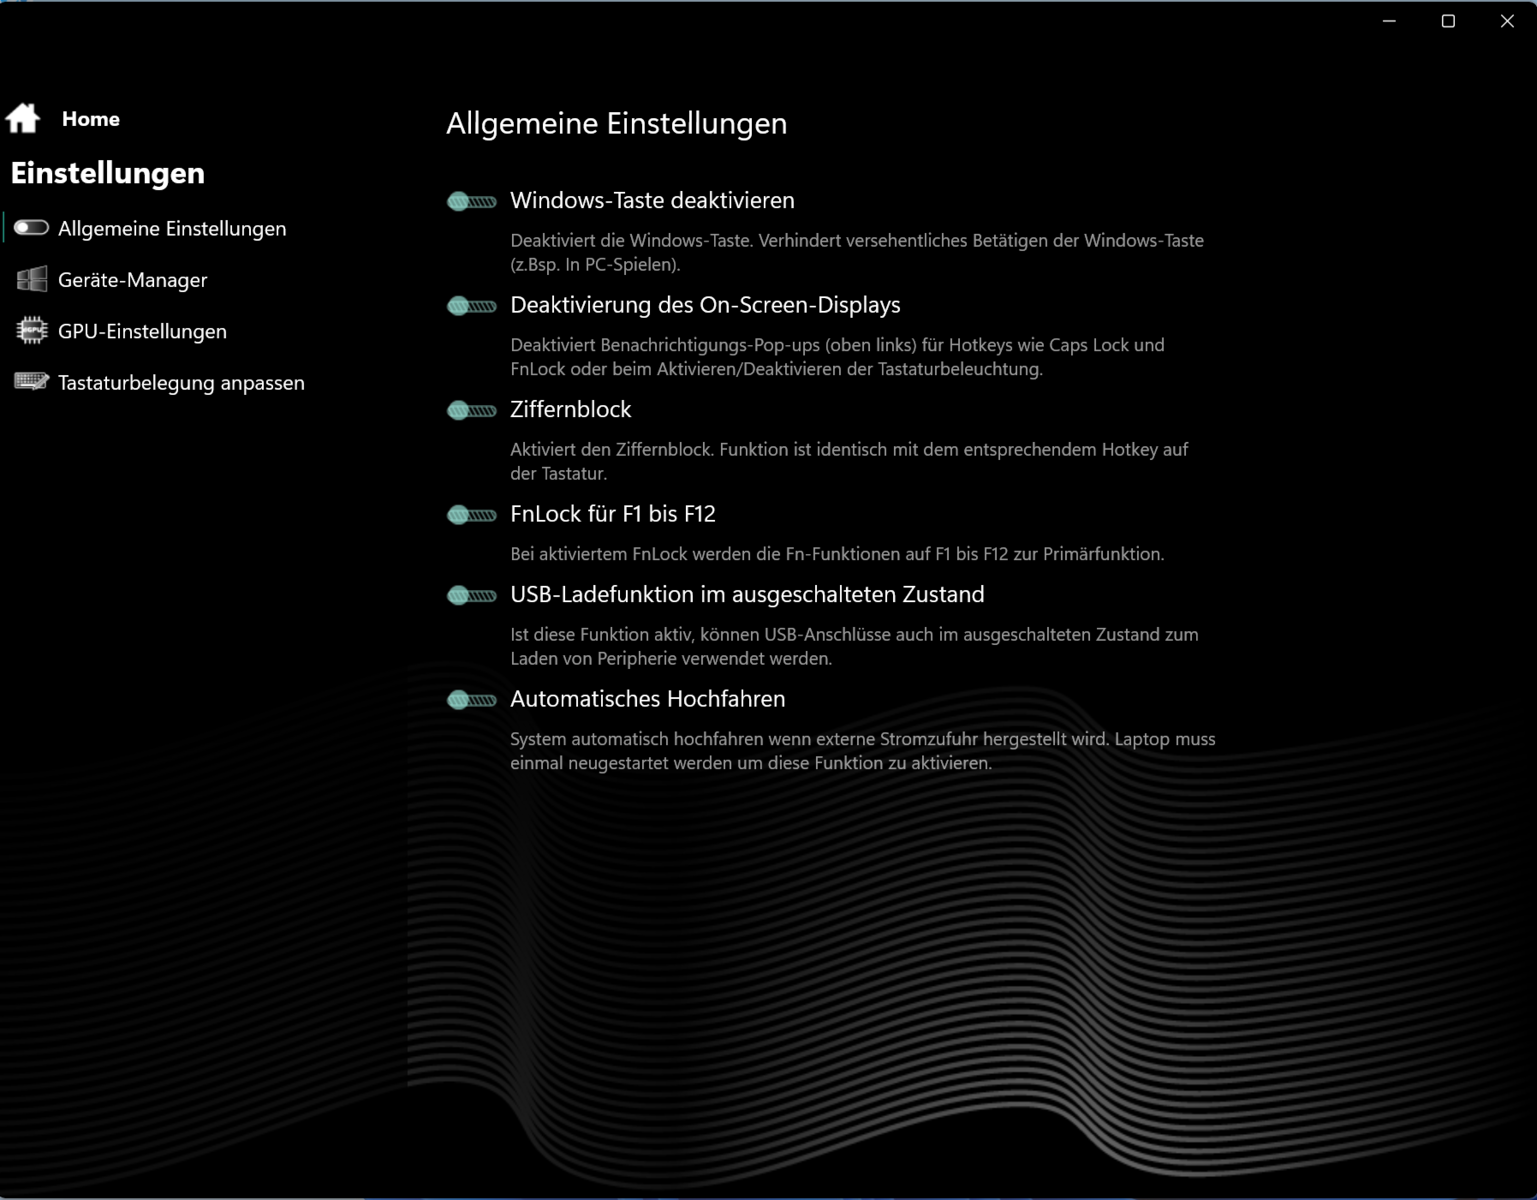
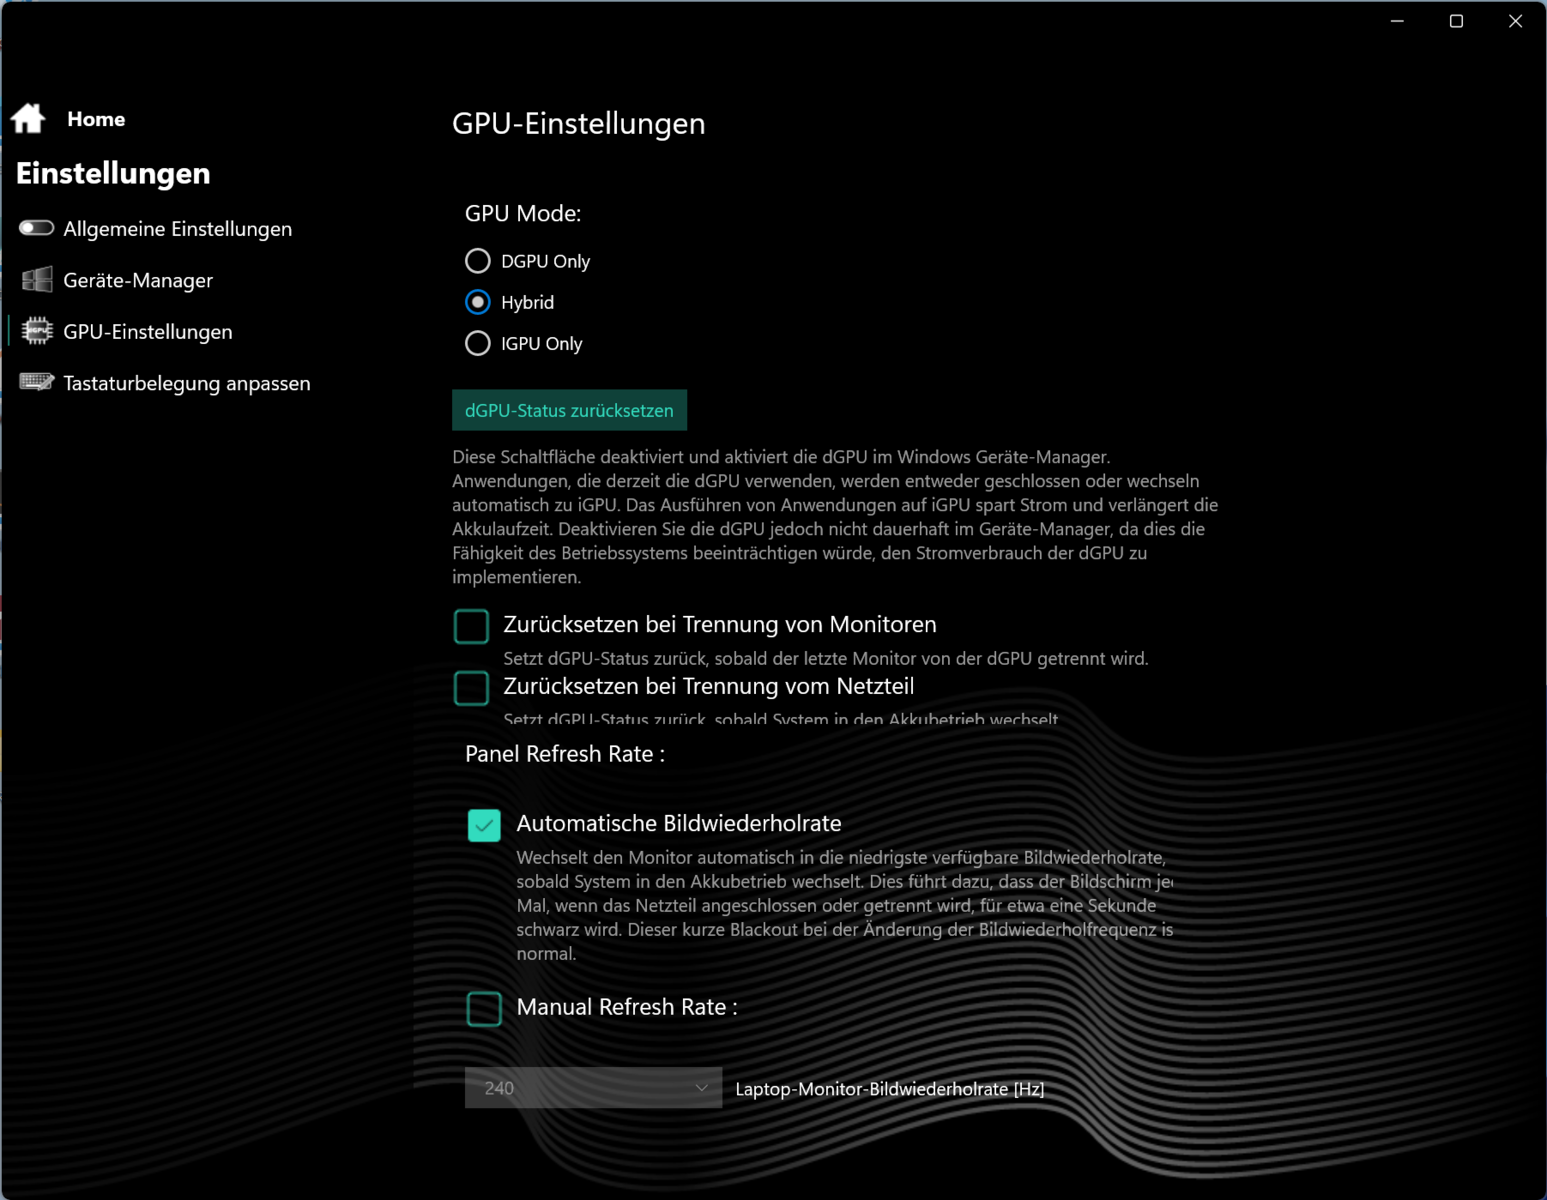
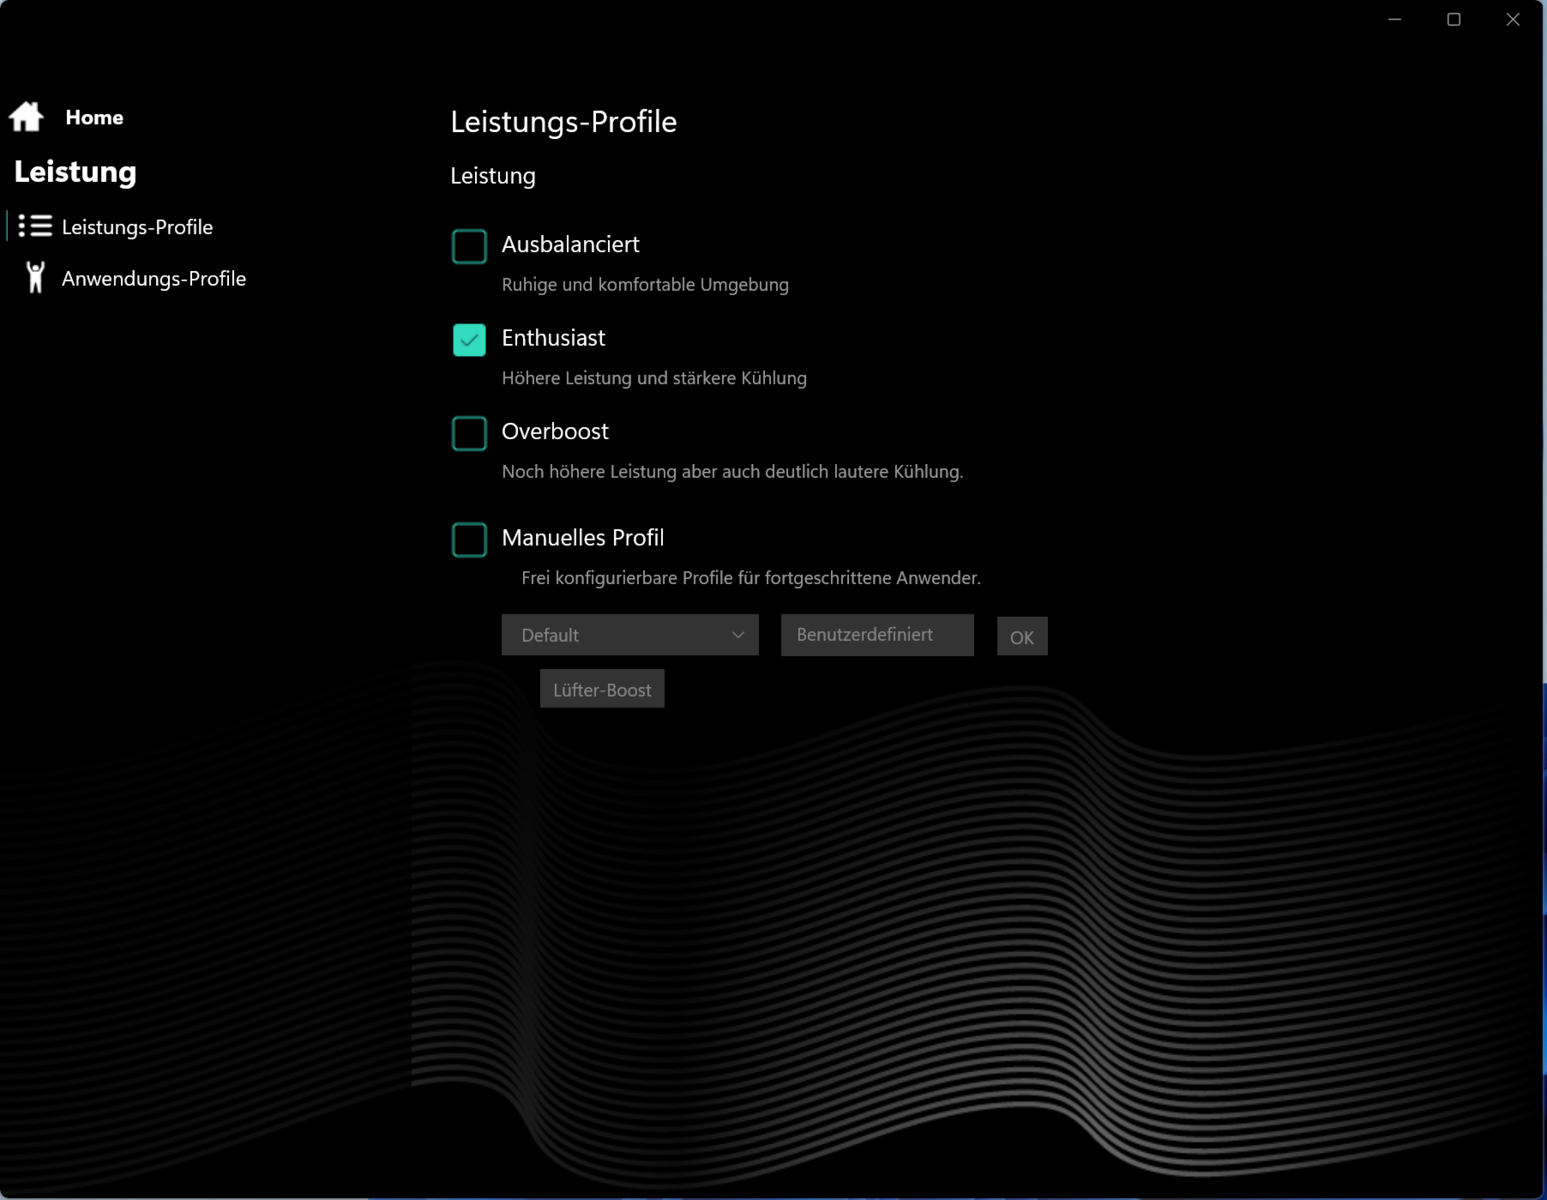
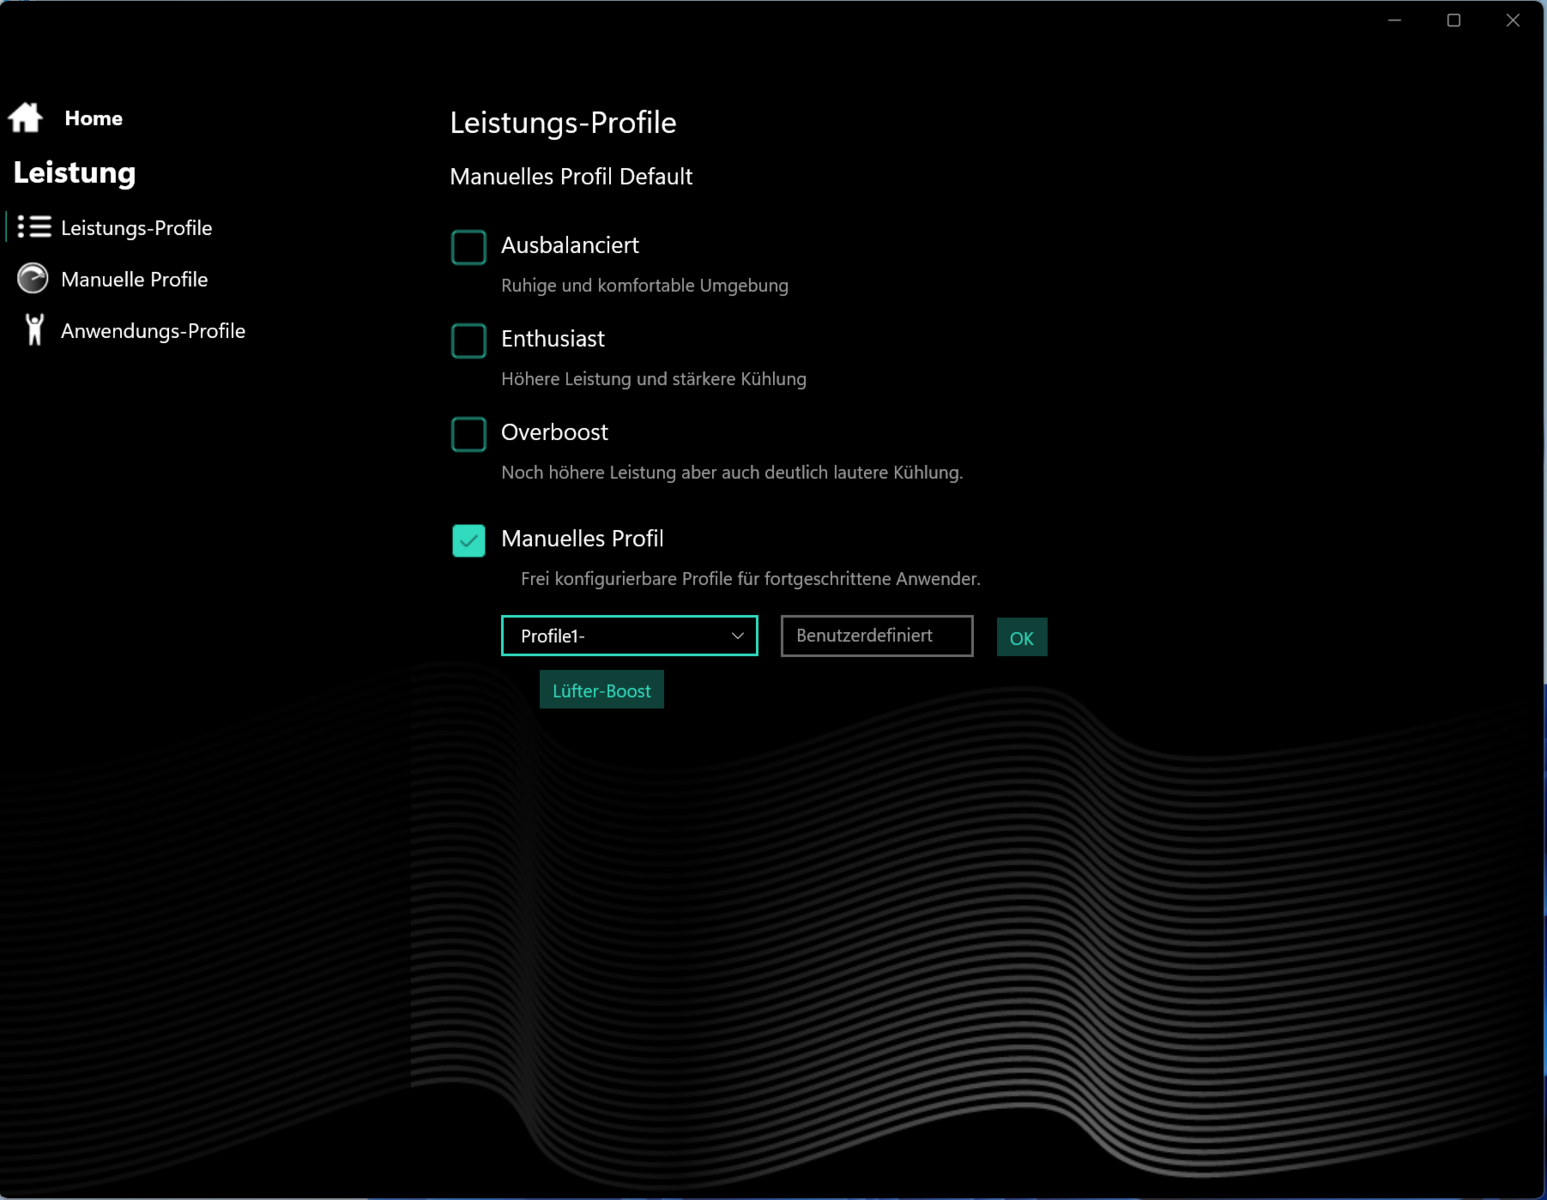
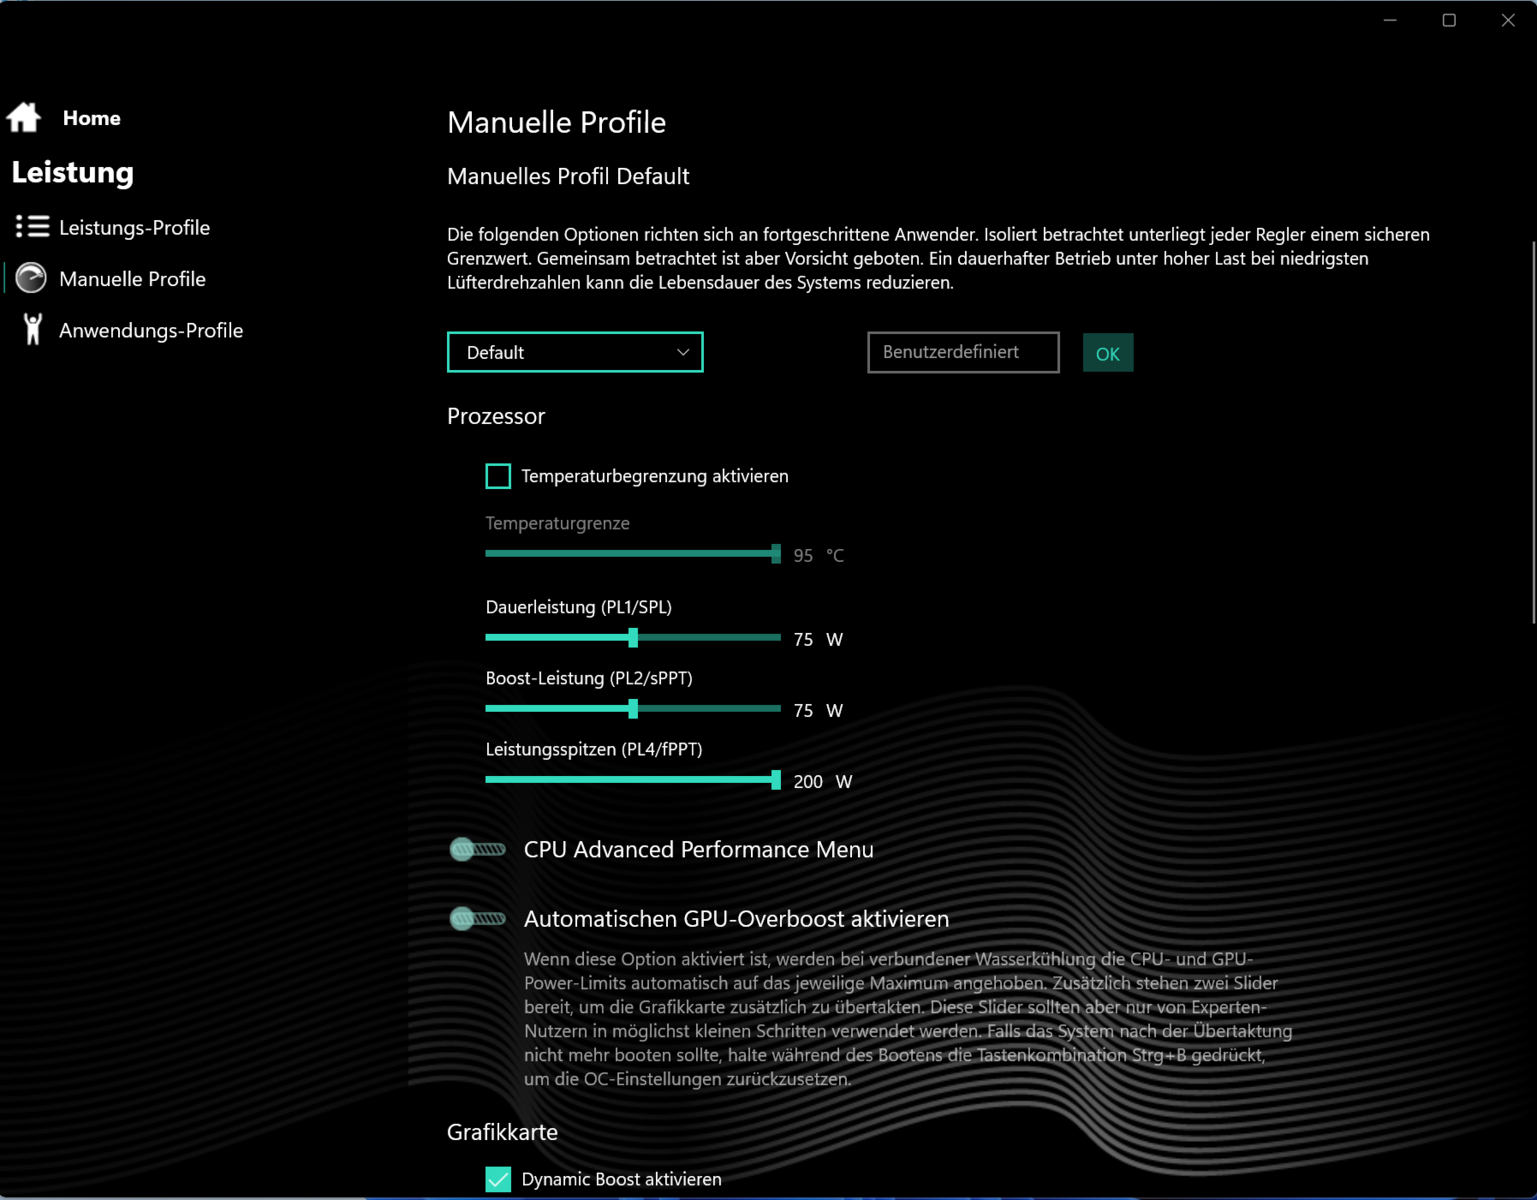
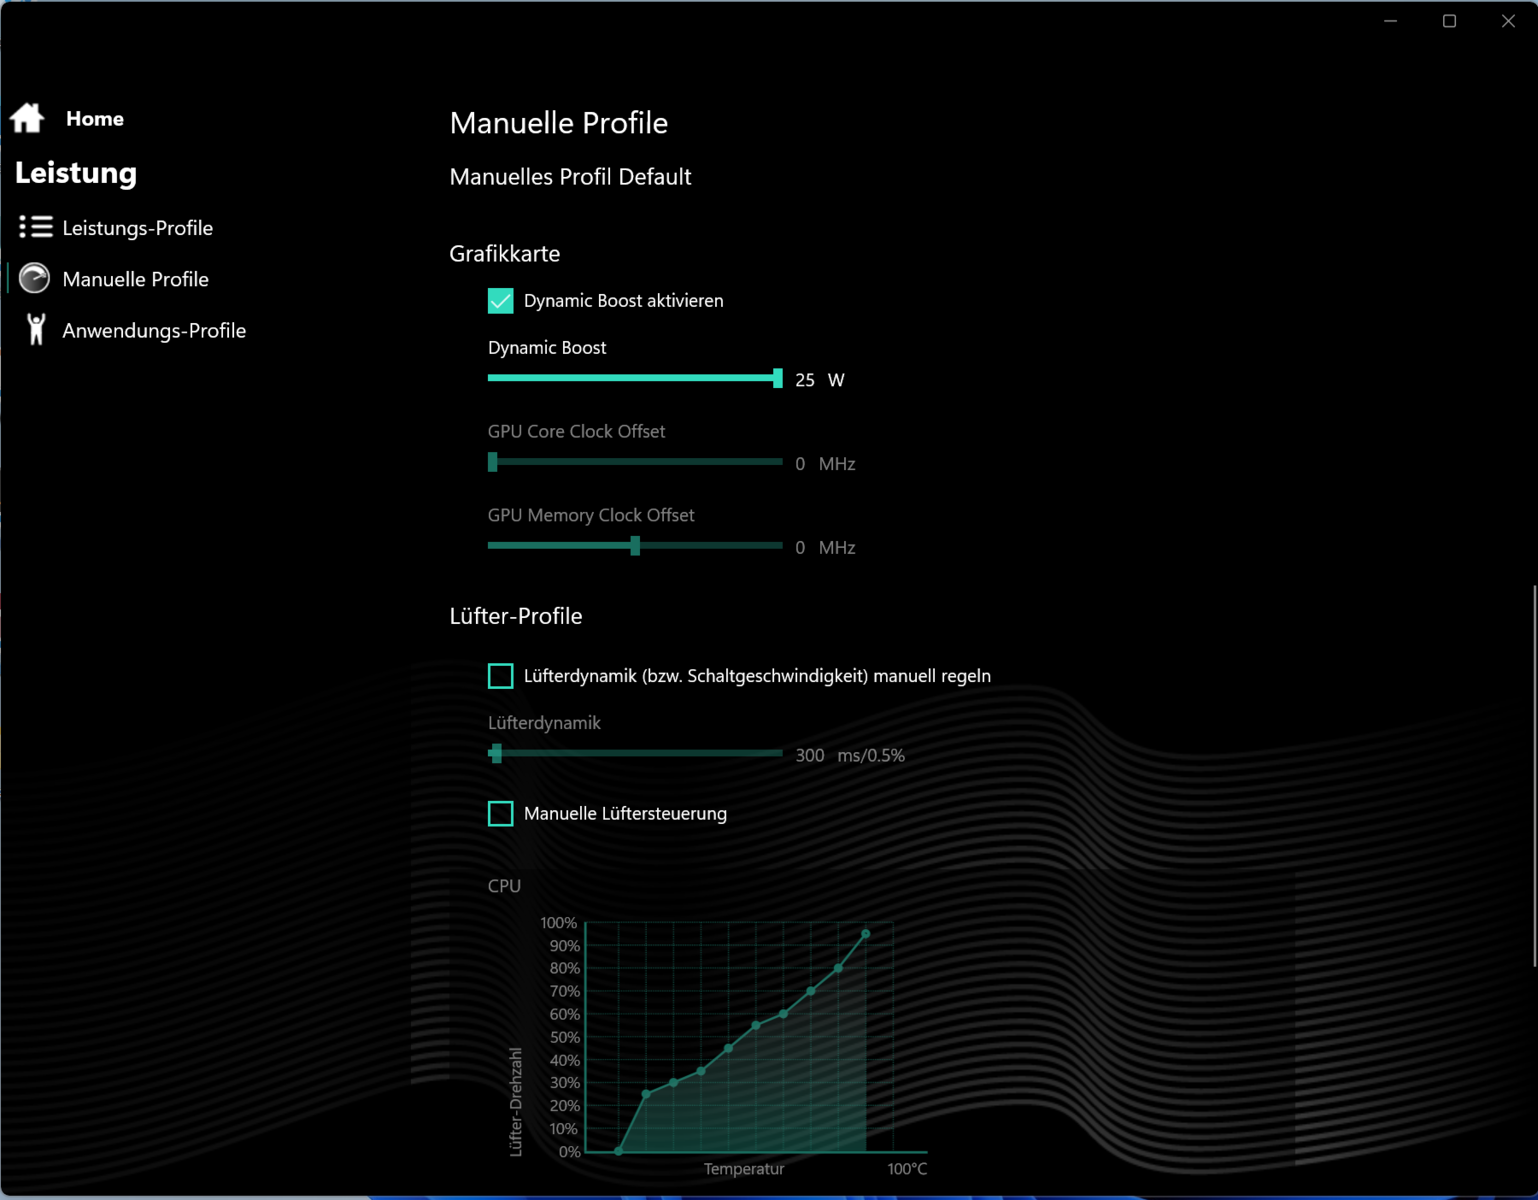
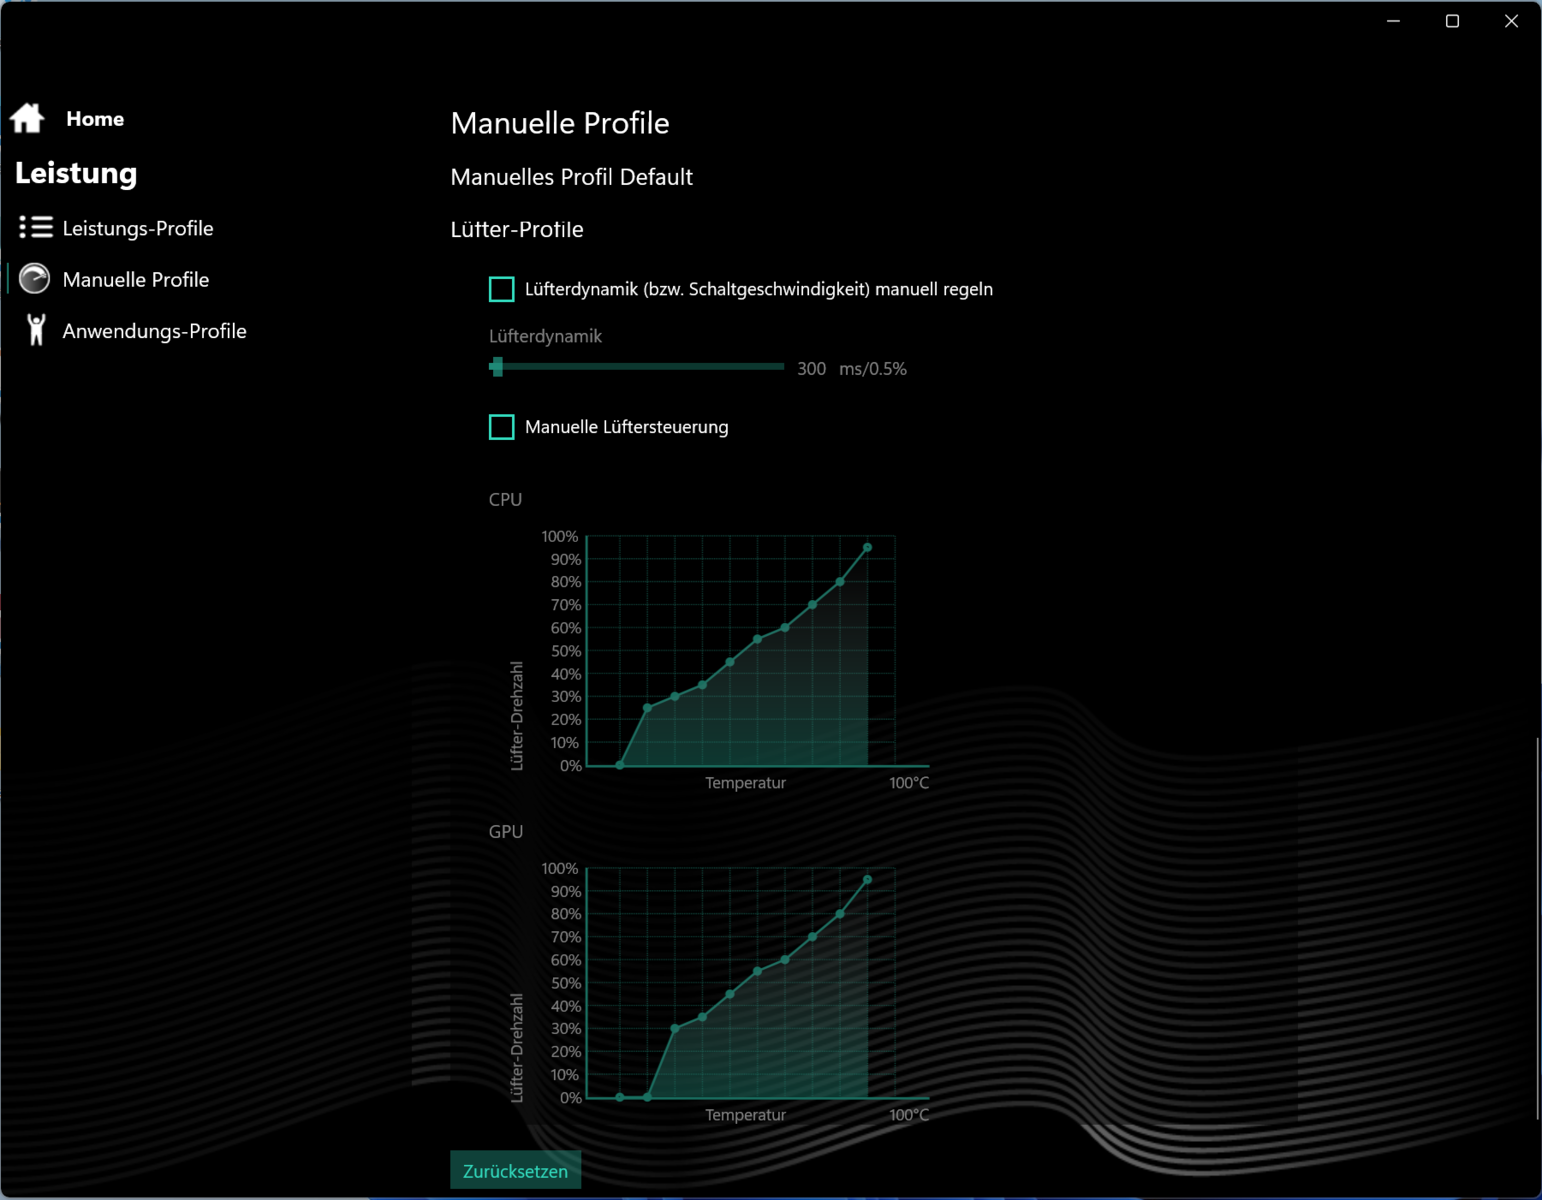
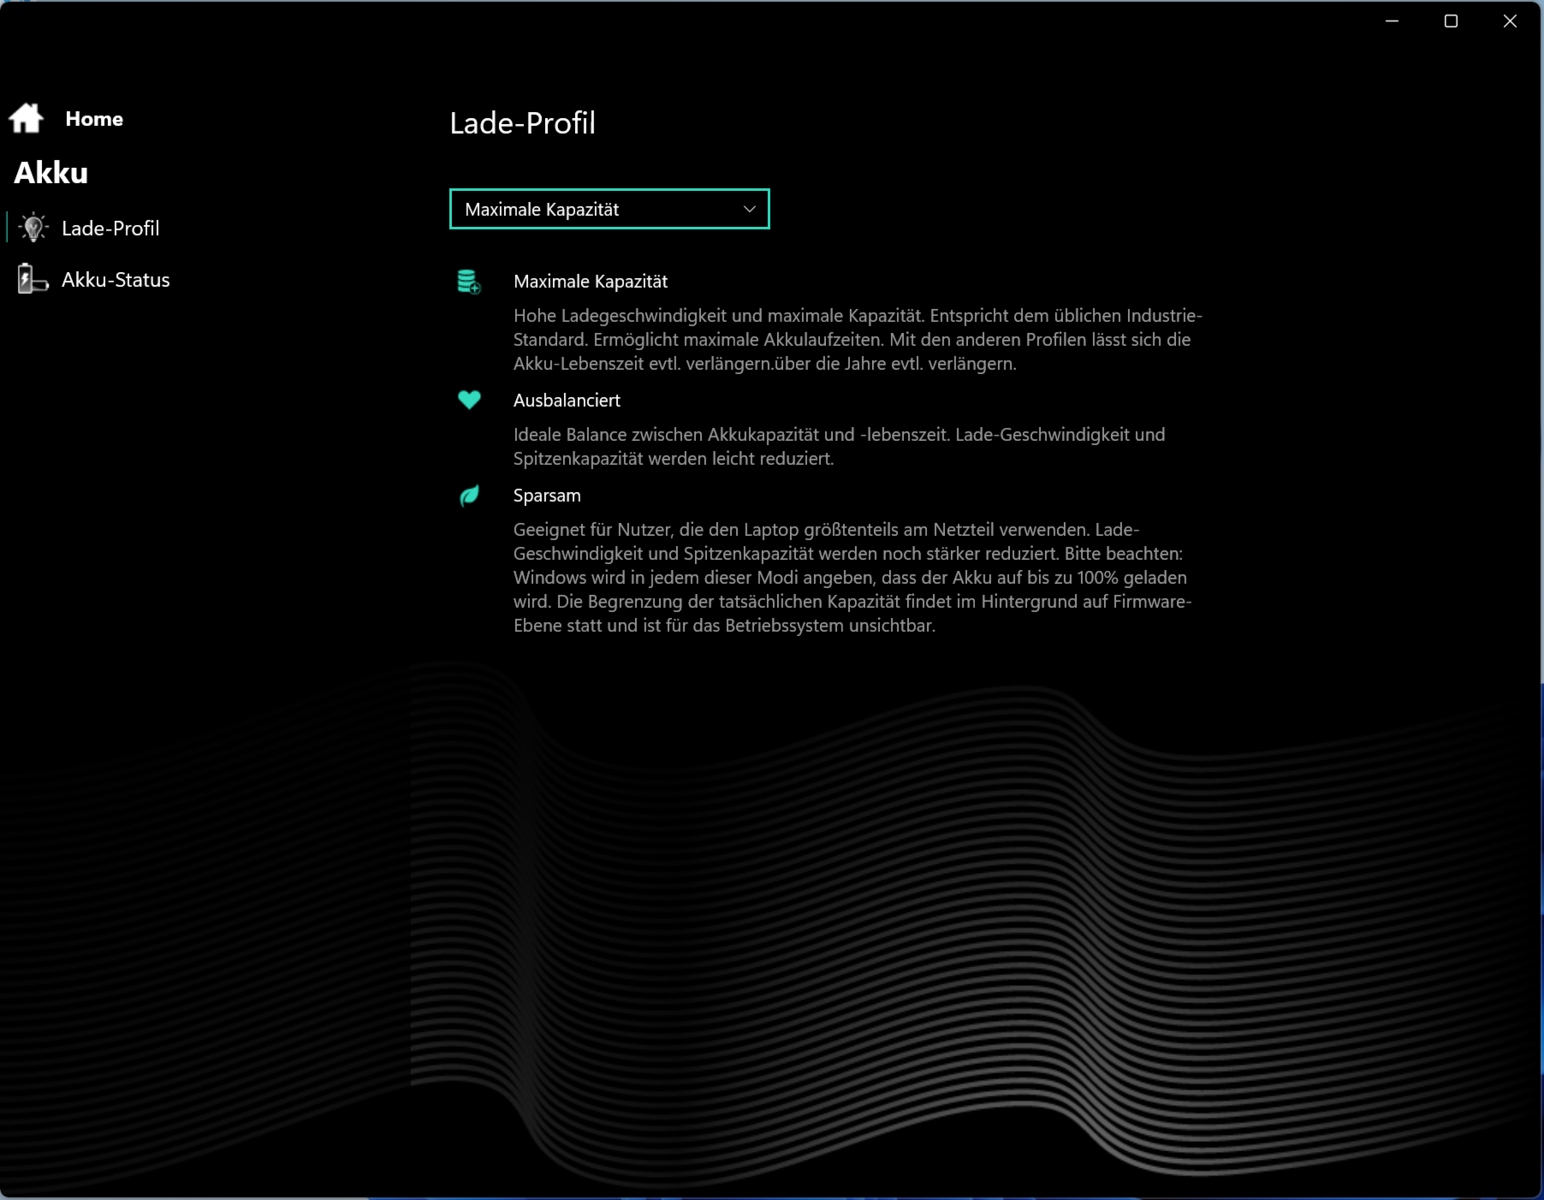
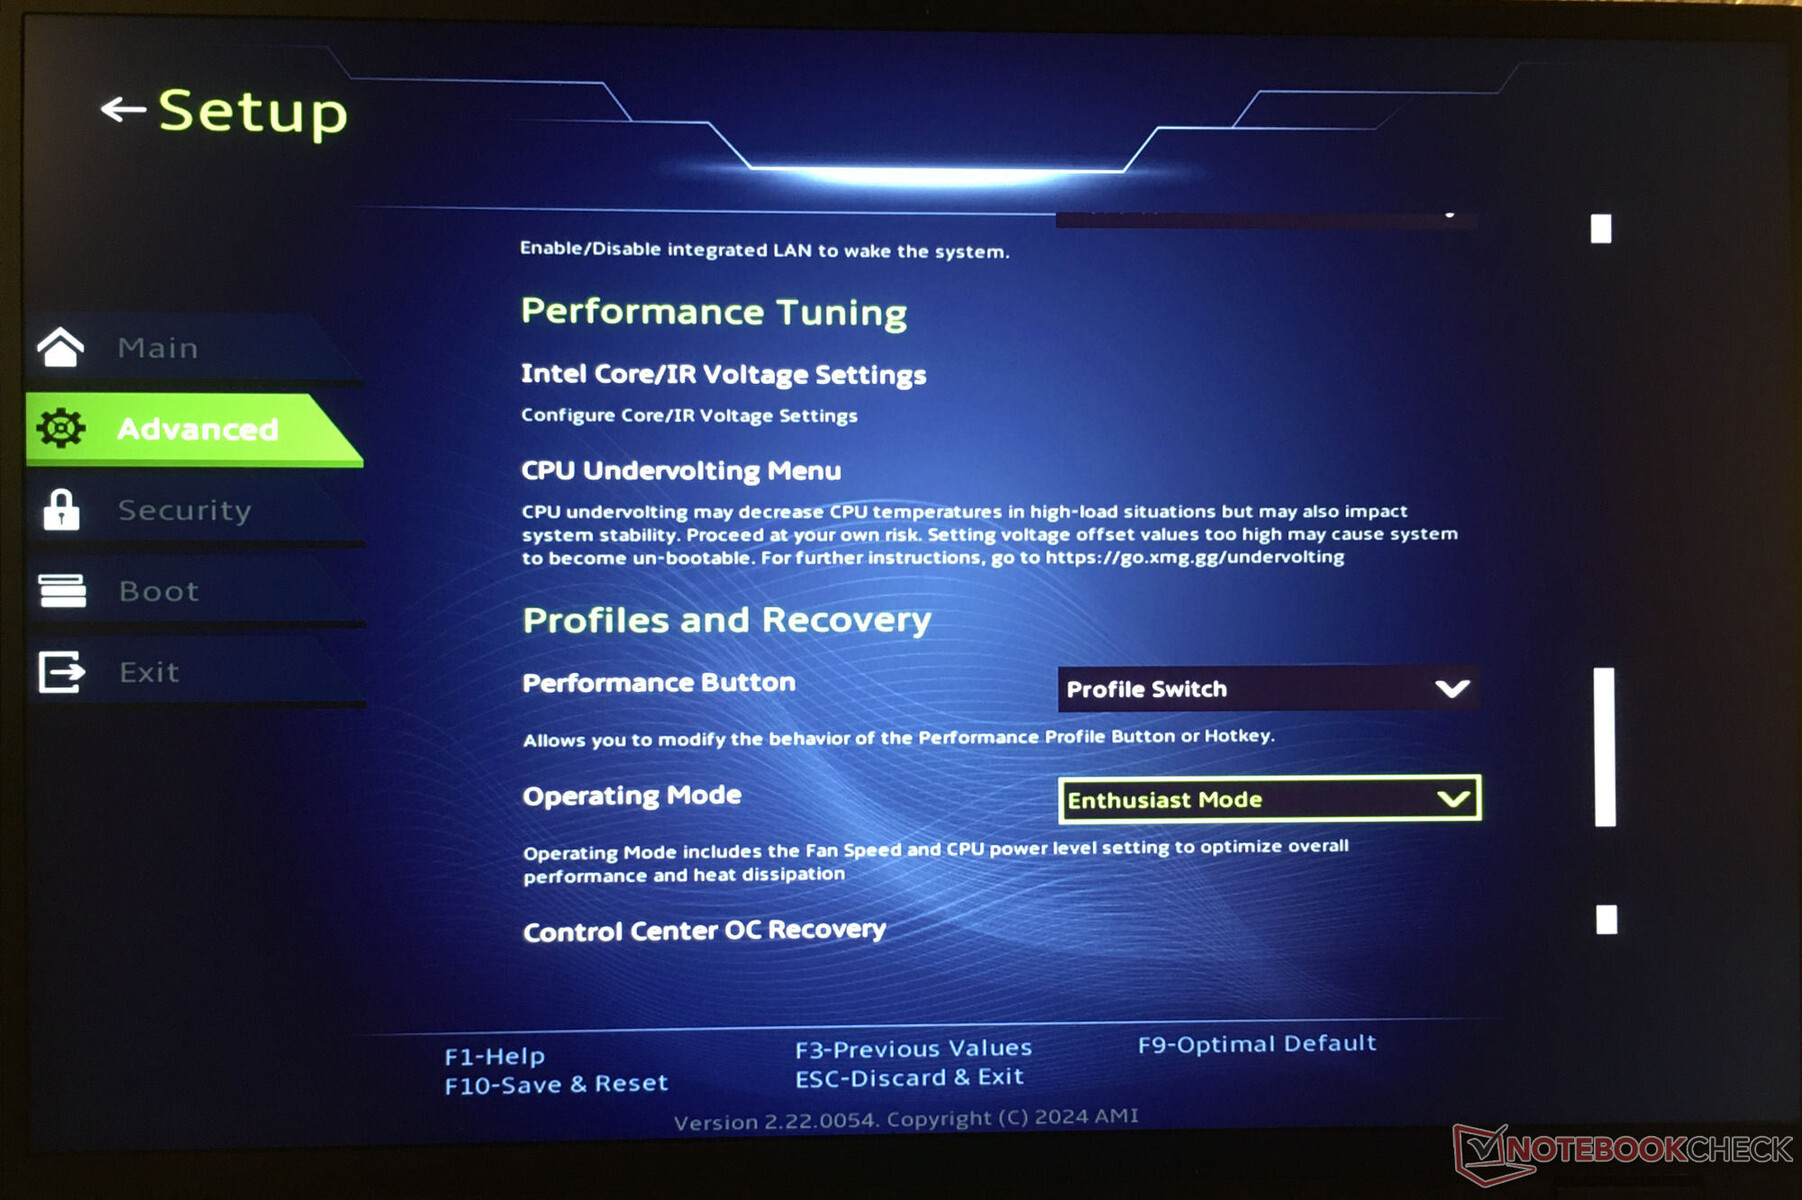
笔记本电脑提供三种制造商特定的性能模式(见表),可使用单独的按钮(电源按钮旁边)在三种模式之间快速切换。可以使用预装的控制中心软件创建个人配置文件。例如,可以调整 CPU 的功率限制、GPU 的 TGP 和/或设备的温度上限。
我们在测试中使用了 "发烧友"模式(基准测试)和 "平衡"模式(电池测试)。GPU 模式设置为混合(= Optimus)。
| 发烧友 | 超增压 | 平衡 | |
|---|---|---|---|
| 功率限制 1 (HWInfo) | 160 瓦 | 160 瓦 | 160 瓦 |
| 功率限制 2 (HWInfo) | 170 瓦 | 170 瓦 | 170 瓦 |
| 噪音 (Witcher 3) | 51 dB(A) | 53 dB(A) | 39 dB(A) |
| 性能 (Witcher 3) | 128 fps | 130 fps | 14-128 fps |

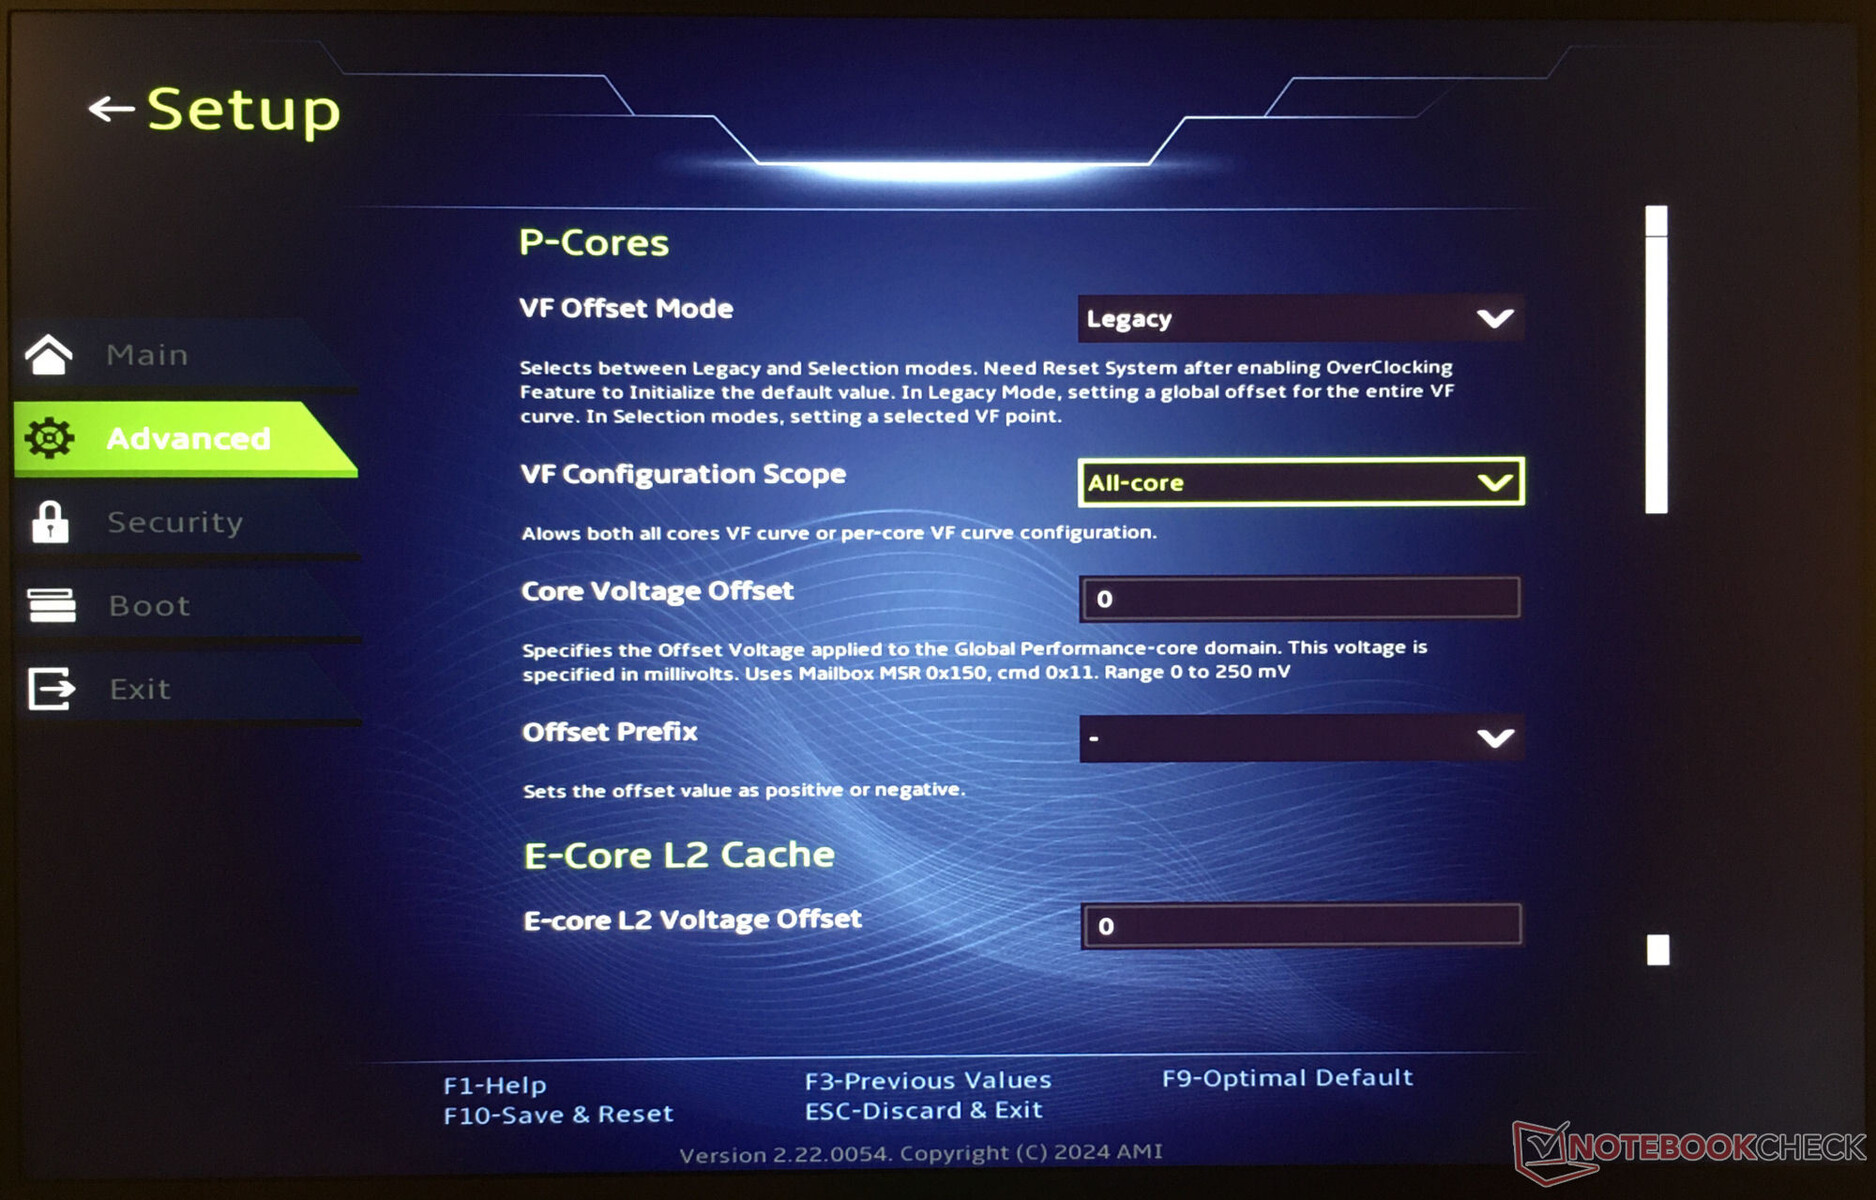
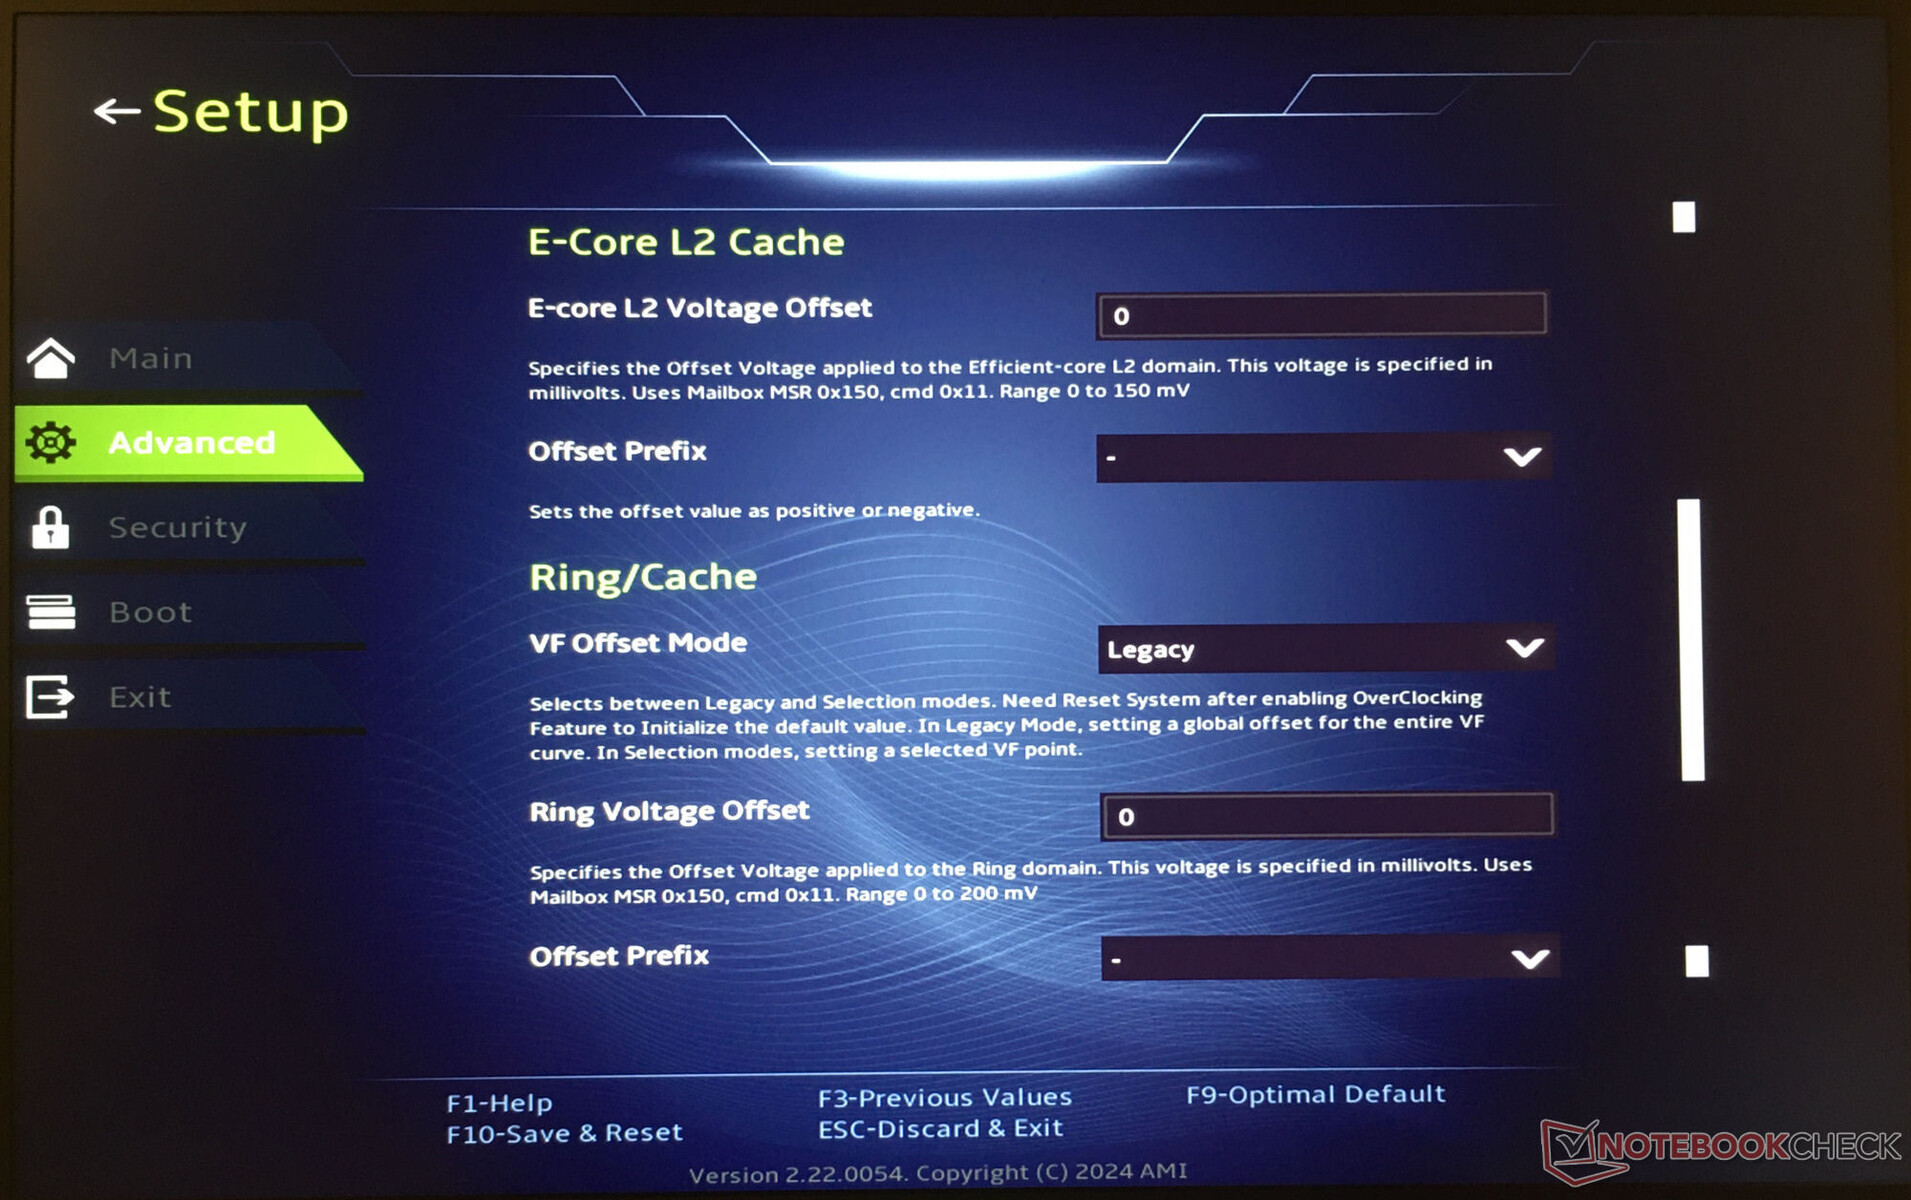
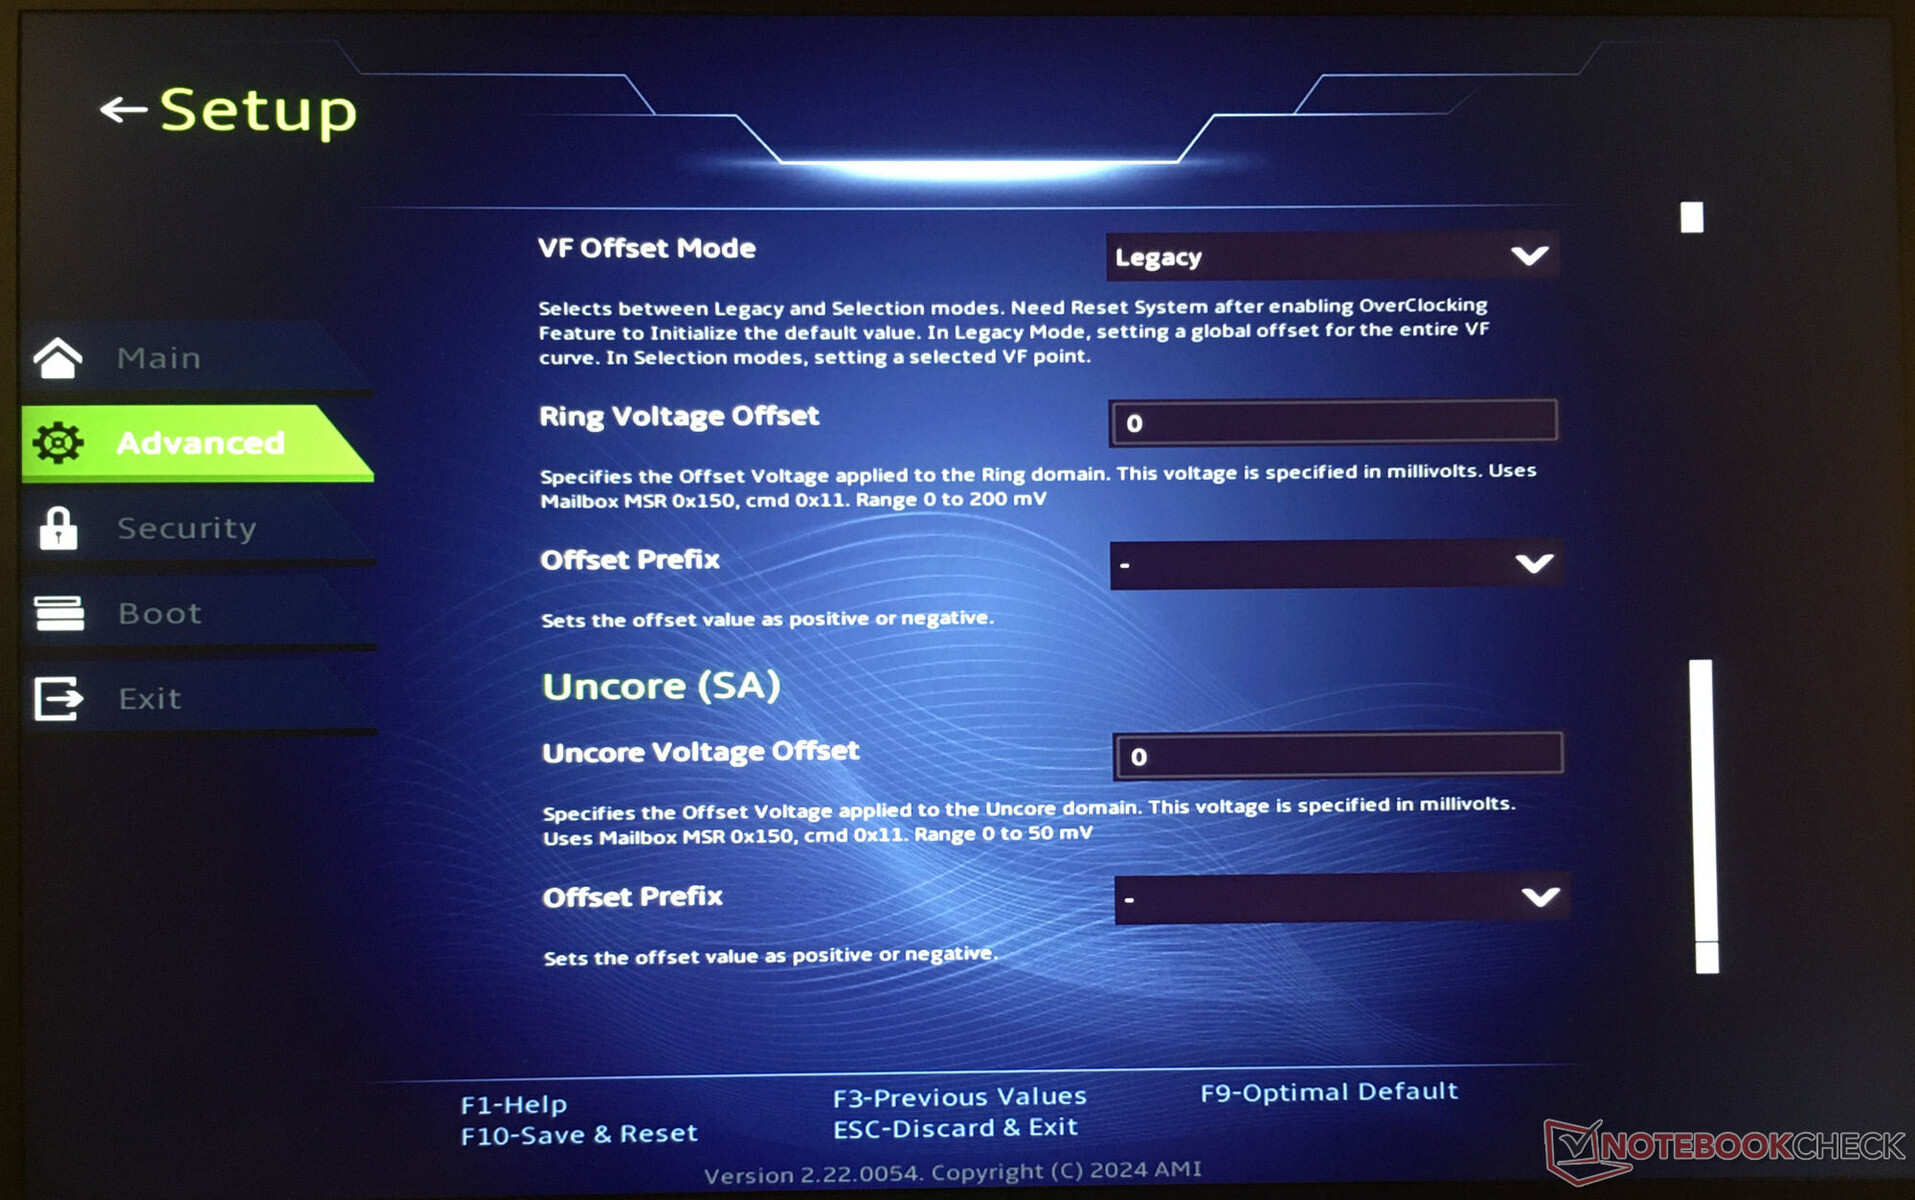
欠压
处理器可以在低于制造商预期电压的情况下运行(欠压)。因此,设备的功耗和热量排放都会降低。但要小心:过度降低电压会导致系统不稳定或出现故障。在这种情况下,必须逆转变化--必须自行承担降压风险。
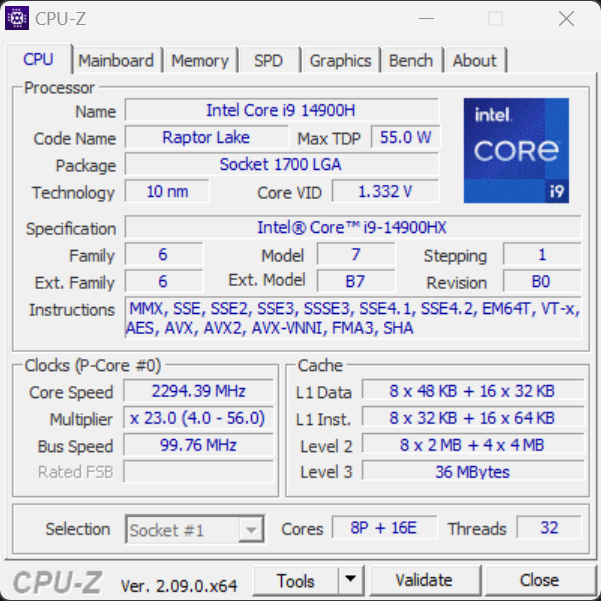
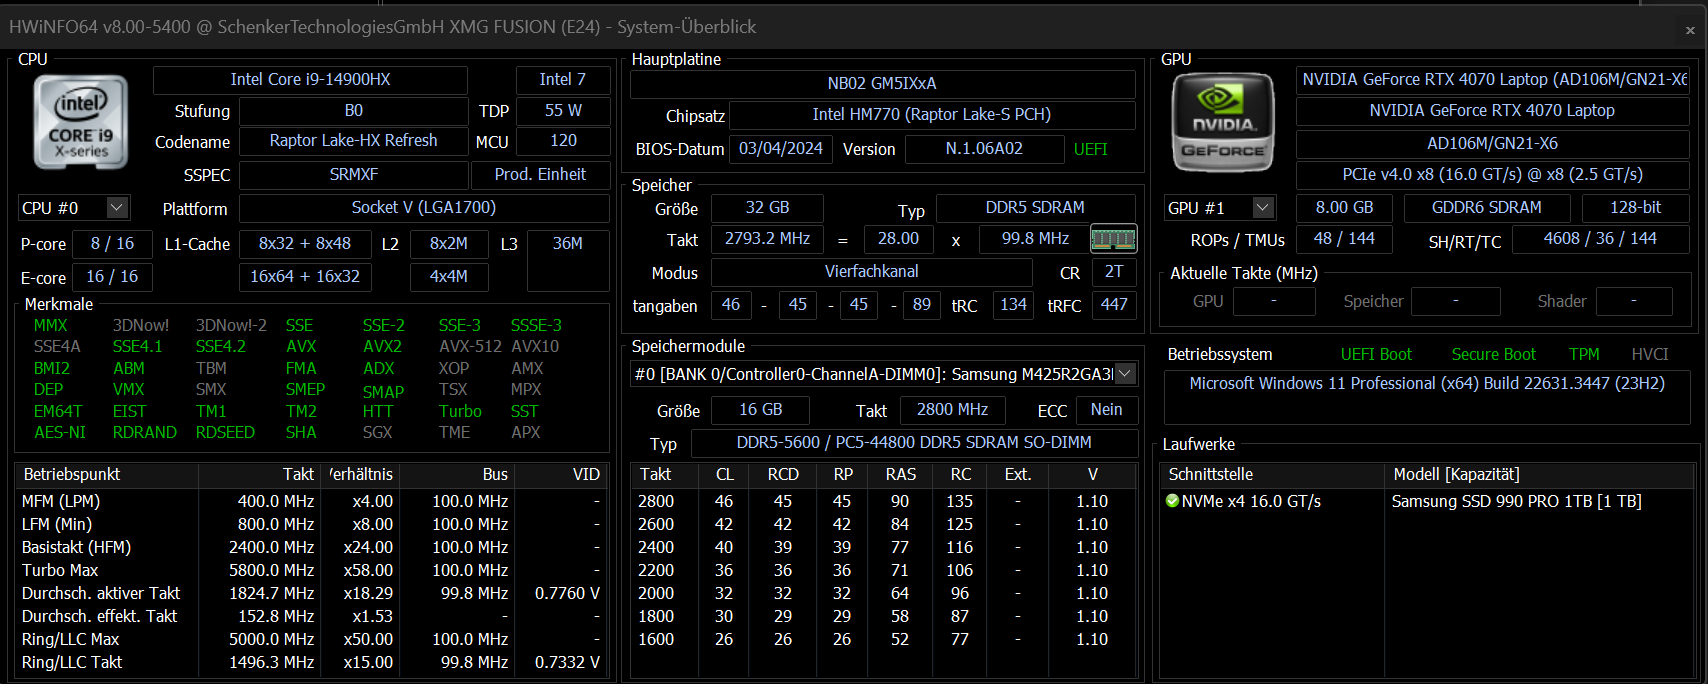
处理器
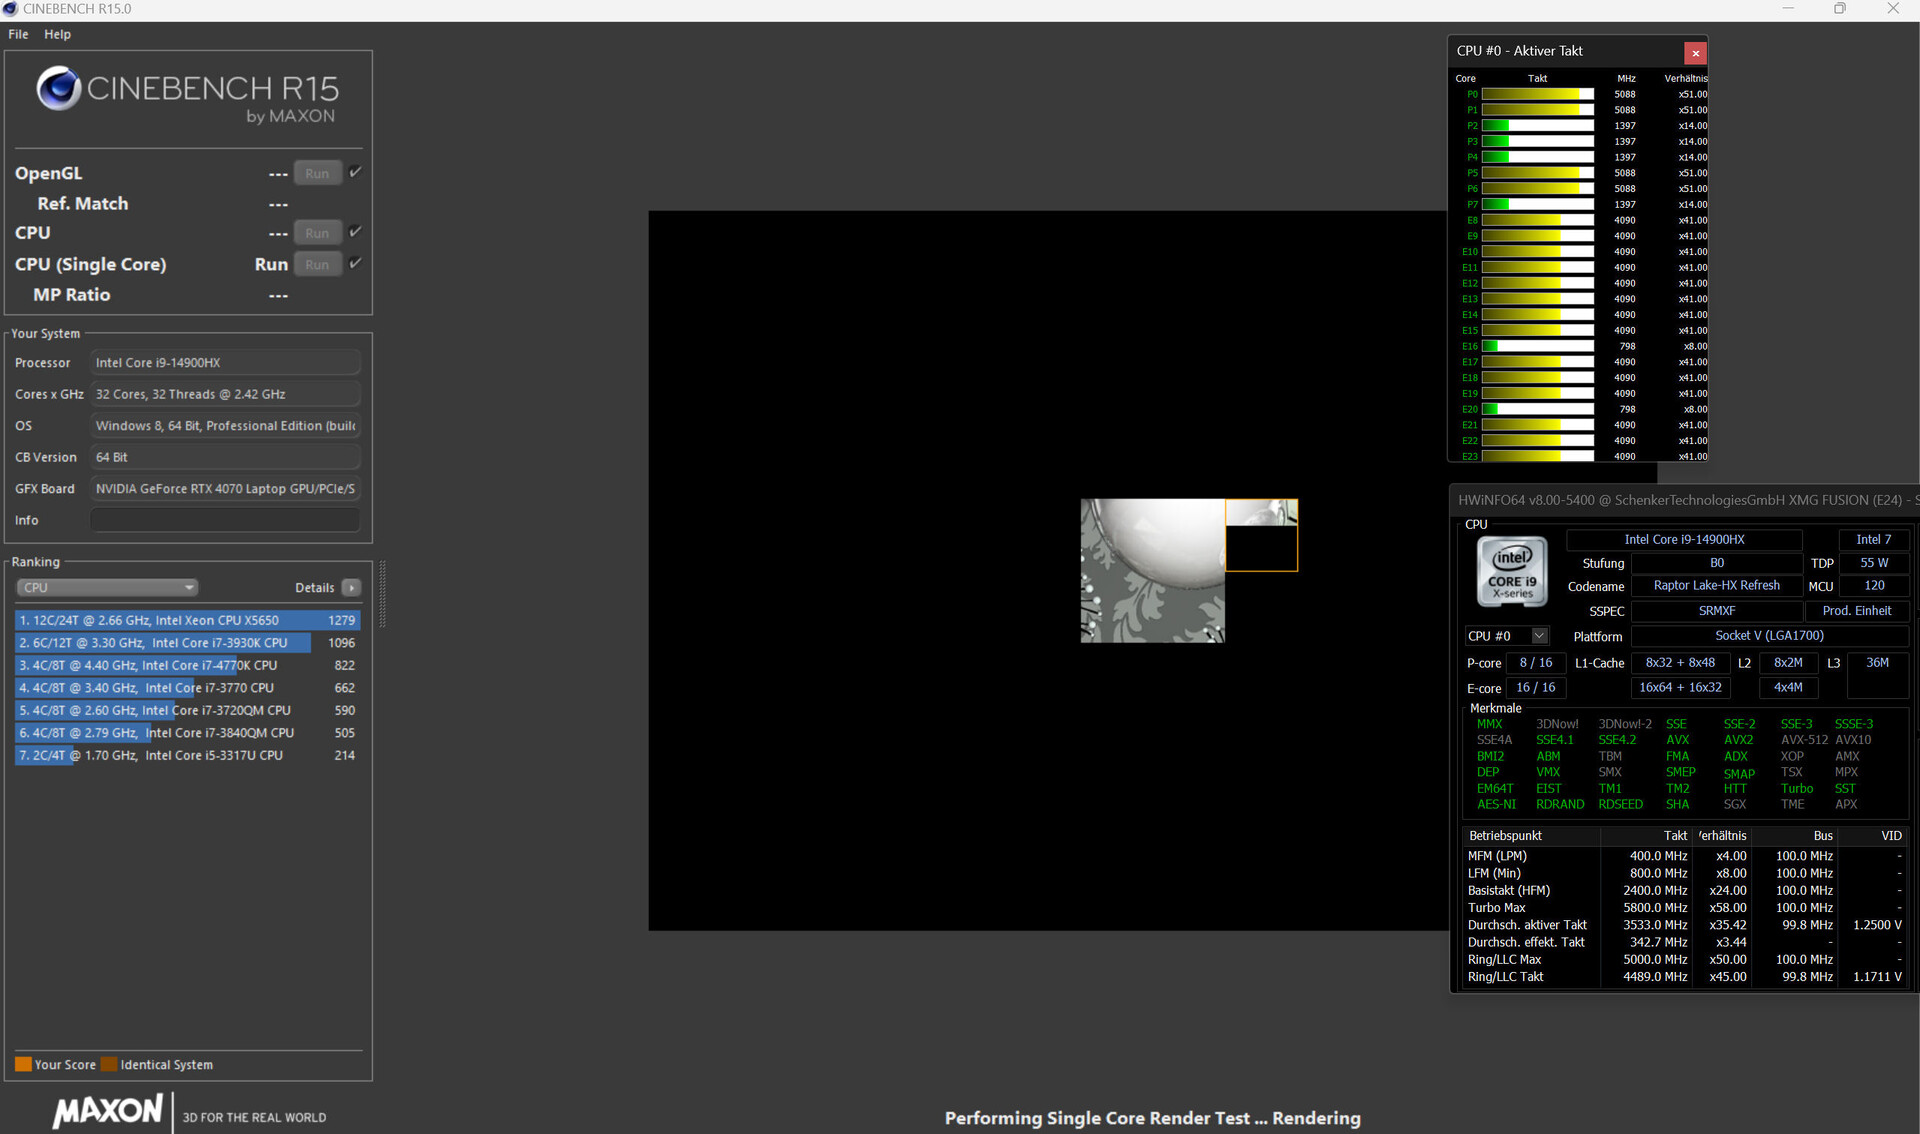
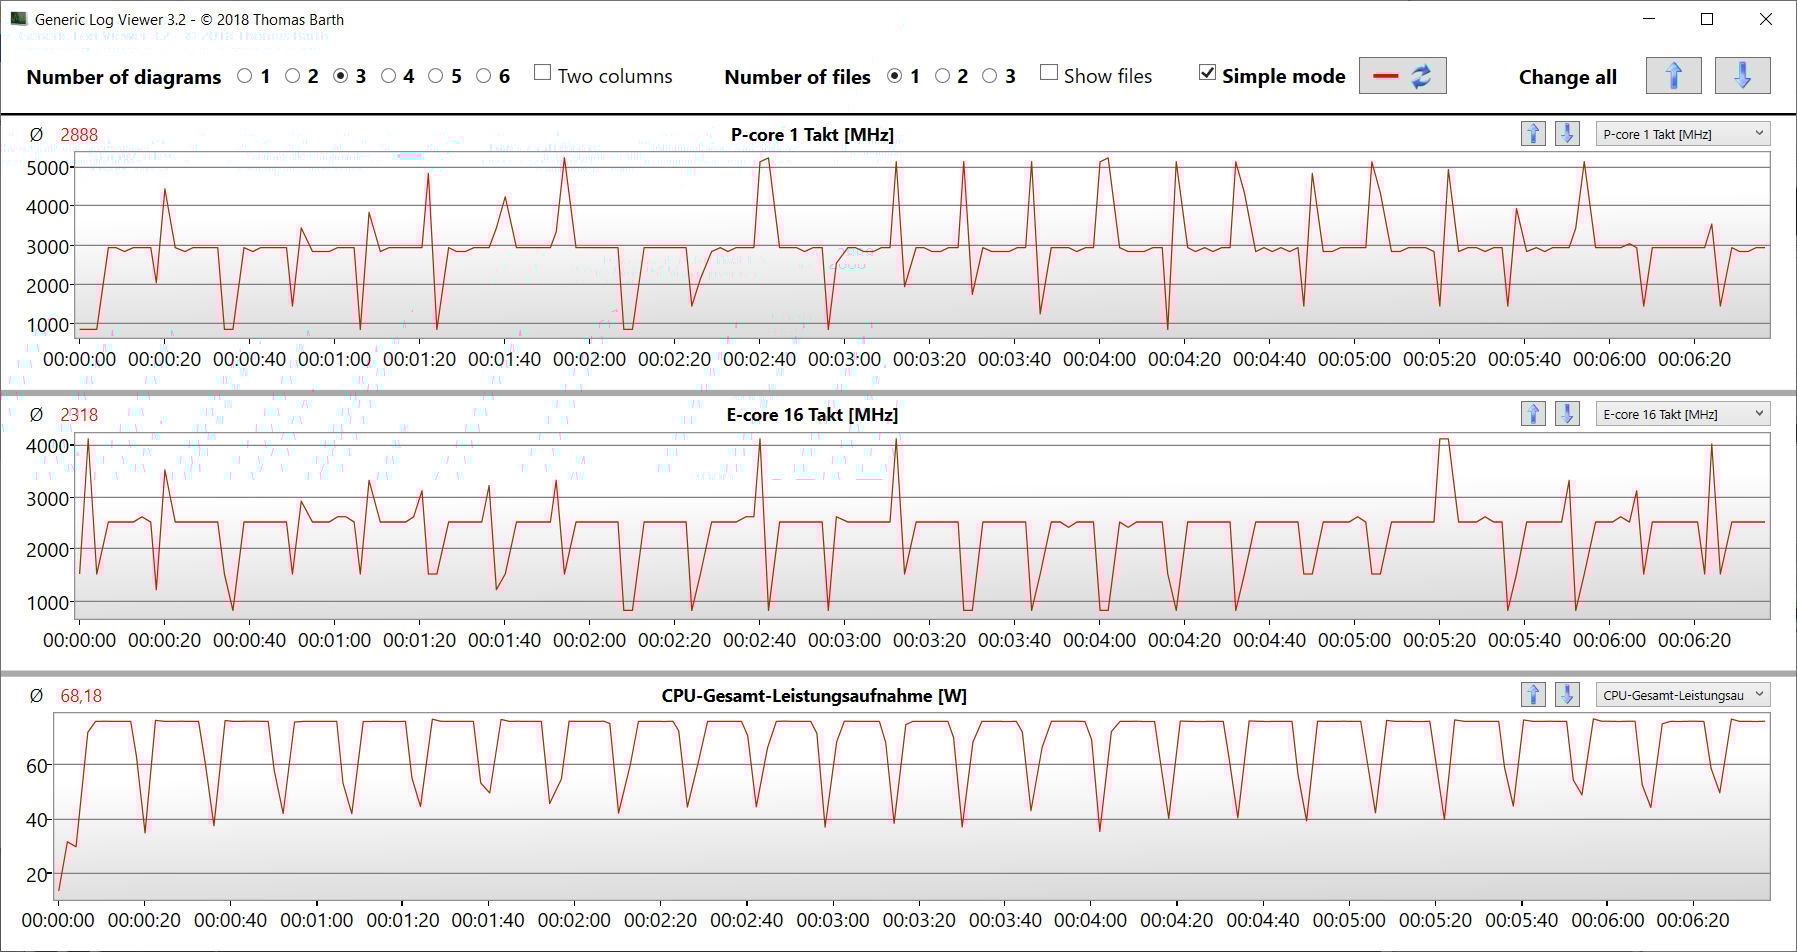
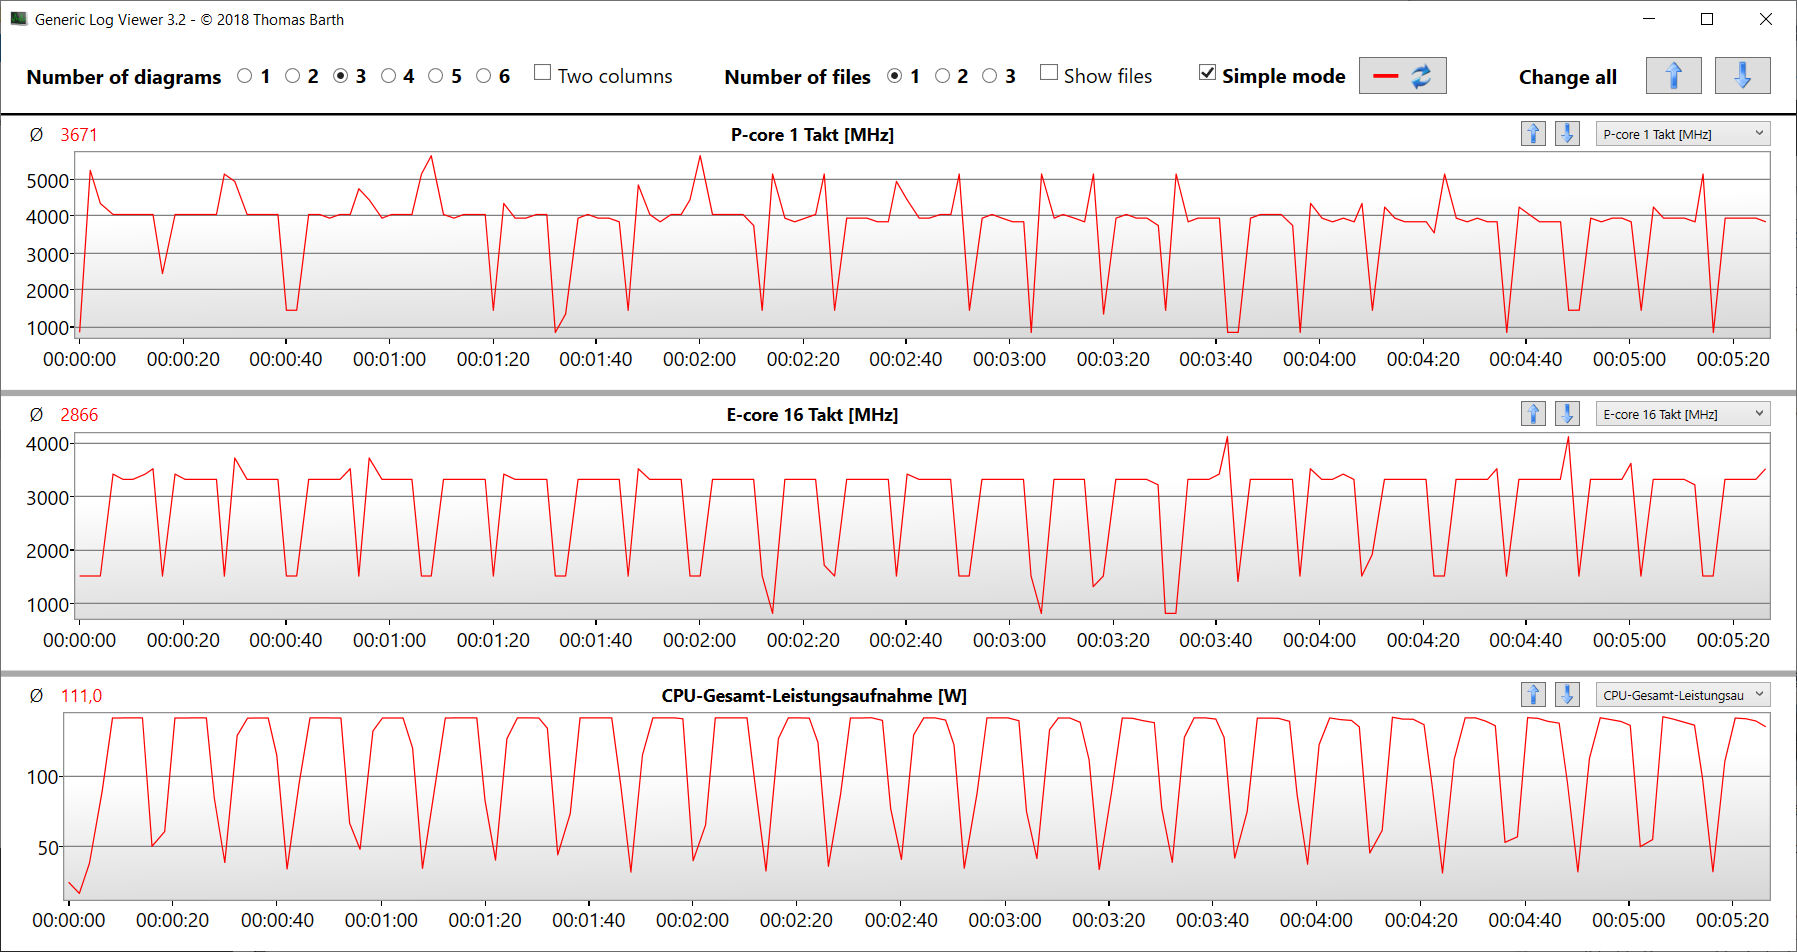
酷睿 i9-14900HX 酷睿 i9-14900HX(Raptor Lake) 的 24 个 CPU 内核(8P + 16E = 32 个线程)可实现 5.8 GHz (P) 和 4.1 GHz (E) 的最高时钟频率。永久多线程负载(CB15 Loop)可实现稳定的时钟频率--其水平取决于所选的电源模式。
Enthusiast提供的基准值低于 CPU 平均值,而Overboost则大大高于平均值--这主要适用于笔记本电脑的多线程性能。在使用所有三种配置文件时,其单线程性能处于较高且非常接近的水平。
有关酷睿 i9 的更多信息,请参阅我们的分析文章。
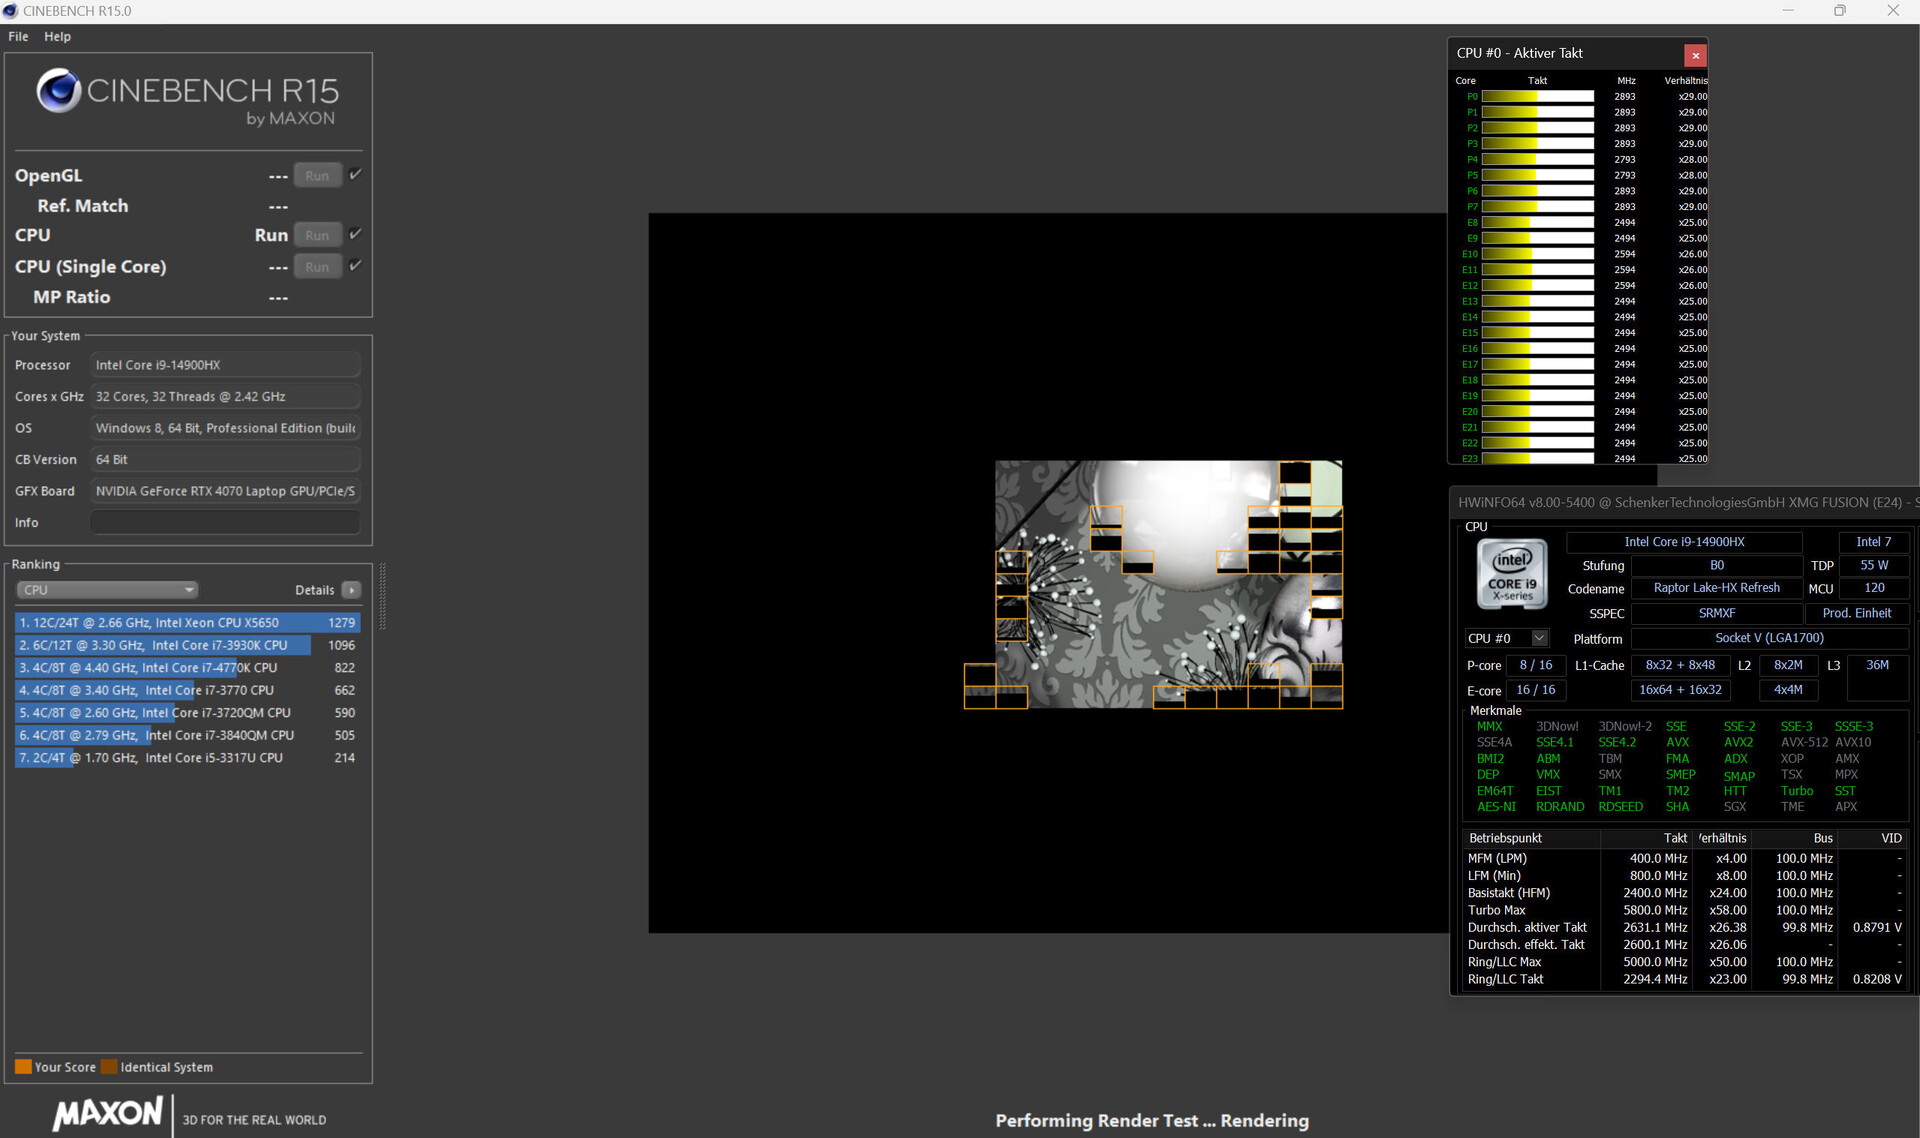
Cinebench R15 Multi continuous test
| CPU Performance rating - Percent | |
| Schenker XMG Fusion 15 (Early 24) | |
| Lenovo Legion Pro 5 16IRX9 | |
| Aorus 16X 2024 | |
| Average Intel Core i9-14900HX | |
| Schenker XMG Fusion 15 (Early 24) | |
| Average of class Gaming | |
| HP Omen Transcend 16-u1095ng | |
| Alienware m16 R2 -1! | |
| Cinebench R23 | |
| Multi Core | |
| Schenker XMG Fusion 15 (Early 24) (Overboost) | |
| Lenovo Legion Pro 5 16IRX9 | |
| Average Intel Core i9-14900HX (17078 - 36249, n=37) | |
| Aorus 16X 2024 | |
| Average of class Gaming (10488 - 42661, n=107, last 2 years) | |
| Schenker XMG Fusion 15 (Early 24) | |
| HP Omen Transcend 16-u1095ng | |
| Alienware m16 R2 | |
| Single Core | |
| Schenker XMG Fusion 15 (Early 24) (Overboost) | |
| Aorus 16X 2024 | |
| HP Omen Transcend 16-u1095ng | |
| Average Intel Core i9-14900HX (1720 - 2245, n=37) | |
| Lenovo Legion Pro 5 16IRX9 | |
| Schenker XMG Fusion 15 (Early 24) | |
| Average of class Gaming (1166 - 2415, n=107, last 2 years) | |
| Alienware m16 R2 | |
| Cinebench R20 | |
| CPU (Multi Core) | |
| Schenker XMG Fusion 15 (Early 24) (Overboost) | |
| Lenovo Legion Pro 5 16IRX9 | |
| Average Intel Core i9-14900HX (6579 - 13832, n=37) | |
| Aorus 16X 2024 | |
| Average of class Gaming (4029 - 16433, n=106, last 2 years) | |
| Schenker XMG Fusion 15 (Early 24) | |
| HP Omen Transcend 16-u1095ng | |
| Alienware m16 R2 | |
| CPU (Single Core) | |
| Schenker XMG Fusion 15 (Early 24) (Overboost) | |
| Aorus 16X 2024 | |
| HP Omen Transcend 16-u1095ng | |
| Average Intel Core i9-14900HX (657 - 859, n=37) | |
| Lenovo Legion Pro 5 16IRX9 | |
| Average of class Gaming (442 - 913, n=106, last 2 years) | |
| Schenker XMG Fusion 15 (Early 24) | |
| Alienware m16 R2 | |
| Cinebench R15 | |
| CPU Multi 64Bit | |
| Lenovo Legion Pro 5 16IRX9 | |
| Schenker XMG Fusion 15 (Early 24) (Overboost) | |
| Average Intel Core i9-14900HX (3263 - 5589, n=38) | |
| Aorus 16X 2024 | |
| Average of class Gaming (1578 - 6330, n=105, last 2 years) | |
| HP Omen Transcend 16-u1095ng | |
| Schenker XMG Fusion 15 (Early 24) | |
| Alienware m16 R2 | |
| CPU Single 64Bit | |
| Aorus 16X 2024 | |
| Schenker XMG Fusion 15 (Early 24) (Overboost) | |
| Average Intel Core i9-14900HX (247 - 323, n=37) | |
| Lenovo Legion Pro 5 16IRX9 | |
| HP Omen Transcend 16-u1095ng | |
| Average of class Gaming (188.8 - 350, n=106, last 2 years) | |
| Schenker XMG Fusion 15 (Early 24) | |
| Alienware m16 R2 | |
| Blender - v2.79 BMW27 CPU | |
| HP Omen Transcend 16-u1095ng | |
| Average of class Gaming (79 - 330, n=104, last 2 years) | |
| Schenker XMG Fusion 15 (Early 24) | |
| Aorus 16X 2024 | |
| Average Intel Core i9-14900HX (91 - 206, n=37) | |
| Lenovo Legion Pro 5 16IRX9 | |
| Schenker XMG Fusion 15 (Early 24) (Overboost) | |
| 7-Zip 18.03 | |
| 7z b 4 | |
| Schenker XMG Fusion 15 (Early 24) (Overboost) | |
| Lenovo Legion Pro 5 16IRX9 | |
| Average Intel Core i9-14900HX (66769 - 136645, n=37) | |
| Aorus 16X 2024 | |
| Schenker XMG Fusion 15 (Early 24) | |
| Average of class Gaming (33491 - 148086, n=105, last 2 years) | |
| HP Omen Transcend 16-u1095ng | |
| Alienware m16 R2 | |
| 7z b 4 -mmt1 | |
| Schenker XMG Fusion 15 (Early 24) | |
| Schenker XMG Fusion 15 (Early 24) (Overboost) | |
| Aorus 16X 2024 | |
| HP Omen Transcend 16-u1095ng | |
| Average Intel Core i9-14900HX (5452 - 7545, n=37) | |
| Lenovo Legion Pro 5 16IRX9 | |
| Average of class Gaming (4199 - 7436, n=105, last 2 years) | |
| Alienware m16 R2 | |
| Geekbench 6.7 | |
| Multi-Core | |
| Lenovo Legion Pro 5 16IRX9 (6.2.1) | |
| Schenker XMG Fusion 15 (Early 24) (6.2.1, Overboost) | |
| Aorus 16X 2024 (6.2.1) | |
| Average Intel Core i9-14900HX (13158 - 19665, n=37) | |
| Schenker XMG Fusion 15 (Early 24) (6.2.1) | |
| HP Omen Transcend 16-u1095ng (6.2.1) | |
| Average of class Gaming (6625 - 22850, n=106, last 2 years) | |
| Alienware m16 R2 (6.2.1) | |
| Single-Core | |
| Schenker XMG Fusion 15 (Early 24) (6.2.1) | |
| Aorus 16X 2024 (6.2.1) | |
| Schenker XMG Fusion 15 (Early 24) (6.2.1, Overboost) | |
| Average Intel Core i9-14900HX (2419 - 3129, n=37) | |
| Lenovo Legion Pro 5 16IRX9 (6.2.1) | |
| Average of class Gaming (1490 - 3259, n=106, last 2 years) | |
| HP Omen Transcend 16-u1095ng (6.2.1) | |
| Alienware m16 R2 (6.2.1) | |
| Geekbench 5.5 | |
| Multi-Core | |
| Lenovo Legion Pro 5 16IRX9 | |
| Schenker XMG Fusion 15 (Early 24) (Overboost) | |
| Aorus 16X 2024 | |
| Average Intel Core i9-14900HX (8618 - 23194, n=37) | |
| HP Omen Transcend 16-u1095ng | |
| Average of class Gaming (6460 - 28263, n=105, last 2 years) | |
| Schenker XMG Fusion 15 (Early 24) | |
| Alienware m16 R2 | |
| Single-Core | |
| Aorus 16X 2024 | |
| Schenker XMG Fusion 15 (Early 24) (Overboost) | |
| Schenker XMG Fusion 15 (Early 24) | |
| Average Intel Core i9-14900HX (1669 - 2210, n=37) | |
| Average of class Gaming (986 - 2474, n=105, last 2 years) | |
| HP Omen Transcend 16-u1095ng | |
| Lenovo Legion Pro 5 16IRX9 | |
| Alienware m16 R2 | |
| HWBOT x265 Benchmark v2.2 - 4k Preset | |
| Schenker XMG Fusion 15 (Early 24) (Overboost) | |
| Lenovo Legion Pro 5 16IRX9 | |
| Average Intel Core i9-14900HX (16.8 - 38.9, n=37) | |
| Average of class Gaming (11.5 - 44.4, n=105, last 2 years) | |
| Aorus 16X 2024 | |
| Schenker XMG Fusion 15 (Early 24) | |
| HP Omen Transcend 16-u1095ng | |
| Alienware m16 R2 | |
| LibreOffice - 20 Documents To PDF | |
| HP Omen Transcend 16-u1095ng (6.3.4.2) | |
| Alienware m16 R2 (6.3.4.2) | |
| Average of class Gaming (33.2 - 88.8, n=105, last 2 years) | |
| Average Intel Core i9-14900HX (19 - 85.1, n=37) | |
| Lenovo Legion Pro 5 16IRX9 (6.3.4.2) | |
| Schenker XMG Fusion 15 (Early 24) (6.3.4.2) | |
| Aorus 16X 2024 (6.3.4.2) | |
| Schenker XMG Fusion 15 (Early 24) (6.3.4.2, Overboost) | |
| R Benchmark 2.5 - Overall mean | |
| Alienware m16 R2 | |
| Average of class Gaming (0.3439 - 0.759, n=106, last 2 years) | |
| HP Omen Transcend 16-u1095ng | |
| Lenovo Legion Pro 5 16IRX9 | |
| Average Intel Core i9-14900HX (0.3604 - 0.4859, n=37) | |
| Aorus 16X 2024 | |
| Schenker XMG Fusion 15 (Early 24) (Overboost) | |
| Schenker XMG Fusion 15 (Early 24) | |
* ... smaller is better
AIDA64: FP32 Ray-Trace | FPU Julia | CPU SHA3 | CPU Queen | FPU SinJulia | FPU Mandel | CPU AES | CPU ZLib | FP64 Ray-Trace | CPU PhotoWorxx
| Performance rating | |
| Schenker XMG Fusion 15 (Early 24) | |
| Average of class Gaming | |
| Lenovo Legion Pro 5 16IRX9 | |
| Average Intel Core i9-14900HX | |
| Aorus 16X 2024 | |
| Schenker XMG Fusion 15 (Early 24) | |
| HP Omen Transcend 16-u1095ng | |
| Alienware m16 R2 | |
| AIDA64 / FP32 Ray-Trace | |
| Average of class Gaming (10227 - 85542, n=105, last 2 years) | |
| Schenker XMG Fusion 15 (Early 24) (v6.92.6600, Overboost) | |
| Lenovo Legion Pro 5 16IRX9 (v6.92.6600) | |
| Average Intel Core i9-14900HX (13098 - 33474, n=36) | |
| Aorus 16X 2024 (v6.92.6600) | |
| Schenker XMG Fusion 15 (Early 24) (v6.92.6600) | |
| Alienware m16 R2 (v6.92.6600) | |
| HP Omen Transcend 16-u1095ng (v6.92.6600) | |
| AIDA64 / FPU Julia | |
| Average of class Gaming (51376 - 238426, n=105, last 2 years) | |
| Schenker XMG Fusion 15 (Early 24) (v6.92.6600, Overboost) | |
| Lenovo Legion Pro 5 16IRX9 (v6.92.6600) | |
| Average Intel Core i9-14900HX (67573 - 166040, n=36) | |
| Aorus 16X 2024 (v6.92.6600) | |
| Schenker XMG Fusion 15 (Early 24) (v6.92.6600) | |
| Alienware m16 R2 (v6.92.6600) | |
| HP Omen Transcend 16-u1095ng (v6.92.6600) | |
| AIDA64 / CPU SHA3 | |
| Schenker XMG Fusion 15 (Early 24) (v6.92.6600, Overboost) | |
| Average of class Gaming (2180 - 10115, n=105, last 2 years) | |
| Lenovo Legion Pro 5 16IRX9 (v6.92.6600) | |
| Average Intel Core i9-14900HX (3589 - 7979, n=36) | |
| Aorus 16X 2024 (v6.92.6600) | |
| Schenker XMG Fusion 15 (Early 24) (v6.92.6600) | |
| HP Omen Transcend 16-u1095ng (v6.92.6600) | |
| Alienware m16 R2 (v6.92.6600) | |
| AIDA64 / CPU Queen | |
| Lenovo Legion Pro 5 16IRX9 (v6.92.6600) | |
| Schenker XMG Fusion 15 (Early 24) (v6.92.6600, Overboost) | |
| Aorus 16X 2024 (v6.92.6600) | |
| Average Intel Core i9-14900HX (118405 - 148966, n=36) | |
| Schenker XMG Fusion 15 (Early 24) (v6.92.6600) | |
| HP Omen Transcend 16-u1095ng (v6.92.6600) | |
| Average of class Gaming (49785 - 173351, n=90, last 2 years) | |
| Alienware m16 R2 (v6.92.6600) | |
| AIDA64 / FPU SinJulia | |
| Schenker XMG Fusion 15 (Early 24) (v6.92.6600, Overboost) | |
| Lenovo Legion Pro 5 16IRX9 (v6.92.6600) | |
| Average Intel Core i9-14900HX (10475 - 18517, n=36) | |
| Aorus 16X 2024 (v6.92.6600) | |
| Average of class Gaming (4424 - 33636, n=105, last 2 years) | |
| Schenker XMG Fusion 15 (Early 24) (v6.92.6600) | |
| HP Omen Transcend 16-u1095ng (v6.92.6600) | |
| Alienware m16 R2 (v6.92.6600) | |
| AIDA64 / FPU Mandel | |
| Average of class Gaming (25115 - 128721, n=105, last 2 years) | |
| Schenker XMG Fusion 15 (Early 24) (v6.92.6600, Overboost) | |
| Lenovo Legion Pro 5 16IRX9 (v6.92.6600) | |
| Average Intel Core i9-14900HX (32543 - 83662, n=36) | |
| Aorus 16X 2024 (v6.92.6600) | |
| Schenker XMG Fusion 15 (Early 24) (v6.92.6600) | |
| Alienware m16 R2 (v6.92.6600) | |
| HP Omen Transcend 16-u1095ng (v6.92.6600) | |
| AIDA64 / CPU AES | |
| Schenker XMG Fusion 15 (Early 24) (v6.92.6600, Overboost) | |
| Schenker XMG Fusion 15 (Early 24) (v6.92.6600) | |
| Average Intel Core i9-14900HX (86964 - 241777, n=36) | |
| Lenovo Legion Pro 5 16IRX9 (v6.92.6600) | |
| Aorus 16X 2024 (v6.92.6600) | |
| Average of class Gaming (39258 - 247074, n=105, last 2 years) | |
| HP Omen Transcend 16-u1095ng (v6.92.6600) | |
| Alienware m16 R2 (v6.92.6600) | |
| AIDA64 / CPU ZLib | |
| Schenker XMG Fusion 15 (Early 24) (v6.92.6600, Overboost) | |
| Lenovo Legion Pro 5 16IRX9 (v6.92.6600) | |
| Average Intel Core i9-14900HX (1054 - 2292, n=36) | |
| Aorus 16X 2024 (v6.92.6600) | |
| Average of class Gaming (574 - 2531, n=105, last 2 years) | |
| Schenker XMG Fusion 15 (Early 24) (v6.92.6600) | |
| HP Omen Transcend 16-u1095ng (v6.92.6600) | |
| Alienware m16 R2 (v6.92.6600) | |
| AIDA64 / FP64 Ray-Trace | |
| Average of class Gaming (5509 - 45446, n=105, last 2 years) | |
| Schenker XMG Fusion 15 (Early 24) (v6.92.6600, Overboost) | |
| Lenovo Legion Pro 5 16IRX9 (v6.92.6600) | |
| Average Intel Core i9-14900HX (6809 - 18349, n=36) | |
| Aorus 16X 2024 (v6.92.6600) | |
| Schenker XMG Fusion 15 (Early 24) (v6.92.6600) | |
| Alienware m16 R2 (v6.92.6600) | |
| HP Omen Transcend 16-u1095ng (v6.92.6600) | |
| AIDA64 / CPU PhotoWorxx | |
| Lenovo Legion Pro 5 16IRX9 (v6.92.6600) | |
| HP Omen Transcend 16-u1095ng (v6.92.6600) | |
| Aorus 16X 2024 (v6.92.6600) | |
| Schenker XMG Fusion 15 (Early 24) (v6.92.6600, Overboost) | |
| Schenker XMG Fusion 15 (Early 24) (v6.92.6600) | |
| Average Intel Core i9-14900HX (23903 - 54702, n=36) | |
| Average of class Gaming (12271 - 89891, n=105, last 2 years) | |
| Alienware m16 R2 (v6.92.6600) | |
系统性能
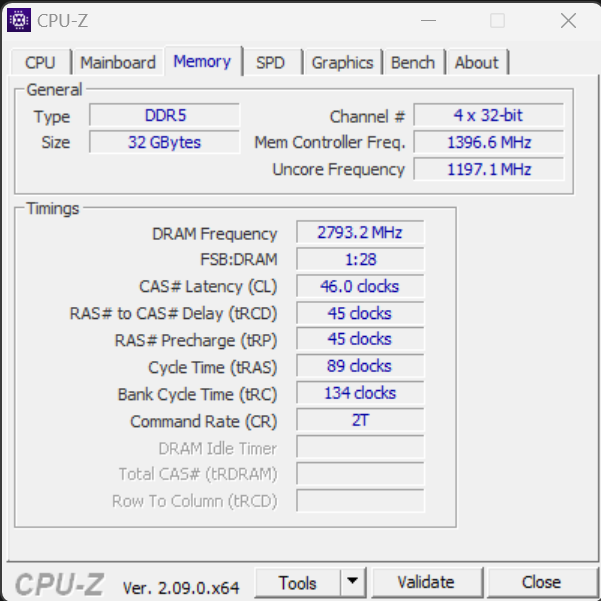
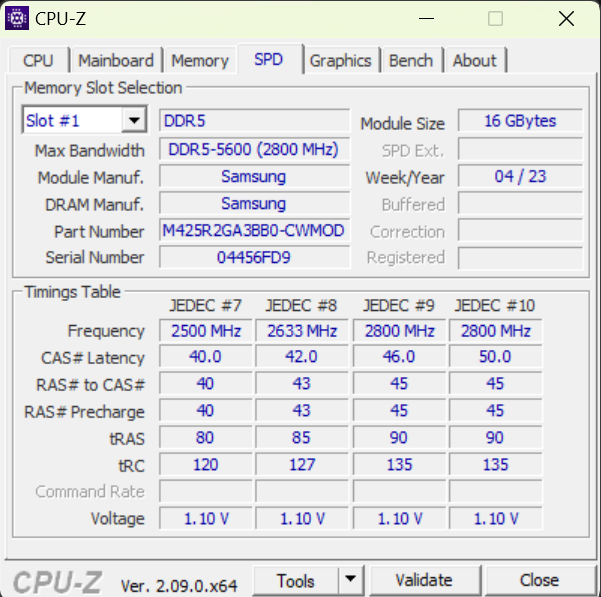
运行流畅的系统并不缺乏计算能力。游戏、流媒体和渲染不会给笔记本电脑带来任何重大挑战。内存的传输速率在 DDR5-5600 内存的正常范围内。PCMark 测试结果也不错。
CrossMark: Overall | Productivity | Creativity | Responsiveness
WebXPRT 3: Overall
WebXPRT 4: Overall
Mozilla Kraken 1.1: Total
| PCMark 10 / Score | |
| Lenovo Legion Pro 5 16IRX9 | |
| Schenker XMG Fusion 15 (Early 24) | |
| Average of class Gaming (5828 - 12414, n=93, last 2 years) | |
| Aorus 16X 2024 | |
| Average Intel Core i9-14900HX, NVIDIA GeForce RTX 4070 Laptop GPU (7768 - 8550, n=8) | |
| HP Omen Transcend 16-u1095ng | |
| Alienware m16 R2 | |
| PCMark 10 / Essentials | |
| Schenker XMG Fusion 15 (Early 24) | |
| Lenovo Legion Pro 5 16IRX9 | |
| Aorus 16X 2024 | |
| Average Intel Core i9-14900HX, NVIDIA GeForce RTX 4070 Laptop GPU (10104 - 11815, n=8) | |
| Average of class Gaming (8810 - 11935, n=97, last 2 years) | |
| HP Omen Transcend 16-u1095ng | |
| Alienware m16 R2 | |
| PCMark 10 / Productivity | |
| Average of class Gaming (6845 - 25323, n=95, last 2 years) | |
| Aorus 16X 2024 | |
| Schenker XMG Fusion 15 (Early 24) | |
| Average Intel Core i9-14900HX, NVIDIA GeForce RTX 4070 Laptop GPU (9577 - 11103, n=8) | |
| HP Omen Transcend 16-u1095ng | |
| Lenovo Legion Pro 5 16IRX9 | |
| Alienware m16 R2 | |
| PCMark 10 / Digital Content Creation | |
| Lenovo Legion Pro 5 16IRX9 | |
| Average of class Gaming (7602 - 19954, n=95, last 2 years) | |
| Schenker XMG Fusion 15 (Early 24) | |
| Average Intel Core i9-14900HX, NVIDIA GeForce RTX 4070 Laptop GPU (12114 - 14827, n=8) | |
| Aorus 16X 2024 | |
| Alienware m16 R2 | |
| HP Omen Transcend 16-u1095ng | |
| CrossMark / Overall | |
| Aorus 16X 2024 | |
| Schenker XMG Fusion 15 (Early 24) | |
| Average Intel Core i9-14900HX, NVIDIA GeForce RTX 4070 Laptop GPU (2002 - 2312, n=7) | |
| Lenovo Legion Pro 5 16IRX9 | |
| Average of class Gaming (1366 - 2409, n=94, last 2 years) | |
| Alienware m16 R2 | |
| CrossMark / Productivity | |
| Aorus 16X 2024 | |
| Schenker XMG Fusion 15 (Early 24) | |
| Average Intel Core i9-14900HX, NVIDIA GeForce RTX 4070 Laptop GPU (1827 - 2191, n=7) | |
| Average of class Gaming (1386 - 2254, n=94, last 2 years) | |
| Lenovo Legion Pro 5 16IRX9 | |
| Alienware m16 R2 | |
| CrossMark / Creativity | |
| Aorus 16X 2024 | |
| Average Intel Core i9-14900HX, NVIDIA GeForce RTX 4070 Laptop GPU (2258 - 2458, n=7) | |
| Schenker XMG Fusion 15 (Early 24) | |
| Lenovo Legion Pro 5 16IRX9 | |
| Average of class Gaming (1343 - 2786, n=94, last 2 years) | |
| Alienware m16 R2 | |
| CrossMark / Responsiveness | |
| Aorus 16X 2024 | |
| Average Intel Core i9-14900HX, NVIDIA GeForce RTX 4070 Laptop GPU (1734 - 2330, n=7) | |
| Schenker XMG Fusion 15 (Early 24) | |
| Lenovo Legion Pro 5 16IRX9 | |
| Average of class Gaming (1226 - 2334, n=94, last 2 years) | |
| Alienware m16 R2 | |
| WebXPRT 3 / Overall | |
| HP Omen Transcend 16-u1095ng | |
| Schenker XMG Fusion 15 (Early 24) | |
| Aorus 16X 2024 | |
| Lenovo Legion Pro 5 16IRX9 | |
| Average Intel Core i9-14900HX, NVIDIA GeForce RTX 4070 Laptop GPU (269 - 342, n=8) | |
| Average of class Gaming (220 - 532, n=98, last 2 years) | |
| Alienware m16 R2 | |
| WebXPRT 4 / Overall | |
| Schenker XMG Fusion 15 (Early 24) | |
| Average Intel Core i9-14900HX, NVIDIA GeForce RTX 4070 Laptop GPU (291 - 304, n=6) | |
| Lenovo Legion Pro 5 16IRX9 | |
| Average of class Gaming (165 - 354, n=98, last 2 years) | |
| Alienware m16 R2 | |
| Mozilla Kraken 1.1 / Total | |
| Alienware m16 R2 | |
| Average of class Gaming (391 - 590, n=100, last 2 years) | |
| Lenovo Legion Pro 5 16IRX9 | |
| Average Intel Core i9-14900HX, NVIDIA GeForce RTX 4070 Laptop GPU (431 - 469, n=8) | |
| HP Omen Transcend 16-u1095ng | |
| Aorus 16X 2024 | |
| Schenker XMG Fusion 15 (Early 24) | |
* ... smaller is better
| PCMark 10 Score | 8522 points | |
Help | ||
| AIDA64 / Memory Copy | |
| Lenovo Legion Pro 5 16IRX9 | |
| Aorus 16X 2024 | |
| HP Omen Transcend 16-u1095ng | |
| Schenker XMG Fusion 15 (Early 24) | |
| Average Intel Core i9-14900HX (38028 - 83392, n=36) | |
| Average of class Gaming (21750 - 129946, n=105, last 2 years) | |
| Alienware m16 R2 | |
| AIDA64 / Memory Read | |
| Aorus 16X 2024 | |
| Lenovo Legion Pro 5 16IRX9 | |
| Schenker XMG Fusion 15 (Early 24) | |
| HP Omen Transcend 16-u1095ng | |
| Average Intel Core i9-14900HX (43306 - 87568, n=36) | |
| Alienware m16 R2 | |
| Average of class Gaming (22956 - 118858, n=105, last 2 years) | |
| AIDA64 / Memory Write | |
| HP Omen Transcend 16-u1095ng | |
| Aorus 16X 2024 | |
| Lenovo Legion Pro 5 16IRX9 | |
| Average of class Gaming (22297 - 135096, n=105, last 2 years) | |
| Average Intel Core i9-14900HX (37146 - 80589, n=36) | |
| Schenker XMG Fusion 15 (Early 24) | |
| Alienware m16 R2 | |
| AIDA64 / Memory Latency | |
| Alienware m16 R2 | |
| Average of class Gaming (75.3 - 259, n=105, last 2 years) | |
| HP Omen Transcend 16-u1095ng | |
| Average Intel Core i9-14900HX (76.1 - 105, n=36) | |
| Lenovo Legion Pro 5 16IRX9 | |
| Schenker XMG Fusion 15 (Early 24) | |
| Aorus 16X 2024 | |
* ... smaller is better
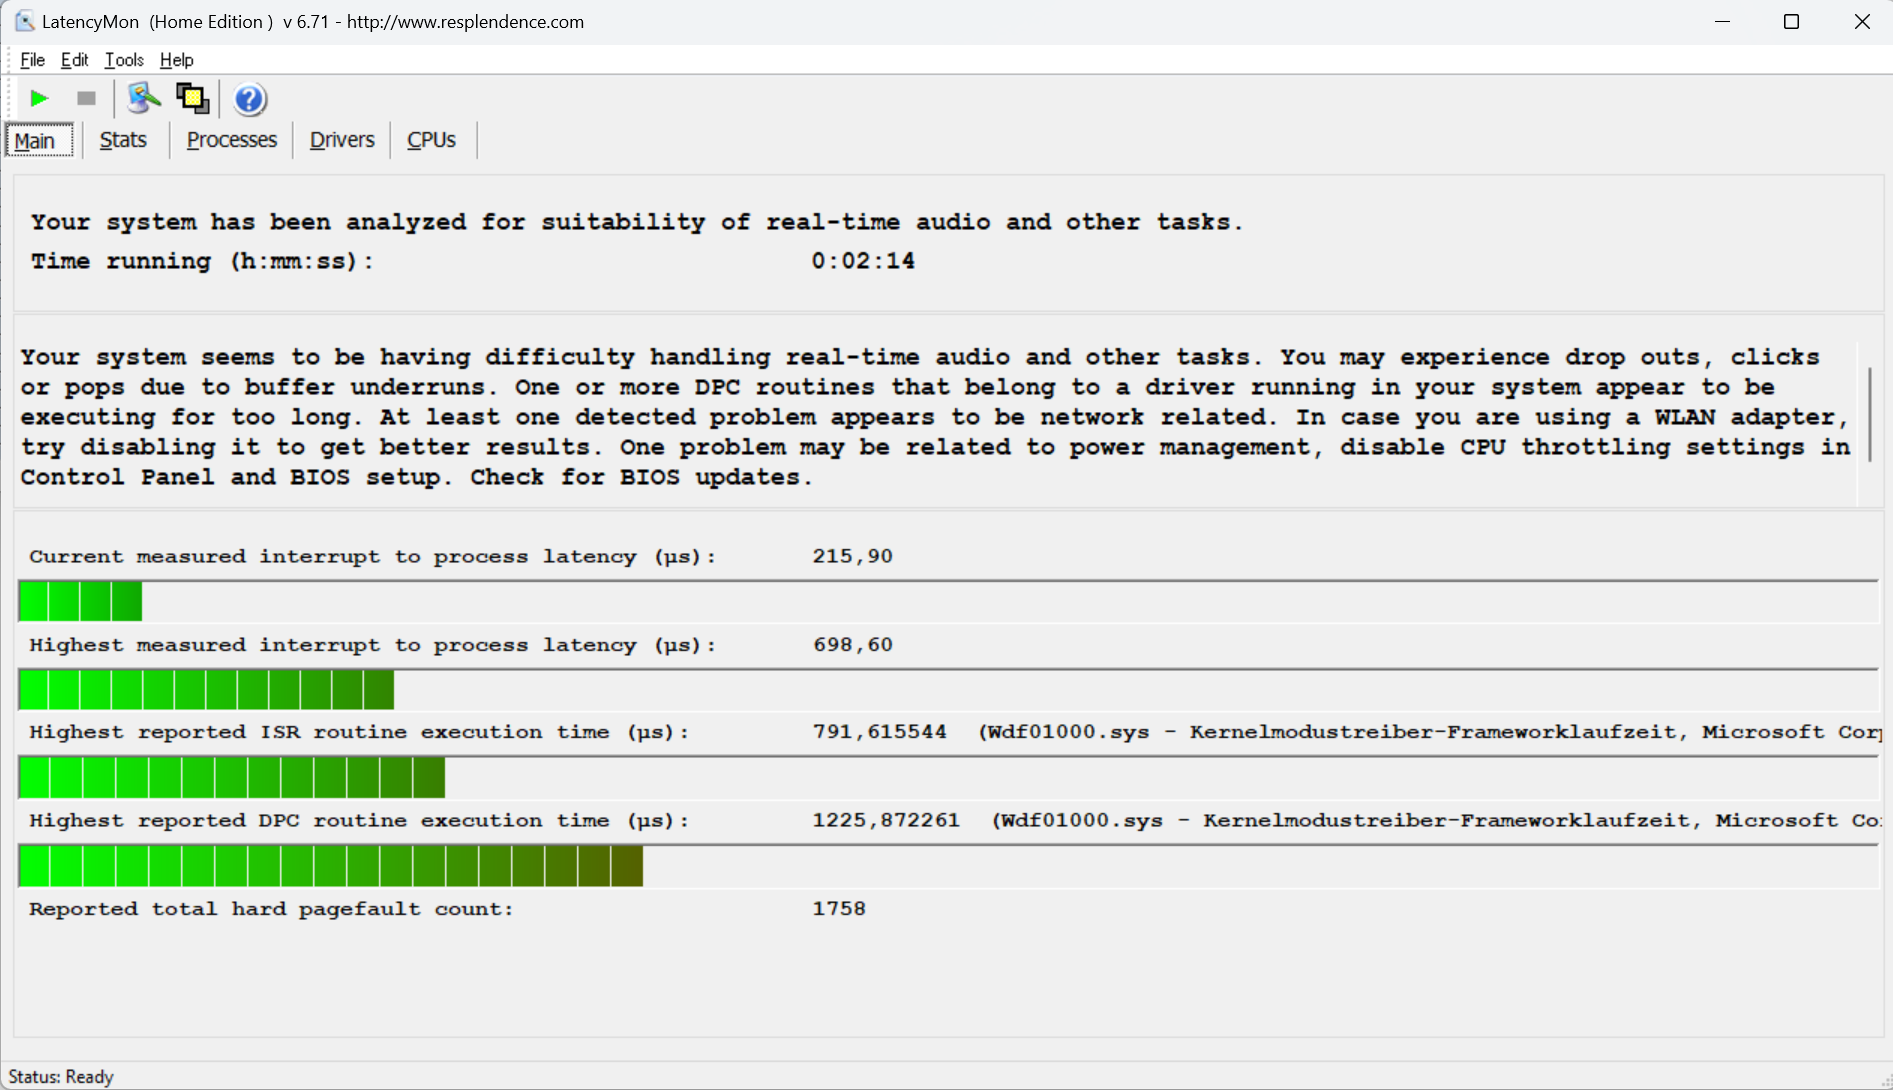
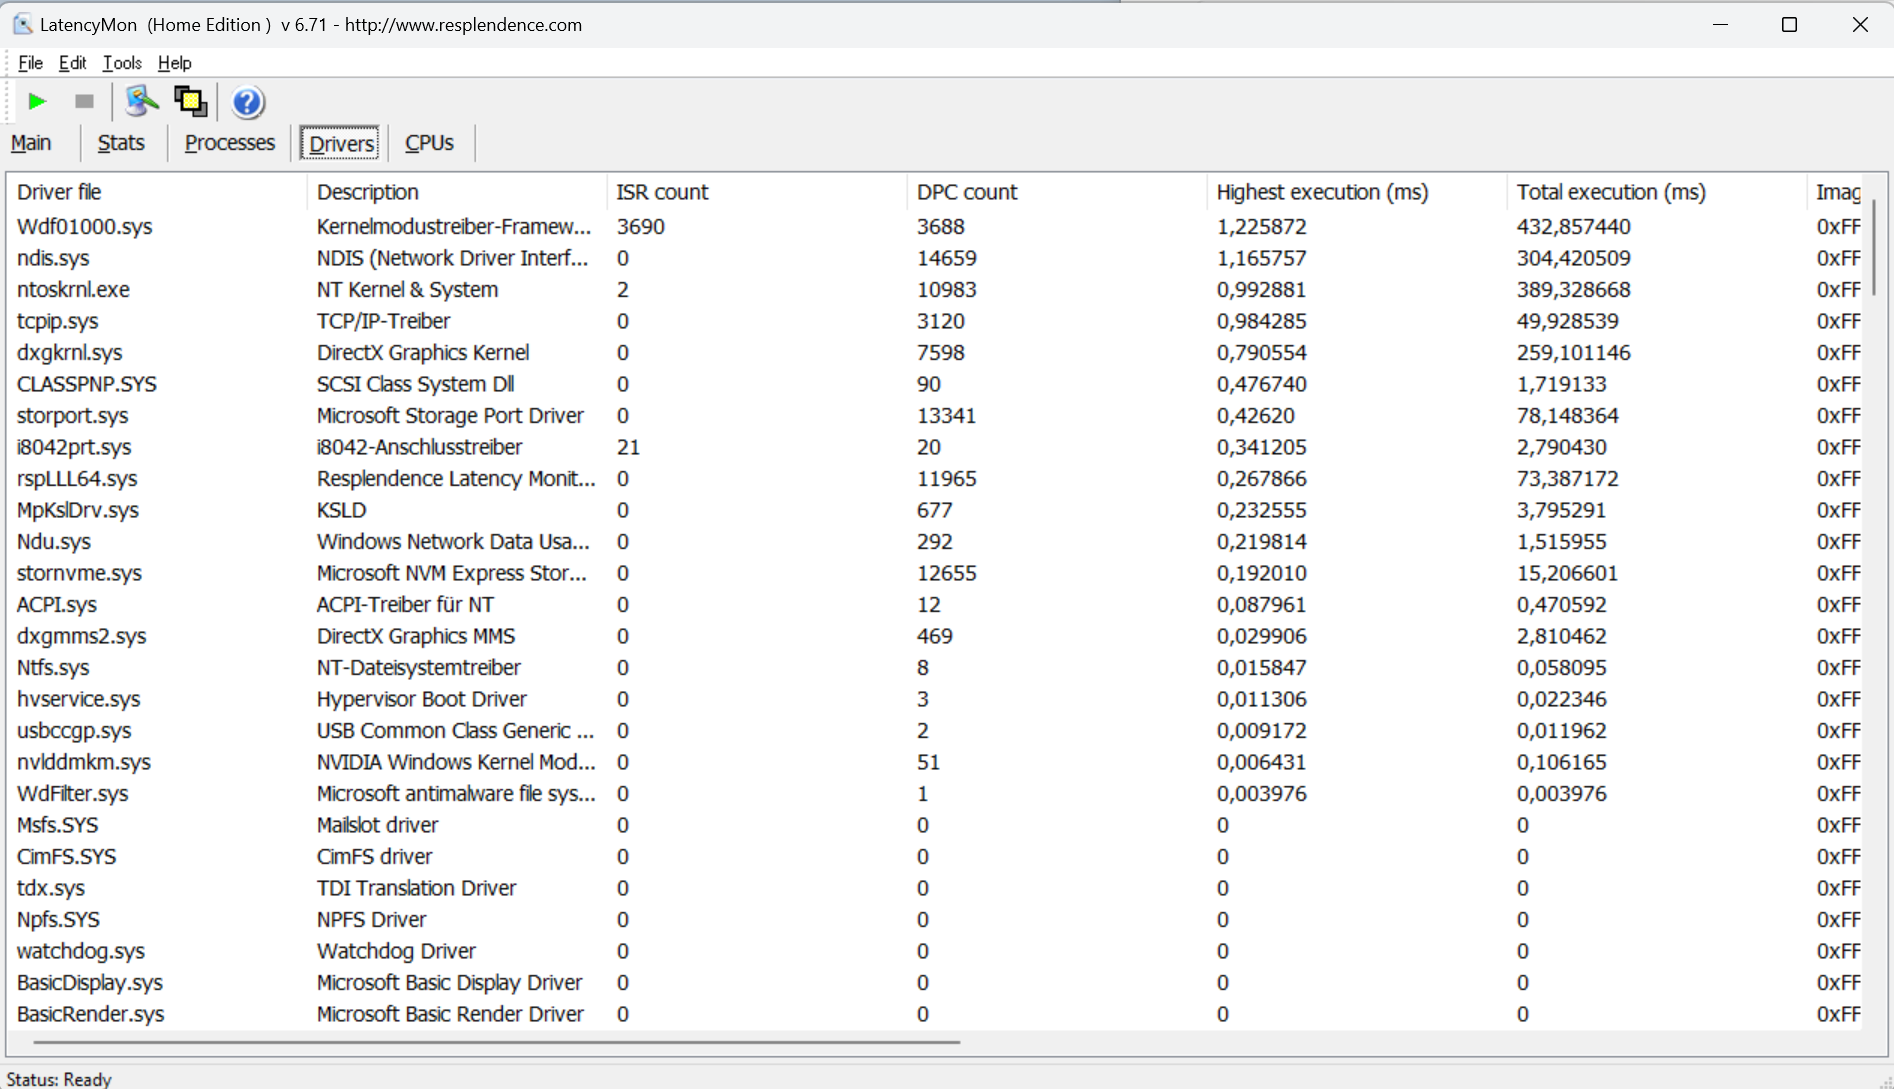
DPC 延迟
标准延迟监控测试(网上冲浪、4K 视频播放、Prime95 高负载)发现了一些异常情况。该系统似乎不适合实时视频和音频编辑。未来的软件更新可能会带来改进,甚至恶化。
| DPC Latencies / LatencyMon - interrupt to process latency (max), Web, Youtube, Prime95 | |
| Alienware m16 R2 | |
| HP Omen Transcend 16-u1095ng | |
| Aorus 16X 2024 | |
| Lenovo Legion Pro 5 16IRX9 | |
| Schenker XMG Fusion 15 (Early 24) | |
* ... smaller is better
存储设备
Fusion 共可容纳两个 M.2-2280 格式的 PCIe-4 SSD。支持 RAID-0/1。我们测试设备的三星固态硬盘(1TB)提供了出色的数据传输速率。正面:我们没有注意到任何热节流现象。


* ... smaller is better
Reading continuous performance: DiskSpd Read Loop, Queue Depth 8
图形卡
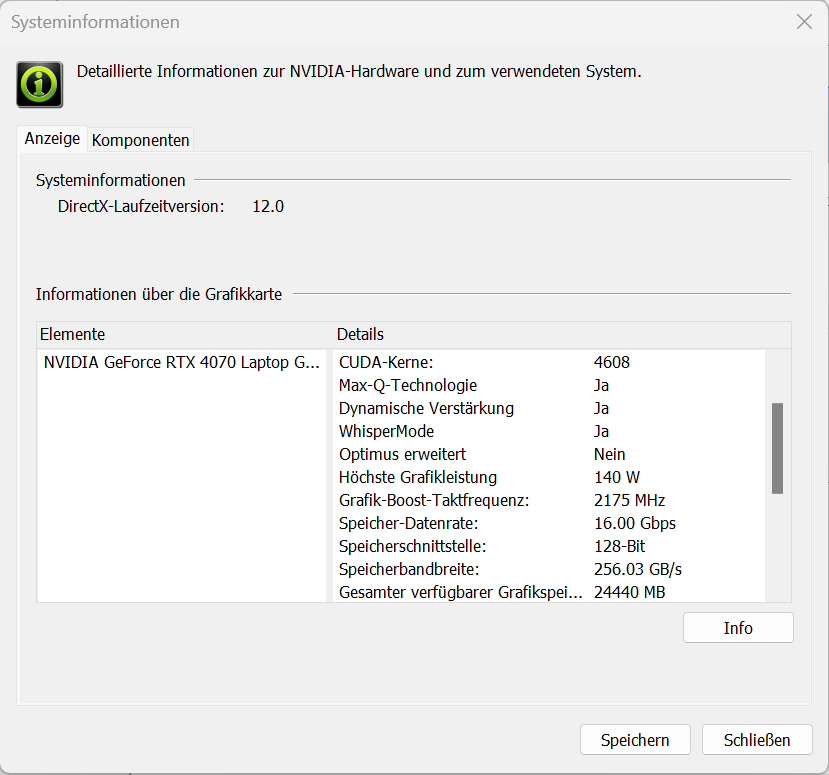
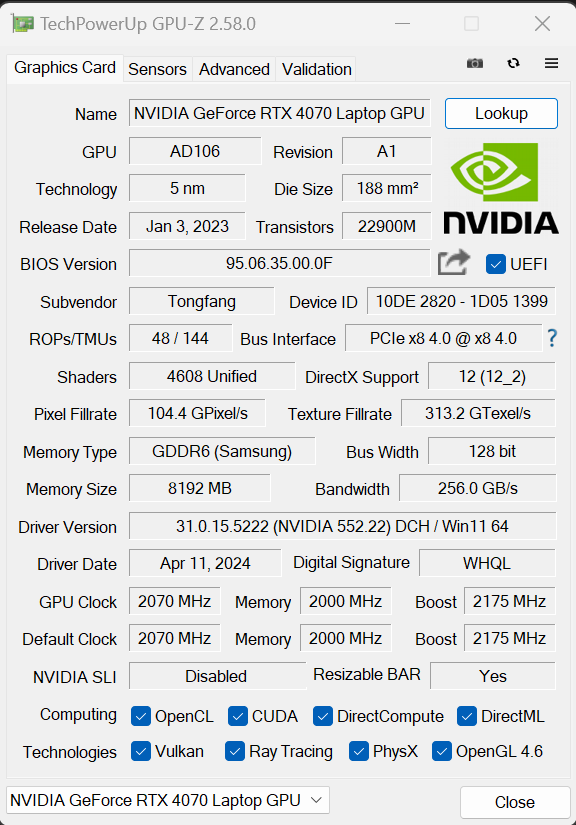
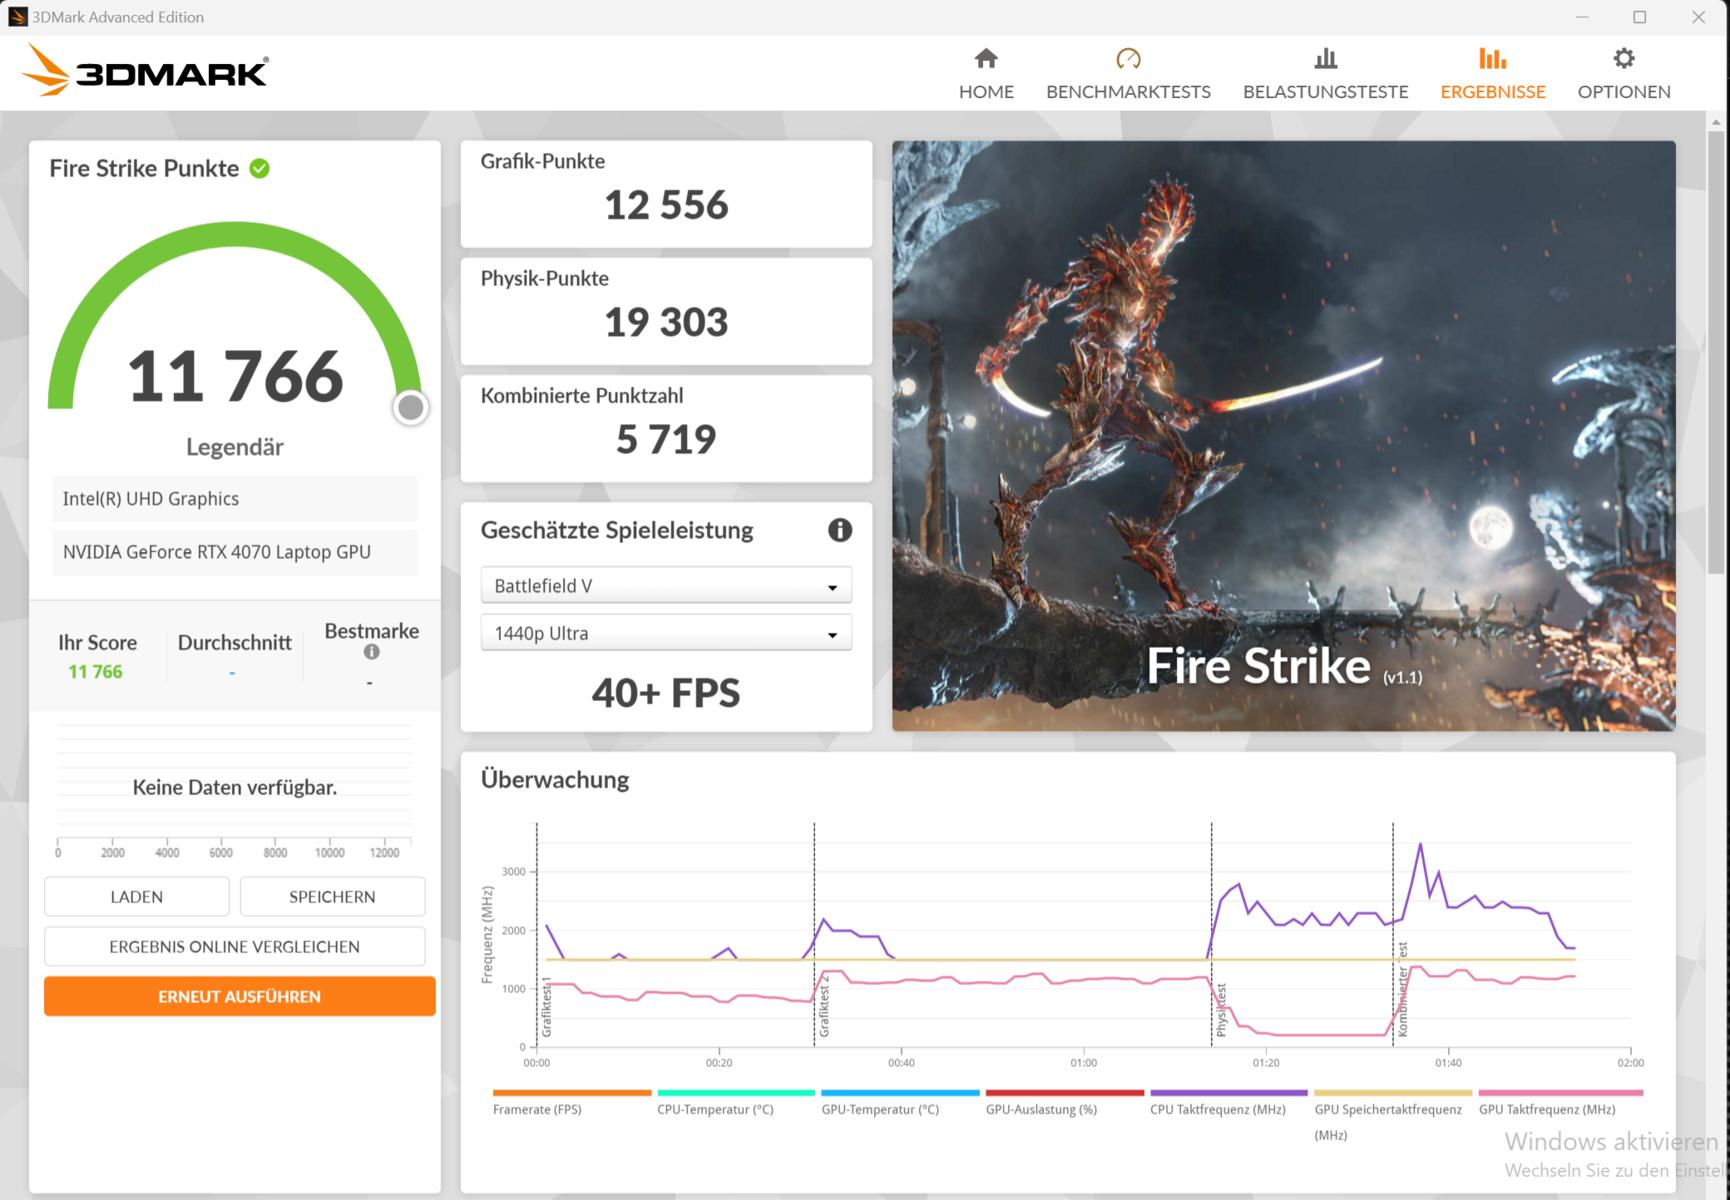
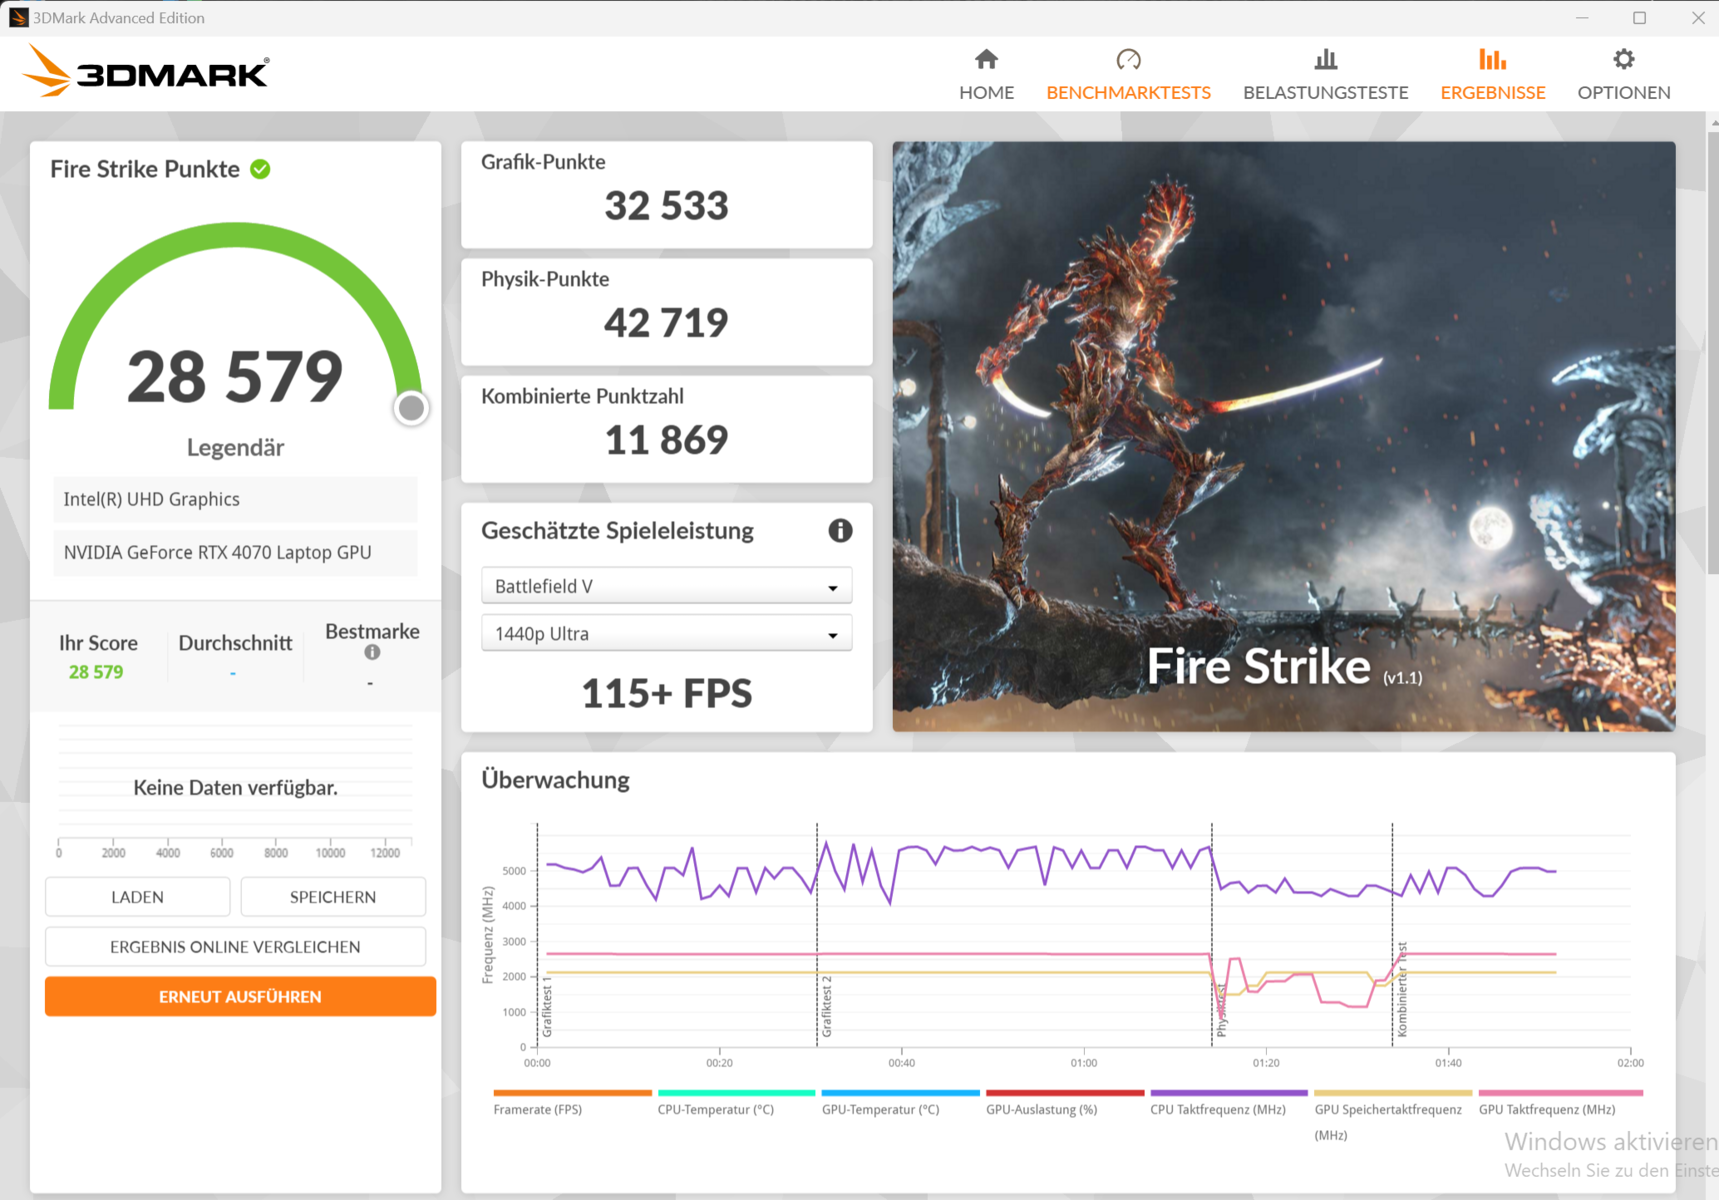
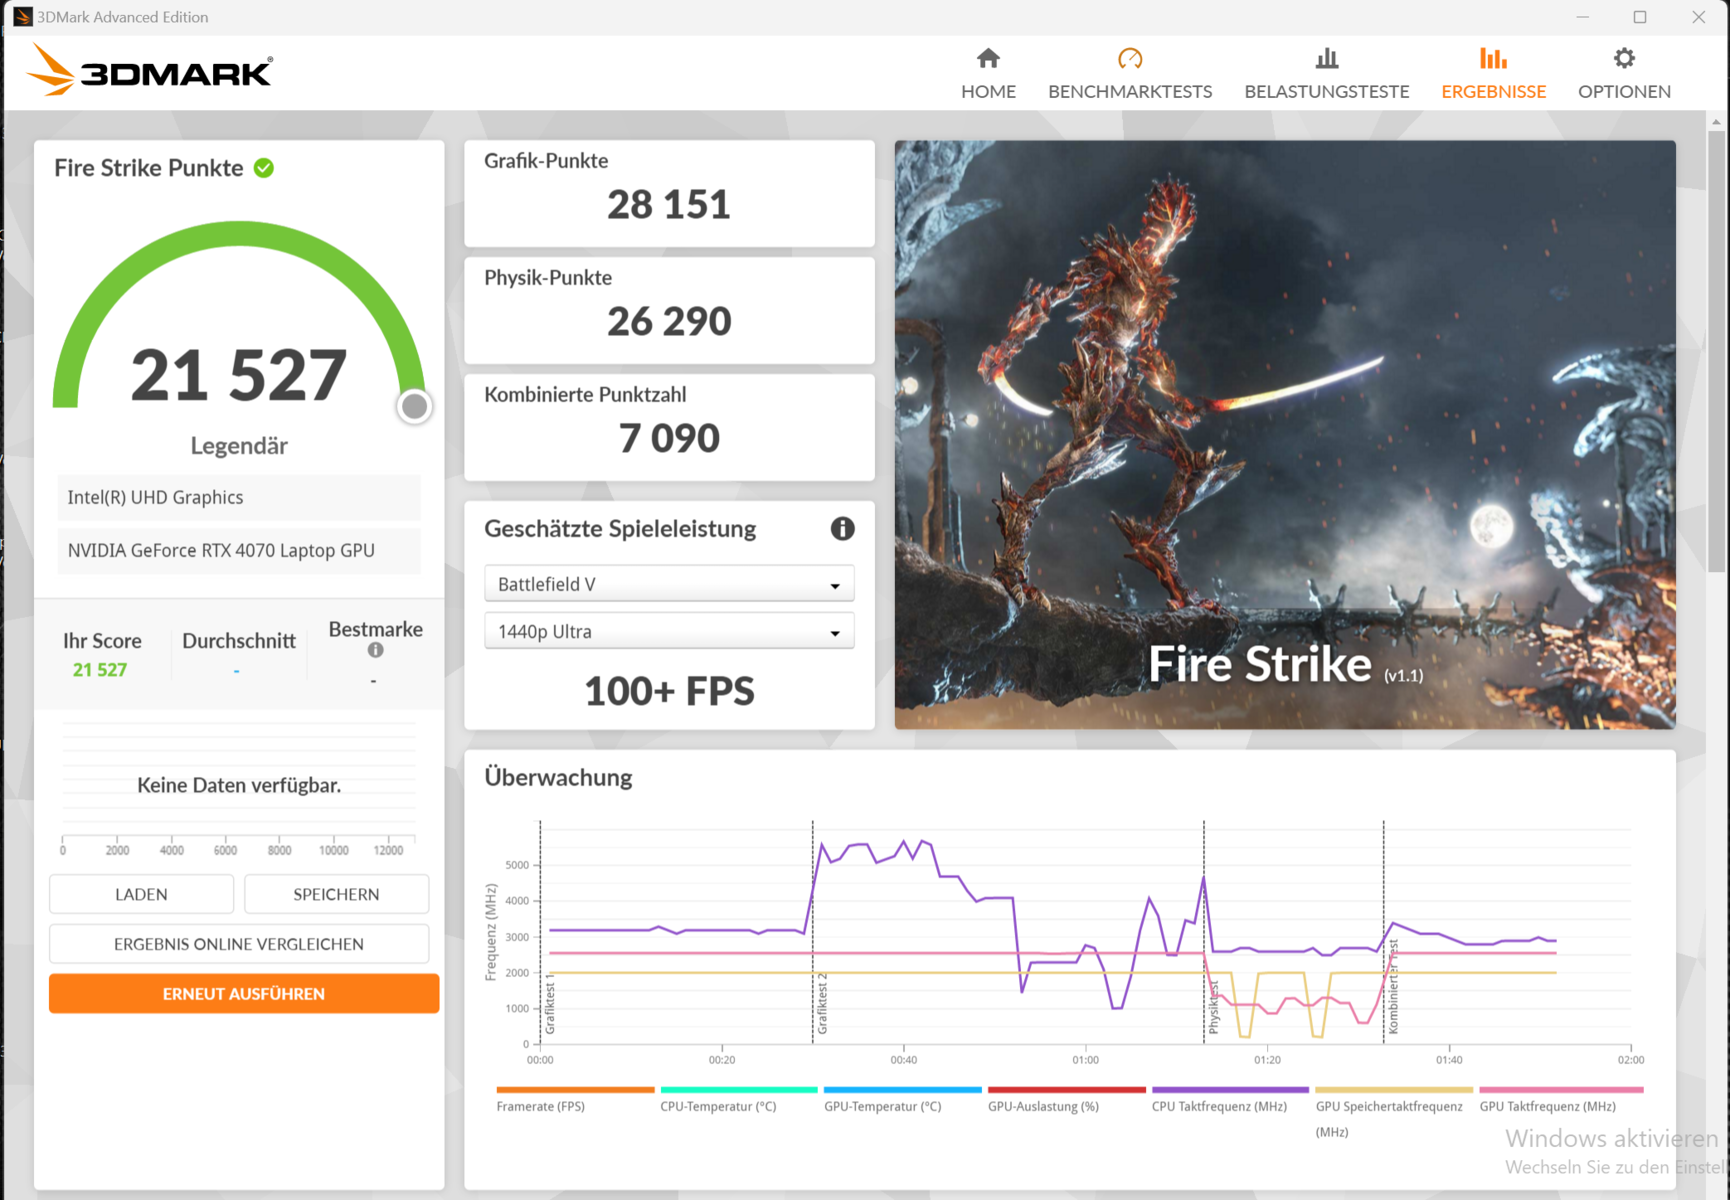
申克允许笔记本电脑的 GeForce RTX 4070的最大 TGP 为 140 瓦(115 瓦 + 25 瓦 Dynamic Boost)--Nvidia 并不建议超过此值。GPU 可以访问 8 GB VRAM(GDDR6)--对于当今的需求来说有点偏低。基准测试的结果高于 RTX-4070 的平均水平(Enthusiast),而Overboost只带来了微小的优势。在 dGPU 和 Optimus 之间切换需要重新启动。

| 3DMark Performance rating - Percent | |
| Average of class Gaming | |
| Schenker XMG Fusion 15 (Early 24) | |
| Lenovo Legion Pro 5 16IRX9 | |
| Schenker XMG Fusion 15 (Early 24) | |
| Alienware m16 R2 | |
| Aorus 16X 2024 | |
| Average NVIDIA GeForce RTX 4070 Laptop GPU | |
| HP Omen Transcend 16-u1095ng | |
| 3DMark 11 - 1280x720 Performance GPU | |
| Average of class Gaming (21841 - 80022, n=104, last 2 years) | |
| Schenker XMG Fusion 15 (Early 24) (Overboost) | |
| Schenker XMG Fusion 15 (Early 24) | |
| Lenovo Legion Pro 5 16IRX9 | |
| Alienware m16 R2 | |
| Aorus 16X 2024 | |
| Average NVIDIA GeForce RTX 4070 Laptop GPU (24229 - 46434, n=67) | |
| HP Omen Transcend 16-u1095ng | |
| 3DMark | |
| 1920x1080 Fire Strike Graphics | |
| Average of class Gaming (12242 - 62849, n=115, last 2 years) | |
| Schenker XMG Fusion 15 (Early 24) (Overboost) | |
| Schenker XMG Fusion 15 (Early 24) | |
| Lenovo Legion Pro 5 16IRX9 | |
| Alienware m16 R2 | |
| Aorus 16X 2024 | |
| Average NVIDIA GeForce RTX 4070 Laptop GPU (12242 - 33451, n=71) | |
| HP Omen Transcend 16-u1095ng | |
| 2560x1440 Time Spy Graphics | |
| Average of class Gaming (5012 - 26212, n=115, last 2 years) | |
| Schenker XMG Fusion 15 (Early 24) (Overboost) | |
| Lenovo Legion Pro 5 16IRX9 | |
| Alienware m16 R2 | |
| Schenker XMG Fusion 15 (Early 24) | |
| Aorus 16X 2024 | |
| Average NVIDIA GeForce RTX 4070 Laptop GPU (5012 - 13391, n=70) | |
| HP Omen Transcend 16-u1095ng | |
| 3DMark 06 Standard Score | 63892 points | |
| 3DMark 11 Performance | 36008 points | |
| 3DMark Fire Strike Score | 26661 points | |
| 3DMark Time Spy Score | 13067 points | |
Help | ||
| Geekbench 5.5 | |
| OpenCL Score | |
| Average of class Gaming (80702 - 277970, n=101, last 2 years) | |
| Schenker XMG Fusion 15 (Early 24) | |
| Schenker XMG Fusion 15 (Early 24) (Overboost) | |
| Aorus 16X 2024 | |
| HP Omen Transcend 16-u1095ng | |
| Average NVIDIA GeForce RTX 4070 Laptop GPU (17391 - 132836, n=68) | |
| Lenovo Legion Pro 5 16IRX9 | |
| Alienware m16 R2 | |
| Vulkan Score 5.5 | |
| Average of class Gaming (18857 - 246759, n=76, last 2 years) | |
| Schenker XMG Fusion 15 (Early 24) (Overboost) | |
| Aorus 16X 2024 | |
| Schenker XMG Fusion 15 (Early 24) | |
| Average NVIDIA GeForce RTX 4070 Laptop GPU (28158 - 102618, n=37) | |
| Alienware m16 R2 | |
| Lenovo Legion Pro 5 16IRX9 | |
| Geekbench 6.7 | |
| GPU OpenCL | |
| Average of class Gaming (67235 - 253130, n=103, last 2 years) | |
| Schenker XMG Fusion 15 (Early 24) (6.2.1) | |
| Schenker XMG Fusion 15 (Early 24) (6.2.1, Overboost) | |
| HP Omen Transcend 16-u1095ng (6.2.1) | |
| Aorus 16X 2024 (6.2.1) | |
| Lenovo Legion Pro 5 16IRX9 (6.2.1) | |
| Average NVIDIA GeForce RTX 4070 Laptop GPU (85488 - 129836, n=45) | |
| Alienware m16 R2 (6.2.1) | |
| GPU Vulkan | |
| Schenker XMG Fusion 15 (Early 24) (6.2.1, Overboost) | |
| Average of class Gaming (7562 - 244348, n=59, last 2 years) | |
| Alienware m16 R2 (6.2.1) | |
| Lenovo Legion Pro 5 16IRX9 (6.2.1) | |
| Average NVIDIA GeForce RTX 4070 Laptop GPU (89638 - 120033, n=24) | |
| Schenker XMG Fusion 15 (Early 24) (6.2.1) | |
| Aorus 16X 2024 (6.2.1) | |
| V-Ray 5 Benchmark | |
| GPU RTX | |
| Average of class Gaming (1146 - 4363, n=33, last 2 years) | |
| Lenovo Legion Pro 5 16IRX9 (5.0.1) | |
| Schenker XMG Fusion 15 (Early 24) (5.0.1, Overboost) | |
| Schenker XMG Fusion 15 (Early 24) (5.0.1) | |
| Alienware m16 R2 (5.0.1) | |
| Aorus 16X 2024 (5.0.1) | |
| Average NVIDIA GeForce RTX 4070 Laptop GPU (171 - 1872, n=39) | |
| GPU CUDA | |
| Average of class Gaming (887 - 3288, n=33, last 2 years) | |
| Lenovo Legion Pro 5 16IRX9 (5.0.1) | |
| Schenker XMG Fusion 15 (Early 24) (5.0.1, Overboost) | |
| Schenker XMG Fusion 15 (Early 24) (5.0.1) | |
| Alienware m16 R2 (5.0.1) | |
| Aorus 16X 2024 (5.0.1) | |
| Average NVIDIA GeForce RTX 4070 Laptop GPU (120 - 1356, n=39) | |
| CPU | |
| Schenker XMG Fusion 15 (Early 24) (5.0.1, Overboost) | |
| Average of class Gaming (5864 - 30302, n=32, last 2 years) | |
| Lenovo Legion Pro 5 16IRX9 (5.0.1) | |
| Aorus 16X 2024 (5.0.1) | |
| Schenker XMG Fusion 15 (Early 24) (5.0.1) | |
| Average NVIDIA GeForce RTX 4070 Laptop GPU (9339 - 20388, n=38) | |
| Alienware m16 R2 (5.0.1) | |
| V-Ray Benchmark Next 4.10 | |
| GPU | |
| Average of class Gaming (427 - 1627, n=99, last 2 years) | |
| Lenovo Legion Pro 5 16IRX9 (v4.10.07 ) | |
| Schenker XMG Fusion 15 (Early 24) (v4.10.07, Overboost) | |
| Average NVIDIA GeForce RTX 4070 Laptop GPU (434 - 686, n=52) | |
| Schenker XMG Fusion 15 (Early 24) (v4.10.07 ) | |
| HP Omen Transcend 16-u1095ng (v4.10.07 ) | |
| Aorus 16X 2024 (v4.10.07 ) | |
| CPU | |
| Schenker XMG Fusion 15 (Early 24) (v4.10.07, Overboost) | |
| Lenovo Legion Pro 5 16IRX9 (v4.10.07 ) | |
| Average of class Gaming (10048 - 45327, n=97, last 2 years) | |
| Aorus 16X 2024 (v4.10.07 ) | |
| Schenker XMG Fusion 15 (Early 24) (v4.10.07 ) | |
| HP Omen Transcend 16-u1095ng (v4.10.07 ) | |
| Average NVIDIA GeForce RTX 4070 Laptop GPU (12638 - 35173, n=52) | |
* ... smaller is better
游戏性能
该硬件适用于高至最高设置下的 QHD 游戏。通过使用 DLSS 3 和 "帧生成",您可以在更高分辨率和最高设置下玩游戏,包括光线追踪,但仅限于支持这些功能的游戏。我们注意到,帧率高于 RTX-4070 的平均水平(Enthusiast),Overboost带来了微小的优势。
| Performance rating - Percent | |
| Average of class Gaming | |
| Schenker XMG Fusion 15 (Early 24) | |
| Lenovo Legion Pro 5 16IRX9 | |
| Schenker XMG Fusion 15 (Early 24) | |
| Aorus 16X 2024 | |
| HP Omen Transcend 16-u1095ng | |
| Average NVIDIA GeForce RTX 4070 Laptop GPU | |
| Alienware m16 R2 -1! | |
| The Witcher 3 - 1920x1080 Ultra Graphics & Postprocessing (HBAO+) | |
| Average of class Gaming (104.7 - 240, n=7, last 2 years) | |
| Lenovo Legion Pro 5 16IRX9 | |
| Schenker XMG Fusion 15 (Early 24) (Overboost) | |
| Schenker XMG Fusion 15 (Early 24) | |
| Aorus 16X 2024 | |
| Alienware m16 R2 | |
| HP Omen Transcend 16-u1095ng | |
| Average NVIDIA GeForce RTX 4070 Laptop GPU (69.8 - 133.7, n=57) | |
| GTA V - 1920x1080 Highest AA:4xMSAA + FX AF:16x | |
| Schenker XMG Fusion 15 (Early 24) (Overboost) | |
| Schenker XMG Fusion 15 (Early 24) | |
| Average of class Gaming (48.3 - 186.9, n=94, last 2 years) | |
| Lenovo Legion Pro 5 16IRX9 | |
| HP Omen Transcend 16-u1095ng | |
| Average NVIDIA GeForce RTX 4070 Laptop GPU (48.3 - 141.6, n=63) | |
| Aorus 16X 2024 | |
| Final Fantasy XV Benchmark - 1920x1080 High Quality | |
| Average of class Gaming (41 - 215, n=95, last 2 years) | |
| Schenker XMG Fusion 15 (Early 24) (1.3, Overboost) | |
| Lenovo Legion Pro 5 16IRX9 (1.3) | |
| Schenker XMG Fusion 15 (Early 24) (1.3) | |
| Alienware m16 R2 (1.3) | |
| Aorus 16X 2024 (1.3) | |
| Average NVIDIA GeForce RTX 4070 Laptop GPU (41 - 131.9, n=65) | |
| HP Omen Transcend 16-u1095ng (1.3) | |
| Strange Brigade - 1920x1080 ultra AA:ultra AF:16 | |
| Average of class Gaming (76.3 - 458, n=87, last 2 years) | |
| Lenovo Legion Pro 5 16IRX9 (1.47.22.14 D3D12) | |
| Schenker XMG Fusion 15 (Early 24) (1.47.22.14 D3D12, Overboost) | |
| Alienware m16 R2 (1.47.22.14 D3D12) | |
| Schenker XMG Fusion 15 (Early 24) (1.47.22.14 D3D12) | |
| Aorus 16X 2024 (1.47.22.14 D3D12) | |
| Average NVIDIA GeForce RTX 4070 Laptop GPU (76.3 - 234, n=63) | |
| HP Omen Transcend 16-u1095ng (1.47.22.14 D3D12) | |
| Dota 2 Reborn - 1920x1080 ultra (3/3) best looking | |
| Schenker XMG Fusion 15 (Early 24) (Overboost) | |
| Lenovo Legion Pro 5 16IRX9 | |
| Schenker XMG Fusion 15 (Early 24) | |
| Aorus 16X 2024 | |
| HP Omen Transcend 16-u1095ng | |
| Average of class Gaming (84.8 - 248, n=107, last 2 years) | |
| Average NVIDIA GeForce RTX 4070 Laptop GPU (89.7 - 191.2, n=67) | |
| Alienware m16 R2 | |
| X-Plane 11.11 - 1920x1080 high (fps_test=3) | |
| Schenker XMG Fusion 15 (Early 24) (Overboost) | |
| Lenovo Legion Pro 5 16IRX9 | |
| Schenker XMG Fusion 15 (Early 24) | |
| Aorus 16X 2024 | |
| HP Omen Transcend 16-u1095ng | |
| Average NVIDIA GeForce RTX 4070 Laptop GPU (52.1 - 147.9, n=69) | |
| Average of class Gaming (55.5 - 143.5, n=109, last 2 years) | |
| Alienware m16 R2 | |
| Cyberpunk 2077 | |
| 1920x1080 Ultra Preset (FSR off) | |
| Average of class Gaming (17.7 - 169.9, n=115, last 2 years) | |
| Schenker XMG Fusion 15 (Early 24) (2.02, Overboost) | |
| Lenovo Legion Pro 5 16IRX9 (2.02) | |
| Schenker XMG Fusion 15 (Early 24) (2.02) | |
| Alienware m16 R2 (2.02) | |
| Average NVIDIA GeForce RTX 4070 Laptop GPU (30.7 - 90.7, n=40) | |
| Aorus 16X 2024 (2.02) | |
| 2560x1440 Ultra Preset (FSR off) | |
| Average of class Gaming (24.8 - 122.8, n=93, last 2 years) | |
| Schenker XMG Fusion 15 (Early 24) (2.02, Overboost) | |
| Lenovo Legion Pro 5 16IRX9 (2.02) | |
| Alienware m16 R2 (2.02) | |
| Schenker XMG Fusion 15 (Early 24) (2.02) | |
| Aorus 16X 2024 (2.02) | |
| Average NVIDIA GeForce RTX 4070 Laptop GPU (24.8 - 57.1, n=37) | |
| 1920x1080 Ray Tracing Ultra Preset (DLSS off) | |
| Average of class Gaming (19.1 - 84.9, n=36, last 2 years) | |
| Schenker XMG Fusion 15 (Early 24) (2.02, Overboost) | |
| Lenovo Legion Pro 5 16IRX9 (2.02) | |
| Schenker XMG Fusion 15 (Early 24) (2.02) | |
| Alienware m16 R2 (2.02) | |
| Aorus 16X 2024 (2.02) | |
| Average NVIDIA GeForce RTX 4070 Laptop GPU (19.1 - 46.8, n=23) | |
| Alone in the Dark | |
| 1920x1080 Cinematic Preset | |
| Schenker XMG Fusion 15 (Early 24) | |
| Aorus 16X 2024 | |
| Average NVIDIA GeForce RTX 4070 Laptop GPU (105.5 - 126, n=5) | |
| 2560x1440 Cinematic Preset | |
| Schenker XMG Fusion 15 (Early 24) | |
| Average NVIDIA GeForce RTX 4070 Laptop GPU (37.4 - 76.6, n=5) | |
| Aorus 16X 2024 | |
| The Witcher 3 v4 | |
| 1920x1080 Ultra Preset / On AA:FX | |
| Schenker XMG Fusion 15 (Early 24) | |
| Average NVIDIA GeForce RTX 4070 Laptop GPU (85 - 86.5, n=2) | |
| 1920x1080 RT Ultra Preset / On AA:FX | |
| Schenker XMG Fusion 15 (Early 24) | |
| Average NVIDIA GeForce RTX 4070 Laptop GPU (36 - 40.4, n=2) | |
为了测试《Witcher 3》的帧速率是否能在较长时间内保持稳定,我们以全高清模式运行了约 60 分钟,并将设置调至最高。我们没有移动游戏角色。我们没有注意到帧速率的下降,但大约 50 分钟后,帧速率下降了百分之几(Enthusiast)。在激活配置文件 "超频 "的情况下,则不会出现这种情况。
Witcher 3 FPS diagram
| low | med. | high | ultra | QHD | |
|---|---|---|---|---|---|
| GTA V (2015) | 187.8 | 187 | 186.4 | 137.6 | 98.2 |
| The Witcher 3 (2015) | 603.3 | 418.4 | 246.2 | 128 | 92.2 |
| Dota 2 Reborn (2015) | 234 | 207 | 196.5 | 182.1 | |
| Final Fantasy XV Benchmark (2018) | 226 | 175.5 | 124.6 | 90.5 | |
| X-Plane 11.11 (2018) | 205 | 173.3 | 136.9 | ||
| Far Cry 5 (2018) | 204 | 176 | 166 | 157 | 124 |
| Strange Brigade (2018) | 558 | 313 | 245 | 214 | 139.2 |
| The Witcher 3 v4 (2023) | 271 | 215 | 176.2 | 86.5 | |
| Baldur's Gate 3 (2023) | 157.2 | 121.2 | 106.1 | 105 | 82.1 |
| Cyberpunk 2077 (2023) | 156.6 | 124.5 | 103.6 | 87 | 52.6 |
| Alan Wake 2 (2023) | 74.3 | 71.4 | 70.1 | 42.8 | |
| Alone in the Dark (2024) | 222 | 209 | 196.5 | 126 | 76.6 |
| Dragon's Dogma 2 (2024) | 83.9 | 80 | 61.3 |
排放物 - 申克笔记本电脑温度很高
噪音排放
在日常使用和空转时,笔记本电脑的运行非常安静。虽然风扇一直处于激活状态(可通过 BIOS 关闭),但只有在非常安静的环境中才能听到风扇的声音。在负载情况下,情况很快就会发生变化:我们注意到风扇发出的噪音高达 53 dB(A)("发烧友"模式)。超频模式下的数值甚至更高。在使用平衡模式时,设备运行时的噪音要小得多,但也牺牲了一些性能。
Noise level
| Idle |
| 27 / 28 / 33 dB(A) |
| Load |
| 52 / 53 dB(A) |
 | ||
30 dB silent 40 dB(A) audible 50 dB(A) loud |
||
min: | ||
| Schenker XMG Fusion 15 (Early 24) i9-14900HX, GeForce RTX 4070 Laptop GPU | Aorus 16X 2024 i9-14900HX, GeForce RTX 4070 Laptop GPU | Alienware m16 R2 Ultra 7 155H, GeForce RTX 4070 Laptop GPU | HP Omen Transcend 16-u1095ng i9-14900HX, GeForce RTX 4070 Laptop GPU | Lenovo Legion Pro 5 16IRX9 i9-14900HX, GeForce RTX 4070 Laptop GPU | |
|---|---|---|---|---|---|
| Noise | -5% | 8% | 5% | 6% | |
| off / environment * (dB) | 25 | 26 -4% | 24.7 1% | 24 4% | 23.9 4% |
| Idle Minimum * (dB) | 27 | 26 4% | 25.3 6% | 29 -7% | 24.3 10% |
| Idle Average * (dB) | 28 | 32 -14% | 25.3 10% | 30 -7% | 24.3 13% |
| Idle Maximum * (dB) | 33 | 38 -15% | 25.3 23% | 31 6% | 28.9 12% |
| Load Average * (dB) | 52 | 54 -4% | 31.7 39% | 45 13% | 45.8 12% |
| Witcher 3 ultra * (dB) | 51 | 50 2% | 53.8 -5% | 44 14% | 51 -0% |
| Load Maximum * (dB) | 53 | 55 -4% | 62 -17% | 47 11% | 56.6 -7% |
* ... smaller is better
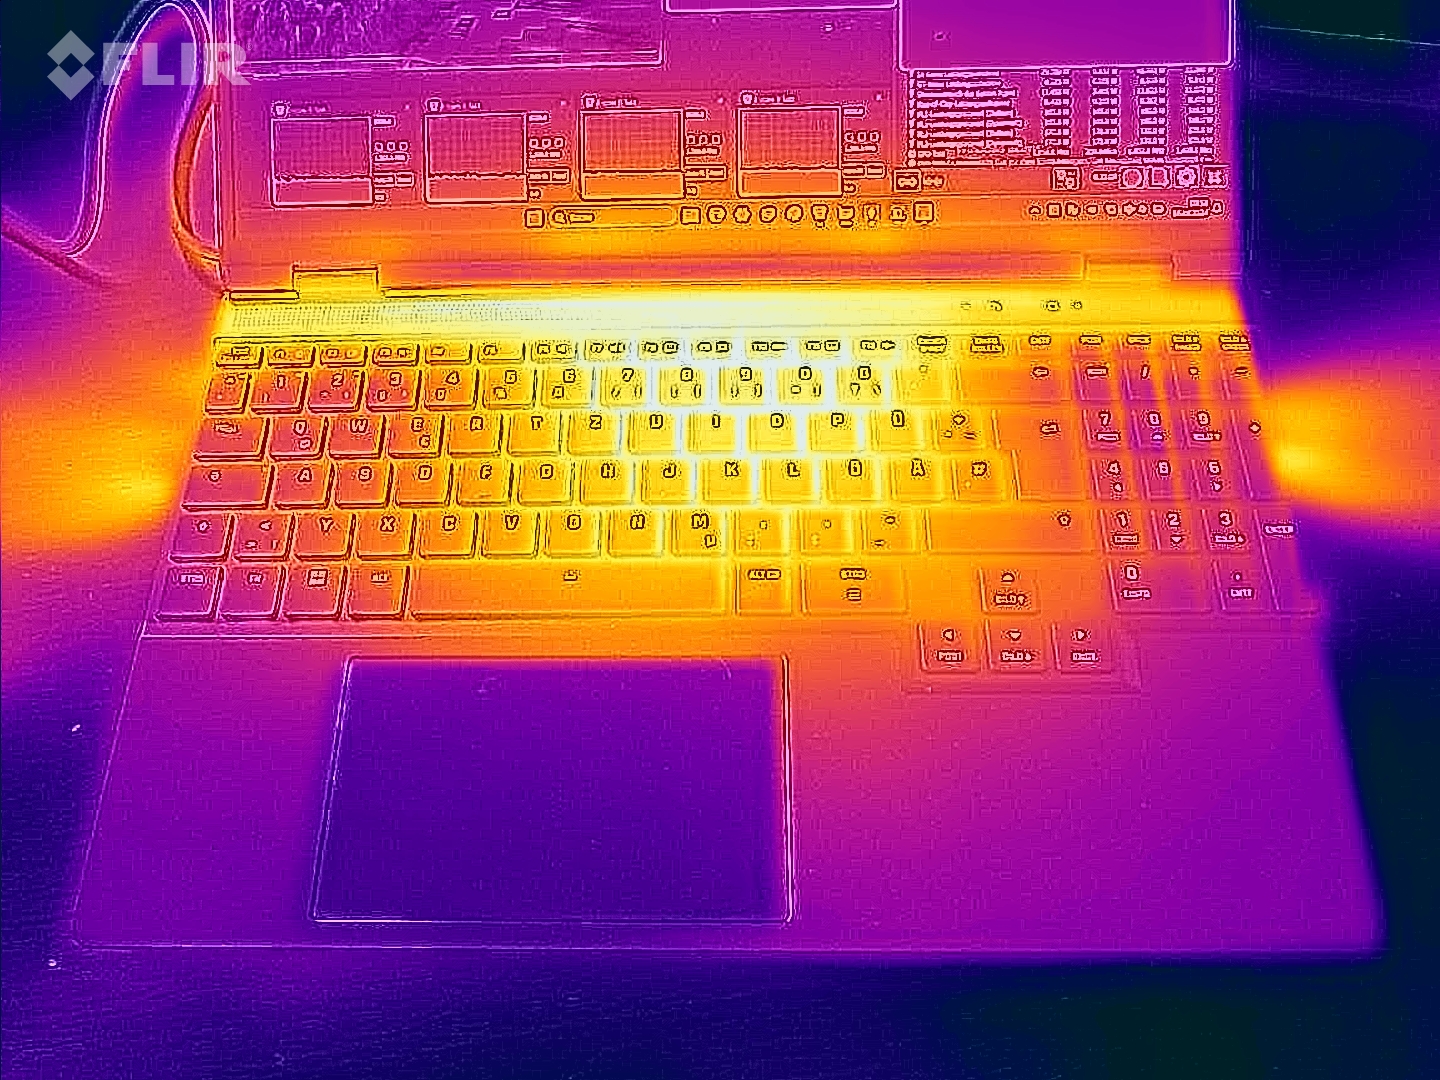
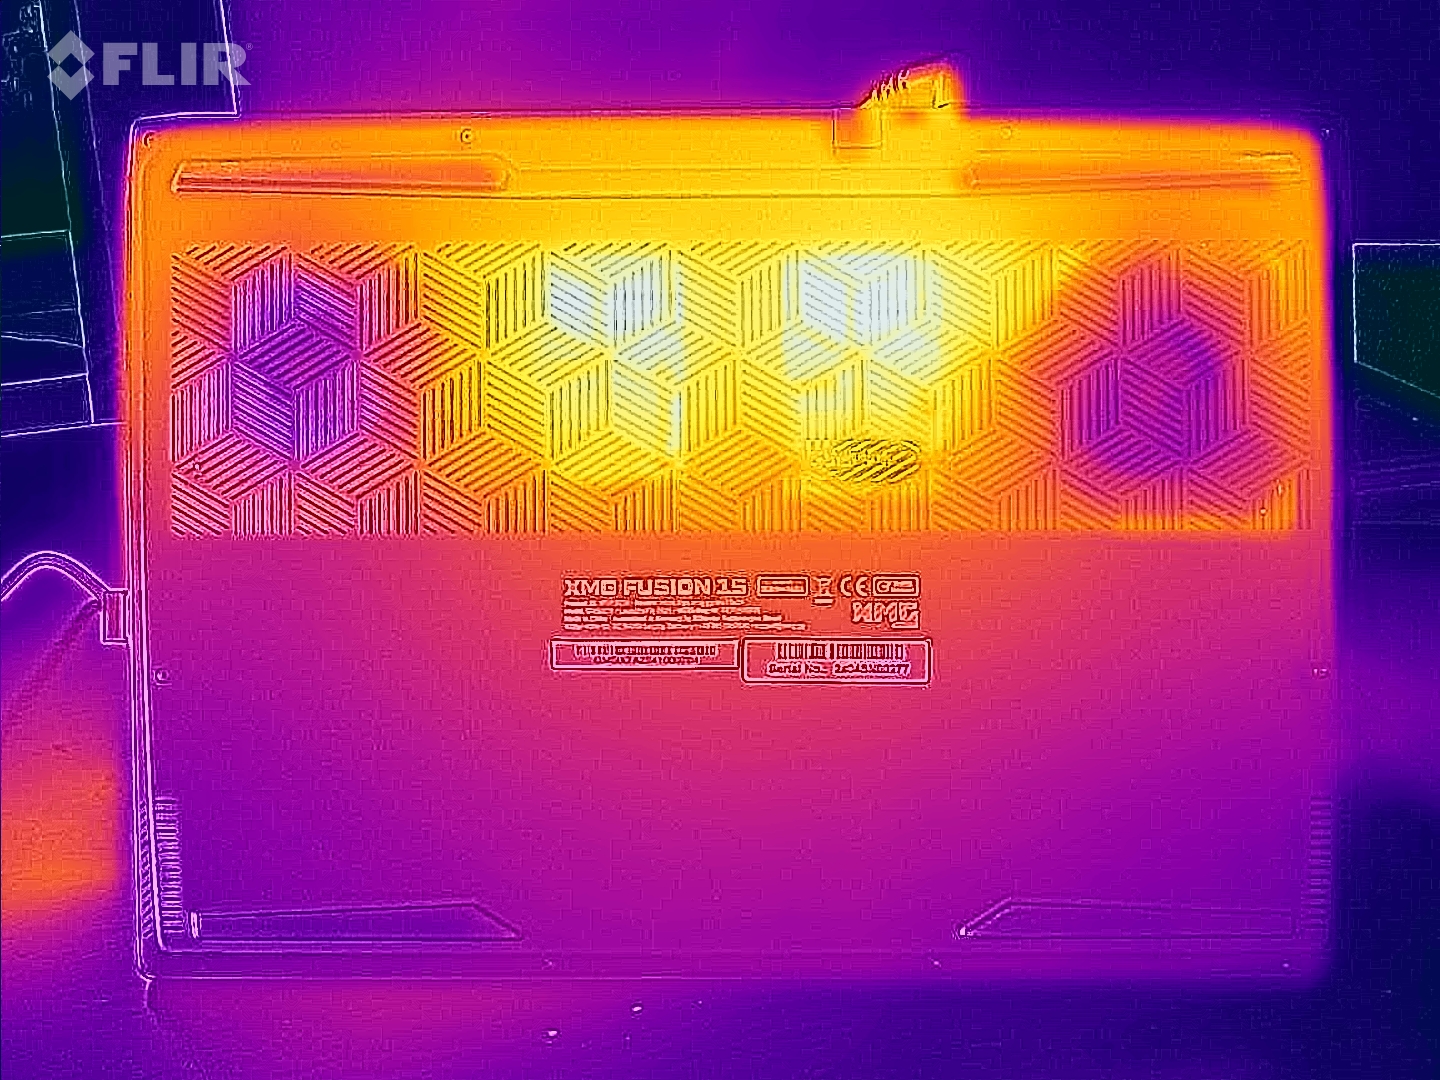
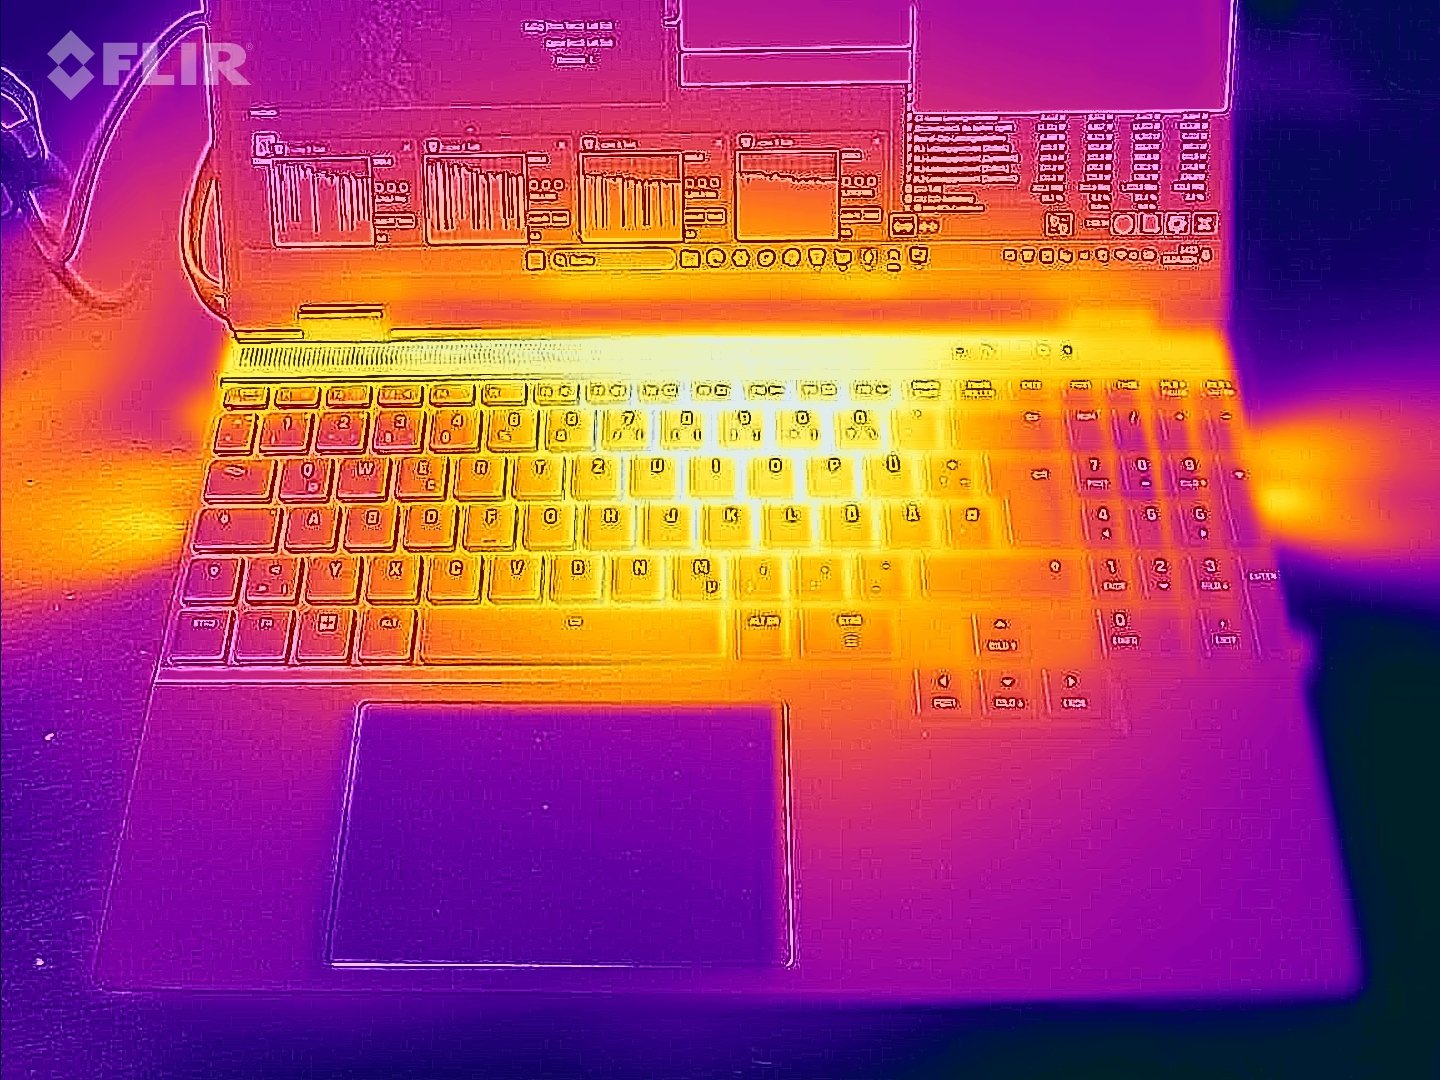
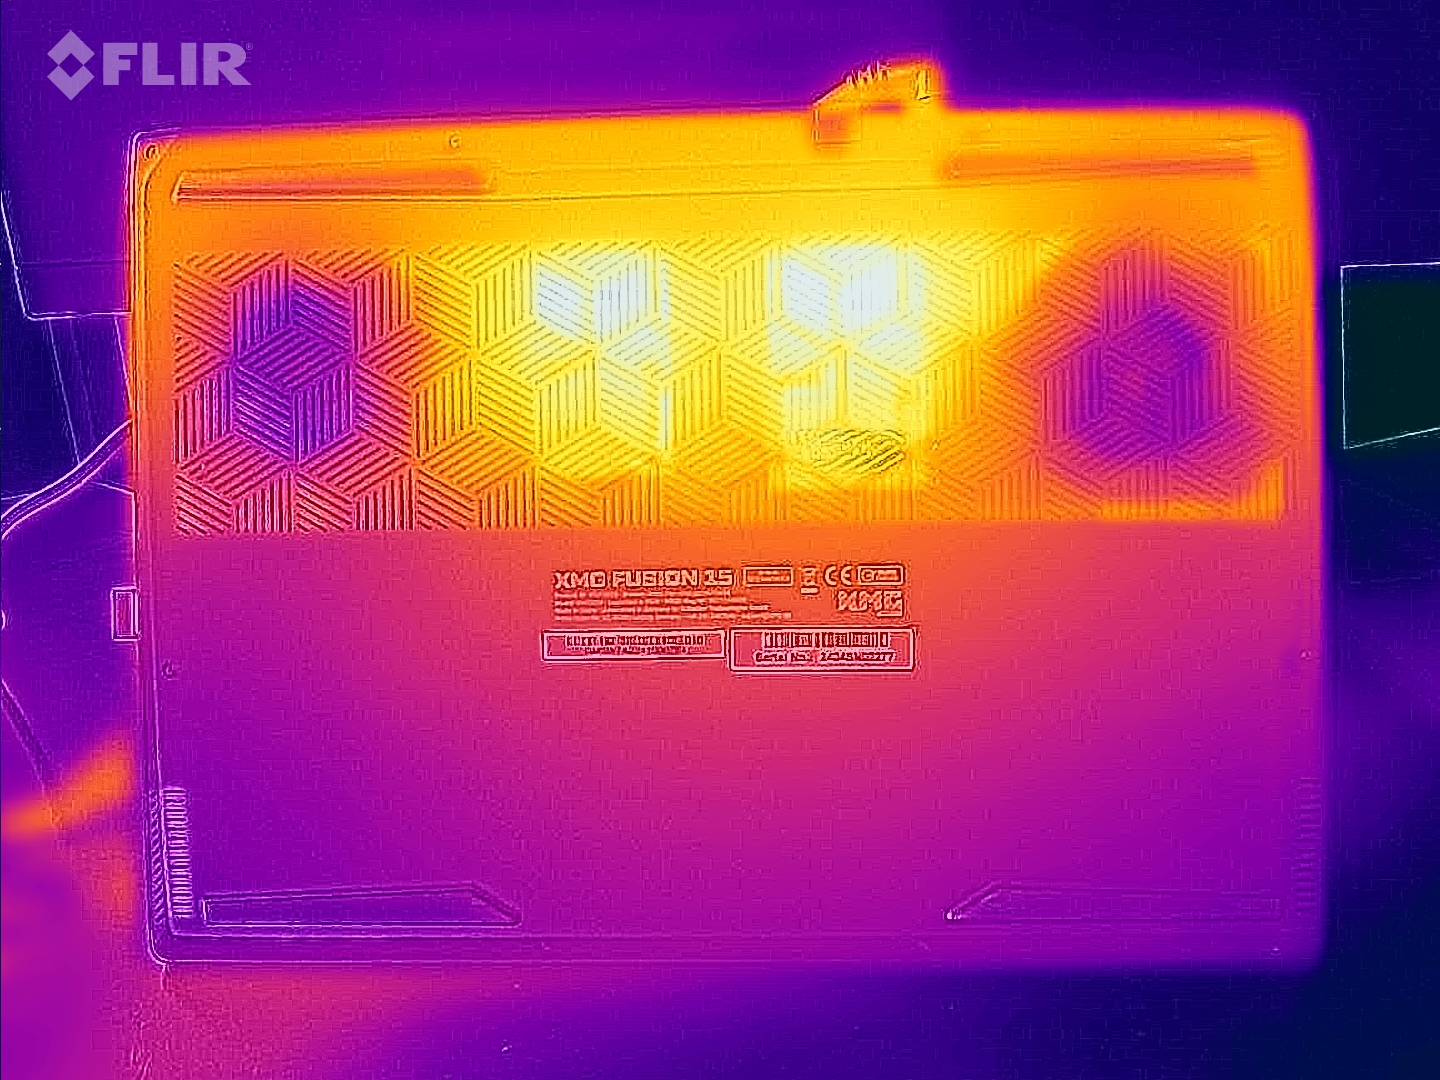
温度
压力测试和 Witcher 3测试导致笔记本电脑明显发热。有时会达到 50 摄氏度以上。在日常使用中(办公、上网),数值一般保持在绿色区域内。
(-) The maximum temperature on the upper side is 48 °C / 118 F, compared to the average of 40.4 °C / 105 F, ranging from 21.2 to 68.8 °C for the class Gaming.
(-) The bottom heats up to a maximum of 56 °C / 133 F, compared to the average of 43.2 °C / 110 F
(+) In idle usage, the average temperature for the upper side is 26.6 °C / 80 F, compared to the device average of 33.9 °C / 93 F.
(-) Playing The Witcher 3, the average temperature for the upper side is 40.4 °C / 105 F, compared to the device average of 33.9 °C / 93 F.
(+) The palmrests and touchpad are reaching skin temperature as a maximum (34 °C / 93.2 F) and are therefore not hot.
(-) The average temperature of the palmrest area of similar devices was 28.8 °C / 83.8 F (-5.2 °C / -9.4 F).
| Schenker XMG Fusion 15 (Early 24) Intel Core i9-14900HX, NVIDIA GeForce RTX 4070 Laptop GPU | Aorus 16X 2024 Intel Core i9-14900HX, NVIDIA GeForce RTX 4070 Laptop GPU | Alienware m16 R2 Intel Core Ultra 7 155H, NVIDIA GeForce RTX 4070 Laptop GPU | HP Omen Transcend 16-u1095ng Intel Core i9-14900HX, NVIDIA GeForce RTX 4070 Laptop GPU | Lenovo Legion Pro 5 16IRX9 Intel Core i9-14900HX, NVIDIA GeForce RTX 4070 Laptop GPU | |
|---|---|---|---|---|---|
| Heat | -5% | -14% | -6% | -8% | |
| Maximum Upper Side * (°C) | 48 | 41 15% | 44.8 7% | 49 -2% | 43.8 9% |
| Maximum Bottom * (°C) | 56 | 41 27% | 48 14% | 63 -13% | 55.4 1% |
| Idle Upper Side * (°C) | 28 | 37 -32% | 37.2 -33% | 30 -7% | 32.8 -17% |
| Idle Bottom * (°C) | 29 | 38 -31% | 42 -45% | 29 -0% | 36 -24% |
* ... smaller is better
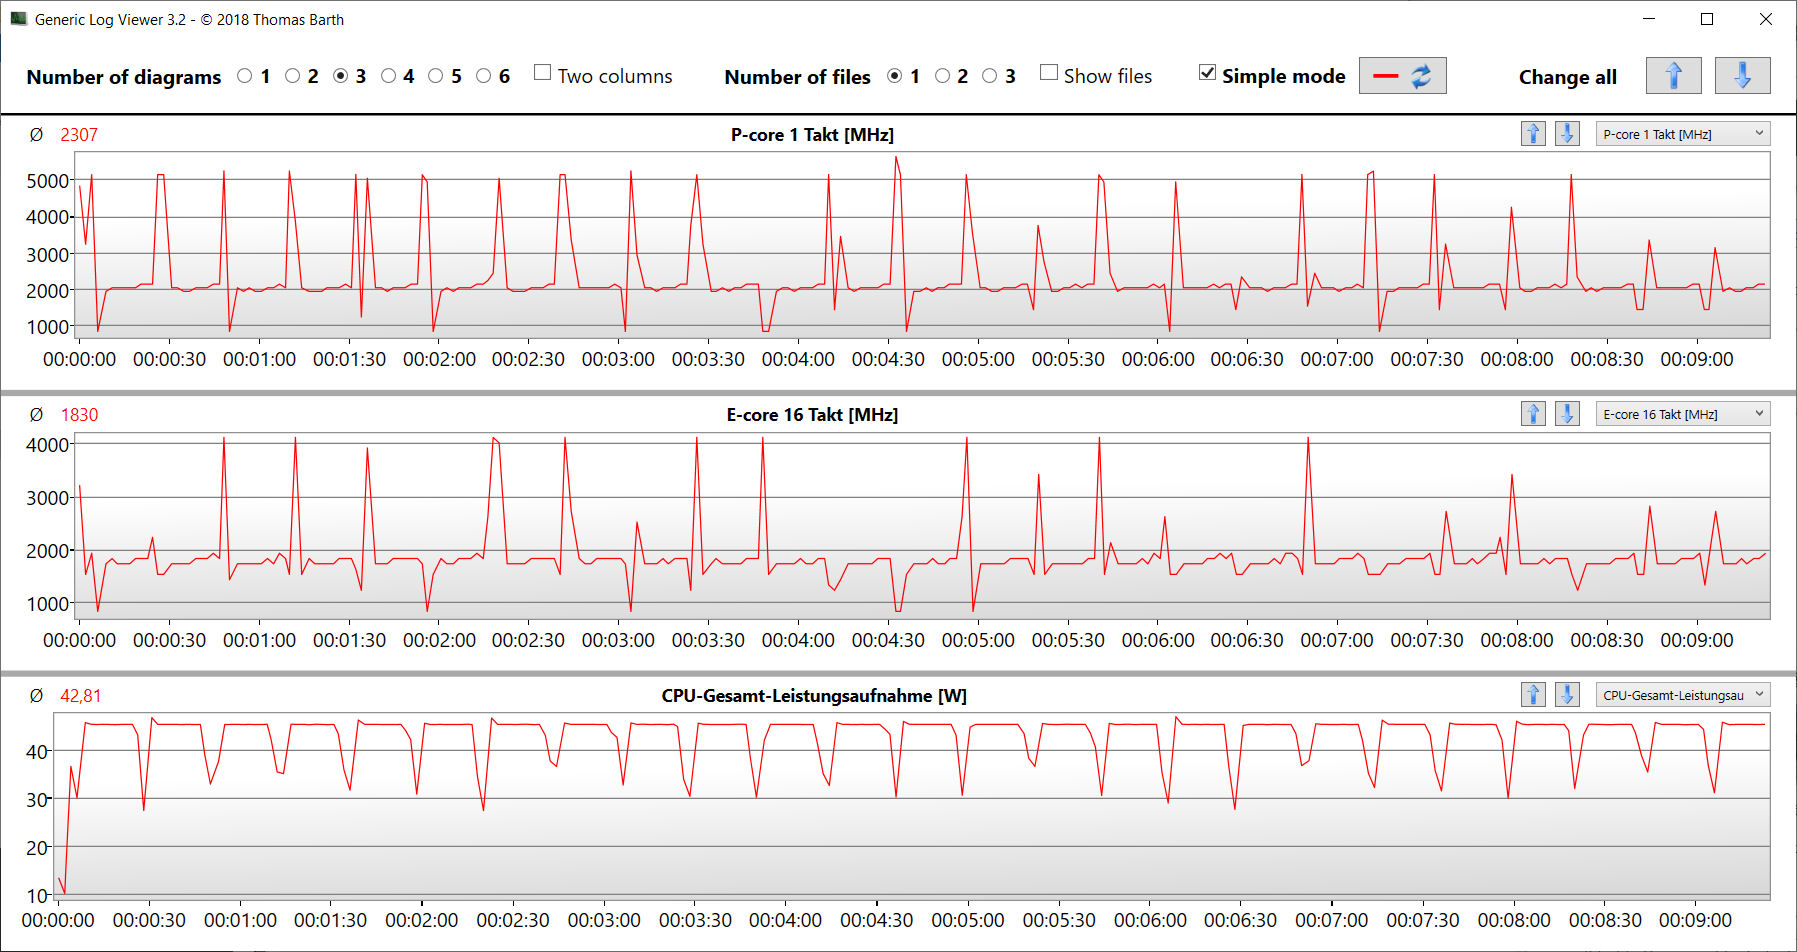
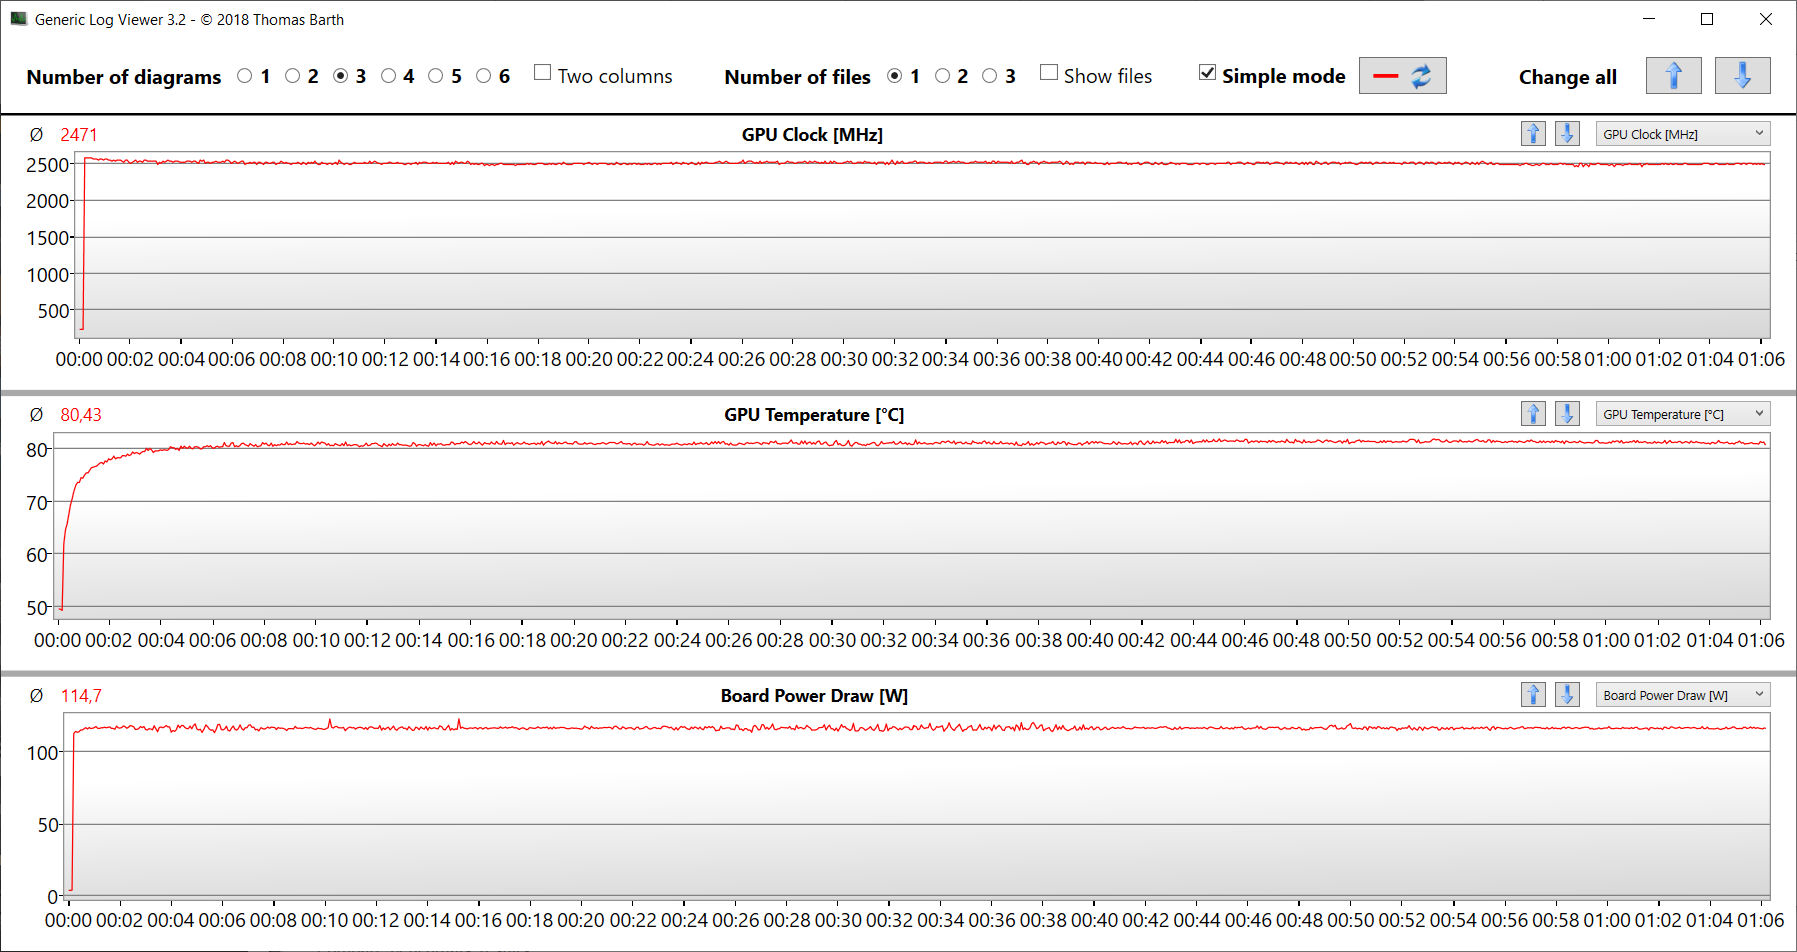
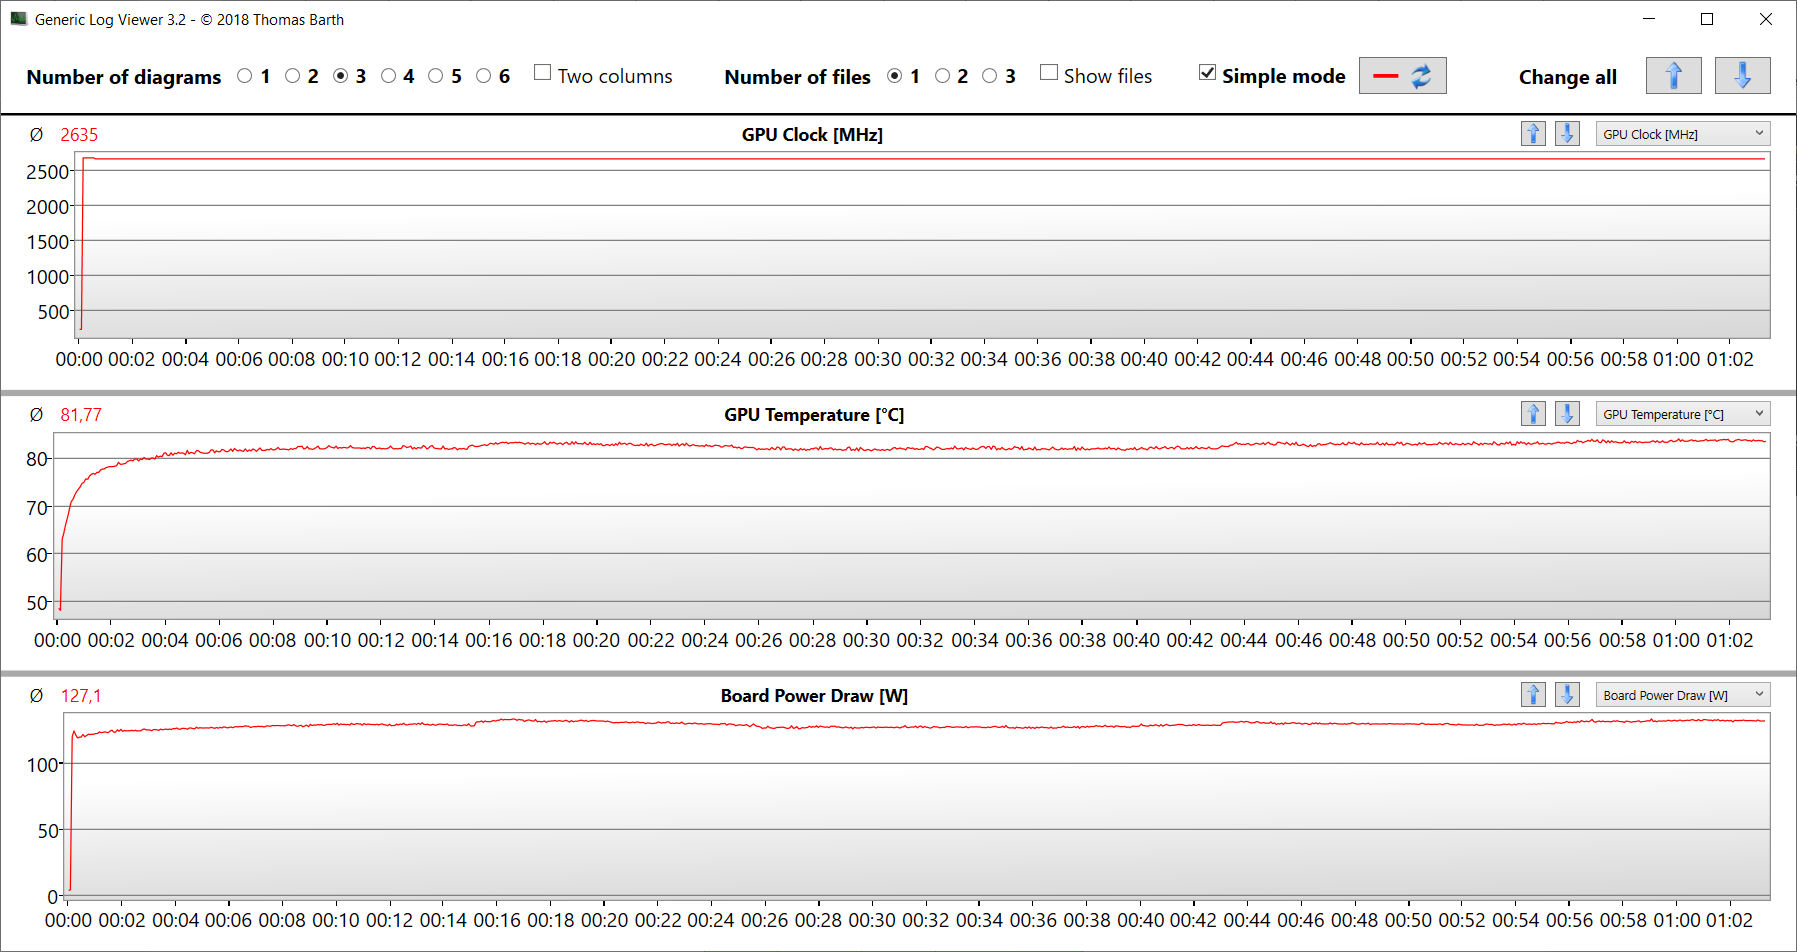
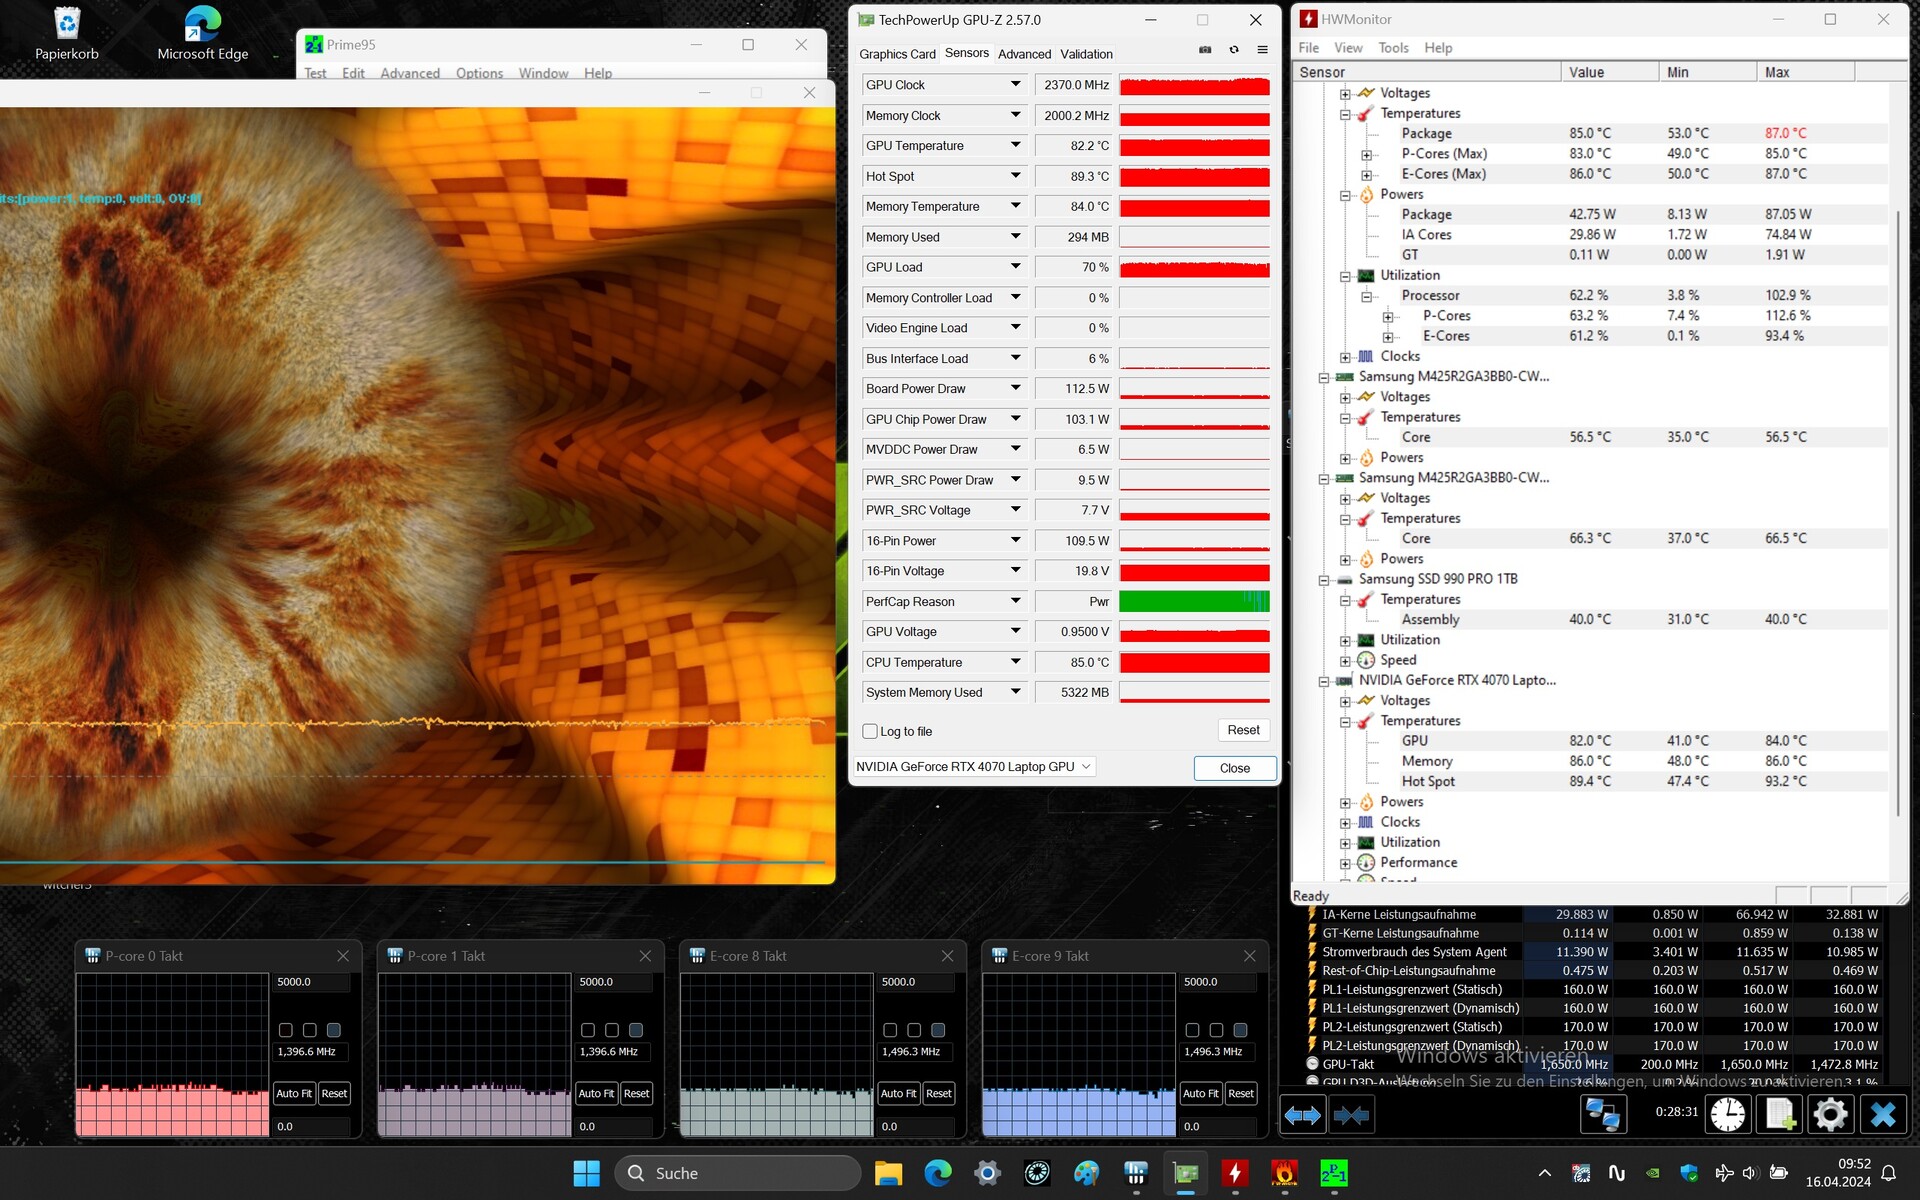
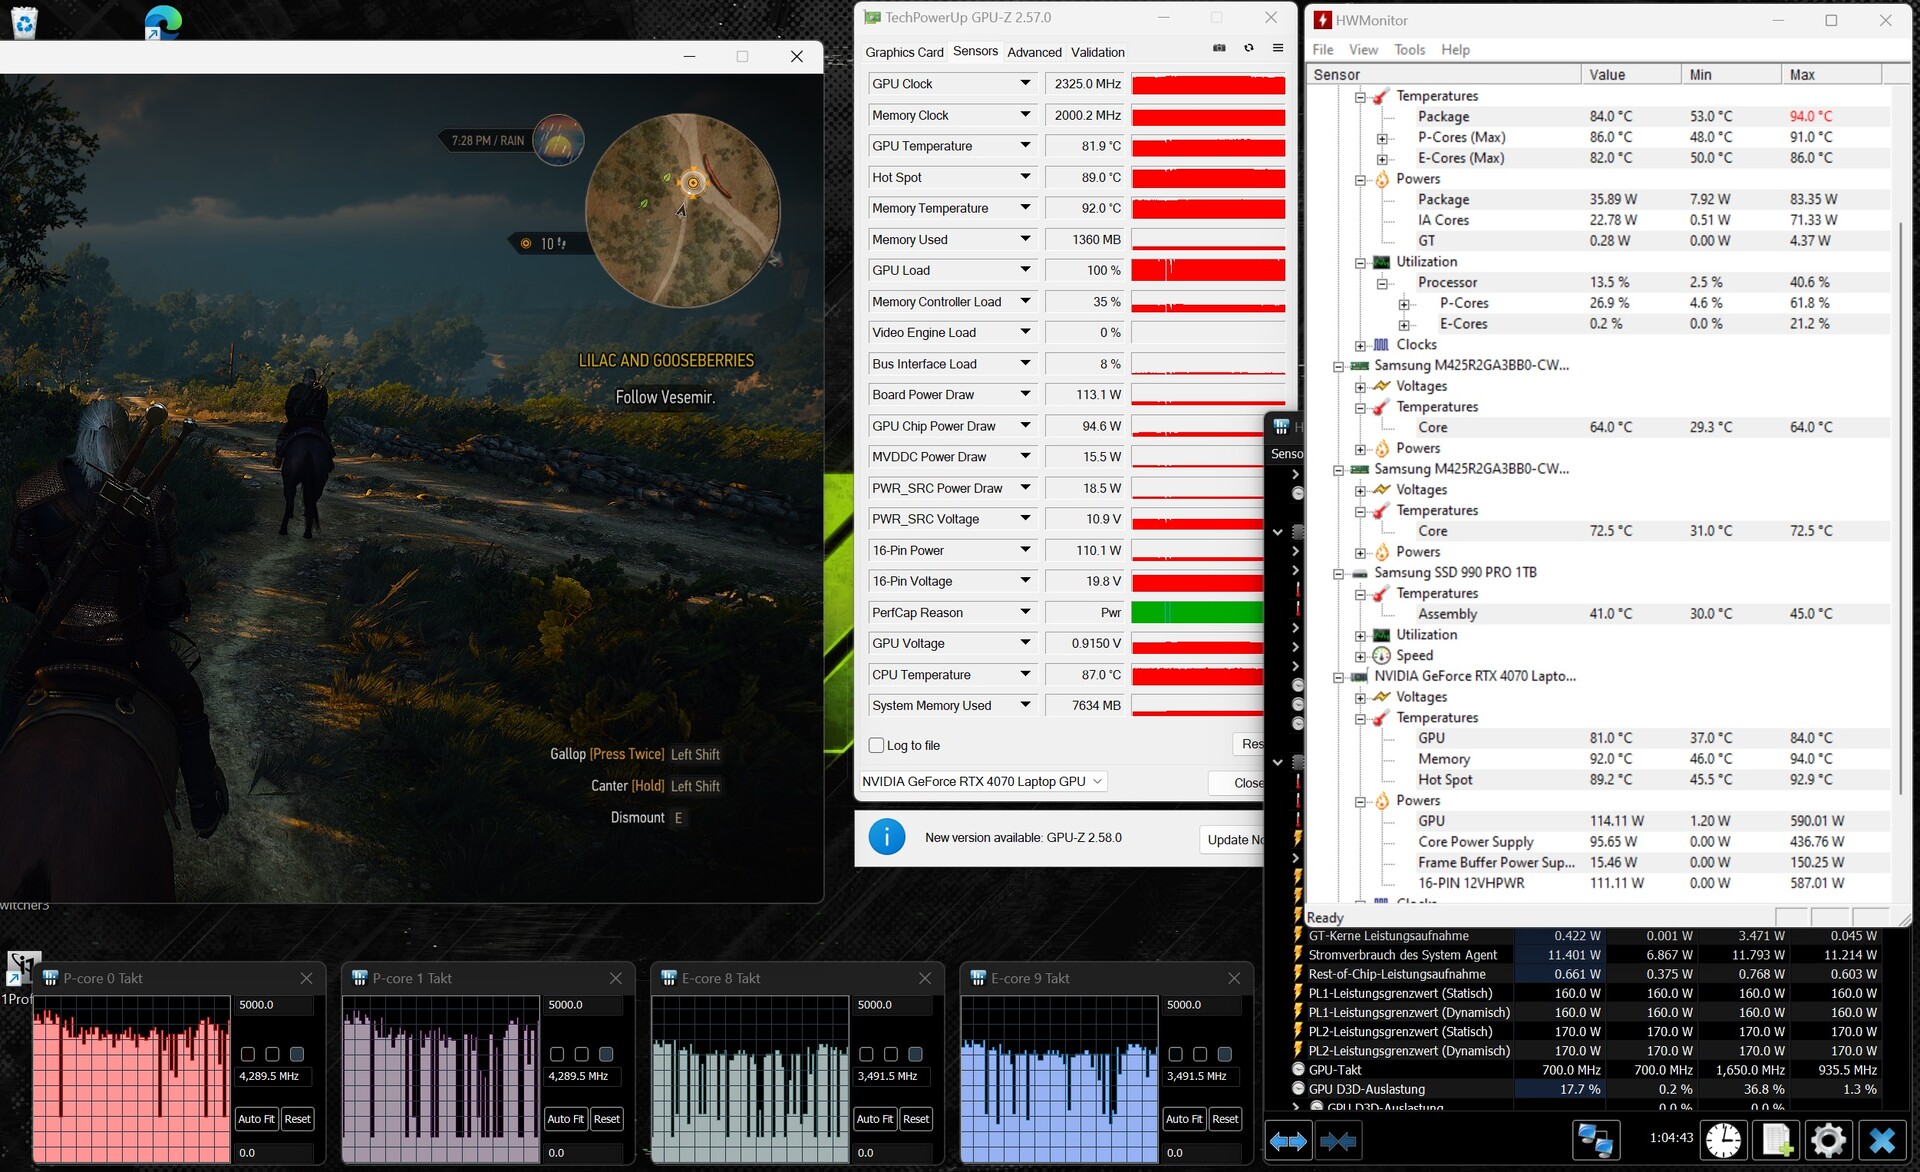
压力测试
压力测试模拟的极端情况(Prime95 和 Furmark 连续运行)检查了系统在满负荷情况下的稳定性。CPU 时钟从略高于基本时钟频率的值缓慢持续下降到低于基本时钟频率的值。图形核心始终高速运行。
发言人
笔记本电脑的立体声扬声器能产生不错的音效,但缺乏低音。连接耳机或外置扬声器可以获得更好的音效体验。
Schenker XMG Fusion 15 (Early 24) audio analysis
(+) | speakers can play relatively loud (85 dB)
Bass 100 - 315 Hz
(-) | nearly no bass - on average 15.8% lower than median
(±) | linearity of bass is average (12.5% delta to prev. frequency)
Mids 400 - 2000 Hz
(+) | balanced mids - only 4.4% away from median
(+) | mids are linear (5.9% delta to prev. frequency)
Highs 2 - 16 kHz
(+) | balanced highs - only 2% away from median
(+) | highs are linear (4.8% delta to prev. frequency)
Overall 100 - 16.000 Hz
(+) | overall sound is linear (11.5% difference to median)
Compared to same class
» 10% of all tested devices in this class were better, 3% similar, 87% worse
» The best had a delta of 6%, average was 18%, worst was 132%
Compared to all devices tested
» 8% of all tested devices were better, 2% similar, 90% worse
» The best had a delta of 4%, average was 23%, worst was 134%
Aorus 16X 2024 audio analysis
(+) | speakers can play relatively loud (85 dB)
Bass 100 - 315 Hz
(±) | reduced bass - on average 8.5% lower than median
(±) | linearity of bass is average (8.3% delta to prev. frequency)
Mids 400 - 2000 Hz
(+) | balanced mids - only 3.1% away from median
(+) | mids are linear (5.8% delta to prev. frequency)
Highs 2 - 16 kHz
(+) | balanced highs - only 2.5% away from median
(±) | linearity of highs is average (7% delta to prev. frequency)
Overall 100 - 16.000 Hz
(+) | overall sound is linear (8.4% difference to median)
Compared to same class
» 2% of all tested devices in this class were better, 1% similar, 97% worse
» The best had a delta of 6%, average was 18%, worst was 132%
Compared to all devices tested
» 2% of all tested devices were better, 1% similar, 97% worse
» The best had a delta of 4%, average was 23%, worst was 134%
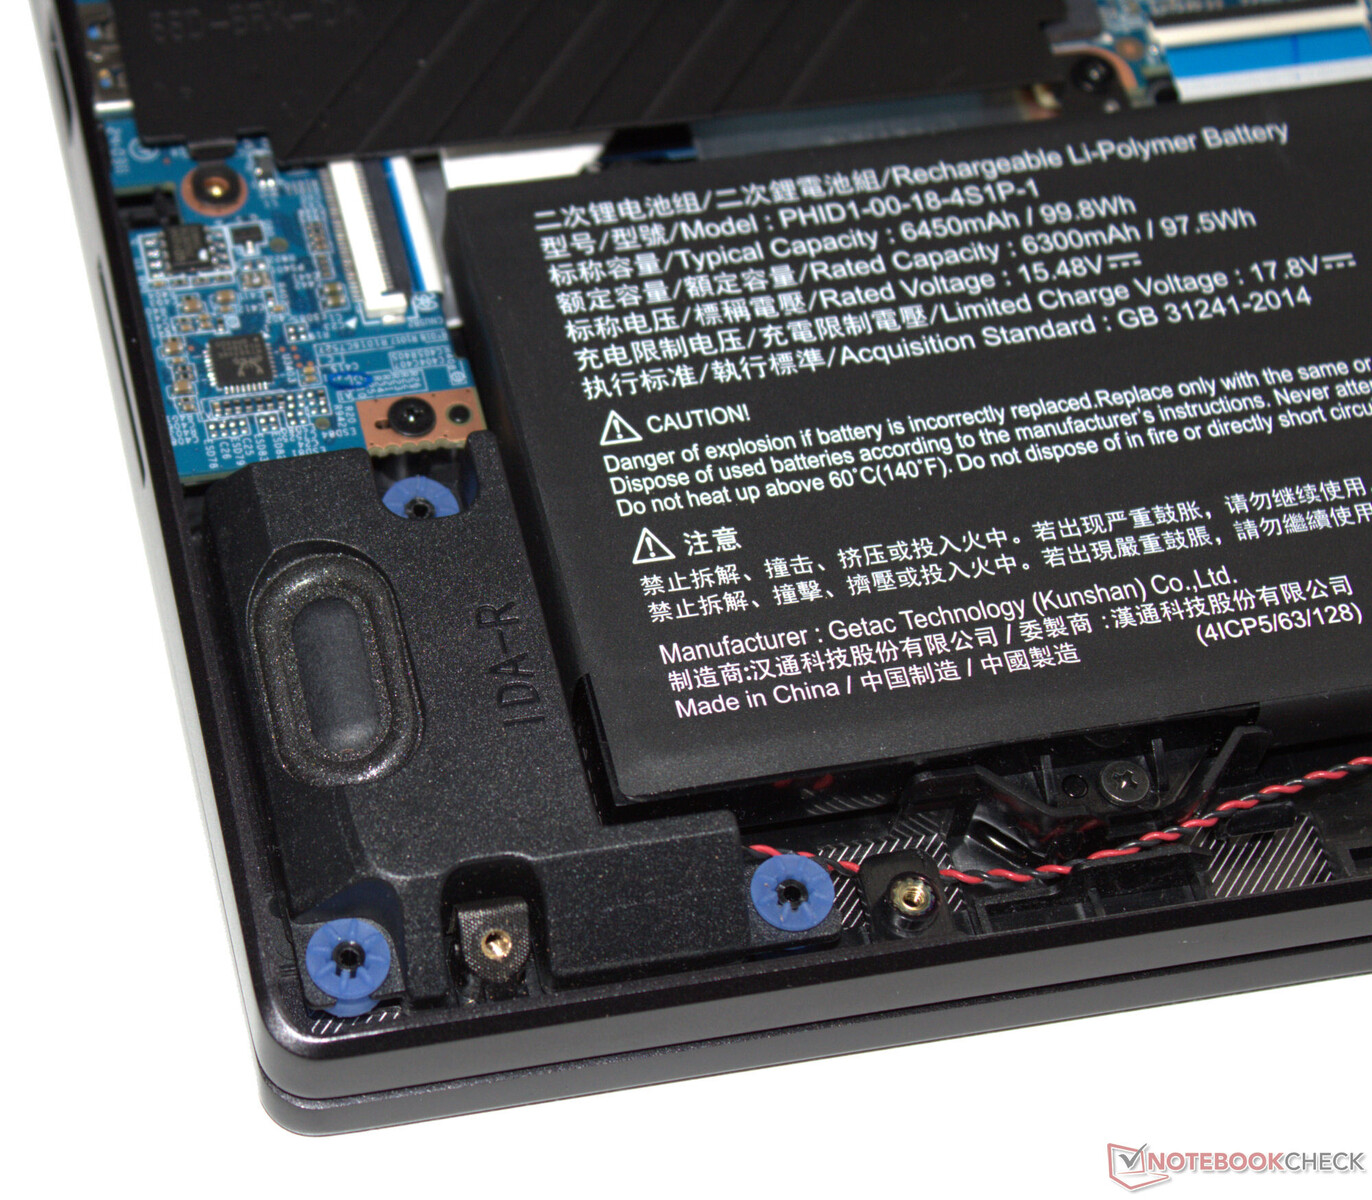
电源管理 - Fusion 15 的运行时间非常出色
耗电量
对于已安装的硬件而言,其电力需求基本正常。例外情况:尽管电池电量充足,但我们测得笔记本电脑在关机状态下的功耗值约为 20 瓦。这可能是一个错误。测试 Witcher 3测试和压力测试运行时,功耗值略有下降。电源(280 瓦)功率充足。
| Idle | |
| Load |
|
Key:
min: | |
| Schenker XMG Fusion 15 (Early 24) i9-14900HX, GeForce RTX 4070 Laptop GPU | Aorus 16X 2024 i9-14900HX, GeForce RTX 4070 Laptop GPU | Alienware m16 R2 Ultra 7 155H, GeForce RTX 4070 Laptop GPU | HP Omen Transcend 16-u1095ng i9-14900HX, GeForce RTX 4070 Laptop GPU | Average of class Gaming | |
|---|---|---|---|---|---|
| Power Consumption | -21% | -3% | -10% | -19% | |
| Idle Minimum * (Watt) | 8 | 13 -63% | 8.1 -1% | 10 -25% | 13 ? -63% |
| Idle Average * (Watt) | 14 | 18 -29% | 13 7% | 18 -29% | 19 ? -36% |
| Idle Maximum * (Watt) | 26 | 35 -35% | 40.3 -55% | 32 -23% | 24.6 ? 5% |
| Load Average * (Watt) | 118 | 138 -17% | 79 33% | 128 -8% | 110.7 ? 6% |
| Witcher 3 ultra * (Watt) | 192.7 | 172.6 10% | 188.1 2% | 148.4 23% | |
| Load Maximum * (Watt) | 244 | 222 9% | 254.9 -4% | 242 1% | 259 ? -6% |
* ... smaller is better
Power consumption Witcher 3 / stress test
Power consumption with external monitor
运行时间
在 WiFi 测试(通过脚本加载网站)和视频测试(循环播放短片 Big Buck Bunny(H.264 编码,FHD))中,我们测得的运行时间分别为 8:00 小时和 10:02小时。这些数值都非常不错。
| Schenker XMG Fusion 15 (Early 24) i9-14900HX, GeForce RTX 4070 Laptop GPU, 99.8 Wh | Aorus 16X 2024 i9-14900HX, GeForce RTX 4070 Laptop GPU, 99 Wh | Alienware m16 R2 Ultra 7 155H, GeForce RTX 4070 Laptop GPU, 90 Wh | HP Omen Transcend 16-u1095ng i9-14900HX, GeForce RTX 4070 Laptop GPU, 97 Wh | Lenovo Legion Pro 5 16IRX9 i9-14900HX, GeForce RTX 4070 Laptop GPU, 80 Wh | Average of class Gaming | |
|---|---|---|---|---|---|---|
| Battery runtime | -16% | -26% | -39% | -52% | -30% | |
| Reader / Idle (h) | 15.2 | 12.6 -17% | 12.6 -17% | 6.7 -56% | 8.27 ? -46% | |
| H.264 (h) | 10 | 9 -10% | 8.32 ? -17% | |||
| WiFi v1.3 (h) | 8 | 8 0% | 8.1 1% | 4.9 -39% | 4.8 -40% | 7.11 ? -11% |
| Load (h) | 2.7 | 1.7 -37% | 1 -63% | 1.1 -59% | 1.502 ? -44% |
Pros
Cons
评价:便携、强大、坚韧不拔
紧凑的尺寸和较轻的重量(约 2.1 千克)不会降低硬件性能。处理器 酷睿 i9处理器和 GeForce RTX 4070能够以稳定的高时钟频率工作。这款笔记本电脑将性能与便携性完美融合,可谓成功之作。
XMG Fusion 15(24 出头)--一款功能强大的便携式笔记本电脑,适合游戏玩家和创作者。
这款笔记本电脑在负载情况下温度较高,因此会产生大量噪音。如果噪音较小,则需要牺牲一些计算能力。它的 15.3 英寸屏幕(2560 x 1600 像素、IPS、240 Hz、自适应同步)采用 16:10 宽高比,整体效果令人印象深刻。其高亮度也值得一提。
一次充满电(99.8 瓦时)的实际运行时间约为 8-10 小时,非常不错。优点电池可通过 USB-C 电源(最小 100 瓦,20 V)充电,笔记本电脑的 TB4 端口支持 Power Delivery。因此,您不必一直携带专有电源(280 瓦)。
另一种选择是 Aorus 16X (2024).这款笔记本电脑的计算能力相当,运行时间也同样出色。
价格和供应情况
XMG Fusion 15(早期 24 型)可直接通过Schenker 在线商店进行配置和订购。.目前的测试设备价格约为 2,500 美元。起价约为 1,700 美元。
Schenker XMG Fusion 15 (Early 24)
- 05/01/2024 v7 (old)
Sascha Mölck
Transparency
The selection of devices to be reviewed is made by our editorial team. The test sample was provided to the author as a loan by the manufacturer or retailer for the purpose of this review. The lender had no influence on this review, nor did the manufacturer receive a copy of this review before publication. There was no obligation to publish this review. As an independent media company, Notebookcheck is not subjected to the authority of manufacturers, retailers or publishers.
This is how Notebookcheck is testing
Every year, Notebookcheck independently reviews hundreds of laptops and smartphones using standardized procedures to ensure that all results are comparable. We have continuously developed our test methods for around 20 years and set industry standards in the process. In our test labs, high-quality measuring equipment is utilized by experienced technicians and editors. These tests involve a multi-stage validation process. Our complex rating system is based on hundreds of well-founded measurements and benchmarks, which maintains objectivity. Further information on our test methods can be found here.
Price comparison

