戴尔 XPS 16 9640 评测--配备 4K OLED 和恼人触控条的多媒体笔记本电脑
戴尔公司用两款新机型取代了其著名的多媒体笔记本电脑 XPS 15:首先是更小巧的 XPS 14。-我们已经对它进行了全面测试,它的概念为我们揭示了许多问题。今天,我们将看看更大的 16 英寸机型,即 XPS 16。一般来说,它的配方是相同的,除了英特尔的新流星湖处理器外,它还使用了 Nvidia 的专用显卡,但这次也是 RTX 4070 笔记本电脑的更强大型号。另外还有一些不同之处,我们将在本次评测中详细讨论。
我们的测试设备配置精良,采用Core Ultra 7 155H 、RTX 4070 笔记本电脑 、32 GB 内存、1 TB SSD 以及高分辨率 OLED 触摸屏,售价 2899 美元。因此,XPS 16 与其他高品质多媒体笔记本电脑和游戏/多媒体混合型产品竞争,如ROG Zephyrus G16 。
潜在的竞争对手比较
Rating | Date | Model | Weight | Height | Size | Resolution | Price |
|---|---|---|---|---|---|---|---|
| 88.6 % v7 (old) | 04 / 2024 | Dell XPS 16 9640 Ultra 7 155H, GeForce RTX 4070 Laptop GPU | 2.3 kg | 18.7 mm | 16.30" | 3840x2400 | |
| 90.4 % v7 (old) | 03 / 2024 | Samsung Galaxy Book4 Ultra Ultra 7 155H, GeForce RTX 4050 Laptop GPU | 1.8 kg | 17 mm | 16.00" | 2880x1800 | |
| 90 % v7 (old) | 03 / 2024 | Honor MagicBook Pro 16 2024 Ultra 7 155H, GeForce RTX 4060 Laptop GPU | 1.9 kg | 17.9 mm | 16.00" | 3072x1920 | |
| 92.3 % v7 (old) | 02 / 2024 | Asus ROG Zephyrus G16 2024 GU605M Ultra 7 155H, GeForce RTX 4070 Laptop GPU | 1.8 kg | 16.4 mm | 16.00" | 2560x1600 | |
| 88.4 % v7 (old) | 08 / 2023 | Lenovo Yoga Pro 9 16-IRP G8 i7-13705H, GeForce RTX 4060 Laptop GPU | 2.2 kg | 18.2 mm | 16.00" | 3200x2000 | |
| 88.6 % v7 (old) | 07 / 2023 | Schenker VISION 16 Pro (M23) i7-13700H, GeForce RTX 4070 Laptop GPU | 1.6 kg | 17.1 mm | 16.00" | 2560x1600 | |
| 90.3 % v7 (old) | 04 / 2023 | Dell XPS 15 9530 RTX 4070 i7-13700H, GeForce RTX 4070 Laptop GPU | 1.9 kg | 18 mm | 15.60" | 3456x2160 |
外壳 - 坚固的铝制外壳
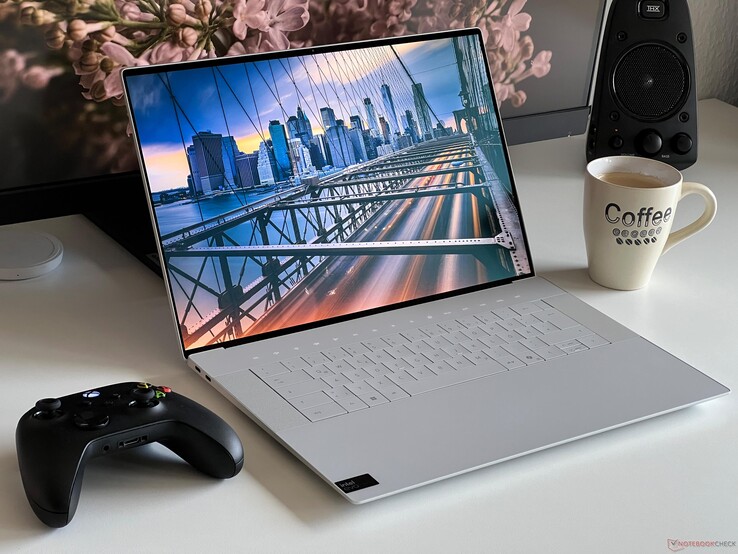
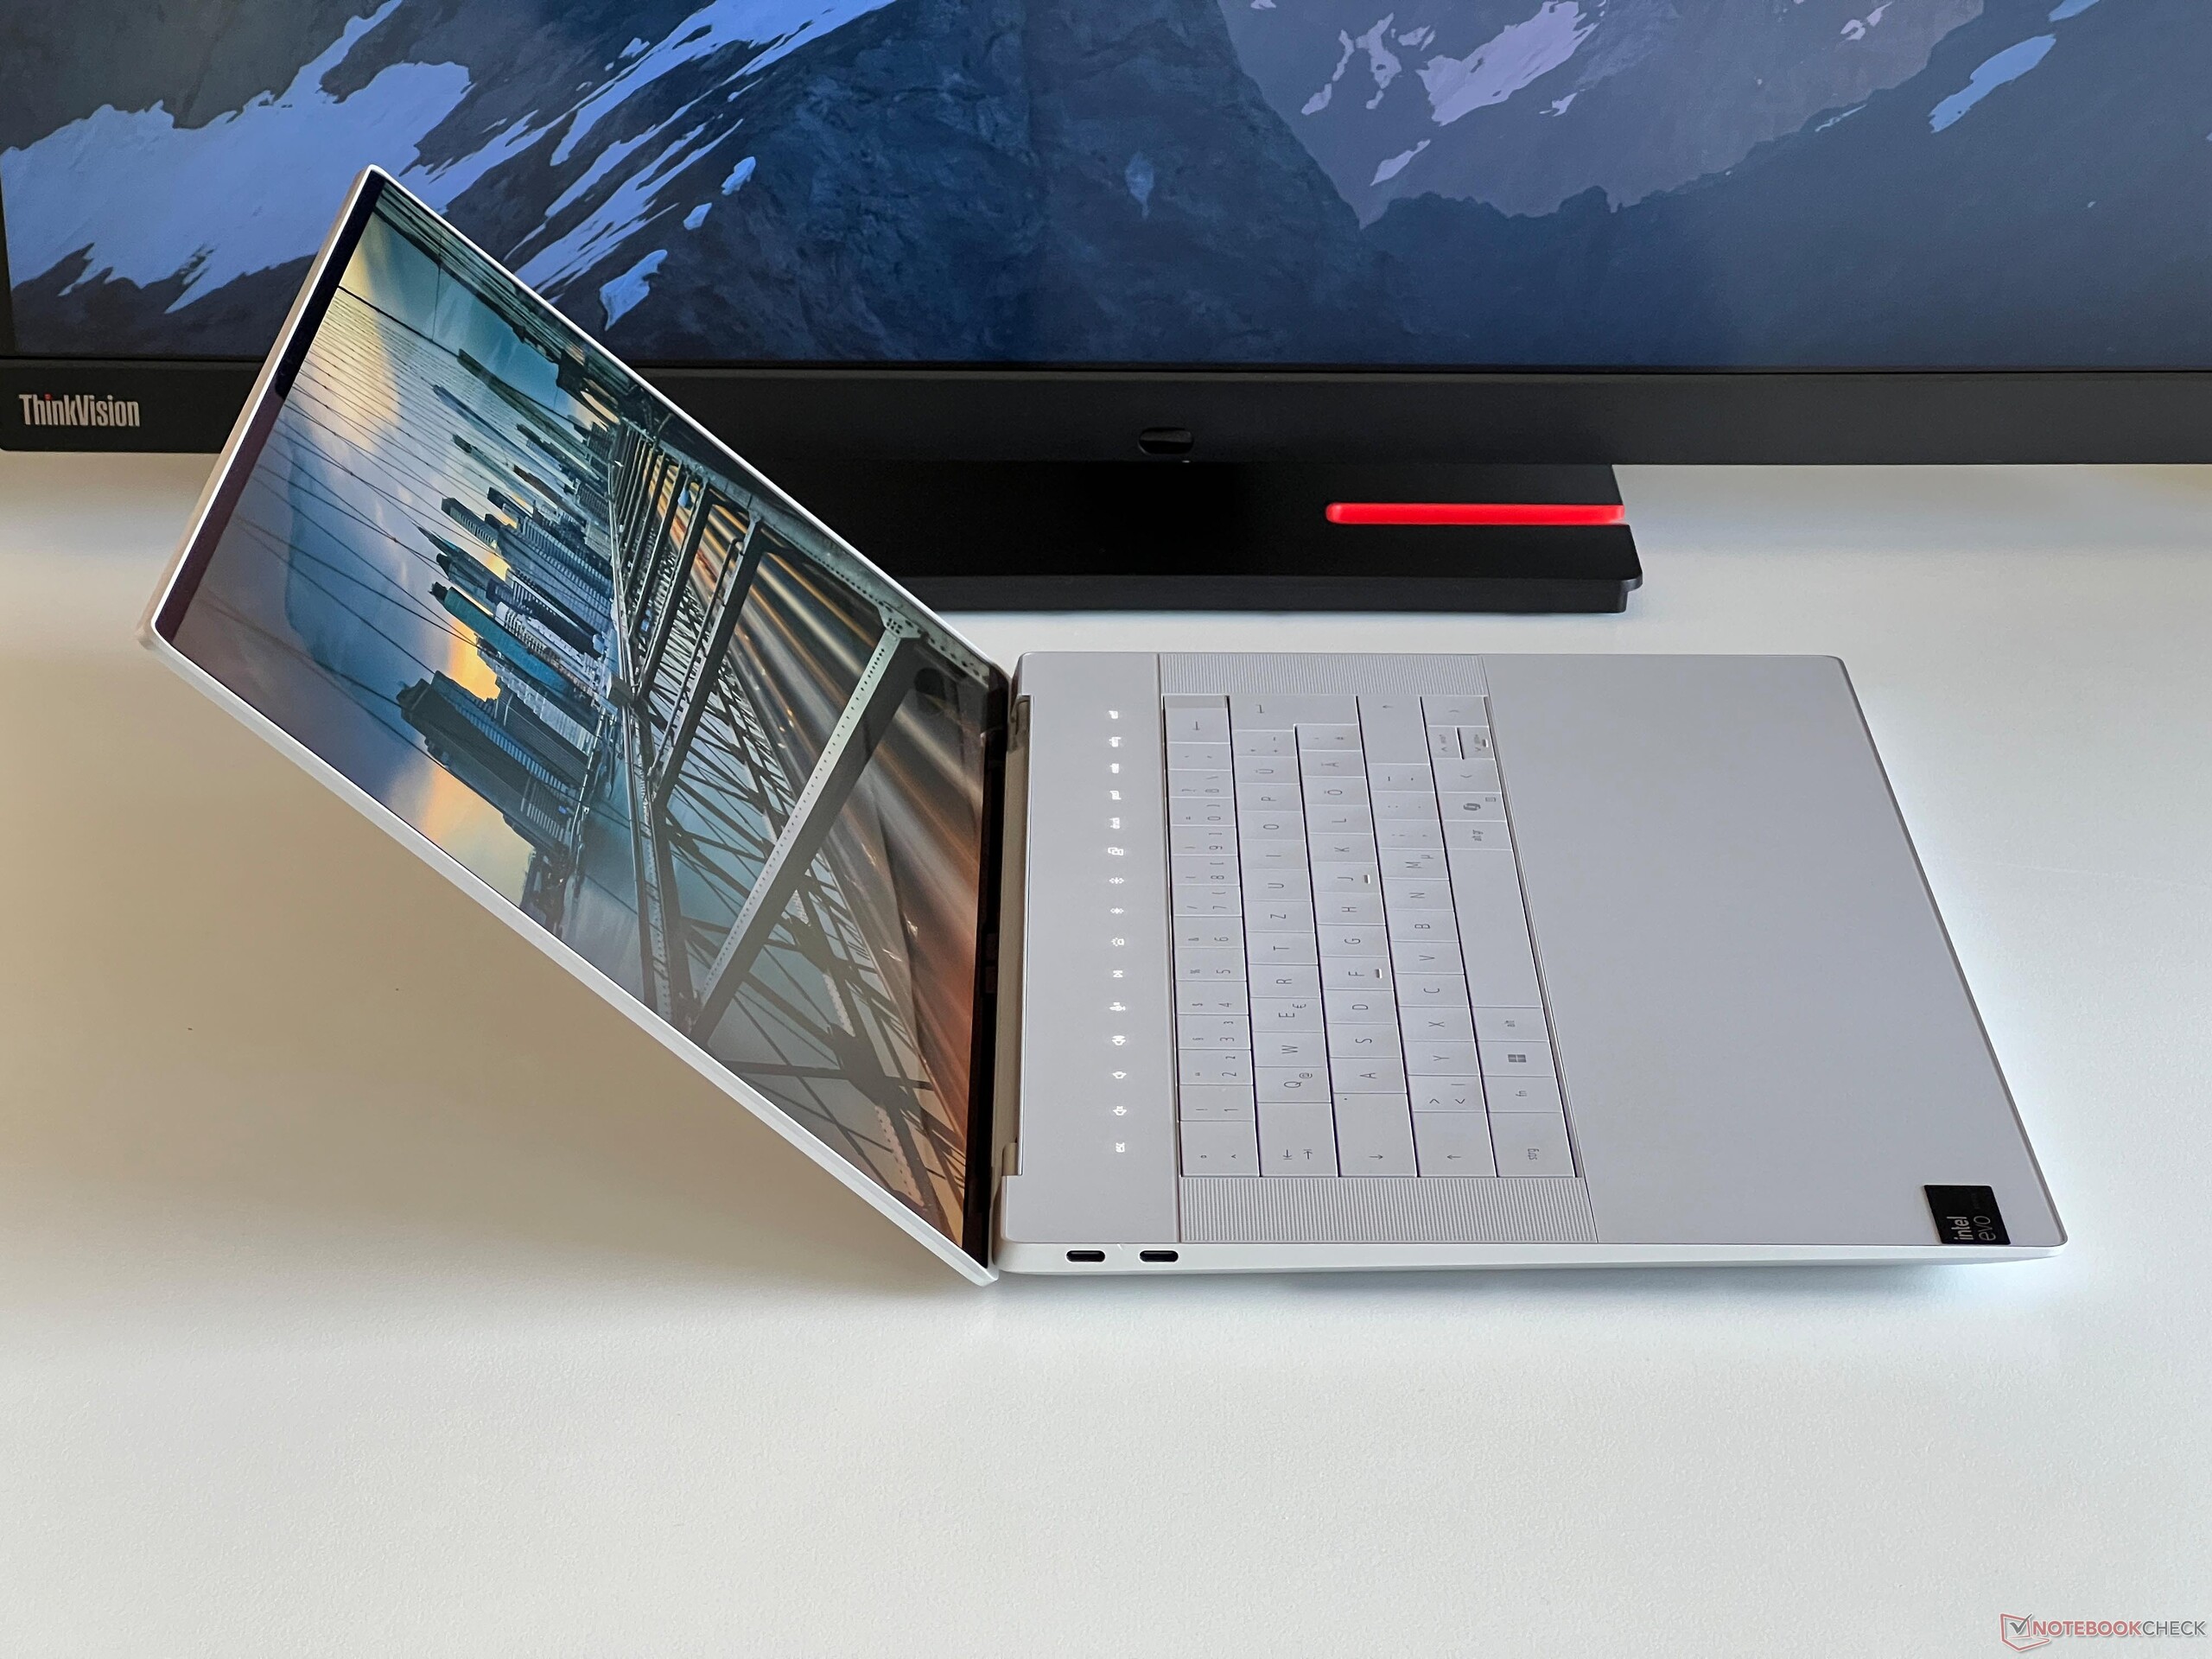
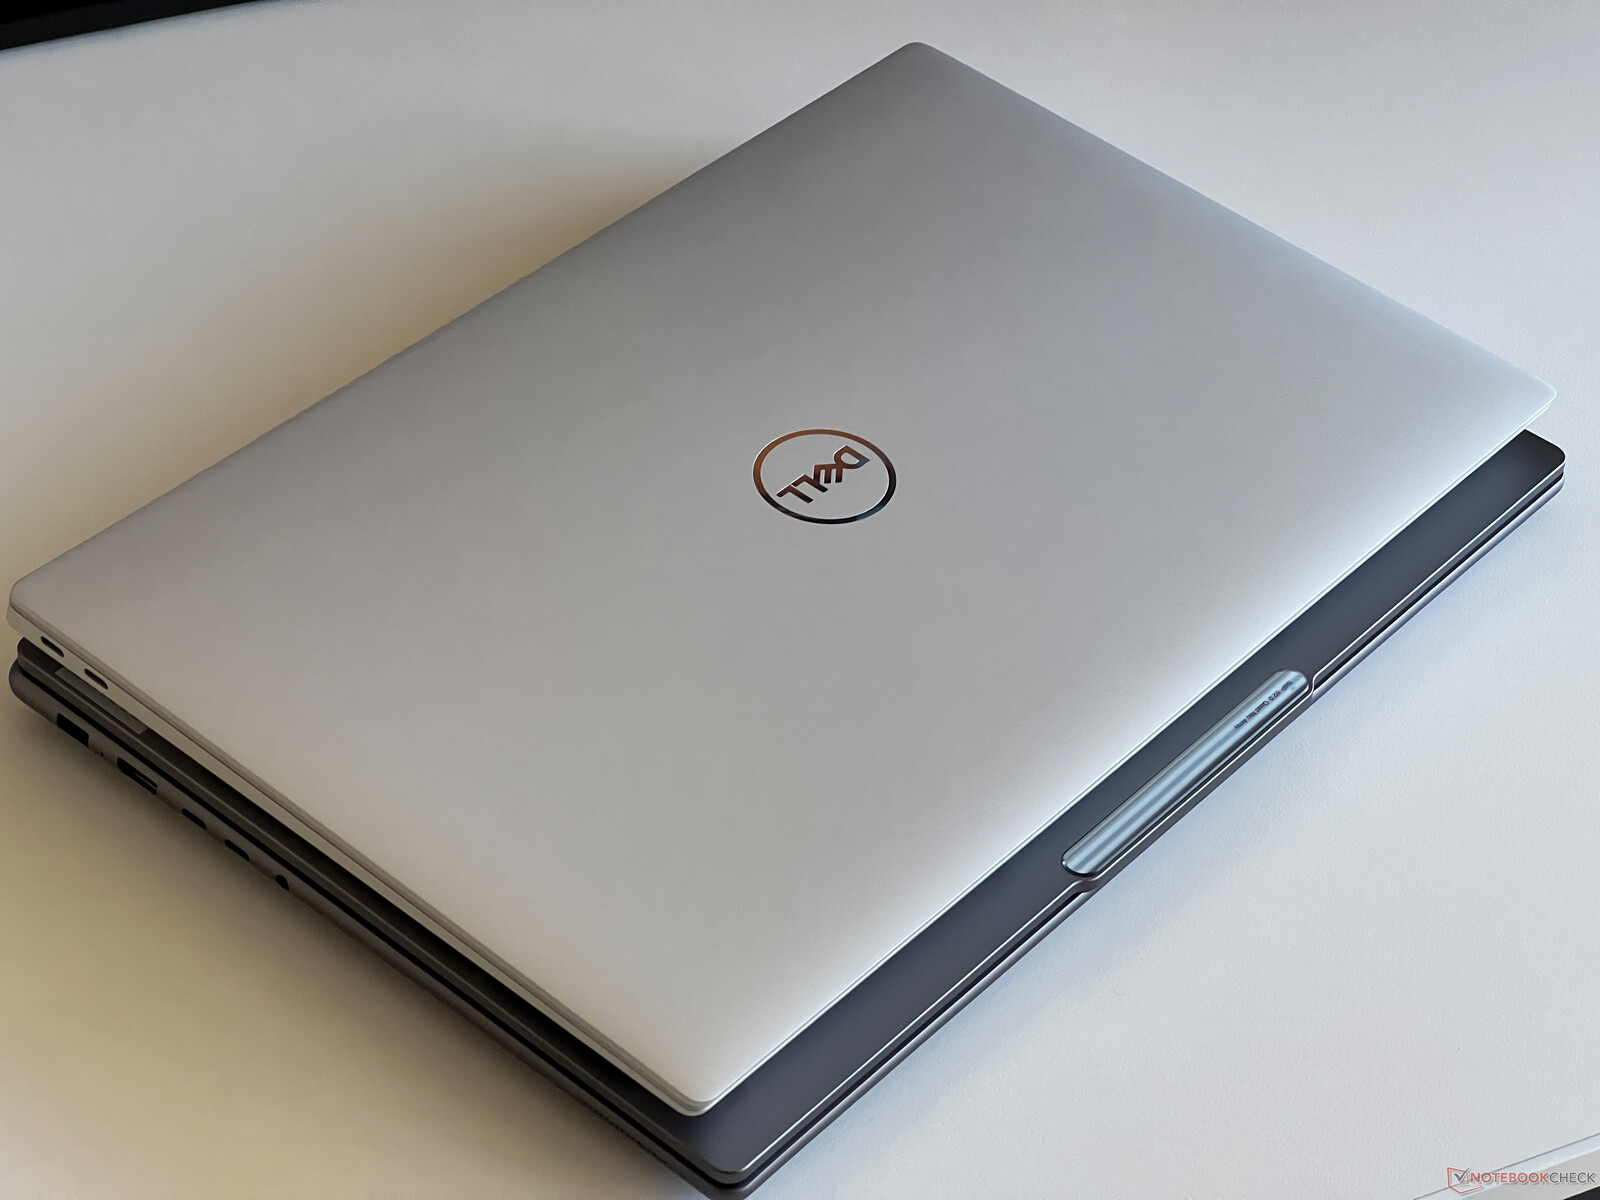
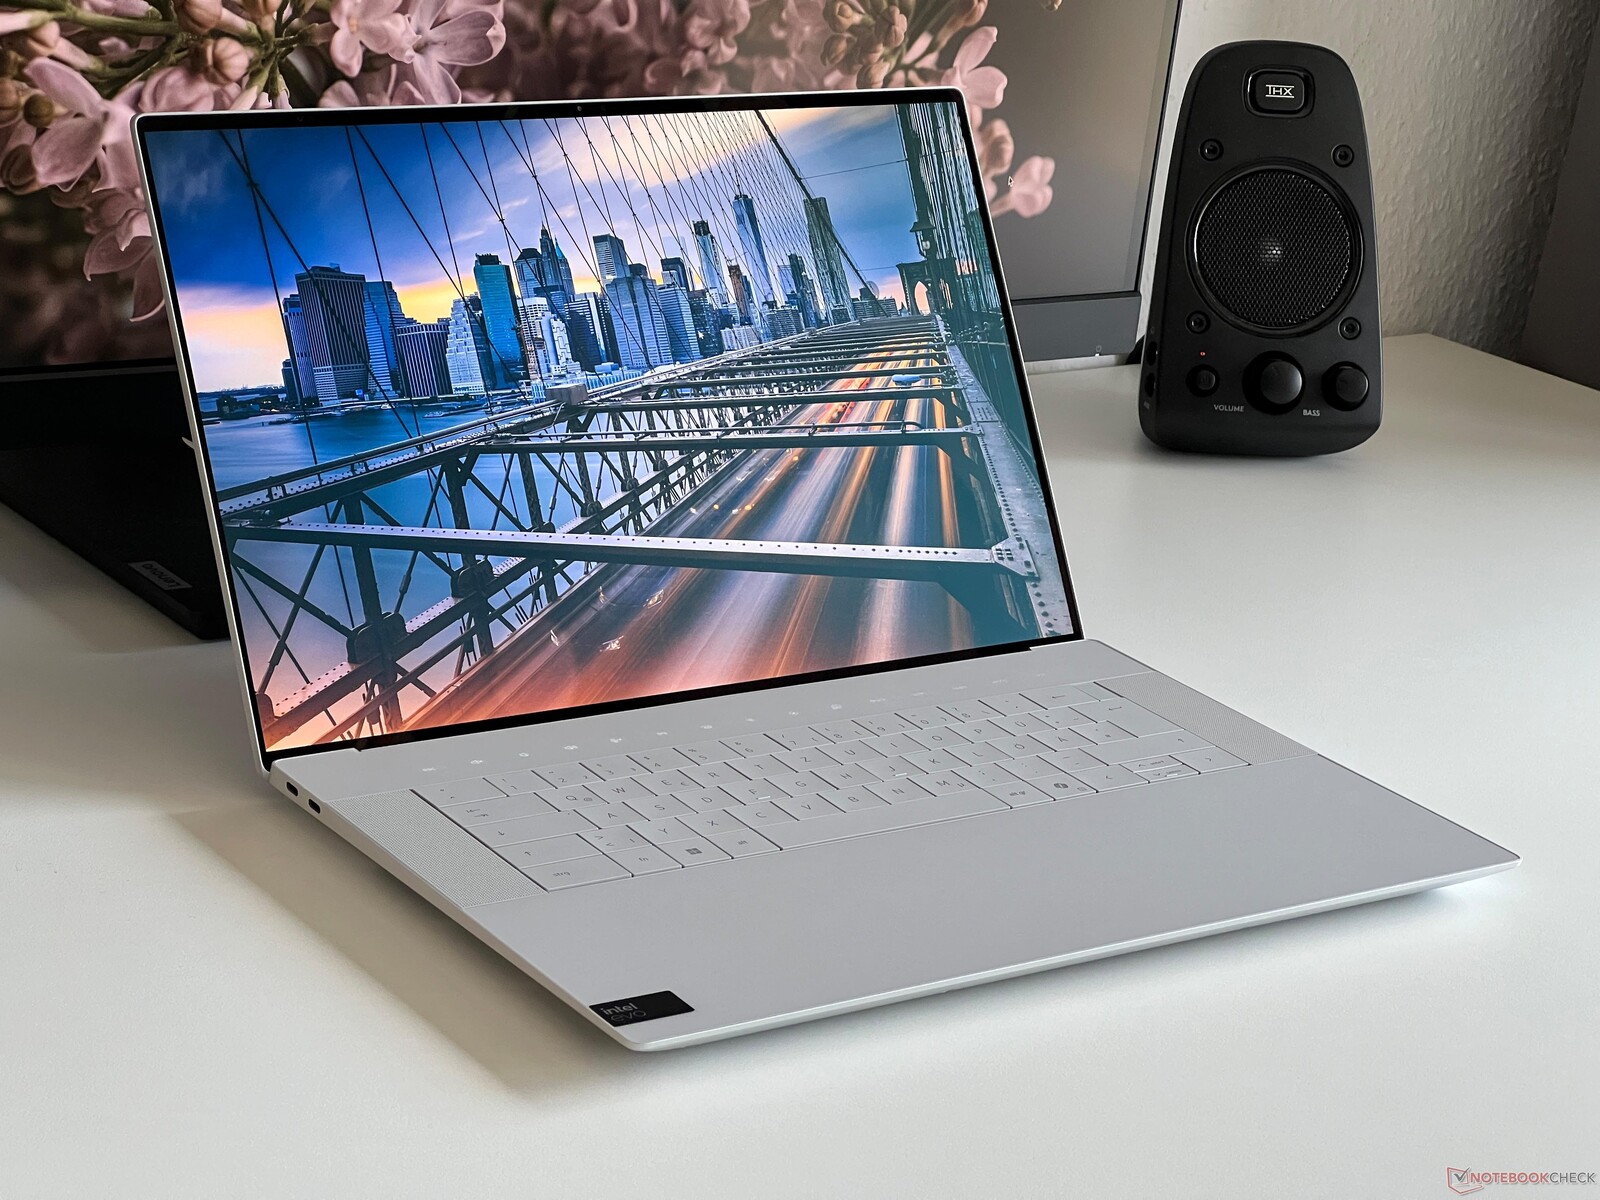
戴尔为当前 XPS 系列的所有三个变体采用了相同的基本设计,其灵感来源于 XPS 13 Plus及其宽大、连续的玻璃掌托和包括触摸条在内的非同寻常的键盘。除了我们的浅色版本,戴尔还提供深灰色版本的笔记本电脑。它的四边边框都很纤薄,外观现代感十足。由于占地面积较大,XPS 16 看起来不像较小的 XPS 14 那么笨重。 较小的 XPS 14.
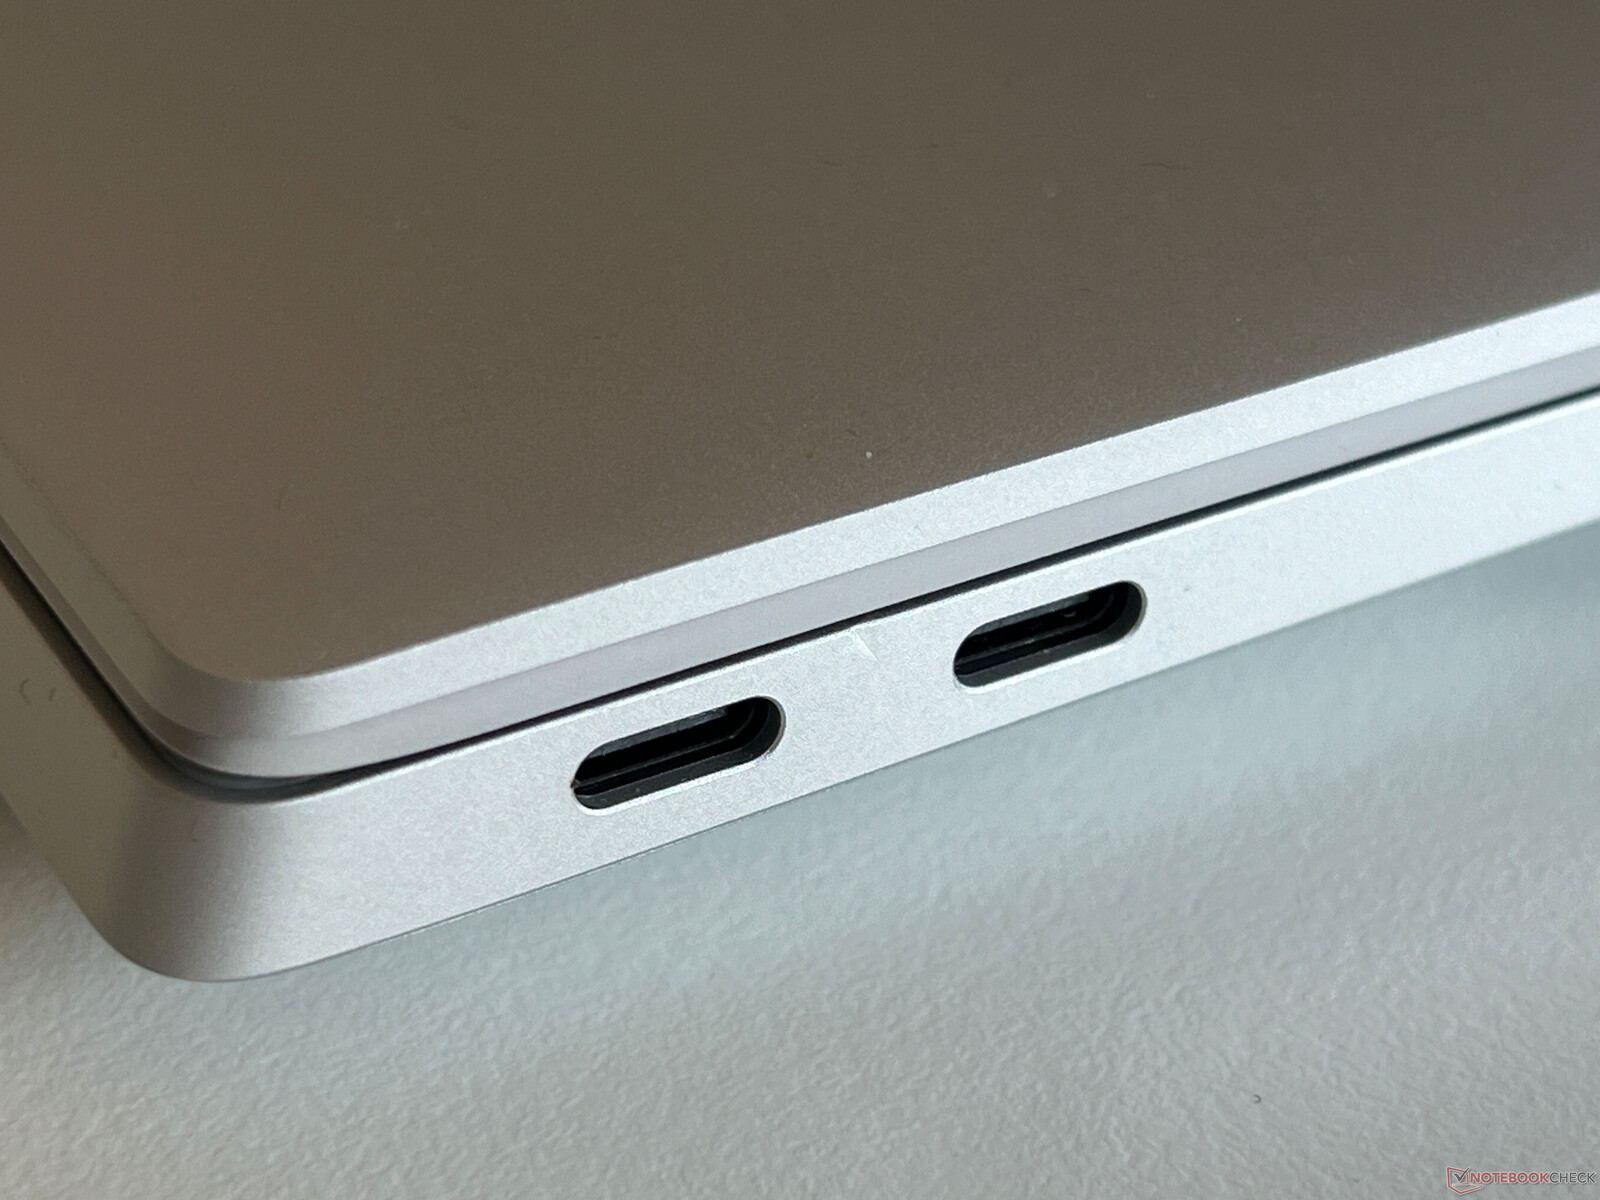
不过,我们注意到测试设备左侧的两个 USB-C 端口之间有一个小缺陷。屏幕也非常稳定,在调整打开角度(最大 135 度)时,盖子只会轻微弹起。不过,由于正面边缘的形状,单手很难打开盖子。
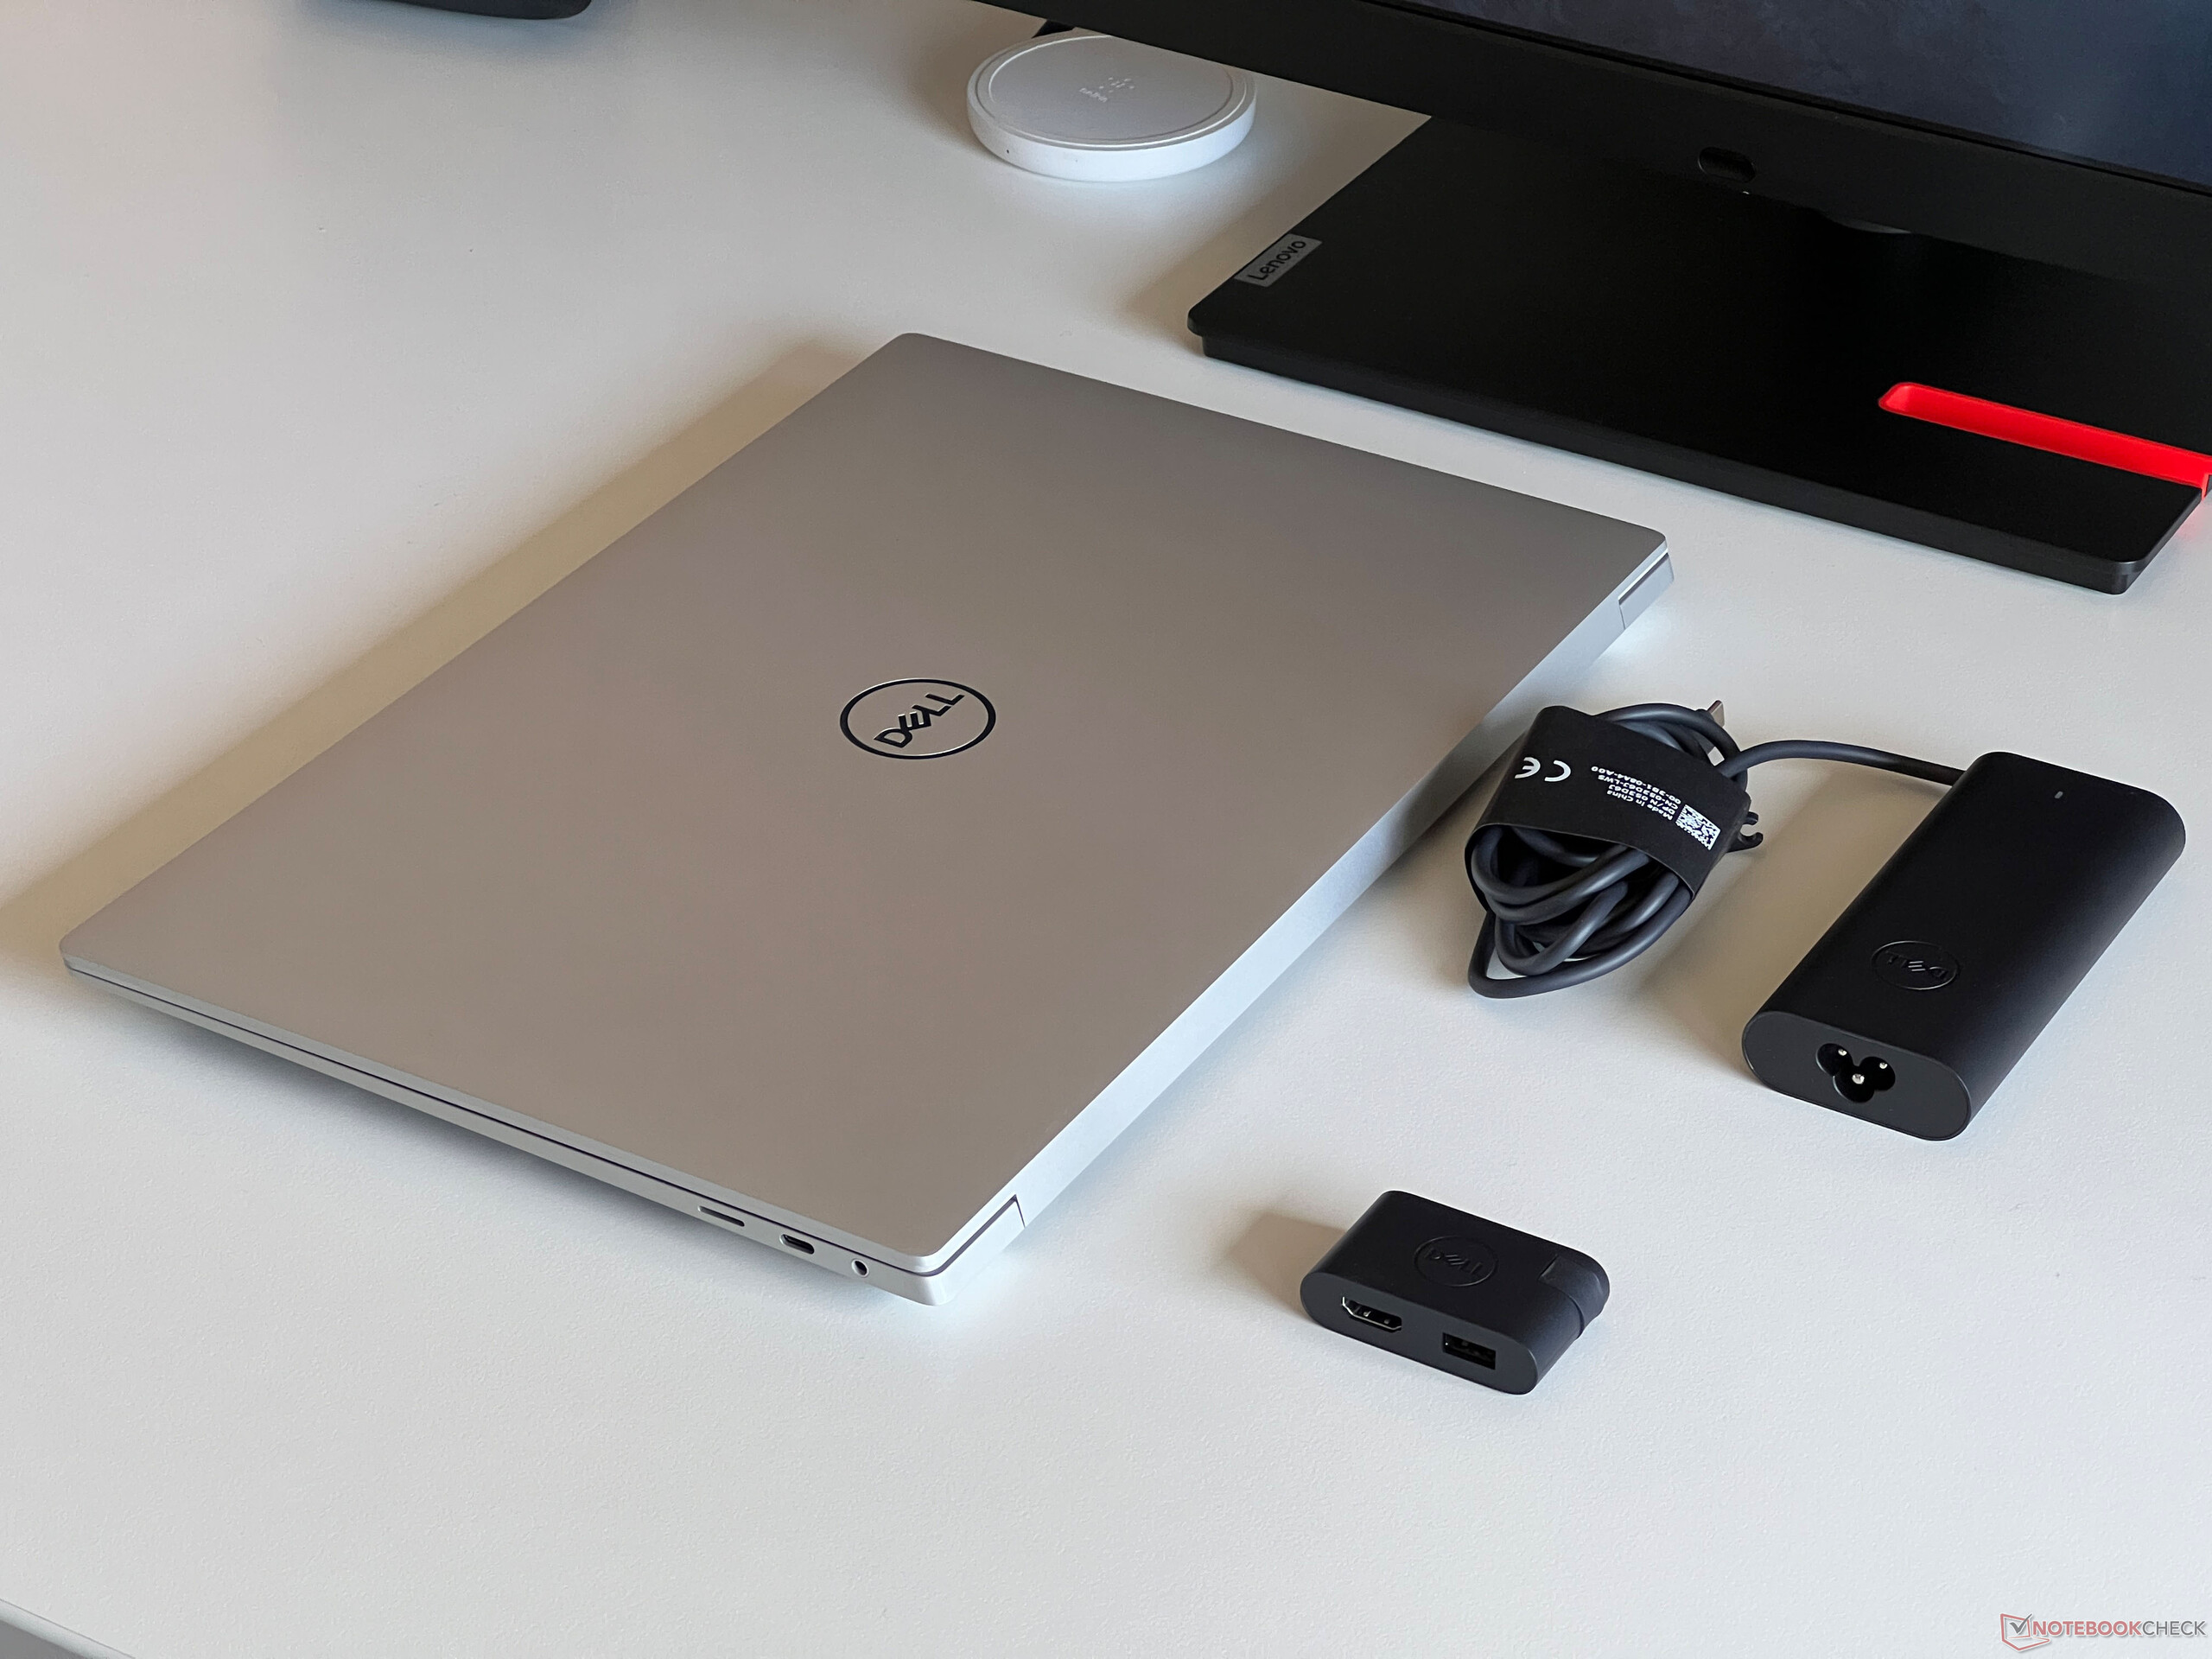
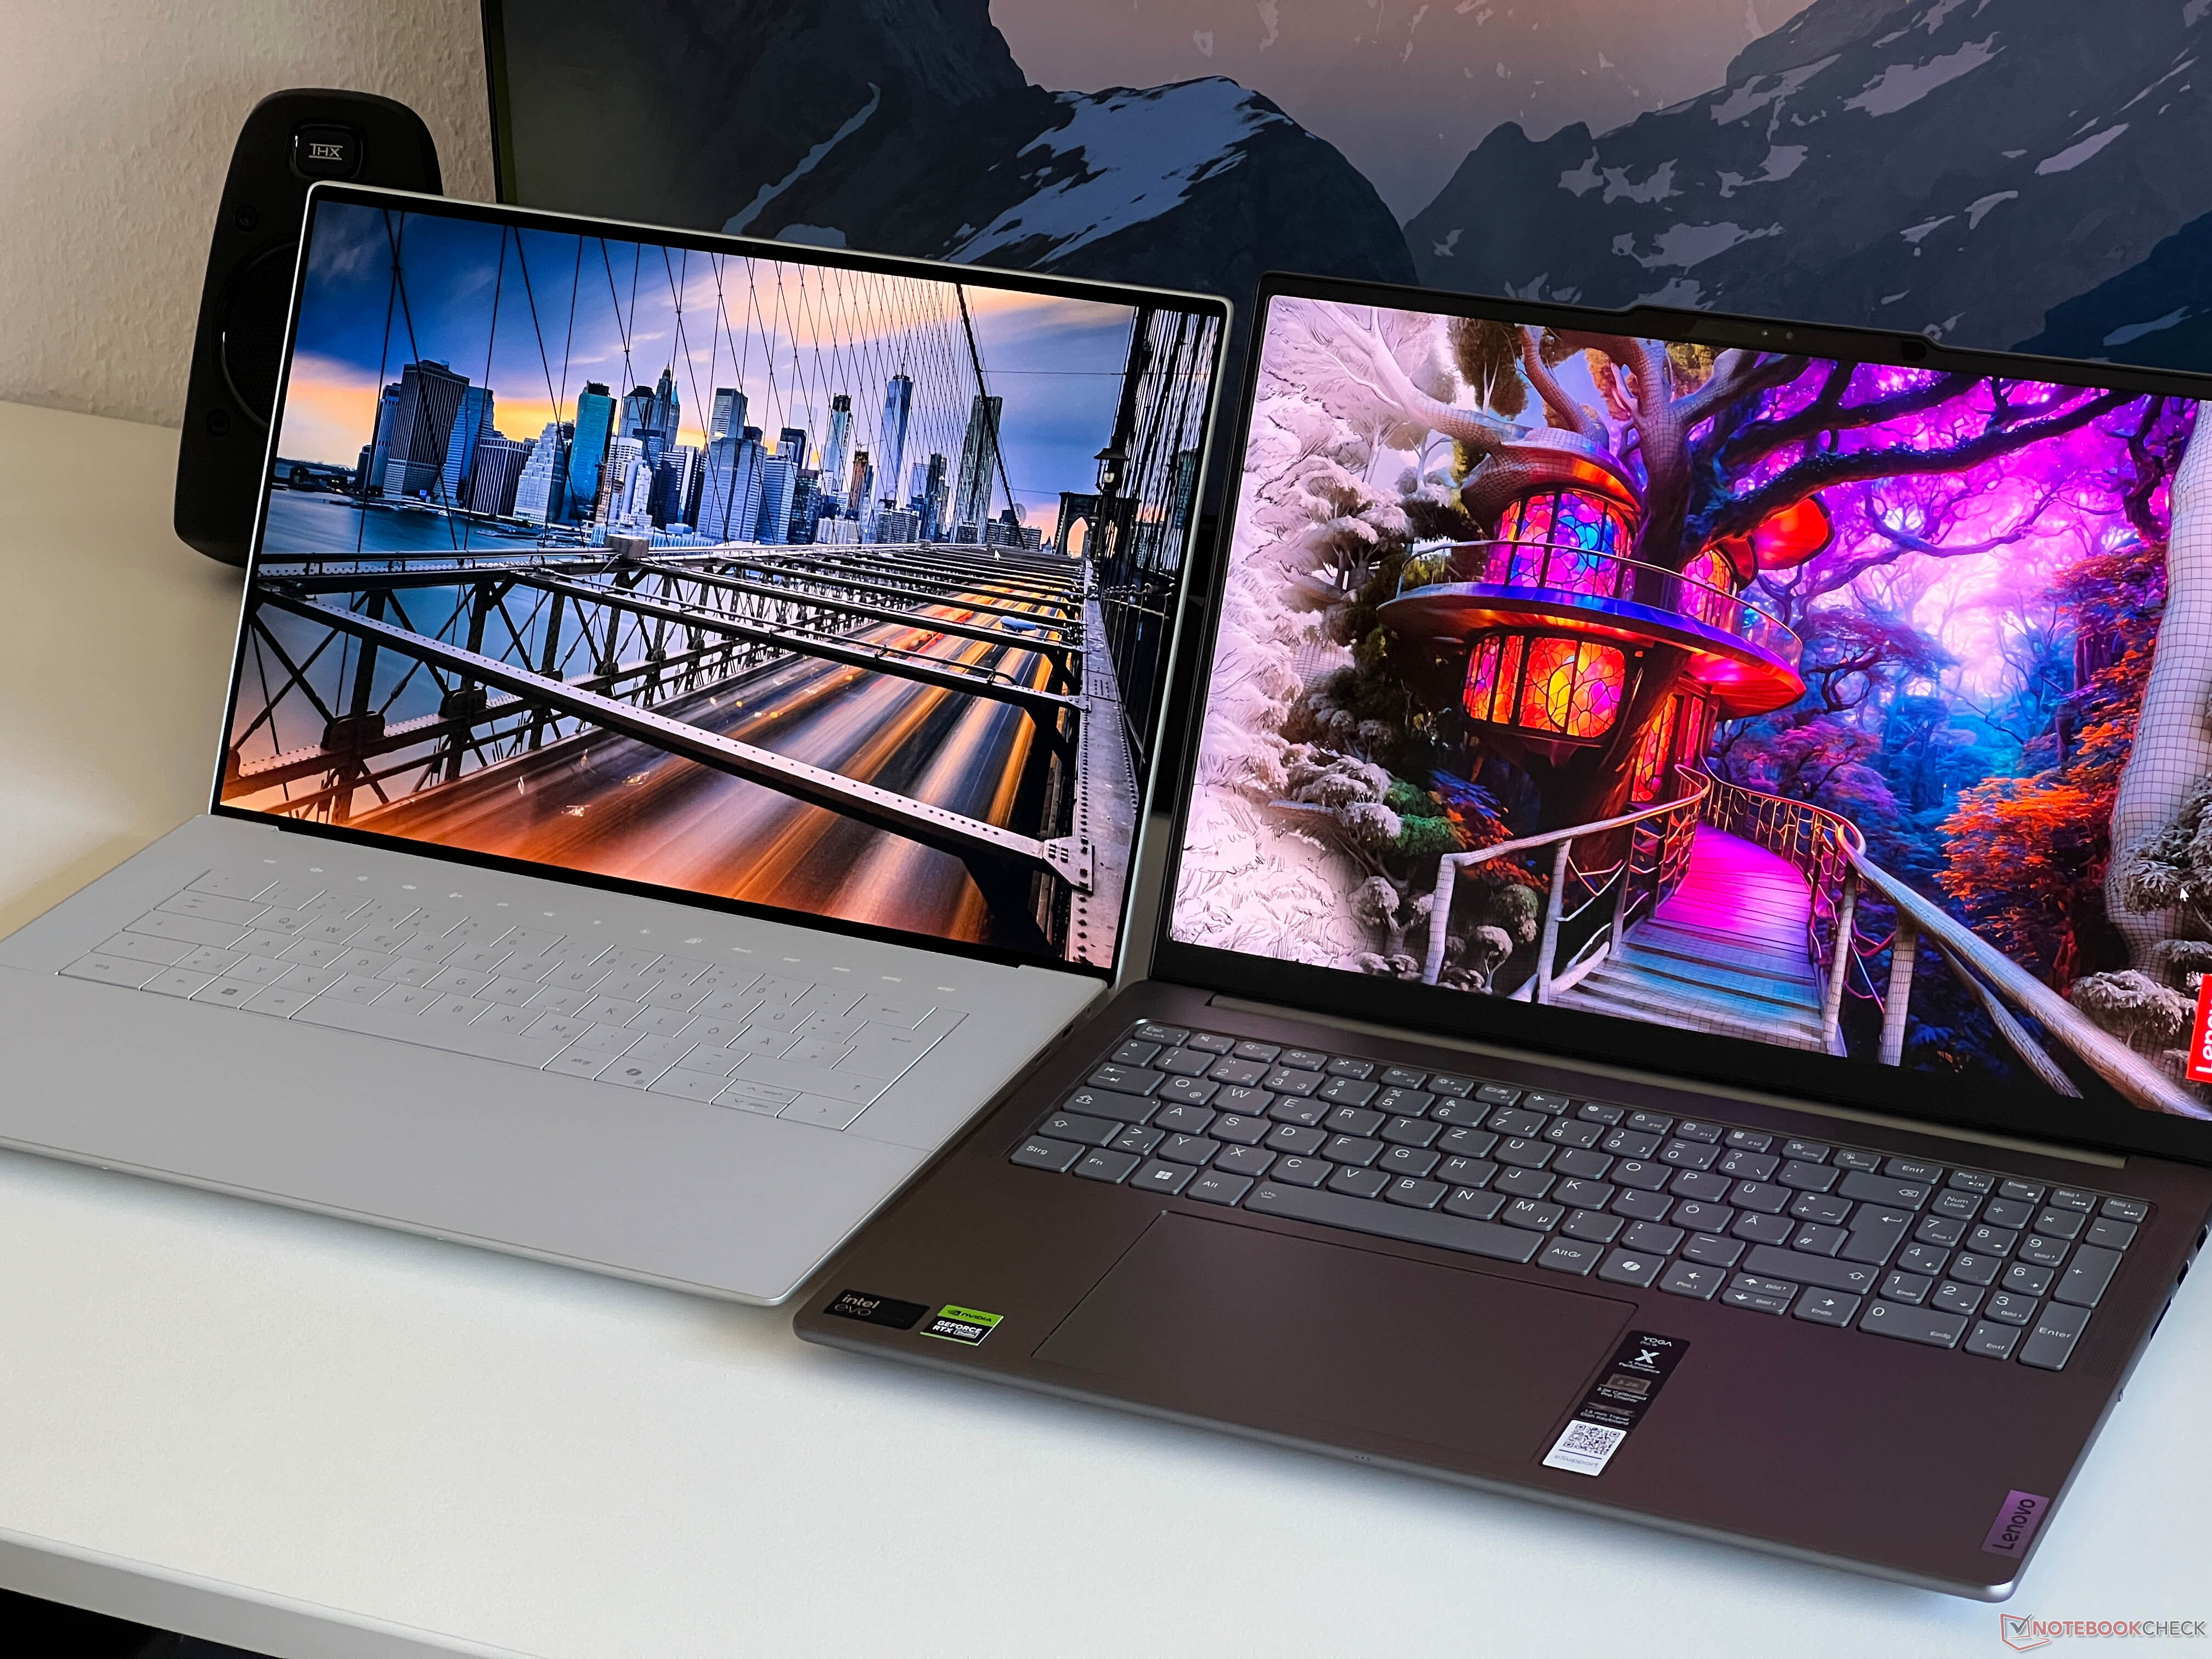
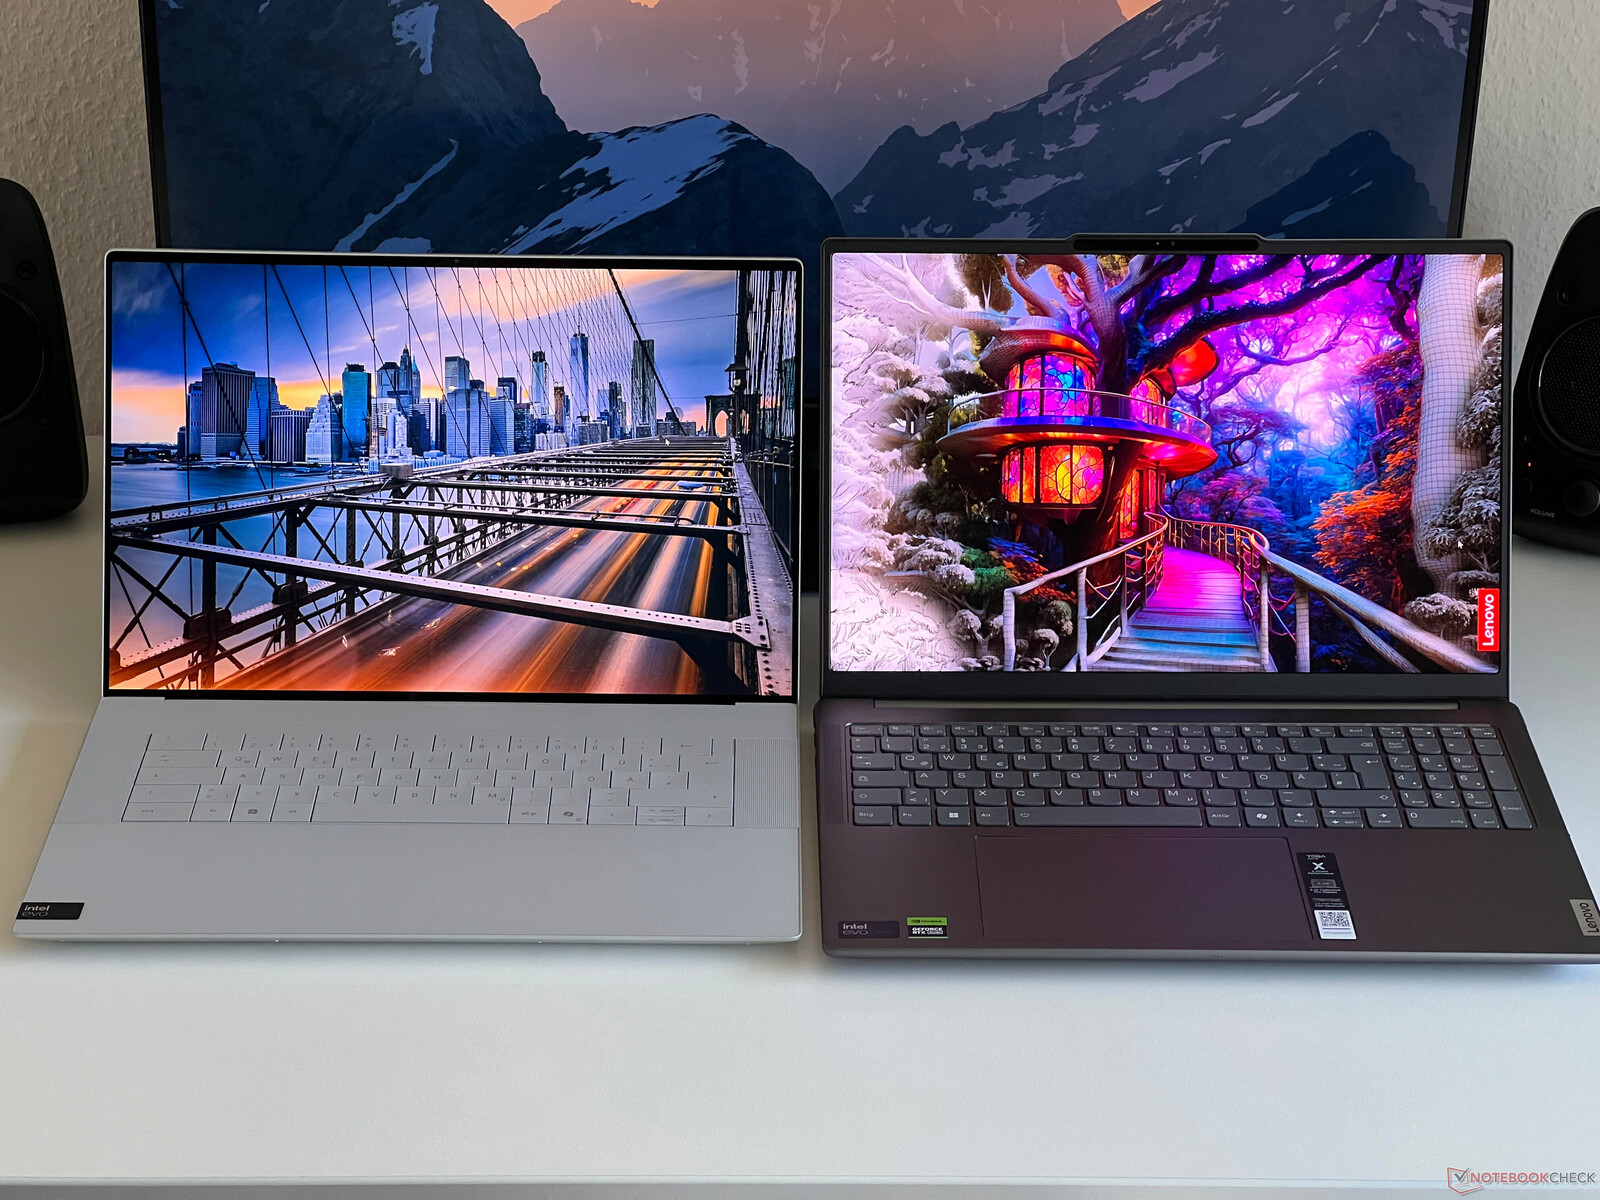
如前所述,16 英寸机型的新设计看起来比 XPS 14 更漂亮,与竞争对手相比也没有什么大的差别,尤其是在占地面积和机壳厚度方面。与目前的 Yoga Pro 9 16 2024(见下面的对比图片)相比,XPS 的优势在于边框更纤薄。不过,XPS 16 的重量为 2.313 千克,仍然是我们对比组中最重的设备。
连接性 - 最快的 XPS 16,仅配备 2x Thunderbolt 4
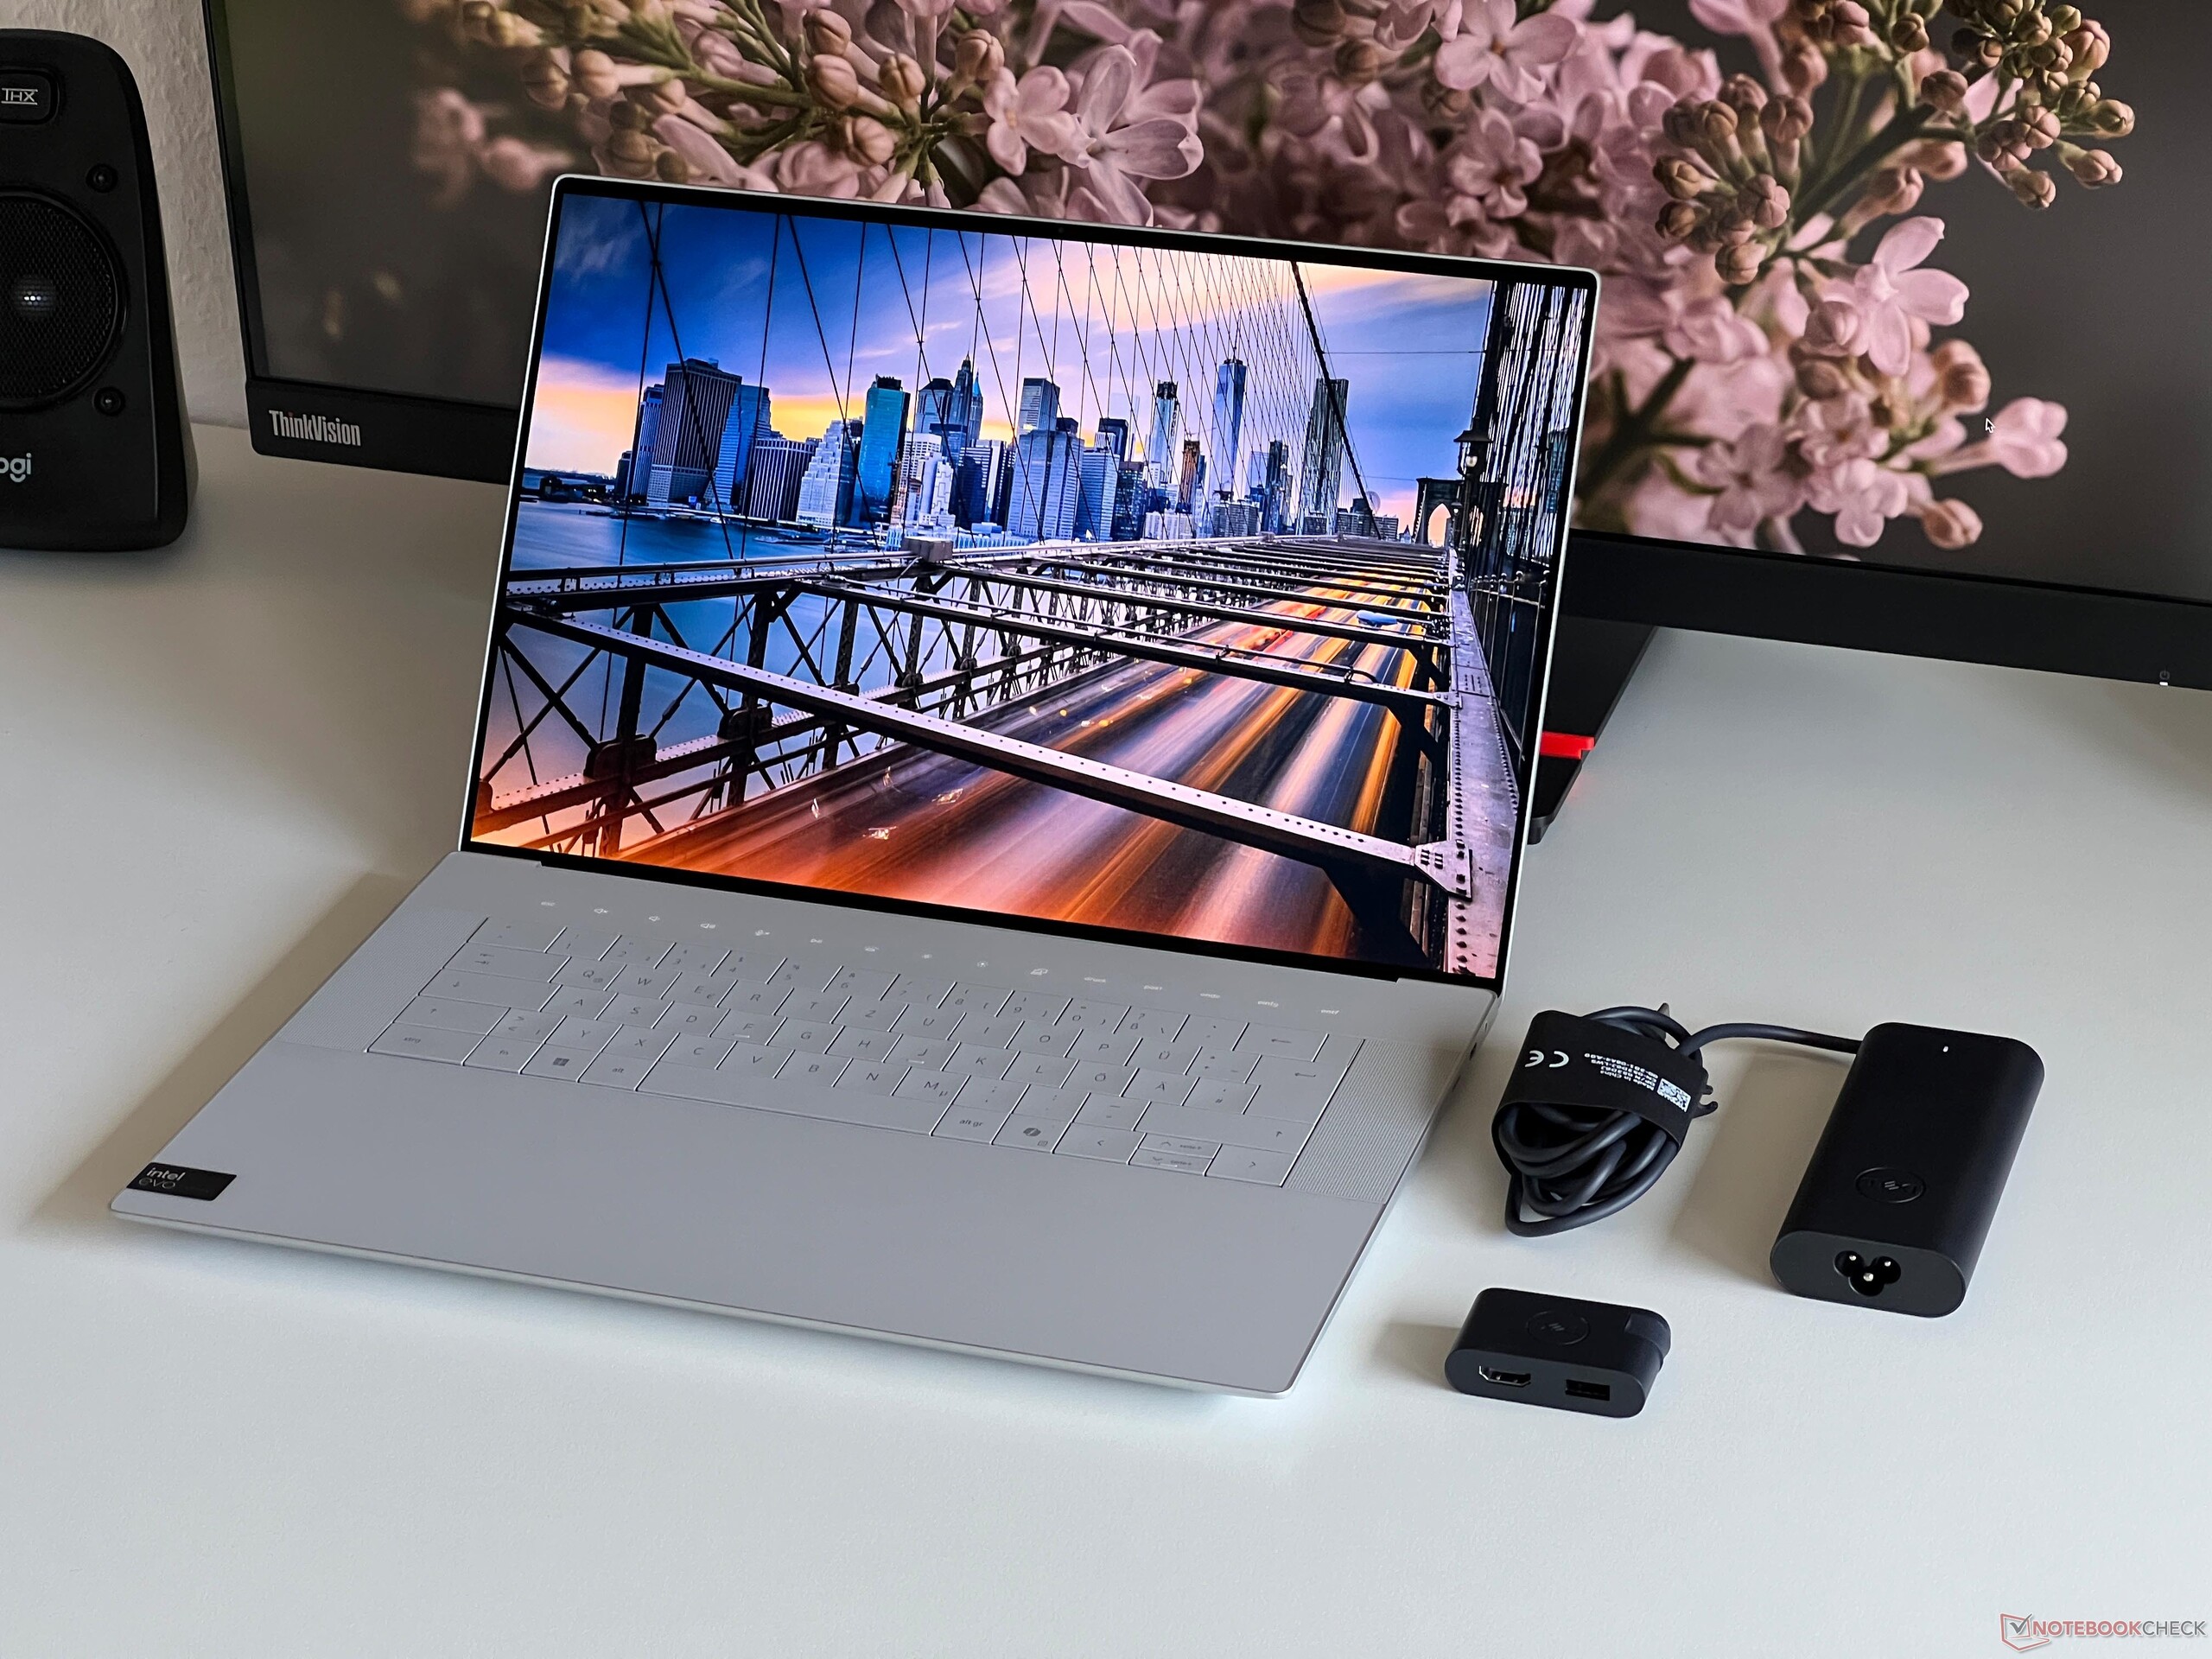
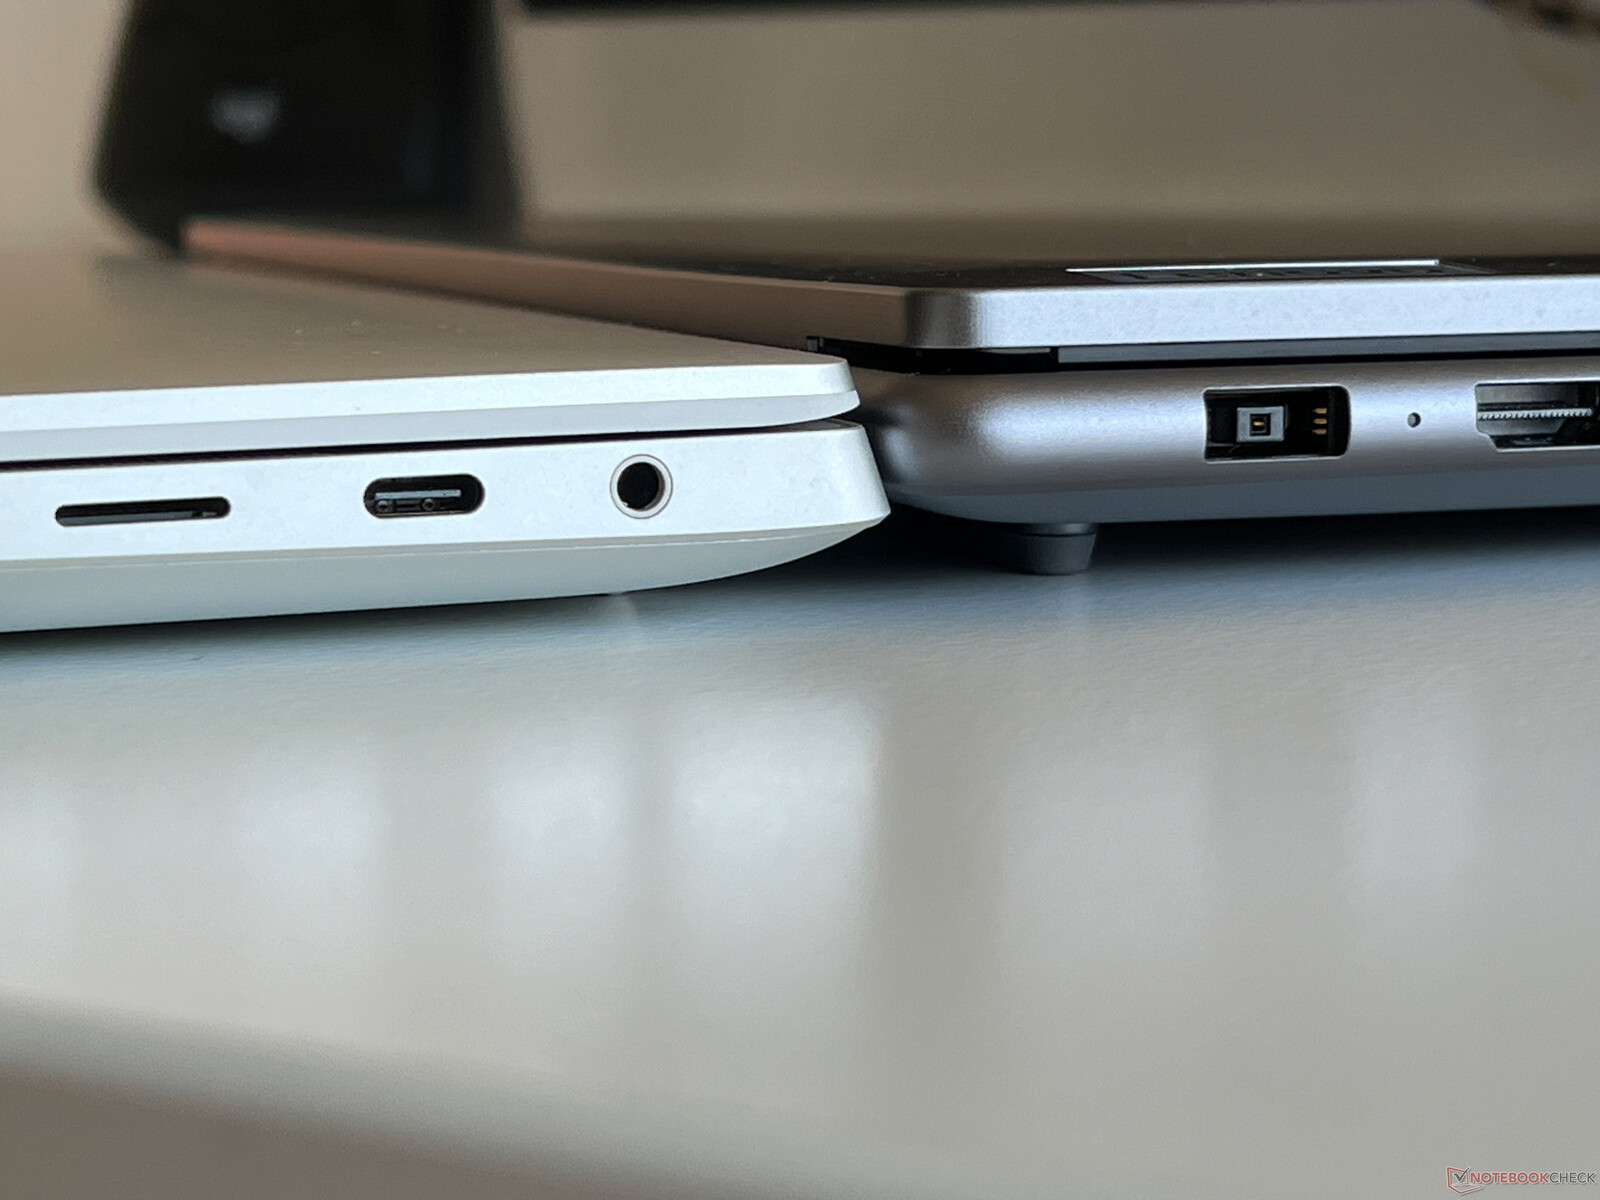
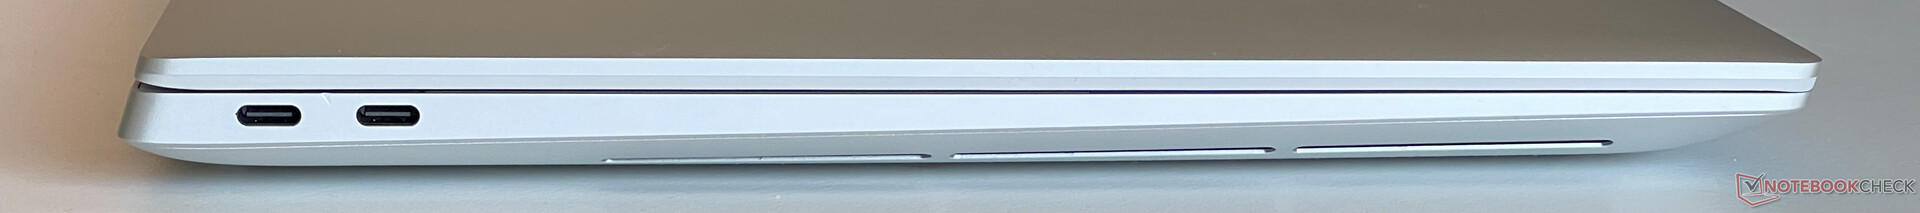
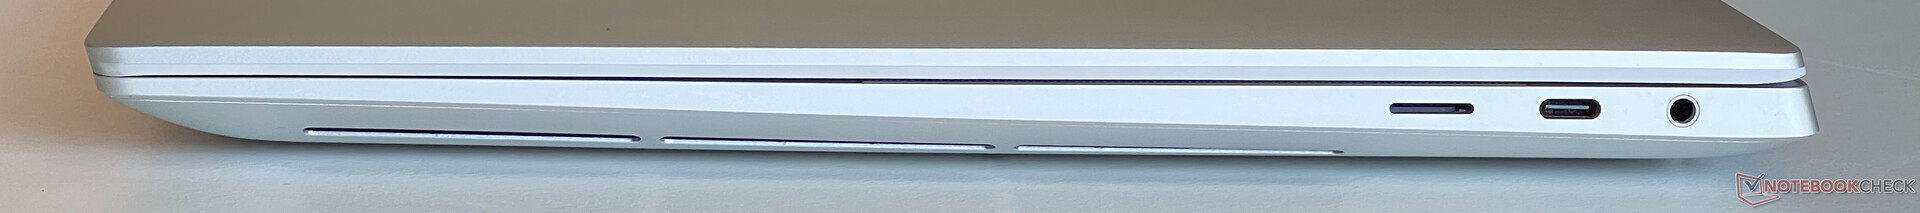
XPS 16 的连接选项与较小的 XPS 14戴尔将额外的空间留作闲置。总共有 3 个 USB-C 端口和一个读卡器,仅此而已。更糟糕的是,配备快速 RTX 4070 笔记本电脑的机型只有左侧的两个端口支持 Thunderbolt 4,而右侧仅支持 USB-C 3.2 Gen 2。相比之下,速度较慢机型的三个端口均支持 Thunderbolt 4。此外,所有 USB-C 输出均通过 iGPU 连接。供货范围还包括一个带有 USB-A 端口和 HDMI 输出的小型扩展坞。
SD 读卡器
microSD 读卡器(弹簧装置)位于设备的右侧,几乎可以完全读取紧凑型存储卡。与我们的参考卡(Angelbird AV Pro V60)配合使用时,其传输速率最高可达 204 MB/s,而在复制图像文件时,我们测得的传输速率为 148 MB/s。
| SD Card Reader | |
| average JPG Copy Test (av. of 3 runs) | |
| Dell XPS 15 9530 RTX 4070 (Toshiba Exceria Pro SDXC 64 GB UHS-II) | |
| Dell XPS 16 9640 (Angelbird AV Pro V60) | |
| Average of class Multimedia (23 - 531, n=40, last 2 years) | |
| Samsung Galaxy Book4 Ultra (Angelbird AV Pro V60) | |
| Asus ROG Zephyrus G16 2024 GU605M | |
| Lenovo Yoga Pro 9 16-IRP G8 (Angelibird AV Pro V60) | |
| Schenker VISION 16 Pro (M23) (Angelbird AV Pro V60) | |
| maximum AS SSD Seq Read Test (1GB) | |
| Dell XPS 16 9640 (Angelbird AV Pro V60) | |
| Average of class Multimedia (37.3 - 1455, n=39, last 2 years) | |
| Dell XPS 15 9530 RTX 4070 (Toshiba Exceria Pro SDXC 64 GB UHS-II) | |
| Asus ROG Zephyrus G16 2024 GU605M | |
| Samsung Galaxy Book4 Ultra (Angelbird AV Pro V60) | |
| Lenovo Yoga Pro 9 16-IRP G8 (Angelibird AV Pro V60) | |
| Schenker VISION 16 Pro (M23) (Angelbird AV Pro V60) | |
交流
与较小的 XPS 14相比,戴尔在 XPS 16 中安装了英特尔的 Wi-Fi-7 模块。它还支持蓝牙 5.4。我们还不能测试它的 Wi-Fi 7 性能,但结合我们的华硕参考路由器,它的性能比 XPS 14 的 Wi-Fi 6E 模块稍差一些。尽管如此,你应该不会注意到任何限制,在测试过程中,我们没有发现任何连接问题。
| Networking | |
| Dell XPS 16 9640 | |
| iperf3 transmit AXE11000 | |
| iperf3 receive AXE11000 | |
| Samsung Galaxy Book4 Ultra | |
| iperf3 transmit AXE11000 | |
| iperf3 receive AXE11000 | |
| Honor MagicBook Pro 16 2024 | |
| iperf3 transmit AXE11000 | |
| iperf3 receive AXE11000 | |
| Asus ROG Zephyrus G16 2024 GU605M | |
| iperf3 transmit AXE11000 | |
| iperf3 receive AXE11000 | |
| Lenovo Yoga Pro 9 16-IRP G8 | |
| iperf3 transmit AXE11000 | |
| iperf3 receive AXE11000 | |
| Schenker VISION 16 Pro (M23) | |
| iperf3 transmit AXE11000 | |
| iperf3 receive AXE11000 | |
| Dell XPS 15 9530 RTX 4070 | |
| iperf3 transmit AXE11000 | |
| iperf3 receive AXE11000 | |
网络摄像头
戴尔在显示屏顶部边框安装了一个 1080p 网络摄像头,另外还有一个红外摄像头,用于通过 Windows Hello 进行面部识别。在光线充足的条件下,网络摄像头的质量还不错。此外,作为操作系统的一部分,摄像头还支持工作室特效(背景柔焦、眼球跟踪、自动取景),这意味着无论当前使用的是什么应用程序,它都能正常工作。


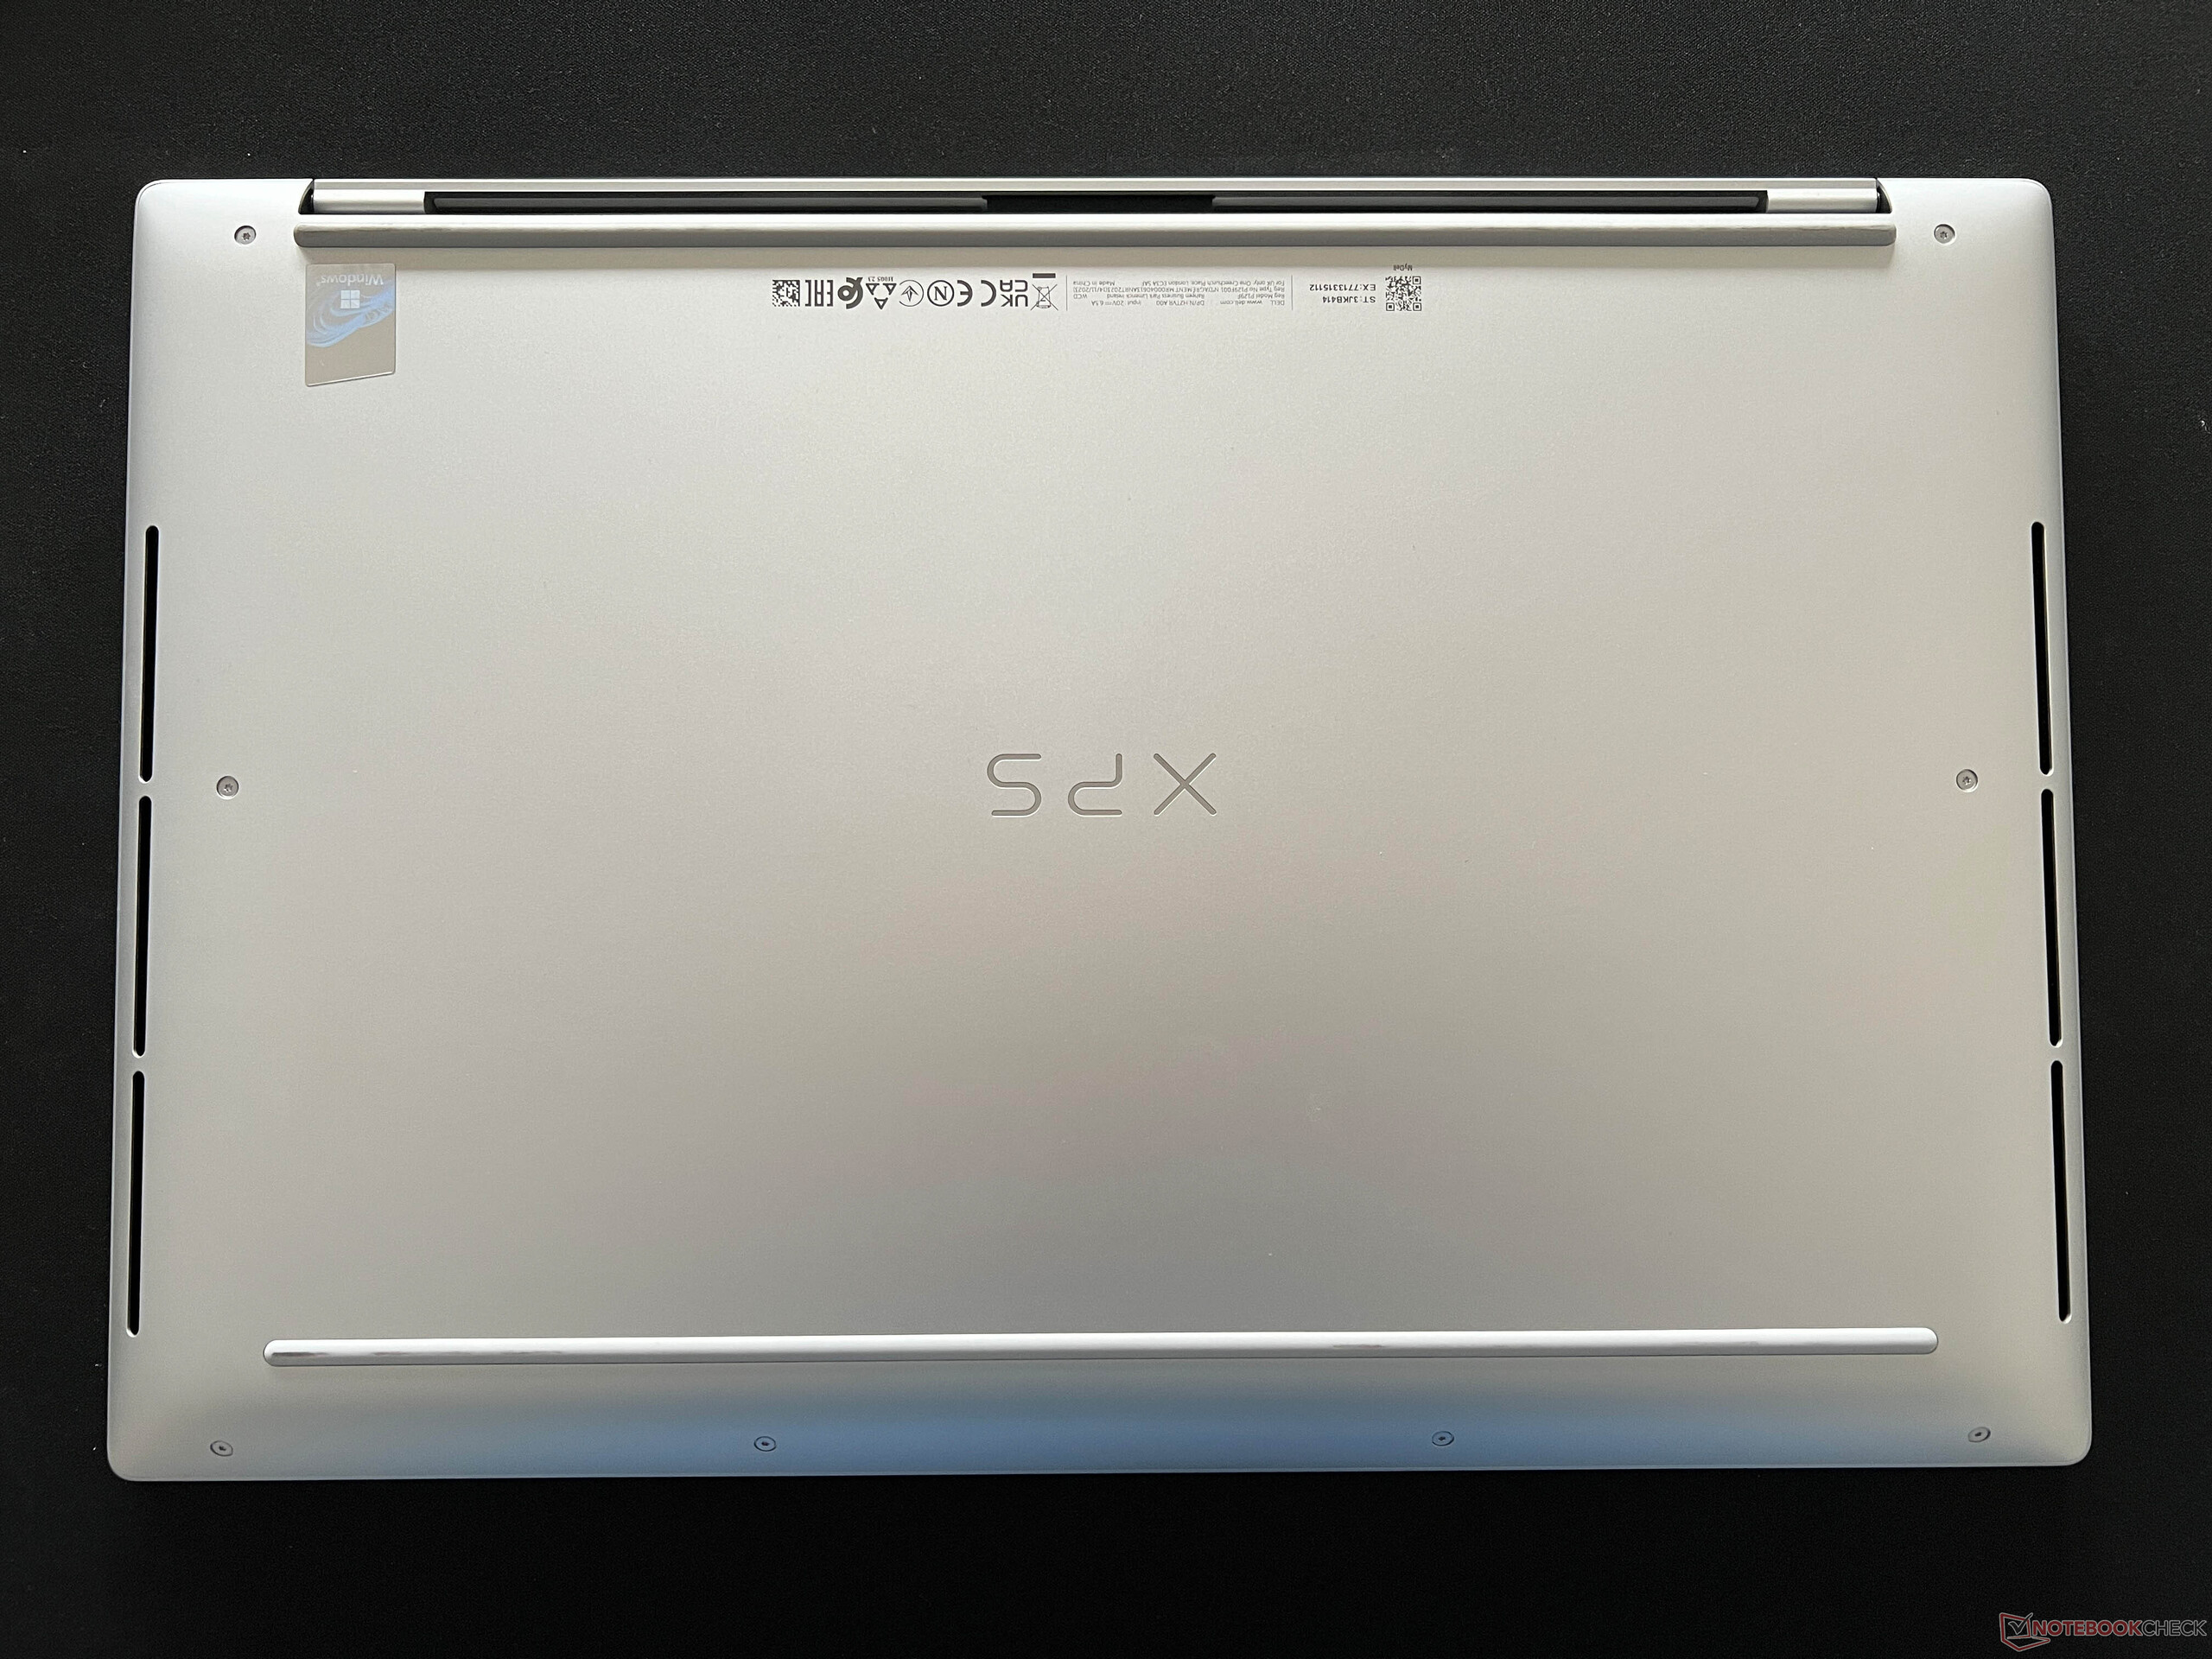
维护
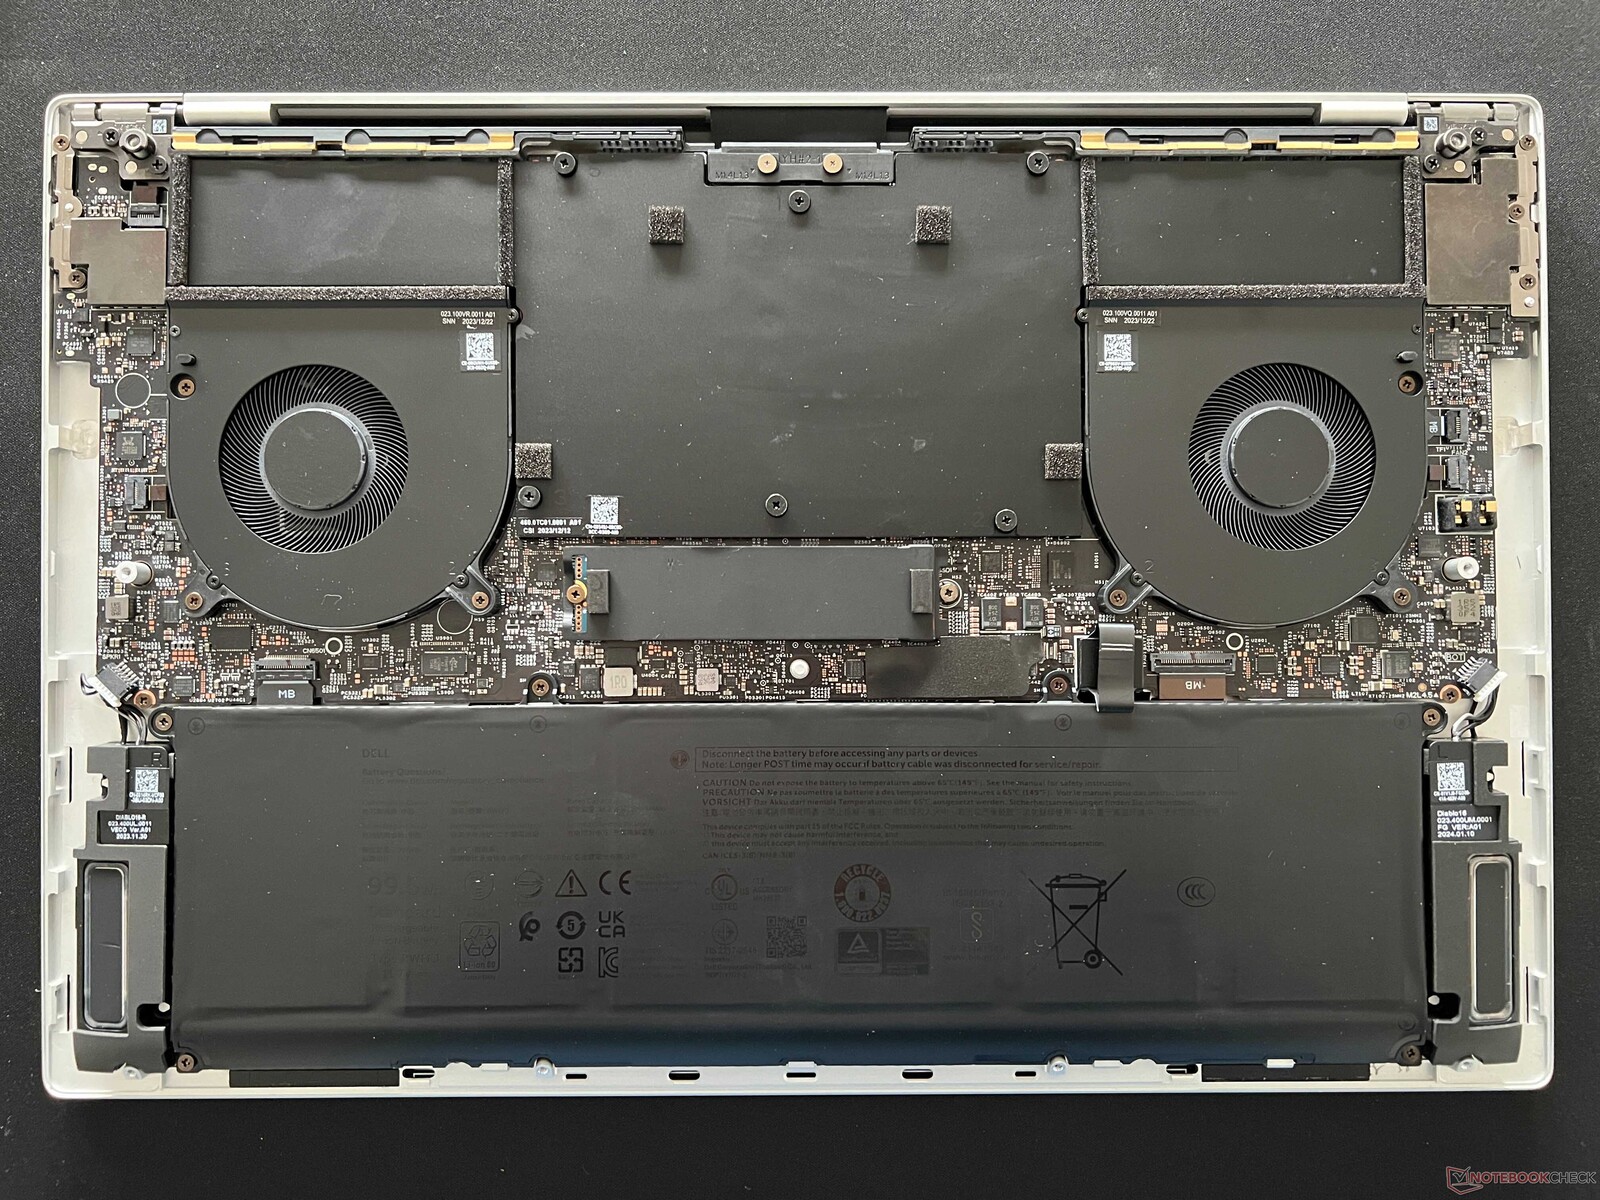
机箱底盖通过 Torx 螺钉(T5)固定,可以轻松取下。内部结构主要是冷却装置和电池。你只能对 M.2-2280 固态硬盘进行维护和清洁笔记本的风扇,此外,如果需要,你还可以更换电池。所有其他组件,包括无线局域网模块和内存,都是焊接上去的。
输入设备 - 键盘需要一些时间适应,功能键也很恼人
正如前面提到的 XPS 14戴尔还在较大的 XPS 16 机型上采用了与旧款 XPS 13 Plus 相同的键盘设计,各个按键之间没有空隙。它没有数字键盘,键盘旁边的空间用于笔记本的扬声器。键盘本身略微凹陷,打字时感觉非常舒适,按键精准。不过,我们也注意到了偶尔出现的问题,因为我们经常会不小心按错键,所以你肯定需要一些时间来适应这个键盘。我们还发现,用较大的手指敲击细小的垂直方向键很不方便,而且较大按键(空格键、回车键)的敲击声也更大。电源键位于右上方(包括指纹扫描仪),而你通常会认为删除键应该在这里,这就带来了下一个问题。
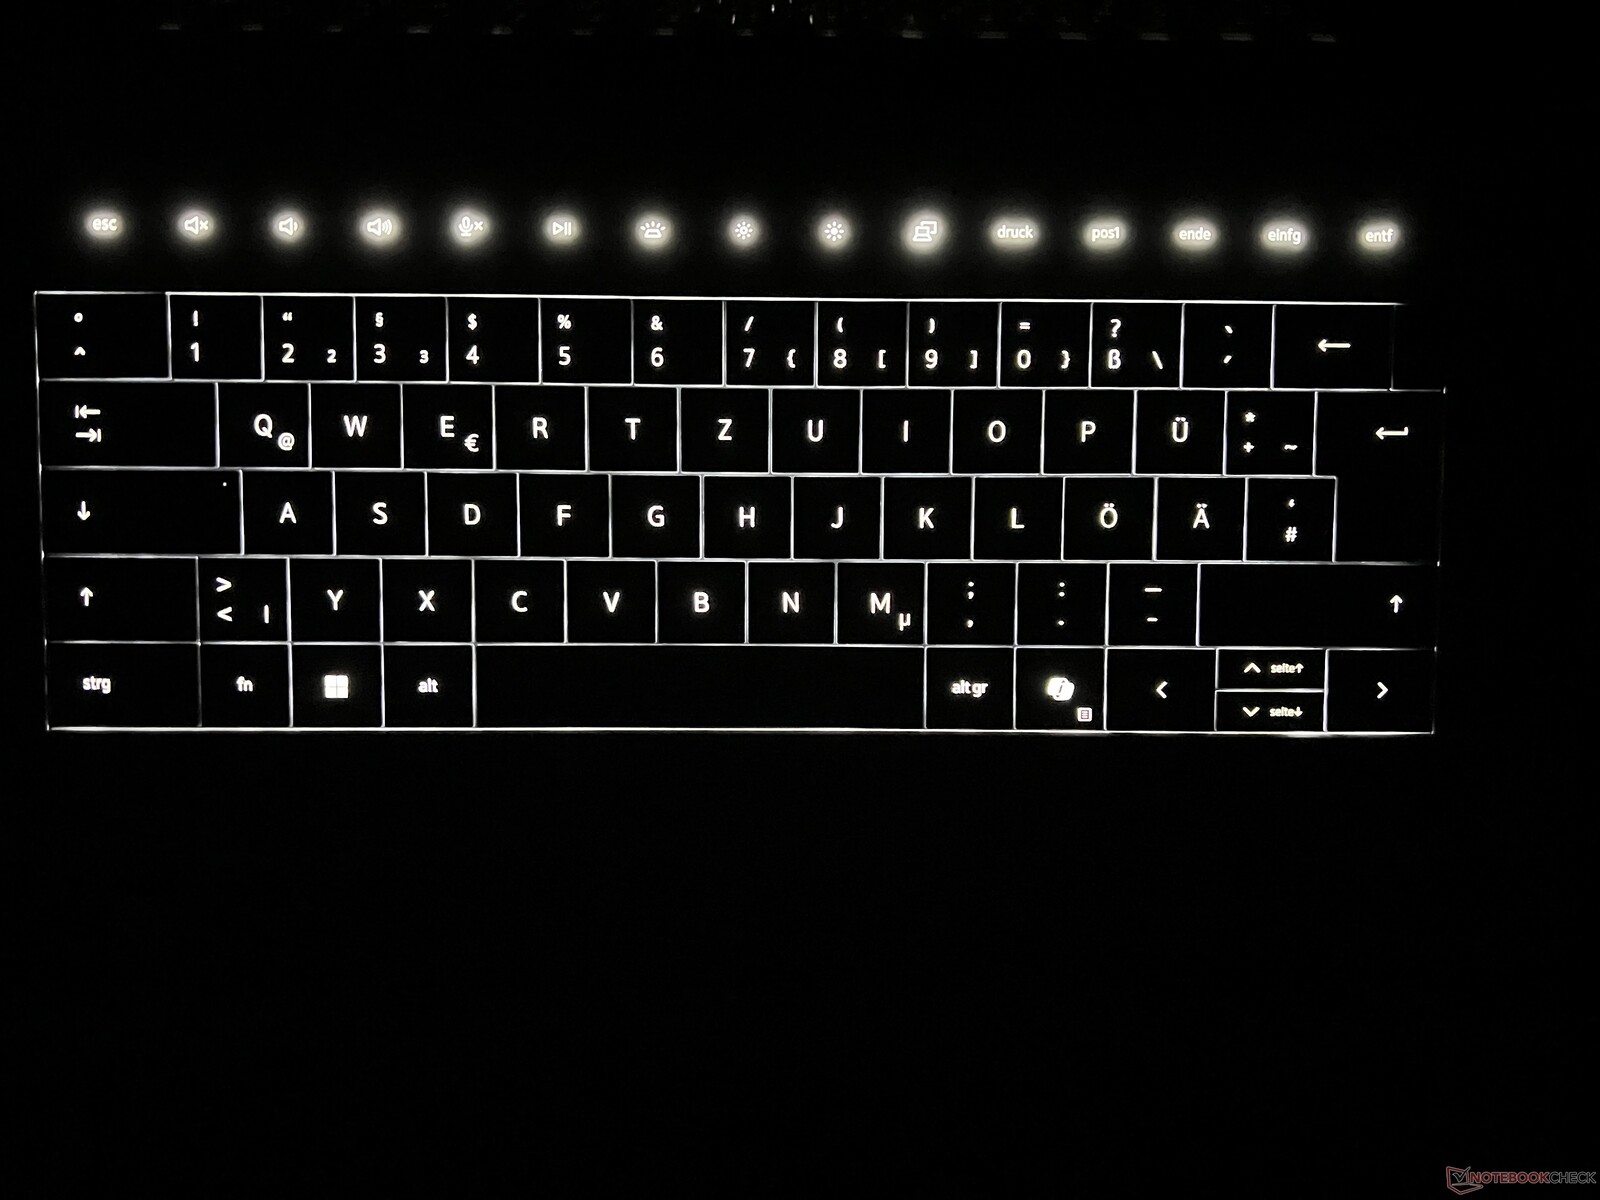
功能键被安装成了触摸条,这不仅没有为用户增加任何附加价值,而且还相当恼人。因此,你甚至不能盲目地点击删除键,而必须一直看着按键。它的背光也同样令人讨厌,因为它在不活动时会关闭,但在连续观看视频数小时后却不会关闭,即使你没有触碰任何按键。此外,当背光关闭时,你不知道该按哪里,这意味着你可能会按错键,直到背光重新激活。白色背光本身是通过传感器不断调整的,你根本无法影响其强度,至少我们找不到影响强度的选项。传感器也不关心你之前是否手动关闭了背光,一旦光线条件发生变化,背光就会被重新激活。
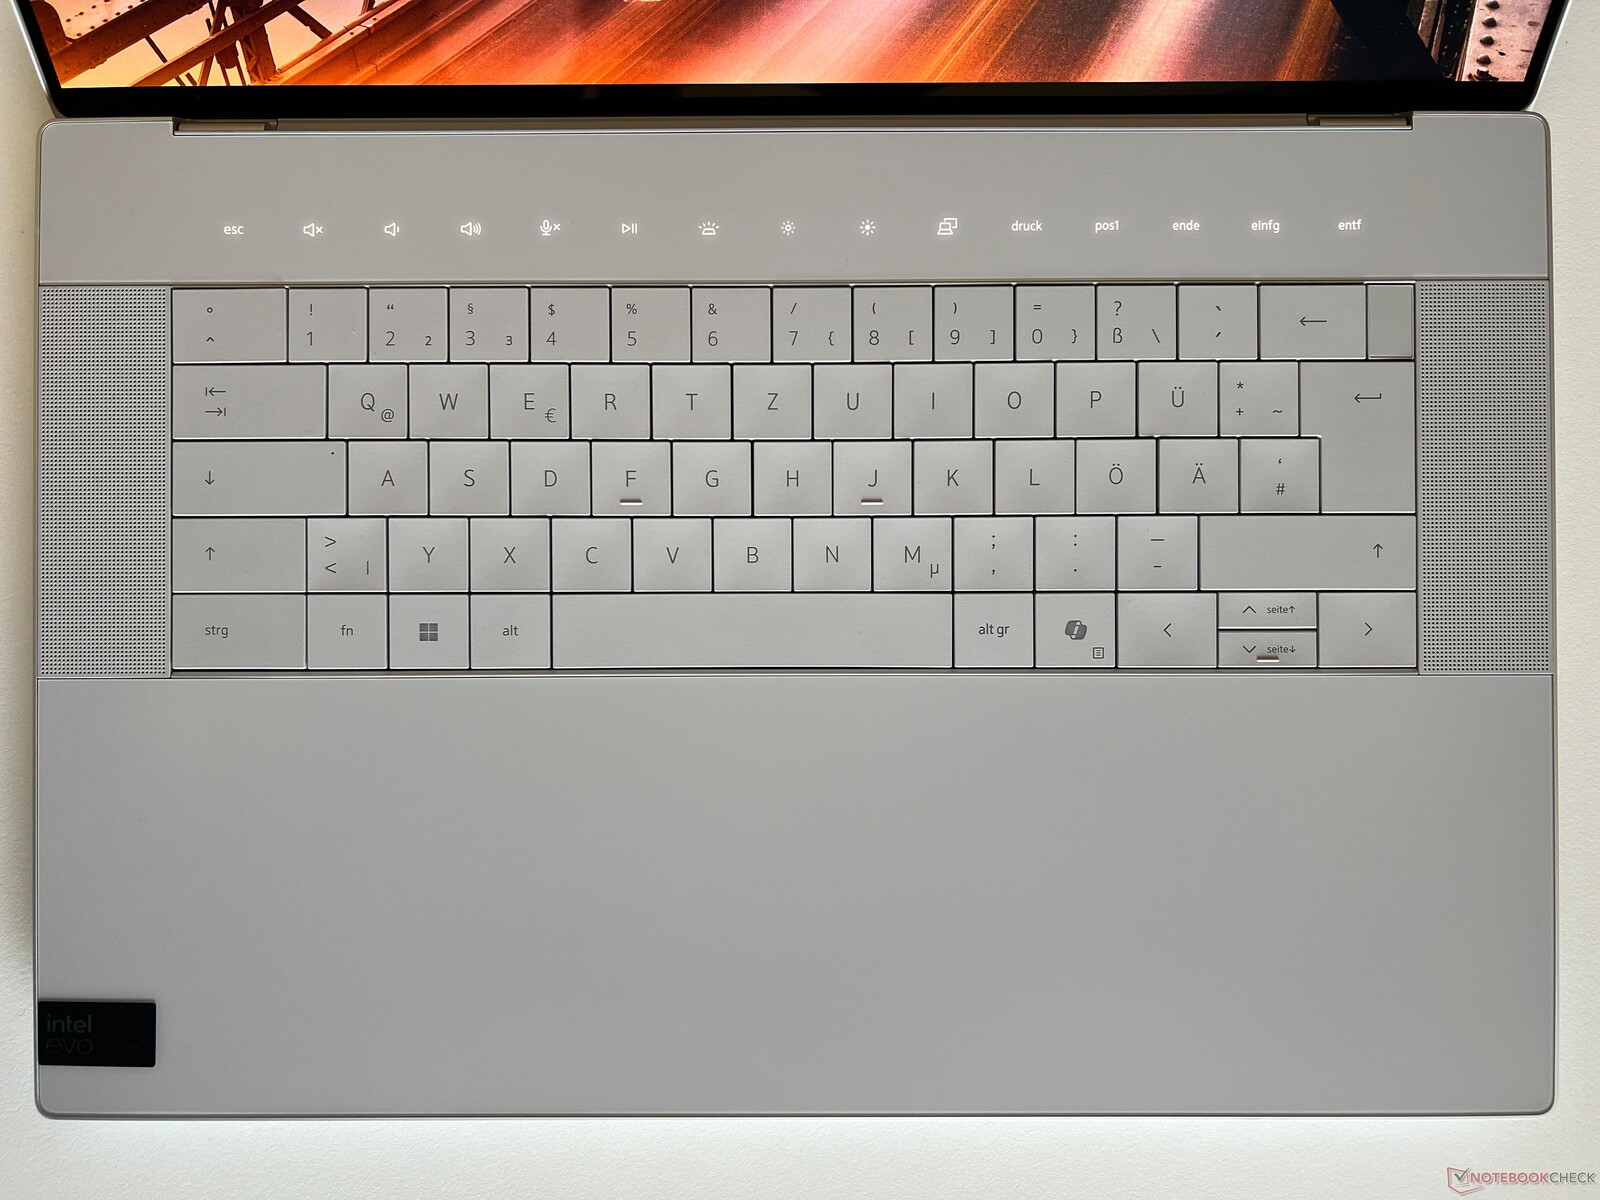
触摸板完全与掌托融为一体,没有明显的边界。触摸板使用掌托的整个高度,宽度从左 Fn 键的中心延伸到左箭头键的中心。总的来说,触摸板运行良好,点击均匀流畅,但如果离开触摸板区域或开始动作时稍稍偏离实际触摸板区域,我们偶尔会遇到一些问题。不过,与触摸条相比,这只是一个小问题。选配的 OLED 面板也配备了电容式触摸屏,而且效果非常好。
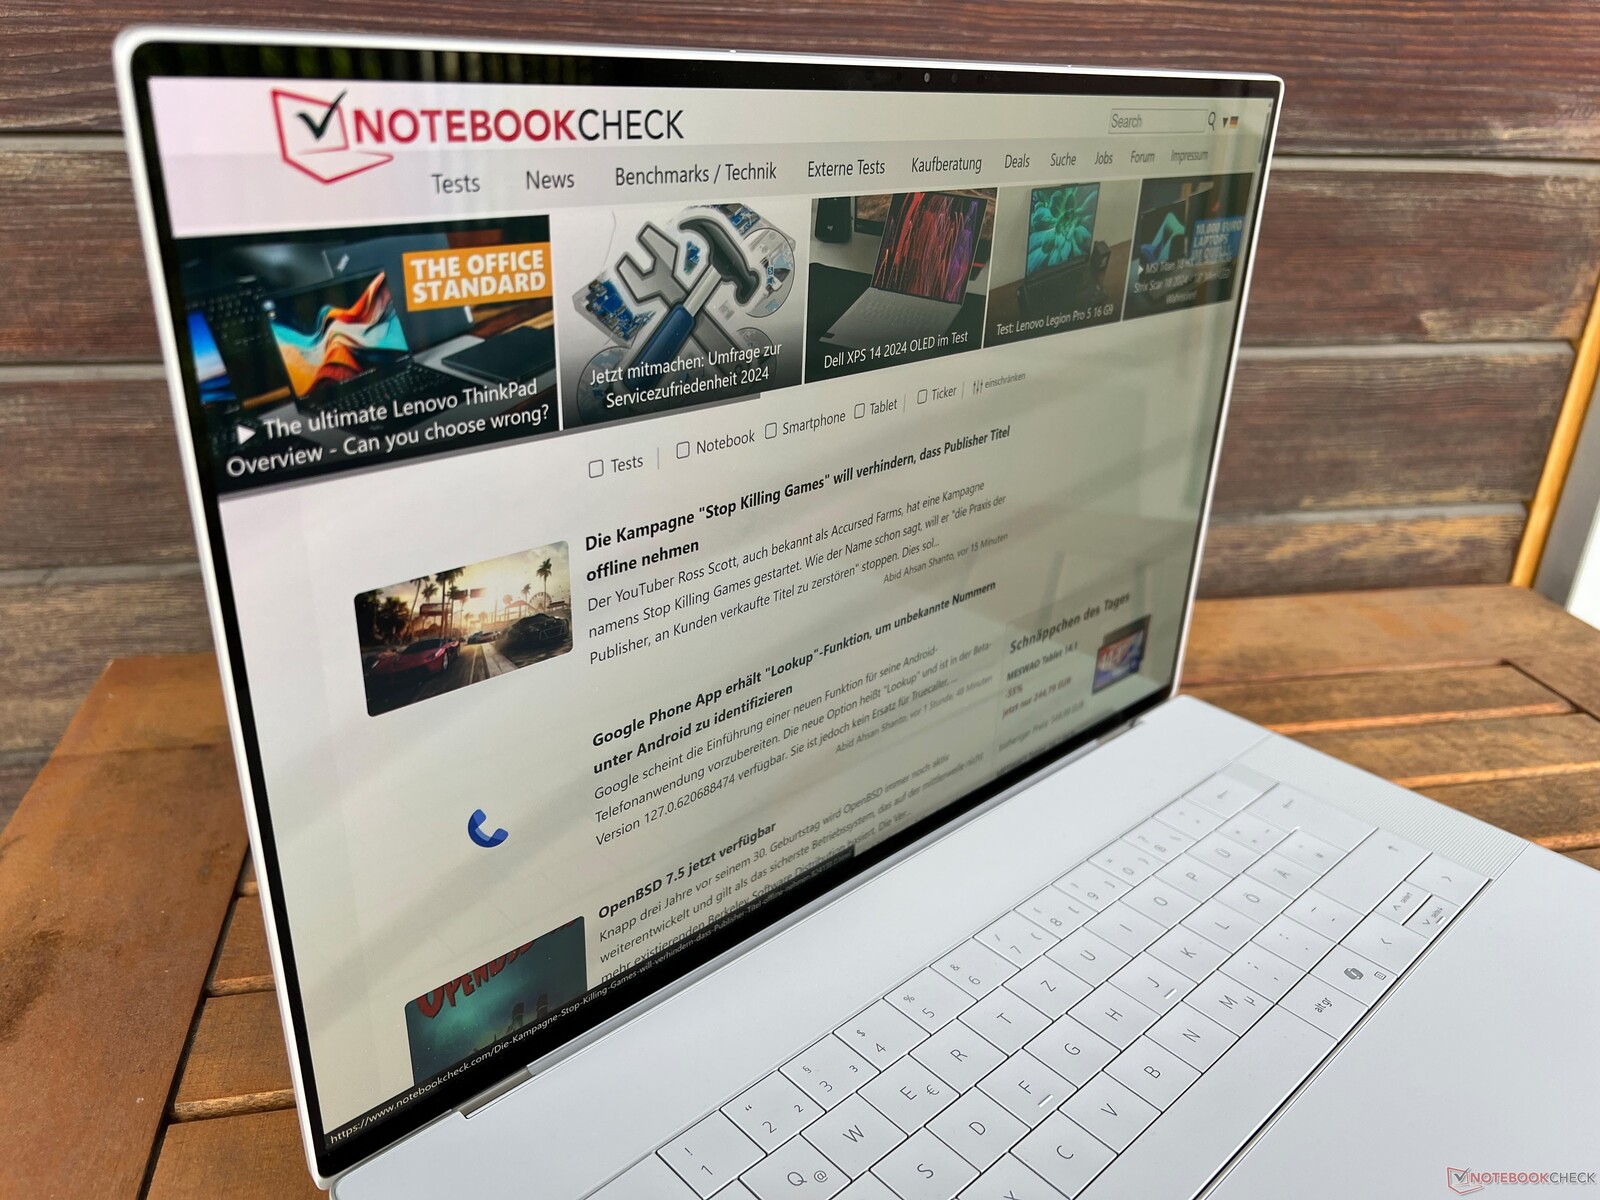
显示屏 - 90-Hz 4K OLED
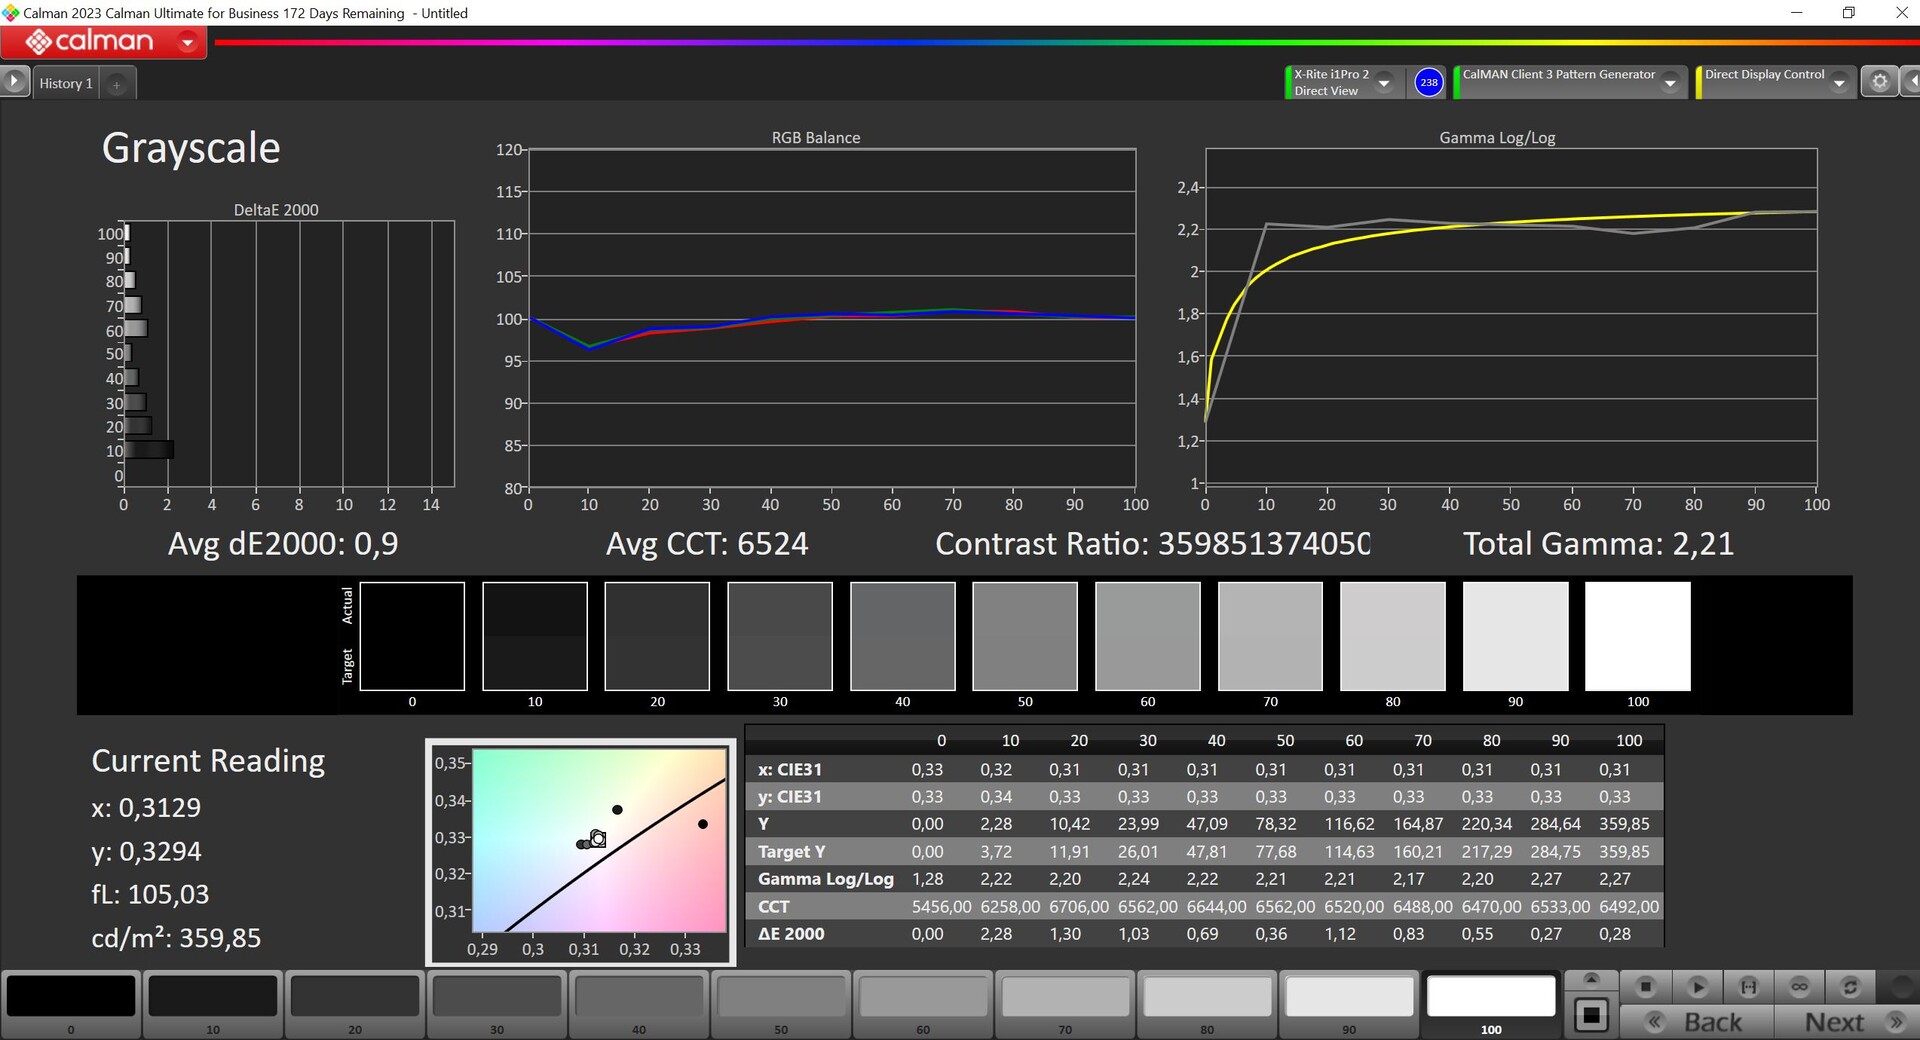
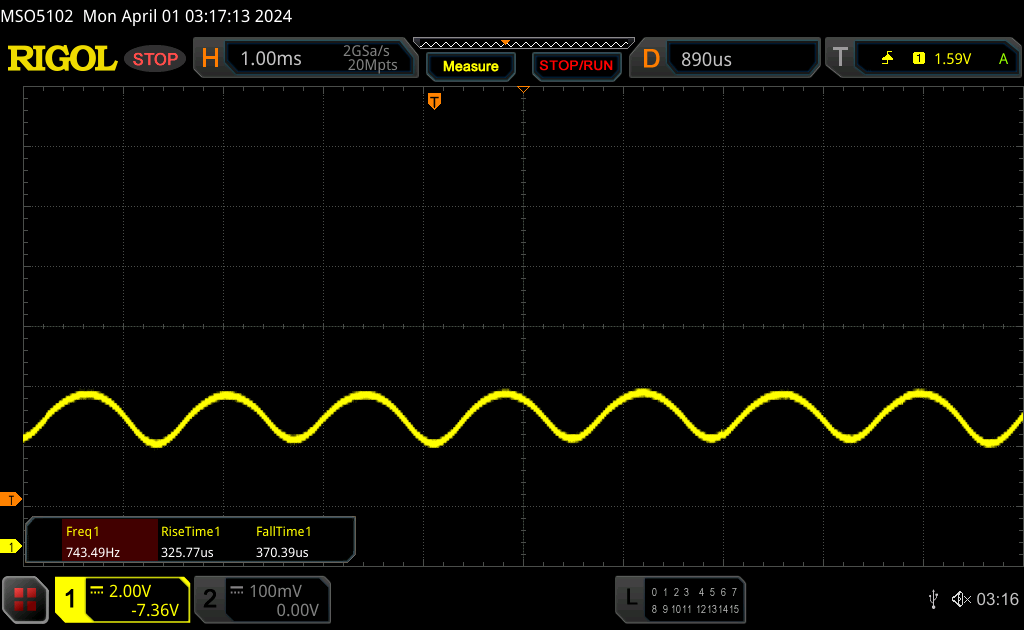
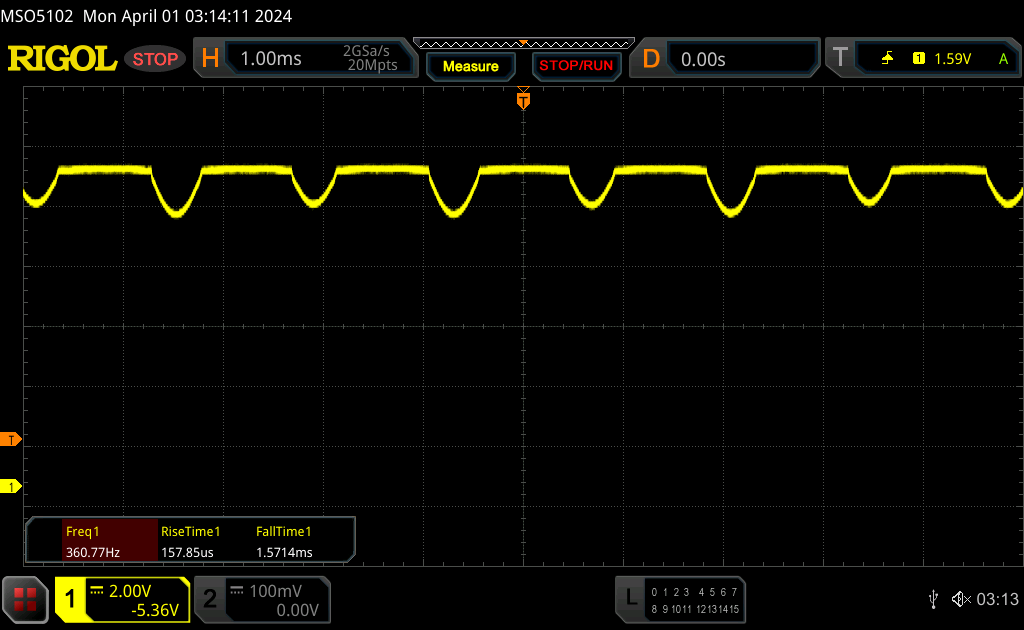
戴尔为其新款 XPS 16 提供两种不同的 16.3 英寸反射面板。标准配置是不带触摸屏的 1080p 型号(500 cd/m²),但只需额外支付 300 美元,就可以获得三星公司提供的分辨率为 3,840 x 2,400 像素的 OLED 触摸屏,这也是我们测试设备上安装的面板。尽管 XPS 16 的主观画质不错,但与三星最新一代的 OLED 屏幕(例如安装在Galaxy Book4 Ultra 上的 OLED 屏幕)相比,XPS 16 的面板显示出一些缺点,尽管其分辨率更高。首先,它的刷新率只有 90 Hz,而不是 120 Hz,当显示明亮的内容时,仔细观察会发现光栅效应。在最大 SDR 亮度方面,戴尔 XPS 16 也略逊一筹,平均亮度约为 367 cd/m²。其黑色值为 0,因此对比度极高。我们注意到,在 HDR 模式下(必须手动激活),最大亮度可达 580 cd/m²。在 0-90% 的所有亮度范围内,我们都能检测到频率为 360 Hz 的 PWM。
| |||||||||||||||||||||||||
Brightness Distribution: 96 %
Center on Battery: 366 cd/m²
Contrast: ∞:1 (Black: 0 cd/m²)
ΔE ColorChecker Calman: 1.3 | ∀{0.5-29.43 Ø4.71}
calibrated: 1
ΔE Greyscale Calman: 2.2 | ∀{0.09-98 Ø4.96}
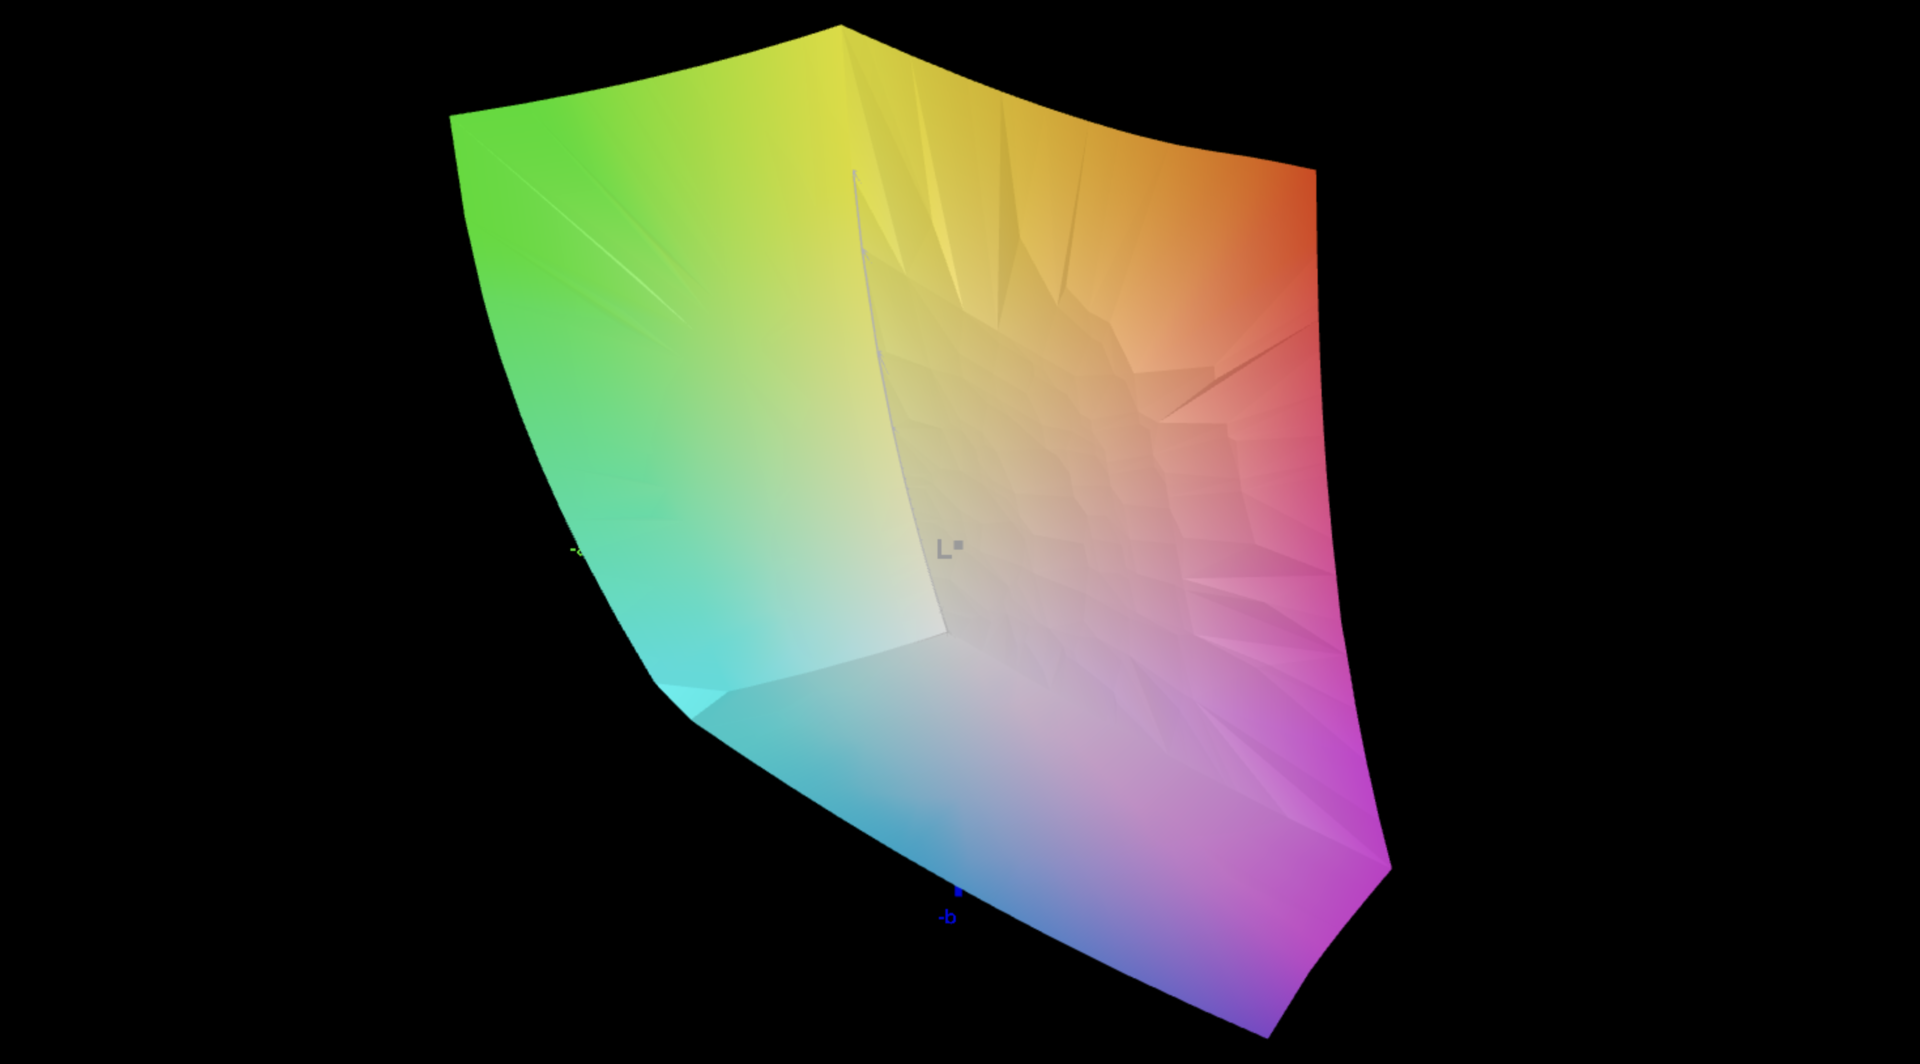
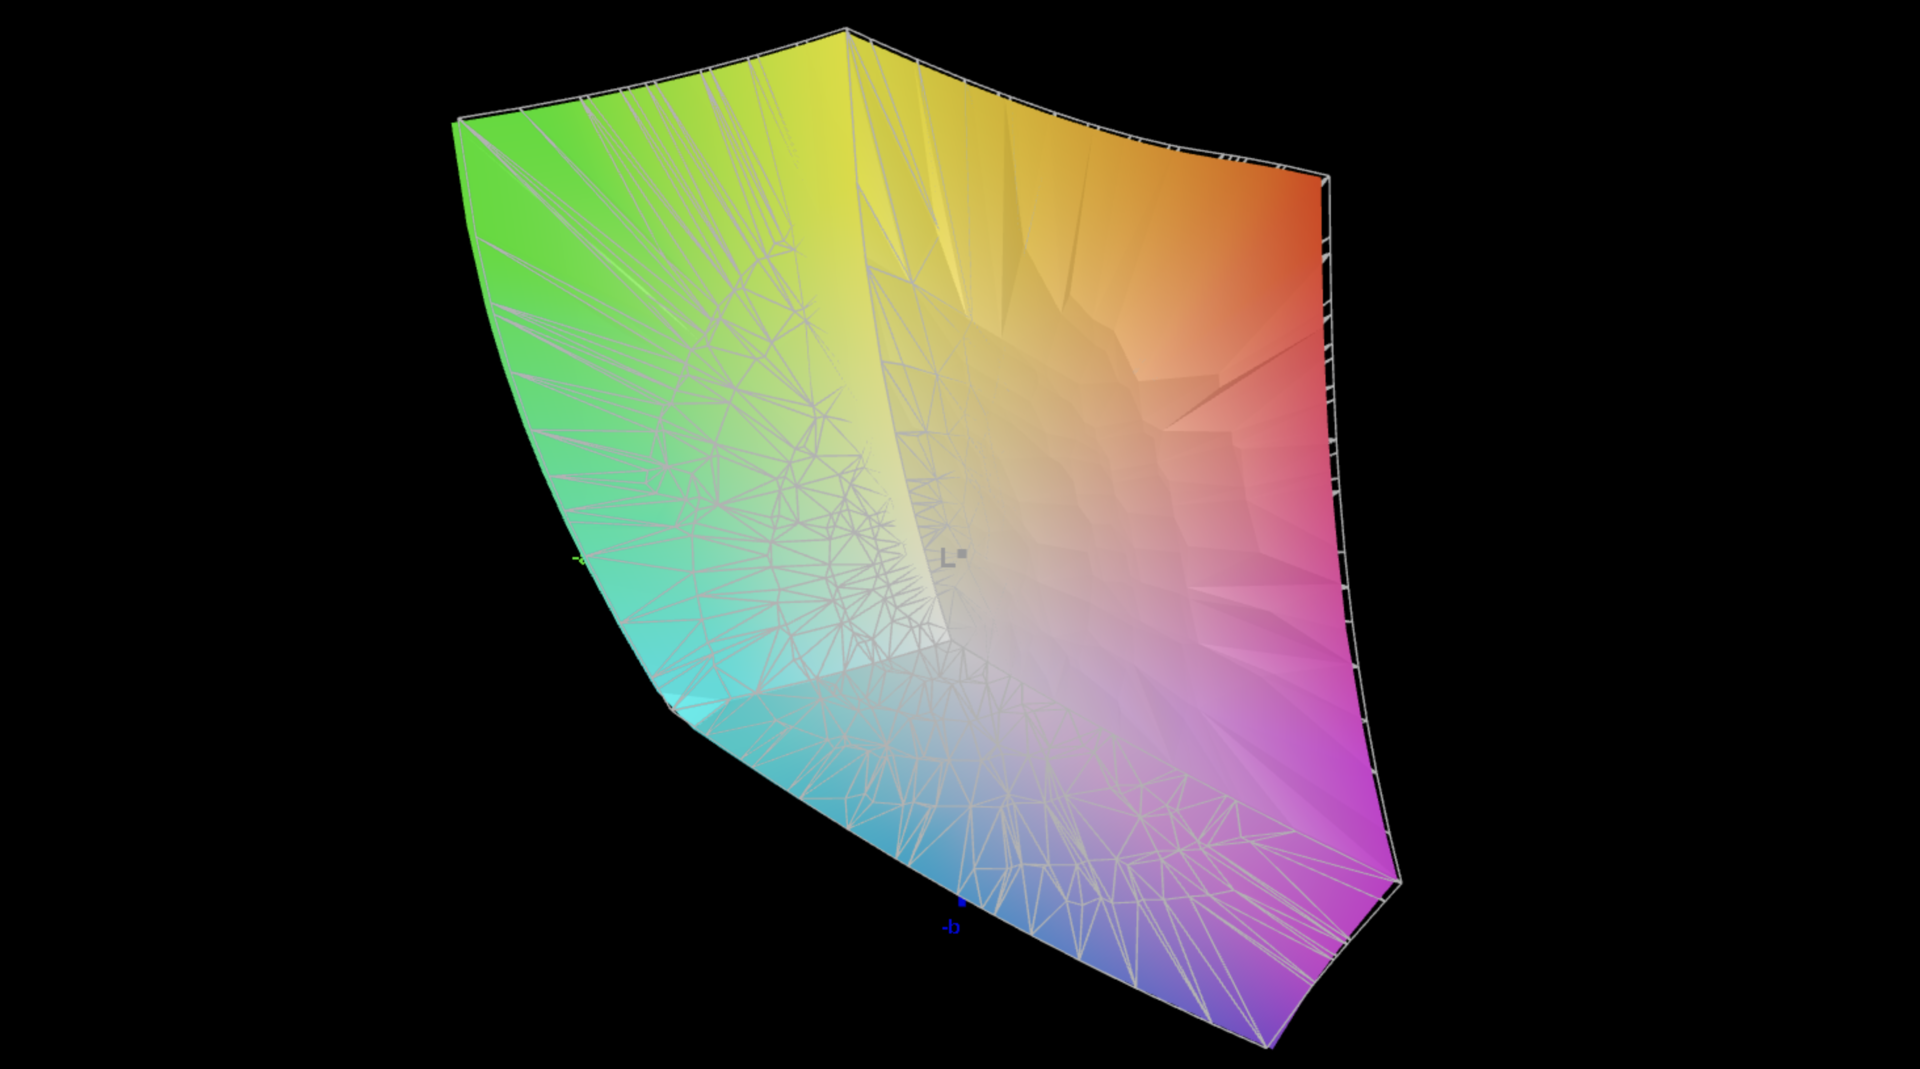
87.8% AdobeRGB 1998 (Argyll 3D)
100% sRGB (Argyll 3D)
98.3% Display P3 (Argyll 3D)
Gamma: 2.14
CCT: 6680 K
| Dell XPS 16 9640 SDC4196, OLED, 3840x2400, 16.3" | Samsung Galaxy Book4 Ultra ATNA60CL07-0, OLED, 2880x1800, 16" | Honor MagicBook Pro 16 2024 TL160MDMP01, IPS, 3072x1920, 16" | Asus ROG Zephyrus G16 2024 GU605M ATNA60DL01-0, OLED, 2560x1600, 16" | Lenovo Yoga Pro 9 16-IRP G8 LEN160-3.2K, Mini-LED, 3200x2000, 16" | Schenker VISION 16 Pro (M23) NE160QDM-NZ1, IPS, 2560x1600, 16" | Dell XPS 15 9530 RTX 4070 Samsung 156XG01, OLED, 3456x2160, 15.6" | |
|---|---|---|---|---|---|---|---|
| Display | 0% | 1% | 4% | 2% | -17% | 5% | |
| Display P3 Coverage (%) | 98.3 | 98.6 0% | 98.8 1% | 99.9 2% | 97 -1% | 68.8 -30% | 99.8 2% |
| sRGB Coverage (%) | 100 | 99.9 0% | 100 0% | 100 0% | 99.8 0% | 98.8 -1% | 100 0% |
| AdobeRGB 1998 Coverage (%) | 87.8 | 88.5 1% | 89.1 1% | 96.9 10% | 95.1 8% | 70 -20% | 98.4 12% |
| Response Times | 27% | -614% | 72% | -1295% | -1212% | -117% | |
| Response Time Grey 50% / Grey 80% * (ms) | 0.82 ? | 0.54 ? 34% | 6.3 ? -668% | 0.22 ? 73% | 14 ? -1607% | 13.7 ? -1571% | 1.68 ? -105% |
| Response Time Black / White * (ms) | 0.85 ? | 0.69 ? 19% | 5.6 ? -559% | 0.25 ? 71% | 9.2 ? -982% | 8.1 ? -853% | 1.94 ? -128% |
| PWM Frequency (Hz) | 360 ? | 240 ? | 960 ? | 5800 ? | 239 | ||
| Screen | 6% | 5% | 4% | 22% | -58% | -64% | |
| Brightness middle (cd/m²) | 366 | 390 7% | 551 51% | 416 14% | 539 47% | 384 5% | 389.5 6% |
| Brightness (cd/m²) | 367 | 393 7% | 524 43% | 418 14% | 546 49% | 371 1% | 392 7% |
| Brightness Distribution (%) | 96 | 98 2% | 91 -5% | 96 0% | 96 0% | 88 -8% | 98 2% |
| Black Level * (cd/m²) | 0.52 | 0.18 | 0.3 | ||||
| Colorchecker dE 2000 * | 1.3 | 1.4 -8% | 1.7 -31% | 1.6 -23% | 1.4 -8% | 3.4 -162% | 4.95 -281% |
| Colorchecker dE 2000 max. * | 3.6 | 2.7 25% | 4.1 -14% | 2.1 42% | 2.1 42% | 9.2 -156% | 8.65 -140% |
| Colorchecker dE 2000 calibrated * | 1 | 1 -0% | 1.3 -30% | 1.53 -53% | |||
| Greyscale dE 2000 * | 2.2 | 2.1 5% | 2.4 -9% | 2.7 -23% | 2.2 -0% | 3.4 -55% | 2 9% |
| Gamma | 2.14 103% | 2.27 97% | 2.2 100% | 2.16 102% | 2.19 100% | 2.16 102% | 2.27 97% |
| CCT | 6680 97% | 6431 101% | 6842 95% | 6331 103% | 6479 100% | 7462 87% | 6265 104% |
| Contrast (:1) | 1060 | 2994 | 1280 | ||||
| Total Average (Program / Settings) | 11% /
8% | -203% /
-99% | 27% /
16% | -424% /
-223% | -429% /
-240% | -59% /
-56% |
* ... smaller is better

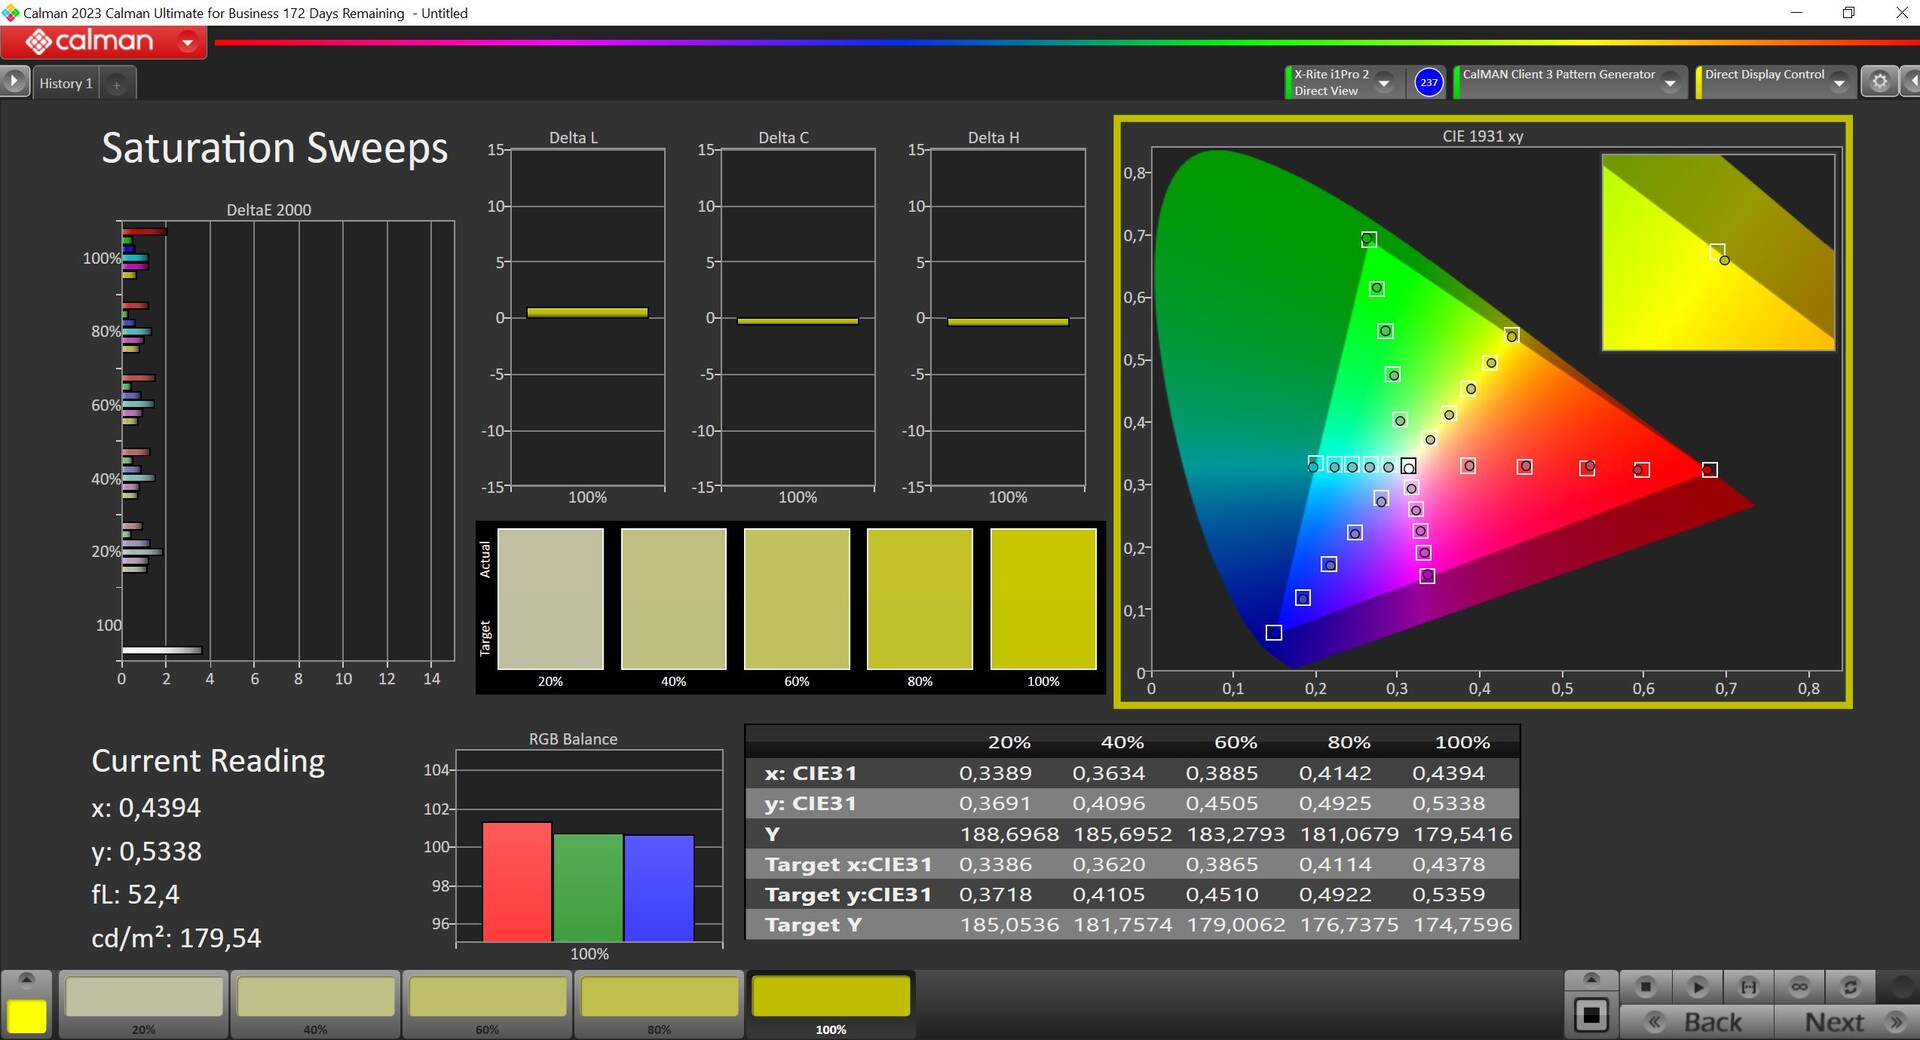

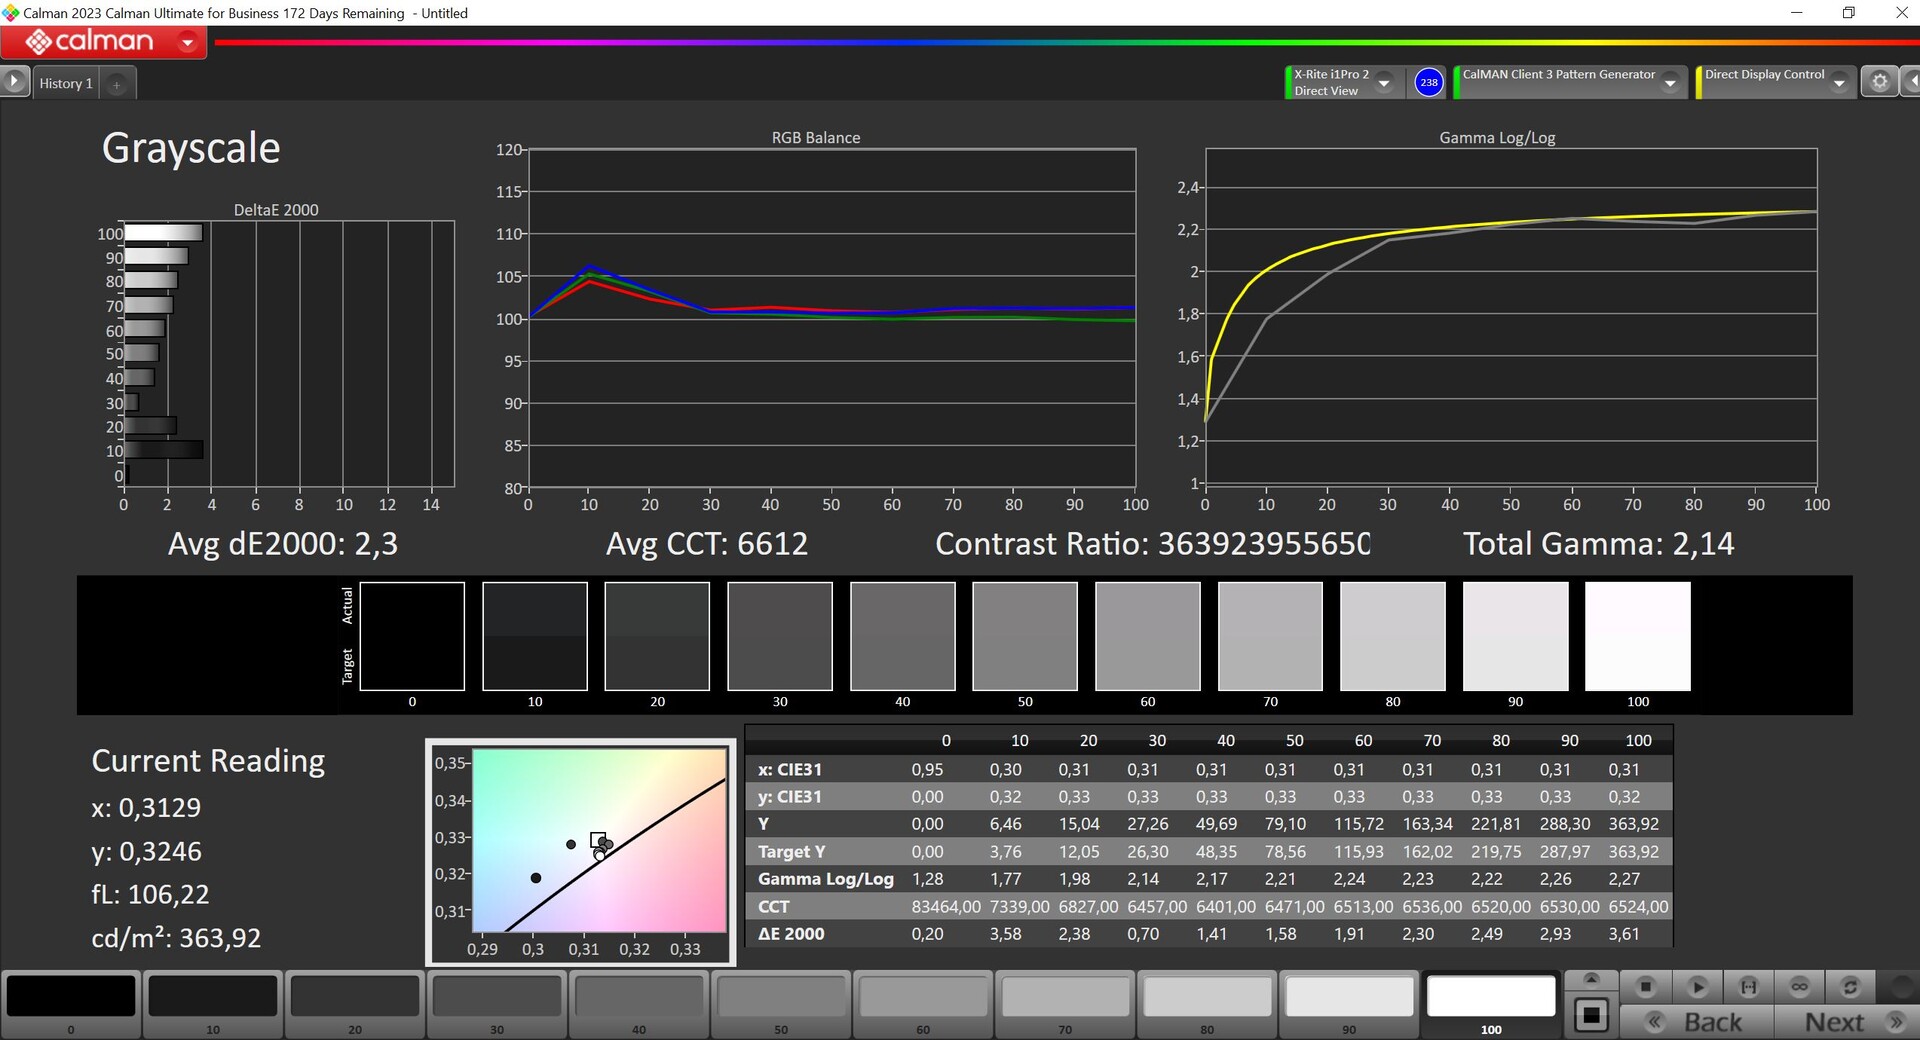
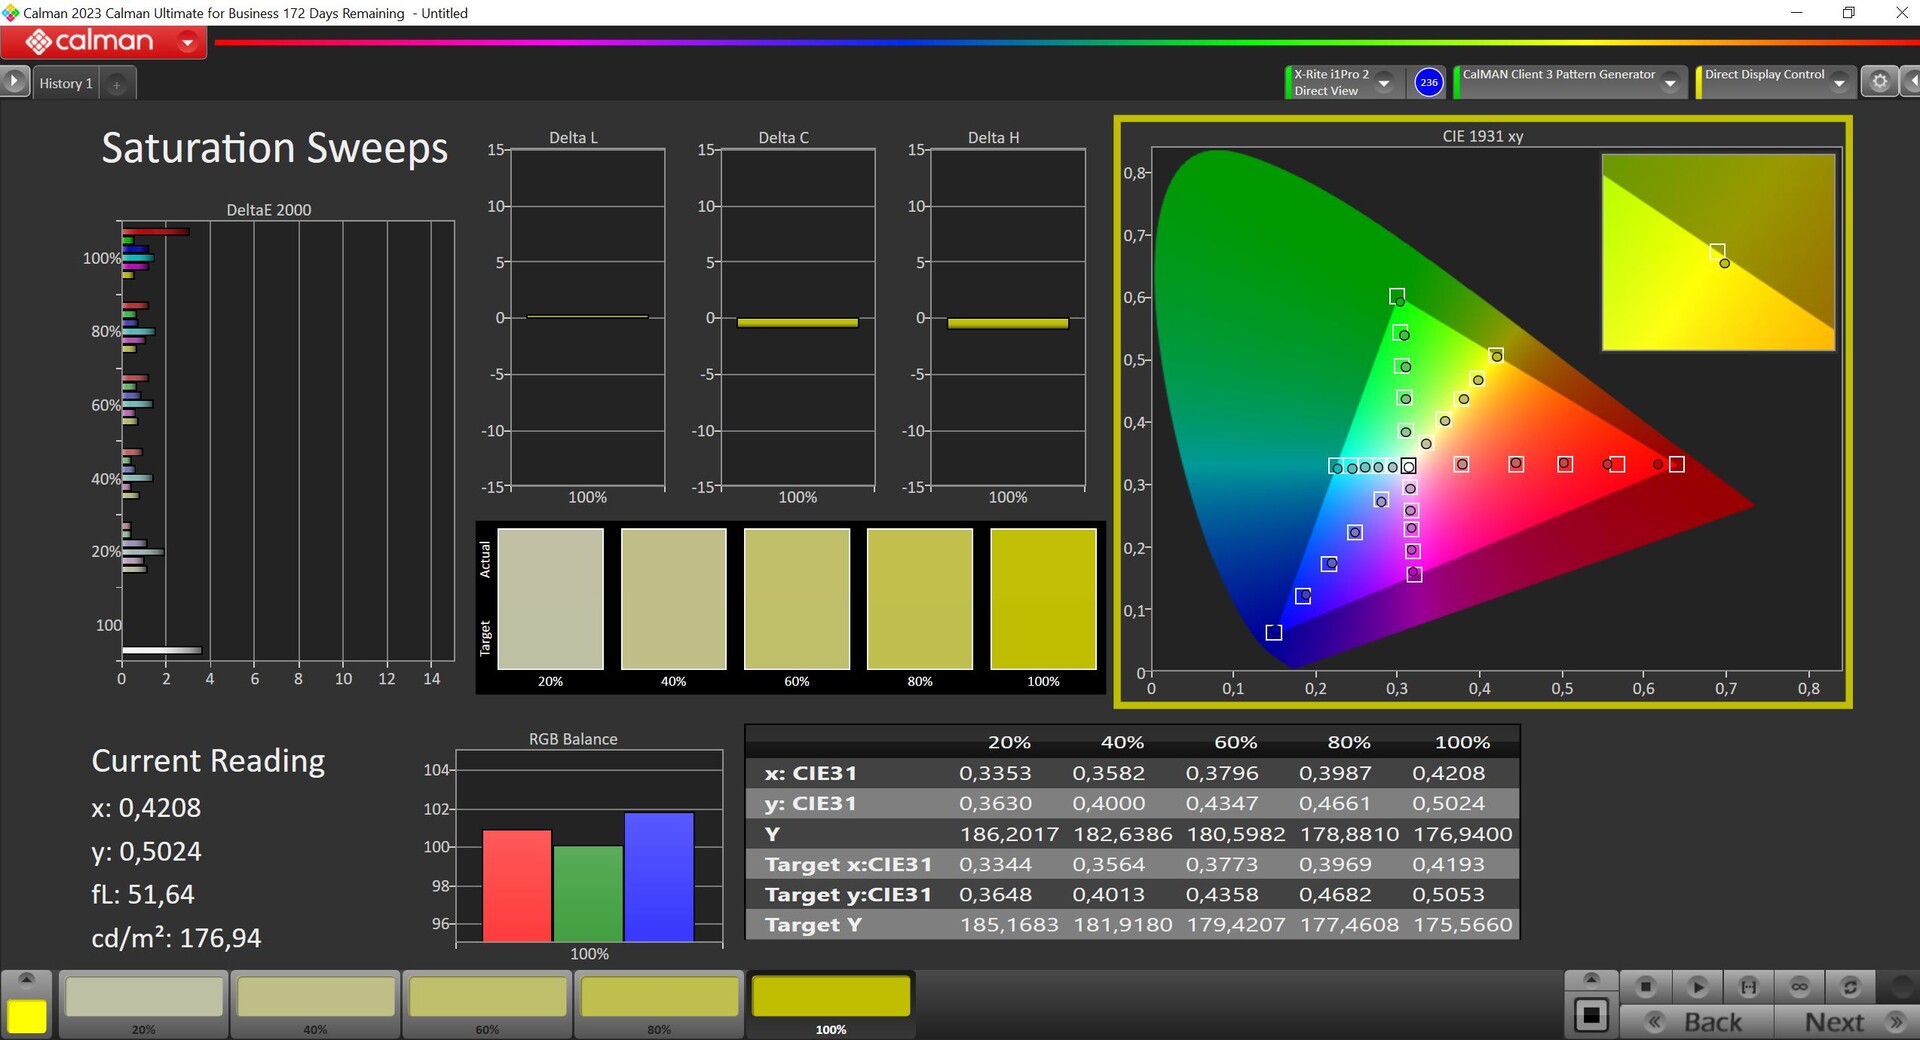

我们使用专业的 CalMAN 软件(X-Rite i1 Pro 2)对面板进行了分析。戴尔提供了不同的色彩配置文件,而预选配置文件Vivid已经提供了非常准确的色彩,只有灰色调仍有一些轻微偏差。使用我们自己的校准软件(您可以在上面免费下载相应的配置文件),我们可以进一步改善色彩描绘。如果你喜欢编辑照片,那么你会喜欢精确的配置文件Internet,它将色彩空间限制为 sRGB。


Display Response Times
| ↔ Response Time Black to White | ||
|---|---|---|
| 0.85 ms ... rise ↗ and fall ↘ combined | ↗ 0.46 ms rise | 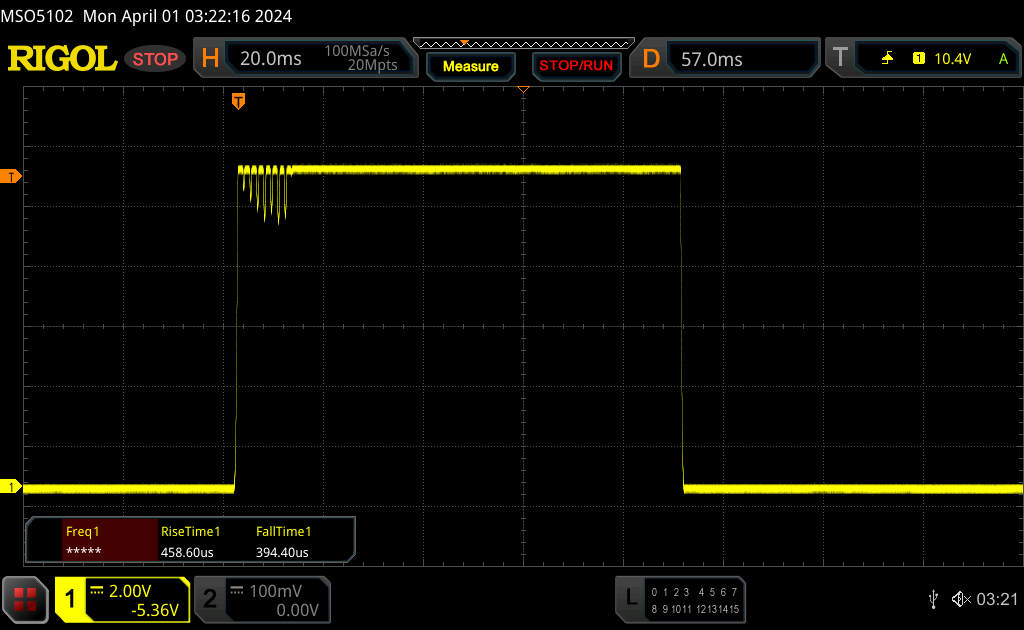 |
| ↘ 0.39 ms fall | ||
| The screen shows very fast response rates in our tests and should be very well suited for fast-paced gaming. In comparison, all tested devices range from 0.1 (minimum) to 240 (maximum) ms. » 3 % of all devices are better. This means that the measured response time is better than the average of all tested devices (19.8 ms). | ||
| ↔ Response Time 50% Grey to 80% Grey | ||
| 0.82 ms ... rise ↗ and fall ↘ combined | ↗ 0.43 ms rise | 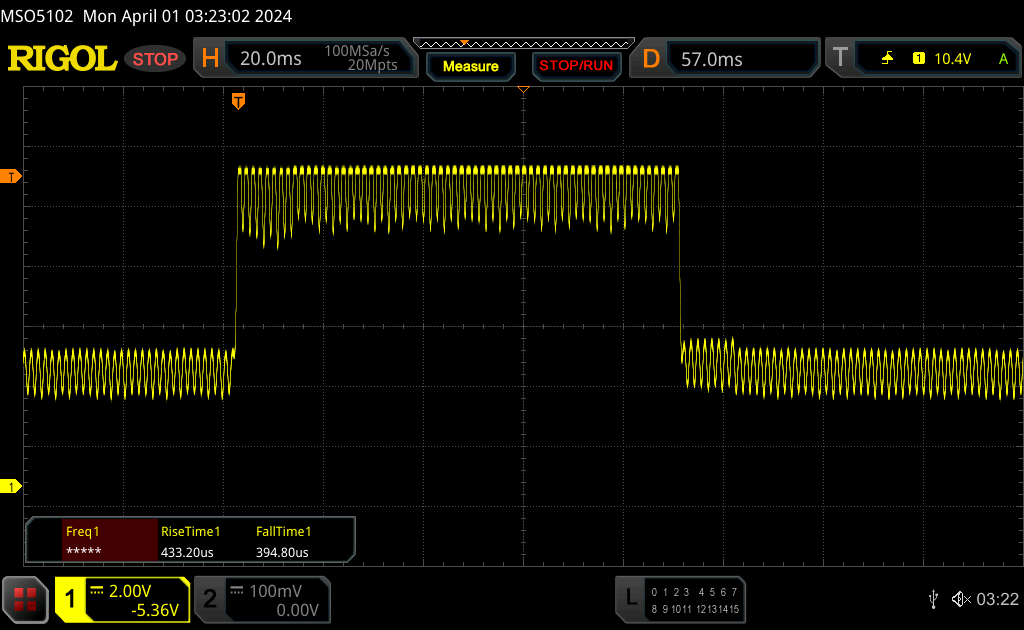 |
| ↘ 0.39 ms fall | ||
| The screen shows very fast response rates in our tests and should be very well suited for fast-paced gaming. In comparison, all tested devices range from 0.165 (minimum) to 636 (maximum) ms. » 3 % of all devices are better. This means that the measured response time is better than the average of all tested devices (31 ms). | ||
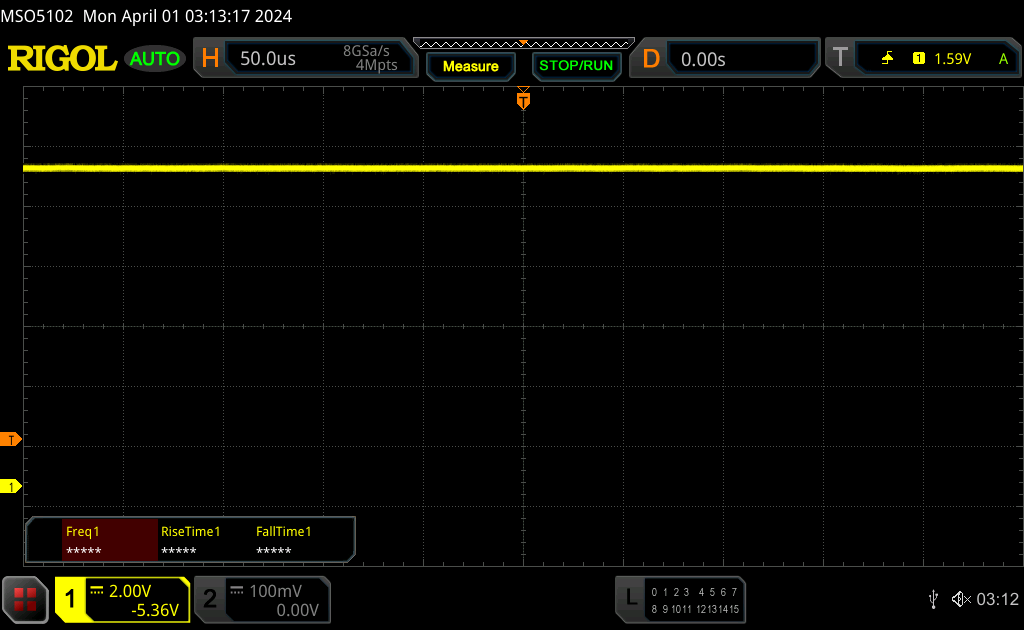
Screen Flickering / PWM (Pulse-Width Modulation)
| Screen flickering / PWM detected | 360 Hz | ≤ 90 % brightness setting | 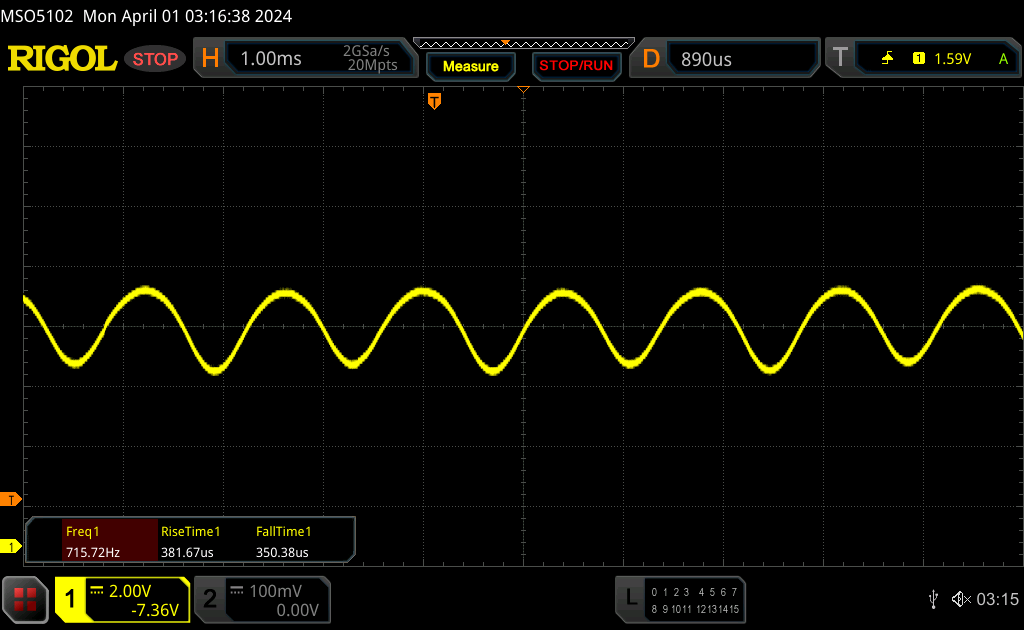 |
The display backlight flickers at 360 Hz (worst case, e.g., utilizing PWM) Flickering detected at a brightness setting of 90 % and below. There should be no flickering or PWM above this brightness setting. The frequency of 360 Hz is relatively high, so most users sensitive to PWM should not notice any flickering. However, there are reports that some users are still sensitive to PWM at 500 Hz and above, so be aware. In comparison: 52 % of all tested devices do not use PWM to dim the display. If PWM was detected, an average of 7757 (minimum: 5 - maximum: 343500) Hz was measured. | |||

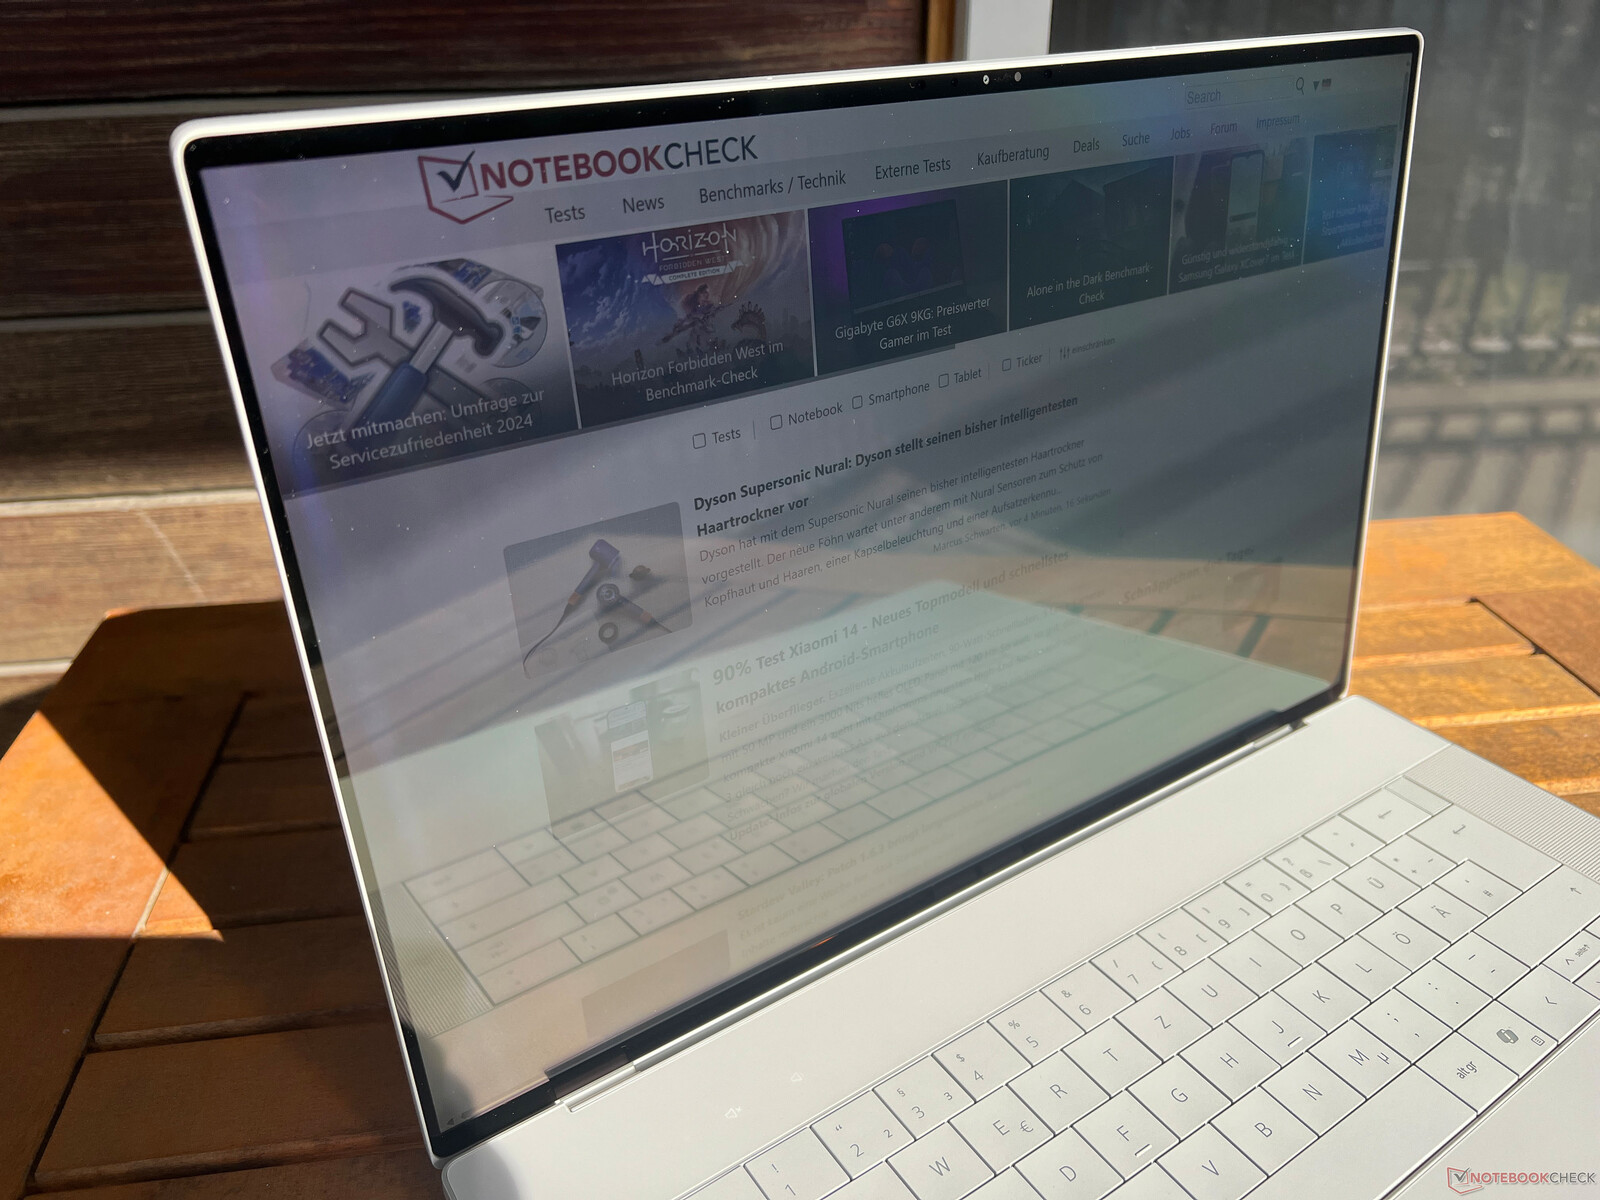
触摸屏非常容易反光,在室内也可能会出现反光问题。在室外,您也必须尽量避免光源或明亮表面的反射。在阴天使用笔记本电脑是可行的,但在阳光充足的大晴天可能会出现问题。它的视角稳定性通常很好,但如果屏幕中心偏离较大,就会出现典型的 OLED 蓝色光泽。

性能 - 配备高级 Optimus 和最高 64 GB 内存的 XPS 16
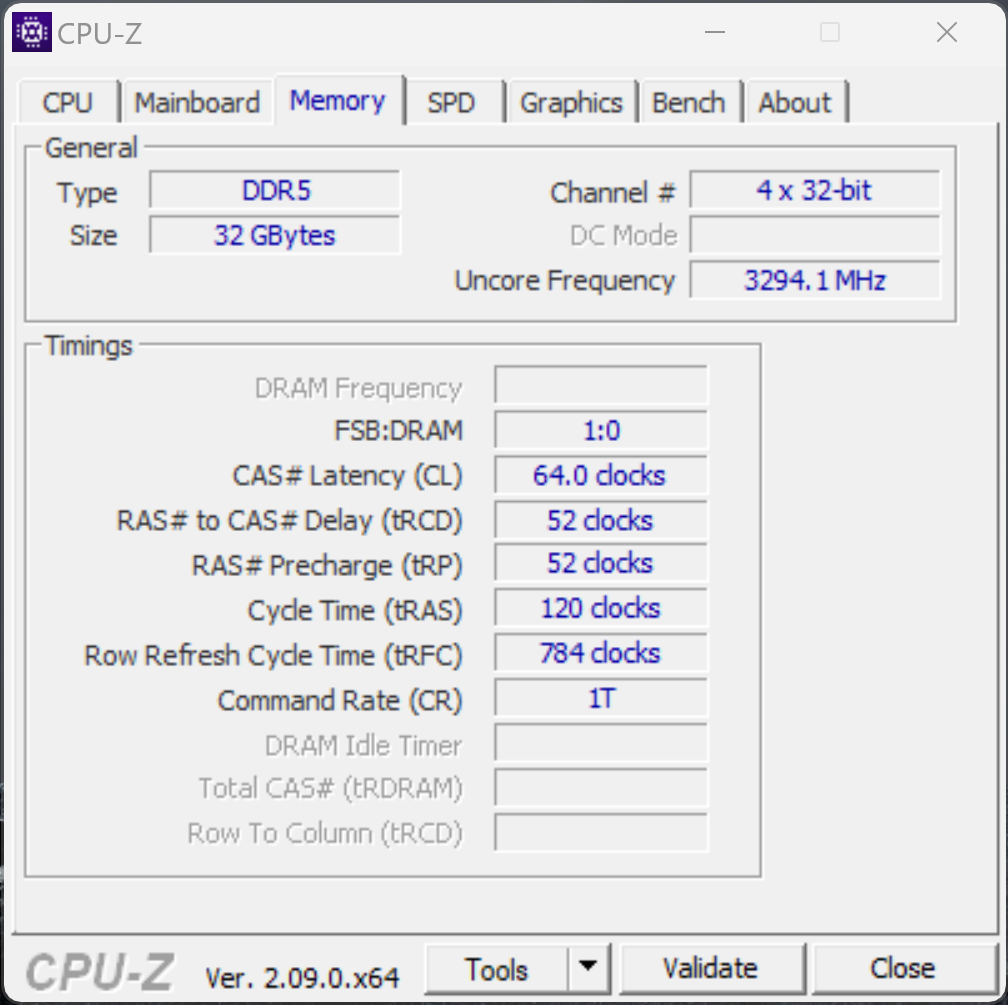
与较小的 XPS 14新款 XPS 16 可以不配置专用显卡,但必须与 16GB 内存(LPDDR5x-6400)配合使用。32 GB 内存只能与专用图形处理器一起使用,而速度更快的 LPDDR5x-7467 内存只能与 RTX 4070 笔记本电脑.如果您想要 64GB 内存,还必须选择 酷睿至尊 9 185H和至少 RTX 4060 笔记本电脑.XPS 16 配备了 MUX 交换机和高级 Optimus 图形交换机。
测试条件
戴尔允许用户选择各种能耗配置文件,这些配置文件还可以与 Windows 性能设置相结合。默认配置文件为 "优化",但只有使用 "超性能"模式才能充分发挥显卡的性能。由于使用这两种配置文件时风扇噪音排放非常相似,因此我们选择超性能模式进行基准测试和测量。
| 能源概况 | CPU 负载 | CB R23 Multi | GPU 负载 | Time Spy 图形 | 赛博朋克 2077 QHD Ultra |
最大风扇噪音排放 |
|---|---|---|---|---|---|---|
| 安静型 | 80 -> 75 瓦 | 18,296 点 | 50 瓦 | 8,186 点 | 30.8fps | 43.3 dB(A) |
| 优化型 | 80 -> 75 瓦 | 18,248 分 | 50 瓦 | 8,532 分 | 37.4fps | 48.1 dB(A) |
| 超高性能 | 100 -> 85 瓦 | 18,518 点 | 60 瓦 | 9,638 点 | 39.6fps | 49.7 dB(A) |
在测试过程中,我们遇到了图形切换过程中的一个错误,因为在全屏模式下,V-Sync 始终处于激活状态。而在窗口模式下,以及在图形驱动程序中手动选择 Nvidia GPU 时,就不会出现这个问题。在连接外接显示器时,正常的 Optimus 切换处于激活状态(因为所有 Thunderbolt 端口都通过英特尔 GPU 运行),问题也可以在这里找到。
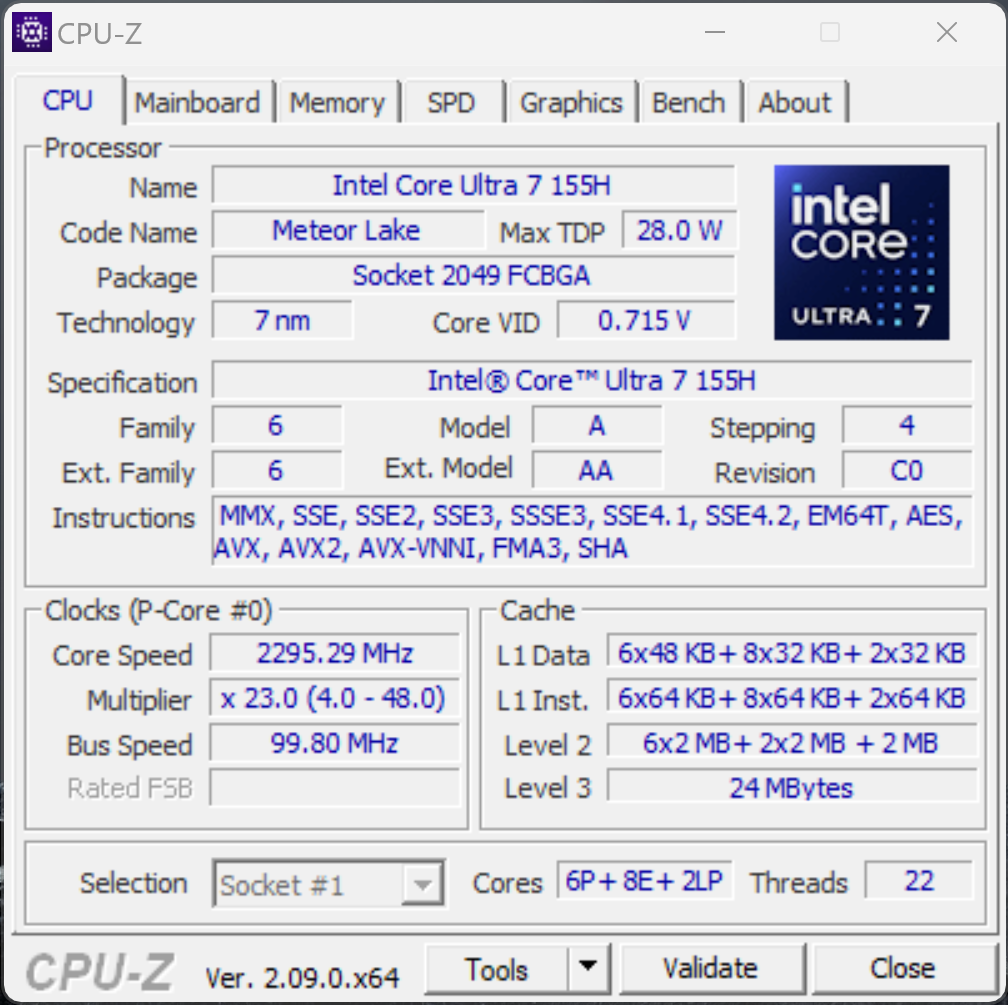
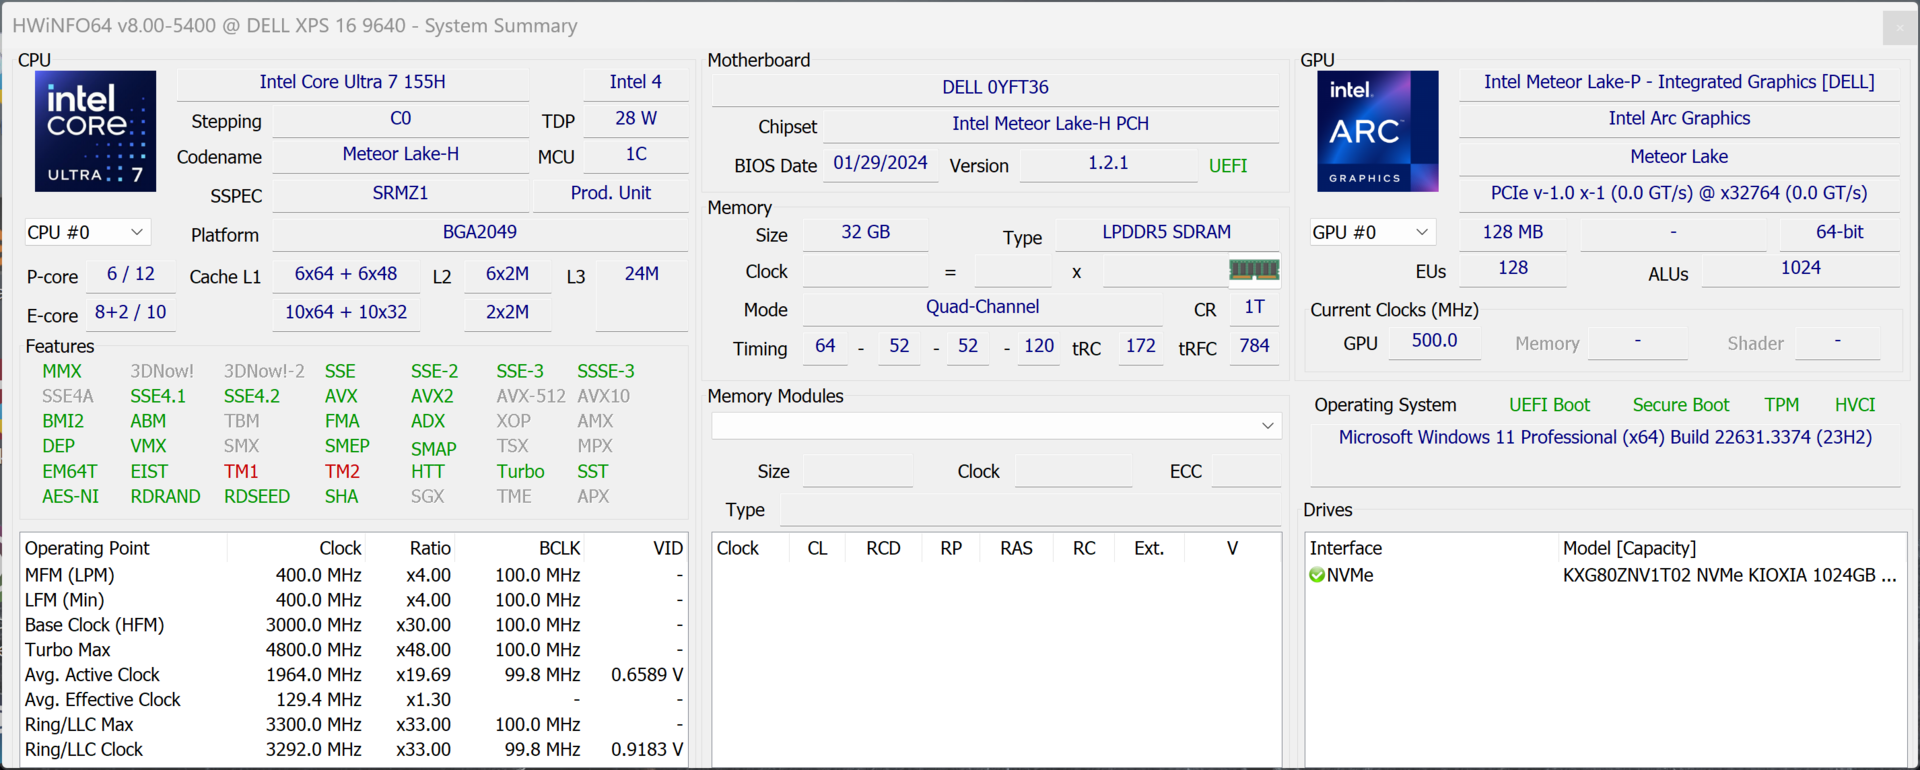
处理器 - Core Ultra 7 155H
酷睿至尊 7 155H 酷睿至尊 7 155H是英特尔当前新一代流星湖处理器的一部分,取代了旧的 酷睿 i7-13700H.它拥有 16 个内核(22 个线程),最高内核时钟频率可达 4.8 GHz。此外,由于其功耗限制较高(100/85 瓦),其整体多核性能也非常出色。不过,与老款 Raptor Lake 芯片相比,其性能几乎没有优势,单个设备之间的差异是由不同的功耗限制造成的。另一方面,在单核性能方面,新的 Meteor Lake 芯片与旧的 Raptor Lake 型号(如 13700H)相比略有劣势。在电池使用情况下,处理器允许消耗 75/45 瓦特(其中 75 瓦特可以保持相当长的时间),其多核性能仅下降约 4%。反过来,在长时间负载的情况下,差异会更大。更多 CPU 基准测试请参见 我们的技术部分。
Cinebench R15 Multi continuous test
Cinebench R23: Multi Core | Single Core
Cinebench R20: CPU (Multi Core) | CPU (Single Core)
Cinebench R15: CPU Multi 64Bit | CPU Single 64Bit
Blender: v2.79 BMW27 CPU
7-Zip 18.03: 7z b 4 | 7z b 4 -mmt1
Geekbench 6.7: Multi-Core | Single-Core
Geekbench 5.5: Multi-Core | Single-Core
HWBOT x265 Benchmark v2.2: 4k Preset
LibreOffice : 20 Documents To PDF
R Benchmark 2.5: Overall mean
| CPU Performance rating | |
| Lenovo Yoga Pro 9 16-IRP G8 | |
| Honor MagicBook Pro 16 2024 | |
| Dell XPS 16 9640 | |
| Average of class Multimedia | |
| Asus ROG Zephyrus G16 2024 GU605M | |
| Dell XPS 15 9530 RTX 4070 -2! | |
| Samsung Galaxy Book4 Ultra | |
| Schenker VISION 16 Pro (M23) -2! | |
| Average Intel Core Ultra 7 155H | |
| Cinebench R23 / Multi Core | |
| Lenovo Yoga Pro 9 16-IRP G8 | |
| Honor MagicBook Pro 16 2024 | |
| Dell XPS 16 9640 | |
| Asus ROG Zephyrus G16 2024 GU605M | |
| Average of class Multimedia (4861 - 33362, n=76, last 2 years) | |
| Samsung Galaxy Book4 Ultra | |
| Dell XPS 15 9530 RTX 4070 | |
| Average Intel Core Ultra 7 155H (9769 - 19007, n=52) | |
| Schenker VISION 16 Pro (M23) | |
| Cinebench R23 / Single Core | |
| Average of class Multimedia (1128 - 2459, n=68, last 2 years) | |
| Schenker VISION 16 Pro (M23) | |
| Lenovo Yoga Pro 9 16-IRP G8 | |
| Dell XPS 15 9530 RTX 4070 | |
| Dell XPS 16 9640 | |
| Samsung Galaxy Book4 Ultra | |
| Honor MagicBook Pro 16 2024 | |
| Average Intel Core Ultra 7 155H (1496 - 1815, n=52) | |
| Asus ROG Zephyrus G16 2024 GU605M | |
| Cinebench R20 / CPU (Multi Core) | |
| Lenovo Yoga Pro 9 16-IRP G8 | |
| Honor MagicBook Pro 16 2024 | |
| Dell XPS 16 9640 | |
| Asus ROG Zephyrus G16 2024 GU605M | |
| Average of class Multimedia (1887 - 12912, n=59, last 2 years) | |
| Samsung Galaxy Book4 Ultra | |
| Dell XPS 15 9530 RTX 4070 | |
| Average Intel Core Ultra 7 155H (3798 - 7409, n=50) | |
| Schenker VISION 16 Pro (M23) | |
| Cinebench R20 / CPU (Single Core) | |
| Lenovo Yoga Pro 9 16-IRP G8 | |
| Average of class Multimedia (425 - 853, n=59, last 2 years) | |
| Schenker VISION 16 Pro (M23) | |
| Dell XPS 15 9530 RTX 4070 | |
| Asus ROG Zephyrus G16 2024 GU605M | |
| Samsung Galaxy Book4 Ultra | |
| Honor MagicBook Pro 16 2024 | |
| Dell XPS 16 9640 | |
| Average Intel Core Ultra 7 155H (601 - 696, n=50) | |
| Cinebench R15 / CPU Multi 64Bit | |
| Lenovo Yoga Pro 9 16-IRP G8 | |
| Honor MagicBook Pro 16 2024 | |
| Dell XPS 16 9640 | |
| Asus ROG Zephyrus G16 2024 GU605M | |
| Dell XPS 15 9530 RTX 4070 | |
| Average of class Multimedia (856 - 5224, n=63, last 2 years) | |
| Samsung Galaxy Book4 Ultra | |
| Average Intel Core Ultra 7 155H (1932 - 2880, n=56) | |
| Schenker VISION 16 Pro (M23) | |
| Cinebench R15 / CPU Single 64Bit | |
| Average of class Multimedia (184.8 - 326, n=61, last 2 years) | |
| Schenker VISION 16 Pro (M23) | |
| Lenovo Yoga Pro 9 16-IRP G8 | |
| Dell XPS 15 9530 RTX 4070 | |
| Honor MagicBook Pro 16 2024 | |
| Asus ROG Zephyrus G16 2024 GU605M | |
| Dell XPS 16 9640 | |
| Samsung Galaxy Book4 Ultra | |
| Average Intel Core Ultra 7 155H (99.6 - 268, n=52) | |
| Blender / v2.79 BMW27 CPU | |
| Average of class Multimedia (100 - 557, n=60, last 2 years) | |
| Average Intel Core Ultra 7 155H (175 - 381, n=47) | |
| Schenker VISION 16 Pro (M23) | |
| Samsung Galaxy Book4 Ultra | |
| Dell XPS 15 9530 RTX 4070 | |
| Asus ROG Zephyrus G16 2024 GU605M | |
| Honor MagicBook Pro 16 2024 | |
| Dell XPS 16 9640 | |
| Lenovo Yoga Pro 9 16-IRP G8 | |
| 7-Zip 18.03 / 7z b 4 | |
| Lenovo Yoga Pro 9 16-IRP G8 | |
| Dell XPS 16 9640 | |
| Honor MagicBook Pro 16 2024 | |
| Asus ROG Zephyrus G16 2024 GU605M | |
| Samsung Galaxy Book4 Ultra | |
| Schenker VISION 16 Pro (M23) | |
| Dell XPS 15 9530 RTX 4070 | |
| Average Intel Core Ultra 7 155H (41739 - 70254, n=50) | |
| Average of class Multimedia (26062 - 130368, n=57, last 2 years) | |
| 7-Zip 18.03 / 7z b 4 -mmt1 | |
| Schenker VISION 16 Pro (M23) | |
| Dell XPS 15 9530 RTX 4070 | |
| Lenovo Yoga Pro 9 16-IRP G8 | |
| Average of class Multimedia (3666 - 7545, n=58, last 2 years) | |
| Samsung Galaxy Book4 Ultra | |
| Honor MagicBook Pro 16 2024 | |
| Dell XPS 16 9640 | |
| Asus ROG Zephyrus G16 2024 GU605M | |
| Average Intel Core Ultra 7 155H (4594 - 5621, n=50) | |
| Geekbench 6.7 / Multi-Core | |
| Average of class Multimedia (4983 - 29415, n=71, last 2 years) | |
| Lenovo Yoga Pro 9 16-IRP G8 | |
| Dell XPS 16 9640 | |
| Asus ROG Zephyrus G16 2024 GU605M | |
| Honor MagicBook Pro 16 2024 | |
| Samsung Galaxy Book4 Ultra | |
| Average Intel Core Ultra 7 155H (7732 - 13656, n=55) | |
| Geekbench 6.7 / Single-Core | |
| Average of class Multimedia (1534 - 4335, n=70, last 2 years) | |
| Lenovo Yoga Pro 9 16-IRP G8 | |
| Honor MagicBook Pro 16 2024 | |
| Samsung Galaxy Book4 Ultra | |
| Dell XPS 16 9640 | |
| Asus ROG Zephyrus G16 2024 GU605M | |
| Average Intel Core Ultra 7 155H (1901 - 2473, n=52) | |
| Geekbench 5.5 / Multi-Core | |
| Lenovo Yoga Pro 9 16-IRP G8 | |
| Dell XPS 16 9640 | |
| Dell XPS 15 9530 RTX 4070 | |
| Honor MagicBook Pro 16 2024 | |
| Average of class Multimedia (4652 - 20422, n=58, last 2 years) | |
| Asus ROG Zephyrus G16 2024 GU605M | |
| Samsung Galaxy Book4 Ultra | |
| Average Intel Core Ultra 7 155H (10017 - 13556, n=52) | |
| Schenker VISION 16 Pro (M23) | |
| Geekbench 5.5 / Single-Core | |
| Average of class Multimedia (805 - 2974, n=58, last 2 years) | |
| Dell XPS 15 9530 RTX 4070 | |
| Schenker VISION 16 Pro (M23) | |
| Samsung Galaxy Book4 Ultra | |
| Honor MagicBook Pro 16 2024 | |
| Lenovo Yoga Pro 9 16-IRP G8 | |
| Dell XPS 16 9640 | |
| Asus ROG Zephyrus G16 2024 GU605M | |
| Average Intel Core Ultra 7 155H (1462 - 1824, n=52) | |
| HWBOT x265 Benchmark v2.2 / 4k Preset | |
| Lenovo Yoga Pro 9 16-IRP G8 | |
| Dell XPS 16 9640 | |
| Honor MagicBook Pro 16 2024 | |
| Asus ROG Zephyrus G16 2024 GU605M | |
| Average of class Multimedia (5.26 - 36.1, n=58, last 2 years) | |
| Dell XPS 15 9530 RTX 4070 | |
| Samsung Galaxy Book4 Ultra | |
| Schenker VISION 16 Pro (M23) | |
| Average Intel Core Ultra 7 155H (9.93 - 21.2, n=50) | |
| LibreOffice / 20 Documents To PDF | |
| Average of class Multimedia (23.9 - 146.7, n=59, last 2 years) | |
| Asus ROG Zephyrus G16 2024 GU605M | |
| Average Intel Core Ultra 7 155H (37.5 - 79.2, n=49) | |
| Lenovo Yoga Pro 9 16-IRP G8 | |
| Schenker VISION 16 Pro (M23) | |
| Honor MagicBook Pro 16 2024 | |
| Samsung Galaxy Book4 Ultra | |
| Dell XPS 16 9640 | |
| Dell XPS 15 9530 RTX 4070 | |
| R Benchmark 2.5 / Overall mean | |
| Dell XPS 16 9640 | |
| Average Intel Core Ultra 7 155H (0.4457 - 0.53, n=49) | |
| Samsung Galaxy Book4 Ultra | |
| Asus ROG Zephyrus G16 2024 GU605M | |
| Average of class Multimedia (0.3604 - 0.947, n=58, last 2 years) | |
| Honor MagicBook Pro 16 2024 | |
| Lenovo Yoga Pro 9 16-IRP G8 | |
| Dell XPS 15 9530 RTX 4070 | |
| Schenker VISION 16 Pro (M23) | |
* ... smaller is better
AIDA64: FP32 Ray-Trace | FPU Julia | CPU SHA3 | CPU Queen | FPU SinJulia | FPU Mandel | CPU AES | CPU ZLib | FP64 Ray-Trace | CPU PhotoWorxx
| Performance rating | |
| Honor MagicBook Pro 16 2024 | |
| Lenovo Yoga Pro 9 16-IRP G8 | |
| Dell XPS 16 9640 | |
| Asus ROG Zephyrus G16 2024 GU605M | |
| Average of class Multimedia | |
| Samsung Galaxy Book4 Ultra | |
| Schenker VISION 16 Pro (M23) | |
| Dell XPS 15 9530 RTX 4070 | |
| Average Intel Core Ultra 7 155H | |
| AIDA64 / FP32 Ray-Trace | |
| Average of class Multimedia (2214 - 50388, n=55, last 2 years) | |
| Lenovo Yoga Pro 9 16-IRP G8 | |
| Honor MagicBook Pro 16 2024 | |
| Dell XPS 16 9640 | |
| Asus ROG Zephyrus G16 2024 GU605M | |
| Dell XPS 15 9530 RTX 4070 | |
| Samsung Galaxy Book4 Ultra | |
| Schenker VISION 16 Pro (M23) | |
| Average Intel Core Ultra 7 155H (6670 - 18470, n=50) | |
| AIDA64 / FPU Julia | |
| Honor MagicBook Pro 16 2024 | |
| Lenovo Yoga Pro 9 16-IRP G8 | |
| Dell XPS 16 9640 | |
| Asus ROG Zephyrus G16 2024 GU605M | |
| Average of class Multimedia (12867 - 201874, n=56, last 2 years) | |
| Samsung Galaxy Book4 Ultra | |
| Schenker VISION 16 Pro (M23) | |
| Average Intel Core Ultra 7 155H (40905 - 93181, n=50) | |
| Dell XPS 15 9530 RTX 4070 | |
| AIDA64 / CPU SHA3 | |
| Honor MagicBook Pro 16 2024 | |
| Lenovo Yoga Pro 9 16-IRP G8 | |
| Dell XPS 16 9640 | |
| Average of class Multimedia (626 - 8623, n=56, last 2 years) | |
| Asus ROG Zephyrus G16 2024 GU605M | |
| Samsung Galaxy Book4 Ultra | |
| Average Intel Core Ultra 7 155H (1940 - 4436, n=50) | |
| Schenker VISION 16 Pro (M23) | |
| Dell XPS 15 9530 RTX 4070 | |
| AIDA64 / CPU Queen | |
| Lenovo Yoga Pro 9 16-IRP G8 | |
| Dell XPS 15 9530 RTX 4070 | |
| Schenker VISION 16 Pro (M23) | |
| Asus ROG Zephyrus G16 2024 GU605M | |
| Dell XPS 16 9640 | |
| Samsung Galaxy Book4 Ultra | |
| Honor MagicBook Pro 16 2024 | |
| Average Intel Core Ultra 7 155H (64698 - 94181, n=50) | |
| Average of class Multimedia (13483 - 181505, n=43, last 2 years) | |
| AIDA64 / FPU SinJulia | |
| Lenovo Yoga Pro 9 16-IRP G8 | |
| Asus ROG Zephyrus G16 2024 GU605M | |
| Honor MagicBook Pro 16 2024 | |
| Dell XPS 16 9640 | |
| Samsung Galaxy Book4 Ultra | |
| Average Intel Core Ultra 7 155H (5639 - 10647, n=50) | |
| Schenker VISION 16 Pro (M23) | |
| Average of class Multimedia (886 - 28794, n=56, last 2 years) | |
| Dell XPS 15 9530 RTX 4070 | |
| AIDA64 / FPU Mandel | |
| Dell XPS 16 9640 | |
| Honor MagicBook Pro 16 2024 | |
| Average of class Multimedia (6395 - 105740, n=55, last 2 years) | |
| Lenovo Yoga Pro 9 16-IRP G8 | |
| Asus ROG Zephyrus G16 2024 GU605M | |
| Samsung Galaxy Book4 Ultra | |
| Average Intel Core Ultra 7 155H (18236 - 47685, n=50) | |
| Dell XPS 15 9530 RTX 4070 | |
| Schenker VISION 16 Pro (M23) | |
| AIDA64 / CPU AES | |
| Honor MagicBook Pro 16 2024 | |
| Lenovo Yoga Pro 9 16-IRP G8 | |
| Dell XPS 16 9640 | |
| Asus ROG Zephyrus G16 2024 GU605M | |
| Average Intel Core Ultra 7 155H (45713 - 152179, n=50) | |
| Samsung Galaxy Book4 Ultra | |
| Schenker VISION 16 Pro (M23) | |
| Average of class Multimedia (8171 - 126790, n=56, last 2 years) | |
| Dell XPS 15 9530 RTX 4070 | |
| AIDA64 / CPU ZLib | |
| Honor MagicBook Pro 16 2024 | |
| Lenovo Yoga Pro 9 16-IRP G8 | |
| Dell XPS 16 9640 | |
| Asus ROG Zephyrus G16 2024 GU605M | |
| Average of class Multimedia (143.8 - 2022, n=56, last 2 years) | |
| Samsung Galaxy Book4 Ultra | |
| Average Intel Core Ultra 7 155H (557 - 1250, n=50) | |
| Schenker VISION 16 Pro (M23) | |
| Dell XPS 15 9530 RTX 4070 | |
| AIDA64 / FP64 Ray-Trace | |
| Average of class Multimedia (1014 - 26875, n=56, last 2 years) | |
| Lenovo Yoga Pro 9 16-IRP G8 | |
| Dell XPS 16 9640 | |
| Honor MagicBook Pro 16 2024 | |
| Asus ROG Zephyrus G16 2024 GU605M | |
| Dell XPS 15 9530 RTX 4070 | |
| Schenker VISION 16 Pro (M23) | |
| Samsung Galaxy Book4 Ultra | |
| Average Intel Core Ultra 7 155H (3569 - 9802, n=50) | |
| AIDA64 / CPU PhotoWorxx | |
| Lenovo Yoga Pro 9 16-IRP G8 | |
| Dell XPS 16 9640 | |
| Samsung Galaxy Book4 Ultra | |
| Average of class Multimedia (8187 - 88154, n=56, last 2 years) | |
| Asus ROG Zephyrus G16 2024 GU605M | |
| Average Intel Core Ultra 7 155H (32719 - 54223, n=50) | |
| Honor MagicBook Pro 16 2024 | |
| Schenker VISION 16 Pro (M23) | |
| Dell XPS 15 9530 RTX 4070 | |
系统性能
在日常使用中,新款 XPS 16 9640 的响应速度非常快,我们在合成基准测试中也没有发现异常。我们在测试过程中没有遇到任何问题。
CrossMark: Overall | Productivity | Creativity | Responsiveness
WebXPRT 3: Overall
WebXPRT 4: Overall
Mozilla Kraken 1.1: Total
| PCMark 10 / Score | |
| Average of class Multimedia (4325 - 10386, n=54, last 2 years) | |
| Average Intel Core Ultra 7 155H, NVIDIA GeForce RTX 4070 Laptop GPU (7084 - 7761, n=4) | |
| Schenker VISION 16 Pro (M23) | |
| Lenovo Yoga Pro 9 16-IRP G8 | |
| Dell XPS 15 9530 RTX 4070 | |
| Asus ROG Zephyrus G16 2024 GU605M | |
| Dell XPS 16 9640 | |
| Samsung Galaxy Book4 Ultra | |
| Honor MagicBook Pro 16 2024 | |
| PCMark 10 / Essentials | |
| Dell XPS 15 9530 RTX 4070 | |
| Lenovo Yoga Pro 9 16-IRP G8 | |
| Schenker VISION 16 Pro (M23) | |
| Average of class Multimedia (8025 - 11664, n=53, last 2 years) | |
| Samsung Galaxy Book4 Ultra | |
| Dell XPS 16 9640 | |
| Average Intel Core Ultra 7 155H, NVIDIA GeForce RTX 4070 Laptop GPU (10038 - 10393, n=4) | |
| Asus ROG Zephyrus G16 2024 GU605M | |
| Honor MagicBook Pro 16 2024 | |
| PCMark 10 / Productivity | |
| Average of class Multimedia (7323 - 18233, n=53, last 2 years) | |
| Schenker VISION 16 Pro (M23) | |
| Average Intel Core Ultra 7 155H, NVIDIA GeForce RTX 4070 Laptop GPU (9192 - 9518, n=4) | |
| Asus ROG Zephyrus G16 2024 GU605M | |
| Dell XPS 16 9640 | |
| Samsung Galaxy Book4 Ultra | |
| Lenovo Yoga Pro 9 16-IRP G8 | |
| Dell XPS 15 9530 RTX 4070 | |
| Honor MagicBook Pro 16 2024 | |
| PCMark 10 / Digital Content Creation | |
| Average Intel Core Ultra 7 155H, NVIDIA GeForce RTX 4070 Laptop GPU (10100 - 13035, n=4) | |
| Lenovo Yoga Pro 9 16-IRP G8 | |
| Schenker VISION 16 Pro (M23) | |
| Honor MagicBook Pro 16 2024 | |
| Dell XPS 15 9530 RTX 4070 | |
| Asus ROG Zephyrus G16 2024 GU605M | |
| Average of class Multimedia (3651 - 16240, n=53, last 2 years) | |
| Dell XPS 16 9640 | |
| Samsung Galaxy Book4 Ultra | |
| CrossMark / Overall | |
| Schenker VISION 16 Pro (M23) | |
| Dell XPS 15 9530 RTX 4070 | |
| Average of class Multimedia (866 - 2728, n=62, last 2 years) | |
| Dell XPS 16 9640 | |
| Lenovo Yoga Pro 9 16-IRP G8 | |
| Average Intel Core Ultra 7 155H, NVIDIA GeForce RTX 4070 Laptop GPU (1687 - 1848, n=4) | |
| Samsung Galaxy Book4 Ultra | |
| Honor MagicBook Pro 16 2024 | |
| Asus ROG Zephyrus G16 2024 GU605M | |
| CrossMark / Productivity | |
| Schenker VISION 16 Pro (M23) | |
| Average of class Multimedia (931 - 2489, n=62, last 2 years) | |
| Dell XPS 15 9530 RTX 4070 | |
| Dell XPS 16 9640 | |
| Lenovo Yoga Pro 9 16-IRP G8 | |
| Honor MagicBook Pro 16 2024 | |
| Average Intel Core Ultra 7 155H, NVIDIA GeForce RTX 4070 Laptop GPU (1589 - 1750, n=4) | |
| Samsung Galaxy Book4 Ultra | |
| Asus ROG Zephyrus G16 2024 GU605M | |
| CrossMark / Creativity | |
| Average of class Multimedia (907 - 3465, n=62, last 2 years) | |
| Dell XPS 15 9530 RTX 4070 | |
| Lenovo Yoga Pro 9 16-IRP G8 | |
| Dell XPS 16 9640 | |
| Schenker VISION 16 Pro (M23) | |
| Asus ROG Zephyrus G16 2024 GU605M | |
| Average Intel Core Ultra 7 155H, NVIDIA GeForce RTX 4070 Laptop GPU (1860 - 2014, n=4) | |
| Samsung Galaxy Book4 Ultra | |
| Honor MagicBook Pro 16 2024 | |
| CrossMark / Responsiveness | |
| Schenker VISION 16 Pro (M23) | |
| Dell XPS 16 9640 | |
| Dell XPS 15 9530 RTX 4070 | |
| Honor MagicBook Pro 16 2024 | |
| Average Intel Core Ultra 7 155H, NVIDIA GeForce RTX 4070 Laptop GPU (1424 - 1683, n=4) | |
| Lenovo Yoga Pro 9 16-IRP G8 | |
| Average of class Multimedia (605 - 2024, n=62, last 2 years) | |
| Samsung Galaxy Book4 Ultra | |
| Asus ROG Zephyrus G16 2024 GU605M | |
| WebXPRT 3 / Overall | |
| Average of class Multimedia (136.4 - 596, n=65, last 2 years) | |
| Dell XPS 15 9530 RTX 4070 | |
| Schenker VISION 16 Pro (M23) | |
| Lenovo Yoga Pro 9 16-IRP G8 | |
| Honor MagicBook Pro 16 2024 | |
| Asus ROG Zephyrus G16 2024 GU605M | |
| Dell XPS 16 9640 | |
| Samsung Galaxy Book4 Ultra | |
| Average Intel Core Ultra 7 155H, NVIDIA GeForce RTX 4070 Laptop GPU (264 - 294, n=4) | |
| WebXPRT 4 / Overall | |
| Average of class Multimedia (167.3 - 402, n=67, last 2 years) | |
| Dell XPS 15 9530 RTX 4070 | |
| Schenker VISION 16 Pro (M23) | |
| Lenovo Yoga Pro 9 16-IRP G8 | |
| Honor MagicBook Pro 16 2024 | |
| Samsung Galaxy Book4 Ultra | |
| Asus ROG Zephyrus G16 2024 GU605M | |
| Dell XPS 16 9640 | |
| Average Intel Core Ultra 7 155H, NVIDIA GeForce RTX 4070 Laptop GPU (247 - 257, n=4) | |
| Mozilla Kraken 1.1 / Total | |
| Average Intel Core Ultra 7 155H, NVIDIA GeForce RTX 4070 Laptop GPU (546 - 568, n=3) | |
| Asus ROG Zephyrus G16 2024 GU605M | |
| Honor MagicBook Pro 16 2024 | |
| Lenovo Yoga Pro 9 16-IRP G8 | |
| Dell XPS 15 9530 RTX 4070 | |
| Schenker VISION 16 Pro (M23) | |
| Average of class Multimedia (228 - 835, n=68, last 2 years) | |
| Samsung Galaxy Book4 Ultra | |
* ... smaller is better
| PCMark 10 Score | 7084 points | |
Help | ||
| AIDA64 / Memory Copy | |
| Dell XPS 16 9640 | |
| Samsung Galaxy Book4 Ultra | |
| Asus ROG Zephyrus G16 2024 GU605M | |
| Honor MagicBook Pro 16 2024 | |
| Average Intel Core Ultra 7 155H (62397 - 96791, n=50) | |
| Average of class Multimedia (11299 - 132135, n=56, last 2 years) | |
| Lenovo Yoga Pro 9 16-IRP G8 | |
| Dell XPS 15 9530 RTX 4070 | |
| Schenker VISION 16 Pro (M23) | |
| AIDA64 / Memory Read | |
| Samsung Galaxy Book4 Ultra | |
| Asus ROG Zephyrus G16 2024 GU605M | |
| Dell XPS 16 9640 | |
| Average of class Multimedia (11624 - 174586, n=56, last 2 years) | |
| Average Intel Core Ultra 7 155H (60544 - 90647, n=50) | |
| Lenovo Yoga Pro 9 16-IRP G8 | |
| Honor MagicBook Pro 16 2024 | |
| Schenker VISION 16 Pro (M23) | |
| Dell XPS 15 9530 RTX 4070 | |
| AIDA64 / Memory Write | |
| Lenovo Yoga Pro 9 16-IRP G8 | |
| Average of class Multimedia (11755 - 134998, n=56, last 2 years) | |
| Honor MagicBook Pro 16 2024 | |
| Samsung Galaxy Book4 Ultra | |
| Dell XPS 16 9640 | |
| Asus ROG Zephyrus G16 2024 GU605M | |
| Average Intel Core Ultra 7 155H (58692 - 93451, n=50) | |
| Dell XPS 15 9530 RTX 4070 | |
| Schenker VISION 16 Pro (M23) | |
| AIDA64 / Memory Latency | |
| Average Intel Core Ultra 7 155H (116.2 - 233, n=50) | |
| Honor MagicBook Pro 16 2024 | |
| Samsung Galaxy Book4 Ultra | |
| Asus ROG Zephyrus G16 2024 GU605M | |
| Dell XPS 16 9640 | |
| Average of class Multimedia (7 - 535, n=55, last 2 years) | |
| Lenovo Yoga Pro 9 16-IRP G8 | |
| Dell XPS 15 9530 RTX 4070 | |
| Schenker VISION 16 Pro (M23) | |
* ... smaller is better
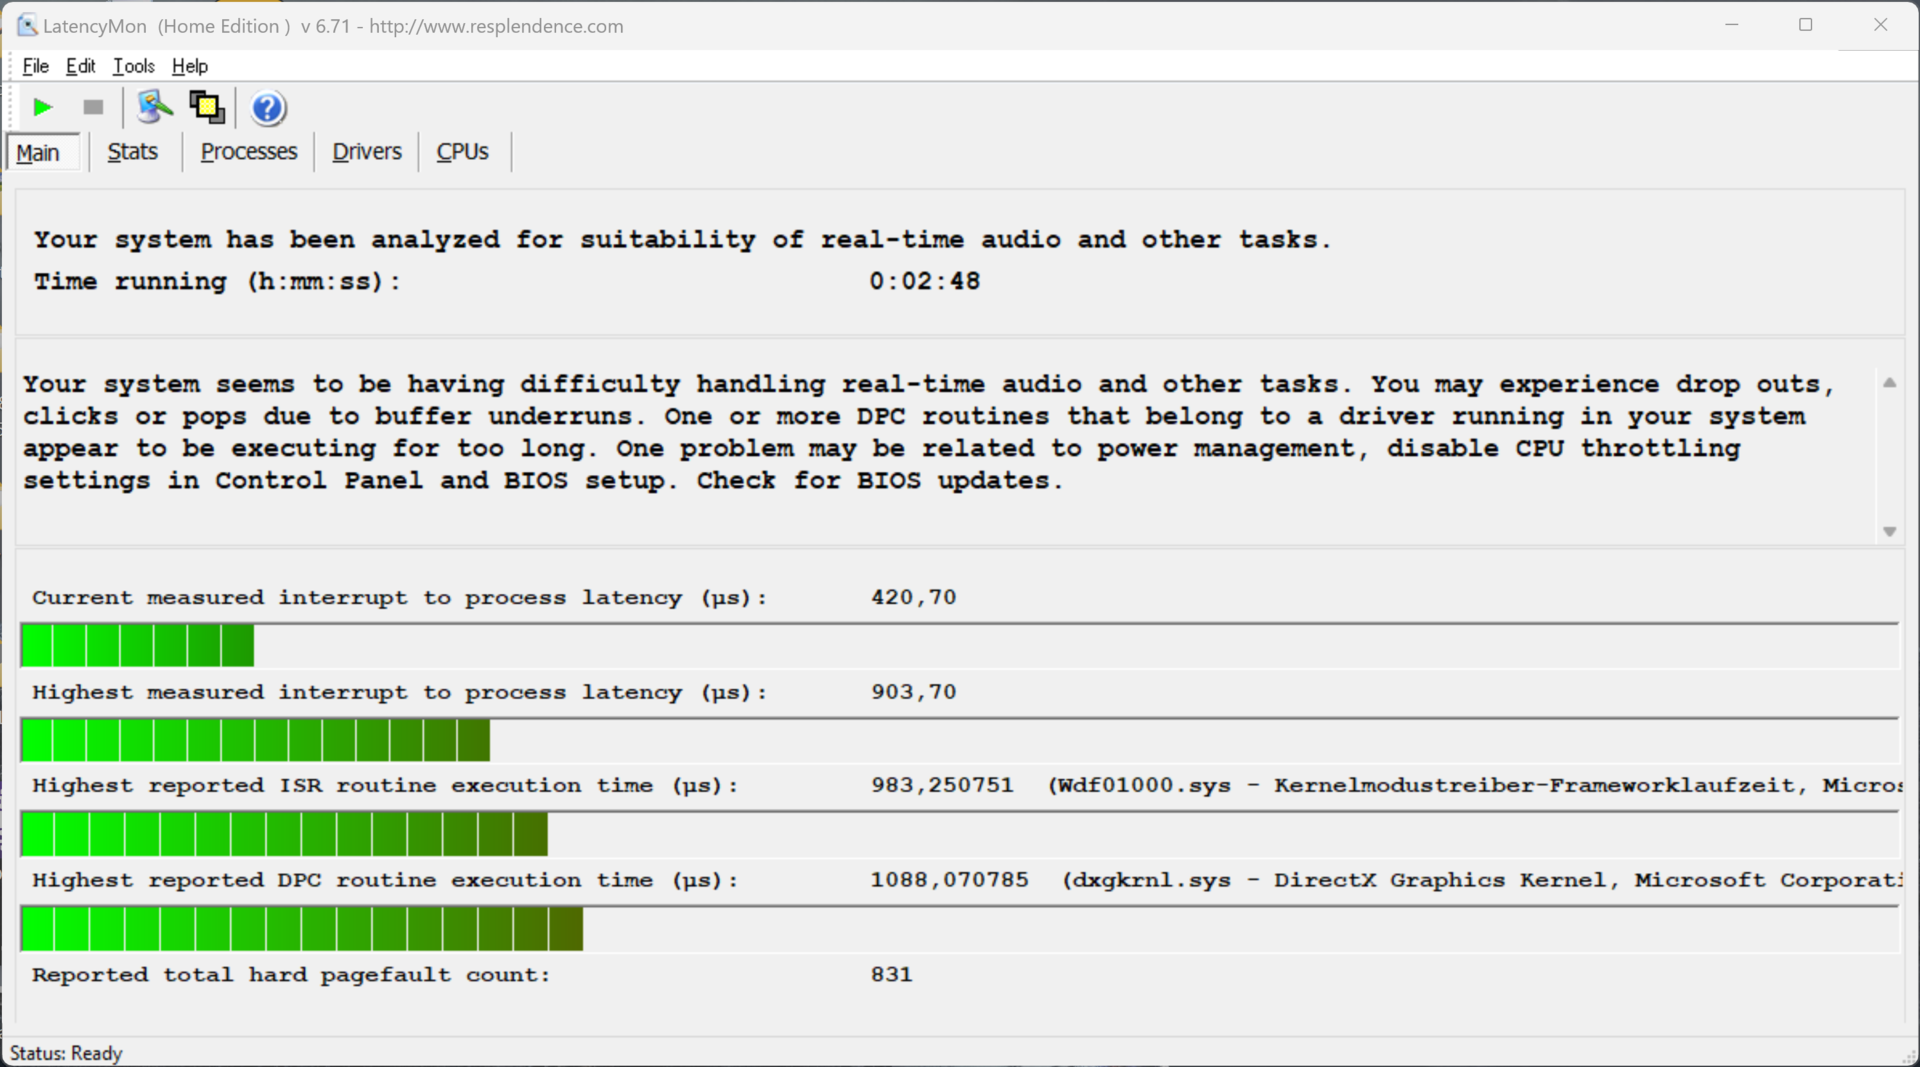
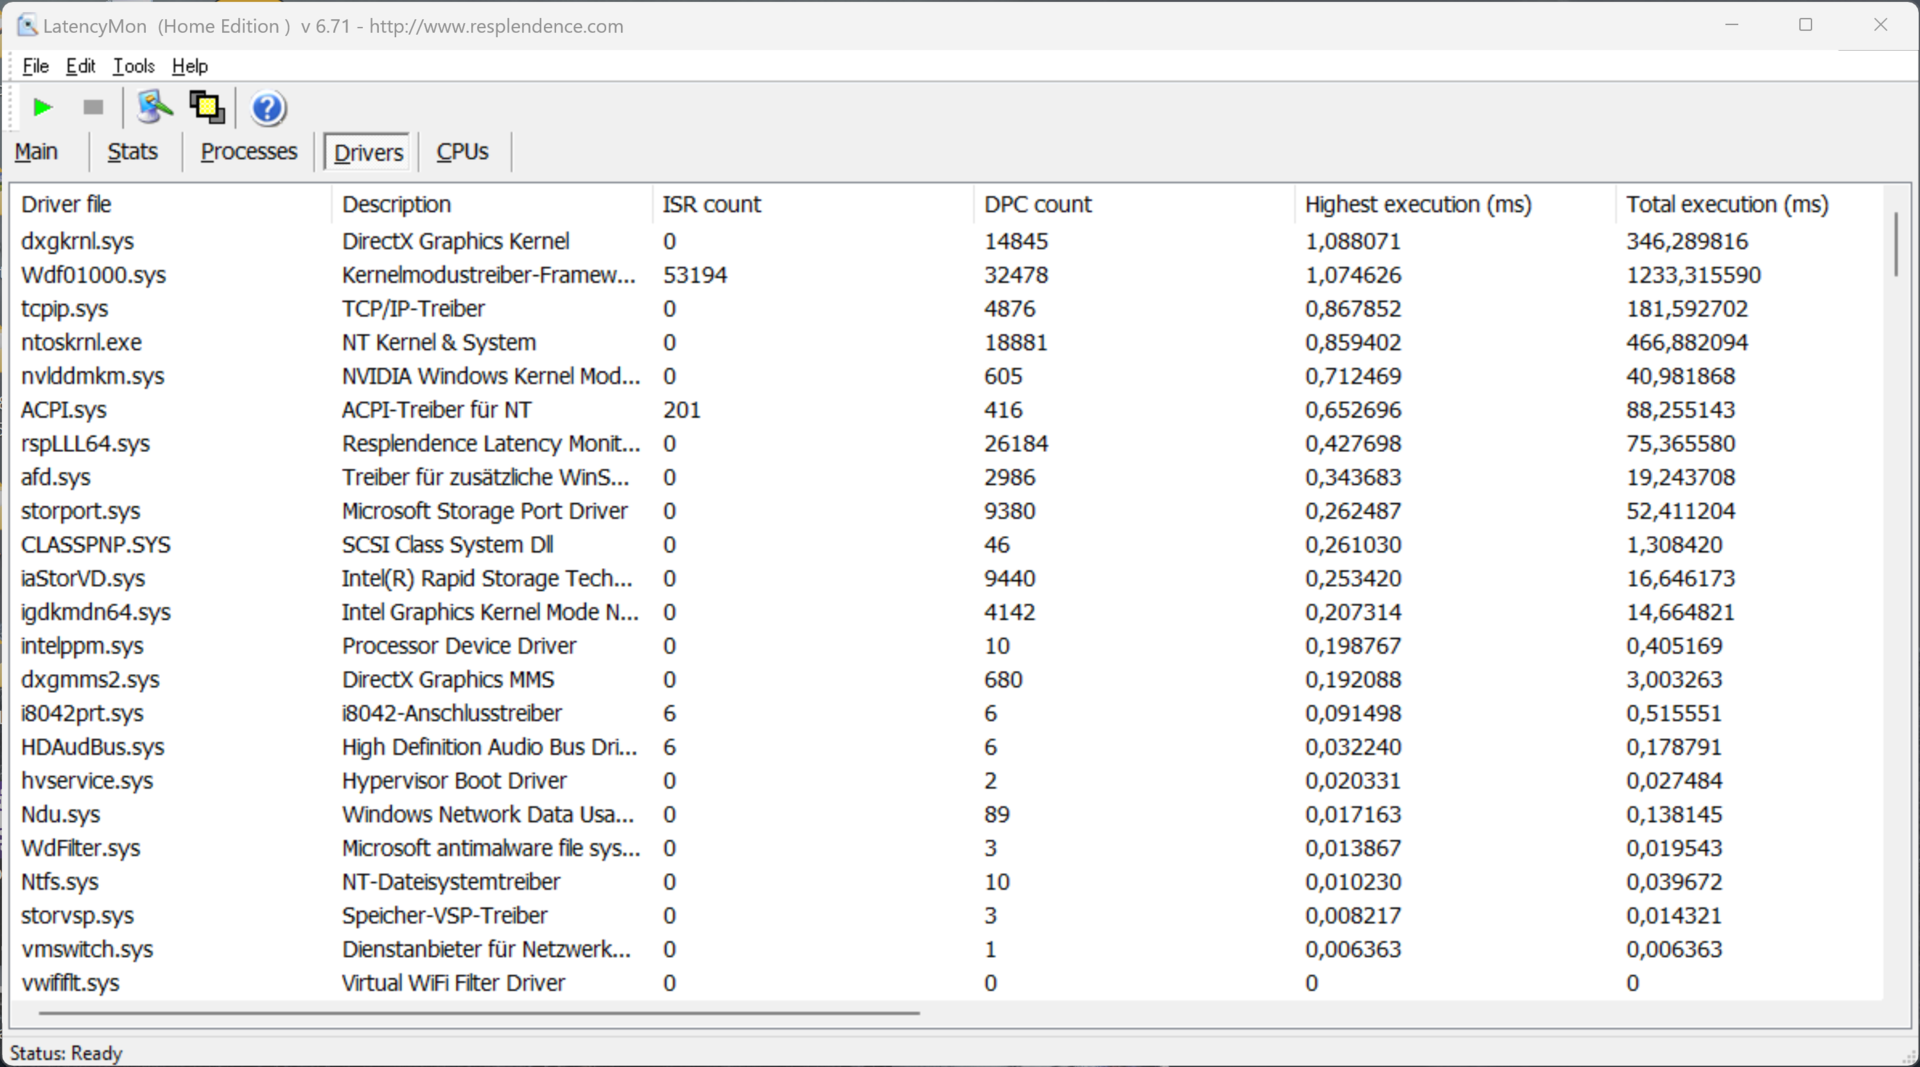
DPC 延迟
在我们的标准化延迟测试(网上冲浪、4K YouTube 播放、CPU 负载)中,使用当前 BIOS 版本的测试设备仅在使用实时音频应用程序时表现出轻微的限制。
| DPC Latencies / LatencyMon - interrupt to process latency (max), Web, Youtube, Prime95 | |
| Lenovo Yoga Pro 9 16-IRP G8 | |
| Asus ROG Zephyrus G16 2024 GU605M | |
| Honor MagicBook Pro 16 2024 | |
| Dell XPS 15 9530 RTX 4070 | |
| Dell XPS 16 9640 | |
| Schenker VISION 16 Pro (M23) | |
| Samsung Galaxy Book4 Ultra | |
* ... smaller is better
存储设备
我们的测试设备中安装了 1TB 版本的 Kioxia XG8,用户首次启动笔记本电脑后可使用 834 GB。PCIe-4.0 固态硬盘的性能非常好,最重要的是非常稳定。没有额外的固态硬盘插槽。更多固态硬盘基准测试 这里.

* ... smaller is better
Reading continuous performance: DiskSpd Read Loop, Queue Depth 8
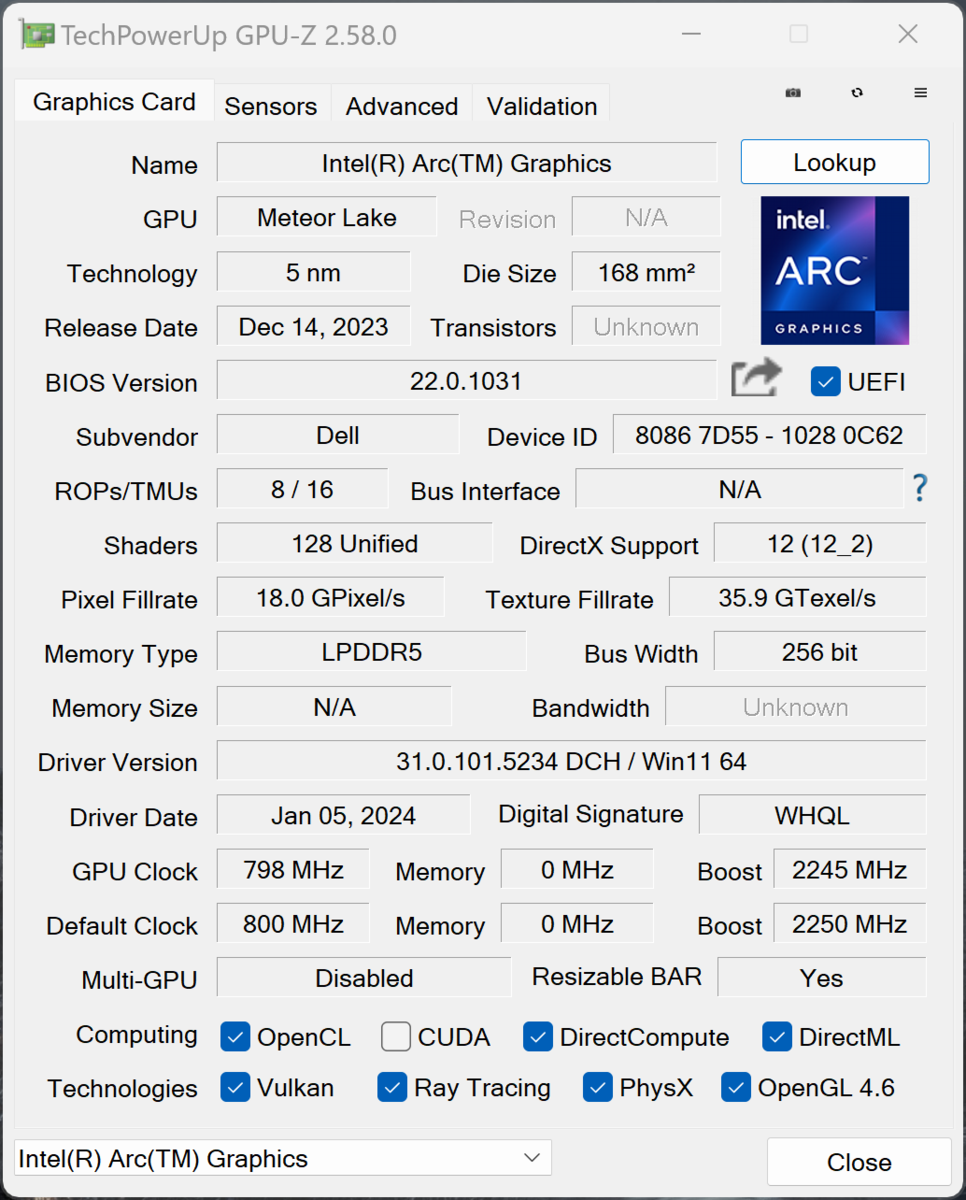
图形卡
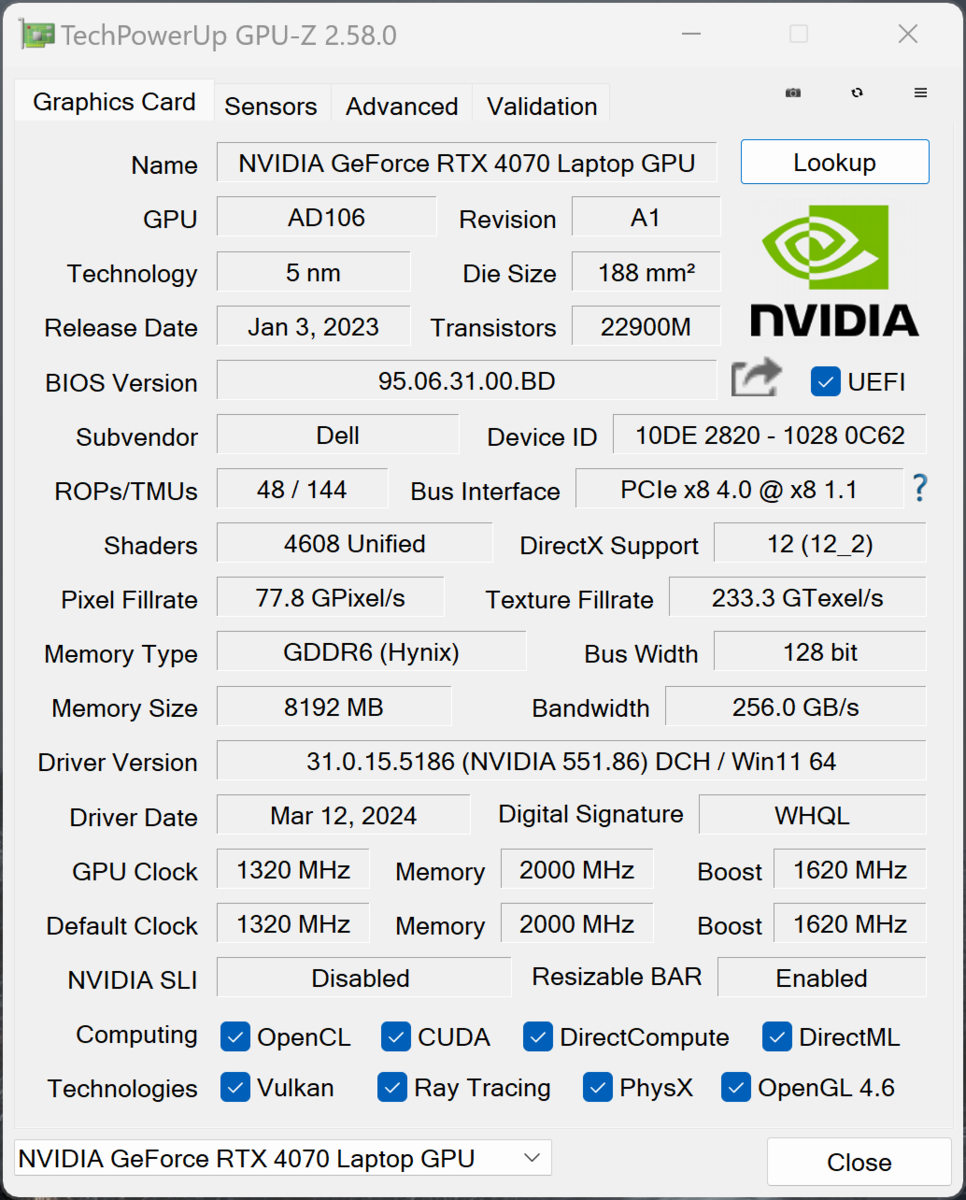
我们的测试设备配备了 GeForce RTX 4070 笔记本电脑配备 8GB VRAM,其 TGP 为 50-60 瓦,具体取决于所选的能耗配置文件。XPS 16 配备了一个 MUX 开关,并通过高级 Optimus 支持图形切换--简单的图形计算由集成的 英特尔弧形图形.
因此,它的性能比旧款 XPS 15它采用了 50 瓦版的 RTX 4070 笔记本电脑,但这一细分市场中的竞争对手提供的机型速度更快,因此 GPU 性能也更强。去年的 Yoga Pro 9 16配备了 100 瓦版 RTX 4060 笔记本电脑例如,它的速度并不慢。在这方面,本来可以做得更多。
它的图形性能在连续负载下保持稳定,但允许 GPU 在电池模式下最大消耗 50 瓦,导致性能降低略低于 10%。更多 GPU 基准测试见 这里.
| 3DMark 11 Performance | 29315 points | |
| 3DMark Fire Strike Score | 21848 points | |
| 3DMark Time Spy Score | 9774 points | |
Help | ||
| Blender / v3.3 Classroom OPTIX/RTX | |
| Average of class Multimedia (12 - 105, n=23, last 2 years) | |
| Samsung Galaxy Book4 Ultra | |
| Dell XPS 15 9530 RTX 4070 | |
| Lenovo Yoga Pro 9 16-IRP G8 | |
| Schenker VISION 16 Pro (M23) | |
| Honor MagicBook Pro 16 2024 | |
| Asus ROG Zephyrus G16 2024 GU605M | |
| Average NVIDIA GeForce RTX 4070 Laptop GPU (18 - 30, n=68) | |
| Dell XPS 16 9640 | |
| Blender / v3.3 Classroom CUDA | |
| Average of class Multimedia (20 - 186, n=23, last 2 years) | |
| Samsung Galaxy Book4 Ultra | |
| Dell XPS 15 9530 RTX 4070 | |
| Lenovo Yoga Pro 9 16-IRP G8 | |
| Honor MagicBook Pro 16 2024 | |
| Dell XPS 16 9640 | |
| Schenker VISION 16 Pro (M23) | |
| Average NVIDIA GeForce RTX 4070 Laptop GPU (32 - 50, n=67) | |
| Asus ROG Zephyrus G16 2024 GU605M | |
| Blender / v3.3 Classroom CPU | |
| Average of class Multimedia (134.5 - 1042, n=63, last 2 years) | |
| Schenker VISION 16 Pro (M23) | |
| Samsung Galaxy Book4 Ultra | |
| Dell XPS 15 9530 RTX 4070 | |
| Asus ROG Zephyrus G16 2024 GU605M | |
| Honor MagicBook Pro 16 2024 | |
| Lenovo Yoga Pro 9 16-IRP G8 | |
| Dell XPS 16 9640 | |
| Average NVIDIA GeForce RTX 4070 Laptop GPU (158 - 440, n=67) | |
* ... smaller is better
游戏性能
在 RTX 4070 笔记本电脑的支持下,XPS 16 9640 的游戏性能并不逊色--我们测试的所有游戏都可以在 QHD 分辨率下流畅运行,并获得最大细节。不过,对于 3840 x 2400 像素的原生分辨率屏幕来说,要么降低细节,要么使用 Nvidia 的 DLSS 等升频技术。与竞争对手相比,XPS 再次逊色于配备 RTX 4070 笔记本电脑的机型和 RTX 4060 笔记本电脑的快速版本(例如:MagicBook Pro)。Honor MagicBook Pro, 联想 Yoga Pro 9 16).即使在长时间的游戏过程中,它的游戏性能也能保持稳定。
| The Witcher 3 - 1920x1080 Ultra Graphics & Postprocessing (HBAO+) | |
| Schenker VISION 16 Pro (M23) | |
| Asus ROG Zephyrus G16 2024 GU605M | |
| Lenovo Yoga Pro 9 16-IRP G8 | |
| Dell XPS 16 9640 | |
| Honor MagicBook Pro 16 2024 | |
| Dell XPS 15 9530 RTX 4070 | |
| Average of class Multimedia (11 - 121, n=10, last 2 years) | |
| Samsung Galaxy Book4 Ultra | |
| Baldur's Gate 3 | |
| 1920x1080 Ultra Preset AA:T | |
| Average NVIDIA GeForce RTX 4070 Laptop GPU (66.7 - 128.5, n=30) | |
| Dell XPS 16 9640 | |
| Average of class Multimedia (7.8 - 158.7, n=67, last 2 years) | |
| 2560x1440 Ultra Preset AA:T | |
| Average NVIDIA GeForce RTX 4070 Laptop GPU (54.4 - 89.6, n=25) | |
| Average of class Multimedia (28.7 - 121, n=25, last 2 years) | |
| Dell XPS 16 9640 | |
| Horizon Forbidden West | |
| 1920x1080 Very High Preset AA:T | |
| Average NVIDIA GeForce RTX 4070 Laptop GPU (53.2 - 76.7, n=10) | |
| Dell XPS 16 9640 | |
| Average of class Multimedia (12.4 - 64.4, n=3, last 2 years) | |
| 2560x1440 Very High Preset AA:T | |
| Average NVIDIA GeForce RTX 4070 Laptop GPU (40.3 - 59.1, n=9) | |
| Average of class Multimedia (n=1last 2 years) | |
| Dell XPS 16 9640 | |
Witcher 3 FPS diagram
| low | med. | high | ultra | QHD | 4K | |
|---|---|---|---|---|---|---|
| GTA V (2015) | 177 | 170.7 | 103.6 | 81.3 | ||
| The Witcher 3 (2015) | 399 | 327 | 195 | 87.8 | 73 | |
| Dota 2 Reborn (2015) | 89.8 | 89.6 | 89.5 | 89.7 | 115.7 | |
| Final Fantasy XV Benchmark (2018) | 150.2 | 123.2 | 93.1 | 70 | ||
| X-Plane 11.11 (2018) | 125.1 | 108.5 | 84.7 | 68.9 | ||
| Far Cry 5 (2018) | 140 | 126 | 122 | 115 | 94 | |
| Strange Brigade (2018) | 423 | 258 | 202 | 175 | 116 | |
| F1 23 (2023) | 214 | 189.7 | 175.1 | 55.5 | 35.2 | |
| Baldur's Gate 3 (2023) | 135.7 | 107.1 | 93.5 | 91.8 | 63.8 | |
| Cyberpunk 2077 (2023) | 112 | 87.6 | 74.7 | 64.3 | 39.6 | |
| Horizon Forbidden West (2024) | 96.6 | 83.7 | 58.5 | 53.2 | 40.3 |
排放 - 戴尔在 XPS 16 中安装了蒸气室
噪音排放
相比之下 较小的 XPS 14的传统散热器相比,戴尔在较大的 XPS 16 中安装了带两个风扇的 Vapor Chamber 冷却装置。特别是在低负载情况下,风扇经常保持关闭或非常安静的状态,但在高负载情况下,风扇的声音还是会很快变大。我们对优化配置文件(最大 48.1 dB(A))和超高性能配置文件(最大 49.7 dB(A))之间的微小差异感到特别惊讶,两者都太吵了,以至于不需要耳机也能玩游戏。Quiet 配置文件的最大音量为 43.3 dB(A),实际上一点也不安静。不少竞争对手,如 MagicBook Pro或 Zephyrus G16等不少竞争对手都能以更低的噪音提供更好的性能。我们在测试样本中没有发现任何额外的电子噪音。
Noise level
| Idle |
| 24.5 / 24.5 / 27.5 dB(A) |
| Load |
| 39.6 / 49.7 dB(A) |
 | ||
30 dB silent 40 dB(A) audible 50 dB(A) loud |
||
min: | ||
| Dell XPS 16 9640 GeForce RTX 4070 Laptop GPU, Ultra 7 155H, Kioxia XG8 KXG80ZNV1T02 | Samsung Galaxy Book4 Ultra GeForce RTX 4050 Laptop GPU, Ultra 7 155H, Samsung PM9A1 MZVL2512HCJQ | Honor MagicBook Pro 16 2024 GeForce RTX 4060 Laptop GPU, Ultra 7 155H, WD PC SN740 SDDPNQD-1T00 | Asus ROG Zephyrus G16 2024 GU605M GeForce RTX 4070 Laptop GPU, Ultra 7 155H, WD PC SN560 SDDPNQE-1T00 | Lenovo Yoga Pro 9 16-IRP G8 GeForce RTX 4060 Laptop GPU, i7-13705H, Samsung PM9A1 MZVL21T0HCLR | Schenker VISION 16 Pro (M23) GeForce RTX 4070 Laptop GPU, i7-13700H, Samsung 990 Pro 1 TB | Dell XPS 15 9530 RTX 4070 GeForce RTX 4070 Laptop GPU, i7-13700H, SK hynix PC801 HFS001TEJ9X101N | |
|---|---|---|---|---|---|---|---|
| Noise | 7% | 8% | 1% | -3% | -10% | 13% | |
| off / environment * (dB) | 24.5 | 24.2 1% | 24 2% | 23.9 2% | 24.7 -1% | 25.9 -6% | 23.1 6% |
| Idle Minimum * (dB) | 24.5 | 24.2 1% | 24 2% | 23.9 2% | 24.7 -1% | 25.9 -6% | 23.1 6% |
| Idle Average * (dB) | 24.5 | 24.2 1% | 24 2% | 27.8 -13% | 26.2 -7% | 25.9 -6% | 23.1 6% |
| Idle Maximum * (dB) | 27.5 | 24.2 12% | 27.2 1% | 30.1 -9% | 26.2 5% | 32 -16% | 24.2 12% |
| Load Average * (dB) | 39.6 | 37.9 4% | 29 27% | 34.2 14% | 39.7 -0% | 47.2 -19% | 27.1 32% |
| Witcher 3 ultra * (dB) | 49.7 | 41.7 16% | 42.1 15% | 46.4 7% | 53.2 -7% | 53.1 -7% | 40.1 19% |
| Load Maximum * (dB) | 49.7 | 41.7 16% | 45 9% | 46.4 7% | 53.2 -7% | 53.1 -7% | 44.6 10% |
* ... smaller is better
温度
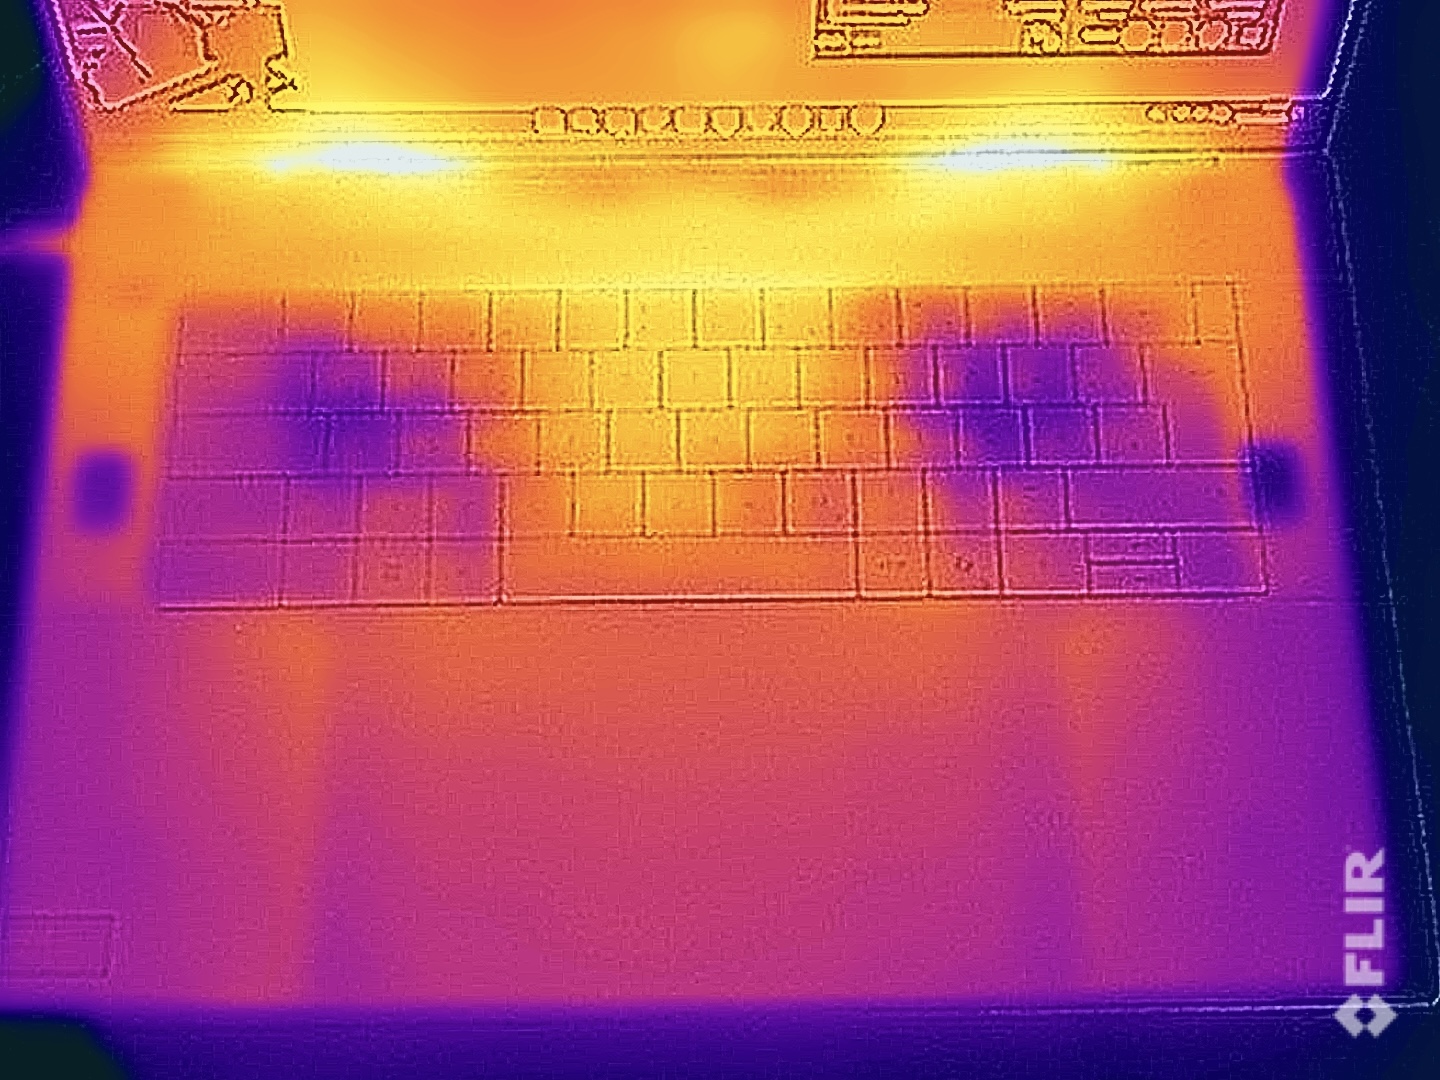
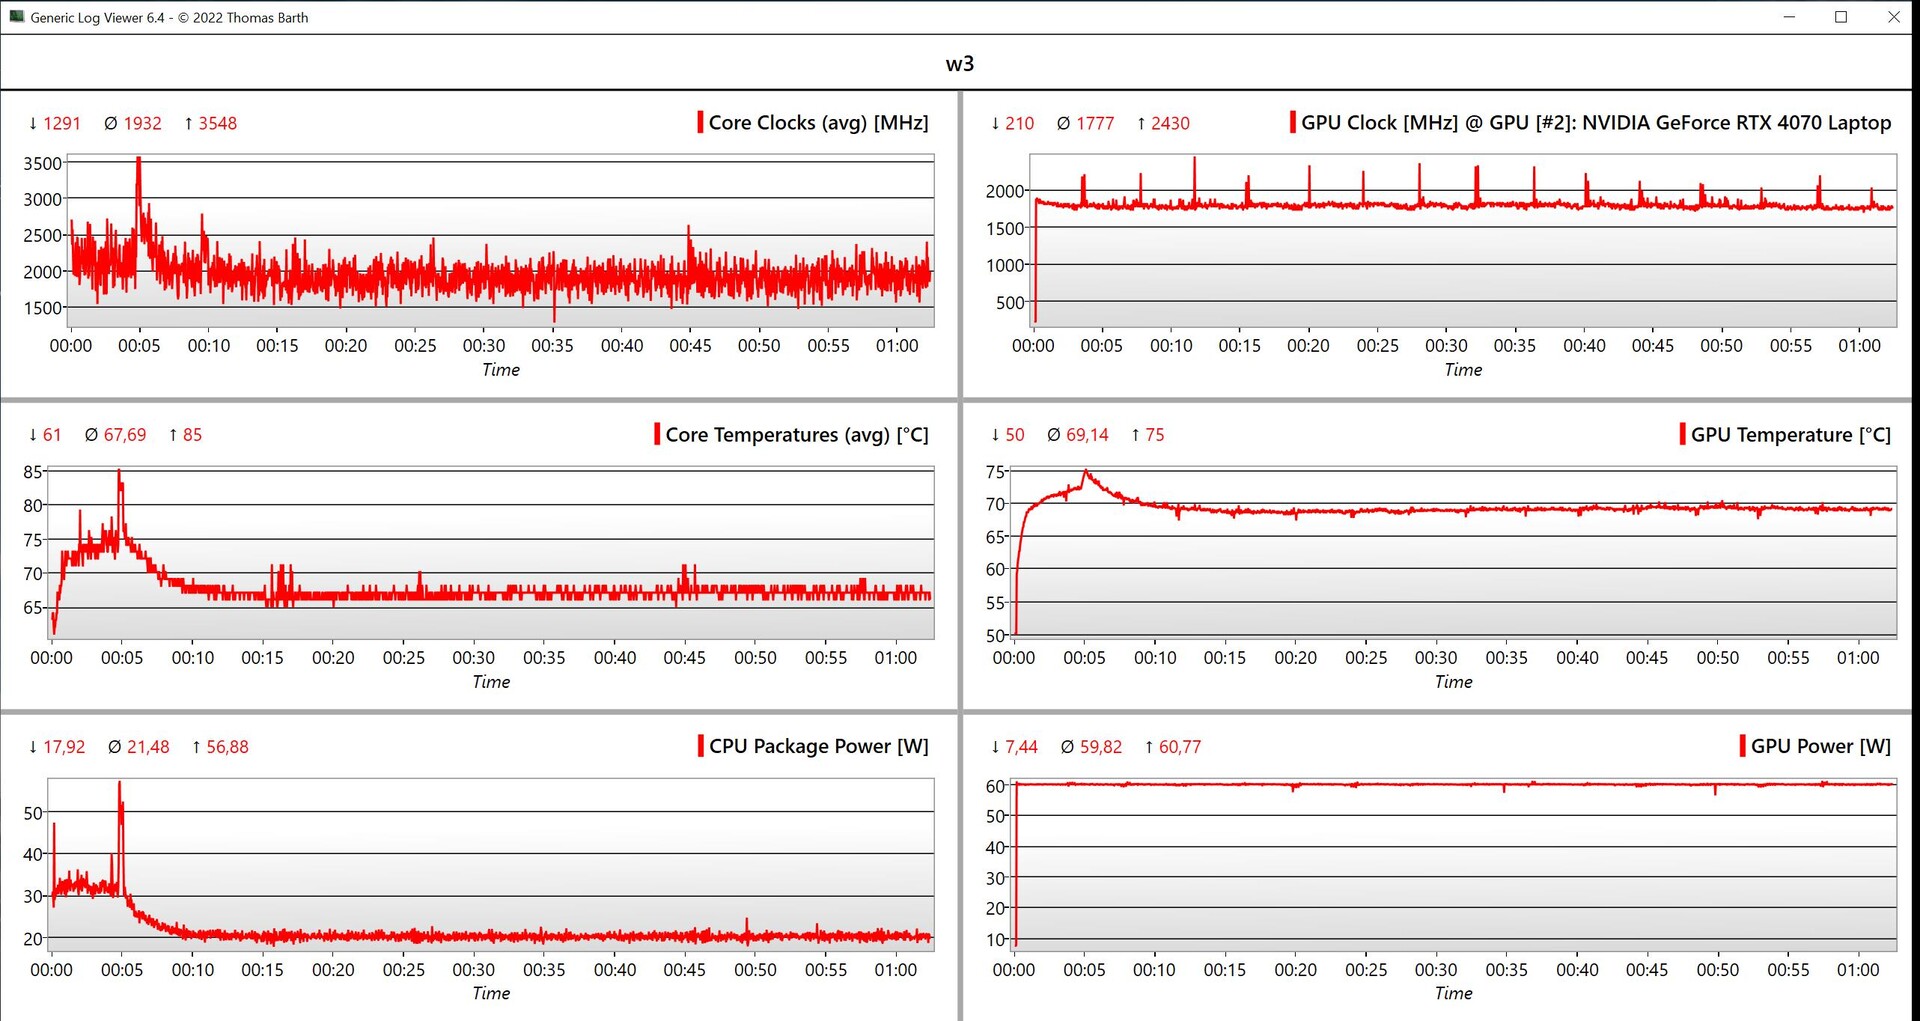
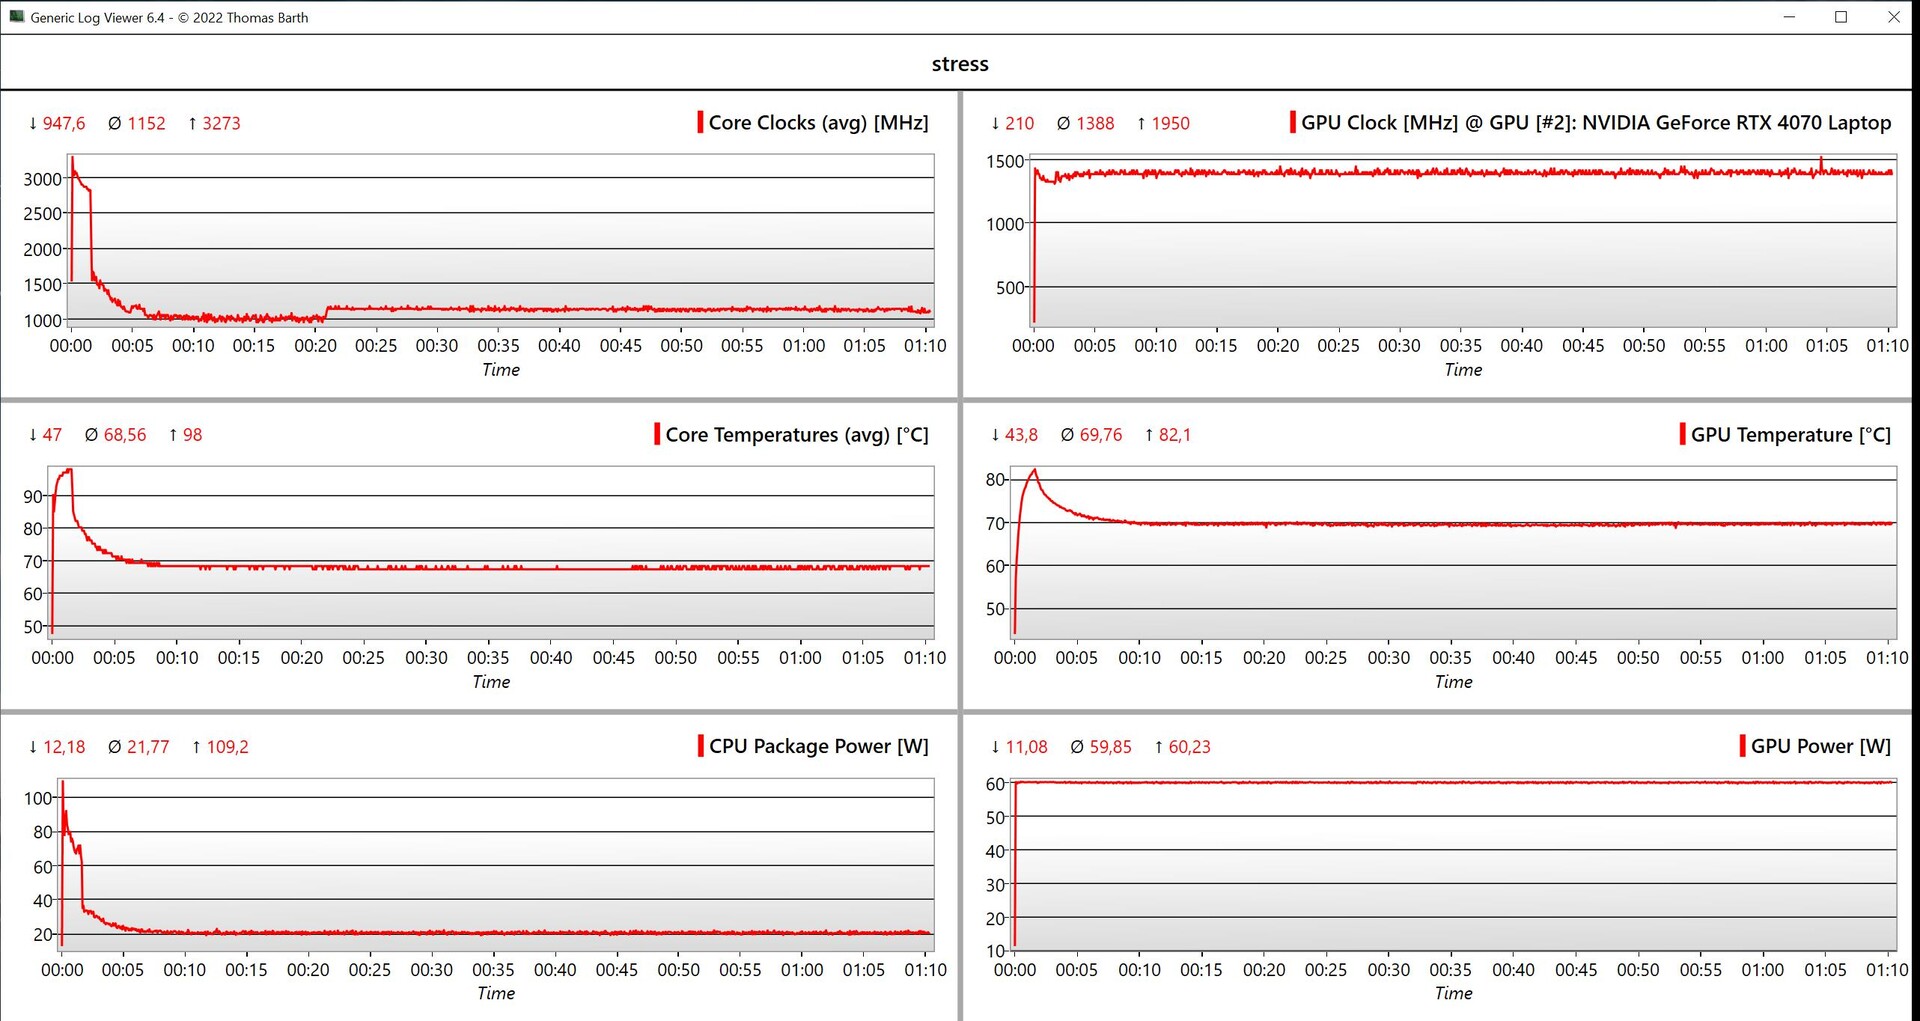
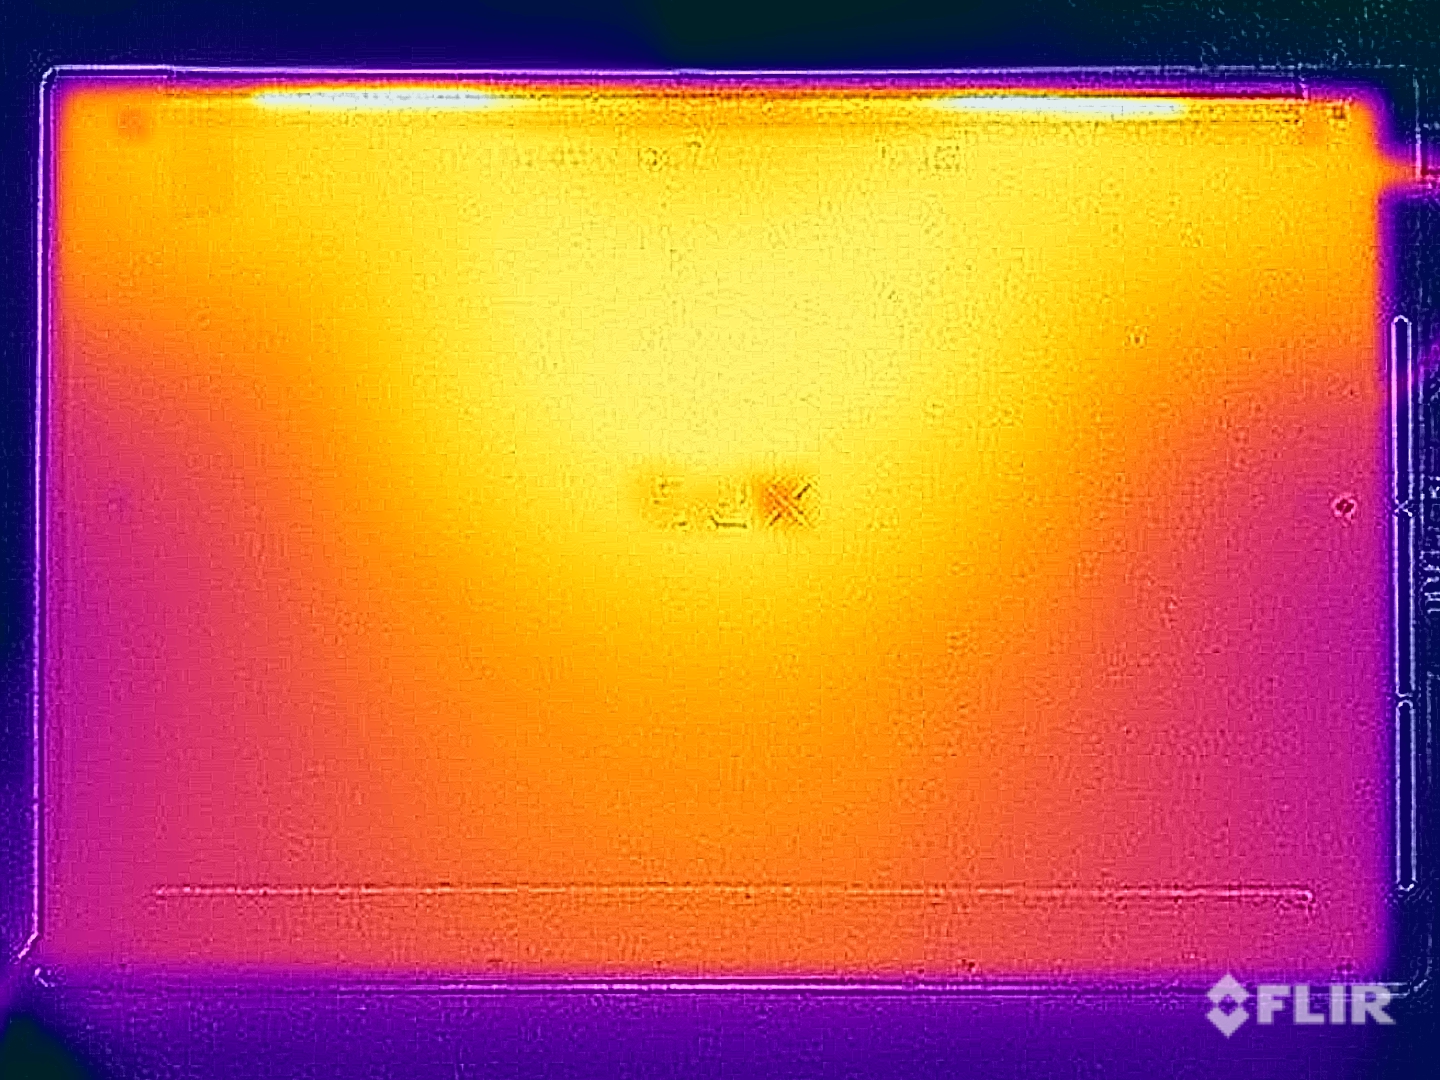
笔记本的表面温度表明,戴尔可以提高部件的性能或降低风扇的转速,因为即使在压力测试中,我们测得的温度也从未超过 40 °C。在执行简单任务和空转时,铝制外壳几乎没有升温。在使用 CPU/GPU 综合负载的压力测试中,显卡的功率稳定在 60 瓦,而处理器的功率仅为 20 瓦。
(+) The maximum temperature on the upper side is 39.4 °C / 103 F, compared to the average of 36.8 °C / 98 F, ranging from 21 to 71 °C for the class Multimedia.
(+) The bottom heats up to a maximum of 36.9 °C / 98 F, compared to the average of 39.1 °C / 102 F
(+) In idle usage, the average temperature for the upper side is 26.3 °C / 79 F, compared to the device average of 31.3 °C / 88 F.
(±) Playing The Witcher 3, the average temperature for the upper side is 34 °C / 93 F, compared to the device average of 31.3 °C / 88 F.
(+) The palmrests and touchpad are cooler than skin temperature with a maximum of 30.2 °C / 86.4 F and are therefore cool to the touch.
(±) The average temperature of the palmrest area of similar devices was 28.7 °C / 83.7 F (-1.5 °C / -2.7 F).
| Dell XPS 16 9640 Intel Core Ultra 7 155H, NVIDIA GeForce RTX 4070 Laptop GPU | Samsung Galaxy Book4 Ultra Intel Core Ultra 7 155H, NVIDIA GeForce RTX 4050 Laptop GPU | Honor MagicBook Pro 16 2024 Intel Core Ultra 7 155H, NVIDIA GeForce RTX 4060 Laptop GPU | Asus ROG Zephyrus G16 2024 GU605M Intel Core Ultra 7 155H, NVIDIA GeForce RTX 4070 Laptop GPU | Lenovo Yoga Pro 9 16-IRP G8 Intel Core i7-13705H, NVIDIA GeForce RTX 4060 Laptop GPU | Schenker VISION 16 Pro (M23) Intel Core i7-13700H, NVIDIA GeForce RTX 4070 Laptop GPU | Dell XPS 15 9530 RTX 4070 Intel Core i7-13700H, NVIDIA GeForce RTX 4070 Laptop GPU | |
|---|---|---|---|---|---|---|---|
| Heat | 5% | 3% | -17% | -10% | -15% | -18% | |
| Maximum Upper Side * (°C) | 39.4 | 38.5 2% | 39.7 -1% | 50.3 -28% | 41.6 -6% | 46.7 -19% | 45.6 -16% |
| Maximum Bottom * (°C) | 36.9 | 41.2 -12% | 42.9 -16% | 48 -30% | 50 -36% | 54.1 -47% | 42 -14% |
| Idle Upper Side * (°C) | 28.2 | 23.5 17% | 23.7 16% | 28.8 -2% | 26.8 5% | 26.5 6% | 34.4 -22% |
| Idle Bottom * (°C) | 27.4 | 24.1 12% | 23.5 14% | 29.8 -9% | 27.9 -2% | 26.8 2% | 33.2 -21% |
* ... smaller is better
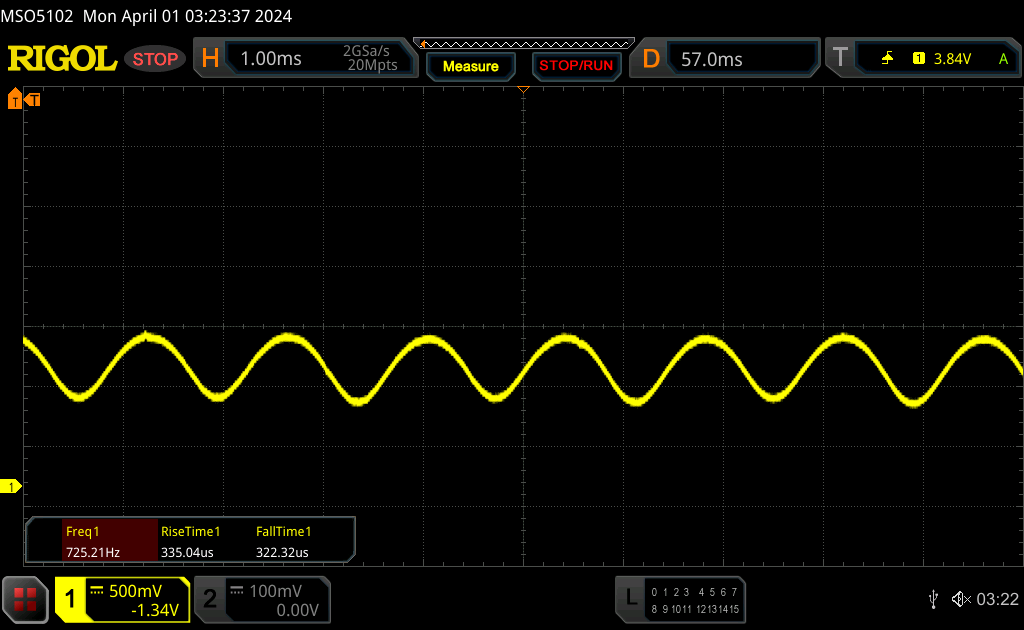
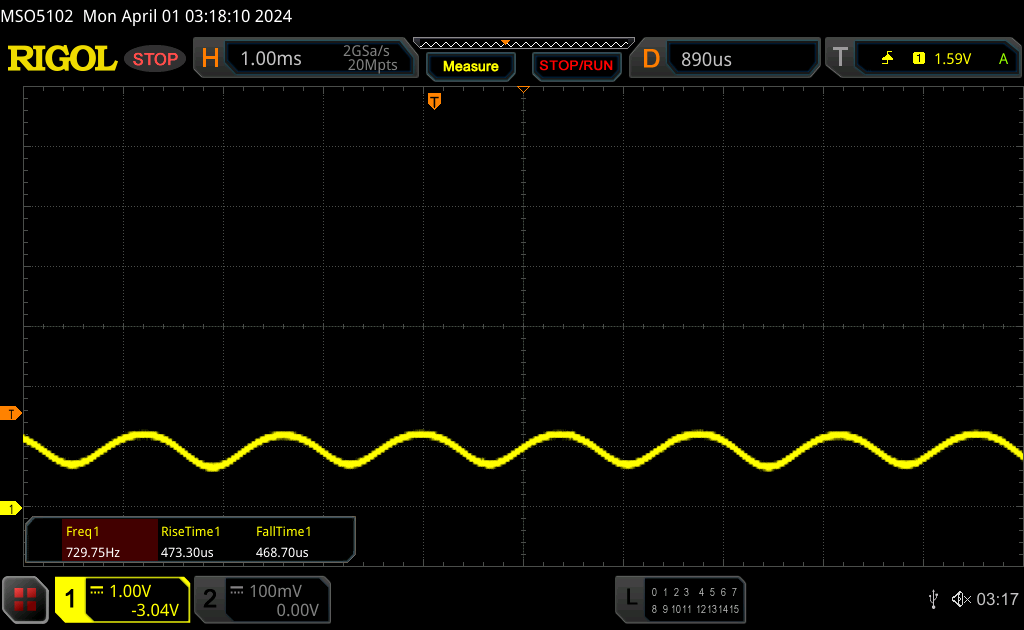
发言人
XPS 16 的音响系统由四个扬声器组成,总输出功率为 10 瓦。所产生的音效很好,几乎不会让你失望,但竞争对手如 ROG Zephyrus G16等竞争对手的产品可以做得更好。根据我们的分析,新款 XPS 16 还略逊于旧款 XPS 15.
Dell XPS 16 9640 audio analysis
(+) | speakers can play relatively loud (83.4 dB)
Bass 100 - 315 Hz
(±) | reduced bass - on average 11.2% lower than median
(±) | linearity of bass is average (8.9% delta to prev. frequency)
Mids 400 - 2000 Hz
(+) | balanced mids - only 4.5% away from median
(+) | mids are linear (3% delta to prev. frequency)
Highs 2 - 16 kHz
(+) | balanced highs - only 1.4% away from median
(+) | highs are linear (2% delta to prev. frequency)
Overall 100 - 16.000 Hz
(+) | overall sound is linear (10% difference to median)
Compared to same class
» 13% of all tested devices in this class were better, 2% similar, 84% worse
» The best had a delta of 5%, average was 17%, worst was 45%
Compared to all devices tested
» 4% of all tested devices were better, 1% similar, 94% worse
» The best had a delta of 4%, average was 23%, worst was 134%
Asus ROG Zephyrus G16 2024 GU605M audio analysis
(+) | speakers can play relatively loud (83.3 dB)
Bass 100 - 315 Hz
(+) | good bass - only 3.8% away from median
(±) | linearity of bass is average (8.1% delta to prev. frequency)
Mids 400 - 2000 Hz
(+) | balanced mids - only 3.5% away from median
(+) | mids are linear (2.4% delta to prev. frequency)
Highs 2 - 16 kHz
(+) | balanced highs - only 2.2% away from median
(+) | highs are linear (3.7% delta to prev. frequency)
Overall 100 - 16.000 Hz
(+) | overall sound is linear (7.3% difference to median)
Compared to same class
» 1% of all tested devices in this class were better, 0% similar, 99% worse
» The best had a delta of 6%, average was 18%, worst was 132%
Compared to all devices tested
» 1% of all tested devices were better, 0% similar, 99% worse
» The best had a delta of 4%, average was 23%, worst was 134%
Lenovo Yoga Pro 9 16-IRP G8 audio analysis
(±) | speaker loudness is average but good (80.5 dB)
Bass 100 - 315 Hz
(+) | good bass - only 4.9% away from median
(±) | linearity of bass is average (9.1% delta to prev. frequency)
Mids 400 - 2000 Hz
(+) | balanced mids - only 3.2% away from median
(+) | mids are linear (6.5% delta to prev. frequency)
Highs 2 - 16 kHz
(+) | balanced highs - only 2.9% away from median
(+) | highs are linear (3% delta to prev. frequency)
Overall 100 - 16.000 Hz
(+) | overall sound is linear (8.4% difference to median)
Compared to same class
» 9% of all tested devices in this class were better, 2% similar, 89% worse
» The best had a delta of 5%, average was 17%, worst was 45%
Compared to all devices tested
» 2% of all tested devices were better, 1% similar, 97% worse
» The best had a delta of 4%, average was 23%, worst was 134%
Dell XPS 15 9530 RTX 4070 audio analysis
(+) | speakers can play relatively loud (83.4 dB)
Bass 100 - 315 Hz
(+) | good bass - only 3.9% away from median
(+) | bass is linear (6.8% delta to prev. frequency)
Mids 400 - 2000 Hz
(+) | balanced mids - only 4.4% away from median
(+) | mids are linear (4.1% delta to prev. frequency)
Highs 2 - 16 kHz
(+) | balanced highs - only 1.1% away from median
(+) | highs are linear (3.3% delta to prev. frequency)
Overall 100 - 16.000 Hz
(+) | overall sound is linear (6.4% difference to median)
Compared to same class
» 4% of all tested devices in this class were better, 1% similar, 95% worse
» The best had a delta of 5%, average was 17%, worst was 45%
Compared to all devices tested
» 1% of all tested devices were better, 0% similar, 99% worse
» The best had a delta of 4%, average was 23%, worst was 134%
电源管理 - 99.5 瓦时电池提供充足的电量
耗电量
在我们的功耗测量中,高分辨率 OLED 触摸屏的节俭程度令人吃惊,因为尽管标准背景图像很暗,但 10.6 瓦的最大功耗对于 16.3 英寸的屏幕来说并不算高。在负载情况下,我们没有发现任何意外。在压力测试中,它的功耗曾一度达到 138 瓦左右,但 1.5 分钟后稳定在 125 瓦,之后又降至 115 瓦。虽然回旋余地不大,但总体而言,130 瓦的紧凑型电源大小足够。
| Off / Standby | |
| Idle | |
| Load |
|
Key:
min: | |
| Dell XPS 16 9640 Ultra 7 155H, GeForce RTX 4070 Laptop GPU, Kioxia XG8 KXG80ZNV1T02, OLED, 3840x2400, 16.3" | Samsung Galaxy Book4 Ultra Ultra 7 155H, GeForce RTX 4050 Laptop GPU, Samsung PM9A1 MZVL2512HCJQ, OLED, 2880x1800, 16" | Honor MagicBook Pro 16 2024 Ultra 7 155H, GeForce RTX 4060 Laptop GPU, WD PC SN740 SDDPNQD-1T00, IPS, 3072x1920, 16" | Asus ROG Zephyrus G16 2024 GU605M Ultra 7 155H, GeForce RTX 4070 Laptop GPU, WD PC SN560 SDDPNQE-1T00, OLED, 2560x1600, 16" | Lenovo Yoga Pro 9 16-IRP G8 i7-13705H, GeForce RTX 4060 Laptop GPU, Samsung PM9A1 MZVL21T0HCLR, Mini-LED, 3200x2000, 16" | Schenker VISION 16 Pro (M23) i7-13700H, GeForce RTX 4070 Laptop GPU, Samsung 990 Pro 1 TB, IPS, 2560x1600, 16" | Dell XPS 15 9530 RTX 4070 i7-13700H, GeForce RTX 4070 Laptop GPU, SK hynix PC801 HFS001TEJ9X101N, OLED, 3456x2160, 15.6" | Average NVIDIA GeForce RTX 4070 Laptop GPU | Average of class Multimedia | |
|---|---|---|---|---|---|---|---|---|---|
| Power Consumption | 22% | -20% | -11% | -58% | -16% | -57% | -73% | 8% | |
| Idle Minimum * (Watt) | 7.7 | 4.8 38% | 5.2 32% | 8.3 -8% | 10.9 -42% | 8.6 -12% | 20 -160% | 13.2 ? -71% | 5.72 ? 26% |
| Idle Average * (Watt) | 10.3 | 7.5 27% | 14.4 -40% | 12.5 -21% | 22.6 -119% | 12 -17% | 20.7 -101% | 18.2 ? -77% | 10.2 ? 1% |
| Idle Maximum * (Watt) | 10.6 | 7.9 25% | 15.4 -45% | 12.8 -21% | 23.5 -122% | 12.4 -17% | 22.4 -111% | 24.6 ? -132% | 12.4 ? -17% |
| Load Average * (Watt) | 76.5 | 79.3 -4% | 105.4 -38% | 71.3 7% | 84.6 -11% | 80 -5% | 77.1 -1% | 97 ? -27% | 65.5 ? 14% |
| Witcher 3 ultra * (Watt) | 126.4 | 79.2 37% | 107.6 15% | 127.5 -1% | 159.5 -26% | 147.7 -17% | 95.4 25% | ||
| Load Maximum * (Watt) | 138.5 | 125 10% | 195.2 -41% | 169.1 -22% | 177.3 -28% | 173.1 -25% | 133.4 4% | 221 ? -60% | 114 ? 18% |
* ... smaller is better
Power consumption Witcher 3 / stress test
Power consumption with external monitor
运行时间
戴尔为新款 XPS 16 安装了最大容量的电池,其容量为 99.5 Wh,总的来说,其运行时间非常出色。在 150 cd/m²(相当于测试设备最大 SDR 亮度的 57%)的 WLAN 测试中,我们测得在 60 Hz 下的运行时间为 10:29 小时(90 Hz 下为 09:56 小时),在全亮度和 60 Hz 下的运行时间略高于 8 小时(90 Hz 下约为 07:20 小时)。在 150 cd/m² 下的视频测试中,我们注意到 16.5 小时的出色表现,这得益于 Meteor Lake 处理器的两个低功耗内核。在全亮度条件下播放 HDR 视频可长达 6.5 小时以上,而在全负载条件下,测试仅进行了不到 1.5 小时就结束了。
XPS 16 提供两种充电速度:在普通模式下,设备开机后电池充满电需要 151 分钟(93 分钟后达到 80%);在快速模式下,需要 97 分钟(50 分钟后达到 80%)。
| Dell XPS 16 9640 Ultra 7 155H, GeForce RTX 4070 Laptop GPU, 99.5 Wh | Samsung Galaxy Book4 Ultra Ultra 7 155H, GeForce RTX 4050 Laptop GPU, 76 Wh | Honor MagicBook Pro 16 2024 Ultra 7 155H, GeForce RTX 4060 Laptop GPU, 75 Wh | Asus ROG Zephyrus G16 2024 GU605M Ultra 7 155H, GeForce RTX 4070 Laptop GPU, 90 Wh | Lenovo Yoga Pro 9 16-IRP G8 i7-13705H, GeForce RTX 4060 Laptop GPU, 75 Wh | Schenker VISION 16 Pro (M23) i7-13700H, GeForce RTX 4070 Laptop GPU, 80 Wh | Dell XPS 15 9530 RTX 4070 i7-13700H, GeForce RTX 4070 Laptop GPU, 86 Wh | Average of class Multimedia | |
|---|---|---|---|---|---|---|---|---|
| Battery runtime | -0% | -13% | -27% | -49% | -31% | -12% | 9% | |
| H.264 (h) | 16.5 | 17.9 8% | 13.1 -21% | 11.2 -32% | 7.5 -55% | 7.8 -53% | 16.4 ? -1% | |
| WiFi v1.3 (h) | 10.5 | 10.9 4% | 12.2 16% | 7.3 -30% | 6.4 -39% | 7.8 -26% | 8 -24% | 12.2 ? 16% |
| Load (h) | 1.5 | 1.3 -13% | 1 -33% | 1.2 -20% | 0.7 -53% | 1.3 -13% | 1.5 0% | 1.668 ? 11% |
Pros
Cons
评语:全新 XPS 设计作为 16 英寸设备效果更佳
总的来说,新款戴尔 XPS 16 给人的印象要好于较小的 更小的 14 英寸机型。尽管重量很重,但这款笔记本电脑的设计并不会让人感觉非常笨重,而且由于边框纤薄,它的占地面积也比竞争对手要好。即便如此,你也必须注意到,这款机型也将设计放在了首位,尤其是采用了 60 瓦的 RTX 4070 笔记本电脑的图形性能只能算一般。反过来,尽管流星湖处理器与旧款猛禽湖处理器相比没有任何优势,但它的 CPU 性能还是不错的。
该设备的 4K OLED 触摸屏显示出良好的画质和准确的色彩,但与目前最先进的 OLED 面板相比,在观看浅色内容时,你会发现明显的光栅效应,此外,其 90-Hz 的刷新率也不再完全与时俱进。它的新输入设备也不是最好的,因为键盘需要一些时间来适应,特别是触摸栏在日常使用中相当不便。在连接性方面,你只能使用三个 USB-C 端口,就像在较小的 XPS 14 上一样,而配备 RTX 4070 笔记本电脑的较昂贵的 XPS 16 似乎只有 2x Thunderbolt 端口,两款较弱的机型都配备了 3x Thunderbolt 4 端口。
戴尔 XPS 16 在注重设计的同时也提供了良好的 CPU 性能,但其输入设备的人体工学设计和 GPU 性能却因此受到了影响。此外,2899 美元的售价也非常昂贵。
对于这款笔记本电脑的扬声器和运行时间,我们没有什么负面评价,总的来说,它的构造和外壳稳定性很好--尽管我们的测试样品在两个 USB-C 端口之间发现了一个小的构造缺陷。即使在负载情况下,其表面温度仍然很低,但风扇的声音很大,而且我们注意到所有能耗曲线之间没有太大差异。配置选项有很多限制,尤其是在内存方面。您最多可以选择 64 GB 内存,但只能与 Core Ultra 9 185H 结合使用。
你必须清楚一点,那就是性能并不是 XPS 16 的独特卖点--竞争对手提供的性能要高得多,尤其是在图形处理器领域。同时,戴尔 XPS 16 的售价高达 2,899 美元,性价比极高,而且很多竞争对手的性价比更高。
价格和供应情况
新款 XPS 16 9640 目前可直接向戴尔公司订购,起价为1,699 美元。
Dell XPS 16 9640
- 04/09/2024 v7 (old)
Andreas Osthoff
Transparency
The selection of devices to be reviewed is made by our editorial team. The test sample was provided to the author as a loan by the manufacturer or retailer for the purpose of this review. The lender had no influence on this review, nor did the manufacturer receive a copy of this review before publication. There was no obligation to publish this review. As an independent media company, Notebookcheck is not subjected to the authority of manufacturers, retailers or publishers.
This is how Notebookcheck is testing
Every year, Notebookcheck independently reviews hundreds of laptops and smartphones using standardized procedures to ensure that all results are comparable. We have continuously developed our test methods for around 20 years and set industry standards in the process. In our test labs, high-quality measuring equipment is utilized by experienced technicians and editors. These tests involve a multi-stage validation process. Our complex rating system is based on hundreds of well-founded measurements and benchmarks, which maintains objectivity. Further information on our test methods can be found here.
Price comparison

