申克 Vision 16 Pro 2023 评论: 1.配备 RTX 4070 笔记本电脑的 6 千克轻型强力套装
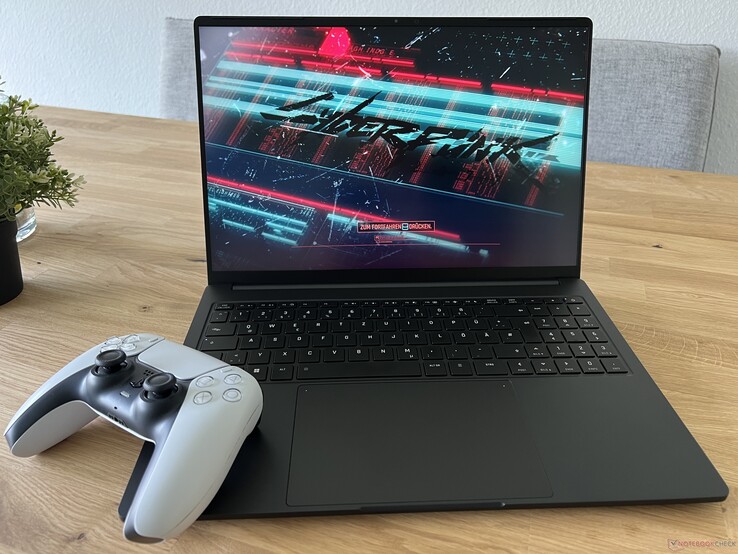
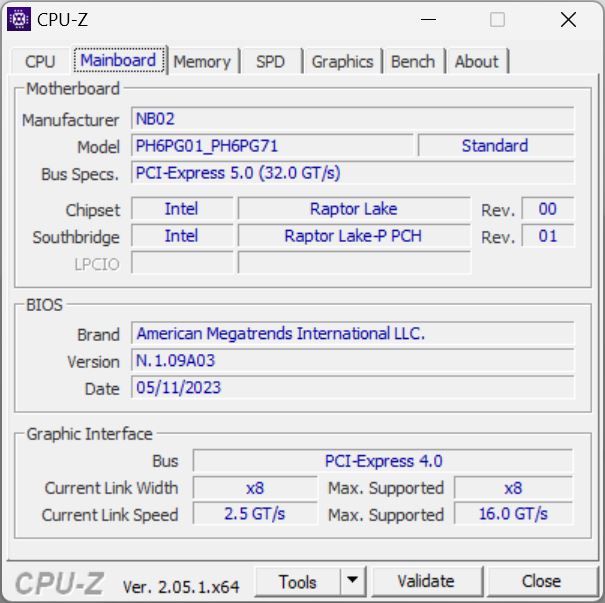
申克公司在 2023 年更新了 Vision 16 Pro,再次推出了一款非常轻便、性能极高的 16 英寸笔记本电脑。处理器升级为英特尔最新的 酷睿 i7-13700H猛禽湖芯片,显卡则可选择新的 GeForce RTX 4060 笔记本电脑或RTX 4070 笔记本电脑,每种显卡的最大 TGP 均为 95 瓦。除了这两项更新外,散热系统也有一些改进(新风扇),除了处理器外,GPU 现在也使用液态金属散热,以实现最佳热传导。
配备酷睿 i7-13700H、GeForce RTX 4060 笔记本电脑、16 GB 内存和 500 GB 固态硬盘的新机型售价为 2099 欧元(约合 2361 美元)起。我们的测试配置包括速度更快的 RTX 4070 笔记本电脑、32 GB 内存、1 TB SSD 和预装的 Windows 11,价格约为 2,600 欧元(约合人民币 2,924 元),这也与前代产品的价格相当。
潜在的竞争对手比较
Rating | Date | Model | Weight | Height | Size | Resolution | Price |
|---|---|---|---|---|---|---|---|
| 88.6 % v7 (old) | 07 / 2023 | Schenker VISION 16 Pro (M23) i7-13700H, GeForce RTX 4070 Laptop GPU | 1.6 kg | 17.1 mm | 16.00" | 2560x1600 | |
| 88.8 % v7 (old) | 05 / 2023 | Samsung Galaxy Book3 Ultra 16, i9-13900H RTX 4070 i9-13900H, GeForce RTX 4070 Laptop GPU | 1.8 kg | 16.8 mm | 16.00" | 2880x1800 | |
| 88.8 % v7 (old) | 07 / 2023 | MSI Stealth 16 Studio A13VG i7-13700H, GeForce RTX 4070 Laptop GPU | 2 kg | 19.95 mm | 16.00" | 2560x1600 | |
| 90.3 % v7 (old) | 04 / 2023 | Dell XPS 15 9530 RTX 4070 i7-13700H, GeForce RTX 4070 Laptop GPU | 1.9 kg | 18 mm | 15.60" | 3456x2160 | |
| 86.1 % v7 (old) | 06 / 2023 | Asus ProArt Studiobook 16 OLED H7604 i9-13980HX, GeForce RTX 4070 Laptop GPU | 2.4 kg | 23.9 mm | 16.00" | 3200x2000 | |
| 93.7 % v7 (old) | 03 / 2023 | Apple MacBook Pro 16 2023 M2 Max M2 Max, M2 Max 38-Core GPU | 2.2 kg | 16.8 mm | 16.20" | 3456x2234 |
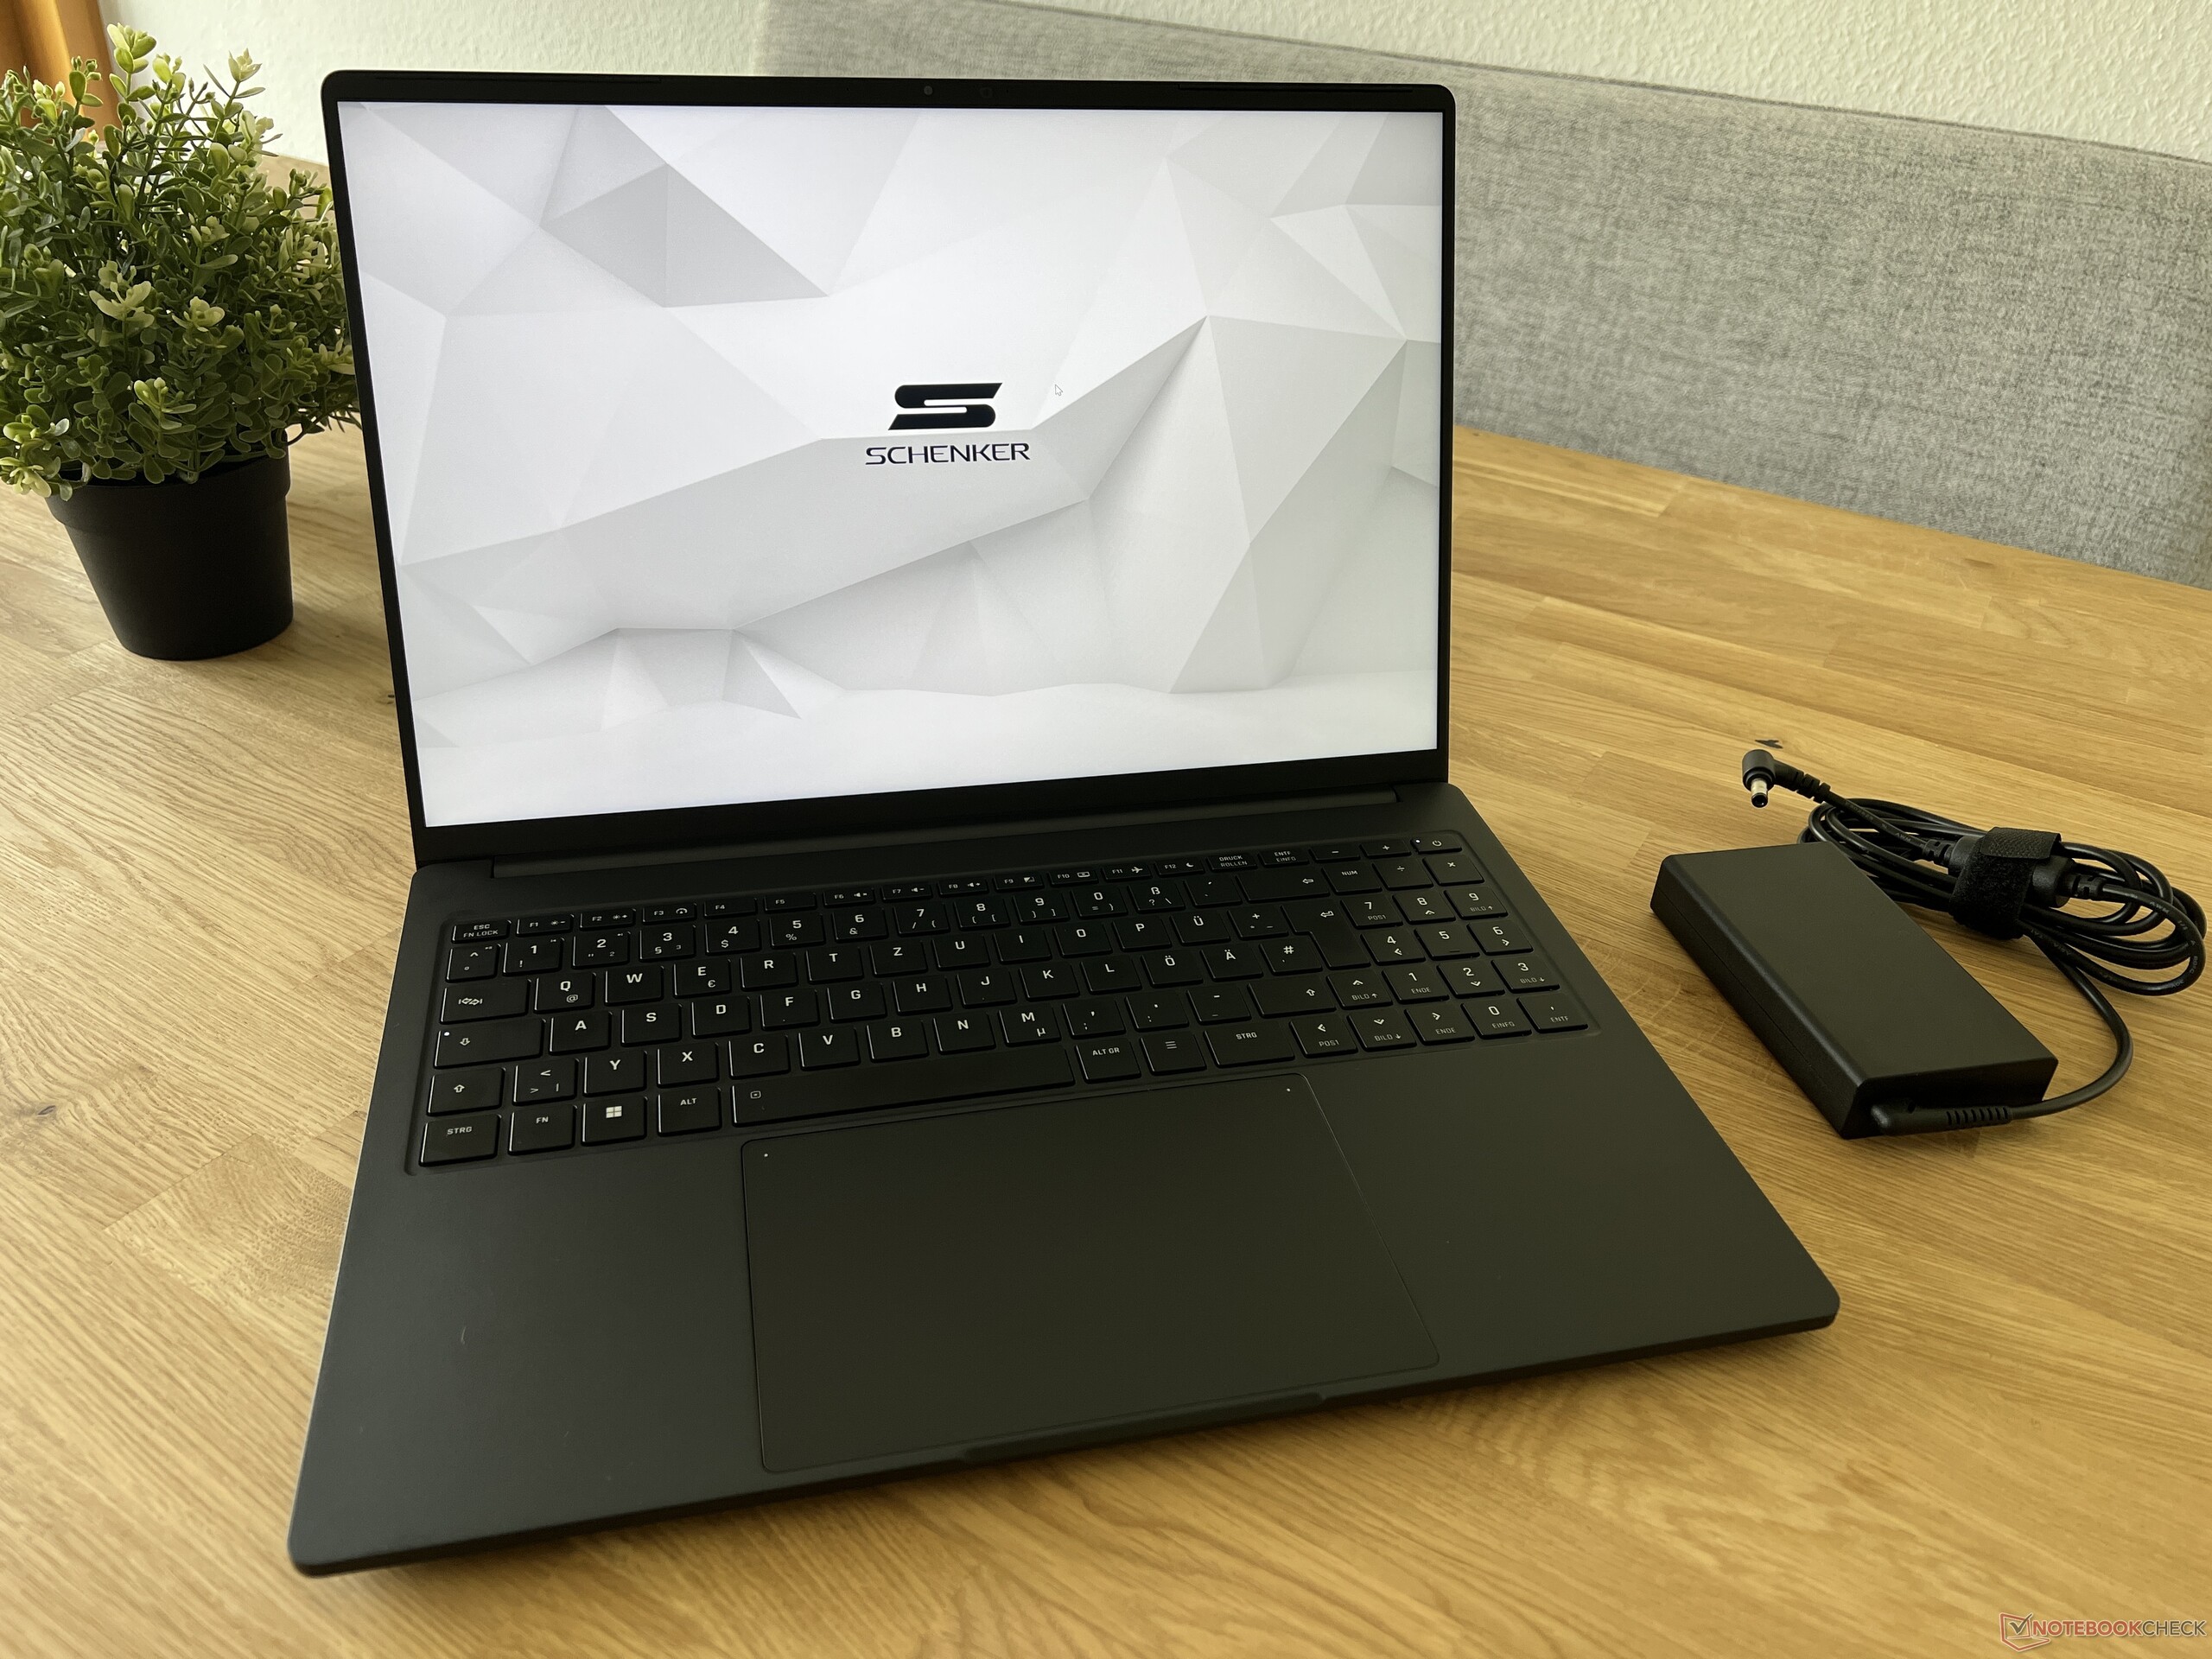
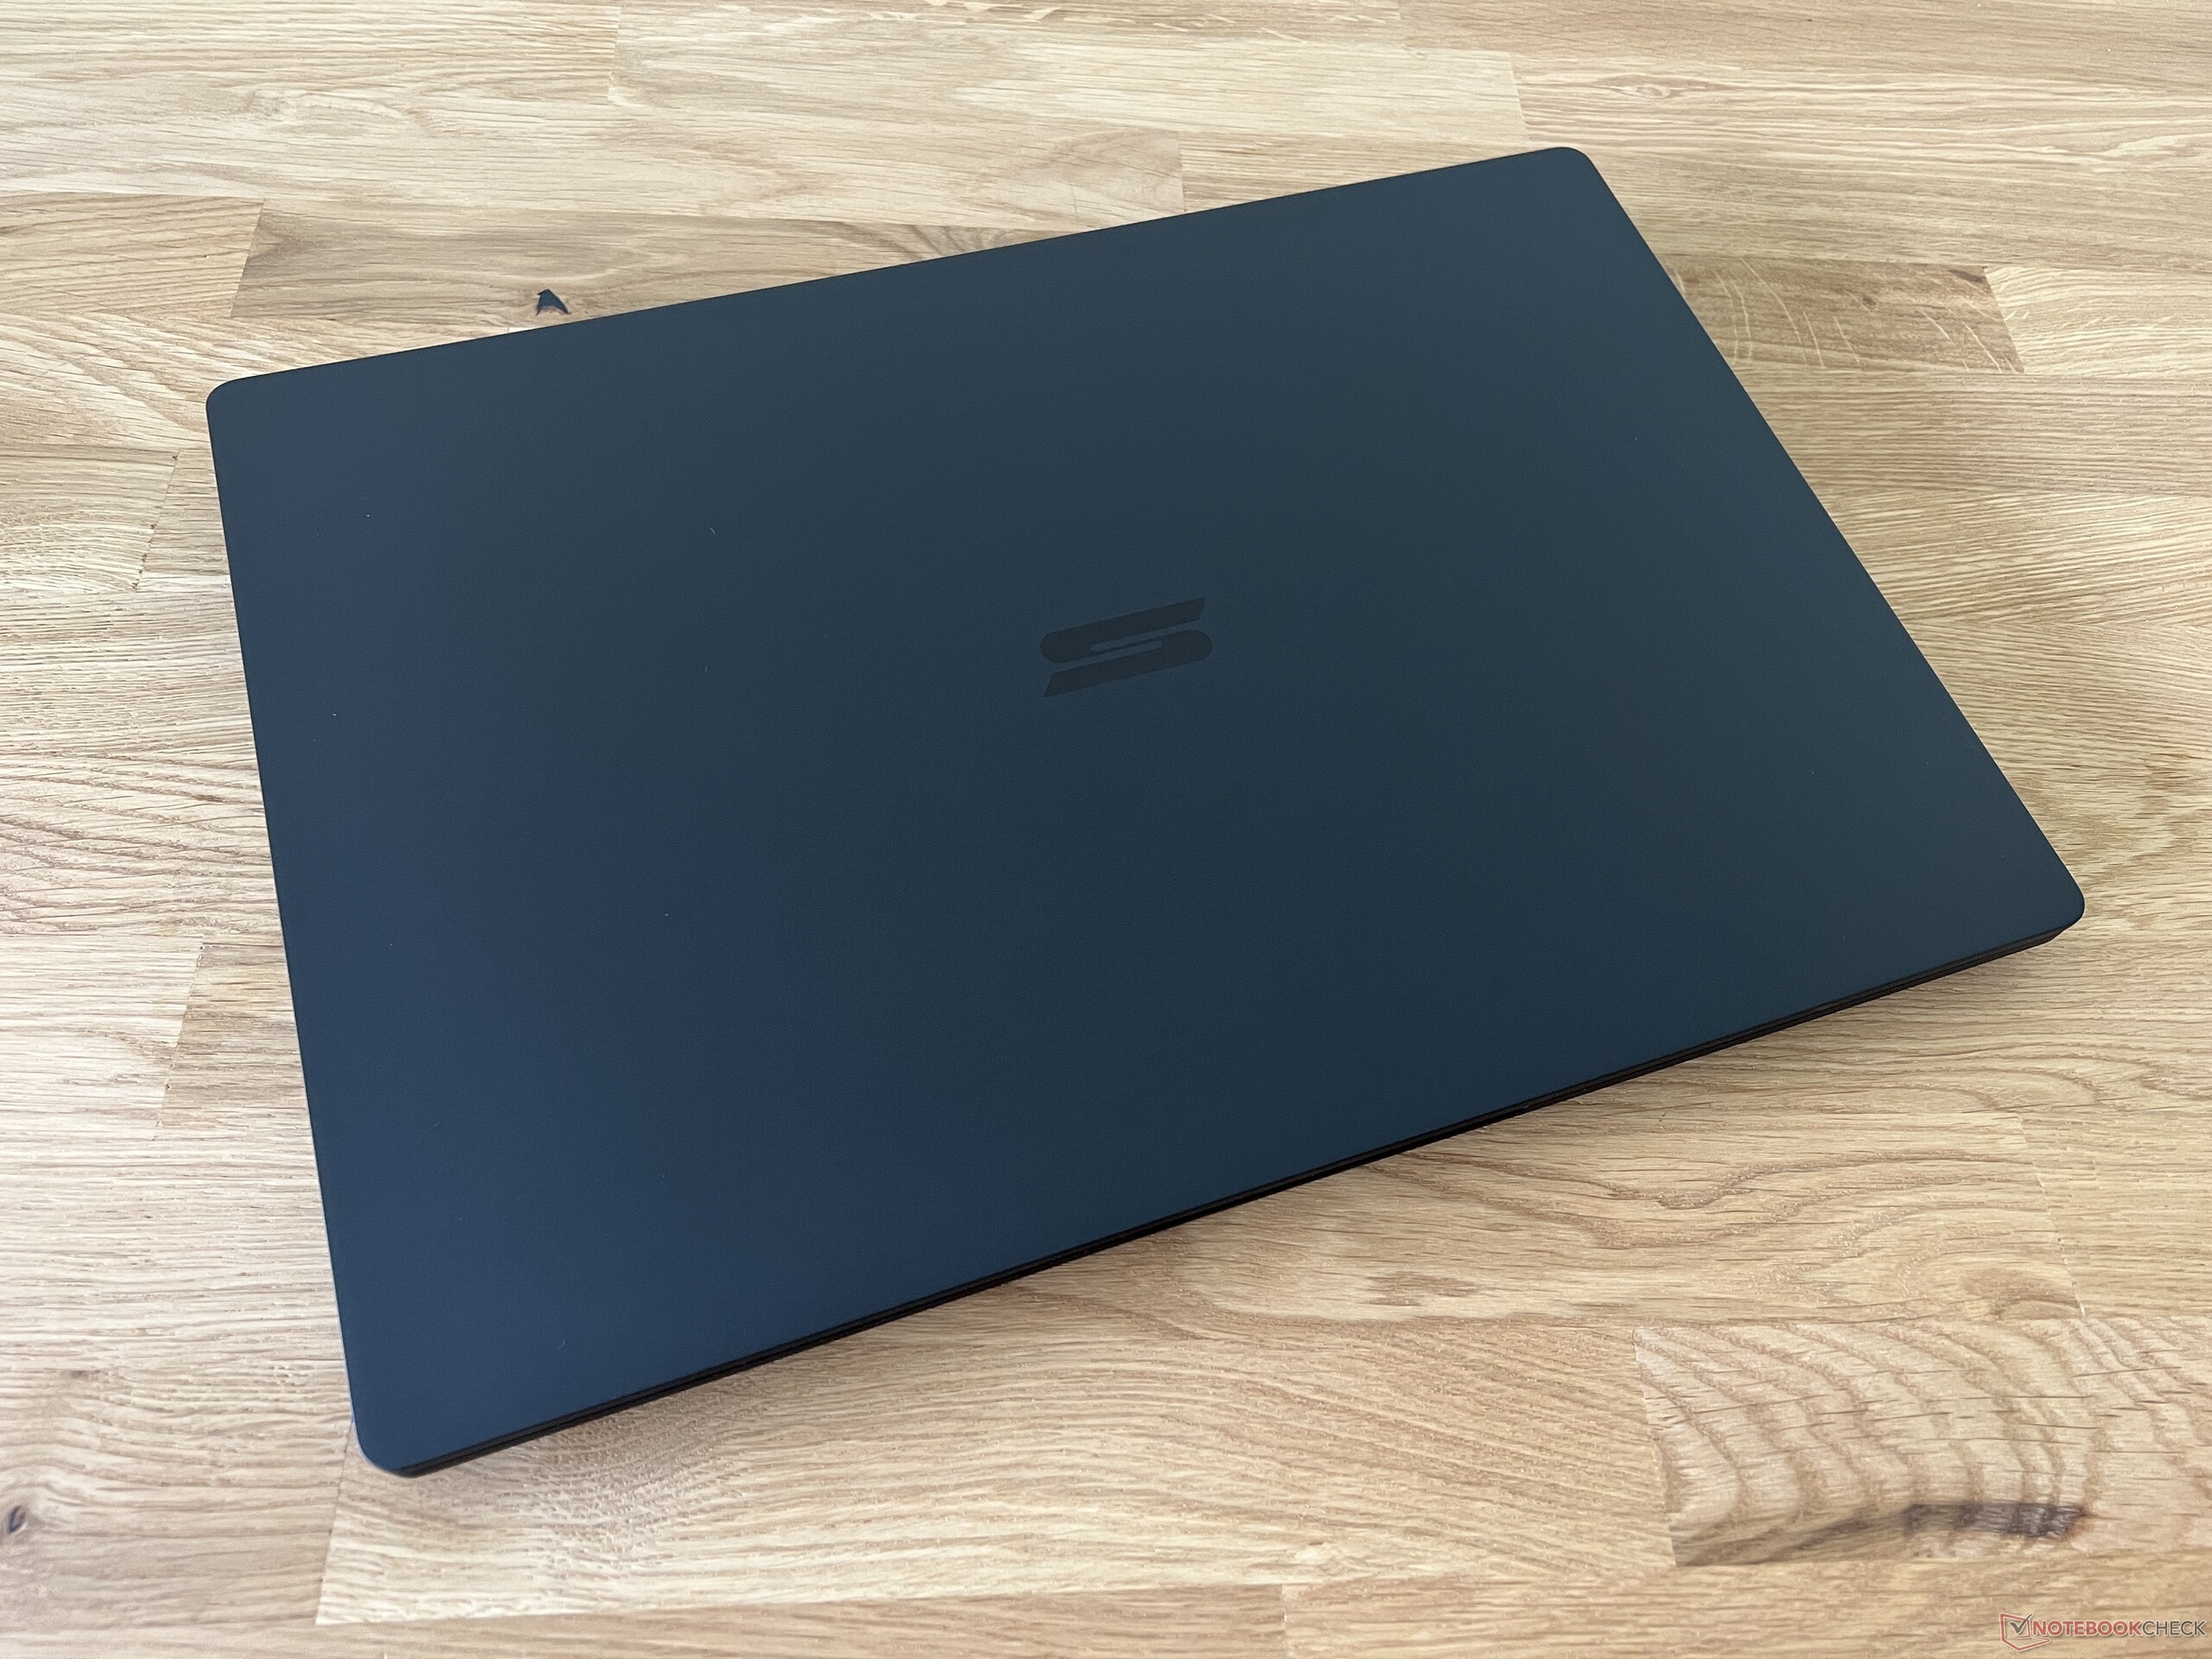
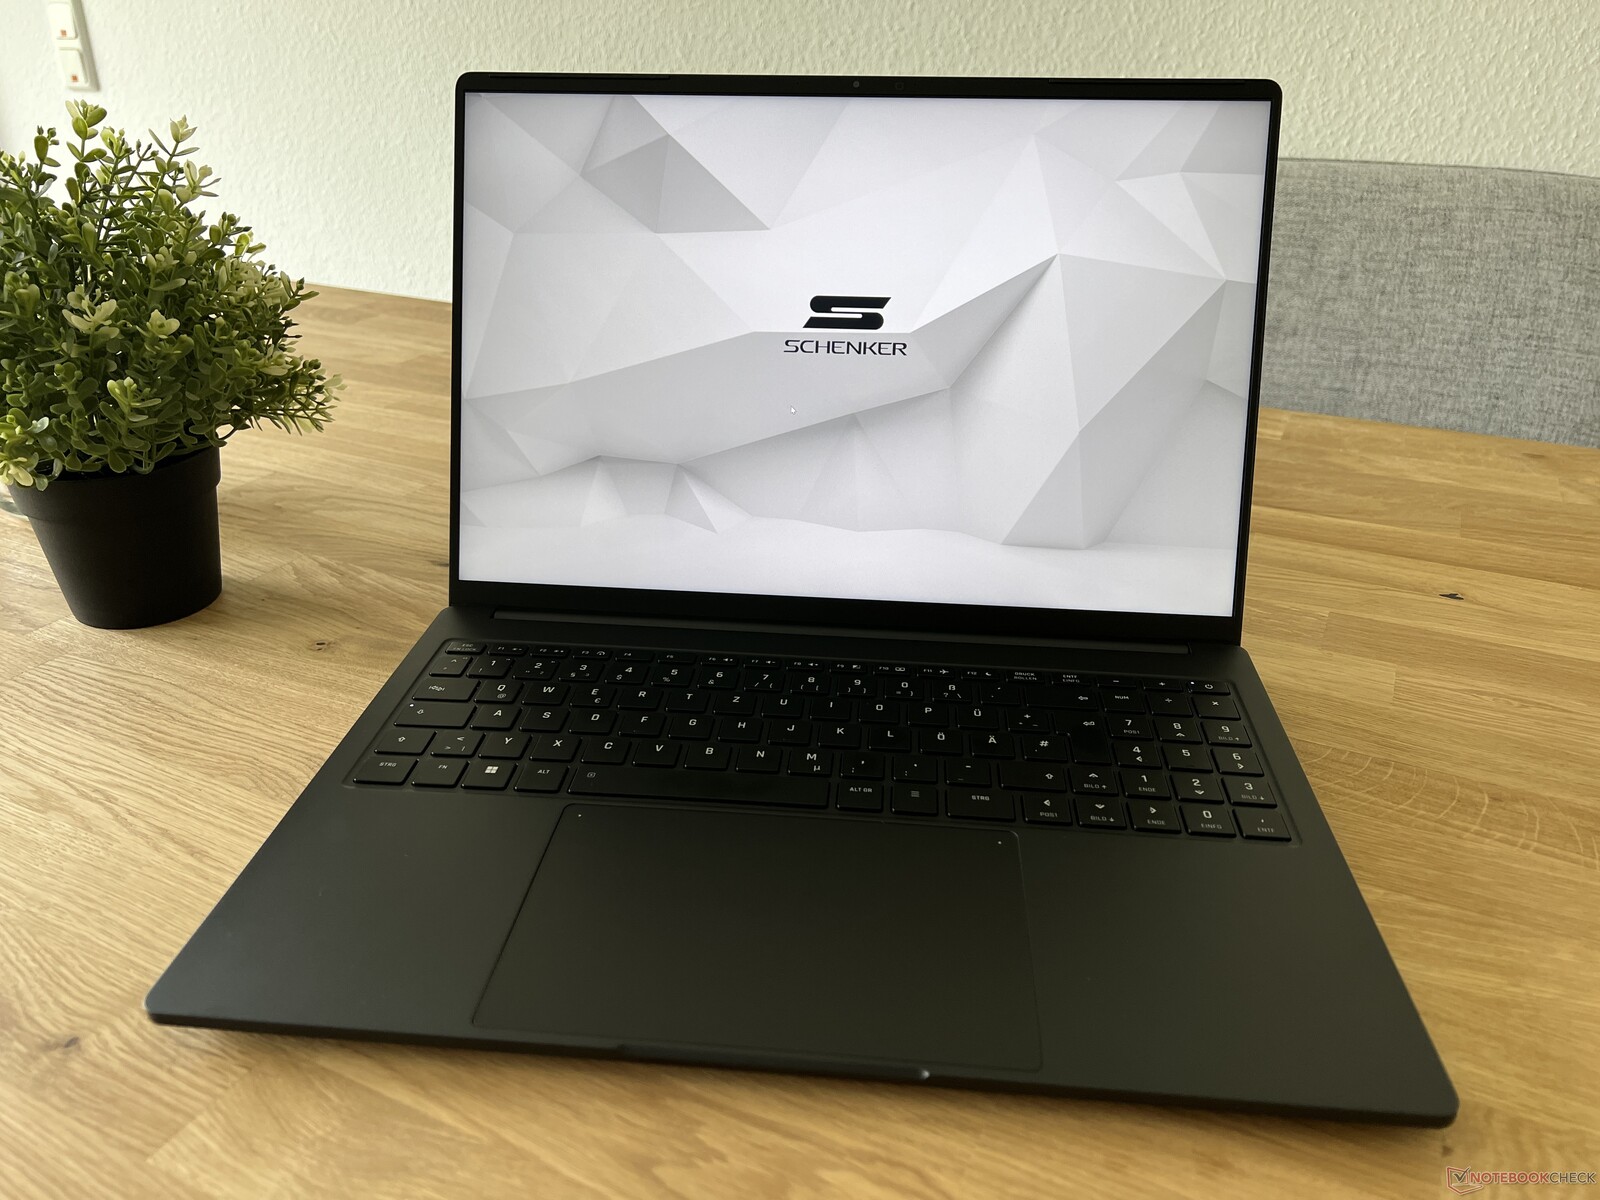
外壳 - 1.6 千克(约 3.5 磅)轻型镁合金外壳
自去年以来,申克公司在机箱方面没有任何改变,这次我们测试的是黑色版本。镁合金外壳(底座和显示屏盖)仅重 1.6 千克(约 3.5 磅),对于一款快速的 16 英寸笔记本电脑来说仍然非常轻巧。底座非常坚固,只有键盘中心可以向下微压,在日常操作中不会造成任何问题。薄薄的显示屏盖子略显灵活,铰链仍然允许一些明显的晃动。
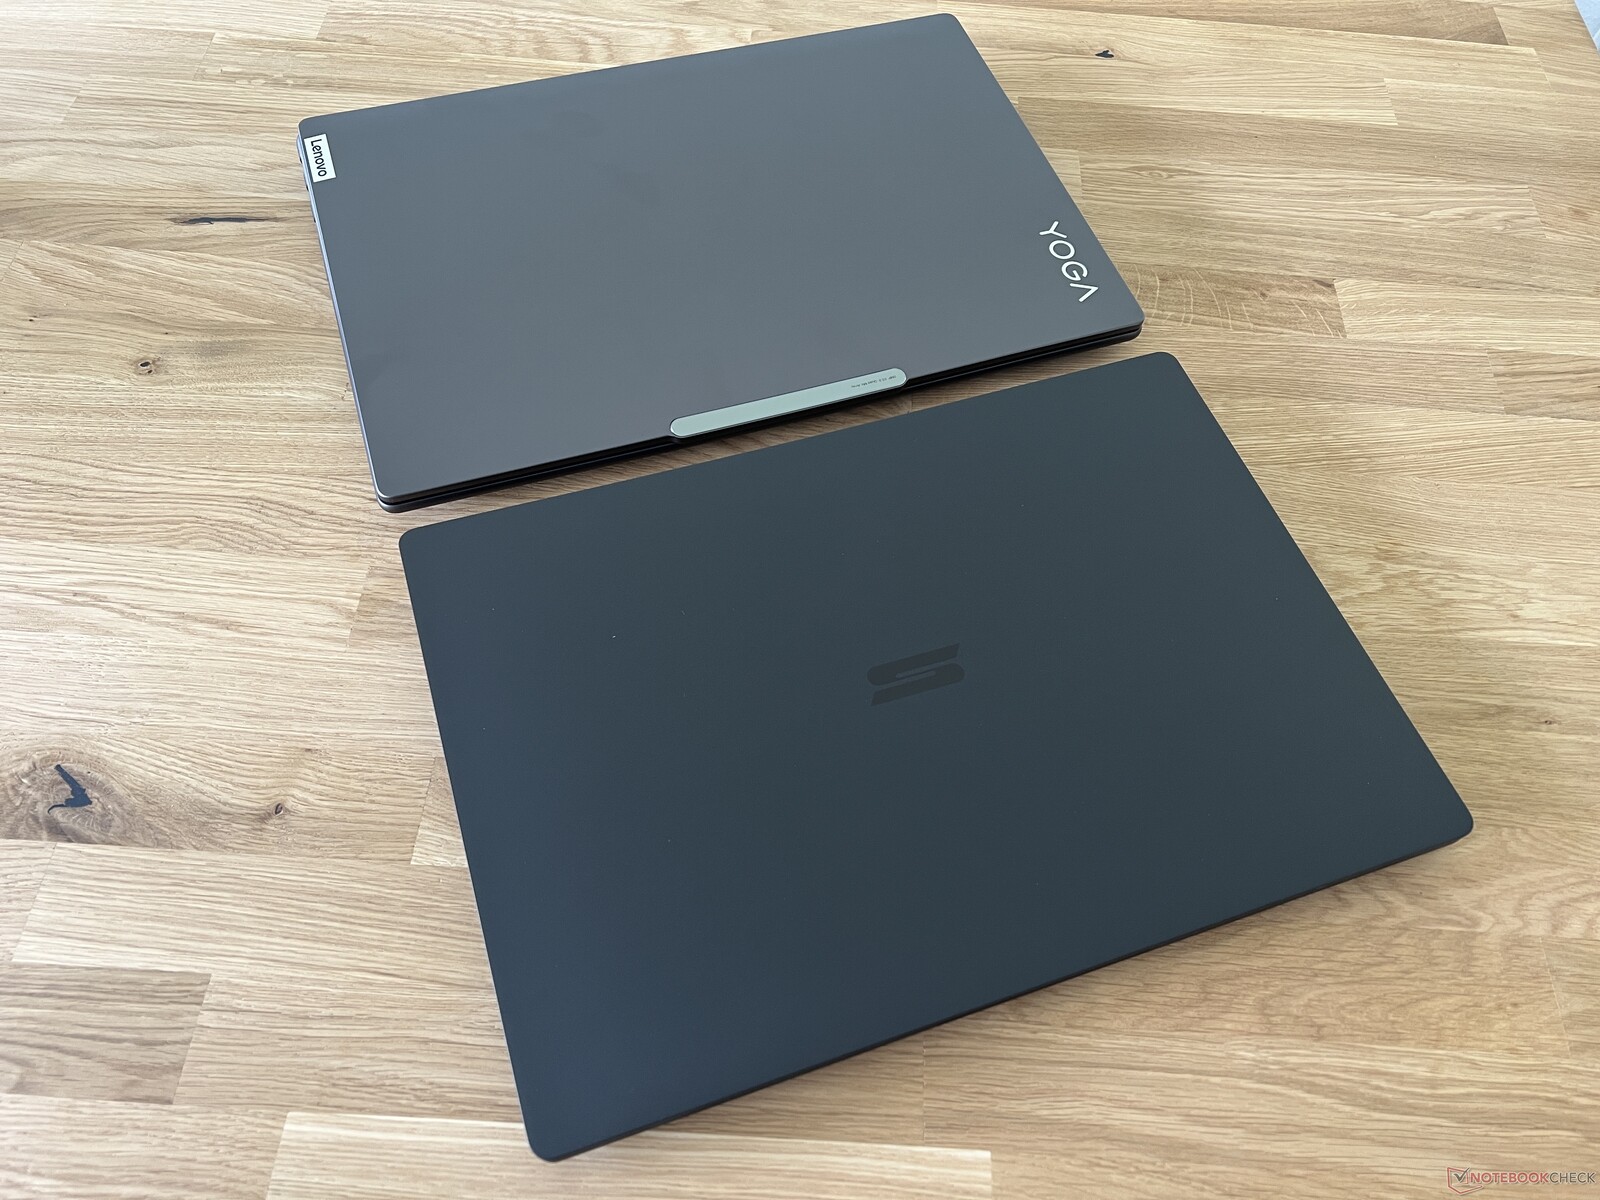
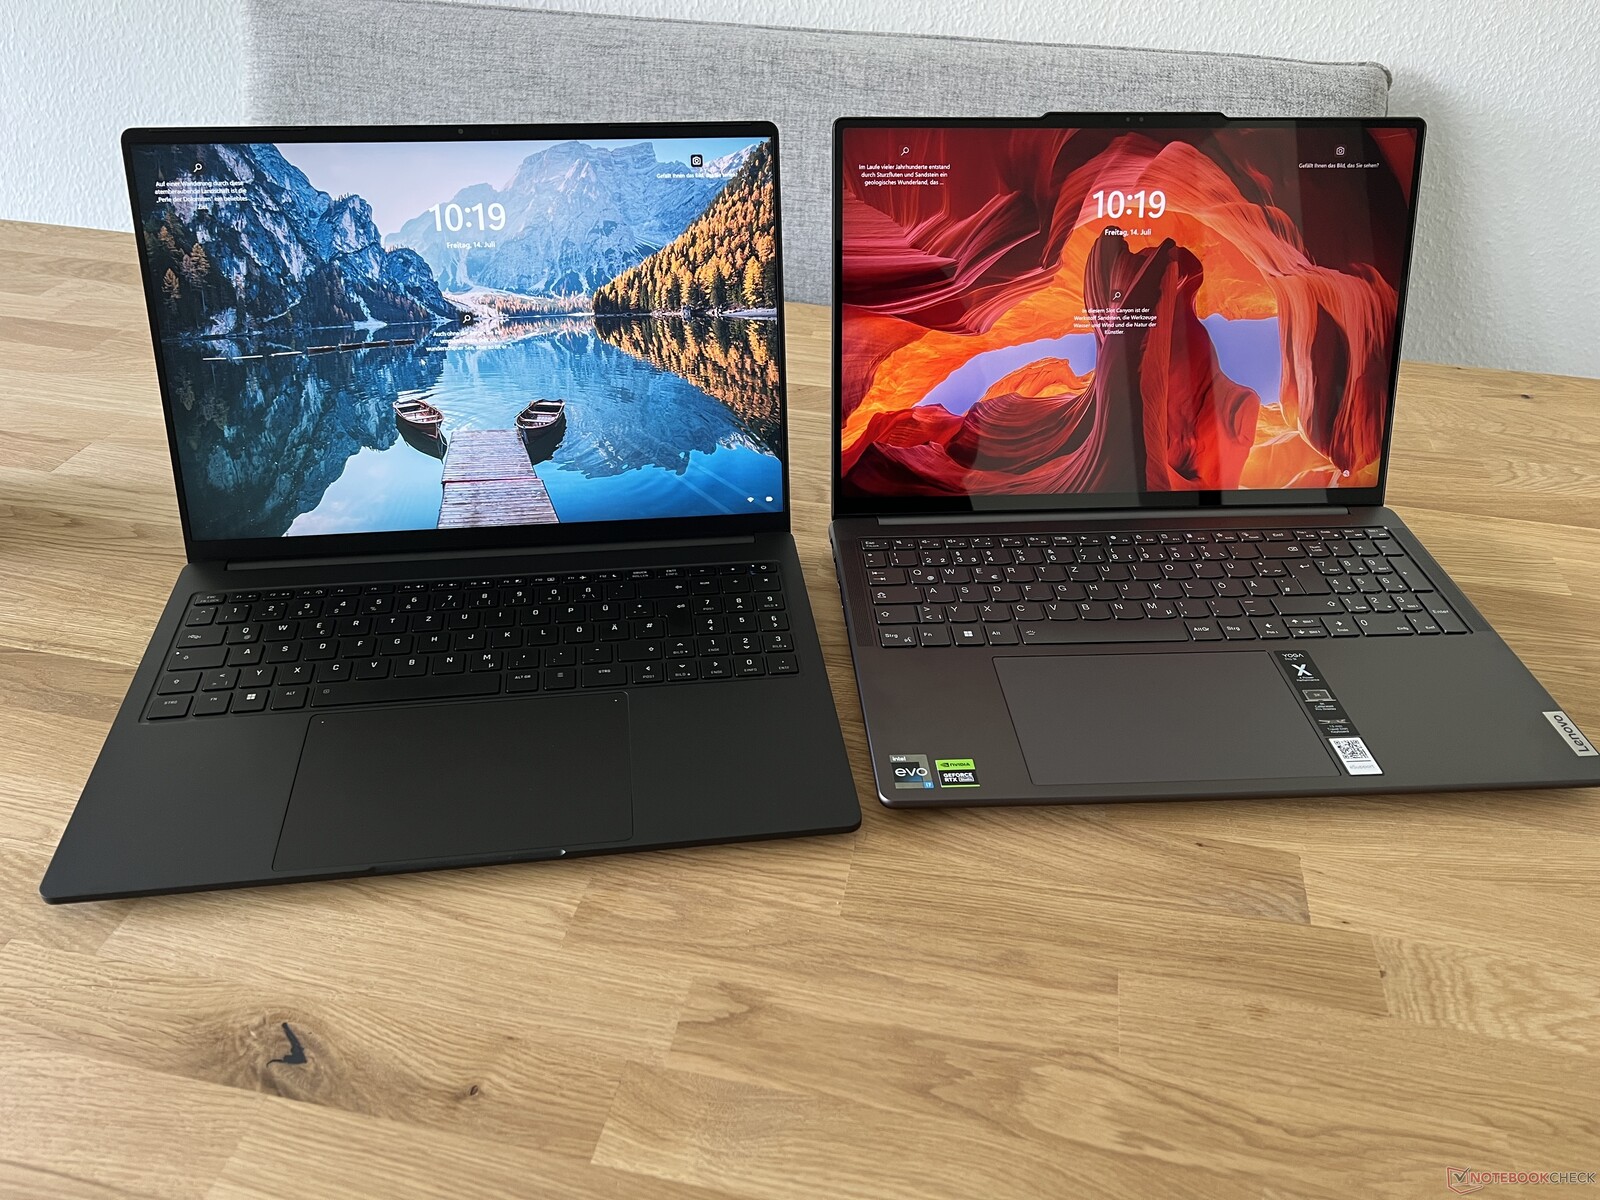
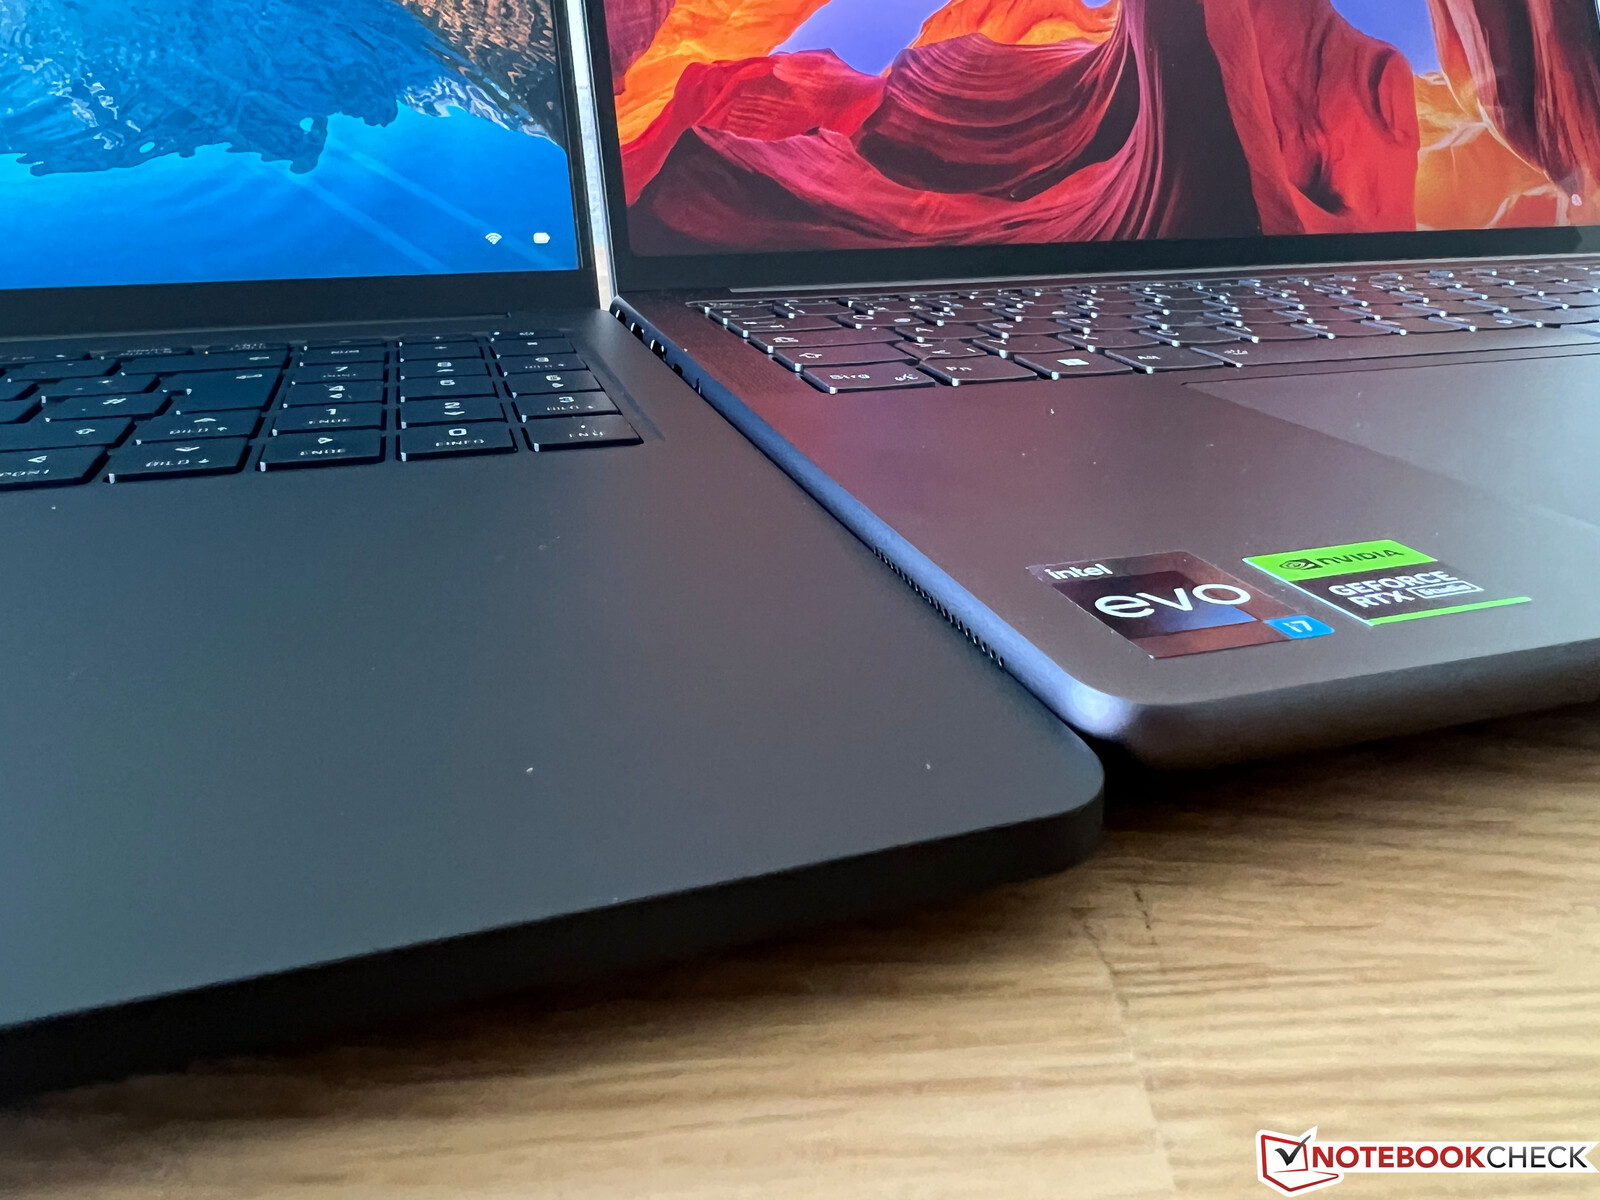
在尺寸对比中,Vision 16 Pro 也是迄今为止最小巧、同时也是最轻便的笔记本电脑。我们还拍摄了几张与我们正在测试的新款联想 Yoga Pro 9 16 的对比照片。它们的占地面积几乎完全相同,但你可以看到高度上的差异,尤其是底座。
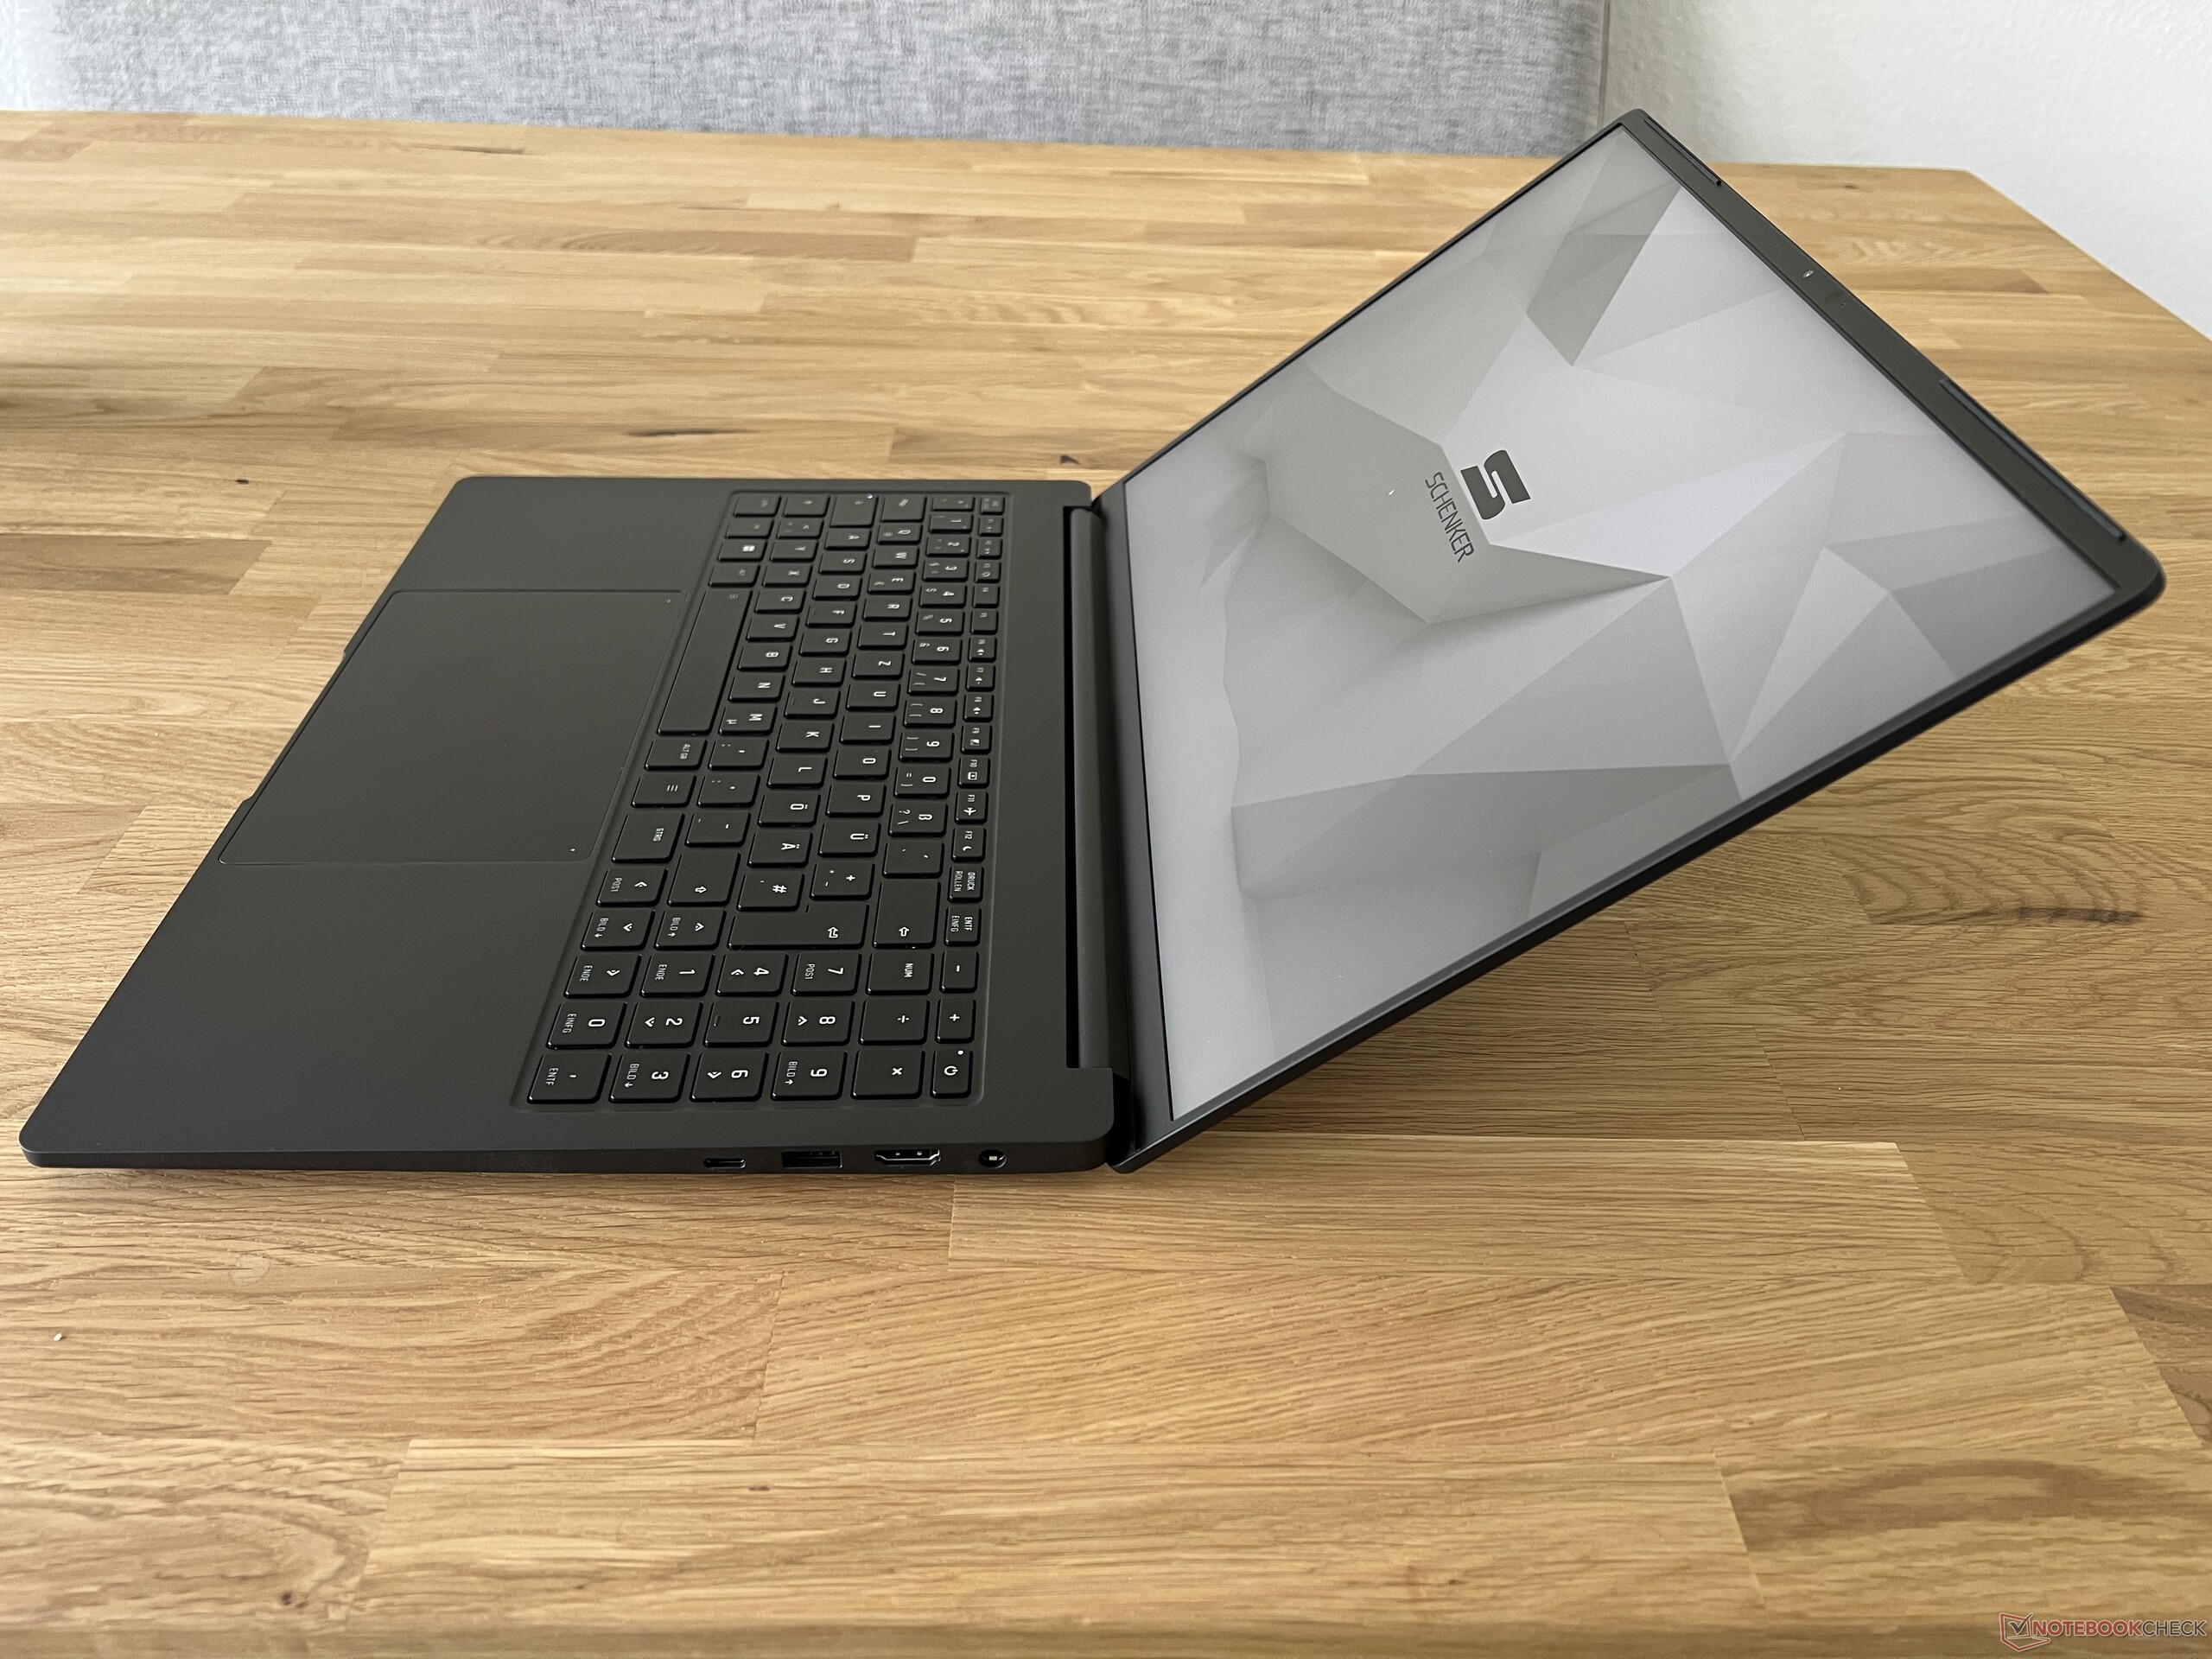
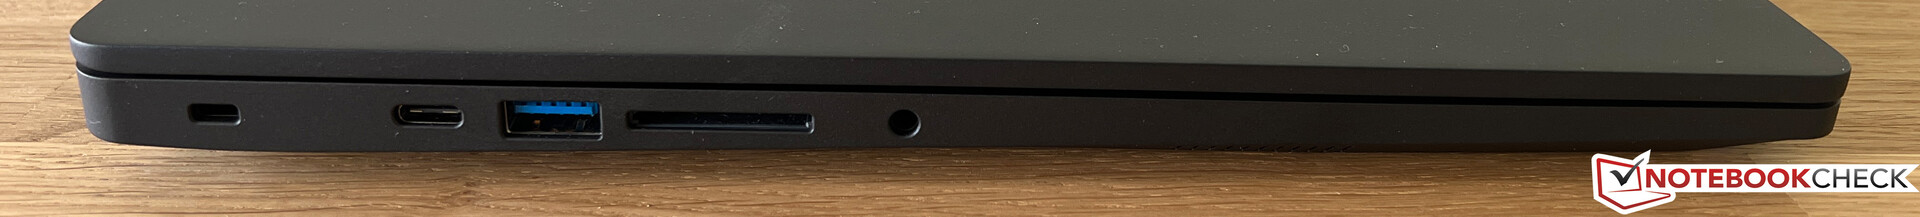
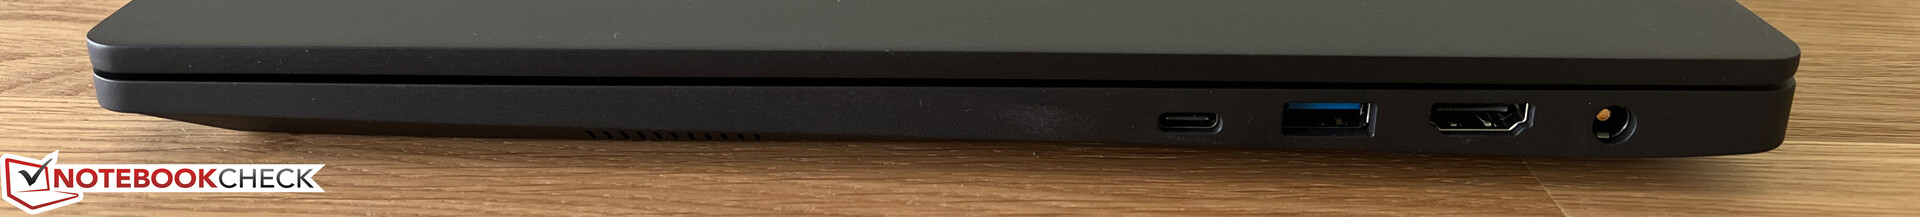
设备 - Thunderbolt 和读卡器
尽管机身纤薄,但 Vision 16 Pro 提供了所有重要的连接,包括 Thunderbolt 4 和 2x USB-A,因此实际上不需要适配器。接口分布在两侧,位于后部区域。在路上,您还可以通过 USB-C 接口(最小 65 瓦,最大 100 瓦)为笔记本电脑充电。与去年的机型相比,读卡器的速度明显变慢,我们用两张 SD 卡进行了测试。此外,由于 Vision 16 Pro 的天线配置不支持 6 GHz 网络(Wi-Fi 6E),因此在 WLAN 模块方面也不得不略作妥协。英特尔的 AX201 模块仍在使用(Wi-Fi 6),传输速率非常不错。1080p 网络摄像头可在合理的光线条件下录制清晰的视频。此外,还有一个红外模块,可通过 Windows Hello 进行人脸识别。
| SD Card Reader | |
| average JPG Copy Test (av. of 3 runs) | |
| Apple MacBook Pro 16 2023 M2 Max (Angelbird AV Pro V60) | |
| MSI Stealth 16 Studio A13VG | |
| Dell XPS 15 9530 RTX 4070 (Toshiba Exceria Pro SDXC 64 GB UHS-II) | |
| Average of class Multimedia (23 - 531, n=37, last 2 years) | |
| Schenker Vision 16 Pro RTX 3070 Ti (AV Pro V60) | |
| Samsung Galaxy Book3 Ultra 16, i9-13900H RTX 4070 (AV Pro SD microSD 128 GB V60) | |
| Asus ProArt Studiobook 16 OLED H7604 (Angelibird AV Pro V60) | |
| Schenker VISION 16 Pro (M23) (Angelbird AV Pro V60) | |
| maximum AS SSD Seq Read Test (1GB) | |
| Apple MacBook Pro 16 2023 M2 Max (Angelbird AV Pro V60) | |
| Average of class Multimedia (37.3 - 1455, n=36, last 2 years) | |
| Dell XPS 15 9530 RTX 4070 (Toshiba Exceria Pro SDXC 64 GB UHS-II) | |
| MSI Stealth 16 Studio A13VG | |
| Samsung Galaxy Book3 Ultra 16, i9-13900H RTX 4070 (AV Pro SD microSD 128 GB V60) | |
| Asus ProArt Studiobook 16 OLED H7604 (Angelibird AV Pro V60) | |
| Schenker Vision 16 Pro RTX 3070 Ti (AV Pro V60) | |
| Schenker VISION 16 Pro (M23) (Angelbird AV Pro V60) | |
| Networking | |
| Schenker VISION 16 Pro (M23) | |
| iperf3 transmit AXE11000 | |
| iperf3 receive AXE11000 | |
| Samsung Galaxy Book3 Ultra 16, i9-13900H RTX 4070 | |
| iperf3 transmit AXE11000 | |
| iperf3 receive AXE11000 | |
| iperf3 transmit AXE11000 6GHz | |
| iperf3 receive AXE11000 6GHz | |
| MSI Stealth 16 Studio A13VG | |
| iperf3 transmit AXE11000 | |
| iperf3 receive AXE11000 | |
| iperf3 transmit AXE11000 6GHz | |
| iperf3 receive AXE11000 6GHz | |
| Dell XPS 15 9530 RTX 4070 | |
| iperf3 transmit AXE11000 | |
| iperf3 receive AXE11000 | |
| Asus ProArt Studiobook 16 OLED H7604 | |
| iperf3 transmit AXE11000 | |
| iperf3 receive AXE11000 | |
| Apple MacBook Pro 16 2023 M2 Max | |
| iperf3 transmit AXE11000 6GHz | |
| iperf3 receive AXE11000 6GHz | |
| Schenker Vision 16 Pro RTX 3070 Ti | |
| iperf3 transmit AXE11000 | |
| iperf3 receive AXE11000 | |

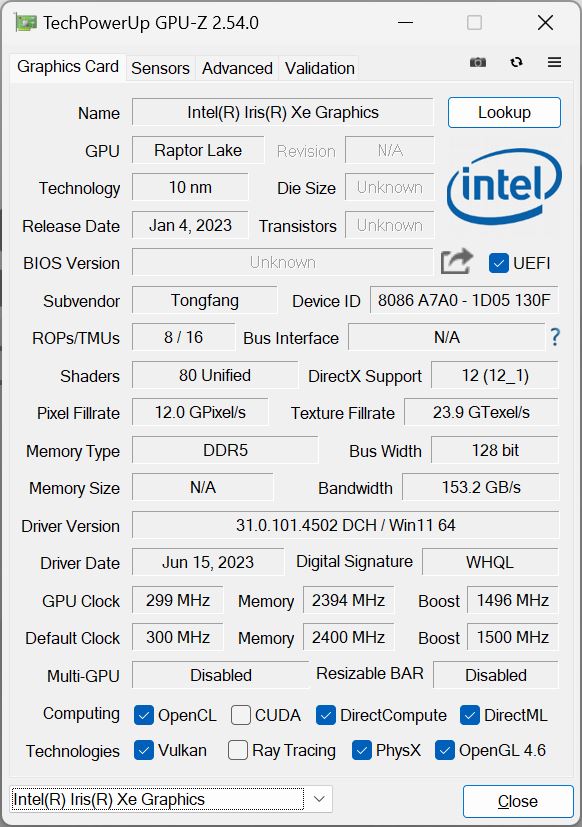
 GeForce RTX 4070 Laptop GPU, i7-13700H, Samsung 990 Pro 1 TB")
 GeForce RTX 4070 Laptop GPU, i7-13700H, Samsung 990 Pro 1 TB")
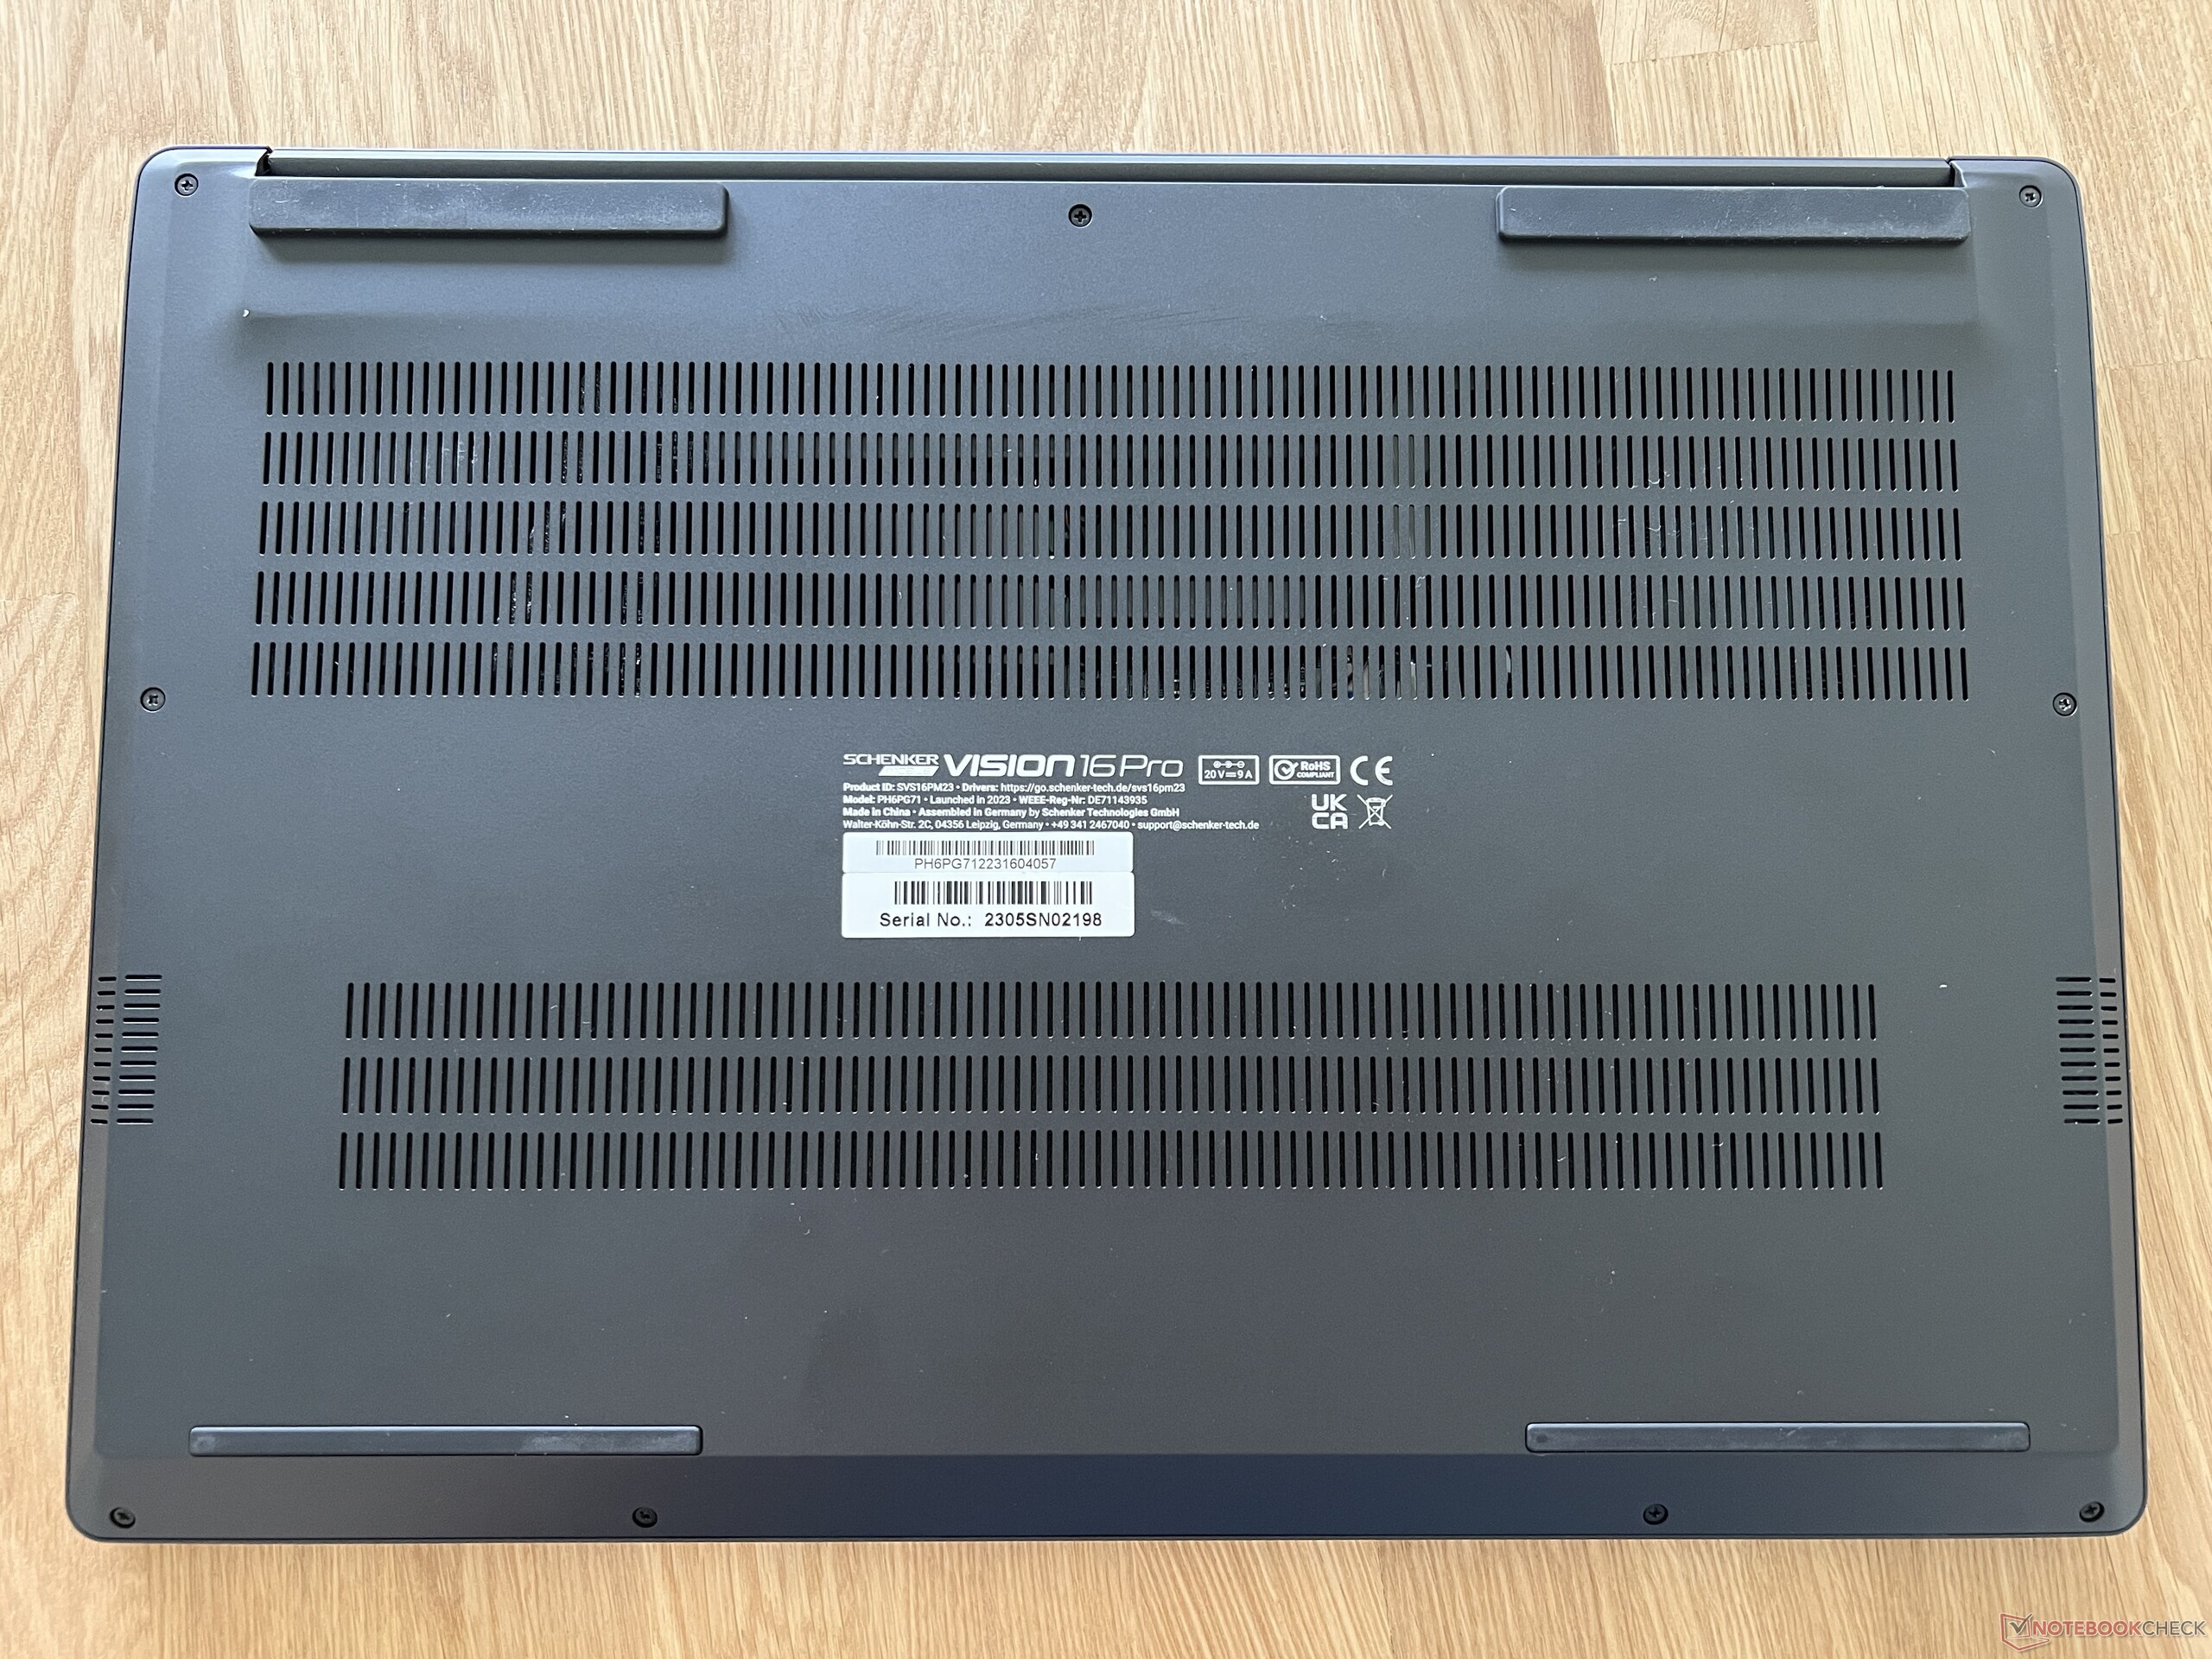
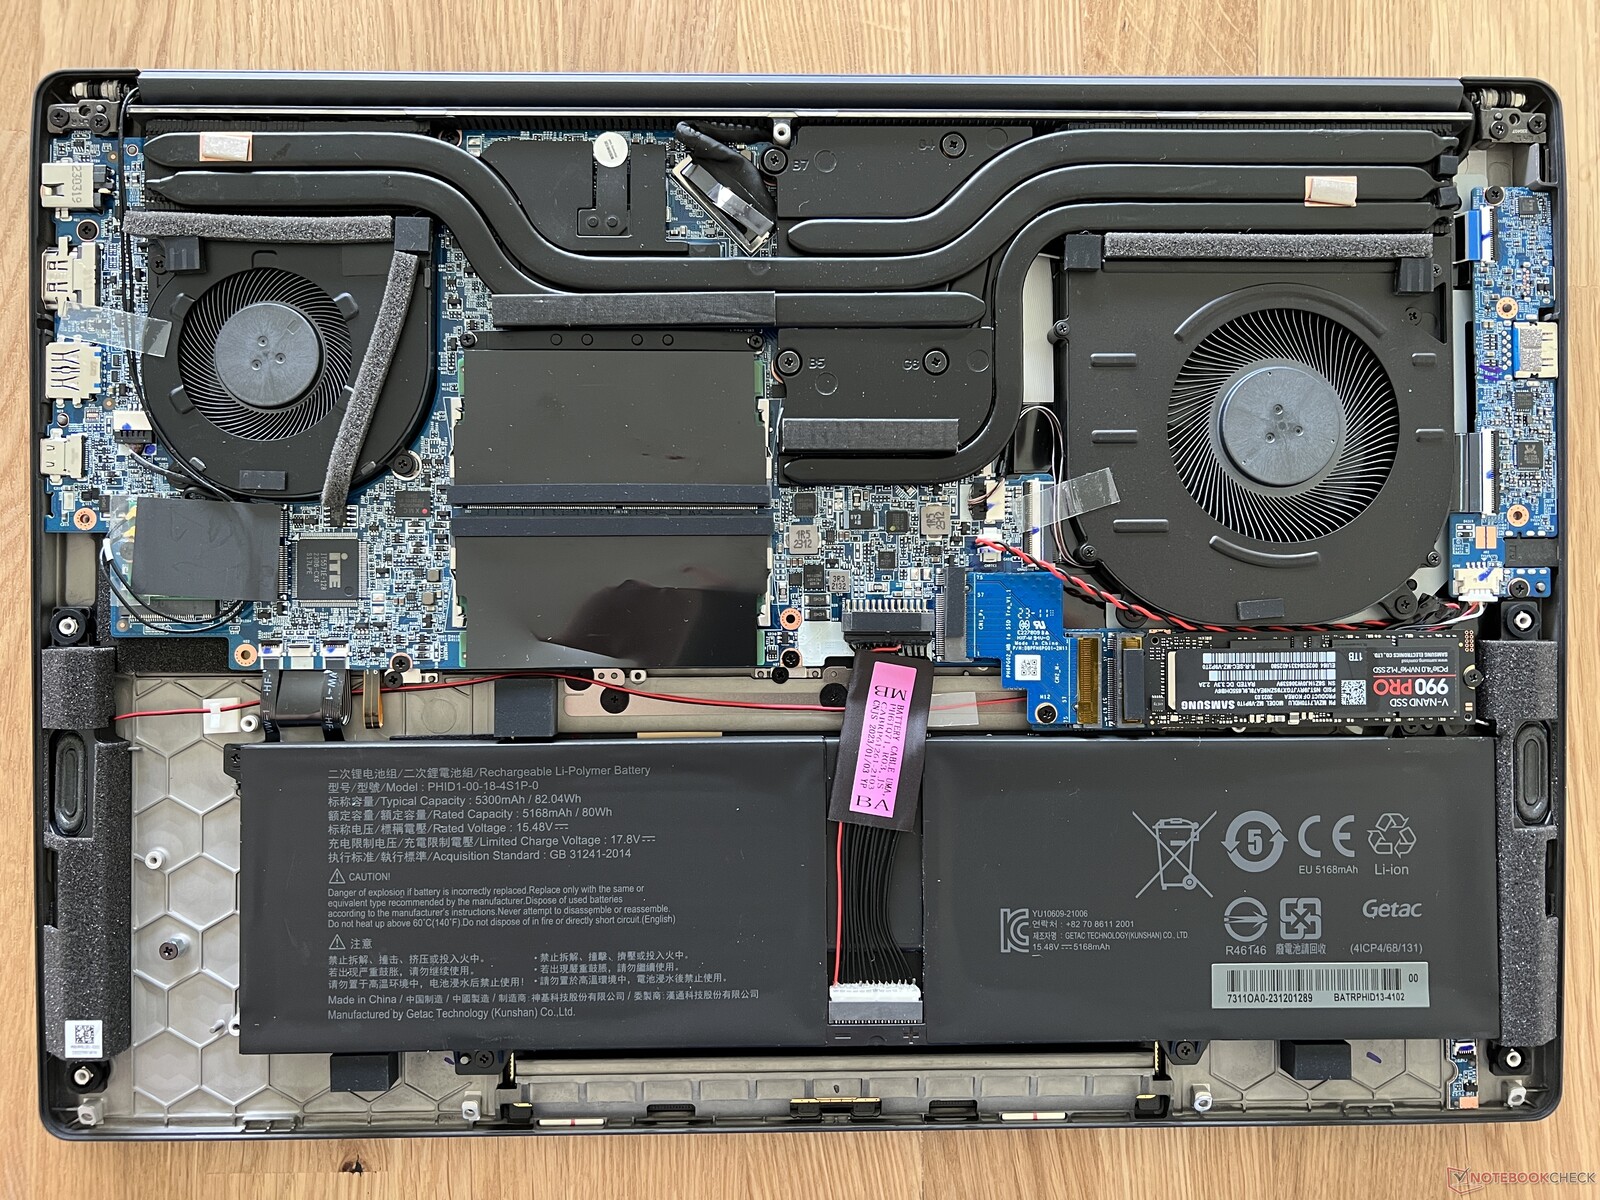
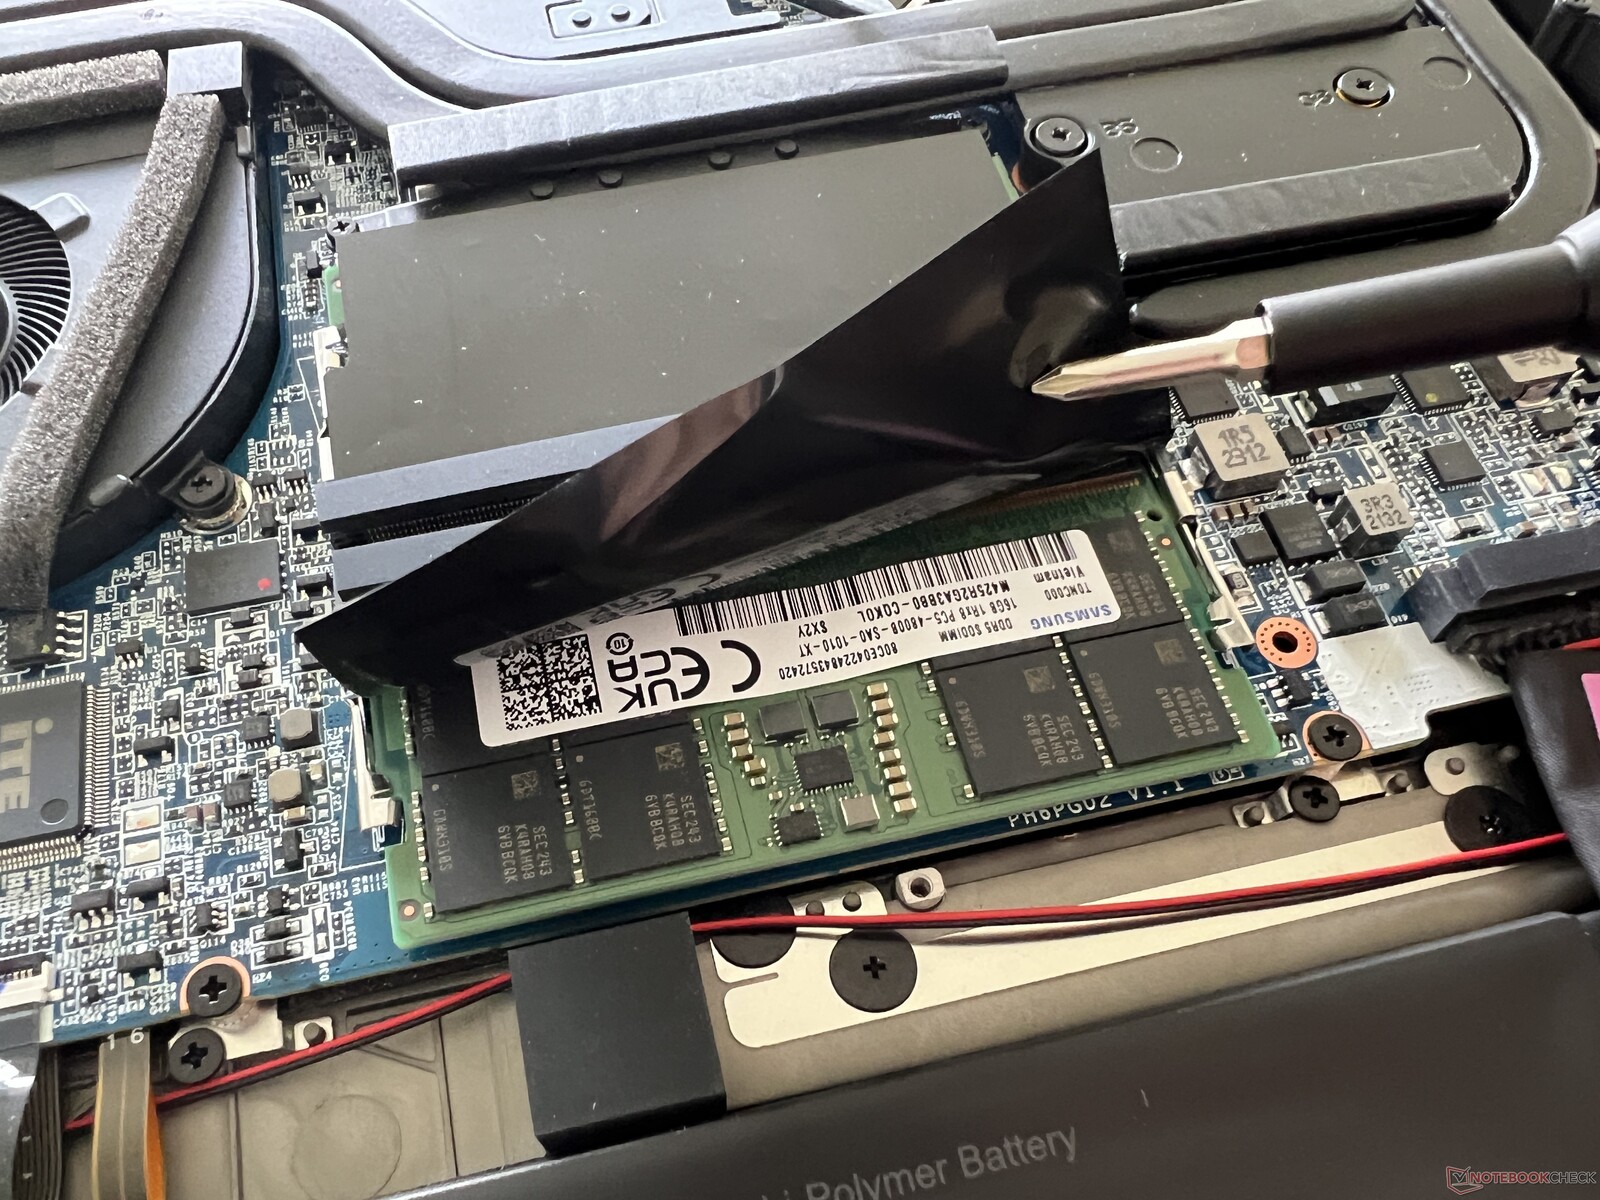
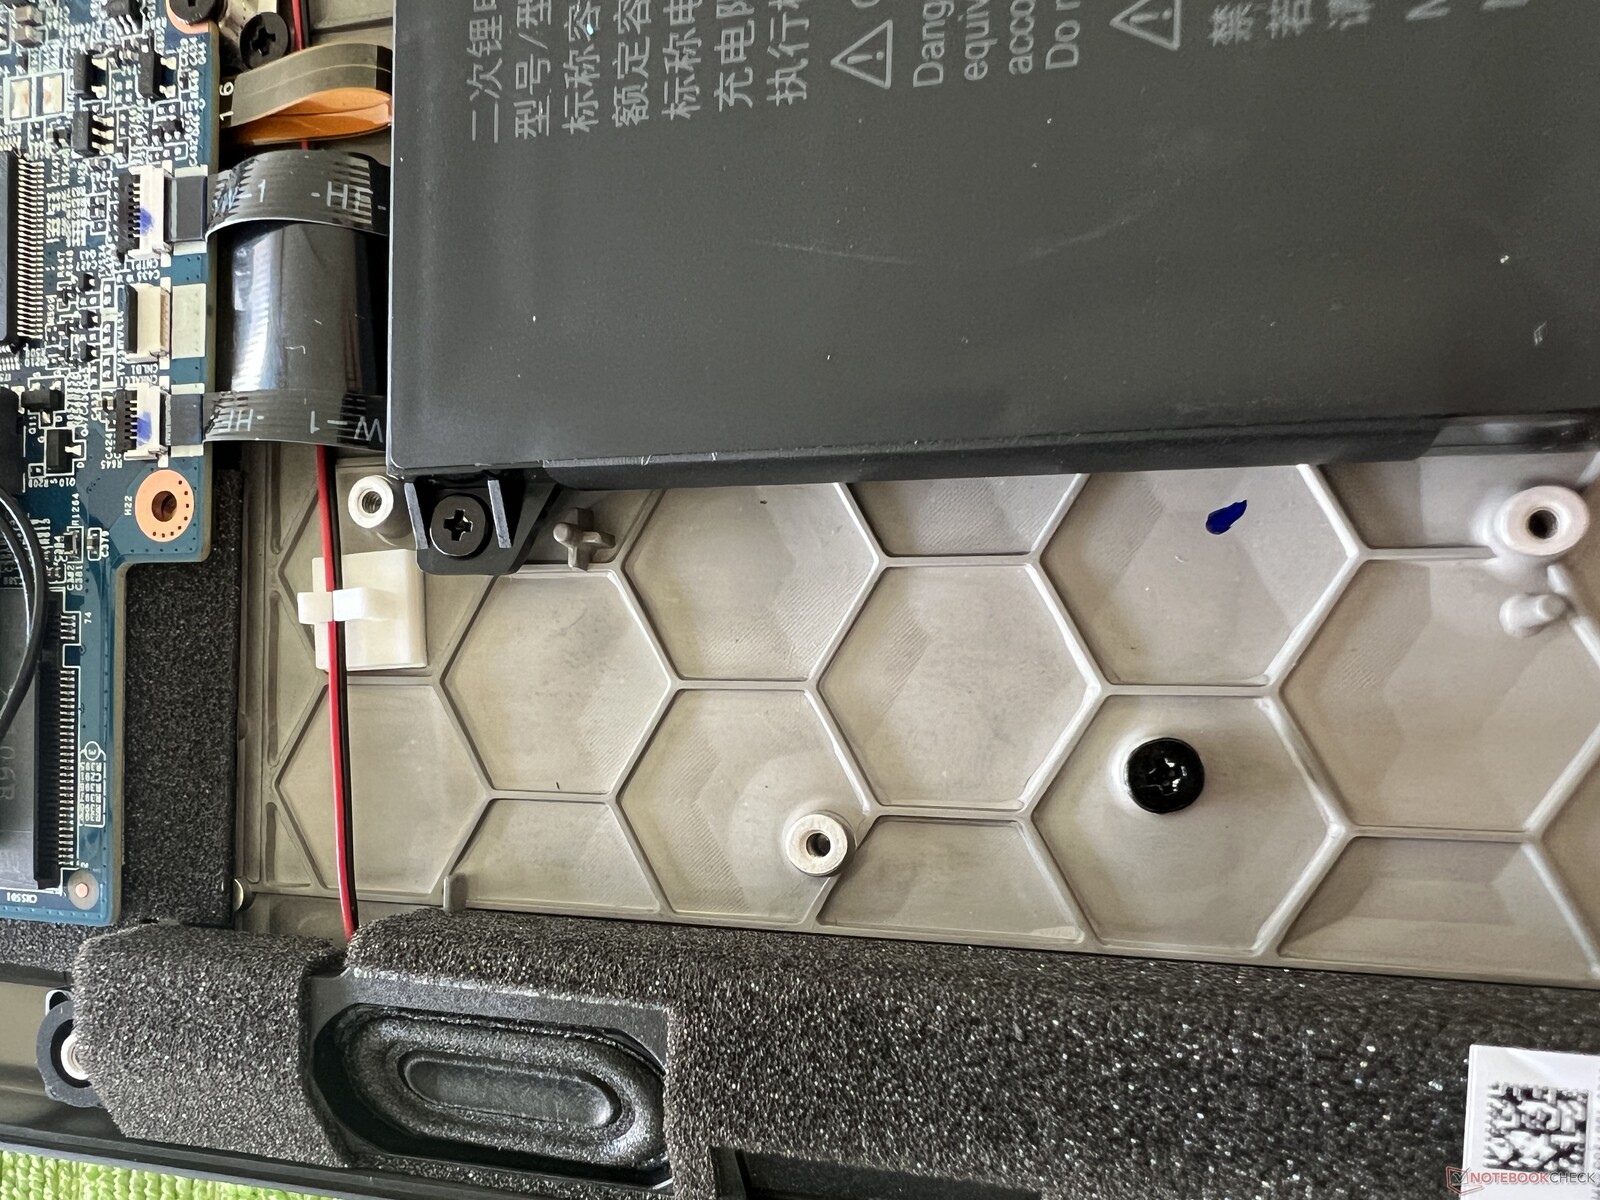
维护
机箱底部用几颗普通的十字螺丝固定,可以轻松拆卸。在机箱内部,除了热导管的位置略有变化外,其他配置基本相同。用户可以使用两个风扇、SO-DIMM 插槽和两个 M.2 2280 SSD 插槽,但只支持单面第二个 SSD。
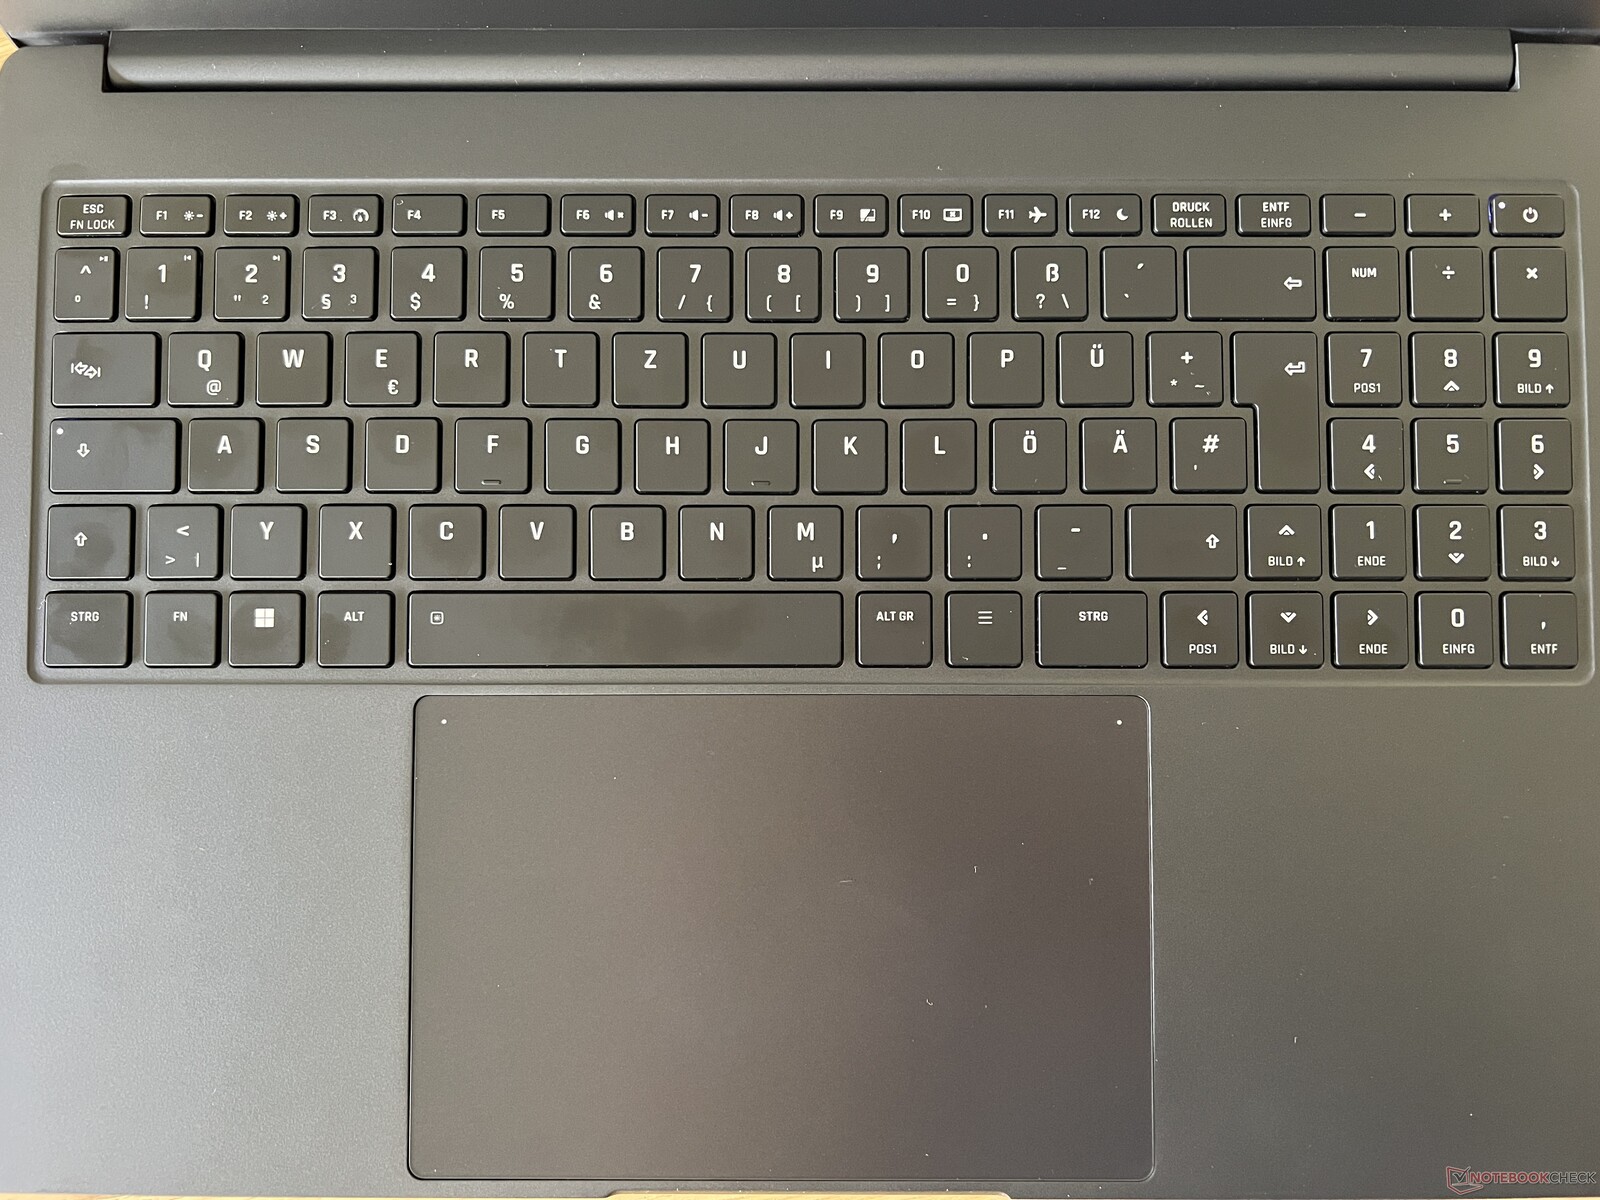
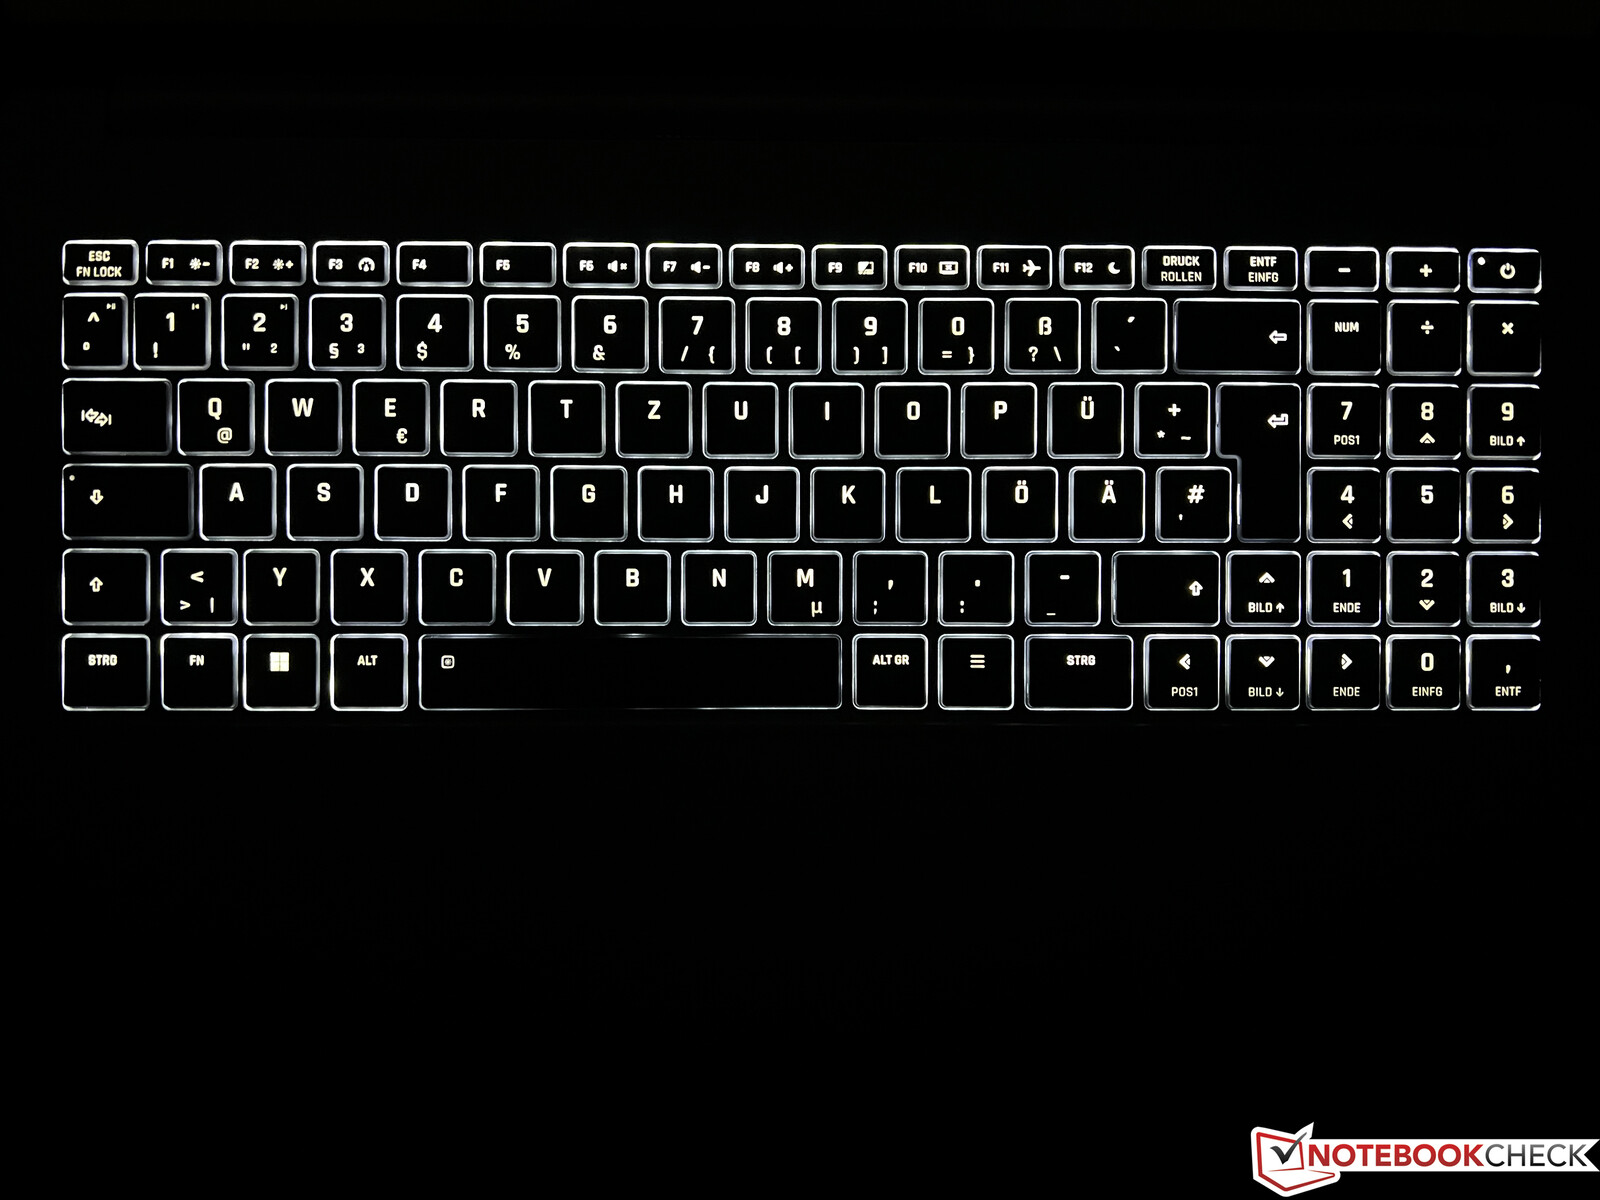
输入设备 - 大型单击板和数字块
全尺寸键盘提供专门的数字区块,包括大尺寸方向键,但这也意味着没有额外的回车键,Shift 键的尺寸也有所减小。总的来说,键盘非常准确、舒适,按键的声音也非常小,只有空格键和回车键的声音稍大。在光线较暗的环境中,白色的两段式键盘照明非常有用。巨大的玻璃 ClickPad(15.4 x 10 厘米,约 6 x 4 英寸)易于操作,为手势和光标移动提供了很大的空间。只是点击的声音有点大。
显示屏 - WQHD 面板,240 赫兹
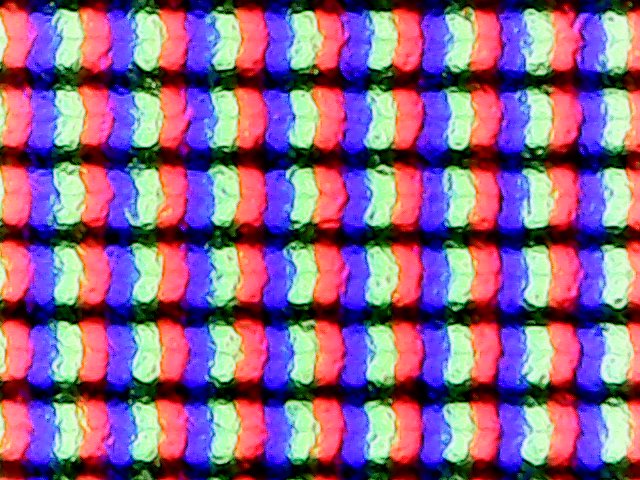
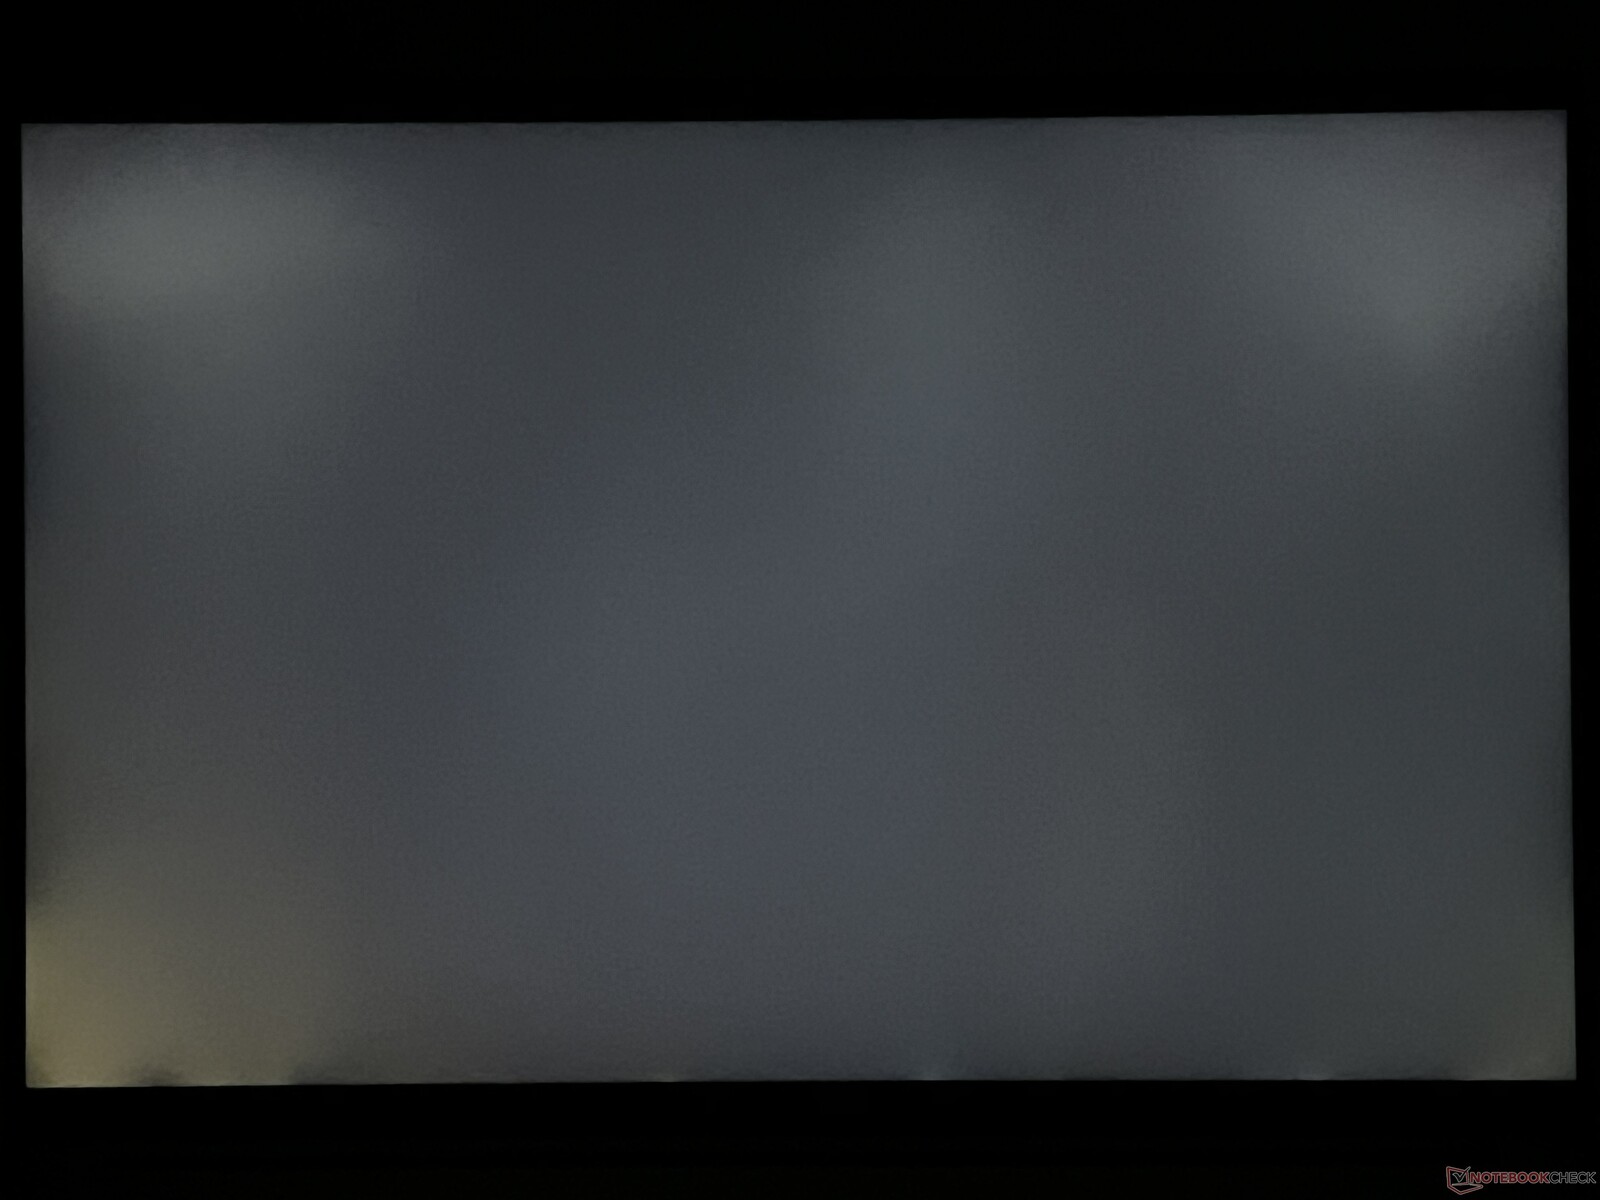
显示屏保持不变,仍为 WQHD 雾面面板,分辨率为 2,560 x 1,600 Pixel,刷新率为 240 Hz。主观的图像印象非常好,因为即使是明亮的区域也能显示出来,没有任何颗粒感。面板(NE160QDM-NZ1)的亮度规定为 350 cd/m²,而我们的面板甚至略高于此,平均亮度为 370 cd/m²。黑色值为 0.3 cd/m²,对比度超过 1,200:1。
240 Hz 的刷新率让人感觉动作非常流畅,响应时间也很快。只有在全亮度下的暗图像中才能看到光晕,但这在实际操作中不会成为问题。未使用 PWM。
| |||||||||||||||||||||||||
Brightness Distribution: 88 %
Center on Battery: 384 cd/m²
Contrast: 1280:1 (Black: 0.3 cd/m²)
ΔE ColorChecker Calman: 3.4 | ∀{0.5-29.43 Ø4.71}
calibrated: 1.3
ΔE Greyscale Calman: 3.4 | ∀{0.09-98 Ø4.96}
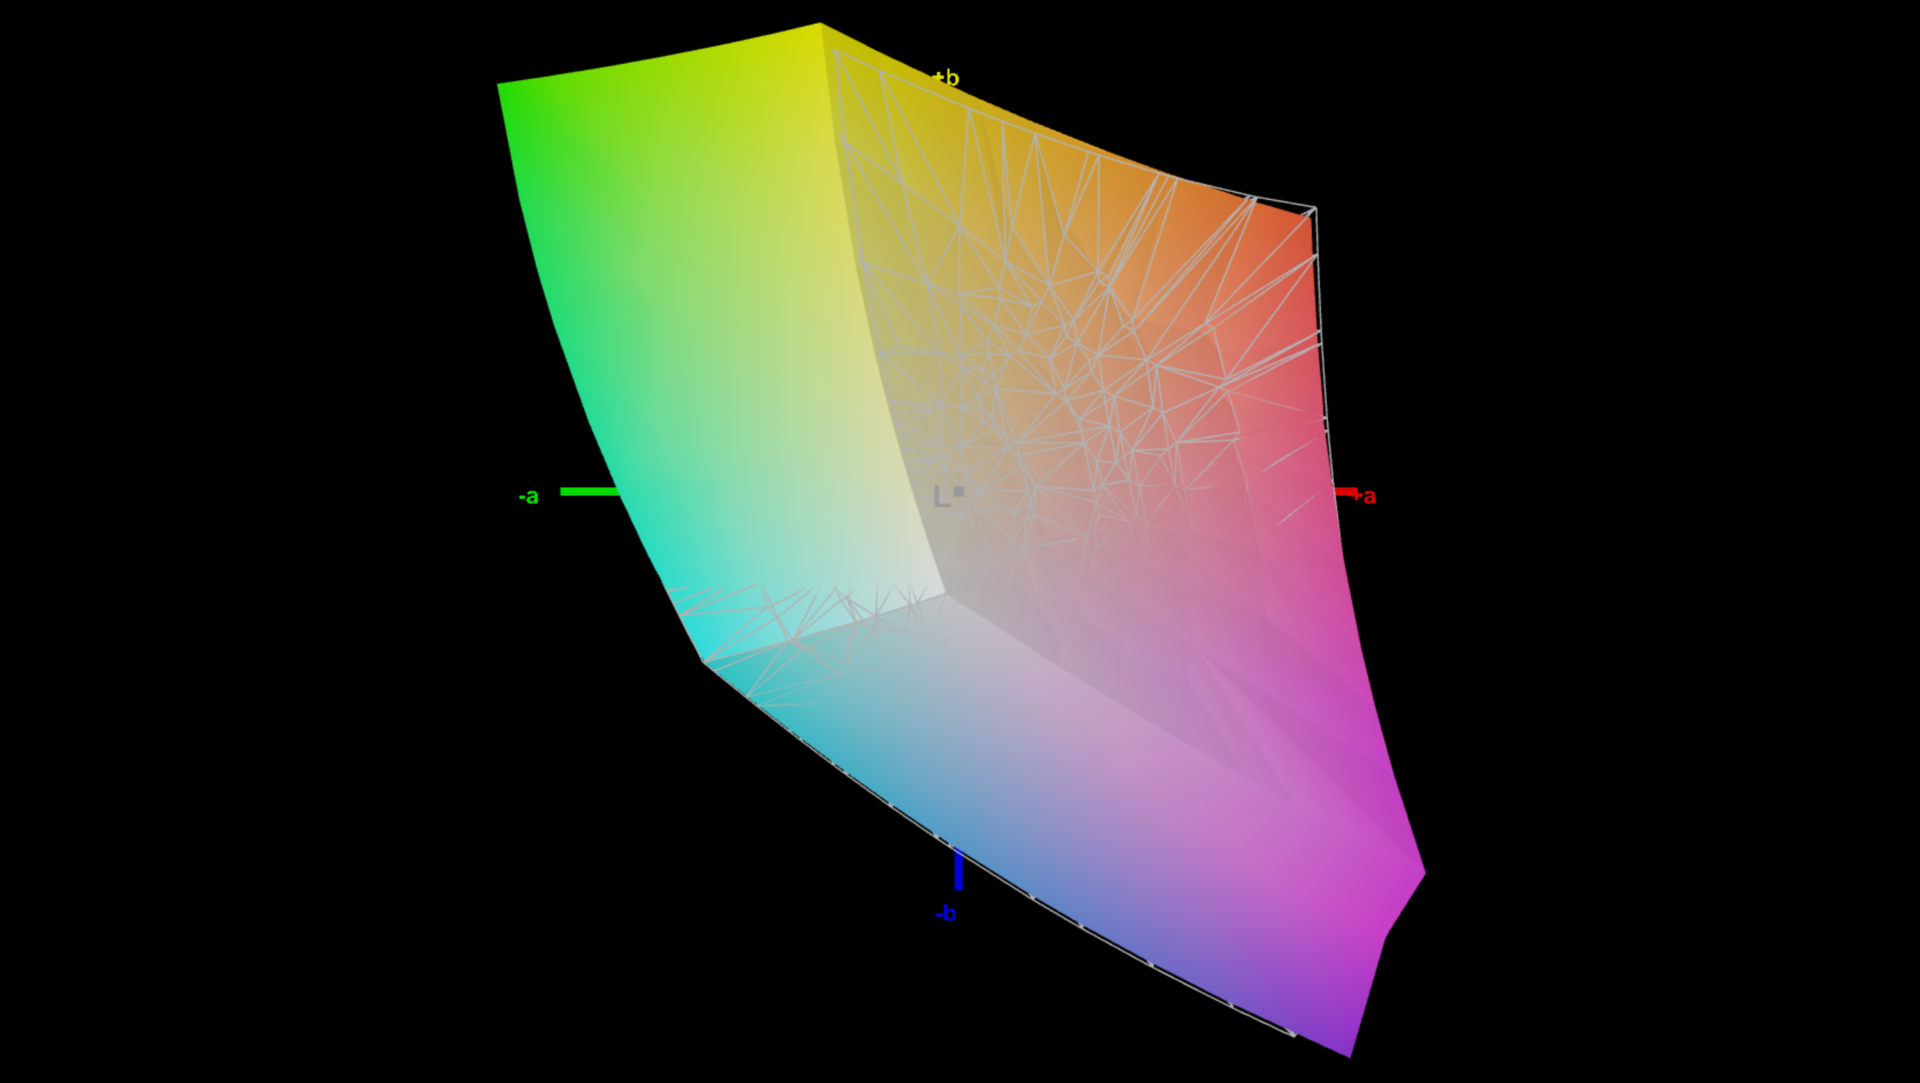
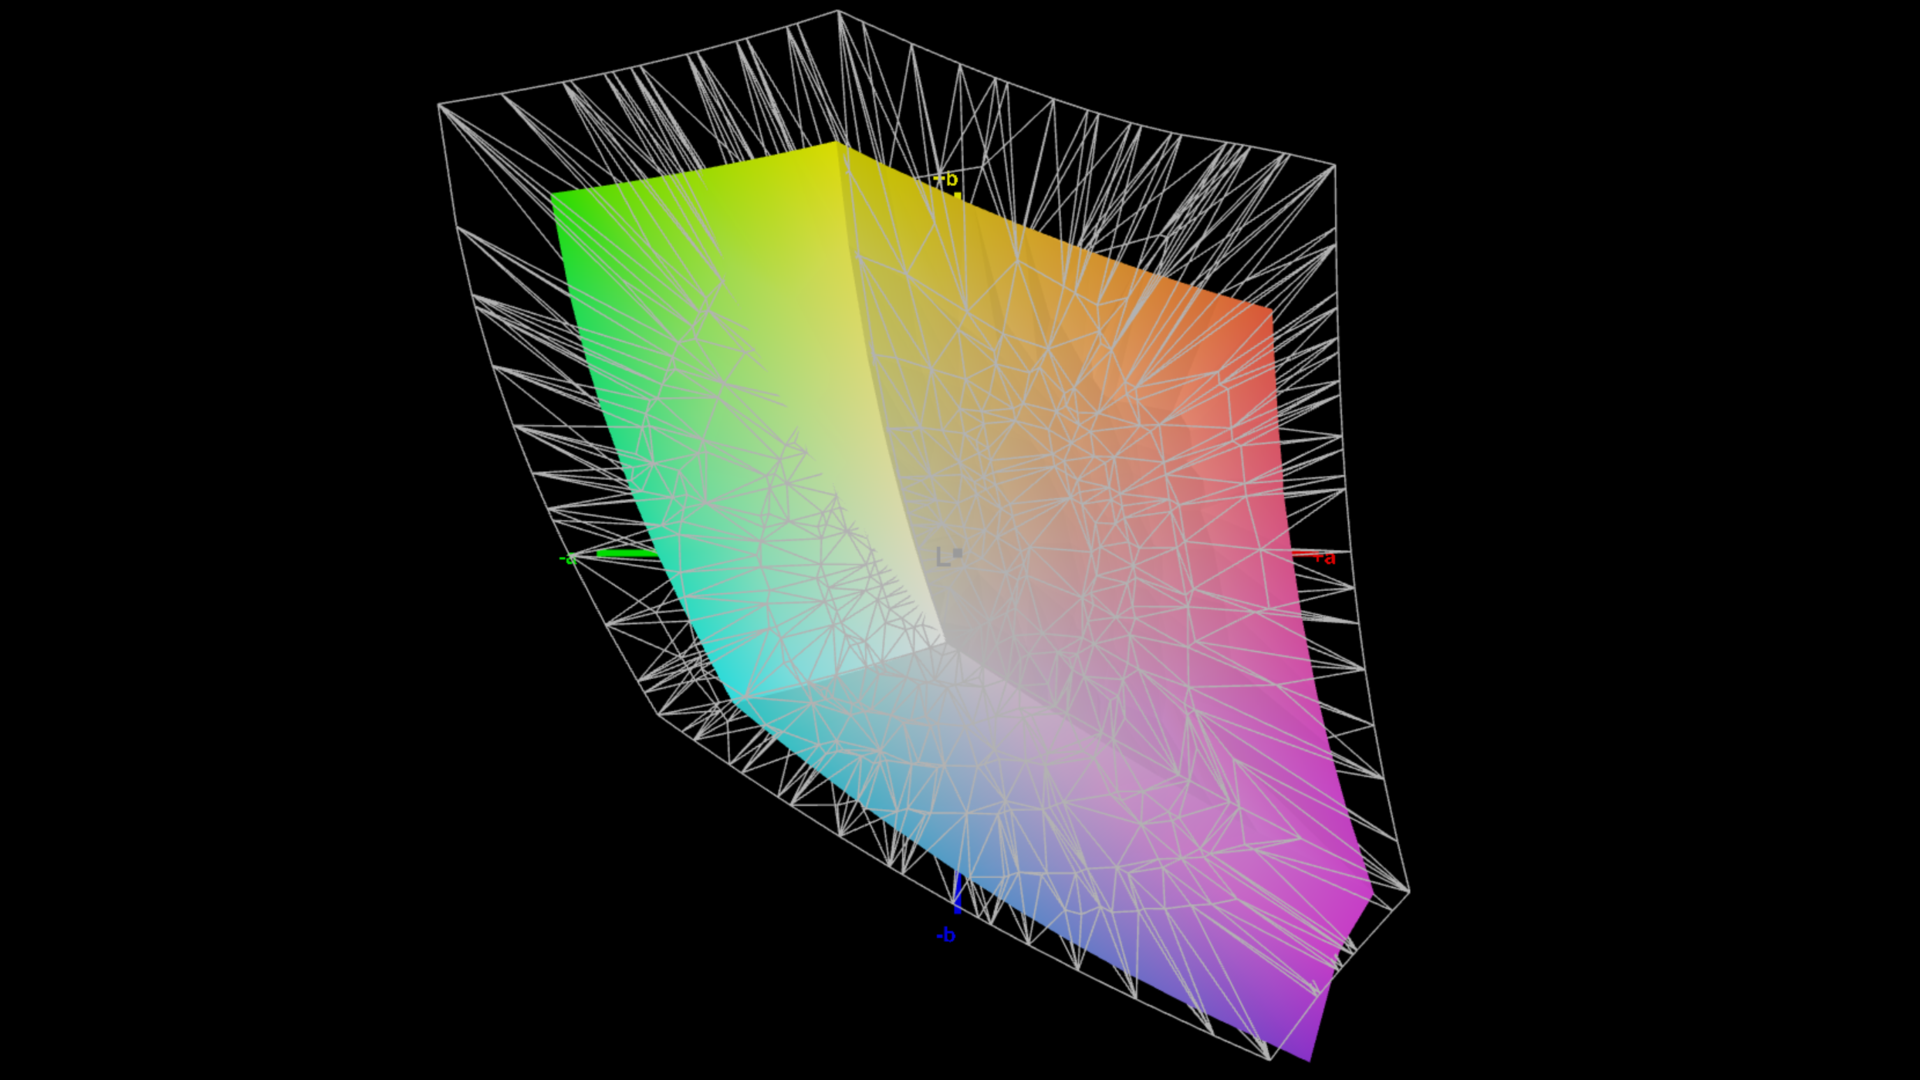
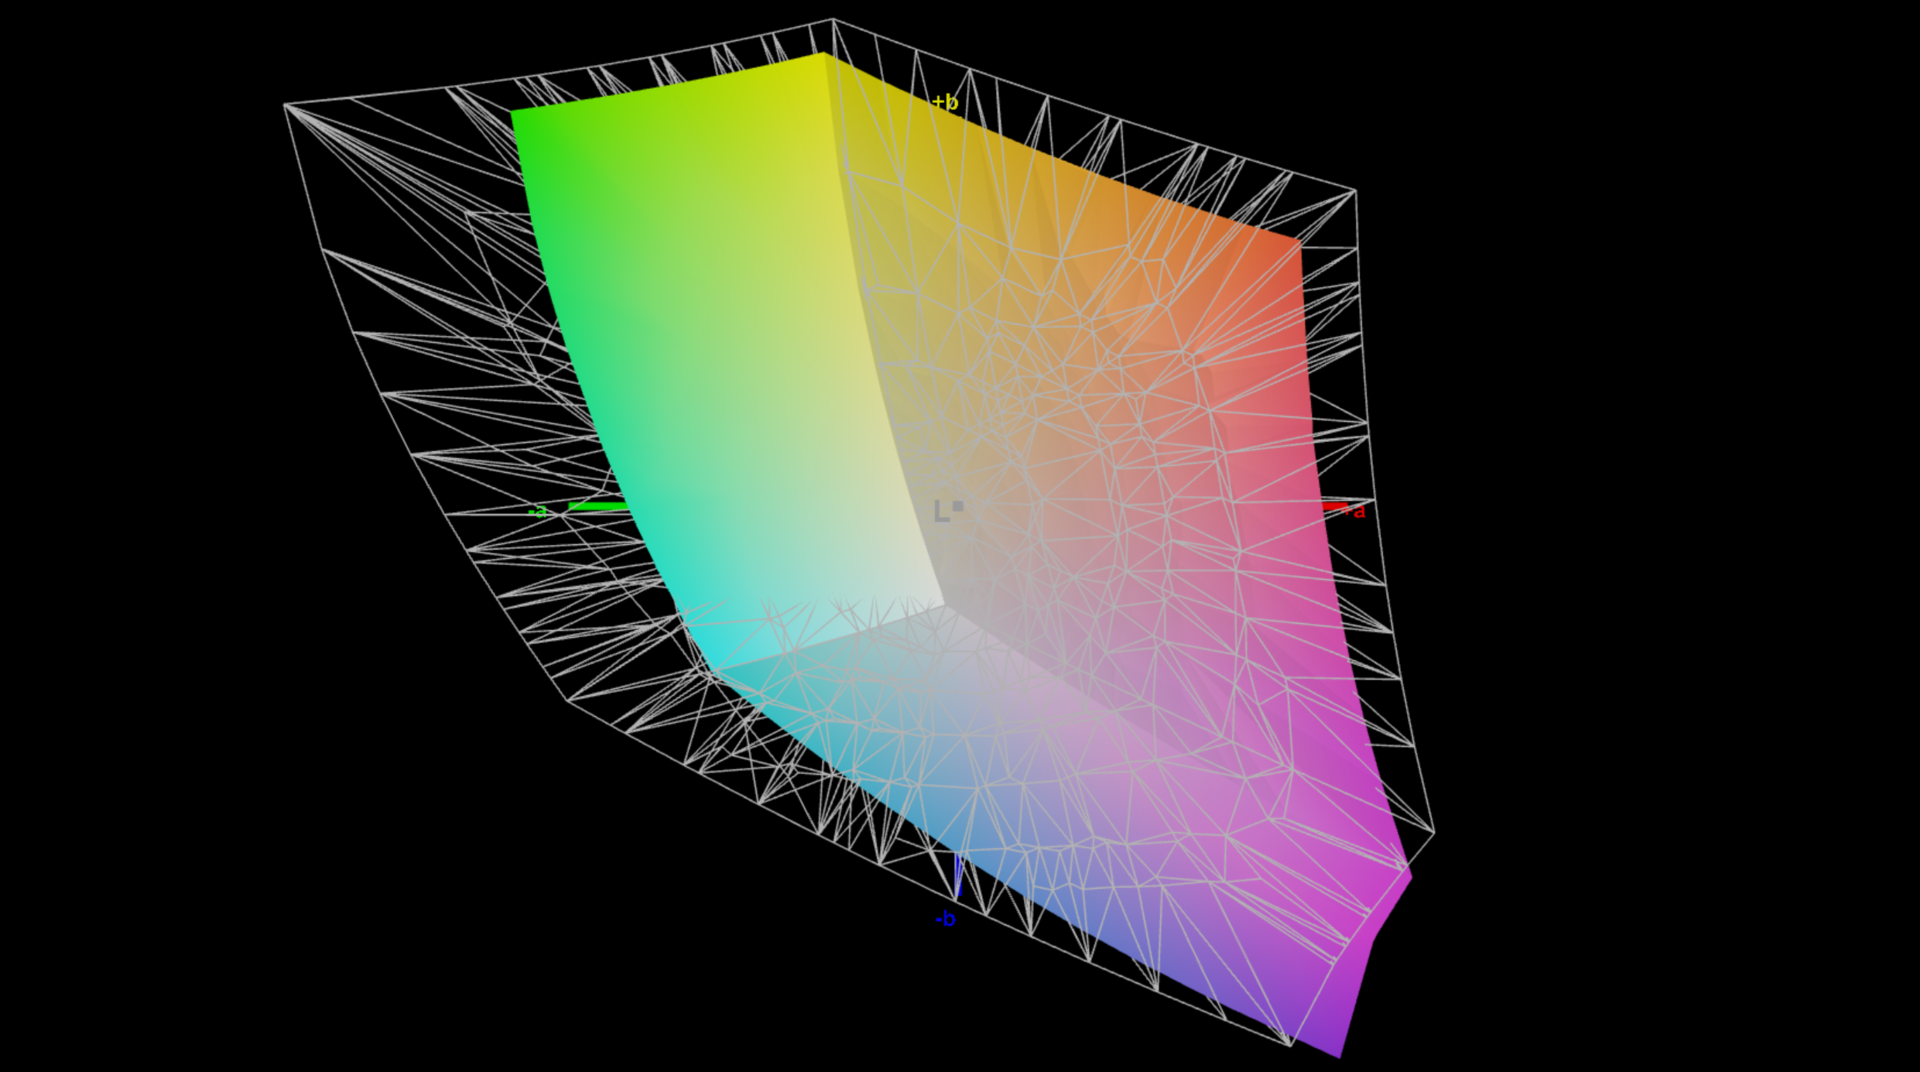
70% AdobeRGB 1998 (Argyll 3D)
98.8% sRGB (Argyll 3D)
68.8% Display P3 (Argyll 3D)
Gamma: 2.16
CCT: 7462 K
| Schenker VISION 16 Pro (M23) NE160QDM-NZ1, IPS, 2560x1600, 16" | Samsung Galaxy Book3 Ultra 16, i9-13900H RTX 4070 Samsung SDC4185 ATNA60CL03-0, OLED / AMOLED, 2880x1800, 16" | MSI Stealth 16 Studio A13VG AUO26A9, IPS, 2560x1600, 16" | Dell XPS 15 9530 RTX 4070 Samsung 156XG01, OLED, 3456x2160, 15.6" | Asus ProArt Studiobook 16 OLED H7604 ATNA60BX01-1, OLED, 3200x2000, 16" | Apple MacBook Pro 16 2023 M2 Max Mini-LED, 3456x2234, 16.2" | Schenker Vision 16 Pro RTX 3070 Ti N160QDM-NZ1, IPS, 2560x1600, 16" | |
|---|---|---|---|---|---|---|---|
| Display | 26% | 21% | 29% | 25% | 24% | -1% | |
| Display P3 Coverage (%) | 68.8 | 95.3 39% | 96.4 40% | 99.8 45% | 99.6 45% | 99 44% | 68.7 0% |
| sRGB Coverage (%) | 98.8 | 99.1 0% | 99.7 1% | 100 1% | 100 1% | 100 1% | 96.7 -2% |
| AdobeRGB 1998 Coverage (%) | 70 | 97.4 39% | 84.8 21% | 98.4 41% | 89.4 28% | 88.5 26% | 70 0% |
| Response Times | 80% | 50% | 82% | 93% | -486% | -5% | |
| Response Time Grey 50% / Grey 80% * (ms) | 13.7 ? | 2 ? 85% | 4.4 ? 68% | 1.68 ? 88% | 0.59 ? 96% | 80.5 ? -488% | 14.3 ? -4% |
| Response Time Black / White * (ms) | 8.1 ? | 2 ? 75% | 5.6 ? 31% | 1.94 ? 76% | 0.79 ? 90% | 47.2 ? -483% | 8.6 ? -6% |
| PWM Frequency (Hz) | 250 ? | 239 | 240 ? | 14880 ? | |||
| Screen | 21% | -16% | 0% | 159% | 4950% | -14% | |
| Brightness middle (cd/m²) | 384 | 403 5% | 424 10% | 389.5 1% | 349 -9% | 504 31% | 364 -5% |
| Brightness (cd/m²) | 371 | 408 10% | 411 11% | 392 6% | 350 -6% | 487 31% | 347 -6% |
| Brightness Distribution (%) | 88 | 98 11% | 88 0% | 98 11% | 95 8% | 94 7% | 89 1% |
| Black Level * (cd/m²) | 0.3 | 0.37 -23% | 0.02 93% | 0.001 100% | 0.3 -0% | ||
| Contrast (:1) | 1280 | 1146 -10% | 17450 1263% | 504000 39275% | 1213 -5% | ||
| Colorchecker dE 2000 * | 3.4 | 2.63 23% | 3.04 11% | 4.95 -46% | 2.1 38% | 1.5 56% | 3.3 3% |
| Colorchecker dE 2000 max. * | 9.2 | 4.07 56% | 7.5 18% | 8.65 6% | 5.5 40% | 3.3 64% | 6.6 28% |
| Colorchecker dE 2000 calibrated * | 1.3 | 3.04 -134% | 1.53 -18% | 2.1 -62% | 2.5 -92% | ||
| Greyscale dE 2000 * | 3.4 | 2.69 21% | 4.34 -28% | 2 41% | 1.2 65% | 2.1 38% | 5.2 -53% |
| Gamma | 2.16 102% | 2.48 89% | 2.32 95% | 2.27 97% | 2.19 100% | 2.25 98% | 2.14 103% |
| CCT | 7462 87% | 6907 94% | 6952 93% | 6265 104% | 6545 99% | 6882 94% | 6331 103% |
| Total Average (Program / Settings) | 42% /
33% | 18% /
1% | 37% /
21% | 92% /
121% | 1496% /
2977% | -7% /
-10% |
* ... smaller is better
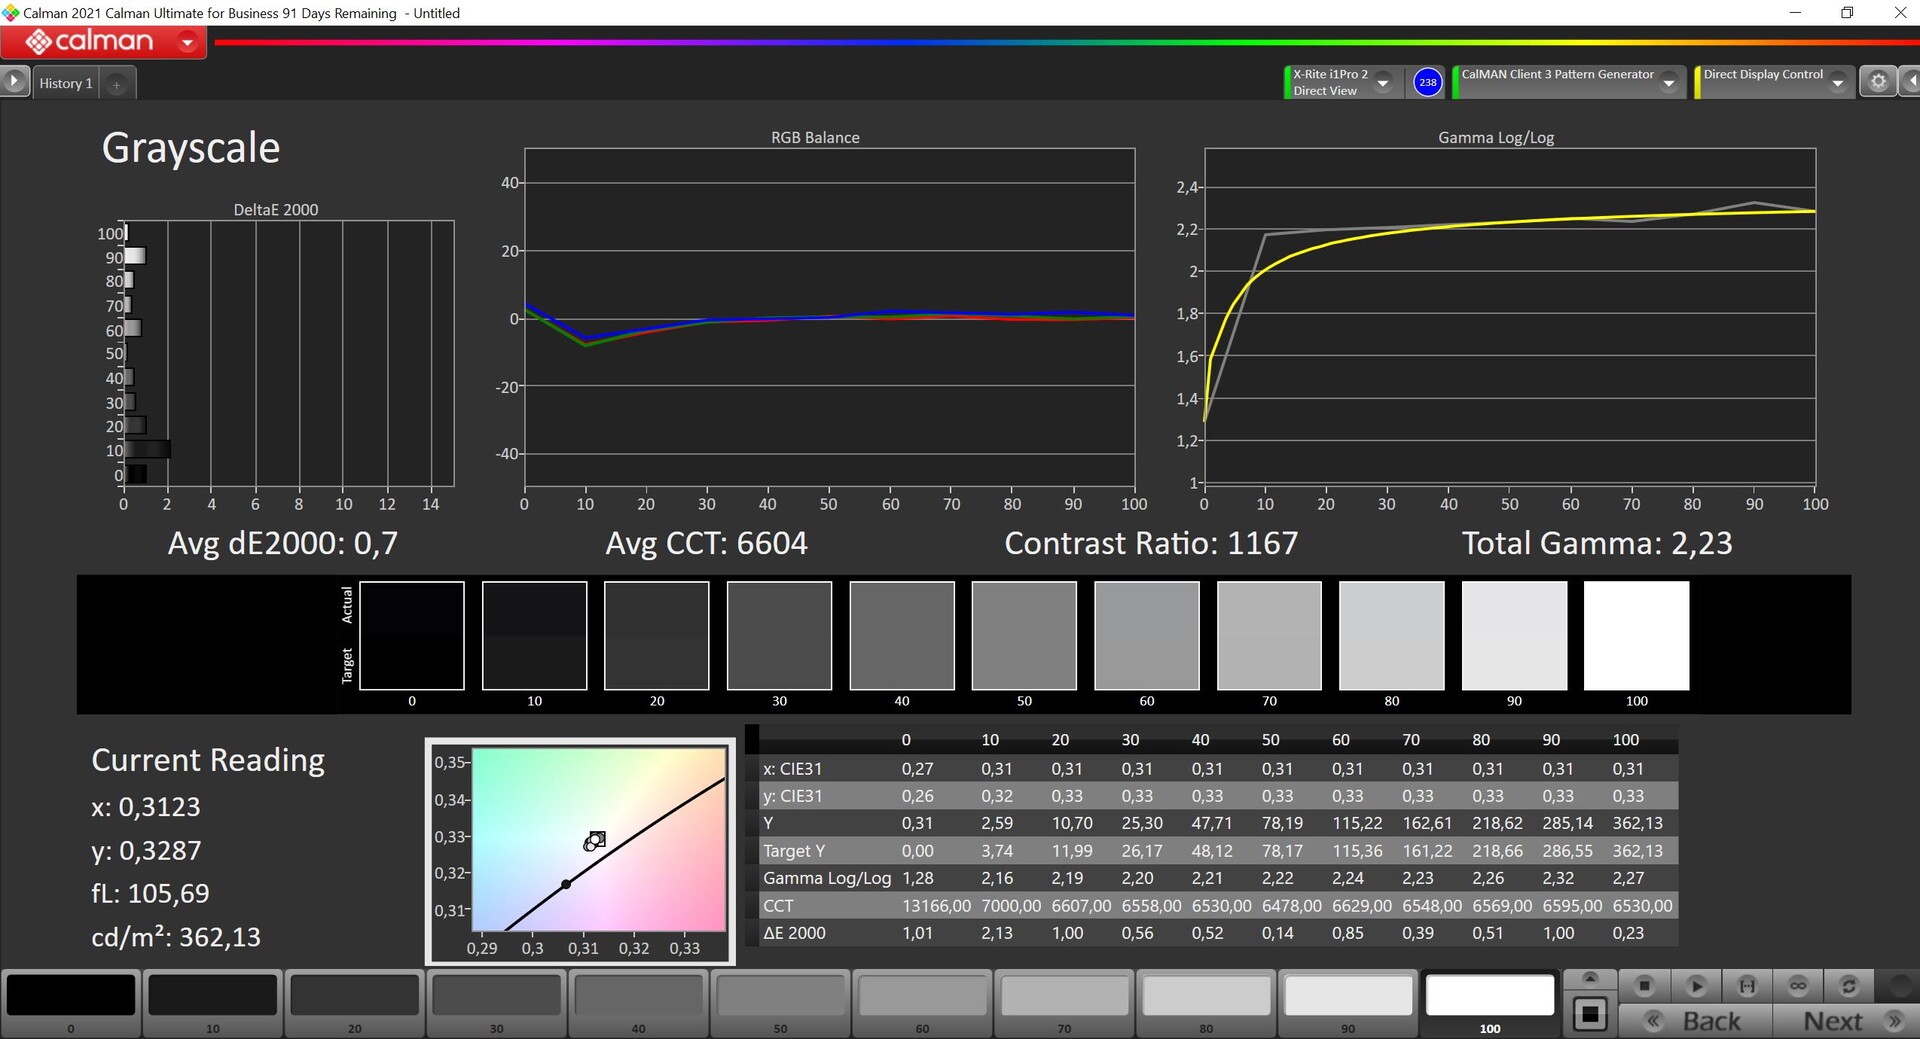
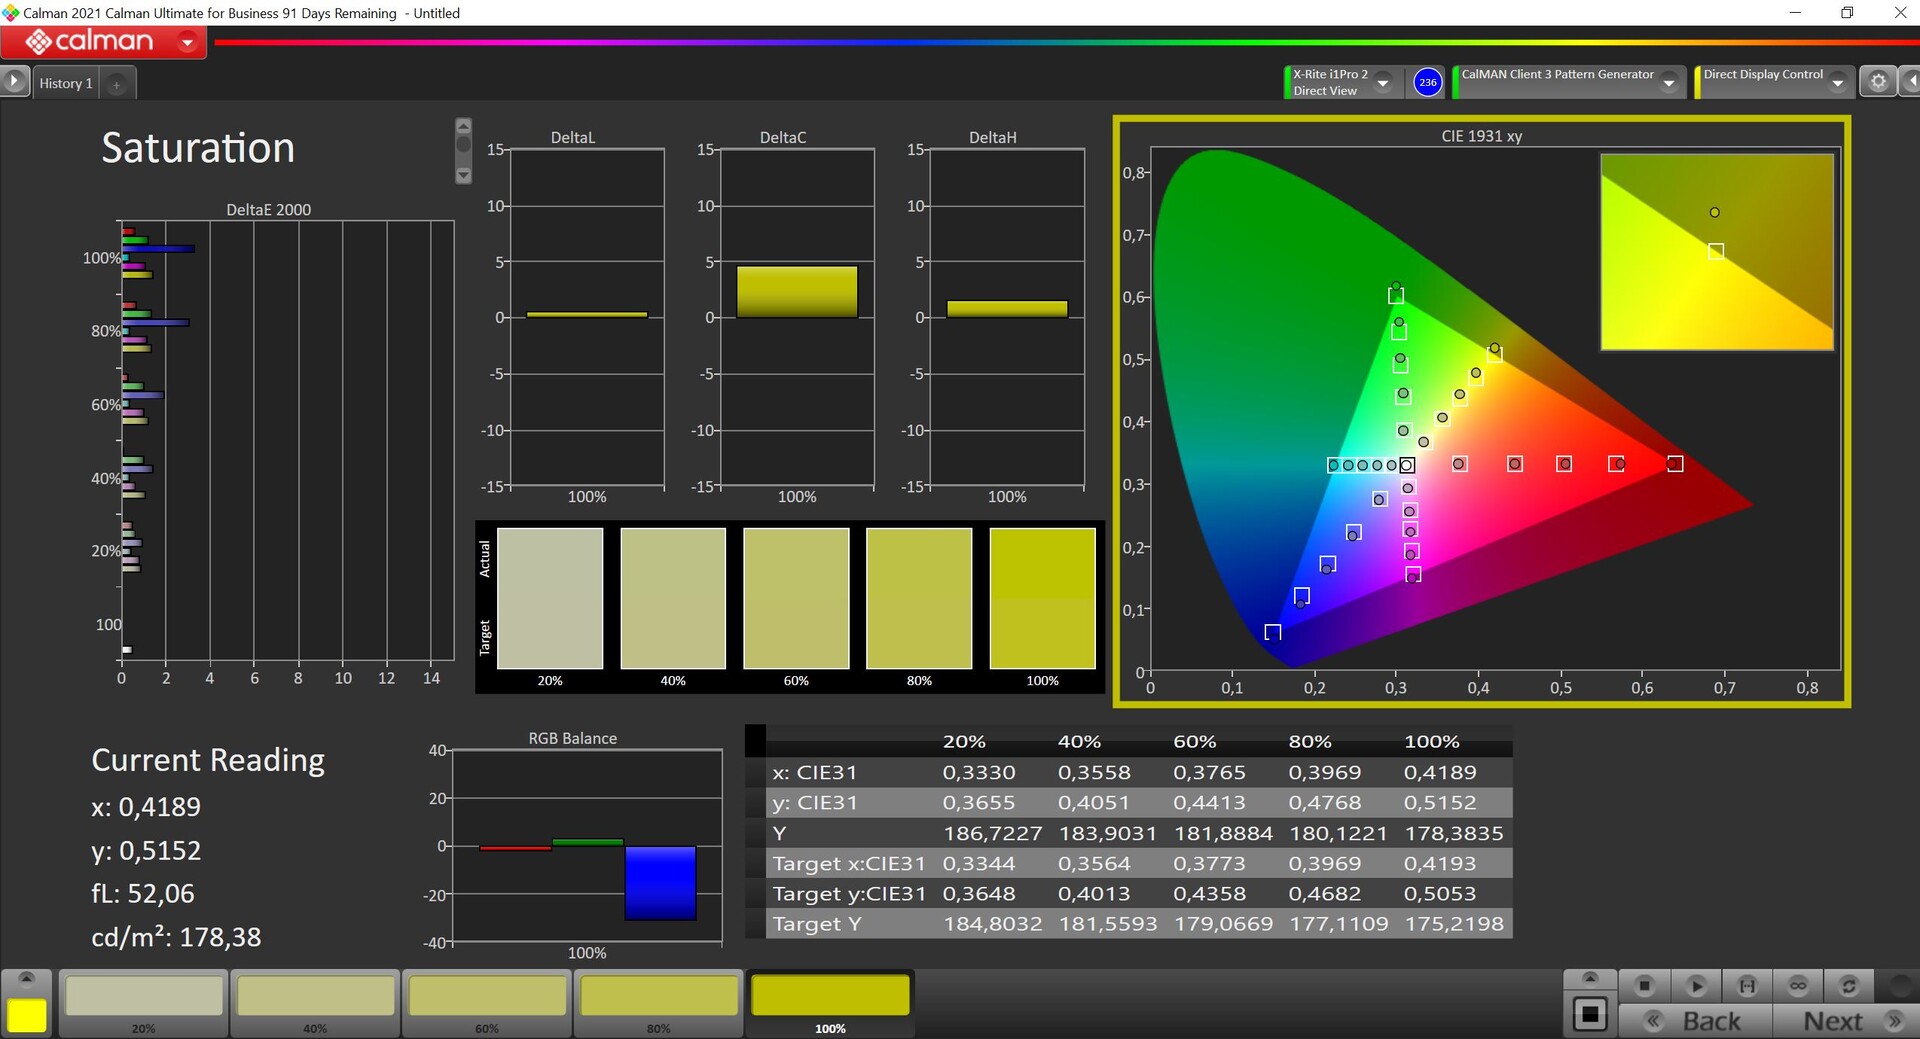
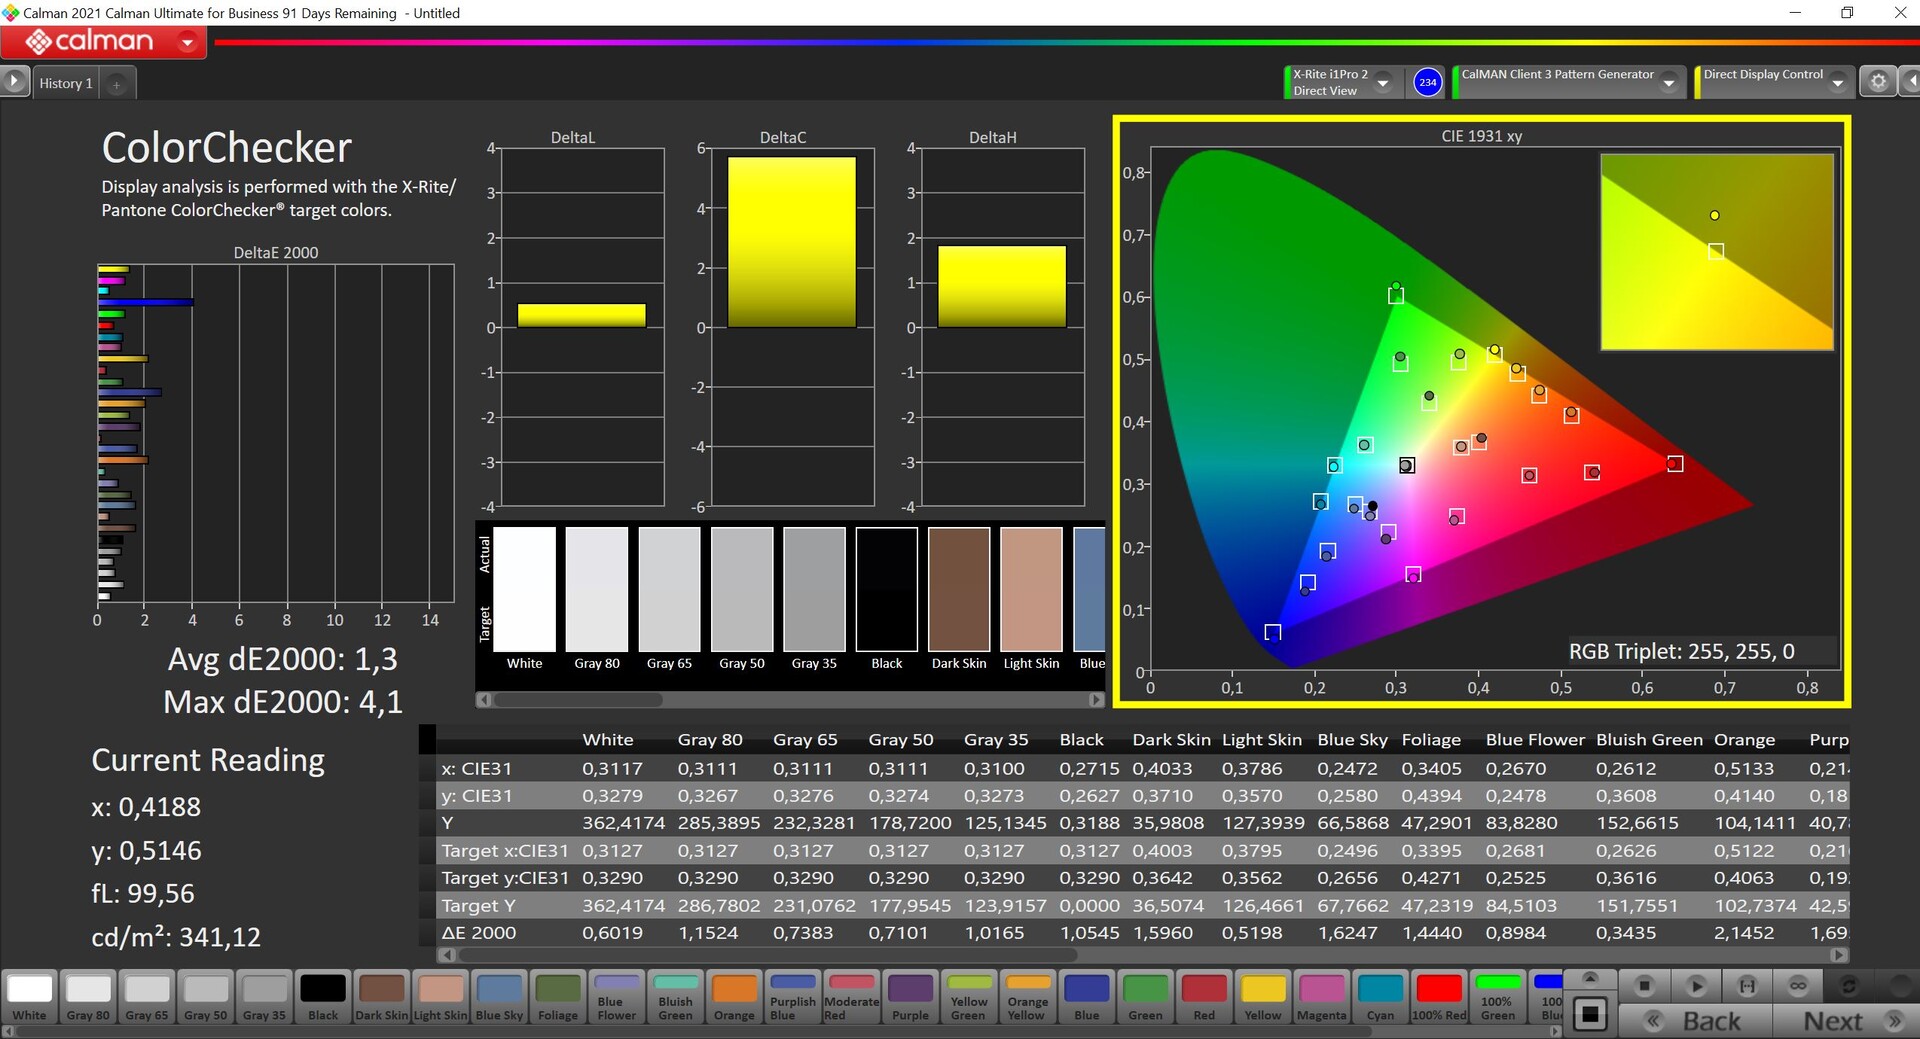
我们使用专业的 CalMAN 软件测量了交货状态下的面板。申克公司在控制中心提供了校准配置文件的下载服务,并通过序列号自动下载。虽然这改善了情况,也消除了色调,但同时也将最大亮度略微降低了约 30 cd/m²。这并不是一个完美的解决方案,我们很快就会看到,但那些无法校准面板(或无法从上面的链接下载我们的校准配置文件)的用户仍会得到明显的改善。
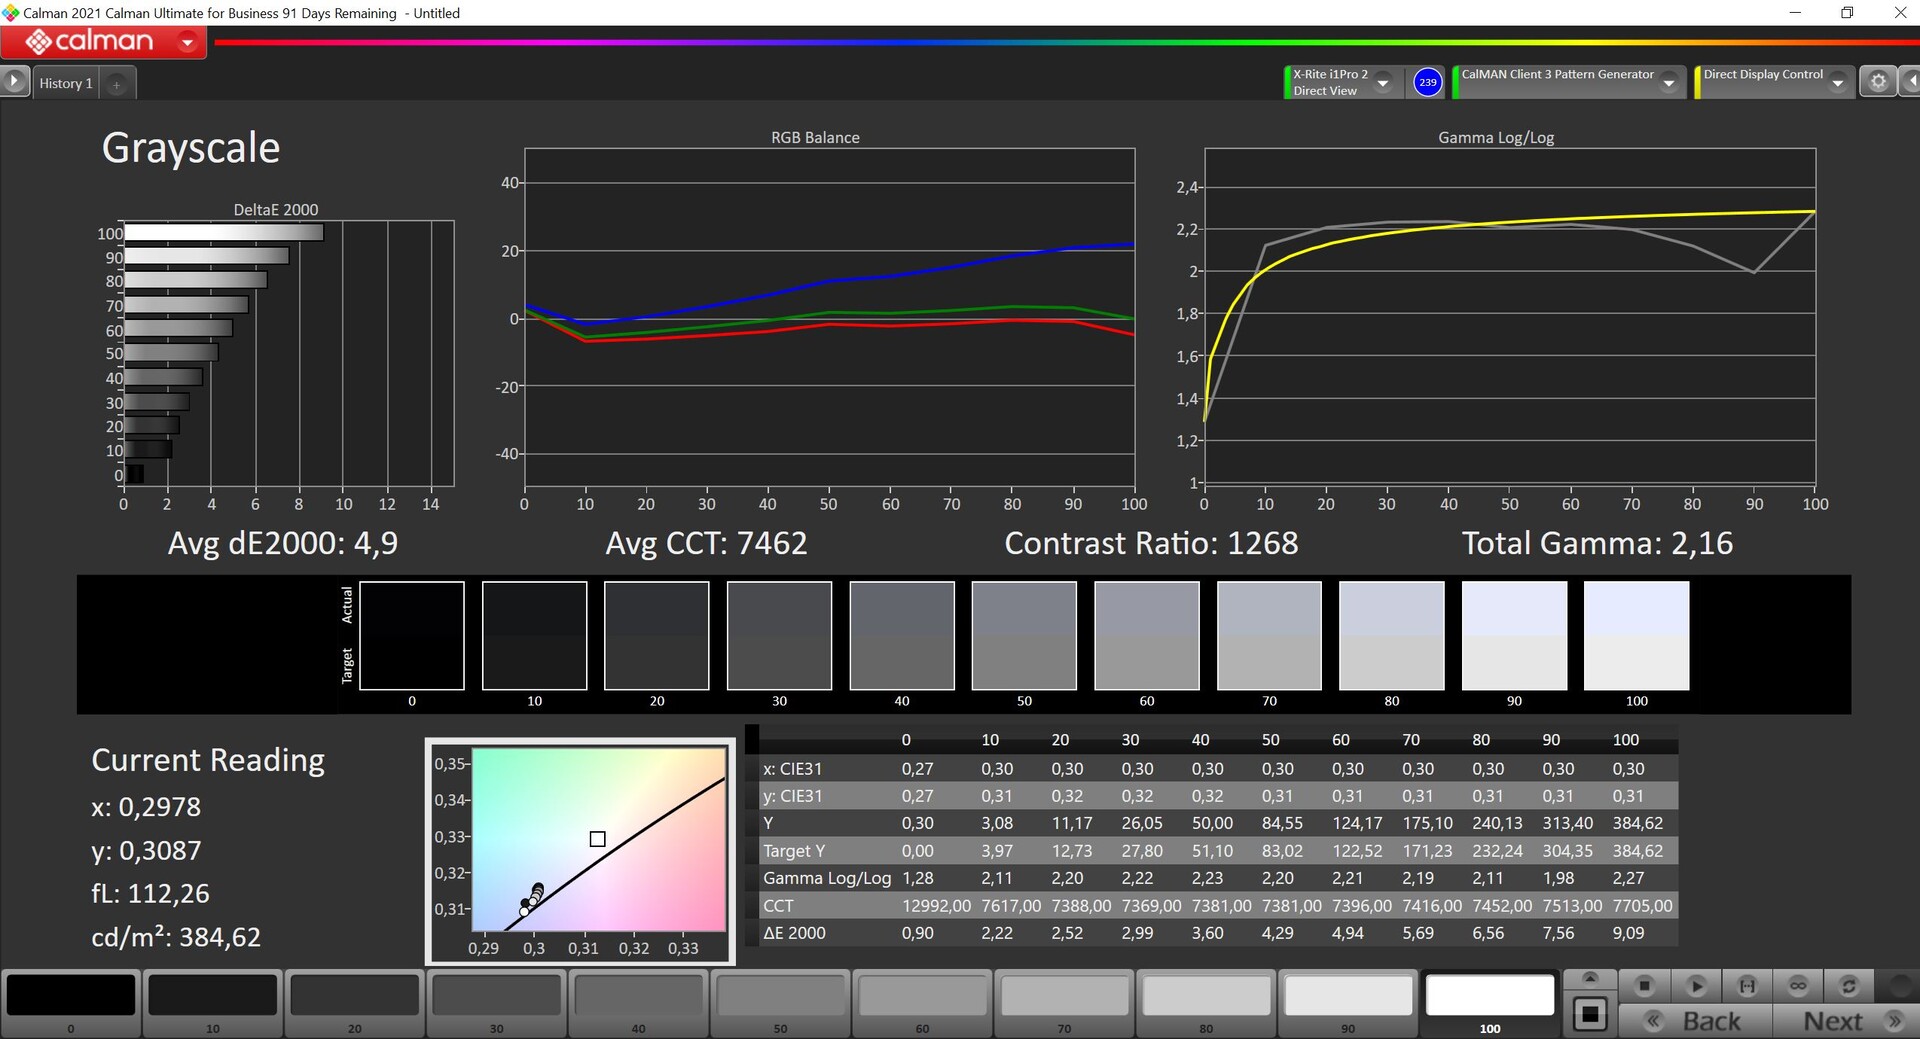
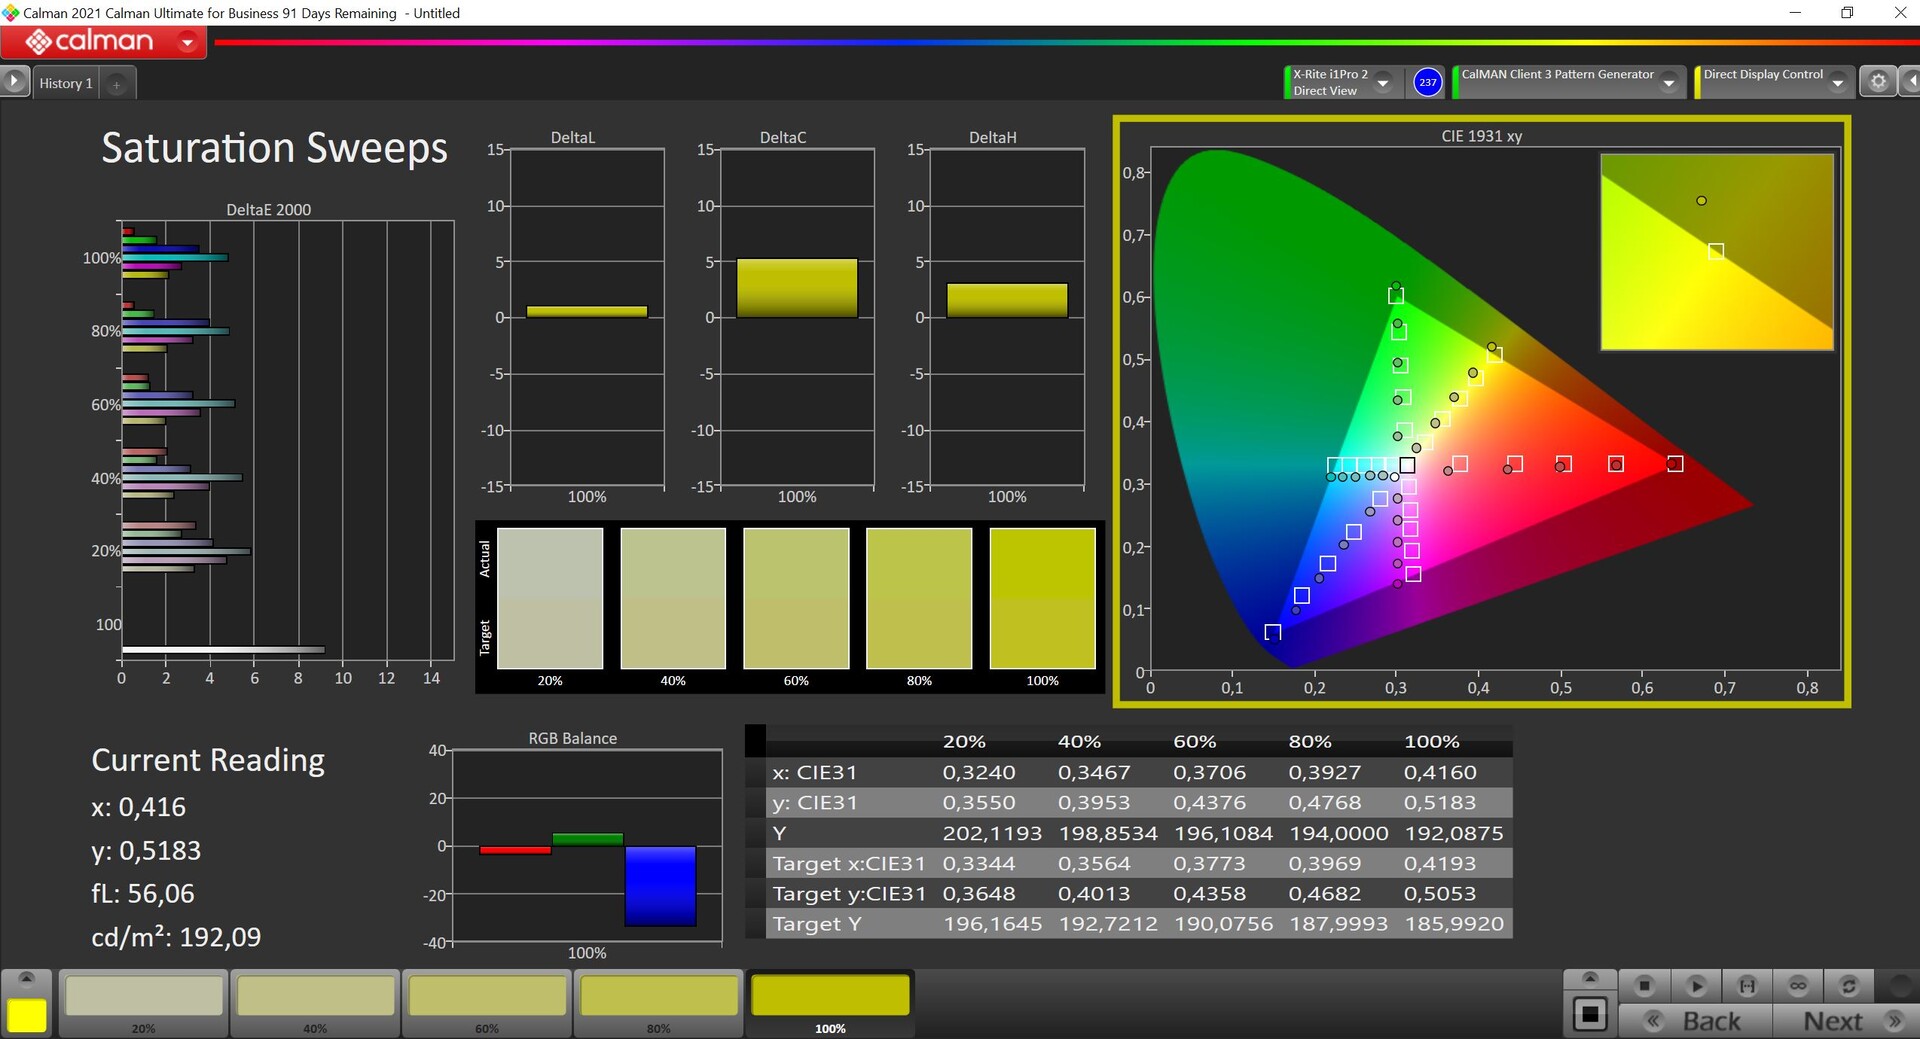
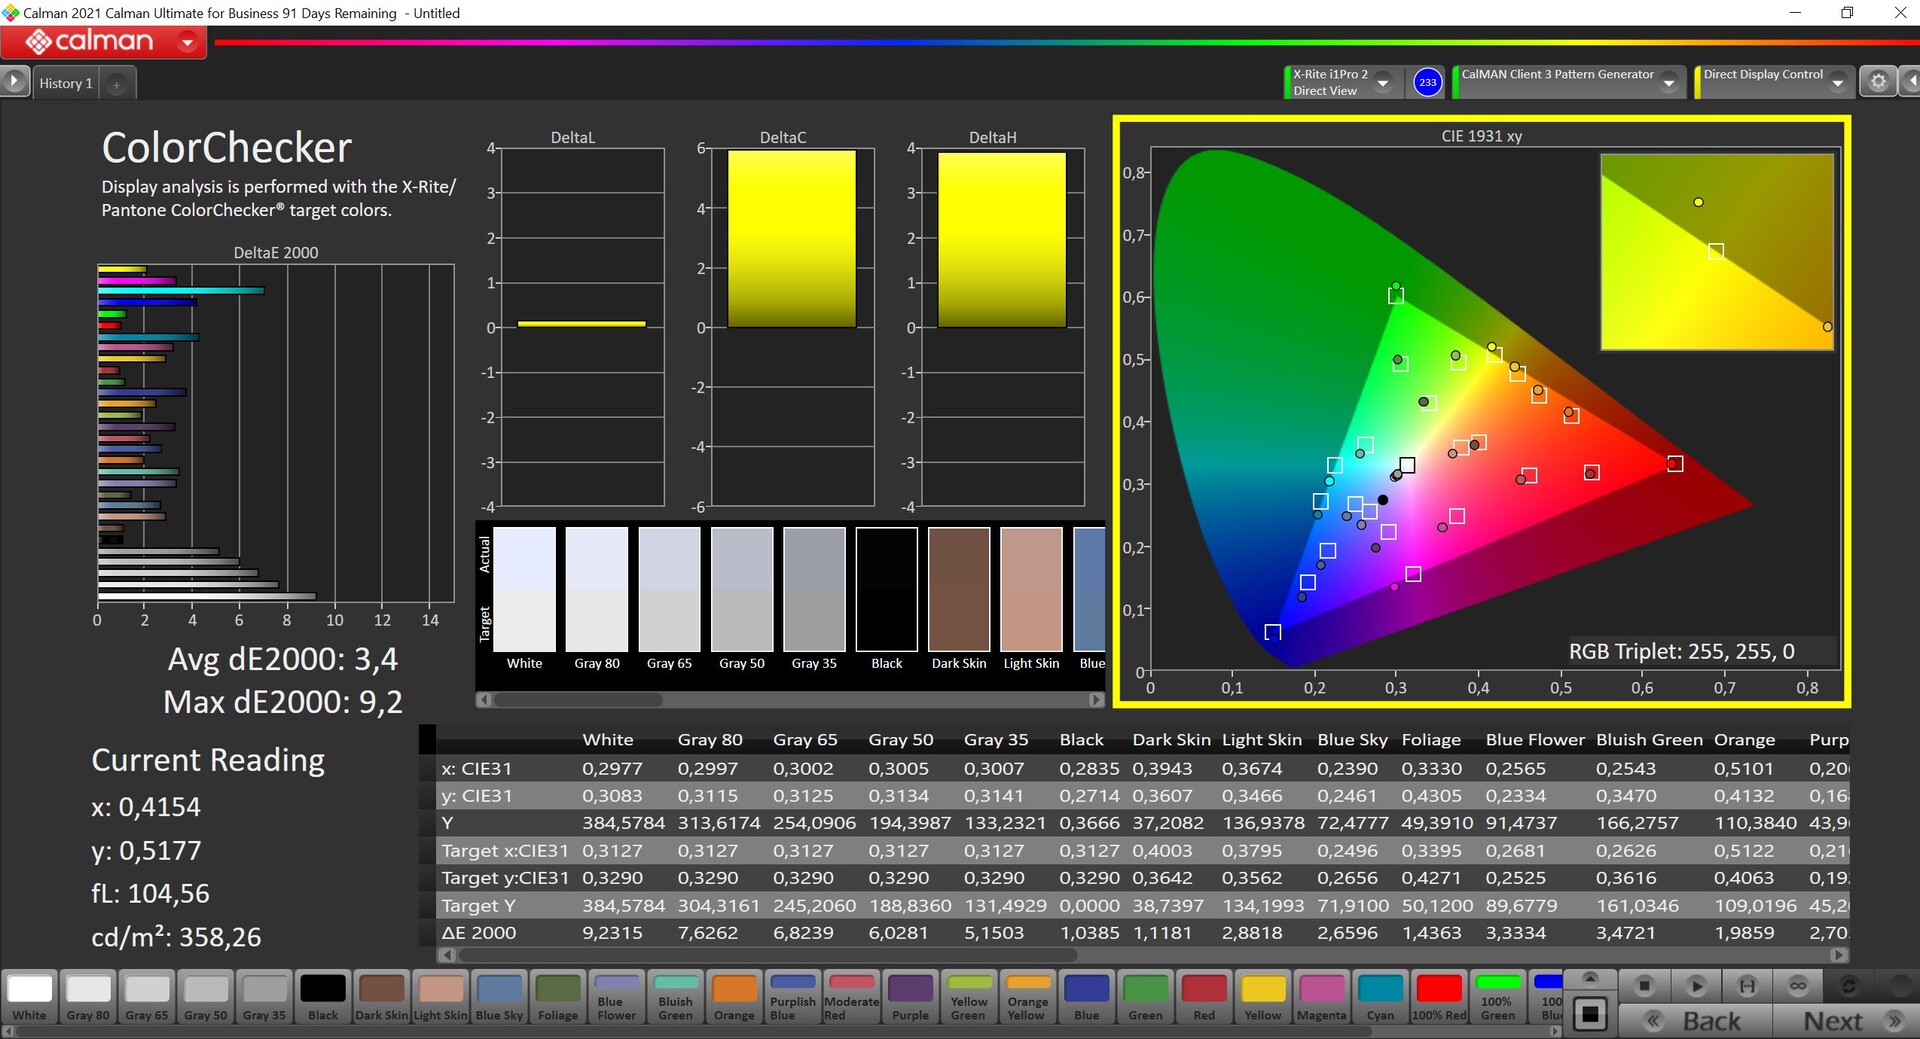


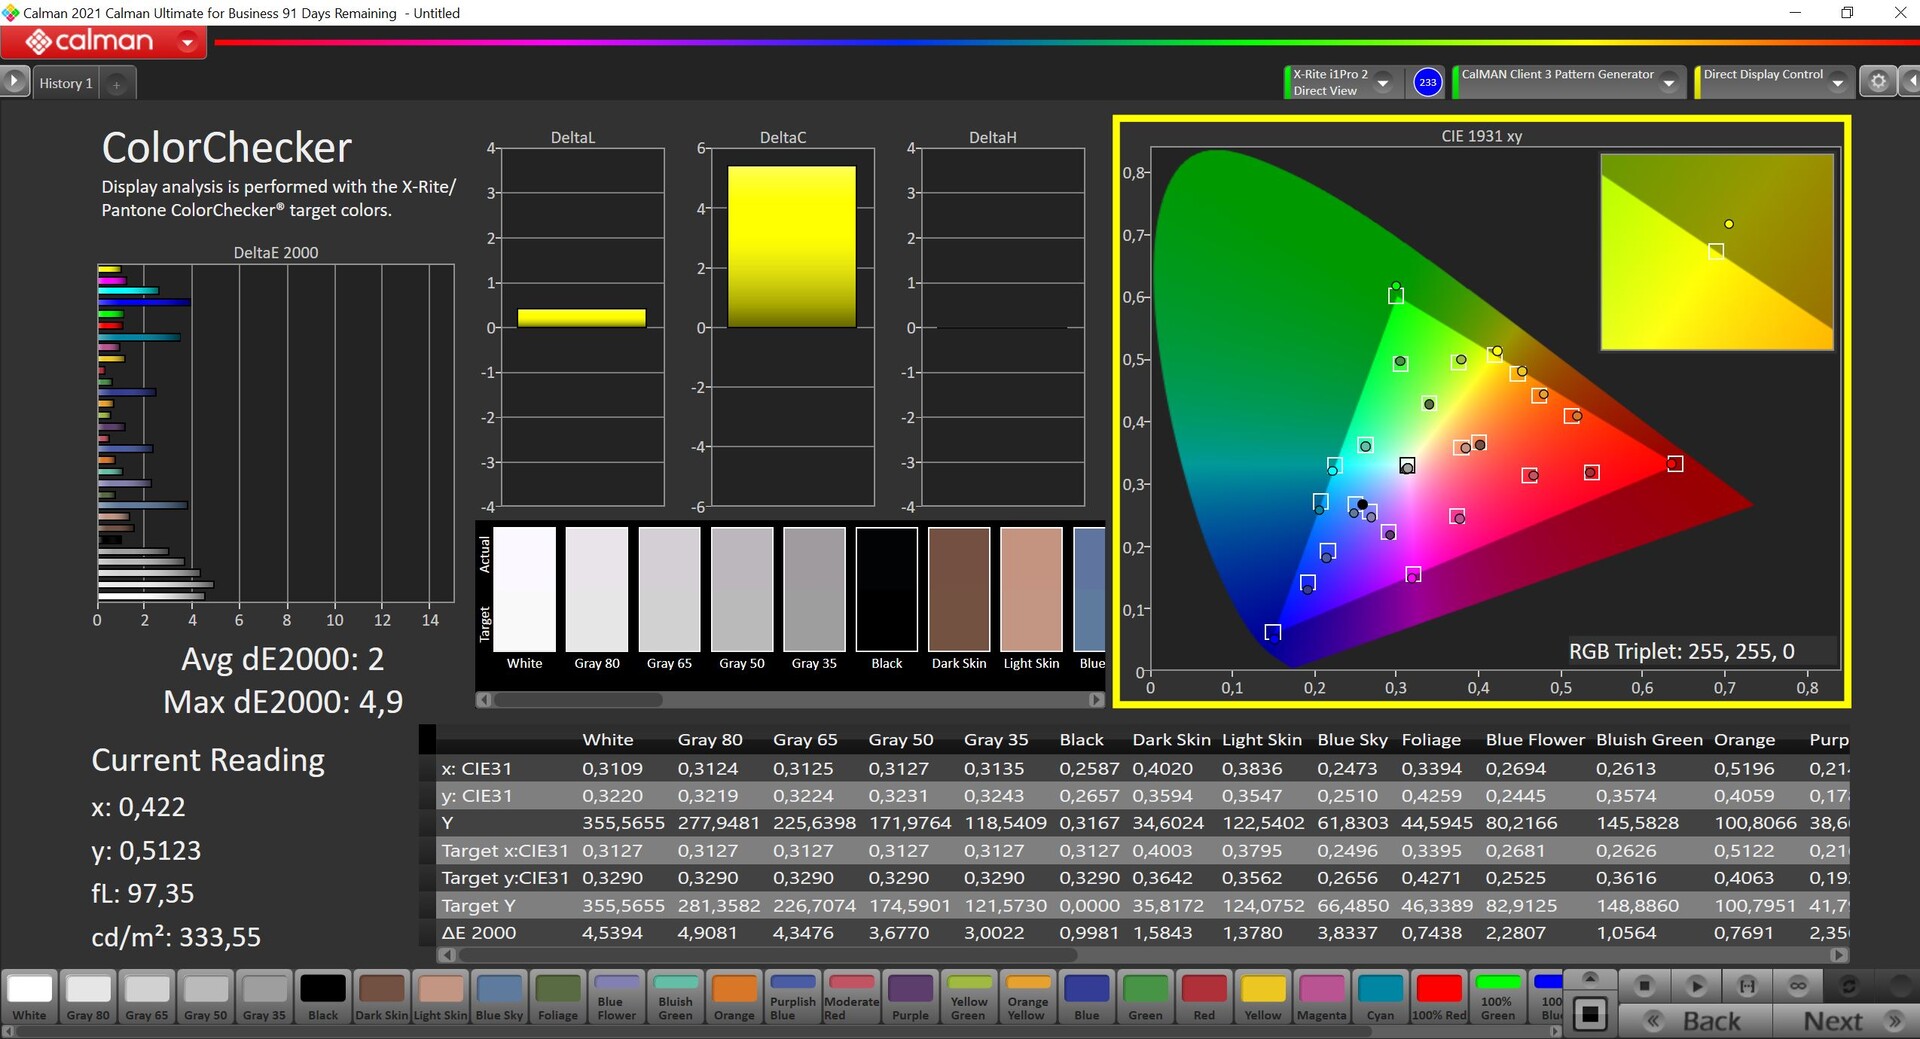
通过我们自己的校准,显示效果得到了进一步改善,灰度达到了参考水平,尤其是色彩偏差更小了。不过,蓝色色调中仍有一些异常值,偏差略高于 3 的重要目标限值。但总体而言,该面板仍然非常适合在几乎完全覆盖的小 sRGB 色彩空间中进行图像处理。
Display Response Times
| ↔ Response Time Black to White | ||
|---|---|---|
| 8.1 ms ... rise ↗ and fall ↘ combined | ↗ 3.8 ms rise | 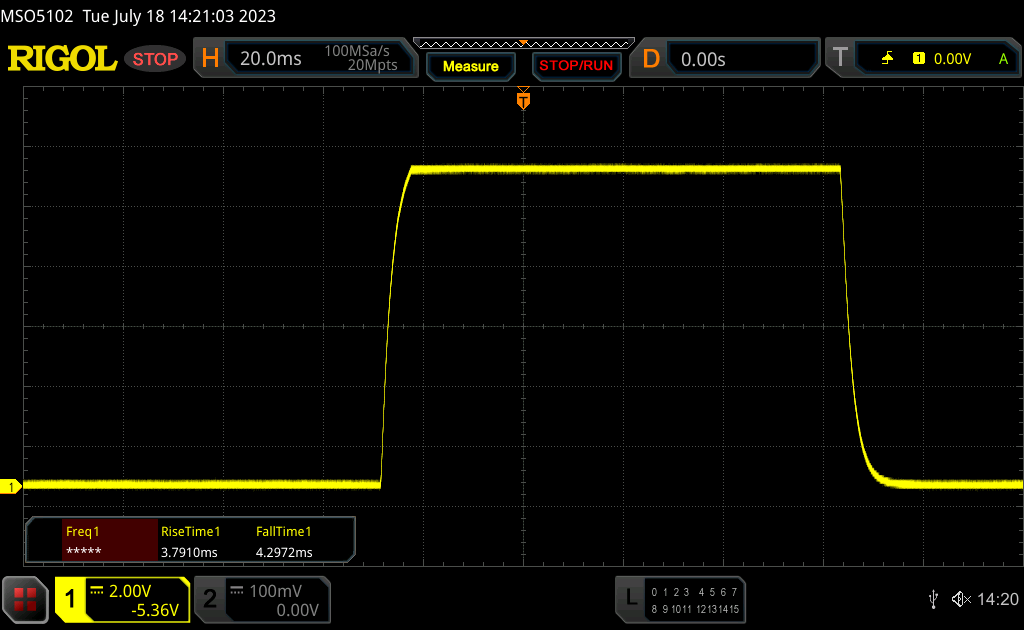 |
| ↘ 4.3 ms fall | ||
| The screen shows fast response rates in our tests and should be suited for gaming. In comparison, all tested devices range from 0.1 (minimum) to 240 (maximum) ms. » 24 % of all devices are better. This means that the measured response time is better than the average of all tested devices (19.8 ms). | ||
| ↔ Response Time 50% Grey to 80% Grey | ||
| 13.7 ms ... rise ↗ and fall ↘ combined | ↗ 6.7 ms rise | 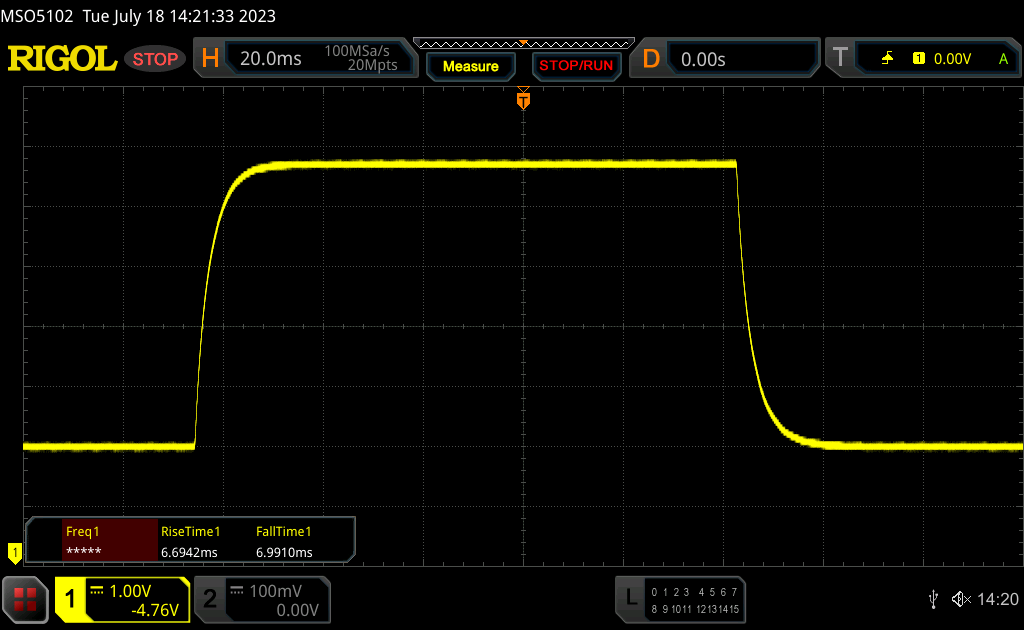 |
| ↘ 7 ms fall | ||
| The screen shows good response rates in our tests, but may be too slow for competitive gamers. In comparison, all tested devices range from 0.165 (minimum) to 636 (maximum) ms. » 28 % of all devices are better. This means that the measured response time is better than the average of all tested devices (31 ms). | ||
Screen Flickering / PWM (Pulse-Width Modulation)
| Screen flickering / PWM not detected | 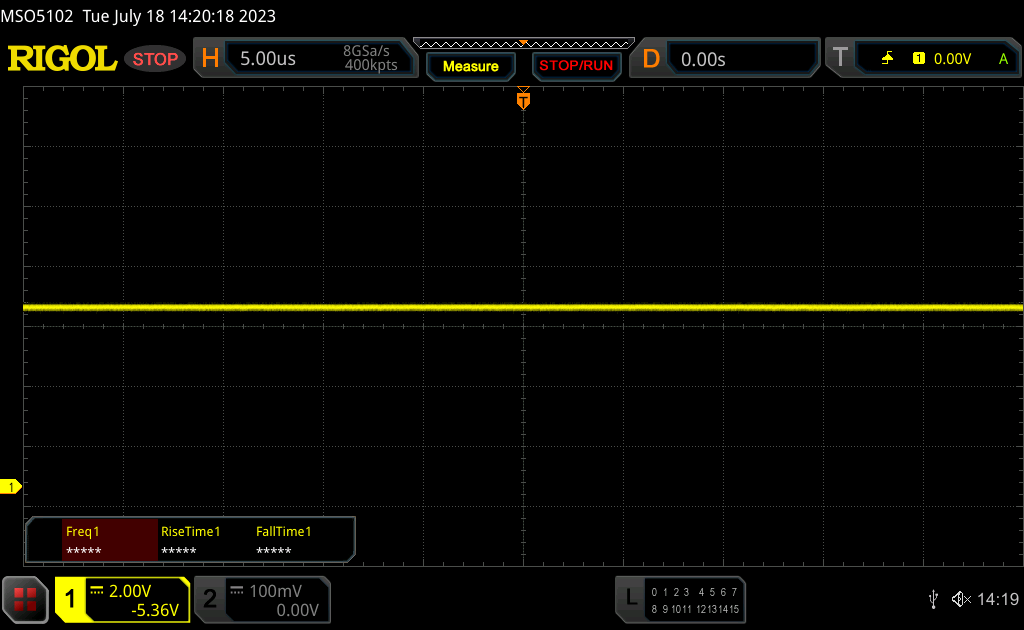 | ||
In comparison: 52 % of all tested devices do not use PWM to dim the display. If PWM was detected, an average of 7754 (minimum: 5 - maximum: 343500) Hz was measured. | |||
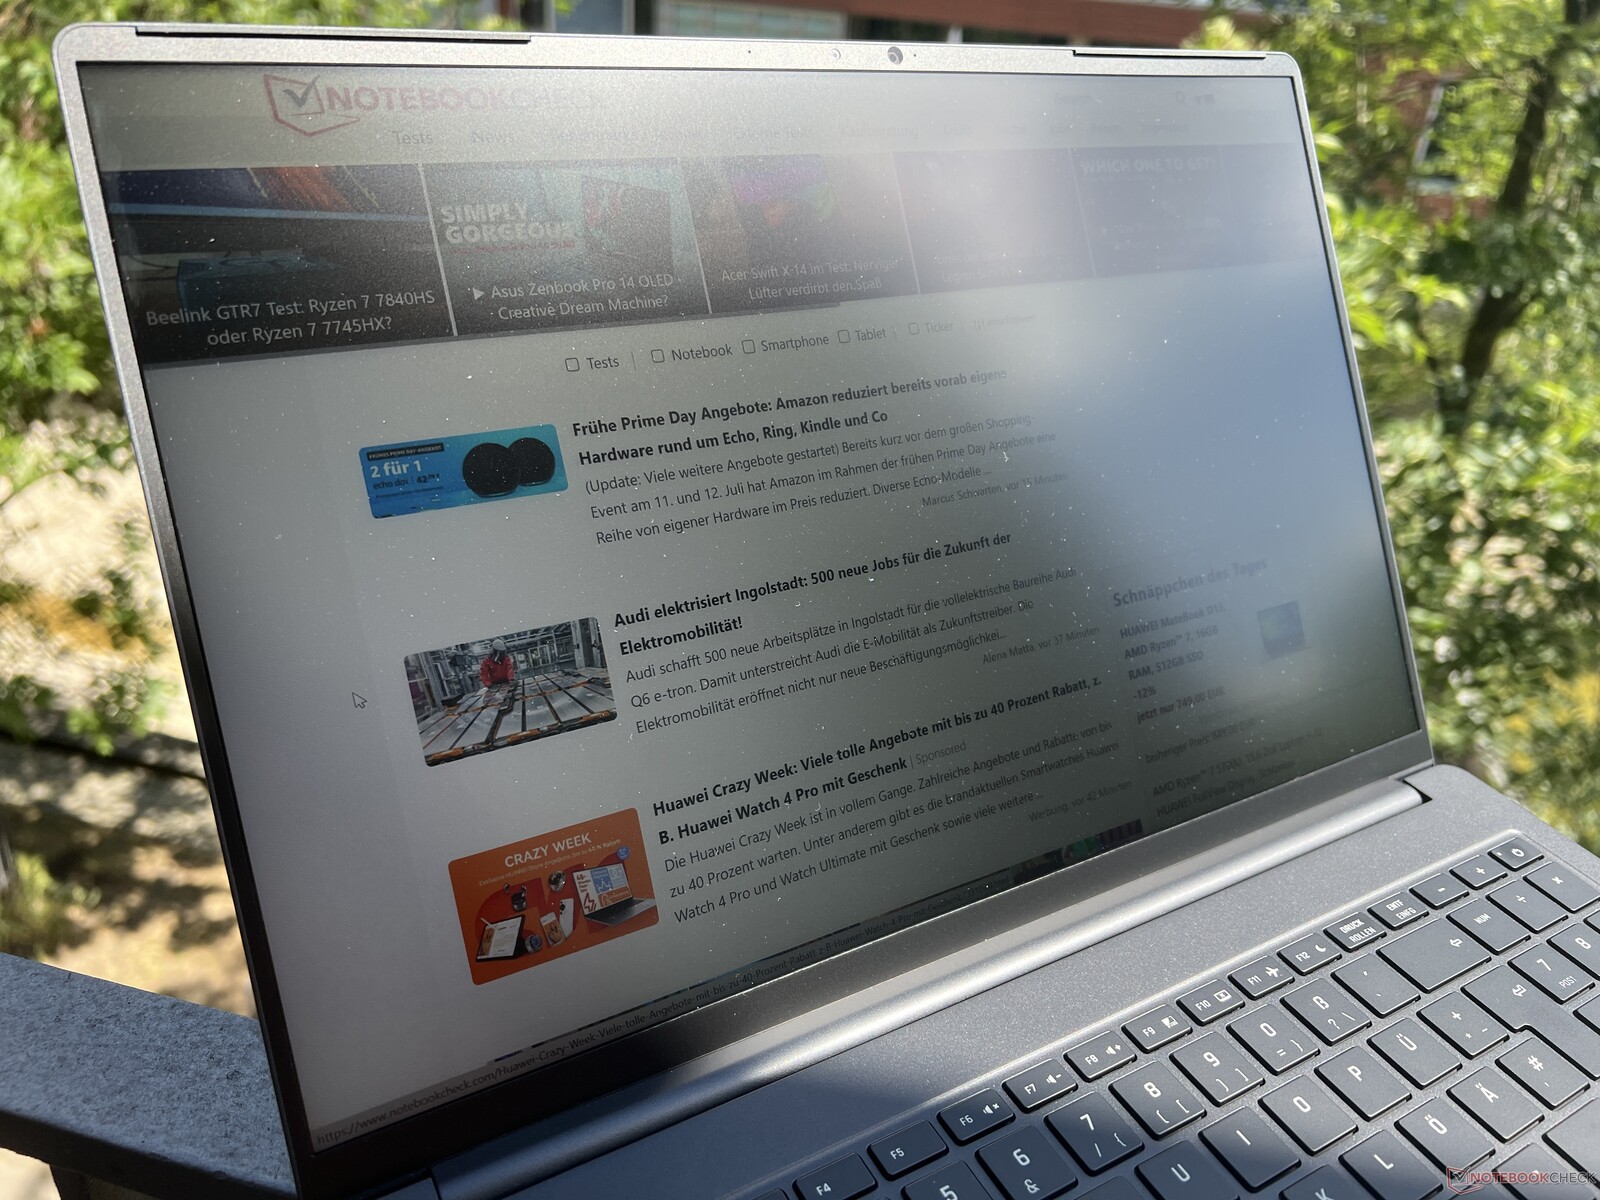
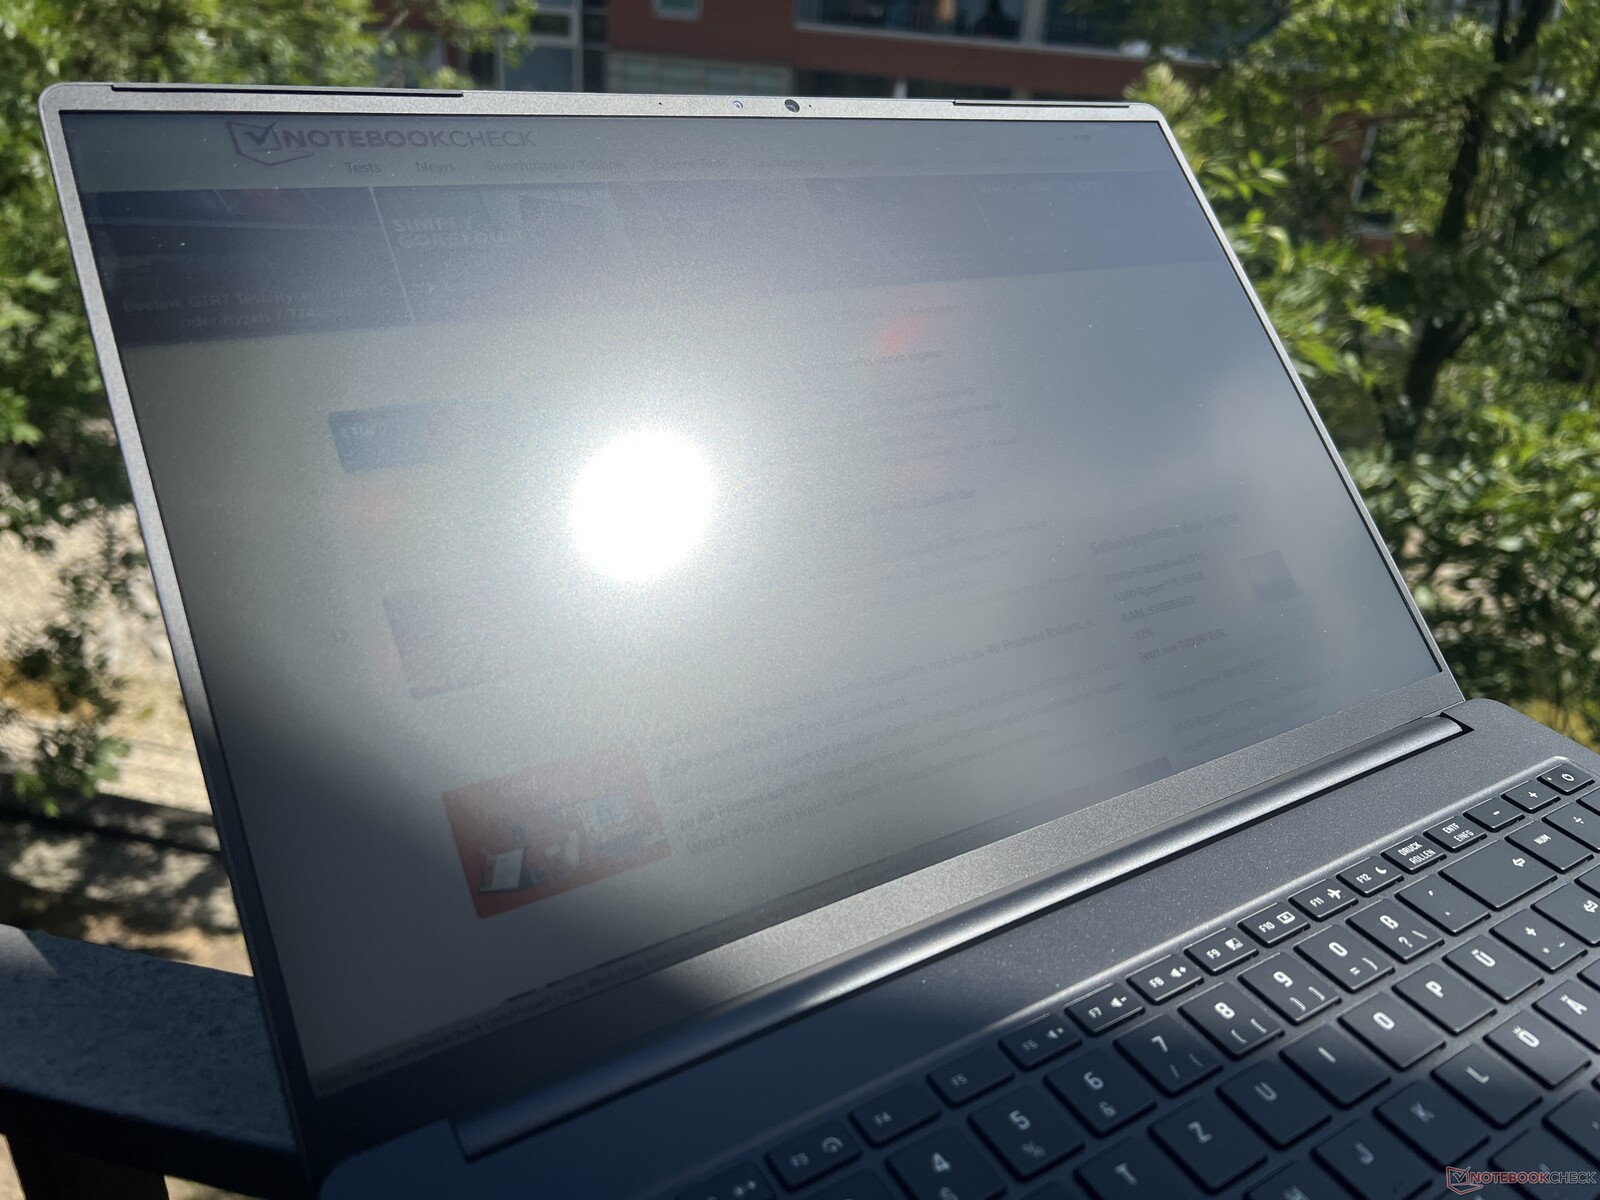
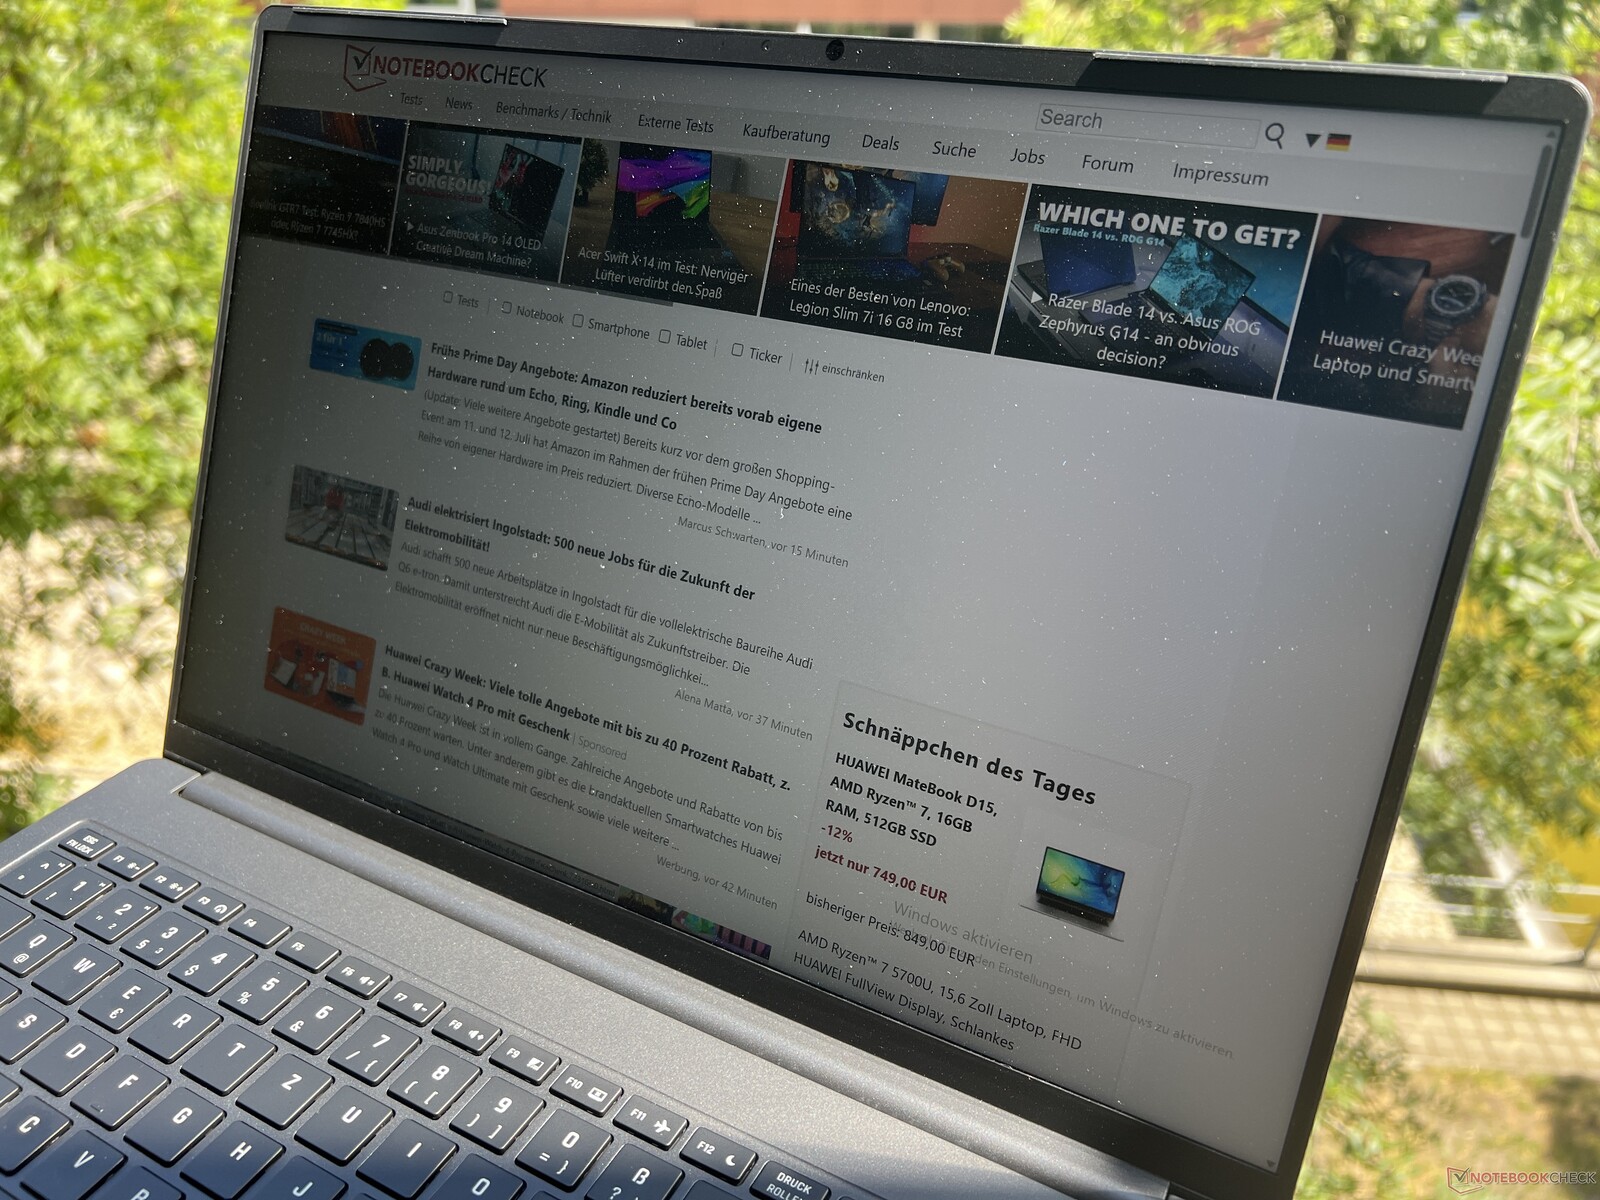
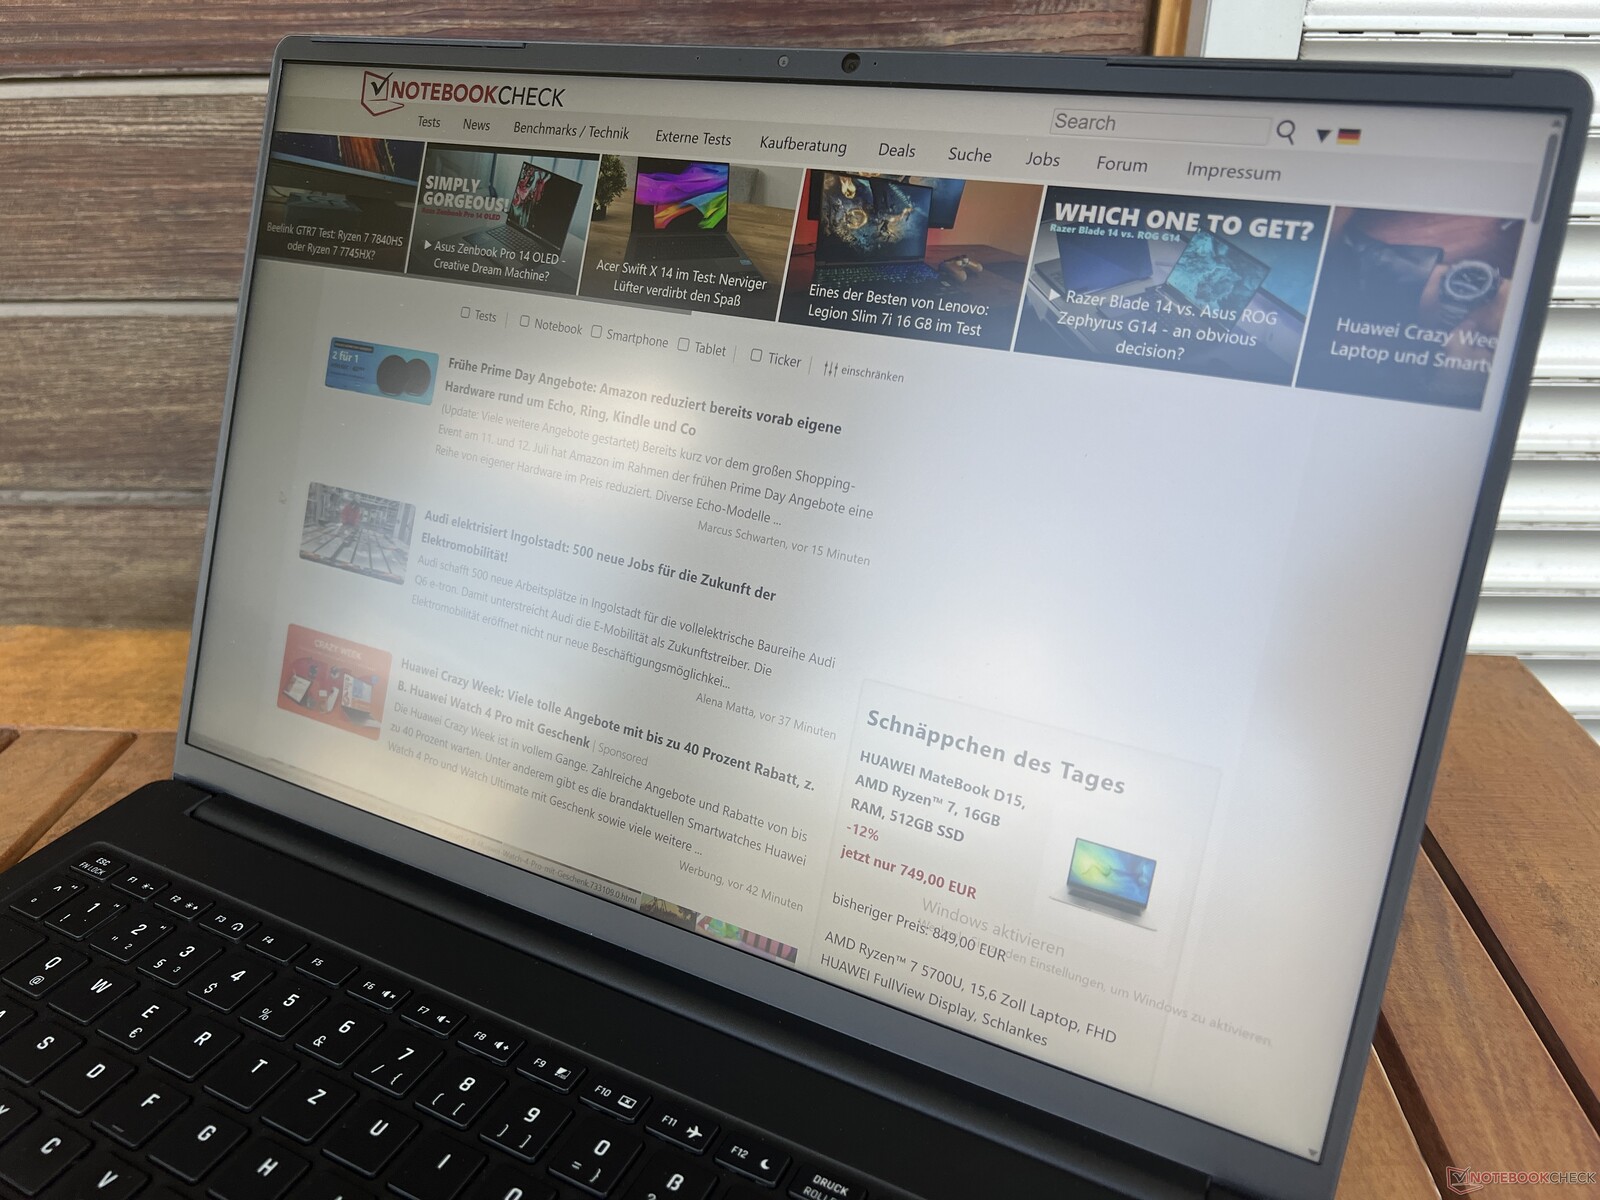
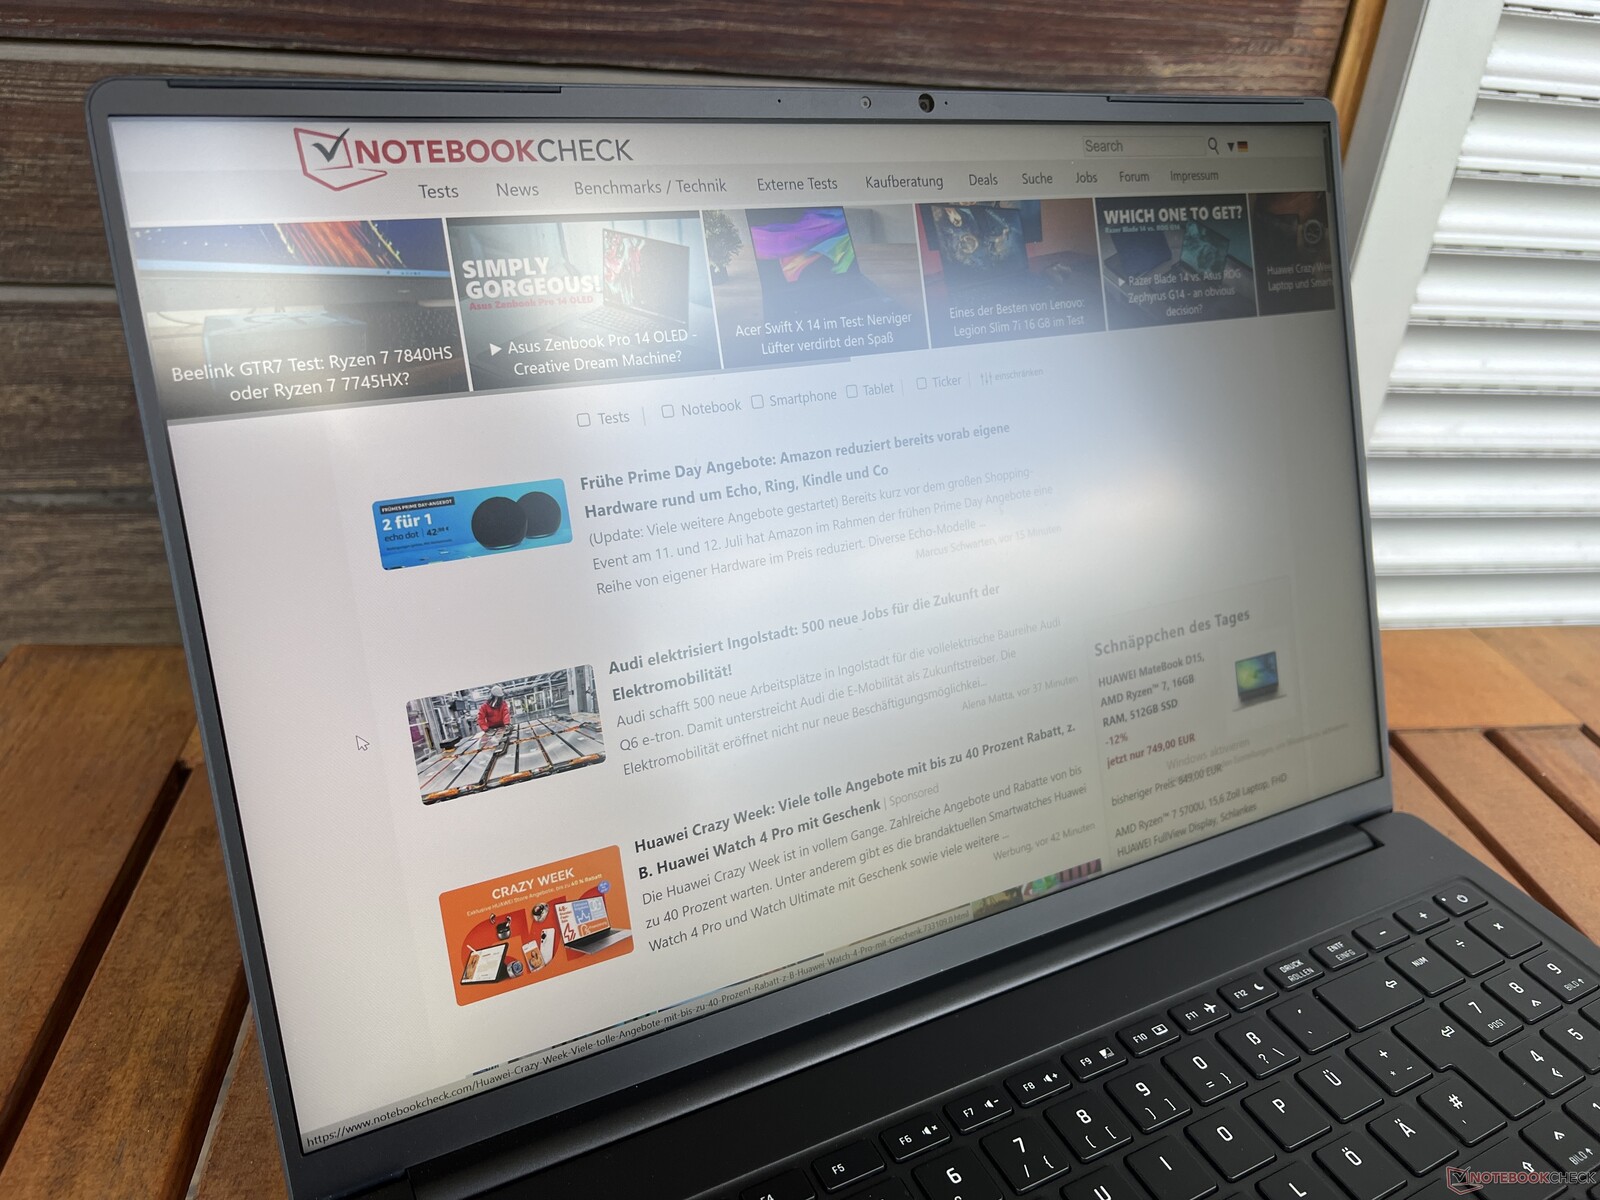

只要避免直接光源的反射,在明亮的环境中使用 Vision 16 Pro 也不会有任何问题。可视角度的稳定性总体良好,但从上方角度观察时会有明显的增亮和对比度降低。

性能 - 95 瓦 RTX 4070 笔记本电脑
测试条件
申克公司在控制中心提供了各种电源配置文件,但与前代产品不同的是,它不再提供手动配置文件,因此无法配置处理器的 TDP 限制。我们再次在 "发烧级性能 "模式下进行了基准测试和测量,将处理器的 TDP 值设置为 60/45 瓦(激活 dGPU 时为 55/35 瓦)。在此模式下,GPU 的功耗为 95 瓦(70 瓦 TGP + 25 瓦 Dynamic Boost),而在 Enthusiast Balanced 模式下为 85 瓦(60 + 25 瓦)。
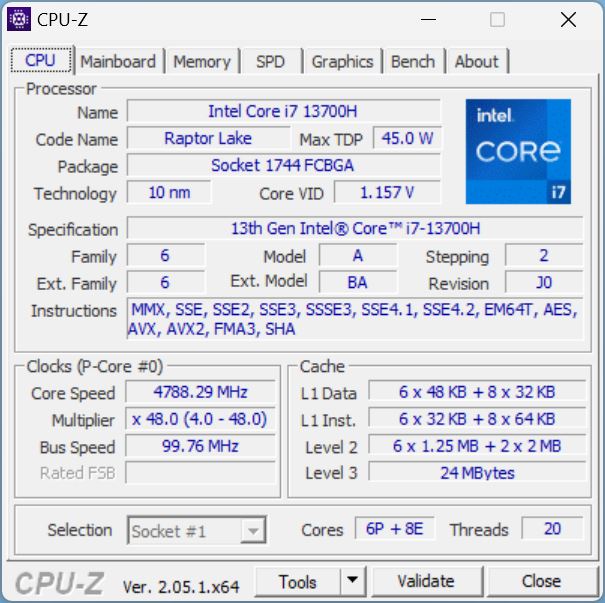
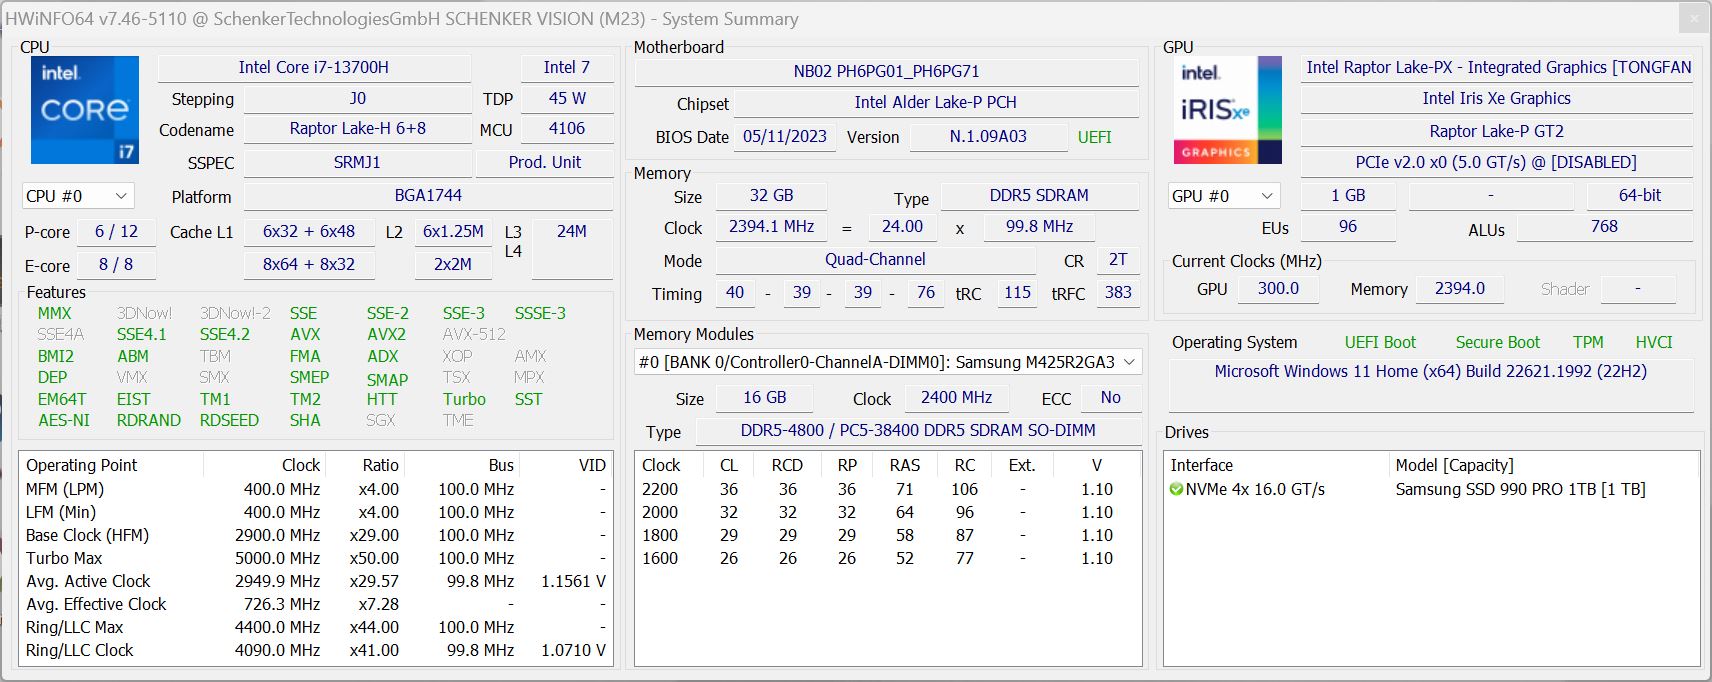
处理器 - 酷睿 i7-13700H
英特尔目前这一代 Raptor Lake 的酷睿 i7-13700H 是酷睿 i7-12700H 的直接继承者,除了最高时钟速度略有提高之外,没有任何变化。 Vision 16 Pro 是为数不多的没有超过 100 瓦的超高功率限制的设备之一。这在日常运行中具有一定优势,因为温度不会迅速升高,而且在持续负载下性能也不会急剧下降。另一方面,短负载下的多核性能也低于竞争对手,仅略高于旧型号。在 Turbo 模式下,旧机型甚至明显更快。在电池工作模式下,功耗限制在 36 瓦,导致多核性能在没有充电器的情况下下降了 20%。您可以在 技术部分.
Cinebench R15 Multi Constant Load Test
Cinebench R23: Multi Core | Single Core
Cinebench R20: CPU (Multi Core) | CPU (Single Core)
Cinebench R15: CPU Multi 64Bit | CPU Single 64Bit
Blender: v2.79 BMW27 CPU
7-Zip 18.03: 7z b 4 | 7z b 4 -mmt1
Geekbench 5.5: Multi-Core | Single-Core
HWBOT x265 Benchmark v2.2: 4k Preset
LibreOffice : 20 Documents To PDF
R Benchmark 2.5: Overall mean
| CPU Performance rating | |
| Asus ProArt Studiobook 16 OLED H7604 | |
| MSI Stealth 16 Studio A13VG | |
| Apple MacBook Pro 16 2023 M2 Max -6! | |
| Dell XPS 15 9530 RTX 4070 | |
| Average of class Multimedia | |
| Schenker VISION 16 Pro (M23) | |
| Average Intel Core i7-13700H | |
| Schenker Vision 16 Pro RTX 3070 Ti | |
| Samsung Galaxy Book3 Ultra 16, i9-13900H RTX 4070 | |
| Cinebench R23 / Multi Core | |
| Asus ProArt Studiobook 16 OLED H7604 | |
| MSI Stealth 16 Studio A13VG | |
| Average of class Multimedia (4861 - 33362, n=74, last 2 years) | |
| Dell XPS 15 9530 RTX 4070 | |
| Average Intel Core i7-13700H (5890 - 20034, n=29) | |
| Apple MacBook Pro 16 2023 M2 Max | |
| Schenker VISION 16 Pro (M23) | |
| Samsung Galaxy Book3 Ultra 16, i9-13900H RTX 4070 | |
| Schenker Vision 16 Pro RTX 3070 Ti | |
| Cinebench R23 / Single Core | |
| Asus ProArt Studiobook 16 OLED H7604 | |
| Average of class Multimedia (1128 - 2459, n=66, last 2 years) | |
| Schenker VISION 16 Pro (M23) | |
| MSI Stealth 16 Studio A13VG | |
| Dell XPS 15 9530 RTX 4070 | |
| Schenker Vision 16 Pro RTX 3070 Ti | |
| Average Intel Core i7-13700H (1323 - 1914, n=29) | |
| Apple MacBook Pro 16 2023 M2 Max | |
| Samsung Galaxy Book3 Ultra 16, i9-13900H RTX 4070 | |
| Cinebench R20 / CPU (Multi Core) | |
| Asus ProArt Studiobook 16 OLED H7604 | |
| MSI Stealth 16 Studio A13VG | |
| Average of class Multimedia (1887 - 12912, n=57, last 2 years) | |
| Dell XPS 15 9530 RTX 4070 | |
| Average Intel Core i7-13700H (2322 - 7674, n=29) | |
| Schenker VISION 16 Pro (M23) | |
| Schenker Vision 16 Pro RTX 3070 Ti | |
| Samsung Galaxy Book3 Ultra 16, i9-13900H RTX 4070 | |
| Apple MacBook Pro 16 2023 M2 Max | |
| Cinebench R20 / CPU (Single Core) | |
| Asus ProArt Studiobook 16 OLED H7604 | |
| Average of class Multimedia (425 - 853, n=57, last 2 years) | |
| Schenker VISION 16 Pro (M23) | |
| MSI Stealth 16 Studio A13VG | |
| Schenker Vision 16 Pro RTX 3070 Ti | |
| Dell XPS 15 9530 RTX 4070 | |
| Average Intel Core i7-13700H (508 - 741, n=29) | |
| Apple MacBook Pro 16 2023 M2 Max | |
| Samsung Galaxy Book3 Ultra 16, i9-13900H RTX 4070 | |
| Cinebench R15 / CPU Multi 64Bit | |
| Asus ProArt Studiobook 16 OLED H7604 | |
| MSI Stealth 16 Studio A13VG | |
| Schenker Vision 16 Pro RTX 3070 Ti | |
| Schenker Vision 16 Pro RTX 3070 Ti | |
| Dell XPS 15 9530 RTX 4070 | |
| Average of class Multimedia (856 - 5224, n=61, last 2 years) | |
| Average Intel Core i7-13700H (905 - 2982, n=29) | |
| Schenker VISION 16 Pro (M23) | |
| Samsung Galaxy Book3 Ultra 16, i9-13900H RTX 4070 | |
| Apple MacBook Pro 16 2023 M2 Max | |
| Cinebench R15 / CPU Single 64Bit | |
| Asus ProArt Studiobook 16 OLED H7604 | |
| Average of class Multimedia (184.8 - 326, n=59, last 2 years) | |
| Schenker VISION 16 Pro (M23) | |
| MSI Stealth 16 Studio A13VG | |
| Dell XPS 15 9530 RTX 4070 | |
| Schenker Vision 16 Pro RTX 3070 Ti | |
| Average Intel Core i7-13700H (213 - 278, n=29) | |
| Apple MacBook Pro 16 2023 M2 Max | |
| Samsung Galaxy Book3 Ultra 16, i9-13900H RTX 4070 | |
| Blender / v2.79 BMW27 CPU | |
| Schenker Vision 16 Pro RTX 3070 Ti | |
| Average of class Multimedia (100 - 557, n=58, last 2 years) | |
| Samsung Galaxy Book3 Ultra 16, i9-13900H RTX 4070 | |
| Average Intel Core i7-13700H (169 - 555, n=29) | |
| Schenker VISION 16 Pro (M23) | |
| Dell XPS 15 9530 RTX 4070 | |
| MSI Stealth 16 Studio A13VG | |
| Asus ProArt Studiobook 16 OLED H7604 | |
| 7-Zip 18.03 / 7z b 4 | |
| Asus ProArt Studiobook 16 OLED H7604 | |
| MSI Stealth 16 Studio A13VG | |
| Schenker VISION 16 Pro (M23) | |
| Average Intel Core i7-13700H (27322 - 76344, n=29) | |
| Dell XPS 15 9530 RTX 4070 | |
| Average of class Multimedia (26062 - 130368, n=55, last 2 years) | |
| Schenker Vision 16 Pro RTX 3070 Ti | |
| Samsung Galaxy Book3 Ultra 16, i9-13900H RTX 4070 | |
| 7-Zip 18.03 / 7z b 4 -mmt1 | |
| Asus ProArt Studiobook 16 OLED H7604 | |
| Schenker VISION 16 Pro (M23) | |
| MSI Stealth 16 Studio A13VG | |
| Dell XPS 15 9530 RTX 4070 | |
| Average of class Multimedia (3666 - 7545, n=56, last 2 years) | |
| Average Intel Core i7-13700H (4825 - 6238, n=29) | |
| Schenker Vision 16 Pro RTX 3070 Ti | |
| Samsung Galaxy Book3 Ultra 16, i9-13900H RTX 4070 | |
| Geekbench 5.5 / Multi-Core | |
| Asus ProArt Studiobook 16 OLED H7604 | |
| Apple MacBook Pro 16 2023 M2 Max | |
| Dell XPS 15 9530 RTX 4070 | |
| MSI Stealth 16 Studio A13VG | |
| Average of class Multimedia (4652 - 20422, n=56, last 2 years) | |
| Schenker VISION 16 Pro (M23) | |
| Average Intel Core i7-13700H (6165 - 14215, n=29) | |
| Schenker Vision 16 Pro RTX 3070 Ti | |
| Samsung Galaxy Book3 Ultra 16, i9-13900H RTX 4070 | |
| Geekbench 5.5 / Single-Core | |
| Asus ProArt Studiobook 16 OLED H7604 | |
| Apple MacBook Pro 16 2023 M2 Max | |
| Average of class Multimedia (805 - 2974, n=56, last 2 years) | |
| Dell XPS 15 9530 RTX 4070 | |
| Schenker VISION 16 Pro (M23) | |
| MSI Stealth 16 Studio A13VG | |
| Schenker Vision 16 Pro RTX 3070 Ti | |
| Average Intel Core i7-13700H (1362 - 1919, n=29) | |
| Samsung Galaxy Book3 Ultra 16, i9-13900H RTX 4070 | |
| HWBOT x265 Benchmark v2.2 / 4k Preset | |
| Asus ProArt Studiobook 16 OLED H7604 | |
| MSI Stealth 16 Studio A13VG | |
| Average of class Multimedia (5.26 - 36.1, n=56, last 2 years) | |
| Dell XPS 15 9530 RTX 4070 | |
| Schenker VISION 16 Pro (M23) | |
| Average Intel Core i7-13700H (6.72 - 21.2, n=29) | |
| Samsung Galaxy Book3 Ultra 16, i9-13900H RTX 4070 | |
| Schenker Vision 16 Pro RTX 3070 Ti | |
| LibreOffice / 20 Documents To PDF | |
| Samsung Galaxy Book3 Ultra 16, i9-13900H RTX 4070 | |
| MSI Stealth 16 Studio A13VG | |
| Average of class Multimedia (23.9 - 146.7, n=57, last 2 years) | |
| Average Intel Core i7-13700H (31.3 - 62.4, n=29) | |
| Schenker VISION 16 Pro (M23) | |
| Asus ProArt Studiobook 16 OLED H7604 | |
| Dell XPS 15 9530 RTX 4070 | |
| Schenker Vision 16 Pro RTX 3070 Ti | |
| R Benchmark 2.5 / Overall mean | |
| Samsung Galaxy Book3 Ultra 16, i9-13900H RTX 4070 | |
| Average Intel Core i7-13700H (0.4308 - 0.607, n=29) | |
| Average of class Multimedia (0.3604 - 0.947, n=56, last 2 years) | |
| Schenker Vision 16 Pro RTX 3070 Ti | |
| MSI Stealth 16 Studio A13VG | |
| Dell XPS 15 9530 RTX 4070 | |
| Schenker VISION 16 Pro (M23) | |
| Asus ProArt Studiobook 16 OLED H7604 | |
* ... smaller is better
AIDA64: FP32 Ray-Trace | FPU Julia | CPU SHA3 | CPU Queen | FPU SinJulia | FPU Mandel | CPU AES | CPU ZLib | FP64 Ray-Trace | CPU PhotoWorxx
| Performance rating | |
| Asus ProArt Studiobook 16 OLED H7604 | |
| MSI Stealth 16 Studio A13VG | |
| Average of class Multimedia | |
| Schenker VISION 16 Pro (M23) | |
| Dell XPS 15 9530 RTX 4070 | |
| Average Intel Core i7-13700H | |
| Samsung Galaxy Book3 Ultra 16, i9-13900H RTX 4070 | |
| Schenker Vision 16 Pro RTX 3070 Ti | |
| AIDA64 / FP32 Ray-Trace | |
| Asus ProArt Studiobook 16 OLED H7604 | |
| MSI Stealth 16 Studio A13VG | |
| Average of class Multimedia (2214 - 50388, n=53, last 2 years) | |
| Samsung Galaxy Book3 Ultra 16, i9-13900H RTX 4070 | |
| Dell XPS 15 9530 RTX 4070 | |
| Average Intel Core i7-13700H (4986 - 18908, n=29) | |
| Schenker VISION 16 Pro (M23) | |
| Schenker Vision 16 Pro RTX 3070 Ti | |
| AIDA64 / FPU Julia | |
| Asus ProArt Studiobook 16 OLED H7604 | |
| Average of class Multimedia (12867 - 201874, n=54, last 2 years) | |
| MSI Stealth 16 Studio A13VG | |
| Schenker VISION 16 Pro (M23) | |
| Average Intel Core i7-13700H (25360 - 92359, n=29) | |
| Dell XPS 15 9530 RTX 4070 | |
| Schenker Vision 16 Pro RTX 3070 Ti | |
| Samsung Galaxy Book3 Ultra 16, i9-13900H RTX 4070 | |
| AIDA64 / CPU SHA3 | |
| Asus ProArt Studiobook 16 OLED H7604 | |
| MSI Stealth 16 Studio A13VG | |
| Average of class Multimedia (626 - 8623, n=54, last 2 years) | |
| Samsung Galaxy Book3 Ultra 16, i9-13900H RTX 4070 | |
| Average Intel Core i7-13700H (1339 - 4224, n=29) | |
| Schenker VISION 16 Pro (M23) | |
| Dell XPS 15 9530 RTX 4070 | |
| Schenker Vision 16 Pro RTX 3070 Ti | |
| AIDA64 / CPU Queen | |
| Asus ProArt Studiobook 16 OLED H7604 | |
| MSI Stealth 16 Studio A13VG | |
| Dell XPS 15 9530 RTX 4070 | |
| Schenker VISION 16 Pro (M23) | |
| Average Intel Core i7-13700H (59324 - 107159, n=29) | |
| Schenker Vision 16 Pro RTX 3070 Ti | |
| Samsung Galaxy Book3 Ultra 16, i9-13900H RTX 4070 | |
| Average of class Multimedia (13483 - 181505, n=41, last 2 years) | |
| AIDA64 / FPU SinJulia | |
| Asus ProArt Studiobook 16 OLED H7604 | |
| MSI Stealth 16 Studio A13VG | |
| Schenker VISION 16 Pro (M23) | |
| Average Intel Core i7-13700H (4800 - 11050, n=29) | |
| Average of class Multimedia (886 - 28794, n=54, last 2 years) | |
| Dell XPS 15 9530 RTX 4070 | |
| Schenker Vision 16 Pro RTX 3070 Ti | |
| Samsung Galaxy Book3 Ultra 16, i9-13900H RTX 4070 | |
| AIDA64 / FPU Mandel | |
| Asus ProArt Studiobook 16 OLED H7604 | |
| MSI Stealth 16 Studio A13VG | |
| Average of class Multimedia (6395 - 105740, n=53, last 2 years) | |
| Samsung Galaxy Book3 Ultra 16, i9-13900H RTX 4070 | |
| Average Intel Core i7-13700H (12321 - 45118, n=29) | |
| Dell XPS 15 9530 RTX 4070 | |
| Schenker VISION 16 Pro (M23) | |
| Schenker Vision 16 Pro RTX 3070 Ti | |
| AIDA64 / CPU AES | |
| Asus ProArt Studiobook 16 OLED H7604 | |
| MSI Stealth 16 Studio A13VG | |
| Average Intel Core i7-13700H (28769 - 151254, n=29) | |
| Schenker VISION 16 Pro (M23) | |
| Average of class Multimedia (8171 - 126790, n=54, last 2 years) | |
| Dell XPS 15 9530 RTX 4070 | |
| Schenker Vision 16 Pro RTX 3070 Ti | |
| Samsung Galaxy Book3 Ultra 16, i9-13900H RTX 4070 | |
| AIDA64 / CPU ZLib | |
| Asus ProArt Studiobook 16 OLED H7604 | |
| MSI Stealth 16 Studio A13VG | |
| Samsung Galaxy Book3 Ultra 16, i9-13900H RTX 4070 | |
| Average of class Multimedia (143.8 - 2022, n=54, last 2 years) | |
| Schenker VISION 16 Pro (M23) | |
| Average Intel Core i7-13700H (389 - 1215, n=29) | |
| Dell XPS 15 9530 RTX 4070 | |
| Schenker Vision 16 Pro RTX 3070 Ti | |
| AIDA64 / FP64 Ray-Trace | |
| Asus ProArt Studiobook 16 OLED H7604 | |
| MSI Stealth 16 Studio A13VG | |
| Average of class Multimedia (1014 - 26875, n=54, last 2 years) | |
| Dell XPS 15 9530 RTX 4070 | |
| Average Intel Core i7-13700H (2540 - 10135, n=29) | |
| Schenker VISION 16 Pro (M23) | |
| Schenker Vision 16 Pro RTX 3070 Ti | |
| Samsung Galaxy Book3 Ultra 16, i9-13900H RTX 4070 | |
| AIDA64 / CPU PhotoWorxx | |
| Average of class Multimedia (8187 - 88154, n=54, last 2 years) | |
| Asus ProArt Studiobook 16 OLED H7604 | |
| Samsung Galaxy Book3 Ultra 16, i9-13900H RTX 4070 | |
| MSI Stealth 16 Studio A13VG | |
| Schenker VISION 16 Pro (M23) | |
| Dell XPS 15 9530 RTX 4070 | |
| Schenker Vision 16 Pro RTX 3070 Ti | |
| Average Intel Core i7-13700H (12872 - 52727, n=29) | |
系统性能
合成基准的测试结果非常好,但对比设备非常接近,在日常操作中不会有任何明显差异。这些都是采用现代组件的反应非常灵敏的电脑。在测试过程中,我们没有遇到任何稳定性问题。
CrossMark: Overall | Productivity | Creativity | Responsiveness
| PCMark 10 / Score | |
| Average of class Multimedia (4325 - 10386, n=52, last 2 years) | |
| Asus ProArt Studiobook 16 OLED H7604 | |
| Average Intel Core i7-13700H, NVIDIA GeForce RTX 4070 Laptop GPU (7158 - 7956, n=8) | |
| Schenker VISION 16 Pro (M23) | |
| MSI Stealth 16 Studio A13VG | |
| Dell XPS 15 9530 RTX 4070 | |
| Samsung Galaxy Book3 Ultra 16, i9-13900H RTX 4070 | |
| PCMark 10 / Essentials | |
| Dell XPS 15 9530 RTX 4070 | |
| Asus ProArt Studiobook 16 OLED H7604 | |
| Schenker VISION 16 Pro (M23) | |
| Average Intel Core i7-13700H, NVIDIA GeForce RTX 4070 Laptop GPU (10252 - 11449, n=8) | |
| Average of class Multimedia (8025 - 11664, n=51, last 2 years) | |
| MSI Stealth 16 Studio A13VG | |
| Samsung Galaxy Book3 Ultra 16, i9-13900H RTX 4070 | |
| PCMark 10 / Productivity | |
| Average of class Multimedia (7323 - 18233, n=51, last 2 years) | |
| Asus ProArt Studiobook 16 OLED H7604 | |
| Schenker VISION 16 Pro (M23) | |
| Average Intel Core i7-13700H, NVIDIA GeForce RTX 4070 Laptop GPU (8501 - 10769, n=8) | |
| MSI Stealth 16 Studio A13VG | |
| Dell XPS 15 9530 RTX 4070 | |
| Samsung Galaxy Book3 Ultra 16, i9-13900H RTX 4070 | |
| PCMark 10 / Digital Content Creation | |
| Average Intel Core i7-13700H, NVIDIA GeForce RTX 4070 Laptop GPU (10358 - 12908, n=8) | |
| MSI Stealth 16 Studio A13VG | |
| Schenker VISION 16 Pro (M23) | |
| Dell XPS 15 9530 RTX 4070 | |
| Asus ProArt Studiobook 16 OLED H7604 | |
| Average of class Multimedia (3651 - 16240, n=51, last 2 years) | |
| Samsung Galaxy Book3 Ultra 16, i9-13900H RTX 4070 | |
| CrossMark / Overall | |
| Asus ProArt Studiobook 16 OLED H7604 | |
| Apple MacBook Pro 16 2023 M2 Max | |
| Schenker VISION 16 Pro (M23) | |
| Dell XPS 15 9530 RTX 4070 | |
| Average Intel Core i7-13700H, NVIDIA GeForce RTX 4070 Laptop GPU (1768 - 2073, n=6) | |
| Average of class Multimedia (866 - 2728, n=60, last 2 years) | |
| MSI Stealth 16 Studio A13VG | |
| Schenker Vision 16 Pro RTX 3070 Ti | |
| Samsung Galaxy Book3 Ultra 16, i9-13900H RTX 4070 | |
| CrossMark / Productivity | |
| Asus ProArt Studiobook 16 OLED H7604 | |
| Schenker VISION 16 Pro (M23) | |
| Average Intel Core i7-13700H, NVIDIA GeForce RTX 4070 Laptop GPU (1645 - 2006, n=6) | |
| Average of class Multimedia (931 - 2489, n=60, last 2 years) | |
| Dell XPS 15 9530 RTX 4070 | |
| MSI Stealth 16 Studio A13VG | |
| Apple MacBook Pro 16 2023 M2 Max | |
| Schenker Vision 16 Pro RTX 3070 Ti | |
| Samsung Galaxy Book3 Ultra 16, i9-13900H RTX 4070 | |
| CrossMark / Creativity | |
| Apple MacBook Pro 16 2023 M2 Max | |
| Asus ProArt Studiobook 16 OLED H7604 | |
| Average of class Multimedia (907 - 3465, n=60, last 2 years) | |
| Dell XPS 15 9530 RTX 4070 | |
| Average Intel Core i7-13700H, NVIDIA GeForce RTX 4070 Laptop GPU (1936 - 2137, n=6) | |
| Schenker VISION 16 Pro (M23) | |
| MSI Stealth 16 Studio A13VG | |
| Schenker Vision 16 Pro RTX 3070 Ti | |
| Samsung Galaxy Book3 Ultra 16, i9-13900H RTX 4070 | |
| CrossMark / Responsiveness | |
| Asus ProArt Studiobook 16 OLED H7604 | |
| Schenker VISION 16 Pro (M23) | |
| Average Intel Core i7-13700H, NVIDIA GeForce RTX 4070 Laptop GPU (1451 - 2202, n=6) | |
| MSI Stealth 16 Studio A13VG | |
| Dell XPS 15 9530 RTX 4070 | |
| Average of class Multimedia (605 - 2024, n=60, last 2 years) | |
| Apple MacBook Pro 16 2023 M2 Max | |
| Schenker Vision 16 Pro RTX 3070 Ti | |
| Samsung Galaxy Book3 Ultra 16, i9-13900H RTX 4070 | |
| PCMark 10 Score | 7368 points | |
Help | ||
| AIDA64 / Memory Copy | |
| Average of class Multimedia (11299 - 132135, n=54, last 2 years) | |
| Asus ProArt Studiobook 16 OLED H7604 | |
| Samsung Galaxy Book3 Ultra 16, i9-13900H RTX 4070 | |
| MSI Stealth 16 Studio A13VG | |
| Dell XPS 15 9530 RTX 4070 | |
| Schenker VISION 16 Pro (M23) | |
| Schenker Vision 16 Pro RTX 3070 Ti | |
| Average Intel Core i7-13700H (24334 - 78081, n=29) | |
| AIDA64 / Memory Read | |
| Average of class Multimedia (11624 - 174586, n=54, last 2 years) | |
| Asus ProArt Studiobook 16 OLED H7604 | |
| MSI Stealth 16 Studio A13VG | |
| Schenker VISION 16 Pro (M23) | |
| Samsung Galaxy Book3 Ultra 16, i9-13900H RTX 4070 | |
| Dell XPS 15 9530 RTX 4070 | |
| Schenker Vision 16 Pro RTX 3070 Ti | |
| Average Intel Core i7-13700H (23681 - 79656, n=29) | |
| AIDA64 / Memory Write | |
| Samsung Galaxy Book3 Ultra 16, i9-13900H RTX 4070 | |
| Average of class Multimedia (11755 - 134998, n=54, last 2 years) | |
| Asus ProArt Studiobook 16 OLED H7604 | |
| MSI Stealth 16 Studio A13VG | |
| Average Intel Core i7-13700H (22986 - 99898, n=29) | |
| Dell XPS 15 9530 RTX 4070 | |
| Schenker VISION 16 Pro (M23) | |
| Schenker Vision 16 Pro RTX 3070 Ti | |
| AIDA64 / Memory Latency | |
| Average of class Multimedia (7 - 535, n=53, last 2 years) | |
| Samsung Galaxy Book3 Ultra 16, i9-13900H RTX 4070 | |
| Average Intel Core i7-13700H (82.4 - 136.8, n=29) | |
| Schenker Vision 16 Pro RTX 3070 Ti | |
| MSI Stealth 16 Studio A13VG | |
| Dell XPS 15 9530 RTX 4070 | |
| Asus ProArt Studiobook 16 OLED H7604 | |
| Schenker VISION 16 Pro (M23) | |
* ... smaller is better
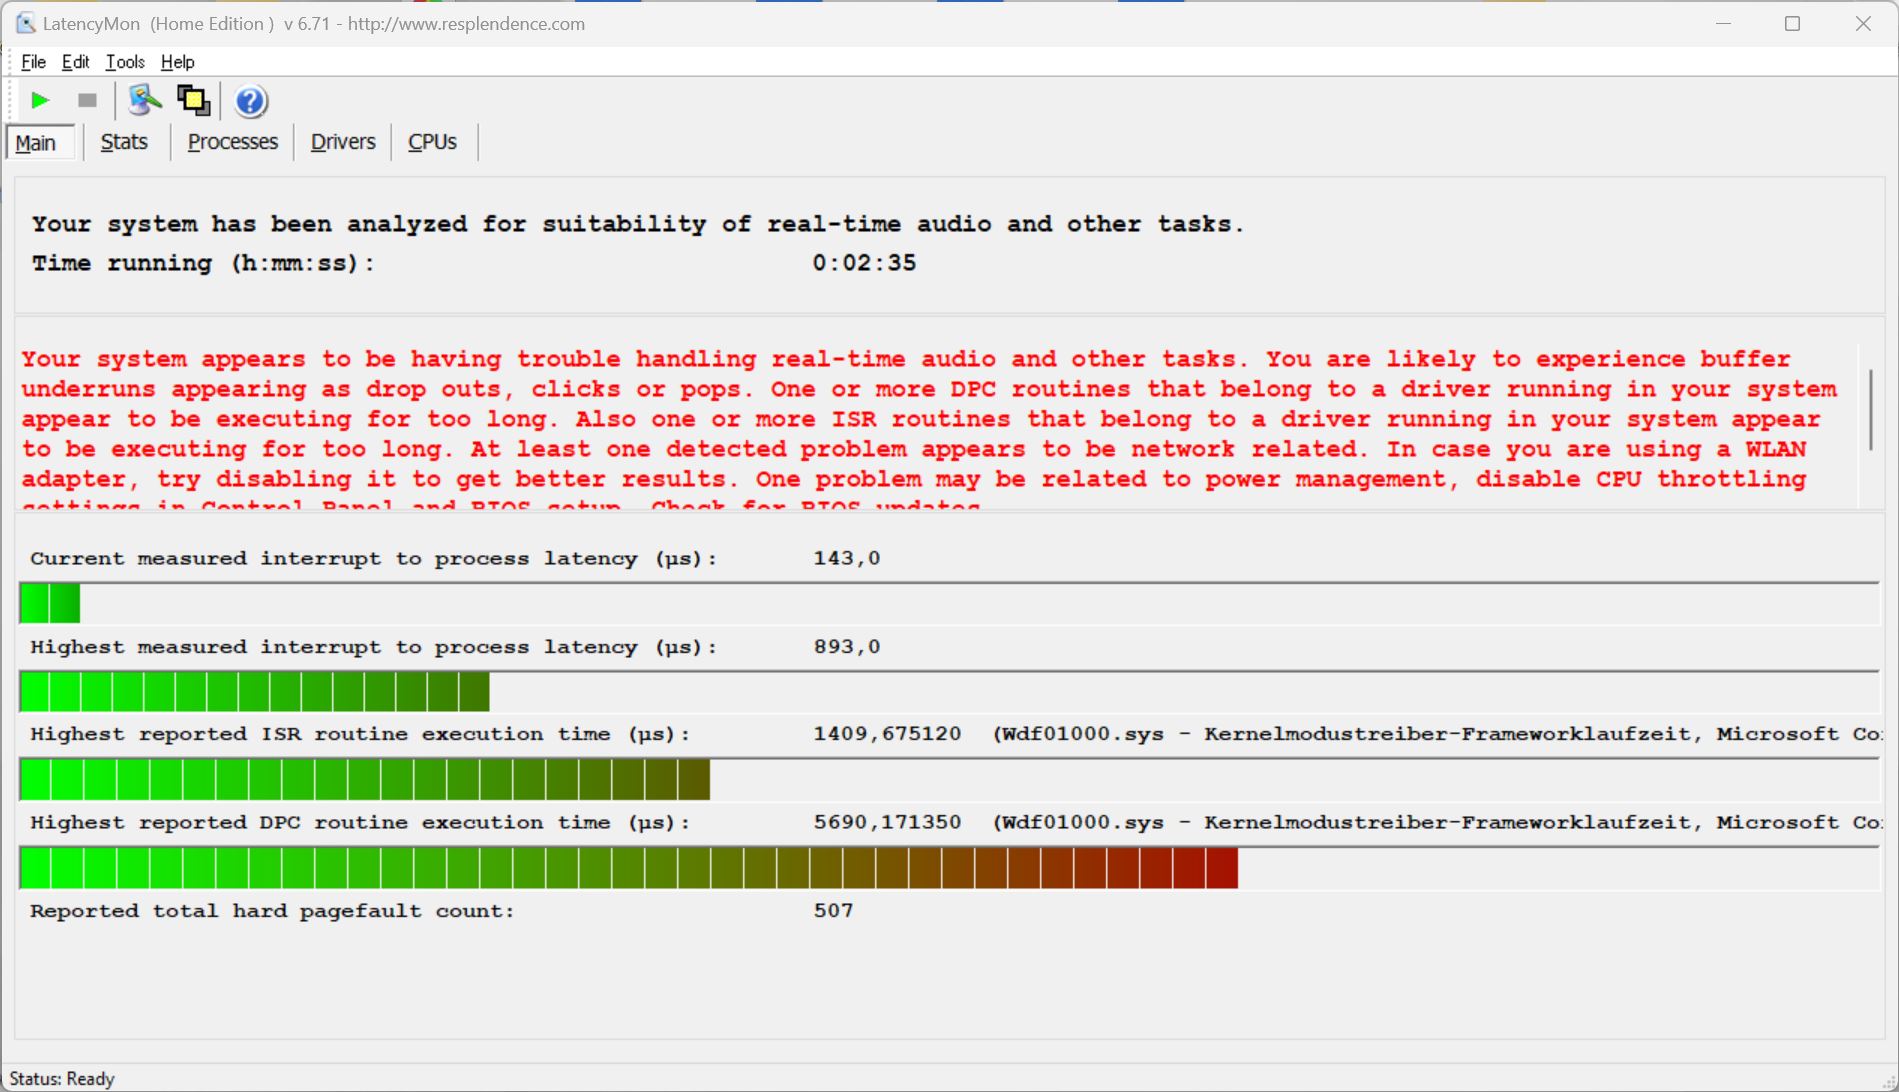
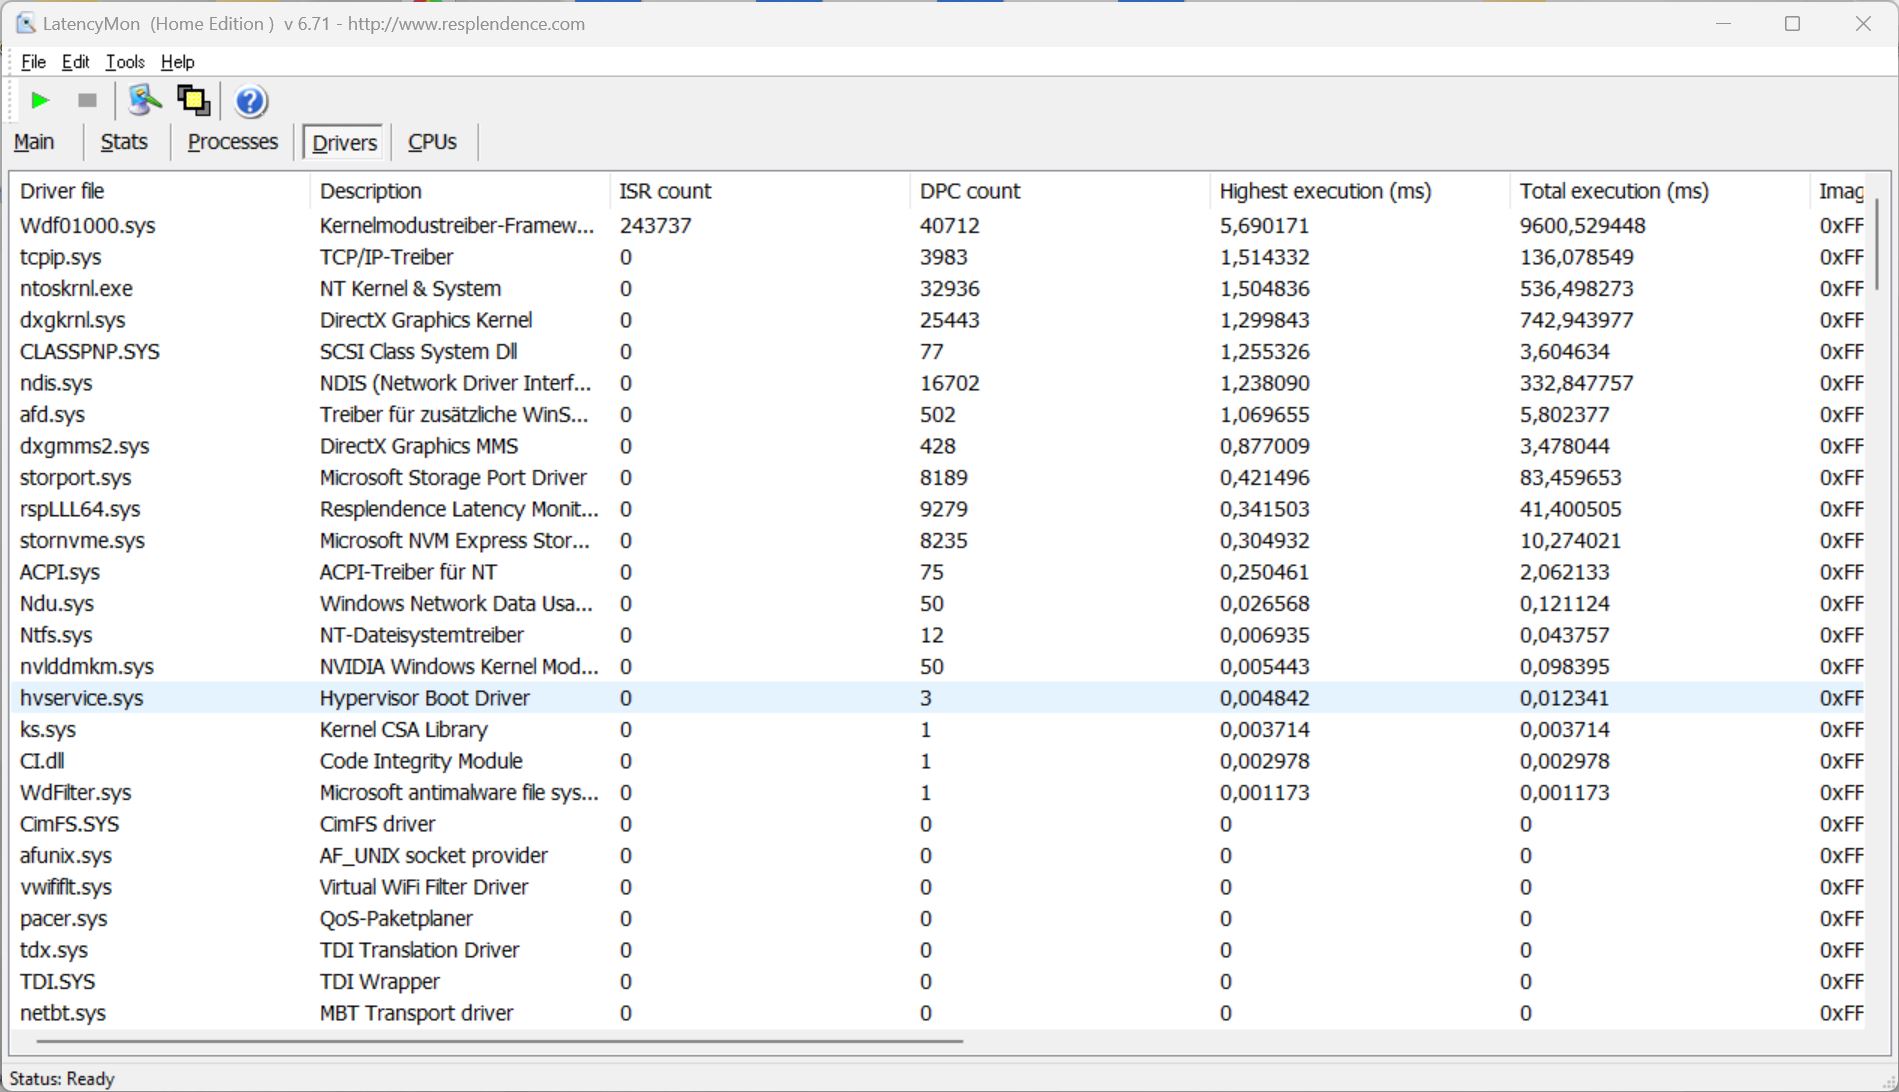
DPC 延迟
在我们的标准延迟测试(上网、4K YouTube 重放和 CPU 负载)中,在测试时使用的当前 BIOS 版本下,我们的测试设备在用于实时音频应用时显示出一些轻微的局限性。
| DPC Latencies / LatencyMon - interrupt to process latency (max), Web, Youtube, Prime95 | |
| MSI Stealth 16 Studio A13VG | |
| Samsung Galaxy Book3 Ultra 16, i9-13900H RTX 4070 | |
| Asus ProArt Studiobook 16 OLED H7604 | |
| Dell XPS 15 9530 RTX 4070 | |
| Schenker VISION 16 Pro (M23) | |
| Schenker Vision 16 Pro RTX 3070 Ti | |
* ... smaller is better
存储解决方案
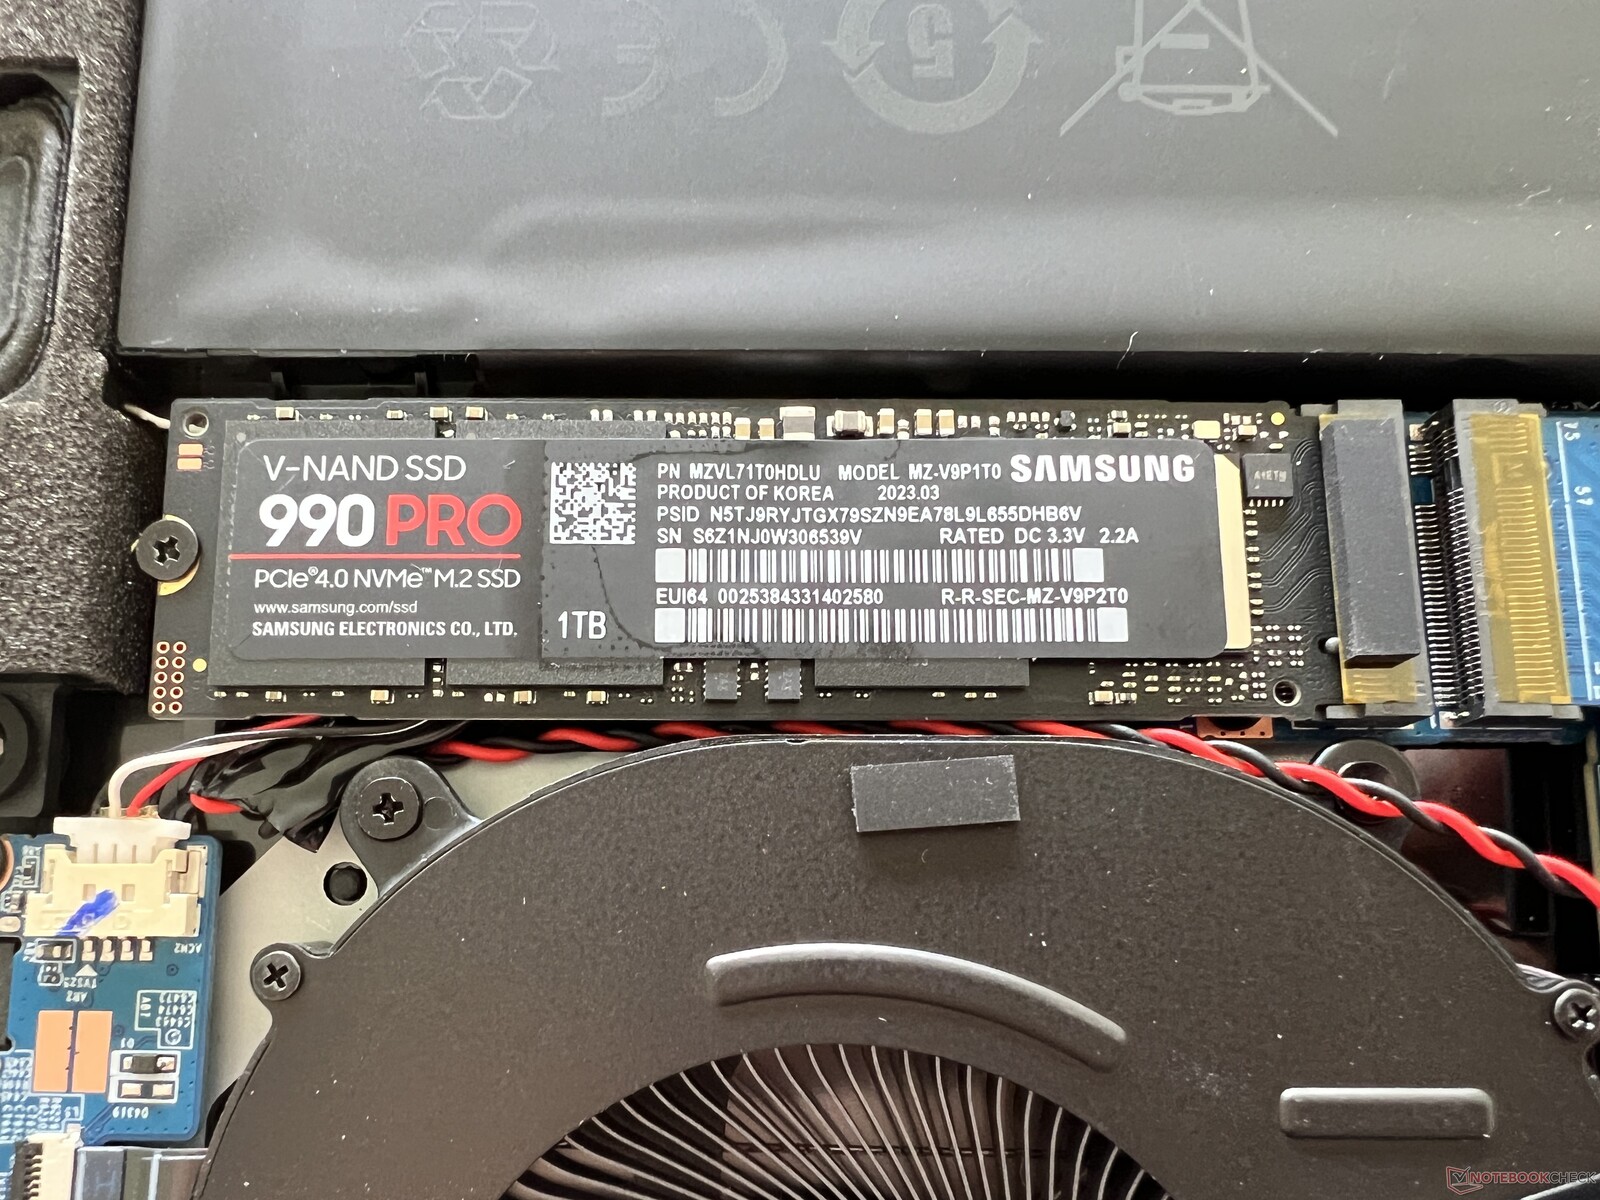
Vision 16 Pro 为固态硬盘提供了两个快速 PCIe 4.0 插槽,电池旁边的第二个插槽只能容纳单面固态硬盘。我们的测试机使用的是 1-TB 版本的三星 990 Pro,首次启动后,用户仍可使用 870 GB 的存储空间。固态硬盘的传输速率非常高,而且即使在长时间加载后,性能也能保持完全稳定,这在目前的高性能固态硬盘中绝无仅有。更多固态硬盘基准测试 这里.

* ... smaller is better
Disk Throttling: DiskSpd Read Loop, Queue Depth 8
显卡 - RTX 4070 笔记本电脑
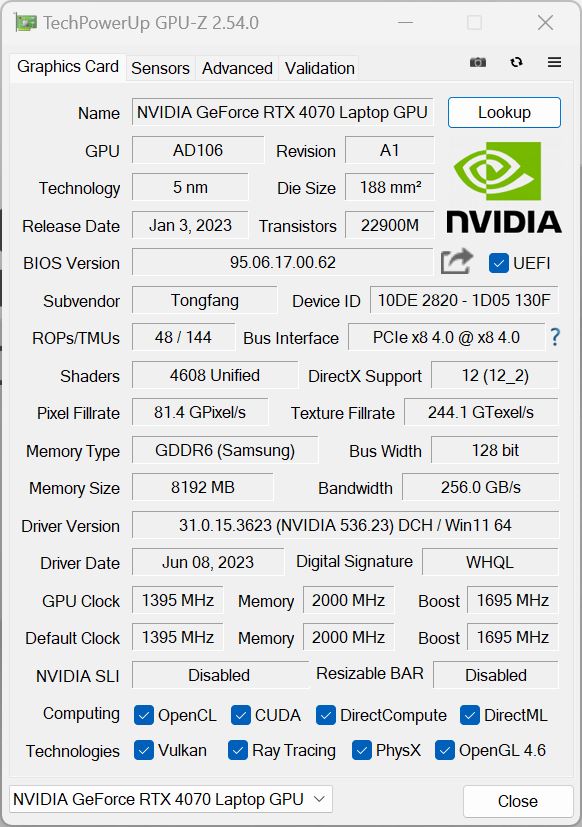
与去年的机型一样,目前使用的是最大 TGP 为 95 瓦的 Nvidia GPU(70 瓦 TGP + 来自 CPU 的 25 瓦 Dynamic Boost),但今年使用的是 新款 RTX 4070 笔记本电脑笔记本电脑。不过RTX 4080 笔记本电脑的直接继承者 RTX 3080这款多媒体笔记本电脑没有 MUX 开关,因此图形切换是通过 Optimus 定期进行的。
这款笔记本的最大功耗为 95 瓦,是 RTX 4070 笔记本的快速版本,因为这接近 4070 在游戏时的最大功耗 105 瓦。只有在一些合成测试(如 FurMark)中,功耗会更高,但这在实际使用中并不起任何作用。在 3DMarks 中,你也可以很容易地看到这一点,Schenker Vision 16 Pro 与 ProArt Studiobook 16 几乎处于同一水平,ProArt Studiobook 16 规定 RTX 4070 笔记本电脑的 TGP 为 130 瓦。与去年的 Vision 16 Pro的 RTX 3070 Ti相比,速度提高了约 25-30%。
我们的测试设备顺利通过了Time Spy 98.2% 的压力测试,但 GPU 的功耗在电池工作状态下被控制在 36 瓦。因此,在不使用充电器的情况下,GPU 性能会降低约 40%。您可以在这里找到其他 GPU 基准测试 这里.
| 3DMark 11 Performance | 32729 points | |
| 3DMark Fire Strike Score | 24151 points | |
| 3DMark Time Spy Score | 11566 points | |
Help | ||
| Blender / v3.3 Classroom METAL | |
| Apple MacBook Pro 16 2023 M2 Max | |
| Average of class Multimedia (17.8 - 68, n=5, last 2 years) | |
| Blender / v3.3 Classroom OPTIX/RTX | |
| Average of class Multimedia (12 - 105, n=22, last 2 years) | |
| Dell XPS 15 9530 RTX 4070 | |
| Schenker Vision 16 Pro RTX 3070 Ti | |
| Samsung Galaxy Book3 Ultra 16, i9-13900H RTX 4070 | |
| MSI Stealth 16 Studio A13VG | |
| Schenker VISION 16 Pro (M23) | |
| Asus ProArt Studiobook 16 OLED H7604 | |
| Average NVIDIA GeForce RTX 4070 Laptop GPU (18 - 30, n=68) | |
| Blender / v3.3 Classroom CUDA | |
| Average of class Multimedia (20 - 186, n=22, last 2 years) | |
| Dell XPS 15 9530 RTX 4070 | |
| Schenker Vision 16 Pro RTX 3070 Ti | |
| Samsung Galaxy Book3 Ultra 16, i9-13900H RTX 4070 | |
| MSI Stealth 16 Studio A13VG | |
| Asus ProArt Studiobook 16 OLED H7604 | |
| Schenker VISION 16 Pro (M23) | |
| Average NVIDIA GeForce RTX 4070 Laptop GPU (32 - 50, n=67) | |
| Blender / v3.3 Classroom CPU | |
| Schenker Vision 16 Pro RTX 3070 Ti | |
| Samsung Galaxy Book3 Ultra 16, i9-13900H RTX 4070 | |
| Average of class Multimedia (134.5 - 1042, n=62, last 2 years) | |
| Schenker VISION 16 Pro (M23) | |
| Dell XPS 15 9530 RTX 4070 | |
| Apple MacBook Pro 16 2023 M2 Max | |
| MSI Stealth 16 Studio A13VG | |
| Average NVIDIA GeForce RTX 4070 Laptop GPU (158 - 440, n=67) | |
| Asus ProArt Studiobook 16 OLED H7604 | |
* ... smaller is better
游戏性能
相对较低的 CPU 性能可能会对游戏性能产生负面影响,因为与其他配备 RTX 4070 的笔记本电脑相比,Vision 16 Pro 的性能有时会下降。但基本上,它的性能完全足够在 QHD 分辨率下流畅地玩《赛博朋克 2077》或《星球大战:绝地求生》等现代游戏,而且在较长时间的游戏过程中也能保持稳定。
| The Witcher 3 - 1920x1080 Ultra Graphics & Postprocessing (HBAO+) | |
| MSI Stealth 16 Studio A13VG | |
| Asus ProArt Studiobook 16 OLED H7604 | |
| Schenker VISION 16 Pro (M23) | |
| Schenker Vision 16 Pro RTX 3070 Ti | |
| Samsung Galaxy Book3 Ultra 16, i9-13900H RTX 4070 | |
| Dell XPS 15 9530 RTX 4070 | |
| Average of class Multimedia (11 - 121, n=7, last 2 years) | |
The Witcher 3 FPS Chart
| low | med. | high | ultra | QHD | |
|---|---|---|---|---|---|
| GTA V (2015) | 170 | 156.9 | 96.5 | 80.6 | |
| The Witcher 3 (2015) | 226 | 105.4 | |||
| Dota 2 Reborn (2015) | 178.4 | 161.3 | 152.4 | 143.8 | |
| Final Fantasy XV Benchmark (2018) | 175.3 | 143.2 | 109 | 81.6 | |
| X-Plane 11.11 (2018) | 154.8 | 138.4 | 109.7 | ||
| Far Cry 5 (2018) | 168 | 134 | 127 | 120 | 108 |
| Strange Brigade (2018) | 362 | 270 | 223 | 196.7 | 131.6 |
| F1 2021 (2021) | 339 | 276 | 234 | 133.1 | 104.3 |
| Cyberpunk 2077 1.6 (2022) | 106 | 102 | 101 | 82 | 52 |
| F1 22 (2022) | 220 | 183 | 72.6 | 47 | |
| Star Wars Jedi Survivor (2023) | 84 | 76 | 72 | 67 | 44 |
排放 - 风扇在全功率运转时噪音很大
噪音排放
您可以在 BIOS 中配置两个风扇是否以低速持续运行,这样做的好处是可以更好地处理峰值负载。虽然在我们的测试设备中激活了这一选项,但在很多情况下,即使在最快性能模式下,风扇也是静止不动的。只有在负载情况下,当 GPU 因功耗较高而发挥较大作用时,风扇才会变得清晰可闻。在游戏和压力测试中,Vision 16 Pro 的噪音约为 53 dB(A),与前代产品在 Turbo 模式下的噪音差不多。我们在下表中列出了不同模式下的测量值:
| 应用 | 静音 | 性能平衡 | 性能发烧友 |
|---|---|---|---|
| 3DMark 06 | 37.7 dB(A) | 47.2 dB(A) | 47.2 dB(A) |
| Witcher 3 | 37.7 dB(A) | 49.9 dB(A) | 53.1 dB(A) |
| 压力测试 | 40.6 dB(A) | 49.9 dB(A) | 53.1 dB(A) |
特别是在日常操作中,以及在玩一些较老或要求不高的游戏时,值得切换到静音模式(通过控制中心或使用 F3 键),因为性能仍然足够,而且风扇也会保持在约 38 至 40 dB(A) 的范围内。在测试设备中,我们没有发现任何其他电子噪音。
Noise level
| Idle |
| 25.9 / 25.9 / 32 dB(A) |
| Load |
| 47.2 / 53.1 dB(A) |
 | ||
30 dB silent 40 dB(A) audible 50 dB(A) loud |
||
min: | ||
| Schenker VISION 16 Pro (M23) GeForce RTX 4070 Laptop GPU, i7-13700H, Samsung 990 Pro 1 TB | Samsung Galaxy Book3 Ultra 16, i9-13900H RTX 4070 GeForce RTX 4070 Laptop GPU, i9-13900H, Samsung PM9A1 MZVL21T0HCLR | MSI Stealth 16 Studio A13VG GeForce RTX 4070 Laptop GPU, i7-13700H, Micron 3400 2TB MTFDKBA2T0TFH | Dell XPS 15 9530 RTX 4070 GeForce RTX 4070 Laptop GPU, i7-13700H, SK hynix PC801 HFS001TEJ9X101N | Asus ProArt Studiobook 16 OLED H7604 GeForce RTX 4070 Laptop GPU, i9-13980HX, Phison EM2804TBMTCB47 | Apple MacBook Pro 16 2023 M2 Max M2 Max 38-Core GPU, M2 Max, Apple SSD AP2048Z | Schenker Vision 16 Pro RTX 3070 Ti GeForce RTX 3070 Ti Laptop GPU, i7-12700H, Samsung SSD 980 Pro 1TB MZ-V8P1T0BW | |
|---|---|---|---|---|---|---|---|
| Noise | 6% | 13% | 20% | 4% | 18% | 11% | |
| off / environment * (dB) | 25.9 | 25.2 3% | 24 7% | 23.1 11% | 24.5 5% | 23.9 8% | 22.9 12% |
| Idle Minimum * (dB) | 25.9 | 25.2 3% | 24 7% | 23.1 11% | 24.5 5% | 23.9 8% | 24.3 6% |
| Idle Average * (dB) | 25.9 | 25.2 3% | 24 7% | 23.1 11% | 24.5 5% | 23.9 8% | 24.3 6% |
| Idle Maximum * (dB) | 32 | 31.3 2% | 24 25% | 24.2 24% | 24.5 23% | 23.9 25% | 24.3 24% |
| Load Average * (dB) | 47.2 | 38.8 18% | 34.81 26% | 27.1 43% | 47.6 -1% | 36.6 22% | 38.5 18% |
| Witcher 3 ultra * (dB) | 53.1 | 44.05 17% | 40.1 24% | 55.9 -5% | 35.1 34% | 51 4% | |
| Load Maximum * (dB) | 53.1 | 51.2 4% | 51.57 3% | 44.6 16% | 56.7 -7% | 43.2 19% | 51 4% |
* ... smaller is better
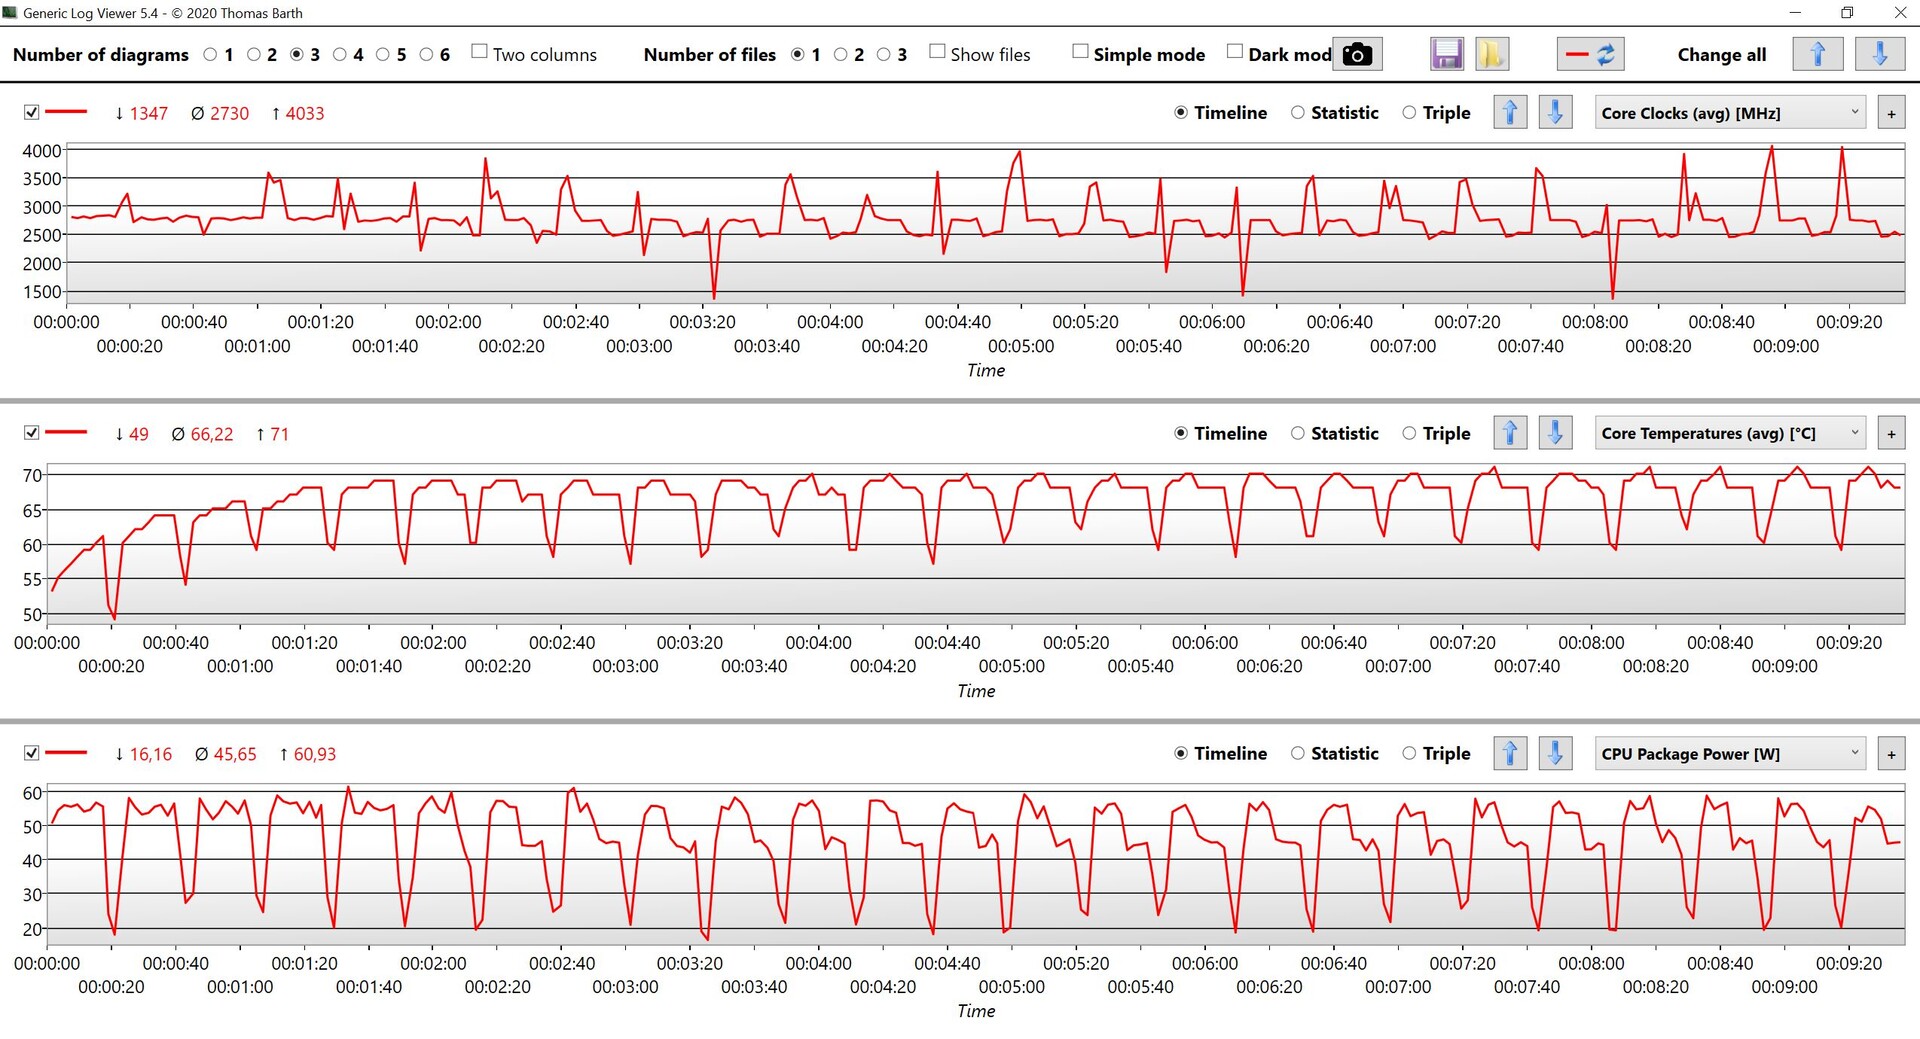
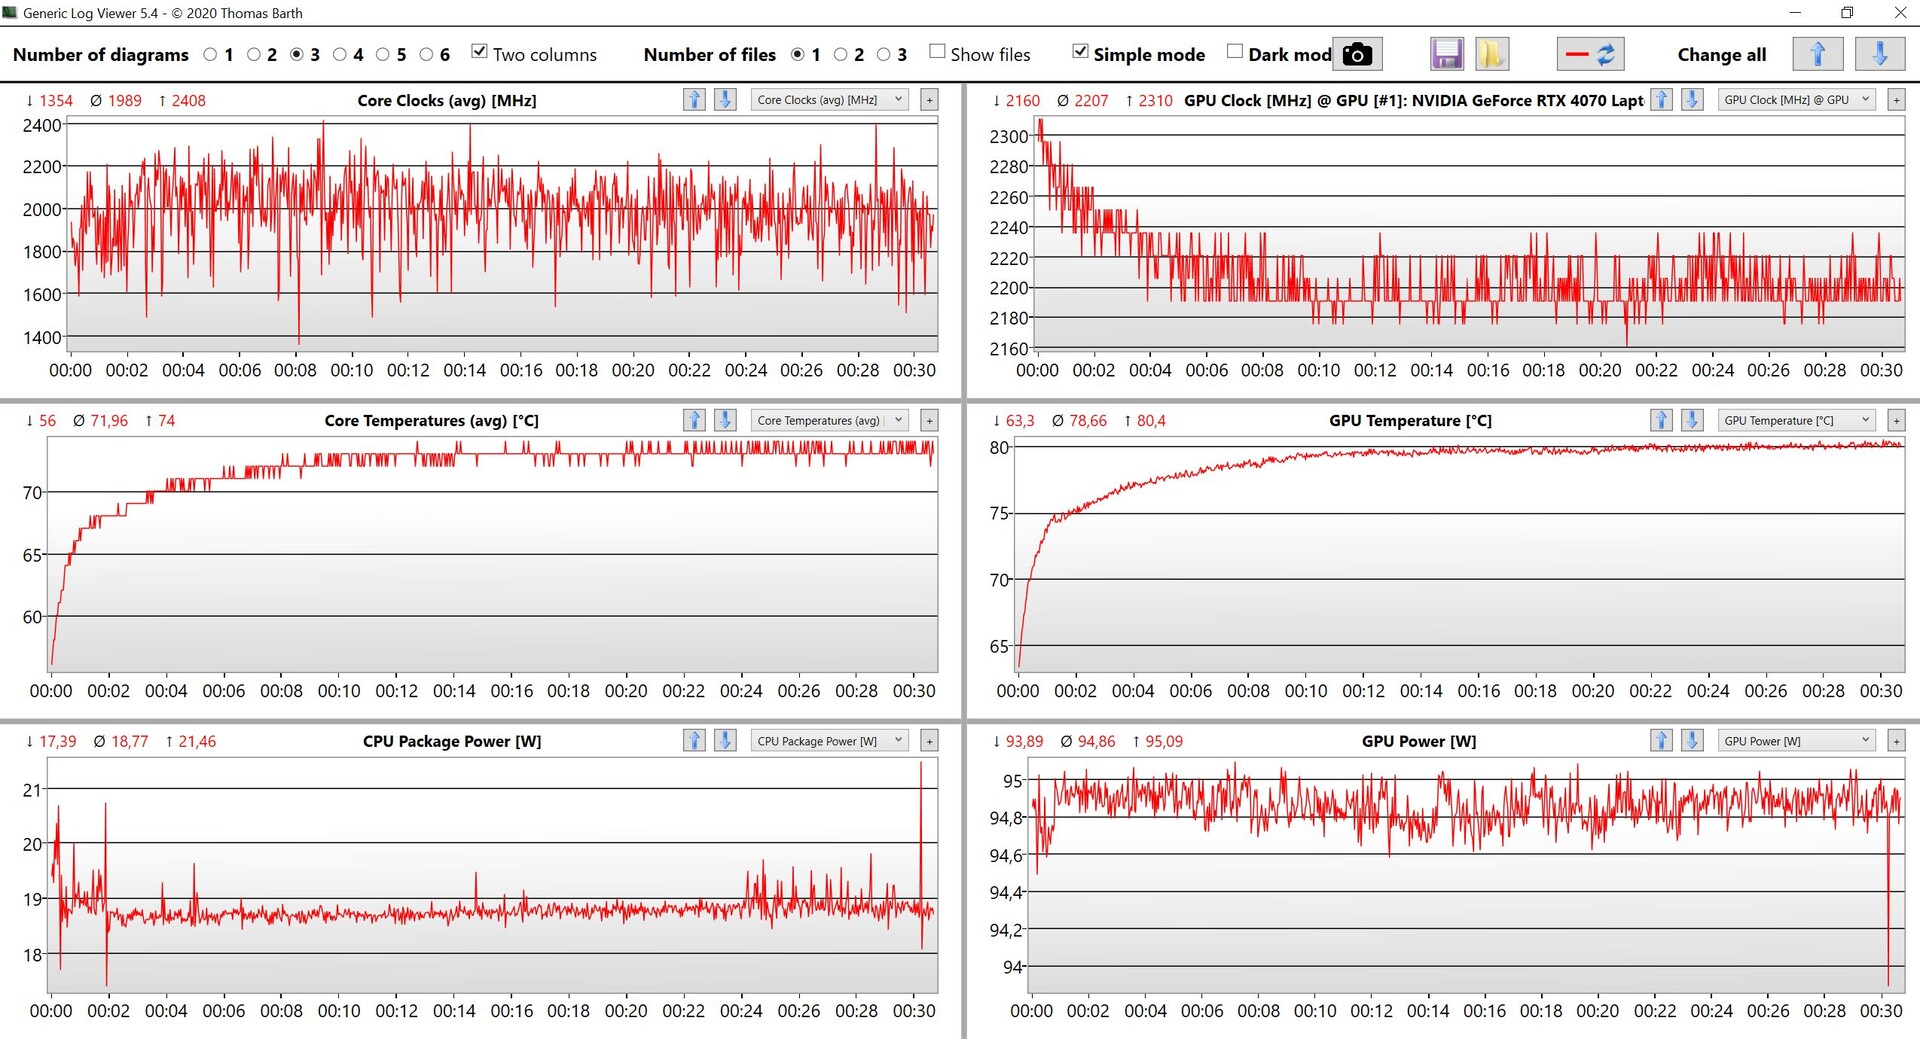
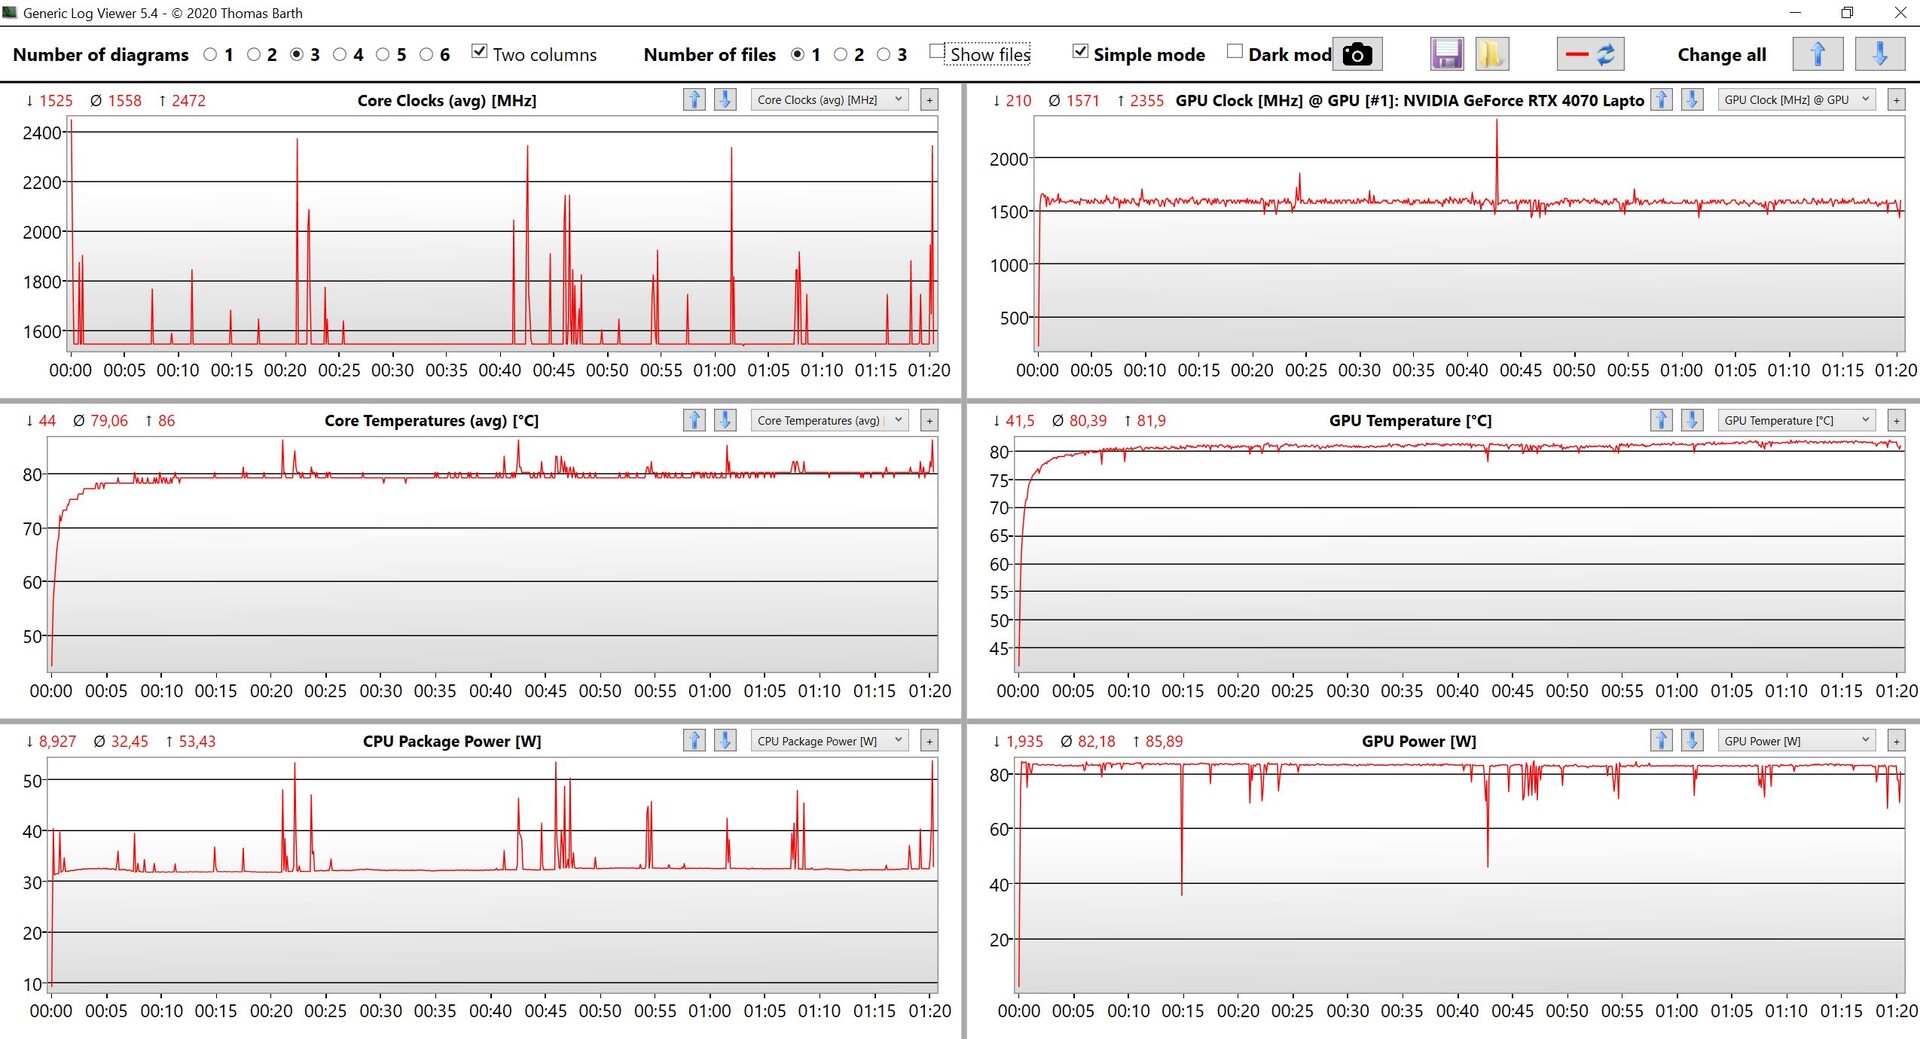
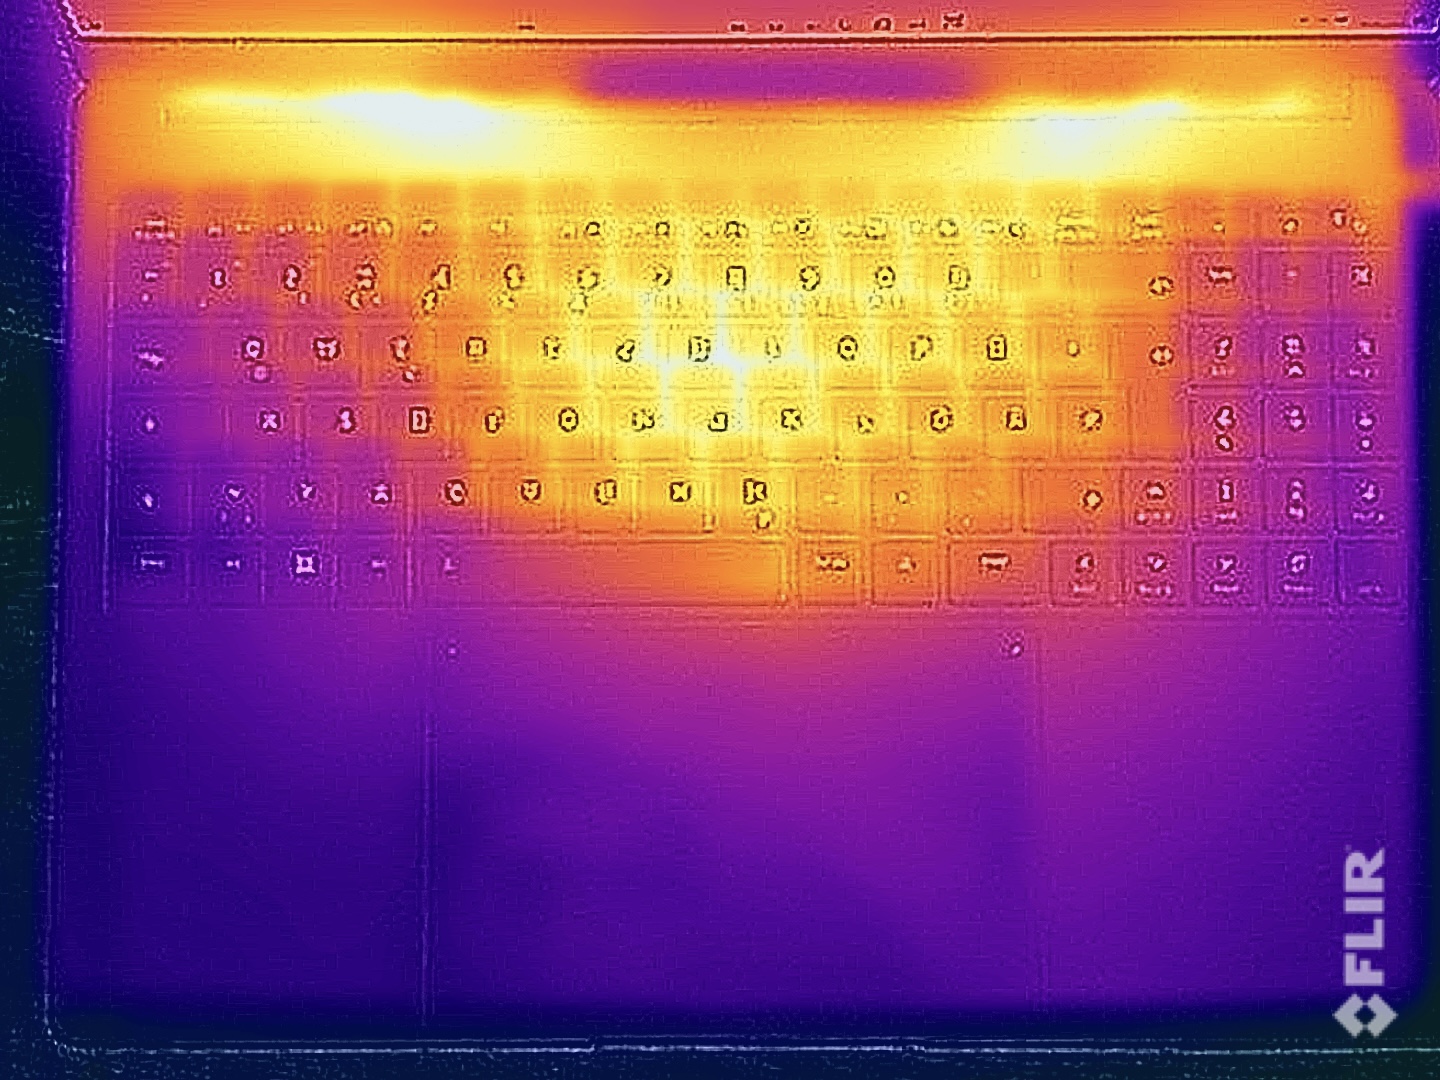
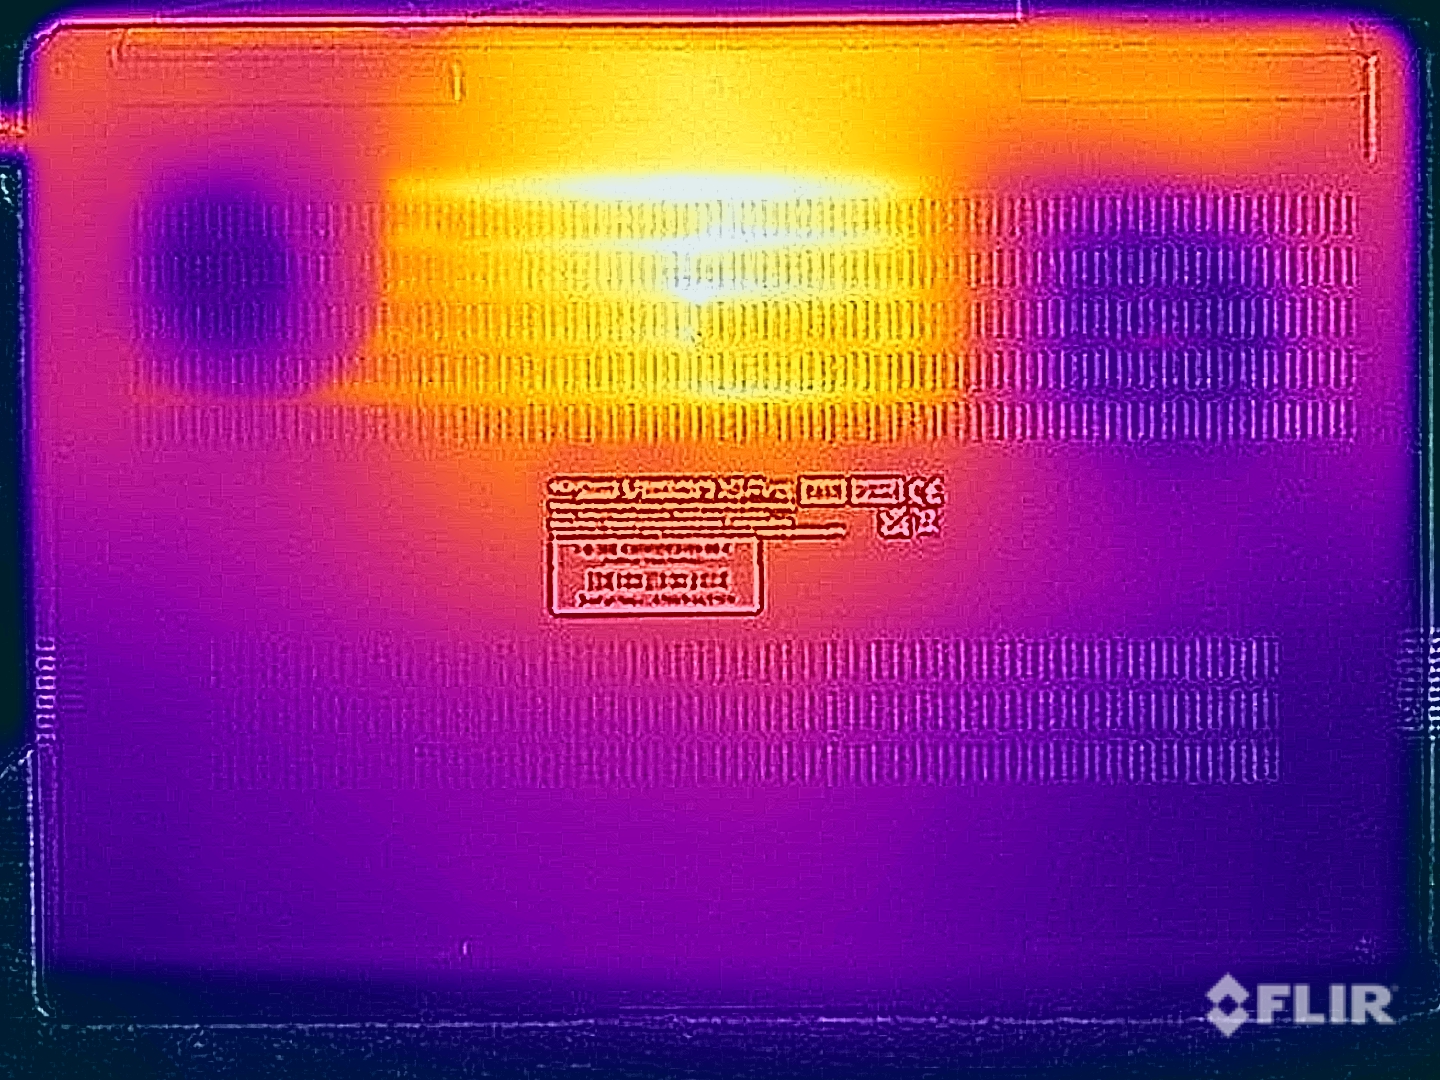
温度
虽然在日常操作中不会出现温度问题,但在玩游戏或组件负载较高时,不应将设备放在膝盖上。在极端情况下,我们测得底部中央区域的温度超过 50 °C(122 °F)。键盘中央区域的温度也超过了 45 °C(113 °F),这在打字时非常明显。不过,典型的 WASD 键仍能保持明显的低温,这在游戏中很有帮助。更为紧凑的充电器温度仅略高于旧型号,最高温度为 44 °C(111 °F)也没有问题。
在压力测试中,显卡优先运行,因为它能以约 82 瓦的功率稳定运行。另一方面,处理器的功耗很快就降到了约 32 瓦。总的来说,对于如此轻薄的设备来说,这个结果还算不错。
(-) The maximum temperature on the upper side is 46.7 °C / 116 F, compared to the average of 36.8 °C / 98 F, ranging from 21 to 71 °C for the class Multimedia.
(-) The bottom heats up to a maximum of 54.1 °C / 129 F, compared to the average of 39.1 °C / 102 F
(+) In idle usage, the average temperature for the upper side is 24.7 °C / 76 F, compared to the device average of 31.3 °C / 88 F.
(±) Playing The Witcher 3, the average temperature for the upper side is 37.7 °C / 100 F, compared to the device average of 31.3 °C / 88 F.
(+) The palmrests and touchpad are cooler than skin temperature with a maximum of 28 °C / 82.4 F and are therefore cool to the touch.
(±) The average temperature of the palmrest area of similar devices was 28.7 °C / 83.7 F (+0.7 °C / 1.3 F).
| Schenker VISION 16 Pro (M23) Intel Core i7-13700H, NVIDIA GeForce RTX 4070 Laptop GPU | Samsung Galaxy Book3 Ultra 16, i9-13900H RTX 4070 Intel Core i9-13900H, NVIDIA GeForce RTX 4070 Laptop GPU | MSI Stealth 16 Studio A13VG Intel Core i7-13700H, NVIDIA GeForce RTX 4070 Laptop GPU | Dell XPS 15 9530 RTX 4070 Intel Core i7-13700H, NVIDIA GeForce RTX 4070 Laptop GPU | Asus ProArt Studiobook 16 OLED H7604 Intel Core i9-13980HX, NVIDIA GeForce RTX 4070 Laptop GPU | Apple MacBook Pro 16 2023 M2 Max Apple M2 Max, Apple M2 Max 38-Core GPU | Schenker Vision 16 Pro RTX 3070 Ti Intel Core i7-12700H, NVIDIA GeForce RTX 3070 Ti Laptop GPU | |
|---|---|---|---|---|---|---|---|
| Heat | -10% | -32% | -8% | -9% | 15% | 1% | |
| Maximum Upper Side * (°C) | 46.7 | 45.9 2% | 60 -28% | 45.6 2% | 44.1 6% | 44.2 5% | 50.8 -9% |
| Maximum Bottom * (°C) | 54.1 | 50.9 6% | 61 -13% | 42 22% | 48 11% | 42.9 21% | 46.3 14% |
| Idle Upper Side * (°C) | 26.5 | 31.6 -19% | 38.2 -44% | 34.4 -30% | 32.7 -23% | 22.4 15% | 27.2 -3% |
| Idle Bottom * (°C) | 26.8 | 34.2 -28% | 37.7 -41% | 33.2 -24% | 34.9 -30% | 22.3 17% | 26.6 1% |
* ... smaller is better
发言人
扬声器系统没有任何变化,尤其是高频非常准确。总体而言,Vision 16 Pro 在这方面的表现也还不错,但仍无法达到 MacBook Pro 16 的出色表现。MacBook Pro 16.
Schenker VISION 16 Pro (M23) audio analysis
(±) | speaker loudness is average but good (77.6 dB)
Bass 100 - 315 Hz
(±) | reduced bass - on average 14.7% lower than median
(-) | bass is not linear (15% delta to prev. frequency)
Mids 400 - 2000 Hz
(+) | balanced mids - only 3.1% away from median
(+) | mids are linear (4.6% delta to prev. frequency)
Highs 2 - 16 kHz
(+) | balanced highs - only 1.3% away from median
(+) | highs are linear (4.1% delta to prev. frequency)
Overall 100 - 16.000 Hz
(+) | overall sound is linear (13.1% difference to median)
Compared to same class
» 26% of all tested devices in this class were better, 5% similar, 69% worse
» The best had a delta of 5%, average was 17%, worst was 45%
Compared to all devices tested
» 13% of all tested devices were better, 3% similar, 84% worse
» The best had a delta of 4%, average was 23%, worst was 134%
Apple MacBook Pro 16 2023 M2 Max audio analysis
(+) | speakers can play relatively loud (86.1 dB)
Bass 100 - 315 Hz
(+) | good bass - only 3.9% away from median
(+) | bass is linear (5.7% delta to prev. frequency)
Mids 400 - 2000 Hz
(+) | balanced mids - only 1.2% away from median
(+) | mids are linear (1.5% delta to prev. frequency)
Highs 2 - 16 kHz
(+) | balanced highs - only 2.5% away from median
(+) | highs are linear (1.7% delta to prev. frequency)
Overall 100 - 16.000 Hz
(+) | overall sound is linear (4.9% difference to median)
Compared to same class
» 0% of all tested devices in this class were better, 0% similar, 99% worse
» The best had a delta of 5%, average was 17%, worst was 45%
Compared to all devices tested
» 0% of all tested devices were better, 0% similar, 100% worse
» The best had a delta of 4%, average was 23%, worst was 134%
电源管理 - 改进电池寿命
耗电量
在我们对耗电量的测量中,新款 2023 型号的整体效率略高,只有 173 瓦的最大耗电量基本相同。但这一数值很快就降到了 150 瓦左右(游戏时也是如此),因此附带的 180 瓦充电器已经足够用了。顺便说一句,现在不仅体积更小巧,重量也更轻(489 克对 811 克,17.2 盎司对 28.6 盎司)。
| Off / Standby | |
| Idle | |
| Load |
|
Key:
min: | |
| Schenker VISION 16 Pro (M23) i7-13700H, GeForce RTX 4070 Laptop GPU, Samsung 990 Pro 1 TB, IPS, 2560x1600, 16" | Samsung Galaxy Book3 Ultra 16, i9-13900H RTX 4070 i9-13900H, GeForce RTX 4070 Laptop GPU, Samsung PM9A1 MZVL21T0HCLR, OLED / AMOLED, 2880x1800, 16" | MSI Stealth 16 Studio A13VG i7-13700H, GeForce RTX 4070 Laptop GPU, Micron 3400 2TB MTFDKBA2T0TFH, IPS, 2560x1600, 16" | Dell XPS 15 9530 RTX 4070 i7-13700H, GeForce RTX 4070 Laptop GPU, SK hynix PC801 HFS001TEJ9X101N, OLED, 3456x2160, 15.6" | Asus ProArt Studiobook 16 OLED H7604 i9-13980HX, GeForce RTX 4070 Laptop GPU, Phison EM2804TBMTCB47, OLED, 3200x2000, 16" | Apple MacBook Pro 16 2023 M2 Max M2 Max, M2 Max 38-Core GPU, Apple SSD AP2048Z, Mini-LED, 3456x2234, 16.2" | Schenker Vision 16 Pro RTX 3070 Ti i7-12700H, GeForce RTX 3070 Ti Laptop GPU, Samsung SSD 980 Pro 1TB MZ-V8P1T0BW, IPS, 2560x1600, 16" | Average NVIDIA GeForce RTX 4070 Laptop GPU | Average of class Multimedia | |
|---|---|---|---|---|---|---|---|---|---|
| Power Consumption | 28% | -28% | -38% | -53% | -3% | -12% | -50% | 20% | |
| Idle Minimum * (Watt) | 8.6 | 4.3 50% | 11 -28% | 20 -133% | 12.8 -49% | 5.2 40% | 9 -5% | 13.2 ? -53% | 5.66 ? 34% |
| Idle Average * (Watt) | 12 | 4.6 62% | 18 -50% | 20.7 -73% | 19.9 -66% | 16.5 -38% | 13.3 -11% | 18.2 ? -52% | 10.2 ? 15% |
| Idle Maximum * (Watt) | 12.4 | 11.4 8% | 19 -53% | 22.4 -81% | 20.3 -64% | 16.8 -35% | 14.3 -15% | 24.6 ? -98% | 12.5 ? -1% |
| Load Average * (Watt) | 80 | 97 -21% | 91 -14% | 77.1 4% | 131.4 -64% | 113 -41% | 107 -34% | 97 ? -21% | 65.2 ? 18% |
| Witcher 3 ultra * (Watt) | 147.7 | 100.9 32% | 130 12% | 95.4 35% | 196.5 -33% | 92 38% | 155.2 -5% | ||
| Load Maximum * (Watt) | 173.1 | 107 38% | 228 -32% | 133.4 23% | 246.8 -43% | 145 16% | 172 1% | 221 ? -28% | 113.5 ? 34% |
* ... smaller is better
Power Consumption The Witcher 3 / Stress Test
Power Consumption With External Monitor
电池寿命
与稍高的能耗值相对应,电池续航时间也稍有改善。在调整亮度为 150 cd/m²(相当于测试设备最大亮度的 39%)的情况下,我们的 WLAN 测试在 60 或 240 Hz 下的运行时间均略高于 7.5 小时,这使得 Vision 16 Pro 2023 的竞争力大大增强。只有 MacBook Pro 16 的表现与之不同,它能持续近 15 个小时。150 cd/m² 下的视频测试也能持续近 8 小时。
在最高显示亮度下,刷新率确实会产生影响,因为在 240 Hz 下进行的 WLAN 测试仅能持续 6 小时,而在 60 Hz 下则能持续 7 小时以上。我们希望,申克公司也能像较小的 Vision 14 一样,推出配备更大电池、取消辅助 M.2 插槽的 Vision 16 Pro 版本。
| Schenker VISION 16 Pro (M23) i7-13700H, GeForce RTX 4070 Laptop GPU, 80 Wh | Samsung Galaxy Book3 Ultra 16, i9-13900H RTX 4070 i9-13900H, GeForce RTX 4070 Laptop GPU, 76 Wh | MSI Stealth 16 Studio A13VG i7-13700H, GeForce RTX 4070 Laptop GPU, 99.9 Wh | Dell XPS 15 9530 RTX 4070 i7-13700H, GeForce RTX 4070 Laptop GPU, 86 Wh | Asus ProArt Studiobook 16 OLED H7604 i9-13980HX, GeForce RTX 4070 Laptop GPU, 90 Wh | Apple MacBook Pro 16 2023 M2 Max M2 Max, M2 Max 38-Core GPU, 99.6 Wh | Schenker Vision 16 Pro RTX 3070 Ti i7-12700H, GeForce RTX 3070 Ti Laptop GPU, 80 Wh | Average of class Multimedia | |
|---|---|---|---|---|---|---|---|---|
| Battery runtime | -4% | 28% | 9% | -22% | 72% | -15% | 68% | |
| H.264 (h) | 7.8 | 9 15% | 7.7 -1% | 6 -23% | 18.7 140% | 6.1 -22% | 17.1 ? 119% | |
| WiFi v1.3 (h) | 7.8 | 8 3% | 7.8 0% | 8 3% | 5.6 -28% | 14.8 90% | 6 -23% | 12.2 ? 56% |
| Load (h) | 1.3 | 0.9 -31% | 2.4 85% | 1.5 15% | 1.1 -15% | 1.1 -15% | 1.3 0% | 1.664 ? 28% |
Pros
Cons
评价:Vision 16 Pro 的轻薄设计依然令人印象深刻
虽然 Vision 16 Pro 的新 2023 型号包括了预期的更新,配备了英特尔 Raptor Lake 处理器和新的 NvidiaGeForce RTX 4070 笔记本电脑,但在电源配置文件中也有一些额外的调整。Vision 16 Pro 是罕见的情况之一,45 瓦的处理器也真正运行在这个值上,而不会出现短期功率限制过高的情况。 这意味着性能保持相当稳定,温度也不会快速蹿升,但同时性能也略有降低,尤其是在短期基准测试中。不过,这在日常运行中并不会产生任何影响。另一方面,我们不明白为什么申克取消了可调节 CPU TDP 值的手动或 Turbo 模式。在以前的型号中,这还可以进一步明显提高 CPU 性能。
在最大 TGP 同为 95 瓦的情况下,新款GeForce RTX 4070 笔记本电脑的性能比旧款 RTX 3070 Ti 提高了约 25-30%,但旧款 RTX 3080 并没有直接的继承者。除此之外,整体性能几乎没有抱怨的理由,快速 PCIe 4.0 SSD 的传输速率也保持不变。不过,我们不明白为什么现在会出现一个明显较慢的读卡器。
申克 Vision 16 Pro 在 2023 版非常轻薄的机身内提供了强大的性能。尽管如此,在连接或维护选项方面却没有丝毫妥协。
主观而言,240 Hz 的哑光 IPS 显示屏提供了良好的图像质量,而且通过申克附带的校准配置文件,还可以纠正色调,但色彩空间覆盖率低和不支持 HDR 仍是其缺点。但至少没有使用 PWM。
显示选项也是竞争对手的最大优势,他们通常提供 OLED 或 MiniLED 面板。这是否一定更好(关键词:PWM)值得商榷,但主观图像印象略好,色彩空间和 HDR 方面也有优势。纯 CPU 性能(多核)也往往优于竞争对手,但特别是在图形性能方面,Vision 16 Pro 并不落后于华硕 ProArt Studiobook 16 或微星 Stealth 16 Studio 等对比设备。尤其是戴尔 XPS 15配备 50 瓦版 RTX 4070 笔记本电脑在这方面明显落后。
价格和供应情况
新款 Vision 16 Pro M23 可在Bestware 上配置,起价为 2,099 欧元(约合 2,361 美元)。(~$2,361).我们的测试配置升级到了 RTX 4070 笔记本电脑以及更多内存和固态硬盘存储,您需要支付约 2,600 欧元(约合 2,924 美元)。
Schenker VISION 16 Pro (M23)
- 07/18/2023 v7 (old)
Andreas Osthoff
Transparency
The selection of devices to be reviewed is made by our editorial team. The test sample was provided to the author as a loan by the manufacturer or retailer for the purpose of this review. The lender had no influence on this review, nor did the manufacturer receive a copy of this review before publication. There was no obligation to publish this review. As an independent media company, Notebookcheck is not subjected to the authority of manufacturers, retailers or publishers.
This is how Notebookcheck is testing
Every year, Notebookcheck independently reviews hundreds of laptops and smartphones using standardized procedures to ensure that all results are comparable. We have continuously developed our test methods for around 20 years and set industry standards in the process. In our test labs, high-quality measuring equipment is utilized by experienced technicians and editors. These tests involve a multi-stage validation process. Our complex rating system is based on hundreds of well-founded measurements and benchmarks, which maintains objectivity. Further information on our test methods can be found here.
Price comparison

