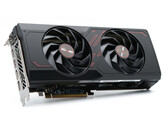
Notebookcheck Logo

AMD Radeon RX 7700 XT

AMD Radeon RX 7700 XT

AMD Radeon RX 7700 XT是一款中端桌面 GPU,主要设计用于 1440p 游戏。这使得 AMD Radeon RX 7700 XT 成为 1440p 游戏领域最小的分支,直接排在 AMD Radeon RX 7800 XT 和 AMD Radeon RX 7900 GRE 之后。该图形芯片采用台积电 5 纳米工艺制造。AMD Radeon RX 7700 XT 也采用了芯片组设计,但只有三个 MCD。AMD Radeon RX 7700 XT 拥有 12 GB 的 VRAM,与 AMD Radeon RX 6700 XT 的前身一样多。

功能特点

RDNA 3 仍是名为 Navi 32 的图形芯片的基础。SAM(智能访问内存)和 Infinity Cache(无限缓存)等已经确立的功能在新的中端型号(又名 Radeon RX 7700 XT)中也同样具备。与 AMD Radeon RX 6700 XT光线追踪部分进行了修改,并在硬件方面实现了人工智能支持。媒体引擎已经更新,视频解码/编码分辨率最高可达 8K。AMD Radeon RX 7700 XT 还提供现代 DisplayPort 2.1 连接。AMD 对 DLSS 的回应是 FSR 2.0,通过升频选项显著提高了游戏性能。在不久的将来,FSR 3 还将提供另一项功能,与 DLSS 3.0 一样,由于帧生成功能,帧速率有望进一步提高。

性能

AMD Radeon RX 7700 XT 在不使用光线追踪技术的游戏中的性能远远领先于 NvidiaGeForce RTX 4060 Ti.在 NvidiaGeForce RTX 4070是 AMD Radeon RX 7700 XT 望尘莫及的。在内部对决中,AMD Radeon RX 7700 XT 的性能可与 AMD Radeon RX 6800 进行比较。 AMD Radeon RX 6800进行比较。

功耗

据制造商估计,AMD Radeon RX 7700 XT 的功耗为 245 瓦(TBP),因此仅比 AMD Radeon RX 6800(250 瓦)略微经济一些。与 NvidiaGeForce RTX 4070AMD Radeon RX 7500 XT 需要多 45 瓦。

Radeon RX 7000 Series

Radeon RX 7900 XTX 6144 @ 2.27 GHz384 Bit @ 20000 MHz
Radeon RX 7900 XT 5376 @ 2 GHz320 Bit @ 20000 MHz
Radeon RX 7900 GRE 5120 @ 2.25 GHz256 Bit @ 18000 MHz
Radeon RX 7800 XT 3840 @ 2.43 GHz256 Bit @ 19500 MHz
Radeon RX 7700 XT 3456 @ 1.7 - 2.54 GHz192 Bit @ 18000 MHz
CodenameNavi 32
ArchitectureRDNA 3
Pipelines3456 - unified
TMUs216
ROPs96
Raytracing Cores54
Tensor / AI Cores108
Core Speed1700 - 2544 (Boost) MHz
Theoretical Performance70.34 TFLOPS FP16, 35.17 TFLOPS FP32, 1.099 TFLOPS FP64
CacheL2: 2 MB, L3: 48 MB
Memory Speed18000 effective = 2430 MHz
Memory Bus Width192 Bit
Memory TypeGDDR6
Max. Amount of Memory12 GB
Shared Memoryno
Memory Bandwidth432 GB/s
APIDirectX 12 Ultimate (12_2), Shader 6.7, OpenGL 4.6, OpenCL 2.2, Vulkan 1.3
Power Consumption245 Watt
Transistor Count28.1 Billion
Die Size 346 mm²
PCIe4.0 x16
Displays4 Displays (max.), HDMI 2.1a, DisplayPort 2.1 UHBR13.5
Date of Announcement25.08.2023
Link to Manufacturer Pagewww.amd.com
SuccessorRadeon RX 6700 XT

Benchmarks

Performance Rating - 3DMark 11 + Fire Strike + Time Spy
19.5 pt (59%)
AMD Radeon HD 8180
0.06605 -100%
...
15.6 -20%
15.6 -20%
AMD Radeon RX 6700 XT
16.2 -17%
NVIDIA Titan RTX
16.3 -16%
AMD Radeon RX 6750 XT
17.1 -12%
NVIDIA GeForce RTX 3070 Ti
17.2 -12%
17.9 -8%
18.2 -7%
18.6 -5%
AMD Radeon RX 7700 XT
19.5
20 3%
20.3 4%
20.7 6%
21.1 8%
21.5 10%
21.5 10%
22.3 14%
22.7 16%
22.9 17%
...
33.3 71%
0%
100%
3DMark - 3DMark Time Spy Score
16454 Points (47%)
3DMark - 3DMark Time Spy Graphics
16777 Points (44%)
3DMark - 3DMark Ice Storm Extreme Graphics
569083 Points (73%)
3DMark - 3DMark Cloud Gate Score
80883 Points (86%)
3DMark - 3DMark Cloud Gate Graphics
201871 Points (53%)
3DMark - 3DMark Fire Strike Standard Score
38758 Points (68%)
3DMark - 3DMark Fire Strike Standard Graphics
42801 Points (48%)
3DMark - 3DMark Ice Storm Graphics
628317 Points (75%)
3DMark - 3DMark Night Raid Graphics Score
176451 Points (68%)
3DMark 11 - 3DM11 Performance GPU
57340 Points (49%)
3DMark Vantage
3DM Vant. Perf. total +
3DMark Vantage - 3DM Vant. Perf. total
126733 Points (37%)
3DM Vant. Perf. GPU no PhysX +
3DMark Vantage - 3DM Vant. Perf. GPU no PhysX
135301 Points (77%)
3DMark 06 3DMark 06 - Standard 1280x1024 +
3DMark 06
65983 Points (86%)
Unigine Valley 1.0 - Unigine Valley 1.0 DX
160.1 fps (52%)
Blender - Blender 3.3 Classroom HIP *
37 Seconds (3%)
SPECviewperf 12
specvp12 sw-03 +
SPECviewperf 12 - specvp12 sw-03
288 fps (71%)
specvp12 snx-02 +
SPECviewperf 12 - specvp12 snx-02
268 fps (40%)
specvp12 showcase-01 +
SPECviewperf 12 - specvp12 showcase-01
179 fps (39%)
specvp12 mediacal-01 +
SPECviewperf 12 - specvp12 mediacal-01
177 fps (45%)
specvp12 maya-04 +
specvp12 energy-01 +
SPECviewperf 12 - specvp12 energy-01
33.4 fps (30%)
specvp12 creo-01 +
SPECviewperf 12 - specvp12 creo-01
123 fps (49%)
specvp12 catia-04 +
SPECviewperf 12 - specvp12 catia-04
351 fps (58%)
specvp12 3dsmax-05 +
SPECviewperf 12 - specvp12 3dsmax-05
373 fps (65%)
SPECviewperf 13 specvp13 sw-04 +
SPECviewperf 13 - specvp13 sw-04
265 fps (71%)
specvp13 snx-03 +
SPECviewperf 13 - specvp13 snx-03
486 fps (54%)
specvp13 showcase-02 +
SPECviewperf 13 - specvp13 showcase-02
179 fps (39%)
specvp13 medical-02 +
SPECviewperf 13 - specvp13 medical-02
300 fps (63%)
specvp13 maya-05 +
SPECviewperf 13 - specvp13 maya-05
487 fps (55%)
specvp13 energy-02 +
SPECviewperf 13 - specvp13 energy-02
115 fps (37%)
specvp13 creo-02 +
specvp13 catia-05 +
SPECviewperf 13 - specvp13 catia-05
529 fps (59%)
specvp13 3dsmax-06 +
SPECviewperf 13 - specvp13 3dsmax-06
371 fps (65%)
SPECviewperf 2020 specvp2020 snx-04 4k +
SPECviewperf 2020 - specvp2020 snx-04 4k
312 fps (32%)
specvp2020 medical-03 4k +
SPECviewperf 2020 - specvp2020 medical-03 4k
56.2 fps (54%)
specvp2020 maya-06 4k +
SPECviewperf 2020 - specvp2020 maya-06 4k
261 fps (43%)
specvp2020 energy-03 4k +
specvp2020 creo-03 4k +
SPECviewperf 2020 - specvp2020 creo-03 4k
130 fps (62%)
specvp2020 catia-06 4k +
SPECviewperf 2020 - specvp2020 catia-06 4k
88.8 fps (58%)
specvp2020 3dsmax-07 4k +
SPECviewperf 2020 - specvp2020 3dsmax-07 4k
106 fps (44%)
Basemark GPU 1.2 - Basemark GPU 1.2 Vulkan Official Medium Offscreen 1080
104.6 fps (1%)
Basemark GPU 1.2 - Basemark GPU 1.2 Vulkan Official High Offscreen 2160
3.6 fps (1%)
Geekbench 6.2 - Geekbench 6.2 GPU OpenCL
126529 points (37%)
Geekbench 6.2 - Geekbench 6.2 GPU Vulkan
131411 points (43%)
LuxMark v2.0 64Bit - LuxMark v2.0 Room GPU
3258 Samples/s (15%)
LuxMark v2.0 64Bit - LuxMark v2.0 Sala GPU
8614 Samples/s (15%)
ComputeMark v2.1 - ComputeMark v2.1 Result
38363 points (41%)
Power Consumption - Furmark Stress Test Power Consumption - external Monitor *
365 Watt (52%)
020406080100120140160180200220240260280300320340360Tooltip
Power Consumption - The Witcher 3 Power Consumption - external Monitor *
384 Watt (54%)
020406080100120140160180200220240260280300320340360380Tooltip
Power Consumption - Witcher 3 ultra Power Efficiency - external Monitor
0.4 fps per Watt (36%)
Emissions Witcher 3 Fan Noise +
Emissions - Witcher 3 Fan Noise
42.1 dB(A) (67%)
- Range of benchmark values for this graphics card
- Average benchmark values for this graphics card
* Smaller numbers mean a higher performance

Game Benchmarks

The following benchmarks stem from our benchmarks of review laptops. The performance depends on the used graphics memory, clock rate, processor, system settings, drivers, and operating systems. So the results don't have to be representative for all laptops with this GPU. For detailed information on the benchmark results, click on the fps number.

Ready or Not

Ready or Not

2023
low 1920x1080
281  fps    + Compare + 📈 Graph
med. 1920x1080
277  fps    + Compare + 📈 Graph
high 1920x1080
269  fps    + Compare + 📈 Graph
ultra 1920x1080
183.6  fps    + Compare + 📈 Graph
QHD 2560x1440
109.9  fps    + Compare + 📈 Graph
4K 3840x2160
48.4  fps    + Compare + 📈 Graph
» With all tested laptops playable in detail settings ultra.
The Finals

The Finals

2023
low 1920x1080
347  fps    + Compare + 📈 Graph
med. 1920x1080
286  fps    + Compare + 📈 Graph
high 1920x1080
253  fps    + Compare + 📈 Graph
ultra 1920x1080
189.3  fps    + Compare + 📈 Graph
QHD 2560x1440
118.9  fps    + Compare + 📈 Graph
4K 3840x2160
54.7  fps    + Compare + 📈 Graph
» With all tested laptops playable in detail settings ultra.
Additional Benchmarks
Low Preset 1280x720
361
Avatar Frontiers of Pandora

Avatar Frontiers of Pandora

2023
low 1920x1080
114  fps    + Compare
med. 1920x1080
103  fps    + Compare
high 1920x1080
87  fps    + Compare
ultra 1920x1080
68  fps    + Compare
QHD 2560x1440
46  fps    + Compare
4K 3840x2160
23  fps    + Compare
» With all tested laptops playable in detail settings ultra.
Additional Benchmarks
Low Preset TAA 1280x720
165
Call of Duty Modern Warfare 3 2023

Call of Duty Modern Warfare 3 2023

2023
low 1920x1080
234  fps    + Compare
med. 1920x1080
212  fps    + Compare
high 1920x1080
171  fps    + Compare
ultra 1920x1080
158  fps    + Compare
QHD 2560x1440
109  fps    + Compare
4K 3840x2160
64  fps    + Compare
» With all tested laptops playable in detail settings ultra.
Additional Benchmarks
Minimum Preset 1280x720
321
EA Sports WRC

EA Sports WRC

2023
low 1920x1080
240  fps    + Compare + 📈 Graph
med. 1920x1080
155.8  fps    + Compare + 📈 Graph
high 1920x1080
140.4  fps    + Compare + 📈 Graph
ultra 1920x1080
125.5  fps    + Compare + 📈 Graph
QHD 2560x1440
92.8  fps    + Compare + 📈 Graph
4K 3840x2160
51.8  fps    + Compare + 📈 Graph
» With all tested laptops playable in detail settings ultra.
Additional Benchmarks
Ultra Low Preset LowAA 1280x720
329
Alan Wake 2

Alan Wake 2

2023
low 1920x1080
119.7  fps    + Compare + 📈 Graph
med. 1920x1080
108  fps    + Compare + 📈 Graph
high 1920x1080
93.2  fps    + Compare + 📈 Graph
QHD 2560x1440
62.7  fps    + Compare + 📈 Graph
4K 3840x2160
30.8  fps    + Compare + 📈 Graph
» With all tested laptops playable in detail settings high.
Additional Benchmarks
Low Preset 1280x720
160.9
High Preset + High Ray Tracing 1920x1080
26.7
Lords of the Fallen

Lords of the Fallen

2023
low 1920x1080
135  fps    + Compare + 📈 Graph
med. 1920x1080
113.8  fps    + Compare + 📈 Graph
high 1920x1080
79.4  fps    + Compare + 📈 Graph
ultra 1920x1080
56  fps    + Compare + 📈 Graph
QHD 2560x1440
37.1  fps    + Compare + 📈 Graph
4K 3840x2160
19.2  fps    + Compare + 📈 Graph
» With all tested laptops playable in detail settings ultra.
Additional Benchmarks
Low Preset 1280x720
180.5
Total War Pharaoh

Total War Pharaoh

2023
low 1920x1080
519.1  fps    + Compare
med. 1920x1080
333.2  fps    + Compare
high 1920x1080
209.7  fps    + Compare
ultra 1920x1080
169.6  fps    + Compare
QHD 2560x1440
122.8  fps    + Compare
4K 3840x2160
60.5  fps    + Compare
» With all tested laptops playable in detail settings ultra.
Additional Benchmarks
Low Preset 1280x720
607.9
Assassin's Creed Mirage

Assassin's Creed Mirage

2023
low 1920x1080
186  fps    + Compare
med. 1920x1080
168  fps    + Compare
high 1920x1080
154  fps    + Compare
ultra 1920x1080
120  fps    + Compare
QHD 2560x1440
91  fps    + Compare
4K 3840x2160
54  fps    + Compare
» With all tested laptops playable in detail settings ultra.
Additional Benchmarks
Low Preset (Adaptive Quality Off) 1280x720
241
EA Sports FC 24

EA Sports FC 24

2023
low 1920x1080
395  fps    + Compare + 📈 Graph
med. 1920x1080
345  fps    + Compare + 📈 Graph
high 1920x1080
274  fps    + Compare + 📈 Graph
ultra 1920x1080
246  fps    + Compare + 📈 Graph
QHD 2560x1440
199.1  fps    + Compare + 📈 Graph
4K 3840x2160
127.2  fps    + Compare + 📈 Graph
» With all tested laptops playable in detail settings ultra.
Additional Benchmarks
Low Preset 1280x720
420
Counter-Strike 2

Counter-Strike 2

2023
low 1920x1080
351  fps    + Compare + 📈 Graph
med. 1920x1080
344  fps    + Compare + 📈 Graph
high 1920x1080
283  fps    + Compare + 📈 Graph
ultra 1920x1080
202  fps    + Compare + 📈 Graph
QHD 2560x1440
127.2  fps    + Compare + 📈 Graph
4K 3840x2160
62  fps    + Compare + 📈 Graph
» With all tested laptops playable in detail settings ultra.
Additional Benchmarks
Low Preset 1280x720
344
Cyberpunk 2077 2.0 Phantom Liberty

Cyberpunk 2077 2.0 Phantom Liberty

2023
low 1920x1080
175.9  fps    + Compare
med. 1920x1080
145.1  fps    + Compare
high 1920x1080
120.8  fps    + Compare
ultra 1920x1080
110.2  fps    + Compare
QHD 2560x1440
73.1  fps    + Compare
4K 3840x2160
31.6  fps    + Compare
» With all tested laptops playable in detail settings ultra.
Additional Benchmarks
Low Preset (FSR off) 1280x720
211
Ray Tracing Ultra Preset (DLSS off) 1920x1080
37
Steam Deck 1280x720
224
Ultra Preset (FSR on) 1920x1080
129.2
Lies of P

Lies of P

2023
low 1920x1080
268  fps    + Compare + 📈 Graph
med. 1920x1080
232  fps    + Compare + 📈 Graph
high 1920x1080
196.8  fps    + Compare + 📈 Graph
ultra 1920x1080
173.6  fps    + Compare + 📈 Graph
QHD 2560x1440
122.7  fps    + Compare + 📈 Graph
4K 3840x2160
63.9  fps    + Compare + 📈 Graph
» With all tested laptops playable in detail settings ultra.
Additional Benchmarks
Low Preset 1280x720
355
Starfield

Starfield

2023
low 1920x1080
100.5  fps    + Compare + 📈 Graph
med. 1920x1080
90.4  fps    + Compare + 📈 Graph
high 1920x1080
73.6  fps    + Compare + 📈 Graph
ultra 1920x1080
68  fps    + Compare + 📈 Graph
QHD 2560x1440
55.1  fps    + Compare + 📈 Graph
4K 3840x2160
36  fps    + Compare + 📈 Graph
» With all tested laptops playable in detail settings ultra.
Additional Benchmarks
Low Preset 1280x720
120.5
low 1920x1080
119.5  fps    + Compare + 📈 Graph
med. 1920x1080
118.9  fps    + Compare + 📈 Graph
high 1920x1080
116.8  fps    + Compare + 📈 Graph
ultra 1920x1080
106.4  fps    + Compare + 📈 Graph
QHD 2560x1440
84.3  fps    + Compare + 📈 Graph
4K 3840x2160
51.5  fps    + Compare + 📈 Graph
» With all tested laptops playable in detail settings ultra.
Additional Benchmarks
Low Preset 1280x720
119.8
low 1920x1080
120.2  fps    + Compare + 📈 Graph
high 1920x1080
102.6  fps    + Compare + 📈 Graph
ultra 1920x1080
82.2  fps    + Compare + 📈 Graph
QHD 2560x1440
56.1  fps    + Compare + 📈 Graph
4K 3840x2160
29.9  fps    + Compare + 📈 Graph
» With all tested laptops playable in detail settings ultra.
Additional Benchmarks
Low 1280x720
170.2
low 1920x1080
191.6  fps    + Compare + 📈 Graph
med. 1920x1080
186.6  fps    + Compare + 📈 Graph
high 1920x1080
179  fps    + Compare + 📈 Graph
ultra 1920x1080
165.6  fps    + Compare + 📈 Graph
QHD 2560x1440
117.6  fps    + Compare + 📈 Graph
4K 3840x2160
63.3  fps    + Compare + 📈 Graph
» With all tested laptops playable in detail settings ultra.
low 1920x1080
203  fps    + Compare + 📈 Graph
med. 1920x1080
166.3  fps    + Compare + 📈 Graph
high 1920x1080
136.2  fps    + Compare + 📈 Graph
ultra 1920x1080
133  fps    + Compare + 📈 Graph
QHD 2560x1440
95.7  fps    + Compare + 📈 Graph
4K 3840x2160
50.2  fps    + Compare + 📈 Graph
» With all tested laptops playable in detail settings ultra.
Additional Benchmarks
Low Preset 1280x720
267
low 1920x1080
151.3  fps    + Compare + 📈 Graph
med. 1920x1080
121.9  fps    + Compare + 📈 Graph
high 1920x1080
102.1  fps    + Compare + 📈 Graph
ultra 1920x1080
90  fps    + Compare + 📈 Graph
QHD 2560x1440
72  fps    + Compare + 📈 Graph
4K 3840x2160
42.5  fps    + Compare + 📈 Graph
» With all tested laptops playable in detail settings ultra.
Additional Benchmarks
Very Low Preset 1280x720
176.4
Very High Preset + Very High Raytracing TAA 1920x1080
47.8
F1 23

F1 23

2023
low 1920x1080
464  fps    + Compare
med. 1920x1080
418  fps    + Compare
high 1920x1080
310  fps    + Compare
ultra 1920x1080
76.5  fps    + Compare
QHD 2560x1440
48.7  fps    + Compare
4K 3840x2160
23.5  fps    + Compare
» With all tested laptops playable in detail settings ultra.
Additional Benchmarks
Ultra Low Preset TAA 1280x720
453
Diablo 4

Diablo 4

2023
low 1920x1080
363  fps    + Compare + 📈 Graph
med. 1920x1080
316  fps    + Compare + 📈 Graph
high 1920x1080
286  fps    + Compare + 📈 Graph
ultra 1920x1080
243  fps    + Compare + 📈 Graph
QHD 2560x1440
158  fps    + Compare + 📈 Graph
4K 3840x2160
71  fps    + Compare + 📈 Graph
» With all tested laptops playable in detail settings ultra.
Additional Benchmarks
Low Preset 1280x720
392
low 1920x1080
129.9  fps    + Compare + 📈 Graph
med. 1920x1080
115.6  fps    + Compare + 📈 Graph
high 1920x1080
107.5  fps    + Compare + 📈 Graph
ultra 1920x1080
101  fps    + Compare + 📈 Graph
QHD 2560x1440
62.3  fps    + Compare + 📈 Graph
4K 3840x2160
30.3  fps    + Compare + 📈 Graph
» With all tested laptops playable in detail settings ultra.
Additional Benchmarks
Low Preset 1280x720
164.2
Epic Preset + Ray Tracing 1920x1080
71
Dead Island 2

Dead Island 2

2023
low 1920x1080
353  fps    + Compare + 📈 Graph
med. 1920x1080
318  fps    + Compare + 📈 Graph
high 1920x1080
238  fps    + Compare + 📈 Graph
ultra 1920x1080
166.2  fps    + Compare + 📈 Graph
QHD 2560x1440
119.9  fps    + Compare + 📈 Graph
4K 3840x2160
62.7  fps    + Compare + 📈 Graph
» With all tested laptops playable in detail settings ultra.
Additional Benchmarks
Low Preset Low TAA 1280x720
357
The Last of Us

The Last of Us

2023
low 1920x1080
154.6  fps    + Compare + 📈 Graph
med. 1920x1080
132.5  fps    + Compare + 📈 Graph
high 1920x1080
122  fps    + Compare + 📈 Graph
ultra 1920x1080
105  fps    + Compare + 📈 Graph
QHD 2560x1440
68  fps    + Compare + 📈 Graph
4K 3840x2160
29.6  fps    + Compare + 📈 Graph
» With all tested laptops playable in detail settings ultra.
Additional Benchmarks
Low Preset 1280x720
169
low 1920x1080
229  fps    + Compare + 📈 Graph
med. 1920x1080
180.4  fps    + Compare + 📈 Graph
high 1920x1080
156.1  fps    + Compare + 📈 Graph
ultra 1920x1080
107.1  fps    + Compare + 📈 Graph
QHD 2560x1440
84.2  fps    + Compare + 📈 Graph
4K 3840x2160
49.2  fps    + Compare + 📈 Graph
» With all tested laptops playable in detail settings ultra.
Additional Benchmarks
Prioritize Performance Preset 1280x720
237
low 1920x1080
300.6  fps    + Compare
med. 1920x1080
254  fps    + Compare
high 1920x1080
195.7  fps    + Compare
ultra 1920x1080
194.3  fps    + Compare
QHD 2560x1440
143.4  fps    + Compare
4K 3840x2160
81.3  fps    + Compare
» With all tested laptops playable in detail settings ultra.
Additional Benchmarks
Minimum Settings 1280x720
401.8
low 1920x1080
118.7  fps    + Compare + 📈 Graph
med. 1920x1080
115.6  fps    + Compare + 📈 Graph
high 1920x1080
112.4  fps    + Compare + 📈 Graph
ultra 1920x1080
112.2  fps    + Compare + 📈 Graph
QHD 2560x1440
99.1  fps    + Compare + 📈 Graph
4K 3840x2160
59  fps    + Compare + 📈 Graph
» With all tested laptops playable in detail settings ultra.
Additional Benchmarks
Ultra Low Preset 1280x720
140.4
low 1920x1080
265  fps    + Compare + 📈 Graph
med. 1920x1080
199.4  fps    + Compare + 📈 Graph
high 1920x1080
118.8  fps    + Compare + 📈 Graph
ultra 1920x1080
93.6  fps    + Compare + 📈 Graph
QHD 2560x1440
73.9  fps    + Compare + 📈 Graph
4K 3840x2160
43.8  fps    + Compare + 📈 Graph
» With all tested laptops playable in detail settings ultra.
Additional Benchmarks
Low Preset 1280x720
354
Returnal

Returnal

2023
low 1920x1080
163  fps    + Compare
med. 1920x1080
153  fps    + Compare
high 1920x1080
137  fps    + Compare
ultra 1920x1080
115  fps    + Compare
QHD 2560x1440
87  fps    + Compare
4K 3840x2160
50  fps    + Compare
» With all tested laptops playable in detail settings ultra.
Additional Benchmarks
Low Preset 1280x720
202
Epic Preset + Epic Ray-Tracing 1920x1080
78
Epic Preset + Epic Ray-Tracing 3840x2160
31
low 1920x1080
195.6  fps    + Compare + 📈 Graph
med. 1920x1080
161.1  fps    + Compare + 📈 Graph
high 1920x1080
119.3  fps    + Compare + 📈 Graph
ultra 1920x1080
91.4  fps    + Compare + 📈 Graph
QHD 2560x1440
66.9  fps    + Compare + 📈 Graph
4K 3840x2160
35.5  fps    + Compare + 📈 Graph
» With all tested laptops playable in detail settings ultra.
Additional Benchmarks
Low Preset Low TAA 1280x720
208
Ultra Preset + Full Ray Tracing High TAA 1920x1080
48.6
Ultra Preset + Full Ray Tracing High TAA 3840x2160
18.1
low 1920x1080
133.4  fps    + Compare + 📈 Graph
med. 1920x1080
129.4  fps    + Compare + 📈 Graph
high 1920x1080
110.9  fps    + Compare + 📈 Graph
ultra 1920x1080
111.8  fps    + Compare + 📈 Graph
QHD 2560x1440
75  fps    + Compare + 📈 Graph
4K 3840x2160
36.2  fps    + Compare + 📈 Graph
» With all tested laptops playable in detail settings ultra.
Additional Benchmarks
Low Preset TAA 1280x720
205
low 1920x1080
307  fps    + Compare + 📈 Graph
med. 1920x1080
264  fps    + Compare + 📈 Graph
high 1920x1080
233  fps    + Compare + 📈 Graph
ultra 1920x1080
198  fps    + Compare + 📈 Graph
QHD 2560x1440
122.6  fps    + Compare + 📈 Graph
4K 3840x2160
59.3  fps    + Compare + 📈 Graph
» With all tested laptops playable in detail settings ultra.
Additional Benchmarks
Low Preset / Off 1280x720
317
RT Ultra Preset / On FXAA 1920x1080
40.1
low 1920x1080
350  fps    + Compare + 📈 Graph
med. 1920x1080
263  fps    + Compare + 📈 Graph
high 1920x1080
194.1  fps    + Compare + 📈 Graph
ultra 1920x1080
150.3  fps    + Compare + 📈 Graph
QHD 2560x1440
89.6  fps    + Compare + 📈 Graph
4K 3840x2160
38  fps    + Compare + 📈 Graph
» With all tested laptops playable in detail settings ultra.
Additional Benchmarks
Low Preset 1280x720
358
low 1920x1080
239.8  fps    + Compare
med. 1920x1080
194.1  fps    + Compare
high 1920x1080
177.1  fps    + Compare
ultra 1920x1080
115.3  fps    + Compare
QHD 2560x1440
90.1  fps    + Compare
4K 3840x2160
57.8  fps    + Compare
» With all tested laptops playable in detail settings ultra.
Additional Benchmarks
Low Preset (without FSR Upscaling) 1280x720
254.3
Ultra Preset (without FSR Upscaling) + Full Ray-Tracing 1920x1080
92.4
low 1920x1080
205  fps    + Compare + 📈 Graph
med. 1920x1080
183.3  fps    + Compare + 📈 Graph
high 1920x1080
144.3  fps    + Compare + 📈 Graph
ultra 1920x1080
144.1  fps    + Compare + 📈 Graph
QHD 2560x1440
111.7  fps    + Compare + 📈 Graph
4K 3840x2160
64.2  fps    + Compare + 📈 Graph
» With all tested laptops playable in detail settings ultra.
Additional Benchmarks
Low Preset 1280x720
237
low 1920x1080
154.5  fps    + Compare + 📈 Graph
med. 1920x1080
144.8  fps    + Compare + 📈 Graph
high 1920x1080
130.2  fps    + Compare + 📈 Graph
ultra 1920x1080
121.1  fps    + Compare + 📈 Graph
QHD 2560x1440
100.6  fps    + Compare + 📈 Graph
4K 3840x2160
58.1  fps    + Compare + 📈 Graph
» With all tested laptops playable in detail settings ultra.
Additional Benchmarks
Very Low Preset 1280x720
185
Very High Preset + Ray-Tracing TAA 1920x0180
66.9
low 1920x1080
102.2  fps    + Compare + 📈 Graph
med. 1920x1080
98.8  fps    + Compare + 📈 Graph
high 1920x1080
92.6  fps    + Compare + 📈 Graph
ultra 1920x1080
87  fps    + Compare + 📈 Graph
QHD 2560x1440
70.1  fps    + Compare + 📈 Graph
4K 3840x2160
42.1  fps    + Compare + 📈 Graph
» With all tested laptops playable in detail settings ultra.
Additional Benchmarks
Low Preset 1280x720
122.9
low 1920x1080
160.3  fps    + Compare + 📈 Graph
med. 1920x1080
121.9  fps    + Compare + 📈 Graph
high 1920x1080
92.8  fps    + Compare + 📈 Graph
ultra 1920x1080
70.1  fps    + Compare + 📈 Graph
QHD 2560x1440
52.6  fps    + Compare + 📈 Graph
4K 3840x2160
30.3  fps    + Compare + 📈 Graph
» With all tested laptops playable in detail settings ultra.
Additional Benchmarks
Low Preset 1280x720
191.5
low 1920x1080
234  fps    + Compare + 📈 Graph
med. 1920x1080
172.9  fps    + Compare + 📈 Graph
high 1920x1080
136.9  fps    + Compare + 📈 Graph
ultra 1920x1080
106.3  fps    + Compare + 📈 Graph
QHD 2560x1440
73.6  fps    + Compare + 📈 Graph
4K 3840x2160
37.8  fps    + Compare + 📈 Graph
» With all tested laptops playable in detail settings ultra.
Additional Benchmarks
Low Preset 1280x720
295
F1 22

F1 22

2022
low 1920x1080
426  fps    + Compare
med. 1920x1080
400  fps    + Compare
high 1920x1080
315  fps    + Compare
ultra 1920x1080
92.3  fps    + Compare
QHD 2560x1440
59.9  fps    + Compare
4K 3840x2160
29.8  fps    + Compare
» With all tested laptops playable in detail settings ultra.
Additional Benchmarks
Ultra Low Preset 16xAF TAA 1280x720
594
low 1920x1080
244  fps    + Compare + 📈 Graph
med. 1920x1080
235  fps    + Compare + 📈 Graph
high 1920x1080
233  fps    + Compare + 📈 Graph
ultra 1920x1080
225  fps    + Compare + 📈 Graph
QHD 2560x1440
139.9  fps    + Compare + 📈 Graph
4K 3840x2160
65.7  fps    + Compare + 📈 Graph
» With all tested laptops playable in detail settings ultra.
Additional Benchmarks
Lowest Settings 1280x720
296
Highest Settings + Maximum Ray Tracing 1920x1080
82.5
low 1920x1080
366  fps    + Compare
med. 1920x1080
281  fps    + Compare
high 1920x1080
170.6  fps    + Compare
ultra 1920x1080
133.2  fps    + Compare
QHD 2560x1440
89.2  fps    + Compare
4K 3840x2160
46  fps    + Compare
» With all tested laptops playable in detail settings ultra.
Additional Benchmarks
Lowest Preset (DX12) 1280x720
473
low 1920x1080
193  fps    + Compare
med. 1920x1080
158.2  fps    + Compare
high 1920x1080
132  fps    + Compare
ultra 1920x1080
122.1  fps    + Compare
QHD 2560x1440
80.2  fps    + Compare
4K 3840x2160
36  fps    + Compare
» With all tested laptops playable in detail settings ultra.
Additional Benchmarks
Low Preset 1280x720
243
Ray Tracing Ultra Preset (DLSS off) 1920x1080
39.8
39.8
39.8
Ray Tracing Ultra Preset (DLSS off) 3840x2160
11.5
11.5
low 1920x1080
263  fps    + Compare
med. 1920x1080
226  fps    + Compare
high 1920x1080
194.9  fps    + Compare
ultra 1920x1080
173.1  fps    + Compare
QHD 2560x1440
153.8  fps    + Compare
4K 3840x2160
104.2  fps    + Compare
» With all tested laptops playable in detail settings ultra.
Additional Benchmarks
Low Preset 1280x720
269
low 1920x1080
191.9  fps    + Compare + 📈 Graph
med. 1920x1080
188.1  fps    + Compare + 📈 Graph
high 1920x1080
148.7  fps    + Compare + 📈 Graph
ultra 1920x1080
102  fps    + Compare + 📈 Graph
QHD 2560x1440
85.3  fps    + Compare + 📈 Graph
4K 3840x2160
54.2  fps    + Compare + 📈 Graph
» With all tested laptops playable in detail settings ultra.
Additional Benchmarks
Low Preset 1280x720
209
low 1280x720
180  fps    + Compare
med. 1920x1080
177  fps    + Compare
high 1920x1080
175  fps    + Compare
ultra 1920x1080
164  fps    + Compare
QHD 2560x1440
125  fps    + Compare
4K 3840x2160
72  fps    + Compare
» With all tested laptops playable in detail settings ultra.
Additional Benchmarks
Low Preset 1920x1080
211
Ultra Preset + Ultra Ray-Tracing 1920x1080
77
Far Cry 6

Far Cry 6

2021
low 1280x720
227  fps    + Compare + 📈 Graph
med. 1920x1080
196.9  fps    + Compare + 📈 Graph
high 1920x1080
178.5  fps    + Compare + 📈 Graph
ultra 1920x1080
161.8  fps    + Compare + 📈 Graph
QHD 2560x1440
121.9  fps    + Compare + 📈 Graph
4K 3840x2160
63.1  fps    + Compare + 📈 Graph
» With all tested laptops playable in detail settings ultra.
Additional Benchmarks
Low Graphics Quality 1920x1080
219
Ultra Graphics Quality + HD Textures + DXR TAA 1920x1080
104.1
F1 2021

F1 2021

2021
low 1280x720
645  fps    + Compare
med. 1920x1080
537  fps    + Compare
high 1920x1080
397  fps    + Compare
ultra 1920x1080
172.6  fps    + Compare
QHD 2560x1440
129.5  fps    + Compare
4K 3840x2160
72.6  fps    + Compare
» With all tested laptops playable in detail settings ultra.
low 1280x720
250  fps    + Compare
med. 1920x1080
180  fps    + Compare
high 1920x1080
149  fps    + Compare
ultra 1920x1080
132  fps    + Compare
QHD 2560x1440
101  fps    + Compare
4K 3840x2160
59  fps    + Compare
» With all tested laptops playable in detail settings ultra.
Dirt 5

Dirt 5

2020
low 1280x720
167.9  fps    + Compare
med. 1920x1080
125.7  fps    + Compare
high 1920x1080
98.6  fps    + Compare
ultra 1920x1080
85.9  fps    + Compare
QHD 2560x1440
83.2  fps    + Compare
4K 3840x2160
81.6  fps    + Compare
» With all tested laptops playable in detail settings ultra.
low 1280x720
238  fps    + Compare + 📈 Graph
med. 1920x1080
217  fps    + Compare + 📈 Graph
high 1920x1080
198.9  fps    + Compare + 📈 Graph
ultra 1920x1080
191.9  fps    + Compare + 📈 Graph
QHD 2560x1440
145.6  fps    + Compare + 📈 Graph
4K 3840x2160
81.6  fps    + Compare + 📈 Graph
» With all tested laptops playable in detail settings ultra.
F1 2020

F1 2020

2020
low 1280x720
575  fps    + Compare
med. 1920x1080
391  fps    + Compare
high 1920x1080
322  fps    + Compare
ultra 1920x1080
216  fps    + Compare
QHD 2560x1440
170.6  fps    + Compare
4K 3840x2160
102.5  fps    + Compare
» With all tested laptops playable in detail settings ultra.
low 1280x720
244  fps    + Compare
med. 1920x1080
210  fps    + Compare
high 1920x1080
158.2  fps    + Compare
ultra 1920x1080
126.4  fps    + Compare
QHD 2560x1440
89.4  fps    + Compare
4K 3840x2160
48  fps    + Compare
» With all tested laptops playable in detail settings ultra.
Additional Benchmarks
Very Low Overall Quality (DX11) 1920x1080
237
Control

Control

2019
low 1280x720
240  fps    + Compare + 📈 Graph
med. 1920x1080
214  fps    + Compare + 📈 Graph
high 1920x1080
156.1  fps    + Compare + 📈 Graph
QHD 2560x1440
96.1  fps    + Compare + 📈 Graph
4K 3840x2160
46.4  fps    + Compare + 📈 Graph
» With all tested laptops playable in detail settings high.
Additional Benchmarks
High Quality Preset & High Ray Tracing Preset (DX12) 1920x1080
79.9
High Quality Preset & High Ray Tracing Preset (DX12) 3840x2160
23.6
Anno 1800

Anno 1800

2019
low 1280x720
201  fps    + Compare + 📈 Graph
med. 1920x1080
197.1  fps    + Compare + 📈 Graph
high 1920x1080
143.5  fps    + Compare + 📈 Graph
ultra 1920x1080
68.5  fps    + Compare + 📈 Graph
QHD 2560x1440
58.1  fps    + Compare + 📈 Graph
4K 3840x2160
33.7  fps    + Compare + 📈 Graph
» With all tested laptops playable in detail settings ultra.
low 1280x720
176  fps    + Compare + 📈 Graph
med. 1920x1080
157  fps    + Compare + 📈 Graph
high 1920x1080
151  fps    + Compare + 📈 Graph
ultra 1920x1080
136  fps    + Compare + 📈 Graph
QHD 2560x1440
134  fps    + Compare + 📈 Graph
4K 3840x2160
89  fps    + Compare + 📈 Graph
» With all tested laptops playable in detail settings ultra.
low 1280x720
289  fps    + Compare
med. 1920x1080
194  fps    + Compare
high 1920x1080
148.4  fps    + Compare
ultra 1920x1080
113.9  fps    + Compare
QHD 2560x1440
89.6  fps    + Compare
4K 3840x2160
57  fps    + Compare
» With all tested laptops playable in detail settings ultra.
Additional Benchmarks
Ultra Quality DXR 16xAF 1920x1080
88.1
low 1280x720
181  fps    + Compare
med. 1920x1080
165  fps    + Compare
high 1920x1080
148  fps    + Compare
ultra 1920x1080
121  fps    + Compare
QHD 2560x1440
98  fps    + Compare
4K 3840x2160
58  fps    + Compare
» With all tested laptops playable in detail settings ultra.
low 1280x720
334  fps    + Compare
med. 1920x1080
278  fps    + Compare
high 1920x1080
272  fps    + Compare
ultra 1920x1080
231  fps    + Compare
QHD 2560x1440
197  fps    + Compare
4K 3840x2160
134  fps    + Compare
» With all tested laptops playable in detail settings ultra.
low 1280x720
355  fps    + Compare
med. 1920x1080
242  fps    + Compare
high 1920x1080
223  fps    + Compare
ultra 1920x1080
194.1  fps    + Compare
QHD 2560x1440
131.9  fps    + Compare
4K 3840x2160
65.5  fps    + Compare
» With all tested laptops playable in detail settings ultra.
Additional Benchmarks
Lowest Preset 1920x1080
336
Strange Brigade

Strange Brigade

2018
low 1280x720
730  fps    + Compare
med. 1920x1080
398  fps    + Compare
high 1920x1080
334  fps    + Compare
ultra 1920x1080
287  fps    + Compare
QHD 2560x1440
193  fps    + Compare
4K 3840x2160
97.4  fps    + Compare
» With all tested laptops playable in detail settings ultra.
Far Cry 5

Far Cry 5

2018
low 1280x720
212  fps    + Compare + 📈 Graph
med. 1920x1080
188  fps    + Compare + 📈 Graph
high 1920x1080
181  fps    + Compare + 📈 Graph
ultra 1920x1080
167  fps    + Compare + 📈 Graph
QHD 2560x1440
157  fps    + Compare + 📈 Graph
4K 3840x2160
82  fps    + Compare + 📈 Graph
» With all tested laptops playable in detail settings ultra.
Additional Benchmarks
Low Preset TAA 1920x1080
209
low 1280x720
162.8  fps    + Compare
med. 1920x1080
129.7  fps    + Compare
high 1920x1080
100.2  fps    + Compare
4K 3840x2160
69.3  fps    + Compare
» With all tested laptops playable in detail settings high.
low 1280x720
235  fps    + Compare
med. 1920x1080
203  fps    + Compare
high 1920x1080
139.5  fps    + Compare
QHD 2560x1440
103.1  fps    + Compare
4K 3840x2160
57.4  fps    + Compare
» With all tested laptops playable in detail settings high.
low 1280x720
182  fps    + Compare
med. 1920x1080
144  fps    + Compare
high 1920x1080
134  fps    + Compare
ultra 1920x1080
114  fps    + Compare
QHD 2560x1440
90  fps    + Compare
4K 3840x2160
58  fps    + Compare
» With all tested laptops playable in detail settings ultra.
low 1280x720
213  fps    + Compare
med. 1366x768
216  fps    + Compare
high 1920x1080
195  fps    + Compare
ultra 1920x1080
162  fps    + Compare
4K 3840x2160
81  fps    + Compare
» With all tested laptops playable in detail settings ultra.
Additional Benchmarks
Medium Preset 4xAF 1920x1080
204
Low Preset 1xAF 1920x1080
222
Ultra Preset 16xAF 3840x2160
58
low 1024x768
347  fps    + Compare + 📈 Graph
med. 1366x768
253  fps    + Compare + 📈 Graph
high 1920x1080
170.4  fps    + Compare + 📈 Graph
ultra 1920x1080
148.6  fps    + Compare + 📈 Graph
4K 3840x2160
75.5  fps    + Compare + 📈 Graph
» With all tested laptops playable in detail settings ultra.
low 1280x720
278.7  fps    + Compare
med. 1366x768
206.3  fps    + Compare
high 1920x1080
186.3  fps    + Compare
ultra 1920x1080
169.3  fps    + Compare
4K 3840x2160
123.5  fps    + Compare
» With all tested laptops playable in detail settings ultra.
low 1024x768
732  fps    + Compare + 📈 Graph
med. 1366x768
516  fps    + Compare + 📈 Graph
high 1920x1080
295  fps    + Compare + 📈 Graph
ultra 1920x1080
168.3  fps    + Compare + 📈 Graph
QHD 2560x1440
119.6  fps    + Compare + 📈 Graph
4K 3840x2160
88.7  fps    + Compare + 📈 Graph
» With all tested laptops playable in detail settings ultra.
Additional Benchmarks
Ultra Graphics & Postprocessing (HBAO+) 3840x2160
64.4
Medium Graphics & Postprocessing 1920x1080
295
GTA V

GTA V

2015
low 1024x768
188  fps    + Compare
med. 1366x768
187.4  fps    + Compare
high 1920x1080
186.5  fps    + Compare
ultra 1920x1080
146  fps    + Compare
QHD 2560x1440
105.4  fps    + Compare
4K 3840x2160
112.4  fps    + Compare
» With all tested laptops playable in detail settings ultra.
Additional Benchmarks
Highest Settings possible 16xAF 4xMSAA + FXAA 3840x2160
48.4
Normal/Off 4xAF 1920x1080
187.4
Lowest Settings possible 1920x1080
187.5
lowmed.highultraQHD4K
Ready or Not281277269183.6109.948.4
The Finals347286253189.3118.954.7
Avatar Frontiers of Pandora11410387684623
Call of Duty Modern Warfare 3 202323421217115810964
EA Sports WRC240155.8140.4125.592.851.8
Alan Wake 2119.710893.262.730.8
Lords of the Fallen135113.879.45637.119.2
Total War Pharaoh519.1333.2209.7169.6122.860.5
Assassin's Creed Mirage1861681541209154
EA Sports FC 24395345274246199.1127.2
Counter-Strike 2351344283202127.262
Cyberpunk 2077 2.0 Phantom Liberty175.9145.1120.8110.273.131.6
Lies of P268232196.8173.6122.763.9
Starfield100.590.473.66855.136
Armored Core 6119.5118.9116.8106.484.351.5
Immortals of Aveum120.2102.682.256.129.9
Atlas Fallen191.6186.6179165.6117.663.3
Baldur's Gate 3203166.3136.213395.750.2
Ratchet & Clank Rift Apart151.3121.9102.1907242.5
F1 2346441831076.548.723.5
Diablo 436331628624315871
Star Wars Jedi Survivor129.9115.6107.510162.330.3
Dead Island 2353318238166.2119.962.7
The Last of Us154.6132.51221056829.6
Resident Evil 4 Remake229180.4156.1107.184.249.2
Company of Heroes 3300.6254195.7194.3143.481.3
Sons of the Forest118.7115.6112.4112.299.159
Atomic Heart265199.4118.893.673.943.8
Returnal1631531371158750
Hogwarts Legacy195.6161.1119.391.466.935.5
Dead Space Remake133.4129.4110.9111.87536.2
The Witcher 3 v4.00307264233198122.659.3
High On Life350263194.1150.389.638
The Callisto Protocol239.8194.1177.1115.390.157.8
Need for Speed Unbound205183.3144.3144.1111.764.2
Spider-Man Miles Morales154.5144.8130.2121.1100.658.1
Uncharted Legacy of Thieves Collection102.298.892.68770.142.1
A Plague Tale Requiem160.3121.992.870.152.630.3
The Quarry234172.9136.9106.373.637.8
F1 2242640031592.359.929.8
Ghostwire Tokyo244235233225139.965.7
Tiny Tina's Wonderlands366281170.6133.289.246
Cyberpunk 2077 1.6193158.2132122.180.236
GRID Legends263226194.9173.1153.8104.2
God of War191.9188.1148.710285.354.2
Guardians of the Galaxy18017717516412572
Far Cry 6227196.9178.5161.8121.963.1
F1 2021645537397172.6129.572.6
Assassin´s Creed Valhalla25018014913210159
Dirt 5167.9125.798.685.983.281.6
Death Stranding238217198.9191.9145.681.6
F1 2020575391322216170.6102.5
Borderlands 3244210158.2126.489.448
Control240214156.196.146.4
Anno 1800201197.1143.568.558.133.7
Far Cry New Dawn17615715113613489
Metro Exodus289194148.4113.989.657
Assassin´s Creed Odyssey1811651481219858
Forza Horizon 4334278272231197134
Shadow of the Tomb Raider355242223194.1131.965.5
Strange Brigade73039833428719397.4
Far Cry 521218818116715782
X-Plane 11.11162.8129.7100.269.3
Final Fantasy XV Benchmark235203139.5103.157.4
Assassin´s Creed Origins1821441341149058
The Division21321619516281
Rise of the Tomb Raider347253170.4148.675.5
Dota 2 Reborn278.7206.3186.3169.3123.5
The Witcher 3732516295168.3119.688.7
GTA V188187.4186.5146105.4112.4
< 30 fps
< 60 fps
< 120 fps
≥ 120 fps


6
64


8
61


16
54

1
25
40

8
39
19
6
35
26
3

For more games that might be playable and a list of all games and graphics cards visit our Gaming List

v1.26
log 25. 04:37:13

#0 no ids found in url (should be separated by "_") +0s ... 0s

#1 not redirecting to Ajax server +0s ... 0s

#2 did not recreate cache, as it is less than 5 days old! Created at Mon, 22 Apr 2024 05:40:21 +0200 +0.001s ... 0.001s

#3 no comparison url found in template nbc.compare_page_1 needed +0.054s ... 0.055s

#4 no comparison url found in template nbc.compare_page_1 needed +0s ... 0.055s

#5 no comparison url found in template nbc.compare_page_1 needed +0s ... 0.056s

#6 no comparison url found in template nbc.compare_page_1 needed +0s ... 0.056s

#7 composed specs +0.001s ... 0.057s

#8 did output specs +0s ... 0.057s

#9 start showIntegratedCPUs +0s ... 0.057s

#10 getting avg benchmarks for device 11617 +0.034s ... 0.091s

#11 got single benchmarks 11617 +0.012s ... 0.103s

#12 got avg benchmarks for devices +0s ... 0.103s

#13 min, max, avg, median took s +1.082s ... 1.184s

#14 before gaming benchmark output +0s ... 1.184s

#15 Got 411 rows for game benchmarks. +0.08s ... 1.264s

#16 composed SQL query for gamebenchmarks +0s ... 1.264s

#17 got data and put it in $dataArray +0.052s ... 1.316s

#18 benchmarks composed for output. +3.842s ... 5.158s

#19 no comparison url found in template nbc.compare_page_1 needed +0.008s ... 5.165s

#20 return log +0s ... 5.165s

Please share our article, every link counts!

» Comparison of GPUs
Detailed list of all laptop GPUs sorted by class and performance.

» Benchmark List
Sort and restrict laptop GPUs based on performance in synthetic benchmarks.

» Notebook Gaming List
Playable games for each graphics card and their average FPS results.

Class 1

NVIDIA RTX A6000 Desktop
Radeon Pro W6800 Desktop
NVIDIA Titan RTX Desktop
GeForce RTX 3070 Ti Desktop
Radeon RX 6750 XT Desktop
Radeon RX 6700 XT Desktop
NVIDIA GeForce RTX 3060 Ti Desktop
Radeon RX 6650 XT Desktop
GeForce RTX 2080 (Desktop) Desktop

Class 2

NVIDIA GeForce RTX 3060 Desktop
Titan X Pascal Desktop
Radeon VII Desktop
Radeon RX 5700 XT (Desktop) Desktop
GeForce GTX 1080 (Desktop) Desktop
GeForce RTX 2060 Super (Desktop) Desktop
Radeon RX 5700 (Desktop) Desktop
GeForce RTX 2060 (Desktop) Desktop
RX Vega 64 Desktop
RX Vega 56 Desktop
Radeon RX 5600 XT (Desktop) Desktop
Pro Vega 56 Desktop
GeForce GTX 1660 Ti (Desktop) Desktop
GeForce GTX 1660 Super (Desktop) Desktop
GeForce GTX 1660 (Desktop) Desktop
GeForce GTX 1650 Super (Desktop) Desktop
Radeon R9 Fury Desktop
Radeon R9 Nano Desktop
Radeon RX 580 Desktop
GeForce GTX 1060 (Desktop) Desktop
Radeon RX 570 Desktop
Radeon RX 480 Desktop
Arc A380 Desktop
GeForce GTX 970 Desktop

Class 3

GeForce GTX 960 Desktop
Radeon R7 370 Desktop
GeForce GTX 950 Desktop
T600 Desktop
UHD Graphics 32EUs
UHD Graphics 750
FirePro W4100 Desktop
FirePro W2100 Desktop

Class 4

UHD Graphics 730

* Approximate position of the graphics adapter